User login
Sneak Peek: Journal of Hospital Medicine – Oct. 2017
BACKGROUND: Hospitalized patients frequently report poor sleep, partly due to the inpatient environment. In-hospital sound and light levels are not well described on non–intensive care unit (non-ICU) wards. Although non-ICU wards may have lower average and peak noise levels, sound level changes (SLCs), which are important in disrupting sleep, may still be a substantial problem.
OBJECTIVE: To compare ambient sound and light levels, including SLCs, in ICU and non-ICU environments.
DESIGN: Observational study.
SETTING: Tertiary-care hospital.
MEASUREMENTS: Sound measurements of 0.5 Hz were analyzed to provide average hourly sound levels, sound peaks, and SLCs greater than or equal to 17.5 decibels (dB). For light data, measurements taken at 2-minute intervals provided average and maximum light levels.
RESULTS: The ICU rooms were louder than non-ICU wards; hourly averages ranged from 56.1 plus or minus 1.3 dB to 60.3 plus or minus 1.7 dB in the ICU, 47.3 plus or minus 3.7 dB to 55.1 plus or minus 3.7 dB on the telemetry floor, and 44.6 plus or minus 2.1 dB to 53.7 plus or minus 3.6 dB on the general ward. However, SLCs greater than or equal to 17.5 dB were not statistically different (ICU, 203.9 plus or minus 28.8 times; non-ICU, 270.9 plus or minus 39.5; P = 0.11). In both ICU and non-ICU wards, average daytime light levels were less than 250 lux, and peak light levels occurred in the afternoon and early evening.
CONCLUSIONS: While quieter, non-ICU wards have as many SLCs as ICUs do, which has implications for quality improvement measurements. Efforts to further reduce average noise levels might be counterproductive. Light levels in the hospital (ICU and non-ICU) may not be optimal for maintenance of a normal circadian rhythm for most people.
Read the entire article in the Journal of Hospital Medicine.
Also in JHM this month
Associations of physician empathy with patient anxiety and ratings of communication in hospital admission encounters
AUTHORS: Rachel Weiss, MD, Eric Vittinghoff, PhD, MPH, Margaret C. Fang, MD, MPH, Jenica E. W. Cimino, Kristen Adams Chasteen, MD, Robert M. Arnold, MD, Andrew D. Auerbach, MD, Wendy G. Anderson, MD, MS
A concise tool for measuring care coordination from the provider’s perspective in the hospital setting
AUTHORS: Christine M. Weston, PhD, and Sehyo Yune, MD, Eric B. Bass, MD, MPH, Scott A. Berkowitz, MD, MBA, Daniel J. Brotman, MD, Amy Deutschendorf, MS, RN, ACNS-BC, Eric E. Howell, MD, Melissa B. Richardson, MBA Carol Sylvester, RN, MS, Albert W. Wu, MD, MPH
Post–intensive care unit psychiatric comorbidity and quality of life
AUTHORS: Sophia Wang, MD, and Chris Mosher, MD, Anthony J. Perkins, MS, Sujuan Gao, PhD, Sue Lasiter, RN, PhD, Sikandar Khan, MD, Malaz Boustani, MD, MPH, Babar Khan, MD, MS
An opportunity to improve Medicare’s planned readmissions measure
AUTHORS: Chad Ellimoottil, MD, MS, Roger K. Khouri Jr., MD, Apoorv Dhir, BA, Hechuan Hou, MS, David C. Miller, MD, MPH, James M. Dupree, MD, MPH
Against medical advice discharges
AUTHORS: David Alfandre, MD, MSPH, Jay Brenner, MD, Eberechukwu Onukwugha, MS, PhD
Sound and Light Levels Are Similarly Disruptive in ICU and non-ICU Wards
The hospital environment fails to promote adequate sleep for acutely or critically ill patients. Intensive care units (ICUs) have received the most scrutiny, because critically ill patients suffer from severely fragmented sleep as well as a lack of deeper, more restorative sleep.1-4 ICU survivors frequently cite sleep deprivation, contributed to by ambient noise, as a major stressor while receiving care.5,6 Importantly, efforts to modify the ICU environment to promote sleep have been associated with reductions in delirium.7,8 However, sleep deprivation and delirium in the hospital are not limited to ICU patients.
Sleep in the non-ICU setting is also notoriously poor, with 50%-80% of patients reporting sleep as “unsound” or otherwise subjectively poor.9-11 Additionally, patients frequently ask for and/or receive pharmacological sleeping aids12 despite little evidence of efficacy13 and increasing evidence of harm.14 Here too, efforts to improve sleep seems to attenuate risk of delirium,15 which remains a substantial problem on general wards, with incidence reported as high as 20%-30%. The reasons for poor sleep in the hospital are multifactorial, but data suggest that the inpatient environment, including noise and light levels, which are measurable and modifiable entities, contribute significantly to the problem.16
The World Health Organization (WHO) recommends that nighttime baseline noise levels do not exceed 30 decibels (dB) and that nighttime noise peaks (ie, loud noises) do not exceed 40 dB17; most studies suggest that ICU and general ward rooms are above this range on average.10,18 Others have also demonstrated an association between loud noises and patients’ subjective perception of poor sleep.10,19 However, when considering clinically important noise, peak and average noise levels may not be the key factor in causing arousals from sleep. Buxton and colleagues20 found that noise quality affects arousal probability; for example, electronic alarms and conversational noise are more likely to cause awakenings compared with the opening or closing of doors and ice machines. Importantly, peak and average noise levels may also matter less for sleep than do sound level changes (SLCs), which are defined as the difference between background/baseline noise and peak noise. Using healthy subjects exposed to simulated ICU noise, Stanchina et al.21 found that SLCs >17.5 dB were more likely to cause polysomnographic arousals from sleep regardless of peak noise level. This sound pressure change of approximately 20 dB would be perceived as 4 times louder, or, as an example, would be the difference between normal conversation between 2 people (~40 dB) that is then interrupted by the start of a vacuum cleaner (~60 dB). To our knowledge, no other studies have closely examined SLCs in different hospital environments.
Ambient light also likely affects sleep quality in the hospital. The circadian rhythm system, which controls the human sleep–wake cycle as well as multiple other physiologic functions, depends on ambient light as the primary external factor for regulating the internal clock.22,23 Insufficient and inappropriately timed light exposure can desynchronize the biological clock, thereby negatively affecting sleep quality.24,25 Conversely, patients exposed to early-morning bright light may sleep better while in the hospital.16 In addition to sleep patterns, ambient light affects other aspects of patient care; for example, lower light levels in the hospital have recently been associated with higher levels of fatigue and mood disturbance.26A growing body of data has investigated the ambient environment in the ICU, but fewer studies have focused on sound and light analysis in other inpatient areas such as the general ward and telemetry floors. We examined sound and light levels in the ICU and non-ICU environment, hypothesizing that average sound levels would be higher in the ICU than on non-ICU floors but that the number of SLCs >17.5 dB would be similar. Additionally, we expected that average light levels would be higher in the ICU than on non-ICU floors.
METHODS
This was an observational study of the sound and light environment in the inpatient setting. Per our Institutional Review Board, no consent was required. Battery-operated sound-level (SDL600, Extech Instruments, Nashua, NH) and light-level (SDL400, Extech Instruments, Nashua, NH) meters were placed in 24 patient rooms in our tertiary-care adult hospital in La Jolla, CA. Recordings were obtained in randomly selected, single-patient occupied rooms that were from 3 different hospital units and included 8 general ward rooms, 8 telemetry floor rooms, and 8 ICU rooms. We recorded for approximately 24-72 hours. Depending on the geographic layout of the room, meters were placed as close to the head of the patient’s bed as possible and were generally not placed farther than 2 meters away from the patient’s head of bed; all rooms contained a window.
Sound Measurements
Sound meters measured ambient noise in dB every 2 seconds and were set for A-weighted frequency measurements. We averaged individual data points to obtain hourly averages for ICU and non-ICU rooms. For hourly sound averages, we further separated the data to compare the general ward telemetry floors (both non-ICU), the latter of which has more patient monitoring and a lower nurse-to-patient ratio compared with the general ward floor.
Data from ICU versus non-ICU rooms were analyzed for the number of sound peaks throughout the 24-hour day and for sound peak over the nighttime, defined as the number of times sound levels exceeded 65 dB, 70 dB, or 80 dB, which were averaged over 24 hours and over the nighttime (10 PM to 6 AM). We also calculated the number of average SLCs ≥17.5 dB observed over 24 hours and over the nighttime.
Light Measurements
Light meters measured luminescence in lux at a frequency of 120 seconds. We averaged individual data points to obtain hourly averages for ICU and non-ICU rooms. In addition to hourly averages, light-level data were analyzed for maximum levels throughout the day and night.
Statistical Analysis
Hourly sound-level averages between the 3 floors were evaluated using a 1-way analysis of variance (ANOVA); sound averages from the general ward and telemetry floor were also compared at each hour using a Student t test. Light-level data, sound-level peak data, as well as SLC data were also evaluated using a Student t test.
RESULTS
Sound Measurements
Examples of the raw data distribution for individual sound recordings in an ICU and non-ICU room are shown in Figure 1A and 1B. Sound-level analysis with specific average values and significance levels between ICU and non-ICU rooms (with non-ICU rooms further divided between telemetry and general ward floors for purposes of hourly averages) are shown in Table 1. The average hourly values in all 3 locations were always above the 30-35 dB level (nighttime and daytime, respectively) recommended by the WHO (Figure 1C). A 1-way ANOVA analysis revealed significant differences between the 3 floors at all time points except for 10 AM. An analysis of the means at each time point between the telemetry floor and the general ward floor showed that the telemetry floor had significantly higher sound averages compared with the general ward floor at 10 PM, 11 PM, and 12 AM. Sound levels dropped during the nighttime on both non-ICU wards but remained fairly constant throughout the day and night in the ICU.
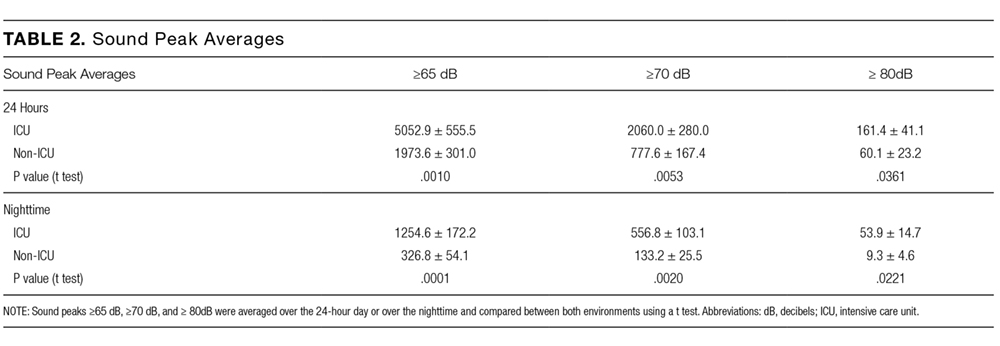
Importantly, despite average and peak sound levels showing that the ICU environment is louder overall, there were an equivalent number of SLCs ≥ 17.5 dB in the ICU and on non-ICU floors. The number of SLCs ≥ 17.5 dB is not statistically different when comparing ICU and non-ICU rooms either averaged over 24 hours or averaged over the nighttime (Figure 1E).
Light Measurements
Examples of light levels over a 24-hour period in an ICU and non-ICU room are shown in Figure 2A and 2B, respectively. Maximum average light levels (reported here as average value ± standard deviation to demonstrate variability within the data) in the ICU were 169.7 ± 127.1 lux and occurred at 1 PM, while maximum average light levels in the non-ICU rooms were 213.5 ± 341.6 lux and occurred at 5 PM (Figure 2C). Average light levels in the morning hours remained low and ranged from 15.9 ± 12.7 lux to 38.9 ± 43.4 lux in the ICU and from 22.3 ± 17.5 lux to 100.7 ± 92.0 lux on the non-ICU floors. The maximum measured level from any of the recordings was 2530 lux and occurred in a general ward room in the 5 PM hour. Overall, light averages remained low, but this particular room had light levels that were significantly higher than the others. A t test analysis of the hourly averages revealed only 1 time point of significant difference between the 2 floors; at 7 AM, the general ward floor had a higher lux level of 49.9 ± 27.5 versus 19.2 ± 10.7 in the ICU (P = 0.038). Otherwise, there were no differences between light levels in ICU rooms versus non-ICU rooms. Evaluation of the data revealed a substantial amount of variability in light levels throughout the daytime hours. Light levels during the nighttime remained low and were not significantly different between the 2 groups.
DISCUSSION
To our knowledge, this is the first study to directly compare the ICU and non-ICU environment for its potential impact on sleep and circadian alignment. Our study adds to the literature with several novel findings. First, average sound levels on non-ICU wards are lower than in the ICU. Second, although quieter on average, SLCs >17.5 dB occurred an equivalent number of times for both the ICU and non-ICU wards. Third, average daytime light levels in both the ICU and non-ICU environment are low. Lastly, peak light levels for both ICU and non-ICU wards occur later in the day instead of in the morning. All of the above have potential impact for optimizing the ward environment to better aid in sleep for patients.
Sound-Level Findings
Data on sound levels for non-ICU floors are limited but mostly consistent with our finding
Average and peak sound levels contribute to the ambient noise experienced by patients but may not be the source of sleep disruptions. Using polysomnography in healthy subjects exposed to recordings of ICU noise, Stanchina et al.21 showed that SLCs from baseline and not peak sound levels determined whether a subject was aroused from sleep by sound. Accordingly, they also found that increasing baseline sound levels by using white noise reduced the number of arousals that subjects experienced. To our knowledge, other studies have not quantified and compared SLCs in the ICU and non-ICU environments. Our data show that patients on non-ICU floors experience at least the same number of SLCs, and thereby the same potential for arousals from sleep, when compared with ICU patients. The higher baseline level of noise in the ICU likely explains the relatively lower number of SLCs when compared with the non-ICU floors. Although decreasing overall noise to promote sleep in the hospital seems like the obvious solution, the treatment for noise pollution in the hospital may actually be more background noise, not less.
Recent studies support the clinical implications of our findings. First, decreasing overall noise levels is difficult to accomplish.29 Second, recent studies utilized white noise in different hospital settings with some success in improving patients’ subjective sleep quality, although more studies using objective data measurements are needed to further understand the impact of white noise on sleep in hospitalized patients.30,31 Third, efforts at reducing interruptions—which likely will decrease the number of SLCs—such as clustering nursing care or reducing intermittent alarms may be more beneficial in improving sleep than efforts at decreasing average sound levels. For example, Bartick et al. reduced the number of patient interruptions at night by eliminating routine vital signs and clustering medication administration. Although they included other interventions as well, we note that this approach likely reduced SLCs and was associated with a reduction in the use of sedative medications.32 Ultimately, our data show that a focus on reducing SLCs will be one necessary component of a multipronged solution to improving inpatient sleep.33
Light-Level Findings
Because of its effect on circadian rhythms, the daily light-dark cycle has a powerful impact on human physiology and behavior, which includes sleep.34 Little is understood about how light affects sleep and other circadian-related functions in general ward patients, as it is not commonly measured. Our findings suggest that patients admitted to the hospital are exposed to light levels and patterns that may not optimally promote wake and sleep. Encouragingly, we did not find excessive average light levels during the nighttime in either ICU or non-ICU environment of our hospital, although others have described intrusive nighttime light in the hospital setting.35,36 Even short bursts of low or moderate light during the nighttime can cause circadian phase delay,37 and efforts to maintain darkness in patient rooms at night should continue.
Our measurements show that average daytime light levels did not exceed 250 lux, which corresponds to low, office-level lighting, while the brightest average light levels occurred in the afternoon for both environments. These levels are consistent with other reports26,35,36 as is the light-level variability noted throughout the day (which is not unexpected given room positioning, patient preference, curtains, etc). The level and amount of daytime light needed to maintain circadian rhythms in humans is still unknown.38 Brighter light is generally more effective at influencing the circadian pacemaker in a dose-dependent manner.39 Although entrainment (synchronization of the body’s biological rhythm with environmental cues such as ambient light) of the human circadian rhythm has been shown with low light levels (eg, <100 lux), these studies included healthy volunteers in a carefully controlled, constant, routine environment.23 How these data apply to acutely ill subjects in the hospital environment is not clear. We note that low to moderate levels of light (50-1000 lux) are less effective for entrainment of the circadian rhythm in older people (age >65 years, the majority of our admissions) compared with younger people. Thus, older, hospitalized patients may require greater light levels for regulation of the sleep-wake cycle.40 These data are important when designing interventions to improve light for and maintain circadian rhythms in hospitalized patients. For example, Simons et al. found that dynamic light-application therapy, which achieved a maximum average lux level of <800 lux, did not reduce rates of delirium in critically ill patients (mean age ~65). One interpretation of these results, though there are many others, is that the light levels achieved were not high enough to influence circadian timing in hospitalized, mostly elderly patients. The physiological impact of light on the circadian rhythm in hospitalized patients still remains to be measured.
LIMITATIONS
Our study does have a few limitations. We did not assess sound quality, which is another determinant of arousal potential.20 Also, a shorter measurement interval might be useful in determining sharper sound increases. It may also be important to consider A- versus C-weighted measurements of sound levels, as A-weighted measurements usually reflect higher-frequency sound while C-weighted measurements usually reflect low-frequency noise18; we obtained only A-weighted measurements in our study. However, A-weighted measurements are generally considered more reflective of what the human ear considers noise and are used more standardly than C-weighted measurements.
Regarding light measurements, we recorded from rooms facing different cardinal directions and during different times of the year, which likely contributed to some of the variability in the daytime light levels on both floors. Additionally, light levels were not measured directly at the patient’s eye level. However, given that overhead fluorescent lighting was the primary source of lighting, it is doubtful that we substantially underestimated optic-nerve light levels. In the future, it may also be important to measure the different wavelengths of lights, as blue light may have a greater impact on sleep than other wavelengths.41 Although our findings align with others’, we note that this was a single-center study, which could limit the generalizability of our findings given inter-hospital variations in patient volume, interior layout and structure, and geographic location.
CONCLUSIONS
Overall, our study suggests that the light and sound environment for sleep in the inpatient setting, including both the ICU and non-ICU wards, has multiple areas for improvement. Our data also suggest specific directions for future clinical efforts at improvement. For example, efforts to decrease average sound levels may worsen sleep fragmentation. Similarly, more light during the day may be more helpful than further attempts to limit light during the night.
Disclosure
This research was funded in part by a NIH/NCATS flagship Clinical and Translational Science Award Grant (5KL2TR001112). None of the authors report any conflict of interest, financial or otherwise, in the preparation of this article.
1. Freedman NS, Gazendam J, Levan L, Pack AI, Schwab RJ. Abnormal sleep/wake
cycles and the effect of environmental noise on sleep disruption in the intensive
care unit. Am J Respir Crit Care Med. 2001;163(2):451-457. PubMed
2. Watson PL, Pandharipande P, Gehlbach BK, et al. Atypical sleep in ventilated
patients: empirical electroencephalography findings and the path toward revised ICU sleep scoring criteria. Crit Care Med. 2013;41(8):1958-1967. PubMed
3. Gehlbach BK, Chapotot F, Leproult R, et al. Temporal disorganization of circadian rhythmicity and sleep-wake regulation in mechanically ventilated patients receiving continuous intravenous sedation. Sleep. 2012;35(8):1105-1114. PubMed
4. Elliott R, McKinley S, Cistulli P, Fien M. Characterisation of sleep in intensive care using 24-hour polysomnography: an observational study. Crit Care. 2013;17(2):R46. PubMed
5. Novaes MA, Aronovich A, Ferraz MB, Knobel E. Stressors in ICU: patients’ evaluation. Intensive Care Med. 1997;23(12):1282-1285. PubMed
6. Tembo AC, Parker V, Higgins I. The experience of sleep deprivation in intensive care patients: findings from a larger hermeneutic phenomenological study. Intensive Crit Care Nurs. 2013;29(6):310-316. PubMed
7. Kamdar BB, Yang J, King LM, et al. Developing, implementing, and evaluating a multifaceted quality improvement intervention to promote sleep in an ICU. Am J Med Qual. 2014;29(6):546-554. PubMed
8. Patel J, Baldwin J, Bunting P, Laha S. The effect of a multicomponent multidisciplinary bundle of interventions on sleep and delirium in medical and surgical intensive care patients. Anaesthesia. 2014;69(6):540-549. PubMed
9. Manian FA, Manian CJ. Sleep quality in adult hospitalized patients with infection: an observational study. Am J Med Sci. 2015;349(1):56-60. PubMed
10. Park MJ, Yoo JH, Cho BW, Kim KT, Jeong WC, Ha M. Noise in hospital rooms and sleep disturbance in hospitalized medical patients. Environ Health Toxicol. 2014;29:e2014006. PubMed
11. Dobing S, Frolova N, McAlister F, Ringrose J. Sleep quality and factors influencing self-reported sleep duration and quality in the general internal medicine inpatient population. PLoS One. 2016;11(6):e0156735. PubMed
12. Gillis CM, Poyant JO, Degrado JR, Ye L, Anger KE, Owens RL. Inpatient pharmacological
sleep aid utilization is common at a tertiary medical center. J Hosp Med. 2014;9(10):652-657. PubMed
13. Krenk L, Jennum P, Kehlet H. Postoperative sleep disturbances after zolpidem treatment in fast-track hip and knee replacement. J Clin Sleep Med. 2014;10(3):321-326. PubMed
14. Kolla BP, Lovely JK, Mansukhani MP, Morgenthaler TI. Zolpidem is independently
associated with increased risk of inpatient falls. J Hosp Med. 2013;8(1):1-6. PubMed
15. Inouye SK, Bogardus ST Jr, Charpentier PA, et al. A multicomponent intervention to prevent delirium in hospitalized older patients. N Engl J Med. 1999;340(9):669-676. PubMed
16. Bano M, Chiaromanni F, Corrias M, et al. The influence of environmental factors on sleep quality in hospitalized medical patients. Front Neurol. 2014;5:267. PubMed
17. Berglund BLTSD. Guidelines for Community Noise. World Health Organization. 1999.
18. Knauert M, Jeon S, Murphy TE, Yaggi HK, Pisani MA, Redeker NS. Comparing average levels and peak occurrence of overnight sound in the medical intensive care unit on A-weighted and C-weighted decibel scales. J Crit Care. 2016;36:1-7. PubMed
19. Yoder JC, Staisiunas PG, Meltzer DO, Knutson KL, Arora VM. Noise and sleep among adult medical inpatients: far from a quiet night. Arch Intern Med. 2012;172(1):68-70. PubMed
20. Buxton OM, Ellenbogen JM, Wang W, et al. Sleep disruption due to hospital noises: a prospective evaluation. Ann Intern Med. 2012;157(3):170-179. PubMed
21. Stanchina ML, Abu-Hijleh M, Chaudhry BK, Carlisle CC, Millman RP. The influence of white noise on sleep in subjects exposed to ICU noise. Sleep Med. 2005;6(5):423-428. PubMed
22. Czeisler CA, Allan JS, Strogatz SH, et al. Bright light resets the human circadian pacemaker independent of the timing of the sleep-wake cycle. Science. 1986;233(4764):667-671. PubMed
23. Duffy JF, Czeisler CA. Effect of light on human circadian physiology. Sleep Med Clin. 2009;4(2):165-177. PubMed
24. Lewy AJ, Wehr TA, Goodwin FK, Newsome DA, Markey SP. Light suppresses melatonin secretion in humans. Science. 1980;210(4475):1267-1269. PubMed
25. Zeitzer JM, Dijk DJ, Kronauer R, Brown E, Czeisler C. Sensitivity of the human circadian pacemaker to nocturnal light: melatonin phase resetting and suppression. J Physiol. 2000;526:695-702. PubMed
26. Bernhofer EI, Higgins PA, Daly BJ, Burant CJ, Hornick TR. Hospital lighting and its association with sleep, mood and pain in medical inpatients. J Adv Nurs. 2014;70(5):1164-1173. PubMed
27. Darbyshire JL, Young JD. An investigation of sound levels on intensive care units with reference to the WHO guidelines. Crit Care. 2013;17(5):R187. PubMed
28. Gillis S. Pharmacologic treatment of depression during pregnancy. J Midwifery Womens Health. 2000;45(4):357-359. PubMed
29. Tainter CR, Levine AR, Quraishi SA, et al. Noise levels in surgical ICUs are consistently above recommended standards. Crit Care Med. 2016;44(1):147-152. PubMed
30. Farrehi PM, Clore KR, Scott JR, Vanini G, Clauw DJ. Efficacy of Sleep Tool Education During Hospitalization: A Randomized Controlled Trial. Am J Med. 2016;129(12):1329.e9-1329.e17. PubMed
31. Farokhnezhad Afshar P, Bahramnezhad F, Asgari P, Shiri M. Effect of white noise on sleep in patients admitted to a coronary care. J Caring Sci. 2016;5(2):103-109. PubMed
32. Bartick MC, Thai X, Schmidt T, Altaye A, Solet JM. Decrease in as-needed sedative use by limiting nighttime sleep disruptions from hospital staff. J Hosp Med. 2010;5(3):E20-E24. PubMed
33. Tamrat R, Huynh-Le MP, Goyal M. Non-pharmacologic interventions to improve the sleep of hospitalized patients: a systematic review. J Gen Intern Med. 2014;29(5):788-795. PubMed
34. Dijk DJ, Archer SN. Light, sleep, and circadian rhythms: together again. PLoS Biol. 2009;7(6):e1000145. PubMed
35. Verceles AC, Liu X, Terrin ML, et al. Ambient light levels and critical care outcomes. J Crit Care. 2013;28(1):110.e1-110.e8. PubMed
36. Hu RF, Hegadoren KM, Wang XY, Jiang XY. An investigation of light and sound levels on intensive care units in China. Aust Crit Care. 2016;29(2):62-67. PubMed
37. Zeitzer JM, Ruby NF, Fisicaro RA, Heller HC. Response of the human circadian system to millisecond flashes of light. PLoS One. 2011;6(7):e22078. PubMed
38. Duffy JF, Wright KP, Jr. Entrainment of the human circadian system by light. J Biol Rhythms. 2005;20(4):326-338. PubMed
39. Wright KP Jr, Gronfier C, Duffy JF, Czeisler CA. Intrinsic period and light intensity determine the phase relationship between melatonin and sleep in humans. J Biol Rhythms. 2005;20(2):168-177. PubMed
40. Duffy JF, Zeitzer JM, Czeisler CA. Decreased sensitivity to phase-delaying effects of moderate intensity light in older subjects. Neurobiol Aging. 2007;28(5):799-807. PubMed
41. Figueiro MG, Plitnick BA, Lok A, et al. Tailored lighting intervention improves measures of sleep, depression, and agitation in persons with Alzheimer’s disease and related dementia living in long-term care facilities. Clin Interv Aging. 2014;9:1527-1537. PubMed
The hospital environment fails to promote adequate sleep for acutely or critically ill patients. Intensive care units (ICUs) have received the most scrutiny, because critically ill patients suffer from severely fragmented sleep as well as a lack of deeper, more restorative sleep.1-4 ICU survivors frequently cite sleep deprivation, contributed to by ambient noise, as a major stressor while receiving care.5,6 Importantly, efforts to modify the ICU environment to promote sleep have been associated with reductions in delirium.7,8 However, sleep deprivation and delirium in the hospital are not limited to ICU patients.
Sleep in the non-ICU setting is also notoriously poor, with 50%-80% of patients reporting sleep as “unsound” or otherwise subjectively poor.9-11 Additionally, patients frequently ask for and/or receive pharmacological sleeping aids12 despite little evidence of efficacy13 and increasing evidence of harm.14 Here too, efforts to improve sleep seems to attenuate risk of delirium,15 which remains a substantial problem on general wards, with incidence reported as high as 20%-30%. The reasons for poor sleep in the hospital are multifactorial, but data suggest that the inpatient environment, including noise and light levels, which are measurable and modifiable entities, contribute significantly to the problem.16
The World Health Organization (WHO) recommends that nighttime baseline noise levels do not exceed 30 decibels (dB) and that nighttime noise peaks (ie, loud noises) do not exceed 40 dB17; most studies suggest that ICU and general ward rooms are above this range on average.10,18 Others have also demonstrated an association between loud noises and patients’ subjective perception of poor sleep.10,19 However, when considering clinically important noise, peak and average noise levels may not be the key factor in causing arousals from sleep. Buxton and colleagues20 found that noise quality affects arousal probability; for example, electronic alarms and conversational noise are more likely to cause awakenings compared with the opening or closing of doors and ice machines. Importantly, peak and average noise levels may also matter less for sleep than do sound level changes (SLCs), which are defined as the difference between background/baseline noise and peak noise. Using healthy subjects exposed to simulated ICU noise, Stanchina et al.21 found that SLCs >17.5 dB were more likely to cause polysomnographic arousals from sleep regardless of peak noise level. This sound pressure change of approximately 20 dB would be perceived as 4 times louder, or, as an example, would be the difference between normal conversation between 2 people (~40 dB) that is then interrupted by the start of a vacuum cleaner (~60 dB). To our knowledge, no other studies have closely examined SLCs in different hospital environments.
Ambient light also likely affects sleep quality in the hospital. The circadian rhythm system, which controls the human sleep–wake cycle as well as multiple other physiologic functions, depends on ambient light as the primary external factor for regulating the internal clock.22,23 Insufficient and inappropriately timed light exposure can desynchronize the biological clock, thereby negatively affecting sleep quality.24,25 Conversely, patients exposed to early-morning bright light may sleep better while in the hospital.16 In addition to sleep patterns, ambient light affects other aspects of patient care; for example, lower light levels in the hospital have recently been associated with higher levels of fatigue and mood disturbance.26A growing body of data has investigated the ambient environment in the ICU, but fewer studies have focused on sound and light analysis in other inpatient areas such as the general ward and telemetry floors. We examined sound and light levels in the ICU and non-ICU environment, hypothesizing that average sound levels would be higher in the ICU than on non-ICU floors but that the number of SLCs >17.5 dB would be similar. Additionally, we expected that average light levels would be higher in the ICU than on non-ICU floors.
METHODS
This was an observational study of the sound and light environment in the inpatient setting. Per our Institutional Review Board, no consent was required. Battery-operated sound-level (SDL600, Extech Instruments, Nashua, NH) and light-level (SDL400, Extech Instruments, Nashua, NH) meters were placed in 24 patient rooms in our tertiary-care adult hospital in La Jolla, CA. Recordings were obtained in randomly selected, single-patient occupied rooms that were from 3 different hospital units and included 8 general ward rooms, 8 telemetry floor rooms, and 8 ICU rooms. We recorded for approximately 24-72 hours. Depending on the geographic layout of the room, meters were placed as close to the head of the patient’s bed as possible and were generally not placed farther than 2 meters away from the patient’s head of bed; all rooms contained a window.
Sound Measurements
Sound meters measured ambient noise in dB every 2 seconds and were set for A-weighted frequency measurements. We averaged individual data points to obtain hourly averages for ICU and non-ICU rooms. For hourly sound averages, we further separated the data to compare the general ward telemetry floors (both non-ICU), the latter of which has more patient monitoring and a lower nurse-to-patient ratio compared with the general ward floor.
Data from ICU versus non-ICU rooms were analyzed for the number of sound peaks throughout the 24-hour day and for sound peak over the nighttime, defined as the number of times sound levels exceeded 65 dB, 70 dB, or 80 dB, which were averaged over 24 hours and over the nighttime (10 PM to 6 AM). We also calculated the number of average SLCs ≥17.5 dB observed over 24 hours and over the nighttime.
Light Measurements
Light meters measured luminescence in lux at a frequency of 120 seconds. We averaged individual data points to obtain hourly averages for ICU and non-ICU rooms. In addition to hourly averages, light-level data were analyzed for maximum levels throughout the day and night.
Statistical Analysis
Hourly sound-level averages between the 3 floors were evaluated using a 1-way analysis of variance (ANOVA); sound averages from the general ward and telemetry floor were also compared at each hour using a Student t test. Light-level data, sound-level peak data, as well as SLC data were also evaluated using a Student t test.
RESULTS
Sound Measurements
Examples of the raw data distribution for individual sound recordings in an ICU and non-ICU room are shown in Figure 1A and 1B. Sound-level analysis with specific average values and significance levels between ICU and non-ICU rooms (with non-ICU rooms further divided between telemetry and general ward floors for purposes of hourly averages) are shown in Table 1. The average hourly values in all 3 locations were always above the 30-35 dB level (nighttime and daytime, respectively) recommended by the WHO (Figure 1C). A 1-way ANOVA analysis revealed significant differences between the 3 floors at all time points except for 10 AM. An analysis of the means at each time point between the telemetry floor and the general ward floor showed that the telemetry floor had significantly higher sound averages compared with the general ward floor at 10 PM, 11 PM, and 12 AM. Sound levels dropped during the nighttime on both non-ICU wards but remained fairly constant throughout the day and night in the ICU.
Importantly, despite average and peak sound levels showing that the ICU environment is louder overall, there were an equivalent number of SLCs ≥ 17.5 dB in the ICU and on non-ICU floors. The number of SLCs ≥ 17.5 dB is not statistically different when comparing ICU and non-ICU rooms either averaged over 24 hours or averaged over the nighttime (Figure 1E).
Light Measurements
Examples of light levels over a 24-hour period in an ICU and non-ICU room are shown in Figure 2A and 2B, respectively. Maximum average light levels (reported here as average value ± standard deviation to demonstrate variability within the data) in the ICU were 169.7 ± 127.1 lux and occurred at 1 PM, while maximum average light levels in the non-ICU rooms were 213.5 ± 341.6 lux and occurred at 5 PM (Figure 2C). Average light levels in the morning hours remained low and ranged from 15.9 ± 12.7 lux to 38.9 ± 43.4 lux in the ICU and from 22.3 ± 17.5 lux to 100.7 ± 92.0 lux on the non-ICU floors. The maximum measured level from any of the recordings was 2530 lux and occurred in a general ward room in the 5 PM hour. Overall, light averages remained low, but this particular room had light levels that were significantly higher than the others. A t test analysis of the hourly averages revealed only 1 time point of significant difference between the 2 floors; at 7 AM, the general ward floor had a higher lux level of 49.9 ± 27.5 versus 19.2 ± 10.7 in the ICU (P = 0.038). Otherwise, there were no differences between light levels in ICU rooms versus non-ICU rooms. Evaluation of the data revealed a substantial amount of variability in light levels throughout the daytime hours. Light levels during the nighttime remained low and were not significantly different between the 2 groups.
DISCUSSION
To our knowledge, this is the first study to directly compare the ICU and non-ICU environment for its potential impact on sleep and circadian alignment. Our study adds to the literature with several novel findings. First, average sound levels on non-ICU wards are lower than in the ICU. Second, although quieter on average, SLCs >17.5 dB occurred an equivalent number of times for both the ICU and non-ICU wards. Third, average daytime light levels in both the ICU and non-ICU environment are low. Lastly, peak light levels for both ICU and non-ICU wards occur later in the day instead of in the morning. All of the above have potential impact for optimizing the ward environment to better aid in sleep for patients.
Sound-Level Findings
Data on sound levels for non-ICU floors are limited but mostly consistent with our finding
Average and peak sound levels contribute to the ambient noise experienced by patients but may not be the source of sleep disruptions. Using polysomnography in healthy subjects exposed to recordings of ICU noise, Stanchina et al.21 showed that SLCs from baseline and not peak sound levels determined whether a subject was aroused from sleep by sound. Accordingly, they also found that increasing baseline sound levels by using white noise reduced the number of arousals that subjects experienced. To our knowledge, other studies have not quantified and compared SLCs in the ICU and non-ICU environments. Our data show that patients on non-ICU floors experience at least the same number of SLCs, and thereby the same potential for arousals from sleep, when compared with ICU patients. The higher baseline level of noise in the ICU likely explains the relatively lower number of SLCs when compared with the non-ICU floors. Although decreasing overall noise to promote sleep in the hospital seems like the obvious solution, the treatment for noise pollution in the hospital may actually be more background noise, not less.
Recent studies support the clinical implications of our findings. First, decreasing overall noise levels is difficult to accomplish.29 Second, recent studies utilized white noise in different hospital settings with some success in improving patients’ subjective sleep quality, although more studies using objective data measurements are needed to further understand the impact of white noise on sleep in hospitalized patients.30,31 Third, efforts at reducing interruptions—which likely will decrease the number of SLCs—such as clustering nursing care or reducing intermittent alarms may be more beneficial in improving sleep than efforts at decreasing average sound levels. For example, Bartick et al. reduced the number of patient interruptions at night by eliminating routine vital signs and clustering medication administration. Although they included other interventions as well, we note that this approach likely reduced SLCs and was associated with a reduction in the use of sedative medications.32 Ultimately, our data show that a focus on reducing SLCs will be one necessary component of a multipronged solution to improving inpatient sleep.33
Light-Level Findings
Because of its effect on circadian rhythms, the daily light-dark cycle has a powerful impact on human physiology and behavior, which includes sleep.34 Little is understood about how light affects sleep and other circadian-related functions in general ward patients, as it is not commonly measured. Our findings suggest that patients admitted to the hospital are exposed to light levels and patterns that may not optimally promote wake and sleep. Encouragingly, we did not find excessive average light levels during the nighttime in either ICU or non-ICU environment of our hospital, although others have described intrusive nighttime light in the hospital setting.35,36 Even short bursts of low or moderate light during the nighttime can cause circadian phase delay,37 and efforts to maintain darkness in patient rooms at night should continue.
Our measurements show that average daytime light levels did not exceed 250 lux, which corresponds to low, office-level lighting, while the brightest average light levels occurred in the afternoon for both environments. These levels are consistent with other reports26,35,36 as is the light-level variability noted throughout the day (which is not unexpected given room positioning, patient preference, curtains, etc). The level and amount of daytime light needed to maintain circadian rhythms in humans is still unknown.38 Brighter light is generally more effective at influencing the circadian pacemaker in a dose-dependent manner.39 Although entrainment (synchronization of the body’s biological rhythm with environmental cues such as ambient light) of the human circadian rhythm has been shown with low light levels (eg, <100 lux), these studies included healthy volunteers in a carefully controlled, constant, routine environment.23 How these data apply to acutely ill subjects in the hospital environment is not clear. We note that low to moderate levels of light (50-1000 lux) are less effective for entrainment of the circadian rhythm in older people (age >65 years, the majority of our admissions) compared with younger people. Thus, older, hospitalized patients may require greater light levels for regulation of the sleep-wake cycle.40 These data are important when designing interventions to improve light for and maintain circadian rhythms in hospitalized patients. For example, Simons et al. found that dynamic light-application therapy, which achieved a maximum average lux level of <800 lux, did not reduce rates of delirium in critically ill patients (mean age ~65). One interpretation of these results, though there are many others, is that the light levels achieved were not high enough to influence circadian timing in hospitalized, mostly elderly patients. The physiological impact of light on the circadian rhythm in hospitalized patients still remains to be measured.
LIMITATIONS
Our study does have a few limitations. We did not assess sound quality, which is another determinant of arousal potential.20 Also, a shorter measurement interval might be useful in determining sharper sound increases. It may also be important to consider A- versus C-weighted measurements of sound levels, as A-weighted measurements usually reflect higher-frequency sound while C-weighted measurements usually reflect low-frequency noise18; we obtained only A-weighted measurements in our study. However, A-weighted measurements are generally considered more reflective of what the human ear considers noise and are used more standardly than C-weighted measurements.
Regarding light measurements, we recorded from rooms facing different cardinal directions and during different times of the year, which likely contributed to some of the variability in the daytime light levels on both floors. Additionally, light levels were not measured directly at the patient’s eye level. However, given that overhead fluorescent lighting was the primary source of lighting, it is doubtful that we substantially underestimated optic-nerve light levels. In the future, it may also be important to measure the different wavelengths of lights, as blue light may have a greater impact on sleep than other wavelengths.41 Although our findings align with others’, we note that this was a single-center study, which could limit the generalizability of our findings given inter-hospital variations in patient volume, interior layout and structure, and geographic location.
CONCLUSIONS
Overall, our study suggests that the light and sound environment for sleep in the inpatient setting, including both the ICU and non-ICU wards, has multiple areas for improvement. Our data also suggest specific directions for future clinical efforts at improvement. For example, efforts to decrease average sound levels may worsen sleep fragmentation. Similarly, more light during the day may be more helpful than further attempts to limit light during the night.
Disclosure
This research was funded in part by a NIH/NCATS flagship Clinical and Translational Science Award Grant (5KL2TR001112). None of the authors report any conflict of interest, financial or otherwise, in the preparation of this article.
1. Freedman NS, Gazendam J, Levan L, Pack AI, Schwab RJ. Abnormal sleep/wake
cycles and the effect of environmental noise on sleep disruption in the intensive
care unit. Am J Respir Crit Care Med. 2001;163(2):451-457. PubMed
2. Watson PL, Pandharipande P, Gehlbach BK, et al. Atypical sleep in ventilated
patients: empirical electroencephalography findings and the path toward revised ICU sleep scoring criteria. Crit Care Med. 2013;41(8):1958-1967. PubMed
3. Gehlbach BK, Chapotot F, Leproult R, et al. Temporal disorganization of circadian rhythmicity and sleep-wake regulation in mechanically ventilated patients receiving continuous intravenous sedation. Sleep. 2012;35(8):1105-1114. PubMed
4. Elliott R, McKinley S, Cistulli P, Fien M. Characterisation of sleep in intensive care using 24-hour polysomnography: an observational study. Crit Care. 2013;17(2):R46. PubMed
5. Novaes MA, Aronovich A, Ferraz MB, Knobel E. Stressors in ICU: patients’ evaluation. Intensive Care Med. 1997;23(12):1282-1285. PubMed
6. Tembo AC, Parker V, Higgins I. The experience of sleep deprivation in intensive care patients: findings from a larger hermeneutic phenomenological study. Intensive Crit Care Nurs. 2013;29(6):310-316. PubMed
7. Kamdar BB, Yang J, King LM, et al. Developing, implementing, and evaluating a multifaceted quality improvement intervention to promote sleep in an ICU. Am J Med Qual. 2014;29(6):546-554. PubMed
8. Patel J, Baldwin J, Bunting P, Laha S. The effect of a multicomponent multidisciplinary bundle of interventions on sleep and delirium in medical and surgical intensive care patients. Anaesthesia. 2014;69(6):540-549. PubMed
9. Manian FA, Manian CJ. Sleep quality in adult hospitalized patients with infection: an observational study. Am J Med Sci. 2015;349(1):56-60. PubMed
10. Park MJ, Yoo JH, Cho BW, Kim KT, Jeong WC, Ha M. Noise in hospital rooms and sleep disturbance in hospitalized medical patients. Environ Health Toxicol. 2014;29:e2014006. PubMed
11. Dobing S, Frolova N, McAlister F, Ringrose J. Sleep quality and factors influencing self-reported sleep duration and quality in the general internal medicine inpatient population. PLoS One. 2016;11(6):e0156735. PubMed
12. Gillis CM, Poyant JO, Degrado JR, Ye L, Anger KE, Owens RL. Inpatient pharmacological
sleep aid utilization is common at a tertiary medical center. J Hosp Med. 2014;9(10):652-657. PubMed
13. Krenk L, Jennum P, Kehlet H. Postoperative sleep disturbances after zolpidem treatment in fast-track hip and knee replacement. J Clin Sleep Med. 2014;10(3):321-326. PubMed
14. Kolla BP, Lovely JK, Mansukhani MP, Morgenthaler TI. Zolpidem is independently
associated with increased risk of inpatient falls. J Hosp Med. 2013;8(1):1-6. PubMed
15. Inouye SK, Bogardus ST Jr, Charpentier PA, et al. A multicomponent intervention to prevent delirium in hospitalized older patients. N Engl J Med. 1999;340(9):669-676. PubMed
16. Bano M, Chiaromanni F, Corrias M, et al. The influence of environmental factors on sleep quality in hospitalized medical patients. Front Neurol. 2014;5:267. PubMed
17. Berglund BLTSD. Guidelines for Community Noise. World Health Organization. 1999.
18. Knauert M, Jeon S, Murphy TE, Yaggi HK, Pisani MA, Redeker NS. Comparing average levels and peak occurrence of overnight sound in the medical intensive care unit on A-weighted and C-weighted decibel scales. J Crit Care. 2016;36:1-7. PubMed
19. Yoder JC, Staisiunas PG, Meltzer DO, Knutson KL, Arora VM. Noise and sleep among adult medical inpatients: far from a quiet night. Arch Intern Med. 2012;172(1):68-70. PubMed
20. Buxton OM, Ellenbogen JM, Wang W, et al. Sleep disruption due to hospital noises: a prospective evaluation. Ann Intern Med. 2012;157(3):170-179. PubMed
21. Stanchina ML, Abu-Hijleh M, Chaudhry BK, Carlisle CC, Millman RP. The influence of white noise on sleep in subjects exposed to ICU noise. Sleep Med. 2005;6(5):423-428. PubMed
22. Czeisler CA, Allan JS, Strogatz SH, et al. Bright light resets the human circadian pacemaker independent of the timing of the sleep-wake cycle. Science. 1986;233(4764):667-671. PubMed
23. Duffy JF, Czeisler CA. Effect of light on human circadian physiology. Sleep Med Clin. 2009;4(2):165-177. PubMed
24. Lewy AJ, Wehr TA, Goodwin FK, Newsome DA, Markey SP. Light suppresses melatonin secretion in humans. Science. 1980;210(4475):1267-1269. PubMed
25. Zeitzer JM, Dijk DJ, Kronauer R, Brown E, Czeisler C. Sensitivity of the human circadian pacemaker to nocturnal light: melatonin phase resetting and suppression. J Physiol. 2000;526:695-702. PubMed
26. Bernhofer EI, Higgins PA, Daly BJ, Burant CJ, Hornick TR. Hospital lighting and its association with sleep, mood and pain in medical inpatients. J Adv Nurs. 2014;70(5):1164-1173. PubMed
27. Darbyshire JL, Young JD. An investigation of sound levels on intensive care units with reference to the WHO guidelines. Crit Care. 2013;17(5):R187. PubMed
28. Gillis S. Pharmacologic treatment of depression during pregnancy. J Midwifery Womens Health. 2000;45(4):357-359. PubMed
29. Tainter CR, Levine AR, Quraishi SA, et al. Noise levels in surgical ICUs are consistently above recommended standards. Crit Care Med. 2016;44(1):147-152. PubMed
30. Farrehi PM, Clore KR, Scott JR, Vanini G, Clauw DJ. Efficacy of Sleep Tool Education During Hospitalization: A Randomized Controlled Trial. Am J Med. 2016;129(12):1329.e9-1329.e17. PubMed
31. Farokhnezhad Afshar P, Bahramnezhad F, Asgari P, Shiri M. Effect of white noise on sleep in patients admitted to a coronary care. J Caring Sci. 2016;5(2):103-109. PubMed
32. Bartick MC, Thai X, Schmidt T, Altaye A, Solet JM. Decrease in as-needed sedative use by limiting nighttime sleep disruptions from hospital staff. J Hosp Med. 2010;5(3):E20-E24. PubMed
33. Tamrat R, Huynh-Le MP, Goyal M. Non-pharmacologic interventions to improve the sleep of hospitalized patients: a systematic review. J Gen Intern Med. 2014;29(5):788-795. PubMed
34. Dijk DJ, Archer SN. Light, sleep, and circadian rhythms: together again. PLoS Biol. 2009;7(6):e1000145. PubMed
35. Verceles AC, Liu X, Terrin ML, et al. Ambient light levels and critical care outcomes. J Crit Care. 2013;28(1):110.e1-110.e8. PubMed
36. Hu RF, Hegadoren KM, Wang XY, Jiang XY. An investigation of light and sound levels on intensive care units in China. Aust Crit Care. 2016;29(2):62-67. PubMed
37. Zeitzer JM, Ruby NF, Fisicaro RA, Heller HC. Response of the human circadian system to millisecond flashes of light. PLoS One. 2011;6(7):e22078. PubMed
38. Duffy JF, Wright KP, Jr. Entrainment of the human circadian system by light. J Biol Rhythms. 2005;20(4):326-338. PubMed
39. Wright KP Jr, Gronfier C, Duffy JF, Czeisler CA. Intrinsic period and light intensity determine the phase relationship between melatonin and sleep in humans. J Biol Rhythms. 2005;20(2):168-177. PubMed
40. Duffy JF, Zeitzer JM, Czeisler CA. Decreased sensitivity to phase-delaying effects of moderate intensity light in older subjects. Neurobiol Aging. 2007;28(5):799-807. PubMed
41. Figueiro MG, Plitnick BA, Lok A, et al. Tailored lighting intervention improves measures of sleep, depression, and agitation in persons with Alzheimer’s disease and related dementia living in long-term care facilities. Clin Interv Aging. 2014;9:1527-1537. PubMed
© 2017 Society of Hospital Medicine