User login
The two leading measures of influenza activity – the percentage of respiratory specimens testing positive for influenza and the proportion of visits to health care providers for influenza-like illness (ILI) – had been following a similar downward path since mid-February. But during the week ending March 7, their paths diverged, according to the Centers for Disease Control and Prevention.
The percentage of respiratory specimens testing positive for influenza dropped for the fourth consecutive week, falling from 26.1% to 21.5%, while the proportion of visits to health care providers for ILI increased from 5.1% to 5.2%, the CDC’s influenza division reported.
One possible explanation for that rise: “The largest increases in ILI activity occurred in areas of the country where COVID-19 is most prevalent. More people may be seeking care for respiratory illness than usual at this time,” the influenza division said March 13 in its weekly Fluview report.
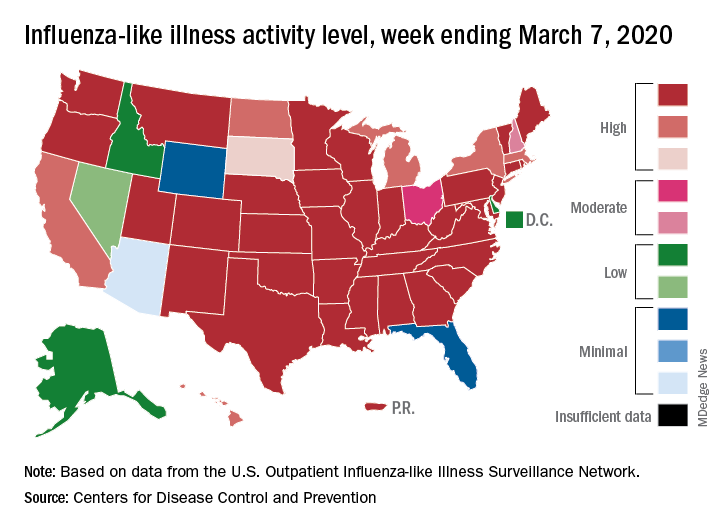
This week’s map puts 34 states and Puerto Rico at level 10 on the CDC’s 1-10 scale of ILI activity, one more state than the week before, and 43 jurisdictions in the “high” range of 8-10, compared with 42 the previous week, the CDC said.
Rates of hospitalizations associated with influenza “remain moderate compared to recent seasons, but rates for children 0-4 years and adults 18-49 years are now the highest CDC has on record for these age groups, surpassing rates reported during the 2009 H1N1 pandemic,” the Fluview report said. Rates for children aged 5-17 years “are higher than any recent regular season but remain lower than rates experienced by this age group during the pandemic.”
The number of pediatric deaths this season is now up to 144, equaling the total for all of the 2018-2019 season. This year’s count led the CDC to invoke 2009 again, since it “is higher for the same time period than in every season since reporting began in 2004-2005, except for the 2009 pandemic.”
For the 2019-2020 season so far there have been 36 million flu illnesses, 370,000 hospitalizations, and 22,000 deaths from flu and pneumonia, the CDC estimated.
The two leading measures of influenza activity – the percentage of respiratory specimens testing positive for influenza and the proportion of visits to health care providers for influenza-like illness (ILI) – had been following a similar downward path since mid-February. But during the week ending March 7, their paths diverged, according to the Centers for Disease Control and Prevention.
The percentage of respiratory specimens testing positive for influenza dropped for the fourth consecutive week, falling from 26.1% to 21.5%, while the proportion of visits to health care providers for ILI increased from 5.1% to 5.2%, the CDC’s influenza division reported.
One possible explanation for that rise: “The largest increases in ILI activity occurred in areas of the country where COVID-19 is most prevalent. More people may be seeking care for respiratory illness than usual at this time,” the influenza division said March 13 in its weekly Fluview report.
This week’s map puts 34 states and Puerto Rico at level 10 on the CDC’s 1-10 scale of ILI activity, one more state than the week before, and 43 jurisdictions in the “high” range of 8-10, compared with 42 the previous week, the CDC said.
Rates of hospitalizations associated with influenza “remain moderate compared to recent seasons, but rates for children 0-4 years and adults 18-49 years are now the highest CDC has on record for these age groups, surpassing rates reported during the 2009 H1N1 pandemic,” the Fluview report said. Rates for children aged 5-17 years “are higher than any recent regular season but remain lower than rates experienced by this age group during the pandemic.”
The number of pediatric deaths this season is now up to 144, equaling the total for all of the 2018-2019 season. This year’s count led the CDC to invoke 2009 again, since it “is higher for the same time period than in every season since reporting began in 2004-2005, except for the 2009 pandemic.”
For the 2019-2020 season so far there have been 36 million flu illnesses, 370,000 hospitalizations, and 22,000 deaths from flu and pneumonia, the CDC estimated.