User login
Person‐organization fit concerns the conditions and consequences of compatibility between people and the organizations for which they work.[1] Studies of other industries have demonstrated that person‐organization fit informs the way individuals join, perform in, and are retained by organizations.[2] Person‐job fit is a closely related subordinate concept that concerns the alignment of workers and their job in as much as workers have needs that their job supplies, or conversely, jobs have requirements that certain workers' abilities can help meet.[3] Explorations of job fit in physicians and their work have recently emerged in a few investigations published in medical journals.[4, 5, 6, 7, 8] Further expanding the understanding of fit between physicians and their employment is important, because the decline of solo practices and recent emphasis on team‐based care have led to a growing number of US physicians working in organizations.[9]
The movement of physicians into employed situations may continue if certain types of Accountable Care Organizations take root.[10] And physicians may be primed to join employer organizations based on current career priorities of individuals in American society. Surveys of medical residents entering the workforce reveal more physicians preferring the security of being employees than starting their own practices.[11] Given these trends, job fit will inform our understanding of how personal and job characteristics facilitate recruitment, performance, satisfaction, and longevity of physician employees.
BACKGROUND
Virtually all hospitalists work in organizationshospitalsand are employees of hospitals, medical schools, physician group practices, or management companies, and therefore invariably function within organizational structures and systems.[7] In spite of their rapid growth in numbers, many employers have faced difficulties recruiting and retaining enough hospitalists to fill their staffing needs. Consequently, the US hospitalist workforce today is characterized by high salaries, work load, and attrition rates.[12]
In this evolving unsaturated market, the attraction‐selection‐attrition framework[13] provides a theoretical construct that predicts that hospitalists and their employers would seek congruence of goals and values early in their relationship through a process of trial and error. This framework assumes that early interactions between workers and organizations serve as opportunities for them to understand if job fit is poor and dissociate or remain affiliated as long as job fit is mutually acceptable. Therefore, job switching on average is expected to increase job fit because workers and organizations gain a better understanding of their own goals and values and choose more wisely the next time.
Other theoretical frameworks, such as the job characteristic model,[14] suggest that over time as workers stay at the same job, they continue to maintain and improve job fit through various workplace‐ or self‐modification strategies. For example, seniority status may have privileges (eg, less undesirable call), or workers may create privileged niches through the acquisition of new skills and abilities over time. Hospitalists' tendency to diversify their work‐related activities by incorporating administrative and teaching responsibilities[15] may thus contribute to improving job fit. Additionally, as a measure of complementarity among people who work together, job fit may be influenced by the quality of relationships among hospitalists and their coworkers through their reorientation to the prevailing organizational climate[16, 17] and increasing socialization.[18] Finally, given that experiential learning is known to contribute to better hospitalist work performance,[19] job fit may affect productivity and clinical outcomes vis‐‐vis quality of work life.
To test the validity of these assumptions in a sample of hospitalists, we critically appraised the following 4 hypotheses:
- Hypothesis 1 (H1): Job attrition and reselection improves job fit among hospitalists entering the job market.
- Hypothesis 2 (H2): Better job fit is achieved through hospitalists engaging a variety of personal skills and abilities.
- Hypothesis 3 (H3): Job fit increases with hospitalists' job duration together with socialization and internalization of organizational values.
- Hypothesis 4 (H4): Job fit is correlated with hospitalists' quality of work life.
METHODS
Analysis was performed on data from the 2009 to 2010 Hospital Medicine Physician Worklife Survey. The sample frame included nonmembers and members of Society of Hospital Medicine (SHM). Details about sampling strategy, data collection, and data quality are available in previous publications.[7, 20] The 118‐item survey instrument, including 9 demographic items and 24 practice and job characteristic items, was administered by mail. Examples of information solicited through these items included respondents' practice model, the number of hospitalist jobs they have held, and the specific kinds of clinical and nonclinical activities they performed as part of their current job.
We used a reliable but broad and generic measure of self‐perceived person‐job fit.[21] The survey items of the 5‐point Likert‐type scale anchored between strongly disagree and strongly agree were: I feel that my work utilizes my full abilities, I feel competent and fully able to handle my job, my job gives me the chance to do the things I feel I do best, I feel that my job and I are well‐matched, I feel I have adequate preparation for the job I now hold. The quality of hospitalists' relationships with physician colleagues, staff, and patients as well as job satisfaction was measured using scales adapted from the Physician Worklife Study.[22] Organizational climate was measured using an adapted scale from the Minimizing Error, Maximizing Outcome study incorporating 3 items from the cohesiveness subscale, 4 items from the organizational trust subscale, and 1 item from the quality emphasis subscale that were most pertinent to hospitalists' relationship with their organizations.[23] Intent to leave practice or reduce work hours was measured using 5 items from the Multi‐Center Hospitalist Survey Project.[24] Frequency of participation in suboptimal patient care was measured by adapting 3 items from the suboptimal reported practice subscale and 2 items from the suboptimal patient care subscale developed by Shanafelt et al.[25] Stress and job burnout were assessed using validated measures.[26, 27] Detailed descriptions of the response rate calculation and imputation of missing item data are available in previous publications.[7, 20]
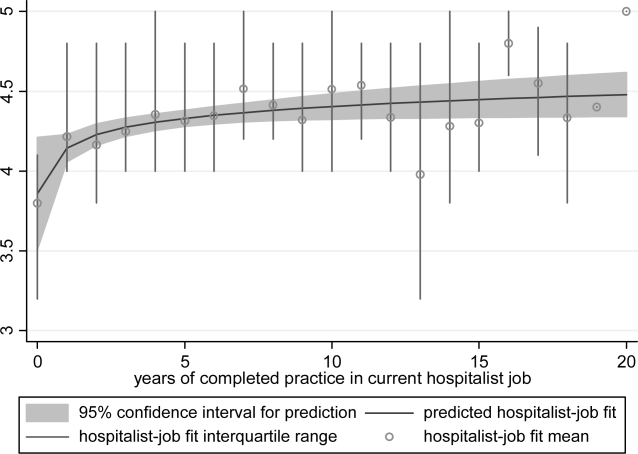
Mean, variance, range, and skew were used to characterize the responses to the job fit survey scale. A table of respondent characteristics was constructed. A visual representation of job fit by individual hospitalist year in current practice was created, first, by plotting a locally weighted scatterplot smoothing curve to examine the shape of the general relationship, and second, by fitting a similarly contoured functional polynomial curve with 95% confidence intervals (CI) to a plot of the mean and interquartile range of job fit for each year in current practice. Spearman partial correlations were calculated for job fit and each of the 5 items addressing likelihood of leaving practice or reducing workload adjusted for gender to control for the higher proportion of women who plan to work part time. Median (interquartile range) job fit was calculated for categories defined by the number of job changes and compared with the reference category (no job change) using the nonparametric rank sum test for comparing non‐normally distributed data. Multivariate logistic regression models were used to calculate the odds ratio (OR) of participating in each of several clinical and nonclinical hospitalist activities between respondents whose job fit score was optimal (5 on a 5‐point scale) and less than optimal controlling for covariates that influence the likelihood of participating in these activities (years in current practice, practice model, and specialty training). A Spearman correlation matrix was created to assess interscale correlations among organizational parameters (years in current practice, job fit, organizational climate, and relationship with colleagues, staff, and patients). Finally, a separate Spearman correlation matrix was created to assess the interscale correlations among individual worker parameters (job fit, suboptimal patient care, job burnout, stress, and job satisfaction). Statistical significance was defined as P value <0.05, and all analyses were performed on Stata 11.0 (StataCorp, College Station, TX). The Northwestern University institutional review board approved this study.
RESULTS
Respondents included 816 hospitalists belonging to around 700 unique organizations. The adjusted response rate from the stratified sample was 26%. Respondents and nonrespondents were similar with regard to geographic region and model of practice, but respondents were more likely to be members of the SHM than nonrespondents. Panel A of Table 1 shows the demographic characteristics of the respondents. The mean age was 44.3 years, and about one‐third were women. The average hospitalist had about 7 years of experience in the specialty and about 5 years with their current hospitalist job. The majority were trained in internal medicine or one of its subspecialties, whereas pediatricians, family physicians, and physicians with other training made up the remainder.
| Panel A | Panel B | ||
|---|---|---|---|
| Total | Assimilation Period Hospitalists | Advancement Period Hospitalists | |
| |||
| Total, n | 816 | 103 | 713 |
| Female, n (%) | 284 (35) | 37 (36) | 247 (35) |
| Age, mean (SD) | 44.3 (9.0) | 41.9 (9.3) | 44.7 (8.9) |
| Years postresidency experience as hospitalist, mean (SD) | 6.9 (4.5) | 4.3 (3.1) | 7.2 (4.6) |
| Years in current practice, mean (SD) | 5.1 (3.9) | 0.9 (0.3) | 6.7 (3.8) |
| Specialty training, n (%) | |||
| Internal medicine | 555 (68) | 75 (73) | 480 (67) |
| Pediatrics | 117 (14) | 8 (8) | 109 (15.3) |
| Family medicine | 49 (6) | 7 (7) | 42 (6) |
| Other | 95 (11) | 13 (13) | 82 (12) |
Job fit was highly skewed toward optimum fit, with a mean of 4.3 on a scale of 1 to 5, with a narrow standard deviation of 0.7. The poorest job fit was reported by 0.3%, whereas optimal fit was reported by 21% of respondents. Job fit plotted against years in current practice had a logarithmic appearance typical of learning curves (Figure 1). An inflection point was visualized at around 2 years. For the purposes of this article, we refer to hospitalists' experience in the first 2 years of a job as an assimilation period, which is marked by a steep increase in job fit early when rapid learning or attrition took place. The years beyond the inflection point are characterized as an advancement period, when a more attenuated rise in job fit was experienced with time. The Spearman correlation between job fit and years in practice during the advancement period was 0.145 (n = 678, P < 0.001). Panel B of Table 1 displays the characteristics of respondents separately for the assimilation and advancement cohorts. Assimilation hospitalists in our sample had a mean age of 41.9 years and mean on‐the‐job experience of 4.3 years, reflecting that many hospitalists in the first 2 years of a job have made at least 1 job change in the past.

To show the effects of attrition and reselection, we first evaluated the proposition that hospitalists experience attrition (ie, intend to leave their jobs) in response to poor fit. Table 2 shows the correlations between job fit and the self‐reported intent to leave practice or reduce workload separately for the assimilation and advancement periods. For hospitalists in the assimilation period, job fit was negatively correlated with intent to leave current practice within 2 years and to leave hospital medicine within 5 years (P = 0.010 and 0.043, respectively). Hospitalists with <2 years in their current job, therefore, tended to consider attrition but not workload reduction to deal with poor job fit. On the other hand, hospitalists in the advancement period considered both attrition and workload reduction strategies in response to poor fit (all P < 0.001).
| Assimilation Period Hospitalists | Advancement Period Hospitalists | |||
|---|---|---|---|---|
| Rho | P Value | Rho | P Value | |
| Likelihood that a hospitalist will: | ||||
| Leave current practice within 2 years | 0.253 | 0.010 | 0.367 | <0.001 |
| Decrease total work hours within 5 years | 0.060 | 0.548 | 0.179 | <0.001 |
| Decrease clinical work hours within 5 years | 0.072 | 0.469 | 0.144 | <0.001 |
| Leave hospital medicine within 5 years | 0.200 | 0.043 | 0.231 | <0.001 |
| Leave direct patient care within 5 years | 0.040 | 0.691 | 0.212 | <0.001 |
In Table 3, we further compared the median job fit across categories for the number of job switches. The median job fit during the assimilation period of hospitalists who had made 1 job change was slightly but statistically higher than the job fit of their counterparts who never left their first job (4.4 vs 4.0, P = 0.046). This suggests that job switching by hospitalists early in their jobs is associated with improved job fit (H1). However, the fit during the assimilation period of hospitalists who switched jobs twice or more was statistically no different from the fit of those in their first jobs, suggesting that the effect of the attrition‐reselection strategy is weak or inconsistent. The job fit for advancement period hospitalists was also different across the job change and no‐change categories. However, in the case of hospitalists later in their jobs, the median job fit was slightly but statistically lower among those who made job changes, revealing the potential drop in job fit that occurs when a hospitalist already established in his or her job starts over again in a new setting.
| n | Age, Mean (95% CI), y | Hospitalist‐Job Fit, Median (IQR) | P Valuea | |
|---|---|---|---|---|
| ||||
| Assimilation period hospitalistsb | ||||
| No job change | 29 | 42.3 (37.347.3) | 4.0 (3.84.4) | Reference |
| 1 job change | 39 | 40.3 (38.142.5) | 4.4 (4.04.8) | 0.046 |
| 2 or more job changes | 27 | 43.8 (41.046.6) | 4.4 (3.84.8) | 0.153 |
| Advancement period hospitalistsc | ||||
| No job change | 390 | 44.5 (43.645.5) | 4.6 (4.05.0) | Reference |
| 1 job change | 183 | 45.0 (43.746.3) | 4.2 (4.04.8) | 0.002 |
| 2 or more job changes | 99 | 44.9 (43.146.6) | 4.2 (3.84.8) | 0.002 |
We hypothesized that hospitalists who achieved high job fit within a particular job were more likely to have engaged in activities that utilize a wider spectrum of their abilities. As shown in Table 4, hospitalists in the highest quartile of job fit were associated with a general trend toward higher odds of participating in a variety of common clinical and nonclinical hospitalist activities, but only the odds ratio associated with teaching achieved statistical significance (OR: 1.53, 95% CI: 1.01‐2.31) (H2).
| Participation, n/N (%) | Odds Ratio (95% CI) | P Value | |
|---|---|---|---|
| |||
| Administrative or committee work | 704/816 (86) | 0.73 (0.431.26) | 0.262 |
| Quality improvement or patient safety initiatives | 678/816 (83) | 1.13 (0.642.00) | 0.680 |
| Information technology design or implementation | 379/816 (46) | 1.18 (0.801.73) | 0.408 |
| Any of the above leadership activities | 758/816 (93) | 1.31 (0.563.05) | 0.535 |
| Teaching | 442/816 (54) | 1.53 (1.012.31) | 0.046 |
| Research | 120/816 (15) | 1.07 (0.601.92) | 0.816 |
| Any of the above academic activities | 457/816 (56) | 1.50 (0.992.27) | 0.057 |
| Code team or rapid response team | 437/816 (54) | 1.13 (0.771.68) | 0.533 |
| Intensive care unit | 254/816 (31) | 0.84 (0.531.35) | 0.469 |
| Skilled nursing facility or long‐term acute care facility | 126/816 (15) | 1.06 (0.621.81) | 0.835 |
| Outpatient general medical practice | 44/816 (5) | 1.75 (0.813.80) | 0.157 |
| Any of the above clinical activities | 681/816 (79) | 1.02 (0.601.76) | 0.930 |
Socialization with peers and the gradual sharing of values within organizations are hypothesized mechanisms for increasing job fit with time. We found that the number of years in current practice was positively correlated with job fit (Spearman coefficient R = 0.149, P < 0.001), organizational climate (R = 0.128, P < 0.001), and relationship with nonphysician staff (R = 0.102, P < 0.01). The association between years in practice and relationship with physician colleagues were weaker (R = 0.079, P < 0.05). Consistent with the episodic nature of patients' encounters with hospitalists, the measure of patient relationships was not significantly associated with length of time in job. In addition, we found substantial correlations among job fit, organizational climate, and all the relational measures (all R > 0.280, P < 0.001), indicating that hospitalists increasingly share the values of their organizations over time (H3).
Finally, we also hypothesized that poor job fit is associated with poor performance and quality of work life. Strong correlations with job fit were noted for stress (R = 0.307, P < 0.001), job burnout (R = 0.360, P < 0.001), and job satisfaction (R = 0.570, P < 0.001). Job fit (R = 0.147, P < 0.001), job burnout (R = 0.236, P < 0.001), stress (R = 0.305, P < 0.001), and job satisfaction (R = 0.224, P < 0.001) were all significantly correlated with the frequency of participating in suboptimal care (H4).
DISCUSSION
In this exploratory analysis, we validated in the hospitalist workforce several assumptions about person‐job fit that have been observed in workers of other industries. We observed attrition‐reselection (ie, job switching) as a strategy used by physicians to achieve better fit early in their job tenure, whereas job modification appeared to be more effective than attrition‐reselection among physicians already established in their jobs. We provided weak but plausible evidence that physicians with optimal job fit had a tendency to participate in activities (eg, teaching) that engage a wider set of interests and abilities. We also demonstrated the growth in hospitalists sharing the values of their organization through the time‐dependent associations among organizational climate, relational measures, and job fit. Finally, we found that physicians with suboptimal job fit were more likely to report poor performance in their work compared to those indicating optimal fit.
Our previous analysis of data from the Hospital Medicine Physician Worklife Survey exposed the widely variable work characteristics of hospitalist jobs in the US market and the equally variable preferences and priorities of individual hospitalists in selecting their work setting.[7] The implication of our present study is that hospitalists achieve the high levels of observed job fit using various strategies that aid their alignment with their employment. One of these strategies involves time, but physician longevity in practice may be both a determinant and product of good job fit. Although early job attrition may be necessary for fitting the right hospitalists to the right jobs, employers may appreciate the importance of retaining experienced hospitalists not only for cost and performance considerations but also for the growth of social capital in organizations consisting of enduring individuals. As our data suggest that hospitalists grow with their jobs, physicians may experience better fit with jobs that flexibly couple their work demands with benefits that address their individual work‐life needs over time. Another implication of this study is that job fit is a useful and predictive measure of job selection, performance, and retention. In light of studies that expose the limitations of job satisfaction as a measure influenced more by workers' dispositional affect (ie, their temperament and outlook) than their compatibility with their jobs,[28] job fit may add a functional dimension to traditional employee feedback measures.
There are limitations to this analysis. The most notable is the low survey response rate. Two reasons contributed to the fairly low rate of return. First, the original sampling frame included many outdated addresses and names of individuals who did not meet inclusion criteria. Although all sampled individuals who would have been excluded from the study could not be identified, we calculated our response rate without accounting for the proportion of potential ineligibles in the denominator population [Response Rate 2 (RR2) according to standards of the American Association of Public Opinion Research].[29] Second, the response rates of physician surveys have seen a steady decline over the years.[30] Respondents to our survey may be older and more experienced than US hospitalists in general. Although concerns about bias from under‐reporting cannot be fully addressed, we believe that the study sample is adequate for this preliminary study intended to translate the evidence of observed phenomena from the nonphysician to the physician workforces. The suboptimal response characteristics (high skew and low variability) of the generic person‐job fit survey scale used in this study indicate that a reliable survey instrument specifically designed to measure physician‐job fit need to be constructed de novo and validated for any future study. Although we performed simple analyses to support our assertions, few of our subanalyses may be underpowered, contributing to overinterpretation of the data. Additional empirical work is also necessary to assess the generalizability of this study's claims in other medical and surgical specialties. Such studies would also allow measurement of the sensitivity and specificity of physicians' self‐identification of poor job fit. Finally, additional investigations of this time‐dependent construct are more appropriately performed using a longitudinal study design to overcome the limitations inherent in this cross‐sectional analysis. Our conclusions about the time‐dependent features of job fit may be explained by other characteristics such as generational and cultural differences among hospitalists with varying experience.
As the US healthcare system reorganizes to bolster accountability,[31] we anticipate increasing interdependence between physicians and their employer organizations. Ultimately, the desired accountability in healthcare is likely to be obtained if physicians function not only as passive and interchangeable employees but as active stakeholders in the achievement of each organization's goals. A methodology for assessing the alignment of physicians and their jobs will continue to be important along the way.
Disclosure
Nothing to report.
- . Person‐organization fit: an integrative review of its conceptualizations, measurement, and implications. Personnel Psychol. 1996;49:1–49.
- , , . Consequences of individuals' fit at work: a meta‐analysis of person‐job, person‐organization, person‐group, and person‐supervisor fit. Personnel Psychol. 2005;58(2):281–342.
- .Person‐job fit: a conceptual integration, literature review and methodological critique. In: Cooper CL, Robertson IT, eds. International Review of Industrial and Organizational Psychology. Vol.6. New York, NY:John Wiley 1991.
- . Organizational culture, person‐culture fit, and turnover: a replication in the health care industry. J Organ Behav. 1999;20(2):175–184.
- , , , . Organizational culture and physician satisfaction with dimensions of group practice. Health Serv Res. 2007;42(3 pt 1):1150–1176.
- , , , et al. Career fit and burnout among academic faculty. Arch Intern Med. 2009;169(10):990–995.
- , , , , . Job characteristics, satisfaction, and burnout across hospitalist practice models. J Hosp Med. 2012;7(5):402–410.
- . Provider‐hospital “fit” and patient outcomes: evidence from Massachusetts cardiac surgeons, 2002–2004. Health Serv Res. 2011;46(1 pt 1):1–26.
- . The evolving primary care physician. N Engl J Med. 2012;366(20):1849–1853.
- , . Hospitals' race to employ physicians—the logic behind a money‐losing proposition. N Engl J Med. 2011;364(19):1790–1793.
- 2011 Survey of Final‐Year Medical Residents. Irving, TX:Merritt Hawkins;2011.
- State of Hospital Medicine: 2010 Report Based on 2009 Data. Englewood, CO:Society of Hospital Medicine and the Medical Group Management Association;2010.
- , , . The ASA framework: an update. Personnel Psychol. 1995;48(4):747–773.
- , . Work Redesign. Reading. MA:Addison‐Wesley;1980.
- , . The expanding role of hospitalists in the United States. Swiss Med Wkly. 2006;136(37–38):591–596.
- , . Organizational socialization as a learning‐process—the role of information acquisition. Personnel Psychol. 1992;45(4):849–874.
- , . The moderating effect of tenure in person‐environment fit: a field study in educational organizations. J Occup Organ Psych. 1997;70:173–188.
- . Matching people and organizations—selection and socialization in public accounting firms. Admin Sci Quart. 1991;36(3):459–484.
- , , , et al. Effects of physician experience on costs and outcomes on an academic general medicine service: results of a trial of hospitalists. Ann Intern Med. 2002;137(11):866–874.
- , , , , . Worklife and satisfaction of hospitalists: toward flourishing careers. J Gen Intern Med. 2012;27(1):28–36.
- . Karasek's model in the People's Republic of China: effects of job demands, control, and individual differences. Acad Manage J. 1996;39(6):1594–1618.
- , , , et al. Measuring physician job satisfaction in a changing workplace and a challenging environment. SGIM Career Satisfaction Study Group. Society of General Internal Medicine. Med Care. 1999;37(11):1174–1182.
- , , , et al. Organizational climate, stress, and error in primary care: The MEMO Study. Adv Patient Saf. 2005;1:65–77.
- , , , et al. Effects of inpatient experience on outcomes and costs in a multicenter trial of academic hospitalists. J Gen Intern Med. 2005;20(suppl 1):141–142.
- , , , . Burnout and self‐reported patient care in an internal medicine residency program. Ann Intern Med. 2002;136(5):358–367.
- , . Effect of job demands and social support on worker stress—a study of VDT users. Behav Inform Technol. 1995;14(1):32–40.
- , , . Validation of a single‐item measure of burnout against the Maslach Burnout Inventory among physicians. Stress Health. 2004;20(2):75–79.
- , . Job satisfaction: a meta‐analysis of stabilities. J Organ Behav. 2001;22(5):483–504.
- The American Association for Public Opinion Research. Standard definitions: final dispositions of case codes and outcome rates for surveys.7th ed. Available at: http://www.aapor.org/Standard_Definitions2.htm. Accessed May 2,2012.
- , , , . Response rates and response bias for 50 surveys of pediatricians. Health Serv Res. 2005;40(1):213–226.
- , . Accountable care organizations: accountable for what, to whom, and how. JAMA. 2010;304(15):1715–6.
Person‐organization fit concerns the conditions and consequences of compatibility between people and the organizations for which they work.[1] Studies of other industries have demonstrated that person‐organization fit informs the way individuals join, perform in, and are retained by organizations.[2] Person‐job fit is a closely related subordinate concept that concerns the alignment of workers and their job in as much as workers have needs that their job supplies, or conversely, jobs have requirements that certain workers' abilities can help meet.[3] Explorations of job fit in physicians and their work have recently emerged in a few investigations published in medical journals.[4, 5, 6, 7, 8] Further expanding the understanding of fit between physicians and their employment is important, because the decline of solo practices and recent emphasis on team‐based care have led to a growing number of US physicians working in organizations.[9]
The movement of physicians into employed situations may continue if certain types of Accountable Care Organizations take root.[10] And physicians may be primed to join employer organizations based on current career priorities of individuals in American society. Surveys of medical residents entering the workforce reveal more physicians preferring the security of being employees than starting their own practices.[11] Given these trends, job fit will inform our understanding of how personal and job characteristics facilitate recruitment, performance, satisfaction, and longevity of physician employees.
BACKGROUND
Virtually all hospitalists work in organizationshospitalsand are employees of hospitals, medical schools, physician group practices, or management companies, and therefore invariably function within organizational structures and systems.[7] In spite of their rapid growth in numbers, many employers have faced difficulties recruiting and retaining enough hospitalists to fill their staffing needs. Consequently, the US hospitalist workforce today is characterized by high salaries, work load, and attrition rates.[12]
In this evolving unsaturated market, the attraction‐selection‐attrition framework[13] provides a theoretical construct that predicts that hospitalists and their employers would seek congruence of goals and values early in their relationship through a process of trial and error. This framework assumes that early interactions between workers and organizations serve as opportunities for them to understand if job fit is poor and dissociate or remain affiliated as long as job fit is mutually acceptable. Therefore, job switching on average is expected to increase job fit because workers and organizations gain a better understanding of their own goals and values and choose more wisely the next time.
Other theoretical frameworks, such as the job characteristic model,[14] suggest that over time as workers stay at the same job, they continue to maintain and improve job fit through various workplace‐ or self‐modification strategies. For example, seniority status may have privileges (eg, less undesirable call), or workers may create privileged niches through the acquisition of new skills and abilities over time. Hospitalists' tendency to diversify their work‐related activities by incorporating administrative and teaching responsibilities[15] may thus contribute to improving job fit. Additionally, as a measure of complementarity among people who work together, job fit may be influenced by the quality of relationships among hospitalists and their coworkers through their reorientation to the prevailing organizational climate[16, 17] and increasing socialization.[18] Finally, given that experiential learning is known to contribute to better hospitalist work performance,[19] job fit may affect productivity and clinical outcomes vis‐‐vis quality of work life.
To test the validity of these assumptions in a sample of hospitalists, we critically appraised the following 4 hypotheses:
- Hypothesis 1 (H1): Job attrition and reselection improves job fit among hospitalists entering the job market.
- Hypothesis 2 (H2): Better job fit is achieved through hospitalists engaging a variety of personal skills and abilities.
- Hypothesis 3 (H3): Job fit increases with hospitalists' job duration together with socialization and internalization of organizational values.
- Hypothesis 4 (H4): Job fit is correlated with hospitalists' quality of work life.
METHODS
Analysis was performed on data from the 2009 to 2010 Hospital Medicine Physician Worklife Survey. The sample frame included nonmembers and members of Society of Hospital Medicine (SHM). Details about sampling strategy, data collection, and data quality are available in previous publications.[7, 20] The 118‐item survey instrument, including 9 demographic items and 24 practice and job characteristic items, was administered by mail. Examples of information solicited through these items included respondents' practice model, the number of hospitalist jobs they have held, and the specific kinds of clinical and nonclinical activities they performed as part of their current job.
We used a reliable but broad and generic measure of self‐perceived person‐job fit.[21] The survey items of the 5‐point Likert‐type scale anchored between strongly disagree and strongly agree were: I feel that my work utilizes my full abilities, I feel competent and fully able to handle my job, my job gives me the chance to do the things I feel I do best, I feel that my job and I are well‐matched, I feel I have adequate preparation for the job I now hold. The quality of hospitalists' relationships with physician colleagues, staff, and patients as well as job satisfaction was measured using scales adapted from the Physician Worklife Study.[22] Organizational climate was measured using an adapted scale from the Minimizing Error, Maximizing Outcome study incorporating 3 items from the cohesiveness subscale, 4 items from the organizational trust subscale, and 1 item from the quality emphasis subscale that were most pertinent to hospitalists' relationship with their organizations.[23] Intent to leave practice or reduce work hours was measured using 5 items from the Multi‐Center Hospitalist Survey Project.[24] Frequency of participation in suboptimal patient care was measured by adapting 3 items from the suboptimal reported practice subscale and 2 items from the suboptimal patient care subscale developed by Shanafelt et al.[25] Stress and job burnout were assessed using validated measures.[26, 27] Detailed descriptions of the response rate calculation and imputation of missing item data are available in previous publications.[7, 20]
Mean, variance, range, and skew were used to characterize the responses to the job fit survey scale. A table of respondent characteristics was constructed. A visual representation of job fit by individual hospitalist year in current practice was created, first, by plotting a locally weighted scatterplot smoothing curve to examine the shape of the general relationship, and second, by fitting a similarly contoured functional polynomial curve with 95% confidence intervals (CI) to a plot of the mean and interquartile range of job fit for each year in current practice. Spearman partial correlations were calculated for job fit and each of the 5 items addressing likelihood of leaving practice or reducing workload adjusted for gender to control for the higher proportion of women who plan to work part time. Median (interquartile range) job fit was calculated for categories defined by the number of job changes and compared with the reference category (no job change) using the nonparametric rank sum test for comparing non‐normally distributed data. Multivariate logistic regression models were used to calculate the odds ratio (OR) of participating in each of several clinical and nonclinical hospitalist activities between respondents whose job fit score was optimal (5 on a 5‐point scale) and less than optimal controlling for covariates that influence the likelihood of participating in these activities (years in current practice, practice model, and specialty training). A Spearman correlation matrix was created to assess interscale correlations among organizational parameters (years in current practice, job fit, organizational climate, and relationship with colleagues, staff, and patients). Finally, a separate Spearman correlation matrix was created to assess the interscale correlations among individual worker parameters (job fit, suboptimal patient care, job burnout, stress, and job satisfaction). Statistical significance was defined as P value <0.05, and all analyses were performed on Stata 11.0 (StataCorp, College Station, TX). The Northwestern University institutional review board approved this study.
RESULTS
Respondents included 816 hospitalists belonging to around 700 unique organizations. The adjusted response rate from the stratified sample was 26%. Respondents and nonrespondents were similar with regard to geographic region and model of practice, but respondents were more likely to be members of the SHM than nonrespondents. Panel A of Table 1 shows the demographic characteristics of the respondents. The mean age was 44.3 years, and about one‐third were women. The average hospitalist had about 7 years of experience in the specialty and about 5 years with their current hospitalist job. The majority were trained in internal medicine or one of its subspecialties, whereas pediatricians, family physicians, and physicians with other training made up the remainder.
| Panel A | Panel B | ||
|---|---|---|---|
| Total | Assimilation Period Hospitalists | Advancement Period Hospitalists | |
| |||
| Total, n | 816 | 103 | 713 |
| Female, n (%) | 284 (35) | 37 (36) | 247 (35) |
| Age, mean (SD) | 44.3 (9.0) | 41.9 (9.3) | 44.7 (8.9) |
| Years postresidency experience as hospitalist, mean (SD) | 6.9 (4.5) | 4.3 (3.1) | 7.2 (4.6) |
| Years in current practice, mean (SD) | 5.1 (3.9) | 0.9 (0.3) | 6.7 (3.8) |
| Specialty training, n (%) | |||
| Internal medicine | 555 (68) | 75 (73) | 480 (67) |
| Pediatrics | 117 (14) | 8 (8) | 109 (15.3) |
| Family medicine | 49 (6) | 7 (7) | 42 (6) |
| Other | 95 (11) | 13 (13) | 82 (12) |
Job fit was highly skewed toward optimum fit, with a mean of 4.3 on a scale of 1 to 5, with a narrow standard deviation of 0.7. The poorest job fit was reported by 0.3%, whereas optimal fit was reported by 21% of respondents. Job fit plotted against years in current practice had a logarithmic appearance typical of learning curves (Figure 1). An inflection point was visualized at around 2 years. For the purposes of this article, we refer to hospitalists' experience in the first 2 years of a job as an assimilation period, which is marked by a steep increase in job fit early when rapid learning or attrition took place. The years beyond the inflection point are characterized as an advancement period, when a more attenuated rise in job fit was experienced with time. The Spearman correlation between job fit and years in practice during the advancement period was 0.145 (n = 678, P < 0.001). Panel B of Table 1 displays the characteristics of respondents separately for the assimilation and advancement cohorts. Assimilation hospitalists in our sample had a mean age of 41.9 years and mean on‐the‐job experience of 4.3 years, reflecting that many hospitalists in the first 2 years of a job have made at least 1 job change in the past.
To show the effects of attrition and reselection, we first evaluated the proposition that hospitalists experience attrition (ie, intend to leave their jobs) in response to poor fit. Table 2 shows the correlations between job fit and the self‐reported intent to leave practice or reduce workload separately for the assimilation and advancement periods. For hospitalists in the assimilation period, job fit was negatively correlated with intent to leave current practice within 2 years and to leave hospital medicine within 5 years (P = 0.010 and 0.043, respectively). Hospitalists with <2 years in their current job, therefore, tended to consider attrition but not workload reduction to deal with poor job fit. On the other hand, hospitalists in the advancement period considered both attrition and workload reduction strategies in response to poor fit (all P < 0.001).
| Assimilation Period Hospitalists | Advancement Period Hospitalists | |||
|---|---|---|---|---|
| Rho | P Value | Rho | P Value | |
| Likelihood that a hospitalist will: | ||||
| Leave current practice within 2 years | 0.253 | 0.010 | 0.367 | <0.001 |
| Decrease total work hours within 5 years | 0.060 | 0.548 | 0.179 | <0.001 |
| Decrease clinical work hours within 5 years | 0.072 | 0.469 | 0.144 | <0.001 |
| Leave hospital medicine within 5 years | 0.200 | 0.043 | 0.231 | <0.001 |
| Leave direct patient care within 5 years | 0.040 | 0.691 | 0.212 | <0.001 |
In Table 3, we further compared the median job fit across categories for the number of job switches. The median job fit during the assimilation period of hospitalists who had made 1 job change was slightly but statistically higher than the job fit of their counterparts who never left their first job (4.4 vs 4.0, P = 0.046). This suggests that job switching by hospitalists early in their jobs is associated with improved job fit (H1). However, the fit during the assimilation period of hospitalists who switched jobs twice or more was statistically no different from the fit of those in their first jobs, suggesting that the effect of the attrition‐reselection strategy is weak or inconsistent. The job fit for advancement period hospitalists was also different across the job change and no‐change categories. However, in the case of hospitalists later in their jobs, the median job fit was slightly but statistically lower among those who made job changes, revealing the potential drop in job fit that occurs when a hospitalist already established in his or her job starts over again in a new setting.
| n | Age, Mean (95% CI), y | Hospitalist‐Job Fit, Median (IQR) | P Valuea | |
|---|---|---|---|---|
| ||||
| Assimilation period hospitalistsb | ||||
| No job change | 29 | 42.3 (37.347.3) | 4.0 (3.84.4) | Reference |
| 1 job change | 39 | 40.3 (38.142.5) | 4.4 (4.04.8) | 0.046 |
| 2 or more job changes | 27 | 43.8 (41.046.6) | 4.4 (3.84.8) | 0.153 |
| Advancement period hospitalistsc | ||||
| No job change | 390 | 44.5 (43.645.5) | 4.6 (4.05.0) | Reference |
| 1 job change | 183 | 45.0 (43.746.3) | 4.2 (4.04.8) | 0.002 |
| 2 or more job changes | 99 | 44.9 (43.146.6) | 4.2 (3.84.8) | 0.002 |
We hypothesized that hospitalists who achieved high job fit within a particular job were more likely to have engaged in activities that utilize a wider spectrum of their abilities. As shown in Table 4, hospitalists in the highest quartile of job fit were associated with a general trend toward higher odds of participating in a variety of common clinical and nonclinical hospitalist activities, but only the odds ratio associated with teaching achieved statistical significance (OR: 1.53, 95% CI: 1.01‐2.31) (H2).
| Participation, n/N (%) | Odds Ratio (95% CI) | P Value | |
|---|---|---|---|
| |||
| Administrative or committee work | 704/816 (86) | 0.73 (0.431.26) | 0.262 |
| Quality improvement or patient safety initiatives | 678/816 (83) | 1.13 (0.642.00) | 0.680 |
| Information technology design or implementation | 379/816 (46) | 1.18 (0.801.73) | 0.408 |
| Any of the above leadership activities | 758/816 (93) | 1.31 (0.563.05) | 0.535 |
| Teaching | 442/816 (54) | 1.53 (1.012.31) | 0.046 |
| Research | 120/816 (15) | 1.07 (0.601.92) | 0.816 |
| Any of the above academic activities | 457/816 (56) | 1.50 (0.992.27) | 0.057 |
| Code team or rapid response team | 437/816 (54) | 1.13 (0.771.68) | 0.533 |
| Intensive care unit | 254/816 (31) | 0.84 (0.531.35) | 0.469 |
| Skilled nursing facility or long‐term acute care facility | 126/816 (15) | 1.06 (0.621.81) | 0.835 |
| Outpatient general medical practice | 44/816 (5) | 1.75 (0.813.80) | 0.157 |
| Any of the above clinical activities | 681/816 (79) | 1.02 (0.601.76) | 0.930 |
Socialization with peers and the gradual sharing of values within organizations are hypothesized mechanisms for increasing job fit with time. We found that the number of years in current practice was positively correlated with job fit (Spearman coefficient R = 0.149, P < 0.001), organizational climate (R = 0.128, P < 0.001), and relationship with nonphysician staff (R = 0.102, P < 0.01). The association between years in practice and relationship with physician colleagues were weaker (R = 0.079, P < 0.05). Consistent with the episodic nature of patients' encounters with hospitalists, the measure of patient relationships was not significantly associated with length of time in job. In addition, we found substantial correlations among job fit, organizational climate, and all the relational measures (all R > 0.280, P < 0.001), indicating that hospitalists increasingly share the values of their organizations over time (H3).
Finally, we also hypothesized that poor job fit is associated with poor performance and quality of work life. Strong correlations with job fit were noted for stress (R = 0.307, P < 0.001), job burnout (R = 0.360, P < 0.001), and job satisfaction (R = 0.570, P < 0.001). Job fit (R = 0.147, P < 0.001), job burnout (R = 0.236, P < 0.001), stress (R = 0.305, P < 0.001), and job satisfaction (R = 0.224, P < 0.001) were all significantly correlated with the frequency of participating in suboptimal care (H4).
DISCUSSION
In this exploratory analysis, we validated in the hospitalist workforce several assumptions about person‐job fit that have been observed in workers of other industries. We observed attrition‐reselection (ie, job switching) as a strategy used by physicians to achieve better fit early in their job tenure, whereas job modification appeared to be more effective than attrition‐reselection among physicians already established in their jobs. We provided weak but plausible evidence that physicians with optimal job fit had a tendency to participate in activities (eg, teaching) that engage a wider set of interests and abilities. We also demonstrated the growth in hospitalists sharing the values of their organization through the time‐dependent associations among organizational climate, relational measures, and job fit. Finally, we found that physicians with suboptimal job fit were more likely to report poor performance in their work compared to those indicating optimal fit.
Our previous analysis of data from the Hospital Medicine Physician Worklife Survey exposed the widely variable work characteristics of hospitalist jobs in the US market and the equally variable preferences and priorities of individual hospitalists in selecting their work setting.[7] The implication of our present study is that hospitalists achieve the high levels of observed job fit using various strategies that aid their alignment with their employment. One of these strategies involves time, but physician longevity in practice may be both a determinant and product of good job fit. Although early job attrition may be necessary for fitting the right hospitalists to the right jobs, employers may appreciate the importance of retaining experienced hospitalists not only for cost and performance considerations but also for the growth of social capital in organizations consisting of enduring individuals. As our data suggest that hospitalists grow with their jobs, physicians may experience better fit with jobs that flexibly couple their work demands with benefits that address their individual work‐life needs over time. Another implication of this study is that job fit is a useful and predictive measure of job selection, performance, and retention. In light of studies that expose the limitations of job satisfaction as a measure influenced more by workers' dispositional affect (ie, their temperament and outlook) than their compatibility with their jobs,[28] job fit may add a functional dimension to traditional employee feedback measures.
There are limitations to this analysis. The most notable is the low survey response rate. Two reasons contributed to the fairly low rate of return. First, the original sampling frame included many outdated addresses and names of individuals who did not meet inclusion criteria. Although all sampled individuals who would have been excluded from the study could not be identified, we calculated our response rate without accounting for the proportion of potential ineligibles in the denominator population [Response Rate 2 (RR2) according to standards of the American Association of Public Opinion Research].[29] Second, the response rates of physician surveys have seen a steady decline over the years.[30] Respondents to our survey may be older and more experienced than US hospitalists in general. Although concerns about bias from under‐reporting cannot be fully addressed, we believe that the study sample is adequate for this preliminary study intended to translate the evidence of observed phenomena from the nonphysician to the physician workforces. The suboptimal response characteristics (high skew and low variability) of the generic person‐job fit survey scale used in this study indicate that a reliable survey instrument specifically designed to measure physician‐job fit need to be constructed de novo and validated for any future study. Although we performed simple analyses to support our assertions, few of our subanalyses may be underpowered, contributing to overinterpretation of the data. Additional empirical work is also necessary to assess the generalizability of this study's claims in other medical and surgical specialties. Such studies would also allow measurement of the sensitivity and specificity of physicians' self‐identification of poor job fit. Finally, additional investigations of this time‐dependent construct are more appropriately performed using a longitudinal study design to overcome the limitations inherent in this cross‐sectional analysis. Our conclusions about the time‐dependent features of job fit may be explained by other characteristics such as generational and cultural differences among hospitalists with varying experience.
As the US healthcare system reorganizes to bolster accountability,[31] we anticipate increasing interdependence between physicians and their employer organizations. Ultimately, the desired accountability in healthcare is likely to be obtained if physicians function not only as passive and interchangeable employees but as active stakeholders in the achievement of each organization's goals. A methodology for assessing the alignment of physicians and their jobs will continue to be important along the way.
Disclosure
Nothing to report.
- . Person‐organization fit: an integrative review of its conceptualizations, measurement, and implications. Personnel Psychol. 1996;49:1–49.
- , , . Consequences of individuals' fit at work: a meta‐analysis of person‐job, person‐organization, person‐group, and person‐supervisor fit. Personnel Psychol. 2005;58(2):281–342.
- .Person‐job fit: a conceptual integration, literature review and methodological critique. In: Cooper CL, Robertson IT, eds. International Review of Industrial and Organizational Psychology. Vol.6. New York, NY:John Wiley 1991.
- . Organizational culture, person‐culture fit, and turnover: a replication in the health care industry. J Organ Behav. 1999;20(2):175–184.
- , , , . Organizational culture and physician satisfaction with dimensions of group practice. Health Serv Res. 2007;42(3 pt 1):1150–1176.
- , , , et al. Career fit and burnout among academic faculty. Arch Intern Med. 2009;169(10):990–995.
- , , , , . Job characteristics, satisfaction, and burnout across hospitalist practice models. J Hosp Med. 2012;7(5):402–410.
- . Provider‐hospital “fit” and patient outcomes: evidence from Massachusetts cardiac surgeons, 2002–2004. Health Serv Res. 2011;46(1 pt 1):1–26.
- . The evolving primary care physician. N Engl J Med. 2012;366(20):1849–1853.
- , . Hospitals' race to employ physicians—the logic behind a money‐losing proposition. N Engl J Med. 2011;364(19):1790–1793.
- 2011 Survey of Final‐Year Medical Residents. Irving, TX:Merritt Hawkins;2011.
- State of Hospital Medicine: 2010 Report Based on 2009 Data. Englewood, CO:Society of Hospital Medicine and the Medical Group Management Association;2010.
- , , . The ASA framework: an update. Personnel Psychol. 1995;48(4):747–773.
- , . Work Redesign. Reading. MA:Addison‐Wesley;1980.
- , . The expanding role of hospitalists in the United States. Swiss Med Wkly. 2006;136(37–38):591–596.
- , . Organizational socialization as a learning‐process—the role of information acquisition. Personnel Psychol. 1992;45(4):849–874.
- , . The moderating effect of tenure in person‐environment fit: a field study in educational organizations. J Occup Organ Psych. 1997;70:173–188.
- . Matching people and organizations—selection and socialization in public accounting firms. Admin Sci Quart. 1991;36(3):459–484.
- , , , et al. Effects of physician experience on costs and outcomes on an academic general medicine service: results of a trial of hospitalists. Ann Intern Med. 2002;137(11):866–874.
- , , , , . Worklife and satisfaction of hospitalists: toward flourishing careers. J Gen Intern Med. 2012;27(1):28–36.
- . Karasek's model in the People's Republic of China: effects of job demands, control, and individual differences. Acad Manage J. 1996;39(6):1594–1618.
- , , , et al. Measuring physician job satisfaction in a changing workplace and a challenging environment. SGIM Career Satisfaction Study Group. Society of General Internal Medicine. Med Care. 1999;37(11):1174–1182.
- , , , et al. Organizational climate, stress, and error in primary care: The MEMO Study. Adv Patient Saf. 2005;1:65–77.
- , , , et al. Effects of inpatient experience on outcomes and costs in a multicenter trial of academic hospitalists. J Gen Intern Med. 2005;20(suppl 1):141–142.
- , , , . Burnout and self‐reported patient care in an internal medicine residency program. Ann Intern Med. 2002;136(5):358–367.
- , . Effect of job demands and social support on worker stress—a study of VDT users. Behav Inform Technol. 1995;14(1):32–40.
- , , . Validation of a single‐item measure of burnout against the Maslach Burnout Inventory among physicians. Stress Health. 2004;20(2):75–79.
- , . Job satisfaction: a meta‐analysis of stabilities. J Organ Behav. 2001;22(5):483–504.
- The American Association for Public Opinion Research. Standard definitions: final dispositions of case codes and outcome rates for surveys.7th ed. Available at: http://www.aapor.org/Standard_Definitions2.htm. Accessed May 2,2012.
- , , , . Response rates and response bias for 50 surveys of pediatricians. Health Serv Res. 2005;40(1):213–226.
- , . Accountable care organizations: accountable for what, to whom, and how. JAMA. 2010;304(15):1715–6.
Copyright © 2012 Society of Hospital Medicine