User login
Priorities and Gender Pay Gap
Hospitalists are a growing workforce numbering over 40,000 physicians, one‐third of whom are women.[1] Flexibility of work schedules and control over personal time have been the traditional selling points of the specialty.[2] Multiple studies of physician work life reveal growing physician dissatisfaction and a high prevalence of burnout.[3] To mitigate burnout risk, leaders in hospital medicine recognize the importance of creating a sustainable profession that offers both job and career satisfaction as well as work‐life balance and, importantly, fairness within the work environment.[4] Although success in some of these endeavors has been realized sporadically, sustaining work‐life balance and fairness in the specialty remains a work in progress, whereas evidence of high job attrition and pay inequities remain.[5, 6]
Pay inequity for women relative to men continues to be pervasive in medicine, including among early‐career physicians, researchers, and various specialists.[6, 7, 8, 9, 10, 11, 12, 13] The earnings gap seems to persist for physicians, even as federal efforts such as the Fair Pay Act of 2013 and the Paycheck Fairness Act of 2014 aim to end wage discrimination.[11, 14] Differences in specialty, part‐time status, and practice type do not mitigate the disparity.[8, 10, 15] Additional explanations have been proposed to explain the variability, including gender differences in negotiating skills, lack of opportunities to join networks of influence within organizations, and implicit or explicit bias and discrimination.[12, 16, 17, 18, 19, 20]
The earnings gap is also a consequence of what is commonly called the glass ceiling.[18, 19] Most agree that obstacles to fair advancement of women include absence of collaborative environments and role models who have successfully achieved work‐life balance.[17, 20, 21, 22] Somewhat surprisingly, women leaders in medicine seem to suffer greater income disparity than nonleaders; this income gap is prevalent among leaders in other elite professions as well.[7, 23] It is unknown whether women physicians' emphasis on work‐life balance, seen repeatedly in surveys, explains any of the pay disparity.[24] Little research to date has examined whether work‐life priorities of women in hospital medicine differ from men.
In this study, we sought to examine differences in job priorities between men and women hospitalists. In particular, we examine the relative prioritization of substantial pay to job satisfaction. We also examined gender differences in work patterns and earnings to explore potential sources of the persistent gender earnings gap.
METHODS
We analyzed data from the 20092010 Hospital Medicine Physician Worklife Survey, the design of which is detailed elsewhere.[4] Briefly, a 118‐item survey was administered by mail to a stratified sample of hospitalists from the Society of Hospital Medicine database and 3 large multisite hospitalist groups. A single survey item asked respondents to identify up to 4 out of 12 most important domains to their satisfaction with a hospitalist job. The domains were distilled from focus groups of nationally representative hospitalists as described previously,[4] and the survey item allowed up to one‐third of these domains to be identified as respondents' personal priorities. The list included: optimal variety of tasks, optimal workload, substantial pay, collegiality with other physicians, recognition by leaders, rewarding relationships with patients, satisfaction with nurses, optimal autonomy, control over personal time, fairness within organization, ample availability of resources to do job, and organizational climate of trust and belonging. We tabulated and ranked the frequency with which respondents selected each satisfaction domain by gender. Due to the nonstandard format of the survey item, we a priori decided to analyze only responses that were completed as instructed.
We also used demographic data including detailed work characteristics, clinical and nonclinical workload, total pretax earnings in 2009 as a hospitalist, and self‐identification as leader of their hospital medicine group. Respondent characteristics were tabulated and gender differences were tested using the t test, rank sum test, and the Fischer exact test as appropriate. We also listed the number of nonrespondents for each item. In estimating gender differences in earnings, we opted to use multiple‐imputation techniques to more conservatively account for greater variance inherent in the presence of missing data. Consistent with existing guidelines,[25] we demonstrated that item responses were not missing monotonically by visually inspecting patterns of nonresponse. We further demonstrated that data were missing at random by showing that response patterns of completed survey items did not predict whether or not a given variable response was missing using logistic regression models. We found no significant differences between respondents with complete and missing data. We verified that appropriate regression models for each variable on every other variable converged. We used Stata 13.1 (StataCorp, College Station, TX) to perform multiple imputations using chain equations (mi impute chain) to create 10 imputed tables for 7 normally distributed continuous variables using the ordinary least squares method, 3 non‐normally distributed variables using the predictive mean matching method, 2 nonordinal categorical variables using the multinomial logit method, and 1 binary variable using the logit method.[26, 27] Gender, pediatric specialty status, region of practice, and whether or not respondents prioritized substantial pay for job satisfaction were used as regular variables without missing data points.
Differences in earnings were assessed using a multivariate ordinary linear regression model applied to the imputed datasets fitted by forward selection of explanatory variables using P < 0.20 in bivariate analysis for inclusion and manual backward elimination of all statistically nonsignificant variables. We tested the significance of the women leader interaction term in the final parsimonious model. We used the usual significance threshold of P < 0.05 for inferences. Our analysis of publicly available anonymous data was exempt from IRB review.
RESULTS
Of the 816 survey respondents (response rate 25.6%), 40 either omitted the item soliciting work priorities or completed it incorrectly. Data from the remaining 776 respondents were used for the present analysis. Respondent characteristics are tabulated in Table 1. The characteristics of hospitalists by age, gender, specialty, practice model, and practice region were representative of US hospitalists from other surveys.[28]
| Women | Men | P Value | No. of Missing Responses | |
|---|---|---|---|---|
| ||||
| No. | 263 | 513 | 0 | |
| Role, n (%) | <0.01 | 0 | ||
| Frontline hospitalist | 201 (76) | 337 (66) | ||
| Hospitalist leader | 53 (24) | 176 (34) | ||
| Age, y, mean (SD) | 42 (8) | 45 (9) | <0.01 | 67 |
| Years in current job, mean (SD) | 5 (4) | 6 (5) | 0.07 | 14 |
| Specialty, n (%) | <0.01 | 0 | ||
| Internal medicine | 160 (61) | 369 (72) | ||
| Pediatrics | 56 (21) | 57 (11) | ||
| Other | 39 (15) | 47 (9) | ||
| Family medicine | 8 (3) | 40 (8) | ||
| Practice model, n (%) | 0.02 | 19 | ||
| Hospital employed | 110 (43) | 227 (46) | ||
| Multispecialty group | 44 (17) | 68 (14) | ||
| University/medical school | 47 (18) | 58 (12) | ||
| Multistate group | 27 (11) | 73 (15) | ||
| Local hospitalist group | 22 (8) | 65 (13) | ||
| Other | 7 (3) | 9 (2) | ||
| Practice region, n (%) | 0.14 | 0 | ||
| Southeast | 56 (21) | 151 (29) | ||
| Midwest | 58 (22) | 106 (21) | ||
| Northeast | 54 (21) | 96 (19) | ||
| Southwest | 44 (17) | 83 (16) | ||
| West | 51 (19) | 77 (15) | ||
| Full‐time equivalents, n (%) | <0.01 | 42 | ||
| <100% | 46 (18) | 60 (12) | ||
| 100% | 202 (81) | 402 (83) | ||
| >100% | 2 (1) | 22 (5) | ||
| Days per month doing clinical work if FTE 100%, median (IQR) | 15 (1418) | 16 (1420) | 0.12 | 11 |
| Hours per day doing clinical work, median (IQR) | 11 (912) | 11 (912) | 0.67 | 30 |
| Consecutive days doing clinical work, median (IQR) | 7 (57) | 7 (57) | 0.94 | 17 |
| Percentage of work at night, median (IQR) | 15 (530) | 15 (525) | 0.45 | 16 |
| Percentage of night work in hospital if working nights, median (IQR) | 100 (5100) | 100 (10100) | 0.12 | 8 |
| Hours per month doing nonclinical work, median (IQR) | 12 (540) | 15 (540) | 0.77 | 26 |
| Estimated daily billable encounters, mean (IQR) | 14 (1116) | 15 (1218) | 0.01 | 54 |
| Total earnings in fiscal year 2009, median US$1,000 (IQR) | 185 (150210) | 202 (180240) | <0.01 | 56 |
| Marriage/domestic partnership status, n (%) | 0.15 | 43 | ||
| Married/currently in DP | 197 (80) | 421 (86) | ||
| Never married/never in DP | 26 (11) | 42 (9) | ||
| Divorced or separated | 18 (7) | 20 (4) | ||
| Other | 4 (2) | 5 (1) | ||
| Dependent children under 7 years old living in home, n (%) | 0.22 | 42 | ||
| 0 | 136 (55) | 265 (54) | ||
| 1 | 47 (19) | 92 (19) | ||
| 2 | 52 (21) | 87 (18) | ||
| 3 | 12 (5) | 43 (9) | ||
Several gender differences were seen in the characteristics of hospitalists and their work (Table 1). Women compared to men hospitalists were less likely to be leaders, more likely to be pediatricians, work in university settings, and practice in Western states. Women compared to men, on average, were younger by 3 years, worked fewer full‐time equivalents (FTEs), worked a greater percentage of nights, and reported fewer billable encounters per shift. They were also more likely to be divorced or separated.
Job satisfaction priorities differed for women and men hospitalists. Table 2 lists job satisfaction domains in descending order of the frequency prioritized by men. The largest proportion of women and men prioritized optimal workload. However, although substantial pay was prioritized next most frequently by men, more women prioritized collegiality and control over personal time than substantial pay.
| Women, % | Rank | Men, % | Rank | |
|---|---|---|---|---|
| Optimal workload | 59 | 1 | 59 | 1 |
| Substantial pay | 41 | 4 | 50 | 2 |
| Control over personal time | 44 | 3 | 41 | 3 |
| Collegiality with physicians | 47 | 2 | 38 | 4 |
| Rewarding relationships with patients | 35 | 5 | 34 | 5 |
| Organizational climate of trust and belonging | 27 | 7 | 33 | 6 |
| Ample availability of resources to do job | 24 | 9 | 27 | 7 |
| Optimal autonomy | 26 | 8 | 24 | 8 |
| Fairness within organization | 15 | 10 | 23 | 9 |
| Optimal variety of tasks | 29 | 6 | 22 | 10 |
| Recognition by leaders | 11 | 12 | 10 | 11 |
| Satisfaction with nurses | 12 | 11 | 7 | 12 |
Key differences in individual characteristics, work patterns, and indicating substantial pay as a priority were associated with self‐reported total earnings in 2009 from respondents' work as a hospitalist. As shown in Table 3, the inclusion of detailed productivity measures such as FTE, days of monthly clinical work, and estimated number of daily billable encounters yielded a model that explained 33% of variance in earnings. After adjusting for significant covariates including pediatric specialty, practice model, geography, and amount and type of clinical work, the estimated underpayment of women compared to men was $14,581. Hospitalists who prioritized substantial pay earned $10,771 more than those who did not. The female x leader interaction term testing the hypothesis that gender disparity is greater among leaders than frontline hospitalists was not statistically significant ($16,720, P = 0.087) and excluded from the final model.
| Differences in Salary, 2009 US$ (95% CI) | P Value | |
|---|---|---|
| ||
| Women | 14,581 (23,074 to 6,089) | <0.01 |
| Leader | 21,997 (13,313 to 30,682) | <0.01 |
| Prioritized substantial pay | 10,771 (2,651 to 18,891) | <0.01 |
| Pediatric specialty | 31,126 (43,007 to 19,244) | <0.01 |
| Practice model | ||
| Hospital employed | REF | |
| Multispecialty group | 1,922 (13,891 to 10,047) | 0.75 |
| University/medical school | 33,503 (46,336 to 20,671) | <0.01 |
| Multistate group | 6,505 (72,69 to 20,279) | 0.35 |
| Local hospitalist group | 9,330 (4,352 to 23,012) | 0.18 |
| Other | 17,364 (45,741 to 11,012) | 0.23 |
| Practice region | ||
| Southeast | REF | |
| Midwest | 1,225 (10,595 to 13,044) | 0.84 |
| Northeast | 15,712 (28,182 to 3,242) | 0.01 |
| Southwest | 722 (13,545 to 12,101) | 0.91 |
| West | 5,251 (7,383 to 17,885) | 0.41 |
| FTE | 1,021 (762 to 1,279) | <0.01 |
| Days per month doing clinical work | 1,209 (443 to 1,975) | <0.01 |
| Estimated daily billable encounters | 608 (20 to 1,196) | 0.04 |
DISCUSSION
In a national stratified sample of US hospitalists, we found gender differences in job satisfaction priorities and hospitalist work characteristics. We also confirmed the persistence of a substantial gender earnings disparity. Lower earnings among women compared to men hospitalists were present in our data after controlling for age, pediatric specialty, practice model, geography, type of clinical work, and productivity measures. The gender earnings disparity noted in 1999[6] persists, although it appears to have decreased, possibly indicating progress toward equity. We showed that women hospitalists' relative tendency not to prioritize pay explains a significant portion of the residual income gap.
Hoff examined hospitalist earnings in a large national survey of hospitalists in 1999. Our cohorts differed in age and experience (both lower in the Hoff study). An estimated $24,000 ($124,266 vs. $148,132) earnings gap between women and men was greater than our estimate of $14,581 following an interval of 10 years. Although survey items differed, both studies found that women were less interested in pay than men when considering a hospitalist job. Hoff also found that work setting and attitudes about pay and lifestyle were significantly related to earnings. We extended the previous analyses of gender differences in job satisfaction priorities, work, and demographic characteristics to explain the earnings gap and understand how it may be remedied.
When considering job satisfaction, we found that more men than women prioritized substantial pay and that prioritization of substantial pay was directly related to higher earnings. Therefore, fewer women prioritizing pay partly explains women's lower earnings. Reasons for why fewer women prioritize pay were not assessed in this study but may include factors like being part of 2‐income households and competing commitments.[29] Priorities may even be influenced by empirically observed gender differences in discussions of financial matters, governed by cultural norms. Such norms may implicitly sanction employers to offer women less pay than men for the same or similar work. Women may disadvantage themselves by negotiating less or less well than men for higher starting and promotion salaries. They may be perceived more negatively than men when they do negotiate pay, leading to unintended negative consequences such as loss of social networks, decreased likability, and even loss of job offers.[29, 30, 31, 32]
More women prioritized optimal variety of tasks (6th most prevalent among women and 10th among men). Women who highly rate optimal variety of tasks as a job satisfier may choose positions in which they teach, perform research, and participate in hospital committees and quality‐improvement work, but offer lower pay. Yet hours per month doing nonclinical work was not significantly different between men and women, nor associated with earnings differences in our earnings models. Understanding whether women self‐select into hospitalist jobs with like‐minded colleagues to achieve complementary fit or end up supplementing their skills with hospitalists with different priorities may inform strategies to reduce the gender income disparity.[5] Unlike disparities between various hospital medicine groups, systematic disparities within practices risk generating low levels of organizational fairness and burnout among employees.
Not surprisingly, productivity was positively associated with earnings but did not fully account for the gender earnings gap. Our data demonstrated that women, on average, were associated with work characteristics that expectedly generate less compensation. For example, women were younger, more often part time, academic, pediatric, less often leaders, and reported fewer billable encounters compared to men. These differences account for some of the earnings gap between men and women, but these factors were controlled for in the earnings model. In addition, our analysis may have underestimated the gap by not incorporating loss of fringe benefits from part‐time status and not comprehensively counting incentive pay associated with high productivity. Other work patterns more commonly associated with women suggest an imbalance in reimbursement. More women than men work nights that are often compensated at higher rates than daytime work, yet their average pay was less, suggesting that compensation for night work may need to be adjusted to reflect its unique burdens and responsibilities.[33]
Although the gender pay gap was not more extreme among leaders compared to frontline hospitalists in our data, the trend, nonetheless, underscores an important consideration. Whereas clinical work is paid for in mostly measurable ways, pay for leadership may be influenced by intangible factors such as reputation, negotiation, and confidence that may disadvantage women relative to men.[7, 19, 23, 34, 35, 36] Efforts to overcome implicit gender bias should be most effective when we consciously couple fair promotion of women to leadership with fair compensation commensurate with their male peers.[21]
Our data are vulnerable to nonresponse bias.[1, 4, 5] Post hoc analyses demonstrated that distributions of age, gender, practice model and region of our respondents were similar to other nationally representative cohorts of hospitalists. Consequently, we believe our data can make valid estimates about a nationally representative sample of hospitalists. However, we acknowledge several additional weaknesses of self‐reported data, including recall bias and accuracy of productivity figures, which were rounded to variable significant digits by respondents. Earnings analysis using this data was intended to be exploratory, but the findings echoed analyses using more authoritative data sources.[11] Still, we made inferences conservatively by adopting multiple imputation techniques for dealing with nonresponse surveys in adherence to established reporting guidelines.[25] We also note several limitations relevant to multiple imputations. The greater prevalence of missing data for survey items soliciting earnings and the number of billable encounters suggest they were not truly missing at random as assumed. However, we showed that missingness is unrelated to the variables under study, justifying use of the technique. The wider measures of variance derived from multiple imputations make us vulnerable to not detecting associations that may exist.
The gender earnings gap found in hospital medicine echoes the gap found in multiple medical specialties, including but not limited to pediatrics, academic medicine, gastroenterology, and plastic surgery.[7, 8, 9, 11, 12, 13, 37] Hospital medicine employment models and practice patterns have important structural differences compared to previously studied populations that could mitigate factors contributing to women physicians' lower earnings. However, despite well‐defined working hours, lack of control over the number of patient encounters per day and high prevalence of hospital‐employed practice models, the gender earnings gap persists. We showed that lower prioritization for pay may reflect the self‐selection of women into lower paying jobs. Unmeasured factors, including implicit bias and differences in negotiations, social networks and mentoring opportunities[38, 39] may also contribute to pay differences between men and women hospitalists. As hospital medicine tackles gender inequities and other disparities, strategies to assess and address fair physician compensation must be on the table.
- , , , , ; Society of Hospital Medicine Career Satisfaction Task F. Job characteristics, satisfaction, and burnout across hospitalist practice models. J Hosp Med. 2012;7(5):402–410.
- , . The emerging role of “hospitalists” in the American health care system. N Engl J Med. 1996;335(7):514–517.
- , , , et al. Organizational climate, stress, and error in primary care: The MEMO study. In: Henriksen K, Battles JB, Marks ES, Lewin DI, eds. Advances in Patient Safety: From Research to Implementation. Vol. 1. Research Findings. Rockville, MD; Agency for Healthcare Research and Quality; 2005.
- , , , , . Worklife and satisfaction of hospitalists: toward flourishing careers. J Gen Intern Med. 2012;27(1):28–36.
- , , , , . Person‐job fit: an exploratory cross‐sectional analysis of hospitalists. J Hosp Med. 2013;8(2):96–101.
- . Doing the same and earning less: male and female physicians in a new medical specialty. Inquiry. 2004;41(3):301–315.
- , , , . Compensation and advancement of women in academic medicine: Is there equity? Ann Intern Med. 2004;141(3):205–212.
- . Differences in earnings between male and female physicians. N Engl J Med. 1996;334(15):960–964.
- , , , , , . Gender differences in the salaries of physician researchers. JAMA. 2012;307(22):2410–2417.
- , , , , , . The work lives of women physicians results from the physician work life study. The SGIM Career Satisfaction Study Group. J Gen Intern Med. 2000;15(6):372–380.
- , , , . The $16,819 pay gap for newly trained physicians: the unexplained trend of men earning more than women. Health Aff (Millwood). 2011;30(2):193–201.
- , , , . Assessing gender equity in a large academic department of pediatrics. Acad Med. 2012;87(1):98–104.
- , , , , , . Gender disparity in the practice of gastroenterology: the first 5 years of a career. Am J Gastroenterol. 2005;100(2):259–264.
- H.R. 438, Fair Pay Act of 2013. 113th Congress (2013‐2014).
- , , , , . Topics to ponder: part‐time practice and pay parity. Gend Med. 2010;7(4):350–356.
- , . Understanding and finding mentorship: a review for junior faculty. J Palliat Med. 2010;13(11):1373–1379.
- , , , et al. Career development for women in academic medicine: Multiple interventions in a department of medicine. JAMA. 1996;276(11):898–905.
- , , , , , . Sex differences in academic advancement. Results of a national study of pediatricians. N Engl J Med. 1996;335(17):1282–1289.
- , , , . Promotion of women physicians in academic medicine. Glass ceiling or sticky floor? JAMA. 1995;273(13):1022–1025.
- , , , , . Stories from early‐career women physicians who have left academic medicine: a qualitative study at a single institution. Acad Med. 2011;86(6):752–758.
- , , , , . Experiencing the culture of academic medicine: gender matters, a national study. J Gen Intern Med. 2013;28(2):201–207.
- , . Why aren't there more women leaders in academic medicine? tHe views of clinical department chairs. Acad Med. 2001;76(5):453–465.
- . The gender gap in executive compensation: the role of female directors and chief executive officers. Ann Am Acad Pol Soc Sci. 2012(639):258–278.
- , , . Keys to career satisfaction: insights from a survey of women pediatric surgeons. J Pediatr Surg. 2004;39(6):984–990.
- , , , et al. Multiple imputation for missing data in epidemiological and clinical research: potential and pitfalls. BMJ. 2009;338:b2393.
- Imputation and Variance Estimation Software [computer program]. Ann Arbor, MI: Universtiy of Michigan; 2007.
- , , . Multiple Imputation using chained equations: issues and guidance for practice. Stat Med. 2010;30(4):377–399.
- State of Hospital Medicine: 2010 Report Based on 2009 Data. Englewood, CO and Philadelphia, PA: Medical Group Management Association and Society of Hospital Medicine; 2010.
- , . The Changing Face of Medicine: Women Doctors and the Evolution Of Health Care in America. Ithaca, NY: ILR Press/Cornell University Press; 2008.
- , . Women Don't Ask: Negotiation and the Gender Divide. Princeton, NJ: Princeton University Press; 2003.
- , , , et al. Negotiation in academic medicine: a necessary career skill. J Womens Health (Larchmt). 2007;16(2):235–244.
- . Women and salary negotiation: the costs of self‐advocacy. Psychol Women Q. 2001;25:65–76.
- State of Hospital Medicine: 2014 Report Based on 2013 Data. Englewood, CO and Philadelphia, PA: Medical Group Management Association and Society of Hospital Medicine; 2014.
- , , . Interventions that affect gender bias in hiring: a systematic review. Acad Med. 2009;84(10):1440–1446.
- , . Sociology. The gender gap in NIH grant applications. Science. 2008;322(5907):1472–1474.
- , , , . Organizational climate and family life: how these factors affect the status of women faculty at one medical school. Acad Med. 2009;84(1):87–94.
- , , . Gender differences in the professional and private lives of plastic surgeons. Ann Plast Surg. 2010;64(6):775–779.
- . Gender and supportive co‐worker relations in the medical profession. Gend Work Organ. 2014;21(1):1–17.
- , . Stuck in the out‐group: Jennifer can't grow up, Jane's invisible, and Janet's over the hill. J Womens Health (Larchmt). 2014;23(6):481–484.
Hospitalists are a growing workforce numbering over 40,000 physicians, one‐third of whom are women.[1] Flexibility of work schedules and control over personal time have been the traditional selling points of the specialty.[2] Multiple studies of physician work life reveal growing physician dissatisfaction and a high prevalence of burnout.[3] To mitigate burnout risk, leaders in hospital medicine recognize the importance of creating a sustainable profession that offers both job and career satisfaction as well as work‐life balance and, importantly, fairness within the work environment.[4] Although success in some of these endeavors has been realized sporadically, sustaining work‐life balance and fairness in the specialty remains a work in progress, whereas evidence of high job attrition and pay inequities remain.[5, 6]
Pay inequity for women relative to men continues to be pervasive in medicine, including among early‐career physicians, researchers, and various specialists.[6, 7, 8, 9, 10, 11, 12, 13] The earnings gap seems to persist for physicians, even as federal efforts such as the Fair Pay Act of 2013 and the Paycheck Fairness Act of 2014 aim to end wage discrimination.[11, 14] Differences in specialty, part‐time status, and practice type do not mitigate the disparity.[8, 10, 15] Additional explanations have been proposed to explain the variability, including gender differences in negotiating skills, lack of opportunities to join networks of influence within organizations, and implicit or explicit bias and discrimination.[12, 16, 17, 18, 19, 20]
The earnings gap is also a consequence of what is commonly called the glass ceiling.[18, 19] Most agree that obstacles to fair advancement of women include absence of collaborative environments and role models who have successfully achieved work‐life balance.[17, 20, 21, 22] Somewhat surprisingly, women leaders in medicine seem to suffer greater income disparity than nonleaders; this income gap is prevalent among leaders in other elite professions as well.[7, 23] It is unknown whether women physicians' emphasis on work‐life balance, seen repeatedly in surveys, explains any of the pay disparity.[24] Little research to date has examined whether work‐life priorities of women in hospital medicine differ from men.
In this study, we sought to examine differences in job priorities between men and women hospitalists. In particular, we examine the relative prioritization of substantial pay to job satisfaction. We also examined gender differences in work patterns and earnings to explore potential sources of the persistent gender earnings gap.
METHODS
We analyzed data from the 20092010 Hospital Medicine Physician Worklife Survey, the design of which is detailed elsewhere.[4] Briefly, a 118‐item survey was administered by mail to a stratified sample of hospitalists from the Society of Hospital Medicine database and 3 large multisite hospitalist groups. A single survey item asked respondents to identify up to 4 out of 12 most important domains to their satisfaction with a hospitalist job. The domains were distilled from focus groups of nationally representative hospitalists as described previously,[4] and the survey item allowed up to one‐third of these domains to be identified as respondents' personal priorities. The list included: optimal variety of tasks, optimal workload, substantial pay, collegiality with other physicians, recognition by leaders, rewarding relationships with patients, satisfaction with nurses, optimal autonomy, control over personal time, fairness within organization, ample availability of resources to do job, and organizational climate of trust and belonging. We tabulated and ranked the frequency with which respondents selected each satisfaction domain by gender. Due to the nonstandard format of the survey item, we a priori decided to analyze only responses that were completed as instructed.
We also used demographic data including detailed work characteristics, clinical and nonclinical workload, total pretax earnings in 2009 as a hospitalist, and self‐identification as leader of their hospital medicine group. Respondent characteristics were tabulated and gender differences were tested using the t test, rank sum test, and the Fischer exact test as appropriate. We also listed the number of nonrespondents for each item. In estimating gender differences in earnings, we opted to use multiple‐imputation techniques to more conservatively account for greater variance inherent in the presence of missing data. Consistent with existing guidelines,[25] we demonstrated that item responses were not missing monotonically by visually inspecting patterns of nonresponse. We further demonstrated that data were missing at random by showing that response patterns of completed survey items did not predict whether or not a given variable response was missing using logistic regression models. We found no significant differences between respondents with complete and missing data. We verified that appropriate regression models for each variable on every other variable converged. We used Stata 13.1 (StataCorp, College Station, TX) to perform multiple imputations using chain equations (mi impute chain) to create 10 imputed tables for 7 normally distributed continuous variables using the ordinary least squares method, 3 non‐normally distributed variables using the predictive mean matching method, 2 nonordinal categorical variables using the multinomial logit method, and 1 binary variable using the logit method.[26, 27] Gender, pediatric specialty status, region of practice, and whether or not respondents prioritized substantial pay for job satisfaction were used as regular variables without missing data points.
Differences in earnings were assessed using a multivariate ordinary linear regression model applied to the imputed datasets fitted by forward selection of explanatory variables using P < 0.20 in bivariate analysis for inclusion and manual backward elimination of all statistically nonsignificant variables. We tested the significance of the women leader interaction term in the final parsimonious model. We used the usual significance threshold of P < 0.05 for inferences. Our analysis of publicly available anonymous data was exempt from IRB review.
RESULTS
Of the 816 survey respondents (response rate 25.6%), 40 either omitted the item soliciting work priorities or completed it incorrectly. Data from the remaining 776 respondents were used for the present analysis. Respondent characteristics are tabulated in Table 1. The characteristics of hospitalists by age, gender, specialty, practice model, and practice region were representative of US hospitalists from other surveys.[28]
| Women | Men | P Value | No. of Missing Responses | |
|---|---|---|---|---|
| ||||
| No. | 263 | 513 | 0 | |
| Role, n (%) | <0.01 | 0 | ||
| Frontline hospitalist | 201 (76) | 337 (66) | ||
| Hospitalist leader | 53 (24) | 176 (34) | ||
| Age, y, mean (SD) | 42 (8) | 45 (9) | <0.01 | 67 |
| Years in current job, mean (SD) | 5 (4) | 6 (5) | 0.07 | 14 |
| Specialty, n (%) | <0.01 | 0 | ||
| Internal medicine | 160 (61) | 369 (72) | ||
| Pediatrics | 56 (21) | 57 (11) | ||
| Other | 39 (15) | 47 (9) | ||
| Family medicine | 8 (3) | 40 (8) | ||
| Practice model, n (%) | 0.02 | 19 | ||
| Hospital employed | 110 (43) | 227 (46) | ||
| Multispecialty group | 44 (17) | 68 (14) | ||
| University/medical school | 47 (18) | 58 (12) | ||
| Multistate group | 27 (11) | 73 (15) | ||
| Local hospitalist group | 22 (8) | 65 (13) | ||
| Other | 7 (3) | 9 (2) | ||
| Practice region, n (%) | 0.14 | 0 | ||
| Southeast | 56 (21) | 151 (29) | ||
| Midwest | 58 (22) | 106 (21) | ||
| Northeast | 54 (21) | 96 (19) | ||
| Southwest | 44 (17) | 83 (16) | ||
| West | 51 (19) | 77 (15) | ||
| Full‐time equivalents, n (%) | <0.01 | 42 | ||
| <100% | 46 (18) | 60 (12) | ||
| 100% | 202 (81) | 402 (83) | ||
| >100% | 2 (1) | 22 (5) | ||
| Days per month doing clinical work if FTE 100%, median (IQR) | 15 (1418) | 16 (1420) | 0.12 | 11 |
| Hours per day doing clinical work, median (IQR) | 11 (912) | 11 (912) | 0.67 | 30 |
| Consecutive days doing clinical work, median (IQR) | 7 (57) | 7 (57) | 0.94 | 17 |
| Percentage of work at night, median (IQR) | 15 (530) | 15 (525) | 0.45 | 16 |
| Percentage of night work in hospital if working nights, median (IQR) | 100 (5100) | 100 (10100) | 0.12 | 8 |
| Hours per month doing nonclinical work, median (IQR) | 12 (540) | 15 (540) | 0.77 | 26 |
| Estimated daily billable encounters, mean (IQR) | 14 (1116) | 15 (1218) | 0.01 | 54 |
| Total earnings in fiscal year 2009, median US$1,000 (IQR) | 185 (150210) | 202 (180240) | <0.01 | 56 |
| Marriage/domestic partnership status, n (%) | 0.15 | 43 | ||
| Married/currently in DP | 197 (80) | 421 (86) | ||
| Never married/never in DP | 26 (11) | 42 (9) | ||
| Divorced or separated | 18 (7) | 20 (4) | ||
| Other | 4 (2) | 5 (1) | ||
| Dependent children under 7 years old living in home, n (%) | 0.22 | 42 | ||
| 0 | 136 (55) | 265 (54) | ||
| 1 | 47 (19) | 92 (19) | ||
| 2 | 52 (21) | 87 (18) | ||
| 3 | 12 (5) | 43 (9) | ||
Several gender differences were seen in the characteristics of hospitalists and their work (Table 1). Women compared to men hospitalists were less likely to be leaders, more likely to be pediatricians, work in university settings, and practice in Western states. Women compared to men, on average, were younger by 3 years, worked fewer full‐time equivalents (FTEs), worked a greater percentage of nights, and reported fewer billable encounters per shift. They were also more likely to be divorced or separated.
Job satisfaction priorities differed for women and men hospitalists. Table 2 lists job satisfaction domains in descending order of the frequency prioritized by men. The largest proportion of women and men prioritized optimal workload. However, although substantial pay was prioritized next most frequently by men, more women prioritized collegiality and control over personal time than substantial pay.
| Women, % | Rank | Men, % | Rank | |
|---|---|---|---|---|
| Optimal workload | 59 | 1 | 59 | 1 |
| Substantial pay | 41 | 4 | 50 | 2 |
| Control over personal time | 44 | 3 | 41 | 3 |
| Collegiality with physicians | 47 | 2 | 38 | 4 |
| Rewarding relationships with patients | 35 | 5 | 34 | 5 |
| Organizational climate of trust and belonging | 27 | 7 | 33 | 6 |
| Ample availability of resources to do job | 24 | 9 | 27 | 7 |
| Optimal autonomy | 26 | 8 | 24 | 8 |
| Fairness within organization | 15 | 10 | 23 | 9 |
| Optimal variety of tasks | 29 | 6 | 22 | 10 |
| Recognition by leaders | 11 | 12 | 10 | 11 |
| Satisfaction with nurses | 12 | 11 | 7 | 12 |
Key differences in individual characteristics, work patterns, and indicating substantial pay as a priority were associated with self‐reported total earnings in 2009 from respondents' work as a hospitalist. As shown in Table 3, the inclusion of detailed productivity measures such as FTE, days of monthly clinical work, and estimated number of daily billable encounters yielded a model that explained 33% of variance in earnings. After adjusting for significant covariates including pediatric specialty, practice model, geography, and amount and type of clinical work, the estimated underpayment of women compared to men was $14,581. Hospitalists who prioritized substantial pay earned $10,771 more than those who did not. The female x leader interaction term testing the hypothesis that gender disparity is greater among leaders than frontline hospitalists was not statistically significant ($16,720, P = 0.087) and excluded from the final model.
| Differences in Salary, 2009 US$ (95% CI) | P Value | |
|---|---|---|
| ||
| Women | 14,581 (23,074 to 6,089) | <0.01 |
| Leader | 21,997 (13,313 to 30,682) | <0.01 |
| Prioritized substantial pay | 10,771 (2,651 to 18,891) | <0.01 |
| Pediatric specialty | 31,126 (43,007 to 19,244) | <0.01 |
| Practice model | ||
| Hospital employed | REF | |
| Multispecialty group | 1,922 (13,891 to 10,047) | 0.75 |
| University/medical school | 33,503 (46,336 to 20,671) | <0.01 |
| Multistate group | 6,505 (72,69 to 20,279) | 0.35 |
| Local hospitalist group | 9,330 (4,352 to 23,012) | 0.18 |
| Other | 17,364 (45,741 to 11,012) | 0.23 |
| Practice region | ||
| Southeast | REF | |
| Midwest | 1,225 (10,595 to 13,044) | 0.84 |
| Northeast | 15,712 (28,182 to 3,242) | 0.01 |
| Southwest | 722 (13,545 to 12,101) | 0.91 |
| West | 5,251 (7,383 to 17,885) | 0.41 |
| FTE | 1,021 (762 to 1,279) | <0.01 |
| Days per month doing clinical work | 1,209 (443 to 1,975) | <0.01 |
| Estimated daily billable encounters | 608 (20 to 1,196) | 0.04 |
DISCUSSION
In a national stratified sample of US hospitalists, we found gender differences in job satisfaction priorities and hospitalist work characteristics. We also confirmed the persistence of a substantial gender earnings disparity. Lower earnings among women compared to men hospitalists were present in our data after controlling for age, pediatric specialty, practice model, geography, type of clinical work, and productivity measures. The gender earnings disparity noted in 1999[6] persists, although it appears to have decreased, possibly indicating progress toward equity. We showed that women hospitalists' relative tendency not to prioritize pay explains a significant portion of the residual income gap.
Hoff examined hospitalist earnings in a large national survey of hospitalists in 1999. Our cohorts differed in age and experience (both lower in the Hoff study). An estimated $24,000 ($124,266 vs. $148,132) earnings gap between women and men was greater than our estimate of $14,581 following an interval of 10 years. Although survey items differed, both studies found that women were less interested in pay than men when considering a hospitalist job. Hoff also found that work setting and attitudes about pay and lifestyle were significantly related to earnings. We extended the previous analyses of gender differences in job satisfaction priorities, work, and demographic characteristics to explain the earnings gap and understand how it may be remedied.
When considering job satisfaction, we found that more men than women prioritized substantial pay and that prioritization of substantial pay was directly related to higher earnings. Therefore, fewer women prioritizing pay partly explains women's lower earnings. Reasons for why fewer women prioritize pay were not assessed in this study but may include factors like being part of 2‐income households and competing commitments.[29] Priorities may even be influenced by empirically observed gender differences in discussions of financial matters, governed by cultural norms. Such norms may implicitly sanction employers to offer women less pay than men for the same or similar work. Women may disadvantage themselves by negotiating less or less well than men for higher starting and promotion salaries. They may be perceived more negatively than men when they do negotiate pay, leading to unintended negative consequences such as loss of social networks, decreased likability, and even loss of job offers.[29, 30, 31, 32]
More women prioritized optimal variety of tasks (6th most prevalent among women and 10th among men). Women who highly rate optimal variety of tasks as a job satisfier may choose positions in which they teach, perform research, and participate in hospital committees and quality‐improvement work, but offer lower pay. Yet hours per month doing nonclinical work was not significantly different between men and women, nor associated with earnings differences in our earnings models. Understanding whether women self‐select into hospitalist jobs with like‐minded colleagues to achieve complementary fit or end up supplementing their skills with hospitalists with different priorities may inform strategies to reduce the gender income disparity.[5] Unlike disparities between various hospital medicine groups, systematic disparities within practices risk generating low levels of organizational fairness and burnout among employees.
Not surprisingly, productivity was positively associated with earnings but did not fully account for the gender earnings gap. Our data demonstrated that women, on average, were associated with work characteristics that expectedly generate less compensation. For example, women were younger, more often part time, academic, pediatric, less often leaders, and reported fewer billable encounters compared to men. These differences account for some of the earnings gap between men and women, but these factors were controlled for in the earnings model. In addition, our analysis may have underestimated the gap by not incorporating loss of fringe benefits from part‐time status and not comprehensively counting incentive pay associated with high productivity. Other work patterns more commonly associated with women suggest an imbalance in reimbursement. More women than men work nights that are often compensated at higher rates than daytime work, yet their average pay was less, suggesting that compensation for night work may need to be adjusted to reflect its unique burdens and responsibilities.[33]
Although the gender pay gap was not more extreme among leaders compared to frontline hospitalists in our data, the trend, nonetheless, underscores an important consideration. Whereas clinical work is paid for in mostly measurable ways, pay for leadership may be influenced by intangible factors such as reputation, negotiation, and confidence that may disadvantage women relative to men.[7, 19, 23, 34, 35, 36] Efforts to overcome implicit gender bias should be most effective when we consciously couple fair promotion of women to leadership with fair compensation commensurate with their male peers.[21]
Our data are vulnerable to nonresponse bias.[1, 4, 5] Post hoc analyses demonstrated that distributions of age, gender, practice model and region of our respondents were similar to other nationally representative cohorts of hospitalists. Consequently, we believe our data can make valid estimates about a nationally representative sample of hospitalists. However, we acknowledge several additional weaknesses of self‐reported data, including recall bias and accuracy of productivity figures, which were rounded to variable significant digits by respondents. Earnings analysis using this data was intended to be exploratory, but the findings echoed analyses using more authoritative data sources.[11] Still, we made inferences conservatively by adopting multiple imputation techniques for dealing with nonresponse surveys in adherence to established reporting guidelines.[25] We also note several limitations relevant to multiple imputations. The greater prevalence of missing data for survey items soliciting earnings and the number of billable encounters suggest they were not truly missing at random as assumed. However, we showed that missingness is unrelated to the variables under study, justifying use of the technique. The wider measures of variance derived from multiple imputations make us vulnerable to not detecting associations that may exist.
The gender earnings gap found in hospital medicine echoes the gap found in multiple medical specialties, including but not limited to pediatrics, academic medicine, gastroenterology, and plastic surgery.[7, 8, 9, 11, 12, 13, 37] Hospital medicine employment models and practice patterns have important structural differences compared to previously studied populations that could mitigate factors contributing to women physicians' lower earnings. However, despite well‐defined working hours, lack of control over the number of patient encounters per day and high prevalence of hospital‐employed practice models, the gender earnings gap persists. We showed that lower prioritization for pay may reflect the self‐selection of women into lower paying jobs. Unmeasured factors, including implicit bias and differences in negotiations, social networks and mentoring opportunities[38, 39] may also contribute to pay differences between men and women hospitalists. As hospital medicine tackles gender inequities and other disparities, strategies to assess and address fair physician compensation must be on the table.
- , , , , ; Society of Hospital Medicine Career Satisfaction Task F. Job characteristics, satisfaction, and burnout across hospitalist practice models. J Hosp Med. 2012;7(5):402–410.
- , . The emerging role of “hospitalists” in the American health care system. N Engl J Med. 1996;335(7):514–517.
- , , , et al. Organizational climate, stress, and error in primary care: The MEMO study. In: Henriksen K, Battles JB, Marks ES, Lewin DI, eds. Advances in Patient Safety: From Research to Implementation. Vol. 1. Research Findings. Rockville, MD; Agency for Healthcare Research and Quality; 2005.
- , , , , . Worklife and satisfaction of hospitalists: toward flourishing careers. J Gen Intern Med. 2012;27(1):28–36.
- , , , , . Person‐job fit: an exploratory cross‐sectional analysis of hospitalists. J Hosp Med. 2013;8(2):96–101.
- . Doing the same and earning less: male and female physicians in a new medical specialty. Inquiry. 2004;41(3):301–315.
- , , , . Compensation and advancement of women in academic medicine: Is there equity? Ann Intern Med. 2004;141(3):205–212.
- . Differences in earnings between male and female physicians. N Engl J Med. 1996;334(15):960–964.
- , , , , , . Gender differences in the salaries of physician researchers. JAMA. 2012;307(22):2410–2417.
- , , , , , . The work lives of women physicians results from the physician work life study. The SGIM Career Satisfaction Study Group. J Gen Intern Med. 2000;15(6):372–380.
- , , , . The $16,819 pay gap for newly trained physicians: the unexplained trend of men earning more than women. Health Aff (Millwood). 2011;30(2):193–201.
- , , , . Assessing gender equity in a large academic department of pediatrics. Acad Med. 2012;87(1):98–104.
- , , , , , . Gender disparity in the practice of gastroenterology: the first 5 years of a career. Am J Gastroenterol. 2005;100(2):259–264.
- H.R. 438, Fair Pay Act of 2013. 113th Congress (2013‐2014).
- , , , , . Topics to ponder: part‐time practice and pay parity. Gend Med. 2010;7(4):350–356.
- , . Understanding and finding mentorship: a review for junior faculty. J Palliat Med. 2010;13(11):1373–1379.
- , , , et al. Career development for women in academic medicine: Multiple interventions in a department of medicine. JAMA. 1996;276(11):898–905.
- , , , , , . Sex differences in academic advancement. Results of a national study of pediatricians. N Engl J Med. 1996;335(17):1282–1289.
- , , , . Promotion of women physicians in academic medicine. Glass ceiling or sticky floor? JAMA. 1995;273(13):1022–1025.
- , , , , . Stories from early‐career women physicians who have left academic medicine: a qualitative study at a single institution. Acad Med. 2011;86(6):752–758.
- , , , , . Experiencing the culture of academic medicine: gender matters, a national study. J Gen Intern Med. 2013;28(2):201–207.
- , . Why aren't there more women leaders in academic medicine? tHe views of clinical department chairs. Acad Med. 2001;76(5):453–465.
- . The gender gap in executive compensation: the role of female directors and chief executive officers. Ann Am Acad Pol Soc Sci. 2012(639):258–278.
- , , . Keys to career satisfaction: insights from a survey of women pediatric surgeons. J Pediatr Surg. 2004;39(6):984–990.
- , , , et al. Multiple imputation for missing data in epidemiological and clinical research: potential and pitfalls. BMJ. 2009;338:b2393.
- Imputation and Variance Estimation Software [computer program]. Ann Arbor, MI: Universtiy of Michigan; 2007.
- , , . Multiple Imputation using chained equations: issues and guidance for practice. Stat Med. 2010;30(4):377–399.
- State of Hospital Medicine: 2010 Report Based on 2009 Data. Englewood, CO and Philadelphia, PA: Medical Group Management Association and Society of Hospital Medicine; 2010.
- , . The Changing Face of Medicine: Women Doctors and the Evolution Of Health Care in America. Ithaca, NY: ILR Press/Cornell University Press; 2008.
- , . Women Don't Ask: Negotiation and the Gender Divide. Princeton, NJ: Princeton University Press; 2003.
- , , , et al. Negotiation in academic medicine: a necessary career skill. J Womens Health (Larchmt). 2007;16(2):235–244.
- . Women and salary negotiation: the costs of self‐advocacy. Psychol Women Q. 2001;25:65–76.
- State of Hospital Medicine: 2014 Report Based on 2013 Data. Englewood, CO and Philadelphia, PA: Medical Group Management Association and Society of Hospital Medicine; 2014.
- , , . Interventions that affect gender bias in hiring: a systematic review. Acad Med. 2009;84(10):1440–1446.
- , . Sociology. The gender gap in NIH grant applications. Science. 2008;322(5907):1472–1474.
- , , , . Organizational climate and family life: how these factors affect the status of women faculty at one medical school. Acad Med. 2009;84(1):87–94.
- , , . Gender differences in the professional and private lives of plastic surgeons. Ann Plast Surg. 2010;64(6):775–779.
- . Gender and supportive co‐worker relations in the medical profession. Gend Work Organ. 2014;21(1):1–17.
- , . Stuck in the out‐group: Jennifer can't grow up, Jane's invisible, and Janet's over the hill. J Womens Health (Larchmt). 2014;23(6):481–484.
© 2015 Society of Hospital Medicine
Hospitalist‐Job Fit
Person‐organization fit concerns the conditions and consequences of compatibility between people and the organizations for which they work.[1] Studies of other industries have demonstrated that person‐organization fit informs the way individuals join, perform in, and are retained by organizations.[2] Person‐job fit is a closely related subordinate concept that concerns the alignment of workers and their job in as much as workers have needs that their job supplies, or conversely, jobs have requirements that certain workers' abilities can help meet.[3] Explorations of job fit in physicians and their work have recently emerged in a few investigations published in medical journals.[4, 5, 6, 7, 8] Further expanding the understanding of fit between physicians and their employment is important, because the decline of solo practices and recent emphasis on team‐based care have led to a growing number of US physicians working in organizations.[9]
The movement of physicians into employed situations may continue if certain types of Accountable Care Organizations take root.[10] And physicians may be primed to join employer organizations based on current career priorities of individuals in American society. Surveys of medical residents entering the workforce reveal more physicians preferring the security of being employees than starting their own practices.[11] Given these trends, job fit will inform our understanding of how personal and job characteristics facilitate recruitment, performance, satisfaction, and longevity of physician employees.
BACKGROUND
Virtually all hospitalists work in organizationshospitalsand are employees of hospitals, medical schools, physician group practices, or management companies, and therefore invariably function within organizational structures and systems.[7] In spite of their rapid growth in numbers, many employers have faced difficulties recruiting and retaining enough hospitalists to fill their staffing needs. Consequently, the US hospitalist workforce today is characterized by high salaries, work load, and attrition rates.[12]
In this evolving unsaturated market, the attraction‐selection‐attrition framework[13] provides a theoretical construct that predicts that hospitalists and their employers would seek congruence of goals and values early in their relationship through a process of trial and error. This framework assumes that early interactions between workers and organizations serve as opportunities for them to understand if job fit is poor and dissociate or remain affiliated as long as job fit is mutually acceptable. Therefore, job switching on average is expected to increase job fit because workers and organizations gain a better understanding of their own goals and values and choose more wisely the next time.
Other theoretical frameworks, such as the job characteristic model,[14] suggest that over time as workers stay at the same job, they continue to maintain and improve job fit through various workplace‐ or self‐modification strategies. For example, seniority status may have privileges (eg, less undesirable call), or workers may create privileged niches through the acquisition of new skills and abilities over time. Hospitalists' tendency to diversify their work‐related activities by incorporating administrative and teaching responsibilities[15] may thus contribute to improving job fit. Additionally, as a measure of complementarity among people who work together, job fit may be influenced by the quality of relationships among hospitalists and their coworkers through their reorientation to the prevailing organizational climate[16, 17] and increasing socialization.[18] Finally, given that experiential learning is known to contribute to better hospitalist work performance,[19] job fit may affect productivity and clinical outcomes vis‐‐vis quality of work life.
To test the validity of these assumptions in a sample of hospitalists, we critically appraised the following 4 hypotheses:
- Hypothesis 1 (H1): Job attrition and reselection improves job fit among hospitalists entering the job market.
- Hypothesis 2 (H2): Better job fit is achieved through hospitalists engaging a variety of personal skills and abilities.
- Hypothesis 3 (H3): Job fit increases with hospitalists' job duration together with socialization and internalization of organizational values.
- Hypothesis 4 (H4): Job fit is correlated with hospitalists' quality of work life.
METHODS
Analysis was performed on data from the 2009 to 2010 Hospital Medicine Physician Worklife Survey. The sample frame included nonmembers and members of Society of Hospital Medicine (SHM). Details about sampling strategy, data collection, and data quality are available in previous publications.[7, 20] The 118‐item survey instrument, including 9 demographic items and 24 practice and job characteristic items, was administered by mail. Examples of information solicited through these items included respondents' practice model, the number of hospitalist jobs they have held, and the specific kinds of clinical and nonclinical activities they performed as part of their current job.
We used a reliable but broad and generic measure of self‐perceived person‐job fit.[21] The survey items of the 5‐point Likert‐type scale anchored between strongly disagree and strongly agree were: I feel that my work utilizes my full abilities, I feel competent and fully able to handle my job, my job gives me the chance to do the things I feel I do best, I feel that my job and I are well‐matched, I feel I have adequate preparation for the job I now hold. The quality of hospitalists' relationships with physician colleagues, staff, and patients as well as job satisfaction was measured using scales adapted from the Physician Worklife Study.[22] Organizational climate was measured using an adapted scale from the Minimizing Error, Maximizing Outcome study incorporating 3 items from the cohesiveness subscale, 4 items from the organizational trust subscale, and 1 item from the quality emphasis subscale that were most pertinent to hospitalists' relationship with their organizations.[23] Intent to leave practice or reduce work hours was measured using 5 items from the Multi‐Center Hospitalist Survey Project.[24] Frequency of participation in suboptimal patient care was measured by adapting 3 items from the suboptimal reported practice subscale and 2 items from the suboptimal patient care subscale developed by Shanafelt et al.[25] Stress and job burnout were assessed using validated measures.[26, 27] Detailed descriptions of the response rate calculation and imputation of missing item data are available in previous publications.[7, 20]
Mean, variance, range, and skew were used to characterize the responses to the job fit survey scale. A table of respondent characteristics was constructed. A visual representation of job fit by individual hospitalist year in current practice was created, first, by plotting a locally weighted scatterplot smoothing curve to examine the shape of the general relationship, and second, by fitting a similarly contoured functional polynomial curve with 95% confidence intervals (CI) to a plot of the mean and interquartile range of job fit for each year in current practice. Spearman partial correlations were calculated for job fit and each of the 5 items addressing likelihood of leaving practice or reducing workload adjusted for gender to control for the higher proportion of women who plan to work part time. Median (interquartile range) job fit was calculated for categories defined by the number of job changes and compared with the reference category (no job change) using the nonparametric rank sum test for comparing non‐normally distributed data. Multivariate logistic regression models were used to calculate the odds ratio (OR) of participating in each of several clinical and nonclinical hospitalist activities between respondents whose job fit score was optimal (5 on a 5‐point scale) and less than optimal controlling for covariates that influence the likelihood of participating in these activities (years in current practice, practice model, and specialty training). A Spearman correlation matrix was created to assess interscale correlations among organizational parameters (years in current practice, job fit, organizational climate, and relationship with colleagues, staff, and patients). Finally, a separate Spearman correlation matrix was created to assess the interscale correlations among individual worker parameters (job fit, suboptimal patient care, job burnout, stress, and job satisfaction). Statistical significance was defined as P value <0.05, and all analyses were performed on Stata 11.0 (StataCorp, College Station, TX). The Northwestern University institutional review board approved this study.
RESULTS
Respondents included 816 hospitalists belonging to around 700 unique organizations. The adjusted response rate from the stratified sample was 26%. Respondents and nonrespondents were similar with regard to geographic region and model of practice, but respondents were more likely to be members of the SHM than nonrespondents. Panel A of Table 1 shows the demographic characteristics of the respondents. The mean age was 44.3 years, and about one‐third were women. The average hospitalist had about 7 years of experience in the specialty and about 5 years with their current hospitalist job. The majority were trained in internal medicine or one of its subspecialties, whereas pediatricians, family physicians, and physicians with other training made up the remainder.
| Panel A | Panel B | ||
|---|---|---|---|
| Total | Assimilation Period Hospitalists | Advancement Period Hospitalists | |
| |||
| Total, n | 816 | 103 | 713 |
| Female, n (%) | 284 (35) | 37 (36) | 247 (35) |
| Age, mean (SD) | 44.3 (9.0) | 41.9 (9.3) | 44.7 (8.9) |
| Years postresidency experience as hospitalist, mean (SD) | 6.9 (4.5) | 4.3 (3.1) | 7.2 (4.6) |
| Years in current practice, mean (SD) | 5.1 (3.9) | 0.9 (0.3) | 6.7 (3.8) |
| Specialty training, n (%) | |||
| Internal medicine | 555 (68) | 75 (73) | 480 (67) |
| Pediatrics | 117 (14) | 8 (8) | 109 (15.3) |
| Family medicine | 49 (6) | 7 (7) | 42 (6) |
| Other | 95 (11) | 13 (13) | 82 (12) |
Job fit was highly skewed toward optimum fit, with a mean of 4.3 on a scale of 1 to 5, with a narrow standard deviation of 0.7. The poorest job fit was reported by 0.3%, whereas optimal fit was reported by 21% of respondents. Job fit plotted against years in current practice had a logarithmic appearance typical of learning curves (Figure 1). An inflection point was visualized at around 2 years. For the purposes of this article, we refer to hospitalists' experience in the first 2 years of a job as an assimilation period, which is marked by a steep increase in job fit early when rapid learning or attrition took place. The years beyond the inflection point are characterized as an advancement period, when a more attenuated rise in job fit was experienced with time. The Spearman correlation between job fit and years in practice during the advancement period was 0.145 (n = 678, P < 0.001). Panel B of Table 1 displays the characteristics of respondents separately for the assimilation and advancement cohorts. Assimilation hospitalists in our sample had a mean age of 41.9 years and mean on‐the‐job experience of 4.3 years, reflecting that many hospitalists in the first 2 years of a job have made at least 1 job change in the past.

To show the effects of attrition and reselection, we first evaluated the proposition that hospitalists experience attrition (ie, intend to leave their jobs) in response to poor fit. Table 2 shows the correlations between job fit and the self‐reported intent to leave practice or reduce workload separately for the assimilation and advancement periods. For hospitalists in the assimilation period, job fit was negatively correlated with intent to leave current practice within 2 years and to leave hospital medicine within 5 years (P = 0.010 and 0.043, respectively). Hospitalists with <2 years in their current job, therefore, tended to consider attrition but not workload reduction to deal with poor job fit. On the other hand, hospitalists in the advancement period considered both attrition and workload reduction strategies in response to poor fit (all P < 0.001).
| Assimilation Period Hospitalists | Advancement Period Hospitalists | |||
|---|---|---|---|---|
| Rho | P Value | Rho | P Value | |
| Likelihood that a hospitalist will: | ||||
| Leave current practice within 2 years | 0.253 | 0.010 | 0.367 | <0.001 |
| Decrease total work hours within 5 years | 0.060 | 0.548 | 0.179 | <0.001 |
| Decrease clinical work hours within 5 years | 0.072 | 0.469 | 0.144 | <0.001 |
| Leave hospital medicine within 5 years | 0.200 | 0.043 | 0.231 | <0.001 |
| Leave direct patient care within 5 years | 0.040 | 0.691 | 0.212 | <0.001 |
In Table 3, we further compared the median job fit across categories for the number of job switches. The median job fit during the assimilation period of hospitalists who had made 1 job change was slightly but statistically higher than the job fit of their counterparts who never left their first job (4.4 vs 4.0, P = 0.046). This suggests that job switching by hospitalists early in their jobs is associated with improved job fit (H1). However, the fit during the assimilation period of hospitalists who switched jobs twice or more was statistically no different from the fit of those in their first jobs, suggesting that the effect of the attrition‐reselection strategy is weak or inconsistent. The job fit for advancement period hospitalists was also different across the job change and no‐change categories. However, in the case of hospitalists later in their jobs, the median job fit was slightly but statistically lower among those who made job changes, revealing the potential drop in job fit that occurs when a hospitalist already established in his or her job starts over again in a new setting.
| n | Age, Mean (95% CI), y | Hospitalist‐Job Fit, Median (IQR) | P Valuea | |
|---|---|---|---|---|
| ||||
| Assimilation period hospitalistsb | ||||
| No job change | 29 | 42.3 (37.347.3) | 4.0 (3.84.4) | Reference |
| 1 job change | 39 | 40.3 (38.142.5) | 4.4 (4.04.8) | 0.046 |
| 2 or more job changes | 27 | 43.8 (41.046.6) | 4.4 (3.84.8) | 0.153 |
| Advancement period hospitalistsc | ||||
| No job change | 390 | 44.5 (43.645.5) | 4.6 (4.05.0) | Reference |
| 1 job change | 183 | 45.0 (43.746.3) | 4.2 (4.04.8) | 0.002 |
| 2 or more job changes | 99 | 44.9 (43.146.6) | 4.2 (3.84.8) | 0.002 |
We hypothesized that hospitalists who achieved high job fit within a particular job were more likely to have engaged in activities that utilize a wider spectrum of their abilities. As shown in Table 4, hospitalists in the highest quartile of job fit were associated with a general trend toward higher odds of participating in a variety of common clinical and nonclinical hospitalist activities, but only the odds ratio associated with teaching achieved statistical significance (OR: 1.53, 95% CI: 1.01‐2.31) (H2).
| Participation, n/N (%) | Odds Ratio (95% CI) | P Value | |
|---|---|---|---|
| |||
| Administrative or committee work | 704/816 (86) | 0.73 (0.431.26) | 0.262 |
| Quality improvement or patient safety initiatives | 678/816 (83) | 1.13 (0.642.00) | 0.680 |
| Information technology design or implementation | 379/816 (46) | 1.18 (0.801.73) | 0.408 |
| Any of the above leadership activities | 758/816 (93) | 1.31 (0.563.05) | 0.535 |
| Teaching | 442/816 (54) | 1.53 (1.012.31) | 0.046 |
| Research | 120/816 (15) | 1.07 (0.601.92) | 0.816 |
| Any of the above academic activities | 457/816 (56) | 1.50 (0.992.27) | 0.057 |
| Code team or rapid response team | 437/816 (54) | 1.13 (0.771.68) | 0.533 |
| Intensive care unit | 254/816 (31) | 0.84 (0.531.35) | 0.469 |
| Skilled nursing facility or long‐term acute care facility | 126/816 (15) | 1.06 (0.621.81) | 0.835 |
| Outpatient general medical practice | 44/816 (5) | 1.75 (0.813.80) | 0.157 |
| Any of the above clinical activities | 681/816 (79) | 1.02 (0.601.76) | 0.930 |
Socialization with peers and the gradual sharing of values within organizations are hypothesized mechanisms for increasing job fit with time. We found that the number of years in current practice was positively correlated with job fit (Spearman coefficient R = 0.149, P < 0.001), organizational climate (R = 0.128, P < 0.001), and relationship with nonphysician staff (R = 0.102, P < 0.01). The association between years in practice and relationship with physician colleagues were weaker (R = 0.079, P < 0.05). Consistent with the episodic nature of patients' encounters with hospitalists, the measure of patient relationships was not significantly associated with length of time in job. In addition, we found substantial correlations among job fit, organizational climate, and all the relational measures (all R > 0.280, P < 0.001), indicating that hospitalists increasingly share the values of their organizations over time (H3).
Finally, we also hypothesized that poor job fit is associated with poor performance and quality of work life. Strong correlations with job fit were noted for stress (R = 0.307, P < 0.001), job burnout (R = 0.360, P < 0.001), and job satisfaction (R = 0.570, P < 0.001). Job fit (R = 0.147, P < 0.001), job burnout (R = 0.236, P < 0.001), stress (R = 0.305, P < 0.001), and job satisfaction (R = 0.224, P < 0.001) were all significantly correlated with the frequency of participating in suboptimal care (H4).
DISCUSSION
In this exploratory analysis, we validated in the hospitalist workforce several assumptions about person‐job fit that have been observed in workers of other industries. We observed attrition‐reselection (ie, job switching) as a strategy used by physicians to achieve better fit early in their job tenure, whereas job modification appeared to be more effective than attrition‐reselection among physicians already established in their jobs. We provided weak but plausible evidence that physicians with optimal job fit had a tendency to participate in activities (eg, teaching) that engage a wider set of interests and abilities. We also demonstrated the growth in hospitalists sharing the values of their organization through the time‐dependent associations among organizational climate, relational measures, and job fit. Finally, we found that physicians with suboptimal job fit were more likely to report poor performance in their work compared to those indicating optimal fit.
Our previous analysis of data from the Hospital Medicine Physician Worklife Survey exposed the widely variable work characteristics of hospitalist jobs in the US market and the equally variable preferences and priorities of individual hospitalists in selecting their work setting.[7] The implication of our present study is that hospitalists achieve the high levels of observed job fit using various strategies that aid their alignment with their employment. One of these strategies involves time, but physician longevity in practice may be both a determinant and product of good job fit. Although early job attrition may be necessary for fitting the right hospitalists to the right jobs, employers may appreciate the importance of retaining experienced hospitalists not only for cost and performance considerations but also for the growth of social capital in organizations consisting of enduring individuals. As our data suggest that hospitalists grow with their jobs, physicians may experience better fit with jobs that flexibly couple their work demands with benefits that address their individual work‐life needs over time. Another implication of this study is that job fit is a useful and predictive measure of job selection, performance, and retention. In light of studies that expose the limitations of job satisfaction as a measure influenced more by workers' dispositional affect (ie, their temperament and outlook) than their compatibility with their jobs,[28] job fit may add a functional dimension to traditional employee feedback measures.
There are limitations to this analysis. The most notable is the low survey response rate. Two reasons contributed to the fairly low rate of return. First, the original sampling frame included many outdated addresses and names of individuals who did not meet inclusion criteria. Although all sampled individuals who would have been excluded from the study could not be identified, we calculated our response rate without accounting for the proportion of potential ineligibles in the denominator population [Response Rate 2 (RR2) according to standards of the American Association of Public Opinion Research].[29] Second, the response rates of physician surveys have seen a steady decline over the years.[30] Respondents to our survey may be older and more experienced than US hospitalists in general. Although concerns about bias from under‐reporting cannot be fully addressed, we believe that the study sample is adequate for this preliminary study intended to translate the evidence of observed phenomena from the nonphysician to the physician workforces. The suboptimal response characteristics (high skew and low variability) of the generic person‐job fit survey scale used in this study indicate that a reliable survey instrument specifically designed to measure physician‐job fit need to be constructed de novo and validated for any future study. Although we performed simple analyses to support our assertions, few of our subanalyses may be underpowered, contributing to overinterpretation of the data. Additional empirical work is also necessary to assess the generalizability of this study's claims in other medical and surgical specialties. Such studies would also allow measurement of the sensitivity and specificity of physicians' self‐identification of poor job fit. Finally, additional investigations of this time‐dependent construct are more appropriately performed using a longitudinal study design to overcome the limitations inherent in this cross‐sectional analysis. Our conclusions about the time‐dependent features of job fit may be explained by other characteristics such as generational and cultural differences among hospitalists with varying experience.
As the US healthcare system reorganizes to bolster accountability,[31] we anticipate increasing interdependence between physicians and their employer organizations. Ultimately, the desired accountability in healthcare is likely to be obtained if physicians function not only as passive and interchangeable employees but as active stakeholders in the achievement of each organization's goals. A methodology for assessing the alignment of physicians and their jobs will continue to be important along the way.
Disclosure
Nothing to report.
- . Person‐organization fit: an integrative review of its conceptualizations, measurement, and implications. Personnel Psychol. 1996;49:1–49.
- , , . Consequences of individuals' fit at work: a meta‐analysis of person‐job, person‐organization, person‐group, and person‐supervisor fit. Personnel Psychol. 2005;58(2):281–342.
- .Person‐job fit: a conceptual integration, literature review and methodological critique. In: Cooper CL, Robertson IT, eds. International Review of Industrial and Organizational Psychology. Vol.6. New York, NY:John Wiley 1991.
- . Organizational culture, person‐culture fit, and turnover: a replication in the health care industry. J Organ Behav. 1999;20(2):175–184.
- , , , . Organizational culture and physician satisfaction with dimensions of group practice. Health Serv Res. 2007;42(3 pt 1):1150–1176.
- , , , et al. Career fit and burnout among academic faculty. Arch Intern Med. 2009;169(10):990–995.
- , , , , . Job characteristics, satisfaction, and burnout across hospitalist practice models. J Hosp Med. 2012;7(5):402–410.
- . Provider‐hospital “fit” and patient outcomes: evidence from Massachusetts cardiac surgeons, 2002–2004. Health Serv Res. 2011;46(1 pt 1):1–26.
- . The evolving primary care physician. N Engl J Med. 2012;366(20):1849–1853.
- , . Hospitals' race to employ physicians—the logic behind a money‐losing proposition. N Engl J Med. 2011;364(19):1790–1793.
- 2011 Survey of Final‐Year Medical Residents. Irving, TX:Merritt Hawkins;2011.
- State of Hospital Medicine: 2010 Report Based on 2009 Data. Englewood, CO:Society of Hospital Medicine and the Medical Group Management Association;2010.
- , , . The ASA framework: an update. Personnel Psychol. 1995;48(4):747–773.
- , . Work Redesign. Reading. MA:Addison‐Wesley;1980.
- , . The expanding role of hospitalists in the United States. Swiss Med Wkly. 2006;136(37–38):591–596.
- , . Organizational socialization as a learning‐process—the role of information acquisition. Personnel Psychol. 1992;45(4):849–874.
- , . The moderating effect of tenure in person‐environment fit: a field study in educational organizations. J Occup Organ Psych. 1997;70:173–188.
- . Matching people and organizations—selection and socialization in public accounting firms. Admin Sci Quart. 1991;36(3):459–484.
- , , , et al. Effects of physician experience on costs and outcomes on an academic general medicine service: results of a trial of hospitalists. Ann Intern Med. 2002;137(11):866–874.
- , , , , . Worklife and satisfaction of hospitalists: toward flourishing careers. J Gen Intern Med. 2012;27(1):28–36.
- . Karasek's model in the People's Republic of China: effects of job demands, control, and individual differences. Acad Manage J. 1996;39(6):1594–1618.
- , , , et al. Measuring physician job satisfaction in a changing workplace and a challenging environment. SGIM Career Satisfaction Study Group. Society of General Internal Medicine. Med Care. 1999;37(11):1174–1182.
- , , , et al. Organizational climate, stress, and error in primary care: The MEMO Study. Adv Patient Saf. 2005;1:65–77.
- , , , et al. Effects of inpatient experience on outcomes and costs in a multicenter trial of academic hospitalists. J Gen Intern Med. 2005;20(suppl 1):141–142.
- , , , . Burnout and self‐reported patient care in an internal medicine residency program. Ann Intern Med. 2002;136(5):358–367.
- , . Effect of job demands and social support on worker stress—a study of VDT users. Behav Inform Technol. 1995;14(1):32–40.
- , , . Validation of a single‐item measure of burnout against the Maslach Burnout Inventory among physicians. Stress Health. 2004;20(2):75–79.
- , . Job satisfaction: a meta‐analysis of stabilities. J Organ Behav. 2001;22(5):483–504.
- The American Association for Public Opinion Research. Standard definitions: final dispositions of case codes and outcome rates for surveys.7th ed. Available at: http://www.aapor.org/Standard_Definitions2.htm. Accessed May 2,2012.
- , , , . Response rates and response bias for 50 surveys of pediatricians. Health Serv Res. 2005;40(1):213–226.
- , . Accountable care organizations: accountable for what, to whom, and how. JAMA. 2010;304(15):1715–6.
Person‐organization fit concerns the conditions and consequences of compatibility between people and the organizations for which they work.[1] Studies of other industries have demonstrated that person‐organization fit informs the way individuals join, perform in, and are retained by organizations.[2] Person‐job fit is a closely related subordinate concept that concerns the alignment of workers and their job in as much as workers have needs that their job supplies, or conversely, jobs have requirements that certain workers' abilities can help meet.[3] Explorations of job fit in physicians and their work have recently emerged in a few investigations published in medical journals.[4, 5, 6, 7, 8] Further expanding the understanding of fit between physicians and their employment is important, because the decline of solo practices and recent emphasis on team‐based care have led to a growing number of US physicians working in organizations.[9]
The movement of physicians into employed situations may continue if certain types of Accountable Care Organizations take root.[10] And physicians may be primed to join employer organizations based on current career priorities of individuals in American society. Surveys of medical residents entering the workforce reveal more physicians preferring the security of being employees than starting their own practices.[11] Given these trends, job fit will inform our understanding of how personal and job characteristics facilitate recruitment, performance, satisfaction, and longevity of physician employees.
BACKGROUND
Virtually all hospitalists work in organizationshospitalsand are employees of hospitals, medical schools, physician group practices, or management companies, and therefore invariably function within organizational structures and systems.[7] In spite of their rapid growth in numbers, many employers have faced difficulties recruiting and retaining enough hospitalists to fill their staffing needs. Consequently, the US hospitalist workforce today is characterized by high salaries, work load, and attrition rates.[12]
In this evolving unsaturated market, the attraction‐selection‐attrition framework[13] provides a theoretical construct that predicts that hospitalists and their employers would seek congruence of goals and values early in their relationship through a process of trial and error. This framework assumes that early interactions between workers and organizations serve as opportunities for them to understand if job fit is poor and dissociate or remain affiliated as long as job fit is mutually acceptable. Therefore, job switching on average is expected to increase job fit because workers and organizations gain a better understanding of their own goals and values and choose more wisely the next time.
Other theoretical frameworks, such as the job characteristic model,[14] suggest that over time as workers stay at the same job, they continue to maintain and improve job fit through various workplace‐ or self‐modification strategies. For example, seniority status may have privileges (eg, less undesirable call), or workers may create privileged niches through the acquisition of new skills and abilities over time. Hospitalists' tendency to diversify their work‐related activities by incorporating administrative and teaching responsibilities[15] may thus contribute to improving job fit. Additionally, as a measure of complementarity among people who work together, job fit may be influenced by the quality of relationships among hospitalists and their coworkers through their reorientation to the prevailing organizational climate[16, 17] and increasing socialization.[18] Finally, given that experiential learning is known to contribute to better hospitalist work performance,[19] job fit may affect productivity and clinical outcomes vis‐‐vis quality of work life.
To test the validity of these assumptions in a sample of hospitalists, we critically appraised the following 4 hypotheses:
- Hypothesis 1 (H1): Job attrition and reselection improves job fit among hospitalists entering the job market.
- Hypothesis 2 (H2): Better job fit is achieved through hospitalists engaging a variety of personal skills and abilities.
- Hypothesis 3 (H3): Job fit increases with hospitalists' job duration together with socialization and internalization of organizational values.
- Hypothesis 4 (H4): Job fit is correlated with hospitalists' quality of work life.
METHODS
Analysis was performed on data from the 2009 to 2010 Hospital Medicine Physician Worklife Survey. The sample frame included nonmembers and members of Society of Hospital Medicine (SHM). Details about sampling strategy, data collection, and data quality are available in previous publications.[7, 20] The 118‐item survey instrument, including 9 demographic items and 24 practice and job characteristic items, was administered by mail. Examples of information solicited through these items included respondents' practice model, the number of hospitalist jobs they have held, and the specific kinds of clinical and nonclinical activities they performed as part of their current job.
We used a reliable but broad and generic measure of self‐perceived person‐job fit.[21] The survey items of the 5‐point Likert‐type scale anchored between strongly disagree and strongly agree were: I feel that my work utilizes my full abilities, I feel competent and fully able to handle my job, my job gives me the chance to do the things I feel I do best, I feel that my job and I are well‐matched, I feel I have adequate preparation for the job I now hold. The quality of hospitalists' relationships with physician colleagues, staff, and patients as well as job satisfaction was measured using scales adapted from the Physician Worklife Study.[22] Organizational climate was measured using an adapted scale from the Minimizing Error, Maximizing Outcome study incorporating 3 items from the cohesiveness subscale, 4 items from the organizational trust subscale, and 1 item from the quality emphasis subscale that were most pertinent to hospitalists' relationship with their organizations.[23] Intent to leave practice or reduce work hours was measured using 5 items from the Multi‐Center Hospitalist Survey Project.[24] Frequency of participation in suboptimal patient care was measured by adapting 3 items from the suboptimal reported practice subscale and 2 items from the suboptimal patient care subscale developed by Shanafelt et al.[25] Stress and job burnout were assessed using validated measures.[26, 27] Detailed descriptions of the response rate calculation and imputation of missing item data are available in previous publications.[7, 20]
Mean, variance, range, and skew were used to characterize the responses to the job fit survey scale. A table of respondent characteristics was constructed. A visual representation of job fit by individual hospitalist year in current practice was created, first, by plotting a locally weighted scatterplot smoothing curve to examine the shape of the general relationship, and second, by fitting a similarly contoured functional polynomial curve with 95% confidence intervals (CI) to a plot of the mean and interquartile range of job fit for each year in current practice. Spearman partial correlations were calculated for job fit and each of the 5 items addressing likelihood of leaving practice or reducing workload adjusted for gender to control for the higher proportion of women who plan to work part time. Median (interquartile range) job fit was calculated for categories defined by the number of job changes and compared with the reference category (no job change) using the nonparametric rank sum test for comparing non‐normally distributed data. Multivariate logistic regression models were used to calculate the odds ratio (OR) of participating in each of several clinical and nonclinical hospitalist activities between respondents whose job fit score was optimal (5 on a 5‐point scale) and less than optimal controlling for covariates that influence the likelihood of participating in these activities (years in current practice, practice model, and specialty training). A Spearman correlation matrix was created to assess interscale correlations among organizational parameters (years in current practice, job fit, organizational climate, and relationship with colleagues, staff, and patients). Finally, a separate Spearman correlation matrix was created to assess the interscale correlations among individual worker parameters (job fit, suboptimal patient care, job burnout, stress, and job satisfaction). Statistical significance was defined as P value <0.05, and all analyses were performed on Stata 11.0 (StataCorp, College Station, TX). The Northwestern University institutional review board approved this study.
RESULTS
Respondents included 816 hospitalists belonging to around 700 unique organizations. The adjusted response rate from the stratified sample was 26%. Respondents and nonrespondents were similar with regard to geographic region and model of practice, but respondents were more likely to be members of the SHM than nonrespondents. Panel A of Table 1 shows the demographic characteristics of the respondents. The mean age was 44.3 years, and about one‐third were women. The average hospitalist had about 7 years of experience in the specialty and about 5 years with their current hospitalist job. The majority were trained in internal medicine or one of its subspecialties, whereas pediatricians, family physicians, and physicians with other training made up the remainder.
| Panel A | Panel B | ||
|---|---|---|---|
| Total | Assimilation Period Hospitalists | Advancement Period Hospitalists | |
| |||
| Total, n | 816 | 103 | 713 |
| Female, n (%) | 284 (35) | 37 (36) | 247 (35) |
| Age, mean (SD) | 44.3 (9.0) | 41.9 (9.3) | 44.7 (8.9) |
| Years postresidency experience as hospitalist, mean (SD) | 6.9 (4.5) | 4.3 (3.1) | 7.2 (4.6) |
| Years in current practice, mean (SD) | 5.1 (3.9) | 0.9 (0.3) | 6.7 (3.8) |
| Specialty training, n (%) | |||
| Internal medicine | 555 (68) | 75 (73) | 480 (67) |
| Pediatrics | 117 (14) | 8 (8) | 109 (15.3) |
| Family medicine | 49 (6) | 7 (7) | 42 (6) |
| Other | 95 (11) | 13 (13) | 82 (12) |
Job fit was highly skewed toward optimum fit, with a mean of 4.3 on a scale of 1 to 5, with a narrow standard deviation of 0.7. The poorest job fit was reported by 0.3%, whereas optimal fit was reported by 21% of respondents. Job fit plotted against years in current practice had a logarithmic appearance typical of learning curves (Figure 1). An inflection point was visualized at around 2 years. For the purposes of this article, we refer to hospitalists' experience in the first 2 years of a job as an assimilation period, which is marked by a steep increase in job fit early when rapid learning or attrition took place. The years beyond the inflection point are characterized as an advancement period, when a more attenuated rise in job fit was experienced with time. The Spearman correlation between job fit and years in practice during the advancement period was 0.145 (n = 678, P < 0.001). Panel B of Table 1 displays the characteristics of respondents separately for the assimilation and advancement cohorts. Assimilation hospitalists in our sample had a mean age of 41.9 years and mean on‐the‐job experience of 4.3 years, reflecting that many hospitalists in the first 2 years of a job have made at least 1 job change in the past.
To show the effects of attrition and reselection, we first evaluated the proposition that hospitalists experience attrition (ie, intend to leave their jobs) in response to poor fit. Table 2 shows the correlations between job fit and the self‐reported intent to leave practice or reduce workload separately for the assimilation and advancement periods. For hospitalists in the assimilation period, job fit was negatively correlated with intent to leave current practice within 2 years and to leave hospital medicine within 5 years (P = 0.010 and 0.043, respectively). Hospitalists with <2 years in their current job, therefore, tended to consider attrition but not workload reduction to deal with poor job fit. On the other hand, hospitalists in the advancement period considered both attrition and workload reduction strategies in response to poor fit (all P < 0.001).
| Assimilation Period Hospitalists | Advancement Period Hospitalists | |||
|---|---|---|---|---|
| Rho | P Value | Rho | P Value | |
| Likelihood that a hospitalist will: | ||||
| Leave current practice within 2 years | 0.253 | 0.010 | 0.367 | <0.001 |
| Decrease total work hours within 5 years | 0.060 | 0.548 | 0.179 | <0.001 |
| Decrease clinical work hours within 5 years | 0.072 | 0.469 | 0.144 | <0.001 |
| Leave hospital medicine within 5 years | 0.200 | 0.043 | 0.231 | <0.001 |
| Leave direct patient care within 5 years | 0.040 | 0.691 | 0.212 | <0.001 |
In Table 3, we further compared the median job fit across categories for the number of job switches. The median job fit during the assimilation period of hospitalists who had made 1 job change was slightly but statistically higher than the job fit of their counterparts who never left their first job (4.4 vs 4.0, P = 0.046). This suggests that job switching by hospitalists early in their jobs is associated with improved job fit (H1). However, the fit during the assimilation period of hospitalists who switched jobs twice or more was statistically no different from the fit of those in their first jobs, suggesting that the effect of the attrition‐reselection strategy is weak or inconsistent. The job fit for advancement period hospitalists was also different across the job change and no‐change categories. However, in the case of hospitalists later in their jobs, the median job fit was slightly but statistically lower among those who made job changes, revealing the potential drop in job fit that occurs when a hospitalist already established in his or her job starts over again in a new setting.
| n | Age, Mean (95% CI), y | Hospitalist‐Job Fit, Median (IQR) | P Valuea | |
|---|---|---|---|---|
| ||||
| Assimilation period hospitalistsb | ||||
| No job change | 29 | 42.3 (37.347.3) | 4.0 (3.84.4) | Reference |
| 1 job change | 39 | 40.3 (38.142.5) | 4.4 (4.04.8) | 0.046 |
| 2 or more job changes | 27 | 43.8 (41.046.6) | 4.4 (3.84.8) | 0.153 |
| Advancement period hospitalistsc | ||||
| No job change | 390 | 44.5 (43.645.5) | 4.6 (4.05.0) | Reference |
| 1 job change | 183 | 45.0 (43.746.3) | 4.2 (4.04.8) | 0.002 |
| 2 or more job changes | 99 | 44.9 (43.146.6) | 4.2 (3.84.8) | 0.002 |
We hypothesized that hospitalists who achieved high job fit within a particular job were more likely to have engaged in activities that utilize a wider spectrum of their abilities. As shown in Table 4, hospitalists in the highest quartile of job fit were associated with a general trend toward higher odds of participating in a variety of common clinical and nonclinical hospitalist activities, but only the odds ratio associated with teaching achieved statistical significance (OR: 1.53, 95% CI: 1.01‐2.31) (H2).
| Participation, n/N (%) | Odds Ratio (95% CI) | P Value | |
|---|---|---|---|
| |||
| Administrative or committee work | 704/816 (86) | 0.73 (0.431.26) | 0.262 |
| Quality improvement or patient safety initiatives | 678/816 (83) | 1.13 (0.642.00) | 0.680 |
| Information technology design or implementation | 379/816 (46) | 1.18 (0.801.73) | 0.408 |
| Any of the above leadership activities | 758/816 (93) | 1.31 (0.563.05) | 0.535 |
| Teaching | 442/816 (54) | 1.53 (1.012.31) | 0.046 |
| Research | 120/816 (15) | 1.07 (0.601.92) | 0.816 |
| Any of the above academic activities | 457/816 (56) | 1.50 (0.992.27) | 0.057 |
| Code team or rapid response team | 437/816 (54) | 1.13 (0.771.68) | 0.533 |
| Intensive care unit | 254/816 (31) | 0.84 (0.531.35) | 0.469 |
| Skilled nursing facility or long‐term acute care facility | 126/816 (15) | 1.06 (0.621.81) | 0.835 |
| Outpatient general medical practice | 44/816 (5) | 1.75 (0.813.80) | 0.157 |
| Any of the above clinical activities | 681/816 (79) | 1.02 (0.601.76) | 0.930 |
Socialization with peers and the gradual sharing of values within organizations are hypothesized mechanisms for increasing job fit with time. We found that the number of years in current practice was positively correlated with job fit (Spearman coefficient R = 0.149, P < 0.001), organizational climate (R = 0.128, P < 0.001), and relationship with nonphysician staff (R = 0.102, P < 0.01). The association between years in practice and relationship with physician colleagues were weaker (R = 0.079, P < 0.05). Consistent with the episodic nature of patients' encounters with hospitalists, the measure of patient relationships was not significantly associated with length of time in job. In addition, we found substantial correlations among job fit, organizational climate, and all the relational measures (all R > 0.280, P < 0.001), indicating that hospitalists increasingly share the values of their organizations over time (H3).
Finally, we also hypothesized that poor job fit is associated with poor performance and quality of work life. Strong correlations with job fit were noted for stress (R = 0.307, P < 0.001), job burnout (R = 0.360, P < 0.001), and job satisfaction (R = 0.570, P < 0.001). Job fit (R = 0.147, P < 0.001), job burnout (R = 0.236, P < 0.001), stress (R = 0.305, P < 0.001), and job satisfaction (R = 0.224, P < 0.001) were all significantly correlated with the frequency of participating in suboptimal care (H4).
DISCUSSION
In this exploratory analysis, we validated in the hospitalist workforce several assumptions about person‐job fit that have been observed in workers of other industries. We observed attrition‐reselection (ie, job switching) as a strategy used by physicians to achieve better fit early in their job tenure, whereas job modification appeared to be more effective than attrition‐reselection among physicians already established in their jobs. We provided weak but plausible evidence that physicians with optimal job fit had a tendency to participate in activities (eg, teaching) that engage a wider set of interests and abilities. We also demonstrated the growth in hospitalists sharing the values of their organization through the time‐dependent associations among organizational climate, relational measures, and job fit. Finally, we found that physicians with suboptimal job fit were more likely to report poor performance in their work compared to those indicating optimal fit.
Our previous analysis of data from the Hospital Medicine Physician Worklife Survey exposed the widely variable work characteristics of hospitalist jobs in the US market and the equally variable preferences and priorities of individual hospitalists in selecting their work setting.[7] The implication of our present study is that hospitalists achieve the high levels of observed job fit using various strategies that aid their alignment with their employment. One of these strategies involves time, but physician longevity in practice may be both a determinant and product of good job fit. Although early job attrition may be necessary for fitting the right hospitalists to the right jobs, employers may appreciate the importance of retaining experienced hospitalists not only for cost and performance considerations but also for the growth of social capital in organizations consisting of enduring individuals. As our data suggest that hospitalists grow with their jobs, physicians may experience better fit with jobs that flexibly couple their work demands with benefits that address their individual work‐life needs over time. Another implication of this study is that job fit is a useful and predictive measure of job selection, performance, and retention. In light of studies that expose the limitations of job satisfaction as a measure influenced more by workers' dispositional affect (ie, their temperament and outlook) than their compatibility with their jobs,[28] job fit may add a functional dimension to traditional employee feedback measures.
There are limitations to this analysis. The most notable is the low survey response rate. Two reasons contributed to the fairly low rate of return. First, the original sampling frame included many outdated addresses and names of individuals who did not meet inclusion criteria. Although all sampled individuals who would have been excluded from the study could not be identified, we calculated our response rate without accounting for the proportion of potential ineligibles in the denominator population [Response Rate 2 (RR2) according to standards of the American Association of Public Opinion Research].[29] Second, the response rates of physician surveys have seen a steady decline over the years.[30] Respondents to our survey may be older and more experienced than US hospitalists in general. Although concerns about bias from under‐reporting cannot be fully addressed, we believe that the study sample is adequate for this preliminary study intended to translate the evidence of observed phenomena from the nonphysician to the physician workforces. The suboptimal response characteristics (high skew and low variability) of the generic person‐job fit survey scale used in this study indicate that a reliable survey instrument specifically designed to measure physician‐job fit need to be constructed de novo and validated for any future study. Although we performed simple analyses to support our assertions, few of our subanalyses may be underpowered, contributing to overinterpretation of the data. Additional empirical work is also necessary to assess the generalizability of this study's claims in other medical and surgical specialties. Such studies would also allow measurement of the sensitivity and specificity of physicians' self‐identification of poor job fit. Finally, additional investigations of this time‐dependent construct are more appropriately performed using a longitudinal study design to overcome the limitations inherent in this cross‐sectional analysis. Our conclusions about the time‐dependent features of job fit may be explained by other characteristics such as generational and cultural differences among hospitalists with varying experience.
As the US healthcare system reorganizes to bolster accountability,[31] we anticipate increasing interdependence between physicians and their employer organizations. Ultimately, the desired accountability in healthcare is likely to be obtained if physicians function not only as passive and interchangeable employees but as active stakeholders in the achievement of each organization's goals. A methodology for assessing the alignment of physicians and their jobs will continue to be important along the way.
Disclosure
Nothing to report.
- . Person‐organization fit: an integrative review of its conceptualizations, measurement, and implications. Personnel Psychol. 1996;49:1–49.
- , , . Consequences of individuals' fit at work: a meta‐analysis of person‐job, person‐organization, person‐group, and person‐supervisor fit. Personnel Psychol. 2005;58(2):281–342.
- .Person‐job fit: a conceptual integration, literature review and methodological critique. In: Cooper CL, Robertson IT, eds. International Review of Industrial and Organizational Psychology. Vol.6. New York, NY:John Wiley 1991.
- . Organizational culture, person‐culture fit, and turnover: a replication in the health care industry. J Organ Behav. 1999;20(2):175–184.
- , , , . Organizational culture and physician satisfaction with dimensions of group practice. Health Serv Res. 2007;42(3 pt 1):1150–1176.
- , , , et al. Career fit and burnout among academic faculty. Arch Intern Med. 2009;169(10):990–995.
- , , , , . Job characteristics, satisfaction, and burnout across hospitalist practice models. J Hosp Med. 2012;7(5):402–410.
- . Provider‐hospital “fit” and patient outcomes: evidence from Massachusetts cardiac surgeons, 2002–2004. Health Serv Res. 2011;46(1 pt 1):1–26.
- . The evolving primary care physician. N Engl J Med. 2012;366(20):1849–1853.
- , . Hospitals' race to employ physicians—the logic behind a money‐losing proposition. N Engl J Med. 2011;364(19):1790–1793.
- 2011 Survey of Final‐Year Medical Residents. Irving, TX:Merritt Hawkins;2011.
- State of Hospital Medicine: 2010 Report Based on 2009 Data. Englewood, CO:Society of Hospital Medicine and the Medical Group Management Association;2010.
- , , . The ASA framework: an update. Personnel Psychol. 1995;48(4):747–773.
- , . Work Redesign. Reading. MA:Addison‐Wesley;1980.
- , . The expanding role of hospitalists in the United States. Swiss Med Wkly. 2006;136(37–38):591–596.
- , . Organizational socialization as a learning‐process—the role of information acquisition. Personnel Psychol. 1992;45(4):849–874.
- , . The moderating effect of tenure in person‐environment fit: a field study in educational organizations. J Occup Organ Psych. 1997;70:173–188.
- . Matching people and organizations—selection and socialization in public accounting firms. Admin Sci Quart. 1991;36(3):459–484.
- , , , et al. Effects of physician experience on costs and outcomes on an academic general medicine service: results of a trial of hospitalists. Ann Intern Med. 2002;137(11):866–874.
- , , , , . Worklife and satisfaction of hospitalists: toward flourishing careers. J Gen Intern Med. 2012;27(1):28–36.
- . Karasek's model in the People's Republic of China: effects of job demands, control, and individual differences. Acad Manage J. 1996;39(6):1594–1618.
- , , , et al. Measuring physician job satisfaction in a changing workplace and a challenging environment. SGIM Career Satisfaction Study Group. Society of General Internal Medicine. Med Care. 1999;37(11):1174–1182.
- , , , et al. Organizational climate, stress, and error in primary care: The MEMO Study. Adv Patient Saf. 2005;1:65–77.
- , , , et al. Effects of inpatient experience on outcomes and costs in a multicenter trial of academic hospitalists. J Gen Intern Med. 2005;20(suppl 1):141–142.
- , , , . Burnout and self‐reported patient care in an internal medicine residency program. Ann Intern Med. 2002;136(5):358–367.
- , . Effect of job demands and social support on worker stress—a study of VDT users. Behav Inform Technol. 1995;14(1):32–40.
- , , . Validation of a single‐item measure of burnout against the Maslach Burnout Inventory among physicians. Stress Health. 2004;20(2):75–79.
- , . Job satisfaction: a meta‐analysis of stabilities. J Organ Behav. 2001;22(5):483–504.
- The American Association for Public Opinion Research. Standard definitions: final dispositions of case codes and outcome rates for surveys.7th ed. Available at: http://www.aapor.org/Standard_Definitions2.htm. Accessed May 2,2012.
- , , , . Response rates and response bias for 50 surveys of pediatricians. Health Serv Res. 2005;40(1):213–226.
- , . Accountable care organizations: accountable for what, to whom, and how. JAMA. 2010;304(15):1715–6.
Copyright © 2012 Society of Hospital Medicine
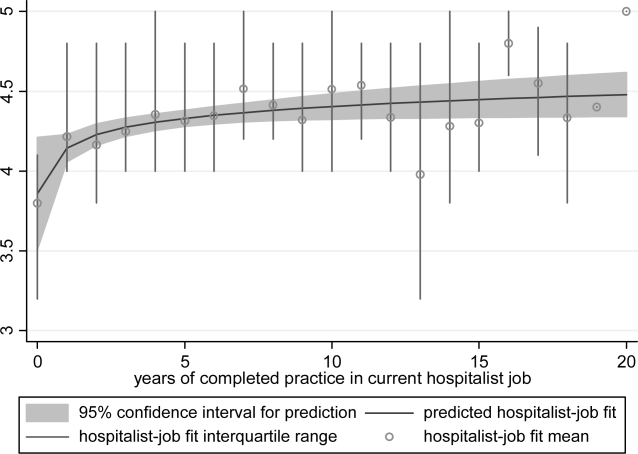
Hospitalist Practice Models
Over the past 15 years, there has been dramatic growth in the number of hospitalist physicians in the United States and in the number of hospitals served by them.13 Hospitals are motivated to hire experienced hospitalists to staff their inpatient services,4 with goals that include obtaining cost‐savings and higher quality.59 The rapid growth of Hospital Medicine saw multiple types of hospital practice models emerge with differing job characteristics, clinical duties, workload, and compensation schemes.10 The extent of the variability of hospitalist jobs across practice models is not known.
Intensifying recruitment efforts and the concomitant increase in compensation for hospitalists over the last decade suggest that demand for hospitalists is strong and sustained.11 As a result, today's cohort of hospitalists has a wide range of choices of types of jobs, practice models, and locations. The diversity of available hospitalist jobs is characterized, for example, by setting (community hospital vs academic hospital), employer (hospital vs private practice), job duties (the amount and type of clinical work, and other administrative, teaching, or research duties), and intensity (work hours and duties to maximize income or lifestyle). How these choices relate to job satisfaction and burnout are also unknown.
The Society of Hospital Medicine (SHM) has administered surveys to hospitalist group leaders biennially since 2003.1215 These surveys, however, do not address issues related to individual hospitalist worklife, recruitment, and retention. In 2005, SHM convened a Career Satisfaction Task Force that designed and executed a national survey of hospitalists in 2009‐2010. The objective of this study is to evaluate how job characteristics vary by practice model, and the association of these characteristics and practice models with job satisfaction and burnout.
METHODS
Survey Instrument
A detailed description of the survey design, sampling strategy, data collection, and response rate calculations is described elsewhere.16 Portions of the 118‐item survey instrument assessed characteristics of the respondents' hospitalist group (12 items), details about their individual work patterns (12 items), and demographics (9 items). Work patterns were evaluated by the average number of clinical work days, consecutive days, hours per month, percentage of work assigned to night duty, and number of patient encounters. Average hours spent on nonclinical work, and the percentage of time allocated for clinical, administrative, teaching, and research activities were solicited. Additional items assessed specific clinical responsibilities, pretax earnings in FY2010, the availability of information technology capabilities, and the adequacy of available resources. Job and specialty satisfaction and 11 satisfaction domain measures were measured using validated scales.1726 Burnout symptoms were measured using a validated single‐item measure.26, 27
Sampling Strategy
We surveyed a national stratified sample of hospitalists in the US and Puerto Rico. We used the largest database of hospitalists (>24,000 names) currently available and maintained by the SHM as our sampling frame. We linked hospitalist employer information to hospital statistics from the American Hospital Association database28 to stratify the sample by number of hospital beds, geographic region, employment model, and specialty training, oversampling pediatric hospitalists due to small numbers. A respondent sample of about 700 hospitalists was calculated to be adequate to detect a 0.5 point difference in job satisfaction scores between subgroups assuming 90% power and alpha of 0.05. However, we sampled a total of 5389 addresses from the database to overcome the traditionally low physician response rates, duplicate sampling, bad addresses, and non‐hospitalists being included in the sampling frame. In addition, 2 multistate hospitalist companies (EmCare, In Compass Health) and 1 for‐profit hospital chain (HCA, Inc) financially sponsored this project with the stipulation that all of their hospitalist employees (n = 884) would be surveyed.
Data Collection
The healthcare consulting firm, Press Ganey, provided support with survey layout and administration following the modified Dillman method.29 Three rounds of coded surveys and solicitation letters from the investigators were mailed 2 weeks apart in November and December 2009. Because of low response rates to the mailed survey, an online survey was created using Survey Monkey and sent to 650 surveyees for whom e‐mail addresses were available, and administered at a kiosk for sample physicians during the SHM 2010 annual meeting.
Data Analysis
Nonresponse bias was measured by comparing characteristics between respondents of separate survey waves.30 We determined the validity of mailing addresses immediately following the survey period by mapping each address using Google, and if the address was a hospital, researching online whether or not the intended recipient was currently employed there. Practice characteristics were compared across 5 model categories distilled from the SHM & Medical Group Management Association survey: local hospitalist‐only group, multistate hospitalist group, multispecialty physician group, employer hospital, and university or medical school. Weighted proportions, means, and medians were calculated to account for oversampling of pediatric hospitalists. Differences in categorical measures were assessed using the chi‐square test and the design‐based F test for comparing weighted data. Weighted means (99% confidence intervals) and medians (interquartile ranges) were calculated. Because each parameter yielded a single outlier value across the 5 practice models, differences across weighted means were assessed using generalized linear models with the single outlier value chosen as the reference mean. Pair‐wise Wilcoxon rank sum test was used to compare median values. In these 4‐way comparisons of means and medians, significance was defined as P value of 0.0125 per Bonferroni correction. A single survey item solicited respondents to choose exactly 4 of 13 considerations most pertinent to job satisfaction. The proportion of respondents who scored 4 on a 5‐point Likert scale of the 11 satisfaction domains and 2 global measures of satisfaction, and burnout symptoms defined as 3 on a 5‐point single item measure were bar‐graphed. Chi‐square statistics were used to evaluate for differences across practice models. Statistical significance was defined by alpha less than 0.05, unless otherwise specified. All analyses were performed using STATA version 11.0 (College Station, TX). This study was approved by the Loyola University Institutional Review Board.
Survey data required cleaning prior to analysis. Missing gender information was imputed using the respondents' name. Responses to the item that asked to indicate the proportion of work dedicated to administrative responsibilities, clinical care, teaching, and research that did not add up to 100% were dropped. Two responses that indicated full‐time equivalent (FTE) of 0%, but whose respondents otherwise completed the survey implying they worked as clinical hospitalists, were replaced with values calculated from the given number of work hours relative to the median work hours in our sample. Out of range or implausible responses to the following items were dropped from analyses: the average number of billable encounters during a typical day or shift, number of shifts performing clinical activities during a typical month, pretax earnings, the year the respondent completed residency training, and the number of whole years practiced as a hospitalist. The proportion of selective item nonresponse was small and we did not, otherwise, impute missing data.
RESULTS
Response Rate
Of the 5389 originally sampled addresses, 1868 were undeliverable. Addresses were further excluded if they appeared in duplicate or were outdated. This yielded a total of 3105 eligible surveyees in the sample. As illustrated in Figure 1, 841 responded to the mailed survey and 5 responded to the Web‐based survey. After rejecting 67 non‐hospitalist respondents and 3 duplicate surveys, a total of 776 surveys were included in the final analysis. The adjusted response rate was 25.6% (776/3035). Members of SHM were more likely to return the survey than nonmembers. The adjusted response rate from hospitalists affiliated with the 3 sponsoring institutions was 6% (40/662). Because these respondents were more likely to be non‐members of SHM, we opted to analyze the responses from the sponsor hospitalists together with the sampled hospitalists. The demographics of the resulting pool of 816 respondents affiliated with over 650 unique hospitalist groups were representative of the original survey frame. We analyzed data from 794 of these who responded to the item indicating their hospitalist practice model. Demographic characteristics of responders and nonresponders to the practice model survey item were similar.

Characteristics of Hospitalists and Their Groups
Table 1 summarizes the characteristics of hospitalist respondents and their organizations by practice model. More (44%) respondents identified their practice model as directly employed by the hospital than other models, including multispecialty physician group (15%), multistate hospitalist group (14%), university or medical school (14%), local hospitalist group (12%), and other (2%). The median age of hospitalist respondents was 42 years, with 6.8 years of mean experience as a hospitalist. One third were women, 84% were married, and 46% had dependent children 6 years old or younger at home. Notably, hospitalists in multistate groups had fewer years of experience, and fewer hospitalists in local and multistate groups were married compared to hospitalists in other practice models.
| Local Hospitalist‐Only Group | Multi‐State Hospitalist Group | Multispecialty Physician Group | Employer Hospital | University or Medical School | ||
|---|---|---|---|---|---|---|
| n = 95 | n = 111 | n = 115 | n = 348 | n = 107 | P Value | |
| ||||||
| Hospitalist characteristics | ||||||
| Age, weighted mean (99% CI) | 45 (42, 48) | 44 (42, 47) | 45 (43, 47) | 45 (43, 46) | 43 (40, 46) | |
| Years hospitalist experience, weighted mean (99% CI) | 8 (6, 9)* | 5 (4, 6)* | 8 (7, 9) | 7 (6, 7) | 8 (6, 9) | <0.010* |
| Women, weighted % | 29 | 30 | 39 | 31 | 43 | 0.118 |
| Married, weighted % | 76 | 77 | 82 | 89 | 81 | 0.009 |
| At least 1 dependent child younger than age 6 living in home, weighted % | 47 | 48 | 43 | 47 | 45 | 0.905 |
| Pediatric specialty, n (%) | <10 | <10 | 11 (10%) | 57 (16%) | 36 (34%) | <0.001 |
| Hospitalist group characteristics | ||||||
| Region, weighted % | <0.001 | |||||
| Northeast (AHA 1 & 2) | 13 | 10 | 16 | 27 | 13 | |
| South (AHA 3 & 4) | 19 | 37 | 13 | 24 | 21 | |
| Midwest (AHA 5 & 6) | 23 | 24 | 25 | 22 | 26 | |
| Mountain (AHA 7 & 8) | 22 | 20 | 16 | 13 | 24 | |
| West (AHA 9) | 24 | 10 | 31 | 14 | 16 | |
| No. beds of primary hospital, weighted % | <0.001 | |||||
| Up to 149 | 17 | 26 | 12 | 24 | 14 | |
| 150299 | 30 | 36 | 36 | 33 | 21 | |
| 300449 | 26 | 24 | 29 | 20 | 19 | |
| 450599 | 13 | 8 | 17 | 11 | 21 | |
| 600 or more | 12 | 6 | 7 | 13 | 24 | |
| No. of hospital facilities served by current practice, weighted % | <0.001 | |||||
| 1 | 53 | 70 | 67 | 77 | 66 | |
| 2 | 20 | 22 | 20 | 16 | 24 | |
| 3 or more | 27 | 9 | 13 | 7 | 10 | |
| No. of physicians in current practice, median (IQR) | 10 (5, 18) | 8 (6, 12)* | 14 (8, 25)* | 12 (6, 18) | 12 (7, 20) | <0.001*, 0.001 |
| No. of non‐physician providers in current practice, median (IQR) | 0 (0, 2) | 0 (0, 2) | 0 (0, 3) | 1 (0, 2) | 0 (0, 2) | |
| Available information technology capabilities, weighted % | ||||||
| EHR to access physician notes | 57 | 57 | 75 | 58 | 79 | <0.001 |
| EHR to access nursing documentations | 68 | 67 | 74 | 75 | 76 | 0.357 |
| EHR to access laboratory or test results | 97 | 89 | 95 | 96 | 96 | 0.054 |
| Electronic order entry | 30 | 19 | 53 | 38 | 56 | <0.001 |
| Electronic billing | 38 | 31 | 36 | 36 | 38 | 0.818 |
| Access to EHR at home or off site | 78 | 73 | 78 | 82 | 84 | 0.235 |
| Access to Up‐to‐Date or other clinical guideline resources | 80 | 77 | 91 | 92 | 96 | <0.001 |
| Access to schedules, calendars, or other organizational resources | 56 | 57 | 66 | 67 | 75 | 0.024 |
| E‐mail, Web‐based paging, or other communication resources | 74 | 63 | 88 | 89 | 90 | <0.001 |
Several differences in respondent group characteristics by practice model were found. Respondents in multistate hospitalist groups were more likely from the South and Midwest, while respondents from multispecialty groups were likely from the West. More multistate group practices were based in smaller hospitals, while academic hospitalists tended to practice in hospitals with 600 or more beds. Respondents employed by hospitals were more likely to practice at 1 hospital facility only, while local group practices were more likely to practice at 3 or more facilities. The median number of physicians in a hospitalist group was 11 (interquartile range [IQR] 6, 19). Local and multistate groups had fewer hospitalists compared to other models. Nonphysician providers were employed by nearly half of all hospitalist practices. Although almost all groups had access to some information technology, more academic hospitalists had access to electronic order entry, electronic physician notes, electronic clinical guidelines resources and communication technology, while local and multistate groups were least likely to have access to these resources.
Work Pattern Variations
Table 2 further details hospitalist work hours by practice model. The majority of hospitalists (78%) reported their position was full‐time (FTE 1.0), while 13% reported working less than full‐time (FTE <1.0). Only 5% of local group hospitalists worked part‐time, while 20% of multispecialty group hospitalists did. An additional 9% reported FTE >1.0, indicating their work hours exceeded the definition of a full‐time physician in their practice. Among full‐time hospitalists, local group members worked a greater number of shifts per month than employees of multispecialty groups, hospitals, and academic medical centers. Academic hospitalists reported higher numbers of consecutive clinical days worked on average, but fewer night shifts compared to hospitalists employed by multistate groups, multispecialty groups, and hospitals; fewer billable encounters than hospitalists in local and multistate groups; and more nonclinical work hours than hospitalists of any other practice model. Academic hospitalists also spent more time on teaching and research than other practice models. Hospitalists spent 11%‐18% of their time on administrative and committee responsibilities, with the least amount spent by hospitalists in multistate groups and the most in academic practice.
| Local Hospitalist‐Only Group | Multi‐State Hospitalist Group | Multispecialty Physician Group | Employer Hospital | University or Medical School | ||
|---|---|---|---|---|---|---|
| n = 95 | n = 111 | n = 115 | n = 348 | n = 107 | P Value | |
| ||||||
| FTE, weighted % | 0.058 | |||||
| FTE < 1.0 | 6 | 13 | 20 | 12 | 14 | |
| FTE = 1.0 | 85 | 75 | 74 | 80 | 82 | |
| FTE > 1.0 | 10 | 13 | 6 | 8 | 5 | |
| Workload parameters, weighted mean (99% CI) | ||||||
| Clinical shifts per month for FTE 1.0 | 19 (17, 20)* | 17 (16, 19) | 15 (14, 17)* | 16 (15, 16) | 15 (13, 17) | <0.001* |
| Hours per clinical shift | 10 (9, 11) | 11 (10, 11)* | 10 (10, 11.0) | 11 (10, 11.0) | 10 (9, 10)* | 0.006*, 0.002 |
| Consecutive days on clinical shift | 8 (6, 9) | 7 (6, 7)* | 6 (6, 7) | 7 (6, 7) | 9 (7, 10)* | 0.002*, <0.001 |
| % Clinical shifts on nights | 20 (15, 25) | 23 (18, 28)* | 23 (17, 29) | 21 (17, 24) | 14 (9, 18)* | 0.001*, 0.002 |
| % Night shifts spent in hospital | 61 (49, 74)* | 63 (52, 75) | 72 (62, 83) | 73 (67, 80) | 43 (29, 57)* | 0.010*, 0.003, <0.001 |
| Billable encounters per clinical shift | 17 (14, 19)* | 17 (16, 18) | 14 (13, 15) | 15 (14, 16) | 13 (11, 14)* | <0.001*, 0.002 |
| Hours nonclinical work per month | 23 (12, 34)* | 19 (11, 27) | 31 (20, 42) | 30 (24, 36) | 71 (55, 86)* | <0.001* |
| Hours clinical and nonclinical work per month for FTE 1.0 | 202 (186, 219) | 211 (196, 226) | 184 (170, 198)* | 193 (186, 201) | 221 (203, 238)* | <0.001* |
| Professional activity, weighted mean % (99% CI) | ||||||
| Clinical | 84 (78, 89)* | 86 (81, 90) | 78 (72, 84) | 79 (76, 82) | 58 (51, 64)* | <0.001* |
| Teaching | 2.3 (1, 5)* | 3 (1, 4) | 6 (4, 9) | 6 (5, 8) | 17 (14, 20)* | <0.001* |
| Administration and Committee work | 13 (8, 19) | 11 (8, 15)* | 16 (10, 21) | 14 (12, 17) | 19 (14, 24)* | 0.001* |
| Research | 0 (0, 0)* | 1 (0, 2) | 0 (0, 1) | 1 (0, 1) | 7 (3, 11)* | <0.001* |
Table 3 tabulates other work pattern characteristics. Most hospitalists indicated that their current clinical work as hospitalists involved the general medical wards (100%), medical consultations (98%), and comanagement with specialists (92%). There were wide differences in participation in comanagement (100%, local groups vs 71%, academic), intensive care unit (ICU) responsibilities (94%, multistate groups vs 27%, academic), and nursing home care (30%, local groups vs 8%, academic). Among activities that are potentially not reimbursable, academic hospitalists were less likely to participate in coordination of patient transfers and code or rapid response teams, while multistate groups were least likely to participate in quality improvement activities. In total, 99% of hospitalists reported participating in at least 1 potentially nonreimbursable clinical activity.
| Local Hospitalist‐Only Group | Multi‐State Hospitalist Group | Multispecialty Physician Group | Employer Hospital | University or Medical School | ||
|---|---|---|---|---|---|---|
| n = 95 | n = 111 | n = 115 | n = 348 | n = 107 | P Value | |
| ||||||
| Reimbursable activities, overlapping weighted % | ||||||
| General medical ward | 100 | 99 | 100 | 99 | 99 | 0.809 |
| Medical consultations | 99 | 99 | 100 | 98 | 95 | 0.043 |
| Comanagement with specialists | 100 | 96 | 96 | 93 | 71 | <0.001 |
| Preoperative evaluations | 92 | 92 | 90 | 88 | 77 | 0.002 |
| Intensive care unit | 86 | 94 | 67 | 75 | 27 | <0.001 |
| Skilled nursing facility or long‐term acute care facility | 30 | 19 | 12 | 16 | 8 | <0.001 |
| Outpatient general medical practice | 4 | 4 | 5 | 5 | 10 | 0.241 |
| Potentially nonreimbursable activities, overlapping weighted % | ||||||
| Coordination of patient transfers | 92 | 94 | 95 | 93 | 82 | 0.005 |
| Quality improvement or patient safety initiatives | 81 | 78 | 83 | 89 | 89 | 0.029 |
| Code team or rapid response team | 56 | 57 | 53 | 62 | 37 | <0.001 |
| Information technology design or implementation | 42 | 39 | 47 | 51 | 51 | 0.154 |
| Admission triage for emergency department | 49 | 46 | 43 | 40 | 31 | 0.132 |
| Compensation scheme, weighted % | <0.001 | |||||
| Salary only | 18 | 21 | 30 | 29 | 47 | |
| Salary plus performance incentive | 54 | 72 | 59 | 67 | 53 | |
| Fee‐for‐service | 20 | 1 | 7 | 2 | 0 | |
| Capitation | 0 | 0 | 0 | 0 | 0 | |
| Other | 9 | 7 | 4 | 3 | 0 | |
| Compensation links to incentives, overlapping weighted % | ||||||
| No incentives | 40 | 28 | 29 | 29 | 48 | 0.003 |
| Patient satisfaction | 23 | 39 | 38 | 38 | 14 | <0.001 |
| Length of stay | 18 | 17 | 20 | 13 | 10 | 0.208 |
| Overall cost | 8 | 11 | 9 | 5 | 6 | 0.270 |
| Test utilization | 2 | 2 | 7 | 1 | 0 | <0.001 |
| Clinical processes and outcomes | 26 | 34 | 44 | 43 | 24 | <0.001 |
| Other | 17 | 29 | 26 | 31 | 25 | 0.087 |
| Earnings, weighted mean dollars (99% CI) | 226,065 (202,891, 249,240)* | 225,613 (210,772, 240,454) | 202,617 (186,036, 219,198) | 206,087 (198,413, 213,460) | 166,478 (151,135, 181,821)* | <0.001* |
Hospitalist compensation schemes were significantly different across the practice models. Salary‐only schemes were most common among academic hospitalists (47%), while 72% of multistate groups used performance incentives in addition to salary. More local groups used fee‐for‐service compensation than other models. Incentives differed by practice model, with more multistate groups having incentives based on patient satisfaction, while more multispecialty physician groups had incentives based on clinical processes and outcomes than other models. Finally, mean earnings for academic hospitalists were significantly lower than for hospitalists of other practice models. Local and multistate group hospitalists earned more than any other practice model (all P <0.001), and $60,000 more than the lowest compensated academic hospitalists.
Components of Job Satisfaction
Hospitalists' rankings of the most important factors for job satisfaction revealed differences across models (Figure 2). Overall, hospitalists were most likely to consider optimal workload and compensation as important factors for job satisfaction from a list of 13 considerations. Local groups and academics were least likely to rank optimal workload as a top factor, and local group hospitalists were more likely to rank optimal autonomy than those of other models. Academic hospitalists had less concern for substantial pay, and more concern for the variety of tasks they perform and recognition by leaders, than other hospitalists.
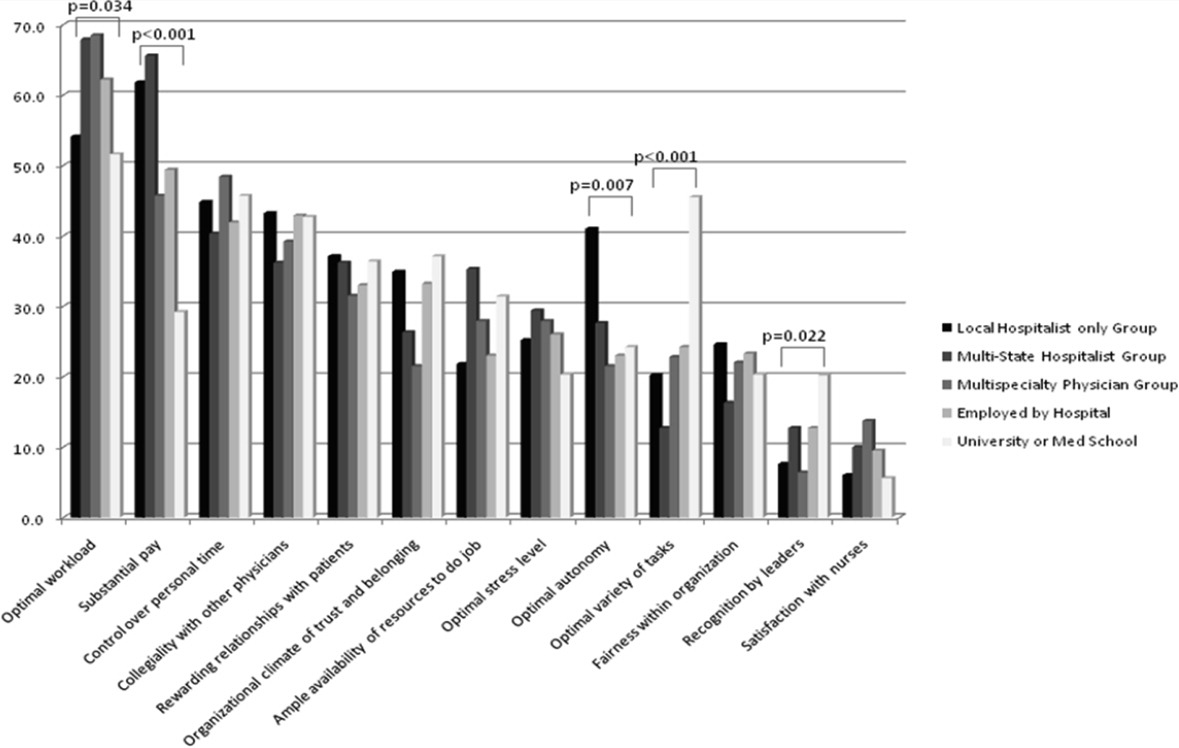
Job Satisfaction and Burnout Risk
Differences in the ratings of 4 of the 11 satisfaction and job characteristic domains were found across the practice models (Figure 3). Multispecialty group hospitalists were less satisfied with autonomy and their relationship with patients than other practice models, and along with multistate groups, reported the highest perceived workload. Organizational fairness was rated much higher by local group hospitalists than other practice models. Despite these differences in work patterns and satisfaction, there were no differences found in level of global job satisfaction, specialty satisfaction, or burnout across the practice models. Overall, 62% of respondents reported high job satisfaction (4 on a 1 to 5 scale), and 30% indicated burnout symptoms.
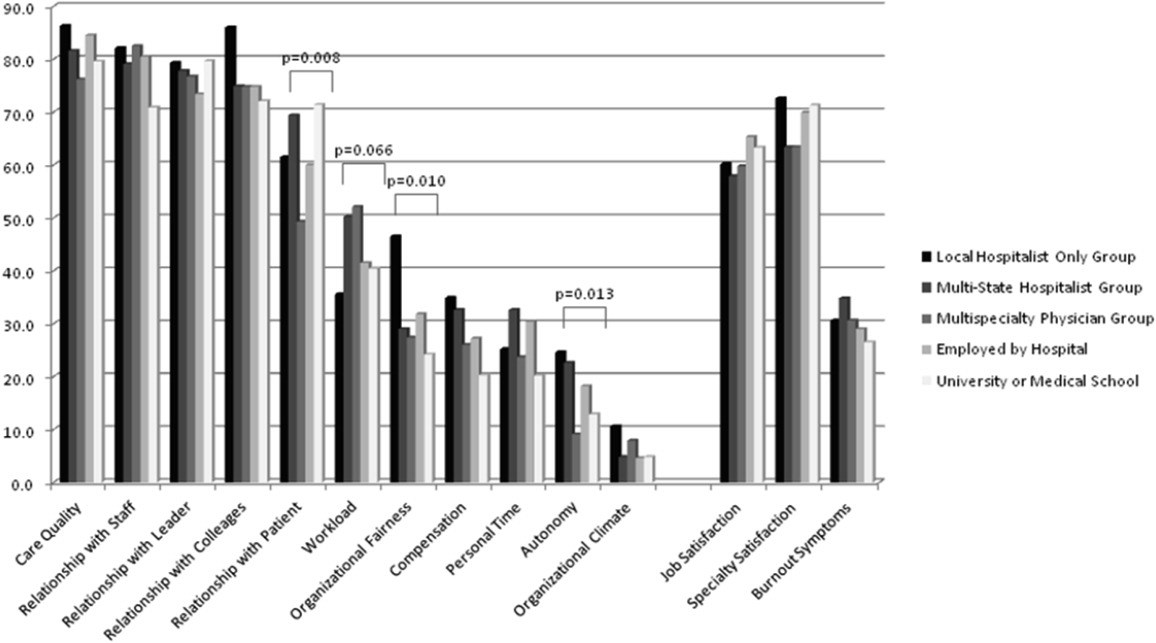
DISCUSSION
In our sample of US hospitalists, we found major differences in work patterns and compensation across hospitalist practice models, but no differences in job satisfaction, specialty satisfaction, and burnout. In particular, differences across these models included variations in hospitalist workload, hours, pay, and distribution of work activities. We found that hospitalists perform a variety of clinical and nonclinical tasks, for many of which there are not standard reimbursement mechanisms. We also found that features of a job that individual hospitalists considered most important vary by practice model.
Previous analysis of this data explored the overall state of hospitalist satisfaction.16 The present analysis offers a glimpse into hospitalists' systems‐orientation through a deeper look at their work patterns. The growth in the number of hospitalists who participate in intensive care medicine, specialty comanagement, and other work that involves close working relationships with specialist physicians confirms collaborative care as one of the dominant drivers of the hospitalist movement. At the level of indirect patient care, nearly all hospitalists contributed to work that facilitates coordination, quality, patient safety, or information technology. Understanding the integrative value of hospitalists outside of their clinical productivity may be of interest to hospital administrators.
Global satisfaction measures were similar across practice models. This finding is particularly interesting given the major differences in job characteristics seen among the practice models. This similarity in global satisfaction despite real differences in the nature of the job suggests that individuals find settings that allow them to address their individual professional goals. Our study demonstrates that, in 2010, Hospital Medicine has evolved enough to accommodate a wide variety of goals and needs.
While global satisfaction did not differ among practice types, hospitalists from various models did report differences in factors considered important to global satisfaction. While workload and pay were rated as influential across most models, the degree of importance was significantly different. In academic settings, substantial pay was not a top consideration for overall job satisfaction, whereas in local and multistate hospitalist groups, pay was a very close second in importance to optimal workload. These results may prove helpful for individual hospitalists trying to find their optimal job. For example, someone who is less concerned about workload, but wants to be paid well and have a high degree of autonomy, may find satisfaction in local hospitalist groups. However, for someone who is willing to sacrifice a higher salary for variety of activities, academic Hospital Medicine may be a better fit.
There is a concerning aspect of hospitalist job satisfaction that different practice models do not seem to solve. Control over personal time is a top consideration for many hospitalists across practice models, yet their satisfaction with personal time is low. As control over personal time is seen as a draw to the Hospital Medicine specialty, group leaders may need to evaluate their programs to ensure that schedules and workload support efforts for hospitalists to balance work and homelife commitments.
There are additional findings that are important for Hospital Medicine group leaders. Regardless of practice model, compensation and workload are often used as tools to recruit and retain hospitalists. While these tools may be effective, leaders may find more nuanced approaches to improving their hospitalists' overall satisfaction. Leaders of local hospitalist groups may find their hospitalists tolerant of heavier workloads as long as they are adequately rewarded and are given real autonomy over their work. However, leaders of academic programs may be missing the primary factor that can improve their hospitalists' satisfaction. Rather than asking for higher salaries to remain competitive, it may be more effective to advocate for time and training for their hospitalists to pursue important other activities beyond direct clinical care. Given that resources will always be limited, group leaders need to understand all of the elements that can contribute to hospitalist job satisfaction.
We point out several limitations to this study. First, our adjusted response rate of 25.6% is low for survey research, in general. As mentioned above, hospitalists are not easily identified in any available national physician database. Therefore, we deliberately designed our sampling strategy to error on the side of including ineligible surveyees to reduce systematic exclusion of practicing hospitalists. Using simple post hoc methods, we identified many nonhospitalists and bad addresses from our sample, but because these methods were exclusionary as opposed to confirmatory, we believe that a significant proportion of remaining nonrespondents may also have been ineligible for the survey. Although this does not fully address concerns about potential response bias, we believe that our sample representing a large number of hospitalist groups is adequate to make estimations about a nationally representative sample of practicing hospitalists. Second, in spite of our inclusive approach, we may still have excluded categories of practicing hospitalists. We were careful not to allow SHM members to represent all US hospitalists and included non‐members in the sampling frame, but the possibility of systematic exclusion that may alter our results remains a concern. Additionally, one of our goals was to characterize pediatric hospitalists independently from their adult‐patient counterparts. Despite oversampling of pediatricians, their sample was too small for a more detailed comparison across practice models. Also, self‐reported data about workload and compensation are subject to inaccuracies related to recall and cognitive biases. Last, this is a cross‐sectional study of hospitalist satisfaction at one point in time. Consequently, our sample may not be representative of very dissatisfied hospitalists who have already left their jobs.
The diversity found across existing practice models and the characteristics of the practices provide physicians with the opportunity to bring their unique skills and motivations to the hospitalist movement. As hospitals and other organizations seek to create, maintain, or grow hospitalist programs, the data provided here may prove useful to understand the relationship between practice characteristics and individual job satisfaction. Additionally, hospitalists looking for a job can consider these results as additional information to guide their choice of practice model and work patterns.
Acknowledgements
The authors thank Kenneth A. Rasinski for assistance with survey items refinement, and members of the SHM Career Satisfaction Task Force for their assistance in survey development.
- ,,,.The status of hospital medicine groups in the United States.J Hosp Med.2006;1(2):75–80.
- ,,,.Growth in the care of older patients by hospitalists in the United States.N Engl J Med.2009;360(11):1102–1112.
- .The state of hospital medicine in 2008.Med Clin North Am.2008;92(2):265–273,vii.
- ,,,.Health care market trends and the evolution of hospitalist use and roles.J Gen Intern Med.2005;20(2):101–107.
- ,,, et al.Effects of physician experience on costs and outcomes on an academic general medicine service: results of a trial of hospitalists.Ann Intern Med.2002;137(11):866–874.
- .The Park Nicollet experience in establishing a hospitalist system.Ann Intern Med.1999;130(4 pt 2):350–354.
- ,.Effects of an HMO hospitalist program on inpatient utilization.Am J Manag Care.2001;7(11):1051–1057.
- ,.The impact of hospitalists on the cost and quality of inpatient care in the United States: a research synthesis.Med Care Res Rev.2005;62(4):379–406.
- ,,,.Pediatric hospitalists: a systematic review of the literature.Pediatrics.2006;117(5):1736–1744.
- ,.The hospitalist movement 5 years later.JAMA.2002;287(4):487–494.
- ,,,,,.Trends in market demand for internal medicine 1999 to 2004: an analysis of physician job advertisements.J Gen Intern Med.2006;21(10):1079–1085.
- SHM. 2003–2004 Survey by the Society of Hospital Medicine on Productivity and Compensation: Analysis of Results. 2004 [updated 2004]. Available at: http://www.hospitalmedicine.org/AM/Template. cfm?Section=Practice_Resources Available at: http://cme.medscape.com/viewarticle/578134. Accessed October 21,2010.
- State of Hospital Medicine: 2010 Report Based on 2009 Data.Englewood, CO and Philadelphia, PA:Medical Group Management Association and Society of Hospital Medicine;2010.
- ,,,,.Worklife and satisfaction of hospitalists: toward flourishing careers.J Gen Intern Med.2011, Jul 20. PMID: 21773849.
- ,,, et al.Worklife and satisfaction of general internists.Arch Intern Med.2002;162(6):649–656.
- ,,, et al.Organizational climate, stress, and error in primary care: the MEMO study. In: Henriksen K, Battles JB, Marks ES, Lewin DI, eds.Advances in Patient Safety: From Research to Implementation. Vol 1: Research Findings.Rockville, MD:Agency for Healthcare Research and Quality;2005;1:65–77.
- ,,,.Hospitalists and the practice of inpatient medicine: results of a survey of the National Association of Inpatient Physicians.Ann Intern Med.1999;130(4 pt 2):343–349.
- ,,,,,.Physician attitudes toward and prevalence of the hospitalist model of care: results of a national survey.Am J Med.2000;109(8):648–653.
- .Taking the Measure of Work: A Guide to Validated Scales for Organizational Research and Diagnosis.Thousand Oaks, CA:Sage Publications;2002.
- ,,,,.Job Demands and Worker Health.Ann Arbor, MI:University of Michigan, Institute for Social Research;1980.
- .On the dimensionality of organizational justice: a construct validation of a measure.J Appl Psychol.2001;86(3):386–400.
- ,.Effect of job demands and social support on worker stress—a study of VDT users.Behav Inform Technol.1995;14(1):32–40.
- ,,, et al.Measuring physician job satisfaction in a changing workplace and a challenging environment. SGIM Career Satisfaction Study Group. Society of General Internal Medicine.Med Care.1999;37(11):1174–1182.
- ,,, et al.Working conditions in primary care: physician reactions and care quality.Ann Intern Med.2009;151(1):28–U48.
- ,,.Validation of a single‐item measure of burnout against the Maslach Burnout Inventory among physicians.Stress Health.2004;20(2):75–79.
- American Hospital Association. AHA Hospital Statistics. 2009 [updated 2009]. Available at: http://www.ahadata.com/ahadata/html/AHAStatistics.html. Accessed April 12,2011.
- ,,, et al.How to obtain excellent response rates when surveying physicians.Fam Pract.2009;26(1):65–68.
- ,.Estimating nonresponse bias in mail surveys.J Marketing Res.1977;14(3):396–402.
Over the past 15 years, there has been dramatic growth in the number of hospitalist physicians in the United States and in the number of hospitals served by them.13 Hospitals are motivated to hire experienced hospitalists to staff their inpatient services,4 with goals that include obtaining cost‐savings and higher quality.59 The rapid growth of Hospital Medicine saw multiple types of hospital practice models emerge with differing job characteristics, clinical duties, workload, and compensation schemes.10 The extent of the variability of hospitalist jobs across practice models is not known.
Intensifying recruitment efforts and the concomitant increase in compensation for hospitalists over the last decade suggest that demand for hospitalists is strong and sustained.11 As a result, today's cohort of hospitalists has a wide range of choices of types of jobs, practice models, and locations. The diversity of available hospitalist jobs is characterized, for example, by setting (community hospital vs academic hospital), employer (hospital vs private practice), job duties (the amount and type of clinical work, and other administrative, teaching, or research duties), and intensity (work hours and duties to maximize income or lifestyle). How these choices relate to job satisfaction and burnout are also unknown.
The Society of Hospital Medicine (SHM) has administered surveys to hospitalist group leaders biennially since 2003.1215 These surveys, however, do not address issues related to individual hospitalist worklife, recruitment, and retention. In 2005, SHM convened a Career Satisfaction Task Force that designed and executed a national survey of hospitalists in 2009‐2010. The objective of this study is to evaluate how job characteristics vary by practice model, and the association of these characteristics and practice models with job satisfaction and burnout.
METHODS
Survey Instrument
A detailed description of the survey design, sampling strategy, data collection, and response rate calculations is described elsewhere.16 Portions of the 118‐item survey instrument assessed characteristics of the respondents' hospitalist group (12 items), details about their individual work patterns (12 items), and demographics (9 items). Work patterns were evaluated by the average number of clinical work days, consecutive days, hours per month, percentage of work assigned to night duty, and number of patient encounters. Average hours spent on nonclinical work, and the percentage of time allocated for clinical, administrative, teaching, and research activities were solicited. Additional items assessed specific clinical responsibilities, pretax earnings in FY2010, the availability of information technology capabilities, and the adequacy of available resources. Job and specialty satisfaction and 11 satisfaction domain measures were measured using validated scales.1726 Burnout symptoms were measured using a validated single‐item measure.26, 27
Sampling Strategy
We surveyed a national stratified sample of hospitalists in the US and Puerto Rico. We used the largest database of hospitalists (>24,000 names) currently available and maintained by the SHM as our sampling frame. We linked hospitalist employer information to hospital statistics from the American Hospital Association database28 to stratify the sample by number of hospital beds, geographic region, employment model, and specialty training, oversampling pediatric hospitalists due to small numbers. A respondent sample of about 700 hospitalists was calculated to be adequate to detect a 0.5 point difference in job satisfaction scores between subgroups assuming 90% power and alpha of 0.05. However, we sampled a total of 5389 addresses from the database to overcome the traditionally low physician response rates, duplicate sampling, bad addresses, and non‐hospitalists being included in the sampling frame. In addition, 2 multistate hospitalist companies (EmCare, In Compass Health) and 1 for‐profit hospital chain (HCA, Inc) financially sponsored this project with the stipulation that all of their hospitalist employees (n = 884) would be surveyed.
Data Collection
The healthcare consulting firm, Press Ganey, provided support with survey layout and administration following the modified Dillman method.29 Three rounds of coded surveys and solicitation letters from the investigators were mailed 2 weeks apart in November and December 2009. Because of low response rates to the mailed survey, an online survey was created using Survey Monkey and sent to 650 surveyees for whom e‐mail addresses were available, and administered at a kiosk for sample physicians during the SHM 2010 annual meeting.
Data Analysis
Nonresponse bias was measured by comparing characteristics between respondents of separate survey waves.30 We determined the validity of mailing addresses immediately following the survey period by mapping each address using Google, and if the address was a hospital, researching online whether or not the intended recipient was currently employed there. Practice characteristics were compared across 5 model categories distilled from the SHM & Medical Group Management Association survey: local hospitalist‐only group, multistate hospitalist group, multispecialty physician group, employer hospital, and university or medical school. Weighted proportions, means, and medians were calculated to account for oversampling of pediatric hospitalists. Differences in categorical measures were assessed using the chi‐square test and the design‐based F test for comparing weighted data. Weighted means (99% confidence intervals) and medians (interquartile ranges) were calculated. Because each parameter yielded a single outlier value across the 5 practice models, differences across weighted means were assessed using generalized linear models with the single outlier value chosen as the reference mean. Pair‐wise Wilcoxon rank sum test was used to compare median values. In these 4‐way comparisons of means and medians, significance was defined as P value of 0.0125 per Bonferroni correction. A single survey item solicited respondents to choose exactly 4 of 13 considerations most pertinent to job satisfaction. The proportion of respondents who scored 4 on a 5‐point Likert scale of the 11 satisfaction domains and 2 global measures of satisfaction, and burnout symptoms defined as 3 on a 5‐point single item measure were bar‐graphed. Chi‐square statistics were used to evaluate for differences across practice models. Statistical significance was defined by alpha less than 0.05, unless otherwise specified. All analyses were performed using STATA version 11.0 (College Station, TX). This study was approved by the Loyola University Institutional Review Board.
Survey data required cleaning prior to analysis. Missing gender information was imputed using the respondents' name. Responses to the item that asked to indicate the proportion of work dedicated to administrative responsibilities, clinical care, teaching, and research that did not add up to 100% were dropped. Two responses that indicated full‐time equivalent (FTE) of 0%, but whose respondents otherwise completed the survey implying they worked as clinical hospitalists, were replaced with values calculated from the given number of work hours relative to the median work hours in our sample. Out of range or implausible responses to the following items were dropped from analyses: the average number of billable encounters during a typical day or shift, number of shifts performing clinical activities during a typical month, pretax earnings, the year the respondent completed residency training, and the number of whole years practiced as a hospitalist. The proportion of selective item nonresponse was small and we did not, otherwise, impute missing data.
RESULTS
Response Rate
Of the 5389 originally sampled addresses, 1868 were undeliverable. Addresses were further excluded if they appeared in duplicate or were outdated. This yielded a total of 3105 eligible surveyees in the sample. As illustrated in Figure 1, 841 responded to the mailed survey and 5 responded to the Web‐based survey. After rejecting 67 non‐hospitalist respondents and 3 duplicate surveys, a total of 776 surveys were included in the final analysis. The adjusted response rate was 25.6% (776/3035). Members of SHM were more likely to return the survey than nonmembers. The adjusted response rate from hospitalists affiliated with the 3 sponsoring institutions was 6% (40/662). Because these respondents were more likely to be non‐members of SHM, we opted to analyze the responses from the sponsor hospitalists together with the sampled hospitalists. The demographics of the resulting pool of 816 respondents affiliated with over 650 unique hospitalist groups were representative of the original survey frame. We analyzed data from 794 of these who responded to the item indicating their hospitalist practice model. Demographic characteristics of responders and nonresponders to the practice model survey item were similar.
Characteristics of Hospitalists and Their Groups
Table 1 summarizes the characteristics of hospitalist respondents and their organizations by practice model. More (44%) respondents identified their practice model as directly employed by the hospital than other models, including multispecialty physician group (15%), multistate hospitalist group (14%), university or medical school (14%), local hospitalist group (12%), and other (2%). The median age of hospitalist respondents was 42 years, with 6.8 years of mean experience as a hospitalist. One third were women, 84% were married, and 46% had dependent children 6 years old or younger at home. Notably, hospitalists in multistate groups had fewer years of experience, and fewer hospitalists in local and multistate groups were married compared to hospitalists in other practice models.
| Local Hospitalist‐Only Group | Multi‐State Hospitalist Group | Multispecialty Physician Group | Employer Hospital | University or Medical School | ||
|---|---|---|---|---|---|---|
| n = 95 | n = 111 | n = 115 | n = 348 | n = 107 | P Value | |
| ||||||
| Hospitalist characteristics | ||||||
| Age, weighted mean (99% CI) | 45 (42, 48) | 44 (42, 47) | 45 (43, 47) | 45 (43, 46) | 43 (40, 46) | |
| Years hospitalist experience, weighted mean (99% CI) | 8 (6, 9)* | 5 (4, 6)* | 8 (7, 9) | 7 (6, 7) | 8 (6, 9) | <0.010* |
| Women, weighted % | 29 | 30 | 39 | 31 | 43 | 0.118 |
| Married, weighted % | 76 | 77 | 82 | 89 | 81 | 0.009 |
| At least 1 dependent child younger than age 6 living in home, weighted % | 47 | 48 | 43 | 47 | 45 | 0.905 |
| Pediatric specialty, n (%) | <10 | <10 | 11 (10%) | 57 (16%) | 36 (34%) | <0.001 |
| Hospitalist group characteristics | ||||||
| Region, weighted % | <0.001 | |||||
| Northeast (AHA 1 & 2) | 13 | 10 | 16 | 27 | 13 | |
| South (AHA 3 & 4) | 19 | 37 | 13 | 24 | 21 | |
| Midwest (AHA 5 & 6) | 23 | 24 | 25 | 22 | 26 | |
| Mountain (AHA 7 & 8) | 22 | 20 | 16 | 13 | 24 | |
| West (AHA 9) | 24 | 10 | 31 | 14 | 16 | |
| No. beds of primary hospital, weighted % | <0.001 | |||||
| Up to 149 | 17 | 26 | 12 | 24 | 14 | |
| 150299 | 30 | 36 | 36 | 33 | 21 | |
| 300449 | 26 | 24 | 29 | 20 | 19 | |
| 450599 | 13 | 8 | 17 | 11 | 21 | |
| 600 or more | 12 | 6 | 7 | 13 | 24 | |
| No. of hospital facilities served by current practice, weighted % | <0.001 | |||||
| 1 | 53 | 70 | 67 | 77 | 66 | |
| 2 | 20 | 22 | 20 | 16 | 24 | |
| 3 or more | 27 | 9 | 13 | 7 | 10 | |
| No. of physicians in current practice, median (IQR) | 10 (5, 18) | 8 (6, 12)* | 14 (8, 25)* | 12 (6, 18) | 12 (7, 20) | <0.001*, 0.001 |
| No. of non‐physician providers in current practice, median (IQR) | 0 (0, 2) | 0 (0, 2) | 0 (0, 3) | 1 (0, 2) | 0 (0, 2) | |
| Available information technology capabilities, weighted % | ||||||
| EHR to access physician notes | 57 | 57 | 75 | 58 | 79 | <0.001 |
| EHR to access nursing documentations | 68 | 67 | 74 | 75 | 76 | 0.357 |
| EHR to access laboratory or test results | 97 | 89 | 95 | 96 | 96 | 0.054 |
| Electronic order entry | 30 | 19 | 53 | 38 | 56 | <0.001 |
| Electronic billing | 38 | 31 | 36 | 36 | 38 | 0.818 |
| Access to EHR at home or off site | 78 | 73 | 78 | 82 | 84 | 0.235 |
| Access to Up‐to‐Date or other clinical guideline resources | 80 | 77 | 91 | 92 | 96 | <0.001 |
| Access to schedules, calendars, or other organizational resources | 56 | 57 | 66 | 67 | 75 | 0.024 |
| E‐mail, Web‐based paging, or other communication resources | 74 | 63 | 88 | 89 | 90 | <0.001 |
Several differences in respondent group characteristics by practice model were found. Respondents in multistate hospitalist groups were more likely from the South and Midwest, while respondents from multispecialty groups were likely from the West. More multistate group practices were based in smaller hospitals, while academic hospitalists tended to practice in hospitals with 600 or more beds. Respondents employed by hospitals were more likely to practice at 1 hospital facility only, while local group practices were more likely to practice at 3 or more facilities. The median number of physicians in a hospitalist group was 11 (interquartile range [IQR] 6, 19). Local and multistate groups had fewer hospitalists compared to other models. Nonphysician providers were employed by nearly half of all hospitalist practices. Although almost all groups had access to some information technology, more academic hospitalists had access to electronic order entry, electronic physician notes, electronic clinical guidelines resources and communication technology, while local and multistate groups were least likely to have access to these resources.
Work Pattern Variations
Table 2 further details hospitalist work hours by practice model. The majority of hospitalists (78%) reported their position was full‐time (FTE 1.0), while 13% reported working less than full‐time (FTE <1.0). Only 5% of local group hospitalists worked part‐time, while 20% of multispecialty group hospitalists did. An additional 9% reported FTE >1.0, indicating their work hours exceeded the definition of a full‐time physician in their practice. Among full‐time hospitalists, local group members worked a greater number of shifts per month than employees of multispecialty groups, hospitals, and academic medical centers. Academic hospitalists reported higher numbers of consecutive clinical days worked on average, but fewer night shifts compared to hospitalists employed by multistate groups, multispecialty groups, and hospitals; fewer billable encounters than hospitalists in local and multistate groups; and more nonclinical work hours than hospitalists of any other practice model. Academic hospitalists also spent more time on teaching and research than other practice models. Hospitalists spent 11%‐18% of their time on administrative and committee responsibilities, with the least amount spent by hospitalists in multistate groups and the most in academic practice.
| Local Hospitalist‐Only Group | Multi‐State Hospitalist Group | Multispecialty Physician Group | Employer Hospital | University or Medical School | ||
|---|---|---|---|---|---|---|
| n = 95 | n = 111 | n = 115 | n = 348 | n = 107 | P Value | |
| ||||||
| FTE, weighted % | 0.058 | |||||
| FTE < 1.0 | 6 | 13 | 20 | 12 | 14 | |
| FTE = 1.0 | 85 | 75 | 74 | 80 | 82 | |
| FTE > 1.0 | 10 | 13 | 6 | 8 | 5 | |
| Workload parameters, weighted mean (99% CI) | ||||||
| Clinical shifts per month for FTE 1.0 | 19 (17, 20)* | 17 (16, 19) | 15 (14, 17)* | 16 (15, 16) | 15 (13, 17) | <0.001* |
| Hours per clinical shift | 10 (9, 11) | 11 (10, 11)* | 10 (10, 11.0) | 11 (10, 11.0) | 10 (9, 10)* | 0.006*, 0.002 |
| Consecutive days on clinical shift | 8 (6, 9) | 7 (6, 7)* | 6 (6, 7) | 7 (6, 7) | 9 (7, 10)* | 0.002*, <0.001 |
| % Clinical shifts on nights | 20 (15, 25) | 23 (18, 28)* | 23 (17, 29) | 21 (17, 24) | 14 (9, 18)* | 0.001*, 0.002 |
| % Night shifts spent in hospital | 61 (49, 74)* | 63 (52, 75) | 72 (62, 83) | 73 (67, 80) | 43 (29, 57)* | 0.010*, 0.003, <0.001 |
| Billable encounters per clinical shift | 17 (14, 19)* | 17 (16, 18) | 14 (13, 15) | 15 (14, 16) | 13 (11, 14)* | <0.001*, 0.002 |
| Hours nonclinical work per month | 23 (12, 34)* | 19 (11, 27) | 31 (20, 42) | 30 (24, 36) | 71 (55, 86)* | <0.001* |
| Hours clinical and nonclinical work per month for FTE 1.0 | 202 (186, 219) | 211 (196, 226) | 184 (170, 198)* | 193 (186, 201) | 221 (203, 238)* | <0.001* |
| Professional activity, weighted mean % (99% CI) | ||||||
| Clinical | 84 (78, 89)* | 86 (81, 90) | 78 (72, 84) | 79 (76, 82) | 58 (51, 64)* | <0.001* |
| Teaching | 2.3 (1, 5)* | 3 (1, 4) | 6 (4, 9) | 6 (5, 8) | 17 (14, 20)* | <0.001* |
| Administration and Committee work | 13 (8, 19) | 11 (8, 15)* | 16 (10, 21) | 14 (12, 17) | 19 (14, 24)* | 0.001* |
| Research | 0 (0, 0)* | 1 (0, 2) | 0 (0, 1) | 1 (0, 1) | 7 (3, 11)* | <0.001* |
Table 3 tabulates other work pattern characteristics. Most hospitalists indicated that their current clinical work as hospitalists involved the general medical wards (100%), medical consultations (98%), and comanagement with specialists (92%). There were wide differences in participation in comanagement (100%, local groups vs 71%, academic), intensive care unit (ICU) responsibilities (94%, multistate groups vs 27%, academic), and nursing home care (30%, local groups vs 8%, academic). Among activities that are potentially not reimbursable, academic hospitalists were less likely to participate in coordination of patient transfers and code or rapid response teams, while multistate groups were least likely to participate in quality improvement activities. In total, 99% of hospitalists reported participating in at least 1 potentially nonreimbursable clinical activity.
| Local Hospitalist‐Only Group | Multi‐State Hospitalist Group | Multispecialty Physician Group | Employer Hospital | University or Medical School | ||
|---|---|---|---|---|---|---|
| n = 95 | n = 111 | n = 115 | n = 348 | n = 107 | P Value | |
| ||||||
| Reimbursable activities, overlapping weighted % | ||||||
| General medical ward | 100 | 99 | 100 | 99 | 99 | 0.809 |
| Medical consultations | 99 | 99 | 100 | 98 | 95 | 0.043 |
| Comanagement with specialists | 100 | 96 | 96 | 93 | 71 | <0.001 |
| Preoperative evaluations | 92 | 92 | 90 | 88 | 77 | 0.002 |
| Intensive care unit | 86 | 94 | 67 | 75 | 27 | <0.001 |
| Skilled nursing facility or long‐term acute care facility | 30 | 19 | 12 | 16 | 8 | <0.001 |
| Outpatient general medical practice | 4 | 4 | 5 | 5 | 10 | 0.241 |
| Potentially nonreimbursable activities, overlapping weighted % | ||||||
| Coordination of patient transfers | 92 | 94 | 95 | 93 | 82 | 0.005 |
| Quality improvement or patient safety initiatives | 81 | 78 | 83 | 89 | 89 | 0.029 |
| Code team or rapid response team | 56 | 57 | 53 | 62 | 37 | <0.001 |
| Information technology design or implementation | 42 | 39 | 47 | 51 | 51 | 0.154 |
| Admission triage for emergency department | 49 | 46 | 43 | 40 | 31 | 0.132 |
| Compensation scheme, weighted % | <0.001 | |||||
| Salary only | 18 | 21 | 30 | 29 | 47 | |
| Salary plus performance incentive | 54 | 72 | 59 | 67 | 53 | |
| Fee‐for‐service | 20 | 1 | 7 | 2 | 0 | |
| Capitation | 0 | 0 | 0 | 0 | 0 | |
| Other | 9 | 7 | 4 | 3 | 0 | |
| Compensation links to incentives, overlapping weighted % | ||||||
| No incentives | 40 | 28 | 29 | 29 | 48 | 0.003 |
| Patient satisfaction | 23 | 39 | 38 | 38 | 14 | <0.001 |
| Length of stay | 18 | 17 | 20 | 13 | 10 | 0.208 |
| Overall cost | 8 | 11 | 9 | 5 | 6 | 0.270 |
| Test utilization | 2 | 2 | 7 | 1 | 0 | <0.001 |
| Clinical processes and outcomes | 26 | 34 | 44 | 43 | 24 | <0.001 |
| Other | 17 | 29 | 26 | 31 | 25 | 0.087 |
| Earnings, weighted mean dollars (99% CI) | 226,065 (202,891, 249,240)* | 225,613 (210,772, 240,454) | 202,617 (186,036, 219,198) | 206,087 (198,413, 213,460) | 166,478 (151,135, 181,821)* | <0.001* |
Hospitalist compensation schemes were significantly different across the practice models. Salary‐only schemes were most common among academic hospitalists (47%), while 72% of multistate groups used performance incentives in addition to salary. More local groups used fee‐for‐service compensation than other models. Incentives differed by practice model, with more multistate groups having incentives based on patient satisfaction, while more multispecialty physician groups had incentives based on clinical processes and outcomes than other models. Finally, mean earnings for academic hospitalists were significantly lower than for hospitalists of other practice models. Local and multistate group hospitalists earned more than any other practice model (all P <0.001), and $60,000 more than the lowest compensated academic hospitalists.
Components of Job Satisfaction
Hospitalists' rankings of the most important factors for job satisfaction revealed differences across models (Figure 2). Overall, hospitalists were most likely to consider optimal workload and compensation as important factors for job satisfaction from a list of 13 considerations. Local groups and academics were least likely to rank optimal workload as a top factor, and local group hospitalists were more likely to rank optimal autonomy than those of other models. Academic hospitalists had less concern for substantial pay, and more concern for the variety of tasks they perform and recognition by leaders, than other hospitalists.
Job Satisfaction and Burnout Risk
Differences in the ratings of 4 of the 11 satisfaction and job characteristic domains were found across the practice models (Figure 3). Multispecialty group hospitalists were less satisfied with autonomy and their relationship with patients than other practice models, and along with multistate groups, reported the highest perceived workload. Organizational fairness was rated much higher by local group hospitalists than other practice models. Despite these differences in work patterns and satisfaction, there were no differences found in level of global job satisfaction, specialty satisfaction, or burnout across the practice models. Overall, 62% of respondents reported high job satisfaction (4 on a 1 to 5 scale), and 30% indicated burnout symptoms.
DISCUSSION
In our sample of US hospitalists, we found major differences in work patterns and compensation across hospitalist practice models, but no differences in job satisfaction, specialty satisfaction, and burnout. In particular, differences across these models included variations in hospitalist workload, hours, pay, and distribution of work activities. We found that hospitalists perform a variety of clinical and nonclinical tasks, for many of which there are not standard reimbursement mechanisms. We also found that features of a job that individual hospitalists considered most important vary by practice model.
Previous analysis of this data explored the overall state of hospitalist satisfaction.16 The present analysis offers a glimpse into hospitalists' systems‐orientation through a deeper look at their work patterns. The growth in the number of hospitalists who participate in intensive care medicine, specialty comanagement, and other work that involves close working relationships with specialist physicians confirms collaborative care as one of the dominant drivers of the hospitalist movement. At the level of indirect patient care, nearly all hospitalists contributed to work that facilitates coordination, quality, patient safety, or information technology. Understanding the integrative value of hospitalists outside of their clinical productivity may be of interest to hospital administrators.
Global satisfaction measures were similar across practice models. This finding is particularly interesting given the major differences in job characteristics seen among the practice models. This similarity in global satisfaction despite real differences in the nature of the job suggests that individuals find settings that allow them to address their individual professional goals. Our study demonstrates that, in 2010, Hospital Medicine has evolved enough to accommodate a wide variety of goals and needs.
While global satisfaction did not differ among practice types, hospitalists from various models did report differences in factors considered important to global satisfaction. While workload and pay were rated as influential across most models, the degree of importance was significantly different. In academic settings, substantial pay was not a top consideration for overall job satisfaction, whereas in local and multistate hospitalist groups, pay was a very close second in importance to optimal workload. These results may prove helpful for individual hospitalists trying to find their optimal job. For example, someone who is less concerned about workload, but wants to be paid well and have a high degree of autonomy, may find satisfaction in local hospitalist groups. However, for someone who is willing to sacrifice a higher salary for variety of activities, academic Hospital Medicine may be a better fit.
There is a concerning aspect of hospitalist job satisfaction that different practice models do not seem to solve. Control over personal time is a top consideration for many hospitalists across practice models, yet their satisfaction with personal time is low. As control over personal time is seen as a draw to the Hospital Medicine specialty, group leaders may need to evaluate their programs to ensure that schedules and workload support efforts for hospitalists to balance work and homelife commitments.
There are additional findings that are important for Hospital Medicine group leaders. Regardless of practice model, compensation and workload are often used as tools to recruit and retain hospitalists. While these tools may be effective, leaders may find more nuanced approaches to improving their hospitalists' overall satisfaction. Leaders of local hospitalist groups may find their hospitalists tolerant of heavier workloads as long as they are adequately rewarded and are given real autonomy over their work. However, leaders of academic programs may be missing the primary factor that can improve their hospitalists' satisfaction. Rather than asking for higher salaries to remain competitive, it may be more effective to advocate for time and training for their hospitalists to pursue important other activities beyond direct clinical care. Given that resources will always be limited, group leaders need to understand all of the elements that can contribute to hospitalist job satisfaction.
We point out several limitations to this study. First, our adjusted response rate of 25.6% is low for survey research, in general. As mentioned above, hospitalists are not easily identified in any available national physician database. Therefore, we deliberately designed our sampling strategy to error on the side of including ineligible surveyees to reduce systematic exclusion of practicing hospitalists. Using simple post hoc methods, we identified many nonhospitalists and bad addresses from our sample, but because these methods were exclusionary as opposed to confirmatory, we believe that a significant proportion of remaining nonrespondents may also have been ineligible for the survey. Although this does not fully address concerns about potential response bias, we believe that our sample representing a large number of hospitalist groups is adequate to make estimations about a nationally representative sample of practicing hospitalists. Second, in spite of our inclusive approach, we may still have excluded categories of practicing hospitalists. We were careful not to allow SHM members to represent all US hospitalists and included non‐members in the sampling frame, but the possibility of systematic exclusion that may alter our results remains a concern. Additionally, one of our goals was to characterize pediatric hospitalists independently from their adult‐patient counterparts. Despite oversampling of pediatricians, their sample was too small for a more detailed comparison across practice models. Also, self‐reported data about workload and compensation are subject to inaccuracies related to recall and cognitive biases. Last, this is a cross‐sectional study of hospitalist satisfaction at one point in time. Consequently, our sample may not be representative of very dissatisfied hospitalists who have already left their jobs.
The diversity found across existing practice models and the characteristics of the practices provide physicians with the opportunity to bring their unique skills and motivations to the hospitalist movement. As hospitals and other organizations seek to create, maintain, or grow hospitalist programs, the data provided here may prove useful to understand the relationship between practice characteristics and individual job satisfaction. Additionally, hospitalists looking for a job can consider these results as additional information to guide their choice of practice model and work patterns.
Acknowledgements
The authors thank Kenneth A. Rasinski for assistance with survey items refinement, and members of the SHM Career Satisfaction Task Force for their assistance in survey development.
- ,,,.The status of hospital medicine groups in the United States.J Hosp Med.2006;1(2):75–80.
- ,,,.Growth in the care of older patients by hospitalists in the United States.N Engl J Med.2009;360(11):1102–1112.
- .The state of hospital medicine in 2008.Med Clin North Am.2008;92(2):265–273,vii.
- ,,,.Health care market trends and the evolution of hospitalist use and roles.J Gen Intern Med.2005;20(2):101–107.
- ,,, et al.Effects of physician experience on costs and outcomes on an academic general medicine service: results of a trial of hospitalists.Ann Intern Med.2002;137(11):866–874.
- .The Park Nicollet experience in establishing a hospitalist system.Ann Intern Med.1999;130(4 pt 2):350–354.
- ,.Effects of an HMO hospitalist program on inpatient utilization.Am J Manag Care.2001;7(11):1051–1057.
- ,.The impact of hospitalists on the cost and quality of inpatient care in the United States: a research synthesis.Med Care Res Rev.2005;62(4):379–406.
- ,,,.Pediatric hospitalists: a systematic review of the literature.Pediatrics.2006;117(5):1736–1744.
- ,.The hospitalist movement 5 years later.JAMA.2002;287(4):487–494.
- ,,,,,.Trends in market demand for internal medicine 1999 to 2004: an analysis of physician job advertisements.J Gen Intern Med.2006;21(10):1079–1085.
- SHM. 2003–2004 Survey by the Society of Hospital Medicine on Productivity and Compensation: Analysis of Results. 2004 [updated 2004]. Available at: http://www.hospitalmedicine.org/AM/Template. cfm?Section=Practice_Resources Available at: http://cme.medscape.com/viewarticle/578134. Accessed October 21,2010.
- State of Hospital Medicine: 2010 Report Based on 2009 Data.Englewood, CO and Philadelphia, PA:Medical Group Management Association and Society of Hospital Medicine;2010.
- ,,,,.Worklife and satisfaction of hospitalists: toward flourishing careers.J Gen Intern Med.2011, Jul 20. PMID: 21773849.
- ,,, et al.Worklife and satisfaction of general internists.Arch Intern Med.2002;162(6):649–656.
- ,,, et al.Organizational climate, stress, and error in primary care: the MEMO study. In: Henriksen K, Battles JB, Marks ES, Lewin DI, eds.Advances in Patient Safety: From Research to Implementation. Vol 1: Research Findings.Rockville, MD:Agency for Healthcare Research and Quality;2005;1:65–77.
- ,,,.Hospitalists and the practice of inpatient medicine: results of a survey of the National Association of Inpatient Physicians.Ann Intern Med.1999;130(4 pt 2):343–349.
- ,,,,,.Physician attitudes toward and prevalence of the hospitalist model of care: results of a national survey.Am J Med.2000;109(8):648–653.
- .Taking the Measure of Work: A Guide to Validated Scales for Organizational Research and Diagnosis.Thousand Oaks, CA:Sage Publications;2002.
- ,,,,.Job Demands and Worker Health.Ann Arbor, MI:University of Michigan, Institute for Social Research;1980.
- .On the dimensionality of organizational justice: a construct validation of a measure.J Appl Psychol.2001;86(3):386–400.
- ,.Effect of job demands and social support on worker stress—a study of VDT users.Behav Inform Technol.1995;14(1):32–40.
- ,,, et al.Measuring physician job satisfaction in a changing workplace and a challenging environment. SGIM Career Satisfaction Study Group. Society of General Internal Medicine.Med Care.1999;37(11):1174–1182.
- ,,, et al.Working conditions in primary care: physician reactions and care quality.Ann Intern Med.2009;151(1):28–U48.
- ,,.Validation of a single‐item measure of burnout against the Maslach Burnout Inventory among physicians.Stress Health.2004;20(2):75–79.
- American Hospital Association. AHA Hospital Statistics. 2009 [updated 2009]. Available at: http://www.ahadata.com/ahadata/html/AHAStatistics.html. Accessed April 12,2011.
- ,,, et al.How to obtain excellent response rates when surveying physicians.Fam Pract.2009;26(1):65–68.
- ,.Estimating nonresponse bias in mail surveys.J Marketing Res.1977;14(3):396–402.
Copyright © 2012 Society of Hospital Medicine
Provider Expectations and Experiences
Comanagement is common in hospital medicine practice. And yet, there is no consensus about how comanagement is different from traditional consultative practice. At its core, hospitalist comanagement is a practice arrangement wherein hospitalists and other specialists manage complex patients collaboratively. Beyond this, Huddleston et al. distinguish comanagement from traditional consultations in the comanaging hospitalists' prerogative to provide direct medical care in addition to consultative advice.1 Siegal focuses on the shared responsibility and authority among partnering providers in the comanagement model.2 Whinney and Michota see comanagement as patient care referral at the onset of a care episode, in contrast to consultations that are activated to address emergent problems.3 In a recent study that found the growing adoption of medical comanagement in Medicare beneficiaries (as much as 40% of surgical hospitalizations in 2006), comanagement was defined as an intensive form of consultation involving a claim for evaluation and management services on greater than 70% of inpatient days.4
In addition to the intensity, frequency, timing, responsibility, and authority of care, comanagement may be described by participating physicians' roles. With recent attention on multidisciplinary teams and an increasing focus on collaborative care, many of the hierarchical relations among healthcare providers are breaking down.5 Several studies of multidisciplinary teams suggest that more egalitarian, rather than hierarchical, problem‐solving and decision‐making among team members are beneficial to patients.67 However, neither the intended nor natural team structure under comanagement is known. We sought to shed some light on provider interactions by characterizing the expectations and experiences of providers of a comanaged service. The findings yielded an opportunity to generate an evolving, but conceptually supported definition of comanagement.
SETTING
We conducted a survey study of providers participating in a comanaged inpatient hepatology service at the University of Chicago Medical Center, a 572‐bed urban teaching hospital. The service was created in 2006, partly to address staffing problems related to housestaff work hour restrictions and partly to improve the care of candidates and recipients of liver transplantation. Nonsurgical floor patients with liver diseases were managed on the service by two collaborating teams of providers. The hepatology team consisted of an attending physician and a fellow, while the hospitalist team consisted of a hospitalist and one or two nonphysician providers (physician assistant or nurse practitioner). The practice model is characterized as comanagement because of the highly interdependent nature of the team's daily tasks and the norms of intensive communication, through formal joint daily rounds and informal direct exchanges of instructions and updates. Hepatologists were mainly responsible for coordinating admissions, managing issues related to liver dysfunction, communicating with transplant surgeons if necessary, and arranging postdischarge care. Hospitalists were responsible for admitting patients, managing routine (eg, ordering daily labs) and urgent issues (eg, responding to critical lab values) during hospitalizations, coordinating with ancillary and consultative staff, and discharging patients. Occasional meetings between the hepatology and hospital medicine groups were used to clarify assignment of responsibilities. Floor nurses received in‐servicing at the commencement of the service. Additional details about the service are described elsewhere.8
DATA COLLECTION AND ANALYSIS
For the purpose of our analysis, we defined interactions between any member of the hospitalist and hepatologist teams as pertinent to comanagement. The hospitalist nonphysician provider (NPP) and hepatologistfellow relationships are governed by the more traditional hierarchical dynamics based on supervision and authority according to laws and regulations. At the beginning of the study period, each participant completed nine items of a Baseline Survey that addressed respondents' expectations and preferences for the management of an ideally comanaged service. Responses were solicited using a 4‐point Likert‐type scale and were dichotomized such that agree and somewhat agree were grouped, while disagree and somewhat disagree were grouped for data analysis. Items were generated to address the salient issues of comanagement after reviewing the pertinent literature.
Subsequently, participants were asked to complete Repeated Surveys immediately before each change in membership of the comanaged team between April and October 2008. The surveys were hand delivered by one of the authors (K.H.) on the last day of each team's rotation and were often completed immediately. The seven items of the Repeated Survey reprised items from the Baseline Survey that were rephrased to allow respondents to report their direct experiences on specific teams. Because all providers rotated on the service more than once during the study period, the average value for each Likert‐type response across multiple surveys completed by a single provider was calculated before being dichotomized at the midpoint (<2.5, agree; 2.5, disagree). We reported proportions of respondents in agreement with survey item statements.
Comparison statistics across providers were generated using the chi‐square test. Differences in proportions between related items of the Baseline and Repeated Surveys were compared using the two‐sample test of proportions. All analyses were conducted using a statistics application (STATA 10.0, College Station, TX) with alpha equal to, or less than, 0.05 considered significant. The Institutional Review Board of the University of Chicago approved this project.
RESULTS
All 43 providers completed the Baseline Survey. During the study period, 32 of these participants rotated on the service and completed 177 of the 233 Repeated Surveys (79%) administered. The responses describe team interactions on the 47 unique combinations of providers comprising the comanaged teams. Details of the response rates are shown in Table 1.
| Baseline Survey, Completed/ Administered (%) | Repeated Surveys, Completed/ Administered (%) | Respondents Completing Repeated Surveys, n | Repeated Surveys Completed per Respondent, Median (IQR) | |
|---|---|---|---|---|
| ||||
| Hospitalists | 18/18 (100) | 36/43 (84) | 15 | 2 (2, 3) |
| NPPs | 5/5 (100) | 92/97 (95) | 5 | 20 (18, 20) |
| Hepatologists | 6/6 (100) | 26/42 (62) | 6 | 7 (3.75, 8) |
| Fellows | 12/12 (100) | 23/42 (55) | 6 | 7 (5.5, 8.5) |
| Total | 43/43 (100) | 177/223 (79) | 32 | 4.5 (2, 8.25) |
As shown in Table 2A, items 13, more members of the hospitalist team preferred to be informed about every management decision compared to members of the hepatologist team. Conversely, more of members of the hepatologist team than the hospitalist team preferred their comanaging partners to participate in every decision. A statistically similar proportion of respondents in each of the professional roles indicated desire for greater influence in directing management decisions (Table 2B, item 1).
| A. Baseline Survey | Hospitalists, % (n = 18) | NPPs, % (n = 5) | Hepatologists, % (n = 6) | GI Fellows, % (n = 12) | P‐value |
|---|---|---|---|---|---|
| |||||
| 1. I prefer to be informed about every decision. | 83 | 100 | 17 | 42 | <0.01 |
| 2. I prefer to participate in every decision. | 67 | 100 | 33 | 50 | 0.11 |
| 3. I prefer that my comanager participate in every decision. | 22 | 20 | 50 | 75 | 0.02 |
| 4. I prefer to have the final say in every decision. | 50 | 80 | 50 | 33 | 0.38 |
| 5. There should be one physician leader to direct the overall management of the patients' hospital course. | 89* | 100 | 67 | 83 | 0.43 |
| 6. Physician consensus should always be sought in every clinical decision. | 22 | 40 | 50 | 67 | 0.11 |
| 7. I have a clear understanding of my role on the comanagement service. | 61 | 80 | 83 | 75 | 0.66 |
| 8. I have as much a sense of ownership of patients on the comanaged service as on a non‐comanaged service. | 61 | 60 | 83 | 50 | 0.60 |
| 9. Comanagement tends to improve patient care. | 94 | 100* | 83 | 100* | 0.47 |
| B. Repeated Surveys | Hospitalists, % (n = 15) | NPPs, % (n = 5) | Hepatologists, % (n = 6) | GI Fellows, % (n = 6) | P‐value |
| 1. I would have liked greater influence in directing the overall management. | 40 | 60 | 0 | 17 | 0.12 |
| 2. I was responsible for work in clinical areas I was not comfortable managing. | 0 | 0 | 0 | 0 | NA |
| 3. There was one physician leader to direct the overall management of the patients' hospital course. | 60* | 80 | 67 | 83 | 0.70 |
| 4. Physician consensus was always sought in every clinical decision. | 40 | 40 | 50 | 67 | 0.72 |
| 5. I (have/had) a clear understanding of my role on the comanagement service. | 73 | 80 | 100 | 83 | 0.57 |
| 6. I had as much a sense of ownership of patients on the comanaged service as on a non‐comanaged service. | 53 | 80 | 100 | 67 | 0.20 |
| 7. Patients on my service received better care than they would have without comanagement. | 93 | 40* | 67 | 50* | 0.06 |
For the majority of surveyed areas, there was concordance between expectations and experiences of providers on comanagement. Most providers, regardless of professional role, agreed that there should be a single physician leader to direct the overall management (Table 2A, item 5). The majority perceived that a single physician directed the overall management of the patients' hospital course, although fewer hospitalists did so compared with baseline expectations (Table 2B, item 3). Many respondents felt at baseline that physician consensus should govern every management decision, and a similar proportion actually experienced consensus‐seeking on service.
We found that the proportion of providers reporting an understanding of their role increased slightly, though not significantly, from before (Table 2A, item 7) to after rotating on the comanaged service (Table 2B, item 5). Although not statistically significant, there was a trend towards hospitalists and gastrointestinal (GI) fellows reporting a lack of patient ownership, both before and after serving on the comanaged service. Finally, nearly all respondents reported that comanagement should improve care quality, although only the attending hospitalist and hepatologist felt that their experience on the comanaged service actually improved patient care (Table 2B, item 7).
DISCUSSION
In this survey of providers participating on a comanaged medical service, most reported understanding their role in the collaborative arrangement and had an initial perception that comanagement should improve patient care quality. We found that hospitalists preferred and were expected to participate in care globally, while hepatologists themselves preferred and were expected not to focus on every management decision. The prevalence of desire for ultimate authority across the professional roles suggests tensions that exist in this care model around how decisions are made. The majority of providers preferred and experienced a single physician leader under comanagement, but many also experienced consensus‐seeking for every management decision.
From these findings, we conclude that decision‐making processes are not uniform under comanagement and that some role ambiguity is present, but there appears to be a pattern of natural roles. This pattern can be defined by focus (general for hospitalists vs specialty‐specific for hepatologists), rather than by responsibilities for managing particular medical problems. The preference among both generalists and specialists for the broader involvement of hospitalist comanagers suggests an implicit recognition of the need for integrated management to overcome the silo‐effect within the comanagement structure.9 Although details about how such integration was achieved are not available in our data, we found that comanagement may be distinct from traditional consultative practice in that the consultants (hospitalists in this case) manage not only general medical problems, such as diabetes or hypertension, but hospitalizations more generally. From a mission‐based standpoint, comanagement may be seen as a collaborative management of complex patients by two or more clinical experts with distinct knowledge, skills, or focus enacted for the purpose of improving care quality.
The focus of comanagement on improving quality is in line with the founding charge of the hospital medicine specialty to raise hospital care quality.10 In fact, the distinction between comanagement and consultation may be meaningful only if comanagers can work with specialists to implement evidence‐based practice, process improvement, and address quality and cost concerns. But as seen in NPPs and fellows' skepticism of improved quality under comanagement, there is still clearly work to be done to validate this model through measurable improvement in patients' experiences and outcomes. Proving the advantages of comanagement as a platform for practice improvement remains future work.11
Collaborative arrangements create natural tensions related to team function.5 This is seen in the similar proportion of hospitalists and hepatologists indicating desire for final decision‐making authority. Although comanagement evokes assumptions about egalitarian provider interactions involving shared decision‐making and responsibility, it seems to function empirically under hierarchical as well as consensus‐seeking forms of decision‐making. Providers at the top of hierarchical teams typically experience their work as interdependent and collaborative, and report more positive interactions with other care providers.12 Based on the fact that no hepatologists wanted more influence over decision‐making, we assume that hepatologists were the physician leaders for most of the studied comanaged teams. Under situations characterized by high levels of complexity and interdependence, a team governed by a single leader may often be more effective than one governed by shared authority.8 However, even under hierarchical models, a more participatory than supervisory leadership can help avoid alienating partners through a pattern of we decide, you carry it out that is often associated with ineffective leadership styles.1314 In fact, this alienating effect on providers in subordinate roles (ie, NPPs and fellows) may have contributed to the negative perception of the team's function on improving patient care.
This study is limited in the following ways. We did not have 100% participation in the Repeated Surveys. Attitudes and experiences of participants in a single comanagement practice are not representative of all comanaging providers. However, the goal of this studyto collect unique survey data from providers themselves to inform an evolving definition of comanagementis modest enough in scope to not require a generalizable sample. Because this study unearthed differences in expectations and experiences within a single site, they may serve as a lower bound for the extent of differences across and within multiple sites. In addition, comanagement enacted for complex medical patients is not as common as the comanagement of surgical patients. Moreover, comanagement models in academic hospitals may have structural features and priorities not found in community settings. Whether or not these disparate models share enough in common to be categorized under a single rubric is a valid question.
Although the teamwork structure and provider roles within comanagement vary, the practice arrangement's preoccupation with quality can be seen as its defining feature. Limited evidence, to date,1, 1519 and the rapid proliferation of the model, suggest that quality and efficiency advantages can be obtained from an effective implementation of comanagement. As in any team‐based care model, a common understanding of roles and expectations are essential to enhancing teamwork. Our interpretation of the mission of comanagement may further enhance teamwork through an explicit articulation of shared goals.
- ,,, et al.Medical and surgical comanagement after elective hip and knee arthroplasty: A randomized, controlled trial.Ann Intern Med.2004;141(1):28–38.
- .Just because you can, doesn't mean that you should: A call for the rational application of hospitalist comanagement.J Hosp Med.2008;3(5):398–402.
- ,.Surgical comanagement: A natural evolution of hospitalist practice.J Hosp Med.2008;3(5):394–397.
- ,,,,.Comanagement of hospitalized surgical patients by medicine physicians in the United States.Arch Intern Med.2010;170(4):363–368.
- .Structure and meaning in multidisciplinary teamwork.Sociol Health Illn.1998;20(6):848–873.
- ,,,,.Human factors and cardiac surgery: A multicenter study.J Thorac Cardiov Surg.2000;119(4):661–670.
- ,,.The effects of a collaborative model of primary care on the mortality and hospital use of community‐dwelling older adults.J Gerontol A‐Biol.2001;56(2):M106–M112.
- ,,,,,.Effects of provider characteristics on care coordination under comanagement.J Hosp Med.2010;5:508–513.
- ,,.Crossing the Quality Chasm: A New Health System for the Twenty‐First Century.Washington, DC:Institute of Medicine;2001.
- ,.The emerging role of “hospitalists” in the American health care system.N Engl J Med.1996;335(7):514–517.
- .Internal medicine comanagement of surgical patients: Can we afford to do this?Arch Intern Med.2010;170(22):1965–1966.
- ,,, et al.Operating room teamwork among physicians and nurses: Teamwork in the eye of the beholder.J Am Coll Surg.2006;202(5):746–752.
- .“We decide, you carry it out”: A social network analysis of multidisciplinary longterm care teams.Soc Sci Med.1997;45(9):1411–1421.
- ,,.Patterns of aggressive behavior in experimentally created social climates.J Soc Psychol.1939;10:271–301.
- ,,, et al.Comanagement of surgical patients between neurosurgeons and hospitalists.Arch Intern Med.2010;170(22):2004–2010.
- ,,,,,.Outcomes for older patients with hip fractures: The impact of orthopedic and geriatric medicine cocare.J Orthop Trauma.2006;20(3):172–180.
- ,,, et al.Effects of a hospitalist model on elderly patients with hip fracture.Arch Intern Med.2005;165(7):796–801.
- ,,,.Hip fractures in geriatric patients. Results of an interdisciplinary hospital care program.Clin Orthop Relat Res.1992(274):213–225.
- ,,,.Impact of a comanaged Geriatric Fracture Center on short‐term hip fracture outcomes.Arch Intern Med.2009;169(18):1712–1717.
Comanagement is common in hospital medicine practice. And yet, there is no consensus about how comanagement is different from traditional consultative practice. At its core, hospitalist comanagement is a practice arrangement wherein hospitalists and other specialists manage complex patients collaboratively. Beyond this, Huddleston et al. distinguish comanagement from traditional consultations in the comanaging hospitalists' prerogative to provide direct medical care in addition to consultative advice.1 Siegal focuses on the shared responsibility and authority among partnering providers in the comanagement model.2 Whinney and Michota see comanagement as patient care referral at the onset of a care episode, in contrast to consultations that are activated to address emergent problems.3 In a recent study that found the growing adoption of medical comanagement in Medicare beneficiaries (as much as 40% of surgical hospitalizations in 2006), comanagement was defined as an intensive form of consultation involving a claim for evaluation and management services on greater than 70% of inpatient days.4
In addition to the intensity, frequency, timing, responsibility, and authority of care, comanagement may be described by participating physicians' roles. With recent attention on multidisciplinary teams and an increasing focus on collaborative care, many of the hierarchical relations among healthcare providers are breaking down.5 Several studies of multidisciplinary teams suggest that more egalitarian, rather than hierarchical, problem‐solving and decision‐making among team members are beneficial to patients.67 However, neither the intended nor natural team structure under comanagement is known. We sought to shed some light on provider interactions by characterizing the expectations and experiences of providers of a comanaged service. The findings yielded an opportunity to generate an evolving, but conceptually supported definition of comanagement.
SETTING
We conducted a survey study of providers participating in a comanaged inpatient hepatology service at the University of Chicago Medical Center, a 572‐bed urban teaching hospital. The service was created in 2006, partly to address staffing problems related to housestaff work hour restrictions and partly to improve the care of candidates and recipients of liver transplantation. Nonsurgical floor patients with liver diseases were managed on the service by two collaborating teams of providers. The hepatology team consisted of an attending physician and a fellow, while the hospitalist team consisted of a hospitalist and one or two nonphysician providers (physician assistant or nurse practitioner). The practice model is characterized as comanagement because of the highly interdependent nature of the team's daily tasks and the norms of intensive communication, through formal joint daily rounds and informal direct exchanges of instructions and updates. Hepatologists were mainly responsible for coordinating admissions, managing issues related to liver dysfunction, communicating with transplant surgeons if necessary, and arranging postdischarge care. Hospitalists were responsible for admitting patients, managing routine (eg, ordering daily labs) and urgent issues (eg, responding to critical lab values) during hospitalizations, coordinating with ancillary and consultative staff, and discharging patients. Occasional meetings between the hepatology and hospital medicine groups were used to clarify assignment of responsibilities. Floor nurses received in‐servicing at the commencement of the service. Additional details about the service are described elsewhere.8
DATA COLLECTION AND ANALYSIS
For the purpose of our analysis, we defined interactions between any member of the hospitalist and hepatologist teams as pertinent to comanagement. The hospitalist nonphysician provider (NPP) and hepatologistfellow relationships are governed by the more traditional hierarchical dynamics based on supervision and authority according to laws and regulations. At the beginning of the study period, each participant completed nine items of a Baseline Survey that addressed respondents' expectations and preferences for the management of an ideally comanaged service. Responses were solicited using a 4‐point Likert‐type scale and were dichotomized such that agree and somewhat agree were grouped, while disagree and somewhat disagree were grouped for data analysis. Items were generated to address the salient issues of comanagement after reviewing the pertinent literature.
Subsequently, participants were asked to complete Repeated Surveys immediately before each change in membership of the comanaged team between April and October 2008. The surveys were hand delivered by one of the authors (K.H.) on the last day of each team's rotation and were often completed immediately. The seven items of the Repeated Survey reprised items from the Baseline Survey that were rephrased to allow respondents to report their direct experiences on specific teams. Because all providers rotated on the service more than once during the study period, the average value for each Likert‐type response across multiple surveys completed by a single provider was calculated before being dichotomized at the midpoint (<2.5, agree; 2.5, disagree). We reported proportions of respondents in agreement with survey item statements.
Comparison statistics across providers were generated using the chi‐square test. Differences in proportions between related items of the Baseline and Repeated Surveys were compared using the two‐sample test of proportions. All analyses were conducted using a statistics application (STATA 10.0, College Station, TX) with alpha equal to, or less than, 0.05 considered significant. The Institutional Review Board of the University of Chicago approved this project.
RESULTS
All 43 providers completed the Baseline Survey. During the study period, 32 of these participants rotated on the service and completed 177 of the 233 Repeated Surveys (79%) administered. The responses describe team interactions on the 47 unique combinations of providers comprising the comanaged teams. Details of the response rates are shown in Table 1.
| Baseline Survey, Completed/ Administered (%) | Repeated Surveys, Completed/ Administered (%) | Respondents Completing Repeated Surveys, n | Repeated Surveys Completed per Respondent, Median (IQR) | |
|---|---|---|---|---|
| ||||
| Hospitalists | 18/18 (100) | 36/43 (84) | 15 | 2 (2, 3) |
| NPPs | 5/5 (100) | 92/97 (95) | 5 | 20 (18, 20) |
| Hepatologists | 6/6 (100) | 26/42 (62) | 6 | 7 (3.75, 8) |
| Fellows | 12/12 (100) | 23/42 (55) | 6 | 7 (5.5, 8.5) |
| Total | 43/43 (100) | 177/223 (79) | 32 | 4.5 (2, 8.25) |
As shown in Table 2A, items 13, more members of the hospitalist team preferred to be informed about every management decision compared to members of the hepatologist team. Conversely, more of members of the hepatologist team than the hospitalist team preferred their comanaging partners to participate in every decision. A statistically similar proportion of respondents in each of the professional roles indicated desire for greater influence in directing management decisions (Table 2B, item 1).
| A. Baseline Survey | Hospitalists, % (n = 18) | NPPs, % (n = 5) | Hepatologists, % (n = 6) | GI Fellows, % (n = 12) | P‐value |
|---|---|---|---|---|---|
| |||||
| 1. I prefer to be informed about every decision. | 83 | 100 | 17 | 42 | <0.01 |
| 2. I prefer to participate in every decision. | 67 | 100 | 33 | 50 | 0.11 |
| 3. I prefer that my comanager participate in every decision. | 22 | 20 | 50 | 75 | 0.02 |
| 4. I prefer to have the final say in every decision. | 50 | 80 | 50 | 33 | 0.38 |
| 5. There should be one physician leader to direct the overall management of the patients' hospital course. | 89* | 100 | 67 | 83 | 0.43 |
| 6. Physician consensus should always be sought in every clinical decision. | 22 | 40 | 50 | 67 | 0.11 |
| 7. I have a clear understanding of my role on the comanagement service. | 61 | 80 | 83 | 75 | 0.66 |
| 8. I have as much a sense of ownership of patients on the comanaged service as on a non‐comanaged service. | 61 | 60 | 83 | 50 | 0.60 |
| 9. Comanagement tends to improve patient care. | 94 | 100* | 83 | 100* | 0.47 |
| B. Repeated Surveys | Hospitalists, % (n = 15) | NPPs, % (n = 5) | Hepatologists, % (n = 6) | GI Fellows, % (n = 6) | P‐value |
| 1. I would have liked greater influence in directing the overall management. | 40 | 60 | 0 | 17 | 0.12 |
| 2. I was responsible for work in clinical areas I was not comfortable managing. | 0 | 0 | 0 | 0 | NA |
| 3. There was one physician leader to direct the overall management of the patients' hospital course. | 60* | 80 | 67 | 83 | 0.70 |
| 4. Physician consensus was always sought in every clinical decision. | 40 | 40 | 50 | 67 | 0.72 |
| 5. I (have/had) a clear understanding of my role on the comanagement service. | 73 | 80 | 100 | 83 | 0.57 |
| 6. I had as much a sense of ownership of patients on the comanaged service as on a non‐comanaged service. | 53 | 80 | 100 | 67 | 0.20 |
| 7. Patients on my service received better care than they would have without comanagement. | 93 | 40* | 67 | 50* | 0.06 |
For the majority of surveyed areas, there was concordance between expectations and experiences of providers on comanagement. Most providers, regardless of professional role, agreed that there should be a single physician leader to direct the overall management (Table 2A, item 5). The majority perceived that a single physician directed the overall management of the patients' hospital course, although fewer hospitalists did so compared with baseline expectations (Table 2B, item 3). Many respondents felt at baseline that physician consensus should govern every management decision, and a similar proportion actually experienced consensus‐seeking on service.
We found that the proportion of providers reporting an understanding of their role increased slightly, though not significantly, from before (Table 2A, item 7) to after rotating on the comanaged service (Table 2B, item 5). Although not statistically significant, there was a trend towards hospitalists and gastrointestinal (GI) fellows reporting a lack of patient ownership, both before and after serving on the comanaged service. Finally, nearly all respondents reported that comanagement should improve care quality, although only the attending hospitalist and hepatologist felt that their experience on the comanaged service actually improved patient care (Table 2B, item 7).
DISCUSSION
In this survey of providers participating on a comanaged medical service, most reported understanding their role in the collaborative arrangement and had an initial perception that comanagement should improve patient care quality. We found that hospitalists preferred and were expected to participate in care globally, while hepatologists themselves preferred and were expected not to focus on every management decision. The prevalence of desire for ultimate authority across the professional roles suggests tensions that exist in this care model around how decisions are made. The majority of providers preferred and experienced a single physician leader under comanagement, but many also experienced consensus‐seeking for every management decision.
From these findings, we conclude that decision‐making processes are not uniform under comanagement and that some role ambiguity is present, but there appears to be a pattern of natural roles. This pattern can be defined by focus (general for hospitalists vs specialty‐specific for hepatologists), rather than by responsibilities for managing particular medical problems. The preference among both generalists and specialists for the broader involvement of hospitalist comanagers suggests an implicit recognition of the need for integrated management to overcome the silo‐effect within the comanagement structure.9 Although details about how such integration was achieved are not available in our data, we found that comanagement may be distinct from traditional consultative practice in that the consultants (hospitalists in this case) manage not only general medical problems, such as diabetes or hypertension, but hospitalizations more generally. From a mission‐based standpoint, comanagement may be seen as a collaborative management of complex patients by two or more clinical experts with distinct knowledge, skills, or focus enacted for the purpose of improving care quality.
The focus of comanagement on improving quality is in line with the founding charge of the hospital medicine specialty to raise hospital care quality.10 In fact, the distinction between comanagement and consultation may be meaningful only if comanagers can work with specialists to implement evidence‐based practice, process improvement, and address quality and cost concerns. But as seen in NPPs and fellows' skepticism of improved quality under comanagement, there is still clearly work to be done to validate this model through measurable improvement in patients' experiences and outcomes. Proving the advantages of comanagement as a platform for practice improvement remains future work.11
Collaborative arrangements create natural tensions related to team function.5 This is seen in the similar proportion of hospitalists and hepatologists indicating desire for final decision‐making authority. Although comanagement evokes assumptions about egalitarian provider interactions involving shared decision‐making and responsibility, it seems to function empirically under hierarchical as well as consensus‐seeking forms of decision‐making. Providers at the top of hierarchical teams typically experience their work as interdependent and collaborative, and report more positive interactions with other care providers.12 Based on the fact that no hepatologists wanted more influence over decision‐making, we assume that hepatologists were the physician leaders for most of the studied comanaged teams. Under situations characterized by high levels of complexity and interdependence, a team governed by a single leader may often be more effective than one governed by shared authority.8 However, even under hierarchical models, a more participatory than supervisory leadership can help avoid alienating partners through a pattern of we decide, you carry it out that is often associated with ineffective leadership styles.1314 In fact, this alienating effect on providers in subordinate roles (ie, NPPs and fellows) may have contributed to the negative perception of the team's function on improving patient care.
This study is limited in the following ways. We did not have 100% participation in the Repeated Surveys. Attitudes and experiences of participants in a single comanagement practice are not representative of all comanaging providers. However, the goal of this studyto collect unique survey data from providers themselves to inform an evolving definition of comanagementis modest enough in scope to not require a generalizable sample. Because this study unearthed differences in expectations and experiences within a single site, they may serve as a lower bound for the extent of differences across and within multiple sites. In addition, comanagement enacted for complex medical patients is not as common as the comanagement of surgical patients. Moreover, comanagement models in academic hospitals may have structural features and priorities not found in community settings. Whether or not these disparate models share enough in common to be categorized under a single rubric is a valid question.
Although the teamwork structure and provider roles within comanagement vary, the practice arrangement's preoccupation with quality can be seen as its defining feature. Limited evidence, to date,1, 1519 and the rapid proliferation of the model, suggest that quality and efficiency advantages can be obtained from an effective implementation of comanagement. As in any team‐based care model, a common understanding of roles and expectations are essential to enhancing teamwork. Our interpretation of the mission of comanagement may further enhance teamwork through an explicit articulation of shared goals.
- ,,, et al.Medical and surgical comanagement after elective hip and knee arthroplasty: A randomized, controlled trial.Ann Intern Med.2004;141(1):28–38.
- .Just because you can, doesn't mean that you should: A call for the rational application of hospitalist comanagement.J Hosp Med.2008;3(5):398–402.
- ,.Surgical comanagement: A natural evolution of hospitalist practice.J Hosp Med.2008;3(5):394–397.
- ,,,,.Comanagement of hospitalized surgical patients by medicine physicians in the United States.Arch Intern Med.2010;170(4):363–368.
- .Structure and meaning in multidisciplinary teamwork.Sociol Health Illn.1998;20(6):848–873.
- ,,,,.Human factors and cardiac surgery: A multicenter study.J Thorac Cardiov Surg.2000;119(4):661–670.
- ,,.The effects of a collaborative model of primary care on the mortality and hospital use of community‐dwelling older adults.J Gerontol A‐Biol.2001;56(2):M106–M112.
- ,,,,,.Effects of provider characteristics on care coordination under comanagement.J Hosp Med.2010;5:508–513.
- ,,.Crossing the Quality Chasm: A New Health System for the Twenty‐First Century.Washington, DC:Institute of Medicine;2001.
- ,.The emerging role of “hospitalists” in the American health care system.N Engl J Med.1996;335(7):514–517.
- .Internal medicine comanagement of surgical patients: Can we afford to do this?Arch Intern Med.2010;170(22):1965–1966.
- ,,, et al.Operating room teamwork among physicians and nurses: Teamwork in the eye of the beholder.J Am Coll Surg.2006;202(5):746–752.
- .“We decide, you carry it out”: A social network analysis of multidisciplinary longterm care teams.Soc Sci Med.1997;45(9):1411–1421.
- ,,.Patterns of aggressive behavior in experimentally created social climates.J Soc Psychol.1939;10:271–301.
- ,,, et al.Comanagement of surgical patients between neurosurgeons and hospitalists.Arch Intern Med.2010;170(22):2004–2010.
- ,,,,,.Outcomes for older patients with hip fractures: The impact of orthopedic and geriatric medicine cocare.J Orthop Trauma.2006;20(3):172–180.
- ,,, et al.Effects of a hospitalist model on elderly patients with hip fracture.Arch Intern Med.2005;165(7):796–801.
- ,,,.Hip fractures in geriatric patients. Results of an interdisciplinary hospital care program.Clin Orthop Relat Res.1992(274):213–225.
- ,,,.Impact of a comanaged Geriatric Fracture Center on short‐term hip fracture outcomes.Arch Intern Med.2009;169(18):1712–1717.
Copyright © 2011 Society of Hospital Medicine
QI Systems for Managing ACS
Addressing quality improvement (QI) for the management of acute coronary syndrome (ACS) at the institutional level is essential for supporting hospitalists and other clinicians as they manage patients with ACS and achieve desired institutional outcomes. This systems approach may identify institution‐specific barriers to quality care, including those that affect the complex management of ACS. Having a firsthand view of patient care puts the hospitalist in a good position to assess the viability of existing processes and protocols that support care. Indeed, the hospitalist has a vested interest in improving systems of care as these systems directly affect the hospitalist's practice. This unique perspective gives the hospitalist an opportunity to facilitate systems change within the institution and to become an integral participant or leader in QI initiatives.
An increasing number of hospitalists are providing critical care at secondary and tertiary care facilities, driven by a shortage of intensivists in the United States. In a 20052006 survey about 75% of hospitalists reported they provide critical care services as part of their practice,1 and this would include care of patients with ACS. The Society of Hospital Medicine (SHM) has developed core competencies that recognize the important role of hospitalists in leading or participating in QI teams for ACS.2 Hospitalists must also be able to apply evidenced‐based outcomes data to support these initiatives.3 Hospitalist competencies for ACS include protocol development that supports the timely diagnosis and treatment of ACS, evaluation of resource utilization, staff education of secondary prevention measures, and implementation of measures to ensure institutional compliance with national quality standards (Table 1).2 Most hospital medicine groups will be expected to contribute to systems improvement, an area where hospitalists have already shown leadership for QI protocols related to glycemic control and venous thromboembolism prophylaxis. Hospitalists were prominent in targeting QI in these areas even though these QI initiatives could easily have been spearheaded by specialists.46
|
| Lead, coordinate, or participate in: |
| Protocol development to rapidly identify ACS, minimizing time to intervention |
| Protocol development for rapid identification and transfer of patients with ACS to a facility with an appropriate level of care |
| Multidisciplinary initiatives, including order sets for ACS and chest pain, that promote patient safety and optimize the use of resources |
| Staff education initiatives on the value of smoking cessation counseling and other prevention measures |
| Implement or integrate: |
| Systems to ensure hospitalwide adherence to national standards, documenting adherence as required by certifying organizations |
| Outcomes research, institution‐specific laboratory policies, and hospital formulary to create indicated and cost‐effective diagnostic and management strategies for patients with ACS |
QI Basics
QI at the institutional level addresses systems of care rather than individual performance, targeting both institutional performance and use of resources.3 QI is a continuous process in which practices and procedures related to patient management are regularly assessed to ascertain whether a quality gap exists. This in turn may lead to new processes, protocols, and algorithms that help the institution and clinicians meet benchmarks of quality care.
QI starts when an existing gap is recognizedthe gap between the scientific understanding of optimal care and actual patient care. The goal is to narrow or close this gap so that each patient receives optimal care. Underlying any QI initiative are 2 essential concepts. First, improvement requires systems changeany system will produce exactly what it is designed to produce. For example, if procedures are not in place to educate patients about smoking cessation while they are hospitalized, it is unlikely that the majority will routinely receive this counseling before they are discharged. Second, less is moreproductivity is not destroyed but often is enhanced by initiating simple and practical change. If a patient arrives in the emergency department (ED) with chest pain, instituting an order set that reminds clinicians to start antiplatelet therapy or a beta blocker can lessen the chance that these medications will be overlooked, especially when the patient transitions between providers or services within the hospital.
SHM has identified 7 essential elements of any QI initiative, and these are applicable to the care of the ACS patient (Table 2).7 These elements highlight the need for institutional support and teamwork that support standardized measures and tools specific to issues in ACS management. These issues include: (1) rapidly identifying a patient with ACS and initiating a care plan when the patient is admitted; (2) encouraging good communication between providers; (3) symptom management; (4) medication safety, polypharmacy, and medication reconciliation; (5) patient and caregiver education; (6) safe discharge and transitions in care; and (7) meeting Centers for Medicare and Medicaid Services (CMS) core measures.
| |
| Institutional support | Commitment of time, personnel, and tools to support the initiative |
| Multidisciplinary team | Team that focuses on quality of care for patients with ACS |
| Reliable metrics | Reflect CMS core and applicable PQRI measures; also reportable to inform team decision making |
| Identify the goal | Establish a measurable, achievable goal with an established timeline |
| Standard order sets | Defined clinical pathways that support evidence‐based treatment strategies, risk stratification, and safe transitions in care |
| Policies that support algorithms and protocols | Institution‐specific to support order sets |
| Education programs | Targeted to clinicians and patients; should cover items addressed in order sets, algorithms, and protocols |
Tools such as process flow mapping and run charts can reveal quality gaps and indicate if process improvements are leading to stated objectives. Process flow mapping makes it possible to identify and visualize quality gaps that might otherwise be hidden and to identify their source or cause. Process mapping documents discrete steps within the flow and usually requires input from multiple disciplines; this information can guide a multidisciplinary QI team when formulating interventions for process improvement.7 Figure 1 shows process flow mapping for the early identification of ST‐segment elevation myocardial infarction (STEMI) when hospitalists have open access to activate the catheterization laboratory (cath lab). The time from door‐to‐balloon is a critical factor in reducing STEMI‐related morbidity8; processes that overcome delays to percutaneous coronary intervention (PCI) and improve communication can have a direct benefit on patient outcomes.

A run chart is a commonly used tool which graphically depicts progress in attaining a goal over time, before and after an intervention. Figure 2a is a run chart that shows the average time to PCI following implementation of an order set designed to support the use of a risk stratification tool for the early diagnosis of STEMI. In this case, the average time to PCI is observed to decrease over time, but still lags behind the desired goal of less than 90 minutes. This run chart indicates that further work is needed to improve the process of identifying patients with STEMI. Figure 2b shows the number of eligible STEMI patients who received aspirin at discharge following implementation of a discharge order set; here, the hospital has clearly made progress toward meeting this CMS core measure.
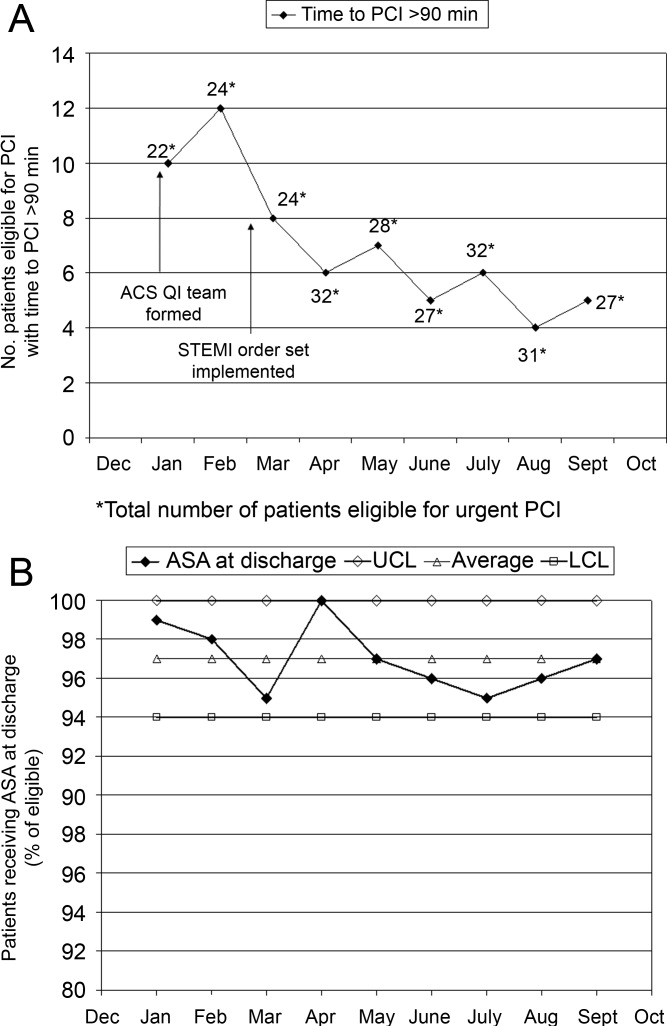
The following is a case study that illustrates how the implementation of standardized measures and tools can help hospitalists and other clinicians achieve quality measures in the care of a patient with ACS.
Case Study
Mary, a 68‐year‐old woman, presents to the ED with fatigue and some heartburn. She has a history of hypertension and may have had a mini stroke a few years ago. Her symptoms, which she has had on and off for the past few days, worsened considerably right before her arrival. She has been taking chewable antacids but is unsure if they have helped. Her physical exam is unremarkable. A stat electrocardiogram (ECG) shows inferior ST (part of an electrocardiogram between the QRS complex and the T wave) elevation in leads II and III, and augmented vector foot (aVF). Troponins are positive. This case can be approached from 2 perspectives.
Scenario 1
Mary arrives at a hospital that has few standardized systems or protocols for triage and transitions in care. The triage nurse recognizes the need for and obtains an ECG, but fails to alert the ED physician. When the ED physician eventually sees the patient and reviews the ECG, she immediately administers nitroglycerin and pages the cardiologist on call and the hospitalist. The hospitalist arrives first and recognizes the STEMI, but hesitates to start unfractionated or low molecular weight heparin until the cardiologist determines whether the patient will undergo PCI. The cardiologist orders PCI, the cath lab is alerted, and the patient is started on the appropriate medications; the patient does not start an aspirin until after PCI. In this scenario, several short delays amount to a significant delay of about 2 hours before the patient reaches the cath lab. In addition, although aspirin is given on day 1, it is not done on arrival. Following PCI, the patient is transferred to the coronary care unit (CCU).
Scenario 2
Mary arrives at an institution with well‐defined, institution‐specific protocols for triage and transitions in care. The triage nurse recognizes the need for and obtains an ECG; the results are immediately reviewed with the ED physician. STEMI is diagnosed and the cath lab protocol is activated; the patient receives aspirin as part of a standing order. The hospitalist meets the patient in the ED within 5 minutes and begins the protocol for unfractionated heparin and preparation for immediate PCI, allowing the ED physician to return to ED care. Simultaneously, the interventional cardiologist and cath lab are mobilized and the patient is transferred within 15 minutes. Additional appropriate medications are begun. The door‐to‐balloon time is 60 minutes, well within recommended timeframes. Following PCI, the patient is transferred to the CCU.
Measuring Performance Relative to ACS
Two agencies promulgating quality measures for hospital inpatient care are The Joint Commission (TJC) and the CMS. TJC and CMS jointly established core measures for patients with acute myocardial infarction (AMI) and these are considered key indicators of quality, evidence‐based care. As outlined in Table 3, the TJC/CMS recommendations promote, unless contraindicated, a minimum standard of care for patients with AMI.9, 10 Public reporting of institutional core measure performance has led to an intense focus on improving these metrics.
| Core Measure | Sample Metric |
|---|---|
| |
| Aspirin at arrival | Percentage of patients receiving aspirin within 24 hours before or after hospital arrival |
| Aspirin at discharge | Percentage of patients prescribed aspirin at hospital discharge |
| ACE inhibitor or ARB for LVSD | Percentage of patients with LVSD prescribed an ACEI or ARB at hospital discharge |
| Beta blocker | Percentage of patients prescribed a beta blocker at hospital discharge |
| Fibrinolytic medication given within 30 minutes of hospital arrival | Median time to fibrinolysis |
| Percentage of patients given fibrinolytic medication within 30 minutes of hospital arrival | |
| PCI received within 90 minutes of hospital arrival | Median time to PCI |
| Percentage of patients receiving primary PCI within 90 minutes of hospital arrival | |
| Smoking cessation counseling | Percentage of patients with a history of smoking cigarettes who are counseled about smoking cessation during hospitalization |
On a national level, TJC documented performance improvement from 2002 to 2008 for each of the core measures. Compliance with smoking cessation counseling improved the most, rising from 67% to almost 99%. In 2008, a combined measure of all individual core measures indicated that, overall, care of heart attack patients is of high quality. Hospitals delivered evidenced‐based care in 96.7% of the opportunities they had to provide this care. Compliance related to oral medications was also good (95%); however, a closer look at other individual measures shows that improvement is needed to reduce the time to fibrinolysis (52.4% compliance rate for 30 minutes or less) and time to primary PCI (81.6% compliance rate for 90 minutes or less).11
Financial incentives are tied to QI measures including those from CMS. At present, this system is in the pay‐for‐reporting phase, in which institutions are penalized for not reporting quality metrics for the CMS core measures. It is likely that, to further incentivize institutions to meet quality benchmarks, this will be expanded to a pay‐for‐performance system (eg, differential payments for readmissions or different payment scales based on prior performance). Public disclosure of institutional performance relative to ACS and other medical conditions is available through the HHS.gov website (www.hospitalcompare.hhs.gov), which compares performance between hospitals and provides a clear business motivation for institutions to improve and provide high quality care.
Two other reporting systems should be noted. The CMS Physician Quality Reporting Initiative (PQRI) includes physician‐related quality measures specific to ACS12 that overlap with institution‐level CMS core measures with regard to prescribing ACS medications. Payments associated with the PQRI are currently a small financial factor for hospitalists, but will likely grow as quality initiatives develop overall. The Hospital Care Quality Information From the Consumer Perspective (HCAHPS) initiative, also from CMS, strives to capture patients' perspectives on hospital care through a standardized survey. The goals are to collect data that can be used to compare hospital performance, create an incentive for QI through public disclosure of results, and increase transparency regarding the quality of hospital care.13 However, the focus is not ACS‐specific. Patients are queried about communication with hospital staff, communication about medications, and information about discharge, all areas of concern for the hospitalist in general that have been identified as areas for improvement relative to ACS.
Case Study (cont)
Scenario 1 (cont)
Mary recuperates in the CCU and is transferred to the medical floor. The hospitalist and cardiologist see her separately on rounds and each assumes the other has a reason for not starting a beta blocker; therefore, a beta blocker is not prescribed. The nurse cannot tell who is in charge and does not anticipate the day of dischargeshe is just implementing the orders as they are written. The day of discharge arrives; the nurse learns from Mary that the hospitalist will discharge her that day. The hospitalist reviews the list of ACS medications and realizes that Mary still has not started a beta blocker. He cannot reach the cardiologist before Mary's ride home arrives, so he writes a note in the discharge summary alerting the primary care physician (PCP) to consider a beta blocker at follow‐up. Because of this lack of communication and systems for tracking the implementation of guideline‐recommended therapies, Mary is discharged without a CMS core measure medication, with no assurance that this will be addressed by the PCP.
Scenario 2 (cont)
Mary recuperates in the CCU and is transferred to the medical floor. Standard post‐PCI/STEMI orders are in place according to institutional protocol. The hospitalist is able to confirm that all interventions required at admission (aspirin, beta blocker, assessment of smoking status) have occurred by reviewing a well‐structured checklist that includes easy‐to‐read visual cues. The checklist indicates that Mary was counseled about smoking cessation on day 1 of her stay in the CCU. Mary and her physicians and nurses are all aware of the target discharge date and the milestones that must be met prior to discharge (eg, echocardiogram, medication review, education, assessment of mobility, etc). Mary is instructed about each new medication and given educational materials.14 Follow‐up appointments postdischarge are made, and the discharge summary is sent electronically to the PCP. These institution‐specific protocols enhance communication overall and help the hospital meet high standards of patient care.
Special QI Issues in ACS Management for the Hospitalist
Coordination is especially important for patients with ACS because their care is so complex. Seamless transitions promote safe care as the patient moves from the ED, cath lab, recovery unit, medical floor, and discharge through the transition to primary care. Poor communication between clinicians during these transitions may result in delayed or overlooked treatment and other medical errors. Implementing an institutional system of care may overcome communication barriers and help ensure the institution meets its quality benchmarks, such as the CMS core measures. Standard order sets and protocols identify the steps and components needed to manage ACS. At admission, these measures promote early assessment of patient risk, triage to early intervention, medication reconciliation, and communication between stakeholders such as the hospitalist, cardiologist, and the cath lab.15, 16 During hospitalization, they help assure ongoing risk assessment and early consideration of discharge planning, culminating in discharge and the transition back to primary care.
A recent guideline update8 focused attention on the coordination of care between institutions and the critical importance of rapid triage for patients who need primary PCI and transfer from a non‐PCI to a PCI‐capable institution. The decision to transfer rests on multiple factors and requires rapid decision making on the part of clinicians. Time to reperfusion is shown to have a direct effect on patient outcomes. Established protocols within a non‐PCI facility can support timely transfer to a PCI‐capable facility if indicated. Factors such as the patient's mortality risk, the risk of bleeding from fibrinolytic therapy, duration of symptoms, and the time for transport to a PCI facility all must be considered. It is recognized that a regional system of STEMI care best supports collaborative efforts between institutions and community resources that support QI efforts.
Transitions in care, and particularly discharge, are areas with identified gaps in quality care17, 18 for which improvement has been pursued on an institutional level. Project BOOST (Better Outcomes for Older Adults Through Safe Transitions) seeks to improve the care of patients during the transition from inpatient to outpatient care, and focuses on elderly patients identified to be at high‐risk for adverse events during this transition.19 The goal is to improve outcomes related to 30‐day readmission rates, patient satisfaction, communication between inpatient and outpatient providers, identification of high‐risk patients who need intervention to reduce risk, and patient education about their risk for an adverse event. BOOST addresses these outcomes at an institutional level by offering resources related to project management, data collection, tools for clinicians and patients, and participating mentor institutions. These resources help an institution assess its readiness for change, identify quality gaps, promote teamwork, and guide the implementation and subsequent evaluation of process improvements. Specific tools for clinicians also support institutional goals for teamwork and communication, creating an environment for safe transitions. Both BOOST19 and the adaptable Transitions Tool from the SHM20 provide a framework for understanding processes that involve multiple departments and stakeholders, breaking complex processes into discrete parts for which quality gaps can be identified and change instituted to improve care. A checklist can also be a useful tool for ensuring specific issues are addressed during transitions in care. SHM developed a checklist for hospitalist use that lists elements of a discharge summary for patients with ACS (Table 4).21
| |
| Diagnoses | Elaborate on details of MI such as location, complications |
| Comorbidities | List, including diabetes, lipids, hypertension, renal disease |
| Medications | Note medication reconciliation, reason for not prescribing core measure medications, titration of any medications |
| Specific medications to address include ACE/ARB inhibitors, aspirin, beta blockers, statin, sublingual NTG, clopidogrel (include duration of therapy) | |
| Procedures | Type of stent (bare‐metal stent, drug‐eluting stent) and stent location |
| Complications (hematoma, transfusion) | |
| If ECHO, note type, ejection fraction; provide copy of ECG | |
| Follow‐up appointment(s) | Primary care, cardiology, others such as cardiac rehabilitation |
| Follow‐up testing | ETT (type, timeframe); ECHO if indicated; laboratory assessments |
| Code status | |
| Activity | |
| Diet | |
| Wound care (eg, groin) | |
| Treatment course | Address cognitive level, discharge LDL, discharge creatinine, INR if on warfarin, LFTs if on statin |
| Copy all providers | |
Staff and patient education is also an area that can benefit from evaluation. Clinicians from multiple disciplines are stakeholders in QI and they should receive education about its purpose and goals. Usually institutions will have a QI methodology in place, and this should be conveyed to the members of the ACS team. Staff education about ACS should be tailored to each specialty, be institution‐specific, current, and comprehensive, and include methods for assessing the learner. Education should be easily available (eg, on the Internet or via an electronic format), interactive, case‐based, and mandatory. For patients, education should be available in languages other than English and identify community resources and opportunities for additional outpatient education. The value of any educational program should be assessed to measure learner participation, satisfaction, and comprehension.
Gathering metrics and generating objective evidence of change is critical to QI; quantifying improvement (or lack thereof) must be done to determine whether the changes implemented improve care and ultimately whether desired outcomes are met. Metrics should be meaningful, associated with standards of care (eg, CMS core measures), and carefully chosen to reflect current practice. CMS core measures are a good target for collecting metrics to assess an institution's performance relative to ACS (Table 3). The Specifications Manual for National and Hospital Inpatient Quality Measures10 from TJC and CMS identifies the data elements needed for reporting. Other metrics not specified as core measures are worthy of measurement because they are considered the standard of care for patients with ACS (Table 5). The metrics shown in Tables 3 and 5 assume that all patients are eligible for core‐measure or standard‐of‐care medications and procedures. Because some measures are contraindicated in some patients, it is more meaningful to measure the percentage of patients without a contraindication who receive the measure. If a measure is contraindicated, the patient's medical record must include supporting documentation indicating why a core measure was not met. To be objective and reduce bias regarding the effectiveness of QI measures, data collection is best done prospectively. If necessary, periodic assessments against performance measures (institutional, government, professional association) should be made to support timely intervention. Run charts can be particularly useful here, measuring change over time to identify trends or an intervention that supported, did not affect, or was a barrier to the desired change.
Case Study (cont)
Scenario 1 (cont)
Mary tells the hospitalist she felt the discharge process was rushed and confusing and that she was dissatisfied with her care overall. Recalling a recent review article on the process for public disclosure of patient ratings related to hospital stay, the hospitalist locates HospitalCompare.com on the Internet. He reviews results from patient satisfaction surveys that compare his institution with others in the geographic area and is surprised to discover that patients generally give his institution a poor rating as well as low marks for the quality of nursing and physicianpatient communication. He is interested in this information but is not aware of resources for further exploration.
Scenario 2 (cont)
At discharge, the hospitalist confirms with Mary that she has received smoking cessation counseling during her hospital stay; he documents this in her chart and discharge summary. The hospitalist was aware of this particular quality measure because the recent weekly score card of hospital performance, posted in the unit, reported that the hospital was not meeting its goal of 100% compliance for this CMS core measure. Among heart attack patients who were identified as smokers, only 80% of charts documented that the patient had been counseled about smoking cessation during the hospital stay. Mary says that she understands the importance of not smoking and says she will make an effort to stop.
| Standard of Care Measure | Sample Metric |
|---|---|
| |
| LDL‐cholesterol assessment | Percentage of patients who have LDL cholesterol measured during hospitalization |
| Lipid‐lowering therapy at discharge | Percentage of patients prescribed a statin at hospital discharge |
| Dietary consultation | Percentage of patients who receive a dietary consult during hospitalization |
| Time to receipt of high‐risk abnormal laboratory assessments | Median time to receipt of high‐risk laboratory results, eg, troponins |
| Cardiac risk assessment | Percentage of patients who receive a cardiac risk assessment during admission |
| Measurement of LVEF | Percentage of patients who receive a cardiac echocardiogram to measure of LVEF before discharge |
| Document communication with PCP | Percentage of patients whose communication with the PCP was documented at discharge |
| Completed medication reconciliation | Percentage of patients for whom medication reconciliation was documented by the time of discharge |
| Make 1‐week follow‐up appointment with PCP | Percentage of patients for whom a 1‐week follow‐up appointment with the PCP was documented at the time of discharge |
| Additional Measure | |
| Inpatient mortality | |
Conclusion
Each hospitalist can have an impact on ACS care systemwide. Hospitalists are on the front line of care and have a unique perspective on patients as they are transitioned through the hospital stay and on how an institution handles patient care overall. They experience firsthand the challenges presented by poor communication between providers, patients, and their families. They can offer breadth of experience and perspective when assessing processes linked to patient care and can be instrumental in ensuring each patient experiences safe transitions during the hospital stay. Hospitalists should participate in QI initiatives for ACS and should consider opportunities to take the lead on these initiatives within their institutions.
Acknowledgements
The author thanks Denise Erkkila, RPh for her editorial assistance in the preparation of this manuscript.
- Hospitalists and intensivists: partners in caring for the critically ill—the time has come.J Hosp Med.2010;5:1–3.
- Society of Hospital Medicine. Acute coronary syndrome.J Hosp Med.2006;1(suppl 1):2–3.
- Society of Hospital Medicine. Quality improvement.J Hosp Med.2006;1 (suppl):92.
- ,,, et al.Curriculum development: the venous thromboembolism quality improvement resource room.J Hosp Med.2006;1:124–132.
- ,,,,Society of Hospital Medicine Glycemic Control Task Force summary: practical recommendations for assessing the impact of glycemic control efforts.J Hosp Med.2008;3:66–75.
- ,,,Effects of a subcutaneous insulin protocol, clinical education, and computerized order set on the quality of inpatient management of hyperglycemia: results of a clinical trial.J Hosp Med.2009;4:16–27.
- SHM Acute Coronary Syndrome Advisory Board. A guide for effective quality improvement: improving acute coronary syndrome care for hospitalized patients. Available at: http://www.hospitalmedicine.org. 2010. Accessed July 2010.
- ,,, et al.2009focused updates: ACC/AHA guidelines for the management of patients with ST‐elevation myocardial infarction (updating the 2004 guideline and 2007 focused update) and ACC/AHA/SCAI guidelines on percutaneous coronary intervention (updating the 2005 guideline and 2007 focused update) a report of the American College of Cardiology Foundation/American Heart Association Task Force on Practice Guidelines.J Am Coll Cardiol.year="2009"2009;54:2205–2241.
- The Joint Commission. Performance measure intiatives. Available at: http://www.jointcommission.org/PerformanceMeasurement/PerformanceMeasurement/Acute+Myocardial+Infarction+Core+Measure+Set.htm. 2010. Accessed July 2010.
- The Joint Commission, Centers for Medicare and Medicare Services. Specifications manual for national hospital inpatient quality measures, version 2.5. Available at: http://www.jointcommission.org/PerformanceMeasurement/PerformanceMeasurement/Current+NHQM+Manual.htm. 2009 November 6. Accessed July 2010.
- The Joint Commission. Improving America's hospitals: The Joint Commission's annual report on quality and safety 2009. Available at: http://www.jointcommission.org/Library/annual_report.2009. Accessed July 2010.
- Centers for Medicare and Medicare Services. Physician quality reporting initiative (PQRI). Available at: http://www.cms.hhs.gov/pqri. 2010. Accessed July 2010.
- Hospital Care Quality Information from the Consumer Perspective. CAHPS hospital survey. Available at: http://www.hcahpsonline.org. 2010. Accessed July 2010.
- ,,,.Discharge education improves clinical outcomes in patients with chronic heart failure.Circulation.2005;111:179–185.
- ,,, et al.National efforts to improve door‐to‐balloon time results from the Door‐to‐Balloon Alliance.J Am Coll Cardiol.2009;54:2423–2429.
- ,,, et al.Sustaining improvement in door‐to‐balloon time over 4 years: the Mayo clinic ST‐elevation myocardial infarction protocol.Circ Cardiovasc Qual Outcomes.2009;2:508–513.
- ,,,Promoting effective transitions of care at hospital discharge: a review of key issues for hospitalists.J Hosp Med.2007;2:314–323.
- ,.Lost in transition: challenges and opportunities for improving the quality of transitional care.Ann Intern Med.2004;141:533–536.
- Society of Hospital Medicine. Boosting Care Transitions Resource Room. Available at: http://www.hospitalmedicine.org/ResourceRoomRedesign/RR_CareTransitions/CT_Home.cfm. 2010. Accessed July 2010.
- SHM ACS Transitions Workgroup. SHM ACS Transitions Tool. Available at: http://www.hospitalmedicine.org/ResourceRoomRedesign/RR_ACS/html_ACS/12ClinicalTools/05_Transitions.cfm. 2010. Accessed July 2010.
- ,,, et al.Transition of care for hospitalized elderly patients‐‐development of a discharge checklist for hospitalists.J Hosp Med.2006;1:354–360.
Addressing quality improvement (QI) for the management of acute coronary syndrome (ACS) at the institutional level is essential for supporting hospitalists and other clinicians as they manage patients with ACS and achieve desired institutional outcomes. This systems approach may identify institution‐specific barriers to quality care, including those that affect the complex management of ACS. Having a firsthand view of patient care puts the hospitalist in a good position to assess the viability of existing processes and protocols that support care. Indeed, the hospitalist has a vested interest in improving systems of care as these systems directly affect the hospitalist's practice. This unique perspective gives the hospitalist an opportunity to facilitate systems change within the institution and to become an integral participant or leader in QI initiatives.
An increasing number of hospitalists are providing critical care at secondary and tertiary care facilities, driven by a shortage of intensivists in the United States. In a 20052006 survey about 75% of hospitalists reported they provide critical care services as part of their practice,1 and this would include care of patients with ACS. The Society of Hospital Medicine (SHM) has developed core competencies that recognize the important role of hospitalists in leading or participating in QI teams for ACS.2 Hospitalists must also be able to apply evidenced‐based outcomes data to support these initiatives.3 Hospitalist competencies for ACS include protocol development that supports the timely diagnosis and treatment of ACS, evaluation of resource utilization, staff education of secondary prevention measures, and implementation of measures to ensure institutional compliance with national quality standards (Table 1).2 Most hospital medicine groups will be expected to contribute to systems improvement, an area where hospitalists have already shown leadership for QI protocols related to glycemic control and venous thromboembolism prophylaxis. Hospitalists were prominent in targeting QI in these areas even though these QI initiatives could easily have been spearheaded by specialists.46
|
| Lead, coordinate, or participate in: |
| Protocol development to rapidly identify ACS, minimizing time to intervention |
| Protocol development for rapid identification and transfer of patients with ACS to a facility with an appropriate level of care |
| Multidisciplinary initiatives, including order sets for ACS and chest pain, that promote patient safety and optimize the use of resources |
| Staff education initiatives on the value of smoking cessation counseling and other prevention measures |
| Implement or integrate: |
| Systems to ensure hospitalwide adherence to national standards, documenting adherence as required by certifying organizations |
| Outcomes research, institution‐specific laboratory policies, and hospital formulary to create indicated and cost‐effective diagnostic and management strategies for patients with ACS |
QI Basics
QI at the institutional level addresses systems of care rather than individual performance, targeting both institutional performance and use of resources.3 QI is a continuous process in which practices and procedures related to patient management are regularly assessed to ascertain whether a quality gap exists. This in turn may lead to new processes, protocols, and algorithms that help the institution and clinicians meet benchmarks of quality care.
QI starts when an existing gap is recognizedthe gap between the scientific understanding of optimal care and actual patient care. The goal is to narrow or close this gap so that each patient receives optimal care. Underlying any QI initiative are 2 essential concepts. First, improvement requires systems changeany system will produce exactly what it is designed to produce. For example, if procedures are not in place to educate patients about smoking cessation while they are hospitalized, it is unlikely that the majority will routinely receive this counseling before they are discharged. Second, less is moreproductivity is not destroyed but often is enhanced by initiating simple and practical change. If a patient arrives in the emergency department (ED) with chest pain, instituting an order set that reminds clinicians to start antiplatelet therapy or a beta blocker can lessen the chance that these medications will be overlooked, especially when the patient transitions between providers or services within the hospital.
SHM has identified 7 essential elements of any QI initiative, and these are applicable to the care of the ACS patient (Table 2).7 These elements highlight the need for institutional support and teamwork that support standardized measures and tools specific to issues in ACS management. These issues include: (1) rapidly identifying a patient with ACS and initiating a care plan when the patient is admitted; (2) encouraging good communication between providers; (3) symptom management; (4) medication safety, polypharmacy, and medication reconciliation; (5) patient and caregiver education; (6) safe discharge and transitions in care; and (7) meeting Centers for Medicare and Medicaid Services (CMS) core measures.
| |
| Institutional support | Commitment of time, personnel, and tools to support the initiative |
| Multidisciplinary team | Team that focuses on quality of care for patients with ACS |
| Reliable metrics | Reflect CMS core and applicable PQRI measures; also reportable to inform team decision making |
| Identify the goal | Establish a measurable, achievable goal with an established timeline |
| Standard order sets | Defined clinical pathways that support evidence‐based treatment strategies, risk stratification, and safe transitions in care |
| Policies that support algorithms and protocols | Institution‐specific to support order sets |
| Education programs | Targeted to clinicians and patients; should cover items addressed in order sets, algorithms, and protocols |
Tools such as process flow mapping and run charts can reveal quality gaps and indicate if process improvements are leading to stated objectives. Process flow mapping makes it possible to identify and visualize quality gaps that might otherwise be hidden and to identify their source or cause. Process mapping documents discrete steps within the flow and usually requires input from multiple disciplines; this information can guide a multidisciplinary QI team when formulating interventions for process improvement.7 Figure 1 shows process flow mapping for the early identification of ST‐segment elevation myocardial infarction (STEMI) when hospitalists have open access to activate the catheterization laboratory (cath lab). The time from door‐to‐balloon is a critical factor in reducing STEMI‐related morbidity8; processes that overcome delays to percutaneous coronary intervention (PCI) and improve communication can have a direct benefit on patient outcomes.
A run chart is a commonly used tool which graphically depicts progress in attaining a goal over time, before and after an intervention. Figure 2a is a run chart that shows the average time to PCI following implementation of an order set designed to support the use of a risk stratification tool for the early diagnosis of STEMI. In this case, the average time to PCI is observed to decrease over time, but still lags behind the desired goal of less than 90 minutes. This run chart indicates that further work is needed to improve the process of identifying patients with STEMI. Figure 2b shows the number of eligible STEMI patients who received aspirin at discharge following implementation of a discharge order set; here, the hospital has clearly made progress toward meeting this CMS core measure.
The following is a case study that illustrates how the implementation of standardized measures and tools can help hospitalists and other clinicians achieve quality measures in the care of a patient with ACS.
Case Study
Mary, a 68‐year‐old woman, presents to the ED with fatigue and some heartburn. She has a history of hypertension and may have had a mini stroke a few years ago. Her symptoms, which she has had on and off for the past few days, worsened considerably right before her arrival. She has been taking chewable antacids but is unsure if they have helped. Her physical exam is unremarkable. A stat electrocardiogram (ECG) shows inferior ST (part of an electrocardiogram between the QRS complex and the T wave) elevation in leads II and III, and augmented vector foot (aVF). Troponins are positive. This case can be approached from 2 perspectives.
Scenario 1
Mary arrives at a hospital that has few standardized systems or protocols for triage and transitions in care. The triage nurse recognizes the need for and obtains an ECG, but fails to alert the ED physician. When the ED physician eventually sees the patient and reviews the ECG, she immediately administers nitroglycerin and pages the cardiologist on call and the hospitalist. The hospitalist arrives first and recognizes the STEMI, but hesitates to start unfractionated or low molecular weight heparin until the cardiologist determines whether the patient will undergo PCI. The cardiologist orders PCI, the cath lab is alerted, and the patient is started on the appropriate medications; the patient does not start an aspirin until after PCI. In this scenario, several short delays amount to a significant delay of about 2 hours before the patient reaches the cath lab. In addition, although aspirin is given on day 1, it is not done on arrival. Following PCI, the patient is transferred to the coronary care unit (CCU).
Scenario 2
Mary arrives at an institution with well‐defined, institution‐specific protocols for triage and transitions in care. The triage nurse recognizes the need for and obtains an ECG; the results are immediately reviewed with the ED physician. STEMI is diagnosed and the cath lab protocol is activated; the patient receives aspirin as part of a standing order. The hospitalist meets the patient in the ED within 5 minutes and begins the protocol for unfractionated heparin and preparation for immediate PCI, allowing the ED physician to return to ED care. Simultaneously, the interventional cardiologist and cath lab are mobilized and the patient is transferred within 15 minutes. Additional appropriate medications are begun. The door‐to‐balloon time is 60 minutes, well within recommended timeframes. Following PCI, the patient is transferred to the CCU.
Measuring Performance Relative to ACS
Two agencies promulgating quality measures for hospital inpatient care are The Joint Commission (TJC) and the CMS. TJC and CMS jointly established core measures for patients with acute myocardial infarction (AMI) and these are considered key indicators of quality, evidence‐based care. As outlined in Table 3, the TJC/CMS recommendations promote, unless contraindicated, a minimum standard of care for patients with AMI.9, 10 Public reporting of institutional core measure performance has led to an intense focus on improving these metrics.
| Core Measure | Sample Metric |
|---|---|
| |
| Aspirin at arrival | Percentage of patients receiving aspirin within 24 hours before or after hospital arrival |
| Aspirin at discharge | Percentage of patients prescribed aspirin at hospital discharge |
| ACE inhibitor or ARB for LVSD | Percentage of patients with LVSD prescribed an ACEI or ARB at hospital discharge |
| Beta blocker | Percentage of patients prescribed a beta blocker at hospital discharge |
| Fibrinolytic medication given within 30 minutes of hospital arrival | Median time to fibrinolysis |
| Percentage of patients given fibrinolytic medication within 30 minutes of hospital arrival | |
| PCI received within 90 minutes of hospital arrival | Median time to PCI |
| Percentage of patients receiving primary PCI within 90 minutes of hospital arrival | |
| Smoking cessation counseling | Percentage of patients with a history of smoking cigarettes who are counseled about smoking cessation during hospitalization |
On a national level, TJC documented performance improvement from 2002 to 2008 for each of the core measures. Compliance with smoking cessation counseling improved the most, rising from 67% to almost 99%. In 2008, a combined measure of all individual core measures indicated that, overall, care of heart attack patients is of high quality. Hospitals delivered evidenced‐based care in 96.7% of the opportunities they had to provide this care. Compliance related to oral medications was also good (95%); however, a closer look at other individual measures shows that improvement is needed to reduce the time to fibrinolysis (52.4% compliance rate for 30 minutes or less) and time to primary PCI (81.6% compliance rate for 90 minutes or less).11
Financial incentives are tied to QI measures including those from CMS. At present, this system is in the pay‐for‐reporting phase, in which institutions are penalized for not reporting quality metrics for the CMS core measures. It is likely that, to further incentivize institutions to meet quality benchmarks, this will be expanded to a pay‐for‐performance system (eg, differential payments for readmissions or different payment scales based on prior performance). Public disclosure of institutional performance relative to ACS and other medical conditions is available through the HHS.gov website (www.hospitalcompare.hhs.gov), which compares performance between hospitals and provides a clear business motivation for institutions to improve and provide high quality care.
Two other reporting systems should be noted. The CMS Physician Quality Reporting Initiative (PQRI) includes physician‐related quality measures specific to ACS12 that overlap with institution‐level CMS core measures with regard to prescribing ACS medications. Payments associated with the PQRI are currently a small financial factor for hospitalists, but will likely grow as quality initiatives develop overall. The Hospital Care Quality Information From the Consumer Perspective (HCAHPS) initiative, also from CMS, strives to capture patients' perspectives on hospital care through a standardized survey. The goals are to collect data that can be used to compare hospital performance, create an incentive for QI through public disclosure of results, and increase transparency regarding the quality of hospital care.13 However, the focus is not ACS‐specific. Patients are queried about communication with hospital staff, communication about medications, and information about discharge, all areas of concern for the hospitalist in general that have been identified as areas for improvement relative to ACS.
Case Study (cont)
Scenario 1 (cont)
Mary recuperates in the CCU and is transferred to the medical floor. The hospitalist and cardiologist see her separately on rounds and each assumes the other has a reason for not starting a beta blocker; therefore, a beta blocker is not prescribed. The nurse cannot tell who is in charge and does not anticipate the day of dischargeshe is just implementing the orders as they are written. The day of discharge arrives; the nurse learns from Mary that the hospitalist will discharge her that day. The hospitalist reviews the list of ACS medications and realizes that Mary still has not started a beta blocker. He cannot reach the cardiologist before Mary's ride home arrives, so he writes a note in the discharge summary alerting the primary care physician (PCP) to consider a beta blocker at follow‐up. Because of this lack of communication and systems for tracking the implementation of guideline‐recommended therapies, Mary is discharged without a CMS core measure medication, with no assurance that this will be addressed by the PCP.
Scenario 2 (cont)
Mary recuperates in the CCU and is transferred to the medical floor. Standard post‐PCI/STEMI orders are in place according to institutional protocol. The hospitalist is able to confirm that all interventions required at admission (aspirin, beta blocker, assessment of smoking status) have occurred by reviewing a well‐structured checklist that includes easy‐to‐read visual cues. The checklist indicates that Mary was counseled about smoking cessation on day 1 of her stay in the CCU. Mary and her physicians and nurses are all aware of the target discharge date and the milestones that must be met prior to discharge (eg, echocardiogram, medication review, education, assessment of mobility, etc). Mary is instructed about each new medication and given educational materials.14 Follow‐up appointments postdischarge are made, and the discharge summary is sent electronically to the PCP. These institution‐specific protocols enhance communication overall and help the hospital meet high standards of patient care.
Special QI Issues in ACS Management for the Hospitalist
Coordination is especially important for patients with ACS because their care is so complex. Seamless transitions promote safe care as the patient moves from the ED, cath lab, recovery unit, medical floor, and discharge through the transition to primary care. Poor communication between clinicians during these transitions may result in delayed or overlooked treatment and other medical errors. Implementing an institutional system of care may overcome communication barriers and help ensure the institution meets its quality benchmarks, such as the CMS core measures. Standard order sets and protocols identify the steps and components needed to manage ACS. At admission, these measures promote early assessment of patient risk, triage to early intervention, medication reconciliation, and communication between stakeholders such as the hospitalist, cardiologist, and the cath lab.15, 16 During hospitalization, they help assure ongoing risk assessment and early consideration of discharge planning, culminating in discharge and the transition back to primary care.
A recent guideline update8 focused attention on the coordination of care between institutions and the critical importance of rapid triage for patients who need primary PCI and transfer from a non‐PCI to a PCI‐capable institution. The decision to transfer rests on multiple factors and requires rapid decision making on the part of clinicians. Time to reperfusion is shown to have a direct effect on patient outcomes. Established protocols within a non‐PCI facility can support timely transfer to a PCI‐capable facility if indicated. Factors such as the patient's mortality risk, the risk of bleeding from fibrinolytic therapy, duration of symptoms, and the time for transport to a PCI facility all must be considered. It is recognized that a regional system of STEMI care best supports collaborative efforts between institutions and community resources that support QI efforts.
Transitions in care, and particularly discharge, are areas with identified gaps in quality care17, 18 for which improvement has been pursued on an institutional level. Project BOOST (Better Outcomes for Older Adults Through Safe Transitions) seeks to improve the care of patients during the transition from inpatient to outpatient care, and focuses on elderly patients identified to be at high‐risk for adverse events during this transition.19 The goal is to improve outcomes related to 30‐day readmission rates, patient satisfaction, communication between inpatient and outpatient providers, identification of high‐risk patients who need intervention to reduce risk, and patient education about their risk for an adverse event. BOOST addresses these outcomes at an institutional level by offering resources related to project management, data collection, tools for clinicians and patients, and participating mentor institutions. These resources help an institution assess its readiness for change, identify quality gaps, promote teamwork, and guide the implementation and subsequent evaluation of process improvements. Specific tools for clinicians also support institutional goals for teamwork and communication, creating an environment for safe transitions. Both BOOST19 and the adaptable Transitions Tool from the SHM20 provide a framework for understanding processes that involve multiple departments and stakeholders, breaking complex processes into discrete parts for which quality gaps can be identified and change instituted to improve care. A checklist can also be a useful tool for ensuring specific issues are addressed during transitions in care. SHM developed a checklist for hospitalist use that lists elements of a discharge summary for patients with ACS (Table 4).21
| |
| Diagnoses | Elaborate on details of MI such as location, complications |
| Comorbidities | List, including diabetes, lipids, hypertension, renal disease |
| Medications | Note medication reconciliation, reason for not prescribing core measure medications, titration of any medications |
| Specific medications to address include ACE/ARB inhibitors, aspirin, beta blockers, statin, sublingual NTG, clopidogrel (include duration of therapy) | |
| Procedures | Type of stent (bare‐metal stent, drug‐eluting stent) and stent location |
| Complications (hematoma, transfusion) | |
| If ECHO, note type, ejection fraction; provide copy of ECG | |
| Follow‐up appointment(s) | Primary care, cardiology, others such as cardiac rehabilitation |
| Follow‐up testing | ETT (type, timeframe); ECHO if indicated; laboratory assessments |
| Code status | |
| Activity | |
| Diet | |
| Wound care (eg, groin) | |
| Treatment course | Address cognitive level, discharge LDL, discharge creatinine, INR if on warfarin, LFTs if on statin |
| Copy all providers | |
Staff and patient education is also an area that can benefit from evaluation. Clinicians from multiple disciplines are stakeholders in QI and they should receive education about its purpose and goals. Usually institutions will have a QI methodology in place, and this should be conveyed to the members of the ACS team. Staff education about ACS should be tailored to each specialty, be institution‐specific, current, and comprehensive, and include methods for assessing the learner. Education should be easily available (eg, on the Internet or via an electronic format), interactive, case‐based, and mandatory. For patients, education should be available in languages other than English and identify community resources and opportunities for additional outpatient education. The value of any educational program should be assessed to measure learner participation, satisfaction, and comprehension.
Gathering metrics and generating objective evidence of change is critical to QI; quantifying improvement (or lack thereof) must be done to determine whether the changes implemented improve care and ultimately whether desired outcomes are met. Metrics should be meaningful, associated with standards of care (eg, CMS core measures), and carefully chosen to reflect current practice. CMS core measures are a good target for collecting metrics to assess an institution's performance relative to ACS (Table 3). The Specifications Manual for National and Hospital Inpatient Quality Measures10 from TJC and CMS identifies the data elements needed for reporting. Other metrics not specified as core measures are worthy of measurement because they are considered the standard of care for patients with ACS (Table 5). The metrics shown in Tables 3 and 5 assume that all patients are eligible for core‐measure or standard‐of‐care medications and procedures. Because some measures are contraindicated in some patients, it is more meaningful to measure the percentage of patients without a contraindication who receive the measure. If a measure is contraindicated, the patient's medical record must include supporting documentation indicating why a core measure was not met. To be objective and reduce bias regarding the effectiveness of QI measures, data collection is best done prospectively. If necessary, periodic assessments against performance measures (institutional, government, professional association) should be made to support timely intervention. Run charts can be particularly useful here, measuring change over time to identify trends or an intervention that supported, did not affect, or was a barrier to the desired change.
Case Study (cont)
Scenario 1 (cont)
Mary tells the hospitalist she felt the discharge process was rushed and confusing and that she was dissatisfied with her care overall. Recalling a recent review article on the process for public disclosure of patient ratings related to hospital stay, the hospitalist locates HospitalCompare.com on the Internet. He reviews results from patient satisfaction surveys that compare his institution with others in the geographic area and is surprised to discover that patients generally give his institution a poor rating as well as low marks for the quality of nursing and physicianpatient communication. He is interested in this information but is not aware of resources for further exploration.
Scenario 2 (cont)
At discharge, the hospitalist confirms with Mary that she has received smoking cessation counseling during her hospital stay; he documents this in her chart and discharge summary. The hospitalist was aware of this particular quality measure because the recent weekly score card of hospital performance, posted in the unit, reported that the hospital was not meeting its goal of 100% compliance for this CMS core measure. Among heart attack patients who were identified as smokers, only 80% of charts documented that the patient had been counseled about smoking cessation during the hospital stay. Mary says that she understands the importance of not smoking and says she will make an effort to stop.
| Standard of Care Measure | Sample Metric |
|---|---|
| |
| LDL‐cholesterol assessment | Percentage of patients who have LDL cholesterol measured during hospitalization |
| Lipid‐lowering therapy at discharge | Percentage of patients prescribed a statin at hospital discharge |
| Dietary consultation | Percentage of patients who receive a dietary consult during hospitalization |
| Time to receipt of high‐risk abnormal laboratory assessments | Median time to receipt of high‐risk laboratory results, eg, troponins |
| Cardiac risk assessment | Percentage of patients who receive a cardiac risk assessment during admission |
| Measurement of LVEF | Percentage of patients who receive a cardiac echocardiogram to measure of LVEF before discharge |
| Document communication with PCP | Percentage of patients whose communication with the PCP was documented at discharge |
| Completed medication reconciliation | Percentage of patients for whom medication reconciliation was documented by the time of discharge |
| Make 1‐week follow‐up appointment with PCP | Percentage of patients for whom a 1‐week follow‐up appointment with the PCP was documented at the time of discharge |
| Additional Measure | |
| Inpatient mortality | |
Conclusion
Each hospitalist can have an impact on ACS care systemwide. Hospitalists are on the front line of care and have a unique perspective on patients as they are transitioned through the hospital stay and on how an institution handles patient care overall. They experience firsthand the challenges presented by poor communication between providers, patients, and their families. They can offer breadth of experience and perspective when assessing processes linked to patient care and can be instrumental in ensuring each patient experiences safe transitions during the hospital stay. Hospitalists should participate in QI initiatives for ACS and should consider opportunities to take the lead on these initiatives within their institutions.
Acknowledgements
The author thanks Denise Erkkila, RPh for her editorial assistance in the preparation of this manuscript.
- Hospitalists and intensivists: partners in caring for the critically ill—the time has come.J Hosp Med.2010;5:1–3.
- Society of Hospital Medicine. Acute coronary syndrome.J Hosp Med.2006;1(suppl 1):2–3.
- Society of Hospital Medicine. Quality improvement.J Hosp Med.2006;1 (suppl):92.
- ,,, et al.Curriculum development: the venous thromboembolism quality improvement resource room.J Hosp Med.2006;1:124–132.
- ,,,,Society of Hospital Medicine Glycemic Control Task Force summary: practical recommendations for assessing the impact of glycemic control efforts.J Hosp Med.2008;3:66–75.
- ,,,Effects of a subcutaneous insulin protocol, clinical education, and computerized order set on the quality of inpatient management of hyperglycemia: results of a clinical trial.J Hosp Med.2009;4:16–27.
- SHM Acute Coronary Syndrome Advisory Board. A guide for effective quality improvement: improving acute coronary syndrome care for hospitalized patients. Available at: http://www.hospitalmedicine.org. 2010. Accessed July 2010.
- ,,, et al.2009focused updates: ACC/AHA guidelines for the management of patients with ST‐elevation myocardial infarction (updating the 2004 guideline and 2007 focused update) and ACC/AHA/SCAI guidelines on percutaneous coronary intervention (updating the 2005 guideline and 2007 focused update) a report of the American College of Cardiology Foundation/American Heart Association Task Force on Practice Guidelines.J Am Coll Cardiol.year="2009"2009;54:2205–2241.
- The Joint Commission. Performance measure intiatives. Available at: http://www.jointcommission.org/PerformanceMeasurement/PerformanceMeasurement/Acute+Myocardial+Infarction+Core+Measure+Set.htm. 2010. Accessed July 2010.
- The Joint Commission, Centers for Medicare and Medicare Services. Specifications manual for national hospital inpatient quality measures, version 2.5. Available at: http://www.jointcommission.org/PerformanceMeasurement/PerformanceMeasurement/Current+NHQM+Manual.htm. 2009 November 6. Accessed July 2010.
- The Joint Commission. Improving America's hospitals: The Joint Commission's annual report on quality and safety 2009. Available at: http://www.jointcommission.org/Library/annual_report.2009. Accessed July 2010.
- Centers for Medicare and Medicare Services. Physician quality reporting initiative (PQRI). Available at: http://www.cms.hhs.gov/pqri. 2010. Accessed July 2010.
- Hospital Care Quality Information from the Consumer Perspective. CAHPS hospital survey. Available at: http://www.hcahpsonline.org. 2010. Accessed July 2010.
- ,,,.Discharge education improves clinical outcomes in patients with chronic heart failure.Circulation.2005;111:179–185.
- ,,, et al.National efforts to improve door‐to‐balloon time results from the Door‐to‐Balloon Alliance.J Am Coll Cardiol.2009;54:2423–2429.
- ,,, et al.Sustaining improvement in door‐to‐balloon time over 4 years: the Mayo clinic ST‐elevation myocardial infarction protocol.Circ Cardiovasc Qual Outcomes.2009;2:508–513.
- ,,,Promoting effective transitions of care at hospital discharge: a review of key issues for hospitalists.J Hosp Med.2007;2:314–323.
- ,.Lost in transition: challenges and opportunities for improving the quality of transitional care.Ann Intern Med.2004;141:533–536.
- Society of Hospital Medicine. Boosting Care Transitions Resource Room. Available at: http://www.hospitalmedicine.org/ResourceRoomRedesign/RR_CareTransitions/CT_Home.cfm. 2010. Accessed July 2010.
- SHM ACS Transitions Workgroup. SHM ACS Transitions Tool. Available at: http://www.hospitalmedicine.org/ResourceRoomRedesign/RR_ACS/html_ACS/12ClinicalTools/05_Transitions.cfm. 2010. Accessed July 2010.
- ,,, et al.Transition of care for hospitalized elderly patients‐‐development of a discharge checklist for hospitalists.J Hosp Med.2006;1:354–360.
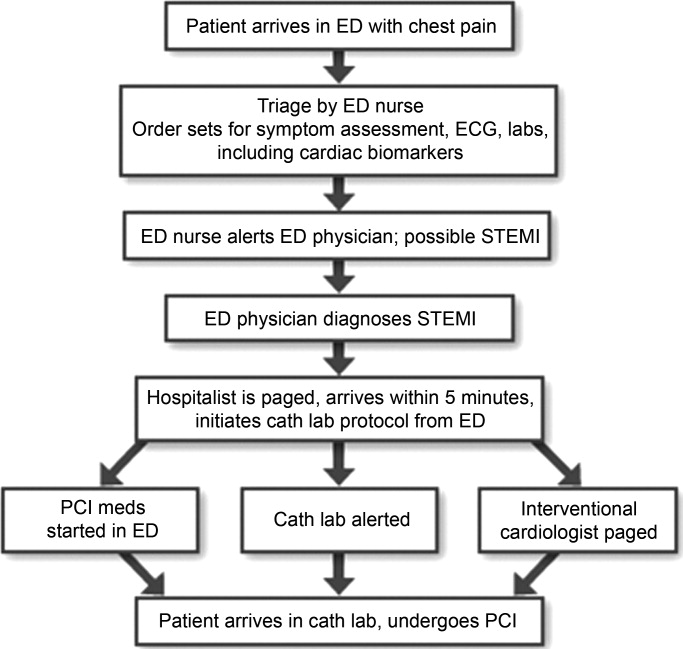
Care Coordination Under Comanagement
Technological advances drive medical providers to specialize through the need for proficiency around increasingly focused areas of expertise.1 But the benefits of specialization are attained only by balancing the advantages of increasing expertise and the costs of coordinating care that must be borne as specialization increases.2 Integrating experts into modern medical delivery systems requires attention to the coordinating mechanisms that govern team‐based care.3
Coordination, defined as the management of task interdependencies,4 is a central component and a useful measure of teamwork.5 Several studies demonstrate the patient‐level impact of coordination among providers.69 Gittell et al.8 demonstrated that orthopedic hospitals whose staff had better relational coordination (RC) measures had shorter lengths of stay and better post‐operative pain control for patients undergoing surgery. In medical intensive care units (ICUs), Wheelan et al.9 showed that staff members of units with lower mortality rates perceived their teams as functioning at higher stages of group development and perceived their team members as less dependent and more trusting.
Communication is the cornerstone of effective team coordination.10, 11 As such, practice model interventions that facilitate frequent communication of higher quality are associated with lower error rates10 and better teamwork.11 The use of hospitalists, for example, is shown to capitalize on this advantage by improving coordination through physician availability that facilitates communication and relational interactions among hospital‐based staff.12 While system‐level interventions such as this have received significant attention from experts in organizations, empirical studies that explore the contribution of team member characteristics to overall coordination are lacking.13
Inpatient comanagement services offer a unique model for studying teamwork. While the label is used to describe a variety of arrangements,1416 comanagement broadly describes a practice model wherein providers of various specialties deliver direct care to patients, in contrast to the traditional generalist‐consultant model in which specialists lend expertise.17 Many recent comanagement practices involve hospitalists in partnership with surgeons in the care of patients with concurrent medical and surgical needs,18 but similar arrangements between hospitalists and medical subspecialists are being adopted in some medical centers for the care of complex patients with conditions such as heart failure, cancer, stroke, and solid organ transplantations. Coordination among providers has not been studied in this context.
The goals of this study are: (1) to measure the input of individual providers to the overall coordination of care on a highly interdependent medical comanagement service, (2) to characterize high and low coordinators, and (3) to explore the relationship between coordination and patient outcomes. The main hypothesis is that the quality of team coordination is determined partly by the attributes of its members such that their individual contributions to the coordination of care affect the outcomes of vulnerable hospitalized patients.
Materials and Methods
Setting
The study was conducted at the University of Chicago Medical Center, Chicago, IL, an urban 572‐bed tertiary care hospital. The comanaged multidisciplinary inpatient service serves hospitalized patients with complex medical needs. This study focused on providers and patients from a subset of the comanaged multidisciplinary inpatient service that involved the collaboration of medical hepatologists with hospitalists. A hepatology team, composed of an attending hepatologist and a fellow, comanaged with 2 hospitalist teams, each composed of an attending hospitalist and 1 or 2 nonphysician providers (NPPs). Attending physicians rotated on the service in 1‐week to 3‐week rotations, while fellows rotated in 4‐week stretches. NPPs worked nonuniform 3‐day or 4‐day weeks excluding weekends and holidays. The hepatology team was responsible for arranging admissions, developing a care plan with a specialty focus, coordinating care with transplant surgeons when necessary, and managing post‐discharge care. The hospitalist teams were responsible for admitting patients, managing routine and emergent inpatient issues, coordinating care with ancillary and consultative staff, and discharging patients. Dedicated evening and night hospitalists, who were not part of the comanaging day‐time teams, provided after‐hours care. Outside of these areas, there was no instruction or education about how responsibilities should be shared among providers on the service.
Subjects and Study Design
Baseline Survey of Providers
All hospitalists, NPPs, hepatologists, and fellows scheduled to rotate on the comanaged multidisciplinary inpatient service signed a written consent to participate. In April 2008 a nonanonymous baseline 17‐item paper survey was administered.
Items of the Baseline Survey (supporting information Appendix A) were generated from a consideration of the most salient issues around the management structure of comanagement models from a comprehensive review the literature. Two items addressed the respondents' experience and intent to leave their role. Twelve items addressed their preferences about the provider management structure of an ideally comanaged inpatient service, specifically soliciting their preferences about a single physician leader, consensus seeking, and their preferred degree of information, participation, and decision making under the model. Included in this set of items was a single item assessment of the provider's sense of patient ownership on an ideally comanaged service. The final 3 items addressed the perceived assignment of responsibilities. Each of these items presented a clinical objective followed by up to 7 contingent tasks on whose completion the successful execution of the objective depended. Each respondent was asked to indicate one or more of the 4 provider types that should be responsible for completing each task.
Repeated Survey of Providers
From April to October 2008, providers who rotated on the comanaged liver service were surveyed repeatedly to give information about the actual management structure and coordination within teams, which consisted of combinations of randomly assigned providers. Physicians were surveyed on the day when any 1 of the 3 physician types ended his or her rotation. NPPs were surveyed every Wednesday except on the weeks when none of the physicians had changed since the previous survey. One investigator (KH) hand‐delivered the surveys, usually during the first minutes of the joint daily rounds and collected them immediately upon completion. Surveys that could not be completed immediately were collected on daily rounds on subsequent days within 1 week. The primary reason for nonresponse was lost surveys that were not immediately completed.
The 14‐item Repeated Survey (supporting information Appendix B) consisted of 2 parts. The first 7 items reprised items from the Baseline Survey that addressed management structures, but were rephrased to allow respondents to report their experiences on their immediate rotation. The second part of the Repeated Survey addressed RC, which is described below.
The study protocols, consents, and data collection mechanisms were approved by the institutional review board of the University of Chicago Medical Center. Collection of patient information was designed to comply with the Health Insurance Portability and Accountability Act of 1996.
Patients
Patients were admitted to 1 of the 2 hospitalist teams on the comanaged service on alternating days, which allowed patients to be assigned to providers pseudo‐randomly. Consent to use clinical data was obtained during their stay or by telephone after discharge. If patients were unable to provide consent due to cognitive impairment, consent was sought through designated proxies.19
Main Measurements
Relational Care Coordination
The survey instrument used to measure individual contributions to overall coordination was adapted from the Relational Coordination tool developed by Gittell.20 This instrument was chosen because it has already been validated in various clinical contexts8, 12, 21 and the theoretical assumptions about the independent relational and communication components of coordination are applicable to our context. RC is characterized by the 7 domains of frequent, timely, accurate, and problem‐solving communications; shared goals, shared knowledge, and mutual respect. Respondents rated, on a 5‐point scale (1 = negative, 5 = positive), team members of the other 3 provider types during each rotation on all of the 7 domains. The mean across the domains yielded the RC score. Although the instrument was originally developed to measure the coordination in groups of individuals, the RC for a single provider was calculated by taking the mean of all the RC directed at that individual across team members who worked with him or her during the study period. Because some providers worked more rotations than others, a nonuniform number of observations contributed to the calculation of individual RC (Table 1). For each provider type, individuals were ranked on their RC and categorized in tertiles representing high, middle, and low coordinators.
| Baseline Survey (%) | Repeated Surveys (%) | % Female | Years Experience Median (range) | # RC Evaluations of Each Provider Median (range) | RC Mean (range) | |
|---|---|---|---|---|---|---|
| ||||||
| Hospitalists | 15/15 (100) | 36/43 (84) | 42 | 1 (0‐10) | 6 (3‐21) | 4.71 (4.33‐4.94) |
| NPPs | 5/5 (100) | 92/97 (95) | 100 | 4 (2‐15) | 30 (23‐34) | 4.60 (4.48‐4.71) |
| Hepatologists | 6/6 (100) | 26/42 (62) | 33 | 7 (1‐25) | 16 (5‐51) | 4.37 (4.03‐4.59) |
| GI fellows | 6/6 (100) | 23/42 (55) | 48 | 1 (0‐1) | 19 (8‐37) | 4.28 (3.88‐4.53) |
| Total | 32/32 (100) | 177/223 (79) | 55 | 2 (0‐25) | 12.5 (3‐51) | 4.57 (3.88‐4.94) |
Statistical Analysis
The discriminating ability of the RC for individuals was assessed by comparing the highest and lowest RC of each provider type using the 2‐tailed t‐test. The difference in responses to items from the Baseline and Repeated Surveys by individual RC tertiles was assessed with the Chi‐squared test for categorical data and the 2‐tailed t‐test for comparing means. For each physician type, the frequency of the composite bad outcomes between the highest and lowest RC tertile categories were compared using a 2‐sample Wilcoxon rank‐sum (Mann‐Whitney) test for nonparametric data.
Results
All 32 providers (100%) completed the Baseline Survey and participated in the Repeated Surveys of which 177/224 (79%) were completed. The median number of surveys that contributed to the calculation of individual RC and the mean RC by provider type are summarized in Table 1.
Of the 119 patients managed on the service, the mean age (standard deviation [SD]) was 55 (14) years and 48% were women. Of the 201 hospitalizations, there were 13 floor‐to‐ICU transfers and 5 in‐hospital deaths, however, we excluded from the analysis 1 death of a patient who was admitted under inpatient hospice status.
RC Measures
Individual provider RC ranges were 4.33 to 4.94 (p = 0.05) for hospitalists; 4.48 to 4.71 (p = 0.10) for NP/PAs; 4.03 to 4.59 (p < 0.01) for hepatologists; and 3.88 to 4.52 (p = 0.02) for fellows. The high, middle, and low coordinator categories for each provider type were shown to be durable through time by demonstrating that the coordination ranking of individuals was essentially preserved even when using partial data from each half of the study period. Thus, RC appears to reflect a stable attribute of the provider as opposed to specific circumstances of the rotation. The categories were shown to be durable to the influences of bad outcomes (inpatient deaths and ICU transfers) by demonstrating that the placement of individuals into 1 of the 3 coordination categories were preserved even when data from rotations involving a bad outcome were removed. Nonetheless, in order to address the possibility of bad outcomes negatively affecting perception of coordination, all analysis involving RC used the values that excluded data from these rotations.
Characteristics of Good and Poor Coordinators
Patient Ownership
The single‐item measure of patient ownership in the Baseline Survey reads: I have as much a sense of ownership of my patients on the comanaged service as on a non‐comanaged service. The majority of providers of every type in the high and middle coordinator categories agreed, while providers in the low coordinator category generally disagreed with the statement. The aggregated responses of all the provider types are shown in Table 2.
| Agree | Somewhat Agree | Somewhat Disagree | Disagree | |
|---|---|---|---|---|
| High | 4 | 6 | 0 | 1 |
| Middle | 5 | 4 | 0 | 2 |
| Low | 2 | 0 | 4 | 4 |
| p < 0.01 |
Leadership
Hepatologists are the potential leader of the comanaged team because of their content expertise in liver diseases. Their responses to the 3 items in the Baseline Survey that addressed perceived assignment of responsibilities are shown in Table 3. The high compared to the low coordinator hepatologists delegated the responsibility of completing necessary tasks to more providers, overall, such that an average of 3 providers were redundantly held responsible for the completion of each task by the high coordinators while only 1 provider was held responsible by the low coordinators. Furthermore, the high coordinators delegated the responsibility of completing more tasks to themselves compared to the low coordinators.
| Hepatologists | Mean # of Tasks Delegated Overall, n (SD) | Mean # of Providers Delegated to Each Task, n (SD) | Mean # of Tasks Delegated to Self, n (SD) |
|---|---|---|---|
| |||
| High (n = 2) | 56 (0.0) | 2.9 (0.0) | 11.5 (2.1) |
| Middle (n = 2) | 35 (2.8) | 1.8 (0.2) | 9.5 (3.5) |
| Low (n = 2) | 19 (1.4) | 1.0 (0.1) | 4.5 (2.1) |
| p value(high vs. low) | <0.01 | <0.01 | 0.08 |
According to responses to the management structure items of the Repeated Surveys, more providers of every type indicated that a single physician leader directed the overall management of every patient when a high or middle coordinator hospitalist was on service as opposed to a service with a low coordinator hospitalist (high 76% vs. middle 73% vs. low 58%, P = 0.06). Furthermore, a low coordinator hospitalist on service was more likely to indicate a desire for greater influence in directing the management of patients (desire influence 93% vs. not 7%, P < 0.01). This pattern was also seen with low coordinator NPPs, who more often indicated a desire for greater influence in directing patient management (desire influence 100% vs. not 0%, P < 0.01).
Experience
Age, years in practice, years at the institution, and time spent on the comanaged service were not associated with RC in our small sample of providers.
Outcomes by Provider Coordination
The unit of analysis in this section is the team‐patient encounter, which is the consecutive days during which a unique assortment of physicians managed a patient's hospitalization. NPPs could not be associated with any single team due to their nonuniform work patterns. The 201 hospitalizations in this study were composed of 351 team‐patient encounters. Table 4 displays the unadjusted frequency of inpatient deaths and ICU transfers that occurred during these encounters by RC tertiles. In each of the 3 physician types, composite bad outcomes are most frequent among the lowest coordinators. The pattern is statistically significant for hospitalists.
| Team‐Patient Encounters, n | Mean Length of Encounter, n (days) | ICU Transfer, n (%) | Hospital Death, n (%) | Bad Outcome, n (%) | |
|---|---|---|---|---|---|
| |||||
| Hospitalists | |||||
| High (n = 5) | 92 | 3.1 | 1 (1.1) | 1 (1.1) | 1 (1.1) |
| Middle (n = 5) | 119 | 3.2 | 1 (0.8) | 1 (0.8) | 1 (0.8) |
| Low (n = 5) | 140 | 3.2 | 11 (7.9) | 2 (1.4) | 12 (8.6) |
| p value (high vs. low) | NA | 0.70 | 0.02 | 0.82 | 0.02 |
| Hepatologists | |||||
| High (n = 2) | 99 | 3.2 | (2.0) | 0 (0.0) | 2 (2.0) |
| Middle (n = 2) | 79 | 3.4 | 3 (3.0) | 1 (1.3) | 3 (3.0) |
| Low (n = 2) | 173 | 3.0 | 8 (4.6) | 3 (1.7) | 9 (5.2) |
| p value (high vs. low) | NA | 0.52 | 0.27 | 0.19 | 0.20 |
| GI fellows | |||||
| High (n = 2) | 111 | 3.1 | 2 (1.8) | 0 (0.0) | 2 (1.8) |
| Middle (n = 2) | 67 | 3.3 | 2 (3.0) | 1 (1.5) | 2 (3.0) |
| Low (n = 2) | 173 | 3.2 | 9 (5.2) | 3 (1.7) | 10 (5.8) |
| p value (high vs. low) | NA | 0.74 | 0.15 | 0.16 | 0.10 |
Another interesting observation is the largest number of encounters in the lowest coordination tertile of each physician type. While the reason for this finding is not clear, associations between work‐load and poor coordination evoke issues related to burnout. In order to address the possibility of an artifactually elevated probability of a bad outcome among providers who rotated through the service more often, we calculated the correlation between the number of encounter‐days and the frequency of bad outcomes for the 15 providers who were associated with at last one such event. If these events occurred by chance, we should find a positive correlation between its frequency and the number of encounters. The Pearson's correlation coefficient of 0.38 suggests that bad outcomes do not occur more frequently with providers who work more rotations by chance alone.
Discussion
By adapting Gittell's RC instrument to focus on individual providers, we found that their characteristic attributes such as preference for particular management styles, leadership quality, and patient ownership are associated with their externally perceived contributions to the overall coordination of care. In an unadjusted analysis, we also observed an intriguing trend towards more frequent major hospital complications when the worst coordinators of each physician type were on service.
Existing evidence22, 23 mostly summarized in a recent RAND Health report shows a weak association between clinical teamwork quality and patient mortality. While our data also support this association, it does so with limitations. Most importantly, the small sample size limited our ability to rigorously account for potential confounders that may have contributed to this apparent association. Further studies may better address whether or not bad outcomes are indeed associated with poor coordinators in highly interdependent clinical teams. In addition to confounding, the small sample size of providers makes the analysis vulnerable to type 1 errors. We addressed this issue by intensively surveying providers repeatedly to achieve a high resolution of the coordination and management structure measures from each comanaged team. The potential for omitted variables and reverse causality in that the coordination scores may be negatively influenced by particularly complex patients and bad outcomes remains a valid concern. We addressed this by confirming the stability of provider RC over time and excluding the RC data from rotations with a bad outcome, but the negative perception of an individual tied to past bad outcomes may persist beyond a particular rotation. Survey responses are subject to recall and hindsight biases, which we attempted to minimize by surveying respondents immediately after each team rotation. Finally, all of our findings may be not be generalizable to other comanagement settings. However, the important correlations between coordination and quality have been observed in other contexts.24, 25
In our study, in‐hospital deaths and ICU transfers are treated as consequences of uncoordinated care. This interpretation may be problematic for circumstances when death is inevitable no matter how well coordinated the care, or when transfer to a higher level of care is appropriate. The rationale for grouping the 2 events into 1 composite bad outcome is based on the assumption that both death and the escalation of care can be delayed to an extent, if not wholly prevented, with the coordinated utilization of a modern hospital's resources. The attribution of these events to poor coordinators may indicate the unraveling of coordination that normally must be maintained to help patients overcome decompensating events that are particularly common in the course of patients with severe liver diseases. Due to the exploratory nature of this analysis, additional studies are necessary to fully characterize the relationship between care coordination and care transfers.
An important implication of this study is that the communication skill and ethical disposition of each individual provider is relevant to the coordination that is sought in multi‐provider teams. Training medical professionals to be better team members may have direct impact on the patients they serve. Our finding about patient ownership suggests that commitment to patients in the framework of care is not merely tradition but a characteristic of competent physicians. Moreover, physicians' commitment to patients is a possible factor, not just in achieving patients' satisfaction, but in securing better outcomes. To that end, the teaching of this and other humanistic principles must remain a vital part of medical education at all levels of training.
Several implications about team leadership and hierarchy are apparent from the data. Findings around the perceived assignment of responsibilities show that high coordinator hepatologists acknowledge the advantages of overlapping task boundaries to prevent critical tasks from being missed and risking bad outcomes. High RC hepatologists in our study adopted a more participatory than supervisory role which presumably facilitated better coordination by transmitting organizational goals to other team members. The function of a comanaged team is likely to be enhanced by a fluid assignment of roles to better handle tasks with high uncertainty. Accordingly, comanagement models of care may not be appropriate in settings where tasks are not interdependent.26 Inherent hierarchy appears to be a feature of well coordinated teams. One possible interpretation of our data is that hospitalists who yield the leadership role to the hepatologist are perceived to be better coordinators and that those who insist on exerting more influence in team decisions are perceived to be poor coordinators.
Existing evidence around care coordination predicts that comanagement designs improve provider coordination through stage‐based and site‐based specialization.12 However, the mechanisms that mediate coordination and patient outcomes are not clear. Moreover, the mechanisms of coordinating multi‐disciplinary teams may be specific to each clinical setting. The role of individual provider characteristics on coordination deserves more attention. Similarly, the impact of organizational culture under which favorable provider characteristics thrive is unknown. Finally, a detailed exposition of patient ownership and the role patients play in affecting the coordination of healthcare resources needs further exploration.
- .Technology, specialization, and the allied health professions.J Allied Health.1983;12(3):177–182.
- .Hospitalists and the doctor‐patient relationship.J Legal Stud.2001;30:589–606.
- .From Chaos to Care: The Promise of Team‐Based medicine.Cambridge, MA:Perseus;2002.
- ,,.Determinants of coordination modes within organizations.Am Sociol Rev.1976;41:322–338.
- .Teamwork and patient safety in dynamic domains of healthcare: a review of the literature.Acta Anaesthesiol Scand.2009;53(2):143–151.
- ,,,,.The association between interdisciplinary collaboration and patient outcomes in a medical intensive care unit.Heart Lung.1992;21:18–24.
- ,,, et al.Patterns of coordination and clinical outcomes: a study of surgical services.Health Serv Res.1998;22:1211–1236.
- ,,, et al.Impact of relational coordination on quality of care, postoperative pain and functioning, and length of stay: a nine‐hospital study of surgical patients.Med Care.2000;38(8):807–819.
- ,,.The link between teamwork and patients' outcomes in intensive care units.Am J Crit Care.2003;12(6):527–534.
- ,,.Assessing system failures in operating rooms and intensive care units.Qual Saf health Care.2007;16:45–50.
- ,,, et al.Patient handover from surgery to intensive care: using Formula 1 pit‐stop and aviation models to improve safety and quality.Paediatr Anaesth.2007;17(5):470–478.
- ,,,.Is the doctor in? A relational approach to job design and the coordination of work.Hum Resour Manage.2008;47(4):729–755.
- ,,,.Developing a team performance framework for the intensive care unit.Crit Care Med.2009;37(5):1787–1793.
- ,,, et al.Medical and surgical comanagement after elective hip and knee arthroplasty: a randomized, controlled trial.Ann Intern Med.2004;141(1):28–38.
- ,,.Medical/psychiatric comanagement by nurse practitioners in chronic hepatitis C treatment: a case study.Arch Psychiatr Nurs.2007;21(2):87–90.
- ,.Perioperative medicine for the hospitalized patient.Med Clin North Am.2008;92(2):325–348.
- .The place and training of the general practitioner.Calif Med.1949;70(4):265–268.
- ,.Surgical comanagement: a natural evolution of hospitalist practice.J Hosp Med.2008;3(5):394–397.
- ,,,.Validation of a telephone version of the mini‐mental state examination.J Am Geriatr Soc.1992;40(7):697–702.
- .Organizing work to support relational co‐ordination.Int J of Human Resource Management.2000;11(3):517–539.
- ,,,,.Beyond our walls: impact of patient and provider coordination across the continuum on outcomes for surgical patients.Health Serv Res.2007;42:7–24.
- ,,,,.The effect of multidisciplinary care teams on intensive care unit mortality.Arch Intern Med.2010;170(4):369–376.
- ,,,.Outcome measures for effective teamwork in inpatient care: final report.Santa Monica:RAND Health;2008.
- ,,, et al.The performance of intensive care units: does good management make a difference?Med Care.1994;32(5):508–525.
- ,,,.Observational assessment of surgical teamwork: a feasibility study.World J Surg.2006;30(10):1774–1783.
- .Just because you can, doesn't mean that you should: A call for the rational application of hospitalist comanagement.J Hosp Med.2008;3(5):398–3402.
Technological advances drive medical providers to specialize through the need for proficiency around increasingly focused areas of expertise.1 But the benefits of specialization are attained only by balancing the advantages of increasing expertise and the costs of coordinating care that must be borne as specialization increases.2 Integrating experts into modern medical delivery systems requires attention to the coordinating mechanisms that govern team‐based care.3
Coordination, defined as the management of task interdependencies,4 is a central component and a useful measure of teamwork.5 Several studies demonstrate the patient‐level impact of coordination among providers.69 Gittell et al.8 demonstrated that orthopedic hospitals whose staff had better relational coordination (RC) measures had shorter lengths of stay and better post‐operative pain control for patients undergoing surgery. In medical intensive care units (ICUs), Wheelan et al.9 showed that staff members of units with lower mortality rates perceived their teams as functioning at higher stages of group development and perceived their team members as less dependent and more trusting.
Communication is the cornerstone of effective team coordination.10, 11 As such, practice model interventions that facilitate frequent communication of higher quality are associated with lower error rates10 and better teamwork.11 The use of hospitalists, for example, is shown to capitalize on this advantage by improving coordination through physician availability that facilitates communication and relational interactions among hospital‐based staff.12 While system‐level interventions such as this have received significant attention from experts in organizations, empirical studies that explore the contribution of team member characteristics to overall coordination are lacking.13
Inpatient comanagement services offer a unique model for studying teamwork. While the label is used to describe a variety of arrangements,1416 comanagement broadly describes a practice model wherein providers of various specialties deliver direct care to patients, in contrast to the traditional generalist‐consultant model in which specialists lend expertise.17 Many recent comanagement practices involve hospitalists in partnership with surgeons in the care of patients with concurrent medical and surgical needs,18 but similar arrangements between hospitalists and medical subspecialists are being adopted in some medical centers for the care of complex patients with conditions such as heart failure, cancer, stroke, and solid organ transplantations. Coordination among providers has not been studied in this context.
The goals of this study are: (1) to measure the input of individual providers to the overall coordination of care on a highly interdependent medical comanagement service, (2) to characterize high and low coordinators, and (3) to explore the relationship between coordination and patient outcomes. The main hypothesis is that the quality of team coordination is determined partly by the attributes of its members such that their individual contributions to the coordination of care affect the outcomes of vulnerable hospitalized patients.
Materials and Methods
Setting
The study was conducted at the University of Chicago Medical Center, Chicago, IL, an urban 572‐bed tertiary care hospital. The comanaged multidisciplinary inpatient service serves hospitalized patients with complex medical needs. This study focused on providers and patients from a subset of the comanaged multidisciplinary inpatient service that involved the collaboration of medical hepatologists with hospitalists. A hepatology team, composed of an attending hepatologist and a fellow, comanaged with 2 hospitalist teams, each composed of an attending hospitalist and 1 or 2 nonphysician providers (NPPs). Attending physicians rotated on the service in 1‐week to 3‐week rotations, while fellows rotated in 4‐week stretches. NPPs worked nonuniform 3‐day or 4‐day weeks excluding weekends and holidays. The hepatology team was responsible for arranging admissions, developing a care plan with a specialty focus, coordinating care with transplant surgeons when necessary, and managing post‐discharge care. The hospitalist teams were responsible for admitting patients, managing routine and emergent inpatient issues, coordinating care with ancillary and consultative staff, and discharging patients. Dedicated evening and night hospitalists, who were not part of the comanaging day‐time teams, provided after‐hours care. Outside of these areas, there was no instruction or education about how responsibilities should be shared among providers on the service.
Subjects and Study Design
Baseline Survey of Providers
All hospitalists, NPPs, hepatologists, and fellows scheduled to rotate on the comanaged multidisciplinary inpatient service signed a written consent to participate. In April 2008 a nonanonymous baseline 17‐item paper survey was administered.
Items of the Baseline Survey (supporting information Appendix A) were generated from a consideration of the most salient issues around the management structure of comanagement models from a comprehensive review the literature. Two items addressed the respondents' experience and intent to leave their role. Twelve items addressed their preferences about the provider management structure of an ideally comanaged inpatient service, specifically soliciting their preferences about a single physician leader, consensus seeking, and their preferred degree of information, participation, and decision making under the model. Included in this set of items was a single item assessment of the provider's sense of patient ownership on an ideally comanaged service. The final 3 items addressed the perceived assignment of responsibilities. Each of these items presented a clinical objective followed by up to 7 contingent tasks on whose completion the successful execution of the objective depended. Each respondent was asked to indicate one or more of the 4 provider types that should be responsible for completing each task.
Repeated Survey of Providers
From April to October 2008, providers who rotated on the comanaged liver service were surveyed repeatedly to give information about the actual management structure and coordination within teams, which consisted of combinations of randomly assigned providers. Physicians were surveyed on the day when any 1 of the 3 physician types ended his or her rotation. NPPs were surveyed every Wednesday except on the weeks when none of the physicians had changed since the previous survey. One investigator (KH) hand‐delivered the surveys, usually during the first minutes of the joint daily rounds and collected them immediately upon completion. Surveys that could not be completed immediately were collected on daily rounds on subsequent days within 1 week. The primary reason for nonresponse was lost surveys that were not immediately completed.
The 14‐item Repeated Survey (supporting information Appendix B) consisted of 2 parts. The first 7 items reprised items from the Baseline Survey that addressed management structures, but were rephrased to allow respondents to report their experiences on their immediate rotation. The second part of the Repeated Survey addressed RC, which is described below.
The study protocols, consents, and data collection mechanisms were approved by the institutional review board of the University of Chicago Medical Center. Collection of patient information was designed to comply with the Health Insurance Portability and Accountability Act of 1996.
Patients
Patients were admitted to 1 of the 2 hospitalist teams on the comanaged service on alternating days, which allowed patients to be assigned to providers pseudo‐randomly. Consent to use clinical data was obtained during their stay or by telephone after discharge. If patients were unable to provide consent due to cognitive impairment, consent was sought through designated proxies.19
Main Measurements
Relational Care Coordination
The survey instrument used to measure individual contributions to overall coordination was adapted from the Relational Coordination tool developed by Gittell.20 This instrument was chosen because it has already been validated in various clinical contexts8, 12, 21 and the theoretical assumptions about the independent relational and communication components of coordination are applicable to our context. RC is characterized by the 7 domains of frequent, timely, accurate, and problem‐solving communications; shared goals, shared knowledge, and mutual respect. Respondents rated, on a 5‐point scale (1 = negative, 5 = positive), team members of the other 3 provider types during each rotation on all of the 7 domains. The mean across the domains yielded the RC score. Although the instrument was originally developed to measure the coordination in groups of individuals, the RC for a single provider was calculated by taking the mean of all the RC directed at that individual across team members who worked with him or her during the study period. Because some providers worked more rotations than others, a nonuniform number of observations contributed to the calculation of individual RC (Table 1). For each provider type, individuals were ranked on their RC and categorized in tertiles representing high, middle, and low coordinators.
| Baseline Survey (%) | Repeated Surveys (%) | % Female | Years Experience Median (range) | # RC Evaluations of Each Provider Median (range) | RC Mean (range) | |
|---|---|---|---|---|---|---|
| ||||||
| Hospitalists | 15/15 (100) | 36/43 (84) | 42 | 1 (0‐10) | 6 (3‐21) | 4.71 (4.33‐4.94) |
| NPPs | 5/5 (100) | 92/97 (95) | 100 | 4 (2‐15) | 30 (23‐34) | 4.60 (4.48‐4.71) |
| Hepatologists | 6/6 (100) | 26/42 (62) | 33 | 7 (1‐25) | 16 (5‐51) | 4.37 (4.03‐4.59) |
| GI fellows | 6/6 (100) | 23/42 (55) | 48 | 1 (0‐1) | 19 (8‐37) | 4.28 (3.88‐4.53) |
| Total | 32/32 (100) | 177/223 (79) | 55 | 2 (0‐25) | 12.5 (3‐51) | 4.57 (3.88‐4.94) |
Statistical Analysis
The discriminating ability of the RC for individuals was assessed by comparing the highest and lowest RC of each provider type using the 2‐tailed t‐test. The difference in responses to items from the Baseline and Repeated Surveys by individual RC tertiles was assessed with the Chi‐squared test for categorical data and the 2‐tailed t‐test for comparing means. For each physician type, the frequency of the composite bad outcomes between the highest and lowest RC tertile categories were compared using a 2‐sample Wilcoxon rank‐sum (Mann‐Whitney) test for nonparametric data.
Results
All 32 providers (100%) completed the Baseline Survey and participated in the Repeated Surveys of which 177/224 (79%) were completed. The median number of surveys that contributed to the calculation of individual RC and the mean RC by provider type are summarized in Table 1.
Of the 119 patients managed on the service, the mean age (standard deviation [SD]) was 55 (14) years and 48% were women. Of the 201 hospitalizations, there were 13 floor‐to‐ICU transfers and 5 in‐hospital deaths, however, we excluded from the analysis 1 death of a patient who was admitted under inpatient hospice status.
RC Measures
Individual provider RC ranges were 4.33 to 4.94 (p = 0.05) for hospitalists; 4.48 to 4.71 (p = 0.10) for NP/PAs; 4.03 to 4.59 (p < 0.01) for hepatologists; and 3.88 to 4.52 (p = 0.02) for fellows. The high, middle, and low coordinator categories for each provider type were shown to be durable through time by demonstrating that the coordination ranking of individuals was essentially preserved even when using partial data from each half of the study period. Thus, RC appears to reflect a stable attribute of the provider as opposed to specific circumstances of the rotation. The categories were shown to be durable to the influences of bad outcomes (inpatient deaths and ICU transfers) by demonstrating that the placement of individuals into 1 of the 3 coordination categories were preserved even when data from rotations involving a bad outcome were removed. Nonetheless, in order to address the possibility of bad outcomes negatively affecting perception of coordination, all analysis involving RC used the values that excluded data from these rotations.
Characteristics of Good and Poor Coordinators
Patient Ownership
The single‐item measure of patient ownership in the Baseline Survey reads: I have as much a sense of ownership of my patients on the comanaged service as on a non‐comanaged service. The majority of providers of every type in the high and middle coordinator categories agreed, while providers in the low coordinator category generally disagreed with the statement. The aggregated responses of all the provider types are shown in Table 2.
| Agree | Somewhat Agree | Somewhat Disagree | Disagree | |
|---|---|---|---|---|
| High | 4 | 6 | 0 | 1 |
| Middle | 5 | 4 | 0 | 2 |
| Low | 2 | 0 | 4 | 4 |
| p < 0.01 |
Leadership
Hepatologists are the potential leader of the comanaged team because of their content expertise in liver diseases. Their responses to the 3 items in the Baseline Survey that addressed perceived assignment of responsibilities are shown in Table 3. The high compared to the low coordinator hepatologists delegated the responsibility of completing necessary tasks to more providers, overall, such that an average of 3 providers were redundantly held responsible for the completion of each task by the high coordinators while only 1 provider was held responsible by the low coordinators. Furthermore, the high coordinators delegated the responsibility of completing more tasks to themselves compared to the low coordinators.
| Hepatologists | Mean # of Tasks Delegated Overall, n (SD) | Mean # of Providers Delegated to Each Task, n (SD) | Mean # of Tasks Delegated to Self, n (SD) |
|---|---|---|---|
| |||
| High (n = 2) | 56 (0.0) | 2.9 (0.0) | 11.5 (2.1) |
| Middle (n = 2) | 35 (2.8) | 1.8 (0.2) | 9.5 (3.5) |
| Low (n = 2) | 19 (1.4) | 1.0 (0.1) | 4.5 (2.1) |
| p value(high vs. low) | <0.01 | <0.01 | 0.08 |
According to responses to the management structure items of the Repeated Surveys, more providers of every type indicated that a single physician leader directed the overall management of every patient when a high or middle coordinator hospitalist was on service as opposed to a service with a low coordinator hospitalist (high 76% vs. middle 73% vs. low 58%, P = 0.06). Furthermore, a low coordinator hospitalist on service was more likely to indicate a desire for greater influence in directing the management of patients (desire influence 93% vs. not 7%, P < 0.01). This pattern was also seen with low coordinator NPPs, who more often indicated a desire for greater influence in directing patient management (desire influence 100% vs. not 0%, P < 0.01).
Experience
Age, years in practice, years at the institution, and time spent on the comanaged service were not associated with RC in our small sample of providers.
Outcomes by Provider Coordination
The unit of analysis in this section is the team‐patient encounter, which is the consecutive days during which a unique assortment of physicians managed a patient's hospitalization. NPPs could not be associated with any single team due to their nonuniform work patterns. The 201 hospitalizations in this study were composed of 351 team‐patient encounters. Table 4 displays the unadjusted frequency of inpatient deaths and ICU transfers that occurred during these encounters by RC tertiles. In each of the 3 physician types, composite bad outcomes are most frequent among the lowest coordinators. The pattern is statistically significant for hospitalists.
| Team‐Patient Encounters, n | Mean Length of Encounter, n (days) | ICU Transfer, n (%) | Hospital Death, n (%) | Bad Outcome, n (%) | |
|---|---|---|---|---|---|
| |||||
| Hospitalists | |||||
| High (n = 5) | 92 | 3.1 | 1 (1.1) | 1 (1.1) | 1 (1.1) |
| Middle (n = 5) | 119 | 3.2 | 1 (0.8) | 1 (0.8) | 1 (0.8) |
| Low (n = 5) | 140 | 3.2 | 11 (7.9) | 2 (1.4) | 12 (8.6) |
| p value (high vs. low) | NA | 0.70 | 0.02 | 0.82 | 0.02 |
| Hepatologists | |||||
| High (n = 2) | 99 | 3.2 | (2.0) | 0 (0.0) | 2 (2.0) |
| Middle (n = 2) | 79 | 3.4 | 3 (3.0) | 1 (1.3) | 3 (3.0) |
| Low (n = 2) | 173 | 3.0 | 8 (4.6) | 3 (1.7) | 9 (5.2) |
| p value (high vs. low) | NA | 0.52 | 0.27 | 0.19 | 0.20 |
| GI fellows | |||||
| High (n = 2) | 111 | 3.1 | 2 (1.8) | 0 (0.0) | 2 (1.8) |
| Middle (n = 2) | 67 | 3.3 | 2 (3.0) | 1 (1.5) | 2 (3.0) |
| Low (n = 2) | 173 | 3.2 | 9 (5.2) | 3 (1.7) | 10 (5.8) |
| p value (high vs. low) | NA | 0.74 | 0.15 | 0.16 | 0.10 |
Another interesting observation is the largest number of encounters in the lowest coordination tertile of each physician type. While the reason for this finding is not clear, associations between work‐load and poor coordination evoke issues related to burnout. In order to address the possibility of an artifactually elevated probability of a bad outcome among providers who rotated through the service more often, we calculated the correlation between the number of encounter‐days and the frequency of bad outcomes for the 15 providers who were associated with at last one such event. If these events occurred by chance, we should find a positive correlation between its frequency and the number of encounters. The Pearson's correlation coefficient of 0.38 suggests that bad outcomes do not occur more frequently with providers who work more rotations by chance alone.
Discussion
By adapting Gittell's RC instrument to focus on individual providers, we found that their characteristic attributes such as preference for particular management styles, leadership quality, and patient ownership are associated with their externally perceived contributions to the overall coordination of care. In an unadjusted analysis, we also observed an intriguing trend towards more frequent major hospital complications when the worst coordinators of each physician type were on service.
Existing evidence22, 23 mostly summarized in a recent RAND Health report shows a weak association between clinical teamwork quality and patient mortality. While our data also support this association, it does so with limitations. Most importantly, the small sample size limited our ability to rigorously account for potential confounders that may have contributed to this apparent association. Further studies may better address whether or not bad outcomes are indeed associated with poor coordinators in highly interdependent clinical teams. In addition to confounding, the small sample size of providers makes the analysis vulnerable to type 1 errors. We addressed this issue by intensively surveying providers repeatedly to achieve a high resolution of the coordination and management structure measures from each comanaged team. The potential for omitted variables and reverse causality in that the coordination scores may be negatively influenced by particularly complex patients and bad outcomes remains a valid concern. We addressed this by confirming the stability of provider RC over time and excluding the RC data from rotations with a bad outcome, but the negative perception of an individual tied to past bad outcomes may persist beyond a particular rotation. Survey responses are subject to recall and hindsight biases, which we attempted to minimize by surveying respondents immediately after each team rotation. Finally, all of our findings may be not be generalizable to other comanagement settings. However, the important correlations between coordination and quality have been observed in other contexts.24, 25
In our study, in‐hospital deaths and ICU transfers are treated as consequences of uncoordinated care. This interpretation may be problematic for circumstances when death is inevitable no matter how well coordinated the care, or when transfer to a higher level of care is appropriate. The rationale for grouping the 2 events into 1 composite bad outcome is based on the assumption that both death and the escalation of care can be delayed to an extent, if not wholly prevented, with the coordinated utilization of a modern hospital's resources. The attribution of these events to poor coordinators may indicate the unraveling of coordination that normally must be maintained to help patients overcome decompensating events that are particularly common in the course of patients with severe liver diseases. Due to the exploratory nature of this analysis, additional studies are necessary to fully characterize the relationship between care coordination and care transfers.
An important implication of this study is that the communication skill and ethical disposition of each individual provider is relevant to the coordination that is sought in multi‐provider teams. Training medical professionals to be better team members may have direct impact on the patients they serve. Our finding about patient ownership suggests that commitment to patients in the framework of care is not merely tradition but a characteristic of competent physicians. Moreover, physicians' commitment to patients is a possible factor, not just in achieving patients' satisfaction, but in securing better outcomes. To that end, the teaching of this and other humanistic principles must remain a vital part of medical education at all levels of training.
Several implications about team leadership and hierarchy are apparent from the data. Findings around the perceived assignment of responsibilities show that high coordinator hepatologists acknowledge the advantages of overlapping task boundaries to prevent critical tasks from being missed and risking bad outcomes. High RC hepatologists in our study adopted a more participatory than supervisory role which presumably facilitated better coordination by transmitting organizational goals to other team members. The function of a comanaged team is likely to be enhanced by a fluid assignment of roles to better handle tasks with high uncertainty. Accordingly, comanagement models of care may not be appropriate in settings where tasks are not interdependent.26 Inherent hierarchy appears to be a feature of well coordinated teams. One possible interpretation of our data is that hospitalists who yield the leadership role to the hepatologist are perceived to be better coordinators and that those who insist on exerting more influence in team decisions are perceived to be poor coordinators.
Existing evidence around care coordination predicts that comanagement designs improve provider coordination through stage‐based and site‐based specialization.12 However, the mechanisms that mediate coordination and patient outcomes are not clear. Moreover, the mechanisms of coordinating multi‐disciplinary teams may be specific to each clinical setting. The role of individual provider characteristics on coordination deserves more attention. Similarly, the impact of organizational culture under which favorable provider characteristics thrive is unknown. Finally, a detailed exposition of patient ownership and the role patients play in affecting the coordination of healthcare resources needs further exploration.
- .Technology, specialization, and the allied health professions.J Allied Health.1983;12(3):177–182.
- .Hospitalists and the doctor‐patient relationship.J Legal Stud.2001;30:589–606.
- .From Chaos to Care: The Promise of Team‐Based medicine.Cambridge, MA:Perseus;2002.
- ,,.Determinants of coordination modes within organizations.Am Sociol Rev.1976;41:322–338.
- .Teamwork and patient safety in dynamic domains of healthcare: a review of the literature.Acta Anaesthesiol Scand.2009;53(2):143–151.
- ,,,,.The association between interdisciplinary collaboration and patient outcomes in a medical intensive care unit.Heart Lung.1992;21:18–24.
- ,,, et al.Patterns of coordination and clinical outcomes: a study of surgical services.Health Serv Res.1998;22:1211–1236.
- ,,, et al.Impact of relational coordination on quality of care, postoperative pain and functioning, and length of stay: a nine‐hospital study of surgical patients.Med Care.2000;38(8):807–819.
- ,,.The link between teamwork and patients' outcomes in intensive care units.Am J Crit Care.2003;12(6):527–534.
- ,,.Assessing system failures in operating rooms and intensive care units.Qual Saf health Care.2007;16:45–50.
- ,,, et al.Patient handover from surgery to intensive care: using Formula 1 pit‐stop and aviation models to improve safety and quality.Paediatr Anaesth.2007;17(5):470–478.
- ,,,.Is the doctor in? A relational approach to job design and the coordination of work.Hum Resour Manage.2008;47(4):729–755.
- ,,,.Developing a team performance framework for the intensive care unit.Crit Care Med.2009;37(5):1787–1793.
- ,,, et al.Medical and surgical comanagement after elective hip and knee arthroplasty: a randomized, controlled trial.Ann Intern Med.2004;141(1):28–38.
- ,,.Medical/psychiatric comanagement by nurse practitioners in chronic hepatitis C treatment: a case study.Arch Psychiatr Nurs.2007;21(2):87–90.
- ,.Perioperative medicine for the hospitalized patient.Med Clin North Am.2008;92(2):325–348.
- .The place and training of the general practitioner.Calif Med.1949;70(4):265–268.
- ,.Surgical comanagement: a natural evolution of hospitalist practice.J Hosp Med.2008;3(5):394–397.
- ,,,.Validation of a telephone version of the mini‐mental state examination.J Am Geriatr Soc.1992;40(7):697–702.
- .Organizing work to support relational co‐ordination.Int J of Human Resource Management.2000;11(3):517–539.
- ,,,,.Beyond our walls: impact of patient and provider coordination across the continuum on outcomes for surgical patients.Health Serv Res.2007;42:7–24.
- ,,,,.The effect of multidisciplinary care teams on intensive care unit mortality.Arch Intern Med.2010;170(4):369–376.
- ,,,.Outcome measures for effective teamwork in inpatient care: final report.Santa Monica:RAND Health;2008.
- ,,, et al.The performance of intensive care units: does good management make a difference?Med Care.1994;32(5):508–525.
- ,,,.Observational assessment of surgical teamwork: a feasibility study.World J Surg.2006;30(10):1774–1783.
- .Just because you can, doesn't mean that you should: A call for the rational application of hospitalist comanagement.J Hosp Med.2008;3(5):398–3402.
Copyright © 2010 Society of Hospital Medicine
UGIB vs. LGIB
Gastrointestinal bleeding (GIB) is a frequent reason for acute hospitalization, with estimated rates of hospitalization at 375 per 100,000 per year in the United States.1 GIB is not a specific disease but rather a diverse set of conditions that lead to the clinical manifestations associated with bleeding into the gastrointestinal tract. One of the most commonly used organizing frameworks in gastrointestinal bleeding is the differentiation between upper gastrointestinal bleeding (UGIB) and lower gastrointestinal bleeding (LGIB). There are important differences in the etiologies between the 2 sources. For example, acid‐related disease is a common etiology in UGIB but does not occur in LGIB. While some aspects of the acute management are shared between UGIB and LGIB, important differences exist in the management, including initial endoscopy and medication choice. There have been few direct comparisons of rates, resource use, and clinical outcomes between UGIB and LGIB.
Historically, rates of UGIB have been reported to exceed those of LGIB by 2‐fold to 8‐fold.25 Protocols, clinical practice guidelines, and policy decisions reflect this emphasis on UGIB.68 Among 9 guidelines hosted by National Guideline Clearinghouse addressing GIB, 6 were focused on UGIB, 2 on both UGIB and LGIB, and only 1 on LGIB.9 There are several reasons to believe that these relative incidence rates may not be accurate. First, recent advances in therapy and prevention of UGIB, such as the treatment of Helicobacter pylori infection; proton pump inhibitors (PPIs); and selective cyclooxygenase‐2 (COX‐2) inhibitors, may have affected the epidemiology of gastrointestinal bleeding.1016 Among these therapies, only COX‐2 inhibitors may also reduce the incidence of LGIB.14, 1618 Therefore, these advances may result in a disproportionate drop in UGIB relative to LGIB. In addition, known risk factors for both LGIB and UGIB, including advancing age and renal failure, are increasing in the general population.5, 19, 20 Finally, given the recent increased recommendations for aspirin therapy and systemic anticoagulation, exposure to aspirin and warfarin have increased, both risk factors for LGIB and UGIB.2124 Indeed, recent studies in the epidemiology of UGIB do suggest a changing pattern of etiologies of UGIB reflecting these advances.25 One study examining rates of both UGIB and LGIB demonstrate a decrease in hospitalizations overall for GIB driven by a reduction in UGIB while at the same time reporting an increase in the incidence of hospitalization for LGIB.1
In addition to a changing epidemiology, a second reason for a potential underestimation of LGIB incidence is one of methodology. There are well‐recognized limitations with using purely administrative data due to difficulties in accurately identifying patients with LGIB.26
Studies using large administrative databases may not accurately identify LGIB because of the poor sensitivity and specificity of International Classification of Diseases, Ninth revision, Clinical Modification (ICD‐9) codes for LGIB.5 While there are standard methods of identifying patients with UGIB using ICD‐9 codes,19 there is not an accepted standard for LGIB. Thus, estimates using only ICD‐9 codes may overidentify or underidentify patients with LGIB. Prior studies that have most accurately identified patients with LGIB used a 2‐step method to address this issue. The initial ICD‐9 identification included a high sensitivity/low specificity approach. These identified patient charts undergo chart review to confirm the presence of an LGIB.5 This method is labor intensive and cannot be done using administrative databases. No direct comparison of UGIB to LGIB among hospitalized patients using this 2‐step method has been done recently.
The current emphasis on UGIB as seen in the published guidelines could also be supported if patients with UGIB had greater resource utilization or worse clinical outcomes. Limited direct comparisons for these outcomes are available. However, 1 administrative database study reported similar mortality rates for UGIB (2.7%) and LGIB (2.9%) in 2006.1 No direct comparisons of other clinical outcomes or resource use outcomes are available. Therefore, the emphasis on UGIB in publications and guidelines is best supported by the incidence rates that are, as has already been discussed, problematic.
We conducted a retrospective cohort study to examine the incidences of UGIB and LGIB among patients admitted to an academic medical center over 2 years using methods designed to optimally identify patients with either UGIB or LGIB. Our study also examined differences in clinical outcomes and resource utilization between subjects with UGIB and LGIB to examine the relative severity of these 2 clinical entities. These results may be useful in determining the need to reconsider clinical approaches as well as protocols and guidelines among patients with gastrointestinal bleeding.
Patients and Methods
Patients
This retrospective cohort study evaluated all patients who were admitted with GIB to a large urban academic medical center from July 1, 2001 to June 30, 2003 and who consented to a larger study examining the effects of hospitalists on patient care. Subjects unable to provide consent due to death or lack of decisional capacity were consented via proxy. To identify patients with GIB, all patients were screened for a primary or secondary diagnosis of GIB using ICD 9 codes. These codes were selected for a very high sensitivity threshold to assure that all potential subjects with GIB were identified. All subjects identified using these codes underwent chart abstraction to determine if they met criteria for GIB. These inclusion criteria required documentation in any portion of the chart (including emergency department [ED] clinician documentation, admission note, nursing intake note, etc.) of signs or symptoms of GI hemorrhage upon admission, including: hematemesis, coffee ground emesis, gastrooccult‐positive emesis, melena, hematochezia, maroon stools, and hemoccult‐positive stools interpreted by the treating physician team as an acute GIB. Subjects identified using the ICD‐9 codes and confirmed to have an acute GIB by chart review were included in the study and underwent additional chart abstraction and administrative data analysis.
ICD‐9 codes for GIB included: esophageal varices with hemorrhage (456.0, 456.20), Mallory‐Weiss syndrome (530.7), gastric ulcer with hemorrhage (531.00531.61), duodenal ulcer with hemorrhage (532.00532.61), peptic ulcer, site unspecified, with hemorrhage (533.00533.61), gastrojejunal ulcer with hemorrhage (534.00534.61), gastritis with hemorrhage (535.61), angiodysplasia of stomach/duodenum with hemorrhage (537.83), hematemesis (578.0578.9), diverticular disease (562.00562.9), other disorders of the intestine (569.00569.9), congenital anomalies of the digestive system (751.00), proctocolitis (556.00), hemorrhoids (455.00455.6), nondysenteric colitis (006.2), noninfectious gastroenteritis and colitis (558.0558.9), salmonella gastroenteritis (003.3), malignant neoplasm of colon (153), familial adenomatous polyposis (211.3), and gastric varices (456.8).
Data
Trained research assistants performed chart abstraction with validation by the principal investigators (PIs) of the first 15 charts to ensure accuracy. Subsequently, research assistants consulted with PIs with any questions during abstracting with final decisions being made by PIs. Detailed chart abstraction collected admission medication lists as obtained by the admitting physician team, including the use of PPIs, histamine‐2 (H‐2) blockers, COX‐2 inhibitors, and medications known to increase the risk of GIB, such as nonselective NSAIDs (nsNSAIDs), aspirin, and other anticoagulants. Other clinical data including risk factors, comorbid illnesses, laboratory tests, and vital signs were also abstracted from subjects' charts.
The source (UGIB vs. LGIB) and etiology (peptic ulcer disease [PUD], varices, diverticula, etc.) of bleeding were assessed using endoscopic reports as the primary source. When no clear source was identified on endoscopy or no endoscopy was done, the abstracter would review all progress notes, discharge summaries, and other diagnostic test results such as angiography in order to identify the source of bleeding (UGIB vs. LGIB). Endoscopic reports that identified a patient as having a UGIB or LGIB but no confirmed etiology were classified as undetermined etiology unless review of the other clinical documentation provided a specific etiology.
Tachycardia was defined as pulse greater than 100 beats per minute. Orthostasis was defined by either a drop in systolic blood pressure of 20 mmHg or an increase in pulse of 10 beats per minute. Hospital administrative databases were utilized to obtain resource utilization (ie, length of stay [LOS], total cost of care, intensive care transfers), Charlson comorbidity index,27 30‐day readmission rate, and in‐hospital mortality. Hospital costs were determined using TSI cost accounting software (Transition Systems Incorporated [now Eclypsis Corporation], Boston, MA), a validated system to assess actual direct and indirect costs of care.
Statistical Analysis
Descriptive statistics (means and proportions) were calculated by location of GIB for all variables describing patient characteristics, clinical presentation, clinical outcomes, and resource utilization. Differences in age and Charlson comorbidity index by GIB location were evaluated using t tests. Differences in gender, race, and medication use were evaluated using chi‐squared tests of independence.
We fit generalized linear models to investigate differences by location of bleed for those variables measuring clinical outcomes (inpatient mortality, intensive care unit [ICU] transfer, emergency surgery, 30‐day readmission, change in hemoglobin) and those variables measuring resource outcomes (total cost, LOS, number of procedures, number of correct scopes, repeat scope indicator, incorrect scope indicator, number of red blood cell [RBC] transfusions). The repeat scope indicator was used to denote a repeat scope (either esophagogastroduodenoscopy [EGD] or colonoscopy) and the incorrect scope indicator was used to denote when the initial scope was negative and a follow‐up scope from the other direction was positive (negative EGD followed by positive colonoscopy or negative colonoscopy followed by positive EGD). For each variable we fit 2 regression models, the first model (unadjusted effect) only included location of bleed as a covariate. The second model (adjusted effect) included location of bleed, age, gender, race (black/not black) and Charlson comorbidity index as covariates. Binary outcomes were modeled using logistic regressions. For continuous variables, we determined the distribution and link of the outcome variable using residual diagnostics and by comparing the log likelihood and information criteria of competing models. All analyses were performed using STATA SE Version 9.0 (StataCorp, College Station, TX)
This study was approved by the University of Chicago Institutional Review Board.
Results
During the 2 years of observation, a total of 7741 subjects were admitted to the internal medicine service and enrolled in the hospitalist study. Of these, 1014 had a primary or secondary ICD‐9 code that may be consistent with UGIB or LGIB and underwent chart review to determine if they had an acute GIB. Out of 1014 subjects, 647 were determined not to have an acute GI hemorrhage and were excluded from the remaining analyses; 367 of the 1104 subjects identified by ICD‐9 codes were found to have a clinical presentation consistent with GIB and were included in this study. A total of 180 of these 367 had UGIB and 187 had LGIB. The mean age was 62.4 years, 56.7% were female, 82.6% were African American, 12.7% were Caucasian, and the mean Charlson index was 1.5. (Table 1) Among baseline characteristics, both gender and age were statistically associated with a difference in rates of upper vs. lower source bleeding, with LGIB patients more likely to be female (P = 0.01) and older (P < 0.001). Etiologies of UGIB include erosive disease, peptic ulcer disease, variceal bleeding, arteriovenous malformation, and malignancy. Etiologies of LGIB include: diverticulosis, colitis, arteriovenous malformation, cancer, ischemic colitis, polyp, hemorrhoidal bleed, ulcer, inflammatory bowel disease, other, and not determined (Table 2).
| Upper and Lower GI Bleeding (n = 367) | Upper GI Bleeding (n = 180) | Lower GI Bleeding (n = 187) | P Value | |
|---|---|---|---|---|
| ||||
| Age (years), mean (SD) | 62.4 (18.0) | 58.6 (18.2) | 66.0 (17.1) | <0.001 |
| Female gender (%) | 56.7 | 50.0 | 63.1 | 0.01 |
| Race (%) | ||||
| African American | 82.6 | 85.3 | 80.1 | 0.43 |
| White | 12.7 | 10.7 | 14.5 | |
| Other | 4.7 | 4.0 | 5.4 | |
| Charlson comorbidity index, mean (SD) | 1.5 (1.5) | 1.6 (1.6) | 1.4 (1.5) | 0.44 |
| Lower GI Bleed (n = 187) | Upper GI Bleed (n = 180) | ||||
|---|---|---|---|---|---|
| Etiology | Frequency | Percent of Total (%) | Etiology | Frequency | Percent of Total (%) |
| |||||
| Diverticulosis | 76 | 41 | Erosive disease | 86 | 48 |
| Not identified | 38 | 20 | Peptic ulcer | 51 | 28 |
| Colitis, NOS | 14 | 7 | Not identified | 26 | 14 |
| AVM | 13 | 7 | Mallory Weiss | 17 | 9 |
| Cancer | 11 | 6 | Varices | 8 | 4 |
| Ischemic colitis | 9 | 5 | AVMs | 5 | 3 |
| Polyp | 9 | 5 | Mass/cancer | 5 | 3 |
| Hemorrhoid | 8 | 4 | |||
| Ulcer | 5 | 3 | |||
| Other | 3 | 1 | |||
| IBD | 1 | <1 | |||
Baseline use of medications known to be associated with either increased or decreased risk of GIB was common. Approximately one‐third of subjects with both LGIB and UGIB used aspirin and 10% used warfarin. LGIB subjects were less likely to use an nsNSAID (P < 0.001), but more likely to use a proton pump inhibitor (PPI) (P = 0.06) (Table 3).
| Upper and Lower GI Bleeding (%) (n = 367) | Upper GI Bleeding (%) (n = 180) | Lower GI Bleeding (%) (n = 187) | P Value* | |
|---|---|---|---|---|
| ||||
| Aspirin | 34.9 | 31.8 | 37.4 | 0.28 |
| nsNSAID | 12.9 | 20.8 | 6.4 | < 0.001 |
| COX‐2 selective inhibitor | 8.2 | 6.5 | 9.6 | 0.29 |
| Warfarin | 10.9 | 8.4 | 12.8 | 0.19 |
| PPI | 24.3 | 19.5 | 28.3 | 0.06 |
| nsNSAID + PPI | 1.8 | 1.3 | 2.1 | 0.56 |
| COX‐2 + PPI | 2.9 | 1.3 | 4.3 | 0.11 |
Key initial clinical presentation findings included vital sign abnormalities and admission hemoglobin levels. While hypotension was not common (4.7%), resting tachycardia (37%) and orthostasis (16%) were seen frequently. Subjects with LGIB were significantly less likely than those with UGIB to present with orthostasis (8.8% vs. 21.0%, respectively; P = 0.006) and resting tachycardia (32.3% vs. 42.5%, respectively; P = 0.04). Subjects with LGIB had a higher admission hemoglobin than those with UGIB (10.7 vs. 9.7, respectively; P < 0.001) (Table 4).
| Clinical Finding | Upper and Lower GI Bleeding (n = 367) | Upper GI Bleeding (n = 180) | Lower GI Bleeding (n = 187) | P Value* |
|---|---|---|---|---|
| ||||
| Hypotension (%) | 4.7 | 5.7 | 3.8 | 0.39 |
| Resting tachycardia (%) | 37.3 | 42.5 | 32.3 | 0.04 |
| Orthostatic hypotension (%) | 16.2 | 21.0 | 8.8 | 0.006 |
| Admission hemoglobin (g/dL), mean (SD) | 10.2 (2.6) | 9.7 (2.7) | 10.7 (2.5) | <0.001 |
We also examined several clinical outcomes. When comparing LGIB to UGIB patients for these clinical outcomes using bivariate and multivariate statistics, there was no difference for in‐hospital mortality (1.1% vs. 1.1%), transfer to ICU (16.0% vs. 13.9%), 30‐day readmission (5.9% vs.7.8%), number of red blood cell (RBC) transfusions (2.7 vs. 2.4), or need for GI surgery (1.1% vs. 0.0%). The mean drop in hemoglobin was greater among subjects with LGIB compared to UGIB (1.9 g/dL vs. 1.5 g/dL, respectively) by both bivariate (P = 0.01) and multivariate (P = 0.003) analyses (Table 5).
| Upper GI Bleeding (n = 180) | Lower GI Bleeding (n = 187) | Bivariate P Value | Multivariate P Value | |
|---|---|---|---|---|
| ||||
| In‐hospital mortality (%)* | 1.1 | 1.1 | 0.97 | 0.74 |
| Transfer to ICU (%)* | 13.9 | 16.0 | 0.56 | 0.44 |
| Drop in hemoglobin (g/dL), mean (SD) | 1.5 (1.5) | 1.9 (1.6) | 0.01 | 0.003 |
| Packed RBC transfusions required (units), mean (SD)* | 2.4 (2.9) | 2.7 (3.7) | 0.36 | 0.33 |
| Surgery for GI bleeding (%) | 0.0% | 1.1 | ||
| 30‐day readmission rate (%)* | 7.8 | 5.9 | 0.49 | 0.45 |
Mean costs were $11,892 for LGIB and $14,301 for UGIB and median costs were $7,890 for LGIB and $9,548 for UGIB, but were not statistically different. LOS was also similar between subjects with LGIB (5.1 days) and UGIB (5.7 days). In bivariate and multivariate analyses, UGIB subjects had a similar mean number of endoscopic procedures (1.3) compared to LGIB subjects (1.2). Thirteen percent of subjects with UGIB required a second EGD while only 8% of subjects with LGIB required 2 colonoscopies. In addition, 29% of subjects with LGIB received an EGD while only 16% of subjects with an UGIB received a colonoscopy (P = 0.001) (Table 6).
| Upper GI Bleeding (n = 180) | Lower GI Bleeding (n = 187) | Bivariate P Value | Multivariate P Value | |
|---|---|---|---|---|
| ||||
| Cost ($), mean (SD)* | 14,301 (17,196) | 11,892 (13,100) | 0.13 | 0.21 |
| Cost ($), median | $9,548 | $7,890 | ||
| Length of stay (days), mean (SD)* | 5.7 (7.0) | 5.1 (5.3) | 0.37 | 0.72 |
| Number of endoscopies/ patient, mean (SD) | 1.3 (0.5) | 1.2 (0.9) | 0.18 | 0.20 |
Conclusions
This study represents one of the largest direct comparisons of LGIB to UGIB not based on administrative databases. The most striking finding was the nearly equal rates of LGIB and UGIB. There are 2 likely explanations for this surprising result. First, there may be methodological reasons that we identified a greater proportion of true LGIBs; our study used a highly sensitive search strategy of ICD‐9 coding with confirmatory chart abstraction to ensure that as many LGIB and UGIB cases would be identified as possible while also excluding cases not meeting accepted criteria for GIB. The second possibility is that there is an actual change in epidemiology of GIB. Known risk factors for LGIB are increasing such as advancing age, increased use of chronic aspirin therapy, and renal disease. At the same time, significant advances in the treatment and prevention of UGIB have been made. Recent studies have demonstrated similar trends in admissions for upper and lower GI complications, suggesting that there may be a changing epidemiology due primarily to reductions in upper GI complications.1, 16
Either explanation would have implications for the care of patients with GIB. Clinical decision‐making based on prior literature would support that in ambiguous clinical situations and initial evaluation for an UGIB is appropriate. Most risk stratification literature and clinical guidelines focus on UGIB. If rates of LGIB and UGIB are similar, then existing clinical decision protocols may need to be reevaluated to incorporate the higher likelihood of LGIB. This reevaluation would be less important if the clinical outcomes or resource utilization of UGIB was significantly greater than that for LGIB, but we did not find this was the case. Similarly, if the ability to distinguish between LGIB and UGIB were robust on clinical signs and symptoms, then a reevaluation would be less important. However, we found fairly similar numbers of patients initially receiving evaluation for UGIB then being evaluated for LGIB as we found patients initially receiving evaluation for LGIB then being evaluated for UGIB. This suggests the potential benefit of clinical decision protocols that could better distinguish between UGIB and LGIB and account for the potentially higher incidence of LGIB than previously thought.
In addition to affecting the attention paid to LGIB for acute management, a changed understanding of incidence could also affect the attention paid to prevention of LGIB. Of the recent nonendoscopic advances in the treatment and prevention of GIB, only the use of COX‐2s (when used in place of traditional nsNSAIDs) reduces the risk of both LGIB and UGIB;14, 1618 H .pylori treatment and PPIs only prevent UGIB. Therefore, if the clinical and financial burdens of LGIB are similar to those seen in UGIB, more attention may need to be focused on preventing LGIB.
Baseline medication use was notable primarily for the similarities between UGIB and LGIB. Agents known to affect the rates of GIB were common in both groups. Over one‐third of the population was using aspirin and 10% were taking warfarin. Over 20% of subjects were taking an nsNSAID or a COX‐2 inhibitor. Almost one‐quarter of subjects were taking a PPI, agents known to decrease rates of UGIB and potentially increase LGIB through the risk of C. difficile colitis. Notably, the only statistically significant difference in baseline medication use between subjects with UGIB and LGIB was the more than 3‐fold higher use of nsNSAIDs in patients with UGIB as compared to LGIB. While current guidelines are not clear and consistent about which populations of at‐risk patients should receive GI prophylaxis,2830 these results suggest that patients admitted with GIB are very likely to be taking medications which impact the risk of GIB.
In terms of disease severity, the clinical presentation at admission suggests a greater degree of hemodynamic instability among subjects with UGIB. Rates of orthostatic hypotension and resting tachycardia are higher in UGIB subjects, as well as having a lower mean hemoglobin levels at presentation. However, despite the more severe clinical presentation, clinical outcomes did not differ significantly between the 2 bleeding sources. Thus, the most relevant clinical outcomes suggest that the severity of both LGIB and UGIB are similar. This similarity again suggest that the clinical burden of LGIB is not significantly different than UGIB.
Our results concerning resource utilization demonstrate a similar pattern. While the point estimates for costs and LOS suggest that UGIB may be associated with higher resource utilization, these differences were not significant in either bivariate or multivariate analyses. Those subjects with UGIB did receive more total endoscopic procedures than subjects with LGIB. More interesting though was that 24% of all subjects received an endoscopy of the opposite site (LGIB with EGD and UGIB with colonoscopy). These results suggest that the site of bleeding is not clear in a significant proportion of patients who present with GIB. These additional endoscopies are associated with increased risk, costs, LOS, and discomfort to patients. Improving our ability to accurately predict the source (upper vs. lower) of bleeding would allow us to reduce the number of these excess endoscopies. Additionally, it is interesting that despite the almost universal use of endoscopies, 20% of LGIB and 14% of UGIB subjects could not have a specific etiology identified during endoscopy or subsequent workup.
There are some important limitations to this study. While the sample size is among the largest of its type involving chart abstraction, it may be underpowered to detect some differences. Additionally, our results are from a single urban academic medical center with a patient population that is predominantly African American, which may limit generalizability. This study required consent and therefore only examines a subset of patients admitted to the medical center with GIB, which could potentially introduce bias into the sample. However, it is not clear why there would be systematic differences in subjects who choose to consent vs. those who decide not to consent that would affect the results of this study in substantive ways.
Despite significant efforts at identifying all subjects with GIB admitted during this time period, there were potential methodological reasons that may have resulted in some cases being missed. Only subjects admitted to a medicine service were approached for consent. All subjects in this medical center with GIB are admitted to a medicine service. We captured all subjects who were initially admitted to a medicine service as well as those admitted initially to an ICU and then transferred to the floor at any point prior to discharge. It is possible, though, that a subject would be admitted to an ICU for GIB and die prior to being transferred to the floor. While it is the impression of the director of the ICU that this would be a very unusual event, as most of the patients would be discharged to the floor prior to death (personal communication), given the very low mortality rate seen in this study, small numbers of missed events could have a significant impact on the interpretation of in‐hospital mortality results. It is also important to note that this medical center did not have the ability to perform endoscopy prior to admission for patients with GIB at the time of the study; all patients who presented with GIB would have been admitted and identified for this study. Finally, we were unable to routinely identify the rationale for obtaining an endoscopic exam. We assumed that all endoscopic exams were done for the purpose of evaluating and/or treating the GIB for which the subject was admitted. It is possible that some subjects had additional endoscopies for other reasons, which would have led to our overestimating the rates of additional endoscopies for GIB.
This study highlights the similarities between LGIB and UGIB rather than the differences. There were few significant differences between the 2 bleeding sources in terms of incidence, clinical outcomes, and resource utilization. In fact, the study also suggests that determining the source of bleeding may not be clear, given the high rates of opposite site endoscopies. While this study did reveal several similarities between UGIB and LGIB, it also highlights the need to identify improved strategies to improve the sensitivity and specificity of identification of LGIB compared to UGIB, both for clinical purposes and for research. The value of such improved clinical algorithms have the potential to improve both the cost and outcomes of care, while better algorithms for separating UGIB and LGIB using administrative data might help produce more precise estimates of costs and clinical outcomes, and aid in the development of risk stratification models.
- ,.Hospitalizations for Gastrointestinal Bleeding in 1998 and 2006. HCUP Statistical Brief #65, December 2008.Rockville, MD:Agency for Healthcare Research and Quality.
- ,.Causes and outcome of upper and lower gastrointestinal bleeding: The Grady Hospital Experience.South Med J.1999;92(1):44–50.
- ,,, et al.Acute upper gastrointestinal haemorrhage in west of Scotland: case ascertainment study.BMJ.1997;315:510–540.
- ,.A cost‐effective approach to the patient with peptic ulcer bleeding.Surg Clin North Am.1996;76:83–103.
- .Epidemiology and outcome of patients hospitalized with acute lower gastrointestinal hemorrhage: a population based study.Am J Gastroenterol.1997;92:419–424.
- ,,.Consensus recommendations for managing patients with nonvariceal upper gastrointestinal bleeding.Ann Int Med.2003;139:843–857.
- ,.Incremental value of upper endoscopy for triage of patients with acute non‐variceal upper‐GI hemorrhage.Gastrointest Endosc2004;60:9–14.
- ,,, et al.Upper gastrointestinal hemorrhage clinical guideline‐determining the optimal hospital length of stay.Am J Med.1996;100:313–322.
- National Guideline Clearinghouse. Available at: http://www.guideline.gov. Accessed August2009.
- ,,, et al.Prevention of ulcer recurrence after eradication of Helicobacter pylori: a prospective long‐term follow‐up study.Gastroenterology.1997;113:1082–1086.
- ,,, et al.Treatment of Helicobacter pylori in patients with duodenal ulcer hemorrhage‐a long‐term randomized, controlled study.Am J Gastroenterol.2000;95:2225–2232.
- ,,, et al.Preventing recurrent upper gastrointestinal bleeding in patients with Helicobacter pylori infection who are taking low‐dose aspirin or naproxen.N Engl J Med.2001;344:967–973.
- ,,, et al.Lansoprazole for the prevention of recurrences of ulcer complications from long‐term low‐dose aspirin use.N Engl J Med.2002;346:2033–2038.
- ,,, et al.Comparison of upper gastrointestinal toxicity of rofecoxib and naproxen in patients with rheumatoid arthritis. VIGOR Study Group.N Engl J Med.2000;343:1520–1528.
- ,,, et al.Gastrointestinal toxicity with celecoxib vs nonsteroidal anti‐inflammatory drugs for osteoarthritis and rheumatoid arthritis: the CLASS study: a randomized controlled trial. Celecoxib Long‐Term Arthritis Safety Study.JAMA.2000;284:1247–1255.
- ,,, et al.Time trends and clinical impact of upper and lower gastrointestinal complications. Digestive Disease Week National Meeting,2008. San Diego, CA, May 17–22.
- ,,, et al.Video capsule endoscopy to prospectively assess small bowel injury with celecoxib, naproxen plus omeprazole, and placebo.Clin Gastroenterol Hepatol.2005;3:133–141.
- ,,, et al.Serious lower gastrointestinal clinical events with nonselective NSAID or Coxib use.Gastroenterology.2003;124:288–292.
- ,,, et al.Risk factors for upper gastrointestinal bleeding among end‐stage renal disease patients.Kidney Int.2003;64:1455–1461.
- ,,, et al.Risk factors for hospitalized bleeding among older patients.J Am Geriatr Soc.2001;49:126–133.
- Institute for Clinical Systems Improvement (ICSI). Preventive services in adults. Bloomington, MN: Institute for Clinical Systems Improvement (ICSI).2005. Available at http://www.isci.org/guidelines_and_more/guidelines_order_sets_protocol/for_patients_families/preventive_services_for_adults_for_patients_families_.html. Accessed Month year.
- .NSAID‐associated deaths: the rise and fall of NSAID‐associated GI mortality.Am J Gastroenterol.2005;100:1694–1695.
- ,.Effects of very low doses of daily long‐term aspirin therapy on gastric, duodenal, and rectal prostaglandins on mucosal injury in healthy humans.Gastroenterology. 199;117:17–25.
- ,,, et al.A nationwide study of mortality associated with hospital admission due to severe gastrointestinal events and those associated with nonsteroidal antiinflammatory drug use.Am J Gastroenterol.2005;100:1685–1693.
- ,,, et al.Acute upper GI bleeding: did anything change?Am J Gastroenterol.2003;98:1494–1499.
- ,.Lower intestinal bleeding.Best Pract Res Clin Gastroenterol.2001;15:135–153.
- ,,,.A new method of classifying prognostic comorbidity in longitudinal studies: development and validation.J Chronic Dis.1987;40:373–383.
- AGS Panel on Persistent Pain in Older Persons. The management of persistent pain in older persons.J Am Geriatr Soc.2002;50(6 suppl):S205–S224.
- ,,, et al.Pain in Osteoarthritis, Rheumatoid Arthritis and Juvenile Chronic Arthritis.2nd ed.Clinical practice guideline no. 2.Glenview, IL:American Pain Society (APS);2002:179.
- American College of Rheumatology Subcommittee on Osteoarthritis Guidelines.Recommendations for the Medical Management of Osteoarthritis of the Hip and Knee.Arthritis Rheum.2000;43:1905–1915.
Gastrointestinal bleeding (GIB) is a frequent reason for acute hospitalization, with estimated rates of hospitalization at 375 per 100,000 per year in the United States.1 GIB is not a specific disease but rather a diverse set of conditions that lead to the clinical manifestations associated with bleeding into the gastrointestinal tract. One of the most commonly used organizing frameworks in gastrointestinal bleeding is the differentiation between upper gastrointestinal bleeding (UGIB) and lower gastrointestinal bleeding (LGIB). There are important differences in the etiologies between the 2 sources. For example, acid‐related disease is a common etiology in UGIB but does not occur in LGIB. While some aspects of the acute management are shared between UGIB and LGIB, important differences exist in the management, including initial endoscopy and medication choice. There have been few direct comparisons of rates, resource use, and clinical outcomes between UGIB and LGIB.
Historically, rates of UGIB have been reported to exceed those of LGIB by 2‐fold to 8‐fold.25 Protocols, clinical practice guidelines, and policy decisions reflect this emphasis on UGIB.68 Among 9 guidelines hosted by National Guideline Clearinghouse addressing GIB, 6 were focused on UGIB, 2 on both UGIB and LGIB, and only 1 on LGIB.9 There are several reasons to believe that these relative incidence rates may not be accurate. First, recent advances in therapy and prevention of UGIB, such as the treatment of Helicobacter pylori infection; proton pump inhibitors (PPIs); and selective cyclooxygenase‐2 (COX‐2) inhibitors, may have affected the epidemiology of gastrointestinal bleeding.1016 Among these therapies, only COX‐2 inhibitors may also reduce the incidence of LGIB.14, 1618 Therefore, these advances may result in a disproportionate drop in UGIB relative to LGIB. In addition, known risk factors for both LGIB and UGIB, including advancing age and renal failure, are increasing in the general population.5, 19, 20 Finally, given the recent increased recommendations for aspirin therapy and systemic anticoagulation, exposure to aspirin and warfarin have increased, both risk factors for LGIB and UGIB.2124 Indeed, recent studies in the epidemiology of UGIB do suggest a changing pattern of etiologies of UGIB reflecting these advances.25 One study examining rates of both UGIB and LGIB demonstrate a decrease in hospitalizations overall for GIB driven by a reduction in UGIB while at the same time reporting an increase in the incidence of hospitalization for LGIB.1
In addition to a changing epidemiology, a second reason for a potential underestimation of LGIB incidence is one of methodology. There are well‐recognized limitations with using purely administrative data due to difficulties in accurately identifying patients with LGIB.26
Studies using large administrative databases may not accurately identify LGIB because of the poor sensitivity and specificity of International Classification of Diseases, Ninth revision, Clinical Modification (ICD‐9) codes for LGIB.5 While there are standard methods of identifying patients with UGIB using ICD‐9 codes,19 there is not an accepted standard for LGIB. Thus, estimates using only ICD‐9 codes may overidentify or underidentify patients with LGIB. Prior studies that have most accurately identified patients with LGIB used a 2‐step method to address this issue. The initial ICD‐9 identification included a high sensitivity/low specificity approach. These identified patient charts undergo chart review to confirm the presence of an LGIB.5 This method is labor intensive and cannot be done using administrative databases. No direct comparison of UGIB to LGIB among hospitalized patients using this 2‐step method has been done recently.
The current emphasis on UGIB as seen in the published guidelines could also be supported if patients with UGIB had greater resource utilization or worse clinical outcomes. Limited direct comparisons for these outcomes are available. However, 1 administrative database study reported similar mortality rates for UGIB (2.7%) and LGIB (2.9%) in 2006.1 No direct comparisons of other clinical outcomes or resource use outcomes are available. Therefore, the emphasis on UGIB in publications and guidelines is best supported by the incidence rates that are, as has already been discussed, problematic.
We conducted a retrospective cohort study to examine the incidences of UGIB and LGIB among patients admitted to an academic medical center over 2 years using methods designed to optimally identify patients with either UGIB or LGIB. Our study also examined differences in clinical outcomes and resource utilization between subjects with UGIB and LGIB to examine the relative severity of these 2 clinical entities. These results may be useful in determining the need to reconsider clinical approaches as well as protocols and guidelines among patients with gastrointestinal bleeding.
Patients and Methods
Patients
This retrospective cohort study evaluated all patients who were admitted with GIB to a large urban academic medical center from July 1, 2001 to June 30, 2003 and who consented to a larger study examining the effects of hospitalists on patient care. Subjects unable to provide consent due to death or lack of decisional capacity were consented via proxy. To identify patients with GIB, all patients were screened for a primary or secondary diagnosis of GIB using ICD 9 codes. These codes were selected for a very high sensitivity threshold to assure that all potential subjects with GIB were identified. All subjects identified using these codes underwent chart abstraction to determine if they met criteria for GIB. These inclusion criteria required documentation in any portion of the chart (including emergency department [ED] clinician documentation, admission note, nursing intake note, etc.) of signs or symptoms of GI hemorrhage upon admission, including: hematemesis, coffee ground emesis, gastrooccult‐positive emesis, melena, hematochezia, maroon stools, and hemoccult‐positive stools interpreted by the treating physician team as an acute GIB. Subjects identified using the ICD‐9 codes and confirmed to have an acute GIB by chart review were included in the study and underwent additional chart abstraction and administrative data analysis.
ICD‐9 codes for GIB included: esophageal varices with hemorrhage (456.0, 456.20), Mallory‐Weiss syndrome (530.7), gastric ulcer with hemorrhage (531.00531.61), duodenal ulcer with hemorrhage (532.00532.61), peptic ulcer, site unspecified, with hemorrhage (533.00533.61), gastrojejunal ulcer with hemorrhage (534.00534.61), gastritis with hemorrhage (535.61), angiodysplasia of stomach/duodenum with hemorrhage (537.83), hematemesis (578.0578.9), diverticular disease (562.00562.9), other disorders of the intestine (569.00569.9), congenital anomalies of the digestive system (751.00), proctocolitis (556.00), hemorrhoids (455.00455.6), nondysenteric colitis (006.2), noninfectious gastroenteritis and colitis (558.0558.9), salmonella gastroenteritis (003.3), malignant neoplasm of colon (153), familial adenomatous polyposis (211.3), and gastric varices (456.8).
Data
Trained research assistants performed chart abstraction with validation by the principal investigators (PIs) of the first 15 charts to ensure accuracy. Subsequently, research assistants consulted with PIs with any questions during abstracting with final decisions being made by PIs. Detailed chart abstraction collected admission medication lists as obtained by the admitting physician team, including the use of PPIs, histamine‐2 (H‐2) blockers, COX‐2 inhibitors, and medications known to increase the risk of GIB, such as nonselective NSAIDs (nsNSAIDs), aspirin, and other anticoagulants. Other clinical data including risk factors, comorbid illnesses, laboratory tests, and vital signs were also abstracted from subjects' charts.
The source (UGIB vs. LGIB) and etiology (peptic ulcer disease [PUD], varices, diverticula, etc.) of bleeding were assessed using endoscopic reports as the primary source. When no clear source was identified on endoscopy or no endoscopy was done, the abstracter would review all progress notes, discharge summaries, and other diagnostic test results such as angiography in order to identify the source of bleeding (UGIB vs. LGIB). Endoscopic reports that identified a patient as having a UGIB or LGIB but no confirmed etiology were classified as undetermined etiology unless review of the other clinical documentation provided a specific etiology.
Tachycardia was defined as pulse greater than 100 beats per minute. Orthostasis was defined by either a drop in systolic blood pressure of 20 mmHg or an increase in pulse of 10 beats per minute. Hospital administrative databases were utilized to obtain resource utilization (ie, length of stay [LOS], total cost of care, intensive care transfers), Charlson comorbidity index,27 30‐day readmission rate, and in‐hospital mortality. Hospital costs were determined using TSI cost accounting software (Transition Systems Incorporated [now Eclypsis Corporation], Boston, MA), a validated system to assess actual direct and indirect costs of care.
Statistical Analysis
Descriptive statistics (means and proportions) were calculated by location of GIB for all variables describing patient characteristics, clinical presentation, clinical outcomes, and resource utilization. Differences in age and Charlson comorbidity index by GIB location were evaluated using t tests. Differences in gender, race, and medication use were evaluated using chi‐squared tests of independence.
We fit generalized linear models to investigate differences by location of bleed for those variables measuring clinical outcomes (inpatient mortality, intensive care unit [ICU] transfer, emergency surgery, 30‐day readmission, change in hemoglobin) and those variables measuring resource outcomes (total cost, LOS, number of procedures, number of correct scopes, repeat scope indicator, incorrect scope indicator, number of red blood cell [RBC] transfusions). The repeat scope indicator was used to denote a repeat scope (either esophagogastroduodenoscopy [EGD] or colonoscopy) and the incorrect scope indicator was used to denote when the initial scope was negative and a follow‐up scope from the other direction was positive (negative EGD followed by positive colonoscopy or negative colonoscopy followed by positive EGD). For each variable we fit 2 regression models, the first model (unadjusted effect) only included location of bleed as a covariate. The second model (adjusted effect) included location of bleed, age, gender, race (black/not black) and Charlson comorbidity index as covariates. Binary outcomes were modeled using logistic regressions. For continuous variables, we determined the distribution and link of the outcome variable using residual diagnostics and by comparing the log likelihood and information criteria of competing models. All analyses were performed using STATA SE Version 9.0 (StataCorp, College Station, TX)
This study was approved by the University of Chicago Institutional Review Board.
Results
During the 2 years of observation, a total of 7741 subjects were admitted to the internal medicine service and enrolled in the hospitalist study. Of these, 1014 had a primary or secondary ICD‐9 code that may be consistent with UGIB or LGIB and underwent chart review to determine if they had an acute GIB. Out of 1014 subjects, 647 were determined not to have an acute GI hemorrhage and were excluded from the remaining analyses; 367 of the 1104 subjects identified by ICD‐9 codes were found to have a clinical presentation consistent with GIB and were included in this study. A total of 180 of these 367 had UGIB and 187 had LGIB. The mean age was 62.4 years, 56.7% were female, 82.6% were African American, 12.7% were Caucasian, and the mean Charlson index was 1.5. (Table 1) Among baseline characteristics, both gender and age were statistically associated with a difference in rates of upper vs. lower source bleeding, with LGIB patients more likely to be female (P = 0.01) and older (P < 0.001). Etiologies of UGIB include erosive disease, peptic ulcer disease, variceal bleeding, arteriovenous malformation, and malignancy. Etiologies of LGIB include: diverticulosis, colitis, arteriovenous malformation, cancer, ischemic colitis, polyp, hemorrhoidal bleed, ulcer, inflammatory bowel disease, other, and not determined (Table 2).
| Upper and Lower GI Bleeding (n = 367) | Upper GI Bleeding (n = 180) | Lower GI Bleeding (n = 187) | P Value | |
|---|---|---|---|---|
| ||||
| Age (years), mean (SD) | 62.4 (18.0) | 58.6 (18.2) | 66.0 (17.1) | <0.001 |
| Female gender (%) | 56.7 | 50.0 | 63.1 | 0.01 |
| Race (%) | ||||
| African American | 82.6 | 85.3 | 80.1 | 0.43 |
| White | 12.7 | 10.7 | 14.5 | |
| Other | 4.7 | 4.0 | 5.4 | |
| Charlson comorbidity index, mean (SD) | 1.5 (1.5) | 1.6 (1.6) | 1.4 (1.5) | 0.44 |
| Lower GI Bleed (n = 187) | Upper GI Bleed (n = 180) | ||||
|---|---|---|---|---|---|
| Etiology | Frequency | Percent of Total (%) | Etiology | Frequency | Percent of Total (%) |
| |||||
| Diverticulosis | 76 | 41 | Erosive disease | 86 | 48 |
| Not identified | 38 | 20 | Peptic ulcer | 51 | 28 |
| Colitis, NOS | 14 | 7 | Not identified | 26 | 14 |
| AVM | 13 | 7 | Mallory Weiss | 17 | 9 |
| Cancer | 11 | 6 | Varices | 8 | 4 |
| Ischemic colitis | 9 | 5 | AVMs | 5 | 3 |
| Polyp | 9 | 5 | Mass/cancer | 5 | 3 |
| Hemorrhoid | 8 | 4 | |||
| Ulcer | 5 | 3 | |||
| Other | 3 | 1 | |||
| IBD | 1 | <1 | |||
Baseline use of medications known to be associated with either increased or decreased risk of GIB was common. Approximately one‐third of subjects with both LGIB and UGIB used aspirin and 10% used warfarin. LGIB subjects were less likely to use an nsNSAID (P < 0.001), but more likely to use a proton pump inhibitor (PPI) (P = 0.06) (Table 3).
| Upper and Lower GI Bleeding (%) (n = 367) | Upper GI Bleeding (%) (n = 180) | Lower GI Bleeding (%) (n = 187) | P Value* | |
|---|---|---|---|---|
| ||||
| Aspirin | 34.9 | 31.8 | 37.4 | 0.28 |
| nsNSAID | 12.9 | 20.8 | 6.4 | < 0.001 |
| COX‐2 selective inhibitor | 8.2 | 6.5 | 9.6 | 0.29 |
| Warfarin | 10.9 | 8.4 | 12.8 | 0.19 |
| PPI | 24.3 | 19.5 | 28.3 | 0.06 |
| nsNSAID + PPI | 1.8 | 1.3 | 2.1 | 0.56 |
| COX‐2 + PPI | 2.9 | 1.3 | 4.3 | 0.11 |
Key initial clinical presentation findings included vital sign abnormalities and admission hemoglobin levels. While hypotension was not common (4.7%), resting tachycardia (37%) and orthostasis (16%) were seen frequently. Subjects with LGIB were significantly less likely than those with UGIB to present with orthostasis (8.8% vs. 21.0%, respectively; P = 0.006) and resting tachycardia (32.3% vs. 42.5%, respectively; P = 0.04). Subjects with LGIB had a higher admission hemoglobin than those with UGIB (10.7 vs. 9.7, respectively; P < 0.001) (Table 4).
| Clinical Finding | Upper and Lower GI Bleeding (n = 367) | Upper GI Bleeding (n = 180) | Lower GI Bleeding (n = 187) | P Value* |
|---|---|---|---|---|
| ||||
| Hypotension (%) | 4.7 | 5.7 | 3.8 | 0.39 |
| Resting tachycardia (%) | 37.3 | 42.5 | 32.3 | 0.04 |
| Orthostatic hypotension (%) | 16.2 | 21.0 | 8.8 | 0.006 |
| Admission hemoglobin (g/dL), mean (SD) | 10.2 (2.6) | 9.7 (2.7) | 10.7 (2.5) | <0.001 |
We also examined several clinical outcomes. When comparing LGIB to UGIB patients for these clinical outcomes using bivariate and multivariate statistics, there was no difference for in‐hospital mortality (1.1% vs. 1.1%), transfer to ICU (16.0% vs. 13.9%), 30‐day readmission (5.9% vs.7.8%), number of red blood cell (RBC) transfusions (2.7 vs. 2.4), or need for GI surgery (1.1% vs. 0.0%). The mean drop in hemoglobin was greater among subjects with LGIB compared to UGIB (1.9 g/dL vs. 1.5 g/dL, respectively) by both bivariate (P = 0.01) and multivariate (P = 0.003) analyses (Table 5).
| Upper GI Bleeding (n = 180) | Lower GI Bleeding (n = 187) | Bivariate P Value | Multivariate P Value | |
|---|---|---|---|---|
| ||||
| In‐hospital mortality (%)* | 1.1 | 1.1 | 0.97 | 0.74 |
| Transfer to ICU (%)* | 13.9 | 16.0 | 0.56 | 0.44 |
| Drop in hemoglobin (g/dL), mean (SD) | 1.5 (1.5) | 1.9 (1.6) | 0.01 | 0.003 |
| Packed RBC transfusions required (units), mean (SD)* | 2.4 (2.9) | 2.7 (3.7) | 0.36 | 0.33 |
| Surgery for GI bleeding (%) | 0.0% | 1.1 | ||
| 30‐day readmission rate (%)* | 7.8 | 5.9 | 0.49 | 0.45 |
Mean costs were $11,892 for LGIB and $14,301 for UGIB and median costs were $7,890 for LGIB and $9,548 for UGIB, but were not statistically different. LOS was also similar between subjects with LGIB (5.1 days) and UGIB (5.7 days). In bivariate and multivariate analyses, UGIB subjects had a similar mean number of endoscopic procedures (1.3) compared to LGIB subjects (1.2). Thirteen percent of subjects with UGIB required a second EGD while only 8% of subjects with LGIB required 2 colonoscopies. In addition, 29% of subjects with LGIB received an EGD while only 16% of subjects with an UGIB received a colonoscopy (P = 0.001) (Table 6).
| Upper GI Bleeding (n = 180) | Lower GI Bleeding (n = 187) | Bivariate P Value | Multivariate P Value | |
|---|---|---|---|---|
| ||||
| Cost ($), mean (SD)* | 14,301 (17,196) | 11,892 (13,100) | 0.13 | 0.21 |
| Cost ($), median | $9,548 | $7,890 | ||
| Length of stay (days), mean (SD)* | 5.7 (7.0) | 5.1 (5.3) | 0.37 | 0.72 |
| Number of endoscopies/ patient, mean (SD) | 1.3 (0.5) | 1.2 (0.9) | 0.18 | 0.20 |
Conclusions
This study represents one of the largest direct comparisons of LGIB to UGIB not based on administrative databases. The most striking finding was the nearly equal rates of LGIB and UGIB. There are 2 likely explanations for this surprising result. First, there may be methodological reasons that we identified a greater proportion of true LGIBs; our study used a highly sensitive search strategy of ICD‐9 coding with confirmatory chart abstraction to ensure that as many LGIB and UGIB cases would be identified as possible while also excluding cases not meeting accepted criteria for GIB. The second possibility is that there is an actual change in epidemiology of GIB. Known risk factors for LGIB are increasing such as advancing age, increased use of chronic aspirin therapy, and renal disease. At the same time, significant advances in the treatment and prevention of UGIB have been made. Recent studies have demonstrated similar trends in admissions for upper and lower GI complications, suggesting that there may be a changing epidemiology due primarily to reductions in upper GI complications.1, 16
Either explanation would have implications for the care of patients with GIB. Clinical decision‐making based on prior literature would support that in ambiguous clinical situations and initial evaluation for an UGIB is appropriate. Most risk stratification literature and clinical guidelines focus on UGIB. If rates of LGIB and UGIB are similar, then existing clinical decision protocols may need to be reevaluated to incorporate the higher likelihood of LGIB. This reevaluation would be less important if the clinical outcomes or resource utilization of UGIB was significantly greater than that for LGIB, but we did not find this was the case. Similarly, if the ability to distinguish between LGIB and UGIB were robust on clinical signs and symptoms, then a reevaluation would be less important. However, we found fairly similar numbers of patients initially receiving evaluation for UGIB then being evaluated for LGIB as we found patients initially receiving evaluation for LGIB then being evaluated for UGIB. This suggests the potential benefit of clinical decision protocols that could better distinguish between UGIB and LGIB and account for the potentially higher incidence of LGIB than previously thought.
In addition to affecting the attention paid to LGIB for acute management, a changed understanding of incidence could also affect the attention paid to prevention of LGIB. Of the recent nonendoscopic advances in the treatment and prevention of GIB, only the use of COX‐2s (when used in place of traditional nsNSAIDs) reduces the risk of both LGIB and UGIB;14, 1618 H .pylori treatment and PPIs only prevent UGIB. Therefore, if the clinical and financial burdens of LGIB are similar to those seen in UGIB, more attention may need to be focused on preventing LGIB.
Baseline medication use was notable primarily for the similarities between UGIB and LGIB. Agents known to affect the rates of GIB were common in both groups. Over one‐third of the population was using aspirin and 10% were taking warfarin. Over 20% of subjects were taking an nsNSAID or a COX‐2 inhibitor. Almost one‐quarter of subjects were taking a PPI, agents known to decrease rates of UGIB and potentially increase LGIB through the risk of C. difficile colitis. Notably, the only statistically significant difference in baseline medication use between subjects with UGIB and LGIB was the more than 3‐fold higher use of nsNSAIDs in patients with UGIB as compared to LGIB. While current guidelines are not clear and consistent about which populations of at‐risk patients should receive GI prophylaxis,2830 these results suggest that patients admitted with GIB are very likely to be taking medications which impact the risk of GIB.
In terms of disease severity, the clinical presentation at admission suggests a greater degree of hemodynamic instability among subjects with UGIB. Rates of orthostatic hypotension and resting tachycardia are higher in UGIB subjects, as well as having a lower mean hemoglobin levels at presentation. However, despite the more severe clinical presentation, clinical outcomes did not differ significantly between the 2 bleeding sources. Thus, the most relevant clinical outcomes suggest that the severity of both LGIB and UGIB are similar. This similarity again suggest that the clinical burden of LGIB is not significantly different than UGIB.
Our results concerning resource utilization demonstrate a similar pattern. While the point estimates for costs and LOS suggest that UGIB may be associated with higher resource utilization, these differences were not significant in either bivariate or multivariate analyses. Those subjects with UGIB did receive more total endoscopic procedures than subjects with LGIB. More interesting though was that 24% of all subjects received an endoscopy of the opposite site (LGIB with EGD and UGIB with colonoscopy). These results suggest that the site of bleeding is not clear in a significant proportion of patients who present with GIB. These additional endoscopies are associated with increased risk, costs, LOS, and discomfort to patients. Improving our ability to accurately predict the source (upper vs. lower) of bleeding would allow us to reduce the number of these excess endoscopies. Additionally, it is interesting that despite the almost universal use of endoscopies, 20% of LGIB and 14% of UGIB subjects could not have a specific etiology identified during endoscopy or subsequent workup.
There are some important limitations to this study. While the sample size is among the largest of its type involving chart abstraction, it may be underpowered to detect some differences. Additionally, our results are from a single urban academic medical center with a patient population that is predominantly African American, which may limit generalizability. This study required consent and therefore only examines a subset of patients admitted to the medical center with GIB, which could potentially introduce bias into the sample. However, it is not clear why there would be systematic differences in subjects who choose to consent vs. those who decide not to consent that would affect the results of this study in substantive ways.
Despite significant efforts at identifying all subjects with GIB admitted during this time period, there were potential methodological reasons that may have resulted in some cases being missed. Only subjects admitted to a medicine service were approached for consent. All subjects in this medical center with GIB are admitted to a medicine service. We captured all subjects who were initially admitted to a medicine service as well as those admitted initially to an ICU and then transferred to the floor at any point prior to discharge. It is possible, though, that a subject would be admitted to an ICU for GIB and die prior to being transferred to the floor. While it is the impression of the director of the ICU that this would be a very unusual event, as most of the patients would be discharged to the floor prior to death (personal communication), given the very low mortality rate seen in this study, small numbers of missed events could have a significant impact on the interpretation of in‐hospital mortality results. It is also important to note that this medical center did not have the ability to perform endoscopy prior to admission for patients with GIB at the time of the study; all patients who presented with GIB would have been admitted and identified for this study. Finally, we were unable to routinely identify the rationale for obtaining an endoscopic exam. We assumed that all endoscopic exams were done for the purpose of evaluating and/or treating the GIB for which the subject was admitted. It is possible that some subjects had additional endoscopies for other reasons, which would have led to our overestimating the rates of additional endoscopies for GIB.
This study highlights the similarities between LGIB and UGIB rather than the differences. There were few significant differences between the 2 bleeding sources in terms of incidence, clinical outcomes, and resource utilization. In fact, the study also suggests that determining the source of bleeding may not be clear, given the high rates of opposite site endoscopies. While this study did reveal several similarities between UGIB and LGIB, it also highlights the need to identify improved strategies to improve the sensitivity and specificity of identification of LGIB compared to UGIB, both for clinical purposes and for research. The value of such improved clinical algorithms have the potential to improve both the cost and outcomes of care, while better algorithms for separating UGIB and LGIB using administrative data might help produce more precise estimates of costs and clinical outcomes, and aid in the development of risk stratification models.
- ,.Hospitalizations for Gastrointestinal Bleeding in 1998 and 2006. HCUP Statistical Brief #65, December 2008.Rockville, MD:Agency for Healthcare Research and Quality.
- ,.Causes and outcome of upper and lower gastrointestinal bleeding: The Grady Hospital Experience.South Med J.1999;92(1):44–50.
- ,,, et al.Acute upper gastrointestinal haemorrhage in west of Scotland: case ascertainment study.BMJ.1997;315:510–540.
- ,.A cost‐effective approach to the patient with peptic ulcer bleeding.Surg Clin North Am.1996;76:83–103.
- .Epidemiology and outcome of patients hospitalized with acute lower gastrointestinal hemorrhage: a population based study.Am J Gastroenterol.1997;92:419–424.
- ,,.Consensus recommendations for managing patients with nonvariceal upper gastrointestinal bleeding.Ann Int Med.2003;139:843–857.
- ,.Incremental value of upper endoscopy for triage of patients with acute non‐variceal upper‐GI hemorrhage.Gastrointest Endosc2004;60:9–14.
- ,,, et al.Upper gastrointestinal hemorrhage clinical guideline‐determining the optimal hospital length of stay.Am J Med.1996;100:313–322.
- National Guideline Clearinghouse. Available at: http://www.guideline.gov. Accessed August2009.
- ,,, et al.Prevention of ulcer recurrence after eradication of Helicobacter pylori: a prospective long‐term follow‐up study.Gastroenterology.1997;113:1082–1086.
- ,,, et al.Treatment of Helicobacter pylori in patients with duodenal ulcer hemorrhage‐a long‐term randomized, controlled study.Am J Gastroenterol.2000;95:2225–2232.
- ,,, et al.Preventing recurrent upper gastrointestinal bleeding in patients with Helicobacter pylori infection who are taking low‐dose aspirin or naproxen.N Engl J Med.2001;344:967–973.
- ,,, et al.Lansoprazole for the prevention of recurrences of ulcer complications from long‐term low‐dose aspirin use.N Engl J Med.2002;346:2033–2038.
- ,,, et al.Comparison of upper gastrointestinal toxicity of rofecoxib and naproxen in patients with rheumatoid arthritis. VIGOR Study Group.N Engl J Med.2000;343:1520–1528.
- ,,, et al.Gastrointestinal toxicity with celecoxib vs nonsteroidal anti‐inflammatory drugs for osteoarthritis and rheumatoid arthritis: the CLASS study: a randomized controlled trial. Celecoxib Long‐Term Arthritis Safety Study.JAMA.2000;284:1247–1255.
- ,,, et al.Time trends and clinical impact of upper and lower gastrointestinal complications. Digestive Disease Week National Meeting,2008. San Diego, CA, May 17–22.
- ,,, et al.Video capsule endoscopy to prospectively assess small bowel injury with celecoxib, naproxen plus omeprazole, and placebo.Clin Gastroenterol Hepatol.2005;3:133–141.
- ,,, et al.Serious lower gastrointestinal clinical events with nonselective NSAID or Coxib use.Gastroenterology.2003;124:288–292.
- ,,, et al.Risk factors for upper gastrointestinal bleeding among end‐stage renal disease patients.Kidney Int.2003;64:1455–1461.
- ,,, et al.Risk factors for hospitalized bleeding among older patients.J Am Geriatr Soc.2001;49:126–133.
- Institute for Clinical Systems Improvement (ICSI). Preventive services in adults. Bloomington, MN: Institute for Clinical Systems Improvement (ICSI).2005. Available at http://www.isci.org/guidelines_and_more/guidelines_order_sets_protocol/for_patients_families/preventive_services_for_adults_for_patients_families_.html. Accessed Month year.
- .NSAID‐associated deaths: the rise and fall of NSAID‐associated GI mortality.Am J Gastroenterol.2005;100:1694–1695.
- ,.Effects of very low doses of daily long‐term aspirin therapy on gastric, duodenal, and rectal prostaglandins on mucosal injury in healthy humans.Gastroenterology. 199;117:17–25.
- ,,, et al.A nationwide study of mortality associated with hospital admission due to severe gastrointestinal events and those associated with nonsteroidal antiinflammatory drug use.Am J Gastroenterol.2005;100:1685–1693.
- ,,, et al.Acute upper GI bleeding: did anything change?Am J Gastroenterol.2003;98:1494–1499.
- ,.Lower intestinal bleeding.Best Pract Res Clin Gastroenterol.2001;15:135–153.
- ,,,.A new method of classifying prognostic comorbidity in longitudinal studies: development and validation.J Chronic Dis.1987;40:373–383.
- AGS Panel on Persistent Pain in Older Persons. The management of persistent pain in older persons.J Am Geriatr Soc.2002;50(6 suppl):S205–S224.
- ,,, et al.Pain in Osteoarthritis, Rheumatoid Arthritis and Juvenile Chronic Arthritis.2nd ed.Clinical practice guideline no. 2.Glenview, IL:American Pain Society (APS);2002:179.
- American College of Rheumatology Subcommittee on Osteoarthritis Guidelines.Recommendations for the Medical Management of Osteoarthritis of the Hip and Knee.Arthritis Rheum.2000;43:1905–1915.
Copyright © 2010 Society of Hospital Medicine
Continuing Medical Education Program in
If you wish to receive credit for this activity, which begins on the next page, please refer to the website: www. blackwellpublishing.com/cme.
Accreditation and Designation Statement
Blackwell Futura Media Services designates this educational activity for a 1 AMA PRA Category 1 Credit. Physicians should only claim credit commensurate with the extent of their participation in the activity.
Blackwell Futura Media Services is accredited by the Accreditation Council for Continuing Medical Education to provide continuing medical education for physicians.
Educational Objectives
Continuous participation in the Journal of Hospital Medicine CME program will enable learners to be better able to:
-
Interpret clinical guidelines and their applications for higher quality and more efficient care for all hospitalized patients.
-
Describe the standard of care for common illnesses and conditions treated in the hospital; such as pneumonia, COPD exacerbation, acute coronary syndrome, HF exacerbation, glycemic control, venous thromboembolic disease, stroke, etc.
-
Discuss evidence‐based recommendations involving transitions of care, including the hospital discharge process.
-
Gain insights into the roles of hospitalists as medical educators, researchers, medical ethicists, palliative care providers, and hospital‐based geriatricians.
-
Incorporate best practices for hospitalist administration, including quality improvement, patient safety, practice management, leadership, and demonstrating hospitalist value.
-
Identify evidence‐based best practices and trends for both adult and pediatric hospital medicine.
Instructions on Receiving Credit
For information on applicability and acceptance of continuing medical education credit for this activity, please consult your professional licensing board.
This activity is designed to be completed within the time designated on the title page; physicians should claim only those credits that reflect the time actually spent in the activity. To successfully earn credit, participants must complete the activity during the valid credit period that is noted on the title page.
Follow these steps to earn credit:
-
Log on to www.blackwellpublishing.com/cme.
-
Read the target audience, learning objectives, and author disclosures.
-
Read the article in print or online format.
-
Reflect on the article.
-
Access the CME Exam, and choose the best answer to each question.
-
Complete the required evaluation component of the activity.
New Therapies for UGH
Upper gastrointestinal hemorrhage (UGH) is a common cause of acute admission for hospitalization.13 However, recent advances in our understanding of erosive disease (ED) and peptic ulcer disease (PUD), 2 of the most common etiologies of UGH, have led to effective strategies to reduce the risk of UGH. Successful implementation of these strategies, such as treatment of Helicobacter pylori (H. pylori) and the use of proton pump inhibitors (PPIs) and selective cyclooxygenase‐2 inhibitors (COX‐2s) in place of traditional nonselective nonsteroidal antiinflammatory drugs (NSAIDs), may be able to significantly reduce rates of UGH caused by ED and PUD.47
Prior to these preventive treatments, PUD and ED, both acid‐related disorders, were the most common causes of UGH requiring admission to the hospital, accounting for 62% and 14% of all UGHs, respectively.2 Given the widespread treatment of H. pylori and use of PPIs and COX‐2s, we might expect that the distribution of etiologies of UGH may have changed. However, there are limited data on the distribution of etiologies of UGH in the era of effective preventive therapy.8 If the distribution of etiologies causing patients to present with UGH has fundamentally changed with these new treatments, established strategies of managing acute UGH may need to be reevaluated. Given that well‐established guidelines exist and that many hospitals use a protocol‐driven management strategy to decide on the need for admission and/or intensive care unit (ICU) admission, changes in the distribution of etiologies since the widespread use of these new pharmacologic approaches may affect the appropriateness of these protocols.9, 10 For example, if the eradication of H. pylori has dramatically reduced the proportion of UGH caused by PUD, then risk stratification studies developed when PUD was far more common may need to be revisited. This would be particularly important if bleeding from PUD was of significantly different severity than bleeding from other causes.
While patients with H. pylori‐related UGH from PUD should be treated for H. pylori eradication, several important questions remain surrounding the use of newer therapeutics that may mitigate the risk of UGH in some patients. It is unclear what proportion of patients admitted with UGH in this new era developed bleeding despite using preventive therapy. These treatment failures are known to occur, but it is not well known how much of the burden of UGH today is due to this breakthrough bleeding.5, 6, 11, 12 Contrastingly, there are also patients who are admitted with UGH who are not on preventive treatment. Current guidelines suggest that high‐risk patients requiring NSAIDs be given COX‐2s or traditional NSAIDs with a PPI.1315 However, there is significant disagreement between these national guidelines about what constitutes a high‐risk profile.1315 For example, some guidelines recommend that elderly patients requiring NSAIDs should be on a PPI while others do not make that recommendation. Similarly, while prior UGH is a well‐recognized risk factor for future bleeding risk even without NSAIDs, current guidelines do not provide guidance toward the use of preventive therapy in these patients. If there are few patients who present with UGH related to acid disease that are not on a preventive therapy, then these unanswered questions or conflicts within current guidelines become less important. However, if a large portion of UGH is due to acid‐related disease in patients not on preventive therapy, then these unanswered questions may become important for future research.
In contrast to previous studies, the current study examines the distribution of etiologies of UGH in the era of widespread use of effective preventive therapy for ED and PUD in 2 U.S. academic medical centers. Prior studies were done before the advent of new therapeutics and did not compare different sites, which may be important.16, 17
PATIENTS AND METHODS
Patients
Consecutive patients admitted with UGH were identified at 2 academic medical centers as part of a larger observational study examining the impact of hospitalist physicians on the care of acute medical patients.18 The sample was selected from the 12,091 consecutive general medical patients admitted from July 2001 to June 2003 with UGH identified by International Classification of Diseases, Ninth revision, Clinical Modification (ICD‐9 CM) codes from administrative data and confirmed by chart abstraction. ICD‐9 CM codes for UGH included: esophageal varices with hemorrhage (456.0 and 456.20), Mallory‐Weiss syndrome (530.7), gastric ulcer with hemorrhage (531.00‐531.61), duodenal ulcer with hemorrhage (532.00‐532.61), peptic ulcer, site unspecified, with hemorrhage (533.00‐533.61), gastrojejunal ulcer with hemorrhage (534.00‐534.61), gastritis with hemorrhage (535.61), angiodysplasia of stomach/duodenum with hemorrhage (537.83), and hematemesis (578.0 and 578.9).19 Finally, the admission diagnoses for all patients in the larger cohort were reviewed and any with gastrointestinal hemorrhage were screened for possible inclusion to account for any missed ICD‐9 codes. Subjects were then included in this analysis if they had observed hematemesis, nasogastric (NG) tube aspirate with gross or hemoccult blood, or history of hematemesis, bloody diarrhea, or melena upon chart review.
Data
The inpatient medical records were abstracted by trained researchers. Etiologies of UGH were assessed by esophagogastroduodenoscopy (EGD) report, which listed findings and etiologies as assessed by the endoscopist. Multiple etiologies were allowed if more than 1 source of bleeding was identified. Prior medical history and preadmission medication use were obtained from 3 sources: (1) the emergency department medical record; (2) nursing admission documentation; and (3) the admission history and physical documentation. Risk factors and preadmission medication use were considered present if documented in any of the 3 sources. Relevant past medical history included known risk factors for UGH, including: end‐stage renal disease, alcohol abuse, prior history of UGH, and steroid use. Prior H. pylori status/testing could not reliably be obtained from these data sources. Preadmission medication use of interest included aspirin, NSAIDS, anticoagulants, antiplatelet agents, as well as PPIs and COX‐2s. Demographics, including age, race, and gender, were obtained from administrative databases.
We defined subjects as at‐risk if they had any of the following risk factors: prior UGH (at any time), use of an NSAID (traditional or selective COX‐2), or use of an aspirin prior to admission. Patients taking COX‐2s were included for 2 reasons. First, while COX‐2 inhibitors are associated with a lower risk of UGH than traditional NSAIDs, it is likely that they still lead to an increased risk of UGH compared to placebo. Second, if a patient required NSAIDs of some type (traditional or selective), preadmission use of a COX‐2 rather than a traditional NSAID may reflect the intention of decreasing the risk of UGH compared to using traditional NSAIDs. In order to use the most conservative estimate of potential missed opportunities for prevention, preadmission use of a PPI or COX‐2 was considered preventive therapy. All preadmission medication use was obtained from chart review. Therefore, duration of and purpose for medication use were not available.
Development of the abstraction tool was performed by the authors. Testing of the tool was performed on a learning set of 20 charts at each center. All additional abstractors were trained with a learning set of at least 20 charts to assure uniform abstraction techniques.
Analysis
For each risk factor and etiology, we calculated the proportion of patients with the risk factor or etiology both overall and by site. Differences in risk factors between sites were assessed using chi‐square tests of association. Differences in etiologies between sites were assessed using unadjusted odds ratios (ORs) as well as ORs from logistic regression models controlling for age, gender, and race (black versus not black). Center 1 was the urban center and center 2 was the rural site.
This study was approved by the Institutional Review Board at the University of Iowa Carver College of Medicine and the University of Chicago.
RESULTS
From the entire cohort of 12,091 admitted to the 2 inpatient medical services, 227 (1.9%) patients were identified as having UGH; 138 (61%) were from center 1, where 87% of patients were black and 89 (39%) were from center 2, where 89% of patients were white. Overall, the mean age was 59 years, 45% were female, and 41% were white (Table 1).
| Characteristic | Total (n = 227) | Center 1 (n = 138) | Center 2 (n = 89) | P Value Center 1 versus 2 |
|---|---|---|---|---|
| ||||
| Mean age (years) | 58.6 | 59.5 | 57.1 | 0.317 |
| % Female | 44.5 | 48.6 | 38.2 | 0.126 |
| % White | 41.2 | 10.2 | 88.8 | <0.001 |
| % African American | 54.0 | 86.9 | 3.4 | <0.001 |
| % Other | 4.9 | 2.9 | 7.9 | <0.001 |
The most common etiologies of UGH were ED (44%), PUD (33%), and varices (17%) in the overall population. These same 3 etiologies were also the most common in both of the medical centers, although there were significant differences in the rates of etiologies between the 2 centers. ED was more common among subjects from center 1 (59%) than from center 2 (19%) (P < 0.001), while variceal bleeding was more common among subjects from center 2 (34%) than from center 1 (6.5%) (P = 0.009) (Table 2).
| Etiology | All n = 227 (%) | Center 1 n = 138 (%) | Center 2 n = 89 (%) | Unadjusted OR (95% CI): Center 1 versus 2 | P Value for Unadjusted OR | Adjusted* OR (95% CI): Center 1 versus 2 | P Value (for Adjusted OR) |
|---|---|---|---|---|---|---|---|
| |||||||
| ED | 43.6 | 59.4 | 19.1 | 6.20 (3.3111.62) | <0.001 | 7.10 (2.4820.31) | <0.001 |
| PUD | 33.0 | 37.0 | 27.0 | 1.59 (0.892.84) | 0.119 | 1.33 (0.483.67) | 0.578 |
| Varices | 17.2 | 6.5 | 33.7 | 0.14 (0.060.31) | <0.001 | 0.12 (0.030.60) | 0.009 |
| AVM | 5.3 | 2.9 | 9.0 | 0.30 (0.091.04) | 0.057 | 0.21 (0.031.69) | 0.141 |
| Mallory Weiss Tear | 4.9 | 4.4 | 5.6 | 0.76 (0.232.58) | 0.664 | 0.34 (0.024.85) | 0.425 |
| Cancer/masses | 2.6 | 2.9 | 2.3 | 1.30 (0.237.24) | 0.766 | 0.62 (0.0312.12) | 0.751 |
In multivariate logistic regression analyses, only age and site remained independent predictors of etiologies. Advancing age was associated with a higher risk of arteriovenous malformations (AVMs) with the odds of AVMs increasing 6% for every additional year of life (P = 0.007). Site was associated with both ED and variceal bleeding. Patients from center 1 were significantly more likely to have UGH caused by ED, with an OR = 7.10 (P < 0.001), compared to subjects from center 2. However, subjects from center 1 had a significantly lower OR (OR = 0.12) than those subjects at center 2 (P = 0.009) of having UGH caused by a variceal bleed (Table 2).
Risk factors for UGH were common among the patients, including use of aspirin (25.1%), NSAIDs (22.9%), COX‐2s (4.9%), or prior history of UGH (43%). Additionally, 6.6% of patients were taking both an NSAID and aspirin. Differences between the 2 sites were seen only in aspirin use, with 34.8% of patients in the center 1 population using aspirin compared to 10.1% in center 2 (P < 0.001) (Table 3).
| Risk Factor | All (%) | Center 1 (%) | Center 2 (%) | P Value |
|---|---|---|---|---|
| ||||
| Previous UGH | 42.7 | 41.3 | 45.2 | 0.586 |
| NSAID use | 22.9 | 21.7 | 24.7 | 0.602 |
| ASA use | 25.1 | 34.8 | 10.1 | <0.001 |
| NSAID + ASA | 6.6 | 6.5 | 6.7 | 0.948 |
| COX‐2 use | 4.9 | 6.5 | 2.3 | 0.143 |
| PPI use | 18.5 | 18.1 | 19.1 | 0.852 |
Among the overall population, 68.7% of patients had identifiable risk factors (prior history of UGH or preadmission use of aspirin, NSAIDs, or COX‐2s). Of all subjects, 18.5% were on PPIs and 4.9% were taking COX‐2s while 21.1% of at risk subjects were on PPIs and 6.5% of these subjects were on a COX‐2.
Finally, we examined the effects of variations in preadmission medication use between the sites on the etiologies of UGH. None of the site‐based differences in etiologies could be explained by differences in preadmission medication patterns.
DISCUSSION
Despite the emergence of effective therapies for lowering the risk of ED and PUD, these remain the most common etiologies of UGH in our cohort of patients. In a dramatic change from historically reported patterns, ED was more common than PUD. In prior studies, PUD accounted for almost two‐thirds of all UGH.2 While some of the newer therapeutics such as PPIs and COX‐2s reduce the risk for acid‐related bleeding of all types, H. pylori eradication is effective primarily for PUD. Therefore, it may be that widespread testing and treatment of H. pylori have dramatically decreased rates of PUD. Unfortunately, this study does not allow us to directly evaluate the effect of H. pylori treatment on the changing epidemiology of UGH, as that would require a population‐based study.
While decreasing rates of PUD could explain a portion of the change in the distribution of etiologies, increasing rates of ED could also be playing a role. Prior studies have suggested that African Americans and the elderly are more susceptible to ED, particularly in the setting of NSAIDs and/or aspirin use, and less susceptible to cirrhosis.13, 16, 17, 2023 Our finding of a higher rate of ED and lower rates of cirrhosis in center 1 with a higher proportion of African Americans and greater aspirin use is consistent with these prior findings. However, in multivariate analyses, neither race nor preadmission medication use patterns explained the differences in etiologies seen. This suggests that some other factors must play a role in the differences between the 2 centers studied. These results emphasize the importance of local site characteristics in the interpretation and implementation of national guidelines and recommendations. This finding may be particularly important in diseases and clinical presentations that rely on protocol‐driven pathways, such as UGH. Current recommendations on implementing clinical pathways derived from national guidelines emphasize the fact that national development and local implementation optimization is probably the best approach for effective pathway utilization.24
It is important to understand why ED and PUD, for which we now have effective pharmacologic therapies, continue to account for such a large percentage of the burden of UGH. In this study, we found that a majority of subjects were known to have significant risk factors for UGH (aspirin use, NSAID use, COX‐2s, or prior UGH) and only 31% of the subjects could not have been identified as at‐risk prior to admission. PPIs or COX‐2s should not be used universally as preventive therapy, and they are not completely effective at preventing UGH in at‐risk patients. In this study, two‐thirds of patients with risk factors were not on preventive therapy, but almost one‐third of patients with risk factors had bleeding despite being on preventive therapy. A better understanding of why these treatment failures (bleeding despite preventive therapy) occur may be helpful in our future ability to prevent UGH. This study was not designed to determine if the two‐thirds of patients not taking preventive therapy were being treated consistent with established guidelines. However, current guidelines have significant variation in recommendations as to which patients are at high enough risk to warrant preventive therapy,1315 and there is no consensus as to which patients are at high enough risk to warrant preventive therapy. Our data suggest that additional studies will be required to determine the optimal recommendations for preventive therapy among at‐risk patients.
There are several limitations to this study. First, it only included 2 academic institutions. However, these institutions represented very different patient populations. Second, the study design is not a population‐based study. This limitation prevents us from addressing questions such as the effectiveness or cost‐effectiveness of interventions to prevent admission for UGH. Although we analyzed preadmission PPI or COX‐2 use in at‐risk patients as preventive therapy, we are unable to determine the actual intent of the physician in prescribing these drugs. Finally, although the mechanisms by which PPIs and COX‐2 affect the risk of UGH are fundamentally different and should not be considered equivalent choices, we chose to analyze either option as representing a preventive strategy in order to provide the most conservative estimate possible of preventive therapy utilization rates. However, our assumptions would generally overestimate the use of preventive therapy (as opposed to PPI use for symptom control), as we assumed all potentially preventive therapy was intended as such.
This study highlights several unanswered questions that may be important in the management of UGH. First, identifying factors that affect local patters of UGH may better inform local implementation of nationally developed guidelines. Second, a more complete understanding of the impact positive and negative risk factors for UGH have on specific patient populations may allow for a more consistent targeted approach to using preventive therapy in at‐risk patients.
Finally, and perhaps most importantly, is to determine if the change in distribution of etiologies is in fact related to a decline in bleeding related to PUD. In addition to this being a marker of the success of the H. pylori story, it may have important implications on our understanding of the acute management of UGH. If PUD is of a different severity than other common causes of UGH, such as ED, current risk stratification prediction models may need to be revalidated. For example, if UGH secondary to PUD results in greater morbidity and mortality than UGH secondary to ED, our current models identifying who requires ICU admission, urgent endoscopy, and other therapeutic interventions may result in overutilization of these resource intensive interventions. However, if larger studies do not confirm this decline in PUD it suggests the need for additional studies to identify why PUD remains so prevalent despite the major advances in treatment and prevention of PUD through H. pylori identification and eradication.
- ,,, et al.Effects of physician experience on costs and outcomes on an academic general medicine service: results of a trial of hospitalists.Ann Int Med.2002;137(11):866–874.
- .Epidemiology of hospitalization for acute upper gastrointestinal hemorrhage: a population‐based study.Am J Gastroenterol.1995;90(2):206–210.
- ,,, et al.Epidemiology and course of acute upper gastro‐intestinal haemorrhage in four French geographical areas.Eur J Gastroenterol Hepatol.2000;12:175–181.
- ,,, et al.Prevention of ulcer recurrence after eradication of Helicobacter pylore: a prospective long‐term follow‐up study.Gastroenterology.1997;113:1082–1086.
- ,,, et al.Treatment of Helicobacter pylore in patients with duodenal ulcer hemorrhage‐a long‐term randomized, controlled study.Am J Gasterenterol.2000;95:2225–2232.
- ,,, et al.Preventing recurrent upper gastrointestinal bleeding in patients with Helicobacter pylori infection who are taking low‐dose aspirin or naproxen.N Engl J Med.2001;344:967–973.
- ,,, et al.Lansoprazole for the prevention of recurrences of ulcer complications from long‐term low‐dose aspirin use.N Engl J Med.2002;346:2033–2038.
- ,,, et al.Acute upper GI bleeding: did anything change?: time trend analysis of incidence and outcome of acute upper GI bleeding between 1993/1994 and 2000.Am J Gastroenterol.2003;98:1494–1499.
- ,,, et al.Upper gastrointestinal hemorrhage clinical guideline‐determining the optimal length of stay.Am J Med.1996;100:313–322.
- ,,.Consensus recommendations for managing patients with nonvariceal upper gastrointestinal bleeding.Ann Intern Med.2003;139:843–857.
- ,,, et al.Comparison of upper gastrointestinal toxicity of rofecoxib and naproxen in patients with rheumatoid arthritis. VIGOR Study Group.N Engl J Med.2000;343:1520–1528.
- ,, et al.Gastrointestinal toxicity with celecoxib vs nonsteroidal anti‐inflammatory drugs for osteoarthritis and rheumatoid arthritis: the CLASS study: a randomized controlled trial. Celecoxib Long‐term Arthritis Safety Study.JAMA.2000;284:1247–1255.
- AGS Panel on Persistent Pain in Older Persons.The management of persistent pain in older persons.J Am Geriatr Soc.2002;50(6 Suppl):S205–S224.
- ,,, et al.Pain in osteoarthritis, rheumatoid arthritis and juvenile chronic arthritis.2nd ed.Clinical practice guideline no. 2.Glenview, IL:American Pain Society (APS);2002:179 p.
- .Recommendations for the medical management of osteoarthritis of the hip and knee.Arthritis Rheum.2000;43:1905–1915.
- ,,, et al.Incidence of and mortality from acute upper gastrointestinal haemorrhage in the United Kingdom.BMJ.1995;311:222–226.
- ,,, et al.Risk factors for hospitalized gastrointestinal bleeding among older persons.J Am Geriatr Soc.2001;49:126–133.
- ,,, et al.Effects of inpatient experience on outcomes and costs in a multicenter trial of academic hospitalists.Society of General Internal Medicine Annual Meeting2005.
- ,,,,,.Early endoscopy in upper gastrointestinal hemorrhage: association with recurrent bleeding, surgery, and length of hospital stay.Gastrointest Endosc.1999;49(2):145–152.
- ,,, et al.A comparison of the spectrum of chronic hepatitis C virus between Caucasians and African Americans.Clin Gastroenterol Hepatol.2004;2:469–473.
- ,,, et al.Gastroesophageal reflux among different racial groups in the United States.Gastroenterology.2004;126:1692–1699.
- ,,,.Risk factors for erosive reflux esophagitis: a case‐control study.Am J Gastroenterol.2001;96:41–46.
- ,.Upper gastrointestinal toxicity of nonsteroidal anti‐inflammatory drugs in African‐American and Hispanic elderly patients.Ethn Dis.2003;13:528–533.
- ,.Evidence‐based quality improvement: the state of the science.Health Aff (Millwood).2005;24(1):138–150.
Upper gastrointestinal hemorrhage (UGH) is a common cause of acute admission for hospitalization.13 However, recent advances in our understanding of erosive disease (ED) and peptic ulcer disease (PUD), 2 of the most common etiologies of UGH, have led to effective strategies to reduce the risk of UGH. Successful implementation of these strategies, such as treatment of Helicobacter pylori (H. pylori) and the use of proton pump inhibitors (PPIs) and selective cyclooxygenase‐2 inhibitors (COX‐2s) in place of traditional nonselective nonsteroidal antiinflammatory drugs (NSAIDs), may be able to significantly reduce rates of UGH caused by ED and PUD.47
Prior to these preventive treatments, PUD and ED, both acid‐related disorders, were the most common causes of UGH requiring admission to the hospital, accounting for 62% and 14% of all UGHs, respectively.2 Given the widespread treatment of H. pylori and use of PPIs and COX‐2s, we might expect that the distribution of etiologies of UGH may have changed. However, there are limited data on the distribution of etiologies of UGH in the era of effective preventive therapy.8 If the distribution of etiologies causing patients to present with UGH has fundamentally changed with these new treatments, established strategies of managing acute UGH may need to be reevaluated. Given that well‐established guidelines exist and that many hospitals use a protocol‐driven management strategy to decide on the need for admission and/or intensive care unit (ICU) admission, changes in the distribution of etiologies since the widespread use of these new pharmacologic approaches may affect the appropriateness of these protocols.9, 10 For example, if the eradication of H. pylori has dramatically reduced the proportion of UGH caused by PUD, then risk stratification studies developed when PUD was far more common may need to be revisited. This would be particularly important if bleeding from PUD was of significantly different severity than bleeding from other causes.
While patients with H. pylori‐related UGH from PUD should be treated for H. pylori eradication, several important questions remain surrounding the use of newer therapeutics that may mitigate the risk of UGH in some patients. It is unclear what proportion of patients admitted with UGH in this new era developed bleeding despite using preventive therapy. These treatment failures are known to occur, but it is not well known how much of the burden of UGH today is due to this breakthrough bleeding.5, 6, 11, 12 Contrastingly, there are also patients who are admitted with UGH who are not on preventive treatment. Current guidelines suggest that high‐risk patients requiring NSAIDs be given COX‐2s or traditional NSAIDs with a PPI.1315 However, there is significant disagreement between these national guidelines about what constitutes a high‐risk profile.1315 For example, some guidelines recommend that elderly patients requiring NSAIDs should be on a PPI while others do not make that recommendation. Similarly, while prior UGH is a well‐recognized risk factor for future bleeding risk even without NSAIDs, current guidelines do not provide guidance toward the use of preventive therapy in these patients. If there are few patients who present with UGH related to acid disease that are not on a preventive therapy, then these unanswered questions or conflicts within current guidelines become less important. However, if a large portion of UGH is due to acid‐related disease in patients not on preventive therapy, then these unanswered questions may become important for future research.
In contrast to previous studies, the current study examines the distribution of etiologies of UGH in the era of widespread use of effective preventive therapy for ED and PUD in 2 U.S. academic medical centers. Prior studies were done before the advent of new therapeutics and did not compare different sites, which may be important.16, 17
PATIENTS AND METHODS
Patients
Consecutive patients admitted with UGH were identified at 2 academic medical centers as part of a larger observational study examining the impact of hospitalist physicians on the care of acute medical patients.18 The sample was selected from the 12,091 consecutive general medical patients admitted from July 2001 to June 2003 with UGH identified by International Classification of Diseases, Ninth revision, Clinical Modification (ICD‐9 CM) codes from administrative data and confirmed by chart abstraction. ICD‐9 CM codes for UGH included: esophageal varices with hemorrhage (456.0 and 456.20), Mallory‐Weiss syndrome (530.7), gastric ulcer with hemorrhage (531.00‐531.61), duodenal ulcer with hemorrhage (532.00‐532.61), peptic ulcer, site unspecified, with hemorrhage (533.00‐533.61), gastrojejunal ulcer with hemorrhage (534.00‐534.61), gastritis with hemorrhage (535.61), angiodysplasia of stomach/duodenum with hemorrhage (537.83), and hematemesis (578.0 and 578.9).19 Finally, the admission diagnoses for all patients in the larger cohort were reviewed and any with gastrointestinal hemorrhage were screened for possible inclusion to account for any missed ICD‐9 codes. Subjects were then included in this analysis if they had observed hematemesis, nasogastric (NG) tube aspirate with gross or hemoccult blood, or history of hematemesis, bloody diarrhea, or melena upon chart review.
Data
The inpatient medical records were abstracted by trained researchers. Etiologies of UGH were assessed by esophagogastroduodenoscopy (EGD) report, which listed findings and etiologies as assessed by the endoscopist. Multiple etiologies were allowed if more than 1 source of bleeding was identified. Prior medical history and preadmission medication use were obtained from 3 sources: (1) the emergency department medical record; (2) nursing admission documentation; and (3) the admission history and physical documentation. Risk factors and preadmission medication use were considered present if documented in any of the 3 sources. Relevant past medical history included known risk factors for UGH, including: end‐stage renal disease, alcohol abuse, prior history of UGH, and steroid use. Prior H. pylori status/testing could not reliably be obtained from these data sources. Preadmission medication use of interest included aspirin, NSAIDS, anticoagulants, antiplatelet agents, as well as PPIs and COX‐2s. Demographics, including age, race, and gender, were obtained from administrative databases.
We defined subjects as at‐risk if they had any of the following risk factors: prior UGH (at any time), use of an NSAID (traditional or selective COX‐2), or use of an aspirin prior to admission. Patients taking COX‐2s were included for 2 reasons. First, while COX‐2 inhibitors are associated with a lower risk of UGH than traditional NSAIDs, it is likely that they still lead to an increased risk of UGH compared to placebo. Second, if a patient required NSAIDs of some type (traditional or selective), preadmission use of a COX‐2 rather than a traditional NSAID may reflect the intention of decreasing the risk of UGH compared to using traditional NSAIDs. In order to use the most conservative estimate of potential missed opportunities for prevention, preadmission use of a PPI or COX‐2 was considered preventive therapy. All preadmission medication use was obtained from chart review. Therefore, duration of and purpose for medication use were not available.
Development of the abstraction tool was performed by the authors. Testing of the tool was performed on a learning set of 20 charts at each center. All additional abstractors were trained with a learning set of at least 20 charts to assure uniform abstraction techniques.
Analysis
For each risk factor and etiology, we calculated the proportion of patients with the risk factor or etiology both overall and by site. Differences in risk factors between sites were assessed using chi‐square tests of association. Differences in etiologies between sites were assessed using unadjusted odds ratios (ORs) as well as ORs from logistic regression models controlling for age, gender, and race (black versus not black). Center 1 was the urban center and center 2 was the rural site.
This study was approved by the Institutional Review Board at the University of Iowa Carver College of Medicine and the University of Chicago.
RESULTS
From the entire cohort of 12,091 admitted to the 2 inpatient medical services, 227 (1.9%) patients were identified as having UGH; 138 (61%) were from center 1, where 87% of patients were black and 89 (39%) were from center 2, where 89% of patients were white. Overall, the mean age was 59 years, 45% were female, and 41% were white (Table 1).
| Characteristic | Total (n = 227) | Center 1 (n = 138) | Center 2 (n = 89) | P Value Center 1 versus 2 |
|---|---|---|---|---|
| ||||
| Mean age (years) | 58.6 | 59.5 | 57.1 | 0.317 |
| % Female | 44.5 | 48.6 | 38.2 | 0.126 |
| % White | 41.2 | 10.2 | 88.8 | <0.001 |
| % African American | 54.0 | 86.9 | 3.4 | <0.001 |
| % Other | 4.9 | 2.9 | 7.9 | <0.001 |
The most common etiologies of UGH were ED (44%), PUD (33%), and varices (17%) in the overall population. These same 3 etiologies were also the most common in both of the medical centers, although there were significant differences in the rates of etiologies between the 2 centers. ED was more common among subjects from center 1 (59%) than from center 2 (19%) (P < 0.001), while variceal bleeding was more common among subjects from center 2 (34%) than from center 1 (6.5%) (P = 0.009) (Table 2).
| Etiology | All n = 227 (%) | Center 1 n = 138 (%) | Center 2 n = 89 (%) | Unadjusted OR (95% CI): Center 1 versus 2 | P Value for Unadjusted OR | Adjusted* OR (95% CI): Center 1 versus 2 | P Value (for Adjusted OR) |
|---|---|---|---|---|---|---|---|
| |||||||
| ED | 43.6 | 59.4 | 19.1 | 6.20 (3.3111.62) | <0.001 | 7.10 (2.4820.31) | <0.001 |
| PUD | 33.0 | 37.0 | 27.0 | 1.59 (0.892.84) | 0.119 | 1.33 (0.483.67) | 0.578 |
| Varices | 17.2 | 6.5 | 33.7 | 0.14 (0.060.31) | <0.001 | 0.12 (0.030.60) | 0.009 |
| AVM | 5.3 | 2.9 | 9.0 | 0.30 (0.091.04) | 0.057 | 0.21 (0.031.69) | 0.141 |
| Mallory Weiss Tear | 4.9 | 4.4 | 5.6 | 0.76 (0.232.58) | 0.664 | 0.34 (0.024.85) | 0.425 |
| Cancer/masses | 2.6 | 2.9 | 2.3 | 1.30 (0.237.24) | 0.766 | 0.62 (0.0312.12) | 0.751 |
In multivariate logistic regression analyses, only age and site remained independent predictors of etiologies. Advancing age was associated with a higher risk of arteriovenous malformations (AVMs) with the odds of AVMs increasing 6% for every additional year of life (P = 0.007). Site was associated with both ED and variceal bleeding. Patients from center 1 were significantly more likely to have UGH caused by ED, with an OR = 7.10 (P < 0.001), compared to subjects from center 2. However, subjects from center 1 had a significantly lower OR (OR = 0.12) than those subjects at center 2 (P = 0.009) of having UGH caused by a variceal bleed (Table 2).
Risk factors for UGH were common among the patients, including use of aspirin (25.1%), NSAIDs (22.9%), COX‐2s (4.9%), or prior history of UGH (43%). Additionally, 6.6% of patients were taking both an NSAID and aspirin. Differences between the 2 sites were seen only in aspirin use, with 34.8% of patients in the center 1 population using aspirin compared to 10.1% in center 2 (P < 0.001) (Table 3).
| Risk Factor | All (%) | Center 1 (%) | Center 2 (%) | P Value |
|---|---|---|---|---|
| ||||
| Previous UGH | 42.7 | 41.3 | 45.2 | 0.586 |
| NSAID use | 22.9 | 21.7 | 24.7 | 0.602 |
| ASA use | 25.1 | 34.8 | 10.1 | <0.001 |
| NSAID + ASA | 6.6 | 6.5 | 6.7 | 0.948 |
| COX‐2 use | 4.9 | 6.5 | 2.3 | 0.143 |
| PPI use | 18.5 | 18.1 | 19.1 | 0.852 |
Among the overall population, 68.7% of patients had identifiable risk factors (prior history of UGH or preadmission use of aspirin, NSAIDs, or COX‐2s). Of all subjects, 18.5% were on PPIs and 4.9% were taking COX‐2s while 21.1% of at risk subjects were on PPIs and 6.5% of these subjects were on a COX‐2.
Finally, we examined the effects of variations in preadmission medication use between the sites on the etiologies of UGH. None of the site‐based differences in etiologies could be explained by differences in preadmission medication patterns.
DISCUSSION
Despite the emergence of effective therapies for lowering the risk of ED and PUD, these remain the most common etiologies of UGH in our cohort of patients. In a dramatic change from historically reported patterns, ED was more common than PUD. In prior studies, PUD accounted for almost two‐thirds of all UGH.2 While some of the newer therapeutics such as PPIs and COX‐2s reduce the risk for acid‐related bleeding of all types, H. pylori eradication is effective primarily for PUD. Therefore, it may be that widespread testing and treatment of H. pylori have dramatically decreased rates of PUD. Unfortunately, this study does not allow us to directly evaluate the effect of H. pylori treatment on the changing epidemiology of UGH, as that would require a population‐based study.
While decreasing rates of PUD could explain a portion of the change in the distribution of etiologies, increasing rates of ED could also be playing a role. Prior studies have suggested that African Americans and the elderly are more susceptible to ED, particularly in the setting of NSAIDs and/or aspirin use, and less susceptible to cirrhosis.13, 16, 17, 2023 Our finding of a higher rate of ED and lower rates of cirrhosis in center 1 with a higher proportion of African Americans and greater aspirin use is consistent with these prior findings. However, in multivariate analyses, neither race nor preadmission medication use patterns explained the differences in etiologies seen. This suggests that some other factors must play a role in the differences between the 2 centers studied. These results emphasize the importance of local site characteristics in the interpretation and implementation of national guidelines and recommendations. This finding may be particularly important in diseases and clinical presentations that rely on protocol‐driven pathways, such as UGH. Current recommendations on implementing clinical pathways derived from national guidelines emphasize the fact that national development and local implementation optimization is probably the best approach for effective pathway utilization.24
It is important to understand why ED and PUD, for which we now have effective pharmacologic therapies, continue to account for such a large percentage of the burden of UGH. In this study, we found that a majority of subjects were known to have significant risk factors for UGH (aspirin use, NSAID use, COX‐2s, or prior UGH) and only 31% of the subjects could not have been identified as at‐risk prior to admission. PPIs or COX‐2s should not be used universally as preventive therapy, and they are not completely effective at preventing UGH in at‐risk patients. In this study, two‐thirds of patients with risk factors were not on preventive therapy, but almost one‐third of patients with risk factors had bleeding despite being on preventive therapy. A better understanding of why these treatment failures (bleeding despite preventive therapy) occur may be helpful in our future ability to prevent UGH. This study was not designed to determine if the two‐thirds of patients not taking preventive therapy were being treated consistent with established guidelines. However, current guidelines have significant variation in recommendations as to which patients are at high enough risk to warrant preventive therapy,1315 and there is no consensus as to which patients are at high enough risk to warrant preventive therapy. Our data suggest that additional studies will be required to determine the optimal recommendations for preventive therapy among at‐risk patients.
There are several limitations to this study. First, it only included 2 academic institutions. However, these institutions represented very different patient populations. Second, the study design is not a population‐based study. This limitation prevents us from addressing questions such as the effectiveness or cost‐effectiveness of interventions to prevent admission for UGH. Although we analyzed preadmission PPI or COX‐2 use in at‐risk patients as preventive therapy, we are unable to determine the actual intent of the physician in prescribing these drugs. Finally, although the mechanisms by which PPIs and COX‐2 affect the risk of UGH are fundamentally different and should not be considered equivalent choices, we chose to analyze either option as representing a preventive strategy in order to provide the most conservative estimate possible of preventive therapy utilization rates. However, our assumptions would generally overestimate the use of preventive therapy (as opposed to PPI use for symptom control), as we assumed all potentially preventive therapy was intended as such.
This study highlights several unanswered questions that may be important in the management of UGH. First, identifying factors that affect local patters of UGH may better inform local implementation of nationally developed guidelines. Second, a more complete understanding of the impact positive and negative risk factors for UGH have on specific patient populations may allow for a more consistent targeted approach to using preventive therapy in at‐risk patients.
Finally, and perhaps most importantly, is to determine if the change in distribution of etiologies is in fact related to a decline in bleeding related to PUD. In addition to this being a marker of the success of the H. pylori story, it may have important implications on our understanding of the acute management of UGH. If PUD is of a different severity than other common causes of UGH, such as ED, current risk stratification prediction models may need to be revalidated. For example, if UGH secondary to PUD results in greater morbidity and mortality than UGH secondary to ED, our current models identifying who requires ICU admission, urgent endoscopy, and other therapeutic interventions may result in overutilization of these resource intensive interventions. However, if larger studies do not confirm this decline in PUD it suggests the need for additional studies to identify why PUD remains so prevalent despite the major advances in treatment and prevention of PUD through H. pylori identification and eradication.
- ,,, et al.Effects of physician experience on costs and outcomes on an academic general medicine service: results of a trial of hospitalists.Ann Int Med.2002;137(11):866–874.
- .Epidemiology of hospitalization for acute upper gastrointestinal hemorrhage: a population‐based study.Am J Gastroenterol.1995;90(2):206–210.
- ,,, et al.Epidemiology and course of acute upper gastro‐intestinal haemorrhage in four French geographical areas.Eur J Gastroenterol Hepatol.2000;12:175–181.
- ,,, et al.Prevention of ulcer recurrence after eradication of Helicobacter pylore: a prospective long‐term follow‐up study.Gastroenterology.1997;113:1082–1086.
- ,,, et al.Treatment of Helicobacter pylore in patients with duodenal ulcer hemorrhage‐a long‐term randomized, controlled study.Am J Gasterenterol.2000;95:2225–2232.
- ,,, et al.Preventing recurrent upper gastrointestinal bleeding in patients with Helicobacter pylori infection who are taking low‐dose aspirin or naproxen.N Engl J Med.2001;344:967–973.
- ,,, et al.Lansoprazole for the prevention of recurrences of ulcer complications from long‐term low‐dose aspirin use.N Engl J Med.2002;346:2033–2038.
- ,,, et al.Acute upper GI bleeding: did anything change?: time trend analysis of incidence and outcome of acute upper GI bleeding between 1993/1994 and 2000.Am J Gastroenterol.2003;98:1494–1499.
- ,,, et al.Upper gastrointestinal hemorrhage clinical guideline‐determining the optimal length of stay.Am J Med.1996;100:313–322.
- ,,.Consensus recommendations for managing patients with nonvariceal upper gastrointestinal bleeding.Ann Intern Med.2003;139:843–857.
- ,,, et al.Comparison of upper gastrointestinal toxicity of rofecoxib and naproxen in patients with rheumatoid arthritis. VIGOR Study Group.N Engl J Med.2000;343:1520–1528.
- ,, et al.Gastrointestinal toxicity with celecoxib vs nonsteroidal anti‐inflammatory drugs for osteoarthritis and rheumatoid arthritis: the CLASS study: a randomized controlled trial. Celecoxib Long‐term Arthritis Safety Study.JAMA.2000;284:1247–1255.
- AGS Panel on Persistent Pain in Older Persons.The management of persistent pain in older persons.J Am Geriatr Soc.2002;50(6 Suppl):S205–S224.
- ,,, et al.Pain in osteoarthritis, rheumatoid arthritis and juvenile chronic arthritis.2nd ed.Clinical practice guideline no. 2.Glenview, IL:American Pain Society (APS);2002:179 p.
- .Recommendations for the medical management of osteoarthritis of the hip and knee.Arthritis Rheum.2000;43:1905–1915.
- ,,, et al.Incidence of and mortality from acute upper gastrointestinal haemorrhage in the United Kingdom.BMJ.1995;311:222–226.
- ,,, et al.Risk factors for hospitalized gastrointestinal bleeding among older persons.J Am Geriatr Soc.2001;49:126–133.
- ,,, et al.Effects of inpatient experience on outcomes and costs in a multicenter trial of academic hospitalists.Society of General Internal Medicine Annual Meeting2005.
- ,,,,,.Early endoscopy in upper gastrointestinal hemorrhage: association with recurrent bleeding, surgery, and length of hospital stay.Gastrointest Endosc.1999;49(2):145–152.
- ,,, et al.A comparison of the spectrum of chronic hepatitis C virus between Caucasians and African Americans.Clin Gastroenterol Hepatol.2004;2:469–473.
- ,,, et al.Gastroesophageal reflux among different racial groups in the United States.Gastroenterology.2004;126:1692–1699.
- ,,,.Risk factors for erosive reflux esophagitis: a case‐control study.Am J Gastroenterol.2001;96:41–46.
- ,.Upper gastrointestinal toxicity of nonsteroidal anti‐inflammatory drugs in African‐American and Hispanic elderly patients.Ethn Dis.2003;13:528–533.
- ,.Evidence‐based quality improvement: the state of the science.Health Aff (Millwood).2005;24(1):138–150.
Copyright © 2009 Society of Hospital Medicine