Through the creation of the process map, the project team found that there was wide variation in the process and structure for scheduling surgeries. Some departments used one central scheduler while others used individual secretaries for each surgeon. Some surgeons maintained control over changing their schedule, while others did not. Further, the project team learned that the metric of block utilization rate was of varying importance to people working on the ground.
As each department used a unique process to schedule surgeries in their assigned block times, the project team decided to focus on one department. Urology was chosen because they were a smaller department and demonstrated readiness for change. The process map for urology is shown in Figure 1 .Tool 4: Fishbone Diagram
After understanding the process, the project team considered all of the factors that
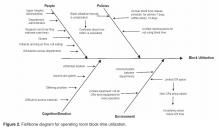
could influence block utilization rates using a fishbone diagram ( Figure 2 ). Many people and systems could impact to the global aim of improving block utilization rate and the fishbone diagram served as an organized way to visualize and consider which of the many contributing factors to focus on first.Tool 5: Specific Aim
Though the global aim was to improve block utilization, the project team needed to chose a specific aim that met S.M.A.R.T criteria: Specific, Measureable, Achievable, Results-focused, and Time-bound [7]. After considering multiple potential areas of initial focus, the OR staff suggested focusing on the issue of case length accuracy. In qualitative interviews, the student team had found that the surgery request forms ask for “case length,” and the schedulers were not sure how the surgeons defined it. When the OR is booked for an operation, the amount of time blocked out is the time from when the patient is brought into the operating room to the time that the patient leaves the room, or WIWO (Wheels In Wheels Out). This WIWO time includes anesthesia induction and preparations for surgery such as positioning. Some surgeons think about case length as only the time that the patient is operated on, or CTC (Cut to Close). Thus, the surgeon may be requesting less time than is really necessary for the case if he or she is only thinking about CTC time. The student team created a survey and found that 2 urology surgeons considered case length to be WIWO, and 4 considered case length to mean CTC.
In order to understand the potential impact of this difference, the project team compared the recorded case length (WIWO time) with the time that had been requested for the urology surgeons in 2014. Surgeons in this department varied from 21%-40% in their case length accuracy ( Table 2 ). Given these discrepancies, the project team established the following specific aim: We will improve the percentage of “accurate” case lengths by 10% in one week (with “accurate” defined as within 15 minutes of the scheduled time).Tools 6 and 7: PDSA Cycle and Control Charts
The Plan-Do-Study-Act cycle is an iterative plan of action for designing and testing a specific change [7]. This part of the QI cycle involved implementing and testing a change to address our specific aim. As the first cycle of change, the team requested that the scheduler add 15 minutes to the surgeons’ requested case time over 1 week. Of the urologists scheduled that week, one had used CTC and the other had not completed the student team’s survey. In order to study the change, the project team used control charts for the 2 surgeons whose case times were adapted. Prior to the intervention, the surgeons averaged at least 20 minutes over their scheduled time, with wide variation. Surgeons were infrequently completing cases at or below their requested case time. Most of the inaccuracy came from going long. The team used control charts to understand the impact of the change. The control charts showed that after the change in scheduling time, the 2 surgeons still went over their allotted case time, but to a lesser degree.


