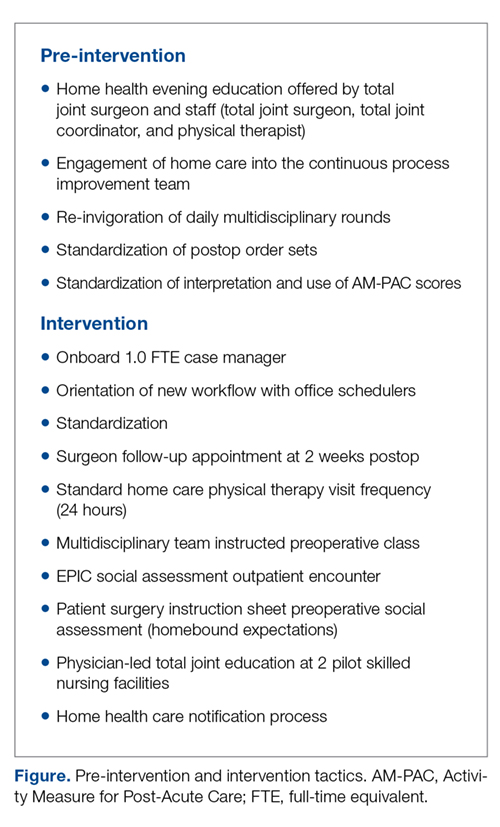
The workgroup also established a relationship with the lead home health care service to develop a standard notification process to set volume and service expectations. Finally, they worked with the lead SNFs to explain the surgical procedure and set expectations for patient recovery at the facilities. These changes are summarized in the Figure.
Analysis
Descriptive statistics were used to describe patients and metrics in the baseline and performance periods. The difference in the proportion of patients discharged to a SNF in the baseline and performance periods was examined by a Z-test of proportion and change in relative risk. A Z-test of proportion was also used examine differences in the 90-day all-cause readmission rate and in the average length of stay between the 2 periods.
Results
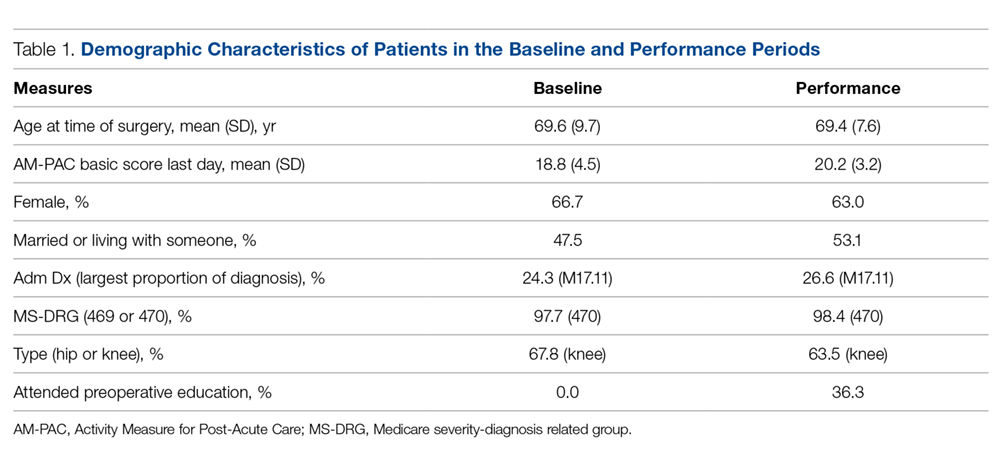
Differences between Medicare fee-for-service patients in the baseline and performance periods are reported in Table 1. While age, sex, diagnoses, and surgical types were similar, AM-PAC scores and the proportion of patients married or living with someone were higher in the performance period. The AM-PAC score in Table 1 represents the last documented score prior to discharge.
The proportion of Medicare patients discharged to a SNF fell from 39.5% (70/177) in the baseline period to 17.7% (34/192) in the performance period (Table 2). The 21.9% difference was significant at the 0.05 level (Z = 4.6586, P = 0.0001). Medicare patients in the intervention period had nearly half (0.45) the risk (95% confidence interval, 0.314-0.639) of SNF utilization compared with patients in the baseline period. Using Fisher’s exact test and a 2-tailed test, this reduction was found to be significant (P < 0.0001).
Concomitantly, the 90-day all-cause readmission rate among Medicare patients rose from 2.8% (5/177) to 4.7% (9/192), but the difference in proportions was not statistically significant (Z = –0.9356, P = 0.3495). Similarly, the average length of stay for Medicare patients was 2.9 days in both the baseline and performance periods.


