Results
Patient Characteristics
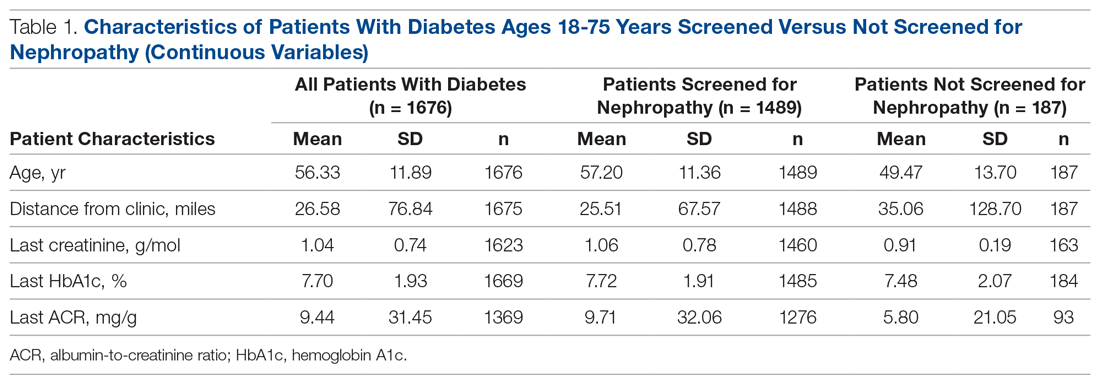
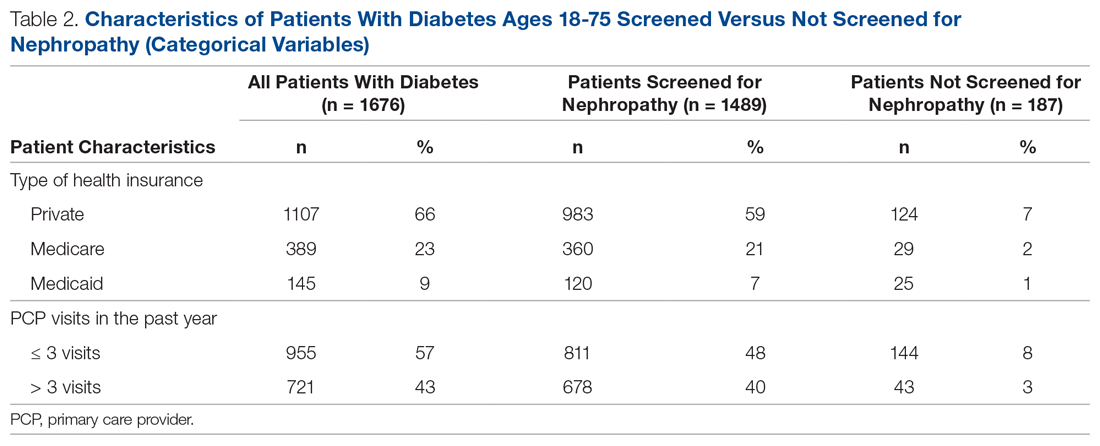
There were 1676 family medicine clinic patients with diabetes between 18 and 75 years of age (Table 1 and Table 2). Of the total sample, 1489 (88.8%) had completed screening for nephropathy in the 12 months prior to evaluation, and 67.5%, 23.7%, and 8.8% of patients had private insurance, Medicare, and Medicaid, respectively.
The mean (SD) age of the patients was 56.3 (11.9) years. The mean distance between the patient’s home and the clinic was 26.6 (76.8) miles. The mean number of visits was 3.6 (2.9) per year, and 43.0% of the patientvisited the clinic more than 3 times in a year. The mean values for HbA1c (%), creatinine (g/mol), and ACR (mg/g) were 7.7 (1.9), 1.0 (0.7), and 9.4 (31.4), respectively.
Screening of Patients for Nephropathy
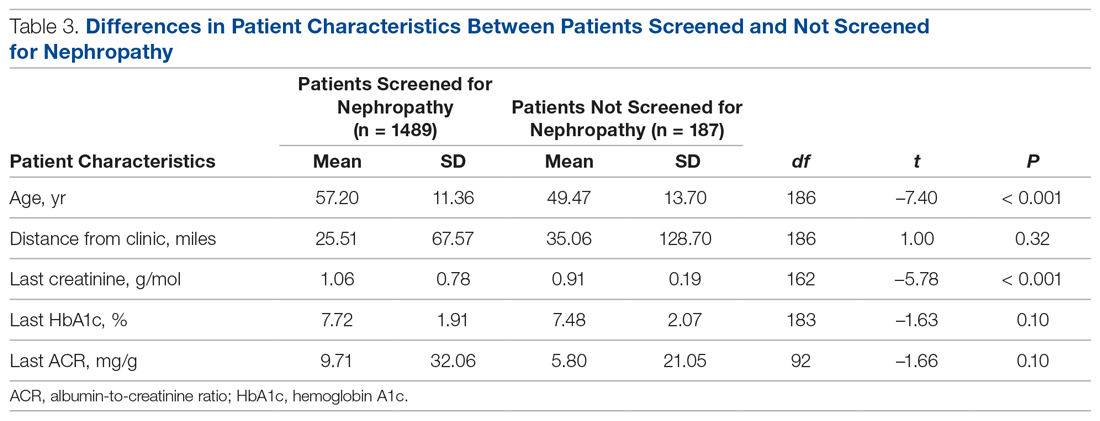
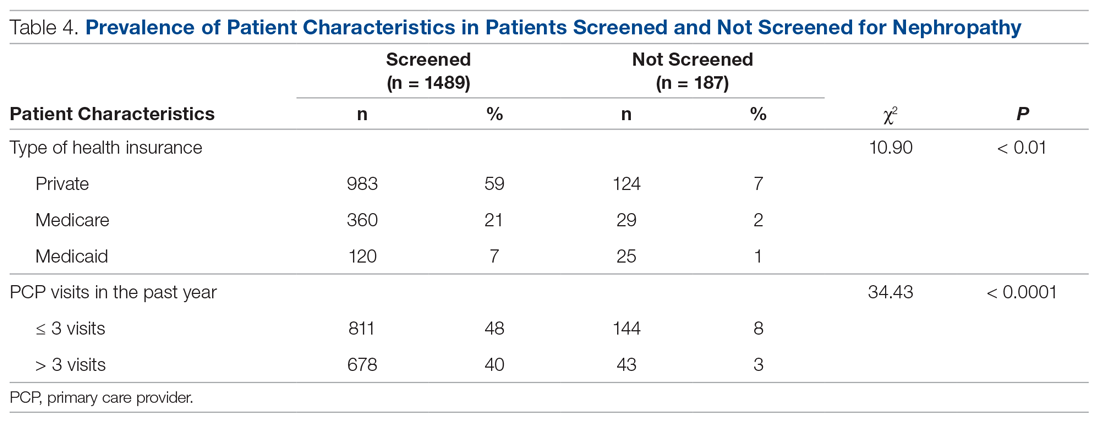
Patients with Medicare and private insurance were more likely to have completed the nephropathy screening than those with Medicaid (92.5% versus 88.8% versus 82.8%, P = 0.004; Table 3 and Table 4).
Patients with more than 3 visits were more likely to complete the nephropathy screening than those with 3 or fewer visits (94.0% versus 84.9%, P < 0.0001). Patients who completed the nephropathy screening were older (P < 0.0001) and had higher creatinine levels (P = 0.02) than their counterparts who did not complete screening. There were no significant differences in screening success based on HbA1c, ACR, or the distance between the patient’s home and the clinic.Changes in Screening Rate
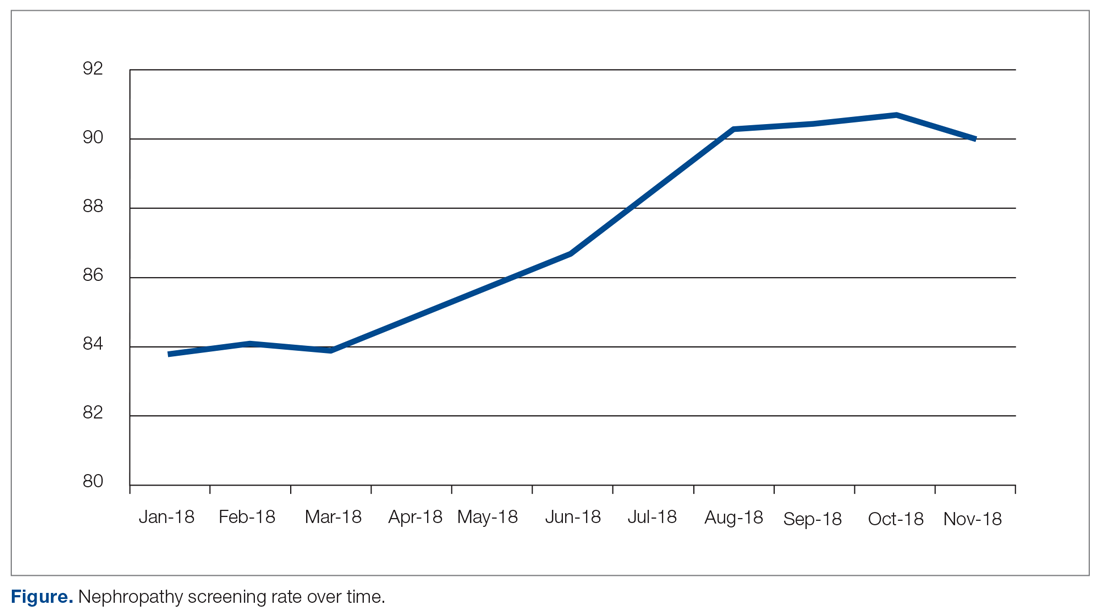
The practice-wide screening rate was 83.8% at the start of this project in January 2018. The screening rate steadily increased throughout 2018, reaching 90.3% in August 2018, and then leveled off around 90% when the project was concluded at the end of November 2018 (Figure). As an added benefit of the increased screening rates, a number of patients were initiated on an ACE inhibitor or ARB based on the team’s screening efforts.
Predictors of Nephropathy Screening
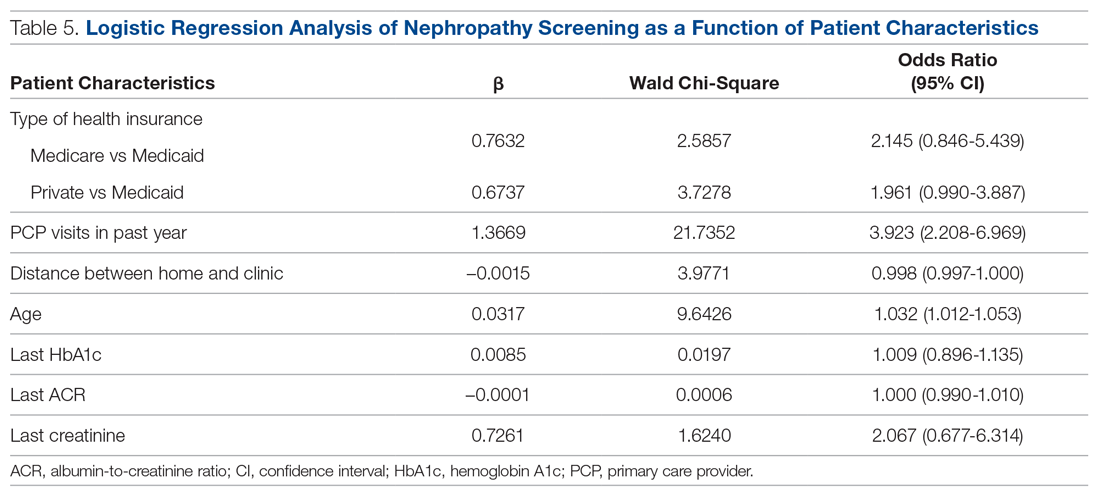
A logistic regression analysis was conducted with nephropathy screening (screened or not screened) as the outcome and 7 patient characteristics as predictors: type of insurance (private, Medicare, or Medicaid), PCP visits in the past 12 months (≤ 3 or > 3), distance in miles of the patient’s residence from the clinic, age, last HbA1c value, last ACR value, and last creatinine value. A test of the full model with all 7 predictors was statistically significant (χ2 (8) = 57.77, P < 0.001). Table 5 shows regression coefficients, Wald statistics, and 95% confidence intervals for odds ratios for each of the 7 predictors. According to the Wald criterion, 3 patient characteristics were significant predictors of nephropathy screening: age, distance between the patient’s home and clinic, and number of PCP visits in the past 12 months. After adjusting for the covariates, there were still significant associations between the nephropathy screening status and age ( χ2(1) = 9.64, P < 0.01); distance between the patient’s home and the clinic (χ2(1) = 3.98, P < 0.05); and the number of PCP visits in the previous year (χ2(1) = 21.74, P < 0.001). With each 1-year increment in age, the odds of completing the nephropathy screening increased by 3.2%. With each 1-mile increase in the distance between the patient’s home and clinic, the odds of completing the nephropathy screening decreased by 0.2%. Patients who visited the clinic more than 3 times in a year were 3.9 times (95% confidence interval, 2.2-7.0) more likely to complete the nephropathy screening than their counterparts who visited fewer than 3 times per year.
In summary, older patients living within about 164 miles of the clinic (ie, within 1 standard deviation from the average miles between patient’s homes and the clinic) who visited their PCP 3 or more times per year were the most likely to be screened.

