ANSWER
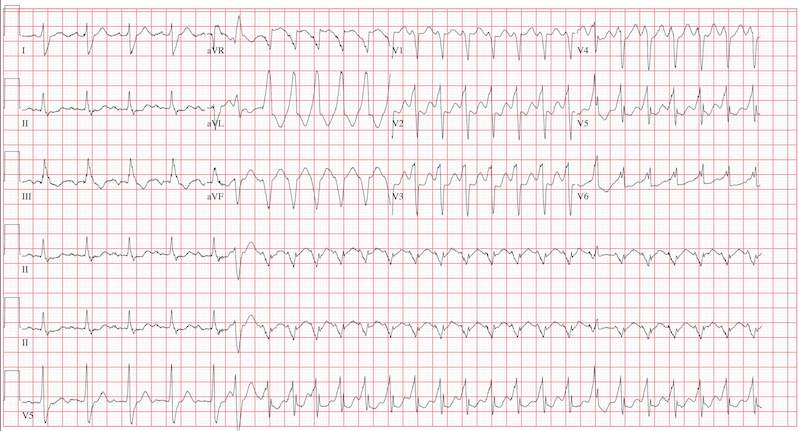
This ECG reveals sinus tachycardia transitioning to a wide complex tachycardia. A fusion complex is present, suggesting this is ventricular tachycardia. T-wave abnormalities in the inferior leads are present and suggest inferior ischemia.
There are two items of note that one must be aware of in order to accurately interpret this ECG. Normally, the computer measurements of heart rate and intervals are correct and often more accurate than a clinician can manually measure. These are typically measured as an average of all beats taken during the 12-second analysis prior to printing. However, when the rate abruptly changes during the analysis of the heart rate and rhythm, these measurements become inaccurate.
In this ECG, the computer notes the rate to be 156 beats/min; however, careful analysis of the sinus tachycardia prior to onset of ventricular tachycardia shows the rate is 107 beats/min, and the ventricular tachycardia rate is 188 beats/min.
The second item of note is that the ECG instrument measures all leads simultaneously over a 12-second period and separates them into the appropriate leads for printing. Hence, the progression from leads I to aVR to V1 to V4 represents a continuous tracing, in a similar fashion to the rhythm strip in lead II at the bottom of the page. Knowing this can help determine the presence of fusion complexes, as well as atrioventricular dissociation between QRS complexes and P waves indicative of ventricular tachycardia.
This patient developed hemodynamically significant ventricular tachycardia during the 12-second interval required for a 12-lead ECG analysis, a rare occurrence. She was treated with DC cardioversion, which resulted in a return to normal sinus rhythm.

