User login
Bone mineral density testing: Is a T score enough to determine the screening interval?
Some members of the public may have noticed the conclusions of a recent study1 that said that if an older postmenopausal woman has her bone mineral density measured to screen for osteoporosis and has a normal or only mildly low result, she does not need to come back for another measurement for approximately 15 years.
We believe this interpretation of the study’s findings is overly simplistic and may have the unfortunate result of causing some people to neglect their bone health. Moreover, the study looked mainly at baseline T scores as the determinant of the subsequent screening interval. However, clinicians must carefully consider a variety of clinical risk factors when deciding how often to obtain bone mineral density measurements. The ultimate goal is to not miss the window of opportunity for early detection and treatment when it would matter the most (ie, before fractures develop).
Here, we will review this recent study, its findings, and its implications.
OSTEOPOROSIS POSES AN ENORMOUS PUBLIC HEALTH PROBLEM
If we consider only the hip, an estimated 10 million people in the United States have osteoporosis (T score ≤ −2.5 or a preexisting fragility fracture), and 33.6 million have osteopenia (T score −1.01 to −2.49).2 The number of people with osteopenia can be assumed to be much higher if other skeletal sites are considered.
By increasing the risk of fragility fractures, osteoporosis poses an enormous public health problem. The surgeon general’s report points out that one of every two white women over age 50 will experience an osteoporosis-related fracture in her lifetime.3 Of all osteoporosis-related fractures, those of the hip carry the worse clinical outcome. Approximately one in five elderly people who experience an osteoporosis-related hip fracture need long-term nursing home care, and as many as 20% die within 1 year.3
In recognition of the burden of osteoporosis, the US Preventive Services Task Force (USPSTF)4 and other scientific bodies2,3 recommend an initial bone mineral density test for all women age 65 and older. Dual-energy x-ray absorptiometry (DXA) is considered the gold standard for bone mineral density testing. Although the patient population that should receive an initial bone mineral density test has been clearly identified (see below), guidelines on the optimal frequency of testing do not exist, as data have been lacking. Recognizing this knowledge gap, Gourlay et al1 attempted to answer the question of how often elderly postmenopausal women should be retested.
WHEN DO 10% OF ELDERLY POSTMENOPAUSAL WOMEN REACH A T SCORE OF −2.5?
Gourlay et al1 analyzed data from 4,957 women in the Study of Osteoporotic Fractures. These women were predominantly white, were at least 67 years old and ambulatory, and had normal bone mineral density or osteopenia and no history of hip or clinical vertebral fracture at baseline. They had been recruited between 1986 and 1988 at sites in Baltimore, MD, Minneapolis, MN, the Monongahela Valley near Pittsburgh, PA, and Portland, OR.
DXA of the hip had been performed at baseline and at multiple times thereafter. The average follow-up time was 8 years.
The primary outcome measured was how long it took for 10% of the patients to reach a T score of −2.5 or less at the femoral neck or total hip as they progressed from having normal bone mineral density to osteoporosis or from osteopenia to osteoporosis and before they developed a fracture or needed treatment for osteoporosis.
Clinical risk factors such as age, body mass index, estrogen use at baseline, fracture after age 50, current smoking, current or past use of glucocorticoids, and self-reported rheumatoid arthritis were included as covariates in time-to-event analyses.
ANSWER: 16.8 YEARS (IF NORMAL AT BASELINE)
The authors estimated that 10% of women would make the transition to osteoporosis before having a hip or clinical vertebral fracture in the following intervals:
- 16.8 years in women whose bone mineral density was normal at baseline (T score at femoral neck and total hip of −1.00 or higher)
- 17.3 years in women who had mild osteopenia at baseline (T score −1.01 to −1.49)
- 4.7 years in women with moderate osteopenia at baseline (T score −1.5 to −1.99)
- 1.1 years in women with advanced osteopenia at baseline (T score −2.00 to −2.49).
The authors also found that body mass index and current estrogen use were the only clinical risk factors that influenced these intervals; other clinical factors such as a fracture after age 50, current smoking, previous or current use of oral glucocorticoids, and self-reported rheumatoid arthritis did not.
They concluded that osteoporosis would develop in fewer than 10% of women if the rescreening interval was lengthened to 15 years for women with normal density or mild osteopenia, 5 years for women with moderate osteopenia, and 1 year for women with advanced osteopenia.
WHAT DOES THIS MEAN FOR THE PRACTICING CLINICIAN?
Who needs an initial DXA test according to current guidelines?
The USPSTF,4 the National Osteoporosis Foundation (NOF),5 the International Society for Clinical Densitometry (ISCD),6 and the American Association of Clinical Endocrinologists (AACE)7 propose that the following groups should undergo DXA:
- All women age 65 and older
- All postmenopausal women who have had a fragility fracture or who have one or more risk factors for osteoporosis (height loss, body mass index < 20 kg/m2, family history of osteoporosis, active smoking, excessive alcohol consumption)
- Adults who have a condition (eg, rheumatoid arthritis) or are taking a medication (eg, glucocorticoids in a daily dose ≥ 5 mg of prednisone or its equivalent for ≥ 3 months) associated with low bone mass or bone loss
- Anyone being considered for drug therapy for osteoporosis, discontinuing therapy for osteoporosis (including estrogen), or being treated for osteoporosis, to monitor the effect of treatment.
Assessing fracture risk. Although clinicians have traditionally relied on bone mineral density obtained by DXA to estimate fracture risk, the World Health Organization has developed a computer-based algorithm that calculates an individual’s 10-year fracture probability from easily obtained clinical risk factors with or without adding femoral-neck bone mineral density. The Fracture Risk Assessment tool, or FRAX, has attracted intense interest since its introduction in 2007 and has been endorsed by the USPSTF4 and by other scientific societies, including the NOF5 and the ISCD.8 In fact, the most recent USPSTF guidelines,4 which recommend screening all women age 65 and older, call for using FRAX to identify younger women at higher risk of fracture.
According to FRAX, a 65-year-old white woman who has no risk factors has a 9.3% chance of developing a major osteoporotic fracture in the next 10 years. And if a younger woman (between the ages of 50 and 64) has a fracture risk as high or higher than a 65-year-old white woman who has no risk factors, then she too should be screened by DXA.
The FRAX calculator is available online at www.shef.ac.uk/FRAX.
What are the current recommendations about follow-up DXA testing?
In eligible patients, the Centers for Medicare and Medicaid Services will pay for a DXA scan every 2 years. This interval is based on the concept that in an otherwise healthy person, it takes a minimum of 2 years to see a significant change in bone mineral density that can be attributed to a biological change in the bone and not just chance. The USPSTF4 and scientific societies such as the NOF5 generally agree with the Medicare guidelines of retesting every 2 years but recognize certain clinical situations that may warrant more frequent retesting (see below).
But the real question is how long the DXA screening interval can be extended so that meaningful information can still be obtained to help make management decisions and before a complication such as a fracture occurs. While there is convincing evidence to support the recommendations for an initial DXA test, data to answer the question of how long the resting interval should be are lacking.
Before the study by Gourlay et al,1 the only data on repeat DXA came from work by Hillier et al.9 But those investigators asked a different question. They were interested in how well repeated measurements predicted fractures. They used the same population that Gourlay et al did but evaluated fractures, not T scores. They concluded that in healthy, adult postmenopausal women, repeating the bone mineral density measurement up to 8 years later adds little value to initial measurement for predicting incident fractures.
Clinical factors also count
The T score should not be the only major factor determining the interval for bone mineral density testing in elderly women; clinical risk factors also should be kept in mind.
Gourlay et al concluded that age and T scores are the key predictive factors in determining the bone mineral density testing interval in elderly, postmenopausal women for screening purposes.1 In their statistical model, clinical risk factors such as fracture after age 50, current smoking, previous or current use of glucocorticoids, and self-reported rheumatoid arthritis did not influence the testing interval. They say that clinicians should not feel compelled to shorten the testing interval when these risk factors are present.
Readers may take this to mean that if these results were strictly applied to a 70-year-old white woman receiving oral glucocorticoids for rheumatoid arthritis and who has a baseline T score of −1.45, then her next test may be postponed by 15 years (given that both these factors did not influence the testing interval). Readers may also conclude that if this patient’s T score were −1.51, then her screening interval would be 5 years and not 15 years.
However, Gourlay et al say1 that clinicians can choose to shorten the testing interval if there is evidence of decreased activity or mobility, weight loss, or other risk factors not considered in their analysis.
Soon after this study1 was published, Lewiecki et al10 and others11–13 published critical commentaries addressing controversial issues surrounding the study. They highlighted the importance of considering clinical risk factors for fracture in addition to the femoral neck and total hip T scores. In response to these comments, Gourlay et al clarified that their results were not generalizable to patients with secondary osteoporosis, such as those taking glucocorticoids or those who have rheumatic diseases.14
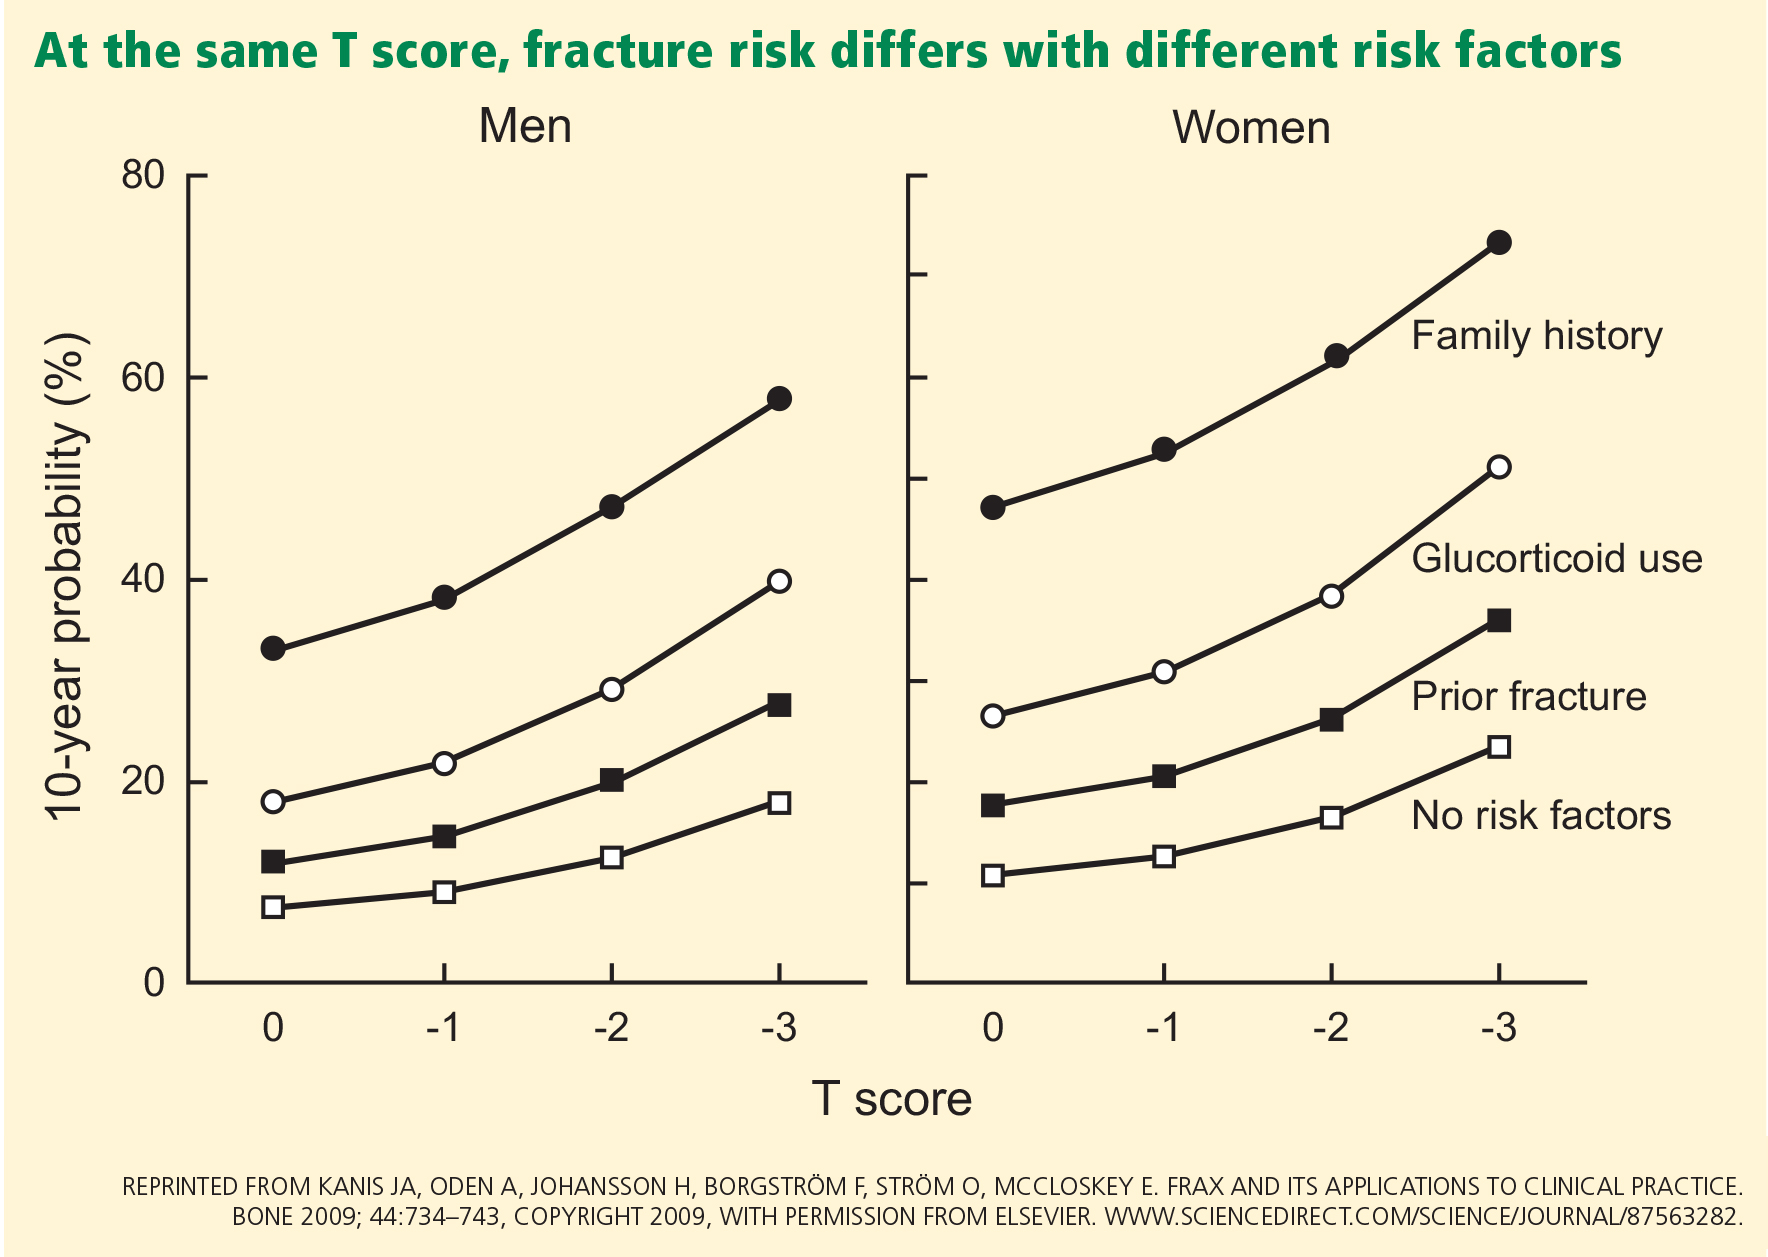
Readers should keep in mind that clinical risk factors make independent contributions to fracture risk (Figure 1).15
Readers should also recognize the following groups in whom the results of the study by Gourlay et al are not applicable since they were not included in their study:
- Men
- Women other than white women
- Women already diagnosed with osteoporosis and on bisphosphonates or any other osteoporosis treatment (except for estrogen). The findings also do not apply to:
- Patients who experience a significant decline in health status or who develop new clinical conditions (such as hyperparathyroidism, paraproteinemias, or type 2 diabetes) or who use medications such as glucocorticoids that cause rapid bone loss. Changes in clinical situations such as these may necessitate more frequent bone mineral density testing in spite of a “good” baseline T score.
- Perimenopausal women or women who received their first bone mineral density test before age 65. Perimenopause and menopause may trigger rapid bone loss, which may be as much as one T-score point (ie, 1 standard deviation) at the spine and femoral neck.16 Therefore, testing done during this time cannot be used as the basis of future monitoring.
The study did not address asymptomatic vertebral fractures and lumbar spine density
Gourlay et al1 did not take into account asymptomatic spinal fractures; they used only clinical vertebral fractures in their risk estimates of spinal fractures. Ascertainment of morphometric spinal fractures may be methodologically challenging, but if the study had included these fractures, the outcomes and conclusions could have been very different.
Vertebral fractures are present in as many as 14% to 33% of postmenopausal women17 and indicate osteoporosis (regardless of the bone mineral density). Moreover, most vertebral fractures are clinically silent and escape detection, and approximately only one in three radiographically defined vertebral fractures is reported clinically.18,19 Given the prevalence of these fractures, we and others10 have noted that the results of the Gourlay study may be biased toward longer screening intervals because they did not account for morphometric vertebral fractures.
Gourlay et al used T scores only of the femoral neck and total hip and not those of the lumbar spine. Some studies have found that hip measurements may be superior to spine measurements for overall osteoporotic fracture prediction.20,21 However, lumbar spine bone mineral density is predictive of fracture at other skeletal sites,22,23 is a widely accepted skeletal site measurement, and is used to diagnose osteoporosis. Moreover, the lumbar spine T score can be −2.5 or higher even if the total hip or femoral neck T score is lower than −2.5.
More fractures occur in people with osteopenia than with osteoporosis
Osteoporosis imparts a much higher risk of fracture than does osteopenia. However, if one recognizes the much greater prevalence of osteopenia (33.6 million people) compared with osteoporosis (10 million),2 it is not hard to appreciate that the number of fractures is higher in the osteopenic group than in those with osteoporosis based on T scores. Siris et al24 point out that at least half of osteoporotic fractures are in patients with osteopenia, who comprise a larger segment of the population than those with osteoporosis.
Some clinical trials have shown that bisphosphonates are not effective in preventing clinical fractures in women who do not have osteoporosis.25,26 However, clinicians must recognize that while bisphosphonates may not be as effective in preventing fractures in the osteopenic group with no other clinical risk factors, the presence of multiple clinical risk factors incrementally increases the fracture risk (which can be assessed via FRAX) and may require starting drug therapy earlier.
Women with vertebral fractures are considered to have clinical osteoporosis even if they have T scores in the osteopenic range, and must be considered for drug therapy.
The public health burden of fractures will not decrease unless individuals with low bone mineral density who are at an increased risk of fracture are identified and treated.24
Is DXA testing overused or underused? does it decrease the rate of fractures?
The study of Gourlay et al1 captured a lot of media attention, with many newspapers and blogs claiming that women may be getting tested too often.27,28 However, in reality, this test is highly underutilized. The 2011 Healthcare Effectiveness Data and Information Set report noted that 71.0% of women in Medicare health maintenance organizations and 75.0% of women in Medicare preferred provider organizations ever had a bone mineral density test for osteoporosis.29 While these numbers may not appear to be too far from the target, they are a poor gauge of DXA use as they include all types of bone mineral density tests in a woman’s lifetime, including even heel tests at health fairs.
Central DXA is used far less than one might expect. King and Fiorentino, in a recent analysis, showed that only about 14% of fee-for-service Medicare beneficiaries 65 years and older had one or more DXA tests in 2010.30 DXA retesting also does not seem to be an issue, with only 1 in 10 elderly women reporting having had a repeat test at 2-year intervals, and fewer than 1 in 100 tested reported testing more frequently.30
- Gourlay ML, Fine JP, Preisser JS, et al; Study of Osteoporotic Fractures research group. Bone-density testing interval and transition to osteoporosis in older women. N Engl J Med 2012; 366:225–233.
- National Osteoporosis Foundation (NOF). America’s Bone Health: The State of Osteoporosis and Low Bone Mass in Our Nation. Washington, DC: National Osteoporosis Foundation; 2002.
- US Department of Health and Human Services. Bone Health and Osteoporosis: A Report of the Surgeon General. Rockville, MD: US Department of Health and Human Services, Office of the Surgeon General; 2004.
- US Preventive Services Task Force. Screening for osteoporosis: US preventive services task force recommendation statement. Ann Intern Med 2011; 154:356–364.
- National Osteoporosis Foundation. Clinician’s Guide to Prevention and Treatment of Osteoporosis. Washington, DC: National Osteoporosis Foundation; 2010.
- Baim S, Binkley N, Bilezikian JP, et al. Official Positions of the International Society for Clinical Densitometry and executive summary of the 2007 ISCD Position Development Conference. J Clin Densitom 2008; 11:75–91.
- Watts NB, Bilezikian JP, Camacho PM, et al; AACE Osteoporosis Task Force. American Association of Clinical Endocrinologists Medical Guidelines for Clinical Practice for the diagnosis and treatment of postmenopausal osteoporosis. Endocr Pract 2010; 16(suppl 3):1–37.
- The International Society for Clinical Densitometry (ISCD); the International Osteoporosis Foundation (IOF). 2010 Official Positions on FRAX. www.iscd.org/official-positions. Accessed February 1, 2013.
- Hillier TA, Stone KL, Bauer DC, et al. Evaluating the value of repeat bone mineral density measurement and prediction of fractures in older women: the study of osteoporotic fractures. Arch Intern Med 2007; 167:155–160.
- Lewiecki EM, Laster AJ, Miller PD, Bilezikian JP. More bone density testing is needed, not less. J Bone Miner Res 2012; 27:739–742.
- Leslie WD, Morin SN, Lix LM. Bone-density testing interval and transition to osteoporosis. N Engl J Med 2012; 366:1547.
- Endocrine Society. The Endocrine Society Recommends Individualization of Bone Mineral Density Testing Frequency in Women Over the Age of 67: February 7, 2012. http://www.endo-society.org/advocacy/legislative/letters/upload/Endocrine-Society-Response-to-BMD-Testing-Final.pdf. Accessed January 29, 2013.
- The International Society for Clinical Densitometry (ISCD). ISCD response to NEJM article: January 20, 2012. http://www.american-bonehealth.org/images/stories/BMD_Testing_Interval_ISCD_Response_to_NEJM_Article.pdf. Accessed January 29, 2013.
- Gourlay ML, Preisser JS, Lui LY, Cauley JA, Ensrud BeStudy of Osteoporotic Fractures Research Group. BMD screening in older women: initial measurement and testing interval. J Bone Miner Res 2012; 27:743–746.
- Kanis JA, Oden A, Johansson H, Borgström F, Ström O, McCloskey E. FRAX and its applications to clinical practice. Bone 2009; 44:734–743.
- Recker RR. Early postmenopausal bone loss and what to do about it. Ann NY Acad Sci 2011; 1240:E26–E30.
- Genant HK, Jergas M, Palermo L, et al. Comparison of semiquantitative visual and quantitative morphometric assessment of prevalent and incident vertebral fractures in osteoporosis The Study of Osteoporotic Fractures Research Group. J Bone Miner Res 1996; 11:984–996.
- Black DM, Cummings SR, Karpf DB, et al. Randomised trial of effect of alendronate on risk of fracture in women with existing vertebral fractures. Fracture Intervention Trial Research Group. Lancet 1996; 348:1535–1541.
- Nevitt MC, Ettinger B, Black DM, et al. The association of radiographically detected vertebral fractures with back pain and function: a prospective study. Ann Intern Med 1998; 128:793–800.
- Leslie WD, Tsang JF, Caetano PA, Lix LM; Manitoba Bone Density Program. Effectiveness of bone density measurement for predicting osteoporotic fractures in clinical practice. J Clin Endocrinol Metab 2007; 92:77–81.
- Leslie WD, Lix LM, Tsang JF, Caetano PA; Manitoba Bone Density Program. Single-site vs multisite bone density measurement for fracture prediction. Arch Intern Med 2007; 167:1641–1647.
- Stone KL, Seeley DG, Lui LY, et al; Osteoporotic Fractures Research Group. BMD at multiple sites and risk of fracture of multiple types: long-term results from the Study of Osteoporotic Fractures. J Bone Miner Res 2003; 18:1947–1954.
- Black DM, Cummings SR, Genant HK, Nevitt MC, Palermo L, Browner W. Axial and appendicular bone density predict fractures in older women. J Bone Miner Res 1992; 7:633–638.
- Siris ES, Baim S, Nattiv A. Primary care use of FRAX: absolute fracture risk assessment in postmenopausal women and older men. Postgrad Med 2010; 122:82–90.
- Cummings SR, Black DM, Thompson DE, et al. Effect of alendronate on risk of fracture in women with low bone density but without vertebral fractures: results from the Fracture Intervention Trial. JAMA 1998; 280:2077–2082.
- McClung MR, Geusens P, Miller PD, et al; Hip Intervention Program Study Group. Effect of risedronate on the risk of hip fracture in elderly women. Hip Intervention Program Study Group. N Engl J Med 2001; 344:333–340.
- Park A. How often do women really need bone density tests? Time: Health & Family. January 19, 2012. http://healthland.time.com/2012/01/19/most-women-may-be-getting-too-many-bone-density-tests/. Accessed January 29, 2013.
- Kolata G. Osteoporosis patients advised to delay bone density retests. The New York Times: Health. January 19, 2012. http://query.nytimes.com/gst/fullpage.html?res=9B01E1D61230F93AA25752C0A9649D8B63. Accessed January 29, 2013.
- National Committee for Quality Assurance. The State of Health Care Quality Report. http://www.ncqa.org/Portals/0/State%20of%20Health%20Care/2012/SOHC%20Report%20Web.pdf. Accessed February 1, 2013.
- King AB, Fiorentino DM. Medicare payment cuts for osteoporosis testing reduced use despite tests’ benefit in reducing fractures. Health Aff (Millwood) 2011; 30:2362–2370.
Some members of the public may have noticed the conclusions of a recent study1 that said that if an older postmenopausal woman has her bone mineral density measured to screen for osteoporosis and has a normal or only mildly low result, she does not need to come back for another measurement for approximately 15 years.
We believe this interpretation of the study’s findings is overly simplistic and may have the unfortunate result of causing some people to neglect their bone health. Moreover, the study looked mainly at baseline T scores as the determinant of the subsequent screening interval. However, clinicians must carefully consider a variety of clinical risk factors when deciding how often to obtain bone mineral density measurements. The ultimate goal is to not miss the window of opportunity for early detection and treatment when it would matter the most (ie, before fractures develop).
Here, we will review this recent study, its findings, and its implications.
OSTEOPOROSIS POSES AN ENORMOUS PUBLIC HEALTH PROBLEM
If we consider only the hip, an estimated 10 million people in the United States have osteoporosis (T score ≤ −2.5 or a preexisting fragility fracture), and 33.6 million have osteopenia (T score −1.01 to −2.49).2 The number of people with osteopenia can be assumed to be much higher if other skeletal sites are considered.
By increasing the risk of fragility fractures, osteoporosis poses an enormous public health problem. The surgeon general’s report points out that one of every two white women over age 50 will experience an osteoporosis-related fracture in her lifetime.3 Of all osteoporosis-related fractures, those of the hip carry the worse clinical outcome. Approximately one in five elderly people who experience an osteoporosis-related hip fracture need long-term nursing home care, and as many as 20% die within 1 year.3
In recognition of the burden of osteoporosis, the US Preventive Services Task Force (USPSTF)4 and other scientific bodies2,3 recommend an initial bone mineral density test for all women age 65 and older. Dual-energy x-ray absorptiometry (DXA) is considered the gold standard for bone mineral density testing. Although the patient population that should receive an initial bone mineral density test has been clearly identified (see below), guidelines on the optimal frequency of testing do not exist, as data have been lacking. Recognizing this knowledge gap, Gourlay et al1 attempted to answer the question of how often elderly postmenopausal women should be retested.
WHEN DO 10% OF ELDERLY POSTMENOPAUSAL WOMEN REACH A T SCORE OF −2.5?
Gourlay et al1 analyzed data from 4,957 women in the Study of Osteoporotic Fractures. These women were predominantly white, were at least 67 years old and ambulatory, and had normal bone mineral density or osteopenia and no history of hip or clinical vertebral fracture at baseline. They had been recruited between 1986 and 1988 at sites in Baltimore, MD, Minneapolis, MN, the Monongahela Valley near Pittsburgh, PA, and Portland, OR.
DXA of the hip had been performed at baseline and at multiple times thereafter. The average follow-up time was 8 years.
The primary outcome measured was how long it took for 10% of the patients to reach a T score of −2.5 or less at the femoral neck or total hip as they progressed from having normal bone mineral density to osteoporosis or from osteopenia to osteoporosis and before they developed a fracture or needed treatment for osteoporosis.
Clinical risk factors such as age, body mass index, estrogen use at baseline, fracture after age 50, current smoking, current or past use of glucocorticoids, and self-reported rheumatoid arthritis were included as covariates in time-to-event analyses.
ANSWER: 16.8 YEARS (IF NORMAL AT BASELINE)
The authors estimated that 10% of women would make the transition to osteoporosis before having a hip or clinical vertebral fracture in the following intervals:
- 16.8 years in women whose bone mineral density was normal at baseline (T score at femoral neck and total hip of −1.00 or higher)
- 17.3 years in women who had mild osteopenia at baseline (T score −1.01 to −1.49)
- 4.7 years in women with moderate osteopenia at baseline (T score −1.5 to −1.99)
- 1.1 years in women with advanced osteopenia at baseline (T score −2.00 to −2.49).
The authors also found that body mass index and current estrogen use were the only clinical risk factors that influenced these intervals; other clinical factors such as a fracture after age 50, current smoking, previous or current use of oral glucocorticoids, and self-reported rheumatoid arthritis did not.
They concluded that osteoporosis would develop in fewer than 10% of women if the rescreening interval was lengthened to 15 years for women with normal density or mild osteopenia, 5 years for women with moderate osteopenia, and 1 year for women with advanced osteopenia.
WHAT DOES THIS MEAN FOR THE PRACTICING CLINICIAN?
Who needs an initial DXA test according to current guidelines?
The USPSTF,4 the National Osteoporosis Foundation (NOF),5 the International Society for Clinical Densitometry (ISCD),6 and the American Association of Clinical Endocrinologists (AACE)7 propose that the following groups should undergo DXA:
- All women age 65 and older
- All postmenopausal women who have had a fragility fracture or who have one or more risk factors for osteoporosis (height loss, body mass index < 20 kg/m2, family history of osteoporosis, active smoking, excessive alcohol consumption)
- Adults who have a condition (eg, rheumatoid arthritis) or are taking a medication (eg, glucocorticoids in a daily dose ≥ 5 mg of prednisone or its equivalent for ≥ 3 months) associated with low bone mass or bone loss
- Anyone being considered for drug therapy for osteoporosis, discontinuing therapy for osteoporosis (including estrogen), or being treated for osteoporosis, to monitor the effect of treatment.
Assessing fracture risk. Although clinicians have traditionally relied on bone mineral density obtained by DXA to estimate fracture risk, the World Health Organization has developed a computer-based algorithm that calculates an individual’s 10-year fracture probability from easily obtained clinical risk factors with or without adding femoral-neck bone mineral density. The Fracture Risk Assessment tool, or FRAX, has attracted intense interest since its introduction in 2007 and has been endorsed by the USPSTF4 and by other scientific societies, including the NOF5 and the ISCD.8 In fact, the most recent USPSTF guidelines,4 which recommend screening all women age 65 and older, call for using FRAX to identify younger women at higher risk of fracture.
According to FRAX, a 65-year-old white woman who has no risk factors has a 9.3% chance of developing a major osteoporotic fracture in the next 10 years. And if a younger woman (between the ages of 50 and 64) has a fracture risk as high or higher than a 65-year-old white woman who has no risk factors, then she too should be screened by DXA.
The FRAX calculator is available online at www.shef.ac.uk/FRAX.
What are the current recommendations about follow-up DXA testing?
In eligible patients, the Centers for Medicare and Medicaid Services will pay for a DXA scan every 2 years. This interval is based on the concept that in an otherwise healthy person, it takes a minimum of 2 years to see a significant change in bone mineral density that can be attributed to a biological change in the bone and not just chance. The USPSTF4 and scientific societies such as the NOF5 generally agree with the Medicare guidelines of retesting every 2 years but recognize certain clinical situations that may warrant more frequent retesting (see below).
But the real question is how long the DXA screening interval can be extended so that meaningful information can still be obtained to help make management decisions and before a complication such as a fracture occurs. While there is convincing evidence to support the recommendations for an initial DXA test, data to answer the question of how long the resting interval should be are lacking.
Before the study by Gourlay et al,1 the only data on repeat DXA came from work by Hillier et al.9 But those investigators asked a different question. They were interested in how well repeated measurements predicted fractures. They used the same population that Gourlay et al did but evaluated fractures, not T scores. They concluded that in healthy, adult postmenopausal women, repeating the bone mineral density measurement up to 8 years later adds little value to initial measurement for predicting incident fractures.
Clinical factors also count
The T score should not be the only major factor determining the interval for bone mineral density testing in elderly women; clinical risk factors also should be kept in mind.
Gourlay et al concluded that age and T scores are the key predictive factors in determining the bone mineral density testing interval in elderly, postmenopausal women for screening purposes.1 In their statistical model, clinical risk factors such as fracture after age 50, current smoking, previous or current use of glucocorticoids, and self-reported rheumatoid arthritis did not influence the testing interval. They say that clinicians should not feel compelled to shorten the testing interval when these risk factors are present.
Readers may take this to mean that if these results were strictly applied to a 70-year-old white woman receiving oral glucocorticoids for rheumatoid arthritis and who has a baseline T score of −1.45, then her next test may be postponed by 15 years (given that both these factors did not influence the testing interval). Readers may also conclude that if this patient’s T score were −1.51, then her screening interval would be 5 years and not 15 years.
However, Gourlay et al say1 that clinicians can choose to shorten the testing interval if there is evidence of decreased activity or mobility, weight loss, or other risk factors not considered in their analysis.
Soon after this study1 was published, Lewiecki et al10 and others11–13 published critical commentaries addressing controversial issues surrounding the study. They highlighted the importance of considering clinical risk factors for fracture in addition to the femoral neck and total hip T scores. In response to these comments, Gourlay et al clarified that their results were not generalizable to patients with secondary osteoporosis, such as those taking glucocorticoids or those who have rheumatic diseases.14
Readers should keep in mind that clinical risk factors make independent contributions to fracture risk (Figure 1).15
Readers should also recognize the following groups in whom the results of the study by Gourlay et al are not applicable since they were not included in their study:
- Men
- Women other than white women
- Women already diagnosed with osteoporosis and on bisphosphonates or any other osteoporosis treatment (except for estrogen). The findings also do not apply to:
- Patients who experience a significant decline in health status or who develop new clinical conditions (such as hyperparathyroidism, paraproteinemias, or type 2 diabetes) or who use medications such as glucocorticoids that cause rapid bone loss. Changes in clinical situations such as these may necessitate more frequent bone mineral density testing in spite of a “good” baseline T score.
- Perimenopausal women or women who received their first bone mineral density test before age 65. Perimenopause and menopause may trigger rapid bone loss, which may be as much as one T-score point (ie, 1 standard deviation) at the spine and femoral neck.16 Therefore, testing done during this time cannot be used as the basis of future monitoring.
The study did not address asymptomatic vertebral fractures and lumbar spine density
Gourlay et al1 did not take into account asymptomatic spinal fractures; they used only clinical vertebral fractures in their risk estimates of spinal fractures. Ascertainment of morphometric spinal fractures may be methodologically challenging, but if the study had included these fractures, the outcomes and conclusions could have been very different.
Vertebral fractures are present in as many as 14% to 33% of postmenopausal women17 and indicate osteoporosis (regardless of the bone mineral density). Moreover, most vertebral fractures are clinically silent and escape detection, and approximately only one in three radiographically defined vertebral fractures is reported clinically.18,19 Given the prevalence of these fractures, we and others10 have noted that the results of the Gourlay study may be biased toward longer screening intervals because they did not account for morphometric vertebral fractures.
Gourlay et al used T scores only of the femoral neck and total hip and not those of the lumbar spine. Some studies have found that hip measurements may be superior to spine measurements for overall osteoporotic fracture prediction.20,21 However, lumbar spine bone mineral density is predictive of fracture at other skeletal sites,22,23 is a widely accepted skeletal site measurement, and is used to diagnose osteoporosis. Moreover, the lumbar spine T score can be −2.5 or higher even if the total hip or femoral neck T score is lower than −2.5.
More fractures occur in people with osteopenia than with osteoporosis
Osteoporosis imparts a much higher risk of fracture than does osteopenia. However, if one recognizes the much greater prevalence of osteopenia (33.6 million people) compared with osteoporosis (10 million),2 it is not hard to appreciate that the number of fractures is higher in the osteopenic group than in those with osteoporosis based on T scores. Siris et al24 point out that at least half of osteoporotic fractures are in patients with osteopenia, who comprise a larger segment of the population than those with osteoporosis.
Some clinical trials have shown that bisphosphonates are not effective in preventing clinical fractures in women who do not have osteoporosis.25,26 However, clinicians must recognize that while bisphosphonates may not be as effective in preventing fractures in the osteopenic group with no other clinical risk factors, the presence of multiple clinical risk factors incrementally increases the fracture risk (which can be assessed via FRAX) and may require starting drug therapy earlier.
Women with vertebral fractures are considered to have clinical osteoporosis even if they have T scores in the osteopenic range, and must be considered for drug therapy.
The public health burden of fractures will not decrease unless individuals with low bone mineral density who are at an increased risk of fracture are identified and treated.24
Is DXA testing overused or underused? does it decrease the rate of fractures?
The study of Gourlay et al1 captured a lot of media attention, with many newspapers and blogs claiming that women may be getting tested too often.27,28 However, in reality, this test is highly underutilized. The 2011 Healthcare Effectiveness Data and Information Set report noted that 71.0% of women in Medicare health maintenance organizations and 75.0% of women in Medicare preferred provider organizations ever had a bone mineral density test for osteoporosis.29 While these numbers may not appear to be too far from the target, they are a poor gauge of DXA use as they include all types of bone mineral density tests in a woman’s lifetime, including even heel tests at health fairs.
Central DXA is used far less than one might expect. King and Fiorentino, in a recent analysis, showed that only about 14% of fee-for-service Medicare beneficiaries 65 years and older had one or more DXA tests in 2010.30 DXA retesting also does not seem to be an issue, with only 1 in 10 elderly women reporting having had a repeat test at 2-year intervals, and fewer than 1 in 100 tested reported testing more frequently.30
- Gourlay ML, Fine JP, Preisser JS, et al; Study of Osteoporotic Fractures research group. Bone-density testing interval and transition to osteoporosis in older women. N Engl J Med 2012; 366:225–233.
- National Osteoporosis Foundation (NOF). America’s Bone Health: The State of Osteoporosis and Low Bone Mass in Our Nation. Washington, DC: National Osteoporosis Foundation; 2002.
- US Department of Health and Human Services. Bone Health and Osteoporosis: A Report of the Surgeon General. Rockville, MD: US Department of Health and Human Services, Office of the Surgeon General; 2004.
- US Preventive Services Task Force. Screening for osteoporosis: US preventive services task force recommendation statement. Ann Intern Med 2011; 154:356–364.
- National Osteoporosis Foundation. Clinician’s Guide to Prevention and Treatment of Osteoporosis. Washington, DC: National Osteoporosis Foundation; 2010.
- Baim S, Binkley N, Bilezikian JP, et al. Official Positions of the International Society for Clinical Densitometry and executive summary of the 2007 ISCD Position Development Conference. J Clin Densitom 2008; 11:75–91.
- Watts NB, Bilezikian JP, Camacho PM, et al; AACE Osteoporosis Task Force. American Association of Clinical Endocrinologists Medical Guidelines for Clinical Practice for the diagnosis and treatment of postmenopausal osteoporosis. Endocr Pract 2010; 16(suppl 3):1–37.
- The International Society for Clinical Densitometry (ISCD); the International Osteoporosis Foundation (IOF). 2010 Official Positions on FRAX. www.iscd.org/official-positions. Accessed February 1, 2013.
- Hillier TA, Stone KL, Bauer DC, et al. Evaluating the value of repeat bone mineral density measurement and prediction of fractures in older women: the study of osteoporotic fractures. Arch Intern Med 2007; 167:155–160.
- Lewiecki EM, Laster AJ, Miller PD, Bilezikian JP. More bone density testing is needed, not less. J Bone Miner Res 2012; 27:739–742.
- Leslie WD, Morin SN, Lix LM. Bone-density testing interval and transition to osteoporosis. N Engl J Med 2012; 366:1547.
- Endocrine Society. The Endocrine Society Recommends Individualization of Bone Mineral Density Testing Frequency in Women Over the Age of 67: February 7, 2012. http://www.endo-society.org/advocacy/legislative/letters/upload/Endocrine-Society-Response-to-BMD-Testing-Final.pdf. Accessed January 29, 2013.
- The International Society for Clinical Densitometry (ISCD). ISCD response to NEJM article: January 20, 2012. http://www.american-bonehealth.org/images/stories/BMD_Testing_Interval_ISCD_Response_to_NEJM_Article.pdf. Accessed January 29, 2013.
- Gourlay ML, Preisser JS, Lui LY, Cauley JA, Ensrud BeStudy of Osteoporotic Fractures Research Group. BMD screening in older women: initial measurement and testing interval. J Bone Miner Res 2012; 27:743–746.
- Kanis JA, Oden A, Johansson H, Borgström F, Ström O, McCloskey E. FRAX and its applications to clinical practice. Bone 2009; 44:734–743.
- Recker RR. Early postmenopausal bone loss and what to do about it. Ann NY Acad Sci 2011; 1240:E26–E30.
- Genant HK, Jergas M, Palermo L, et al. Comparison of semiquantitative visual and quantitative morphometric assessment of prevalent and incident vertebral fractures in osteoporosis The Study of Osteoporotic Fractures Research Group. J Bone Miner Res 1996; 11:984–996.
- Black DM, Cummings SR, Karpf DB, et al. Randomised trial of effect of alendronate on risk of fracture in women with existing vertebral fractures. Fracture Intervention Trial Research Group. Lancet 1996; 348:1535–1541.
- Nevitt MC, Ettinger B, Black DM, et al. The association of radiographically detected vertebral fractures with back pain and function: a prospective study. Ann Intern Med 1998; 128:793–800.
- Leslie WD, Tsang JF, Caetano PA, Lix LM; Manitoba Bone Density Program. Effectiveness of bone density measurement for predicting osteoporotic fractures in clinical practice. J Clin Endocrinol Metab 2007; 92:77–81.
- Leslie WD, Lix LM, Tsang JF, Caetano PA; Manitoba Bone Density Program. Single-site vs multisite bone density measurement for fracture prediction. Arch Intern Med 2007; 167:1641–1647.
- Stone KL, Seeley DG, Lui LY, et al; Osteoporotic Fractures Research Group. BMD at multiple sites and risk of fracture of multiple types: long-term results from the Study of Osteoporotic Fractures. J Bone Miner Res 2003; 18:1947–1954.
- Black DM, Cummings SR, Genant HK, Nevitt MC, Palermo L, Browner W. Axial and appendicular bone density predict fractures in older women. J Bone Miner Res 1992; 7:633–638.
- Siris ES, Baim S, Nattiv A. Primary care use of FRAX: absolute fracture risk assessment in postmenopausal women and older men. Postgrad Med 2010; 122:82–90.
- Cummings SR, Black DM, Thompson DE, et al. Effect of alendronate on risk of fracture in women with low bone density but without vertebral fractures: results from the Fracture Intervention Trial. JAMA 1998; 280:2077–2082.
- McClung MR, Geusens P, Miller PD, et al; Hip Intervention Program Study Group. Effect of risedronate on the risk of hip fracture in elderly women. Hip Intervention Program Study Group. N Engl J Med 2001; 344:333–340.
- Park A. How often do women really need bone density tests? Time: Health & Family. January 19, 2012. http://healthland.time.com/2012/01/19/most-women-may-be-getting-too-many-bone-density-tests/. Accessed January 29, 2013.
- Kolata G. Osteoporosis patients advised to delay bone density retests. The New York Times: Health. January 19, 2012. http://query.nytimes.com/gst/fullpage.html?res=9B01E1D61230F93AA25752C0A9649D8B63. Accessed January 29, 2013.
- National Committee for Quality Assurance. The State of Health Care Quality Report. http://www.ncqa.org/Portals/0/State%20of%20Health%20Care/2012/SOHC%20Report%20Web.pdf. Accessed February 1, 2013.
- King AB, Fiorentino DM. Medicare payment cuts for osteoporosis testing reduced use despite tests’ benefit in reducing fractures. Health Aff (Millwood) 2011; 30:2362–2370.
KEY POINTS
- The criteria for who should undergo bone mineral density measurement are well established, but data on repeat testing are scarce.
- Gourlay et al concluded that age and T scores are the key predictive factors in determining the bone mineral density testing interval, while clinical risk factors such as fracture after age 50, current smoking, previous or current use of glucocorticoids, and self-reported rheumatoid arthritis are not.
- The Fracture Risk Assessment tool (FRAX) is a useful clinical tool that calculates an individual’s 10-year risk of fracture. It is available at www.shef.ac.uk/FRAX
New tools for detecting occult monoclonal gammopathy, a cause of secondary osteoporosis
Sometimes, osteoporosis can be the presenting sign of a monoclonal gammopathy, which in some people may precede a diagnosis of multiple myeloma.1
In this article, we use two cases to illustrate the challenges of detecting monoclonal gammopathies as the cause of secondary osteoporosis. We also discuss the diagnostic limitations of current tests and the advantages of a newer test—measuring the serum levels of free light chains—in the workup of these patients.
CASE 1: A 55-YEAR-OLD WOMAN WITH BACK PAIN
A 55-year-old woman develops back pain after walking her dog, and the pain worsens despite treatment with a nonsteroidal anti-inflammatory drug for 1 week.
The patient has a history of well-controlled hypertension. She went through menopause 5 years ago, and about 2 years ago she was started on oral calcium and vitamin D for low bone density. At that time she complained of mild fatigue, which she attributed to working overtime and to lack of sleep.
Laboratory data, other tests
- Her white blood cell differential count is normal
- Hemoglobin 11.8 g/dL (normal range 12–15)
- Serum creatinine 1.0 mg/dL (0.5–1.4)
- Calcium 8.2 mg/dL (8.0–10.0)
- Albumin 4.5 g/dL (3.5–5.0)
- Total protein 5.7 g/dL (6.0–8.4)
- Serum and urine protein electrophoreses show no monoclonal spike (M-spike) or bands
- Serum free kappa light chains 5,542 mg/L (normal range 3.3–19.4).
Based on the elevation of serum free kappa light chains, the patient undergoes bone marrow aspiration biopsy. Histologic analysis reveals plasmacytosis (60% of her marrow cells are plasma cells [normal is < 5%]) with kappa light chain restriction.
A complete x-ray survey of the skull and long bones reveals widespread lytic lesions, consistent with multiple myeloma.
CASE 2: AN 88-YEAR-OLD MAN WITH MALAISE AND BACK PAIN
An 88-year-old man sees his family doctor because of malaise and back pain. He was treated for bladder cancer several years ago. He is currently being treated for prostatic hyperplasia, hypertension, and arthritis. Spinal radiography shows a compression deformity at T12, for which he undergoes kyphoplasty.
His complete blood cell count, white blood cell differential count, and kidney and metabolic profiles are normal.
Urine protein electrophoresis is normal, but serum electrophoresis detects an M-spike. On DXA of the hip, his T score is −3.7 (normal ≥ −1.0), and his Z score is −2.4 (normal > −2.0); suspicion of a secondary cause may be raised with Z scores of −1.0 or −1.5. The level of urinary NTX (cross-linked N-telopeptide of type I collagen, a marker of bone turnover) is 190 nmol bone collagen equivalents/nmol creatinine (normal range for men < 75), indicating a high level of bone turnover.
A serum free light chain assay shows twice the normal concentration of kappa light chains. The patient is referred for hematologic study and undergoes bone marrrow aspiration biopsy, which shows an abnormally high number of monoclonal plasma cells.
LESSONS FROM THESE CASES
The cases presented above illustrate several key clinical points:
- Minor back pain can be a symptom of a spinal compression fracture.
- Declining bone density should raise the suspicion of secondary osteoporosis, as should an abnormally low Z score.
- Markers of bone turnover are commonly elevated in secondary osteoporosis.
- Routine laboratory tests often fail to detect multiple myeloma.
BACK PAIN AS A SYMPTOM OF SPINAL COMPRESSION FRACTURE
Back pain is a very common complaint, and fortunately, most cases are due to benign causes. However, serious causes such as cancer, infection, and fractures must be considered. The topic has been reviewed in detail by Siemionow et al.2
Osteoporotic compression fractures are common in the elderly and are associated with loss of height. They can occur spontaneously or from minimal trauma. The workup can start with plain anteroposterior and lateral radiographs and routine laboratory tests, as in the patients described above. This information, as well as DXA testing, may provide clues that suggest that the osteoporosis is secondary to an underlying problem, or that a coexisting bone condition caused the fracture.
DXA CAN SUGGEST SECONDARY OSTEOPOROSIS
Declining bone density
Standard DXA testing is used to identify patients at high risk of fragility fractures from osteoporosis. It is also the accepted way to monitor disease progression and efficacy of treatment.
However, when checking to see if a patient’s bone density has changed over time, one must recognize that variations in technique from center to center or operator to operator can produce false changes in DXA results. 3,4 The testing center should state its own level of variance (referred to as the least significant change) and should indicate whether changes in a patient’s follow-up test results are statistically significant (ie, exceed that level).
A significant decline in bone mineral density over time may indicate that the patient is either not taking his or her medications or is not taking them as directed, as often happens with oral bisphosphonates—which must be taken first thing in the morning, on an empty stomach, with only a glass of water, at least 30 minutes before breakfast, during which time the patient must remain in an upright position.5–7 But a decline also raises the suspicion of an underlying condition instead of or in addition to osteoporosis, as described in the cases above. The normal decline in bone mineral density due to aging is 0.1% to 0.2% per year. For women 5 years after menopause, the rate increases to 1% to 2% and then slows to the rate of decline due to aging. A decline in bone density to the degree seen in case 1 is more than that which could be attributed to primary osteoporosis, and so an underlying cause must be considered.
Abnormally low Z scores also raise the suspicion of secondary osteoporosis
The T score is the difference, in standard deviations, between the patient’s bone density and the mean value in a population of healthy young adults. Since bone density tends to decline with age, so does the T score.
In contrast, the Z score compares a patient’s bone density with the mean value in a population the same age and sex as the patient. When it is abnormally low, it implies greater bone loss than predicted by aging alone or greater than expected from primary disease, so a secondary disorder must be considered.8,9 This was the case in our second patient, who had a Z score of −2.4.
No specific Z score cutoff has been established. Rather, the physician should be suspicious when it is lower than about −1.0 and when something in the patient’s clinical presentation, history, or laboratory evaluation raises suspicion of an underlying condition. In other words, the Z score is useful not by itself, but in context with other information.
In a retrospective analysis of men and women with osteoporosis, Swaminathan et al9 reported that a Z score cutoff of −1.0 had a sensitivity of 87.5% for detecting an underlying cause of osteoporosis.
Again, we want to emphasize that a low Z score alone is not sufficient to make a diagnosis of a secondary cause of osteoporosis. But it is good to be suspicious when a Z score is as low as in our second case and when that suspicion is reinforced by other clinical data.
MARKERS OF BONE TURNOVER
Biochemical markers of bone resorption, such as urinary NTX and the cross-linked C-telopeptide of type I collagen (CTX), have been shown to predict fracture risk independent of bone density measurements. The evidence to date supports the use of these markers in conjunction with bone density measurements to ascertain early on whether osteoporosis is responding to treatment, but their use alone to screen for osteoporosis is not encouraged.10
The markedly high level of NTX in our second patient would be unusual in primary disease—it implies a high degree of bone turnover and, in concert with the clinical information, suggests secondary osteoporosis.
SOME CAUSES OF SECONDARY BONE LOSS
If a patient has a low Z score, a declining T score, or other clues, it is critical to evaluate for causes of secondary bone loss, such as8:
- Endocrine disorders (Cushing syndrome, hyperparathyroidism, hypogonadism)
- Gastrointestinal disorders (malabsorption, cirrhosis, gastric bypass surgery)
- Renal insufficiency and failure
- Pulmonary diseases and their treatment
- Drug use (corticosteroids, antigonadotropins, anticonvulsants, aromatase inhibitors, antirejection drugs)
- Nutritional factors (alcohol abuse, smoking, eating disorders)
- Neurologic disease or its treatment
- Transplantation
- Genetic metabolic disorders
- Malignancy.
As in the scenarios presented above, unexplained changes in bone mineral density and mild anemia may trigger an evaluation for a monoclonal gammopathy.
MULTIPLE MYELOMA
Multiple myeloma is a cancer of the immunoglobulin-producing plasma cells in the bone marrow. Since the cancerous cells are clones, they all produce the same immunoglobulin—thus, the distinctive M-spike on serum or urine protein electrophoresis. It affects about 50,000 people in the United States.
The typical features of multiple myeloma are hypercalcemia, renal insufficiency, anemia, and bone lesions with or without osteoporosis. 11 Most patients have identifiable features of myeloma at the time of diagnosis, but perhaps 20% lack the characteristic symptoms of fatigue, back pain, or bone pain.
Most patients who eventually develop symptomatic multiple myeloma first present with monoclonal gammopathy of undetermined significance (MGUS), a disorder characterized by asymptomatic overproduction of an immunoglobulin. However, MGUS develops into multiple myeloma in only about 15% of cases.11
Widespread osteoporosis, due to cytokine-mediated osteoclast activation, is common in patients with multiple myeloma. As many as 90% of patients have lytic skeletal lesions or osteoporosis at the time of diagnosis.11,12
Myeloma-related osteoporosis can be difficult to differentiate from primary osteoporosis because not all patients secrete a monoclonal protein that standard urine or serum tests can detect.13 But new assays for serum free light chains can help resolve this diagnostic dilemma.14
WHEN IS TESTING FOR MONOCLONAL GAMMOPATHIES WARRANTED?
Screening for MGUS in the general osteoporotic population is not warranted, since its prevalence (2.1%) is similar to that in the general population (2.9%) of women age 50 or older and 5.3% to 7.5% of all persons age 70 years or older.15,16 However, testing for monoclonal gammopathies is warranted when clinical or laboratory findings—eg, subtle hints such as an unexplained elevation in the erythrocyte sedimentation rate or a low anion gap—trigger diagnostic suspicion. Unexplained hypercalcemia, renal insufficiency, unexplained anemia, hypo- and hypergammaglobulinemia, skeletal problems (eg, widespread osteoporosis, unexplained back or bone pain), and distal, symmetric polyneuropathy are the usual signs of underlying plasma cell neoplasia.
Signs of multiple myeloma: the CRAB mnemonic
Patients should be screened for multiple myeloma if they have any of the following presenting features not attributable to another disorder, using the mnemonic CRAB17:
Calcium elevation (serum calcium ≥ 11.5 mg/dL)
Renal insufficiency (serum creatinine > 1.73 mmol/L)
Anemia (normochromic, normocytic anema, with a hemoglobin value lower than 10 g/dL or more than 2 g/dL below the lower limit of normal)
Bone disease (lytic lesions, widespread osteoporosis, or bone fractures on skeletal survey, or a decline in bone mineral density or evidence of osteoporosis on DXA).
For the diagnosis of multiple myeloma to be made, the patient must have at least 10% clonal bone marrow plasma cells, evidence of a monoclonal protein in the serum or urine, and CRAB-related organ damage. When in doubt, referral for a hematologic evaluation is advised. Patients with signs of myeloma-related organ damage warrant prompt treatment.
Electrophoresis is not 100% sensitive
As the clinical cases above illustrate, standard testing for the monoclonal protein is not 100% sensitive for multiple myeloma, as some patients do not secrete the protein in the serum or urine.
In more than 97% of patients, the plasma cells that proliferate clonally produce a measurable monoclonal protein, such as an intact immunoglobulin only (eg, IgG kappa, IgA lambda), a light chain only (kappa or lambda), or intact immunoglobulins and free light chains. In the rest, no detectable monoclonal protein is produced, a disease subtype called nonsecretory multiple myeloma.
Of patients who secrete an intact immunoglobulin, 90% to 95% also produce excess free light chains.18,19 From 15% to 20% of patients with multiple myeloma secrete only light chains.1,20
Classically, serum and urine protein electrophoreses are the diagnostic tools used to evaluate monoclonal gammopathy, but urine electrophoresis detects only about 50% of myelomas.19
WHEN TO CONSIDER FREE LIGHT CHAIN ANALYSIS
While serum and urine protein electrophoreses are still the standard for screening for MGUS or multiple myeloma if one strongly suspects it, additional testing with serum free light chain analysis should be considered if patients exhibit CRAB-related features of myeloma-related organ damage, such as hypercalcemia, renal insufficiency, anemia, or bone loss.
Serum assays for free kappa and free lambda light chains can detect circulating clonal free light chains in most patients with nonsecretory multiple myeloma. In one study,21 elevated concentrations of either kappa or lambda free light chains (and abnormal kappa-lambda ratios) were detected in the sera of 19 of 28 patients with nonsecretory multiple myeloma, such that the diagnosis could be changed to oligosecretory disease.
Several studies have also found serum light chain panels to be highly sensitive for the diagnosis of MGUS or multiple myeloma.22–24 Clonal light chains must be present in a concentration of at least 500 mg/L to be detected by serum protein electrophoresis, or at least 150 mg/L to be detected by serum immunofixation. 25 In contrast, free light chain immunoassays can measure free light chain concentrations of 3 mg/L or lower, and can therefore detect light-chain-related disorders despite negative results on serum protein electrophoresis or immunofixation.14
Cost-effectiveness of free light chain analysis
Serum free light chain assays appear to be more cost-effective than urine tests in screening for monoclonal gammopathy: Medicare reimbursement is $38 for the serum free light chain assay vs $71 for the urine assay, which includes total urine protein, urine protein electrophoresis, and urine immunofixation electrophoresis.22
The kappa-lambda ratio
Normal values for serum free light chains are:
- Kappa 3.3–19.4 mg/L
- Lambda 5.7–26.3 mg/L
- Kappa-lambda ratio 0.26–1.65.
The kappa-lambda ratio is an indication of clonality.26,27 A ratio greater than 1.65 suggests a kappa free light chain monoclonal gammopathy; a ratio less than 0.26 suggests a lambda free light chain monoclonal gammopathy.
Importantly, in patients with renal impairment but no monoclonal gammopathy, the kappa-lambda ratio is often slightly higher—up to 3:1 because of reduced renal light chain clearance.26
However, not all patients with a monoclonal gammopathy have an abnormal free light chain ratio. Only one-third of patients with MGUS do, and these patients are at greater risk of progression to other plasma cell dyscrasias. 28 The free light chain ratio is normal in 5% to 10% of patients with intact immunoglobulin multiple myeloma.29,30 In a study of 116 patients with plasmacytoma, serum protein electrophoresis demonstrated an M-spike in half of patients, serum immunofixation was abnormal in two-thirds, and the kappa-lambda ratio was abnormal in half.31
A risk exists that MGUS will progress to multiple myeloma in patients who have an abnormal free light chain ratio. Thus, patients should be referred to a hematologist-oncologist for evaluation and monitoring if an abnormal kappa-lambda ratio is detected by serum free light chain assay.
Patients with abnormalities in the kappa-lambda ratio and no other evidence of monoclonal protein may harbor light-chain-related diseases only (eg, light chain multiple myeloma, primary amyloidosis, or light chain deposition disease) or a newly described entity, free light chain MGUS.14,19,27 An abnormal kappa-lambda ratio has also been noted in variable percentages of patients with chronic lymphocytic leukemia and malignant lymphoma.32
- Weiss BM, Abadie J, Verma P, Howard RS, Kuehl WM. A monoclonal gammopathy precedes multiple myeloma in most patients. Blood 2009; 113:5418–5422.
- Siemionow K, Steinmetz M, Bell G, Ilaslan H, McLain RF. Identifying serious causes of back pain: cancer, infection, fracture. Cleve Clin J Med 2008; 75:557–566.
- Binkley N, Krueger D. What should DXA reports contain? P of ordering health care providers. J Clin Densitom 2009; 12:5–10.
- Bonnick SL, Johnston CC, Kleerekoper M, et al Importance of precision in bone density measurements. J Clin Densitom 2001; 4:105–110.
- Gold DE, Alexander IM, Ettinger MP. How can osteoporosis patients benefit more from their therapy? Adherence issues with bisphosphonate therapy. Ann Pharmacother 2006; 40:1143–1150.
- Cremers SC, Pillai G, Papapoulos SE. Pharmacokinetics/pharmacodynamics of bisphosphonates: use for optimisation of intermittent therapy for osteoporosis. Clin Pharmacokinet 2005; 44:551–570.
- Lin JT, Lane JM. Bisphosphonates. J Am Acad Orthop Surg 2003; 11:1–4.
- Licata AA. Diagnosing primary osteoporosis: it’s more than a T score. Cleve Clin J Med 2006; 73:473–476.
- Swaminathan K, Flynn K, Garton M, Paterson C, Leese G. Search for secondary osteoporosis: are Z scores useful predictors? Postgrad Med J 2009; 85:38–39.
- Clowes JA, Eastell R. The role of bone turnover markers and risk factors in the assessment of osteoporosis and fracture risk. Baillieres Best Pract Res Clin Endocrinol Metab 2000; 14:213–232.
- Kyle RA, Gertz MA, Witzig TE, et al Review of 1027 patients with newly diagnosed multiple myeloma. Mayo Clin Proc 2003; 78:21–33.
- Hussein MA, Vrionis FD, Allison R, et al., International Myeloma Working Group. The role of vertebral augmentation in multiple myeloma: International Myeloma Working Group Consensus Statement. Leukemia 2008; 22:1479–1484.
- Blade J, Kyle RA. Nonsecretory myeloma, immunoglobulin D myeloma, and plasma cell leukemia. Hematol Oncol Clin North Am 1999; 13:1259–1272.
- Bradwell AR, Carr-Smith HD, Mead GP, Harvey TC, Drayson MT. Serum test for assessment of patients with Bence Jones myeloma. Lancet 2003; 361:489–491.
- Tannenbaum C, Clark J, Schwartzman K, et al Yield of laboratory testing to identify secondary contributors to osteoporosis in otherwise healthy women. J Clin Endocrinol Metab 2002; 87:4431–4437.
- Kyle RA, Therneau TM, Rajkumar SV, et al Prevalence of monoclonal gammopathy of undetermined significance. N Engl J Med 2006; 354:1362–1369.
- International Myeloma Working Group. Criteria for the classification of monoclonal gammopathies, multiple myeloma and related disorders: a report of the International Myeloma Working Group. Br J Haematol 2003; 121:749–757.
- Pepe J, Petrucci MT, Nofroni I, et al Lumbar bone mineral density as the major factor determining increased prevalence of vertebral fractures in monoclonal gammopathy of undetermined significance. Br J Haematol 2006; 134:485–490.
- Berenson JR, Yellin O, Boccia RV, et al Zoledronic acid markedly improves bone mineral density for patients with monoclonal gammopathy of undetermined significance and bone loss. Clin Cancer Res 2008; 14:6289–6295.
- Pepe J, Petrucci MT, Mascia ML, et al The effects of alendronate treatment in osteoporotic patients affected by monoclonal gammopathy of undetermined significance. Calcif Tissue Int 2008; 82:418–426.
- Drayson M, Tang LX, Drew R, Mead GP, Carr-Smith H, Bradwell AR. Serum free light-chain measurements for identifying and monitoring patients with nonsecretory multiple myeloma. Blood 2001; 97:2900–2902.
- Katzmann JA, Dispenzieri A, Kyle RA, et al Elimination of the need for urine studies in the screening algorithm for monoclonal gammopathies by using serum immunofixation and free light chain assays. Mayo Clin Proc 2006; 81:1575–1578.
- Abadie JM, van Hoeven KH, Wells JM. Are renal reference intervals required when screening for plasma cell disorders with serum free light chains and serum protein electrophoresis? Am J Clin Pathol 2009; 131:166–171.
- Abadie JM, Bankson DD. Assessment of serum free light chain assays for plasma cell disorder screening in a Veterans Affairs population. Ann Clin Lab Sci 2006; 36:157–162.
- Shaw GR. Nonsecretory plasma cell myeloma—becoming even more rare with serum free light-chain assay: a brief review. Arch Pathol Lab Med 2006; 130:1212–1215.
- Hutchison CA, Harding S, Hewins P, et al Quantitative assessment of serum and urinary polyclonal free light chains in patients with chronic kidney disease. Clin J Am Soc Nephrol 2008; 3:1684–1690.
- Katzmann JA, Clark RJ, Abraham RS, et al Serum reference intervals and diagnostic ranges for free kappa and free lambda immunoglobulin light chains: relative sensitivity for detection of monoclonal light chains. Clin Chem 2002; 48:1437–1444.
- Rajkumar SV, Kyle RA, Therneau TM, et al Serum free light chain ratio is an independent risk factor for progression in monoclonal gammopathy of undetermined significance. Blood 2005; 106:812–817.
- Mead GP, Carr-Smith HD, Drayson MT, Morgan GJ, Child JA, Bradwell AR. Serum free light chains for monitoring multiple myeloma. Br J Haematol 2004; 126:348–354.
- Dispenzieri A, Zhang L, Katzmann JA, et al Appraisal of immunoglobulin free light chain as a marker of response. Blood 2008; 111:4908–4915.
- Dingli D, Kyle RA, Rajkumar SV, et al Immunoglobulin free light chains and solitary plasmacytoma of bone. Blood 2006; 108:1979–1983.
- Martin W, Abraham R, Shanafelt T, et al Serum-free light chain—a new biomarker for patients with B-cell non-Hodgkin lymphoma and chronic lymphocytic leukemia. Transl Res 2007; 149:231–235.
Sometimes, osteoporosis can be the presenting sign of a monoclonal gammopathy, which in some people may precede a diagnosis of multiple myeloma.1
In this article, we use two cases to illustrate the challenges of detecting monoclonal gammopathies as the cause of secondary osteoporosis. We also discuss the diagnostic limitations of current tests and the advantages of a newer test—measuring the serum levels of free light chains—in the workup of these patients.
CASE 1: A 55-YEAR-OLD WOMAN WITH BACK PAIN
A 55-year-old woman develops back pain after walking her dog, and the pain worsens despite treatment with a nonsteroidal anti-inflammatory drug for 1 week.
The patient has a history of well-controlled hypertension. She went through menopause 5 years ago, and about 2 years ago she was started on oral calcium and vitamin D for low bone density. At that time she complained of mild fatigue, which she attributed to working overtime and to lack of sleep.
Laboratory data, other tests
- Her white blood cell differential count is normal
- Hemoglobin 11.8 g/dL (normal range 12–15)
- Serum creatinine 1.0 mg/dL (0.5–1.4)
- Calcium 8.2 mg/dL (8.0–10.0)
- Albumin 4.5 g/dL (3.5–5.0)
- Total protein 5.7 g/dL (6.0–8.4)
- Serum and urine protein electrophoreses show no monoclonal spike (M-spike) or bands
- Serum free kappa light chains 5,542 mg/L (normal range 3.3–19.4).
Based on the elevation of serum free kappa light chains, the patient undergoes bone marrow aspiration biopsy. Histologic analysis reveals plasmacytosis (60% of her marrow cells are plasma cells [normal is < 5%]) with kappa light chain restriction.
A complete x-ray survey of the skull and long bones reveals widespread lytic lesions, consistent with multiple myeloma.
CASE 2: AN 88-YEAR-OLD MAN WITH MALAISE AND BACK PAIN
An 88-year-old man sees his family doctor because of malaise and back pain. He was treated for bladder cancer several years ago. He is currently being treated for prostatic hyperplasia, hypertension, and arthritis. Spinal radiography shows a compression deformity at T12, for which he undergoes kyphoplasty.
His complete blood cell count, white blood cell differential count, and kidney and metabolic profiles are normal.
Urine protein electrophoresis is normal, but serum electrophoresis detects an M-spike. On DXA of the hip, his T score is −3.7 (normal ≥ −1.0), and his Z score is −2.4 (normal > −2.0); suspicion of a secondary cause may be raised with Z scores of −1.0 or −1.5. The level of urinary NTX (cross-linked N-telopeptide of type I collagen, a marker of bone turnover) is 190 nmol bone collagen equivalents/nmol creatinine (normal range for men < 75), indicating a high level of bone turnover.
A serum free light chain assay shows twice the normal concentration of kappa light chains. The patient is referred for hematologic study and undergoes bone marrrow aspiration biopsy, which shows an abnormally high number of monoclonal plasma cells.
LESSONS FROM THESE CASES
The cases presented above illustrate several key clinical points:
- Minor back pain can be a symptom of a spinal compression fracture.
- Declining bone density should raise the suspicion of secondary osteoporosis, as should an abnormally low Z score.
- Markers of bone turnover are commonly elevated in secondary osteoporosis.
- Routine laboratory tests often fail to detect multiple myeloma.
BACK PAIN AS A SYMPTOM OF SPINAL COMPRESSION FRACTURE
Back pain is a very common complaint, and fortunately, most cases are due to benign causes. However, serious causes such as cancer, infection, and fractures must be considered. The topic has been reviewed in detail by Siemionow et al.2
Osteoporotic compression fractures are common in the elderly and are associated with loss of height. They can occur spontaneously or from minimal trauma. The workup can start with plain anteroposterior and lateral radiographs and routine laboratory tests, as in the patients described above. This information, as well as DXA testing, may provide clues that suggest that the osteoporosis is secondary to an underlying problem, or that a coexisting bone condition caused the fracture.
DXA CAN SUGGEST SECONDARY OSTEOPOROSIS
Declining bone density
Standard DXA testing is used to identify patients at high risk of fragility fractures from osteoporosis. It is also the accepted way to monitor disease progression and efficacy of treatment.
However, when checking to see if a patient’s bone density has changed over time, one must recognize that variations in technique from center to center or operator to operator can produce false changes in DXA results. 3,4 The testing center should state its own level of variance (referred to as the least significant change) and should indicate whether changes in a patient’s follow-up test results are statistically significant (ie, exceed that level).
A significant decline in bone mineral density over time may indicate that the patient is either not taking his or her medications or is not taking them as directed, as often happens with oral bisphosphonates—which must be taken first thing in the morning, on an empty stomach, with only a glass of water, at least 30 minutes before breakfast, during which time the patient must remain in an upright position.5–7 But a decline also raises the suspicion of an underlying condition instead of or in addition to osteoporosis, as described in the cases above. The normal decline in bone mineral density due to aging is 0.1% to 0.2% per year. For women 5 years after menopause, the rate increases to 1% to 2% and then slows to the rate of decline due to aging. A decline in bone density to the degree seen in case 1 is more than that which could be attributed to primary osteoporosis, and so an underlying cause must be considered.
Abnormally low Z scores also raise the suspicion of secondary osteoporosis
The T score is the difference, in standard deviations, between the patient’s bone density and the mean value in a population of healthy young adults. Since bone density tends to decline with age, so does the T score.
In contrast, the Z score compares a patient’s bone density with the mean value in a population the same age and sex as the patient. When it is abnormally low, it implies greater bone loss than predicted by aging alone or greater than expected from primary disease, so a secondary disorder must be considered.8,9 This was the case in our second patient, who had a Z score of −2.4.
No specific Z score cutoff has been established. Rather, the physician should be suspicious when it is lower than about −1.0 and when something in the patient’s clinical presentation, history, or laboratory evaluation raises suspicion of an underlying condition. In other words, the Z score is useful not by itself, but in context with other information.
In a retrospective analysis of men and women with osteoporosis, Swaminathan et al9 reported that a Z score cutoff of −1.0 had a sensitivity of 87.5% for detecting an underlying cause of osteoporosis.
Again, we want to emphasize that a low Z score alone is not sufficient to make a diagnosis of a secondary cause of osteoporosis. But it is good to be suspicious when a Z score is as low as in our second case and when that suspicion is reinforced by other clinical data.
MARKERS OF BONE TURNOVER
Biochemical markers of bone resorption, such as urinary NTX and the cross-linked C-telopeptide of type I collagen (CTX), have been shown to predict fracture risk independent of bone density measurements. The evidence to date supports the use of these markers in conjunction with bone density measurements to ascertain early on whether osteoporosis is responding to treatment, but their use alone to screen for osteoporosis is not encouraged.10
The markedly high level of NTX in our second patient would be unusual in primary disease—it implies a high degree of bone turnover and, in concert with the clinical information, suggests secondary osteoporosis.
SOME CAUSES OF SECONDARY BONE LOSS
If a patient has a low Z score, a declining T score, or other clues, it is critical to evaluate for causes of secondary bone loss, such as8:
- Endocrine disorders (Cushing syndrome, hyperparathyroidism, hypogonadism)
- Gastrointestinal disorders (malabsorption, cirrhosis, gastric bypass surgery)
- Renal insufficiency and failure
- Pulmonary diseases and their treatment
- Drug use (corticosteroids, antigonadotropins, anticonvulsants, aromatase inhibitors, antirejection drugs)
- Nutritional factors (alcohol abuse, smoking, eating disorders)
- Neurologic disease or its treatment
- Transplantation
- Genetic metabolic disorders
- Malignancy.
As in the scenarios presented above, unexplained changes in bone mineral density and mild anemia may trigger an evaluation for a monoclonal gammopathy.
MULTIPLE MYELOMA
Multiple myeloma is a cancer of the immunoglobulin-producing plasma cells in the bone marrow. Since the cancerous cells are clones, they all produce the same immunoglobulin—thus, the distinctive M-spike on serum or urine protein electrophoresis. It affects about 50,000 people in the United States.
The typical features of multiple myeloma are hypercalcemia, renal insufficiency, anemia, and bone lesions with or without osteoporosis. 11 Most patients have identifiable features of myeloma at the time of diagnosis, but perhaps 20% lack the characteristic symptoms of fatigue, back pain, or bone pain.
Most patients who eventually develop symptomatic multiple myeloma first present with monoclonal gammopathy of undetermined significance (MGUS), a disorder characterized by asymptomatic overproduction of an immunoglobulin. However, MGUS develops into multiple myeloma in only about 15% of cases.11
Widespread osteoporosis, due to cytokine-mediated osteoclast activation, is common in patients with multiple myeloma. As many as 90% of patients have lytic skeletal lesions or osteoporosis at the time of diagnosis.11,12
Myeloma-related osteoporosis can be difficult to differentiate from primary osteoporosis because not all patients secrete a monoclonal protein that standard urine or serum tests can detect.13 But new assays for serum free light chains can help resolve this diagnostic dilemma.14
WHEN IS TESTING FOR MONOCLONAL GAMMOPATHIES WARRANTED?
Screening for MGUS in the general osteoporotic population is not warranted, since its prevalence (2.1%) is similar to that in the general population (2.9%) of women age 50 or older and 5.3% to 7.5% of all persons age 70 years or older.15,16 However, testing for monoclonal gammopathies is warranted when clinical or laboratory findings—eg, subtle hints such as an unexplained elevation in the erythrocyte sedimentation rate or a low anion gap—trigger diagnostic suspicion. Unexplained hypercalcemia, renal insufficiency, unexplained anemia, hypo- and hypergammaglobulinemia, skeletal problems (eg, widespread osteoporosis, unexplained back or bone pain), and distal, symmetric polyneuropathy are the usual signs of underlying plasma cell neoplasia.
Signs of multiple myeloma: the CRAB mnemonic
Patients should be screened for multiple myeloma if they have any of the following presenting features not attributable to another disorder, using the mnemonic CRAB17:
Calcium elevation (serum calcium ≥ 11.5 mg/dL)
Renal insufficiency (serum creatinine > 1.73 mmol/L)
Anemia (normochromic, normocytic anema, with a hemoglobin value lower than 10 g/dL or more than 2 g/dL below the lower limit of normal)
Bone disease (lytic lesions, widespread osteoporosis, or bone fractures on skeletal survey, or a decline in bone mineral density or evidence of osteoporosis on DXA).
For the diagnosis of multiple myeloma to be made, the patient must have at least 10% clonal bone marrow plasma cells, evidence of a monoclonal protein in the serum or urine, and CRAB-related organ damage. When in doubt, referral for a hematologic evaluation is advised. Patients with signs of myeloma-related organ damage warrant prompt treatment.
Electrophoresis is not 100% sensitive
As the clinical cases above illustrate, standard testing for the monoclonal protein is not 100% sensitive for multiple myeloma, as some patients do not secrete the protein in the serum or urine.
In more than 97% of patients, the plasma cells that proliferate clonally produce a measurable monoclonal protein, such as an intact immunoglobulin only (eg, IgG kappa, IgA lambda), a light chain only (kappa or lambda), or intact immunoglobulins and free light chains. In the rest, no detectable monoclonal protein is produced, a disease subtype called nonsecretory multiple myeloma.
Of patients who secrete an intact immunoglobulin, 90% to 95% also produce excess free light chains.18,19 From 15% to 20% of patients with multiple myeloma secrete only light chains.1,20
Classically, serum and urine protein electrophoreses are the diagnostic tools used to evaluate monoclonal gammopathy, but urine electrophoresis detects only about 50% of myelomas.19
WHEN TO CONSIDER FREE LIGHT CHAIN ANALYSIS
While serum and urine protein electrophoreses are still the standard for screening for MGUS or multiple myeloma if one strongly suspects it, additional testing with serum free light chain analysis should be considered if patients exhibit CRAB-related features of myeloma-related organ damage, such as hypercalcemia, renal insufficiency, anemia, or bone loss.
Serum assays for free kappa and free lambda light chains can detect circulating clonal free light chains in most patients with nonsecretory multiple myeloma. In one study,21 elevated concentrations of either kappa or lambda free light chains (and abnormal kappa-lambda ratios) were detected in the sera of 19 of 28 patients with nonsecretory multiple myeloma, such that the diagnosis could be changed to oligosecretory disease.
Several studies have also found serum light chain panels to be highly sensitive for the diagnosis of MGUS or multiple myeloma.22–24 Clonal light chains must be present in a concentration of at least 500 mg/L to be detected by serum protein electrophoresis, or at least 150 mg/L to be detected by serum immunofixation. 25 In contrast, free light chain immunoassays can measure free light chain concentrations of 3 mg/L or lower, and can therefore detect light-chain-related disorders despite negative results on serum protein electrophoresis or immunofixation.14
Cost-effectiveness of free light chain analysis
Serum free light chain assays appear to be more cost-effective than urine tests in screening for monoclonal gammopathy: Medicare reimbursement is $38 for the serum free light chain assay vs $71 for the urine assay, which includes total urine protein, urine protein electrophoresis, and urine immunofixation electrophoresis.22
The kappa-lambda ratio
Normal values for serum free light chains are:
- Kappa 3.3–19.4 mg/L
- Lambda 5.7–26.3 mg/L
- Kappa-lambda ratio 0.26–1.65.
The kappa-lambda ratio is an indication of clonality.26,27 A ratio greater than 1.65 suggests a kappa free light chain monoclonal gammopathy; a ratio less than 0.26 suggests a lambda free light chain monoclonal gammopathy.
Importantly, in patients with renal impairment but no monoclonal gammopathy, the kappa-lambda ratio is often slightly higher—up to 3:1 because of reduced renal light chain clearance.26
However, not all patients with a monoclonal gammopathy have an abnormal free light chain ratio. Only one-third of patients with MGUS do, and these patients are at greater risk of progression to other plasma cell dyscrasias. 28 The free light chain ratio is normal in 5% to 10% of patients with intact immunoglobulin multiple myeloma.29,30 In a study of 116 patients with plasmacytoma, serum protein electrophoresis demonstrated an M-spike in half of patients, serum immunofixation was abnormal in two-thirds, and the kappa-lambda ratio was abnormal in half.31
A risk exists that MGUS will progress to multiple myeloma in patients who have an abnormal free light chain ratio. Thus, patients should be referred to a hematologist-oncologist for evaluation and monitoring if an abnormal kappa-lambda ratio is detected by serum free light chain assay.
Patients with abnormalities in the kappa-lambda ratio and no other evidence of monoclonal protein may harbor light-chain-related diseases only (eg, light chain multiple myeloma, primary amyloidosis, or light chain deposition disease) or a newly described entity, free light chain MGUS.14,19,27 An abnormal kappa-lambda ratio has also been noted in variable percentages of patients with chronic lymphocytic leukemia and malignant lymphoma.32
- Weiss BM, Abadie J, Verma P, Howard RS, Kuehl WM. A monoclonal gammopathy precedes multiple myeloma in most patients. Blood 2009; 113:5418–5422.
- Siemionow K, Steinmetz M, Bell G, Ilaslan H, McLain RF. Identifying serious causes of back pain: cancer, infection, fracture. Cleve Clin J Med 2008; 75:557–566.
- Binkley N, Krueger D. What should DXA reports contain? P of ordering health care providers. J Clin Densitom 2009; 12:5–10.
- Bonnick SL, Johnston CC, Kleerekoper M, et al Importance of precision in bone density measurements. J Clin Densitom 2001; 4:105–110.
- Gold DE, Alexander IM, Ettinger MP. How can osteoporosis patients benefit more from their therapy? Adherence issues with bisphosphonate therapy. Ann Pharmacother 2006; 40:1143–1150.
- Cremers SC, Pillai G, Papapoulos SE. Pharmacokinetics/pharmacodynamics of bisphosphonates: use for optimisation of intermittent therapy for osteoporosis. Clin Pharmacokinet 2005; 44:551–570.
- Lin JT, Lane JM. Bisphosphonates. J Am Acad Orthop Surg 2003; 11:1–4.
- Licata AA. Diagnosing primary osteoporosis: it’s more than a T score. Cleve Clin J Med 2006; 73:473–476.
- Swaminathan K, Flynn K, Garton M, Paterson C, Leese G. Search for secondary osteoporosis: are Z scores useful predictors? Postgrad Med J 2009; 85:38–39.
- Clowes JA, Eastell R. The role of bone turnover markers and risk factors in the assessment of osteoporosis and fracture risk. Baillieres Best Pract Res Clin Endocrinol Metab 2000; 14:213–232.
- Kyle RA, Gertz MA, Witzig TE, et al Review of 1027 patients with newly diagnosed multiple myeloma. Mayo Clin Proc 2003; 78:21–33.
- Hussein MA, Vrionis FD, Allison R, et al., International Myeloma Working Group. The role of vertebral augmentation in multiple myeloma: International Myeloma Working Group Consensus Statement. Leukemia 2008; 22:1479–1484.
- Blade J, Kyle RA. Nonsecretory myeloma, immunoglobulin D myeloma, and plasma cell leukemia. Hematol Oncol Clin North Am 1999; 13:1259–1272.
- Bradwell AR, Carr-Smith HD, Mead GP, Harvey TC, Drayson MT. Serum test for assessment of patients with Bence Jones myeloma. Lancet 2003; 361:489–491.
- Tannenbaum C, Clark J, Schwartzman K, et al Yield of laboratory testing to identify secondary contributors to osteoporosis in otherwise healthy women. J Clin Endocrinol Metab 2002; 87:4431–4437.
- Kyle RA, Therneau TM, Rajkumar SV, et al Prevalence of monoclonal gammopathy of undetermined significance. N Engl J Med 2006; 354:1362–1369.
- International Myeloma Working Group. Criteria for the classification of monoclonal gammopathies, multiple myeloma and related disorders: a report of the International Myeloma Working Group. Br J Haematol 2003; 121:749–757.
- Pepe J, Petrucci MT, Nofroni I, et al Lumbar bone mineral density as the major factor determining increased prevalence of vertebral fractures in monoclonal gammopathy of undetermined significance. Br J Haematol 2006; 134:485–490.
- Berenson JR, Yellin O, Boccia RV, et al Zoledronic acid markedly improves bone mineral density for patients with monoclonal gammopathy of undetermined significance and bone loss. Clin Cancer Res 2008; 14:6289–6295.
- Pepe J, Petrucci MT, Mascia ML, et al The effects of alendronate treatment in osteoporotic patients affected by monoclonal gammopathy of undetermined significance. Calcif Tissue Int 2008; 82:418–426.
- Drayson M, Tang LX, Drew R, Mead GP, Carr-Smith H, Bradwell AR. Serum free light-chain measurements for identifying and monitoring patients with nonsecretory multiple myeloma. Blood 2001; 97:2900–2902.
- Katzmann JA, Dispenzieri A, Kyle RA, et al Elimination of the need for urine studies in the screening algorithm for monoclonal gammopathies by using serum immunofixation and free light chain assays. Mayo Clin Proc 2006; 81:1575–1578.
- Abadie JM, van Hoeven KH, Wells JM. Are renal reference intervals required when screening for plasma cell disorders with serum free light chains and serum protein electrophoresis? Am J Clin Pathol 2009; 131:166–171.
- Abadie JM, Bankson DD. Assessment of serum free light chain assays for plasma cell disorder screening in a Veterans Affairs population. Ann Clin Lab Sci 2006; 36:157–162.
- Shaw GR. Nonsecretory plasma cell myeloma—becoming even more rare with serum free light-chain assay: a brief review. Arch Pathol Lab Med 2006; 130:1212–1215.
- Hutchison CA, Harding S, Hewins P, et al Quantitative assessment of serum and urinary polyclonal free light chains in patients with chronic kidney disease. Clin J Am Soc Nephrol 2008; 3:1684–1690.
- Katzmann JA, Clark RJ, Abraham RS, et al Serum reference intervals and diagnostic ranges for free kappa and free lambda immunoglobulin light chains: relative sensitivity for detection of monoclonal light chains. Clin Chem 2002; 48:1437–1444.
- Rajkumar SV, Kyle RA, Therneau TM, et al Serum free light chain ratio is an independent risk factor for progression in monoclonal gammopathy of undetermined significance. Blood 2005; 106:812–817.
- Mead GP, Carr-Smith HD, Drayson MT, Morgan GJ, Child JA, Bradwell AR. Serum free light chains for monitoring multiple myeloma. Br J Haematol 2004; 126:348–354.
- Dispenzieri A, Zhang L, Katzmann JA, et al Appraisal of immunoglobulin free light chain as a marker of response. Blood 2008; 111:4908–4915.
- Dingli D, Kyle RA, Rajkumar SV, et al Immunoglobulin free light chains and solitary plasmacytoma of bone. Blood 2006; 108:1979–1983.
- Martin W, Abraham R, Shanafelt T, et al Serum-free light chain—a new biomarker for patients with B-cell non-Hodgkin lymphoma and chronic lymphocytic leukemia. Transl Res 2007; 149:231–235.
KEY POINTS
- Minor back pain can be a symptom of spinal compression fracture.
- Rapidly declining bone density or a low Z score on dual-energy x-ray absorptiometry suggests that osteoporosis is secondary to another condition.
- The evidence to date supports the use of bone turnover markers in conjunction with density measurements to ascertain early on whether osteoporosis is responding to treatment, but the use of biochemical markers by themselves to screen for osteoporosis is not encouraged.
- Standard tests may fail to detect myeloma in the presence of worsening bone density.
- While serum and urine protein electrophoreses are still the standard screening tests for multiple myeloma, additional testing with serum free light chain analysis should be considered if the suspicion is high.
Biochemical markers of bone turnover: Useful but underused
Biochemical markers of bone turnover are commonly used as tests in the management of bone disorders, as explained very elegantly by Drs. Singer and Eyre in this issue of the Journal.1
These tests assess the activity of osteoblastic cells or osteoclastic cells in a variety of bone diseases. Such tests do not establish the diagnosis of a disease, but rather they reflect the activity of the skeleton. Because the activity of osteoblasts and the activity of osteoclasts are chemically coupled, markers of blastic and clastic activity move in the same direction. In states of high bone metabolism or turnover, marker levels are high, predicting bone loss and fracture risk. Therapies that slow down bone metabolism make these levels decrease; anabolic drugs that stimulate bone growth do the opposite.
The utility of these markers in general practice is not well appreciated. In part this is because the results can vary if the tests are not appropriately done, causing frustration for some clinicians, who erroneously conclude that these markers lack utility.
WILL INSURANCE PAY FOR TESTING?
In addition, these tests are a source of confrontation with third-party payers who refuse to pay for them, even though they are approved by Medicare and have appropriate Current Procedural Terminology codes assigned to them. The reasons cited for denying payment are that the tests are not diagnostic, that they do not predict risk, and that they are not useful in patient management.
Wrong on all counts! First of all, these markers were never meant to diagnose a specific bone disease. They reflect high bone activity or turnover and potential bone loss, and high levels indicate that further assessment is needed. (In much the same way, an elevated prostate-specific antigen level may or may not mean the patient has prostate cancer, but it does mean further assessment is needed.)
Second, these tests do address fracture risk, either when used alone or when combined with bone densitometry measurements. A high level of a turnover marker indicates a risk of fracture similar to that of a T score lower than −2.5, with an odds ratio in the range of 2.4 to 2.8. 2 Moreover, if a patient has a low T score and a high marker level, his or her risk is even higher, with an odds ratio of 4.1.
Third, the argument about the tests’ lack of ability to help in patient management is completely untrue, as shown by information reviewed by Drs. Singer and Eyre, 1 and by other data recently published. 3 These tests can indicate whether bone physiology is responding to antiresorptive and anabolic drug therapy: marker activity should decline with antiresorptive drugs and increase with anabolic agents.
And this occurs months to years before bone densitometry even reflects a change! The failure of test values to respond appropriately should prompt physicians to find out why. Is the patient not taking the medicine appropriately? Or more worrisome, is he or she not taking it at all?
AN ADDED BENEFIT: BETTER ADHERENCE
The latter point brings up a common problem seen in practice—lack of adherence to drug therapy. Studies have repeatedly shown that only 50% to 60% of osteoporotic patients actually continue taking their oral medicine for a year or so. 4, 5 The reasons are unclear but may include cost, side effects, inconvenience in administration, and lack of any sign that the drug is doing anything. Bone densitometry may not always show changes that encourage patients to continue using expensive medicines.
Bone markers may be a solution to this dilemma. Changes in a bone marker help clinicians know that the patient is properly using therapy. 6 Moreover, these changes tell the patient that treatment is working. In my experience, relaying this type of information to the patient encourages adherence. Studies have indicated that markers do indeed help patients stay adherent to therapy and avoid fractures. 7, 8 Hence, these markers can indicate the risk of fracture and are useful in managing patients and promoting compliance.
It is unclear when third-party carriers will begin reading the appropriate literature to confirm these points, but practitioners need to recognize that there is a valid reason for using these tests.
- Singer FR, Eyre DR. Using biochemical markers of bone turnover in clinical practice. Cleve Clin J Med. 2008; 75:739–750.
- Johnell O, Odén A, De Laet C, Garnero P, Delmas PD, Kanis JA. Biochemical indices of bone turnover and the assessment of fracture probability. Osteoporos Int. 2002; 13:523–526.
- Delmas PD, Eastell R, Garnero P, Seibel MJ, Stepan JCommittee of Scientific Advisors of the International Osteoporosis Foundation. The use of biochemical markers of bone turnover in osteoporosis. Osteoporos Int 2000; 11(suppl 6):S2–S17.
- Ivaska KK, Lenora J, Gerdhem P, Akesson K, Väänänen HK, Obrant KJ. Serial assessment of serum bone metabolism markers identifies women with the highest rate of bone loss and osteoporosis risk. J Clin Endocrinol Metab. 2008; 93:2622–2632.
- Briesacher BA, Andrade SE, Fouayzi H, Chan KA. Comparison of drug adherence rates among patients with seven different medical conditions. Pharmacotherapy. 2008; 28:437–443.
- Eastell R, Krege JH, Chen P, Glass EV, Reginster JY. Development of an algorithm for using PINP to monitor treatment of patients with teriparatide. Curr Med Res Opin. 2006; 22:61–66.
- Briesacher BA, Andrade SE, Yood RA, Kahler KH. Consequences of poor compliance with bisphosphonates. Bone. 2007; 41:882–887.
- Delmas PD, Vrijens B, Eastell R, et al. Effect of monitoring bone turnover markers on persistence with risedronate treatment of postmenopausal osteoporosis. J Clin Endocrinol Metab. 2007; 92:1296–1304.
Biochemical markers of bone turnover are commonly used as tests in the management of bone disorders, as explained very elegantly by Drs. Singer and Eyre in this issue of the Journal.1
These tests assess the activity of osteoblastic cells or osteoclastic cells in a variety of bone diseases. Such tests do not establish the diagnosis of a disease, but rather they reflect the activity of the skeleton. Because the activity of osteoblasts and the activity of osteoclasts are chemically coupled, markers of blastic and clastic activity move in the same direction. In states of high bone metabolism or turnover, marker levels are high, predicting bone loss and fracture risk. Therapies that slow down bone metabolism make these levels decrease; anabolic drugs that stimulate bone growth do the opposite.
The utility of these markers in general practice is not well appreciated. In part this is because the results can vary if the tests are not appropriately done, causing frustration for some clinicians, who erroneously conclude that these markers lack utility.
WILL INSURANCE PAY FOR TESTING?
In addition, these tests are a source of confrontation with third-party payers who refuse to pay for them, even though they are approved by Medicare and have appropriate Current Procedural Terminology codes assigned to them. The reasons cited for denying payment are that the tests are not diagnostic, that they do not predict risk, and that they are not useful in patient management.
Wrong on all counts! First of all, these markers were never meant to diagnose a specific bone disease. They reflect high bone activity or turnover and potential bone loss, and high levels indicate that further assessment is needed. (In much the same way, an elevated prostate-specific antigen level may or may not mean the patient has prostate cancer, but it does mean further assessment is needed.)
Second, these tests do address fracture risk, either when used alone or when combined with bone densitometry measurements. A high level of a turnover marker indicates a risk of fracture similar to that of a T score lower than −2.5, with an odds ratio in the range of 2.4 to 2.8. 2 Moreover, if a patient has a low T score and a high marker level, his or her risk is even higher, with an odds ratio of 4.1.
Third, the argument about the tests’ lack of ability to help in patient management is completely untrue, as shown by information reviewed by Drs. Singer and Eyre, 1 and by other data recently published. 3 These tests can indicate whether bone physiology is responding to antiresorptive and anabolic drug therapy: marker activity should decline with antiresorptive drugs and increase with anabolic agents.
And this occurs months to years before bone densitometry even reflects a change! The failure of test values to respond appropriately should prompt physicians to find out why. Is the patient not taking the medicine appropriately? Or more worrisome, is he or she not taking it at all?
AN ADDED BENEFIT: BETTER ADHERENCE
The latter point brings up a common problem seen in practice—lack of adherence to drug therapy. Studies have repeatedly shown that only 50% to 60% of osteoporotic patients actually continue taking their oral medicine for a year or so. 4, 5 The reasons are unclear but may include cost, side effects, inconvenience in administration, and lack of any sign that the drug is doing anything. Bone densitometry may not always show changes that encourage patients to continue using expensive medicines.
Bone markers may be a solution to this dilemma. Changes in a bone marker help clinicians know that the patient is properly using therapy. 6 Moreover, these changes tell the patient that treatment is working. In my experience, relaying this type of information to the patient encourages adherence. Studies have indicated that markers do indeed help patients stay adherent to therapy and avoid fractures. 7, 8 Hence, these markers can indicate the risk of fracture and are useful in managing patients and promoting compliance.
It is unclear when third-party carriers will begin reading the appropriate literature to confirm these points, but practitioners need to recognize that there is a valid reason for using these tests.
- Singer FR, Eyre DR. Using biochemical markers of bone turnover in clinical practice. Cleve Clin J Med. 2008; 75:739–750.
- Johnell O, Odén A, De Laet C, Garnero P, Delmas PD, Kanis JA. Biochemical indices of bone turnover and the assessment of fracture probability. Osteoporos Int. 2002; 13:523–526.
- Delmas PD, Eastell R, Garnero P, Seibel MJ, Stepan JCommittee of Scientific Advisors of the International Osteoporosis Foundation. The use of biochemical markers of bone turnover in osteoporosis. Osteoporos Int 2000; 11(suppl 6):S2–S17.
- Ivaska KK, Lenora J, Gerdhem P, Akesson K, Väänänen HK, Obrant KJ. Serial assessment of serum bone metabolism markers identifies women with the highest rate of bone loss and osteoporosis risk. J Clin Endocrinol Metab. 2008; 93:2622–2632.
- Briesacher BA, Andrade SE, Fouayzi H, Chan KA. Comparison of drug adherence rates among patients with seven different medical conditions. Pharmacotherapy. 2008; 28:437–443.
- Eastell R, Krege JH, Chen P, Glass EV, Reginster JY. Development of an algorithm for using PINP to monitor treatment of patients with teriparatide. Curr Med Res Opin. 2006; 22:61–66.
- Briesacher BA, Andrade SE, Yood RA, Kahler KH. Consequences of poor compliance with bisphosphonates. Bone. 2007; 41:882–887.
- Delmas PD, Vrijens B, Eastell R, et al. Effect of monitoring bone turnover markers on persistence with risedronate treatment of postmenopausal osteoporosis. J Clin Endocrinol Metab. 2007; 92:1296–1304.