User login
Increasing Mobility via In-hospital Ambulation Protocol Delivered by Mobility Technicians: A Pilot Randomized Controlled Trial
Individuals aged 65 years and over represent 13% of the United States population and account for nearly 40% of hospital discharges.1 Bedrest hastens the functional decline of older patients2-5 and is associated with risk of serious complications, such as falls, delirium, venous thrombosis, and skin breakdown.6,7 Ambulation is widely recognized as important for improving hospital outcomes.8-10 Observational studies suggest that increases of 600 steps per day are associated with shortened length of hospital stay.9 However, randomized trials of assisted ambulation have not demonstrated consistent benefit.11-14 As a result, usual care at most hospitals in the United States does not include assisted ambulation. Even when ambulation is ordered, execution of the orders is inconsistent.15-17
Studies have demonstrated the benefits of various exercise protocols for older patients in rehabilitation facilities,18,19 medical intensive care units,20 and medical and surgical wards.13,18,21 These interventions are usually nursing centered; however, assisting patients with ambulation multiple times per day may be a burdensome addition to the myriad responsibilities of nurses.19,22,23 In fact, ambulation orders are the most frequently overlooked nursing task.24
We designed a graded protocol of assisted ambulation implemented by a dedicated patient care nursing assistant (PCNA) multiple times daily to increase patient mobility. The objective of this study was to assess the feasibility and effectiveness of such an intervention for older inpatients. We hypothesized that the intervention would prove feasible and improve hospital outcomes, including less need for inpatient rehabilitation and shorter length of stay.
METHODS
We conducted a single-blind randomized controlled trial of patients aged ≥60 years and admitted as medical inpatients to the Cleveland Clinic Main Campus, a tertiary care center with over 1,440 inpatient beds. The consent form and study protocol were approved by the Cleveland Clinic Institutional Review Board, and the study was registered with ClinicalTrials.gov (NCT02757131).
Patients
All patients who were admitted to study wards for a medical illness and evaluated by Physical Therapy (PT) were eligible for the study. PT evaluations were ordered by the medical team if deemed necessary on the basis of factors, such as age, estimated mobility, and concerns raised by the ancillary staff. All patients who were expected to be discharged to a skilled nursing facility placement or who required home PT received a PT evaluation. Assessment of mobility was documented via Activity Measure for Postacute Care Inpatient Basic Mobility “six-clicks” short form, hereafter abbreviated as “six-clicks.” Based on past experience, patients with scores <16 rarely go home (<20% of the time), and those with scores >20 usually go home regardless of ambulation. Therefore, only patients with scores of 16-20 were invited to participate in the study. Although patients who were not evaluated by PT might also benefit from the intervention, we required a six-clicks score to assess eligibility. The exclusion criteria included anticipated remaining length of stay less than three days, admission under observation status, admission to the intensive care unit (ICU,) patients receiving comfort care measures, and patients with medical conditions precluding ambulation, such as decompensated heart failure or unstable angina.
Randomization
Patients were randomized to “usual care” or “mobility technician” after baseline evaluation using a computerized system. A block randomization scheme with a size of four was used to ensure an approximately equal number of patients per group.
Intervention
Patients randomized to the intervention group were asked to participate in the ambulation protocol outlined by the PT three times daily under the supervision of the mobility technician. The protocol involved four exercise levels (sitting, standing, walking, and stairs), which were implemented depending on the patient’s physical capacity. The mobility technicians, who were PCNAs, were trained by the PT team. PCNAs have no specific degrees or certification. They are taught safe handling techniques during their job orientation, so they already had an understanding of how to transfer and assist a patient with ambulation. The mobility technician training consisted of one four-hour session run by the PT team in the physical therapy department and the nursing unit. The training included safe handling practices and basic mobility, such as transfers from bed to chair, bed to standing, walking with assistance, and walking independently with equipment such as cane, rolling walker, and walking belt. All instruction was demonstrated by the trainer, and the mobility technician was then able to practice. The mobility technician then shadowed the trainer and practiced the techniques under supervision. Competency was assessed by the trainer.
The cohort of patients randomized to “usual care” was not seen by the mobility technicians but was not otherwise restricted in nursing’s baseline ability to execute recommendations placed by the PT team. Compliance with the recommendations is highly variable and dependent on patient acuity during the shift, staffing issues, and competing duties. Cleveland Clinic promotes a “culture of mobility,” and nurses are encouraged to get patients out of bed and assist with ambulation.
Study Instruments—Measures of Mobility
The six-clicks instrument is a tool for measuring basic mobility. It was adapted from the Activity Measures for Post-Acute Care (AM-PAC) instrument.25 Although initially created for self-report in the post-acute care setting, six-clicks has been validated for use by PTs in the acute care setting26 and is currently in use at more than 1,000 US hospitals. Cleveland Clinic PTs have used this measure for routine evaluation since 2011. The instrument has high interrater reliability and can predict discharge disposition.27-29
Each patient was provided with a tracking device (Fitbit) attached at the wrist to record daily steps for measuring mobility. The use of Fitbit has been validated in ambulatory and inpatient settings.30 The device produces step counts within 3% of the observed step count for most patients but may undercount steps in patients with very slow gait.31 The device was provided to each enrollee and collected at discharge.
Variables
Demographic information, comorbid diagnoses, and discharge destination were extracted from the electronic medical record. Information on prehospitalization physical activity level was obtained from the initial PT assessment. Falls were tracked through the safety event reporting system.
Outcomes
The primary outcomes were discharge disposition and hospital length of stay. The secondary outcomes included average steps per day, change in six-clicks score from admission to discharge, inpatient mortality, admission to ICU, falls, deep vein thrombosis, pulmonary embolism, or pneumonia, and readmission within 30 days.
Statistical Analysis
Patient characteristics were summarized as means and standard deviations or medians and interquartile ranges for continuous variables and as frequencies and percentages for categorical variables. The t-test or Wilcoxon rank sum test was applied to compare continuous characteristics between the intervention and control groups. Chi-squared test or Fisher’s exact test was applied to compare categorical characteristics. Given its skewed distribution, the length of stay was log-transformed and compared between the two groups using Student’s t-test. Chi-squared test was used to compare categorical outcomes. The analysis of final six-clicks scores was adjusted for baseline scores, and the least-square estimates are provided. A linear mixed effects model was used to compare the number of daily steps taken because each participant had multiple steps measured. Results were adjusted for prehospital activity. In addition to comparing the total steps taken by each group, we determined the proportion of patients who exceeded a particular threshold by taking the average number of steps per day for all subjects and relating it to home discharge using the Receiver Operating Characteristics (ROC) curve. An optimal cut-off was determined to maximize the Youden index. We also compared the proportion of patients who exceeded 900 steps because this value was previously reported as an important threshold.32 All analyses were conducted using intention-to-treat principles. We also conducted a per-protocol analysis in which we limited the intervention group to those who received at least one assisted ambulation session. A dose-response analysis was also performed, in which patients were categorized as not receiving the therapy, receiving sessions on one or two days, or receiving them on more than two days.
All analyses were conducted using R-studio (Boston, MA). Statistical significance was defined as a P-value < .05. Given that this is a pilot study, the results were not adjusted for multiple comparisons.
RESULTS
Characteristics of patients in the intervention and control groups are shown in Table 1. The patients were mostly white and female, with an average age in the mid-70s (range 61-98). All measures evaluated were not significantly different between the intervention and control groups. However, more patients in the intervention group had a prehospital activity level classified as independent.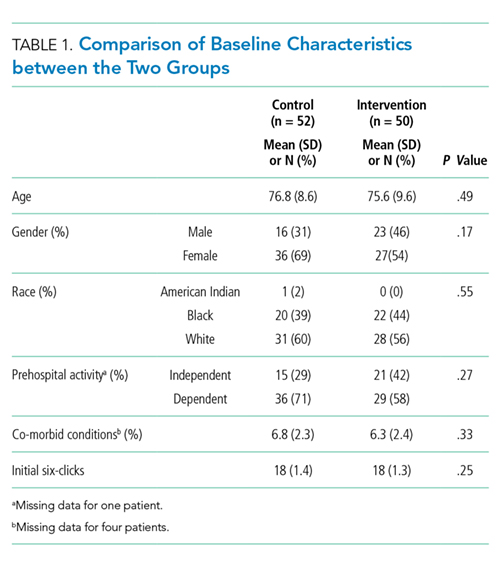
Table 2 demonstrates the feasibility of the intervention. Of patients randomized to the intervention group, 74% were ambulated at least once. Once enrolled, the patients successfully participated in assisted ambulation for about two-thirds of their hospital stay. However, the intervention was delivered for only one-third of the total length of stay because most patients were not enrolled on admission. On average, the mobility technicians made 11 attempts to ambulate each patient and 56% of these attempts were successful. The proportion of unsuccessful attempts did not change over the course of the study. The reasons for unsuccessful attempts included patient refusal (n = 102) or unavailability (n = 68), mobility technicians running out of time (n = 2), and other (n = 12).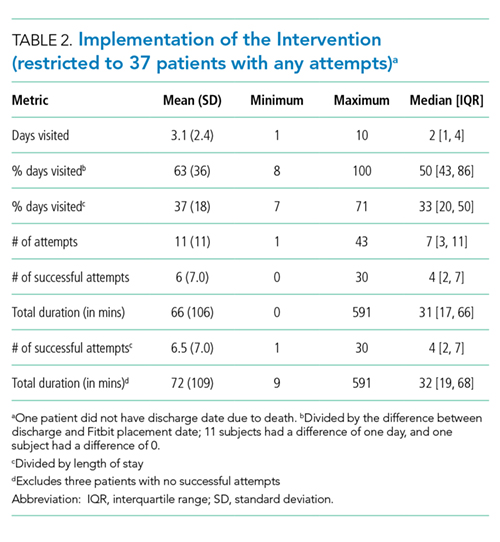
Initially, the mobility technicians were not available on weekends. In addition, they were often reassigned to other duties by their nurse managers, who were dealing with staffing shortages. As the study progressed, we were able to secure the mobility technicians to work seven days per week and to convince the nurse managers that their role should be protected. Consequently, the median number [IQR] of successful attempts increased from 1.5 [0, 2] in the first two months to 3 [0, 5] in the next three months and finally to 5 [1.5, 13] in the final months (P < .002). The median visit duration was 10 minutes, with an interquartile range of 6-15 minutes.
In the intention-to-treat analysis, patients in the intervention group took close to 50% more steps than did the control patients. After adjustment for prehospital activity level, the difference was not statistically significant. The intervention also did not significantly affect the length of stay or discharge disposition (Table 3). In the per protocol analysis, the difference in the step count was significant, even after adjustment. The six-clicks score also significantly increased.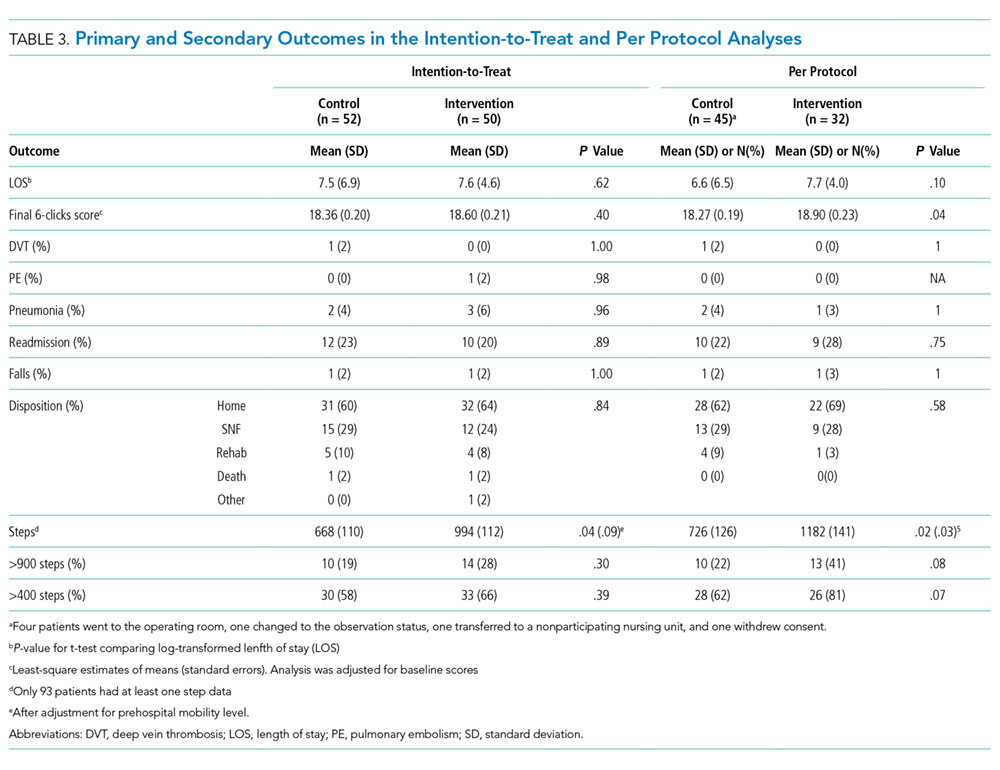
To assess for dose response, we compared outcomes among patients who received no intervention, those who received two or fewer days of intervention, and those who received more than two days of intervention (Table 4). The length of stay was significantly longer in patients with more than two days of intervention, likely reflecting greater opportunities for exposure to the intervention. The longer intervention time significantly increased the six-clicks score.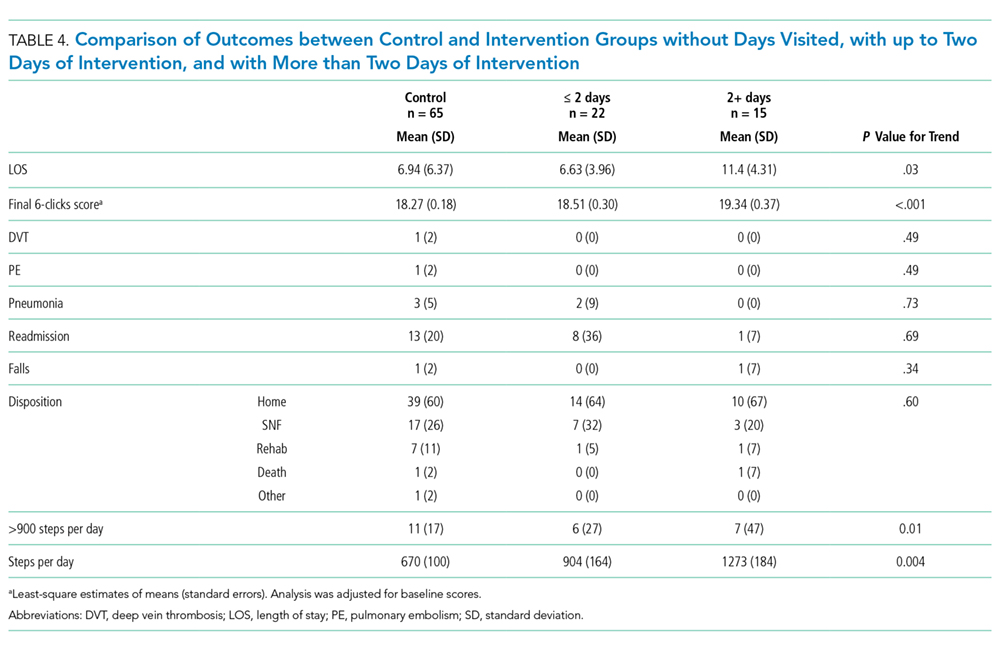
We examined the relationship between steps achieved and discharge disposition. Patients who achieved at least 900 steps more often went home than those who did not (79% vs. 56%, P < .05). The ROC for the model of discharge disposition using steps taken as the only predictor had an area under the curve of 0.67, with optimal discrimination at 411 steps. At a threshold of 400 steps, the model had a sensitivity of 75.9% and a specificity of 51.4%. Patients achieving 400 steps were more likely to go home than those who did not achieve that goal (71% vs. 46%, P =.01). More patients in the intervention group achieved the 900 step goal (28% vs. 19%, P = .30) and the 400 step goal (66% vs. 58%, P = .39), but neither association reached statistical significance.
DISCUSSION
In this pilot study conducted with older medical inpatients, we found that assisted ambulation provided by a dedicated mobility technician was feasible and increased the number of steps taken by patients. Not all patients in the treatment group received the intervention partly due to the fact that the program initially did not include weekends and the mobility technicians were sometimes redirected to other nursing duties. Both issues were addressed during the course of the study. In the per protocol analysis, the intervention increased the average six-clicks score and there was a nonsignificant reduction in the percentage of patients discharged to a rehabilitation facility.
A range of hospital-based mobility interventions have been described. Several of which were complex multidisciplinary interventions that included a mobility component. The compliance rates have ranged from 82% to 93.7%,12,13 although a systematic review noted that many studies do not provide this level of information.11 Interventions were carried out by nursing staff and PT with support from family members and social workers.33-35 Ambulation-specific programs have also relied on nurses and PT13,14,36 and, occasionally, on research assistants to implement assisted ambulation protocols.12,37 A recent study that employed research assistants to deliver inhospital ambulation reported achieving 51.3% of intended walks.37
In contradistinction to previous studies, we created a new role, employing PCNAs as dedicated mobility technicians. We did this for two reasons. First, the approach is less expensive than deploying registered nurses or PTs to ambulate patients and therefore more likely to be adopted by hospitals, especially if it can decrease the cost of an episode of care by avoiding subsequent inpatient rehabilitation. Mobility technicians have no degree or certification requirements and are therefore paid less than nurses or physical therapists. Second, by having a single responsibility, mobility technicians were more likely to engage in their task than nurses, who have competing responsibilities. However, when nurse staffing was short, nurse managers were tempted to recall the PCNAs for other nursing duties. It took time before PCNAs and supervisors prioritized this new responsibility. When they did, the number of attempted walks increased substantially, but the percentage of successful attempts remained constant at 56%, highlighting the difficulty of getting hospitalized patients to walk.
On average, patients who received the intervention engaged in 72 minutes of additional physical activity and averaged 990 steps per day. Observational data suggest patients accrue about 1,100 steps in the day before discharge, with older patients accruing closer to 900.21 One study found that older patients with fewer than 900 steps per day were likely to experience a functional decline.32 We also found that patients who achieved at least 900 steps were more likely to go home. However, we found that a lower threshold, namely, 400 steps, offered better discrimination between patients who go home and those who do not. Future prospective studies are needed to establish the appropriate goal for exercise interventions. A lower step goal could dramatically enhance the efficiency of the intervention.
A Cochrane review found that pooled analysis of multidisciplinary interventions that included exercise, often in the form of walking, achieved a small but significant increase in the proportion of patients discharged to home (RR 1.08, 95%CI 1.03 to 1.14).11 We found no significant change in the discharge disposition, but our study was underpowered for this endpoint. The six-clicks score showed a small but significant change in the per protocol analysis. The six-clicks score has been shown to correlate with discharge disposition,28,29 and an improvement in the score suggests that discharge disposition may be influenced.
The intervention may also not have been implemented for long enough. On average, visits were achieved for one-third of the hospital stay partly because of the delay in PT evaluation, which we required for eligibility. In practice, PT evaluation can occur just a few days before the anticipated discharge. We observed a dose dependent response among patients in the intervention group, suggesting that earlier intervention could be more effective. Earlier intervention might be achieved if the MT performed the six-clicks on potentially eligible patients.
The effects of hospitalization on mobility may be the most pronounced in the long term; one study found that 40% of hospitalized older patients manifested new ADL or IADL disability three months after discharge compared with 31% at discharge.7 Hospital-based mobility interventions may continue to affect subjects’ independence for weeks or months. In one RCT, an inpatient ambulation intervention improved mobility in the community one month after discharge.37 A hospital-based exercise program that included ambulation achieved better functional outcomes one month later.13 One RCT that combined inpatient exercise with outpatient care coordination also decreased readmission rates.34 We found that the intervention did not affect readmission.
This pilot study has several limitations. The sample size was small, and the findings need to be replicated in a larger randomized controlled trial. This is particularly important because the two study arms were not balanced in terms of their prehospital activity. After adjustment for prehospital activity, the differences in the step count in the intention-to-treat analysis were no longer significant. As we adjusted the intervention to hospital workflow, the intervention changed over time. The intention-to-treat analysis may therefore underestimate the effect of the intervention. This work provides a basis for future trial. Finally, discharge disposition depends on a complex interplay of factors, including social factors and preferences, which may not be affected by a mobility intervention.
In summary, an inhospital mobility protocol of attempting ambulation delivered by dedicated mobility technicians three times daily successfully increased the daily step counts and mobility scores of the patients. Studies with a larger sample size are needed to determine whether the proposed approach can affect length of hospital stay, discharge disposition, and overall cost of an episode of care.
Disclosures
Mary Stilphen reports consulting for CreCare and Adeo, which license and distribute AM-PAC short forms, including 6 clicks. All other authors report no conflicts of interest.
Funding
This study was supported by a Research Program Committee grant from the Cleveland Clinic.
1. National Center for Health Statistics. National Hospital Discharge Survey. 2010. PubMed
2. Corcoran PJ. Use it or lose it--the hazards of bed rest and inactivity. West J Med. 1991;154(5):536-538. PubMed
3. Gillick MR, Serrell NA, Gillick LS. Adverse consequences of hospitalization in the elderly. Soc Sci Med. 1982;16(10):1033-1038. doi: 10.1016/0277-9536(82)90175-7. PubMed
4. Hirsch CH, Sommers L, Olsen A, Mullen L, Winograd CH. The natural history of functional morbidity in hospitalized older patients. J Am Geriatr Soc. 1990;38(12):1296-1303. doi: 10.1111/j.1532-5415.1990.tb03451.x. PubMed
5. Zisberg A, Shadmi E, Sinoff G, Gur-Yaish N, Srulovici E, Admi H. Low mobility during hospitalization and functional decline in older adults. J Am Geriatr Soc. 2011;59(2):266-273. doi: 10.1111/j.1532-5415.2010.03276.x. PubMed
6. Heit JA, Silverstein MD, Mohr DN, Petterson TM, O’Fallon WM, Melton LJ, 3rd. Risk factors for deep vein thrombosis and pulmonary embolism: A population-based case-control study. Arch Intern Med. 2000;160(6):809-815. doi: 10.1067/mob.2001.107919. PubMed
7. Sager MA, Franke T, Inouye SK, et al. Functional outcomes of acute medical illness and hospitalization in older persons. Arch Intern Med. 1996;156(6):645-652. doi: 10.1001/archinte.1996.00440060067008. PubMed
8. Campbell AJ, Borrie MJ, Spears GF. Risk factors for falls in a community-based prospective study of people 70 years and older. J Gerontol. 1989;44(4):M112-M117. doi: 10.1093/geronj/44.4.M112. PubMed
9. Fisher SR, Kuo YF, Graham JE, Ottenbacher KJ, Ostir GV. Early ambulation and length of stay in older adults hospitalized for acute illness. Arch Intern Med. 2010;170(21):1942-1943. doi: 0.1001/archinternmed.2010.422. PubMed
10. Graf C. Functional decline in hospitalized older adults. Am J Nurs. 2006;106(1):58-67, quiz 67-58. PubMed
11. de Morton NA, Keating JL, Jeffs K. Exercise for acutely hospitalised older medical patients. Cochrane Database Syst Rev. 2007(1):CD005955. doi: 10.1002/14651858.CD005955. PubMed
12. Jones CT, Lowe AJ, MacGregor L, Brand CA, Tweddle N, Russell DM. A randomised controlled trial of an exercise intervention to reduce functional decline and health service utilisation in the hospitalised elderly. Australas J Ageing. 2006;25(3):126-133. doi: 10.1111/j.1741-6612.2006.00167.x.
13. Siebens H, Aronow H, Edwards D, Ghasemi Z. A randomized controlled trial of exercise to improve outcomes of acute hospitalization in older adults. J Am Geriatr Soc. 2000;48(12):1545-1552. doi: 10.1111/j.1532-5415.2000.tb03862.x. PubMed
14. Mundy LM, Leet TL, Darst K, Schnitzler MA, Dunagan WC. Early mobilization of patients hospitalized with community-acquired pneumonia. Chest. 2003;124(3):883-889. doi: 10.1378/chest.124.3.883. PubMed
15. Brown CJ, Redden DT, Flood KL, Allman RM. The underrecognized epidemic of low mobility during hospitalization of older adults. J Am Geriatr Soc. 2009;57(9):1660-1665. doi: 10.1111/j.1532-5415.2009.02393.x. PubMed
16. Callen BL, Mahoney JE, Grieves CB, Wells TJ, Enloe M. Frequency of hallway ambulation by hospitalized older adults on medical units of an academic hospital. Geriatr Nurs. 2004;25(4):212-217. doi: 10.1016/j.gerinurse.2004.06.016. PubMed
17. Fisher SR, Goodwin JS, Protas EJ, et al. Ambulatory activity of older adults hospitalized with acute medical illness. J Am Geriatr Soc. 2011;59(1):91-95. doi: 10.1111/j.1532-5415.2010.03202.x. PubMed
18. McVey LJ, Becker PM, Saltz CC, Feussner JR, Cohen HJ. Effect of a geriatric consultation team on functional status of elderly hospitalized patients: A randomized, controlled clinical trial. Ann Intern Med. 1989;110(1):79-84. doi: PubMed
19. Said CM, Morris ME, Woodward M, Churilov L, Bernhardt J. Enhancing physical activity in older adults receiving hospital based rehabilitation: A phase II feasibility study. BMC Geriatr. 2012;12:26. doi: 10.1186/1471-2318-12-26. PubMed
20. Timmerman RA. A mobility protocol for critically ill adults. Dimens Crit Care Nurs. 2007;26(5):175-179; quiz 180-171. doi: 10.1097/01.DCC.0000286816.40570.da. PubMed
21. Sallis R, Roddy-Sturm Y, Chijioke E, et al. Stepping toward discharge: Level of ambulation in hospitalized patients. J Hosp Med. 2015;10(6):384-389. doi: 10.1002/jhm.2343. PubMed
22. Inouye SK, Wagner DR, Acampora D, Horwitz RI, Cooney LM, Jr., Tinetii ME. A controlled trial of a nursing-centered intervention in hospitalized elderly medical patients: The yale geriatric care program. J Am Geriatr Soc. 1993;41(12):1353-1360. doi: 10.1111/j.1532-5415.1993.tb06487.x. PubMed
23. Kalisch BJ, Landstrom GL, Hinshaw AS. Missed nursing care: A concept analysis. J Adv Nurs. 2009;65(7):1509-1517. doi: 10.1111/j.1365-2648.2009.05027.x. PubMed
24. Kalisch BJ, Tschannen D, Lee H, Friese CR. Hospital variation in missed nursing care. Am J Med Qual. 2011;26(4):291-299. doi: 10.1177/1062860610395929. PubMed
25. Haley SM, Coster WJ, Andres PL, et al. Activity outcome measurement for postacute care. Med Care. 2004;42(1 Suppl):I49-161. doi: 10.1097/01.mlr.0000103520.43902.6c. PubMed
26. Jette DU, Stilphen M, Ranganathan VK, Passek SD, Frost FS, Jette AM. Validity of the AM-PAC “6-Clicks” inpatient daily activity and basic mobility short forms. Phys Ther. 2014;94(3):379-391. doi: 10.2522/ptj.20130199. PubMed
27. Jette DU, Stilphen M, Ranganathan VK, Passek S, Frost FS, Jette AM. Interrater reliability of AM-PAC 6-Clicks” basic mobility and daily activity short forms. Phys Ther. 2015;95(5):758-766. doi: 10.2522/ptj.20140174. PubMed
28. Jette DU, Stilphen M, Ranganathan VK, Passek SD, Frost FS, Jette AM. AM-PAC “6-Clicks” functional assessment scores predict acute care hospital discharge destination. Phys Ther. 2014;94(9):1252-1261. doi: 10.2522/ptj.20130359. PubMed
29. Menendez ME, Schumacher CS, Ring D, Freiberg AA, Rubash HE, Kwon YM. Does “6-Clicks” day 1 postoperative mobility score predict discharge disposition after total hip and knee arthroplasties? J Arthroplasty. 2016;31(9):1916-1920. doi: 10.1016/j.arth.2016.02.017. PubMed
30. Feehan LM, Geldman J, Sayre EC, et al. Accuracy of fitbit devices: Systematic review and narrative syntheses of quantitative data. JMIR Mhealth Uhealth. 2018;6(8):e10527-e10527. doi: 10.2196/10527. PubMed
31. Treacy D, Hassett L, Schurr K, Chagpar S, Paul SS, Sherrington C. Validity of different activity monitors to count steps in an inpatient rehabilitation setting. Phys Ther. 2017;97(5):581-588. doi: 10.1093/ptj/pzx010. PubMed
32. Agmon M, Zisberg A, Gil E, Rand D, Gur-Yaish N, Azriel M. Association between 900 steps a day and functional decline in older hospitalized patients. JAMA Intern Med. 2017;177(2):272-274. doi: 10.1001/jamainternmed.2016.7266. PubMed
33. Counsell SR, Holder CM, Liebenauer LL, et al. Effects of a multicomponent intervention on functional outcomes and process of care in hospitalized older patients: a randomized controlled trial of Acute Care for Elders (ACE) in a community hospital. J Am Geriatr Soc. 2000;48(12):1572-1581. doi: 10.1111/j.1532-5415.2000.tb03866.x. PubMed
34. Courtney M, Edwards H, Chang A, Parker A, Finlayson K, Hamilton K. Fewer emergency readmissions and better quality of life for older adults at risk of hospital readmission: a randomized controlled trial to determine the effectiveness of a 24-week exercise and telephone follow-up program. J Am Geriatr Soc. 2009;57(3):395-402. doi: 10.1111/j.1532-5415.2009.02138.x. PubMed
35. Landefeld CS, Palmer RM, Kresevic DM, Fortinsky RH, Kowal J. A randomized trial of care in a hospital medical unit especially designed to improve the functional outcomes of acutely ill older patients. N Engl J Med. 1995;332(20):1338-1344. doi: 10.1056/NEJM199505183322006. PubMed
36. Hoyer EH, Friedman M, Lavezza A, et al. Promoting mobility and reducing length of stay in hospitalized general medicine patients: A quality-improvement project. J Hosp Med. 2016;11(5):341-347. doi: 10.1002/jhm.2546. PubMed
37. Brown CJ, Foley KT, Lowman JD, Jr., et al. comparison of posthospitalization function and community mobility in hospital mobility program and usual care patients: a randomized clinical trial. JAMA Intern Med. 2016;176(7):921-927. doi: 10.1001/jamainternmed.2016.1870. PubMed
Individuals aged 65 years and over represent 13% of the United States population and account for nearly 40% of hospital discharges.1 Bedrest hastens the functional decline of older patients2-5 and is associated with risk of serious complications, such as falls, delirium, venous thrombosis, and skin breakdown.6,7 Ambulation is widely recognized as important for improving hospital outcomes.8-10 Observational studies suggest that increases of 600 steps per day are associated with shortened length of hospital stay.9 However, randomized trials of assisted ambulation have not demonstrated consistent benefit.11-14 As a result, usual care at most hospitals in the United States does not include assisted ambulation. Even when ambulation is ordered, execution of the orders is inconsistent.15-17
Studies have demonstrated the benefits of various exercise protocols for older patients in rehabilitation facilities,18,19 medical intensive care units,20 and medical and surgical wards.13,18,21 These interventions are usually nursing centered; however, assisting patients with ambulation multiple times per day may be a burdensome addition to the myriad responsibilities of nurses.19,22,23 In fact, ambulation orders are the most frequently overlooked nursing task.24
We designed a graded protocol of assisted ambulation implemented by a dedicated patient care nursing assistant (PCNA) multiple times daily to increase patient mobility. The objective of this study was to assess the feasibility and effectiveness of such an intervention for older inpatients. We hypothesized that the intervention would prove feasible and improve hospital outcomes, including less need for inpatient rehabilitation and shorter length of stay.
METHODS
We conducted a single-blind randomized controlled trial of patients aged ≥60 years and admitted as medical inpatients to the Cleveland Clinic Main Campus, a tertiary care center with over 1,440 inpatient beds. The consent form and study protocol were approved by the Cleveland Clinic Institutional Review Board, and the study was registered with ClinicalTrials.gov (NCT02757131).
Patients
All patients who were admitted to study wards for a medical illness and evaluated by Physical Therapy (PT) were eligible for the study. PT evaluations were ordered by the medical team if deemed necessary on the basis of factors, such as age, estimated mobility, and concerns raised by the ancillary staff. All patients who were expected to be discharged to a skilled nursing facility placement or who required home PT received a PT evaluation. Assessment of mobility was documented via Activity Measure for Postacute Care Inpatient Basic Mobility “six-clicks” short form, hereafter abbreviated as “six-clicks.” Based on past experience, patients with scores <16 rarely go home (<20% of the time), and those with scores >20 usually go home regardless of ambulation. Therefore, only patients with scores of 16-20 were invited to participate in the study. Although patients who were not evaluated by PT might also benefit from the intervention, we required a six-clicks score to assess eligibility. The exclusion criteria included anticipated remaining length of stay less than three days, admission under observation status, admission to the intensive care unit (ICU,) patients receiving comfort care measures, and patients with medical conditions precluding ambulation, such as decompensated heart failure or unstable angina.
Randomization
Patients were randomized to “usual care” or “mobility technician” after baseline evaluation using a computerized system. A block randomization scheme with a size of four was used to ensure an approximately equal number of patients per group.
Intervention
Patients randomized to the intervention group were asked to participate in the ambulation protocol outlined by the PT three times daily under the supervision of the mobility technician. The protocol involved four exercise levels (sitting, standing, walking, and stairs), which were implemented depending on the patient’s physical capacity. The mobility technicians, who were PCNAs, were trained by the PT team. PCNAs have no specific degrees or certification. They are taught safe handling techniques during their job orientation, so they already had an understanding of how to transfer and assist a patient with ambulation. The mobility technician training consisted of one four-hour session run by the PT team in the physical therapy department and the nursing unit. The training included safe handling practices and basic mobility, such as transfers from bed to chair, bed to standing, walking with assistance, and walking independently with equipment such as cane, rolling walker, and walking belt. All instruction was demonstrated by the trainer, and the mobility technician was then able to practice. The mobility technician then shadowed the trainer and practiced the techniques under supervision. Competency was assessed by the trainer.
The cohort of patients randomized to “usual care” was not seen by the mobility technicians but was not otherwise restricted in nursing’s baseline ability to execute recommendations placed by the PT team. Compliance with the recommendations is highly variable and dependent on patient acuity during the shift, staffing issues, and competing duties. Cleveland Clinic promotes a “culture of mobility,” and nurses are encouraged to get patients out of bed and assist with ambulation.
Study Instruments—Measures of Mobility
The six-clicks instrument is a tool for measuring basic mobility. It was adapted from the Activity Measures for Post-Acute Care (AM-PAC) instrument.25 Although initially created for self-report in the post-acute care setting, six-clicks has been validated for use by PTs in the acute care setting26 and is currently in use at more than 1,000 US hospitals. Cleveland Clinic PTs have used this measure for routine evaluation since 2011. The instrument has high interrater reliability and can predict discharge disposition.27-29
Each patient was provided with a tracking device (Fitbit) attached at the wrist to record daily steps for measuring mobility. The use of Fitbit has been validated in ambulatory and inpatient settings.30 The device produces step counts within 3% of the observed step count for most patients but may undercount steps in patients with very slow gait.31 The device was provided to each enrollee and collected at discharge.
Variables
Demographic information, comorbid diagnoses, and discharge destination were extracted from the electronic medical record. Information on prehospitalization physical activity level was obtained from the initial PT assessment. Falls were tracked through the safety event reporting system.
Outcomes
The primary outcomes were discharge disposition and hospital length of stay. The secondary outcomes included average steps per day, change in six-clicks score from admission to discharge, inpatient mortality, admission to ICU, falls, deep vein thrombosis, pulmonary embolism, or pneumonia, and readmission within 30 days.
Statistical Analysis
Patient characteristics were summarized as means and standard deviations or medians and interquartile ranges for continuous variables and as frequencies and percentages for categorical variables. The t-test or Wilcoxon rank sum test was applied to compare continuous characteristics between the intervention and control groups. Chi-squared test or Fisher’s exact test was applied to compare categorical characteristics. Given its skewed distribution, the length of stay was log-transformed and compared between the two groups using Student’s t-test. Chi-squared test was used to compare categorical outcomes. The analysis of final six-clicks scores was adjusted for baseline scores, and the least-square estimates are provided. A linear mixed effects model was used to compare the number of daily steps taken because each participant had multiple steps measured. Results were adjusted for prehospital activity. In addition to comparing the total steps taken by each group, we determined the proportion of patients who exceeded a particular threshold by taking the average number of steps per day for all subjects and relating it to home discharge using the Receiver Operating Characteristics (ROC) curve. An optimal cut-off was determined to maximize the Youden index. We also compared the proportion of patients who exceeded 900 steps because this value was previously reported as an important threshold.32 All analyses were conducted using intention-to-treat principles. We also conducted a per-protocol analysis in which we limited the intervention group to those who received at least one assisted ambulation session. A dose-response analysis was also performed, in which patients were categorized as not receiving the therapy, receiving sessions on one or two days, or receiving them on more than two days.
All analyses were conducted using R-studio (Boston, MA). Statistical significance was defined as a P-value < .05. Given that this is a pilot study, the results were not adjusted for multiple comparisons.
RESULTS
Characteristics of patients in the intervention and control groups are shown in Table 1. The patients were mostly white and female, with an average age in the mid-70s (range 61-98). All measures evaluated were not significantly different between the intervention and control groups. However, more patients in the intervention group had a prehospital activity level classified as independent.
Table 2 demonstrates the feasibility of the intervention. Of patients randomized to the intervention group, 74% were ambulated at least once. Once enrolled, the patients successfully participated in assisted ambulation for about two-thirds of their hospital stay. However, the intervention was delivered for only one-third of the total length of stay because most patients were not enrolled on admission. On average, the mobility technicians made 11 attempts to ambulate each patient and 56% of these attempts were successful. The proportion of unsuccessful attempts did not change over the course of the study. The reasons for unsuccessful attempts included patient refusal (n = 102) or unavailability (n = 68), mobility technicians running out of time (n = 2), and other (n = 12).
Initially, the mobility technicians were not available on weekends. In addition, they were often reassigned to other duties by their nurse managers, who were dealing with staffing shortages. As the study progressed, we were able to secure the mobility technicians to work seven days per week and to convince the nurse managers that their role should be protected. Consequently, the median number [IQR] of successful attempts increased from 1.5 [0, 2] in the first two months to 3 [0, 5] in the next three months and finally to 5 [1.5, 13] in the final months (P < .002). The median visit duration was 10 minutes, with an interquartile range of 6-15 minutes.
In the intention-to-treat analysis, patients in the intervention group took close to 50% more steps than did the control patients. After adjustment for prehospital activity level, the difference was not statistically significant. The intervention also did not significantly affect the length of stay or discharge disposition (Table 3). In the per protocol analysis, the difference in the step count was significant, even after adjustment. The six-clicks score also significantly increased.
To assess for dose response, we compared outcomes among patients who received no intervention, those who received two or fewer days of intervention, and those who received more than two days of intervention (Table 4). The length of stay was significantly longer in patients with more than two days of intervention, likely reflecting greater opportunities for exposure to the intervention. The longer intervention time significantly increased the six-clicks score.
We examined the relationship between steps achieved and discharge disposition. Patients who achieved at least 900 steps more often went home than those who did not (79% vs. 56%, P < .05). The ROC for the model of discharge disposition using steps taken as the only predictor had an area under the curve of 0.67, with optimal discrimination at 411 steps. At a threshold of 400 steps, the model had a sensitivity of 75.9% and a specificity of 51.4%. Patients achieving 400 steps were more likely to go home than those who did not achieve that goal (71% vs. 46%, P =.01). More patients in the intervention group achieved the 900 step goal (28% vs. 19%, P = .30) and the 400 step goal (66% vs. 58%, P = .39), but neither association reached statistical significance.
DISCUSSION
In this pilot study conducted with older medical inpatients, we found that assisted ambulation provided by a dedicated mobility technician was feasible and increased the number of steps taken by patients. Not all patients in the treatment group received the intervention partly due to the fact that the program initially did not include weekends and the mobility technicians were sometimes redirected to other nursing duties. Both issues were addressed during the course of the study. In the per protocol analysis, the intervention increased the average six-clicks score and there was a nonsignificant reduction in the percentage of patients discharged to a rehabilitation facility.
A range of hospital-based mobility interventions have been described. Several of which were complex multidisciplinary interventions that included a mobility component. The compliance rates have ranged from 82% to 93.7%,12,13 although a systematic review noted that many studies do not provide this level of information.11 Interventions were carried out by nursing staff and PT with support from family members and social workers.33-35 Ambulation-specific programs have also relied on nurses and PT13,14,36 and, occasionally, on research assistants to implement assisted ambulation protocols.12,37 A recent study that employed research assistants to deliver inhospital ambulation reported achieving 51.3% of intended walks.37
In contradistinction to previous studies, we created a new role, employing PCNAs as dedicated mobility technicians. We did this for two reasons. First, the approach is less expensive than deploying registered nurses or PTs to ambulate patients and therefore more likely to be adopted by hospitals, especially if it can decrease the cost of an episode of care by avoiding subsequent inpatient rehabilitation. Mobility technicians have no degree or certification requirements and are therefore paid less than nurses or physical therapists. Second, by having a single responsibility, mobility technicians were more likely to engage in their task than nurses, who have competing responsibilities. However, when nurse staffing was short, nurse managers were tempted to recall the PCNAs for other nursing duties. It took time before PCNAs and supervisors prioritized this new responsibility. When they did, the number of attempted walks increased substantially, but the percentage of successful attempts remained constant at 56%, highlighting the difficulty of getting hospitalized patients to walk.
On average, patients who received the intervention engaged in 72 minutes of additional physical activity and averaged 990 steps per day. Observational data suggest patients accrue about 1,100 steps in the day before discharge, with older patients accruing closer to 900.21 One study found that older patients with fewer than 900 steps per day were likely to experience a functional decline.32 We also found that patients who achieved at least 900 steps were more likely to go home. However, we found that a lower threshold, namely, 400 steps, offered better discrimination between patients who go home and those who do not. Future prospective studies are needed to establish the appropriate goal for exercise interventions. A lower step goal could dramatically enhance the efficiency of the intervention.
A Cochrane review found that pooled analysis of multidisciplinary interventions that included exercise, often in the form of walking, achieved a small but significant increase in the proportion of patients discharged to home (RR 1.08, 95%CI 1.03 to 1.14).11 We found no significant change in the discharge disposition, but our study was underpowered for this endpoint. The six-clicks score showed a small but significant change in the per protocol analysis. The six-clicks score has been shown to correlate with discharge disposition,28,29 and an improvement in the score suggests that discharge disposition may be influenced.
The intervention may also not have been implemented for long enough. On average, visits were achieved for one-third of the hospital stay partly because of the delay in PT evaluation, which we required for eligibility. In practice, PT evaluation can occur just a few days before the anticipated discharge. We observed a dose dependent response among patients in the intervention group, suggesting that earlier intervention could be more effective. Earlier intervention might be achieved if the MT performed the six-clicks on potentially eligible patients.
The effects of hospitalization on mobility may be the most pronounced in the long term; one study found that 40% of hospitalized older patients manifested new ADL or IADL disability three months after discharge compared with 31% at discharge.7 Hospital-based mobility interventions may continue to affect subjects’ independence for weeks or months. In one RCT, an inpatient ambulation intervention improved mobility in the community one month after discharge.37 A hospital-based exercise program that included ambulation achieved better functional outcomes one month later.13 One RCT that combined inpatient exercise with outpatient care coordination also decreased readmission rates.34 We found that the intervention did not affect readmission.
This pilot study has several limitations. The sample size was small, and the findings need to be replicated in a larger randomized controlled trial. This is particularly important because the two study arms were not balanced in terms of their prehospital activity. After adjustment for prehospital activity, the differences in the step count in the intention-to-treat analysis were no longer significant. As we adjusted the intervention to hospital workflow, the intervention changed over time. The intention-to-treat analysis may therefore underestimate the effect of the intervention. This work provides a basis for future trial. Finally, discharge disposition depends on a complex interplay of factors, including social factors and preferences, which may not be affected by a mobility intervention.
In summary, an inhospital mobility protocol of attempting ambulation delivered by dedicated mobility technicians three times daily successfully increased the daily step counts and mobility scores of the patients. Studies with a larger sample size are needed to determine whether the proposed approach can affect length of hospital stay, discharge disposition, and overall cost of an episode of care.
Disclosures
Mary Stilphen reports consulting for CreCare and Adeo, which license and distribute AM-PAC short forms, including 6 clicks. All other authors report no conflicts of interest.
Funding
This study was supported by a Research Program Committee grant from the Cleveland Clinic.
1. National Center for Health Statistics. National Hospital Discharge Survey. 2010. PubMed
2. Corcoran PJ. Use it or lose it--the hazards of bed rest and inactivity. West J Med. 1991;154(5):536-538. PubMed
3. Gillick MR, Serrell NA, Gillick LS. Adverse consequences of hospitalization in the elderly. Soc Sci Med. 1982;16(10):1033-1038. doi: 10.1016/0277-9536(82)90175-7. PubMed
4. Hirsch CH, Sommers L, Olsen A, Mullen L, Winograd CH. The natural history of functional morbidity in hospitalized older patients. J Am Geriatr Soc. 1990;38(12):1296-1303. doi: 10.1111/j.1532-5415.1990.tb03451.x. PubMed
5. Zisberg A, Shadmi E, Sinoff G, Gur-Yaish N, Srulovici E, Admi H. Low mobility during hospitalization and functional decline in older adults. J Am Geriatr Soc. 2011;59(2):266-273. doi: 10.1111/j.1532-5415.2010.03276.x. PubMed
6. Heit JA, Silverstein MD, Mohr DN, Petterson TM, O’Fallon WM, Melton LJ, 3rd. Risk factors for deep vein thrombosis and pulmonary embolism: A population-based case-control study. Arch Intern Med. 2000;160(6):809-815. doi: 10.1067/mob.2001.107919. PubMed
7. Sager MA, Franke T, Inouye SK, et al. Functional outcomes of acute medical illness and hospitalization in older persons. Arch Intern Med. 1996;156(6):645-652. doi: 10.1001/archinte.1996.00440060067008. PubMed
8. Campbell AJ, Borrie MJ, Spears GF. Risk factors for falls in a community-based prospective study of people 70 years and older. J Gerontol. 1989;44(4):M112-M117. doi: 10.1093/geronj/44.4.M112. PubMed
9. Fisher SR, Kuo YF, Graham JE, Ottenbacher KJ, Ostir GV. Early ambulation and length of stay in older adults hospitalized for acute illness. Arch Intern Med. 2010;170(21):1942-1943. doi: 0.1001/archinternmed.2010.422. PubMed
10. Graf C. Functional decline in hospitalized older adults. Am J Nurs. 2006;106(1):58-67, quiz 67-58. PubMed
11. de Morton NA, Keating JL, Jeffs K. Exercise for acutely hospitalised older medical patients. Cochrane Database Syst Rev. 2007(1):CD005955. doi: 10.1002/14651858.CD005955. PubMed
12. Jones CT, Lowe AJ, MacGregor L, Brand CA, Tweddle N, Russell DM. A randomised controlled trial of an exercise intervention to reduce functional decline and health service utilisation in the hospitalised elderly. Australas J Ageing. 2006;25(3):126-133. doi: 10.1111/j.1741-6612.2006.00167.x.
13. Siebens H, Aronow H, Edwards D, Ghasemi Z. A randomized controlled trial of exercise to improve outcomes of acute hospitalization in older adults. J Am Geriatr Soc. 2000;48(12):1545-1552. doi: 10.1111/j.1532-5415.2000.tb03862.x. PubMed
14. Mundy LM, Leet TL, Darst K, Schnitzler MA, Dunagan WC. Early mobilization of patients hospitalized with community-acquired pneumonia. Chest. 2003;124(3):883-889. doi: 10.1378/chest.124.3.883. PubMed
15. Brown CJ, Redden DT, Flood KL, Allman RM. The underrecognized epidemic of low mobility during hospitalization of older adults. J Am Geriatr Soc. 2009;57(9):1660-1665. doi: 10.1111/j.1532-5415.2009.02393.x. PubMed
16. Callen BL, Mahoney JE, Grieves CB, Wells TJ, Enloe M. Frequency of hallway ambulation by hospitalized older adults on medical units of an academic hospital. Geriatr Nurs. 2004;25(4):212-217. doi: 10.1016/j.gerinurse.2004.06.016. PubMed
17. Fisher SR, Goodwin JS, Protas EJ, et al. Ambulatory activity of older adults hospitalized with acute medical illness. J Am Geriatr Soc. 2011;59(1):91-95. doi: 10.1111/j.1532-5415.2010.03202.x. PubMed
18. McVey LJ, Becker PM, Saltz CC, Feussner JR, Cohen HJ. Effect of a geriatric consultation team on functional status of elderly hospitalized patients: A randomized, controlled clinical trial. Ann Intern Med. 1989;110(1):79-84. doi: PubMed
19. Said CM, Morris ME, Woodward M, Churilov L, Bernhardt J. Enhancing physical activity in older adults receiving hospital based rehabilitation: A phase II feasibility study. BMC Geriatr. 2012;12:26. doi: 10.1186/1471-2318-12-26. PubMed
20. Timmerman RA. A mobility protocol for critically ill adults. Dimens Crit Care Nurs. 2007;26(5):175-179; quiz 180-171. doi: 10.1097/01.DCC.0000286816.40570.da. PubMed
21. Sallis R, Roddy-Sturm Y, Chijioke E, et al. Stepping toward discharge: Level of ambulation in hospitalized patients. J Hosp Med. 2015;10(6):384-389. doi: 10.1002/jhm.2343. PubMed
22. Inouye SK, Wagner DR, Acampora D, Horwitz RI, Cooney LM, Jr., Tinetii ME. A controlled trial of a nursing-centered intervention in hospitalized elderly medical patients: The yale geriatric care program. J Am Geriatr Soc. 1993;41(12):1353-1360. doi: 10.1111/j.1532-5415.1993.tb06487.x. PubMed
23. Kalisch BJ, Landstrom GL, Hinshaw AS. Missed nursing care: A concept analysis. J Adv Nurs. 2009;65(7):1509-1517. doi: 10.1111/j.1365-2648.2009.05027.x. PubMed
24. Kalisch BJ, Tschannen D, Lee H, Friese CR. Hospital variation in missed nursing care. Am J Med Qual. 2011;26(4):291-299. doi: 10.1177/1062860610395929. PubMed
25. Haley SM, Coster WJ, Andres PL, et al. Activity outcome measurement for postacute care. Med Care. 2004;42(1 Suppl):I49-161. doi: 10.1097/01.mlr.0000103520.43902.6c. PubMed
26. Jette DU, Stilphen M, Ranganathan VK, Passek SD, Frost FS, Jette AM. Validity of the AM-PAC “6-Clicks” inpatient daily activity and basic mobility short forms. Phys Ther. 2014;94(3):379-391. doi: 10.2522/ptj.20130199. PubMed
27. Jette DU, Stilphen M, Ranganathan VK, Passek S, Frost FS, Jette AM. Interrater reliability of AM-PAC 6-Clicks” basic mobility and daily activity short forms. Phys Ther. 2015;95(5):758-766. doi: 10.2522/ptj.20140174. PubMed
28. Jette DU, Stilphen M, Ranganathan VK, Passek SD, Frost FS, Jette AM. AM-PAC “6-Clicks” functional assessment scores predict acute care hospital discharge destination. Phys Ther. 2014;94(9):1252-1261. doi: 10.2522/ptj.20130359. PubMed
29. Menendez ME, Schumacher CS, Ring D, Freiberg AA, Rubash HE, Kwon YM. Does “6-Clicks” day 1 postoperative mobility score predict discharge disposition after total hip and knee arthroplasties? J Arthroplasty. 2016;31(9):1916-1920. doi: 10.1016/j.arth.2016.02.017. PubMed
30. Feehan LM, Geldman J, Sayre EC, et al. Accuracy of fitbit devices: Systematic review and narrative syntheses of quantitative data. JMIR Mhealth Uhealth. 2018;6(8):e10527-e10527. doi: 10.2196/10527. PubMed
31. Treacy D, Hassett L, Schurr K, Chagpar S, Paul SS, Sherrington C. Validity of different activity monitors to count steps in an inpatient rehabilitation setting. Phys Ther. 2017;97(5):581-588. doi: 10.1093/ptj/pzx010. PubMed
32. Agmon M, Zisberg A, Gil E, Rand D, Gur-Yaish N, Azriel M. Association between 900 steps a day and functional decline in older hospitalized patients. JAMA Intern Med. 2017;177(2):272-274. doi: 10.1001/jamainternmed.2016.7266. PubMed
33. Counsell SR, Holder CM, Liebenauer LL, et al. Effects of a multicomponent intervention on functional outcomes and process of care in hospitalized older patients: a randomized controlled trial of Acute Care for Elders (ACE) in a community hospital. J Am Geriatr Soc. 2000;48(12):1572-1581. doi: 10.1111/j.1532-5415.2000.tb03866.x. PubMed
34. Courtney M, Edwards H, Chang A, Parker A, Finlayson K, Hamilton K. Fewer emergency readmissions and better quality of life for older adults at risk of hospital readmission: a randomized controlled trial to determine the effectiveness of a 24-week exercise and telephone follow-up program. J Am Geriatr Soc. 2009;57(3):395-402. doi: 10.1111/j.1532-5415.2009.02138.x. PubMed
35. Landefeld CS, Palmer RM, Kresevic DM, Fortinsky RH, Kowal J. A randomized trial of care in a hospital medical unit especially designed to improve the functional outcomes of acutely ill older patients. N Engl J Med. 1995;332(20):1338-1344. doi: 10.1056/NEJM199505183322006. PubMed
36. Hoyer EH, Friedman M, Lavezza A, et al. Promoting mobility and reducing length of stay in hospitalized general medicine patients: A quality-improvement project. J Hosp Med. 2016;11(5):341-347. doi: 10.1002/jhm.2546. PubMed
37. Brown CJ, Foley KT, Lowman JD, Jr., et al. comparison of posthospitalization function and community mobility in hospital mobility program and usual care patients: a randomized clinical trial. JAMA Intern Med. 2016;176(7):921-927. doi: 10.1001/jamainternmed.2016.1870. PubMed
© 2019 Society of Hospital Medicine
Do HCAHPS doctor communication scores reflect the communication skills of the attending on record? A cautionary tale from a tertiary-care medical service
Communication is the foundation of medical care.1 Effective communication can improve health outcomes, safety, adherence, satisfaction, trust, and enable genuine informed consent and decision-making.2-9 Furthermore, high-quality communication increases provider engagement and workplace satisfaction, while reducing stress and malpractice risk.10-15
Direct measurement of communication in the healthcare setting can be challenging. The “Four Habits Model,” which is derived from a synthesis of empiric studies8,16-20 and theoretical models21-24 of communication, offers 1 framework for assessing healthcare communication. The conceptual model underlying the 4 habits has been validated in studies of physician and patient satisfaction.1,4,25-27 The 4 habits are: investing in the beginning, eliciting the patient’s perspective, demonstrating empathy, and investing in the end. Each habit is divided into several identifiable tasks or skill sets, which can be reliably measured using validated tools and checklists.28 One such instrument, the Four Habits Coding Scheme (4HCS), has been evaluated against other tools and demonstrated overall satisfactory inter-rater reliability and validity.29,30
The Hospital Consumer Assessment of Healthcare Providers and Systems (HCAHPS) survey, developed under the direction of the Centers for Medicare and Medicaid Services (CMS) and the Agency for Healthcare Research and Quality, is an established national standard for measuring patient perceptions of care. HCAHPS retrospectively measures global perceptions of communication, support and empathy from physicians and staff, processes of care, and the overall patient experience. HCAHPS scores were first collected nationally in 2006 and have been publicly reported since 2008.31 With the introduction of value-based purchasing in 2012, health system revenues are now tied to HCAHPS survey performance.32 As a result, hospitals are financially motivated to improve HCAHPS scores but lack evidence-based methods for doing so. Some healthcare organizations have invested in communication training programs based on the available literature and best practices.2,33-35 However, it is not known how, if at all, HCAHPS scores relate to physicians’ real-time observed communication skills.
To examine the relationship between physician communication, as reported by global HCAHPS scores, and the quality of physician communication skills in specific encounters, we observed hospitalist physicians during inpatient bedside rounds and measured their communication skills using the 4HCS.
METHODS
Study Design
The study utilized a cross sectional design; physicians who consented were observed on rounds during 3 separate encounters, and we compared hospitalists’ 4HCS scores to their HCAHPS scores to assess the correlation. The study was approved by the Institutional Review Board of the Cleveland Clinic.
Population
The study was conducted at the main campus of the Cleveland Clinic. All physicians specializing in hospital medicine who had received 10 or more completed HCAHPS survey responses while rounding on a medicine service in the past year were invited to participate in the study. Participation was voluntary; night hospitalists were excluded. A research nurse was trained in the Four Habits Model28 and in the use of the 4HCS coding scheme by the principal investigator. The nurse observed each physician and ascertained the presence of communication behaviors using the 4HCS tool. Physicians were observed between August 2013 and August 2014. Multiple observations per physician could occur on the same day, but only 1 observation per patient was used for analysis. Observations consisted of a physician’s first encounter with a hospitalized patient, with the patient’s consent. Observations were conducted during encounters with English-speaking and cognitively intact patients only. Resident physicians were permitted to stay and conduct rounds per their normal routine. Patient information was not collected as part of the study.
Measures
HCAHPS. For each physician, we extracted all HCAHPS scores that were collected from our hospital’s Press Ganey database. The HCAHPS survey contains 22 core questions divided into 7 themes or domains, 1 of which is doctor communication. The survey uses frequency-based questions with possible answers fixed on a 4-point scale (4=always, 3=usually, 2=sometimes, 1=never). Our primary outcome was the doctor communication domain, which comprises 3 questions: 1) During this hospital stay, how often did the doctors treat you with respect? 2) During this hospital stay, how often did the doctors listen to you? and 3) During this hospital stay, how often did the doctors explain things in a language you can understand? Because CMS counts only the percentage of responses that are graded “always,” so-called “top box” scoring, we used the same measure.
The HCAHPS scores are always attributed to the physician at the time of discharge even if he may not have been responsible for the care of the patient during the entire hospital course. To mitigate contamination from patients seen by multiple providers, we cross-matched length of stay (LOS) data with billing data to determine the proportion of days a patient was seen by a single provider during the entire length of stay. We stratified patients seen by the attending providers to less than 50%, 50% to less than 100%, and at 100% of the LOS. However, we were unable to identify which patients were seen by other consultants or by residents due to limitations in data gathering and the nature of the database.

The Four Habits. The Four Habits are: invest in the beginning, elicit the patient’s perspective, demonstrate empathy, and invest in the end (Figure 1). Specific behaviors for Habits 1 to 4 are outlined in the Appendix, but we will briefly describe the themes as follows. Habit 1, invest in the beginning, describes the ability of the physician to set a welcoming environment for the patient, establish rapport, and collaborate on an agenda for the visit. Habit 2, elicit the patient’s perspective, describes the ability of the physician to explore the patients’ worries, ideas, expectations, and the impact of the illness on their lifestyle. Habit 3, demonstrate empathy, describes the physician’s openness to the patient’s emotions as well as the ability to explore, validate; express curiosity, and openly accept these feelings. Habit 4, invest in the end, is a measure of the physician’s ability to counsel patients in a language built around their original concerns or worries, as well as the ability to check the patients’ understanding of the plan.2,29-30
4HCS. The 4HCS tool (Appendix) measures discreet behaviors and phrases based on each of the Four Habits (Figure 1). With a scoring range from a low of 4 to a high of 20, the rater at bedside assigns a range of points on a scale of 1 to 5 for each habit. It is an instrument based on a teaching model used widely throughout Kaiser Permanente to improve clinicians’ communication skills. The 4HCS was first tested for interrater reliability and validity against the Roter Interaction Analysis System using 100 videotaped primary care physician encounters.29 It was further evaluated in a randomized control trial. Videotapes from 497 hospital encounters involving 71 doctors from a variety of clinical specialties were rated by 4 trained raters using the coding scheme. The total score Pearson’s R and intraclass correlation coefficient (ICC) exceeded 0.70 for all pairs of raters, and the interrater reliability was satisfactory for the 4HCS as applied to heterogeneous material.30
STATISTICAL ANALYSIS
Physician characteristics were summarized with standard descriptive statistics. Pearson correlation coefficients were computed between HCAHPS and 4HCS scores. All analyses were performed with RStudio (Boston, MA). The Pearson correlation between the averaged HCAHPS and 4HCS scores was also computed. A correlation with a P value less than 0.05 was considered statistically significant. With 28 physicians, the study had a power of 88% to detect a moderate correlation (greater than 0.50) with a 2-sided alpha of 0.05. We also computed the correlations based on the subgroups of data with patients seen by providers for less than 50%, 50% to less than 100%, and 100% of LOS. All analyses were conducted in SAS 9.2 (SAS Institute Inc., Cary, NC).36
RESULTS
There were 31 physicians who met our inclusion criteria. Of 29 volunteers, 28 were observed during 3 separate inpatient encounters and made up the final sample. A total of 1003 HCAHPS survey responses were available for these physicians. Participants were predominantly female (60.7%), with an average age of 39 years. They were in practice for an average of 4 years (12 were in practice more than 5 years), and 9 were observed on a teaching rotation.

The means of the overall 4HCS scores per observation were 17.39 ± 2.33 for the first, 17.00 ± 2.37 for the second, and 17.43 ± 2.36 for third bedside observation. The mean 4HCS scores per observation, broken down by habit, appear in Table 1. The ICC among the repeated scores within the same physician was 0.81. The median number of HCAHPS survey returns was 32 (range = [8, 85], with mean = 35.8, interquartile range = [16, 54]). The median overall HCAHPS doctor communication score was 89.6 (range = 80.9-93.7). Participants scored the highest in the respect subdomain and the lowest in the explain subdomain. Median HCAHPS scores and ranges appear in Table 2.
Because there were no significant associations between 4HCS scores or HCAHPS scores and physician age, sex, years in practice, or teaching site, correlations were not adjusted. Figure 2A and 2B show the association between mean 4HCS scores and HCAHPS scores by physician. There was no significant correlation between overall 4HCS and HCAHPS doctor communication scores (Pearson correlation coefficient 0.098; 95% confidence interval [CI], -0.285, 0.455). The individual habits also were not correlated with overall HCAHPS scores or with their corresponding HCAHPS domain (Table 3).

For 325 patients, 1 hospitalist was present for the entire LOS. In sensitivity analysis limiting observations to these patients (Figure 2C, Figure 2D, Table 3), we found a moderate correlation between habit 3 and the HCAHPS respect score (Pearson correlation coefficient 0.515; 95% CI, 0.176, 0.745; P = 0.005), and a weaker correlation between habit 3 and the HCAHPS overall doctor communication score (0.442; 95% CI, 0.082, 0.7; P = 0.019). There were no other significant correlations between specific habits and HCAHPS scores.

DISCUSSION
In this observational study of hospitalist physicians at a large tertiary care center, we found that communication skills, as measured by the 4HCS, varied substantially among physicians but were highly correlated within patients of the same physician. However, there was virtually no correlation between the attending physician of record’s 4HCS scores and their HCAHPS communication scores. When we limited our analysis to patients who saw only 1 hospitalist throughout their stay, there were moderate correlations between demonstration of empathy and both the HCAHPS respect score and overall doctor communication score. There were no trends across the strata of hospitalist involvement. It is important to note that the addition of even 1 different hospitalist to the LOS removes any association. Habits 1 and 2 are close to significance in the 100% subgroup, with a weak correlation. Interestingly, Habit 4, which focuses on creating a plan with the patient, showed no correlation at all with patients reporting that doctors explained things in language they could understand.
Development and testing of the HCAHPS survey began in 2002, commissioned by CMS and the Agency for Healthcare Research and Quality for the purpose of measuring patient experience in the hospital. The HCAHPS survey was endorsed by the National Quality Forum in 2005, with final approval of the national implementation granted by the Office of Management and Budget later that year. The CMS began implementation of the HCAHPS survey in 2006, with the first required public reporting of all hospitals taking place in March 2008.37-41 Based on CMS’ value-based purchasing initiative, hospitals with low HCAHPS scores have faced substantial penalties since 2012. Under these circumstances, it is important that the HCAHPS measures what it purports to measure. Because HCAHPS was designed to compare hospitals, testing was limited to assessment of internal reliability, hospital-level reliability, and construct validity. External validation with known measures of physician communication was not performed.41 Our study appears to be the first to compare HCAHPS scores to directly observed measures of physician communication skills. The lack of association between the 2 should sound a cautionary note to hospitals who seek to tie individual compensation to HCAHPS scores to improve them. In particular, the survey asks for a rating for all the patient’s doctors, not just the primary hospitalist. We found that, for hospital stays with just 1 hospitalist, the HCAHPS score reflected observed expression of empathy, although the correlation was only moderate, and HCAHPS were not correlated with other communication skills. Of all communication skills, empathy may be most important. Almost the entire body of research on physician communication cites empathy as a central skill. Empathy improves patient outcomes1-9,13-14,16-18,42 such as adherence to treatment, loyalty, and perception of care; and provider outcomes10-12,15 such as reduced burnout and a decreased likelihood of malpractice litigation.
It is less clear why other communication skills did not correlate with HCAHPS, but several differences in the measures themselves and how they were obtained might be responsible. It is possible that HCAHPS measures something broader than physician communication. In addition, the 4HCS was developed and normed on outpatient encounters as is true for virtually all doctor-patient coding schemes.43 Little is known about inpatient communication best practices. The timing of HCAHPS may also degrade the relationship between observed and reported communication. The HCAHPS questionnaires, collected after discharge, are retrospective reconstructions that are subject to recall bias and recency effects.44,45 In contrast, our observations took place in real time and were specific to the face-to-face interactions that take place when physicians engage patients at the bedside. Third, the response rate for HCAHPS surveys is only 30%, leading to potential sample bias.46 Respondents represent discharged patients who are willing and able to answer surveys, and may not be representative of all hospitalized patients. Finally, as with all global questions, the meaning any individual patient assigns to terms like “respect” may vary.
Our study has several limitations. The HCAHPS and 4HCS scores were not obtained from the same sample of patients. It is possible that the patients who were observed were not representative of the patients who completed the HCAHPS surveys. In addition, the only type of encounter observed was the initial visit between the hospitalist and the patient, and did not include communication during follow-up visits or on the day of discharge. However, there was a strong ICC among the 4HCS scores, implying that the 4HCS measures an inherent physician skill, which should be consistent across patients and encounters. Coding bias of the habits by a single observer could not be excluded. High intra-class correlation could be due in part to observer preferences for particular communication styles. Our sample included only 28 physicians. Although our study was powered to rule out a moderate correlation between 4HCS scores and HCAHPS scores (Pearson correlation coefficient greater than 0.5), we cannot exclude weaker correlations. Most correlations that we observed were so small that they would not be clinically meaningful, even in a much larger sample.
CONCLUSIONS
Our findings that HCAHPS scores did not correlate with the communication skills of the attending of record have some important implications. In an environment of value-based purchasing, most hospital systems are interested in identifying modifiable provider behaviors that optimize efficiency and payment structures. This study shows that directly measured communication skills do not correlate with HCAHPS scores as generally reported, indicating that HCAHPS may be measuring a broader domain than only physician communication skills. Better attribution based on the proportion of care provided by an individual physician could make the scores more useful for individual comparisons, but most institutions do not report their data in this way. Given this limitation, hospitals should refrain from comparing and incentivizing individual physicians based on their HCAHPS scores, because this measure was not designed for this purpose and does not appear to reflect an individual’s skills. This is important in the current environment in which hospitals face substantial penalties for underperformance but lack specific tools to improve their scores. Furthermore, there is concern that this type of measurement creates perverse incentives that may adversely alter clinical practice with the aim of improving scores.46
Training clinicians in communication and teaming skills is one potential means of increasing overall scores.15 Improving doctor-patient and team relationships is also the right thing to do. It is increasingly being demanded by patients and has always been a deep source of satisfaction for physicians.15,47 Moreover, there is an increasingly robust literature that relates face-to-face communication to biomedical and psychosocial outcomes of care.48 Identifying individual physicians who need help with communication skills is a worthwhile goal. Unfortunately, the HCAHPS survey does not appear to be the appropriate tool for this purpose.
Disclosure
The Cleveland Clinic Foundation, Division of Clinical Research, Research Programs Committees provided funding support. No funding source had any role in the study design; in the collection, analysis, and interpretation of data; in the writing of the report; or in the decision to submit the article for publication. The authors have no conflicts of interest for this study.
1. Glass RM. The patient-physician relationship. JAMA focuses on the center of medicine. JAMA. 1996;275(2):147-148. PubMed
2. Stein T, Frankel RM, Krupat E. Enhancing clinician communication skills in a large healthcare organization: a longitudinal case study. Patient Educ Couns. 2005;58(1):4-12. PubMed
3. Stewart M, Brown JB, Donner A, et al. The impact of patient-centered care on outcomes. J Fam Pract. 2000;49(9):796-804. PubMed
4. Safran DG, Taira DA, Rogers WH, Kosinski M, Ware JE, Tarlov AR. Linking primary care performance to outcomes of care. J Fam Pract. 1998;47(3):213-220. PubMed
5. Like R, Zyzanski SJ. Patient satisfaction with the clinical encounter: social psychological determinants. Soc Sci Med. 1987;24(4):351-357. PubMed
6. Williams S, Weinman J, Dale J. Doctor-patient communication and patient satisfaction: a review. Fam Pract. 1998;15(5):480-492. PubMed
7. Ciechanowski P, Katon WJ. The interpersonal experience of health care through the eyes of patients with diabetes. Soc Sci Med. 2006;63(12):3067-3079. PubMed
8. Stewart MA. Effective physician-patient communication and health outcomes: a review. CMAJ. 1995;152(9):1423-1433. PubMed
9. Hojat M, Louis DZ, Markham FW, Wender R, Rabinowitz C, Gonnella JS. Physicians’ empathy and clinical outcomes for diabetic patients. Acad Med. 2011;86(3):359-364. PubMed
10. Levinson W, Roter DL, Mullooly JP, Dull VT, Frankel RM. Physician-patient communication. The relationship with malpractice claims among primary care physicians and surgeons. JAMA. 1997;277(7):553-559. PubMed
11. Ambady N, Laplante D, Nguyen T, Rosenthal R, Chaumeton N, Levinson W. Surgeons’ tone of voice: a clue to malpractice history. Surgery. 2002;132(1):5-9. PubMed
12. Weng HC, Hung CM, Liu YT, et al. Associations between emotional intelligence and doctor burnout, job satisfaction and patient satisfaction. Med Educ. 2011;45(8):835-842. PubMed
13. Mauksch LB, Dugdale DC, Dodson S, Epstein R. Relationship, communication, and efficiency in the medical encounter: creating a clinical model from a literature review. Arch Intern Med. 2008;168(13):1387-1395. PubMed
14. Suchman AL, Roter D, Green M, Lipkin M Jr. Physician satisfaction with primary care office visits. Collaborative Study Group of the American Academy on Physician and Patient. Med Care. 1993;31(12):1083-1092. PubMed
15. Boissy A, Windover AK, Bokar D, et al. Communication skills training for physicians improves patient satisfaction. J Gen Intern Med. 2016;31(7):755-761. PubMed
16. Brody DS, Miller SM, Lerman CE, Smith DG, Lazaro CG, Blum MJ. The relationship between patients’ satisfaction with their physicians and perceptions about interventions they desired and received. Med Care. 1989;27(11):1027-1035. PubMed
17. Wasserman RC, Inui TS, Barriatua RD, Carter WB, Lippincott P. Pediatric clinicians’ support for parents makes a difference: an outcome-based analysis of clinician-parent interaction. Pediatrics. 1984;74(6):1047-1053. PubMed
18. Greenfield S, Kaplan S, Ware JE Jr. Expanding patient involvement in care. Effects on patient outcomes. Ann Intern Med. 1985;102(4):520-528. PubMed
19. Inui TS, Carter WB. Problems and prospects for health services research on provider-patient communication. Med Care. 1985;23(5):521-538. PubMed
20. Beckman H, Frankel R, Kihm J, Kulesza G, Geheb M. Measurement and improvement of humanistic skills in first-year trainees. J Gen Intern Med. 1990;5(1):42-45. PubMed
21. Keller S, O’Malley AJ, Hays RD, et al. Methods used to streamline the CAHPS Hospital Survey. Health Serv Res. 2005;40(6 pt 2):2057-2077. PubMed
22. Engel GL. The clinical application of the biopsychosocial model. Am J Psychiatry. 1980;137(5):535-544. PubMed
23. Lazare A, Eisenthal S, Wasserman L. The customer approach to patienthood. Attending to patient requests in a walk-in clinic. Arch Gen Psychiatry. 1975;32(5):553-558. PubMed
24. Eisenthal S, Lazare A. Evaluation of the initial interview in a walk-in clinic. The clinician’s perspective on a “negotiated approach”. J Nerv Ment Dis. 1977;164(1):30-35. PubMed
25. Kravitz RL, Callahan EJ, Paterniti D, Antonius D, Dunham M, Lewis CE. Prevalence and sources of patients’ unmet expectations for care. Ann Intern Med. 1996;125(9):730-737. PubMed
26. Froehlich GW, Welch HG. Meeting walk-in patients’ expectations for testing. Effects on satisfaction. J Gen Intern Med. 1996;11(8):470-474. PubMed
27. DiMatteo MR, Taranta A, Friedman HS, Prince LM. Predicting patient satisfaction from physicians’ nonverbal communication skills. Med Care. 1980;18(4):376-387. PubMed
28. Frankel RM, Stein T. Getting the most out of the clinical encounter: the four habits model. J Med Pract Manage. 2001;16(4):184-191. PubMed
29. Krupat E, Frankel R, Stein T, Irish J. The Four Habits Coding Scheme: validation of an instrument to assess clinicians’ communication behavior. Patient Educ Couns. 2006;62(1):38-45. PubMed
30. Fossli Jensen B, Gulbrandsen P, Benth JS, Dahl FA, Krupat E, Finset A. Interrater reliability for the Four Habits Coding Scheme as part of a randomized controlled trial. Patient Educ Couns. 2010;80(3):405-409. PubMed
31. Giordano LA, Elliott MN, Goldstein E, Lehrman WG, Spencer PA. Development, implementation, and public reporting of the HCAHPS survey. Med Care Res Rev. 2010;67(1):27-37. PubMed
32. Anonymous. CMS continues to shift emphasis to quality of care. Hosp Case Manag. 2012;20(10):150-151. PubMed
33. The R.E.D.E. Model 2015. Cleveland Clinic Center for Excellence in Healthcare
Communication. http://healthcarecommunication.info/. Accessed April 3 2016.
34. Empathetics, Inc. A Boston-based empathy training firm raises $1.5 million in
Series A Financing 2015. Empathetics Inc. http://www.prnewswire.com/news-releases/
empathetics-inc----a-boston-based-empathy-training-firm-raises-15-million-
in-series-a-financing-300072696.html). Accessed April 3, 2016.
35. Intensive Communication Skills 2016. Institute for Healthcare Communication.
http://healthcarecomm.org/. Accessed April 3, 2016.
36. Hu B, Palta M, Shao J. Variability explained by covariates in linear mixed-effect
models for longitudinal data. Canadian Journal of Statistics. 2010;38:352-368.
37. O’Malley AJ, Zaslavsky AM, Elliott MN, Zaborski L, Cleary PD. Case-mix adjustment
of the CAHPS Hospital Survey. Health Serv Res. 2005;40(6 pt 2):2162-2181. PubMed
38. O’Malley AJ, Zaslavsky AM, Hays RD, Hepner KA, Keller S, Cleary PD. Exploratory
factor analyses of the CAHPS Hospital Pilot Survey responses across
and within medical, surgical, and obstetric services. Health Serv Res. 2005;40(6 pt
2):2078-2095. PubMed
39. Goldstein E, Farquhar M, Crofton C, Darby C, Garfinkel S. Measuring hospital
care from the patients’ perspective: an overview of the CAHPS Hospital Survey
development process. Health Serv Res. 2005;40(6 pt 2):1977-1995. PubMed
40. Darby C, Hays RD, Kletke P. Development and evaluation of the CAHPS hospital
survey. Health Serv Res. 2005;40(6 pt 2):1973-1976. PubMed
41. Keller VF, Carroll JG. A new model for physician-patient communication. Patient
Educ Couns. 1994;23(2):131-140. PubMed
42. Quirk M, Mazor K, Haley HL, et al. How patients perceive a doctor’s caring attitude.
Patient Educ Couns. 2008;72(3):359-366. PubMed
43. Frankel RM, Levinson W. Back to the future: Can conversation analysis be used
to judge physicians’ malpractice history? Commun Med. 2014;11(1):27-39. PubMed
44. Furnham A. Response bias, social desirability and dissimulation. Personality and
individual differences 1986;7(3):385-400.
45. Shteingart H, Neiman T, Loewenstein Y. The role of first impression in operant
learning. J Exp Psychol Gen. 2013;142(2):476-488. PubMed
46. Tefera L, Lehrman WG, Conway P. Measurement of the patient experience: clarifying
facts, myths, and approaches. JAMA. 2016;315(2):2167-2168. PubMed
47. Horowitz CR, Suchman AL, Branch WT Jr, Frankel RM. What do doctors find
meaningful about their work? Ann Intern Med. 2003;138(9):772-775. PubMed
48. Rao JK, Anderson LA, Inui TS, Frankel RM. Communication interventions make
a difference in conversations between physicians and patients: a systematic review
of the evidence. Med Care. 2007;45(4):340-349. PubMed
Communication is the foundation of medical care.1 Effective communication can improve health outcomes, safety, adherence, satisfaction, trust, and enable genuine informed consent and decision-making.2-9 Furthermore, high-quality communication increases provider engagement and workplace satisfaction, while reducing stress and malpractice risk.10-15
Direct measurement of communication in the healthcare setting can be challenging. The “Four Habits Model,” which is derived from a synthesis of empiric studies8,16-20 and theoretical models21-24 of communication, offers 1 framework for assessing healthcare communication. The conceptual model underlying the 4 habits has been validated in studies of physician and patient satisfaction.1,4,25-27 The 4 habits are: investing in the beginning, eliciting the patient’s perspective, demonstrating empathy, and investing in the end. Each habit is divided into several identifiable tasks or skill sets, which can be reliably measured using validated tools and checklists.28 One such instrument, the Four Habits Coding Scheme (4HCS), has been evaluated against other tools and demonstrated overall satisfactory inter-rater reliability and validity.29,30
The Hospital Consumer Assessment of Healthcare Providers and Systems (HCAHPS) survey, developed under the direction of the Centers for Medicare and Medicaid Services (CMS) and the Agency for Healthcare Research and Quality, is an established national standard for measuring patient perceptions of care. HCAHPS retrospectively measures global perceptions of communication, support and empathy from physicians and staff, processes of care, and the overall patient experience. HCAHPS scores were first collected nationally in 2006 and have been publicly reported since 2008.31 With the introduction of value-based purchasing in 2012, health system revenues are now tied to HCAHPS survey performance.32 As a result, hospitals are financially motivated to improve HCAHPS scores but lack evidence-based methods for doing so. Some healthcare organizations have invested in communication training programs based on the available literature and best practices.2,33-35 However, it is not known how, if at all, HCAHPS scores relate to physicians’ real-time observed communication skills.
To examine the relationship between physician communication, as reported by global HCAHPS scores, and the quality of physician communication skills in specific encounters, we observed hospitalist physicians during inpatient bedside rounds and measured their communication skills using the 4HCS.
METHODS
Study Design
The study utilized a cross sectional design; physicians who consented were observed on rounds during 3 separate encounters, and we compared hospitalists’ 4HCS scores to their HCAHPS scores to assess the correlation. The study was approved by the Institutional Review Board of the Cleveland Clinic.
Population
The study was conducted at the main campus of the Cleveland Clinic. All physicians specializing in hospital medicine who had received 10 or more completed HCAHPS survey responses while rounding on a medicine service in the past year were invited to participate in the study. Participation was voluntary; night hospitalists were excluded. A research nurse was trained in the Four Habits Model28 and in the use of the 4HCS coding scheme by the principal investigator. The nurse observed each physician and ascertained the presence of communication behaviors using the 4HCS tool. Physicians were observed between August 2013 and August 2014. Multiple observations per physician could occur on the same day, but only 1 observation per patient was used for analysis. Observations consisted of a physician’s first encounter with a hospitalized patient, with the patient’s consent. Observations were conducted during encounters with English-speaking and cognitively intact patients only. Resident physicians were permitted to stay and conduct rounds per their normal routine. Patient information was not collected as part of the study.
Measures
HCAHPS. For each physician, we extracted all HCAHPS scores that were collected from our hospital’s Press Ganey database. The HCAHPS survey contains 22 core questions divided into 7 themes or domains, 1 of which is doctor communication. The survey uses frequency-based questions with possible answers fixed on a 4-point scale (4=always, 3=usually, 2=sometimes, 1=never). Our primary outcome was the doctor communication domain, which comprises 3 questions: 1) During this hospital stay, how often did the doctors treat you with respect? 2) During this hospital stay, how often did the doctors listen to you? and 3) During this hospital stay, how often did the doctors explain things in a language you can understand? Because CMS counts only the percentage of responses that are graded “always,” so-called “top box” scoring, we used the same measure.
The HCAHPS scores are always attributed to the physician at the time of discharge even if he may not have been responsible for the care of the patient during the entire hospital course. To mitigate contamination from patients seen by multiple providers, we cross-matched length of stay (LOS) data with billing data to determine the proportion of days a patient was seen by a single provider during the entire length of stay. We stratified patients seen by the attending providers to less than 50%, 50% to less than 100%, and at 100% of the LOS. However, we were unable to identify which patients were seen by other consultants or by residents due to limitations in data gathering and the nature of the database.
The Four Habits. The Four Habits are: invest in the beginning, elicit the patient’s perspective, demonstrate empathy, and invest in the end (Figure 1). Specific behaviors for Habits 1 to 4 are outlined in the Appendix, but we will briefly describe the themes as follows. Habit 1, invest in the beginning, describes the ability of the physician to set a welcoming environment for the patient, establish rapport, and collaborate on an agenda for the visit. Habit 2, elicit the patient’s perspective, describes the ability of the physician to explore the patients’ worries, ideas, expectations, and the impact of the illness on their lifestyle. Habit 3, demonstrate empathy, describes the physician’s openness to the patient’s emotions as well as the ability to explore, validate; express curiosity, and openly accept these feelings. Habit 4, invest in the end, is a measure of the physician’s ability to counsel patients in a language built around their original concerns or worries, as well as the ability to check the patients’ understanding of the plan.2,29-30
4HCS. The 4HCS tool (Appendix) measures discreet behaviors and phrases based on each of the Four Habits (Figure 1). With a scoring range from a low of 4 to a high of 20, the rater at bedside assigns a range of points on a scale of 1 to 5 for each habit. It is an instrument based on a teaching model used widely throughout Kaiser Permanente to improve clinicians’ communication skills. The 4HCS was first tested for interrater reliability and validity against the Roter Interaction Analysis System using 100 videotaped primary care physician encounters.29 It was further evaluated in a randomized control trial. Videotapes from 497 hospital encounters involving 71 doctors from a variety of clinical specialties were rated by 4 trained raters using the coding scheme. The total score Pearson’s R and intraclass correlation coefficient (ICC) exceeded 0.70 for all pairs of raters, and the interrater reliability was satisfactory for the 4HCS as applied to heterogeneous material.30
STATISTICAL ANALYSIS
Physician characteristics were summarized with standard descriptive statistics. Pearson correlation coefficients were computed between HCAHPS and 4HCS scores. All analyses were performed with RStudio (Boston, MA). The Pearson correlation between the averaged HCAHPS and 4HCS scores was also computed. A correlation with a P value less than 0.05 was considered statistically significant. With 28 physicians, the study had a power of 88% to detect a moderate correlation (greater than 0.50) with a 2-sided alpha of 0.05. We also computed the correlations based on the subgroups of data with patients seen by providers for less than 50%, 50% to less than 100%, and 100% of LOS. All analyses were conducted in SAS 9.2 (SAS Institute Inc., Cary, NC).36
RESULTS
There were 31 physicians who met our inclusion criteria. Of 29 volunteers, 28 were observed during 3 separate inpatient encounters and made up the final sample. A total of 1003 HCAHPS survey responses were available for these physicians. Participants were predominantly female (60.7%), with an average age of 39 years. They were in practice for an average of 4 years (12 were in practice more than 5 years), and 9 were observed on a teaching rotation.
The means of the overall 4HCS scores per observation were 17.39 ± 2.33 for the first, 17.00 ± 2.37 for the second, and 17.43 ± 2.36 for third bedside observation. The mean 4HCS scores per observation, broken down by habit, appear in Table 1. The ICC among the repeated scores within the same physician was 0.81. The median number of HCAHPS survey returns was 32 (range = [8, 85], with mean = 35.8, interquartile range = [16, 54]). The median overall HCAHPS doctor communication score was 89.6 (range = 80.9-93.7). Participants scored the highest in the respect subdomain and the lowest in the explain subdomain. Median HCAHPS scores and ranges appear in Table 2.
Because there were no significant associations between 4HCS scores or HCAHPS scores and physician age, sex, years in practice, or teaching site, correlations were not adjusted. Figure 2A and 2B show the association between mean 4HCS scores and HCAHPS scores by physician. There was no significant correlation between overall 4HCS and HCAHPS doctor communication scores (Pearson correlation coefficient 0.098; 95% confidence interval [CI], -0.285, 0.455). The individual habits also were not correlated with overall HCAHPS scores or with their corresponding HCAHPS domain (Table 3).
For 325 patients, 1 hospitalist was present for the entire LOS. In sensitivity analysis limiting observations to these patients (Figure 2C, Figure 2D, Table 3), we found a moderate correlation between habit 3 and the HCAHPS respect score (Pearson correlation coefficient 0.515; 95% CI, 0.176, 0.745; P = 0.005), and a weaker correlation between habit 3 and the HCAHPS overall doctor communication score (0.442; 95% CI, 0.082, 0.7; P = 0.019). There were no other significant correlations between specific habits and HCAHPS scores.
DISCUSSION
In this observational study of hospitalist physicians at a large tertiary care center, we found that communication skills, as measured by the 4HCS, varied substantially among physicians but were highly correlated within patients of the same physician. However, there was virtually no correlation between the attending physician of record’s 4HCS scores and their HCAHPS communication scores. When we limited our analysis to patients who saw only 1 hospitalist throughout their stay, there were moderate correlations between demonstration of empathy and both the HCAHPS respect score and overall doctor communication score. There were no trends across the strata of hospitalist involvement. It is important to note that the addition of even 1 different hospitalist to the LOS removes any association. Habits 1 and 2 are close to significance in the 100% subgroup, with a weak correlation. Interestingly, Habit 4, which focuses on creating a plan with the patient, showed no correlation at all with patients reporting that doctors explained things in language they could understand.
Development and testing of the HCAHPS survey began in 2002, commissioned by CMS and the Agency for Healthcare Research and Quality for the purpose of measuring patient experience in the hospital. The HCAHPS survey was endorsed by the National Quality Forum in 2005, with final approval of the national implementation granted by the Office of Management and Budget later that year. The CMS began implementation of the HCAHPS survey in 2006, with the first required public reporting of all hospitals taking place in March 2008.37-41 Based on CMS’ value-based purchasing initiative, hospitals with low HCAHPS scores have faced substantial penalties since 2012. Under these circumstances, it is important that the HCAHPS measures what it purports to measure. Because HCAHPS was designed to compare hospitals, testing was limited to assessment of internal reliability, hospital-level reliability, and construct validity. External validation with known measures of physician communication was not performed.41 Our study appears to be the first to compare HCAHPS scores to directly observed measures of physician communication skills. The lack of association between the 2 should sound a cautionary note to hospitals who seek to tie individual compensation to HCAHPS scores to improve them. In particular, the survey asks for a rating for all the patient’s doctors, not just the primary hospitalist. We found that, for hospital stays with just 1 hospitalist, the HCAHPS score reflected observed expression of empathy, although the correlation was only moderate, and HCAHPS were not correlated with other communication skills. Of all communication skills, empathy may be most important. Almost the entire body of research on physician communication cites empathy as a central skill. Empathy improves patient outcomes1-9,13-14,16-18,42 such as adherence to treatment, loyalty, and perception of care; and provider outcomes10-12,15 such as reduced burnout and a decreased likelihood of malpractice litigation.
It is less clear why other communication skills did not correlate with HCAHPS, but several differences in the measures themselves and how they were obtained might be responsible. It is possible that HCAHPS measures something broader than physician communication. In addition, the 4HCS was developed and normed on outpatient encounters as is true for virtually all doctor-patient coding schemes.43 Little is known about inpatient communication best practices. The timing of HCAHPS may also degrade the relationship between observed and reported communication. The HCAHPS questionnaires, collected after discharge, are retrospective reconstructions that are subject to recall bias and recency effects.44,45 In contrast, our observations took place in real time and were specific to the face-to-face interactions that take place when physicians engage patients at the bedside. Third, the response rate for HCAHPS surveys is only 30%, leading to potential sample bias.46 Respondents represent discharged patients who are willing and able to answer surveys, and may not be representative of all hospitalized patients. Finally, as with all global questions, the meaning any individual patient assigns to terms like “respect” may vary.
Our study has several limitations. The HCAHPS and 4HCS scores were not obtained from the same sample of patients. It is possible that the patients who were observed were not representative of the patients who completed the HCAHPS surveys. In addition, the only type of encounter observed was the initial visit between the hospitalist and the patient, and did not include communication during follow-up visits or on the day of discharge. However, there was a strong ICC among the 4HCS scores, implying that the 4HCS measures an inherent physician skill, which should be consistent across patients and encounters. Coding bias of the habits by a single observer could not be excluded. High intra-class correlation could be due in part to observer preferences for particular communication styles. Our sample included only 28 physicians. Although our study was powered to rule out a moderate correlation between 4HCS scores and HCAHPS scores (Pearson correlation coefficient greater than 0.5), we cannot exclude weaker correlations. Most correlations that we observed were so small that they would not be clinically meaningful, even in a much larger sample.
CONCLUSIONS
Our findings that HCAHPS scores did not correlate with the communication skills of the attending of record have some important implications. In an environment of value-based purchasing, most hospital systems are interested in identifying modifiable provider behaviors that optimize efficiency and payment structures. This study shows that directly measured communication skills do not correlate with HCAHPS scores as generally reported, indicating that HCAHPS may be measuring a broader domain than only physician communication skills. Better attribution based on the proportion of care provided by an individual physician could make the scores more useful for individual comparisons, but most institutions do not report their data in this way. Given this limitation, hospitals should refrain from comparing and incentivizing individual physicians based on their HCAHPS scores, because this measure was not designed for this purpose and does not appear to reflect an individual’s skills. This is important in the current environment in which hospitals face substantial penalties for underperformance but lack specific tools to improve their scores. Furthermore, there is concern that this type of measurement creates perverse incentives that may adversely alter clinical practice with the aim of improving scores.46
Training clinicians in communication and teaming skills is one potential means of increasing overall scores.15 Improving doctor-patient and team relationships is also the right thing to do. It is increasingly being demanded by patients and has always been a deep source of satisfaction for physicians.15,47 Moreover, there is an increasingly robust literature that relates face-to-face communication to biomedical and psychosocial outcomes of care.48 Identifying individual physicians who need help with communication skills is a worthwhile goal. Unfortunately, the HCAHPS survey does not appear to be the appropriate tool for this purpose.
Disclosure
The Cleveland Clinic Foundation, Division of Clinical Research, Research Programs Committees provided funding support. No funding source had any role in the study design; in the collection, analysis, and interpretation of data; in the writing of the report; or in the decision to submit the article for publication. The authors have no conflicts of interest for this study.
1. Glass RM. The patient-physician relationship. JAMA focuses on the center of medicine. JAMA. 1996;275(2):147-148. PubMed
2. Stein T, Frankel RM, Krupat E. Enhancing clinician communication skills in a large healthcare organization: a longitudinal case study. Patient Educ Couns. 2005;58(1):4-12. PubMed
3. Stewart M, Brown JB, Donner A, et al. The impact of patient-centered care on outcomes. J Fam Pract. 2000;49(9):796-804. PubMed
4. Safran DG, Taira DA, Rogers WH, Kosinski M, Ware JE, Tarlov AR. Linking primary care performance to outcomes of care. J Fam Pract. 1998;47(3):213-220. PubMed
5. Like R, Zyzanski SJ. Patient satisfaction with the clinical encounter: social psychological determinants. Soc Sci Med. 1987;24(4):351-357. PubMed
6. Williams S, Weinman J, Dale J. Doctor-patient communication and patient satisfaction: a review. Fam Pract. 1998;15(5):480-492. PubMed
7. Ciechanowski P, Katon WJ. The interpersonal experience of health care through the eyes of patients with diabetes. Soc Sci Med. 2006;63(12):3067-3079. PubMed
8. Stewart MA. Effective physician-patient communication and health outcomes: a review. CMAJ. 1995;152(9):1423-1433. PubMed
9. Hojat M, Louis DZ, Markham FW, Wender R, Rabinowitz C, Gonnella JS. Physicians’ empathy and clinical outcomes for diabetic patients. Acad Med. 2011;86(3):359-364. PubMed
10. Levinson W, Roter DL, Mullooly JP, Dull VT, Frankel RM. Physician-patient communication. The relationship with malpractice claims among primary care physicians and surgeons. JAMA. 1997;277(7):553-559. PubMed
11. Ambady N, Laplante D, Nguyen T, Rosenthal R, Chaumeton N, Levinson W. Surgeons’ tone of voice: a clue to malpractice history. Surgery. 2002;132(1):5-9. PubMed
12. Weng HC, Hung CM, Liu YT, et al. Associations between emotional intelligence and doctor burnout, job satisfaction and patient satisfaction. Med Educ. 2011;45(8):835-842. PubMed
13. Mauksch LB, Dugdale DC, Dodson S, Epstein R. Relationship, communication, and efficiency in the medical encounter: creating a clinical model from a literature review. Arch Intern Med. 2008;168(13):1387-1395. PubMed
14. Suchman AL, Roter D, Green M, Lipkin M Jr. Physician satisfaction with primary care office visits. Collaborative Study Group of the American Academy on Physician and Patient. Med Care. 1993;31(12):1083-1092. PubMed
15. Boissy A, Windover AK, Bokar D, et al. Communication skills training for physicians improves patient satisfaction. J Gen Intern Med. 2016;31(7):755-761. PubMed
16. Brody DS, Miller SM, Lerman CE, Smith DG, Lazaro CG, Blum MJ. The relationship between patients’ satisfaction with their physicians and perceptions about interventions they desired and received. Med Care. 1989;27(11):1027-1035. PubMed
17. Wasserman RC, Inui TS, Barriatua RD, Carter WB, Lippincott P. Pediatric clinicians’ support for parents makes a difference: an outcome-based analysis of clinician-parent interaction. Pediatrics. 1984;74(6):1047-1053. PubMed
18. Greenfield S, Kaplan S, Ware JE Jr. Expanding patient involvement in care. Effects on patient outcomes. Ann Intern Med. 1985;102(4):520-528. PubMed
19. Inui TS, Carter WB. Problems and prospects for health services research on provider-patient communication. Med Care. 1985;23(5):521-538. PubMed
20. Beckman H, Frankel R, Kihm J, Kulesza G, Geheb M. Measurement and improvement of humanistic skills in first-year trainees. J Gen Intern Med. 1990;5(1):42-45. PubMed
21. Keller S, O’Malley AJ, Hays RD, et al. Methods used to streamline the CAHPS Hospital Survey. Health Serv Res. 2005;40(6 pt 2):2057-2077. PubMed
22. Engel GL. The clinical application of the biopsychosocial model. Am J Psychiatry. 1980;137(5):535-544. PubMed
23. Lazare A, Eisenthal S, Wasserman L. The customer approach to patienthood. Attending to patient requests in a walk-in clinic. Arch Gen Psychiatry. 1975;32(5):553-558. PubMed
24. Eisenthal S, Lazare A. Evaluation of the initial interview in a walk-in clinic. The clinician’s perspective on a “negotiated approach”. J Nerv Ment Dis. 1977;164(1):30-35. PubMed
25. Kravitz RL, Callahan EJ, Paterniti D, Antonius D, Dunham M, Lewis CE. Prevalence and sources of patients’ unmet expectations for care. Ann Intern Med. 1996;125(9):730-737. PubMed
26. Froehlich GW, Welch HG. Meeting walk-in patients’ expectations for testing. Effects on satisfaction. J Gen Intern Med. 1996;11(8):470-474. PubMed
27. DiMatteo MR, Taranta A, Friedman HS, Prince LM. Predicting patient satisfaction from physicians’ nonverbal communication skills. Med Care. 1980;18(4):376-387. PubMed
28. Frankel RM, Stein T. Getting the most out of the clinical encounter: the four habits model. J Med Pract Manage. 2001;16(4):184-191. PubMed
29. Krupat E, Frankel R, Stein T, Irish J. The Four Habits Coding Scheme: validation of an instrument to assess clinicians’ communication behavior. Patient Educ Couns. 2006;62(1):38-45. PubMed
30. Fossli Jensen B, Gulbrandsen P, Benth JS, Dahl FA, Krupat E, Finset A. Interrater reliability for the Four Habits Coding Scheme as part of a randomized controlled trial. Patient Educ Couns. 2010;80(3):405-409. PubMed
31. Giordano LA, Elliott MN, Goldstein E, Lehrman WG, Spencer PA. Development, implementation, and public reporting of the HCAHPS survey. Med Care Res Rev. 2010;67(1):27-37. PubMed
32. Anonymous. CMS continues to shift emphasis to quality of care. Hosp Case Manag. 2012;20(10):150-151. PubMed
33. The R.E.D.E. Model 2015. Cleveland Clinic Center for Excellence in Healthcare
Communication. http://healthcarecommunication.info/. Accessed April 3 2016.
34. Empathetics, Inc. A Boston-based empathy training firm raises $1.5 million in
Series A Financing 2015. Empathetics Inc. http://www.prnewswire.com/news-releases/
empathetics-inc----a-boston-based-empathy-training-firm-raises-15-million-
in-series-a-financing-300072696.html). Accessed April 3, 2016.
35. Intensive Communication Skills 2016. Institute for Healthcare Communication.
http://healthcarecomm.org/. Accessed April 3, 2016.
36. Hu B, Palta M, Shao J. Variability explained by covariates in linear mixed-effect
models for longitudinal data. Canadian Journal of Statistics. 2010;38:352-368.
37. O’Malley AJ, Zaslavsky AM, Elliott MN, Zaborski L, Cleary PD. Case-mix adjustment
of the CAHPS Hospital Survey. Health Serv Res. 2005;40(6 pt 2):2162-2181. PubMed
38. O’Malley AJ, Zaslavsky AM, Hays RD, Hepner KA, Keller S, Cleary PD. Exploratory
factor analyses of the CAHPS Hospital Pilot Survey responses across
and within medical, surgical, and obstetric services. Health Serv Res. 2005;40(6 pt
2):2078-2095. PubMed
39. Goldstein E, Farquhar M, Crofton C, Darby C, Garfinkel S. Measuring hospital
care from the patients’ perspective: an overview of the CAHPS Hospital Survey
development process. Health Serv Res. 2005;40(6 pt 2):1977-1995. PubMed
40. Darby C, Hays RD, Kletke P. Development and evaluation of the CAHPS hospital
survey. Health Serv Res. 2005;40(6 pt 2):1973-1976. PubMed
41. Keller VF, Carroll JG. A new model for physician-patient communication. Patient
Educ Couns. 1994;23(2):131-140. PubMed
42. Quirk M, Mazor K, Haley HL, et al. How patients perceive a doctor’s caring attitude.
Patient Educ Couns. 2008;72(3):359-366. PubMed
43. Frankel RM, Levinson W. Back to the future: Can conversation analysis be used
to judge physicians’ malpractice history? Commun Med. 2014;11(1):27-39. PubMed
44. Furnham A. Response bias, social desirability and dissimulation. Personality and
individual differences 1986;7(3):385-400.
45. Shteingart H, Neiman T, Loewenstein Y. The role of first impression in operant
learning. J Exp Psychol Gen. 2013;142(2):476-488. PubMed
46. Tefera L, Lehrman WG, Conway P. Measurement of the patient experience: clarifying
facts, myths, and approaches. JAMA. 2016;315(2):2167-2168. PubMed
47. Horowitz CR, Suchman AL, Branch WT Jr, Frankel RM. What do doctors find
meaningful about their work? Ann Intern Med. 2003;138(9):772-775. PubMed
48. Rao JK, Anderson LA, Inui TS, Frankel RM. Communication interventions make
a difference in conversations between physicians and patients: a systematic review
of the evidence. Med Care. 2007;45(4):340-349. PubMed
© 2017 Society of Hospital Medicine
Impact of a Connected Care model on 30-day readmission rates from skilled nursing facilities
Approximately 20% of hospitalized Medicare beneficiaries in the U.S. are discharged to skilled nursing facilities (SNFs) for post-acute care,1,2 and 23.5% of these patients are readmitted within 30 days.3 Because hospital readmissions are costly and associated with worse outcomes,4,5 30-day readmission rates are considered a quality indicator,6 and there are financial penalties for hospitals with higher than expected rates.7 As a result, hospitals invest substantial resources in programs to reduce readmissions.8-10 The SNFs represent an attractive target for readmission reduction efforts, since SNFs contribute a disproportionate share of readmissions.3,4 Because SNF patients are in a monitored environment with high medication adherence, risk factors for readmission likely differ between patients discharged to SNFs and those sent home. For example, 1 study showed that among heart failure patients with cognitive impairment, those discharged to SNFs had lower readmissions during the first 20 days, likely due to better medication adherence.11 Patients discharged to SNFs generally have more complex illnesses, lower functional status, and higher 1-year mortality than patients discharged to the community.12,13 Despite this, SNF patients might have infrequent contact with physicians. Federal regulations require only that patients discharged to SNFs need to be seen within 30 days and then at least once every 30 days thereafter.14 According to the 2014 Office of Inspector General report, one-third of Medicare beneficiaries in SNFs experience adverse events from substandard treatment, inadequate resident monitoring and failure or delay of necessary care, most of which are thought to be preventable.15
To address this issue, the Cleveland Clinic developed a program called “Connected Care SNF,” in which hospital-employed physicians and advanced practice professionals visit patients in selected SNFs 4 to 5 times per week, for the purpose of reducing preventable readmissions. The aim of this study was to assess whether the program reduced 30-day readmissions, and to identify which patients benefited most from the program.
METHODS
Setting and Intervention
The Cleveland Clinic main campus is a tertiary academic medical center with 1400 beds and approximately 50,000 admissions per year. In late 2012, the Cleveland Clinic implemented the Connected Care SNF program, wherein Cleveland Clinic physicians regularly visited patients who were discharged from the Cleveland Clinic main campus to 7 regional SNFs. Beginning in December 2012, these 7 high-volume referral SNFs that were not part of the Cleveland Clinic Health System (CCHS) agreed to participate in the program, which focused on reducing avoidable hospital readmissions and delivering quality care (Table 1). The Connected Care team, comprised of 2 geriatricians (1 of whom was also a palliative medicine specialist), 1 internist, 1 family physician, and 5 advanced practice professionals (nurse practitioners and physician assistants), provided medical services at the participating SNFs. These providers aimed to see patients 4 to 5 times per week, were available on site during working hours, and provided telephone coverage at nights and on weekends. All providers had access to hospital electronic medical records and could communicate with the discharging physician and with specialists familiar with the patient as needed. Prior to the admission, providers were informed about patient arrival and, at the time of admission to the SNF, providers reviewed medications and discussed goals of care with patients and their families. In the SNF, providers worked closely with staff members to deliver medications and timely treatment. They also met monthly with multidisciplinary teams for continuous quality improvement and to review outcomes. Patients at Connected Care SNFs who had their own physicians, including most long-stay and some short-stay residents, did not receive the Connected Care intervention. They constituted less than 10% of the patients discharged from Cleveland Clinic main campus.

Study Design and Population
We reviewed administrative and clinical data from a retrospective cohort of patients discharged to SNF from the Cleveland Clinic main campus from January 1, 2011 to December 31, 2014. We included all patients who were discharged to an SNF during the study period. Our main outcome measure was 30-day all-cause readmissions to any hospital in the Cleveland Clinic Health System (CCHS), including the main campus and 8 regional community hospitals. Study patients were followed until January 30, 2015 to capture 30-day readmissions. According to 2012 Medicare data, of CCHS patients who were readmitted within 30 days, 83% of pneumonia, 81% of major joint replacement, 72% of heart failure and 57% of acute myocardial infarction patients were readmitted to a CCHS facility. As the Cleveland Clinic main campus attracts cardiac patients from a 100+-mile radius, they may be more likely to seek care readmission near home and are not reflective of CCHS patients overall. Because we did not have access to readmissions data from non-CCHS hospitals, we excluded patients who were discharged to SNFs beyond a 25-mile radius from the main campus, where they may be more likely to utilize non-CCHS hospitals for acute hospitalization. We also excluded patients discharged to non-CCHS hospital-based SNFs, which may refer readmissions to their own hospital system. Because the Connected Care program began in December 2012, the years 2011-2012 served as the baseline period. The intervention was conducted at 7 SNFs. All other SNFs within the 25-mile radius were included as controls, except for 3 hospital-based SNFs that would be unlikely to admit patients to CCHS. We compared the change in all-cause 30-day readmission rates after implementation of Connected Care, using all patients discharged to SNFs within 25 miles to control for temporal changes in local readmission rates. Discharge to specific SNFs was determined solely by patient choice.
Data Collection
For each patient, we collected the following data that has been shown to be associated with readmissions:16-18 demographics (age, race, sex, ZIP code), lab values on discharge (hemoglobin and sodium); hemodialysis status; medicine or surgical service; elective surgery or nonelective surgery; details of the index admission index (diagnosis-related group [DRG], Medicare severity-diagnosis-related groups [MS-DRG] weight, primary diagnosis code; principal procedure code; admission date; discharge date, length of stay, and post-acute care provider); and common comorbidities, as listed in Table 2. We also calculated each patient’s HOSPITAL19,20 score. The HOSPITAL score was developed to predict risk of preventable 30-day readmissions,19 but it has also been validated to predict 30-day all-cause readmission rates for patients discharged to SNF.21 The model contains 7 elements (hemoglobin, oncology service, sodium, procedure, index type, admissions within the last year, length of stay) (supplemental Table).Patients with a high score (7 or higher) have a 41% chance of readmission, while those with a low score (4 or lower) have only a 15% chance. 21 We assessed all cause 30-day readmission status from CCHS administrative data. Observation patients and outpatient same-day surgeries were not considered to be admissions. For patients with multiple admissions, each admission was counted as a separate index hospitalization. Cleveland Clinic’s Institutional Review Board approved the study.

Statistical Analysis
For the 7 intervention SNFs, patient characteristics were summarized as means and standard deviations or frequencies and percentages for the periods of 2011-2012 and 2013-2014, respectively, and the 2 periods were compared using the Student t test or χ2 test as appropriate.
Mixed-effects logistic regression models were used to model 30-day readmission rates. Since the intervention was implemented in the last quarter of 2012, we examined the difference in readmission rates before and after that time point. The model included the following fixed effects: SNF type (intervention or usual care), time points (quarters of 2011-2014), whether the time is pre- or postintervention (binary), and the 3-way interaction between SNF type, pre- or postintervention and time points, and patient characteristics. The model also contained a Gaussian random effect at the SNF level to account for possible correlations among the outcomes of patients from the same SNF. For each quarter, the mean adjusted readmission rates of 2 types of SNFs were calculated from the fitted mixed models and plotted over time. Furthermore, we compared the mean readmission rates of the 2 groups in the pre- and postintervention periods. Subgroup analyses were performed for medical and surgical patients, and for patients in the low, intermediate and high HOSPITAL score groups.
All analyses were performed using RStudio (Boston, Massachusetts). Statistical significance was established with 2-sided P values less than 0.05.
RESULTS
We identified 119 SNFs within a 25-mile radius of the hospital. Of these, 6 did not receive any referrals. Three non-CCHS hospital-based SNFs were excluded, leaving a total of 110 SNFs in the study sample: 7 intervention SNFs and 103 usual-care SNFs. Between January 2011 and December 2014, there were 23,408 SNF discharges from Cleveland Clinic main campus, including 13,544 who were discharged to study SNFs (Supplemental Figure). Of these, 3334 were discharged to 7 intervention SNFs and 10,210 were discharged to usual care SNFs. Characteristics of patients in both periods appear in Table 2. At baseline, patients in the intervention and control SNFs varied in a number of ways. Patients at intervention SNFs were older (75.6 vs. 70.2 years; P < 0.001), more likely to be African American (45.5% vs. 35.9%; P < 0.001), female (61% vs. 55.4%; P < 0.001) and to be insured by Medicare (85.2% vs. 71.4%; P < 0.001). Both groups had similar proportions of patients with high, intermediate, and low readmission risk as measured by HOSPITAL score. Compared to the 2011-2012 pre-intervention period, during the 2013-2014 intervention period, there were more surgeries (34.3% vs. 41.9%; P < 0.001), more elective surgeries (21.8% vs. 25.5%; P = 0.01), fewer medical patients (65.7% vs. 58.1%; P < 0.001), and an increase in comorbidities, including myocardial infarction, peripheral vascular disease, and liver disease (Table 2).

Table 3 shows adjusted 30-day readmissions rates, before and during the intervention period at the intervention and usual care SNFs. Compared to the pre-intervention period, 30-day all-cause adjusted readmission rates declined in the intervention SNFs (28.1% to 21.7%, P < 0.001), while it increased slightly at control sites (27.1% to 28.5%, P < 0.001). The Figure shows the adjusted 30-day readmission rates by quarter throughout the study period.

Declines in 30-day readmission rates were greater for medical patients (31.0% to 24.6%, P < 0.001) than surgical patients (22.4% to 17.7%, P < 0.001). Patients with high HOSPITAL scores had the greatest decline, while those with low HOSPITAL scores had smaller declines.
DISCUSSION
In this retrospective study of 4 years of discharges to 110 SNFs, we report on the impact of a Connected Care program, in which a physician visited patients on admission to the SNF and 4 to 5 times per week during their stay. Introduction of the program was followed by a 6.8% absolute reduction in all-cause 30-day readmission rates compared to usual care. The absolute reductions ranged from 4.6% for patients at low risk for readmission to 9.1% for patients at high risk, and medical patients benefited more than surgical patients.
Most studies of interventions to reduce hospital readmissions have focused on patients discharged to the community setting.7-9 Interventions have centered on discharge planning, medication reconciliation, and close follow-up to assess for medication adherence and early signs of deterioration. Because patients in SNFs have their medications administered by staff and are under frequent surveillance, such interventions are unlikely to be helpful in this population. We found no studies that focus on short-stay or skilled patients discharged to SNF. Two studies have demonstrated that interventions can reduce hospitalization from nursing homes.22,23 Neither study included readmissions. The Evercare model consisted of nurse practitioners providing active primary care services within the nursing home, as well as offering incentive payments to nursing homes for not hospitalizing patients.22 During a 2-year period, long term residents who enrolled in Evercare had an almost 50% reduction in incident hospitalizations compared to those who did not.22 INTERACT II was a quality improvement intervention that provided tools, education, and strategies to help identify and manage acute conditions proactively.23 In 25 nursing homes employing INTERACT II, there was a 17% reduction in self-reported hospital admissions during the 6-month project, with higher rates of reduction among nursing homes rated as more engaged in the process.23 Although nursing homes may serve some short-stay or skilled patients, they generally serve long-term populations, and studies have shown that short-stay patients are at higher risk for 30-day readmissions.24
There are a number of reasons that short-term SNF patients are at higher risk for readmission. Although prior to admission, they were considered hospital level of care and received a physician visit daily, on transfer to the SNF, relatively little medical care is available. Current federal regulations regarding physician services at a SNF require the resident to be seen by a physician at least once every 30 days for the first 90 days after admission, and at least once every 60 days thereafter.25
The Connected Care program physicians provided a smooth transition of care from hospital to SNF as well as frequent reassessment. Physicians were alerted prior to hospital discharge and performed an initial comprehensive visit generally on the day of admission to the SNF and always within 48 hours. The initial evaluation is important because miscommunication during the handoff from hospital to SNF may result in incorrect medication regimens or inaccurate assessments. By performing prompt medication reconciliation and periodic reassessments of a patient’s medical condition, the Connected Care providers recreate some of the essential elements of successful outpatient readmissions prevention programs.
They also worked together with each SNF’s interdisciplinary team to deliver quality care. There were monthly meetings at each participating Connected Care SNF. Physicians reviewed monthly 30-day readmissions and performed root-cause analysis. When they discovered challenges to timely medication and treatment delivery during daily rounds, they provided in-services to SNF nurses.
In addition, Connected Care providers discussed goals of care—something that is often overlooked on admission to a SNF. This is particularly important because patients with chronic illnesses who are discharged to SNF often have poor prognoses. For example, Medicare patients with heart failure who are discharged to SNFs have 1-year mortality in excess of 50%.13 By implementing a plan of care consistent with patient and family goals, inappropriate readmissions for terminal patients may be avoided.
Reducing readmissions is important for hospitals because under the Hospital Readmissions Reduction Program, hospitals now face substantial penalties for higher than expected readmissions rates. Hospitals involved in bundled payments or other total cost-of-care arrangements have additional incentive to avoid readmissions. Beginning in 2019, SNFs will also receive incentive payments based on their 30-day all-cause hospital readmissions as part of the Skilled Nursing Facility Value-Based Purchasing program.25 The Connected Care model offers 1 means of achieving this goal through partnership between hospitals and SNFs.
Our study has several limitations. First, our study was observational in nature, so the observed reduction in readmissions could have been due to temporal trends unrelated to the intervention. However, no significant reduction was noted during the same time period in other area SNFs. There was also little change in the characteristics of patients admitted to the intervention SNFs. Importantly, the HOSPITAL score, which can predict 30-day readmission rates,20 did not change throughout the study period. Second, the results reflect patients discharged from a single hospital and may not be generalizable to other geographic areas. However, because the program included 7 SNFs, we believe it could be reproduced in other settings. Third, our readmissions measure included only those patients who returned to a CCHS facility. Although we may have missed some readmissions to other hospital systems, such leakage is uncommon—more than 80% of CCHS patients are readmitted to CCHS facilities—and would be unlikely to differ across the short duration of the study. Finally, at the intervention SNFs, most long-stay and some short-stay residents did not receive the Connected Care intervention because they were cared for by their own physicians who did not participate in Connected Care. Had these patients’ readmissions been excluded from our results, the intervention might appear even more effective.
CONCLUSION
A Connected Care intervention reduced 30-day readmission rates among patients discharged to SNFs from a tertiary academic center. While all subgroups had substantial reductions in readmissions following the implementation of the intervention, patients who are at the highest risk of readmission benefited the most. Further study is necessary to know whether Connected Care can be reproduced in other health care systems and whether it reduces overall costs.
Acknowledgments
The authors would like to thank Michael Felver, MD, and teams for their clinical care of patients; Michael Felver, MD, William Zafirau, MD, Dan Blechschmid, MHA, and Kathy Brezine, and Seth Vilensky, MBA, for their administrative support; and Brad Souder, MPT, for assistance with data collection.
Disclosure
Nothing to report.
1. Medicare Payment Advisory Commission. Report to the Congress: Medicare Payment Policy. Chapter 8. Skilled Nursing Facility Services. March 2013. http://www.medpac.gov/docs/default-source/reports/mar13_entirereport.pdf?sfvrsn=0. Accessed March 1, 2017.
2. Kim DG, Messinger-Rapport BJ. Clarion call for a dedicated clinical and research approach to post-acute care. J Am Med Dir Assoc. 2014;15(8):607. e1-e3. PubMed
3. Mor V, Intrator O, Feng Z, Grabowski D. The revolving door of rehospitalization from skilled nursing facilities. Health Aff. 2010;29(1):57-64. PubMed
4. Jencks SF, Williams MV, Coleman EA. Rehospitalizations among patients in the Medicare fee-for-service program. N Engl J Med. 2009;360(14):1418-1428. PubMed
5. Creditor MC. Hazards of hospitalization of the elderly. Ann Intern Med 1993;118(3):219-223. PubMed
6. Van Walraven C, Bennett C, Jennings A, Austin PC, Forester AJ. Proportion of hospital readmissions deemed avoidable: a systematic review. CMAJ. 2011;183(7):E391-E402. PubMed
7. Brenson RA, Paulus RA, Kalman NS. Medicare’s readmissions-reduction program – a positive alternative. N Engl J Med 2012;366(15):1364-1366. PubMed
8. Jack BW, Chetty VK, Anthony D, et al. A reengineered hospital discharge program to decrease rehospitalization: a randomized trial. Ann Intern Med. 2009;150(3):178-187. PubMed
9. Naylor MD, Brooten D, Campbell R, et al. Comprehensive discharge planning and home follow-up of hospitalized elders: a randomized clinical trial. JAMA. 1999;281(7):613-620. PubMed
10. Coleman EA, Parry C, Chalmers S, Min SJ. The care transition intervention: results of a randomized controlled trial. Arch Intern Med. 2006;166(17):1822-1828. PubMed
11. Patel A, Parikh R, Howell EH, Hsich E, Landers SH, Gorodeski EZ. Mini-cog performance: novel marker of post discharge risk among patients hospitalized for heart failure. Circ Heart Fail. 2015;8(1):8-16. PubMed
12. Walter LC, Brand RJ, Counsell SR, et al. Development and validation of a prognostic index for 1-year mortality in older adults after hospitalization. JAMA. 2001;285(23):2987-2994. PubMed
13. Allen LA, Hernandez AF, Peterson ED, et al. Discharge to a skilled nursing facility and subsequent clinical outcomes among older patients hospitalized for heart failure. Circ Heart Fail. 2011;4(3):293-300. PubMed
14. 42 CFR 483.40 – Physician services. US government Publishing Office. https://www.gpo.gov/fdsys/granule/CFR-2011-title42-vol5/CFR-2011-title42-vol5-sec483-40. Published October 1, 2011. Accessed August 31, 2016.
15. Office of Inspector General. Adverse Events in Skilled Nursing Facilities: National Incidence among Medicare Beneficiaries. OEI-06-11-00370. February 2014. http://oig.hhs.gov/oei/reports/oei-06-11-00370.pdf. Accessed March 22, 2016.
16. Hasan O, Meltzer DO, Shaykevich SA, et al. Hospital readmission in general medicine patients: a prediction model. J Gen Intern Med. 2010;25(3):211-219. PubMed
17. Boult C, Dowd B, McCaffrey D, Boult L, Hernandez R, Krulewitch H. Screening elders for risk of hospital admission. J Am Geriatr Soc. 1993;41(8):811-817. PubMed
18. Silverstein MD, Qin H, Mercer SQ, Fong J, Haydar Z. Risk factors for 30-day hospital readmission in patients ≥65 years of age. Proc (Bayl Univ Med Cent). 2008;21(4):363-372. PubMed
19. Donzé J, Aujesky D, Williams D, Schnipper JL. Potentially avoidable 30-day hospital readmissions in medical patients: derivation and validation of a prediction model. JAMA Intern Med. 2013;173(8):632-638. PubMed
20. Donzé JD, Williams MV, Robinson EJ, et al. International validity of the HOSPITAL score to predict 30-day potentially avoidable hospital readmissions. JAMA Intern Med. 2016;176(4):496-502. PubMed
21. Kim LD, Kou L, Messinger-Rapport BJ, Rothberg MB. Validation of the HOSPITAL score for 30-day all-cause readmissions of patients discharged to skilled nursing facilities. J Am Med Dir Assoc. 2016;17(9):e15-e18. PubMed
22. Kane RL, Keckhafer G, Flood S, Bershardsky B, Siadaty MS. The effect of Evercare on hospital use. J Am Geriatr Soc. 2003;51(10):1427-1434. PubMed
23. Ouslander JG, Lamb G, Tappen R, et al. Interventions to reduce hospitalizations from nursing homes: Evaluation of the INTERACT II collaboration quality improvement project. J Am Geriatr Soc. 2011;59(4):745-753. PubMed
24. Cost drivers for dually eligible beneficiaries: Potentially avoidable hospitalizations from nursing facility, skilled nursing facility, and home and community based service waiver programs. http://www.cms.gov/Research-Statistics-Data-and-Systems/Statistics-Trends-and-Reports/Reports/downloads/costdriverstask2.pdf. Accessed August 31, 2016.
25. H.R. 4302 (113th), Section 215, Protecting Access to Medicare Act of 2014 (PAMA). April 2, 2014. https://www.govtrack.us/congress/bills/113/hr4302/text. Accessed August 31, 2016.
Approximately 20% of hospitalized Medicare beneficiaries in the U.S. are discharged to skilled nursing facilities (SNFs) for post-acute care,1,2 and 23.5% of these patients are readmitted within 30 days.3 Because hospital readmissions are costly and associated with worse outcomes,4,5 30-day readmission rates are considered a quality indicator,6 and there are financial penalties for hospitals with higher than expected rates.7 As a result, hospitals invest substantial resources in programs to reduce readmissions.8-10 The SNFs represent an attractive target for readmission reduction efforts, since SNFs contribute a disproportionate share of readmissions.3,4 Because SNF patients are in a monitored environment with high medication adherence, risk factors for readmission likely differ between patients discharged to SNFs and those sent home. For example, 1 study showed that among heart failure patients with cognitive impairment, those discharged to SNFs had lower readmissions during the first 20 days, likely due to better medication adherence.11 Patients discharged to SNFs generally have more complex illnesses, lower functional status, and higher 1-year mortality than patients discharged to the community.12,13 Despite this, SNF patients might have infrequent contact with physicians. Federal regulations require only that patients discharged to SNFs need to be seen within 30 days and then at least once every 30 days thereafter.14 According to the 2014 Office of Inspector General report, one-third of Medicare beneficiaries in SNFs experience adverse events from substandard treatment, inadequate resident monitoring and failure or delay of necessary care, most of which are thought to be preventable.15
To address this issue, the Cleveland Clinic developed a program called “Connected Care SNF,” in which hospital-employed physicians and advanced practice professionals visit patients in selected SNFs 4 to 5 times per week, for the purpose of reducing preventable readmissions. The aim of this study was to assess whether the program reduced 30-day readmissions, and to identify which patients benefited most from the program.
METHODS
Setting and Intervention
The Cleveland Clinic main campus is a tertiary academic medical center with 1400 beds and approximately 50,000 admissions per year. In late 2012, the Cleveland Clinic implemented the Connected Care SNF program, wherein Cleveland Clinic physicians regularly visited patients who were discharged from the Cleveland Clinic main campus to 7 regional SNFs. Beginning in December 2012, these 7 high-volume referral SNFs that were not part of the Cleveland Clinic Health System (CCHS) agreed to participate in the program, which focused on reducing avoidable hospital readmissions and delivering quality care (Table 1). The Connected Care team, comprised of 2 geriatricians (1 of whom was also a palliative medicine specialist), 1 internist, 1 family physician, and 5 advanced practice professionals (nurse practitioners and physician assistants), provided medical services at the participating SNFs. These providers aimed to see patients 4 to 5 times per week, were available on site during working hours, and provided telephone coverage at nights and on weekends. All providers had access to hospital electronic medical records and could communicate with the discharging physician and with specialists familiar with the patient as needed. Prior to the admission, providers were informed about patient arrival and, at the time of admission to the SNF, providers reviewed medications and discussed goals of care with patients and their families. In the SNF, providers worked closely with staff members to deliver medications and timely treatment. They also met monthly with multidisciplinary teams for continuous quality improvement and to review outcomes. Patients at Connected Care SNFs who had their own physicians, including most long-stay and some short-stay residents, did not receive the Connected Care intervention. They constituted less than 10% of the patients discharged from Cleveland Clinic main campus.
Study Design and Population
We reviewed administrative and clinical data from a retrospective cohort of patients discharged to SNF from the Cleveland Clinic main campus from January 1, 2011 to December 31, 2014. We included all patients who were discharged to an SNF during the study period. Our main outcome measure was 30-day all-cause readmissions to any hospital in the Cleveland Clinic Health System (CCHS), including the main campus and 8 regional community hospitals. Study patients were followed until January 30, 2015 to capture 30-day readmissions. According to 2012 Medicare data, of CCHS patients who were readmitted within 30 days, 83% of pneumonia, 81% of major joint replacement, 72% of heart failure and 57% of acute myocardial infarction patients were readmitted to a CCHS facility. As the Cleveland Clinic main campus attracts cardiac patients from a 100+-mile radius, they may be more likely to seek care readmission near home and are not reflective of CCHS patients overall. Because we did not have access to readmissions data from non-CCHS hospitals, we excluded patients who were discharged to SNFs beyond a 25-mile radius from the main campus, where they may be more likely to utilize non-CCHS hospitals for acute hospitalization. We also excluded patients discharged to non-CCHS hospital-based SNFs, which may refer readmissions to their own hospital system. Because the Connected Care program began in December 2012, the years 2011-2012 served as the baseline period. The intervention was conducted at 7 SNFs. All other SNFs within the 25-mile radius were included as controls, except for 3 hospital-based SNFs that would be unlikely to admit patients to CCHS. We compared the change in all-cause 30-day readmission rates after implementation of Connected Care, using all patients discharged to SNFs within 25 miles to control for temporal changes in local readmission rates. Discharge to specific SNFs was determined solely by patient choice.
Data Collection
For each patient, we collected the following data that has been shown to be associated with readmissions:16-18 demographics (age, race, sex, ZIP code), lab values on discharge (hemoglobin and sodium); hemodialysis status; medicine or surgical service; elective surgery or nonelective surgery; details of the index admission index (diagnosis-related group [DRG], Medicare severity-diagnosis-related groups [MS-DRG] weight, primary diagnosis code; principal procedure code; admission date; discharge date, length of stay, and post-acute care provider); and common comorbidities, as listed in Table 2. We also calculated each patient’s HOSPITAL19,20 score. The HOSPITAL score was developed to predict risk of preventable 30-day readmissions,19 but it has also been validated to predict 30-day all-cause readmission rates for patients discharged to SNF.21 The model contains 7 elements (hemoglobin, oncology service, sodium, procedure, index type, admissions within the last year, length of stay) (supplemental Table).Patients with a high score (7 or higher) have a 41% chance of readmission, while those with a low score (4 or lower) have only a 15% chance. 21 We assessed all cause 30-day readmission status from CCHS administrative data. Observation patients and outpatient same-day surgeries were not considered to be admissions. For patients with multiple admissions, each admission was counted as a separate index hospitalization. Cleveland Clinic’s Institutional Review Board approved the study.
Statistical Analysis
For the 7 intervention SNFs, patient characteristics were summarized as means and standard deviations or frequencies and percentages for the periods of 2011-2012 and 2013-2014, respectively, and the 2 periods were compared using the Student t test or χ2 test as appropriate.
Mixed-effects logistic regression models were used to model 30-day readmission rates. Since the intervention was implemented in the last quarter of 2012, we examined the difference in readmission rates before and after that time point. The model included the following fixed effects: SNF type (intervention or usual care), time points (quarters of 2011-2014), whether the time is pre- or postintervention (binary), and the 3-way interaction between SNF type, pre- or postintervention and time points, and patient characteristics. The model also contained a Gaussian random effect at the SNF level to account for possible correlations among the outcomes of patients from the same SNF. For each quarter, the mean adjusted readmission rates of 2 types of SNFs were calculated from the fitted mixed models and plotted over time. Furthermore, we compared the mean readmission rates of the 2 groups in the pre- and postintervention periods. Subgroup analyses were performed for medical and surgical patients, and for patients in the low, intermediate and high HOSPITAL score groups.
All analyses were performed using RStudio (Boston, Massachusetts). Statistical significance was established with 2-sided P values less than 0.05.
RESULTS
We identified 119 SNFs within a 25-mile radius of the hospital. Of these, 6 did not receive any referrals. Three non-CCHS hospital-based SNFs were excluded, leaving a total of 110 SNFs in the study sample: 7 intervention SNFs and 103 usual-care SNFs. Between January 2011 and December 2014, there were 23,408 SNF discharges from Cleveland Clinic main campus, including 13,544 who were discharged to study SNFs (Supplemental Figure). Of these, 3334 were discharged to 7 intervention SNFs and 10,210 were discharged to usual care SNFs. Characteristics of patients in both periods appear in Table 2. At baseline, patients in the intervention and control SNFs varied in a number of ways. Patients at intervention SNFs were older (75.6 vs. 70.2 years; P < 0.001), more likely to be African American (45.5% vs. 35.9%; P < 0.001), female (61% vs. 55.4%; P < 0.001) and to be insured by Medicare (85.2% vs. 71.4%; P < 0.001). Both groups had similar proportions of patients with high, intermediate, and low readmission risk as measured by HOSPITAL score. Compared to the 2011-2012 pre-intervention period, during the 2013-2014 intervention period, there were more surgeries (34.3% vs. 41.9%; P < 0.001), more elective surgeries (21.8% vs. 25.5%; P = 0.01), fewer medical patients (65.7% vs. 58.1%; P < 0.001), and an increase in comorbidities, including myocardial infarction, peripheral vascular disease, and liver disease (Table 2).
Table 3 shows adjusted 30-day readmissions rates, before and during the intervention period at the intervention and usual care SNFs. Compared to the pre-intervention period, 30-day all-cause adjusted readmission rates declined in the intervention SNFs (28.1% to 21.7%, P < 0.001), while it increased slightly at control sites (27.1% to 28.5%, P < 0.001). The Figure shows the adjusted 30-day readmission rates by quarter throughout the study period.
Declines in 30-day readmission rates were greater for medical patients (31.0% to 24.6%, P < 0.001) than surgical patients (22.4% to 17.7%, P < 0.001). Patients with high HOSPITAL scores had the greatest decline, while those with low HOSPITAL scores had smaller declines.
DISCUSSION
In this retrospective study of 4 years of discharges to 110 SNFs, we report on the impact of a Connected Care program, in which a physician visited patients on admission to the SNF and 4 to 5 times per week during their stay. Introduction of the program was followed by a 6.8% absolute reduction in all-cause 30-day readmission rates compared to usual care. The absolute reductions ranged from 4.6% for patients at low risk for readmission to 9.1% for patients at high risk, and medical patients benefited more than surgical patients.
Most studies of interventions to reduce hospital readmissions have focused on patients discharged to the community setting.7-9 Interventions have centered on discharge planning, medication reconciliation, and close follow-up to assess for medication adherence and early signs of deterioration. Because patients in SNFs have their medications administered by staff and are under frequent surveillance, such interventions are unlikely to be helpful in this population. We found no studies that focus on short-stay or skilled patients discharged to SNF. Two studies have demonstrated that interventions can reduce hospitalization from nursing homes.22,23 Neither study included readmissions. The Evercare model consisted of nurse practitioners providing active primary care services within the nursing home, as well as offering incentive payments to nursing homes for not hospitalizing patients.22 During a 2-year period, long term residents who enrolled in Evercare had an almost 50% reduction in incident hospitalizations compared to those who did not.22 INTERACT II was a quality improvement intervention that provided tools, education, and strategies to help identify and manage acute conditions proactively.23 In 25 nursing homes employing INTERACT II, there was a 17% reduction in self-reported hospital admissions during the 6-month project, with higher rates of reduction among nursing homes rated as more engaged in the process.23 Although nursing homes may serve some short-stay or skilled patients, they generally serve long-term populations, and studies have shown that short-stay patients are at higher risk for 30-day readmissions.24
There are a number of reasons that short-term SNF patients are at higher risk for readmission. Although prior to admission, they were considered hospital level of care and received a physician visit daily, on transfer to the SNF, relatively little medical care is available. Current federal regulations regarding physician services at a SNF require the resident to be seen by a physician at least once every 30 days for the first 90 days after admission, and at least once every 60 days thereafter.25
The Connected Care program physicians provided a smooth transition of care from hospital to SNF as well as frequent reassessment. Physicians were alerted prior to hospital discharge and performed an initial comprehensive visit generally on the day of admission to the SNF and always within 48 hours. The initial evaluation is important because miscommunication during the handoff from hospital to SNF may result in incorrect medication regimens or inaccurate assessments. By performing prompt medication reconciliation and periodic reassessments of a patient’s medical condition, the Connected Care providers recreate some of the essential elements of successful outpatient readmissions prevention programs.
They also worked together with each SNF’s interdisciplinary team to deliver quality care. There were monthly meetings at each participating Connected Care SNF. Physicians reviewed monthly 30-day readmissions and performed root-cause analysis. When they discovered challenges to timely medication and treatment delivery during daily rounds, they provided in-services to SNF nurses.
In addition, Connected Care providers discussed goals of care—something that is often overlooked on admission to a SNF. This is particularly important because patients with chronic illnesses who are discharged to SNF often have poor prognoses. For example, Medicare patients with heart failure who are discharged to SNFs have 1-year mortality in excess of 50%.13 By implementing a plan of care consistent with patient and family goals, inappropriate readmissions for terminal patients may be avoided.
Reducing readmissions is important for hospitals because under the Hospital Readmissions Reduction Program, hospitals now face substantial penalties for higher than expected readmissions rates. Hospitals involved in bundled payments or other total cost-of-care arrangements have additional incentive to avoid readmissions. Beginning in 2019, SNFs will also receive incentive payments based on their 30-day all-cause hospital readmissions as part of the Skilled Nursing Facility Value-Based Purchasing program.25 The Connected Care model offers 1 means of achieving this goal through partnership between hospitals and SNFs.
Our study has several limitations. First, our study was observational in nature, so the observed reduction in readmissions could have been due to temporal trends unrelated to the intervention. However, no significant reduction was noted during the same time period in other area SNFs. There was also little change in the characteristics of patients admitted to the intervention SNFs. Importantly, the HOSPITAL score, which can predict 30-day readmission rates,20 did not change throughout the study period. Second, the results reflect patients discharged from a single hospital and may not be generalizable to other geographic areas. However, because the program included 7 SNFs, we believe it could be reproduced in other settings. Third, our readmissions measure included only those patients who returned to a CCHS facility. Although we may have missed some readmissions to other hospital systems, such leakage is uncommon—more than 80% of CCHS patients are readmitted to CCHS facilities—and would be unlikely to differ across the short duration of the study. Finally, at the intervention SNFs, most long-stay and some short-stay residents did not receive the Connected Care intervention because they were cared for by their own physicians who did not participate in Connected Care. Had these patients’ readmissions been excluded from our results, the intervention might appear even more effective.
CONCLUSION
A Connected Care intervention reduced 30-day readmission rates among patients discharged to SNFs from a tertiary academic center. While all subgroups had substantial reductions in readmissions following the implementation of the intervention, patients who are at the highest risk of readmission benefited the most. Further study is necessary to know whether Connected Care can be reproduced in other health care systems and whether it reduces overall costs.
Acknowledgments
The authors would like to thank Michael Felver, MD, and teams for their clinical care of patients; Michael Felver, MD, William Zafirau, MD, Dan Blechschmid, MHA, and Kathy Brezine, and Seth Vilensky, MBA, for their administrative support; and Brad Souder, MPT, for assistance with data collection.
Disclosure
Nothing to report.
1. Medicare Payment Advisory Commission. Report to the Congress: Medicare Payment Policy. Chapter 8. Skilled Nursing Facility Services. March 2013. http://www.medpac.gov/docs/default-source/reports/mar13_entirereport.pdf?sfvrsn=0. Accessed March 1, 2017.
2. Kim DG, Messinger-Rapport BJ. Clarion call for a dedicated clinical and research approach to post-acute care. J Am Med Dir Assoc. 2014;15(8):607. e1-e3. PubMed
3. Mor V, Intrator O, Feng Z, Grabowski D. The revolving door of rehospitalization from skilled nursing facilities. Health Aff. 2010;29(1):57-64. PubMed
4. Jencks SF, Williams MV, Coleman EA. Rehospitalizations among patients in the Medicare fee-for-service program. N Engl J Med. 2009;360(14):1418-1428. PubMed
5. Creditor MC. Hazards of hospitalization of the elderly. Ann Intern Med 1993;118(3):219-223. PubMed
6. Van Walraven C, Bennett C, Jennings A, Austin PC, Forester AJ. Proportion of hospital readmissions deemed avoidable: a systematic review. CMAJ. 2011;183(7):E391-E402. PubMed
7. Brenson RA, Paulus RA, Kalman NS. Medicare’s readmissions-reduction program – a positive alternative. N Engl J Med 2012;366(15):1364-1366. PubMed
8. Jack BW, Chetty VK, Anthony D, et al. A reengineered hospital discharge program to decrease rehospitalization: a randomized trial. Ann Intern Med. 2009;150(3):178-187. PubMed
9. Naylor MD, Brooten D, Campbell R, et al. Comprehensive discharge planning and home follow-up of hospitalized elders: a randomized clinical trial. JAMA. 1999;281(7):613-620. PubMed
10. Coleman EA, Parry C, Chalmers S, Min SJ. The care transition intervention: results of a randomized controlled trial. Arch Intern Med. 2006;166(17):1822-1828. PubMed
11. Patel A, Parikh R, Howell EH, Hsich E, Landers SH, Gorodeski EZ. Mini-cog performance: novel marker of post discharge risk among patients hospitalized for heart failure. Circ Heart Fail. 2015;8(1):8-16. PubMed
12. Walter LC, Brand RJ, Counsell SR, et al. Development and validation of a prognostic index for 1-year mortality in older adults after hospitalization. JAMA. 2001;285(23):2987-2994. PubMed
13. Allen LA, Hernandez AF, Peterson ED, et al. Discharge to a skilled nursing facility and subsequent clinical outcomes among older patients hospitalized for heart failure. Circ Heart Fail. 2011;4(3):293-300. PubMed
14. 42 CFR 483.40 – Physician services. US government Publishing Office. https://www.gpo.gov/fdsys/granule/CFR-2011-title42-vol5/CFR-2011-title42-vol5-sec483-40. Published October 1, 2011. Accessed August 31, 2016.
15. Office of Inspector General. Adverse Events in Skilled Nursing Facilities: National Incidence among Medicare Beneficiaries. OEI-06-11-00370. February 2014. http://oig.hhs.gov/oei/reports/oei-06-11-00370.pdf. Accessed March 22, 2016.
16. Hasan O, Meltzer DO, Shaykevich SA, et al. Hospital readmission in general medicine patients: a prediction model. J Gen Intern Med. 2010;25(3):211-219. PubMed
17. Boult C, Dowd B, McCaffrey D, Boult L, Hernandez R, Krulewitch H. Screening elders for risk of hospital admission. J Am Geriatr Soc. 1993;41(8):811-817. PubMed
18. Silverstein MD, Qin H, Mercer SQ, Fong J, Haydar Z. Risk factors for 30-day hospital readmission in patients ≥65 years of age. Proc (Bayl Univ Med Cent). 2008;21(4):363-372. PubMed
19. Donzé J, Aujesky D, Williams D, Schnipper JL. Potentially avoidable 30-day hospital readmissions in medical patients: derivation and validation of a prediction model. JAMA Intern Med. 2013;173(8):632-638. PubMed
20. Donzé JD, Williams MV, Robinson EJ, et al. International validity of the HOSPITAL score to predict 30-day potentially avoidable hospital readmissions. JAMA Intern Med. 2016;176(4):496-502. PubMed
21. Kim LD, Kou L, Messinger-Rapport BJ, Rothberg MB. Validation of the HOSPITAL score for 30-day all-cause readmissions of patients discharged to skilled nursing facilities. J Am Med Dir Assoc. 2016;17(9):e15-e18. PubMed
22. Kane RL, Keckhafer G, Flood S, Bershardsky B, Siadaty MS. The effect of Evercare on hospital use. J Am Geriatr Soc. 2003;51(10):1427-1434. PubMed
23. Ouslander JG, Lamb G, Tappen R, et al. Interventions to reduce hospitalizations from nursing homes: Evaluation of the INTERACT II collaboration quality improvement project. J Am Geriatr Soc. 2011;59(4):745-753. PubMed
24. Cost drivers for dually eligible beneficiaries: Potentially avoidable hospitalizations from nursing facility, skilled nursing facility, and home and community based service waiver programs. http://www.cms.gov/Research-Statistics-Data-and-Systems/Statistics-Trends-and-Reports/Reports/downloads/costdriverstask2.pdf. Accessed August 31, 2016.
25. H.R. 4302 (113th), Section 215, Protecting Access to Medicare Act of 2014 (PAMA). April 2, 2014. https://www.govtrack.us/congress/bills/113/hr4302/text. Accessed August 31, 2016.
© 2017 Society of Hospital Medicine