User login
Length of Stay and Readmission After Total Shoulder Arthroplasty: An Analysis of 1505 Cases
Use of total shoulder arthroplasty (TSA) and reverse TSA for shoulder conditions has increased dramatically in recent years.1 Approximately 27,000 standard TSAs were performed in the United States in 2008, and this number is expected to double by 2015.2 TSA provides excellent pain relief, restoration of function, and patient satisfaction.3 The evolution of implant design over the past 25 years has contributed to excellent long-term implant survival, with rates comparable to those of total knee and hip arthroplasty.4 Similarly, compared with previous designs, contemporary designs and techniques have resulted in fewer complications.5
Several studies have investigated the long-term complications of TSA. These complications include prosthetic loosening, instability, periprosthetic fracture, rotator cuff tears, nerve injury, and deltoid dysfunction.6-11 In addition, Waterman and colleagues11 very recently assessed the influence of risk factors on short-term postoperative complications of TSA. However, none of these studies has assessed the influence of multiple risk factors on postoperative length of stay (LOS) after TSA. Only 1 study, using data from 2005 and earlier, has analyzed the potential effect of multiple patient characteristics on readmission after TSA12; other studies have been only descriptive.13-16
We conducted a retrospective cohort study to characterize the risk factors for extended LOS and readmission after TSA in a large sample of patients drawn from a national database. We hypothesized that patient factors, including age, sex, and obesity, would be significantly associated with postoperative LOS and readmission after TSA. National databases have been increasingly used in orthopedic research, as they offer particular advantages. Large sample sizes allow for powerful analyses of associations—analyses previously not possible in single-surgeon and single-institution studies. In addition, use of a large, national patient sample allows us to draw generalizable conclusions to better define patients’ and physicians’ postoperative expectations.
Methods
We conducted a retrospective cohort study using the American College of Surgeons National Surgical Quality Improvement Program (ACS-NSQIP) database. ACS-NSQIP collects 150 patient variables from 374 participating US hospitals.17 Patients are prospectively identified, and information is collected from operative reports, medical records, and patient interviews by trained clinical reviewers.17,18 Routine auditing by the program ensures high-quality data, with reported interrater disagreement below 2% for all variables. Data are collected through the 30th postoperative day, including after discharge.
This study was granted an exemption from our institutional review board, as we used a deidentified and publicly available database. Patients who were 60 years or older and underwent TSA between 2011 and 2012 were identified in the ACS-NSQIP database. TSA patients were identified using Current Procedural Terminology (CPT) code 23472, which includes TSA and reverse TSA procedures.
Patients were divided into groups based on surgical indications, which were available as International Classification of Diseases, Ninth Revision (ICD-9) diagnosis codes. Patients with postoperative ICD-9 codes 714.0 (rheumatoid arthritis), 715.0-9 (osteoarthritis), 716.61/716.81/716.91 (unspecified arthropathy), 718.01 (articular cartilage disorder), 718.31 (recurrent dislocation of shoulder), 718.81 (other joint derangement of shoulder), 719.41/719.91 (unspecified shoulder pain/disorder), 726.0-2 (disorder of shoulder tendons and bursa), 727.61 (rotator cuff rupture), and 840.3-9 (rotator cuff sprain) were classified as having a nonfracture indication. Patients with postoperative ICD-9 codes 716.11 (traumatic arthropathy), 833.80-89 (malunion/nonunion of fracture), and 812.00-20 (fracture of proximal humerus) were classified as having a fracture-associated indication. Patients with incomplete perioperative data were excluded from the study, leaving 1505 patients for the study (out of an initial 1726).
Patient characteristics, including sex, age, height, weight, and history of smoking, were collected from the ACS-NSQIP database. Body mass index (BMI) was calculated from each patient’s height and weight. Information about medical comorbidities was also collected from the ACS-NSQIP database. History of pulmonary disease was defined as a history of dyspnea, severe chronic obstructive pulmonary disease, ventilator-assisted respiration within 48 hours before surgery, or current pneumonia. History of heart disease was defined as a history of congestive heart failure or angina within 1 month before admission, myocardial infarction within 6 months before admission, cardiac surgery, or percutaneous coronary intervention. American Society of Anesthesiologists (ASA) class 3 or higher indicates severe systemic disease. Steroid use was defined as regular administration of corticosteroid medications within 30 days before surgery. Functional status was defined as the ability to perform activities of daily living (ADLs) within 30 days before surgery, with the patient’s best functional status during this period recorded. Similar to how other variables were collected from the database, this information was obtained through medical record abstraction and patient interviews by trained personnel. ADLs are defined in the ACS-NSQIP as “activities usually performed in the course of a normal day in a person’s life” and include bathing, feeding, dressing, toileting, and mobility. An independent patient does not require assistance for any ADLs, a partially dependent patient requires assistance for some ADLs, and a totally dependent patient requires assistance in completing all ADLs. Partially and totally dependent patients were grouped for analysis. Information about a patient’s discharge destination (to home or a facility) was also available in the database.17
Extended Length of Stay
Extended LOS was defined as a binary variable that was positive when the postoperative LOS exceeded the 90th percentile LOS. The 90th percentile LOS was chosen as a cutoff to account for normal variations in LOS and differing practices of surgeons while still capturing patients with abnormally extended LOS.
Readmission
Readmission was defined as a binary variable that was positive when a patient had an unplanned readmission 1 or more times after the initial postoperative discharge.
Patient Demographics
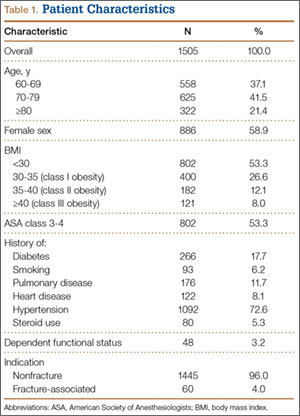
Table 1 summarizes the demographics and comorbidities of the 1505 TSA patients who met our study inclusion criteria. Mean age was 72.8 years (range, 60-90 years). Mean BMI was 30.3 kg/m2 (range, 15.7-63.9 kg/m2); 46.7% of patients were classified as obese (BMI, ≥30 kg/m2). The cohort was 58.9% female. Four percent of patients underwent TSA for a fracture-associated indication.
Statistical Analyses
Statistical analyses were performed with Stata 11.2 (StataCorp). Bivariate and multivariate analyses were used to test patient characteristics for association with extended LOS and readmission. Discharge destination and LOS were included in the readmission analysis because this information would be available at time of discharge and would be useful to include in a model that predicts odds of readmission.
Final multivariate models were constructed using a backward stepwise process that initially included all potential variables and sequentially excluded variables with the highest P value until only those with P < .20 remained. Variables with .05 < P < .20 were left in the model to control for potential confounding but were not considered significantly associated with the outcome. All tests were 2-tailed, and the statistical difference was established at a 2-sided α level of 0.05 (P < .05).
Results
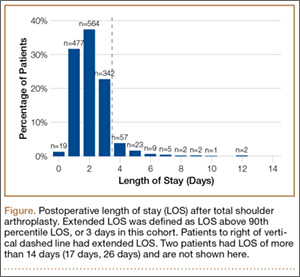
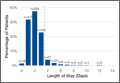
Median LOS after TSA was 2 days (interquartile range, 1-3 days), and extended LOS was defined as LOS of more than 3 days (90th percentile LOS). The distribution of LOS is depicted in the Figure. Results of the bivariate and multivariate analyses are reported in Table 2 and Table 3, respectively. Bivariate analysis revealed an association between extended LOS and increased age, ASA class 3 or higher, and history of diabetes, pulmonary disease, and heart disease. On multivariate analysis, extended LOS was associated with age 70 to 79 years (odds ratio [OR], 1.71; 95% confidence interval [CI], 1.01-2.95; P = .049), age 80 years or older (OR, 3.38; 95% CI, 1.94-5.91; P < .001), and history of diabetes (OR, 2.37; 95% CI, 1.53-3.66; P < .001).
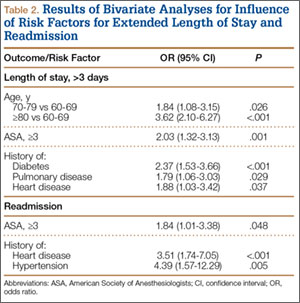
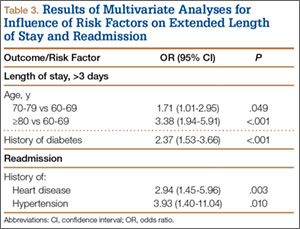
Forty-nine patients (3.3%) were readmitted within the first 30 postoperative days. Bivariate analysis revealed an association between readmission and ASA class 3 or higher, history of heart disease, and history of hypertension. On multivariate analysis, readmission was associated only with history of heart disease (OR, 2.94; 95% CI, 1.45-5.96; P = .003) and history of hypertension (OR, 3.93; 95% CI, 1.40-11.04; P = .010).
Discussion
In the United States, TSA has become increasingly popular because of its favorable outcomes and continued implant development.1-5 However, there is a shortage of information about risk factors for short-term outcomes after TSA. In this study, we used multivariate analyses to identify patient-related factors associated with extended LOS and readmission after discharge. By identifying these factors, we can improve the preoperative discussion and postoperative planning for this procedure.
In the present study, extended LOS (>3 days) was found to be associated with older age and history of diabetes. The TSA literature has little information that can be used to compare these results, though age over 80 years was previously described as a risk factor for extended LOS after TSA.19 Uncontrolled diabetes has been identified as a risk factor for extended LOS in hip and knee arthroplasty,20 and management of diabetes may similarly complicate postoperative care, leading to extended LOS and increased costs in TSA patients. Patients with the identified risk factors for extended LOS should be counseled before surgery. In addition, this is important information for health care organizations and providers.
Readmission within 30 days after TSA was found to be independently associated with history of heart disease and history of hypertension. Similar to factors affecting LOS, patient-related risk factors for readmission are also poorly defined in the TSA literature. In total hip arthroplasty patients, heart disease has been found to be associated with readmission.21,22 Hypertension has also been associated with readmission for other orthopedic procedures.23 Results of the present study indicate these comorbidities may increase the risk for complications after discharge. It is important to note, however, that LOS did not correlate with readmission rates, indicating patients are likely being discharged at the most clinically appropriate time.
Waterman and colleagues11 very recently identified (in the ACS-NSQIP database) a patient population that underwent TSA between 2006 and 2011 to describe risk factors for postoperative complications within 30 days. They found that comorbid cardiac disease and older age were independently associated with mortality. Interestingly, the present study identified older age as associated with extended LOS, and cardiac disease as associated with readmission. Together with the results from the previous study, age and cardiac disease seem to be important patient factors to consider when planning TSA, as they are associated with a significantly worse postoperative course.
This study had several limitations. First, given the nature of the ACS-NSQIP database, readmissions are recorded only up to 30 days after surgery, including after discharge. Second, though the ACS-NSQIP tries to collect as many patient variables as possible, some information is not captured. Additional variables that could potentially affect LOS and readmission (eg, insurance status, hospital volume) were not available for analysis. However, we think the high-quality data collection process used by the ACS-NSQIP outweighs the lack of certain variables. Third, original operative notes are not available in the ACS-NSQIP database, and the only way to identify operative procedures is to check CPT codes. Unfortunately, CPT code 23472 is used for both TSA and reverse TSA, so these procedures could not be separated for analysis, and the results of this study can be used to comment only on the risks of both procedures. Another limitation is that there were not enough patients to further analyze the data by each indication.
Conclusion
With the increasing popularity of TSA for an expanding set of indications, it is important to understand the factors that can affect the postoperative course. In this study, we found several patient-related risk factors for extended LOS and readmission. Although the identified factors are generally not modifiable, this information can be used to better define the expectations of patients, providers, and organizations for this increasingly common procedure.
1. Kim SH, Wise BL, Zhang Y, Szabo RM. Increasing incidence of shoulder arthroplasty in the United States. J Bone Joint Surg Am. 2011;93(24):2249-2254.
2. Day JS, Lau E, Ong KL, Williams GR, Ramsey ML, Kurtz SM. Prevalence and projections of total shoulder and elbow arthroplasty in the United States to 2015. J Shoulder Elbow Surg. 2010;19(8):1115-1120.
3. Adams JE, Sperling JW, Hoskin TL, Melton LJ 3rd, Cofield RH. Shoulder arthroplasty in Olmsted County, Minnesota, 1976–2000: a population-based study. J Shoulder Elbow Surg. 2006;15(1):50-55.
4. Farmer KW, Hammond JW, Queale WS, Keyurapan E, McFarland EG. Shoulder arthroplasty versus hip and knee arthroplasties: a comparison of outcomes. Clin Orthop Relat Res. 2007;(455):183-189.
5. Chin PY, Sperling JW, Cofield RH, Schleck C. Complications of total shoulder arthroplasty: are they fewer or different? J Shoulder Elbow Surg. 2006;15(1):19-22.
6. Bohsali KI, Wirth MA, Rockwood CA Jr. Complications of total shoulder arthroplasty. J Bone Joint Surg Am. 2006;88(10):2279-2292.
7. Torchia ME, Cofield RH, Settergren CR. Total shoulder arthroplasty with the Neer prosthesis: long-term results. J Shoulder Elbow Surg. 1997;6(6):495-505.
8. Sneppen O, Fruensgaard S, Johannsen HV, Olsen BS, Søjbjerg JO, Andersen NH. Total shoulder replacement in rheumatoid arthritis: proximal migration and loosening. J Shoulder Elbow Surg. 1996;5(1):47-52.
9. Søjbjerg JO, Frich LH, Johannsen HV, Sneppen O. Late results of total shoulder replacement in patients with rheumatoid arthritis. Clin Orthop Relat Res. 1999;(366):39-45.
10. Raiss P, Bruckner T, Rickert M, Walch G. Longitudinal observational study of total shoulder replacements with cement: fifteen to twenty-year follow-up. J Bone Joint Surg Am. 2014;96(3):198-205.
11. Waterman BR, Dunn JC, Bader J, Urrea L, Schoenfeld AJ, Belmont PJ Jr. Thirty-day morbidity and mortality after elective total shoulder arthroplasty: patient-based and surgical risk factors. J Shoulder Elbow Surg. 2015;24(1):24-30.
12. Farng E, Zingmond D, Krenek L, Soohoo NF. Factors predicting complication rates after primary shoulder arthroplasty. J Shoulder Elbow Surg. 2011;20(4):557-563.
13. Streubel PN, Simone JP, Sperling JW, Cofield R. Thirty and ninety-day reoperation rates after shoulder arthroplasty. J Bone Joint Surg Am. 2014;96(3):e17.
14. Mahoney A, Bosco JA 3rd, Zuckerman JD. Readmission after shoulder arthroplasty. J Shoulder Elbow Surg. 2014;23(3):377-381.
15. Gay DM, Lyman S, Do H, Hotchkiss RN, Marx RG, Daluiski A. Indications and reoperation rates for total elbow arthroplasty: an analysis of trends in New York state. J Bone Joint Surg Am. 2012;94(2):110-117.
16. Zumstein MA, Pinedo M, Old J, Boileau P. Problems, complications, reoperations, and revisions in reverse total shoulder arthroplasty: a systematic review. J Shoulder Elbow Surg. 2011;20(1):146-157.
17. American College of Surgeons. User Guide for the 2012 ACS NSQIP Participant Use Data File. https://www.facs.org/~/media/files/quality%20programs/nsqip/ug12.ashx. Published October 2013. Accessed June 21, 2015.
18. Khuri SF, Henderson WG, Daley J, et al; Principal Investigators of Patient Safety in Surgery Study. Successful implementation of the Department of Veterans Affairs’ National Surgical Quality Improvement Program in the private sector: the Patient Safety in Surgery study. Ann Surg. 2008;248(2):329-336.
19. Ricchetti ET, Abboud JA, Kuntz AF, Ramsey ML, Glaser DL, Williams GR Jr. Total shoulder arthroplasty in older patients: increased perioperative morbidity? Clin Orthop Relat Res. 2011;469(4):1042-1049.
20. Marchant MH Jr, Viens NA, Cook C, Vail TP, Bolognesi MP. The impact of glycemic control and diabetes mellitus on perioperative outcomes after total joint arthroplasty. J Bone Joint Surg Am. 2009;91(7):1621-1629.
21. Schairer WW, Sing DC, Vail TP, Bozic KJ. Causes and frequency of unplanned hospital readmission after total hip arthroplasty. Clin Orthop Relat Res. 2014;472(2):464-470.
22. Vorhies JS, Wang Y, Herndon J, Maloney WJ, Huddleston JI. Readmission and length of stay after total hip arthroplasty in a national Medicare sample. J Arthroplasty. 2011;26(6 suppl):119-123.
23. Lovecchio F, Hsu WK, Smith TR, Cybulski G, Kim B, Kim JY. Predictors of thirty-day readmission after anterior cervical fusion. Spine. 2014;39(2):127-133.
Use of total shoulder arthroplasty (TSA) and reverse TSA for shoulder conditions has increased dramatically in recent years.1 Approximately 27,000 standard TSAs were performed in the United States in 2008, and this number is expected to double by 2015.2 TSA provides excellent pain relief, restoration of function, and patient satisfaction.3 The evolution of implant design over the past 25 years has contributed to excellent long-term implant survival, with rates comparable to those of total knee and hip arthroplasty.4 Similarly, compared with previous designs, contemporary designs and techniques have resulted in fewer complications.5
Several studies have investigated the long-term complications of TSA. These complications include prosthetic loosening, instability, periprosthetic fracture, rotator cuff tears, nerve injury, and deltoid dysfunction.6-11 In addition, Waterman and colleagues11 very recently assessed the influence of risk factors on short-term postoperative complications of TSA. However, none of these studies has assessed the influence of multiple risk factors on postoperative length of stay (LOS) after TSA. Only 1 study, using data from 2005 and earlier, has analyzed the potential effect of multiple patient characteristics on readmission after TSA12; other studies have been only descriptive.13-16
We conducted a retrospective cohort study to characterize the risk factors for extended LOS and readmission after TSA in a large sample of patients drawn from a national database. We hypothesized that patient factors, including age, sex, and obesity, would be significantly associated with postoperative LOS and readmission after TSA. National databases have been increasingly used in orthopedic research, as they offer particular advantages. Large sample sizes allow for powerful analyses of associations—analyses previously not possible in single-surgeon and single-institution studies. In addition, use of a large, national patient sample allows us to draw generalizable conclusions to better define patients’ and physicians’ postoperative expectations.
Methods
We conducted a retrospective cohort study using the American College of Surgeons National Surgical Quality Improvement Program (ACS-NSQIP) database. ACS-NSQIP collects 150 patient variables from 374 participating US hospitals.17 Patients are prospectively identified, and information is collected from operative reports, medical records, and patient interviews by trained clinical reviewers.17,18 Routine auditing by the program ensures high-quality data, with reported interrater disagreement below 2% for all variables. Data are collected through the 30th postoperative day, including after discharge.
This study was granted an exemption from our institutional review board, as we used a deidentified and publicly available database. Patients who were 60 years or older and underwent TSA between 2011 and 2012 were identified in the ACS-NSQIP database. TSA patients were identified using Current Procedural Terminology (CPT) code 23472, which includes TSA and reverse TSA procedures.
Patients were divided into groups based on surgical indications, which were available as International Classification of Diseases, Ninth Revision (ICD-9) diagnosis codes. Patients with postoperative ICD-9 codes 714.0 (rheumatoid arthritis), 715.0-9 (osteoarthritis), 716.61/716.81/716.91 (unspecified arthropathy), 718.01 (articular cartilage disorder), 718.31 (recurrent dislocation of shoulder), 718.81 (other joint derangement of shoulder), 719.41/719.91 (unspecified shoulder pain/disorder), 726.0-2 (disorder of shoulder tendons and bursa), 727.61 (rotator cuff rupture), and 840.3-9 (rotator cuff sprain) were classified as having a nonfracture indication. Patients with postoperative ICD-9 codes 716.11 (traumatic arthropathy), 833.80-89 (malunion/nonunion of fracture), and 812.00-20 (fracture of proximal humerus) were classified as having a fracture-associated indication. Patients with incomplete perioperative data were excluded from the study, leaving 1505 patients for the study (out of an initial 1726).
Patient characteristics, including sex, age, height, weight, and history of smoking, were collected from the ACS-NSQIP database. Body mass index (BMI) was calculated from each patient’s height and weight. Information about medical comorbidities was also collected from the ACS-NSQIP database. History of pulmonary disease was defined as a history of dyspnea, severe chronic obstructive pulmonary disease, ventilator-assisted respiration within 48 hours before surgery, or current pneumonia. History of heart disease was defined as a history of congestive heart failure or angina within 1 month before admission, myocardial infarction within 6 months before admission, cardiac surgery, or percutaneous coronary intervention. American Society of Anesthesiologists (ASA) class 3 or higher indicates severe systemic disease. Steroid use was defined as regular administration of corticosteroid medications within 30 days before surgery. Functional status was defined as the ability to perform activities of daily living (ADLs) within 30 days before surgery, with the patient’s best functional status during this period recorded. Similar to how other variables were collected from the database, this information was obtained through medical record abstraction and patient interviews by trained personnel. ADLs are defined in the ACS-NSQIP as “activities usually performed in the course of a normal day in a person’s life” and include bathing, feeding, dressing, toileting, and mobility. An independent patient does not require assistance for any ADLs, a partially dependent patient requires assistance for some ADLs, and a totally dependent patient requires assistance in completing all ADLs. Partially and totally dependent patients were grouped for analysis. Information about a patient’s discharge destination (to home or a facility) was also available in the database.17
Extended Length of Stay
Extended LOS was defined as a binary variable that was positive when the postoperative LOS exceeded the 90th percentile LOS. The 90th percentile LOS was chosen as a cutoff to account for normal variations in LOS and differing practices of surgeons while still capturing patients with abnormally extended LOS.
Readmission
Readmission was defined as a binary variable that was positive when a patient had an unplanned readmission 1 or more times after the initial postoperative discharge.
Patient Demographics
Table 1 summarizes the demographics and comorbidities of the 1505 TSA patients who met our study inclusion criteria. Mean age was 72.8 years (range, 60-90 years). Mean BMI was 30.3 kg/m2 (range, 15.7-63.9 kg/m2); 46.7% of patients were classified as obese (BMI, ≥30 kg/m2). The cohort was 58.9% female. Four percent of patients underwent TSA for a fracture-associated indication.
Statistical Analyses
Statistical analyses were performed with Stata 11.2 (StataCorp). Bivariate and multivariate analyses were used to test patient characteristics for association with extended LOS and readmission. Discharge destination and LOS were included in the readmission analysis because this information would be available at time of discharge and would be useful to include in a model that predicts odds of readmission.
Final multivariate models were constructed using a backward stepwise process that initially included all potential variables and sequentially excluded variables with the highest P value until only those with P < .20 remained. Variables with .05 < P < .20 were left in the model to control for potential confounding but were not considered significantly associated with the outcome. All tests were 2-tailed, and the statistical difference was established at a 2-sided α level of 0.05 (P < .05).
Results
Median LOS after TSA was 2 days (interquartile range, 1-3 days), and extended LOS was defined as LOS of more than 3 days (90th percentile LOS). The distribution of LOS is depicted in the Figure. Results of the bivariate and multivariate analyses are reported in Table 2 and Table 3, respectively. Bivariate analysis revealed an association between extended LOS and increased age, ASA class 3 or higher, and history of diabetes, pulmonary disease, and heart disease. On multivariate analysis, extended LOS was associated with age 70 to 79 years (odds ratio [OR], 1.71; 95% confidence interval [CI], 1.01-2.95; P = .049), age 80 years or older (OR, 3.38; 95% CI, 1.94-5.91; P < .001), and history of diabetes (OR, 2.37; 95% CI, 1.53-3.66; P < .001).
Forty-nine patients (3.3%) were readmitted within the first 30 postoperative days. Bivariate analysis revealed an association between readmission and ASA class 3 or higher, history of heart disease, and history of hypertension. On multivariate analysis, readmission was associated only with history of heart disease (OR, 2.94; 95% CI, 1.45-5.96; P = .003) and history of hypertension (OR, 3.93; 95% CI, 1.40-11.04; P = .010).
Discussion
In the United States, TSA has become increasingly popular because of its favorable outcomes and continued implant development.1-5 However, there is a shortage of information about risk factors for short-term outcomes after TSA. In this study, we used multivariate analyses to identify patient-related factors associated with extended LOS and readmission after discharge. By identifying these factors, we can improve the preoperative discussion and postoperative planning for this procedure.
In the present study, extended LOS (>3 days) was found to be associated with older age and history of diabetes. The TSA literature has little information that can be used to compare these results, though age over 80 years was previously described as a risk factor for extended LOS after TSA.19 Uncontrolled diabetes has been identified as a risk factor for extended LOS in hip and knee arthroplasty,20 and management of diabetes may similarly complicate postoperative care, leading to extended LOS and increased costs in TSA patients. Patients with the identified risk factors for extended LOS should be counseled before surgery. In addition, this is important information for health care organizations and providers.
Readmission within 30 days after TSA was found to be independently associated with history of heart disease and history of hypertension. Similar to factors affecting LOS, patient-related risk factors for readmission are also poorly defined in the TSA literature. In total hip arthroplasty patients, heart disease has been found to be associated with readmission.21,22 Hypertension has also been associated with readmission for other orthopedic procedures.23 Results of the present study indicate these comorbidities may increase the risk for complications after discharge. It is important to note, however, that LOS did not correlate with readmission rates, indicating patients are likely being discharged at the most clinically appropriate time.
Waterman and colleagues11 very recently identified (in the ACS-NSQIP database) a patient population that underwent TSA between 2006 and 2011 to describe risk factors for postoperative complications within 30 days. They found that comorbid cardiac disease and older age were independently associated with mortality. Interestingly, the present study identified older age as associated with extended LOS, and cardiac disease as associated with readmission. Together with the results from the previous study, age and cardiac disease seem to be important patient factors to consider when planning TSA, as they are associated with a significantly worse postoperative course.
This study had several limitations. First, given the nature of the ACS-NSQIP database, readmissions are recorded only up to 30 days after surgery, including after discharge. Second, though the ACS-NSQIP tries to collect as many patient variables as possible, some information is not captured. Additional variables that could potentially affect LOS and readmission (eg, insurance status, hospital volume) were not available for analysis. However, we think the high-quality data collection process used by the ACS-NSQIP outweighs the lack of certain variables. Third, original operative notes are not available in the ACS-NSQIP database, and the only way to identify operative procedures is to check CPT codes. Unfortunately, CPT code 23472 is used for both TSA and reverse TSA, so these procedures could not be separated for analysis, and the results of this study can be used to comment only on the risks of both procedures. Another limitation is that there were not enough patients to further analyze the data by each indication.
Conclusion
With the increasing popularity of TSA for an expanding set of indications, it is important to understand the factors that can affect the postoperative course. In this study, we found several patient-related risk factors for extended LOS and readmission. Although the identified factors are generally not modifiable, this information can be used to better define the expectations of patients, providers, and organizations for this increasingly common procedure.
1. Kim SH, Wise BL, Zhang Y, Szabo RM. Increasing incidence of shoulder arthroplasty in the United States. J Bone Joint Surg Am. 2011;93(24):2249-2254.
2. Day JS, Lau E, Ong KL, Williams GR, Ramsey ML, Kurtz SM. Prevalence and projections of total shoulder and elbow arthroplasty in the United States to 2015. J Shoulder Elbow Surg. 2010;19(8):1115-1120.
3. Adams JE, Sperling JW, Hoskin TL, Melton LJ 3rd, Cofield RH. Shoulder arthroplasty in Olmsted County, Minnesota, 1976–2000: a population-based study. J Shoulder Elbow Surg. 2006;15(1):50-55.
4. Farmer KW, Hammond JW, Queale WS, Keyurapan E, McFarland EG. Shoulder arthroplasty versus hip and knee arthroplasties: a comparison of outcomes. Clin Orthop Relat Res. 2007;(455):183-189.
5. Chin PY, Sperling JW, Cofield RH, Schleck C. Complications of total shoulder arthroplasty: are they fewer or different? J Shoulder Elbow Surg. 2006;15(1):19-22.
6. Bohsali KI, Wirth MA, Rockwood CA Jr. Complications of total shoulder arthroplasty. J Bone Joint Surg Am. 2006;88(10):2279-2292.
7. Torchia ME, Cofield RH, Settergren CR. Total shoulder arthroplasty with the Neer prosthesis: long-term results. J Shoulder Elbow Surg. 1997;6(6):495-505.
8. Sneppen O, Fruensgaard S, Johannsen HV, Olsen BS, Søjbjerg JO, Andersen NH. Total shoulder replacement in rheumatoid arthritis: proximal migration and loosening. J Shoulder Elbow Surg. 1996;5(1):47-52.
9. Søjbjerg JO, Frich LH, Johannsen HV, Sneppen O. Late results of total shoulder replacement in patients with rheumatoid arthritis. Clin Orthop Relat Res. 1999;(366):39-45.
10. Raiss P, Bruckner T, Rickert M, Walch G. Longitudinal observational study of total shoulder replacements with cement: fifteen to twenty-year follow-up. J Bone Joint Surg Am. 2014;96(3):198-205.
11. Waterman BR, Dunn JC, Bader J, Urrea L, Schoenfeld AJ, Belmont PJ Jr. Thirty-day morbidity and mortality after elective total shoulder arthroplasty: patient-based and surgical risk factors. J Shoulder Elbow Surg. 2015;24(1):24-30.
12. Farng E, Zingmond D, Krenek L, Soohoo NF. Factors predicting complication rates after primary shoulder arthroplasty. J Shoulder Elbow Surg. 2011;20(4):557-563.
13. Streubel PN, Simone JP, Sperling JW, Cofield R. Thirty and ninety-day reoperation rates after shoulder arthroplasty. J Bone Joint Surg Am. 2014;96(3):e17.
14. Mahoney A, Bosco JA 3rd, Zuckerman JD. Readmission after shoulder arthroplasty. J Shoulder Elbow Surg. 2014;23(3):377-381.
15. Gay DM, Lyman S, Do H, Hotchkiss RN, Marx RG, Daluiski A. Indications and reoperation rates for total elbow arthroplasty: an analysis of trends in New York state. J Bone Joint Surg Am. 2012;94(2):110-117.
16. Zumstein MA, Pinedo M, Old J, Boileau P. Problems, complications, reoperations, and revisions in reverse total shoulder arthroplasty: a systematic review. J Shoulder Elbow Surg. 2011;20(1):146-157.
17. American College of Surgeons. User Guide for the 2012 ACS NSQIP Participant Use Data File. https://www.facs.org/~/media/files/quality%20programs/nsqip/ug12.ashx. Published October 2013. Accessed June 21, 2015.
18. Khuri SF, Henderson WG, Daley J, et al; Principal Investigators of Patient Safety in Surgery Study. Successful implementation of the Department of Veterans Affairs’ National Surgical Quality Improvement Program in the private sector: the Patient Safety in Surgery study. Ann Surg. 2008;248(2):329-336.
19. Ricchetti ET, Abboud JA, Kuntz AF, Ramsey ML, Glaser DL, Williams GR Jr. Total shoulder arthroplasty in older patients: increased perioperative morbidity? Clin Orthop Relat Res. 2011;469(4):1042-1049.
20. Marchant MH Jr, Viens NA, Cook C, Vail TP, Bolognesi MP. The impact of glycemic control and diabetes mellitus on perioperative outcomes after total joint arthroplasty. J Bone Joint Surg Am. 2009;91(7):1621-1629.
21. Schairer WW, Sing DC, Vail TP, Bozic KJ. Causes and frequency of unplanned hospital readmission after total hip arthroplasty. Clin Orthop Relat Res. 2014;472(2):464-470.
22. Vorhies JS, Wang Y, Herndon J, Maloney WJ, Huddleston JI. Readmission and length of stay after total hip arthroplasty in a national Medicare sample. J Arthroplasty. 2011;26(6 suppl):119-123.
23. Lovecchio F, Hsu WK, Smith TR, Cybulski G, Kim B, Kim JY. Predictors of thirty-day readmission after anterior cervical fusion. Spine. 2014;39(2):127-133.
Risk Factors for Thromboembolic Events After Surgery for Ankle Fractures
Venous thromboembolic events (VTEs), encompassing both deep vein thrombosis (DVT) and pulmonary embolism (PE), are potentially fatal events that can occur after orthopedic surgery.1 In patients who do not receive prophylaxis, VTE incidence can be as high as 70% for total hip arthroplasty,2 26% for hip fracture,3 and 5% for ankle fracture.4 Based on the relatively low incidence of VTE after ankle fractures and insufficient evidence for VTE prophylaxis in this population, the American Orthopaedic Foot and Ankle Society and the American College of Chest Physicians do not recommend routine screening or prophylaxis for VTE in patients with ankle fractures.1,5 Nevertheless, certain patients may be at increased risk for VTE after open reduction and internal fixation (ORIF) of an ankle fracture. In such cases, further consideration for prophylaxis may be warranted.
Other studies of VTEs have identified general risk factors of increased age, obesity, prior thromboembolic disease, oral contraceptive use, multitrauma, varicose veins, and prolonged immobilization, among others.1,6,7 In orthopedics, most of this research comes from total joint arthroplasty and hip fracture studies. However, there is relatively limited data for ankle fracture. The best studies directly addressing VTE after ORIF of ankle fractures have had important limitations, including missing patient data and suboptimal capture of VTE occurrences,8-10 possibly leading to underestimates of the incidence of VTEs.
Given the limited data available, we conducted a retrospective national-cohort study to determine the incidence of and independent risk factors for VTEs after ankle fracture ORIF. If patients who are at higher risk for VTE can be identified, they can and should be carefully monitored and be considered for VTE prophylaxis. This information is needed for patient counseling and clinical decision-making.
Materials and Methods
This retrospective study used the American College of Surgeons National Surgical Quality Improvement Program (ACS-NSQIP) database, which captures data from more than 370 participating US hospitals.11 In ACS-NSQIP, 150 patient variables are collected from operative reports, medical records, and patient interviews by trained clinical reviewers.11,12 Patients are identified prospectively and randomly sampled at participating hospitals. Routine auditing is performed to ensure high-quality data. Clinical data are collected for the entire 30-day postoperative period, regardless of discharge status during this time.
Patients who underwent ankle fracture ORIF between 2005 and 2012 were identified in the ACS-NSQIP database. They were initially selected by the postoperative diagnosis of ankle fracture (International Classification of Diseases, Ninth Revision codes 824.0-824.9). Of these patients, only those with primary Current Procedural Terminology codes 27766 (ORIF of medial malleolus fracture), 27769 (ORIF of posterior malleolus fracture), 27792 (ORIF of lateral malleolus fracture), 27814 (ORIF of bimalleollar fracture), and 27822/27823 (ORIF of trimalleollar fracture) were included in the analysis. Patients with incomplete perioperative data were excluded, leaving 4412 patients (out of the initial 4785) for analysis.
Patient characteristics, including sex, age, height, weight, and history of smoking, were collected from the ACS-NSQIP database. Body mass index (BMI) was calculated from each patient’s height and weight. Age was divided into approximately 20-year increments, beginning with age 18 years, in order to compare younger, middle-aged, and elderly groups of patients with ankle fractures. BMI was divided into categories based on the World Health Organization definitions of obesity: under 25 kg/m2 (normal weight), 25 to 30 kg/m2 (overweight), 30 to 35 kg/m2 (class I obesity), and 35 kg/m2 or over (class II and class III obesity).13
Information about medical comorbidities is also available in the ACS-NSQIP database. History of pulmonary disease was defined as a history of dyspnea, severe chronic obstructive pulmonary disease, ventilator-assisted respiration within 48 hours before surgery, or current pneumonia. History of heart disease was defined as a history of congestive heart failure (CHF) or angina within 1 month before admission, myocardial infarction within 6 months before admission, cardiac surgery, or percutaneous coronary intervention. American Society of Anesthesiologists (ASA) classes 3 and above signify severe systemic disease. Steroid use was defined as requiring regular administration of corticosteroid medications within 1 month before surgery. Disseminated cancer was defined as a malignancy that has spread to 1 or more sites besides the primary site.
Functional status was defined as the ability to perform activities of daily living (ADLs) within 30 days before surgery. Best functional status during this period was recorded. ACS-NSQIP defines ADLs as the “activities usually performed in the course of a normal day in a person’s life,” including bathing, feeding, dressing, toileting, and mobility. An independent patient does not require assistance for any ADLs; a partially dependent patient requires assistance for some ADLs; and a totally dependent patient requires assistance in all ADLs. Partially and totally dependent patients were grouped for analysis. Anesthesia type was separated into general and nongeneral, which includes monitored anesthesia care, spinal anesthesia, and regional anesthesia.
ACS-NSQIP also records the occurrence of multiple events up to 30 days after surgery. For our study, VTE was defined as the occurrence of a DVT or a PE during this period. ACS-NSQIP defines DVT as a new blood clot or thrombus identified within a vein—with confirmation by duplex ultrasonography, venogram, or computed tomography (CT)—that required therapy (anticoagulation, placement of vena cava filter, and/or clipping of vena cava). PE is recorded if ventilation/perfusion (VQ) scan, CT examination, transesophageal echocardiogram, pulmonary arteriogram, CT angiogram, or any other definitive modality is positive.
Statistical analyses were performed with Stata Version 11.2 (StataCorp). Demographic and comorbidity variables were tested for association with occurrence of VTE using bivariate and multivariate logistic regression.
Final multivariate models were constructed with a backward stepwise process that initially included all potential variables and sequentially excluded variables with the highest P value until only those with P < .200 remained. Variables with .050 < P < .200 were left in the model to control for potential confounding but are not considered significantly associated with the outcome. Statistical significance was established at a 2-sided α of 0.050 (P < .050). The fitness of the final logistic regression model was assessed with the C statistic and the Hosmer-Lemeshow goodness-of-fit test.
Results
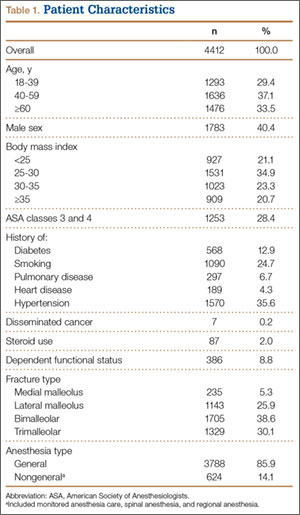
For the 4412 ankle fracture patients who met the inclusion criteria, mean (SD) age was 50.9 (18.2) years, and mean (SD) BMI was 30.4 (7.6) kg/m2. The cohort was 40.4% male. Surgery was performed on 235 patients (5.3%) with medial malleolus fracture, 1143 patients (25.9%) with lateral malleolus fracture, 1705 patients (38.6%) with bimalleollar fracture, and 1329 patients (30.1%) with trimalleollar fracture. Table 1 summarizes the patient characteristics.
Of the 33 patients (0.8%) with a VTE recorded within the first 30 postoperative days, 16 (0.4% of all patients) had a DVT recorded, 14 (0.3% of all patients) had a PE recorded, and 3 (0.1% of all patients) had both a DVT and a PE recorded. In 13 (39.4%) of the 33 patients with a VTE, the event occurred after discharge. VTEs were reported a mean (SD) of 11.5 (9.6) days after surgery. No patient in this study died of VTE.
Bivariate logistic regressions were performed to test the association of each patient variable with the occurrence of a VTE. Results are listed in Table 2. The bivariate analyses revealed significant associations between VTE after ankle fracture ORIF and the patient variables of age 60 years or older (odds ratio [OR], 2.40; 95% confidence interval [CI], 1.01-5.72), class I obesity (BMI, 30-35 kg/m2: OR, 5.15, 95% CI, 1.14-23.28), class II and class III obesity (BMI, ≥35 kg/m2: OR, 6.33, 95% CI, 1.41-28.38), ASA classes 3 and 4 (OR, 3.05; 95% CI, 1.53-6.08), history of heart disease (OR, 5.10; 95% CI, 2.08-12.49), history of hypertension (OR, 2.81; 95% CI, 1.39-5.66), and dependent functional status (OR, 3.39; 95% CI, 1.52-7.56).
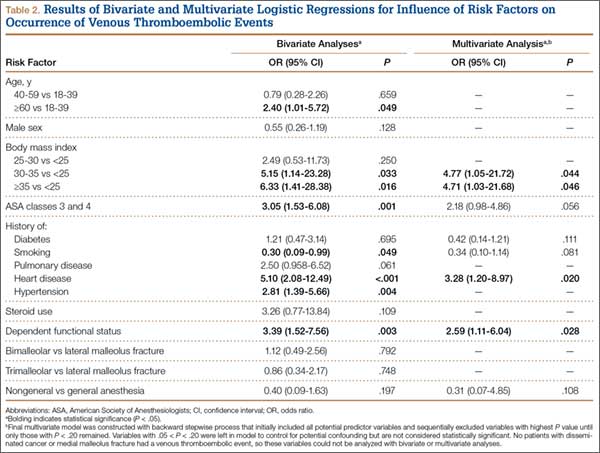
Multivariate logistic regression was used to control for potential confounding variables and determine which factors were independently associated with VTEs. Results of this analysis are listed in Table 2 as well. The multivariate analysis revealed that the patient variables of class I obesity (BMI, 30-35 kg/m2: OR, 4.77; 95% CI, 1.05-21.72; P = .044), class II and class III obesity (BMI, ≥35 kg/m2: OR, 4.71; 95% CI, 1.03-21.68; P = .046), history of heart disease (OR, 3.28; 95% CI, 1.20-8.97; P = .020), and dependent functional status (OR, 2.59; 95% CI, 1.11-6.04; P = .028) were independently associated with an increased rate of VTEs. Of note, anesthesia type was not significantly associated with occurrence of VTE on bivariate or multivariate analysis.
The C statistic of the final multivariate model was 0.76, indicating very good distinguishing ability. The Hosmer-Lemeshow goodness-of-fit test showed no evidence of lack of fit.
Discussion
Citing the lack of conclusive evidence and the low incidence of VTE after ankle fracture surgery, current recommendations are to avoid routine VTE prophylaxis in the postoperative management of patients who undergo this surgery.1,5 However, it is important to identify patients who are at increased risk, as some may benefit from VTE prophylaxis. In the present study, we used the large, high-quality ACS-NSQIP database collecting information from multiple US hospitals to examine risk factors for VTE after ankle fracture ORIF. We identified 4412 patients who underwent ankle fracture ORIF between 2005 and 2012, and found an overall VTE incidence of 0.8%. Multivariate analysis identified obesity, history of heart disease, and dependent functional status as independent risk factors for VTE after ankle fracture ORIF.
This study’s 0.8% incidence of VTE after ankle fracture ORIF is consistent with the range (0.29%-5%) reported in other ankle fracture studies.4,8-10,14-18 We found that VTEs occurred a mean of about 11 days after surgery, and no patient died of VTE.
Obesity (BMI, ≥30 kg/m2) had the strongest association with VTEs in this study. Obesity, which is a growing public health concern, can make postoperative care and mobilization more difficult.19 Obesity has previously been associated with VTEs after ankle fractures, and BMI of over 25 kg/m2 is one of the Caprini criteria for thrombosis risk factor assessment.6,10 In our study, however, BMI of 25 to 30 kg/m2 was not associated with an increased VTE rate, indicating that moderately overweight patients may not be at significantly higher risk for VTE (compared with patients with normal BMI) and may not need VTE prophylaxis. VTE prophylaxis after ankle fracture surgery may be considered in patients with BMI over 30 kg/m2.
History of heart disease was also associated with VTEs in this study. Patients with a history of heart disease were at 3 times the risk for VTE within 30 days of ankle fracture surgery. This association is also consistent with the Caprini criteria, which include acute myocardial infarction and CHF as risk factors for venous thrombosis.6 Other studies have found associations between CHF and VTE and between cardiovascular risk factors and VTE.7,20 The association between cardiovascular disease and VTE may derive from the decreased venous flow rate associated with CHF or an overall vascular disease state. These patients may benefit from heightened surveillance and postoperative prophylaxis for VTE.
Dependent functional status was the final risk factor found to be associated with VTE after ankle fracture ORIF. This association likely derives from an inability to mobilize independently, leading to increased venous stasis. Immobilization has been previously associated with increased risk for VTE after ankle surgery.7,14,16,20 Caretakers should be aware of this increased risk during the postoperative period and diligently monitor these patients for signs and symptoms of VTE. Prophylaxis may also be considered in this patient population.
Several risk factors that were significant on bivariate analysis (increased age; increased ASA class; history of diabetes, pulmonary disease, hypertension) were not significant in the final multivariate model. This finding suggests covariance between these factors and those that were significant in the final multivariate model. In particular, age and increased overall comorbidity (represented by increased ASA class) were not significant in our multivariate model—contrary to findings of other studies.8-10 It is possible that history of heart disease alone was responsible for the association between overall comorbidity and VTE in those studies. In the present study, separating and controlling for individual comorbidities could have allowed this association to be more precisely characterized.
The characteristics of the ACS-NSQIP database limited our study in several ways. First, although ACS-NSQIP makes significant efforts to collect as many patient variables as possible, some information is not captured. Data about additional factors that may affect VTE risk (eg, history of previous VTE, hypercoagulable state, history of malignancy other than disseminated cancer, tourniquet time, patient position in operating room) were not available. Second, data are collected only on those postoperative adverse events that occur within 30 days after surgery; data on VTEs that occur later are not captured. However, it has been shown that the majority of VTEs occur within the first 30 days after lower extremity trauma and surgery,21,22 so this follow-up interval was deemed adequate for capture of VTE data. Third, the database does not include information on the prophylactic regimens used for these patients—which may have weakened the associations between predictor variables and VTE risk and led to an underestimated effect size. VTE incidence, as well as the odds of developing a VTE with one of the identified risk factors, may actually be higher than reported in this study.
Conclusion
VTEs are serious complications that can occur after ORIF of ankle fractures. In this study, the overall incidence of VTE after ankle fracture ORIF was 0.8%. Although the American Orthopaedic Foot and Ankle Society and the American College of Chest Physicians do not recommend routine screening or prophylaxis for VTE in patients with ankle fractures,1,5 the results of this study showed there may be a benefit in emphasizing VTE prophylaxis after ankle fracture ORIF in patients with obesity, history of heart disease, or dependent functional status. At minimum, these patients should be more carefully monitored for development of VTEs.
1. American Orthopaedic Foot and Ankle Society. Position statement: the use of VTED prophylaxis in foot and ankle surgery. http://www.aofas.org/medical-community/health-policy/Documents/VTED-Position-Statement-Approv-7-9-13-FINAL.pdf. Updated 2013. Accessed May 10, 2015.
2. Grady-Benson JC, Oishi CS, Hanson PB, Colwell CW Jr, Otis SM, Walker RH. Routine postoperative duplex ultrasonography screening and monitoring for the detection of deep vein thrombosis. A survey of 110 total hip arthroplasties. Clin Orthop Relat Res. 1994;(307):130-141.
3. Salzman EW, Harris WH, DeSanctis RW. Anticoagulation for prevention of thromboembolism following fractures of the hip. New Engl J Med. 1966;275(3):122-130.
4. Patil S, Gandhi J, Curzon I, Hui AC. Incidence of deep-vein thrombosis in patients with fractures of the ankle treated in a plaster cast. J Bone Joint Surg Br. 2007;89(10):1340-1343.
5. Falck-Ytter Y, Francis CW, Johanson NA, et al; American College of Chest Physicians. Prevention of VTE in orthopedic surgery patients: Antithrombotic Therapy and Prevention of Thrombosis, 9th ed: American College of Chest Physicians Evidence-Based Clinical Practice Guidelines. Chest. 2012;141(2 suppl):e278S-e325S.
6. Caprini JA. Thrombosis risk assessment as a guide to quality patient care. Dis Mon. 2005;51(2-3):70-78.
7. Mayle RE Jr, DiGiovanni CW, Lin SS, Tabrizi P, Chou LB. Current concepts review: venous thromboembolic disease in foot and ankle surgery. Foot Ankle Int. 2007;28(11):1207-1216.
8. Jameson SS, Augustine A, James P, et al. Venous thromboembolic events following foot and ankle surgery in the English National Health Service. J Bone Joint Surg Br. 2011;93(4):490-497.
9. SooHoo NF, Eagan M, Krenek L, Zingmond DS. Incidence and factors predicting pulmonary embolism and deep venous thrombosis following surgical treatment of ankle fractures. Foot Ankle Surg. 2011;17(4):259-262.
10. Shibuya N, Frost CH, Campbell JD, Davis ML, Jupiter DC. Incidence of acute deep vein thrombosis and pulmonary embolism in foot and ankle trauma: analysis of the National Trauma Data Bank. J Foot Ankle Surg. 2012;51(1):63-68.
11. American College of Surgeons National Surgical Quality Improvement Program. User Guide for the 2012 ACS NSQIP Participant Use Data File. http://site.acsnsqip.org/wp-content/uploads/2013/10/ACSNSQIP.PUF_.UserGuide.2012.pdf. Published October 2013. Accessed May 10, 2015.
12. Khuri SF, Henderson WG, Daley J, et al; Principal Investigators of Patient Safety in Surgery Study. Successful implementation of the Department of Veterans Affairs’ National Surgical Quality Improvement Program in the private sector: the Patient Safety in Surgery study. Ann Surg. 2008;248(2):329-336.
13. Must A, Spadano J, Coakley EH, Field AE, Colditz G, Dietz WH. The disease burden associated with overweight and obesity. JAMA. 1999;282(16):1523-1529.
14. Mizel MS, Temple HT, Michelson JD, et al. Thromboembolism after foot and ankle surgery. A multicenter study. Clin Orthop Relat Res. 1998;(348):180-185.
15. Solis G, Saxby T. Incidence of DVT following surgery of the foot and ankle. Foot Ankle Int. 2002;23(5):411-414.
16. Hanslow SS, Grujic L, Slater HK, Chen D. Thromboembolic disease after foot and ankle surgery. Foot Ankle Int. 2006;27(9):693-695.
17. Pelet S, Roger ME, Belzile EL, Bouchard M. The incidence of thromboembolic events in surgically treated ankle fracture. J Bone Joint Surg Am. 2012;94(6):502-506.
18. Manafi Rasi A, Kazemian G, Emami Moghadam M, et al. Deep vein thrombosis following below knee immobilization: the need for chemoprophylaxis. Trauma Mon. 2013;17(4):367-369.
19. Sabharwal S, Root MZ. Impact of obesity on orthopaedics. J Bone Joint Surg Am. 2012;94(11):1045-1052.
20. Kadous A, Abdelgawad AA, Kanlic E. Deep venous thrombosis and pulmonary embolism after surgical treatment of ankle fractures: a case report and review of literature. J Foot Ankle Surg. 2012;51(4):457-463.
21. Forsythe RM, Peitzman AB, DeCato T, et al. Early lower extremity fracture fixation and the risk of early pulmonary embolus: filter before fixation? J Trauma. 2011;70(6):1381-1388.
22. Bjørnarå BT, Gudmundsen TE, Dahl OE. Frequency and timing of clinical venous thromboembolism after major joint surgery. J Bone Joint Surg Br. 2006;88(3):386-391.
Venous thromboembolic events (VTEs), encompassing both deep vein thrombosis (DVT) and pulmonary embolism (PE), are potentially fatal events that can occur after orthopedic surgery.1 In patients who do not receive prophylaxis, VTE incidence can be as high as 70% for total hip arthroplasty,2 26% for hip fracture,3 and 5% for ankle fracture.4 Based on the relatively low incidence of VTE after ankle fractures and insufficient evidence for VTE prophylaxis in this population, the American Orthopaedic Foot and Ankle Society and the American College of Chest Physicians do not recommend routine screening or prophylaxis for VTE in patients with ankle fractures.1,5 Nevertheless, certain patients may be at increased risk for VTE after open reduction and internal fixation (ORIF) of an ankle fracture. In such cases, further consideration for prophylaxis may be warranted.
Other studies of VTEs have identified general risk factors of increased age, obesity, prior thromboembolic disease, oral contraceptive use, multitrauma, varicose veins, and prolonged immobilization, among others.1,6,7 In orthopedics, most of this research comes from total joint arthroplasty and hip fracture studies. However, there is relatively limited data for ankle fracture. The best studies directly addressing VTE after ORIF of ankle fractures have had important limitations, including missing patient data and suboptimal capture of VTE occurrences,8-10 possibly leading to underestimates of the incidence of VTEs.
Given the limited data available, we conducted a retrospective national-cohort study to determine the incidence of and independent risk factors for VTEs after ankle fracture ORIF. If patients who are at higher risk for VTE can be identified, they can and should be carefully monitored and be considered for VTE prophylaxis. This information is needed for patient counseling and clinical decision-making.
Materials and Methods
This retrospective study used the American College of Surgeons National Surgical Quality Improvement Program (ACS-NSQIP) database, which captures data from more than 370 participating US hospitals.11 In ACS-NSQIP, 150 patient variables are collected from operative reports, medical records, and patient interviews by trained clinical reviewers.11,12 Patients are identified prospectively and randomly sampled at participating hospitals. Routine auditing is performed to ensure high-quality data. Clinical data are collected for the entire 30-day postoperative period, regardless of discharge status during this time.
Patients who underwent ankle fracture ORIF between 2005 and 2012 were identified in the ACS-NSQIP database. They were initially selected by the postoperative diagnosis of ankle fracture (International Classification of Diseases, Ninth Revision codes 824.0-824.9). Of these patients, only those with primary Current Procedural Terminology codes 27766 (ORIF of medial malleolus fracture), 27769 (ORIF of posterior malleolus fracture), 27792 (ORIF of lateral malleolus fracture), 27814 (ORIF of bimalleollar fracture), and 27822/27823 (ORIF of trimalleollar fracture) were included in the analysis. Patients with incomplete perioperative data were excluded, leaving 4412 patients (out of the initial 4785) for analysis.
Patient characteristics, including sex, age, height, weight, and history of smoking, were collected from the ACS-NSQIP database. Body mass index (BMI) was calculated from each patient’s height and weight. Age was divided into approximately 20-year increments, beginning with age 18 years, in order to compare younger, middle-aged, and elderly groups of patients with ankle fractures. BMI was divided into categories based on the World Health Organization definitions of obesity: under 25 kg/m2 (normal weight), 25 to 30 kg/m2 (overweight), 30 to 35 kg/m2 (class I obesity), and 35 kg/m2 or over (class II and class III obesity).13
Information about medical comorbidities is also available in the ACS-NSQIP database. History of pulmonary disease was defined as a history of dyspnea, severe chronic obstructive pulmonary disease, ventilator-assisted respiration within 48 hours before surgery, or current pneumonia. History of heart disease was defined as a history of congestive heart failure (CHF) or angina within 1 month before admission, myocardial infarction within 6 months before admission, cardiac surgery, or percutaneous coronary intervention. American Society of Anesthesiologists (ASA) classes 3 and above signify severe systemic disease. Steroid use was defined as requiring regular administration of corticosteroid medications within 1 month before surgery. Disseminated cancer was defined as a malignancy that has spread to 1 or more sites besides the primary site.
Functional status was defined as the ability to perform activities of daily living (ADLs) within 30 days before surgery. Best functional status during this period was recorded. ACS-NSQIP defines ADLs as the “activities usually performed in the course of a normal day in a person’s life,” including bathing, feeding, dressing, toileting, and mobility. An independent patient does not require assistance for any ADLs; a partially dependent patient requires assistance for some ADLs; and a totally dependent patient requires assistance in all ADLs. Partially and totally dependent patients were grouped for analysis. Anesthesia type was separated into general and nongeneral, which includes monitored anesthesia care, spinal anesthesia, and regional anesthesia.
ACS-NSQIP also records the occurrence of multiple events up to 30 days after surgery. For our study, VTE was defined as the occurrence of a DVT or a PE during this period. ACS-NSQIP defines DVT as a new blood clot or thrombus identified within a vein—with confirmation by duplex ultrasonography, venogram, or computed tomography (CT)—that required therapy (anticoagulation, placement of vena cava filter, and/or clipping of vena cava). PE is recorded if ventilation/perfusion (VQ) scan, CT examination, transesophageal echocardiogram, pulmonary arteriogram, CT angiogram, or any other definitive modality is positive.
Statistical analyses were performed with Stata Version 11.2 (StataCorp). Demographic and comorbidity variables were tested for association with occurrence of VTE using bivariate and multivariate logistic regression.
Final multivariate models were constructed with a backward stepwise process that initially included all potential variables and sequentially excluded variables with the highest P value until only those with P < .200 remained. Variables with .050 < P < .200 were left in the model to control for potential confounding but are not considered significantly associated with the outcome. Statistical significance was established at a 2-sided α of 0.050 (P < .050). The fitness of the final logistic regression model was assessed with the C statistic and the Hosmer-Lemeshow goodness-of-fit test.
Results
For the 4412 ankle fracture patients who met the inclusion criteria, mean (SD) age was 50.9 (18.2) years, and mean (SD) BMI was 30.4 (7.6) kg/m2. The cohort was 40.4% male. Surgery was performed on 235 patients (5.3%) with medial malleolus fracture, 1143 patients (25.9%) with lateral malleolus fracture, 1705 patients (38.6%) with bimalleollar fracture, and 1329 patients (30.1%) with trimalleollar fracture. Table 1 summarizes the patient characteristics.
Of the 33 patients (0.8%) with a VTE recorded within the first 30 postoperative days, 16 (0.4% of all patients) had a DVT recorded, 14 (0.3% of all patients) had a PE recorded, and 3 (0.1% of all patients) had both a DVT and a PE recorded. In 13 (39.4%) of the 33 patients with a VTE, the event occurred after discharge. VTEs were reported a mean (SD) of 11.5 (9.6) days after surgery. No patient in this study died of VTE.
Bivariate logistic regressions were performed to test the association of each patient variable with the occurrence of a VTE. Results are listed in Table 2. The bivariate analyses revealed significant associations between VTE after ankle fracture ORIF and the patient variables of age 60 years or older (odds ratio [OR], 2.40; 95% confidence interval [CI], 1.01-5.72), class I obesity (BMI, 30-35 kg/m2: OR, 5.15, 95% CI, 1.14-23.28), class II and class III obesity (BMI, ≥35 kg/m2: OR, 6.33, 95% CI, 1.41-28.38), ASA classes 3 and 4 (OR, 3.05; 95% CI, 1.53-6.08), history of heart disease (OR, 5.10; 95% CI, 2.08-12.49), history of hypertension (OR, 2.81; 95% CI, 1.39-5.66), and dependent functional status (OR, 3.39; 95% CI, 1.52-7.56).
Multivariate logistic regression was used to control for potential confounding variables and determine which factors were independently associated with VTEs. Results of this analysis are listed in Table 2 as well. The multivariate analysis revealed that the patient variables of class I obesity (BMI, 30-35 kg/m2: OR, 4.77; 95% CI, 1.05-21.72; P = .044), class II and class III obesity (BMI, ≥35 kg/m2: OR, 4.71; 95% CI, 1.03-21.68; P = .046), history of heart disease (OR, 3.28; 95% CI, 1.20-8.97; P = .020), and dependent functional status (OR, 2.59; 95% CI, 1.11-6.04; P = .028) were independently associated with an increased rate of VTEs. Of note, anesthesia type was not significantly associated with occurrence of VTE on bivariate or multivariate analysis.
The C statistic of the final multivariate model was 0.76, indicating very good distinguishing ability. The Hosmer-Lemeshow goodness-of-fit test showed no evidence of lack of fit.
Discussion
Citing the lack of conclusive evidence and the low incidence of VTE after ankle fracture surgery, current recommendations are to avoid routine VTE prophylaxis in the postoperative management of patients who undergo this surgery.1,5 However, it is important to identify patients who are at increased risk, as some may benefit from VTE prophylaxis. In the present study, we used the large, high-quality ACS-NSQIP database collecting information from multiple US hospitals to examine risk factors for VTE after ankle fracture ORIF. We identified 4412 patients who underwent ankle fracture ORIF between 2005 and 2012, and found an overall VTE incidence of 0.8%. Multivariate analysis identified obesity, history of heart disease, and dependent functional status as independent risk factors for VTE after ankle fracture ORIF.
This study’s 0.8% incidence of VTE after ankle fracture ORIF is consistent with the range (0.29%-5%) reported in other ankle fracture studies.4,8-10,14-18 We found that VTEs occurred a mean of about 11 days after surgery, and no patient died of VTE.
Obesity (BMI, ≥30 kg/m2) had the strongest association with VTEs in this study. Obesity, which is a growing public health concern, can make postoperative care and mobilization more difficult.19 Obesity has previously been associated with VTEs after ankle fractures, and BMI of over 25 kg/m2 is one of the Caprini criteria for thrombosis risk factor assessment.6,10 In our study, however, BMI of 25 to 30 kg/m2 was not associated with an increased VTE rate, indicating that moderately overweight patients may not be at significantly higher risk for VTE (compared with patients with normal BMI) and may not need VTE prophylaxis. VTE prophylaxis after ankle fracture surgery may be considered in patients with BMI over 30 kg/m2.
History of heart disease was also associated with VTEs in this study. Patients with a history of heart disease were at 3 times the risk for VTE within 30 days of ankle fracture surgery. This association is also consistent with the Caprini criteria, which include acute myocardial infarction and CHF as risk factors for venous thrombosis.6 Other studies have found associations between CHF and VTE and between cardiovascular risk factors and VTE.7,20 The association between cardiovascular disease and VTE may derive from the decreased venous flow rate associated with CHF or an overall vascular disease state. These patients may benefit from heightened surveillance and postoperative prophylaxis for VTE.
Dependent functional status was the final risk factor found to be associated with VTE after ankle fracture ORIF. This association likely derives from an inability to mobilize independently, leading to increased venous stasis. Immobilization has been previously associated with increased risk for VTE after ankle surgery.7,14,16,20 Caretakers should be aware of this increased risk during the postoperative period and diligently monitor these patients for signs and symptoms of VTE. Prophylaxis may also be considered in this patient population.
Several risk factors that were significant on bivariate analysis (increased age; increased ASA class; history of diabetes, pulmonary disease, hypertension) were not significant in the final multivariate model. This finding suggests covariance between these factors and those that were significant in the final multivariate model. In particular, age and increased overall comorbidity (represented by increased ASA class) were not significant in our multivariate model—contrary to findings of other studies.8-10 It is possible that history of heart disease alone was responsible for the association between overall comorbidity and VTE in those studies. In the present study, separating and controlling for individual comorbidities could have allowed this association to be more precisely characterized.
The characteristics of the ACS-NSQIP database limited our study in several ways. First, although ACS-NSQIP makes significant efforts to collect as many patient variables as possible, some information is not captured. Data about additional factors that may affect VTE risk (eg, history of previous VTE, hypercoagulable state, history of malignancy other than disseminated cancer, tourniquet time, patient position in operating room) were not available. Second, data are collected only on those postoperative adverse events that occur within 30 days after surgery; data on VTEs that occur later are not captured. However, it has been shown that the majority of VTEs occur within the first 30 days after lower extremity trauma and surgery,21,22 so this follow-up interval was deemed adequate for capture of VTE data. Third, the database does not include information on the prophylactic regimens used for these patients—which may have weakened the associations between predictor variables and VTE risk and led to an underestimated effect size. VTE incidence, as well as the odds of developing a VTE with one of the identified risk factors, may actually be higher than reported in this study.
Conclusion
VTEs are serious complications that can occur after ORIF of ankle fractures. In this study, the overall incidence of VTE after ankle fracture ORIF was 0.8%. Although the American Orthopaedic Foot and Ankle Society and the American College of Chest Physicians do not recommend routine screening or prophylaxis for VTE in patients with ankle fractures,1,5 the results of this study showed there may be a benefit in emphasizing VTE prophylaxis after ankle fracture ORIF in patients with obesity, history of heart disease, or dependent functional status. At minimum, these patients should be more carefully monitored for development of VTEs.
1. American Orthopaedic Foot and Ankle Society. Position statement: the use of VTED prophylaxis in foot and ankle surgery. http://www.aofas.org/medical-community/health-policy/Documents/VTED-Position-Statement-Approv-7-9-13-FINAL.pdf. Updated 2013. Accessed May 10, 2015.
2. Grady-Benson JC, Oishi CS, Hanson PB, Colwell CW Jr, Otis SM, Walker RH. Routine postoperative duplex ultrasonography screening and monitoring for the detection of deep vein thrombosis. A survey of 110 total hip arthroplasties. Clin Orthop Relat Res. 1994;(307):130-141.
3. Salzman EW, Harris WH, DeSanctis RW. Anticoagulation for prevention of thromboembolism following fractures of the hip. New Engl J Med. 1966;275(3):122-130.
4. Patil S, Gandhi J, Curzon I, Hui AC. Incidence of deep-vein thrombosis in patients with fractures of the ankle treated in a plaster cast. J Bone Joint Surg Br. 2007;89(10):1340-1343.
5. Falck-Ytter Y, Francis CW, Johanson NA, et al; American College of Chest Physicians. Prevention of VTE in orthopedic surgery patients: Antithrombotic Therapy and Prevention of Thrombosis, 9th ed: American College of Chest Physicians Evidence-Based Clinical Practice Guidelines. Chest. 2012;141(2 suppl):e278S-e325S.
6. Caprini JA. Thrombosis risk assessment as a guide to quality patient care. Dis Mon. 2005;51(2-3):70-78.
7. Mayle RE Jr, DiGiovanni CW, Lin SS, Tabrizi P, Chou LB. Current concepts review: venous thromboembolic disease in foot and ankle surgery. Foot Ankle Int. 2007;28(11):1207-1216.
8. Jameson SS, Augustine A, James P, et al. Venous thromboembolic events following foot and ankle surgery in the English National Health Service. J Bone Joint Surg Br. 2011;93(4):490-497.
9. SooHoo NF, Eagan M, Krenek L, Zingmond DS. Incidence and factors predicting pulmonary embolism and deep venous thrombosis following surgical treatment of ankle fractures. Foot Ankle Surg. 2011;17(4):259-262.
10. Shibuya N, Frost CH, Campbell JD, Davis ML, Jupiter DC. Incidence of acute deep vein thrombosis and pulmonary embolism in foot and ankle trauma: analysis of the National Trauma Data Bank. J Foot Ankle Surg. 2012;51(1):63-68.
11. American College of Surgeons National Surgical Quality Improvement Program. User Guide for the 2012 ACS NSQIP Participant Use Data File. http://site.acsnsqip.org/wp-content/uploads/2013/10/ACSNSQIP.PUF_.UserGuide.2012.pdf. Published October 2013. Accessed May 10, 2015.
12. Khuri SF, Henderson WG, Daley J, et al; Principal Investigators of Patient Safety in Surgery Study. Successful implementation of the Department of Veterans Affairs’ National Surgical Quality Improvement Program in the private sector: the Patient Safety in Surgery study. Ann Surg. 2008;248(2):329-336.
13. Must A, Spadano J, Coakley EH, Field AE, Colditz G, Dietz WH. The disease burden associated with overweight and obesity. JAMA. 1999;282(16):1523-1529.
14. Mizel MS, Temple HT, Michelson JD, et al. Thromboembolism after foot and ankle surgery. A multicenter study. Clin Orthop Relat Res. 1998;(348):180-185.
15. Solis G, Saxby T. Incidence of DVT following surgery of the foot and ankle. Foot Ankle Int. 2002;23(5):411-414.
16. Hanslow SS, Grujic L, Slater HK, Chen D. Thromboembolic disease after foot and ankle surgery. Foot Ankle Int. 2006;27(9):693-695.
17. Pelet S, Roger ME, Belzile EL, Bouchard M. The incidence of thromboembolic events in surgically treated ankle fracture. J Bone Joint Surg Am. 2012;94(6):502-506.
18. Manafi Rasi A, Kazemian G, Emami Moghadam M, et al. Deep vein thrombosis following below knee immobilization: the need for chemoprophylaxis. Trauma Mon. 2013;17(4):367-369.
19. Sabharwal S, Root MZ. Impact of obesity on orthopaedics. J Bone Joint Surg Am. 2012;94(11):1045-1052.
20. Kadous A, Abdelgawad AA, Kanlic E. Deep venous thrombosis and pulmonary embolism after surgical treatment of ankle fractures: a case report and review of literature. J Foot Ankle Surg. 2012;51(4):457-463.
21. Forsythe RM, Peitzman AB, DeCato T, et al. Early lower extremity fracture fixation and the risk of early pulmonary embolus: filter before fixation? J Trauma. 2011;70(6):1381-1388.
22. Bjørnarå BT, Gudmundsen TE, Dahl OE. Frequency and timing of clinical venous thromboembolism after major joint surgery. J Bone Joint Surg Br. 2006;88(3):386-391.
Mortality Rates Associated With Odontoid and Subaxial Cervical Spine Fractures
Mortality rate is an important indicator of the severity of traumatic injuries, and these values have been described for different orthopedic injuries and fractures. Studies have identified 3 distinct trends in patient survival when compared with the age- and sex-matched uninjured population:
1. Hip fractures bring about a transient increase in mortality relative to age-matched controls that normalizes after a few months to 1 year.1-10
2. Thoracic and lumbar compression fractures are associated with an ongoing, lifelong increase in mortality rate relative to age-matched controls without an initial marked upswing.11-15
3. Certain injuries such as isolated rib or wrist fractures do not adversely affect survival relative to age-matched controls.12,16-18
Understanding the mortality patterns after these injuries can help guide management and even facilitate the development of appropriate treatment algorithms.19-21 While studies have examined mortality in specific odontoid fracture types,22 such mortality trends have not been broadly established in persons with cervical spine fractures.
Cervical spine fractures are common: 60% of spine fractures localize to this region,23-26 and this equates to 2% to 3% of all blunt-trauma patients.27,28 These injuries can lead to devastating consequences, including neurologic compromise, permanent disability, and death.29-31
Studies have estimated that up to 20% of cervical fractures involve the odontoid process.23-26 These injuries are more common among the elderly population because of their greater prevalence of osteoporosis and likelihood of falling.32 Because of demographic similarities to those of the hip fracture population, a survival analysis of all odontoid fractures is particularly interesting. Published odontoid mortality rates vary significantly, with reports ranging from 13% to 44%.22,33-35 Unfortunately, these studies largely evaluated survival rates specific to an individual treatment modality, such as nonoperative compared with operative, or specific to certain odontoid fracture types (eg, type II). Additionally, studies have generally only considered survivorship during initial hospitalization, have been specific to a constrained age group, or have been based solely on inpatient records that do not permit the longer-term follow-up critical to determining the effect of odontoid fractures on overall mortality.36-39
Likewise, mortality rates after fractures of the subaxial spine (ie, the motion segments between C3 and C7) have yet to be established. In 1 study, the mortality risk of a cohort of elderly patients with cervical fractures appeared to be elevated for the first 6 to 12 months after the traumatic event.40 However, the sample size was too small to examine mortality beyond 1 year.
In this context, the purpose of the current study was to determine the mortality rates at several time points (3 months, 1 year, and 2 years) of patients 50 years or older (start of the second mode of the bimodal age distribution of odontoid fractures41-44) with fractures of the odontoid and subaxial cervical spine. A secondary purpose of this study was to compare survival rates of these 2 cohorts relative to each other and to the general population.
Materials and Methods
Identification of Cervical Fractures and Collection of Demographic Information
This protocol was approved by the human investigation committee of our institution. Every computed tomography (CT) scan of the cervical spine performed in the emergency department (ED) of an academic hospital between November 27, 1997, and December 31, 2006, was identified. Since the threshold for obtaining a CT scan of a patient with suspected cervical spine trauma is relatively low, it was assumed that virtually all acute cervical spine fractures during this time period would be successfully identified through this approach.
Radiology reports for all identified CT scans were reviewed for any findings consistent with acute fractures and/or dislocations of the cervical spine (Figure 1). Every study noted to be positive or equivocal for cervical trauma was directly visualized, including those that did not specifically mention the presence or absence of an injury. Scans with no signs of acute trauma or that showed fractures caused by a pathologic process or penetrating mechanism (eg, metastatic lesions or gunshot wounds) were omitted from this series. Finally, relevant demographic information, such as the medical record number, age, gender, and date of study, was recorded for every subject in this group.
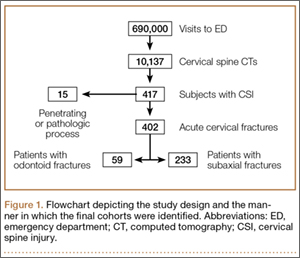
Fracture Classification
Next, the level and the type of cervical injury were documented for each patient. Fractures were segregated according to their involvement with the odontoid or the subaxial vertebrae.
Odontoid fractures were categorized into type I (limited to the tip), type II (across the base of the process) and type III (through the base with extension into the C2 vertebral body).45,46 Since many systems for classifying subaxial cervical spine trauma require a subjective inference of the injury mechanism, which is difficult to ascertain from imaging studies alone, all of these fractures were pooled together.
A preliminary survey of the data indicated that the odontoid fractures appeared to exhibit a bimodal age distribution, with the beginning of the second cluster occurring around age 50 years (Figure 2). As noted above, this has been shown in previous studies.41-44 As a consequence, the mortalities of those older than 50 years became the focus of this study. To control for comorbid conditions, mechanism of injury, and to allow for more direct comparison with the odontoid fractures in this study, the same age demarcation was used for subaxial cervical fractures.
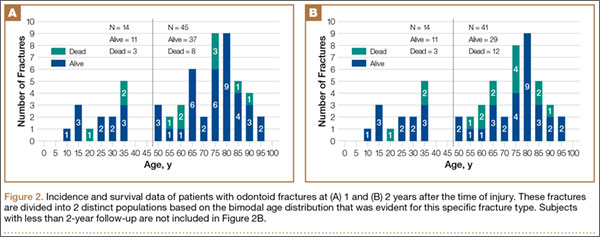
Mortality Data
The mortality status of every patient diagnosed with an acute cervical injury at our institution between November 27, 1997, and December 31, 2006, was determined by referencing the National Death Index (NDI). The NDI is a computerized database of death records maintained by the National Center for Health Statistics (NCHS). The time window for the current study was selected because we had access to NDI information only through 2007 at the time of this study. Social Security numbers (SSNs), which were available for approximately half of the subjects, were used to search the NDI catalog. For individuals whose SSNs were unavailable, patient names and birthdates were considered to be sufficient to confirm a true match. Our center’s medical records of this cohort were also examined to verify whether any had died during their initial hospitalizations and to substantiate the NDI data. Finally, patient deaths were categorized as trauma (eg, motor vehicle accident, fall from a height) or medical comorbidity (eg, diabetes mellitus, cancer, congestive heart failure), based on information in the NDI listing.
Age- and Sex-Matched Controls
Age- and sex-matched controls were determined from the Wide-ranging Online Data for Epidemiologic Research (WONDER) application distributed by the Centers for Disease Control and Prevention (http://wonder.cdc.gov). Composite mortality data from the state in which the study was performed was obtained for the years between 1999 and 2007, and this information was further stratified according to gender and age to estimate the mortality rates and construct survival curves for each group. Controls were used to establish a standardized mortality ratio (SMR) for subjects 50 years and older, a value that compares the number of observed deaths with the figure expected for matched populations from the general population.
Statistical Methods
Statistical analyses were performed by using both SAS 9.2 (SAS Institute Inc., Cary, North Carolina) and R (version 2.9; www.r-project.org, Auckland, New Zealand). Relevant comparisons were planned, and all tests were 2-sided. The Wilcoxon rank sum test was applied to compare the survival times of patients with odontoid fractures with different documented causes of death, and Pearson χ2 test was used to compare the age distributions of odontoid and subaxial fractures. Survival rates at 3 months, 1 year, and 2 years were estimated from Kaplan-Meier curves. The relative survival of these cohorts was compared by completing a 2-sample log-rank test. In addition, a 1-sample log-rank test was implemented to compare the mortality from either odontoid or subaxial cervical spine fractures with that of the age- and gender-matched general population. Statistical significance was defined as a 2-sided α error of less than 0.05 (P < .05).
Results
Fifty-nine patients were diagnosed with odontoid fractures (28 men, 31 women), and 233 patients were diagnosed with subaxial cervical spine fractures (168 men, 65 women).
Odontoid Fracture Patients
Odontoid fracture patients exhibited a distinct bimodal age distribution (Figure 2). In the younger population, there were 14 subjects, 3 of whom died within days of the injury (mean, 12 days; 78.6% survival). At 2-year follow-up, there were no further deaths. The fractures that caused death were high-energy injuries, and only early deaths occurred in these cases.
Because of the significant bimodal age distribution, it was believed these cohorts could not be directly compared. As a result, the remaining analysis focused on the older age group. In the older population mode (50 years and older) were 45 patients with odontoid fractures. Of the 12 subjects who died after odontoid fracture, 5 were assigned a trauma code as the cause of death, while a medical comorbidity code was assigned for the remaining 7. Mean survival time of those who died secondary to trauma was significantly shorter than the medical comorbidity group (P = .025).
In the cohort of subjects older than 50 years, 3-month, 1-year, and 2-year survival rates were 84.4%, 82.2%, and 72.9%, respectively. Figure 2 shows the 1- and 2-year follow-up data by age group.
Analysis was performed relative to gender. Of male patients (n = 22), the 3-month, 1-year, and 2-year survival rates were 72.7%, 72.7%, and 62.7%, respectively. Among women (n = 23), the 3-month, 1-year, and 2-year survival rates were 95.7%, 91.3%, and 82.6%, respectively.
Figure 3 shows the Kaplan-Meier survival curves of the older patients with odontoid fractures. A comparison of the curves for each gender showed no significant disparities between the male and female survival (Figure 3A, P = .124). Compared with age-matched male counterparts, the survival of male subjects with odontoid fractures was significantly worse (Figure 3B, P < .001). Men experienced an initial acute decline in survival, with the remainder of the survival curve matching that of the general male population. In contrast, odontoid fractures did not adversely affect female survival compared with the matched population (Figure 3C, P = .568).
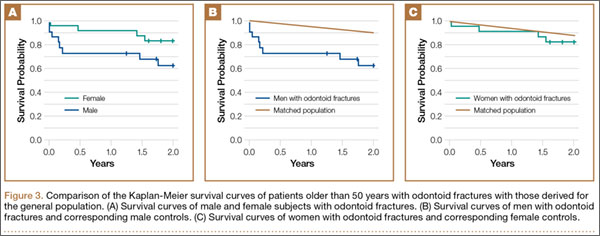
The 2-year SMR of 2.98 for men showed that odontoid fractures led to greater mortality compared with a sex- and age-matched population. This means that men older than 50 years who sustained an odontoid fracture had nearly 3 times the mortality rate after 2 years compared with a normal, matched population; this increase is attributed to the 3-month time point that subsequently normalized. The female rate was 1.33 times that of a matched population, a difference that is not statistically significant.
Subaxial Fracture Patients
Of the 91 patients older than 50 years with subaxial fractures, 3-month, 1-year, and 2-year survival rates were 87.9%, 85.7%, and 85.7%, respectively. Figure 4 shows the 1- and 2-year follow-up data by age group.
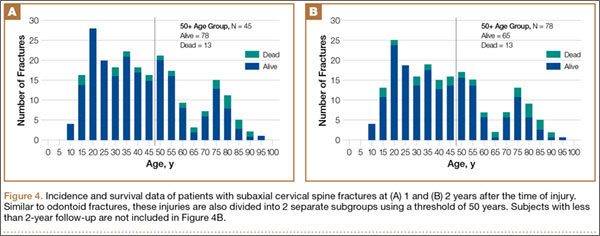
Gender-specific analysis was performed. For men (n = 58), the 3-month, 1-year, and 2-year survival rates were 87.9%, 84.5%, and 84.5%, respectively. Among women (n = 33), 4 deaths were recorded at all time points (87.9% survival).
Figure 5 shows Kaplan-Meier survival curves for the older population with subaxial fractures. A comparison of the curves between genders again showed no significant differences between male and female survival (P = .683, Figure 5A). Compared with age- and gender-matched counterparts, men showed decreased relative survival (P < .0001, Figure 5B), whereas subaxial fractures did not decrease female survival (P = .554, Figure 5C).
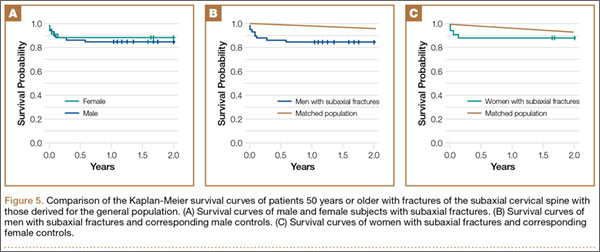
The 2-year SMR of 2.90 for men showed higher mortality rates relative to sex- and age-matched controls. Men who were both 50 years old and sustained a subaxial fracture were 2.9 times as likely to die within 2 years of follow-up compared with their counterparts. Similar to odontoid fractures, this increase occurred by the 3-month time point and subsequently normalized. The female rate, which was 1.34 times that of the uninjured population, was not statistically significant.
Comparison of Odontoid and Subaxial Fracture Patients
The survival of subaxial injuries was not significantly different from that of odontoid fractures (P = .113, Figure 6A). When analyzed by gender and controlled for age, the rates in both male (P = .347, Figure 6B) and female (P = .643, Figure 6C) patients did not differ between fracture types.
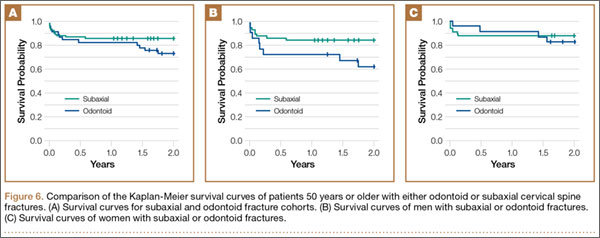
Discussion
The US population is aging rapidly, with the demographic older than 65 years predicted to more than double in size between 2010 and 2050.47 As our elderly population grows, the incidence of age-related injuries will rise accordingly. An understanding of mortality risks associated with different fractures will not only assist practitioners in advising patients regarding prognosis but may also lead to improvements in clinical care.19,48-50 While we know cervical spine trauma is associated with significant morbidity,29-31 little is known about associated moderate-term mortality rates that can be compared with other known injury patterns, such as hip fractures or osteoporotic compression fractures.
An interesting finding of the present study is the bimodal age distribution of the 59 odontoid fractures (Figure 2). The 14 patients younger than 50 years included 3 individuals who died, all within days of their presentation from severe multisystem trauma. This is consistent with the determination that high-energy forces are required to fracture the odontoid process in younger individuals.38,45,46,51,52 Given the severity of their nonspinal injuries, the cause of death was likely not primarily related to their odontoid fractures. Also in line with previous studies, the majority (76%) of odontoid fractures were documented in subjects older than 50 years.32,53,54 Within our cohort older than 50 years, the deaths appear to be spread evenly across age groups and do not seem to be skewed by the oldest portion of the population (Figure 2).
Our gender-specific analyses revealed that older men with odontoid injuries exhibited higher mortality compared with an age-matched male cohort, with 6 of the 8 deaths occurring within 3 months. However, after this exaggerated decline in survival, the rate normalized towards general population mortality rates (Figure 3B). As in the younger cohort, these earlier deaths were largely attributable to multisystem trauma, whereas medical comorbidities were implicated in those who died later. In contrast, the Kaplan-Meier curve of older women with odontoid fractures closely approximates that of age-matched women at every time point (Figure 3C), indicating that these injuries do not decrease survival as they do in their male counterparts.
When comparing the survival of older patients with subaxial cervical spine fractures with that of gender- and age-matched controls, the mortality rates of women were, once again, essentially equivalent. However, the survival of older men was significantly compromised by these injuries. In men, 7 of the 9 deaths were within 3 months, with the remaining 2 deaths occurring within 7 months. Nevertheless, beyond this initial period of elevated mortality, the survival curve again stabilized and paralleled that of the general population. As with odontoid fractures, there was no sustained increase in the mortality of male patients who lived at least 3 months after injury.
The mortality rates of odontoid and subaxial fractures were also compared in the older population. When controlled for age, there was no difference in mortality rates between these 2 groups. When individually analyzed in both men and women, the mortality rates of both fracture types matched those of the general population at all time points.
It is useful to contextualize our findings alongside the mortality of older individuals with other fracture types. Based on our results, we believe that the survival curves of geriatric men with odontoid or subaxial cervical spine fractures most closely resemble the characteristic pattern seen in hip fractures. Hip fractures have shown an early spike in mortality by as much as 8% to 49% in the first 6 to 12 months that returns to baseline after 1 year.1-10 This presumably reflects the natural history of these injuries in response to appropriate therapeutic interventions. Interestingly, the male mortality rates for both odontoid and subaxial cervical spine fractures in this study are largely analogous to those reported by various hip fracture surveys.1,5,55-58 In contrast, similar to prior studies of rib or wrist fractures, older women with these cervical spine fractures did not show a survival decrease after their injuries.12,16-18
While the reasons underlying the differential effects of cervical fractures on the mortality of men and women have not been established, one explanation is that the female geriatric population is relatively more osteoporotic; thus, cervical injuries may occur after lower-energy forces, leading to less severe associated trauma that could otherwise decrease survival. Another explanation is that men are more likely to be involved in high-energy accidents,59,60 thus decreasing their overall survival after injury.
This investigation is not without limitations. Our primary concern is the determination of survival. The NDI maintained by the NCHS is an extremely reliable tool regularly employed by epidemiologists to collect mortality data. However, it is possible that deaths may have been missed. We believe this number would be small, because the NDI database provided multiple probable matches that were carefully compared with supplemental personal information. It is also possible that deaths that were not appropriately registered with the NDI are not represented in this series. Another limitation lies in the determination of controls. As with any case–control study, the patients sustaining these odontoid fractures may differ in some significant way from the average population. A final limitation is that a small portion of patients in the study have only 1-year follow-up, because patient data was collected through 2006, although access to NDI data ended in 2007.
Conclusion
Our results indicate that the survival of older men with either odontoid or subaxial cervical spine fractures shares many of the same mortality characteristics as hip fractures, with diminished survival in the first 3 months that normalizes to the survival rate of the age-matched population. Interestingly, and perhaps because of disparate rates of osteoporosis and traumatic forces, the mortality rates in the female cohort were similar to that of the age-matched general population at all time points. These trends were nearly identical for both odontoid and subaxial cervical fractures.
1. Gennarelli TA, Champion HR, Sacco WJ, Copes WS, Alves WM. Mortality of patients with head injury and extracranial injury treated in trauma centers. J Trauma. 1989;29(9):1193-1201; discussion 1201-1202.
2. George GH, Patel S. Secondary prevention of hip fracture. Rheumatology (Oxford). 2000;39(4):346-349.
3. Gerrelts BD, Petersen EU, Mabry J, Petersen SR. Delayed diagnosis of cervical spine injuries. J Trauma. 1991;31(12):1622-1626.
4. Giannoudis PV, Mehta SS, Tsiridis E. Incidence and outcome of whiplash injury after multiple trauma. Spine. 2007;32(7):776-781.
5. Goldberg W, Mueller C, Panacek E, et al. Distribution and patterns of blunt traumatic cervical spine injury. Ann Emerg Med. 2001;38(1):17-21.
6. Grauer JN, Shafi B, Hilibrand AS, et al. Proposal of a modified, treatment-oriented classification of odontoid fractures. Spine J. 2005;5(2):123-129.
7. Greene KA, Dickman CA, Marciano FF, Drabier JB, Hadley MN, Sonntag VK. Acute axis fractures. Analysis of management and outcome in 340 consecutive cases. Spine. 1997;22(16):1843-1852.
8. Gulli B, Templeman D. Compartment syndrome of the lower extremity. Orthop Clin North Am. 1994;25(4):677-684.
9. Guthkelch AN, Fleischer AS. Patterns of cervical spine injury and their associated lesions. West J Med. 1987;147(4):428-431.
10. Hackl W, Hausberger K, Sailer R, Ulmer H, Gassner R. Prevalence of cervical spine injuries in patients with facial trauma. Oral Surg Oral Med Oral Pathol Oral Radiol Endod. 2001;92(4):370-376.
11. Doruk H, Mas MR, Yildiz C, Sonmez A, Kyrdemir V. The effect of the timing of hip fracture surgery on the activity of daily living and mortality in elderly. Arch Gerontol Geriatr. 2004;39(2):179-185.
12. Garabige V, Giraud P, De Rycke Y, et al. [Impact of nutrition management in patients with head and neck cancers treated with irradiation: is the nutritional intervention useful?]. Cancer Radiother. 2007;11(3):111-116.
13. Garbuz DS, Leitch K, Wright JG. The treatment of supracondylar fractures in children with an absent radial pulse. J Pediatr Orthop. 1996;16(5):594-596.
14. Henderson RL, Reid DC, Saboe LA. Multiple noncontiguous spine fractures. Spine. 1991;16(2):128-131.
15. Henrikson B. Supracondylar fracture of the humerus in children. A late review of end-results with special reference to the cause of deformity, disability and complications. Acta Chir Scand Suppl. 1966;369:1-72.
16. De Boeck H, De Smet P, Penders W, De Rydt D. Supracondylar elbow fractures with impaction of the medial condyle in children. J Pediatr Orthop. 1995;15(4):444-448.
17. Gelberman RH, Panagis JS, Taleisnik J, Baumgaertner M. The arterial anatomy of the human carpus. Part I: The extraosseous vascularity. J Hand Surg Am. 1983;8(4):367-375.
18. Hu J, Liao Q, Long W. Diagnosis and treatment of multiple-level noncontiguous spinal fractures. Zhongguo Xiu Fu Chong Jian Wai Ke Za Zhi. 2005;19(6):424-426.
19. Eleraky MA, Theodore N, Adams M, Rekate HL, Sonntag VK. Pediatric cervical spine injuries: report of 102 cases and review of the literature. J Neurosurg. 2000;92(1 suppl):12-17.
20. Ioannidis G, Papaioannou A, Hopman WM, et al. Relation between fractures and mortality: results from the Canadian Multicentre Osteoporosis Study. CMAJ. 2009;181(5):265-271.
21. Husby J, Sorensen KH. Fracture of the odontoid process of the axis. Acta Orthop Scand. 1974;45(2):182-192.
22. Schoenfeld AJ, Bono CM, Reichmann WM, et al. Type II odontoid fractures of the cervical spine: do treatment type and medical comorbidities affect mortality in elderly patients? Spine. 2011;36(11):879-885.
23. Ensrud KE, Thompson DE, Cauley JA, et al. Prevalent vertebral deformities predict mortality and hospitalization in older women with low bone mass. Fracture Intervention Trial Research Group. J Am Geriatr Soc. 2000;48(3):241-249.
24. Fassett DR, Dailey AT, Vaccaro AR. Vertebral artery injuries associated with cervical spine injuries: a review of the literature. J Spinal Disord Tech. 2008;21(4):252-258.
25. Ippolito E, Caterini R, Scola E. Supracondylar fractures of the humerus in children. Analysis at maturity of fifty-three patients treated conservatively. J Bone Joint Surg Am. 1986;68(3):333-344.
26. Spence KF Jr, Decker S, Sell KW. Bursting atlantal fracture associated with rupture of the transverse ligament. J Bone Joint Surg Am. 1970;52(3):543-549.
27. Irwin ZN, Arthur M, Mullins RJ, Hart RA. Variations in injury patterns, treatment, and outcome for spinal fracture and paralysis in adult versus geriatric patients. Spine. 2004;29(7):796-802.
28. Ismail AA, O’Neill TW, Cooper C, et al. Mortality associated with vertebral deformity in men and women: results from the European Prospective Osteoporosis Study (EPOS). Osteoporos Int. 1998;8(3):291-297.
29. Iyengar SR, Hoffinger SA, Townsend DR. Early versus delayed reduction and pinning of type III displaced supracondylar fractures of the humerus in children: a comparative study. J Orthop Trauma. 1999;13(1):51-55.
30. Jackson AP, Haak MH, Khan N, Meyer PR. Cervical spine injuries in the elderly: acute postoperative mortality. Spine. 2005;30(13):1524-1527.
31. Jacobsen SJ, Goldberg J, Miles TP, Brody JA, Stiers W, Rimm AA. Race and sex differences in mortality following fracture of the hip. Am J Public Health. 1992;82(8):1147-1150.
32. Fisher ES, Baron JA, Malenka DJ, et al. Hip fracture incidence and mortality in New England. Epidemiology. 1991;2(2):116-122.
33. Chapman J, Smith JS, Kopjar B, et al. The AOSpine North America Geriatric Odontoid Fracture Mortality Study: a retrospective review of mortality outcomes for operative versus nonoperative treatment of 322 patients with long-term follow-up. Spine. 2013;38:1098-1104.
34. Denault A, Bains I, Moghadam K, Hu RW, Swamy G. Evaluation of mortality following an odontoid fracture in the octogenarian population. J Bone Joint Surg Br. 2011;93(Supp IV):585.
35. Molinari WJ III, Molinari RW, Khera OA, Gruhn WL. Functional outcomes, morbidity, mortality, and fracture healing in 58 consecutive patients with geriatric odontoid fracture treated with cervical collar or posterior fusion. Global Spine J. 2013;3(1):21-32.
36. Hanigan WC, Powell FC, Elwood PW, Henderson JP. Odontoid fractures in elderly patients. J Neurosurg. 1993;78(1):32-35.
37. Korres DS, Boscainos PJ, Papagelopoulos PJ, Psycharis I, Goudelis G, Nikolopoulos K. Multiple level noncontiguous fractures of the spine. Clin Orthop. 2003;411:95-102.
38. Leet AI, Frisancho J, Ebramzadeh E. Delayed treatment of type 3 supracondylar humerus fractures in children. J Pediatr Orthop. 2002;22(2):203-207.
39. Leone A, Cerase A, Colosimo C, Lauro L, Puca A, Marano P. Occipital condylar fractures: a review. Radiology. 2000;216(3):635-644.
40. Lyles KW, Colón-Emeric CS, Magaziner JS, et al; HORIZON Recurrent Fracture Trial. Zoledronic acid and clinical fractures and mortality after hip fracture. N Engl J Med. 2007;357(18):1799-1809.
41. Müller EJ, Wick M, Russe O, Muhr G. Management of odontoid fractures in the elderly. Eur Spine J. 1999;8(5):360-365.
42. Pepin JW, Bourne RB, Hawkins RJ. Odontoid fractures, with special reference to the elderly patient. Clin Orthop. 1985;193:178-183.
43. Ryan MD, Henderson JJ. The epidemiology of fractures and fracture-dislocations of the cervical spine. Injury. 1992;23(1):38-40.
44. Butler JS, Dolan RT, Burbridge M, et al. The long-term functional outcome of type II odontoid fractures managed non-operatively. Eur Spine J. 2010;19(10):1635-1642.
45. Levine AM, Edwards CC. The management of traumatic spondylolisthesis of the axis. J Bone Joint Surg Am. 1985;67(2):217-226.
46. Lowery DW, Wald MM, Browne BJ, Tigges S, Hoffman JR, Mover WR; NEXUS Group. Epidemiology of cervical spine injury victims. Ann Emerg Med. 2001;38(1):12-16.
47. Jacobsen LA, Kent M, Lee M, Mather M. America’s aging population. Popul Bull. 2011;66(1):1-16. http://www.prb.org/pdf11/aging-in-america.pdf. Published February 2011. Accessed April 22, 2015.
48. Holly LT, Kelly DF, Counelis GJ, Blinman T, McArthur DL, Cryer HG. Cervical spine trauma associated with moderate and severe head injury: incidence, risk factors, and injury characteristics. J Neurosurg. 2002;96(3 suppl):285-291.
49. Holmes JF, Akkinepalli R. Computed tomography versus plain radiography to screen for cervical spine injury: a meta-analysis. J Trauma. 2005;58(5):902-905.
50. Hove LM. Epidemiology of scaphoid fractures in Bergen, Norway. Scand J Plast Reconstr Surg Hand Surg. 1999;33(4):423-426.
51. Lu-Yao G, Baron Ja, Barrett Ja, Fisher Es. Treatment and survival among elderly Americans with hip fractures: a population-based study. Am J Public Health. 1994;84(8):1287-1291.
52. Lu-Yao GL, Keller RB, Littenberg B, Wennberg JE. Outcomes after displaced fractures of the femoral neck. A meta-analysis of one hundred and six published reports. J Bone Joint Surg Am. 1994;76(1):15-25.
53. Kado DM, Browner WS, Palermo L, Nevitt MC, Genant HK, Cummings SR. Vertebral fractures and mortality in older women: a prospective study. Study of Osteoporotic Fractures Research Group. Arch Intern Med. 1999;159(11):1215-1220.
54. Levine AM, Edwards CC. Fractures of the atlas. J Bone Joint Surg Am. 1991;73(5):680-691.
55. Maak TG, Grauer JN. The contemporary treatment of odontoid injuries. Spine. 2006;31(11 Suppl):S53-S60; discussion S61.
56. Magaziner J, Fredman L, Hawkes W, et al. Changes in functional status attributable to hip fracture: a comparison of hip fracture patients to community-dwelling aged. Am J Epidemiol. 2003;157(11):1023-1031.
57. Magaziner J, Hawkes W, Hebel JR, et al. Recovery from hip fracture in eight areas of function. J Gerontol A Biol Sci Med Sci. 2000;55(9):M498-M507.
58. Malham GM, Ackland HM, Jones R, Williamson OD, Varma DK. Occipital condyle fractures: incidence and clinical follow-up at a level 1 trauma centre. Emerg Radiol. 2009;16(4):291-297.
59. Probst C, Zelle B, Panzica M, et al. Clinical re-examination 10 or more years after polytrauma: is there a gender related difference? J Trauma. 2010;68(3):706-711.
60. Holbrook TL, Hoyt DB, Anderson JP. The importance of gender on outcome after major trauma: functional and psychologic outcomes in women versus men. J Trauma. 2001;50(2):270-273.
Mortality rate is an important indicator of the severity of traumatic injuries, and these values have been described for different orthopedic injuries and fractures. Studies have identified 3 distinct trends in patient survival when compared with the age- and sex-matched uninjured population:
1. Hip fractures bring about a transient increase in mortality relative to age-matched controls that normalizes after a few months to 1 year.1-10
2. Thoracic and lumbar compression fractures are associated with an ongoing, lifelong increase in mortality rate relative to age-matched controls without an initial marked upswing.11-15
3. Certain injuries such as isolated rib or wrist fractures do not adversely affect survival relative to age-matched controls.12,16-18
Understanding the mortality patterns after these injuries can help guide management and even facilitate the development of appropriate treatment algorithms.19-21 While studies have examined mortality in specific odontoid fracture types,22 such mortality trends have not been broadly established in persons with cervical spine fractures.
Cervical spine fractures are common: 60% of spine fractures localize to this region,23-26 and this equates to 2% to 3% of all blunt-trauma patients.27,28 These injuries can lead to devastating consequences, including neurologic compromise, permanent disability, and death.29-31
Studies have estimated that up to 20% of cervical fractures involve the odontoid process.23-26 These injuries are more common among the elderly population because of their greater prevalence of osteoporosis and likelihood of falling.32 Because of demographic similarities to those of the hip fracture population, a survival analysis of all odontoid fractures is particularly interesting. Published odontoid mortality rates vary significantly, with reports ranging from 13% to 44%.22,33-35 Unfortunately, these studies largely evaluated survival rates specific to an individual treatment modality, such as nonoperative compared with operative, or specific to certain odontoid fracture types (eg, type II). Additionally, studies have generally only considered survivorship during initial hospitalization, have been specific to a constrained age group, or have been based solely on inpatient records that do not permit the longer-term follow-up critical to determining the effect of odontoid fractures on overall mortality.36-39
Likewise, mortality rates after fractures of the subaxial spine (ie, the motion segments between C3 and C7) have yet to be established. In 1 study, the mortality risk of a cohort of elderly patients with cervical fractures appeared to be elevated for the first 6 to 12 months after the traumatic event.40 However, the sample size was too small to examine mortality beyond 1 year.
In this context, the purpose of the current study was to determine the mortality rates at several time points (3 months, 1 year, and 2 years) of patients 50 years or older (start of the second mode of the bimodal age distribution of odontoid fractures41-44) with fractures of the odontoid and subaxial cervical spine. A secondary purpose of this study was to compare survival rates of these 2 cohorts relative to each other and to the general population.
Materials and Methods
Identification of Cervical Fractures and Collection of Demographic Information
This protocol was approved by the human investigation committee of our institution. Every computed tomography (CT) scan of the cervical spine performed in the emergency department (ED) of an academic hospital between November 27, 1997, and December 31, 2006, was identified. Since the threshold for obtaining a CT scan of a patient with suspected cervical spine trauma is relatively low, it was assumed that virtually all acute cervical spine fractures during this time period would be successfully identified through this approach.
Radiology reports for all identified CT scans were reviewed for any findings consistent with acute fractures and/or dislocations of the cervical spine (Figure 1). Every study noted to be positive or equivocal for cervical trauma was directly visualized, including those that did not specifically mention the presence or absence of an injury. Scans with no signs of acute trauma or that showed fractures caused by a pathologic process or penetrating mechanism (eg, metastatic lesions or gunshot wounds) were omitted from this series. Finally, relevant demographic information, such as the medical record number, age, gender, and date of study, was recorded for every subject in this group.
Fracture Classification
Next, the level and the type of cervical injury were documented for each patient. Fractures were segregated according to their involvement with the odontoid or the subaxial vertebrae.
Odontoid fractures were categorized into type I (limited to the tip), type II (across the base of the process) and type III (through the base with extension into the C2 vertebral body).45,46 Since many systems for classifying subaxial cervical spine trauma require a subjective inference of the injury mechanism, which is difficult to ascertain from imaging studies alone, all of these fractures were pooled together.
A preliminary survey of the data indicated that the odontoid fractures appeared to exhibit a bimodal age distribution, with the beginning of the second cluster occurring around age 50 years (Figure 2). As noted above, this has been shown in previous studies.41-44 As a consequence, the mortalities of those older than 50 years became the focus of this study. To control for comorbid conditions, mechanism of injury, and to allow for more direct comparison with the odontoid fractures in this study, the same age demarcation was used for subaxial cervical fractures.
Mortality Data
The mortality status of every patient diagnosed with an acute cervical injury at our institution between November 27, 1997, and December 31, 2006, was determined by referencing the National Death Index (NDI). The NDI is a computerized database of death records maintained by the National Center for Health Statistics (NCHS). The time window for the current study was selected because we had access to NDI information only through 2007 at the time of this study. Social Security numbers (SSNs), which were available for approximately half of the subjects, were used to search the NDI catalog. For individuals whose SSNs were unavailable, patient names and birthdates were considered to be sufficient to confirm a true match. Our center’s medical records of this cohort were also examined to verify whether any had died during their initial hospitalizations and to substantiate the NDI data. Finally, patient deaths were categorized as trauma (eg, motor vehicle accident, fall from a height) or medical comorbidity (eg, diabetes mellitus, cancer, congestive heart failure), based on information in the NDI listing.
Age- and Sex-Matched Controls
Age- and sex-matched controls were determined from the Wide-ranging Online Data for Epidemiologic Research (WONDER) application distributed by the Centers for Disease Control and Prevention (http://wonder.cdc.gov). Composite mortality data from the state in which the study was performed was obtained for the years between 1999 and 2007, and this information was further stratified according to gender and age to estimate the mortality rates and construct survival curves for each group. Controls were used to establish a standardized mortality ratio (SMR) for subjects 50 years and older, a value that compares the number of observed deaths with the figure expected for matched populations from the general population.
Statistical Methods
Statistical analyses were performed by using both SAS 9.2 (SAS Institute Inc., Cary, North Carolina) and R (version 2.9; www.r-project.org, Auckland, New Zealand). Relevant comparisons were planned, and all tests were 2-sided. The Wilcoxon rank sum test was applied to compare the survival times of patients with odontoid fractures with different documented causes of death, and Pearson χ2 test was used to compare the age distributions of odontoid and subaxial fractures. Survival rates at 3 months, 1 year, and 2 years were estimated from Kaplan-Meier curves. The relative survival of these cohorts was compared by completing a 2-sample log-rank test. In addition, a 1-sample log-rank test was implemented to compare the mortality from either odontoid or subaxial cervical spine fractures with that of the age- and gender-matched general population. Statistical significance was defined as a 2-sided α error of less than 0.05 (P < .05).
Results
Fifty-nine patients were diagnosed with odontoid fractures (28 men, 31 women), and 233 patients were diagnosed with subaxial cervical spine fractures (168 men, 65 women).
Odontoid Fracture Patients
Odontoid fracture patients exhibited a distinct bimodal age distribution (Figure 2). In the younger population, there were 14 subjects, 3 of whom died within days of the injury (mean, 12 days; 78.6% survival). At 2-year follow-up, there were no further deaths. The fractures that caused death were high-energy injuries, and only early deaths occurred in these cases.
Because of the significant bimodal age distribution, it was believed these cohorts could not be directly compared. As a result, the remaining analysis focused on the older age group. In the older population mode (50 years and older) were 45 patients with odontoid fractures. Of the 12 subjects who died after odontoid fracture, 5 were assigned a trauma code as the cause of death, while a medical comorbidity code was assigned for the remaining 7. Mean survival time of those who died secondary to trauma was significantly shorter than the medical comorbidity group (P = .025).
In the cohort of subjects older than 50 years, 3-month, 1-year, and 2-year survival rates were 84.4%, 82.2%, and 72.9%, respectively. Figure 2 shows the 1- and 2-year follow-up data by age group.
Analysis was performed relative to gender. Of male patients (n = 22), the 3-month, 1-year, and 2-year survival rates were 72.7%, 72.7%, and 62.7%, respectively. Among women (n = 23), the 3-month, 1-year, and 2-year survival rates were 95.7%, 91.3%, and 82.6%, respectively.
Figure 3 shows the Kaplan-Meier survival curves of the older patients with odontoid fractures. A comparison of the curves for each gender showed no significant disparities between the male and female survival (Figure 3A, P = .124). Compared with age-matched male counterparts, the survival of male subjects with odontoid fractures was significantly worse (Figure 3B, P < .001). Men experienced an initial acute decline in survival, with the remainder of the survival curve matching that of the general male population. In contrast, odontoid fractures did not adversely affect female survival compared with the matched population (Figure 3C, P = .568).
The 2-year SMR of 2.98 for men showed that odontoid fractures led to greater mortality compared with a sex- and age-matched population. This means that men older than 50 years who sustained an odontoid fracture had nearly 3 times the mortality rate after 2 years compared with a normal, matched population; this increase is attributed to the 3-month time point that subsequently normalized. The female rate was 1.33 times that of a matched population, a difference that is not statistically significant.
Subaxial Fracture Patients
Of the 91 patients older than 50 years with subaxial fractures, 3-month, 1-year, and 2-year survival rates were 87.9%, 85.7%, and 85.7%, respectively. Figure 4 shows the 1- and 2-year follow-up data by age group.
Gender-specific analysis was performed. For men (n = 58), the 3-month, 1-year, and 2-year survival rates were 87.9%, 84.5%, and 84.5%, respectively. Among women (n = 33), 4 deaths were recorded at all time points (87.9% survival).
Figure 5 shows Kaplan-Meier survival curves for the older population with subaxial fractures. A comparison of the curves between genders again showed no significant differences between male and female survival (P = .683, Figure 5A). Compared with age- and gender-matched counterparts, men showed decreased relative survival (P < .0001, Figure 5B), whereas subaxial fractures did not decrease female survival (P = .554, Figure 5C).
The 2-year SMR of 2.90 for men showed higher mortality rates relative to sex- and age-matched controls. Men who were both 50 years old and sustained a subaxial fracture were 2.9 times as likely to die within 2 years of follow-up compared with their counterparts. Similar to odontoid fractures, this increase occurred by the 3-month time point and subsequently normalized. The female rate, which was 1.34 times that of the uninjured population, was not statistically significant.
Comparison of Odontoid and Subaxial Fracture Patients
The survival of subaxial injuries was not significantly different from that of odontoid fractures (P = .113, Figure 6A). When analyzed by gender and controlled for age, the rates in both male (P = .347, Figure 6B) and female (P = .643, Figure 6C) patients did not differ between fracture types.
Discussion
The US population is aging rapidly, with the demographic older than 65 years predicted to more than double in size between 2010 and 2050.47 As our elderly population grows, the incidence of age-related injuries will rise accordingly. An understanding of mortality risks associated with different fractures will not only assist practitioners in advising patients regarding prognosis but may also lead to improvements in clinical care.19,48-50 While we know cervical spine trauma is associated with significant morbidity,29-31 little is known about associated moderate-term mortality rates that can be compared with other known injury patterns, such as hip fractures or osteoporotic compression fractures.
An interesting finding of the present study is the bimodal age distribution of the 59 odontoid fractures (Figure 2). The 14 patients younger than 50 years included 3 individuals who died, all within days of their presentation from severe multisystem trauma. This is consistent with the determination that high-energy forces are required to fracture the odontoid process in younger individuals.38,45,46,51,52 Given the severity of their nonspinal injuries, the cause of death was likely not primarily related to their odontoid fractures. Also in line with previous studies, the majority (76%) of odontoid fractures were documented in subjects older than 50 years.32,53,54 Within our cohort older than 50 years, the deaths appear to be spread evenly across age groups and do not seem to be skewed by the oldest portion of the population (Figure 2).
Our gender-specific analyses revealed that older men with odontoid injuries exhibited higher mortality compared with an age-matched male cohort, with 6 of the 8 deaths occurring within 3 months. However, after this exaggerated decline in survival, the rate normalized towards general population mortality rates (Figure 3B). As in the younger cohort, these earlier deaths were largely attributable to multisystem trauma, whereas medical comorbidities were implicated in those who died later. In contrast, the Kaplan-Meier curve of older women with odontoid fractures closely approximates that of age-matched women at every time point (Figure 3C), indicating that these injuries do not decrease survival as they do in their male counterparts.
When comparing the survival of older patients with subaxial cervical spine fractures with that of gender- and age-matched controls, the mortality rates of women were, once again, essentially equivalent. However, the survival of older men was significantly compromised by these injuries. In men, 7 of the 9 deaths were within 3 months, with the remaining 2 deaths occurring within 7 months. Nevertheless, beyond this initial period of elevated mortality, the survival curve again stabilized and paralleled that of the general population. As with odontoid fractures, there was no sustained increase in the mortality of male patients who lived at least 3 months after injury.
The mortality rates of odontoid and subaxial fractures were also compared in the older population. When controlled for age, there was no difference in mortality rates between these 2 groups. When individually analyzed in both men and women, the mortality rates of both fracture types matched those of the general population at all time points.
It is useful to contextualize our findings alongside the mortality of older individuals with other fracture types. Based on our results, we believe that the survival curves of geriatric men with odontoid or subaxial cervical spine fractures most closely resemble the characteristic pattern seen in hip fractures. Hip fractures have shown an early spike in mortality by as much as 8% to 49% in the first 6 to 12 months that returns to baseline after 1 year.1-10 This presumably reflects the natural history of these injuries in response to appropriate therapeutic interventions. Interestingly, the male mortality rates for both odontoid and subaxial cervical spine fractures in this study are largely analogous to those reported by various hip fracture surveys.1,5,55-58 In contrast, similar to prior studies of rib or wrist fractures, older women with these cervical spine fractures did not show a survival decrease after their injuries.12,16-18
While the reasons underlying the differential effects of cervical fractures on the mortality of men and women have not been established, one explanation is that the female geriatric population is relatively more osteoporotic; thus, cervical injuries may occur after lower-energy forces, leading to less severe associated trauma that could otherwise decrease survival. Another explanation is that men are more likely to be involved in high-energy accidents,59,60 thus decreasing their overall survival after injury.
This investigation is not without limitations. Our primary concern is the determination of survival. The NDI maintained by the NCHS is an extremely reliable tool regularly employed by epidemiologists to collect mortality data. However, it is possible that deaths may have been missed. We believe this number would be small, because the NDI database provided multiple probable matches that were carefully compared with supplemental personal information. It is also possible that deaths that were not appropriately registered with the NDI are not represented in this series. Another limitation lies in the determination of controls. As with any case–control study, the patients sustaining these odontoid fractures may differ in some significant way from the average population. A final limitation is that a small portion of patients in the study have only 1-year follow-up, because patient data was collected through 2006, although access to NDI data ended in 2007.
Conclusion
Our results indicate that the survival of older men with either odontoid or subaxial cervical spine fractures shares many of the same mortality characteristics as hip fractures, with diminished survival in the first 3 months that normalizes to the survival rate of the age-matched population. Interestingly, and perhaps because of disparate rates of osteoporosis and traumatic forces, the mortality rates in the female cohort were similar to that of the age-matched general population at all time points. These trends were nearly identical for both odontoid and subaxial cervical fractures.
1. Gennarelli TA, Champion HR, Sacco WJ, Copes WS, Alves WM. Mortality of patients with head injury and extracranial injury treated in trauma centers. J Trauma. 1989;29(9):1193-1201; discussion 1201-1202.
2. George GH, Patel S. Secondary prevention of hip fracture. Rheumatology (Oxford). 2000;39(4):346-349.
3. Gerrelts BD, Petersen EU, Mabry J, Petersen SR. Delayed diagnosis of cervical spine injuries. J Trauma. 1991;31(12):1622-1626.
4. Giannoudis PV, Mehta SS, Tsiridis E. Incidence and outcome of whiplash injury after multiple trauma. Spine. 2007;32(7):776-781.
5. Goldberg W, Mueller C, Panacek E, et al. Distribution and patterns of blunt traumatic cervical spine injury. Ann Emerg Med. 2001;38(1):17-21.
6. Grauer JN, Shafi B, Hilibrand AS, et al. Proposal of a modified, treatment-oriented classification of odontoid fractures. Spine J. 2005;5(2):123-129.
7. Greene KA, Dickman CA, Marciano FF, Drabier JB, Hadley MN, Sonntag VK. Acute axis fractures. Analysis of management and outcome in 340 consecutive cases. Spine. 1997;22(16):1843-1852.
8. Gulli B, Templeman D. Compartment syndrome of the lower extremity. Orthop Clin North Am. 1994;25(4):677-684.
9. Guthkelch AN, Fleischer AS. Patterns of cervical spine injury and their associated lesions. West J Med. 1987;147(4):428-431.
10. Hackl W, Hausberger K, Sailer R, Ulmer H, Gassner R. Prevalence of cervical spine injuries in patients with facial trauma. Oral Surg Oral Med Oral Pathol Oral Radiol Endod. 2001;92(4):370-376.
11. Doruk H, Mas MR, Yildiz C, Sonmez A, Kyrdemir V. The effect of the timing of hip fracture surgery on the activity of daily living and mortality in elderly. Arch Gerontol Geriatr. 2004;39(2):179-185.
12. Garabige V, Giraud P, De Rycke Y, et al. [Impact of nutrition management in patients with head and neck cancers treated with irradiation: is the nutritional intervention useful?]. Cancer Radiother. 2007;11(3):111-116.
13. Garbuz DS, Leitch K, Wright JG. The treatment of supracondylar fractures in children with an absent radial pulse. J Pediatr Orthop. 1996;16(5):594-596.
14. Henderson RL, Reid DC, Saboe LA. Multiple noncontiguous spine fractures. Spine. 1991;16(2):128-131.
15. Henrikson B. Supracondylar fracture of the humerus in children. A late review of end-results with special reference to the cause of deformity, disability and complications. Acta Chir Scand Suppl. 1966;369:1-72.
16. De Boeck H, De Smet P, Penders W, De Rydt D. Supracondylar elbow fractures with impaction of the medial condyle in children. J Pediatr Orthop. 1995;15(4):444-448.
17. Gelberman RH, Panagis JS, Taleisnik J, Baumgaertner M. The arterial anatomy of the human carpus. Part I: The extraosseous vascularity. J Hand Surg Am. 1983;8(4):367-375.
18. Hu J, Liao Q, Long W. Diagnosis and treatment of multiple-level noncontiguous spinal fractures. Zhongguo Xiu Fu Chong Jian Wai Ke Za Zhi. 2005;19(6):424-426.
19. Eleraky MA, Theodore N, Adams M, Rekate HL, Sonntag VK. Pediatric cervical spine injuries: report of 102 cases and review of the literature. J Neurosurg. 2000;92(1 suppl):12-17.
20. Ioannidis G, Papaioannou A, Hopman WM, et al. Relation between fractures and mortality: results from the Canadian Multicentre Osteoporosis Study. CMAJ. 2009;181(5):265-271.
21. Husby J, Sorensen KH. Fracture of the odontoid process of the axis. Acta Orthop Scand. 1974;45(2):182-192.
22. Schoenfeld AJ, Bono CM, Reichmann WM, et al. Type II odontoid fractures of the cervical spine: do treatment type and medical comorbidities affect mortality in elderly patients? Spine. 2011;36(11):879-885.
23. Ensrud KE, Thompson DE, Cauley JA, et al. Prevalent vertebral deformities predict mortality and hospitalization in older women with low bone mass. Fracture Intervention Trial Research Group. J Am Geriatr Soc. 2000;48(3):241-249.
24. Fassett DR, Dailey AT, Vaccaro AR. Vertebral artery injuries associated with cervical spine injuries: a review of the literature. J Spinal Disord Tech. 2008;21(4):252-258.
25. Ippolito E, Caterini R, Scola E. Supracondylar fractures of the humerus in children. Analysis at maturity of fifty-three patients treated conservatively. J Bone Joint Surg Am. 1986;68(3):333-344.
26. Spence KF Jr, Decker S, Sell KW. Bursting atlantal fracture associated with rupture of the transverse ligament. J Bone Joint Surg Am. 1970;52(3):543-549.
27. Irwin ZN, Arthur M, Mullins RJ, Hart RA. Variations in injury patterns, treatment, and outcome for spinal fracture and paralysis in adult versus geriatric patients. Spine. 2004;29(7):796-802.
28. Ismail AA, O’Neill TW, Cooper C, et al. Mortality associated with vertebral deformity in men and women: results from the European Prospective Osteoporosis Study (EPOS). Osteoporos Int. 1998;8(3):291-297.
29. Iyengar SR, Hoffinger SA, Townsend DR. Early versus delayed reduction and pinning of type III displaced supracondylar fractures of the humerus in children: a comparative study. J Orthop Trauma. 1999;13(1):51-55.
30. Jackson AP, Haak MH, Khan N, Meyer PR. Cervical spine injuries in the elderly: acute postoperative mortality. Spine. 2005;30(13):1524-1527.
31. Jacobsen SJ, Goldberg J, Miles TP, Brody JA, Stiers W, Rimm AA. Race and sex differences in mortality following fracture of the hip. Am J Public Health. 1992;82(8):1147-1150.
32. Fisher ES, Baron JA, Malenka DJ, et al. Hip fracture incidence and mortality in New England. Epidemiology. 1991;2(2):116-122.
33. Chapman J, Smith JS, Kopjar B, et al. The AOSpine North America Geriatric Odontoid Fracture Mortality Study: a retrospective review of mortality outcomes for operative versus nonoperative treatment of 322 patients with long-term follow-up. Spine. 2013;38:1098-1104.
34. Denault A, Bains I, Moghadam K, Hu RW, Swamy G. Evaluation of mortality following an odontoid fracture in the octogenarian population. J Bone Joint Surg Br. 2011;93(Supp IV):585.
35. Molinari WJ III, Molinari RW, Khera OA, Gruhn WL. Functional outcomes, morbidity, mortality, and fracture healing in 58 consecutive patients with geriatric odontoid fracture treated with cervical collar or posterior fusion. Global Spine J. 2013;3(1):21-32.
36. Hanigan WC, Powell FC, Elwood PW, Henderson JP. Odontoid fractures in elderly patients. J Neurosurg. 1993;78(1):32-35.
37. Korres DS, Boscainos PJ, Papagelopoulos PJ, Psycharis I, Goudelis G, Nikolopoulos K. Multiple level noncontiguous fractures of the spine. Clin Orthop. 2003;411:95-102.
38. Leet AI, Frisancho J, Ebramzadeh E. Delayed treatment of type 3 supracondylar humerus fractures in children. J Pediatr Orthop. 2002;22(2):203-207.
39. Leone A, Cerase A, Colosimo C, Lauro L, Puca A, Marano P. Occipital condylar fractures: a review. Radiology. 2000;216(3):635-644.
40. Lyles KW, Colón-Emeric CS, Magaziner JS, et al; HORIZON Recurrent Fracture Trial. Zoledronic acid and clinical fractures and mortality after hip fracture. N Engl J Med. 2007;357(18):1799-1809.
41. Müller EJ, Wick M, Russe O, Muhr G. Management of odontoid fractures in the elderly. Eur Spine J. 1999;8(5):360-365.
42. Pepin JW, Bourne RB, Hawkins RJ. Odontoid fractures, with special reference to the elderly patient. Clin Orthop. 1985;193:178-183.
43. Ryan MD, Henderson JJ. The epidemiology of fractures and fracture-dislocations of the cervical spine. Injury. 1992;23(1):38-40.
44. Butler JS, Dolan RT, Burbridge M, et al. The long-term functional outcome of type II odontoid fractures managed non-operatively. Eur Spine J. 2010;19(10):1635-1642.
45. Levine AM, Edwards CC. The management of traumatic spondylolisthesis of the axis. J Bone Joint Surg Am. 1985;67(2):217-226.
46. Lowery DW, Wald MM, Browne BJ, Tigges S, Hoffman JR, Mover WR; NEXUS Group. Epidemiology of cervical spine injury victims. Ann Emerg Med. 2001;38(1):12-16.
47. Jacobsen LA, Kent M, Lee M, Mather M. America’s aging population. Popul Bull. 2011;66(1):1-16. http://www.prb.org/pdf11/aging-in-america.pdf. Published February 2011. Accessed April 22, 2015.
48. Holly LT, Kelly DF, Counelis GJ, Blinman T, McArthur DL, Cryer HG. Cervical spine trauma associated with moderate and severe head injury: incidence, risk factors, and injury characteristics. J Neurosurg. 2002;96(3 suppl):285-291.
49. Holmes JF, Akkinepalli R. Computed tomography versus plain radiography to screen for cervical spine injury: a meta-analysis. J Trauma. 2005;58(5):902-905.
50. Hove LM. Epidemiology of scaphoid fractures in Bergen, Norway. Scand J Plast Reconstr Surg Hand Surg. 1999;33(4):423-426.
51. Lu-Yao G, Baron Ja, Barrett Ja, Fisher Es. Treatment and survival among elderly Americans with hip fractures: a population-based study. Am J Public Health. 1994;84(8):1287-1291.
52. Lu-Yao GL, Keller RB, Littenberg B, Wennberg JE. Outcomes after displaced fractures of the femoral neck. A meta-analysis of one hundred and six published reports. J Bone Joint Surg Am. 1994;76(1):15-25.
53. Kado DM, Browner WS, Palermo L, Nevitt MC, Genant HK, Cummings SR. Vertebral fractures and mortality in older women: a prospective study. Study of Osteoporotic Fractures Research Group. Arch Intern Med. 1999;159(11):1215-1220.
54. Levine AM, Edwards CC. Fractures of the atlas. J Bone Joint Surg Am. 1991;73(5):680-691.
55. Maak TG, Grauer JN. The contemporary treatment of odontoid injuries. Spine. 2006;31(11 Suppl):S53-S60; discussion S61.
56. Magaziner J, Fredman L, Hawkes W, et al. Changes in functional status attributable to hip fracture: a comparison of hip fracture patients to community-dwelling aged. Am J Epidemiol. 2003;157(11):1023-1031.
57. Magaziner J, Hawkes W, Hebel JR, et al. Recovery from hip fracture in eight areas of function. J Gerontol A Biol Sci Med Sci. 2000;55(9):M498-M507.
58. Malham GM, Ackland HM, Jones R, Williamson OD, Varma DK. Occipital condyle fractures: incidence and clinical follow-up at a level 1 trauma centre. Emerg Radiol. 2009;16(4):291-297.
59. Probst C, Zelle B, Panzica M, et al. Clinical re-examination 10 or more years after polytrauma: is there a gender related difference? J Trauma. 2010;68(3):706-711.
60. Holbrook TL, Hoyt DB, Anderson JP. The importance of gender on outcome after major trauma: functional and psychologic outcomes in women versus men. J Trauma. 2001;50(2):270-273.
Improving Visual Estimates of Cervical Spine Range of Motion
Assessment of cervical spine range of motion (ROM) is an integral aspect of the physical examination for cervical conditions,1-3 surgical outcomes,4 and functional impairment.1 In fact, the emphasis being placed on such functional measures before and after treatments is increasing.4,5
Cervical spine range of motion is routinely used as an outcome measure in clinical studies.6-8 Underscoring the importance of defining cervical spine ROM, studies have found it to be a preoperative predictor of outcomes of anterior cervical surgery,9 and other studies have suggested it is a determinant of athletes’ return to play.10
Spinal ROM measurements can be used to determine the degree of disability experienced by a patient with a spinal condition as defined in the Guides to the Evaluation of Permanent Impairment by the American Medical Association (AMA).1 In the medicolegal realm, ROM measurements made by clinicians can influence the dollar amounts of awards in legal claims, and, according to the AMA guides, the difference in cervical spine ROM between normality and disability or impairment can be as little as 5°.
Although cervical spine ROM is routinely assessed and documented in clinical practice, no universal protocol exists for its evaluation.11,12 In fact, considerable inter-examiner variation in visual estimates of ROM has been found,13-16 and significant inaccuracies have been reported.17,18
Goniometers have been shown to be reliable and highly accurate, with low inter-examiner and intra-examiner variability.5,19-21 Nevertheless, logistics22 and costs21 generally limit their being accepted in routine clinical practice. Among many methods available for assessing ROM, visual estimation is the least reliable or accurate,23 but it is the quickest and least expensive and is recommended in textbooks that describe the spinal-specific physical examination.24 Despite the superiority of goniometers in measuring ROM, these significant barriers have limited their use in clinical practice. When assessing cervical spine ROM, most clinicians prefer visual estimates over goniometers.
We conducted a study to determine whether training could improve the accuracy of visual estimates. We compared the accuracy of visual estimates of cervical spine ROM with that of a radiographically validated electrogoniometer and then investigated whether accuracy and reliability of visual estimates could be improved with a session of instruction and demonstration. Assessments of accuracy were made immediately after and 1 month after this training session.
Materials and Methods
Assessments Made Before Training
This study was approved by our institution’s human investigation committee and was conducted in accordance with the ethical standards of that committee.
Cervical spine ROM was assessed by 8 examiners (2 attending spine surgeons, 4 orthopedic residents, 2 medical students). They were informed they would be participating in a study evaluating visual estimates of motion but were given no other information prior to the study.
Four healthy volunteer subjects (examiners who rotated through the role) were assessed. No subject reported any ongoing neck or spine discomfort or had had any previous spinal surgery. One at a time, subjects were fitted with a cervical harness electrogoniometer capable of measuring angulation of the cervical spine to the nearest degree (modified electrogoniometer, torsiometer, and display from Biometrics, Gwent, UK; Figures 1A, 1B). This electrogoniometer has been shown to have a mean (SD) error of 2.3° (2.6°) relative to radiographic assessments.8
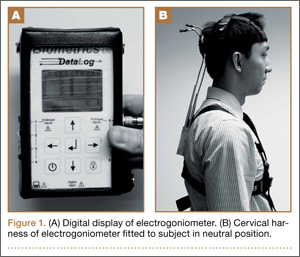
With the electrogoniometer fitted, each subject was instructed to sit upright in a chair with his back to the backrest and his head neutrally positioned. The electrogoniometer was then zeroed, and the subject proceeded with 5 series of flexion-extension, left and right lateral bending, and left and right rotation movements. The subject was instructed to make 1 movement in full motion in each direction and the other 4 movements in less than full motion to yield a variety of excursions for assessment. Each subject was instructed to pause at the apex of each motion. During these pauses, the examiners recorded their visual estimates of movement in each direction while the investigator recorded degrees of motion (displayed by the electrogoniometer) in flexion-extension, lateral bending, and rotation (Figures 2A–2D). The electrogoniometer display was not visible to subjects or examiners.
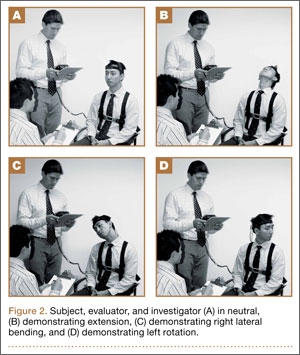
A total of 840 independent visual estimates of 120 distinct movements were recorded.
Training, and Assessments Made Immediately Thereafter
After the first round of visual estimates, the 8 examiners were verbally instructed in cervical spine ROM assessment and were asked to observe 1 subject, fitted with the electrogoniometer, demonstrating partial and full cervical motions while the investigator announced the electrogoniometric measurements. The motions demonstrated included 15°, 30°, and the extremes of cervical spine ROM in each of 6 directions from neutral.
After this training session, each of the 4 subjects from the first round of assessments was again fitted with the harness electrogoniometer and instructed to repeat the movements in turn while examiners visually estimated cervical spine ROM and independently recorded their estimates. Meanwhile, the investigator recorded the degree of motion during each movement (as measured by the electrogoniometer). Again, a total of 840 independent visual estimates of 120 distinct movements were recorded.
Assessments Made 1 Month After Training
One month after the training session, the examiners and the investigator reconvened to assess the same 4 subjects using a procedure for simultaneous visual estimation and electrogoniometric measurement identical to that used 1 month earlier. No additional training was given. Again, 840 independent visual estimates of 120 distinct movements were recorded.
Data Analysis
The reliabilities of visual estimates were analyzed by calculating the intraclass coefficients (ICCs) using random-effect 1-way analyses of variance. By convention, ICCs of < 0.2, 0.2 to 0.39, 0.4 to 0.59, 0.6 to 0.8, and > 0.8 correspond to poor, fair, moderate, substantial, and perfect reliability, respectively.25
We compared the visual estimates and electrogoniometric measurements made for 3 planes of motion (flexion-extension, lateral bending, axial rotation) before, immediately after, and 1 month after training and drew trend lines generated by linear regression relative to a line of perfect correlation.
Mean errors in examiners’ visual estimates (relative to electrogoniometric measurements) made before, immediately after, and 1 month after training were calculated. Paired Student t tests were then used to compare the mean errors before training with the mean errors immediately after and 1 month after training.
All analyses were performed with SPSS for Windows 16.0 (SPSS, Chicago, Illinois).
Results
Inter-examiner reliability of the visual estimates in all planes of motion ranged from 0.51 to 0.79 (suggestive of moderate to substantial reliability). For reference, standard goniometers measuring knee ROM have inter-examiner ICCs of 0.89 to 0.9826 (suggestive of perfect reliability). The ICCs before, immediately after, and 1 month after training were not significantly different.
As expected, there were significant errors in visual estimates of cervical spine ROM in all planes. Initial errors in visual estimates (relative to electrogoniometric measurements) were 23.9° (flexion-extension), 15.5° (lateral bending), and 19.3° (axial rotation) (Table, Figure 3).
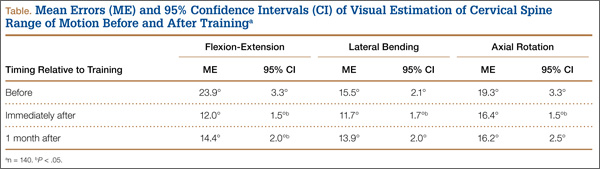
Immediately after training, mean errors in visual estimates decreased to 12.0° (flexion-extension), 11.7° (lateral bending), and 16.4° (axial rotation) (Table, Figure 3). In all 3 planes of cervical motion, these improvements were statistically significant.
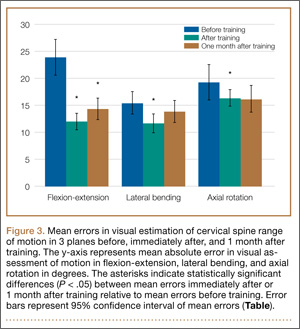
One month after training, mean errors in visual estimates were 14.4° (flexion-extension), 13.9° (lateral bending), and 16.2° (axial rotation) (Table, Figure 3). Only the improvement in the estimate of flexion-extension (the direction of the largest error initially) remained statistically significant—a 39.7% decrease in error.
We also considered how errors varied with degree of motion observed. In flexion-extension, the tendency to overestimate at larger degrees of motion was not apparent after training, and 1 month after training we found a tendency to underestimate at smaller degrees of motion (Figure 4A). The tendency to overestimate lateral bending before training did not persist immediately after or 1 month after training (Figure 4B). Estimates of axial rotation correlated well with goniometer measurements before training and were also well correlated immediately after and 1 month after training (Figure 4C).
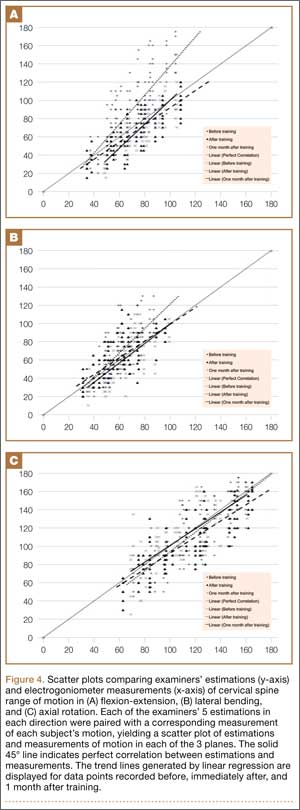
Discussion
Visual estimation of spinal motion is unreliable and inaccurate, but its widespread use in clinical practice continues. Goniometers are far more accurate and reliable but are seldom used. We investigated whether a training session featuring verbal instruction and demonstration with an electrogoniometer could improve visual estimates and whether potential improvement in visual estimates would remain 1 month after training.
Widely variable ICCs (0.42-0.90) have been reported for visual estimates of cervical spine ROM.17,18,22 Our findings on the reliability of these estimates are consistent with the literature.
We recorded the greatest initial error in estimates of motion in flexion-extension. Previous studies have also found the greatest error and least reliability in visual estimates in this plane.14,15,18 Visual estimation may be more difficult in flexion-extension because the shoulders cannot be used as landmarks, whereas they serve as approximate 90° reference points during estimation of lateral bending and axial rotation. Demonstration of 15°, 30° and the extremes of ROM during the training session may have provided alternative reference points during visual estimation after training—decreasing the error to within the range found in other planes of motion.
Initial errors in visual estimates were 23.9° (flexion-extension), 15.5° (lateral bending), and 19.3° (axial rotation). Based on normative cervical spine ROM in a healthy population— 126° ± 12° for flexion-extension, 86° ± 5° for lateral bending, 151° ± 23° for axial rotation22—the errors we identified are 18.9% of the normal range of flexion-extension, 18.0% of lateral bending, and 12.8% of axial rotation.
Training clearly improved the accuracy of visual estimates of cervical spine ROM. Estimates were statistically improved for all planes immediately after training and remained significantly improved for flexion-extension (the plane of largest error initially) 1 month after training. Before training, mean errors varied across planes. Training normalized mean errors to about 15°, and this effect lasted in flexion-extension, lateral bending, and axial rotation (Figures 4A–4C). Of note, before training these percentage errors increased with increased motion from neutral in the flexion-extension and lateral bending planes. At full ROM, percentage errors in estimates were greater. After training, percentage errors did not increase appreciably with increasing motion.
Readers will naturally reflect on the clinical significance of the motion assessment improvements demonstrated after the training session described in this study. We must be aware that functional assessments are increasingly being emphasized in the clinical arena—with respect to clinical conditions, surgical outcomes, and functional impairments. We highlight a point made earlier: A difference of only 5° can affect impairment ratings in the medicolegal realm.1 In estimating flexion-extension motion, lasting improvements of almost 10° were demonstrated and maintained 1 month after the training session described in this study.
Nevertheless, mean errors in visual estimation remained at about 15° in all planes of motion, despite our modest improvements. This finding raises the question of whether visually estimated ROM should be pertinent to assessments of impairment and disability. Although visual estimates of ROM may have more utility as a screening test for impairment and disability, fine differences in ROM simply cannot be reliably assessed by visual estimation.
This study has limitations. First, it was conducted at a single institution where the evaluators received most of their training. Their skill in visually estimating cervical spine ROM may not be generalizable to a larger population of spine specialists who are practicing at other institutions and may have different training backgrounds.
Second, only healthy subjects were assessed. Some studies of cervical spine ROM have shown better reliability in symptomatic subjects relative to asymptomatic subjects.13,14 To attempt to overcome this limitation, we assessed many different excursions of motion that were often not to the extremes of motion.
Third, the “gold standard” we used for motion assessment was an electrogoniometer, which has some inherent error (previously validated mean [SD] error of 2.3° [2.6°] relative to radiographs8). Although obtaining radiographs of each movement would have more closely resembled the gold standard, the radiation dose associated with such a study is prohibitive.
Last, the assessors included medical students. The medical students’ estimates, however, tended to be more accurate than the residents’ or attending surgeons’ (though the difference was not statistically significant). This tendency may reflect the medical students’ closer attention to detail. Clearly, including medical students in the study did not negatively affect the accuracy of the estimates or the validity of our findings.
Conclusion
Despite its limitations, visual assessment of cervical spine motion remains the gold standard in clinical practice and is routinely recorded and reported. Mean errors ranged from 15.5° to 23.9°, depending on plane of motion being assessed, but these improved after a training session.
Visual estimates of motion in flexion-extension were most improved by training, as the initial errors in this plane were the largest. Statistically significant improvement of about 10° remained for flexion-extension motion estimates 1 month after training.
During a time when we are increasingly emphasizing functional outcomes, such a degree of improvement could be of clinical significance. Our study results support a call for more formalized training of ROM assessment, but clinicians should also be aware of the limitations of visual estimates of cervical spine ROM, and our study results support scrutiny of visual assessment of ROM as a criterion for diagnosing permanent impairment or disability.
1. Rondinelli RD, Genovese E, Brigham CR; American Medical Association. Guides to the Evaluation of Permanent Impairment. 6th ed. Chicago, IL: American Medical Association; 2008.
2. Hall TM, Briffa K, Hopper D, Robinson K. Comparative analysis and diagnostic accuracy of the cervical flexion-rotation test. J Headache Pain. 2010;11(5):391-397.
3. De Hertogh WJ, Vaes PH, Vijverman V, De Cordt A, Duquet W. The clinical examination of neck pain patients: the validity of a group of tests. Man Ther. 2007;12(1):50-55.
4. Koller H, Resch H, Acosta F, et al. Assessment of two measurement techniques of cervical spine and C1–C2 rotation in the outcome research of axis fractures: a morphometrical analysis using dynamic computed tomography scanning. Spine. 2010;35(3):286-290.
5. Garrett TR, Youdas JW, Madson TJ. Reliability of measuring forward head posture in a clinical setting. J Orthop Sports Phys Ther. 1993;17(3):155-160.
6. Pearcy MJ, Tibrewal SB. Axial rotation and lateral bending in the normal lumbar spine measured by three-dimensional radiography. Spine. 1984;9(6):582-587.
7. Hayes MA, Howard TC, Gruel CR, Kopta JA. Roentgenographic evaluation of lumbar spine flexion-extension in asymptomatic individuals. Spine. 1989;14(3):327-331.
8. Bible JE, Biswas D, Miller CP, Whang PG, Grauer JN. Normal functional range of motion of the cervical spine during 15 activities of daily living. J Spinal Disord Tech. 2010;23(1):15-21.
9. Penning L. Normal movements of the cervical spine. AJR Am J Roentgenol. 1978;130(2):317-326.
10. Mayer TG, Tencer AF, Kristoferson S, Mooney V. Use of noninvasive techniques for quantification of spinal range-of-motion in normal subjects and chronic low-back dysfunction patients. Spine. 1984;9(6):588-595.
11. Williams MA, McCarthy CJ, Chorti A, Cooke MW, Gates S. A systematic review of reliability and validity studies of methods for measuring active and passive cervical range of motion. J Manipulative Physiol Ther. 2010;33(2):138-155.
12. Schaufele MK, Boden SD. Physical function measurements in neck pain. Phys Med Rehabil Clin North Am. 2003;14(3):569-588.
13. Fjellner A, Bexander C, Faleij R, Strender LE. Interexaminer reliability in physical examination of the cervical spine. J Manipulative Physiol Ther. 1999;22(8):511-516.
14. Nilsson N, Christensen HW, Hartvigsen J. The interexaminer reliability of measuring passive cervical range of motion, revisited. J Manipulative Physiol Ther. 1996;19(5):302-305.
15. Pool JJ, Hoving JL, de Vet HC, van Mameren H, Bouter LM. The interexaminer reproducibility of physical examination of the cervical spine. J Manipulative Physiol Ther. 2004;27(2):84-90.
16. Strender LE, Lundin M, Nell K. Interexaminer reliability in physical examination of the neck. J Manipulative Physiol Ther. 1997;20(8):516-520.
17. Youdas JW, Carey JR, Garrett TR. Reliability of measurements of cervical spine range of motion—comparison of three methods. Phys Ther. 1991;71(2):98-104.
18. Whitcroft KL, Massouh L, Amirfeyz R, Bannister G. Comparison of methods of measuring active cervical range of motion. Spine. 2010;35(19):E976-E980.
19. de Koning CH, van den Heuvel SP, Staal JB, Smits-Engelsman BC, Hendriks EJ. Clinimetric evaluation of active range of motion measures in patients with non-specific neck pain: a systematic review. Eur Spine J. 2008;17(7):905-921.
20. Christensen HW, Nilsson N. The reliability of measuring active and passive cervical range of motion: an observer-blinded and randomized repeated-measures design. J Manipulative Physiol Ther. 1998;21(5):341-347.
21. Florêncio LL, Pereira PA, Silva ER, Pegoretti KS, Gonçalves MC, Bevilaqua-Grossi D. Agreement and reliability of two non-invasive methods for assessing cervical range of motion among young adults. Rev Bras Fisioter. 2010;14(2):175-181.
22. Lea RD, Gerhardt JJ. Range-of-motion measurements. J Bone Joint Surg Am. 1995;77(5):784-798.
23. Youdas JW, Carey JR, Garrett TR. Reliability of measurements of cervical spine range of motion—comparison of three methods. Phys Ther. 1991;71(2):98-104.
24. Greene WB, Netter FH. Netter’s Orthopaedics. Philadelphia, PA: Saunders Elsevier; 2006.
25. Shrout PE, Fleiss JL. Intraclass correlations: uses in assessing rater reliability. Psychol Bull. 1979;86(2):420-428.
26. Brosseau L, Balmer S, Tousignant M, et al. Intra- and intertester reliability and criterion validity of the parallelogram and universal goniometers for measuring maximum active knee flexion and extension of patients with knee restrictions. Arch Phys Med Rehabil. 2001;82(3):396-402.
Assessment of cervical spine range of motion (ROM) is an integral aspect of the physical examination for cervical conditions,1-3 surgical outcomes,4 and functional impairment.1 In fact, the emphasis being placed on such functional measures before and after treatments is increasing.4,5
Cervical spine range of motion is routinely used as an outcome measure in clinical studies.6-8 Underscoring the importance of defining cervical spine ROM, studies have found it to be a preoperative predictor of outcomes of anterior cervical surgery,9 and other studies have suggested it is a determinant of athletes’ return to play.10
Spinal ROM measurements can be used to determine the degree of disability experienced by a patient with a spinal condition as defined in the Guides to the Evaluation of Permanent Impairment by the American Medical Association (AMA).1 In the medicolegal realm, ROM measurements made by clinicians can influence the dollar amounts of awards in legal claims, and, according to the AMA guides, the difference in cervical spine ROM between normality and disability or impairment can be as little as 5°.
Although cervical spine ROM is routinely assessed and documented in clinical practice, no universal protocol exists for its evaluation.11,12 In fact, considerable inter-examiner variation in visual estimates of ROM has been found,13-16 and significant inaccuracies have been reported.17,18
Goniometers have been shown to be reliable and highly accurate, with low inter-examiner and intra-examiner variability.5,19-21 Nevertheless, logistics22 and costs21 generally limit their being accepted in routine clinical practice. Among many methods available for assessing ROM, visual estimation is the least reliable or accurate,23 but it is the quickest and least expensive and is recommended in textbooks that describe the spinal-specific physical examination.24 Despite the superiority of goniometers in measuring ROM, these significant barriers have limited their use in clinical practice. When assessing cervical spine ROM, most clinicians prefer visual estimates over goniometers.
We conducted a study to determine whether training could improve the accuracy of visual estimates. We compared the accuracy of visual estimates of cervical spine ROM with that of a radiographically validated electrogoniometer and then investigated whether accuracy and reliability of visual estimates could be improved with a session of instruction and demonstration. Assessments of accuracy were made immediately after and 1 month after this training session.
Materials and Methods
Assessments Made Before Training
This study was approved by our institution’s human investigation committee and was conducted in accordance with the ethical standards of that committee.
Cervical spine ROM was assessed by 8 examiners (2 attending spine surgeons, 4 orthopedic residents, 2 medical students). They were informed they would be participating in a study evaluating visual estimates of motion but were given no other information prior to the study.
Four healthy volunteer subjects (examiners who rotated through the role) were assessed. No subject reported any ongoing neck or spine discomfort or had had any previous spinal surgery. One at a time, subjects were fitted with a cervical harness electrogoniometer capable of measuring angulation of the cervical spine to the nearest degree (modified electrogoniometer, torsiometer, and display from Biometrics, Gwent, UK; Figures 1A, 1B). This electrogoniometer has been shown to have a mean (SD) error of 2.3° (2.6°) relative to radiographic assessments.8
With the electrogoniometer fitted, each subject was instructed to sit upright in a chair with his back to the backrest and his head neutrally positioned. The electrogoniometer was then zeroed, and the subject proceeded with 5 series of flexion-extension, left and right lateral bending, and left and right rotation movements. The subject was instructed to make 1 movement in full motion in each direction and the other 4 movements in less than full motion to yield a variety of excursions for assessment. Each subject was instructed to pause at the apex of each motion. During these pauses, the examiners recorded their visual estimates of movement in each direction while the investigator recorded degrees of motion (displayed by the electrogoniometer) in flexion-extension, lateral bending, and rotation (Figures 2A–2D). The electrogoniometer display was not visible to subjects or examiners.
A total of 840 independent visual estimates of 120 distinct movements were recorded.
Training, and Assessments Made Immediately Thereafter
After the first round of visual estimates, the 8 examiners were verbally instructed in cervical spine ROM assessment and were asked to observe 1 subject, fitted with the electrogoniometer, demonstrating partial and full cervical motions while the investigator announced the electrogoniometric measurements. The motions demonstrated included 15°, 30°, and the extremes of cervical spine ROM in each of 6 directions from neutral.
After this training session, each of the 4 subjects from the first round of assessments was again fitted with the harness electrogoniometer and instructed to repeat the movements in turn while examiners visually estimated cervical spine ROM and independently recorded their estimates. Meanwhile, the investigator recorded the degree of motion during each movement (as measured by the electrogoniometer). Again, a total of 840 independent visual estimates of 120 distinct movements were recorded.
Assessments Made 1 Month After Training
One month after the training session, the examiners and the investigator reconvened to assess the same 4 subjects using a procedure for simultaneous visual estimation and electrogoniometric measurement identical to that used 1 month earlier. No additional training was given. Again, 840 independent visual estimates of 120 distinct movements were recorded.
Data Analysis
The reliabilities of visual estimates were analyzed by calculating the intraclass coefficients (ICCs) using random-effect 1-way analyses of variance. By convention, ICCs of < 0.2, 0.2 to 0.39, 0.4 to 0.59, 0.6 to 0.8, and > 0.8 correspond to poor, fair, moderate, substantial, and perfect reliability, respectively.25
We compared the visual estimates and electrogoniometric measurements made for 3 planes of motion (flexion-extension, lateral bending, axial rotation) before, immediately after, and 1 month after training and drew trend lines generated by linear regression relative to a line of perfect correlation.
Mean errors in examiners’ visual estimates (relative to electrogoniometric measurements) made before, immediately after, and 1 month after training were calculated. Paired Student t tests were then used to compare the mean errors before training with the mean errors immediately after and 1 month after training.
All analyses were performed with SPSS for Windows 16.0 (SPSS, Chicago, Illinois).
Results
Inter-examiner reliability of the visual estimates in all planes of motion ranged from 0.51 to 0.79 (suggestive of moderate to substantial reliability). For reference, standard goniometers measuring knee ROM have inter-examiner ICCs of 0.89 to 0.9826 (suggestive of perfect reliability). The ICCs before, immediately after, and 1 month after training were not significantly different.
As expected, there were significant errors in visual estimates of cervical spine ROM in all planes. Initial errors in visual estimates (relative to electrogoniometric measurements) were 23.9° (flexion-extension), 15.5° (lateral bending), and 19.3° (axial rotation) (Table, Figure 3).
Immediately after training, mean errors in visual estimates decreased to 12.0° (flexion-extension), 11.7° (lateral bending), and 16.4° (axial rotation) (Table, Figure 3). In all 3 planes of cervical motion, these improvements were statistically significant.
One month after training, mean errors in visual estimates were 14.4° (flexion-extension), 13.9° (lateral bending), and 16.2° (axial rotation) (Table, Figure 3). Only the improvement in the estimate of flexion-extension (the direction of the largest error initially) remained statistically significant—a 39.7% decrease in error.
We also considered how errors varied with degree of motion observed. In flexion-extension, the tendency to overestimate at larger degrees of motion was not apparent after training, and 1 month after training we found a tendency to underestimate at smaller degrees of motion (Figure 4A). The tendency to overestimate lateral bending before training did not persist immediately after or 1 month after training (Figure 4B). Estimates of axial rotation correlated well with goniometer measurements before training and were also well correlated immediately after and 1 month after training (Figure 4C).
Discussion
Visual estimation of spinal motion is unreliable and inaccurate, but its widespread use in clinical practice continues. Goniometers are far more accurate and reliable but are seldom used. We investigated whether a training session featuring verbal instruction and demonstration with an electrogoniometer could improve visual estimates and whether potential improvement in visual estimates would remain 1 month after training.
Widely variable ICCs (0.42-0.90) have been reported for visual estimates of cervical spine ROM.17,18,22 Our findings on the reliability of these estimates are consistent with the literature.
We recorded the greatest initial error in estimates of motion in flexion-extension. Previous studies have also found the greatest error and least reliability in visual estimates in this plane.14,15,18 Visual estimation may be more difficult in flexion-extension because the shoulders cannot be used as landmarks, whereas they serve as approximate 90° reference points during estimation of lateral bending and axial rotation. Demonstration of 15°, 30° and the extremes of ROM during the training session may have provided alternative reference points during visual estimation after training—decreasing the error to within the range found in other planes of motion.
Initial errors in visual estimates were 23.9° (flexion-extension), 15.5° (lateral bending), and 19.3° (axial rotation). Based on normative cervical spine ROM in a healthy population— 126° ± 12° for flexion-extension, 86° ± 5° for lateral bending, 151° ± 23° for axial rotation22—the errors we identified are 18.9% of the normal range of flexion-extension, 18.0% of lateral bending, and 12.8% of axial rotation.
Training clearly improved the accuracy of visual estimates of cervical spine ROM. Estimates were statistically improved for all planes immediately after training and remained significantly improved for flexion-extension (the plane of largest error initially) 1 month after training. Before training, mean errors varied across planes. Training normalized mean errors to about 15°, and this effect lasted in flexion-extension, lateral bending, and axial rotation (Figures 4A–4C). Of note, before training these percentage errors increased with increased motion from neutral in the flexion-extension and lateral bending planes. At full ROM, percentage errors in estimates were greater. After training, percentage errors did not increase appreciably with increasing motion.
Readers will naturally reflect on the clinical significance of the motion assessment improvements demonstrated after the training session described in this study. We must be aware that functional assessments are increasingly being emphasized in the clinical arena—with respect to clinical conditions, surgical outcomes, and functional impairments. We highlight a point made earlier: A difference of only 5° can affect impairment ratings in the medicolegal realm.1 In estimating flexion-extension motion, lasting improvements of almost 10° were demonstrated and maintained 1 month after the training session described in this study.
Nevertheless, mean errors in visual estimation remained at about 15° in all planes of motion, despite our modest improvements. This finding raises the question of whether visually estimated ROM should be pertinent to assessments of impairment and disability. Although visual estimates of ROM may have more utility as a screening test for impairment and disability, fine differences in ROM simply cannot be reliably assessed by visual estimation.
This study has limitations. First, it was conducted at a single institution where the evaluators received most of their training. Their skill in visually estimating cervical spine ROM may not be generalizable to a larger population of spine specialists who are practicing at other institutions and may have different training backgrounds.
Second, only healthy subjects were assessed. Some studies of cervical spine ROM have shown better reliability in symptomatic subjects relative to asymptomatic subjects.13,14 To attempt to overcome this limitation, we assessed many different excursions of motion that were often not to the extremes of motion.
Third, the “gold standard” we used for motion assessment was an electrogoniometer, which has some inherent error (previously validated mean [SD] error of 2.3° [2.6°] relative to radiographs8). Although obtaining radiographs of each movement would have more closely resembled the gold standard, the radiation dose associated with such a study is prohibitive.
Last, the assessors included medical students. The medical students’ estimates, however, tended to be more accurate than the residents’ or attending surgeons’ (though the difference was not statistically significant). This tendency may reflect the medical students’ closer attention to detail. Clearly, including medical students in the study did not negatively affect the accuracy of the estimates or the validity of our findings.
Conclusion
Despite its limitations, visual assessment of cervical spine motion remains the gold standard in clinical practice and is routinely recorded and reported. Mean errors ranged from 15.5° to 23.9°, depending on plane of motion being assessed, but these improved after a training session.
Visual estimates of motion in flexion-extension were most improved by training, as the initial errors in this plane were the largest. Statistically significant improvement of about 10° remained for flexion-extension motion estimates 1 month after training.
During a time when we are increasingly emphasizing functional outcomes, such a degree of improvement could be of clinical significance. Our study results support a call for more formalized training of ROM assessment, but clinicians should also be aware of the limitations of visual estimates of cervical spine ROM, and our study results support scrutiny of visual assessment of ROM as a criterion for diagnosing permanent impairment or disability.
1. Rondinelli RD, Genovese E, Brigham CR; American Medical Association. Guides to the Evaluation of Permanent Impairment. 6th ed. Chicago, IL: American Medical Association; 2008.
2. Hall TM, Briffa K, Hopper D, Robinson K. Comparative analysis and diagnostic accuracy of the cervical flexion-rotation test. J Headache Pain. 2010;11(5):391-397.
3. De Hertogh WJ, Vaes PH, Vijverman V, De Cordt A, Duquet W. The clinical examination of neck pain patients: the validity of a group of tests. Man Ther. 2007;12(1):50-55.
4. Koller H, Resch H, Acosta F, et al. Assessment of two measurement techniques of cervical spine and C1–C2 rotation in the outcome research of axis fractures: a morphometrical analysis using dynamic computed tomography scanning. Spine. 2010;35(3):286-290.
5. Garrett TR, Youdas JW, Madson TJ. Reliability of measuring forward head posture in a clinical setting. J Orthop Sports Phys Ther. 1993;17(3):155-160.
6. Pearcy MJ, Tibrewal SB. Axial rotation and lateral bending in the normal lumbar spine measured by three-dimensional radiography. Spine. 1984;9(6):582-587.
7. Hayes MA, Howard TC, Gruel CR, Kopta JA. Roentgenographic evaluation of lumbar spine flexion-extension in asymptomatic individuals. Spine. 1989;14(3):327-331.
8. Bible JE, Biswas D, Miller CP, Whang PG, Grauer JN. Normal functional range of motion of the cervical spine during 15 activities of daily living. J Spinal Disord Tech. 2010;23(1):15-21.
9. Penning L. Normal movements of the cervical spine. AJR Am J Roentgenol. 1978;130(2):317-326.
10. Mayer TG, Tencer AF, Kristoferson S, Mooney V. Use of noninvasive techniques for quantification of spinal range-of-motion in normal subjects and chronic low-back dysfunction patients. Spine. 1984;9(6):588-595.
11. Williams MA, McCarthy CJ, Chorti A, Cooke MW, Gates S. A systematic review of reliability and validity studies of methods for measuring active and passive cervical range of motion. J Manipulative Physiol Ther. 2010;33(2):138-155.
12. Schaufele MK, Boden SD. Physical function measurements in neck pain. Phys Med Rehabil Clin North Am. 2003;14(3):569-588.
13. Fjellner A, Bexander C, Faleij R, Strender LE. Interexaminer reliability in physical examination of the cervical spine. J Manipulative Physiol Ther. 1999;22(8):511-516.
14. Nilsson N, Christensen HW, Hartvigsen J. The interexaminer reliability of measuring passive cervical range of motion, revisited. J Manipulative Physiol Ther. 1996;19(5):302-305.
15. Pool JJ, Hoving JL, de Vet HC, van Mameren H, Bouter LM. The interexaminer reproducibility of physical examination of the cervical spine. J Manipulative Physiol Ther. 2004;27(2):84-90.
16. Strender LE, Lundin M, Nell K. Interexaminer reliability in physical examination of the neck. J Manipulative Physiol Ther. 1997;20(8):516-520.
17. Youdas JW, Carey JR, Garrett TR. Reliability of measurements of cervical spine range of motion—comparison of three methods. Phys Ther. 1991;71(2):98-104.
18. Whitcroft KL, Massouh L, Amirfeyz R, Bannister G. Comparison of methods of measuring active cervical range of motion. Spine. 2010;35(19):E976-E980.
19. de Koning CH, van den Heuvel SP, Staal JB, Smits-Engelsman BC, Hendriks EJ. Clinimetric evaluation of active range of motion measures in patients with non-specific neck pain: a systematic review. Eur Spine J. 2008;17(7):905-921.
20. Christensen HW, Nilsson N. The reliability of measuring active and passive cervical range of motion: an observer-blinded and randomized repeated-measures design. J Manipulative Physiol Ther. 1998;21(5):341-347.
21. Florêncio LL, Pereira PA, Silva ER, Pegoretti KS, Gonçalves MC, Bevilaqua-Grossi D. Agreement and reliability of two non-invasive methods for assessing cervical range of motion among young adults. Rev Bras Fisioter. 2010;14(2):175-181.
22. Lea RD, Gerhardt JJ. Range-of-motion measurements. J Bone Joint Surg Am. 1995;77(5):784-798.
23. Youdas JW, Carey JR, Garrett TR. Reliability of measurements of cervical spine range of motion—comparison of three methods. Phys Ther. 1991;71(2):98-104.
24. Greene WB, Netter FH. Netter’s Orthopaedics. Philadelphia, PA: Saunders Elsevier; 2006.
25. Shrout PE, Fleiss JL. Intraclass correlations: uses in assessing rater reliability. Psychol Bull. 1979;86(2):420-428.
26. Brosseau L, Balmer S, Tousignant M, et al. Intra- and intertester reliability and criterion validity of the parallelogram and universal goniometers for measuring maximum active knee flexion and extension of patients with knee restrictions. Arch Phys Med Rehabil. 2001;82(3):396-402.