User login
Length of Stay and Readmission After Total Shoulder Arthroplasty: An Analysis of 1505 Cases
Use of total shoulder arthroplasty (TSA) and reverse TSA for shoulder conditions has increased dramatically in recent years.1 Approximately 27,000 standard TSAs were performed in the United States in 2008, and this number is expected to double by 2015.2 TSA provides excellent pain relief, restoration of function, and patient satisfaction.3 The evolution of implant design over the past 25 years has contributed to excellent long-term implant survival, with rates comparable to those of total knee and hip arthroplasty.4 Similarly, compared with previous designs, contemporary designs and techniques have resulted in fewer complications.5
Several studies have investigated the long-term complications of TSA. These complications include prosthetic loosening, instability, periprosthetic fracture, rotator cuff tears, nerve injury, and deltoid dysfunction.6-11 In addition, Waterman and colleagues11 very recently assessed the influence of risk factors on short-term postoperative complications of TSA. However, none of these studies has assessed the influence of multiple risk factors on postoperative length of stay (LOS) after TSA. Only 1 study, using data from 2005 and earlier, has analyzed the potential effect of multiple patient characteristics on readmission after TSA12; other studies have been only descriptive.13-16
We conducted a retrospective cohort study to characterize the risk factors for extended LOS and readmission after TSA in a large sample of patients drawn from a national database. We hypothesized that patient factors, including age, sex, and obesity, would be significantly associated with postoperative LOS and readmission after TSA. National databases have been increasingly used in orthopedic research, as they offer particular advantages. Large sample sizes allow for powerful analyses of associations—analyses previously not possible in single-surgeon and single-institution studies. In addition, use of a large, national patient sample allows us to draw generalizable conclusions to better define patients’ and physicians’ postoperative expectations.
Methods
We conducted a retrospective cohort study using the American College of Surgeons National Surgical Quality Improvement Program (ACS-NSQIP) database. ACS-NSQIP collects 150 patient variables from 374 participating US hospitals.17 Patients are prospectively identified, and information is collected from operative reports, medical records, and patient interviews by trained clinical reviewers.17,18 Routine auditing by the program ensures high-quality data, with reported interrater disagreement below 2% for all variables. Data are collected through the 30th postoperative day, including after discharge.
This study was granted an exemption from our institutional review board, as we used a deidentified and publicly available database. Patients who were 60 years or older and underwent TSA between 2011 and 2012 were identified in the ACS-NSQIP database. TSA patients were identified using Current Procedural Terminology (CPT) code 23472, which includes TSA and reverse TSA procedures.
Patients were divided into groups based on surgical indications, which were available as International Classification of Diseases, Ninth Revision (ICD-9) diagnosis codes. Patients with postoperative ICD-9 codes 714.0 (rheumatoid arthritis), 715.0-9 (osteoarthritis), 716.61/716.81/716.91 (unspecified arthropathy), 718.01 (articular cartilage disorder), 718.31 (recurrent dislocation of shoulder), 718.81 (other joint derangement of shoulder), 719.41/719.91 (unspecified shoulder pain/disorder), 726.0-2 (disorder of shoulder tendons and bursa), 727.61 (rotator cuff rupture), and 840.3-9 (rotator cuff sprain) were classified as having a nonfracture indication. Patients with postoperative ICD-9 codes 716.11 (traumatic arthropathy), 833.80-89 (malunion/nonunion of fracture), and 812.00-20 (fracture of proximal humerus) were classified as having a fracture-associated indication. Patients with incomplete perioperative data were excluded from the study, leaving 1505 patients for the study (out of an initial 1726).
Patient characteristics, including sex, age, height, weight, and history of smoking, were collected from the ACS-NSQIP database. Body mass index (BMI) was calculated from each patient’s height and weight. Information about medical comorbidities was also collected from the ACS-NSQIP database. History of pulmonary disease was defined as a history of dyspnea, severe chronic obstructive pulmonary disease, ventilator-assisted respiration within 48 hours before surgery, or current pneumonia. History of heart disease was defined as a history of congestive heart failure or angina within 1 month before admission, myocardial infarction within 6 months before admission, cardiac surgery, or percutaneous coronary intervention. American Society of Anesthesiologists (ASA) class 3 or higher indicates severe systemic disease. Steroid use was defined as regular administration of corticosteroid medications within 30 days before surgery. Functional status was defined as the ability to perform activities of daily living (ADLs) within 30 days before surgery, with the patient’s best functional status during this period recorded. Similar to how other variables were collected from the database, this information was obtained through medical record abstraction and patient interviews by trained personnel. ADLs are defined in the ACS-NSQIP as “activities usually performed in the course of a normal day in a person’s life” and include bathing, feeding, dressing, toileting, and mobility. An independent patient does not require assistance for any ADLs, a partially dependent patient requires assistance for some ADLs, and a totally dependent patient requires assistance in completing all ADLs. Partially and totally dependent patients were grouped for analysis. Information about a patient’s discharge destination (to home or a facility) was also available in the database.17
Extended Length of Stay
Extended LOS was defined as a binary variable that was positive when the postoperative LOS exceeded the 90th percentile LOS. The 90th percentile LOS was chosen as a cutoff to account for normal variations in LOS and differing practices of surgeons while still capturing patients with abnormally extended LOS.
Readmission
Readmission was defined as a binary variable that was positive when a patient had an unplanned readmission 1 or more times after the initial postoperative discharge.
Patient Demographics
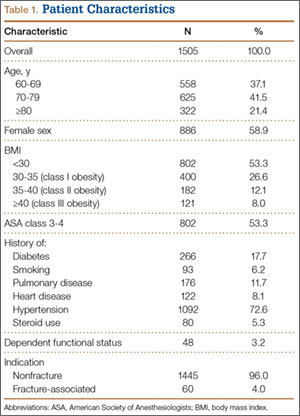
Table 1 summarizes the demographics and comorbidities of the 1505 TSA patients who met our study inclusion criteria. Mean age was 72.8 years (range, 60-90 years). Mean BMI was 30.3 kg/m2 (range, 15.7-63.9 kg/m2); 46.7% of patients were classified as obese (BMI, ≥30 kg/m2). The cohort was 58.9% female. Four percent of patients underwent TSA for a fracture-associated indication.
Statistical Analyses
Statistical analyses were performed with Stata 11.2 (StataCorp). Bivariate and multivariate analyses were used to test patient characteristics for association with extended LOS and readmission. Discharge destination and LOS were included in the readmission analysis because this information would be available at time of discharge and would be useful to include in a model that predicts odds of readmission.
Final multivariate models were constructed using a backward stepwise process that initially included all potential variables and sequentially excluded variables with the highest P value until only those with P < .20 remained. Variables with .05 < P < .20 were left in the model to control for potential confounding but were not considered significantly associated with the outcome. All tests were 2-tailed, and the statistical difference was established at a 2-sided α level of 0.05 (P < .05).
Results
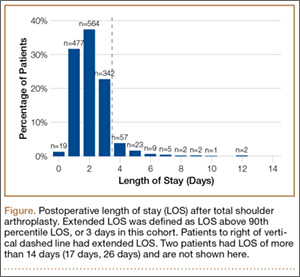
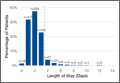
Median LOS after TSA was 2 days (interquartile range, 1-3 days), and extended LOS was defined as LOS of more than 3 days (90th percentile LOS). The distribution of LOS is depicted in the Figure. Results of the bivariate and multivariate analyses are reported in Table 2 and Table 3, respectively. Bivariate analysis revealed an association between extended LOS and increased age, ASA class 3 or higher, and history of diabetes, pulmonary disease, and heart disease. On multivariate analysis, extended LOS was associated with age 70 to 79 years (odds ratio [OR], 1.71; 95% confidence interval [CI], 1.01-2.95; P = .049), age 80 years or older (OR, 3.38; 95% CI, 1.94-5.91; P < .001), and history of diabetes (OR, 2.37; 95% CI, 1.53-3.66; P < .001).
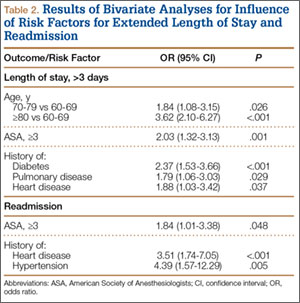
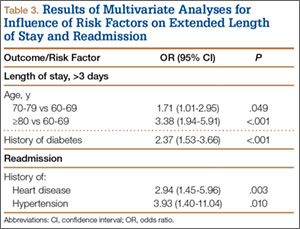
Forty-nine patients (3.3%) were readmitted within the first 30 postoperative days. Bivariate analysis revealed an association between readmission and ASA class 3 or higher, history of heart disease, and history of hypertension. On multivariate analysis, readmission was associated only with history of heart disease (OR, 2.94; 95% CI, 1.45-5.96; P = .003) and history of hypertension (OR, 3.93; 95% CI, 1.40-11.04; P = .010).
Discussion
In the United States, TSA has become increasingly popular because of its favorable outcomes and continued implant development.1-5 However, there is a shortage of information about risk factors for short-term outcomes after TSA. In this study, we used multivariate analyses to identify patient-related factors associated with extended LOS and readmission after discharge. By identifying these factors, we can improve the preoperative discussion and postoperative planning for this procedure.
In the present study, extended LOS (>3 days) was found to be associated with older age and history of diabetes. The TSA literature has little information that can be used to compare these results, though age over 80 years was previously described as a risk factor for extended LOS after TSA.19 Uncontrolled diabetes has been identified as a risk factor for extended LOS in hip and knee arthroplasty,20 and management of diabetes may similarly complicate postoperative care, leading to extended LOS and increased costs in TSA patients. Patients with the identified risk factors for extended LOS should be counseled before surgery. In addition, this is important information for health care organizations and providers.
Readmission within 30 days after TSA was found to be independently associated with history of heart disease and history of hypertension. Similar to factors affecting LOS, patient-related risk factors for readmission are also poorly defined in the TSA literature. In total hip arthroplasty patients, heart disease has been found to be associated with readmission.21,22 Hypertension has also been associated with readmission for other orthopedic procedures.23 Results of the present study indicate these comorbidities may increase the risk for complications after discharge. It is important to note, however, that LOS did not correlate with readmission rates, indicating patients are likely being discharged at the most clinically appropriate time.
Waterman and colleagues11 very recently identified (in the ACS-NSQIP database) a patient population that underwent TSA between 2006 and 2011 to describe risk factors for postoperative complications within 30 days. They found that comorbid cardiac disease and older age were independently associated with mortality. Interestingly, the present study identified older age as associated with extended LOS, and cardiac disease as associated with readmission. Together with the results from the previous study, age and cardiac disease seem to be important patient factors to consider when planning TSA, as they are associated with a significantly worse postoperative course.
This study had several limitations. First, given the nature of the ACS-NSQIP database, readmissions are recorded only up to 30 days after surgery, including after discharge. Second, though the ACS-NSQIP tries to collect as many patient variables as possible, some information is not captured. Additional variables that could potentially affect LOS and readmission (eg, insurance status, hospital volume) were not available for analysis. However, we think the high-quality data collection process used by the ACS-NSQIP outweighs the lack of certain variables. Third, original operative notes are not available in the ACS-NSQIP database, and the only way to identify operative procedures is to check CPT codes. Unfortunately, CPT code 23472 is used for both TSA and reverse TSA, so these procedures could not be separated for analysis, and the results of this study can be used to comment only on the risks of both procedures. Another limitation is that there were not enough patients to further analyze the data by each indication.
Conclusion
With the increasing popularity of TSA for an expanding set of indications, it is important to understand the factors that can affect the postoperative course. In this study, we found several patient-related risk factors for extended LOS and readmission. Although the identified factors are generally not modifiable, this information can be used to better define the expectations of patients, providers, and organizations for this increasingly common procedure.
1. Kim SH, Wise BL, Zhang Y, Szabo RM. Increasing incidence of shoulder arthroplasty in the United States. J Bone Joint Surg Am. 2011;93(24):2249-2254.
2. Day JS, Lau E, Ong KL, Williams GR, Ramsey ML, Kurtz SM. Prevalence and projections of total shoulder and elbow arthroplasty in the United States to 2015. J Shoulder Elbow Surg. 2010;19(8):1115-1120.
3. Adams JE, Sperling JW, Hoskin TL, Melton LJ 3rd, Cofield RH. Shoulder arthroplasty in Olmsted County, Minnesota, 1976–2000: a population-based study. J Shoulder Elbow Surg. 2006;15(1):50-55.
4. Farmer KW, Hammond JW, Queale WS, Keyurapan E, McFarland EG. Shoulder arthroplasty versus hip and knee arthroplasties: a comparison of outcomes. Clin Orthop Relat Res. 2007;(455):183-189.
5. Chin PY, Sperling JW, Cofield RH, Schleck C. Complications of total shoulder arthroplasty: are they fewer or different? J Shoulder Elbow Surg. 2006;15(1):19-22.
6. Bohsali KI, Wirth MA, Rockwood CA Jr. Complications of total shoulder arthroplasty. J Bone Joint Surg Am. 2006;88(10):2279-2292.
7. Torchia ME, Cofield RH, Settergren CR. Total shoulder arthroplasty with the Neer prosthesis: long-term results. J Shoulder Elbow Surg. 1997;6(6):495-505.
8. Sneppen O, Fruensgaard S, Johannsen HV, Olsen BS, Søjbjerg JO, Andersen NH. Total shoulder replacement in rheumatoid arthritis: proximal migration and loosening. J Shoulder Elbow Surg. 1996;5(1):47-52.
9. Søjbjerg JO, Frich LH, Johannsen HV, Sneppen O. Late results of total shoulder replacement in patients with rheumatoid arthritis. Clin Orthop Relat Res. 1999;(366):39-45.
10. Raiss P, Bruckner T, Rickert M, Walch G. Longitudinal observational study of total shoulder replacements with cement: fifteen to twenty-year follow-up. J Bone Joint Surg Am. 2014;96(3):198-205.
11. Waterman BR, Dunn JC, Bader J, Urrea L, Schoenfeld AJ, Belmont PJ Jr. Thirty-day morbidity and mortality after elective total shoulder arthroplasty: patient-based and surgical risk factors. J Shoulder Elbow Surg. 2015;24(1):24-30.
12. Farng E, Zingmond D, Krenek L, Soohoo NF. Factors predicting complication rates after primary shoulder arthroplasty. J Shoulder Elbow Surg. 2011;20(4):557-563.
13. Streubel PN, Simone JP, Sperling JW, Cofield R. Thirty and ninety-day reoperation rates after shoulder arthroplasty. J Bone Joint Surg Am. 2014;96(3):e17.
14. Mahoney A, Bosco JA 3rd, Zuckerman JD. Readmission after shoulder arthroplasty. J Shoulder Elbow Surg. 2014;23(3):377-381.
15. Gay DM, Lyman S, Do H, Hotchkiss RN, Marx RG, Daluiski A. Indications and reoperation rates for total elbow arthroplasty: an analysis of trends in New York state. J Bone Joint Surg Am. 2012;94(2):110-117.
16. Zumstein MA, Pinedo M, Old J, Boileau P. Problems, complications, reoperations, and revisions in reverse total shoulder arthroplasty: a systematic review. J Shoulder Elbow Surg. 2011;20(1):146-157.
17. American College of Surgeons. User Guide for the 2012 ACS NSQIP Participant Use Data File. https://www.facs.org/~/media/files/quality%20programs/nsqip/ug12.ashx. Published October 2013. Accessed June 21, 2015.
18. Khuri SF, Henderson WG, Daley J, et al; Principal Investigators of Patient Safety in Surgery Study. Successful implementation of the Department of Veterans Affairs’ National Surgical Quality Improvement Program in the private sector: the Patient Safety in Surgery study. Ann Surg. 2008;248(2):329-336.
19. Ricchetti ET, Abboud JA, Kuntz AF, Ramsey ML, Glaser DL, Williams GR Jr. Total shoulder arthroplasty in older patients: increased perioperative morbidity? Clin Orthop Relat Res. 2011;469(4):1042-1049.
20. Marchant MH Jr, Viens NA, Cook C, Vail TP, Bolognesi MP. The impact of glycemic control and diabetes mellitus on perioperative outcomes after total joint arthroplasty. J Bone Joint Surg Am. 2009;91(7):1621-1629.
21. Schairer WW, Sing DC, Vail TP, Bozic KJ. Causes and frequency of unplanned hospital readmission after total hip arthroplasty. Clin Orthop Relat Res. 2014;472(2):464-470.
22. Vorhies JS, Wang Y, Herndon J, Maloney WJ, Huddleston JI. Readmission and length of stay after total hip arthroplasty in a national Medicare sample. J Arthroplasty. 2011;26(6 suppl):119-123.
23. Lovecchio F, Hsu WK, Smith TR, Cybulski G, Kim B, Kim JY. Predictors of thirty-day readmission after anterior cervical fusion. Spine. 2014;39(2):127-133.
Use of total shoulder arthroplasty (TSA) and reverse TSA for shoulder conditions has increased dramatically in recent years.1 Approximately 27,000 standard TSAs were performed in the United States in 2008, and this number is expected to double by 2015.2 TSA provides excellent pain relief, restoration of function, and patient satisfaction.3 The evolution of implant design over the past 25 years has contributed to excellent long-term implant survival, with rates comparable to those of total knee and hip arthroplasty.4 Similarly, compared with previous designs, contemporary designs and techniques have resulted in fewer complications.5
Several studies have investigated the long-term complications of TSA. These complications include prosthetic loosening, instability, periprosthetic fracture, rotator cuff tears, nerve injury, and deltoid dysfunction.6-11 In addition, Waterman and colleagues11 very recently assessed the influence of risk factors on short-term postoperative complications of TSA. However, none of these studies has assessed the influence of multiple risk factors on postoperative length of stay (LOS) after TSA. Only 1 study, using data from 2005 and earlier, has analyzed the potential effect of multiple patient characteristics on readmission after TSA12; other studies have been only descriptive.13-16
We conducted a retrospective cohort study to characterize the risk factors for extended LOS and readmission after TSA in a large sample of patients drawn from a national database. We hypothesized that patient factors, including age, sex, and obesity, would be significantly associated with postoperative LOS and readmission after TSA. National databases have been increasingly used in orthopedic research, as they offer particular advantages. Large sample sizes allow for powerful analyses of associations—analyses previously not possible in single-surgeon and single-institution studies. In addition, use of a large, national patient sample allows us to draw generalizable conclusions to better define patients’ and physicians’ postoperative expectations.
Methods
We conducted a retrospective cohort study using the American College of Surgeons National Surgical Quality Improvement Program (ACS-NSQIP) database. ACS-NSQIP collects 150 patient variables from 374 participating US hospitals.17 Patients are prospectively identified, and information is collected from operative reports, medical records, and patient interviews by trained clinical reviewers.17,18 Routine auditing by the program ensures high-quality data, with reported interrater disagreement below 2% for all variables. Data are collected through the 30th postoperative day, including after discharge.
This study was granted an exemption from our institutional review board, as we used a deidentified and publicly available database. Patients who were 60 years or older and underwent TSA between 2011 and 2012 were identified in the ACS-NSQIP database. TSA patients were identified using Current Procedural Terminology (CPT) code 23472, which includes TSA and reverse TSA procedures.
Patients were divided into groups based on surgical indications, which were available as International Classification of Diseases, Ninth Revision (ICD-9) diagnosis codes. Patients with postoperative ICD-9 codes 714.0 (rheumatoid arthritis), 715.0-9 (osteoarthritis), 716.61/716.81/716.91 (unspecified arthropathy), 718.01 (articular cartilage disorder), 718.31 (recurrent dislocation of shoulder), 718.81 (other joint derangement of shoulder), 719.41/719.91 (unspecified shoulder pain/disorder), 726.0-2 (disorder of shoulder tendons and bursa), 727.61 (rotator cuff rupture), and 840.3-9 (rotator cuff sprain) were classified as having a nonfracture indication. Patients with postoperative ICD-9 codes 716.11 (traumatic arthropathy), 833.80-89 (malunion/nonunion of fracture), and 812.00-20 (fracture of proximal humerus) were classified as having a fracture-associated indication. Patients with incomplete perioperative data were excluded from the study, leaving 1505 patients for the study (out of an initial 1726).
Patient characteristics, including sex, age, height, weight, and history of smoking, were collected from the ACS-NSQIP database. Body mass index (BMI) was calculated from each patient’s height and weight. Information about medical comorbidities was also collected from the ACS-NSQIP database. History of pulmonary disease was defined as a history of dyspnea, severe chronic obstructive pulmonary disease, ventilator-assisted respiration within 48 hours before surgery, or current pneumonia. History of heart disease was defined as a history of congestive heart failure or angina within 1 month before admission, myocardial infarction within 6 months before admission, cardiac surgery, or percutaneous coronary intervention. American Society of Anesthesiologists (ASA) class 3 or higher indicates severe systemic disease. Steroid use was defined as regular administration of corticosteroid medications within 30 days before surgery. Functional status was defined as the ability to perform activities of daily living (ADLs) within 30 days before surgery, with the patient’s best functional status during this period recorded. Similar to how other variables were collected from the database, this information was obtained through medical record abstraction and patient interviews by trained personnel. ADLs are defined in the ACS-NSQIP as “activities usually performed in the course of a normal day in a person’s life” and include bathing, feeding, dressing, toileting, and mobility. An independent patient does not require assistance for any ADLs, a partially dependent patient requires assistance for some ADLs, and a totally dependent patient requires assistance in completing all ADLs. Partially and totally dependent patients were grouped for analysis. Information about a patient’s discharge destination (to home or a facility) was also available in the database.17
Extended Length of Stay
Extended LOS was defined as a binary variable that was positive when the postoperative LOS exceeded the 90th percentile LOS. The 90th percentile LOS was chosen as a cutoff to account for normal variations in LOS and differing practices of surgeons while still capturing patients with abnormally extended LOS.
Readmission
Readmission was defined as a binary variable that was positive when a patient had an unplanned readmission 1 or more times after the initial postoperative discharge.
Patient Demographics
Table 1 summarizes the demographics and comorbidities of the 1505 TSA patients who met our study inclusion criteria. Mean age was 72.8 years (range, 60-90 years). Mean BMI was 30.3 kg/m2 (range, 15.7-63.9 kg/m2); 46.7% of patients were classified as obese (BMI, ≥30 kg/m2). The cohort was 58.9% female. Four percent of patients underwent TSA for a fracture-associated indication.
Statistical Analyses
Statistical analyses were performed with Stata 11.2 (StataCorp). Bivariate and multivariate analyses were used to test patient characteristics for association with extended LOS and readmission. Discharge destination and LOS were included in the readmission analysis because this information would be available at time of discharge and would be useful to include in a model that predicts odds of readmission.
Final multivariate models were constructed using a backward stepwise process that initially included all potential variables and sequentially excluded variables with the highest P value until only those with P < .20 remained. Variables with .05 < P < .20 were left in the model to control for potential confounding but were not considered significantly associated with the outcome. All tests were 2-tailed, and the statistical difference was established at a 2-sided α level of 0.05 (P < .05).
Results
Median LOS after TSA was 2 days (interquartile range, 1-3 days), and extended LOS was defined as LOS of more than 3 days (90th percentile LOS). The distribution of LOS is depicted in the Figure. Results of the bivariate and multivariate analyses are reported in Table 2 and Table 3, respectively. Bivariate analysis revealed an association between extended LOS and increased age, ASA class 3 or higher, and history of diabetes, pulmonary disease, and heart disease. On multivariate analysis, extended LOS was associated with age 70 to 79 years (odds ratio [OR], 1.71; 95% confidence interval [CI], 1.01-2.95; P = .049), age 80 years or older (OR, 3.38; 95% CI, 1.94-5.91; P < .001), and history of diabetes (OR, 2.37; 95% CI, 1.53-3.66; P < .001).
Forty-nine patients (3.3%) were readmitted within the first 30 postoperative days. Bivariate analysis revealed an association between readmission and ASA class 3 or higher, history of heart disease, and history of hypertension. On multivariate analysis, readmission was associated only with history of heart disease (OR, 2.94; 95% CI, 1.45-5.96; P = .003) and history of hypertension (OR, 3.93; 95% CI, 1.40-11.04; P = .010).
Discussion
In the United States, TSA has become increasingly popular because of its favorable outcomes and continued implant development.1-5 However, there is a shortage of information about risk factors for short-term outcomes after TSA. In this study, we used multivariate analyses to identify patient-related factors associated with extended LOS and readmission after discharge. By identifying these factors, we can improve the preoperative discussion and postoperative planning for this procedure.
In the present study, extended LOS (>3 days) was found to be associated with older age and history of diabetes. The TSA literature has little information that can be used to compare these results, though age over 80 years was previously described as a risk factor for extended LOS after TSA.19 Uncontrolled diabetes has been identified as a risk factor for extended LOS in hip and knee arthroplasty,20 and management of diabetes may similarly complicate postoperative care, leading to extended LOS and increased costs in TSA patients. Patients with the identified risk factors for extended LOS should be counseled before surgery. In addition, this is important information for health care organizations and providers.
Readmission within 30 days after TSA was found to be independently associated with history of heart disease and history of hypertension. Similar to factors affecting LOS, patient-related risk factors for readmission are also poorly defined in the TSA literature. In total hip arthroplasty patients, heart disease has been found to be associated with readmission.21,22 Hypertension has also been associated with readmission for other orthopedic procedures.23 Results of the present study indicate these comorbidities may increase the risk for complications after discharge. It is important to note, however, that LOS did not correlate with readmission rates, indicating patients are likely being discharged at the most clinically appropriate time.
Waterman and colleagues11 very recently identified (in the ACS-NSQIP database) a patient population that underwent TSA between 2006 and 2011 to describe risk factors for postoperative complications within 30 days. They found that comorbid cardiac disease and older age were independently associated with mortality. Interestingly, the present study identified older age as associated with extended LOS, and cardiac disease as associated with readmission. Together with the results from the previous study, age and cardiac disease seem to be important patient factors to consider when planning TSA, as they are associated with a significantly worse postoperative course.
This study had several limitations. First, given the nature of the ACS-NSQIP database, readmissions are recorded only up to 30 days after surgery, including after discharge. Second, though the ACS-NSQIP tries to collect as many patient variables as possible, some information is not captured. Additional variables that could potentially affect LOS and readmission (eg, insurance status, hospital volume) were not available for analysis. However, we think the high-quality data collection process used by the ACS-NSQIP outweighs the lack of certain variables. Third, original operative notes are not available in the ACS-NSQIP database, and the only way to identify operative procedures is to check CPT codes. Unfortunately, CPT code 23472 is used for both TSA and reverse TSA, so these procedures could not be separated for analysis, and the results of this study can be used to comment only on the risks of both procedures. Another limitation is that there were not enough patients to further analyze the data by each indication.
Conclusion
With the increasing popularity of TSA for an expanding set of indications, it is important to understand the factors that can affect the postoperative course. In this study, we found several patient-related risk factors for extended LOS and readmission. Although the identified factors are generally not modifiable, this information can be used to better define the expectations of patients, providers, and organizations for this increasingly common procedure.
1. Kim SH, Wise BL, Zhang Y, Szabo RM. Increasing incidence of shoulder arthroplasty in the United States. J Bone Joint Surg Am. 2011;93(24):2249-2254.
2. Day JS, Lau E, Ong KL, Williams GR, Ramsey ML, Kurtz SM. Prevalence and projections of total shoulder and elbow arthroplasty in the United States to 2015. J Shoulder Elbow Surg. 2010;19(8):1115-1120.
3. Adams JE, Sperling JW, Hoskin TL, Melton LJ 3rd, Cofield RH. Shoulder arthroplasty in Olmsted County, Minnesota, 1976–2000: a population-based study. J Shoulder Elbow Surg. 2006;15(1):50-55.
4. Farmer KW, Hammond JW, Queale WS, Keyurapan E, McFarland EG. Shoulder arthroplasty versus hip and knee arthroplasties: a comparison of outcomes. Clin Orthop Relat Res. 2007;(455):183-189.
5. Chin PY, Sperling JW, Cofield RH, Schleck C. Complications of total shoulder arthroplasty: are they fewer or different? J Shoulder Elbow Surg. 2006;15(1):19-22.
6. Bohsali KI, Wirth MA, Rockwood CA Jr. Complications of total shoulder arthroplasty. J Bone Joint Surg Am. 2006;88(10):2279-2292.
7. Torchia ME, Cofield RH, Settergren CR. Total shoulder arthroplasty with the Neer prosthesis: long-term results. J Shoulder Elbow Surg. 1997;6(6):495-505.
8. Sneppen O, Fruensgaard S, Johannsen HV, Olsen BS, Søjbjerg JO, Andersen NH. Total shoulder replacement in rheumatoid arthritis: proximal migration and loosening. J Shoulder Elbow Surg. 1996;5(1):47-52.
9. Søjbjerg JO, Frich LH, Johannsen HV, Sneppen O. Late results of total shoulder replacement in patients with rheumatoid arthritis. Clin Orthop Relat Res. 1999;(366):39-45.
10. Raiss P, Bruckner T, Rickert M, Walch G. Longitudinal observational study of total shoulder replacements with cement: fifteen to twenty-year follow-up. J Bone Joint Surg Am. 2014;96(3):198-205.
11. Waterman BR, Dunn JC, Bader J, Urrea L, Schoenfeld AJ, Belmont PJ Jr. Thirty-day morbidity and mortality after elective total shoulder arthroplasty: patient-based and surgical risk factors. J Shoulder Elbow Surg. 2015;24(1):24-30.
12. Farng E, Zingmond D, Krenek L, Soohoo NF. Factors predicting complication rates after primary shoulder arthroplasty. J Shoulder Elbow Surg. 2011;20(4):557-563.
13. Streubel PN, Simone JP, Sperling JW, Cofield R. Thirty and ninety-day reoperation rates after shoulder arthroplasty. J Bone Joint Surg Am. 2014;96(3):e17.
14. Mahoney A, Bosco JA 3rd, Zuckerman JD. Readmission after shoulder arthroplasty. J Shoulder Elbow Surg. 2014;23(3):377-381.
15. Gay DM, Lyman S, Do H, Hotchkiss RN, Marx RG, Daluiski A. Indications and reoperation rates for total elbow arthroplasty: an analysis of trends in New York state. J Bone Joint Surg Am. 2012;94(2):110-117.
16. Zumstein MA, Pinedo M, Old J, Boileau P. Problems, complications, reoperations, and revisions in reverse total shoulder arthroplasty: a systematic review. J Shoulder Elbow Surg. 2011;20(1):146-157.
17. American College of Surgeons. User Guide for the 2012 ACS NSQIP Participant Use Data File. https://www.facs.org/~/media/files/quality%20programs/nsqip/ug12.ashx. Published October 2013. Accessed June 21, 2015.
18. Khuri SF, Henderson WG, Daley J, et al; Principal Investigators of Patient Safety in Surgery Study. Successful implementation of the Department of Veterans Affairs’ National Surgical Quality Improvement Program in the private sector: the Patient Safety in Surgery study. Ann Surg. 2008;248(2):329-336.
19. Ricchetti ET, Abboud JA, Kuntz AF, Ramsey ML, Glaser DL, Williams GR Jr. Total shoulder arthroplasty in older patients: increased perioperative morbidity? Clin Orthop Relat Res. 2011;469(4):1042-1049.
20. Marchant MH Jr, Viens NA, Cook C, Vail TP, Bolognesi MP. The impact of glycemic control and diabetes mellitus on perioperative outcomes after total joint arthroplasty. J Bone Joint Surg Am. 2009;91(7):1621-1629.
21. Schairer WW, Sing DC, Vail TP, Bozic KJ. Causes and frequency of unplanned hospital readmission after total hip arthroplasty. Clin Orthop Relat Res. 2014;472(2):464-470.
22. Vorhies JS, Wang Y, Herndon J, Maloney WJ, Huddleston JI. Readmission and length of stay after total hip arthroplasty in a national Medicare sample. J Arthroplasty. 2011;26(6 suppl):119-123.
23. Lovecchio F, Hsu WK, Smith TR, Cybulski G, Kim B, Kim JY. Predictors of thirty-day readmission after anterior cervical fusion. Spine. 2014;39(2):127-133.
Lumbar Degenerative Disc Disease and Tibiotalar Joint Arthritis: A 710-Specimen Postmortem Study
Osteoarthritis is the most common joint disorder, resulting in significant morbidity and disability. The worldwide prevalence of osteoarthritis was estimated at more than 151 million people, according to data published in 2004.1 In the United States, almost 27 million adults age 25 years and older suffer from clinically apparent disease.2 The spine is one of the most commonly affected joints of arthritis, and idiopathic low back pain is the most frequent complaint in the adult population.3 In adults with low back pain, evidence of lumbar intervertebral disc degeneration is often found on radiography.4 In 1 study, evidence of disc degeneration was found in 90% of adults age 50 to 59 years.5
Degenerative spinal disease most commonly affects the lumbar spine due to its high degree of mobility and weight-loading.6,7 Clinical8,9 and experimental studies10 have suggested that the degenerative changes in the lumbar spine begin in the intervertebral discs. Degenerative disc disease (DDD) results from a continuum of dehydration, degradation, and remodeling of the intervertebral discs and neighboring vertebrae to accommodate the changes in physical loading.11-13 This results in disc-space narrowing, disc bulging and herniation, vertebral rim osteophyte formation, and endplate sclerosis.7,14 Symptomatic neural compression may occur, often manifested by localized lower back and extremity pain, as well as sensory loss and weakness of the lower extremities.15-17 Changes in posture and gait may result because of altered sensation, and the consequent abnormal force transmission may predispose joints to accelerated wear and arthrosis.15,18
Numerous studies have delineated the association between lumbar spinal disorders and lower extremity arthrosis. Of note, research has demonstrated that hip and/or knee pathology and gait alteration may promote low back pain and lumbar disc degeneration.19-21 Although spinal abnormalities, such as scoliosis, may predispose an individual to accelerated hip degeneration,20 no studies have investigated the relationship between lumbar DDD and ankle osteoarthritis.
Ankle arthritis differs from hip and knee arthritis demographically, occurring approximately 9 times less frequently.21 The ankle joint is subjected to more weight-bearing force per square centimeter and is more commonly injured than any other joint in the body.21 Trauma and/or abnormal ankle mechanics are the most common causes of degenerative ankle arthritis.22 Other potential causes include inflammatory arthropathies, neuropathic arthropathy, infection, and tumor. The purpose of this study was to determine if a relationship exists between ankle arthrosis and lumbar disc degeneration, and to delineate if one may promote the onset or progression of the other.
Materials and Methods
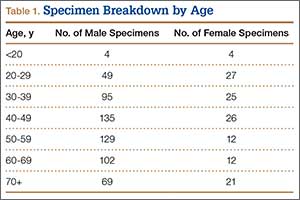
We randomly chose 710 cadaveric specimens from the Hamann-Todd Osteological Collection in Cleveland, Ohio. The Hamann-Todd Collection contains skeletal remains from more than 3000 individuals who died in Cleveland, Ohio between 1893 and 1938. The cohort for this study included 583 male and 127 female cadavers, ranging in age from 17 to 105 years at the time of death. Table 1 shows the breakdown of these specimens according to age group; of the 710 specimens, 306 were of African American ancestry, and 404 were Caucasian.
Lumbar DDD was graded at each lumbar spinal level by a single examiner using the Eubanks modification23 of the Kettler and Wilke classification of vertebral endplate osteophytosis24:
Grade 0: normal vertebral endplates;
Grade 1: mild arthrosis, with evidence of osteophytic reaction involving up to 50% of the vertebral endplates;
Grade 2: moderate arthrosis, with evidence of osteophytic reaction involving 50% to 100% of the vertebral endplates;
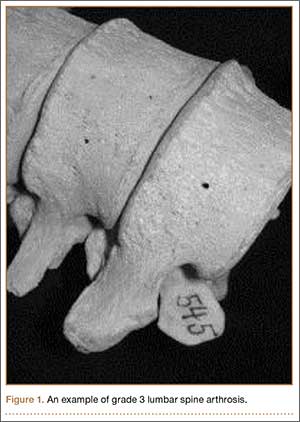
Grade 3: severe arthrosis, with evidence of osteophytic reaction involving 100% of the vertebral endplates. Osteophytes are hypertrophic and bridging the joint space (Figure 1);
Grade 4: complete ankylosis.
Tibiotalar joint osteoarthritis was evaluated by a single examiner using a modification of the Kellgren-Lawrence classification4 for knee osteoarthritis:
Grade 0: no discernable wear/osteophytes;
Grade 1: 1-mm osteophyte(s) and/or <25% surface wear;
Grade 2: 1- to 2-mm osteophyte(s) and/or 25% to 50% joint surface;
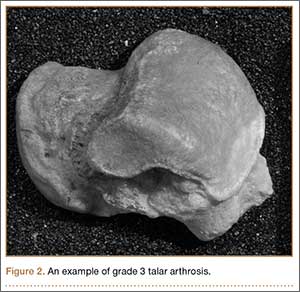
Grade 3: 2- to 3-mm osteophyte(s) and/or >50% joint surface (Figure 2);
Grade 4: multiple large osteophytes and/or definite bony end deformity.
Statistical analysis was performed on the compiled data using Stata software (StataCorp, College Station, Texas). Linear and logistic regression analyses correcting for confounding factors of age, sex, race, and height were performed using a standard P-value cutoff (P < .05) and 95% confidence interval to determine statistical significance.
Results
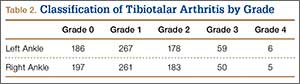
Patients were considered to have osteoarthritis of the tibiotalar joint if either of the extremities measured grade 1 or higher. Of the 710 specimens selected, 14 specimens did not have adequate bone available for bilateral tibiotalar joint measurement, either from extensive bone degradation or amputation. Of the remaining 696 specimens, 586 had some degree of tibiotalar osteoarthritis present (Table 2). Regression analysis showed a significant positive association between right- and left-ankle osteoarthritis (coefficient: 0.491, P < .01). Tibiotalar joint arthritis was classified as severe if either extremity had arthrosis of grade 3 or higher. Of the 586 specimens that had tibiotalar joint arthritis, only 16% (97 specimens) had severe tibiotalar joint arthritis.
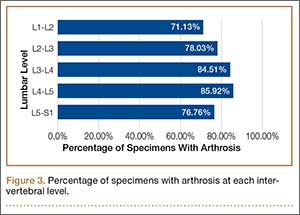
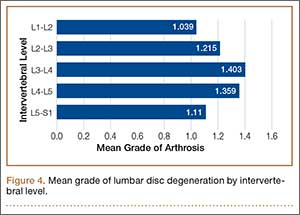
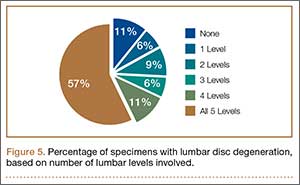
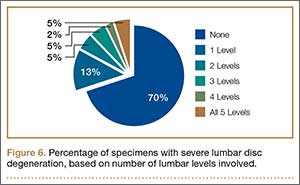
Data regarding lumbar disc degeneration were available for 516 of the 710 specimens selected, 443 of which showed some disc degeneration. Disc degeneration was most prevalent and significant at the L4-L5 and L3-L4 intervertebral levels (Figures 3, 4). Of these 516 specimens, 30 had degeneration at 1 level, 47 specimens had degeneration at 2 levels, 29 specimens had degeneration at 3 levels, 52 had degeneration at 4 levels, and 285 specimens had degeneration at all 5 lumbar levels. The majority of specimens were found to have some degree of degeneration at all 5 lumbar spinal levels (Figure 5). Severe lumbar DDD was defined as grade 3 or higher osteoarthritis present in at least 1 of the 5 lumbar levels. Of the 516 specimens that showed some degree of disc degeneration, 152 were classified as severe. When stratified by number of spinal levels, only 30% of specimens were found to have evidence of severe arthrosis, the majority of which was located at only 1 lumbar segment (Figure 6).
Linear regression analysis of the data showed a statistically significant positive association between lumbar disc degeneration and tibiotalar osteoarthritis (coefficient: 0.844, P < .01), even when correcting for confounding factors, such as age, sex, and race (coefficient: 0.331, P < .01).
Additional analysis of the data demonstrated that tibiotalar joint arthritis remained significantly associated with lumbar DDD across each lumbar level: L1-L2 (coefficient: 0.269, P < .01), L2-L3 (coefficient: 0.283, P < .01), L3-L4 (coefficient: 0.299, P < .01), L4-L5 (coefficient: 0.240, P < .02), L5-S1 (coefficient: 0.167, P < .05).
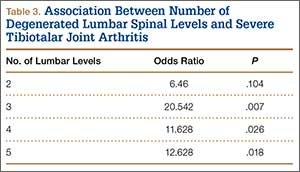
The presence of 3 or more levels of lumbar DDD significantly increased the possibility of developing severe tibiotalar joint arthritis. Lumbar DDD that encompassed 3 levels showed the highest odds for development of severe tibiotalar joint arthritis with an odds ratio (OR) of 20.542 (Table 3).
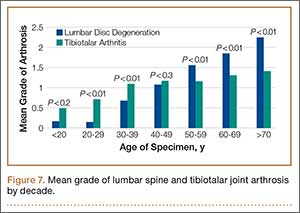
When subjects were compared by decade, the mean grade of tibiotalar joint arthritis was significantly higher than lumbar DDD in specimens who died in their 20s and 30s. This difference was insignificant in the fourth decade, and thereafter the mean value of lumbar DDD surpassed that of tibiotalar joint arthritis (Figure 7).
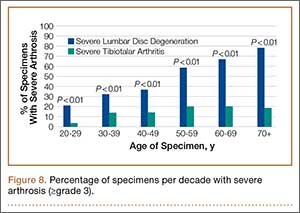
In contrast, severe lumbar DDD was more prevalent than severe tibiotalar joint arthritis in individuals age 20 years or older (Figure 8). There were no specimens under age 20 years with severe lumbar DDD or severe tibiotalar joint arthritis.
Logistic regression showed that individuals with severe lumbar disc degeneration had significantly higher odds of developing severe ankle arthritis (OR: 1.93, P < .05). Similarly, individuals with severe tibiotalar joint arthritis were just as likely to develop severe lumbar DDD with an OR of 1.97 (P < .05).
Discussion
Multiple joint involvement in osteoarthritis is well established with a wide range of evidence linking lower extremity joint pathology and lumbar spinal disease. In 1983, Offierski and MacNab20 were the first to describe hip-spine syndrome. In the next year, a study by Sponseller and colleagues25 of pediatric patients after hip arthrodesis further substantiated the association between spine and extremity disease, and demonstrated a continued cause and effect relationship after surgery.
Lumbar spinal degeneration has also been correlated with knee osteoarthritis. Tsuji and colleagues26 reported that degenerative changes in spinal alignment result in increased thigh muscle tension and knee flexion. Furthermore, in their radiographic analysis of 682 individuals, Horvath and colleagues27 also showed that individuals with spinal degeneration had a higher prevalence of knee and hip osteoarthritis.
One might hypothesize from this evidence that lumbar spinal degeneration and ankle arthritis would also be interrelated, given their interconnected role in lower extremity force transmission. Surprisingly, the literature correlating lumbar degeneration and lower extremity osteoarthritis has overlooked this association and has focused solely on the hip and knee. To our knowledge, this study is the first to identify a statistically significant association between tibiotalar joint osteoarthritis and lumbar disc degeneration.
The literature supported analysis of our data. Miller and colleagues28 evaluated disc degeneration in 600 autopsy specimens using the Nachemson29 grading system. This system categorizes disc degeneration into 4 grades based on macroscopic appearance. Miller and colleagues28 reported evidence of degenerative changes as early as the second decade of life, primarily involving the L3–L4 and L4–L5 levels. Of note, the Nachemson29 classification system includes only evidence of marginal osteophytes in grade 4 disease, which was not identified by Miller and colleagues28 until the fourth decade. These results were similar to those in our study, in which the L3-L4 and L4-L5 intervertebral levels were most commonly affected. However, in our study, significant degenerative changes were found in the third decade of life.
In addition, the percentage of specimens with severe disc degeneration increased with each decade (Figure 8). A substantial amount of histologic evidence demonstrates the progression of disc degeneration with age. With increased age, there is a gradual decrease in the osmotic swelling of intervertebral discs30 and a 2-fold decrease in disc hydration between adolescence and the eighth decade.31 Furthermore, the nucleus pulposus undergoes progressive fibrosis,32,33 with a 5-fold decrease in the fixed-charge density of nucleus glycosaminoglycans,34 and a 2-fold increase in intervertebral disc creep while under compression after age 30 years.35
While analyzing our findings, we had difficulty in determining which pathologic condition debuts and, subsequently, affects the other. According to our results, the mean grade of tibiotalar joint arthritis was higher than that of DDD in specimens through the third and fourth decades of life (Figure 7). After the age of 50 years, the mean grade of DDD surpasses that of tibiotalar arthritis. This may be initially interpreted that development of tibiotalar joint arthritis precedes lumbar disc degeneration. Ankle osteoarthritis is relatively rare, and given that the vast majority of ankle osteoarthritis is secondary to trauma,22 we would expect to see a higher incidence of ankle osteoarthritis in a younger, more active cohort. In addition, given our finding that ankle arthritis is related to lumbar disc degeneration, one could speculate that tibiotalar arthritis at a young age predisposes an individual to developing lumbar degeneration later in life.
However, this conclusion is inherently flawed; closer examination of the data revealed that the mean grade of tibiotalar arthritis and DDD in the third and fourth decades is relatively low, between grade 0 and grade 1 (Figure 7). Therefore, it is difficult to arrive at a conclusion when comparing such small values. Second, we must remember that we are comparing an average value of disc degeneration across all lumbar levels. When a specimen has only 1 disc that is severely degenerated, this value is averaged across all 5 lumbar levels and, thus, the overall mean grade of arthrosis is significantly diminished.
In fact, data from previous studies concur with the second argument. Upper-level lumbar disc degeneration is relatively rare and the vast majority of patients with disc degeneration present with significant disease in only 1 or 2 discs.36,37 Analysis of the specimens in this study revealed bony evidence of disc degeneration present at all 5 lumbar levels in over half of the specimens examined (57%). However, the majority of specimens in this cohort exhibit only low-grade degeneration. When specimens were analyzed for severe arthrosis (grade 3 and higher), nearly half of the specimens were found to have severe disease involving only 1 intervertebral disc (Figure 6). Data from Miller and colleagues28 and the present study show that the upper lumbar levels were relatively spared; the L3-L4 and L4-L5 lumbar levels showed the highest prevalence and severity of degenerative change.
To address this issue, we evaluated the percentage of specimens per decade with severe arthrosis (grade 3 and higher) of at least 1 lumbar intervertebral disc and 1 tibiotalar joint. Severe lumbar disc degeneration was found to be more prevalent than severe ankle arthritis in individuals age 20 years or older (Figure 8). Therefore, we postulate that significant degenerative changes in the lumbar spine precede the development of severe ankle arthritis.
One can further speculate that sequelae from lumbar disc degeneration may lead to the development of tibiotalar arthritis, given our finding that severe lumbar degeneration predisposes an individual to the development of ankle arthritis. Because significant lumbar disc degeneration has long been known to result in both spinal nerve and cord compression, we hypothesize that this resultant neurocompression promotes altered gait and translation of atypical forces to the ankle and foot, thus predisposing to the onset and/or progression of osteoarthritis. In support of this hypothesis, Morag and colleagues15 demonstrated that neurologic compression produced an altered posture and gait because of lost motor function and afferent proprioceptive sensation. This form of neurologic compromise may exert atypical forces upon the foot and ankle, predisposing the joint to accelerated wear and primary arthrosis.
In addition, DDD involving 3 or more lumbar intervertebral levels was found to significantly increase the likelihood of the subject having severe tibiotalar joint arthritis. Provided that lumbar disc degeneration typically involves significant degeneration at 1 level, we assume that significant arthrosis at 3 or more levels correlates to an overall more severe DDD with a higher corresponding likelihood of neural compression. However, compression of peripheral lower extremity nerves has been shown to result in neuropathic arthropathy akin to the diabetic Charcot foot.38 This could be a possible mechanism of accelerated ankle arthritis, but this study did not examine soft-tissue disease nor take into account other medical comorbidities of each specimen, including genetic predispositions towards osteoarthritis.
It should be noted that the aforementioned causative relationship between lumbar disc degeneration and tibiotalar arthritis is speculative and cannot be demonstrated definitively by this investigation. We acknowledge limitations of this study and the need for further research of the possible causative mechanism(s) of accelerated ankle arthrosis secondary to lumbar spinal disease. Ideally, the questions posed by our report would be answered via a large prospective cohort study that utilized both serial imaging and autopsy analysis. Unfortunately, this form of study is logistically and financially difficult to perform.
This was a retrospective cadaveric study in which determination of arthrosis severity was based solely on bony evidence. Therefore, the role of soft-tissue disease in the pathogenesis of arthrosis of the lumbar spine and tibiotalar joint could not be assessed, nor could definitive associations to clinically symptomatic disease. We made the assumption that progression of bone degeneration in both the lumbar spine and tibiotalar joint corresponded equally to the associated soft-tissue changes. Given this assumption, we cannot definitively conclude that degeneration of the lumbar spine precedes that of the ankle, because the absence of magnetic resonance imaging or fresh autopsy specimens in our study misses the early degenerative changes in the discs that precede the bony alteration measured in our study. Furthermore, readers should note that since this study compared only bone morphology, no emphasis was placed on clinical manifestation of lumbar disc degeneration or tibiotalar joint arthritis. As mentioned earlier, radiologic evidence of disc degeneration was found in 90% of adults age 50 to 59 years, according to a study by Hult5; however, it is important to note that not all individuals studied were symptomatic clinically. Unfortunately, medical records were not available for the bony specimens, and clinical correlations could not be assessed during this investigation.
Furthermore, no special attention was given to other pathologic conditions observed during specimen measurement. The presence of diseases, such as osteoporosis, spondylolysis, or previous traumatic injury, may have had implications in the resultant joint degeneration. Finally, the evaluation of arthrosis was performed subjectively without measuring reliability. However, the present analysis includes a large sample, each joint type was reviewed by a single examiner, and used a classification system that was modeled on a validated grading system. Ideally, multiple individuals should have been used for each type of measurement, with subsequent analysis of intraobserver and interobserver reliability.
Conclusion
Based on our study of a large population of adult skeletal specimens, we ascertained that lumbar intervertebral disc degeneration and tibiotalar osteoarthritis are associated. The prevalence of severe lumbar disc degeneration was higher than that of tibiotalar joint arthritis in individuals age 20 years or older. This may suggest that gait changes from disc degeneration or neural compression in the lumbar spine may play a role in the development of ankle osteoarthritis. Additionally, subjects with severe disc degeneration were twice as likely to develop significant tibiotalar osteoarthritis. This must be considered in the differential when treating patients with degenerative changes of the lumbar spine and leg pain.
1. Mathers C, Fat DM, Boerma JT, for the World Health Organization. The Global Burden of Disease: 2004 Update. Geneva, Switzerland: World Health Organization, 2008.
2. Lawrence RC, Felson DT, Helmick CG, et al. Estimates of the prevalence of arthritis and other rheumatic conditions in the United States. Part II. Arthritis Rheum. 2008;58(1):26-35.
3. Kelsey JL, Githens PB, White AA, et al. An epidemiological study of lifting and twisting on the job and risk for acute prolapsed lumbar intervertebral disc. J Orthop Res. 1984;2(1):61-66.
4. Kellgren JH, Lawrence JS. Osteoarthrosis and disc degeneration in an urban population. Ann Rheum Dis. 1958;17(4):388-397.
5. Hult L. Cervical, dorsal and lumbar spinal syndromes; a field investigation of a non-selected material of 1200 workers in different occupations with special reference to disc degeneration and so-called muscular rheumatism. Acta Orthop Scand Suppl. 1954;17:65-73.
6. Hirsch C. The reaction of intervertebral discs to compression forces. J Bone Joint Surg Am. 1955;37(6):1188-1196.
7. Videman T, Nurminen M, Troup JD. Lumbar spinal pathology in cadaveric material in relation to history of back pain, occupation and physical loading. Spine. 1990;15(8):728-740.
8. Butler D, Trafimow JH, Andersson GB, McNeil TW, Huckman MS. Discs degenerate before facets. Spine. 1990;15(2):111-113.
9. Fujiwara A, Tamai K, Yamato M, et al. The relationship between facet joint osteoarthritis and disc degeneration of the lumbar spine: an MRI study. Eur Spine J. 1999;8(5):396-401.
10. Lipson SJ, Muir H. Experimental intervertebral disc degeneration: morphologic and proteoglycan changes over time. Arthritis Rheum. 1981;24(1):12-21.
11. Eisenstein S, Roberts S. The physiology of the disc and its clinical relevance. J Bone Joint Surg Br. 2003;85(5):633-636.
12. Hughes SP, Freemont AJ, Hukins DW, McGregor AH, Roberts S. The pathogenesis of degeneration of the intervertebral disc and emerging therapies in the management of back pain. J Bone Joint Surg Br. 2012;94(10):1298-1304.
13. Inoue N, Espinoza Orías AA. Biomechanics of intervertebral disk degeneration. Orthop Clin North Am. 2011;42(4):487-499.
14. Battié MC, Videman T. Lumbar disc degeneration: epidemiology and genetics. J Bone Joint Surg Am. 2006;88(suppl 2):3-9.
15. Morag E, Hurwitz DE, Andriacchi TP, Hickey M, Andersson GB. Abnormalities in muscle function during gait in relation to the level of lumbar disc herniation. Spine. 2000;25(7):829-833.
16. Oikawa Y, Ohtori S, Koshi T, et al. Lumbar disc degeneration induces persistent groin pain. Spine. 2012;37(2):114-118.
17. Porter RW. Spinal stenosis and neurogenic claudication. Spine. 1996;21(17):2046-2052.
18. Papadakis NC, Christakis DG, Tzagarakis GN, et al. Gait variability measurements in lumbar spinal stenosis patients: part A. Comparison with healthy subjects. Physiol Meas. 2009;30(11):1171-1186.
19. McGregor AH, Hukins DW. Lower limb involvement in spinal function and low back pain. J Back Musculoskelet Rehabil. 2009;22(4):219-222.
20. Offierski CM, MacNab I. Hip-spine syndrome. Spine. 1983;8(3):316-321.
21. Thomas RH, Daniels TR. Ankle arthritis. J Bone Joint Surg Am. 2003;85(5):923-936.
22. Valderrabano V, Horisberger M, Russell I, Dougall H, Hintermann B. Etiology of ankle osteoarthritis. Clin Orthop. 2009;467(7):1800-1806.
23. Eubanks JD, Lee MJ, Cassinelli E, Ahn NU. Does lumbar facet arthrosis precede disc degeneration? A postmortem study. Clin Orthop. 2007;464:184-189.
24. Friberg S, Hirsch C. Anatomical and clinical changes in lumbar disc degeneration. Acta Orthop Scand. 1949;19(2):222-242.
25. Sponseller PD, McBeath AA, Perpich M. Hip arthrodesis in young patients. A long-term follow-up study. J Bone Joint Surg Am. 1984;66(6):853-859.
26. Tsuji T, Matsuyama Y, Goto M, et al. Knee-spine syndrome: correlation between sacral inclination and patellofemoral joint pain. J Orthop Sci. 2002;7(5):519-523.
27. Horvath G, Koroknai G, Acs B, Than P, Illés T. Prevalence of low back pain and lumbar spine degenerative disorders. Questionnaire survey and clinical-radiological analysis of a representative Hungarian population. Int Orthop. 2010;34(8):1245-1249.
28. Miller JA, Schmatz C, Schultz AB. Lumbar disc degeneration: correlation with age, sex, and spine level in 600 autopsy specimens. Spine. 1988;13(2):173-178.
29. Nachemson A. Lumbar intradiscal pressure: experimental studies on post-mortem material. Acta Orthop Scand Suppl. 1960;43:1-104.
30. Kraemer J. Pressure-dependent fluid shifts in the intervertebral disc. Orthop Clin North Am. 1977;8(1):211-216.
31. Urban JP, McMullin JF. Swelling pressure of the intervertebral disc: influence of proteoglycan and collagen contents. Biorheology. 1985;22(2):145-157.
32. Coventry MB, Ghromley RK, Kernohan JW. The intervertebral disc, its macroscopic anatomy and pathology: Part III. Pathologic changes in the intervertebral disc. J Bone Joint Surg Br. 1945;27:460-474.
33. Friberg S, Hirsch C. Anatomical and clinical changes in lumbar disc degeneration. Acta Orthop Scand. 1949;19(2):222-242.
34. Lyons G, Eisenstein SM, Sweet MB. Biochemical changes in intervertebral disc degeneration. Biochim Biophys Acta. 1981;673(4):443-453.
35. Koeller W, Muehlhaus S, Meier W, Hartmann F. Biomechanical properties of human intervertebral discs subjected to axial dynamic compression: influence of age and degeneration. J Biomech. 1986;19(10):807-816.
36. Bosacco SJ, Berman AT, Raisis LW, Zamarin RI. High lumbar herniations. Case reports. Orthopaedics. 1989;12(2):275-278.
37. Spangfort EV. The lumbar disc herniation. A computer-aided analysis of 2,504 operations. Acta Orthop Scand Suppl. 1972;142:1-95.
38. Gupta R. A short history of neuropathic arthropathy. Clin Orthop. 1993;296:43-49.
Osteoarthritis is the most common joint disorder, resulting in significant morbidity and disability. The worldwide prevalence of osteoarthritis was estimated at more than 151 million people, according to data published in 2004.1 In the United States, almost 27 million adults age 25 years and older suffer from clinically apparent disease.2 The spine is one of the most commonly affected joints of arthritis, and idiopathic low back pain is the most frequent complaint in the adult population.3 In adults with low back pain, evidence of lumbar intervertebral disc degeneration is often found on radiography.4 In 1 study, evidence of disc degeneration was found in 90% of adults age 50 to 59 years.5
Degenerative spinal disease most commonly affects the lumbar spine due to its high degree of mobility and weight-loading.6,7 Clinical8,9 and experimental studies10 have suggested that the degenerative changes in the lumbar spine begin in the intervertebral discs. Degenerative disc disease (DDD) results from a continuum of dehydration, degradation, and remodeling of the intervertebral discs and neighboring vertebrae to accommodate the changes in physical loading.11-13 This results in disc-space narrowing, disc bulging and herniation, vertebral rim osteophyte formation, and endplate sclerosis.7,14 Symptomatic neural compression may occur, often manifested by localized lower back and extremity pain, as well as sensory loss and weakness of the lower extremities.15-17 Changes in posture and gait may result because of altered sensation, and the consequent abnormal force transmission may predispose joints to accelerated wear and arthrosis.15,18
Numerous studies have delineated the association between lumbar spinal disorders and lower extremity arthrosis. Of note, research has demonstrated that hip and/or knee pathology and gait alteration may promote low back pain and lumbar disc degeneration.19-21 Although spinal abnormalities, such as scoliosis, may predispose an individual to accelerated hip degeneration,20 no studies have investigated the relationship between lumbar DDD and ankle osteoarthritis.
Ankle arthritis differs from hip and knee arthritis demographically, occurring approximately 9 times less frequently.21 The ankle joint is subjected to more weight-bearing force per square centimeter and is more commonly injured than any other joint in the body.21 Trauma and/or abnormal ankle mechanics are the most common causes of degenerative ankle arthritis.22 Other potential causes include inflammatory arthropathies, neuropathic arthropathy, infection, and tumor. The purpose of this study was to determine if a relationship exists between ankle arthrosis and lumbar disc degeneration, and to delineate if one may promote the onset or progression of the other.
Materials and Methods
We randomly chose 710 cadaveric specimens from the Hamann-Todd Osteological Collection in Cleveland, Ohio. The Hamann-Todd Collection contains skeletal remains from more than 3000 individuals who died in Cleveland, Ohio between 1893 and 1938. The cohort for this study included 583 male and 127 female cadavers, ranging in age from 17 to 105 years at the time of death. Table 1 shows the breakdown of these specimens according to age group; of the 710 specimens, 306 were of African American ancestry, and 404 were Caucasian.
Lumbar DDD was graded at each lumbar spinal level by a single examiner using the Eubanks modification23 of the Kettler and Wilke classification of vertebral endplate osteophytosis24:
Grade 0: normal vertebral endplates;
Grade 1: mild arthrosis, with evidence of osteophytic reaction involving up to 50% of the vertebral endplates;
Grade 2: moderate arthrosis, with evidence of osteophytic reaction involving 50% to 100% of the vertebral endplates;
Grade 3: severe arthrosis, with evidence of osteophytic reaction involving 100% of the vertebral endplates. Osteophytes are hypertrophic and bridging the joint space (Figure 1);
Grade 4: complete ankylosis.
Tibiotalar joint osteoarthritis was evaluated by a single examiner using a modification of the Kellgren-Lawrence classification4 for knee osteoarthritis:
Grade 0: no discernable wear/osteophytes;
Grade 1: 1-mm osteophyte(s) and/or <25% surface wear;
Grade 2: 1- to 2-mm osteophyte(s) and/or 25% to 50% joint surface;
Grade 3: 2- to 3-mm osteophyte(s) and/or >50% joint surface (Figure 2);
Grade 4: multiple large osteophytes and/or definite bony end deformity.
Statistical analysis was performed on the compiled data using Stata software (StataCorp, College Station, Texas). Linear and logistic regression analyses correcting for confounding factors of age, sex, race, and height were performed using a standard P-value cutoff (P < .05) and 95% confidence interval to determine statistical significance.
Results
Patients were considered to have osteoarthritis of the tibiotalar joint if either of the extremities measured grade 1 or higher. Of the 710 specimens selected, 14 specimens did not have adequate bone available for bilateral tibiotalar joint measurement, either from extensive bone degradation or amputation. Of the remaining 696 specimens, 586 had some degree of tibiotalar osteoarthritis present (Table 2). Regression analysis showed a significant positive association between right- and left-ankle osteoarthritis (coefficient: 0.491, P < .01). Tibiotalar joint arthritis was classified as severe if either extremity had arthrosis of grade 3 or higher. Of the 586 specimens that had tibiotalar joint arthritis, only 16% (97 specimens) had severe tibiotalar joint arthritis.
Data regarding lumbar disc degeneration were available for 516 of the 710 specimens selected, 443 of which showed some disc degeneration. Disc degeneration was most prevalent and significant at the L4-L5 and L3-L4 intervertebral levels (Figures 3, 4). Of these 516 specimens, 30 had degeneration at 1 level, 47 specimens had degeneration at 2 levels, 29 specimens had degeneration at 3 levels, 52 had degeneration at 4 levels, and 285 specimens had degeneration at all 5 lumbar levels. The majority of specimens were found to have some degree of degeneration at all 5 lumbar spinal levels (Figure 5). Severe lumbar DDD was defined as grade 3 or higher osteoarthritis present in at least 1 of the 5 lumbar levels. Of the 516 specimens that showed some degree of disc degeneration, 152 were classified as severe. When stratified by number of spinal levels, only 30% of specimens were found to have evidence of severe arthrosis, the majority of which was located at only 1 lumbar segment (Figure 6).
Linear regression analysis of the data showed a statistically significant positive association between lumbar disc degeneration and tibiotalar osteoarthritis (coefficient: 0.844, P < .01), even when correcting for confounding factors, such as age, sex, and race (coefficient: 0.331, P < .01).
Additional analysis of the data demonstrated that tibiotalar joint arthritis remained significantly associated with lumbar DDD across each lumbar level: L1-L2 (coefficient: 0.269, P < .01), L2-L3 (coefficient: 0.283, P < .01), L3-L4 (coefficient: 0.299, P < .01), L4-L5 (coefficient: 0.240, P < .02), L5-S1 (coefficient: 0.167, P < .05).
The presence of 3 or more levels of lumbar DDD significantly increased the possibility of developing severe tibiotalar joint arthritis. Lumbar DDD that encompassed 3 levels showed the highest odds for development of severe tibiotalar joint arthritis with an odds ratio (OR) of 20.542 (Table 3).
When subjects were compared by decade, the mean grade of tibiotalar joint arthritis was significantly higher than lumbar DDD in specimens who died in their 20s and 30s. This difference was insignificant in the fourth decade, and thereafter the mean value of lumbar DDD surpassed that of tibiotalar joint arthritis (Figure 7).
In contrast, severe lumbar DDD was more prevalent than severe tibiotalar joint arthritis in individuals age 20 years or older (Figure 8). There were no specimens under age 20 years with severe lumbar DDD or severe tibiotalar joint arthritis.
Logistic regression showed that individuals with severe lumbar disc degeneration had significantly higher odds of developing severe ankle arthritis (OR: 1.93, P < .05). Similarly, individuals with severe tibiotalar joint arthritis were just as likely to develop severe lumbar DDD with an OR of 1.97 (P < .05).
Discussion
Multiple joint involvement in osteoarthritis is well established with a wide range of evidence linking lower extremity joint pathology and lumbar spinal disease. In 1983, Offierski and MacNab20 were the first to describe hip-spine syndrome. In the next year, a study by Sponseller and colleagues25 of pediatric patients after hip arthrodesis further substantiated the association between spine and extremity disease, and demonstrated a continued cause and effect relationship after surgery.
Lumbar spinal degeneration has also been correlated with knee osteoarthritis. Tsuji and colleagues26 reported that degenerative changes in spinal alignment result in increased thigh muscle tension and knee flexion. Furthermore, in their radiographic analysis of 682 individuals, Horvath and colleagues27 also showed that individuals with spinal degeneration had a higher prevalence of knee and hip osteoarthritis.
One might hypothesize from this evidence that lumbar spinal degeneration and ankle arthritis would also be interrelated, given their interconnected role in lower extremity force transmission. Surprisingly, the literature correlating lumbar degeneration and lower extremity osteoarthritis has overlooked this association and has focused solely on the hip and knee. To our knowledge, this study is the first to identify a statistically significant association between tibiotalar joint osteoarthritis and lumbar disc degeneration.
The literature supported analysis of our data. Miller and colleagues28 evaluated disc degeneration in 600 autopsy specimens using the Nachemson29 grading system. This system categorizes disc degeneration into 4 grades based on macroscopic appearance. Miller and colleagues28 reported evidence of degenerative changes as early as the second decade of life, primarily involving the L3–L4 and L4–L5 levels. Of note, the Nachemson29 classification system includes only evidence of marginal osteophytes in grade 4 disease, which was not identified by Miller and colleagues28 until the fourth decade. These results were similar to those in our study, in which the L3-L4 and L4-L5 intervertebral levels were most commonly affected. However, in our study, significant degenerative changes were found in the third decade of life.
In addition, the percentage of specimens with severe disc degeneration increased with each decade (Figure 8). A substantial amount of histologic evidence demonstrates the progression of disc degeneration with age. With increased age, there is a gradual decrease in the osmotic swelling of intervertebral discs30 and a 2-fold decrease in disc hydration between adolescence and the eighth decade.31 Furthermore, the nucleus pulposus undergoes progressive fibrosis,32,33 with a 5-fold decrease in the fixed-charge density of nucleus glycosaminoglycans,34 and a 2-fold increase in intervertebral disc creep while under compression after age 30 years.35
While analyzing our findings, we had difficulty in determining which pathologic condition debuts and, subsequently, affects the other. According to our results, the mean grade of tibiotalar joint arthritis was higher than that of DDD in specimens through the third and fourth decades of life (Figure 7). After the age of 50 years, the mean grade of DDD surpasses that of tibiotalar arthritis. This may be initially interpreted that development of tibiotalar joint arthritis precedes lumbar disc degeneration. Ankle osteoarthritis is relatively rare, and given that the vast majority of ankle osteoarthritis is secondary to trauma,22 we would expect to see a higher incidence of ankle osteoarthritis in a younger, more active cohort. In addition, given our finding that ankle arthritis is related to lumbar disc degeneration, one could speculate that tibiotalar arthritis at a young age predisposes an individual to developing lumbar degeneration later in life.
However, this conclusion is inherently flawed; closer examination of the data revealed that the mean grade of tibiotalar arthritis and DDD in the third and fourth decades is relatively low, between grade 0 and grade 1 (Figure 7). Therefore, it is difficult to arrive at a conclusion when comparing such small values. Second, we must remember that we are comparing an average value of disc degeneration across all lumbar levels. When a specimen has only 1 disc that is severely degenerated, this value is averaged across all 5 lumbar levels and, thus, the overall mean grade of arthrosis is significantly diminished.
In fact, data from previous studies concur with the second argument. Upper-level lumbar disc degeneration is relatively rare and the vast majority of patients with disc degeneration present with significant disease in only 1 or 2 discs.36,37 Analysis of the specimens in this study revealed bony evidence of disc degeneration present at all 5 lumbar levels in over half of the specimens examined (57%). However, the majority of specimens in this cohort exhibit only low-grade degeneration. When specimens were analyzed for severe arthrosis (grade 3 and higher), nearly half of the specimens were found to have severe disease involving only 1 intervertebral disc (Figure 6). Data from Miller and colleagues28 and the present study show that the upper lumbar levels were relatively spared; the L3-L4 and L4-L5 lumbar levels showed the highest prevalence and severity of degenerative change.
To address this issue, we evaluated the percentage of specimens per decade with severe arthrosis (grade 3 and higher) of at least 1 lumbar intervertebral disc and 1 tibiotalar joint. Severe lumbar disc degeneration was found to be more prevalent than severe ankle arthritis in individuals age 20 years or older (Figure 8). Therefore, we postulate that significant degenerative changes in the lumbar spine precede the development of severe ankle arthritis.
One can further speculate that sequelae from lumbar disc degeneration may lead to the development of tibiotalar arthritis, given our finding that severe lumbar degeneration predisposes an individual to the development of ankle arthritis. Because significant lumbar disc degeneration has long been known to result in both spinal nerve and cord compression, we hypothesize that this resultant neurocompression promotes altered gait and translation of atypical forces to the ankle and foot, thus predisposing to the onset and/or progression of osteoarthritis. In support of this hypothesis, Morag and colleagues15 demonstrated that neurologic compression produced an altered posture and gait because of lost motor function and afferent proprioceptive sensation. This form of neurologic compromise may exert atypical forces upon the foot and ankle, predisposing the joint to accelerated wear and primary arthrosis.
In addition, DDD involving 3 or more lumbar intervertebral levels was found to significantly increase the likelihood of the subject having severe tibiotalar joint arthritis. Provided that lumbar disc degeneration typically involves significant degeneration at 1 level, we assume that significant arthrosis at 3 or more levels correlates to an overall more severe DDD with a higher corresponding likelihood of neural compression. However, compression of peripheral lower extremity nerves has been shown to result in neuropathic arthropathy akin to the diabetic Charcot foot.38 This could be a possible mechanism of accelerated ankle arthritis, but this study did not examine soft-tissue disease nor take into account other medical comorbidities of each specimen, including genetic predispositions towards osteoarthritis.
It should be noted that the aforementioned causative relationship between lumbar disc degeneration and tibiotalar arthritis is speculative and cannot be demonstrated definitively by this investigation. We acknowledge limitations of this study and the need for further research of the possible causative mechanism(s) of accelerated ankle arthrosis secondary to lumbar spinal disease. Ideally, the questions posed by our report would be answered via a large prospective cohort study that utilized both serial imaging and autopsy analysis. Unfortunately, this form of study is logistically and financially difficult to perform.
This was a retrospective cadaveric study in which determination of arthrosis severity was based solely on bony evidence. Therefore, the role of soft-tissue disease in the pathogenesis of arthrosis of the lumbar spine and tibiotalar joint could not be assessed, nor could definitive associations to clinically symptomatic disease. We made the assumption that progression of bone degeneration in both the lumbar spine and tibiotalar joint corresponded equally to the associated soft-tissue changes. Given this assumption, we cannot definitively conclude that degeneration of the lumbar spine precedes that of the ankle, because the absence of magnetic resonance imaging or fresh autopsy specimens in our study misses the early degenerative changes in the discs that precede the bony alteration measured in our study. Furthermore, readers should note that since this study compared only bone morphology, no emphasis was placed on clinical manifestation of lumbar disc degeneration or tibiotalar joint arthritis. As mentioned earlier, radiologic evidence of disc degeneration was found in 90% of adults age 50 to 59 years, according to a study by Hult5; however, it is important to note that not all individuals studied were symptomatic clinically. Unfortunately, medical records were not available for the bony specimens, and clinical correlations could not be assessed during this investigation.
Furthermore, no special attention was given to other pathologic conditions observed during specimen measurement. The presence of diseases, such as osteoporosis, spondylolysis, or previous traumatic injury, may have had implications in the resultant joint degeneration. Finally, the evaluation of arthrosis was performed subjectively without measuring reliability. However, the present analysis includes a large sample, each joint type was reviewed by a single examiner, and used a classification system that was modeled on a validated grading system. Ideally, multiple individuals should have been used for each type of measurement, with subsequent analysis of intraobserver and interobserver reliability.
Conclusion
Based on our study of a large population of adult skeletal specimens, we ascertained that lumbar intervertebral disc degeneration and tibiotalar osteoarthritis are associated. The prevalence of severe lumbar disc degeneration was higher than that of tibiotalar joint arthritis in individuals age 20 years or older. This may suggest that gait changes from disc degeneration or neural compression in the lumbar spine may play a role in the development of ankle osteoarthritis. Additionally, subjects with severe disc degeneration were twice as likely to develop significant tibiotalar osteoarthritis. This must be considered in the differential when treating patients with degenerative changes of the lumbar spine and leg pain.
1. Mathers C, Fat DM, Boerma JT, for the World Health Organization. The Global Burden of Disease: 2004 Update. Geneva, Switzerland: World Health Organization, 2008.
2. Lawrence RC, Felson DT, Helmick CG, et al. Estimates of the prevalence of arthritis and other rheumatic conditions in the United States. Part II. Arthritis Rheum. 2008;58(1):26-35.
3. Kelsey JL, Githens PB, White AA, et al. An epidemiological study of lifting and twisting on the job and risk for acute prolapsed lumbar intervertebral disc. J Orthop Res. 1984;2(1):61-66.
4. Kellgren JH, Lawrence JS. Osteoarthrosis and disc degeneration in an urban population. Ann Rheum Dis. 1958;17(4):388-397.
5. Hult L. Cervical, dorsal and lumbar spinal syndromes; a field investigation of a non-selected material of 1200 workers in different occupations with special reference to disc degeneration and so-called muscular rheumatism. Acta Orthop Scand Suppl. 1954;17:65-73.
6. Hirsch C. The reaction of intervertebral discs to compression forces. J Bone Joint Surg Am. 1955;37(6):1188-1196.
7. Videman T, Nurminen M, Troup JD. Lumbar spinal pathology in cadaveric material in relation to history of back pain, occupation and physical loading. Spine. 1990;15(8):728-740.
8. Butler D, Trafimow JH, Andersson GB, McNeil TW, Huckman MS. Discs degenerate before facets. Spine. 1990;15(2):111-113.
9. Fujiwara A, Tamai K, Yamato M, et al. The relationship between facet joint osteoarthritis and disc degeneration of the lumbar spine: an MRI study. Eur Spine J. 1999;8(5):396-401.
10. Lipson SJ, Muir H. Experimental intervertebral disc degeneration: morphologic and proteoglycan changes over time. Arthritis Rheum. 1981;24(1):12-21.
11. Eisenstein S, Roberts S. The physiology of the disc and its clinical relevance. J Bone Joint Surg Br. 2003;85(5):633-636.
12. Hughes SP, Freemont AJ, Hukins DW, McGregor AH, Roberts S. The pathogenesis of degeneration of the intervertebral disc and emerging therapies in the management of back pain. J Bone Joint Surg Br. 2012;94(10):1298-1304.
13. Inoue N, Espinoza Orías AA. Biomechanics of intervertebral disk degeneration. Orthop Clin North Am. 2011;42(4):487-499.
14. Battié MC, Videman T. Lumbar disc degeneration: epidemiology and genetics. J Bone Joint Surg Am. 2006;88(suppl 2):3-9.
15. Morag E, Hurwitz DE, Andriacchi TP, Hickey M, Andersson GB. Abnormalities in muscle function during gait in relation to the level of lumbar disc herniation. Spine. 2000;25(7):829-833.
16. Oikawa Y, Ohtori S, Koshi T, et al. Lumbar disc degeneration induces persistent groin pain. Spine. 2012;37(2):114-118.
17. Porter RW. Spinal stenosis and neurogenic claudication. Spine. 1996;21(17):2046-2052.
18. Papadakis NC, Christakis DG, Tzagarakis GN, et al. Gait variability measurements in lumbar spinal stenosis patients: part A. Comparison with healthy subjects. Physiol Meas. 2009;30(11):1171-1186.
19. McGregor AH, Hukins DW. Lower limb involvement in spinal function and low back pain. J Back Musculoskelet Rehabil. 2009;22(4):219-222.
20. Offierski CM, MacNab I. Hip-spine syndrome. Spine. 1983;8(3):316-321.
21. Thomas RH, Daniels TR. Ankle arthritis. J Bone Joint Surg Am. 2003;85(5):923-936.
22. Valderrabano V, Horisberger M, Russell I, Dougall H, Hintermann B. Etiology of ankle osteoarthritis. Clin Orthop. 2009;467(7):1800-1806.
23. Eubanks JD, Lee MJ, Cassinelli E, Ahn NU. Does lumbar facet arthrosis precede disc degeneration? A postmortem study. Clin Orthop. 2007;464:184-189.
24. Friberg S, Hirsch C. Anatomical and clinical changes in lumbar disc degeneration. Acta Orthop Scand. 1949;19(2):222-242.
25. Sponseller PD, McBeath AA, Perpich M. Hip arthrodesis in young patients. A long-term follow-up study. J Bone Joint Surg Am. 1984;66(6):853-859.
26. Tsuji T, Matsuyama Y, Goto M, et al. Knee-spine syndrome: correlation between sacral inclination and patellofemoral joint pain. J Orthop Sci. 2002;7(5):519-523.
27. Horvath G, Koroknai G, Acs B, Than P, Illés T. Prevalence of low back pain and lumbar spine degenerative disorders. Questionnaire survey and clinical-radiological analysis of a representative Hungarian population. Int Orthop. 2010;34(8):1245-1249.
28. Miller JA, Schmatz C, Schultz AB. Lumbar disc degeneration: correlation with age, sex, and spine level in 600 autopsy specimens. Spine. 1988;13(2):173-178.
29. Nachemson A. Lumbar intradiscal pressure: experimental studies on post-mortem material. Acta Orthop Scand Suppl. 1960;43:1-104.
30. Kraemer J. Pressure-dependent fluid shifts in the intervertebral disc. Orthop Clin North Am. 1977;8(1):211-216.
31. Urban JP, McMullin JF. Swelling pressure of the intervertebral disc: influence of proteoglycan and collagen contents. Biorheology. 1985;22(2):145-157.
32. Coventry MB, Ghromley RK, Kernohan JW. The intervertebral disc, its macroscopic anatomy and pathology: Part III. Pathologic changes in the intervertebral disc. J Bone Joint Surg Br. 1945;27:460-474.
33. Friberg S, Hirsch C. Anatomical and clinical changes in lumbar disc degeneration. Acta Orthop Scand. 1949;19(2):222-242.
34. Lyons G, Eisenstein SM, Sweet MB. Biochemical changes in intervertebral disc degeneration. Biochim Biophys Acta. 1981;673(4):443-453.
35. Koeller W, Muehlhaus S, Meier W, Hartmann F. Biomechanical properties of human intervertebral discs subjected to axial dynamic compression: influence of age and degeneration. J Biomech. 1986;19(10):807-816.
36. Bosacco SJ, Berman AT, Raisis LW, Zamarin RI. High lumbar herniations. Case reports. Orthopaedics. 1989;12(2):275-278.
37. Spangfort EV. The lumbar disc herniation. A computer-aided analysis of 2,504 operations. Acta Orthop Scand Suppl. 1972;142:1-95.
38. Gupta R. A short history of neuropathic arthropathy. Clin Orthop. 1993;296:43-49.