User login
Patients at Risk for Readmission
Unplanned hospital readmissions are common, costly, and potentially avoidable. Approximately 20% of Medicare patients are readmitted within 30 days of discharge.[1] Readmission rates are estimated to be similarly high in other population subgroups,[2, 3, 4] with approximately 80% of patients[1, 5, 6] readmitted to the original discharging hospital. A recent systematic review suggested that 27% of readmissions may be preventable.[7]
Hospital readmissions have increasingly been viewed as a correctable marker of poor quality care and have been adopted by a number of organizations as quality indicators.[8, 9, 10] As a result, hospitals have important internal and external motivations to address readmissions. Identification of patients at high risk for readmissions may be an important first step toward preventing them. In particular, readmission risk assessment could be used to help providers target the delivery of resource‐intensive transitional care interventions[11, 12, 13, 14] to patients with the greatest needs. Such an approach is appealing because it allows hospitals to focus scarce resources where the impact may be greatest and provides a starting point for organizations struggling to develop robust models of transitional care delivery.
Electronic health records (EHRs) may prove to be an important component of strategies designed to risk stratify patients at the point of care. Algorithms integrated into the EHR that automatically generate risk predictions have the potential to (1) improve provider time efficiency by automating the prediction process, (2) improve consistency of data collection and risk score calculation, (3) increase adoption through improved usability, and (4) provide clinically important information in real‐time to all healthcare team members caring for a hospitalized patient.
We thus sought to derive a predictive model for 30‐day readmissions using data reliably present in our EHR at the time of admission, and integrate this predictive model into our hospital's EHR to create an automated prediction tool that identifies on admission patients at high risk for readmission within 30 days of discharge. In addition, we prospectively validated this model using the 12‐month period after implementation and examined the impact on readmissions.
METHODS
Setting
The University of Pennsylvania Health System (UPHS) includes 3 hospitals, with a combined capacity of over 1500 beds and 70,000 annual admissions. All hospitals currently utilize Sunrise Clinical Manager version 5.5 (Allscripts, Chicago, IL) as their EHR. The study sample included all adult admissions to any of the 3 UPHS hospitals during the study period. Admissions to short procedure, rehabilitation, and hospice units were excluded. The study received expedited approval and a HIPAA waiver from the University of Pennsylvania institutional review board.
Development of Predictive Model
The UPHS Center for Evidence‐based Practice[15, 16] performed a systematic review to identify factors associated with hospital readmission within 30 days of discharge. We then examined the data available from our hospital EHR at the time of admission for those factors identified in the review. Using different threshold values and look‐back periods, we developed and tested 30 candidate prediction models using these variables alone and in combination (Table 1). Prediction models were evaluated using 24 months of historical data between August 1, 2009 and August 1, 2011.
Implementation
An automated readmission risk flag was then integrated into the EHR. Patients classified as being at high risk for readmission with the automated prediction model were flagged in the EHR on admission (Figure 1A). The flag can be double‐clicked to display a separate screen with information relevant to discharge planning including inpatient and emergency department (ED) visits in the prior 12 months, as well as information about the primary team, length of stay, and admitting problem associated with those admissions (Figure 1B). The prediction model was integrated into our EHR using Arden Syntax for Medical Logic Modules.[17] The readmission risk screen involved presenting the provider with a new screen and was thus developed in Microsoft .NET using C# and Windows Forms (Microsoft Corp., Redmond, WA).

The flag was visible on the patient lists of all providers who utilized the EHR. This included but was not limited to nurses, social workers, unit pharmacists, and physicians. At the time of implementation, educational events regarding the readmission risk flag were provided in forums targeting administrators, pharmacists, social workers, and housestaff. Information about the flag and recommendations for use were distributed through emails and broadcast screensaver messages disseminated throughout the inpatient units of the health system. Providers were asked to pay special attention to discharge planning for patients triggering the readmission risk flag, including medication reconciliation by pharmacists for these patients prior to discharge, and arrangement of available home services by social workers.
The risk flag was 1 of 4 classes of interventions developed and endorsed by the health system in its efforts to reduce readmissions. Besides risk stratification, the other classes were: interdisciplinary rounding, patient education, and discharge communication. None of the interventions alone were expected to decrease readmissions, but as all 4 classes of interventions were implemented and performed routinely, the expectation was that they would work in concert to reduce readmissions.
Analysis
The primary outcome was all‐cause hospital readmissions in the healthcare system within 30 days of discharge. Although this outcome is commonly used both in the literature and as a quality metric, significant debate persists as to the appropriateness of this metric.[18] Many of the factors driving 30‐day readmissions may be dependent on factors outside of the discharging hospital's control and it has been argued that nearer‐term, nonelective readmission rates may provide a more meaningful quality metric.[18] Seven‐day unplanned readmissions were thus used as a secondary outcome measure for this study.
Sensitivity, specificity, predictive value, C statistic, F score (the harmonic mean of positive predictive value and sensitivity),[19] and screen‐positive rate were calculated for each of the 30 prediction models evaluated using the historical data. The prediction model with the best balance of F score and screen‐positive rate was selected as the prediction model to be integrated into the EHR. Prospective validation of the selected prediction model was performed using the 12‐month period following implementation of the risk flag (September 2011September 2012).
To assess the impact of the automated prediction model on monthly readmission rate, we used the 24‐month period immediately before and the 12‐month period immediately after implementation of the readmission risk flag. Segmented regression analysis was performed testing for changes in level and slope of readmission rates between preimplementation and postimplementation time periods. This quasiexperimental interrupted time series methodology[20] allows us to control for secular trends in readmission rates and to assess the preimplementation trend (secular trend), the difference in rates immediately before and after the implementation (immediate effect), and the postimplementation change over time (sustained effect). We used Cochrane‐Orcutt estimation[21] to correct for serial autocorrelation.
All analyses were performed using Stata 12.1 software (Stata Corp, College Station, TX).
RESULTS
Predictors of Readmission
Our systematic review of the literature identified several patient and healthcare utilization patterns predictive of 30‐day readmission risk. Utilization factors included length of stay, number of prior admissions, previous 30‐day readmissions, and previous ED visits. Patient characteristics included number of comorbidities, living alone, and payor. Evidence was inconsistent regarding threshold values for these variables.
Many variables readily available in our EHR were either found by the systematic review not to be reliably predictive of 30‐day readmission (including age and gender) or were not readily or reliably available on admission (including length of stay and payor). At the time of implementation, our EHR did not include vital sign or nursing assessment variables, so these were not considered for inclusion in our model.
Of the available variables, 3 were consistently accurate and available in the EHR at the time of patient admission: prior hospital admission, emergency department visit, and 30‐day readmission within UPHS. We then developed 30 candidate prediction models using a combination of these variables, including 1 and 2 prior admissions, ED visits, and 30‐day readmissions in the 6 and 12 months preceding the index visit (Table 1).
Development and Validation
We used 24 months of retrospective data, which included 120,396 discharges with 17,337 thirty‐day readmissions (14.4% 30‐day all‐cause readmission rate) to test the candidate prediction models. A single risk factor, 2 inpatient admissions in the past 12 months, was found to have the best balance of sensitivity (40%), positive predictive value (31%), and proportion of patients flagged (18%) (Table 1).
| Sensitivity | Specificity | C Statistic | PPV | NPV | Screen Positive | F Score | |
|---|---|---|---|---|---|---|---|
| |||||||
| Retrospective Evaluation of Prediction Rules Lookback period: 6 months | |||||||
| Prior Admissions | |||||||
| 1 | 53% | 74% | 0.640 | 26% | 91% | 30% | 0.350 |
| 2 | 32% | 90% | 0.610 | 35% | 89% | 13% | 0.333 |
| 3 | 20% | 96% | 0.578 | 44% | 88% | 7% | 0.274 |
| Prior ED Visits | |||||||
| 1 | 31% | 81% | 0.558 | 21% | 87% | 21% | 0.252 |
| 2 | 13% | 93% | 0.532 | 25% | 87% | 8% | 0.172 |
| 3 | 7% | 97% | 0.519 | 27% | 86% | 4% | 0.111 |
| Prior 30‐day Readmissions | |||||||
| 1 | 39% | 85% | 0.623 | 31% | 89% | 18% | 0.347 |
| 2 | 21% | 95% | 0.582 | 43% | 88% | 7% | 0.284 |
| 3 | 13% | 98% | 0.555 | 53% | 87% | 4% | 0.208 |
| Combined Rules | |||||||
| Admit1 & ED1 | 22% | 92% | 0.568 | 31% | 88% | 10% | 0.255 |
| Admit2 & ED1 | 15% | 96% | 0.556 | 40% | 87% | 5% | 0.217 |
| Admit1 & 30‐day1 | 39% | 85% | 0.623 | 31% | 89% | 18% | 0.346 |
| Admit2 & 30‐day1 | 29% | 92% | 0.603 | 37% | 89% | 11% | 0.324 |
| 30‐day1 & ED1 | 17% | 95% | 0.559 | 37% | 87% | 6% | 0.229 |
| 30‐day1 & ED2 | 8% | 98% | 0.527 | 40% | 86% | 3% | 0.132 |
| Lookback period: 12 months | |||||||
| Prior Admission | |||||||
| 1 | 60% | 68% | 0.593 | 24% | 91% | 36% | 0.340 |
| 2a | 40% | 85% | 0.624 | 31% | 89% | 18% | 0.354 |
| 3 | 28% | 92% | 0.600 | 37% | 88% | 11% | 0.318 |
| Prior ED Visit | |||||||
| 1 | 38% | 74% | 0.560 | 20% | 88% | 28% | 0.260 |
| 2 | 20% | 88% | 0.544 | 23% | 87% | 13% | 0.215 |
| 3 | 8% | 96% | 0.523 | 27% | 86% | 4% | 0.126 |
| Prior 30‐day Readmission | |||||||
| 1 | 43% | 84% | 0.630 | 30% | 90% | 20% | 0.353 |
| 2 | 24% | 94% | 0.592 | 41% | 88% | 9% | 0.305 |
| 3 | 11% | 98% | 0.548 | 54% | 87% | 3% | 0.186 |
| Combined Rules | |||||||
| Admit1 & ED1 | 29% | 87% | 0.580 | 27% | 88% | 15% | 0.281 |
| Admit2 & ED1 | 22% | 93% | 0.574 | 34% | 88% | 9% | 0.266 |
| Admit1 & 30‐day1 | 42% | 84% | 0.630 | 30% | 90% | 14% | 0.353 |
| Admit2 & 30‐day1 | 34% | 89% | 0.615 | 34% | 89% | 14% | 0.341 |
| 30‐day1 & ED1 | 21% | 93% | 0.569 | 35% | 88% | 9% | 0.261 |
| 30‐day1 & ED2 | 13% | 96% | 0.545 | 37% | 87% | 5% | 0.187 |
| Prospective Evaluation of Prediction Rule | |||||||
| 30‐Day All‐Cause | 39% | 84% | 0.614 | 30% | 89% | 18% | 0.339 |
Prospective validation of the prediction model was performed using the 12‐month period directly following readmission risk flag implementation. During this period, the 30‐day all‐cause readmission rate was 15.1%. Sensitivity (39%), positive predictive value (30%), and proportion of patients flagged (18%) were consistent with the values derived from the retrospective data, supporting the reproducibility and predictive stability of the chosen risk prediction model (Table 1). The C statistic of the model was also consistent between the retrospective and prospective datasets (0.62 and 0.61, respectively).
Readmission Rates
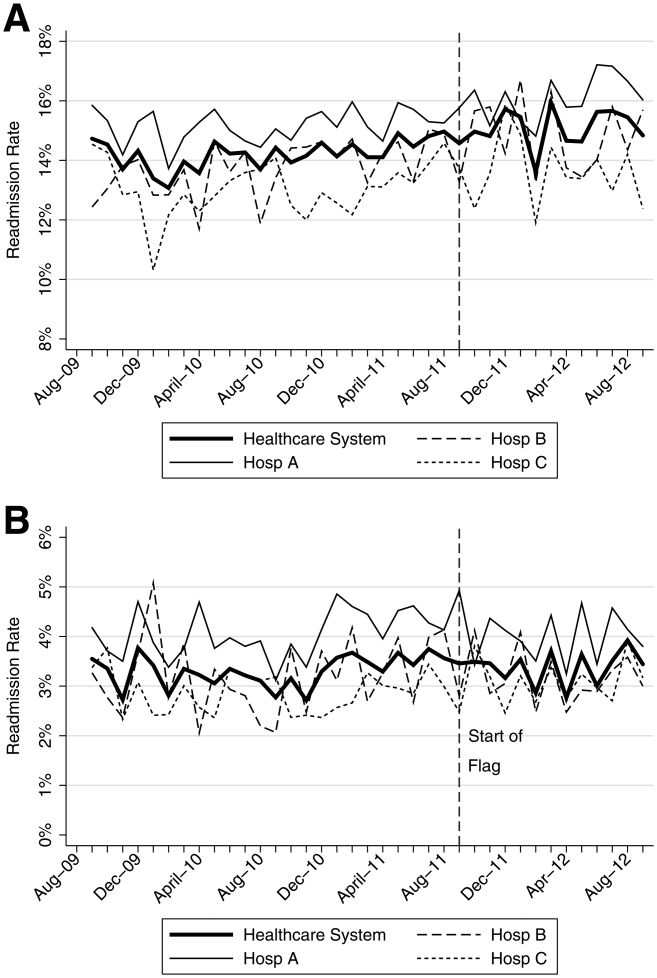
The mean 30‐day all‐cause readmission rate for the 24‐month period prior to the intervention was 14.4%, whereas the mean for the 12‐month period after the implementation was 15.1%. Thirty‐day all‐cause and 7‐day unplanned monthly readmission rates do not appear to have been impacted by the intervention (Figure 2). There was no evidence for either an immediate or sustained effect (Table 2).
| Hospital | Preimplementation Period | Immediate Effect | Postimplementation Period | P Value Change in Trenda | |||||
|---|---|---|---|---|---|---|---|---|---|
| Monthly % Change in Readmission Rates | P Value | Immediate % Change | P Value | Monthly % Change in Readmission Rates | P Value | ||||
| |||||||||
| 30‐Day All‐Cause Readmission Rates | |||||||||
| Hosp A | 0.023 | Stable | 0.153 | 0.480 | 0.991 | 0.100 | Increasing | 0.044 | 0.134 |
| Hosp B | 0.061 | Increasing | 0.002 | 0.492 | 0.125 | 0.060 | Stable | 0.296 | 0.048 |
| Hosp C | 0.026 | Stable | 0.413 | 0.447 | 0.585 | 0.046 | Stable | 0.629 | 0.476 |
| Health System | 0.032 | Increasing | 0.014 | 0.344 | 0.302 | 0.026 | Stable | 0.499 | 0.881 |
| 7‐Day Unplanned Readmission Rates | |||||||||
| Hosp A | 0.004 | Stable | 0.642 | 0.271 | 0.417 | 0.005 | Stable | 0.891 | 0.967 |
| Hosp B | 0.012 | Stable | 0.201 | 0.298 | 0.489 | 0.038 | Stable | 0.429 | 0.602 |
| Hosp C | 0.008 | Stable | 0.213 | 0.353 | 0.204 | 0.004 | Stable | 0.895 | 0.899 |
| Health System | 0.005 | Stable | 0.358 | 0.003 | 0.990 | 0.010 | Stable | 0.712 | 0.583 |
DISCUSSION
In this proof‐of‐concept study, we demonstrated the feasibility of an automated readmission risk prediction model integrated into a health system's EHR for a mixed population of hospitalized medical and surgical patients. To our knowledge, this is the first study in a general population of hospitalized patients to examine the impact of providing readmission risk assessment on readmission rates. We used a simple prediction model potentially generalizable to EHRs and healthcare populations beyond our own.
Existing risk prediction models for hospital readmission have important limitations and are difficult to implement in clinical practice.[22] Prediction models for hospital readmission are often dependent on retrospective claims data, developed for specific patient populations, and not designed for use early in the course of hospitalization when transitional care interventions can be initiated.[22] In addition, the time required to gather the necessary data and calculate the risk score remains a barrier to the adoption of prediction models in practice. By automating the process of readmission risk prediction, we were able to help integrate risk assessment into the healthcare process across many providers in a large multihospital healthcare organization. This has allowed us to consistently share risk assessment in real time with all members of the inpatient team, facilitating a team‐based approach to discharge planning.[23]
Two prior studies have developed readmission risk prediction models designed to be implemented into the EHR. Amarasingham et al.[24] developed and implemented[25] a heart failure‐specific prediction model based on the 18‐item Tabak mortality score.[26] Bradley et al.[27] studied in a broader population of medicine and surgery patients the predictive ability of a 26‐item score that utilized vital sign, cardiac rhythm, and nursing assessment data. Although EHRs are developing rapidly, currently the majority of EHRs do not support the use of many of the variables used in these models. In addition, both models were complex, raising concerns about generalizability to other healthcare settings and populations.
A distinctive characteristic of our model is its simplicity. We were cognizant of the realities of running a prediction model in a high‐volume production environment and the diminishing returns of adding more variables. We thus favored simplicity at all stages of model development, with the associated belief that complexity could be added with future iterations once feasibility had been established. Finally, we were aware that we were constructing a medical decision support tool rather than a simple classifier.[26] As such, the optimal model was not purely driven by discriminative ability, but also by our subjective assessment of the optimal trade‐off between sensitivity and specificity (the test‐treatment threshold) for such a model.[26] To facilitate model assessment, we thus categorized the potential predictor variables and evaluated the test characteristics of each combination of categorized variables. Although the C statistic of a model using continuous variables will be higher than a model using categorical values, model performance at the chosen trade‐off point is unlikely to be different.
Although the overall predictive ability of our model was fair, we found that it was associated with clinically meaningful differences in readmission rates between those triggering and not triggering the flag. The 30‐day all‐cause readmission rate in the 12‐month prospective sample was 15.1%, yet among those flagged as being at high risk for readmission the readmission rate was 30.4%. Given resource constraints and the need to selectively apply potentially costly care transition interventions, this may in practice translate into a meaningful discriminative ability.
Readmission rates did not change significantly during the study period. A number of plausible reasons for this exist, including: (1) the current model may not exhibit sufficient predictive ability to classify those at high risk or impact the behavior of providers appropriately, (2) those patients classified as high risk of readmission may not be at high risk of readmissions that are preventable, (3) information provided by the model may not yet routinely be used such that it can affect care, or (4) providing readmission risk assessment alone is not sufficient to influence readmission rates, and the other interventions or organizational changes necessary to impact care of those defined as high risk have not yet been implemented or are not yet being performed routinely. If the primary reasons for our results are those outlined in numbers 3 or 4, then readmission rates should improve over time as the risk flag becomes more routinely used, and those interventions necessary to impact readmission rates of those defined as high risk are implemented and performed.
Limitations
There are several limitations of this intervention. First, the prediction model was developed using 30‐day all‐cause readmissions, rather than attempting to identify potentially preventable readmissions. Thirty‐day readmission rates may not be a good proxy for preventable readmissions,[18] and as a consequence, the ability to predict 30‐day readmissions may not ensure that a prediction model is able to predict preventable readmissions. Nonetheless, 30‐day readmission rates remain the most commonly used quality metric.
Second, the impact of the risk flag on provider behavior is uncertain. We did not formally assess how the readmission risk flag was used by healthcare team members. Informal assessment has, however, revealed that the readmission risk flag is gradually being adopted by different members of the care team including unit‐based pharmacists who are using the flag to prioritize the delivery of medication education, social workers who are using the flag to prompt providers to consider higher level services for patients at high risk of readmission, and patient navigators who are using the flag to prioritize follow‐up phone calls. As a result, we hope that the flag will ultimately improve the processes of care for high‐risk patients.
Third, we did not capture readmissions to hospitals outside of our healthcare system and have therefore underestimated the readmission rate in our population. However, our assessment of the effect of the risk flag on readmissions focused on relative readmission rates over time, and the use of the interrupted time series methodology should protect against secular changes in outside hospital readmission rates that were not associated with the intervention.
Fourth, it is possible that the prediction model implemented could be significantly improved by including additional variables or data available during the hospital stay. However, simple classification models using a single variable have repeatedly been shown to have the ability to compete favorably with state‐of‐the‐art multivariable classification models.[28]
Fifth, our study was limited to a single academic health system, and our experience may not be generalizable to smaller healthcare systems with limited EHR systems. However, the simplicity of our prediction model and the integration into a commercial EHR may improve the generalizability of our experience to other healthcare settings. Additionally, partly due to recent policy initiatives, the adoption of integrated EHR systems by hospitals is expected to continue at a rapid rate and become the standard of care within the near future.[29]
CONCLUSION
An automated prediction model was effectively integrated into an existing EHR and was able to identify patients on admission who are at risk for readmission within 30 days of discharge. Future work will aim to further examine the impact of the flag on readmission rates, further refine the prediction model, and gather data on how providers and care teams use the information provided by the flag.
Disclosure
Dr. Umscheid‐s contribution to this project was supported in part by the National Center for Research Resources, Grant UL1RR024134, which is now at the National Center for Advancing Translational Sciences, Grant UL1TR000003. The content of this paper is solely the responsibility of the authors and does not necessarily represent the official views of the NIH.
- , , . Rehospitalizations among patients in the Medicare fee‐for‐service program. N Engl J Med. 2009;360(14):1418–1428.
- , . Hospital readmissions as a measure of quality of health care: advantages and limitations. Arch Intern Med. 2000;160(8):1074–1081.
- , , , , . Do older rural and urban veterans experience different rates of unplanned readmission to VA and non‐VA hospitals? J Rural Health. 2009;25(1):62–69.
- , , . Cost, causes and rates of rehospitalization of preterm infants. J Perinatol. 2007;27(10):614–619.
- , , , . Redefining readmission risk factors for general medicine patients. J Hosp Med. 2011;6(2):54–60.
- , , , et al. Incidence and main factors associated with early unplanned hospital readmission among French medical inpatients aged 75 and over admitted through emergency units. Age Ageing. 2008;37(4):416–422.
- , , , , . Proportion of hospital readmissions deemed avoidable: a systematic review. CMAJ. 2011;183(7):E391–E402.
- Hospital Quality Alliance. Available at: http://www.hospitalqualityalliance.org/hospitalqualityalliance/qualitymeasures/qualitymeasures.html. Accessed March 6, 2013.
- Institute for Healthcare Improvement. Available at: http://www.ihi.org/explore/Readmissions/Pages/default.aspx. Accessed March 6, 2013.
- Centers for Medicare and Medicaid Services. Available at: http://www.cms.gov/Medicare/Quality‐Initiatives‐Patient‐Assessment‐Instruments/HospitalQualityInits/OutcomeMeasures.html. Accessed March 6, 2013.
- , , , et al. Comprehensive discharge planning and home follow‐up of hospitalized elders: a randomized clinical trial. JAMA. 1999;281(7):613–620.
- , , , , , . Preparing patients and caregivers to participate in care delivered across settings: the Care Transitions Intervention. J Am Geriatr Soc. 2004;52(11):1817–1825.
- , , , , . The importance of transitional care in achieving health reform. Health Aff (Millwood). 2011;30(4):746–754.
- , , , , . Interventions to reduce 30‐day rehospitalization: a systematic review. Ann Intern Med. 2011;155(8):520–528.
- University of Pennsylvania Health System Center for Evidence‐based Practice. Available at: http://www.uphs.upenn.edu/cep/. Accessed March 6, 2013.
- , , . Hospital‐based comparative effectiveness centers: translating research into practice to improve the quality, safety and value of patient care. J Gen Intern Med. 2010;25(12):1352–1355.
- . Writing Arden Syntax Medical Logic Modules. Comput Biol Med. 1994;24(5):331–363.
- , . Thirty‐day readmissions—truth and consequences. N Engl J Med. 2012;366(15):1366–1369.
- . Information Retrieval. 2nd ed. Oxford, UK: Butterworth‐Heinemann; 1979.
- , , , . Segmented regression analysis of interrupted time series studies in medication use research. J Clin Pharm Ther. 2002;27(4):299–309.
- , . Application of least squares regression to relationships containing auto‐correlated error terms. J Am Stat Assoc. 1949; 44:32–61.
- , , , et al. Risk prediction models for hospital readmission: a systematic review. JAMA. 2011;306(15):1688–1698.
- , , , et al. Core Principles and values of effective team‐based health care. Available at: https://www.nationalahec.org/pdfs/VSRT‐Team‐Based‐Care‐Principles‐Values.pdf. Accessed March 19, 2013.
- , , , et al. An automated model to identify heart failure patients at risk for 30‐day readmission or death using electronic medical record data. Med Care. 2010;48(11):981–988.
- , , , et al. Allocating scarce resources in real‐time to reduce heart failure readmissions: a prospective, controlled study [published online ahead of print July 31, 2013]. BMJ Qual Saf. doi:10.1136/bmjqs‐2013‐001901.
- , . The threshold approach to clinical decision making. N Engl J Med. 1980;302(20):1109–1117.
- , , , , . Identifying patients at increased risk for unplanned readmission. Med Care. 2013;51(9):761–766.
- . Very simple classification rules perform well on most commonly used datasets. Mach Learn. 1993;11(1):63–91.
- . Stimulating the adoption of health information technology. N Engl J Med. 2009;360(15):1477–1479.
Unplanned hospital readmissions are common, costly, and potentially avoidable. Approximately 20% of Medicare patients are readmitted within 30 days of discharge.[1] Readmission rates are estimated to be similarly high in other population subgroups,[2, 3, 4] with approximately 80% of patients[1, 5, 6] readmitted to the original discharging hospital. A recent systematic review suggested that 27% of readmissions may be preventable.[7]
Hospital readmissions have increasingly been viewed as a correctable marker of poor quality care and have been adopted by a number of organizations as quality indicators.[8, 9, 10] As a result, hospitals have important internal and external motivations to address readmissions. Identification of patients at high risk for readmissions may be an important first step toward preventing them. In particular, readmission risk assessment could be used to help providers target the delivery of resource‐intensive transitional care interventions[11, 12, 13, 14] to patients with the greatest needs. Such an approach is appealing because it allows hospitals to focus scarce resources where the impact may be greatest and provides a starting point for organizations struggling to develop robust models of transitional care delivery.
Electronic health records (EHRs) may prove to be an important component of strategies designed to risk stratify patients at the point of care. Algorithms integrated into the EHR that automatically generate risk predictions have the potential to (1) improve provider time efficiency by automating the prediction process, (2) improve consistency of data collection and risk score calculation, (3) increase adoption through improved usability, and (4) provide clinically important information in real‐time to all healthcare team members caring for a hospitalized patient.
We thus sought to derive a predictive model for 30‐day readmissions using data reliably present in our EHR at the time of admission, and integrate this predictive model into our hospital's EHR to create an automated prediction tool that identifies on admission patients at high risk for readmission within 30 days of discharge. In addition, we prospectively validated this model using the 12‐month period after implementation and examined the impact on readmissions.
METHODS
Setting
The University of Pennsylvania Health System (UPHS) includes 3 hospitals, with a combined capacity of over 1500 beds and 70,000 annual admissions. All hospitals currently utilize Sunrise Clinical Manager version 5.5 (Allscripts, Chicago, IL) as their EHR. The study sample included all adult admissions to any of the 3 UPHS hospitals during the study period. Admissions to short procedure, rehabilitation, and hospice units were excluded. The study received expedited approval and a HIPAA waiver from the University of Pennsylvania institutional review board.
Development of Predictive Model
The UPHS Center for Evidence‐based Practice[15, 16] performed a systematic review to identify factors associated with hospital readmission within 30 days of discharge. We then examined the data available from our hospital EHR at the time of admission for those factors identified in the review. Using different threshold values and look‐back periods, we developed and tested 30 candidate prediction models using these variables alone and in combination (Table 1). Prediction models were evaluated using 24 months of historical data between August 1, 2009 and August 1, 2011.
Implementation
An automated readmission risk flag was then integrated into the EHR. Patients classified as being at high risk for readmission with the automated prediction model were flagged in the EHR on admission (Figure 1A). The flag can be double‐clicked to display a separate screen with information relevant to discharge planning including inpatient and emergency department (ED) visits in the prior 12 months, as well as information about the primary team, length of stay, and admitting problem associated with those admissions (Figure 1B). The prediction model was integrated into our EHR using Arden Syntax for Medical Logic Modules.[17] The readmission risk screen involved presenting the provider with a new screen and was thus developed in Microsoft .NET using C# and Windows Forms (Microsoft Corp., Redmond, WA).
The flag was visible on the patient lists of all providers who utilized the EHR. This included but was not limited to nurses, social workers, unit pharmacists, and physicians. At the time of implementation, educational events regarding the readmission risk flag were provided in forums targeting administrators, pharmacists, social workers, and housestaff. Information about the flag and recommendations for use were distributed through emails and broadcast screensaver messages disseminated throughout the inpatient units of the health system. Providers were asked to pay special attention to discharge planning for patients triggering the readmission risk flag, including medication reconciliation by pharmacists for these patients prior to discharge, and arrangement of available home services by social workers.
The risk flag was 1 of 4 classes of interventions developed and endorsed by the health system in its efforts to reduce readmissions. Besides risk stratification, the other classes were: interdisciplinary rounding, patient education, and discharge communication. None of the interventions alone were expected to decrease readmissions, but as all 4 classes of interventions were implemented and performed routinely, the expectation was that they would work in concert to reduce readmissions.
Analysis
The primary outcome was all‐cause hospital readmissions in the healthcare system within 30 days of discharge. Although this outcome is commonly used both in the literature and as a quality metric, significant debate persists as to the appropriateness of this metric.[18] Many of the factors driving 30‐day readmissions may be dependent on factors outside of the discharging hospital's control and it has been argued that nearer‐term, nonelective readmission rates may provide a more meaningful quality metric.[18] Seven‐day unplanned readmissions were thus used as a secondary outcome measure for this study.
Sensitivity, specificity, predictive value, C statistic, F score (the harmonic mean of positive predictive value and sensitivity),[19] and screen‐positive rate were calculated for each of the 30 prediction models evaluated using the historical data. The prediction model with the best balance of F score and screen‐positive rate was selected as the prediction model to be integrated into the EHR. Prospective validation of the selected prediction model was performed using the 12‐month period following implementation of the risk flag (September 2011September 2012).
To assess the impact of the automated prediction model on monthly readmission rate, we used the 24‐month period immediately before and the 12‐month period immediately after implementation of the readmission risk flag. Segmented regression analysis was performed testing for changes in level and slope of readmission rates between preimplementation and postimplementation time periods. This quasiexperimental interrupted time series methodology[20] allows us to control for secular trends in readmission rates and to assess the preimplementation trend (secular trend), the difference in rates immediately before and after the implementation (immediate effect), and the postimplementation change over time (sustained effect). We used Cochrane‐Orcutt estimation[21] to correct for serial autocorrelation.
All analyses were performed using Stata 12.1 software (Stata Corp, College Station, TX).
RESULTS
Predictors of Readmission
Our systematic review of the literature identified several patient and healthcare utilization patterns predictive of 30‐day readmission risk. Utilization factors included length of stay, number of prior admissions, previous 30‐day readmissions, and previous ED visits. Patient characteristics included number of comorbidities, living alone, and payor. Evidence was inconsistent regarding threshold values for these variables.
Many variables readily available in our EHR were either found by the systematic review not to be reliably predictive of 30‐day readmission (including age and gender) or were not readily or reliably available on admission (including length of stay and payor). At the time of implementation, our EHR did not include vital sign or nursing assessment variables, so these were not considered for inclusion in our model.
Of the available variables, 3 were consistently accurate and available in the EHR at the time of patient admission: prior hospital admission, emergency department visit, and 30‐day readmission within UPHS. We then developed 30 candidate prediction models using a combination of these variables, including 1 and 2 prior admissions, ED visits, and 30‐day readmissions in the 6 and 12 months preceding the index visit (Table 1).
Development and Validation
We used 24 months of retrospective data, which included 120,396 discharges with 17,337 thirty‐day readmissions (14.4% 30‐day all‐cause readmission rate) to test the candidate prediction models. A single risk factor, 2 inpatient admissions in the past 12 months, was found to have the best balance of sensitivity (40%), positive predictive value (31%), and proportion of patients flagged (18%) (Table 1).
| Sensitivity | Specificity | C Statistic | PPV | NPV | Screen Positive | F Score | |
|---|---|---|---|---|---|---|---|
| |||||||
| Retrospective Evaluation of Prediction Rules Lookback period: 6 months | |||||||
| Prior Admissions | |||||||
| 1 | 53% | 74% | 0.640 | 26% | 91% | 30% | 0.350 |
| 2 | 32% | 90% | 0.610 | 35% | 89% | 13% | 0.333 |
| 3 | 20% | 96% | 0.578 | 44% | 88% | 7% | 0.274 |
| Prior ED Visits | |||||||
| 1 | 31% | 81% | 0.558 | 21% | 87% | 21% | 0.252 |
| 2 | 13% | 93% | 0.532 | 25% | 87% | 8% | 0.172 |
| 3 | 7% | 97% | 0.519 | 27% | 86% | 4% | 0.111 |
| Prior 30‐day Readmissions | |||||||
| 1 | 39% | 85% | 0.623 | 31% | 89% | 18% | 0.347 |
| 2 | 21% | 95% | 0.582 | 43% | 88% | 7% | 0.284 |
| 3 | 13% | 98% | 0.555 | 53% | 87% | 4% | 0.208 |
| Combined Rules | |||||||
| Admit1 & ED1 | 22% | 92% | 0.568 | 31% | 88% | 10% | 0.255 |
| Admit2 & ED1 | 15% | 96% | 0.556 | 40% | 87% | 5% | 0.217 |
| Admit1 & 30‐day1 | 39% | 85% | 0.623 | 31% | 89% | 18% | 0.346 |
| Admit2 & 30‐day1 | 29% | 92% | 0.603 | 37% | 89% | 11% | 0.324 |
| 30‐day1 & ED1 | 17% | 95% | 0.559 | 37% | 87% | 6% | 0.229 |
| 30‐day1 & ED2 | 8% | 98% | 0.527 | 40% | 86% | 3% | 0.132 |
| Lookback period: 12 months | |||||||
| Prior Admission | |||||||
| 1 | 60% | 68% | 0.593 | 24% | 91% | 36% | 0.340 |
| 2a | 40% | 85% | 0.624 | 31% | 89% | 18% | 0.354 |
| 3 | 28% | 92% | 0.600 | 37% | 88% | 11% | 0.318 |
| Prior ED Visit | |||||||
| 1 | 38% | 74% | 0.560 | 20% | 88% | 28% | 0.260 |
| 2 | 20% | 88% | 0.544 | 23% | 87% | 13% | 0.215 |
| 3 | 8% | 96% | 0.523 | 27% | 86% | 4% | 0.126 |
| Prior 30‐day Readmission | |||||||
| 1 | 43% | 84% | 0.630 | 30% | 90% | 20% | 0.353 |
| 2 | 24% | 94% | 0.592 | 41% | 88% | 9% | 0.305 |
| 3 | 11% | 98% | 0.548 | 54% | 87% | 3% | 0.186 |
| Combined Rules | |||||||
| Admit1 & ED1 | 29% | 87% | 0.580 | 27% | 88% | 15% | 0.281 |
| Admit2 & ED1 | 22% | 93% | 0.574 | 34% | 88% | 9% | 0.266 |
| Admit1 & 30‐day1 | 42% | 84% | 0.630 | 30% | 90% | 14% | 0.353 |
| Admit2 & 30‐day1 | 34% | 89% | 0.615 | 34% | 89% | 14% | 0.341 |
| 30‐day1 & ED1 | 21% | 93% | 0.569 | 35% | 88% | 9% | 0.261 |
| 30‐day1 & ED2 | 13% | 96% | 0.545 | 37% | 87% | 5% | 0.187 |
| Prospective Evaluation of Prediction Rule | |||||||
| 30‐Day All‐Cause | 39% | 84% | 0.614 | 30% | 89% | 18% | 0.339 |
Prospective validation of the prediction model was performed using the 12‐month period directly following readmission risk flag implementation. During this period, the 30‐day all‐cause readmission rate was 15.1%. Sensitivity (39%), positive predictive value (30%), and proportion of patients flagged (18%) were consistent with the values derived from the retrospective data, supporting the reproducibility and predictive stability of the chosen risk prediction model (Table 1). The C statistic of the model was also consistent between the retrospective and prospective datasets (0.62 and 0.61, respectively).
Readmission Rates
The mean 30‐day all‐cause readmission rate for the 24‐month period prior to the intervention was 14.4%, whereas the mean for the 12‐month period after the implementation was 15.1%. Thirty‐day all‐cause and 7‐day unplanned monthly readmission rates do not appear to have been impacted by the intervention (Figure 2). There was no evidence for either an immediate or sustained effect (Table 2).
| Hospital | Preimplementation Period | Immediate Effect | Postimplementation Period | P Value Change in Trenda | |||||
|---|---|---|---|---|---|---|---|---|---|
| Monthly % Change in Readmission Rates | P Value | Immediate % Change | P Value | Monthly % Change in Readmission Rates | P Value | ||||
| |||||||||
| 30‐Day All‐Cause Readmission Rates | |||||||||
| Hosp A | 0.023 | Stable | 0.153 | 0.480 | 0.991 | 0.100 | Increasing | 0.044 | 0.134 |
| Hosp B | 0.061 | Increasing | 0.002 | 0.492 | 0.125 | 0.060 | Stable | 0.296 | 0.048 |
| Hosp C | 0.026 | Stable | 0.413 | 0.447 | 0.585 | 0.046 | Stable | 0.629 | 0.476 |
| Health System | 0.032 | Increasing | 0.014 | 0.344 | 0.302 | 0.026 | Stable | 0.499 | 0.881 |
| 7‐Day Unplanned Readmission Rates | |||||||||
| Hosp A | 0.004 | Stable | 0.642 | 0.271 | 0.417 | 0.005 | Stable | 0.891 | 0.967 |
| Hosp B | 0.012 | Stable | 0.201 | 0.298 | 0.489 | 0.038 | Stable | 0.429 | 0.602 |
| Hosp C | 0.008 | Stable | 0.213 | 0.353 | 0.204 | 0.004 | Stable | 0.895 | 0.899 |
| Health System | 0.005 | Stable | 0.358 | 0.003 | 0.990 | 0.010 | Stable | 0.712 | 0.583 |
DISCUSSION
In this proof‐of‐concept study, we demonstrated the feasibility of an automated readmission risk prediction model integrated into a health system's EHR for a mixed population of hospitalized medical and surgical patients. To our knowledge, this is the first study in a general population of hospitalized patients to examine the impact of providing readmission risk assessment on readmission rates. We used a simple prediction model potentially generalizable to EHRs and healthcare populations beyond our own.
Existing risk prediction models for hospital readmission have important limitations and are difficult to implement in clinical practice.[22] Prediction models for hospital readmission are often dependent on retrospective claims data, developed for specific patient populations, and not designed for use early in the course of hospitalization when transitional care interventions can be initiated.[22] In addition, the time required to gather the necessary data and calculate the risk score remains a barrier to the adoption of prediction models in practice. By automating the process of readmission risk prediction, we were able to help integrate risk assessment into the healthcare process across many providers in a large multihospital healthcare organization. This has allowed us to consistently share risk assessment in real time with all members of the inpatient team, facilitating a team‐based approach to discharge planning.[23]
Two prior studies have developed readmission risk prediction models designed to be implemented into the EHR. Amarasingham et al.[24] developed and implemented[25] a heart failure‐specific prediction model based on the 18‐item Tabak mortality score.[26] Bradley et al.[27] studied in a broader population of medicine and surgery patients the predictive ability of a 26‐item score that utilized vital sign, cardiac rhythm, and nursing assessment data. Although EHRs are developing rapidly, currently the majority of EHRs do not support the use of many of the variables used in these models. In addition, both models were complex, raising concerns about generalizability to other healthcare settings and populations.
A distinctive characteristic of our model is its simplicity. We were cognizant of the realities of running a prediction model in a high‐volume production environment and the diminishing returns of adding more variables. We thus favored simplicity at all stages of model development, with the associated belief that complexity could be added with future iterations once feasibility had been established. Finally, we were aware that we were constructing a medical decision support tool rather than a simple classifier.[26] As such, the optimal model was not purely driven by discriminative ability, but also by our subjective assessment of the optimal trade‐off between sensitivity and specificity (the test‐treatment threshold) for such a model.[26] To facilitate model assessment, we thus categorized the potential predictor variables and evaluated the test characteristics of each combination of categorized variables. Although the C statistic of a model using continuous variables will be higher than a model using categorical values, model performance at the chosen trade‐off point is unlikely to be different.
Although the overall predictive ability of our model was fair, we found that it was associated with clinically meaningful differences in readmission rates between those triggering and not triggering the flag. The 30‐day all‐cause readmission rate in the 12‐month prospective sample was 15.1%, yet among those flagged as being at high risk for readmission the readmission rate was 30.4%. Given resource constraints and the need to selectively apply potentially costly care transition interventions, this may in practice translate into a meaningful discriminative ability.
Readmission rates did not change significantly during the study period. A number of plausible reasons for this exist, including: (1) the current model may not exhibit sufficient predictive ability to classify those at high risk or impact the behavior of providers appropriately, (2) those patients classified as high risk of readmission may not be at high risk of readmissions that are preventable, (3) information provided by the model may not yet routinely be used such that it can affect care, or (4) providing readmission risk assessment alone is not sufficient to influence readmission rates, and the other interventions or organizational changes necessary to impact care of those defined as high risk have not yet been implemented or are not yet being performed routinely. If the primary reasons for our results are those outlined in numbers 3 or 4, then readmission rates should improve over time as the risk flag becomes more routinely used, and those interventions necessary to impact readmission rates of those defined as high risk are implemented and performed.
Limitations
There are several limitations of this intervention. First, the prediction model was developed using 30‐day all‐cause readmissions, rather than attempting to identify potentially preventable readmissions. Thirty‐day readmission rates may not be a good proxy for preventable readmissions,[18] and as a consequence, the ability to predict 30‐day readmissions may not ensure that a prediction model is able to predict preventable readmissions. Nonetheless, 30‐day readmission rates remain the most commonly used quality metric.
Second, the impact of the risk flag on provider behavior is uncertain. We did not formally assess how the readmission risk flag was used by healthcare team members. Informal assessment has, however, revealed that the readmission risk flag is gradually being adopted by different members of the care team including unit‐based pharmacists who are using the flag to prioritize the delivery of medication education, social workers who are using the flag to prompt providers to consider higher level services for patients at high risk of readmission, and patient navigators who are using the flag to prioritize follow‐up phone calls. As a result, we hope that the flag will ultimately improve the processes of care for high‐risk patients.
Third, we did not capture readmissions to hospitals outside of our healthcare system and have therefore underestimated the readmission rate in our population. However, our assessment of the effect of the risk flag on readmissions focused on relative readmission rates over time, and the use of the interrupted time series methodology should protect against secular changes in outside hospital readmission rates that were not associated with the intervention.
Fourth, it is possible that the prediction model implemented could be significantly improved by including additional variables or data available during the hospital stay. However, simple classification models using a single variable have repeatedly been shown to have the ability to compete favorably with state‐of‐the‐art multivariable classification models.[28]
Fifth, our study was limited to a single academic health system, and our experience may not be generalizable to smaller healthcare systems with limited EHR systems. However, the simplicity of our prediction model and the integration into a commercial EHR may improve the generalizability of our experience to other healthcare settings. Additionally, partly due to recent policy initiatives, the adoption of integrated EHR systems by hospitals is expected to continue at a rapid rate and become the standard of care within the near future.[29]
CONCLUSION
An automated prediction model was effectively integrated into an existing EHR and was able to identify patients on admission who are at risk for readmission within 30 days of discharge. Future work will aim to further examine the impact of the flag on readmission rates, further refine the prediction model, and gather data on how providers and care teams use the information provided by the flag.
Disclosure
Dr. Umscheid‐s contribution to this project was supported in part by the National Center for Research Resources, Grant UL1RR024134, which is now at the National Center for Advancing Translational Sciences, Grant UL1TR000003. The content of this paper is solely the responsibility of the authors and does not necessarily represent the official views of the NIH.
- , , . Rehospitalizations among patients in the Medicare fee‐for‐service program. N Engl J Med. 2009;360(14):1418–1428.
- , . Hospital readmissions as a measure of quality of health care: advantages and limitations. Arch Intern Med. 2000;160(8):1074–1081.
- , , , , . Do older rural and urban veterans experience different rates of unplanned readmission to VA and non‐VA hospitals? J Rural Health. 2009;25(1):62–69.
- , , . Cost, causes and rates of rehospitalization of preterm infants. J Perinatol. 2007;27(10):614–619.
- , , , . Redefining readmission risk factors for general medicine patients. J Hosp Med. 2011;6(2):54–60.
- , , , et al. Incidence and main factors associated with early unplanned hospital readmission among French medical inpatients aged 75 and over admitted through emergency units. Age Ageing. 2008;37(4):416–422.
- , , , , . Proportion of hospital readmissions deemed avoidable: a systematic review. CMAJ. 2011;183(7):E391–E402.
- Hospital Quality Alliance. Available at: http://www.hospitalqualityalliance.org/hospitalqualityalliance/qualitymeasures/qualitymeasures.html. Accessed March 6, 2013.
- Institute for Healthcare Improvement. Available at: http://www.ihi.org/explore/Readmissions/Pages/default.aspx. Accessed March 6, 2013.
- Centers for Medicare and Medicaid Services. Available at: http://www.cms.gov/Medicare/Quality‐Initiatives‐Patient‐Assessment‐Instruments/HospitalQualityInits/OutcomeMeasures.html. Accessed March 6, 2013.
- , , , et al. Comprehensive discharge planning and home follow‐up of hospitalized elders: a randomized clinical trial. JAMA. 1999;281(7):613–620.
- , , , , , . Preparing patients and caregivers to participate in care delivered across settings: the Care Transitions Intervention. J Am Geriatr Soc. 2004;52(11):1817–1825.
- , , , , . The importance of transitional care in achieving health reform. Health Aff (Millwood). 2011;30(4):746–754.
- , , , , . Interventions to reduce 30‐day rehospitalization: a systematic review. Ann Intern Med. 2011;155(8):520–528.
- University of Pennsylvania Health System Center for Evidence‐based Practice. Available at: http://www.uphs.upenn.edu/cep/. Accessed March 6, 2013.
- , , . Hospital‐based comparative effectiveness centers: translating research into practice to improve the quality, safety and value of patient care. J Gen Intern Med. 2010;25(12):1352–1355.
- . Writing Arden Syntax Medical Logic Modules. Comput Biol Med. 1994;24(5):331–363.
- , . Thirty‐day readmissions—truth and consequences. N Engl J Med. 2012;366(15):1366–1369.
- . Information Retrieval. 2nd ed. Oxford, UK: Butterworth‐Heinemann; 1979.
- , , , . Segmented regression analysis of interrupted time series studies in medication use research. J Clin Pharm Ther. 2002;27(4):299–309.
- , . Application of least squares regression to relationships containing auto‐correlated error terms. J Am Stat Assoc. 1949; 44:32–61.
- , , , et al. Risk prediction models for hospital readmission: a systematic review. JAMA. 2011;306(15):1688–1698.
- , , , et al. Core Principles and values of effective team‐based health care. Available at: https://www.nationalahec.org/pdfs/VSRT‐Team‐Based‐Care‐Principles‐Values.pdf. Accessed March 19, 2013.
- , , , et al. An automated model to identify heart failure patients at risk for 30‐day readmission or death using electronic medical record data. Med Care. 2010;48(11):981–988.
- , , , et al. Allocating scarce resources in real‐time to reduce heart failure readmissions: a prospective, controlled study [published online ahead of print July 31, 2013]. BMJ Qual Saf. doi:10.1136/bmjqs‐2013‐001901.
- , . The threshold approach to clinical decision making. N Engl J Med. 1980;302(20):1109–1117.
- , , , , . Identifying patients at increased risk for unplanned readmission. Med Care. 2013;51(9):761–766.
- . Very simple classification rules perform well on most commonly used datasets. Mach Learn. 1993;11(1):63–91.
- . Stimulating the adoption of health information technology. N Engl J Med. 2009;360(15):1477–1479.
© 2013 Society of Hospital Medicine
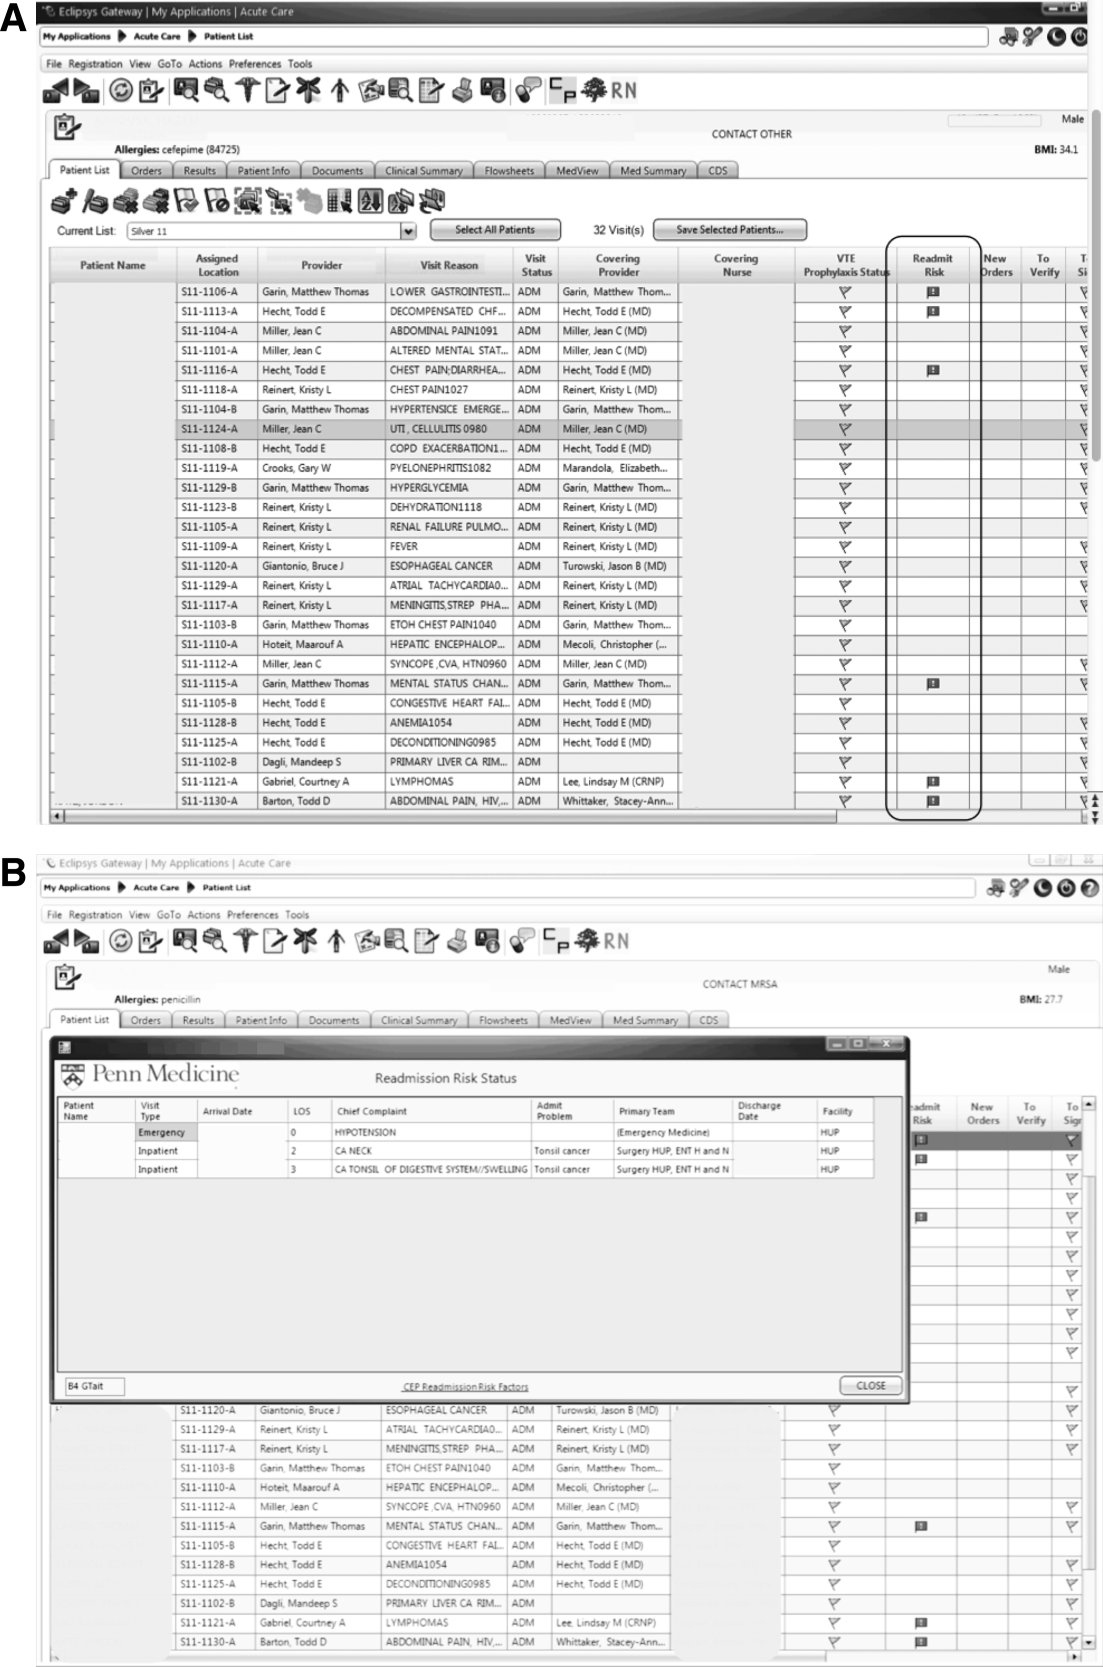
In the Literature: Research You Need to Know
Clinical question: Does the use of steroids and/or antivirals improve recovery in patients with newly diagnosed Bell's palsy?
Background: The American Academy of Neurology's last recommendation in 2001 stated that steroids were probably effective and antivirals possibly effective. The current review and recommendations looked at additional studies published since 2000.
Study design: Systematic review of MEDLINE and Cochrane Database of Systematic Reviews data published since June 2000.
Setting: Prospective controlled studies from Germany, Sweden, Scotland, Italy, South Korea, Japan, and Bangladesh.
Synopsis: The authors identified nine studies that fulfilled inclusion criteria. Two of these studies examined treatment with steroids alone and were judged to have the lowest risk for bias. Both studies enrolled patients within three days of symptom onset, continued treatment for 10 days, and demonstrated a significant increase in the probability of complete recovery in patients randomized to steroids (NNT 6-8). Two high-quality studies were identified that looked at the addition of antivirals to steroids. Neither study showed a statistically significant benefit.
Of note, the studies did not quantify the risk of harm from steroid use in patients with comorbidities, such as diabetes. Thus, the authors concluded that in some patients, it would be reasonable to consider limiting steroid use.
Bottom line: For patients with new-onset Bell’s palsy, steroids increase the probability of recovery of facial nerve function. Patients offered antivirals should be counseled that a benefit from antivirals has not been established and, if there is a benefit, it is modest at best.
Citation: Gronseth GS, Paduga R. Evidence-based guideline update: steroids and antivirals for Bell palsy: report of the Guideline Development Subcommittee of the American Academy of Neurology. Neurology. 2012;79(22):2209-2213.
Visit our website for more physician reviews of recent HM-relevant literature.
ITL: Physician Reviews of HM-Relevant Research
In This Edition
Literature At A Glance
A guide to this month’s studies
- Guidelines on steroids and antivirals to treat Bell’s palsy
- Probiotics to reduce Clostridium difficile-associated diarrhea
- Rates of hemorrhage from warfarin therapy higher in clinical practice
- Less experienced doctors incur higher treatment costs
- Pay-for-performance incentive reduces mortality in England
- No benefit in ultrafiltration to treat acute heart failure
- Hospitalized patients often receive too much acetaminophen
- Longer anticoagulation therapy beneficial after bioprosthetic aortic valve replacement
- Antimicrobial-coated catheters and risk of urinary tract infection
- Patient outcomes improve after in-hospital cardiac arrest
Updated Guidelines on Steroids and Antivirals in Bell’s Palsy
Clinical question: Does the use of steroids and/or antivirals improve recovery in patients with newly diagnosed Bell’s palsy?
Background: The American Academy of Neurology’s last recommendation in 2001 stated that steroids were probably effective and antivirals possibly effective. The current review and recommendations looked at additional studies published since 2000.
Study design: Systematic review of MEDLINE and Cochrane Database of Systematic Reviews data published since June 2000.
Setting: Prospective controlled studies from Germany, Sweden, Scotland, Italy, South Korea, Japan, and Bangladesh.
Synopsis: The authors identified nine studies that fulfilled inclusion criteria. Two of these studies examined treatment with steroids alone and were judged to have the lowest risk for bias. Both studies enrolled patients within three days of symptom onset, continued treatment for 10 days, and demonstrated a significant increase in the probability of complete recovery in patients randomized to steroids (NNT 6-8). Two high-quality studies were identified that looked at the addition of antivirals to steroids. Neither study showed a statistically significant benefit.
Of note, the studies did not quantify the risk of harm from steroid use in patients with comorbidities, such as diabetes. Thus, the authors concluded that in some patients, it would be reasonable to consider limiting steroid use.
Bottom line: For patients with new-onset Bell’s palsy, steroids increase the probability of recovery of facial nerve function. Patients offered antivirals should be counseled that a benefit from antivirals has not been established, and, if there is a benefit, it is modest at best.
Citation: Gronseth GS, Paduga R. Evidence-based guideline update: steroids and antivirals for Bell palsy: report of the Guideline Development Subcommittee of the American Academy of Neurology. Neurology. 2012;79(22):2209-2213.
Probiotic Prophylaxis Reduces Clostridium Difficile-Associated Diarrhea
Clinical question: Are probiotics a safe and efficacious therapy for the prevention of Clostridium difficile-associated diarrhea (CDAD)?
Background: CDAD is the most common cause of hospital-acquired infectious diarrhea in high-income countries. There has been a dramatic rise in the incidence and severity of CDAD since 2002. Previous studies suggested that probiotics might reduce the incidence of CDAD with few adverse events.
Study design: Systematic review and meta-analysis of the literature.
Setting: Randomized controlled trials from the U.S., Canada, Chile, China, United Kingdom, Turkey, Poland, and Sweden.
Synopsis: Investigators identified 20 trials including 3,818 participants using a systematic search of randomized controlled trials of a specified probiotic of any strain in adults or pediatric subjects treated with antibiotics. Probiotics reduced the incidence of CDAD by 66% (risk ratio 0.34, 95% CI 0.24 to 0.49). Subgroup analyses showed similar results in both adults and children, with lower and high doses, and with different probiotic species.
Of probiotic-treated patients, 9.3% experienced an adverse event compared with 12.6% of control patients (relative risk 0.82, 95% CI 0.65 to 1.05). There was no report of any serious adverse events attributable to probiotics.
One limitation is the considerable variability in the reported risk of CDAD in the control group (0% to 40%). The absolute benefit from probiotics will depend on the risk in patients who do not receive prophylaxis.
Bottom line: Moderate-quality evidence suggests that probiotic prophylaxis results in a large reduction in C. diff-associated diarrhea without an increase in clinically important adverse events.
Citation: Johnston BC, Ma SSY, Goldenberg JZ, et al. Probiotics for the prevention of Clostridium difficile-associated diarrhea: a systematic review and meta-analysis. Ann Intern Med. 2012;157(12):878-888.
Rates of Hemorrhage from Warfarin Therapy Higher in Clinical Practice
Clinical question: What is the incidence of hemorrhage in a large population-based cohort of patients with atrial fibrillation who have started warfarin therapy?
Background: There is strong evidence that supports the use of warfarin to reduce the risk of stroke and systemic embolism in patients with atrial fibrillation. There are currently no large studies offering real-world, population-based estimates of hemorrhage rates among patients taking warfarin.
Study design: Retrospective cohort study.
Setting: Ontario.
Synopsis: This population-based, cohort study included 125,195 residents of Ontario age ≥66 years with atrial fibrillation who started taking warfarin sometime from 1997 to 2008. Hemorrhage was defined as bleeding requiring an emergency department visit or hospital admission. The overall risk of hemorrhage was 3.8% per person-year, but it was 11.8% in the first 30 days of therapy. For subjects age >75 years, the overall risk was 4.6% compared with 2.9% for those between 66 and 75 years.
Most hospital admissions involved gastrointestinal hemorrhages (63%). Almost 1 in 5 people (18%) with hospital admissions for hemorrhages died in the hospital or within seven days of discharge.
Bottom line: Rates of hemorrhage for older patients on warfarin therapy are significantly higher in clinical practice than the rates reported in clinical trials. The difference is likely due to the strict inclusion criteria, younger average age, and close monitoring of patients in clinical trials.
Citation: Gomes T, Mamdani MM, Holbrook AM, Paterson JM, Hellings C, Juurlink DN. Rates of hemorrhage during warfarin therapy for atrial fibrillation. CMAJ. 2013; Jan 21 [Epub ahead of print].
Less Experienced Doctors Incur Higher Treatment Costs
Clinical question: Which physician characteristics are associated with higher cost profiles?
Background: While both public and private insurers increasingly use physician cost profiles to identify physicians whose practice patterns account for more healthcare spending than other physicians, the individual physician characteristics associated with cost-profile performance are unknown.
Study design: Retrospective cohort study.
Setting: Four commercial health plans in Massachusetts.
Synopsis: Data collected from the insurance claims records of 1.13 million patients aged 18-65 years who were enrolled in one of four commercial health plans in Massachusetts in 2004 and 2005 were matched with the public records of 12,116 doctors who were stratified into five groups according to years of experience (<10, 10-19, 20-29, 30-39, and ≥40 years).
A strong association was found between physician experience and cost profiles, with the most experienced doctors—40 or more years of experience—providing the least costly care. Costs increased with each successively less experienced group (by 2.5%, 6.5%, 10%, and 13.2% more, respectively, to treat the same condition). No association was found between cost profiles and other physician characteristics, such as having had malpractice claims or disciplinary actions, board certification status, and practice size.
Differences appear to be driven by high-cost outlier patients. While median costs were similar between physicians with different levels of experience, the costs of treating patients at the 95 percentile of cost were much higher among physicians with less experience.
Bottom line: Doctors in this study with the least experience incurred 13.2% greater costs than their most senior counterparts.
Citation: Mehrotra A, Reid RO, Adams JL, Friedberg MW, McGlynn EA, Hussey PS. Physicians with the least experience have higher cost profiles than do physicians with the most experience. Health Aff (Millwood). 2012;31(11):2453-2463.
Pay-For-Performance Incentive Reduces Mortality in England
Clinical question: Do pay-for-performance programs improve quality of care?
Background: Pay-for-performance programs are being widely adopted both internationally and in the U.S. There is, however, limited evidence that these programs improve patient outcomes, and most prior studies have shown modest or inconsistent improvements in quality of care.
Study design: Prospective cohort study.
Setting: National Health Service (NHS) hospitals in northwest England.
Synopsis: The Advanced Quality program, the first hospital-based pay-for-performance program in England, was introduced in October 2004 in all 24 NHS hospitals in northwest England that provide emergency care. The program used a “tournament” system in which only the top-performing hospitals received bonus payments. There was no penalty for poor performers.
The primary end-point was 30-day in-hospital mortality among patients admitted for pneumonia, heart failure, or acute myocardial infarction. Over the three-year period studied (18 months before and 18 months after introduction of the program), the risk-adjusted mortality for these three conditions decreased significantly with an absolute reduction of 1.3% (95% CI 0.4 to 2.1%; P=0.006). The largest change, for pneumonia, was significant (1.9%, 95% CI 0.9 to 3.0, P<0.001), with nonsignificant reductions for acute myocardial infarction (0.6%, 95% CI -0.4 to 1.7; P=0.23) and heart failure (0.6%, 95% CI -0.6 to 1.8; P=0.30).
Bottom line: The introduction of a pay-for-performance program for all National Health Service hospitals in one region of England was associated with a significant reduction in mortality.
Citation: Sutton M, Nikolova S, Boaden R, Lester H, McDonald R, Roland M. Reduced mortality with hospital pay for performance in England. N Engl J Med. 2012;367(19):1821-1828.
Ultrafiltration Shows No Benefit in Acute Heart Failure
Clinical question: Is ultrafiltration superior to pharmacotherapy in the treatment of patients with acute heart failure and cardiorenal syndrome?
Background: Venovenous ultrafiltration is an alternative to diuretic therapy in patients with acute decompensated heart failure and worsened renal function that could allow greater control of the rate of fluid removal and improve outcomes. Little is known about the efficacy and safety of ultrafiltration compared to standard pharmacological therapy.
Study design: Multicenter randomized controlled trial.
Setting: Fourteen clinical centers in the U.S. and Canada.
Synopsis: One hundred eighty-eight patients admitted to a hospital with acute decompensated heart failure and worsened renal function were randomized to stepped pharmacological therapy or ultrafiltration. Ultrafiltration was inferior to pharmacological therapy with respect to the pre-specified primary composite endpoint, the change in serum creatinine level, and body weight at 96 hours after enrollment (P=0.003). This difference was primarily due to an increase in the serum creatinine level in the ultrafiltration group (0.23 vs. -0.04 mg/dl; P=0.003). There was no significant difference in weight loss at 96 hours (loss of 5.5 kg vs. 5.7kg; P=0.58).
A higher percentage of patients in the ultrafiltration group had a serious adverse event over the 60-day follow-up period (72% vs. 57%, P=0.03). There was no significant difference in the composite rate of death or rehospitalization for heart failure in the ultrafiltration group compared to the pharmacologic-therapy group (38% vs. 35%; P=0.96).
Bottom line: Pharmacological therapy is superior to ultrafiltration in patients with acute decompensated heart failure and worsened renal function.
Citation: Bart BA, Goldsmith SR, Lee KL, et al. Ultrafiltration in decompensated heart failure with cardiorenal syndrome. N Engl J Med. 2012;367:2296-2304.
Hospitalized Patients Often Receive Too Much Acetaminophen
Clinical question: What are the prevalence and factors associated with supratherapeutic dosing of acetaminophen in hospitalized patients?
Background: Acetaminophen is a commonly used medication that at high doses can be associated with significant adverse events, including liver failure. Considerable efforts have been made in the outpatient setting to limit the risks associated with acetaminophen. Little research has examined acetaminophen exposure in the inpatient setting.
Study design: Retrospective cohort study.
Setting: Two academic tertiary-care hospitals in the U.S.
Synopsis: The authors reviewed the electronic medication administration record of all adult patients admitted to two academic hospitals from June 1, 2010, to Aug. 31, 2010. A total of 14,411 patients (60.7%) were prescribed acetaminophen, of whom 955 (6.6%) were prescribed more than the 4g per day (the maximum recommended daily dose) at least once. In addition, 22.3% of patients >65 and 17.6% of patients with chronic liver disease exceeded the recommended limit of 3g per day. Half the supratherapeutic episodes involved doses exceeding 5g a day, often for several days. In adjusted analyses, scheduled administration (rather than as needed), a diagnosis of osteoarthritis, and higher-strength tablets were all associated with a higher risk of exposure to supratherapeutic doses.
Bottom line: A significant proportion of hospitalized patients are exposed to supratherapeutic dosing of acetaminophen.
Citation: Zhou L, Maviglia SM, Mahoney LM, et al. Supra-therapeutic dosing of acetaminophen among hospitalized patients. Arch Intern Med. 2012;172(22):1721-1728.
Longer Anticoagulation Therapy after Bioprosthetic Aortic Valve Replacement Might Be Beneficial
Clinical question: How long should anticoagulation therapy with warfarin be continued after surgical bioprosthetic aortic valve replacement?
Background: Current guidelines recommend a three-month course of anticoagulation therapy after bioprosthetic aortic valve surgery. However, the appropriate duration of post-operative anticoagulation therapy has not been well established
Study design: Retrospective cohort study.
Setting: Denmark.
Synopsis: Using data from the Danish National Registries, 4,075 subjects without atrial fibrillation who underwent bioprosthetic aortic valve implantation from 1997 to 2009 were identified. The association between different durations of warfarin therapy after aortic valve implantation and the combined end point of stroke, thromboembolic events, cardiovascular death, or bleeding episodes was examined.
The risk of adverse outcomes was substantially higher for patients not treated with warfarin compared to treated patents. The estimated adverse event rate was 7 per 100 person-years for untreated patients versus 2.7 per 100 for warfarin-treated patients (adjusted incidence rate ratio [IRR] 2.46, 95% CI 1.09 to 6.48). Patients not treated with warfarin were at higher risk of cardiovascular death within 30 to 89 days after surgery, with an event rate of 31.7 per 100 person-years versus 3.8 per 100 person-years (adjusted IRR 7.61, 95% CI 4.37 to 13.26). The difference in cardiovascular mortality continued to be significant from 90 to 179 days after surgery, with an event rate of 6.5 per 100 person-years versus 2.1 per 100 person-years (IRR 3.51, 95% CI 1.54 to 8.03).
Bottom line: Discontinuation of warfarin therapy within six months of bioprosthetic aortic valve replacement is associated with increased cardiovascular death.
Citation: Mérie C, Køber L, Skov Olsen P, et al. Association of warfarin therapy duration after bioprosthetic aortic valve replacement with risk of mortality, thromboembolic complications, and bleeding. JAMA. 2012;308(20):2118-2125.
Limited Evidence for Antimicrobial-Coated Catheters
Clinical question: Does the use of antimicrobial-coated catheters reduce the risk of catheter-associated urinary tract infection (UTI) compared to standard polytetrafluoroethylene (PTFE) catheters?
Background: UTIs associated with indwelling catheters are a major preventable cause of harm for hospitalized patients. Prior studies have shown that catheters made with antimicrobial coatings can reduce rates of bacteriuria, but their usefulness against symptomatic catheter-associated UTIs remains uncertain.
Study design: Multicenter randomized controlled trial.
Setting: Twenty-four hospitals in the United Kingdom.
Synopsis: A total of 7,102 patients >16 undergoing urethral catheterization for an anticipated duration of <14 days were randomly allocated in a 1:1:1 ratio to receive a silver-alloy-coated catheter, a nitrofural-impregnated silicone catheter, or a standard PTFE-coated catheter. The primary outcome was defined as presence of patient-reported symptoms of UTI and prescription of antibiotic for UTI. Incidence of symptomatic catheter-associated UTI up to six weeks after randomization did not differ significantly between groups and occurred in 12.6% of the PTFE control, 12.5% of the silver alloy group, and 10.6% of the nitrofural group. In secondary outcomes, the nitrofural catheter was associated with a slightly reduced incidence of culture-confirmed symptomatic UTI (absolute risk reduction of 1.4%) and lower rate of bacteriuria, but it also had greater patient-reported discomfort during use and removal.
Bottom line: Antimicrobial-coated catheters do not show a clinically significant benefit over standard PTFE catheters in preventing catheter-associated UTI.
Citation: Pickard R, Lam T, Maclennan G, et al. Antimicrobial catheters for reduction of symptomatic urinary tract infection in adults requiring short-term catheterisation in hospital: a multicentre randomized controlled trial. Lancet. 2012;380:1927-1935.
Outcomes Improve after In-Hospital Cardiac Arrest
Clinical question: Have outcomes after in-hospital cardiac arrest improved with recent advances in resuscitation care?
Background: Over the past decade, quality-improvement (QI) efforts in hospital resuscitation care have included use of mock cardiac arrests, defibrillation by nonmedical personnel, and participation in QI registries. It is unclear what effect these efforts have had on overall survival and neurologic recovery.
Study design: Retrospective cohort study.
Setting: Five hundred fifty-three hospitals in the U.S.
Synopsis: A total of 113,514 patients age >18 with a cardiac arrest occurring from Jan. 1, 2000, to Nov. 19, 2009, were identified. Analyses were separated by initial rhythm (PEA/asystole or ventricular fibrillation/tachycardia). Overall survival to discharge increased significantly to 22.3% in 2009 from 13.7% in 2000, with similar increases within each rhythm group. Rates of acute resuscitation survival (return of spontaneous circulation for at least 20 contiguous minutes after initial arrest) and post-resuscitation survival (survival to discharge among patients surviving acute resuscitation) also improved during the study period. Rates of clinically significant neurologic disability, as defined by cerebral performance scores >1, decreased over time for the overall cohort and the subset with ventricular fibrillation/tachycardia. The study was limited by including only hospitals motivated to participate in a QI registry.
Bottom line: From 2000 to 2009, survival after in-hospital cardiac arrest improved, and rates of clinically significant neurologic disability among survivors decreased.
Citation: Girotra S, Nallamothu B, Spertus J, et al. Trends in survival after in-hospital cardiac arrest. N Engl J Med. 2012;367:1912-1920.