User login
Outcomes Following Implementation of a Hospital-Wide, Multicomponent Delirium Care Pathway
Delirium is an acute disturbance in mental status characterized by fluctuations in cognition and attention that affects more than 2.6 million hospitalized older adults in the United States annually, a rate that is expected to increase as the population ages.1-4 Hospital-acquired delirium is associated with poor outcomes, including prolonged hospital length of stay (LOS), loss of independence, cognitive impairment, and even death.5-10 Individuals who develop delirium do poorly after hospital discharge and are more likely to be readmitted within 30 days.11 Approximately 30% to 40% of hospital-acquired delirium cases are preventable.10,12 However, programs designed to prevent delirium and associated complications, such as increased LOS, have demonstrated variable success.12-14 Many studies are limited by small sample sizes, lack of generalizability to different hospitalized patient populations, poor adherence, or reliance on outside funding.12,13,15-18
Delirium prevention programs face several challenges because delirium could be caused by a variety of risk factors and precipitants.19,20 Some risk factors that occur frequently among hospitalized patients can be mitigated, such as sensory impairment, immobility from physical restraints or urinary catheters, and polypharmacy.20,21 Effective delirium care pathways targeting these risk factors must be multifaceted, interdisciplinary, and interprofessional. Accurate risk assessment is critical to allocate resources to high-risk patients. Delirium affects patients in all medical and surgical disciplines, and often is underdiagnosed.19,22 Comprehensive screening is necessary to identify cases early and track outcomes, and educational efforts must reach all providers in the hospital. These challenges require a systematic, pragmatic approach to change.
The purpose of this study was to evaluate the association between a delirium care pathway and clinical outcomes for hospitalized patients. We hypothesized that this program would be associated with reduced hospital LOS, with secondary benefits to hospitalization costs, odds of 30-day readmission, and delirium rates.
METHODS
Study Design
In this retrospective cohort study, we compared clinical outcomes the year before and after implementation of a delirium care pathway across seven hospital units. The study period spanned October 1, 2015, through February 28, 2019. The study was approved by the University of California, San Francisco Institutional Review Board (#13-12500).
Multicomponent Delirium Care Pathway
The delirium care pathway was developed collaboratively among geriatrics, hospital medicine, neurology, anesthesiology, surgery, and psychiatry services, with an interprofessional team of physicians, nurses, pharmacists, and physical and occupational therapists. This pathway was implemented in units consecutively, approximately every 4 months in the following order: neurosciences, medicine, cardiology, general surgery, specialty surgery, hematology-oncology, and transplant. The same implementation education protocols were performed in each unit. The pathway consisted of several components targeting delirium prevention and management (Appendix Figure 1 and Appendix Figure 2). Systematic screening for delirium was introduced as part of the multicomponent intervention. Nursing staff assessed each patient’s risk of developing delirium at admission using the AWOL score, a validated delirium prediction tool.23 AWOL consists of: patient Age, spelling “World” backwards correctly, Orientation, and assessment of iLlness severity by the nurse. For patients who spoke a language other than English, spelling of “world” backwards was translated to his or her primary language, or if this was not possible, the task was modified to serial 7s (subtracting 7 from 100 in a serial fashion). This modification has been validated for use in other languages.24 Patients at high risk for delirium based on an AWOL score ≥2 received a multidisciplinary intervention with four components: (1) notifying the primary team by pager and electronic medical record (EMR), (2) a nurse-led, evidence-based, nonpharmacologic multicomponent intervention,25 (3) placement of a delirium order set by the physician, and (4) review of medications by the unit pharmacist who adjusted administration timing to occur during waking hours and placed a note in the EMR notifying the primary team of potentially deliriogenic medications. The delirium order set reinforced the nonpharmacologic multicomponent intervention through a nursing order, placed an automatic consult to occupational therapy, and included options to order physical therapy, order speech/language therapy, obtain vital signs three times daily with minimal night interruptions, remove an indwelling bladder catheter, and prescribe melatonin as a sleep aid.
The bedside nurse screened all patients for active delirium every 12-hour shift using the Nursing Delirium Screening Scale (NuDESC) and entered the results into the EMR.23,26 Capturing NuDESC results in the EMR allowed communication across medical providers as well as monitoring of screening adherence. Each nurse received two in-person trainings in staff meetings and one-to-one instruction during the first week of implementation. All nurses were required to complete a 15-minute training module and had the option of completing an additional 1-hour continuing medical education module. If a patient was transferred to the intensive care unit (ICU), delirium was identified through use of the ICU-specific Confusion Assessment Method (CAM-ICU) assessments, which the bedside nurse performed each shift throughout the intervention period.27 Nurses were instructed to call the primary team physician after every positive screen. Before each unit’s implementation start date, physicians with patients on that unit received education through a combination of grand rounds, resident lectures and seminars, and a pocket card on delirium evaluation and management.
Participants and Eligibility Criteria
We included all patients aged ≥50 years hospitalized for >1 day on each hospital unit (Figure). We included adults aged ≥50 years to maximize the number of participants for this study while also capturing a population at risk for delirium. Because the delirium care pathway was unit-based and the pathway was rolled out sequentially across units, only patients who were admitted to and discharged from the same unit were included to better isolate the effect of the pathway. Patients who were transferred to the ICU were only included if they were discharged from the original unit of admission. Only the first hospitalization was included for patients with multiple hospitalizations during the study period.

Patient Characteristics
Patient demographics and clinical data were collected after discharge through Clarity and Vizient electronic databases (Table 1 and Table 2). All Elixhauser comorbidities were included except for the following International Classification of Disease, Tenth Revision, Clinical Modification (ICD-10) codes that overlapped with a delirium diagnosis: G31.2, G93.89, G93.9, G94, R41.0, and R41.82 (Appendix Table 1). Severity of illness was obtained from Vizient, which calculates illness severity based on clinical and claims data (Appendix Table 1).

Delirium Metrics
Delirium screening was introduced as part of the multicomponent intervention, and therefore delirium rates before the intervention could not be determined. Trends in delirium prevalence and incidence after the intervention are reported. Prevalent delirium was defined as a single score of ≥2 on the nurse-administered NuDESC or a positive CAM-ICU at any point during the hospital stay. Incident delirium was identified if the first NuDESC score was negative and any subsequent NuDESC or CAM-ICU score was positive.

Outcomes
The primary study outcome was hospital LOS across all participants. Secondary outcomes included total direct cost and odds of 30-day hospital readmission. Readmissions tracked as part of hospital quality reporting were obtained from Vizient and were not captured if they occurred at another hospital. We also examined rates of safety attendant and restraint use during the study period, defined as the number of safety attendant days or restraint days per 1,000 patient days.
Because previous studies have demonstrated the effectiveness of multicomponent delirium interventions among elderly general medical patients,12 we also investigated these same outcomes in the medicine unit alone.
Statistical Analysis
The date of intervention implementation was determined for each hospital unit, which was defined as time(0) [t(0)]. The 12-month postintervention period was divided into four 3-month epochs to assess for trends. Data were aggregated across the seven units using t(0) as the start date, agnostic to the calendar month. Demographic and clinical characteristics were collected for the 12-months before t(0) and the four 3-month epochs after t(0). Univariate analysis of outcome variables comparing trends across the same epochs were conducted in the same manner, except for the rate of delirium, which was measured after t(0) and therefore could not be compared with the preintervention period.
Multivariable models were adjusted for age, sex, race/ethnicity, admission category, Elixhauser comorbidities, severity of illness quartile, and number days spent in the ICU. Admission category referred to whether the admission was emergent, urgent, or elective/unknown. Because it took 3 months after t(0) for each unit to reach a delirium screening compliance rate of 90%, the intervention was only considered fully implemented after this period. A ramp-up variable was set to 0 for admissions occurring prior to the intervention to t(0), 1/3 for admissions occurring 1 month post intervention, 2/3 for 2 months post intervention, and 1 for admissions occurring 3 to 12 months post intervention. In this way, the coefficient for the ramp-up variable estimated the postintervention versus preintervention effect. Numerical outcomes (LOS, cost) were log transformed to reduce skewness and analyzed using linear models. Coefficients were back-transformed to provide interpretations as proportional change in the median outcomes.
For LOS and readmission, we assessed secular trends by including admission date and admission date squared, in case the trend was nonlinear, as possible predictors; admission date was the specific date—not time from t(0)—to account for secular trends and allow contemporaneous controls in the analysis. To be conservative, we retained secular terms (first considering the quadratic and then the linear) if P <.10. The categorical outcome (30-day readmission) was analyzed using a logistic model. Count variables (delirium, safety attendants, restraints) were analyzed using Poisson regression models with a log link, and coefficients were back-transformed to provide rate ratio interpretations. Because delirium was not measured before t(0), and because the intervention was considered to take 3 months to become fully effective, baseline delirium rates were defined as those in the first 3 months adjusted by the ramp-up variable. For each outcome we included hospital unit, a ramp-up variable (measuring the pre- vs postintervention effect), and their interaction. If there was no statistically significant interaction, we presented the outcome for all units combined. If the interaction was statistically significant, we looked for consistency across units and reported results for all units combined when consistent, along with site-specific results. If the results were not consistent across the units, we provided site-specific results only. All statistical analyses were performed using SAS software, version 9.4 (SAS Institute Inc).
RESULTS
Participant Demographics and Clinical Characteristics
A total of 22,708 individuals were included in this study, with 11,018 in the preintervention period (Table 1 and Table 2). Most patients were cared for on the general surgery unit (n = 5,899), followed by the medicine unit (n = 4,923). The smallest number of patients were cared for on the hematology-oncology unit (n = 1,709). Across the five epochs, patients were of similar age and sex, and spent a similar number of days in the ICU. The population was diverse with regard to race and ethnicity; there were minor differences in admission category. There were also minor differences in severity of illness and some comorbidities between timepoints (Appendix Table 1).
Delirium Metrics
Delirium prevalence was 13.0% during the first epoch post intervention, followed by 12.0%, 11.7%, and 13.0% in the subsequent epochs (P = .91). Incident delirium occurred in 6.1% of patients during the first epoch post intervention, followed by 5.3%, 5.3%, and 5.8% in the subsequent epochs (P = .63).
Primary Outcome
Epoch-level data for LOS before and after the intervention is shown in Appendix Table 2. The mean unadjusted LOS for all units combined did not decrease after the intervention, but in the adjusted model, the mean LOS decreased by 2% after the intervention (P = .0087; Table 3).

Secondary Outcomes
The odds of 30-day readmission decreased by 14% (P = .0002) in the adjusted models for all units combined (Table 3). There was no statistically significant reduction in adjusted total direct hospitalization cost or rate of restraint use. The safety attendant results showed strong effect modification across sites; the site-specific estimates are provided in Appendix Table 3. However, the estimated values all showed reductions, and a number were large and statistically significant.
Medicine Unit Outcomes
On the medicine unit alone, we observed a statistically significant reduction in LOS of 9% after implementation of the delirium care pathway (P = .028) in the adjusted model (Table 3). There was an associated 7% proportional decrease in total direct cost (P = .0002). Reductions in 30-day readmission and safety attendant use did not remain statistically significant in the adjusted models.
DISCUSSION
Implementation of a hospital-wide multicomponent delirium care pathway was associated with reduced hospital LOS and 30-day hospital readmission in a study of 22,708 hospitalized adults at a tertiary care, university hospital in Northern California, encompassing both medical and surgical acute care patients. When evaluating general medicine patients alone, pathway implementation was associated with reductions in LOS and total direct cost. The cost savings of 7% among medical patients translates to median savings of $1,237 per hospitalization. This study—one of the largest to date examining implementation of a hospital-wide delirium care pathway—supports use of a multicomponent delirium care pathway for older adults hospitalized for a range of conditions.
Multicomponent pathways for delirium prevention and management are increasingly being used in hospital settings. The United Kingdom National Institute for Health and Care Excellence guidelines recommend delirium assessment and intervention by a multidisciplinary team within 24 hours of hospital admission for those at risk.25 These guidelines are based on evidence accumulated in clinical studies over the past 30 years suggesting that multicomponent interventions reduce incident delirium by 30% to 40% among medical and surgical patients.12,13,25,28
Although multicomponent delirium care pathways are associated with improved patient outcomes, the specific clinical benefits might vary across patient populations. Here, we found larger reductions in LOS and total direct cost among medicine patients. Medical patients might respond more robustly to nonpharmacologic multicomponent delirium interventions because of differing delirium etiologies (eg, constipation and sleep deprivation in a medical patient vs seizures or encephalitis in a neurosciences patient). Another explanation for the difference observed in total direct cost might be the inclusion of surgical units in the total study population. For example, not all hospital days are equivalent in cost for patients on a surgical unit.29 For patients requiring surgical care, most of the hospitalization cost might be incurred during the initial days of hospitalization, when there are perioperative costs; therefore, reduced LOS might have a lower economic impact.29 Multicomponent, nonpharmacologic delirium interventions encourage discontinuing restraints. As a result, one might expect a need for more frequent safety attendant use and an associated cost increase. However, we found that the estimated unit-specific values for safety attendant use showed reductions, which were large and highly statistically significant. For all units combined and the medicine unit alone, we found that the rate of restraint use decreased, although the change was not statistically significant. It is possible that some of the interventions taught to nurses and physicians as part of care pathway implementation, such as the use of family support for at-risk and delirious patients, led to a reduction in both safety attendants and restraints.
Our study had several strengths. This is one of the largest hospital-based delirium interventions studied, both in terms of its scope across seven diverse medical and surgical hospital units and the number of hospitalized patients studied. This intervention did not require additional staff or creating a specialized ward. Adherence to the pathway, as measured by risk assessment and delirium screening, was high (>90%) 3 months after implementation. This allowed for robust outcome ascertainment. The patient population’s characteristics and rates of delirium were stable over time. Because different hospital units incorporated the multicomponent delirium care pathway at different times, limiting enrollment to patients admitted and discharged from the same unit isolated the analysis to patients exposed to the pathway on each unit. This design also limited potential influence of other hospital quality improvement projects that might have occurred at the same time.
The primary limitation of this study is that screening for delirium was introduced as part of the multicomponent intervention. This decision was made to maximize buy-in from bedside nurses performing delirium screening because this addition to their workflow was explicitly linked to delirium prevention and management measures. Delirium could not be ascertained preintervention from the EMR because it is a clinical diagnosis and is coded inadequately.30 We could only measure the change in delirium metrics after implementation of the delirium care pathway. Because baseline delirium rates before the intervention were not measured systematically, conclusions about the intervention’s association with delirium metrics are limited. All other outcomes were measured before and after the intervention.
Although the comprehensive delirium screening program and high rate of adherence are a methodologic strength of this study, a second limitation is the use of the NuDESC. Our previous research demonstrated that the NuDESC has low sensitivity but high specificity and positive predictive value,26 which might underestimate delirium rates in this study. However, any underestimation should be stable over time and temporal trends should remain meaningful. This could allow more widespread study of delirium among hospitalized individuals. Because this care pathway was hospital-wide, it was important to ensure both consistency of screening and longevity of the initiative, and it was necessary to select a delirium assessment tool that was efficient and validated for nursing implementation. For these reasons, the NuDESC was an appropriate choice.
It is possible that our results could be influenced by unmeasured confounders. For example, although we incorporated Elixhauser medical comorbidities and illness severity into our model, we were unable to adjust for baseline functional status or frailty. Baseline functional status and frailty were not reliably recorded in the EMR, although these are potential confounders when investigating clinical outcomes including hospital readmission.
CONCLUSION
Implementation of a systematic, hospital-wide multicomponent delirium care pathway is associated with reductions in hospital LOS and 30-day readmission. In general medicine units, the reduction in LOS and associated cost savings were robust. These results demonstrate the feasibility and effectiveness of implementing an interprofessional, multidisciplinary multicomponent delirium care pathway through medical center funding to benefit patients and the hospital system.
Acknowledgments
The authors thank the many hospital staff members, especially the nurses, pharmacists, therapists, and patient care assistants, who helped implement the multicomponent delirium care pathway. All persons who have contributed significantly to this work are listed as authors of this work.
1. Bidwell J. Interventions for preventing delirium in hospitalized non-ICU patients: A Cochrane review summary. Int J Nurs Stud. 2017;70:142-143. https://doi.org/ 10.1016/j.ijnurstu.2016.11.010
2. Maldonado JR. Delirium in the acute care setting: characteristics, diagnosis and treatment. Crit Care Clin. 2008;24(4):657-722, vii. https://doi.org/10.1016/j.ccc.2008.05.008
3. Field RR, Wall MH. Delirium: past, present, and future. Semin Cardiothorac Vasc Anesth. 2013;17(3):170-179. https://doi.org/10.1177/1089253213476957
4. Oh ST, Park JY. Postoperative delirium. Korean J Anesthesiol. 2019;72(1):4-12. https://doi.org/10.4097/kja.d.18.00073.1
5. Francis J, Martin D, Kapoor WN. A prospective study of delirium in hospitalized elderly. JAMA. 1990;263(8):1097-1101.
6. Salluh JI, Soares M, Teles JM, et al. Delirium epidemiology in critical care (DECCA): an international study. Crit Care. 2010;14(6):R210. https://doi.org/10.1186/cc9333
7. Ely EW, Shintani A, Truman B, et al. Delirium as a predictor of mortality in mechanically ventilated patients in the intensive care unit. JAMA. 2004;291(14):1753-1762. https://doi.org/
8. McCusker J, Cole MG, Dendukuri N, Belzile E. Does delirium increase hospital stay? J Am Geriatr Soc. 2003;51(11):1539-1546. https://doi.org/10.1001/jama.291.14.1753
9. Inouye SK, Rushing JT, Foreman MD, Palmer RM, Pompei P. Does delirium contribute to poor hospital outcomes? A three-site epidemiologic study. J Gen Intern Med. 1998;13(4):234-242. https://doi.org/10.1046/j.1525-1497.1998.00073.x
10. Siddiqi N, House AO, Holmes JD. Occurrence and outcome of delirium in medical in-patients: a systematic literature review. Age Ageing. 2006;35(4):350-364. https://doi.org/10.1093/ageing/afl005
11. LaHue SC, Douglas VC, Kuo T, et al. Association between inpatient delirium and hospital readmission in patients >/= 65 years of age: a retrospective cohort study. J Hosp Med. 2019;14(4):201-206. https://doi.org/10.12788/jhm.3130
12. Hshieh TT, Yue J, Oh E, et al. Effectiveness of multicomponent nonpharmacological delirium interventions: a meta-analysis. JAMA Intern Med. 2015;175(4):512-520. https://doi.org/10.1001/jamainternmed.2014.7779
13. Inouye SK, Bogardus ST, Jr., Charpentier PA, et al. A multicomponent intervention to prevent delirium in hospitalized older patients. N Engl J Med. 1999;340(9):669-676. https://doi.org/10.1056/NEJM199903043400901
14. Marcantonio ER, Flacker JM, Wright RJ, Resnick NM. Reducing delirium after hip fracture: a randomized trial. J Am Geriatr Soc. 2001;49(5):516-522. https://doi.org/
15. Alhaidari AA, Allen-Narker RA. An evolving approach to delirium: A mixed-methods process evaluation of a hospital-wide delirium program in New Zealand. Australas J Ageing. 2017. https://doi.org/10.1046/j.1532-5415.2001.49108.x
16. Holroyd-Leduc JM, Khandwala F, Sink KM. How can delirium best be prevented and managed in older patients in hospital? CMAJ. 2010;182(5):465-470. https://doi.org/10.1503/cmaj.080519
17. Siddiqi N, Stockdale R, Britton AM, Holmes J. Interventions for preventing delirium in hospitalised patients. Cochrane Database Syst Rev. 2007(2):CD005563. https://doi.org/ 10.1002/14651858.CD005563.pub2
18. Siddiqi N, Harrison JK, Clegg A, et al. Interventions for preventing delirium in hospitalised non-ICU patients. Cochrane Database Syst Rev. 2016;3:CD005563. https://doi.org/10.1002/14651858.CD005563.pub3
19. Inouye SK, Westendorp RG, Saczynski JS. Delirium in elderly people. Lancet. 2014;383(9920):911-922. https://doi.org/10.1016/S0140-6736(13)60688-1
20. Inouye SK, Charpentier PA. Precipitating factors for delirium in hospitalized elderly persons. Predictive model and interrelationship with baseline vulnerability. JAMA. 1996;275(11):852-857.
21. LaHue SC, Liu VX. Loud and clear: sensory impairment, delirium, and functional recovery in critical illness. Am J Respir Crit Care Med. 2016;194(3):252-253. https://doi.org/10.1164/rccm.201602-0372ED
22. Ritter SRF, Cardoso AF, Lins MMP, Zoccoli TLV, Freitas MPD, Camargos EF. Underdiagnosis of delirium in the elderly in acute care hospital settings: lessons not learned. Psychogeriatrics. 2018;18(4):268-275. https://doi.org/10.1111/psyg.12324
23. Douglas VC, Hessler CS, Dhaliwal G, et al. The AWOL tool: derivation and validation of a delirium prediction rule. J Hosp Med. 2013;8(9):493-499. https://doi.org/10.1002/jhm.2062
24. Tombaugh TN, McDowell I, Kristjansson B, Hubley AM. Mini-Mental State Examination (MMSE) and the modified MMSE (3MS): A psychometric comparison and normative data. Psychol Assessment. 1996;8(1):48-59. https://doi.org/10.1037/1040-3590.8.1.48
25. Young J, Murthy L, Westby M, Akunne A, O’Mahony R, Guideline Development Group. Diagnosis, prevention, and management of delirium: summary of NICE guidance. BMJ. 2010;341:c3704. https://doi.org/10.1136/bmj.c3704
26. Hargrave A, Bastiaens J, Bourgeois JA, et al. Validation of a nurse-based delirium-screening tool for hospitalized patients. Psychosomatics. 2017;58(6):594-603. https://doi.org/10.1016/j.psym.2017.05.005
27. Ely EW, Inouye SK, Bernard GR, et al. Delirium in mechanically ventilated patients: validity and reliability of the confusion assessment method for the intensive care unit (CAM-ICU). JAMA. 2001;286(21):2703-2710. https://doi.org/10.1001/jama.286.21.2703
28. Strijbos MJ, Steunenberg B, van der Mast RC, Inouye SK, Schuurmans MJ. Design and methods of the Hospital Elder Life Program (HELP), a multicomponent targeted intervention to prevent delirium in hospitalized older patients: efficacy and cost-effectiveness in Dutch health care. BMC Geriatr. 2013;13:78. https://doi.org/10.1186/1471-2318-13-78
29. Taheri PA, Butz DA, Greenfield LJ. Length of stay has minimal impact on the cost of hospital admission. J Am Coll Surg. 2000;191(2):123-130. https://doi.org/10.1016/s1072-7515(00)00352-5
30. Fong TG, Tulebaev SR, Inouye SK. Delirium in elderly adults: diagnosis, prevention and treatment. Nat Rev Neurol. 2009;5(4):210-220. https://doi.org/10.1038/nrneurol.2009.24
Delirium is an acute disturbance in mental status characterized by fluctuations in cognition and attention that affects more than 2.6 million hospitalized older adults in the United States annually, a rate that is expected to increase as the population ages.1-4 Hospital-acquired delirium is associated with poor outcomes, including prolonged hospital length of stay (LOS), loss of independence, cognitive impairment, and even death.5-10 Individuals who develop delirium do poorly after hospital discharge and are more likely to be readmitted within 30 days.11 Approximately 30% to 40% of hospital-acquired delirium cases are preventable.10,12 However, programs designed to prevent delirium and associated complications, such as increased LOS, have demonstrated variable success.12-14 Many studies are limited by small sample sizes, lack of generalizability to different hospitalized patient populations, poor adherence, or reliance on outside funding.12,13,15-18
Delirium prevention programs face several challenges because delirium could be caused by a variety of risk factors and precipitants.19,20 Some risk factors that occur frequently among hospitalized patients can be mitigated, such as sensory impairment, immobility from physical restraints or urinary catheters, and polypharmacy.20,21 Effective delirium care pathways targeting these risk factors must be multifaceted, interdisciplinary, and interprofessional. Accurate risk assessment is critical to allocate resources to high-risk patients. Delirium affects patients in all medical and surgical disciplines, and often is underdiagnosed.19,22 Comprehensive screening is necessary to identify cases early and track outcomes, and educational efforts must reach all providers in the hospital. These challenges require a systematic, pragmatic approach to change.
The purpose of this study was to evaluate the association between a delirium care pathway and clinical outcomes for hospitalized patients. We hypothesized that this program would be associated with reduced hospital LOS, with secondary benefits to hospitalization costs, odds of 30-day readmission, and delirium rates.
METHODS
Study Design
In this retrospective cohort study, we compared clinical outcomes the year before and after implementation of a delirium care pathway across seven hospital units. The study period spanned October 1, 2015, through February 28, 2019. The study was approved by the University of California, San Francisco Institutional Review Board (#13-12500).
Multicomponent Delirium Care Pathway
The delirium care pathway was developed collaboratively among geriatrics, hospital medicine, neurology, anesthesiology, surgery, and psychiatry services, with an interprofessional team of physicians, nurses, pharmacists, and physical and occupational therapists. This pathway was implemented in units consecutively, approximately every 4 months in the following order: neurosciences, medicine, cardiology, general surgery, specialty surgery, hematology-oncology, and transplant. The same implementation education protocols were performed in each unit. The pathway consisted of several components targeting delirium prevention and management (Appendix Figure 1 and Appendix Figure 2). Systematic screening for delirium was introduced as part of the multicomponent intervention. Nursing staff assessed each patient’s risk of developing delirium at admission using the AWOL score, a validated delirium prediction tool.23 AWOL consists of: patient Age, spelling “World” backwards correctly, Orientation, and assessment of iLlness severity by the nurse. For patients who spoke a language other than English, spelling of “world” backwards was translated to his or her primary language, or if this was not possible, the task was modified to serial 7s (subtracting 7 from 100 in a serial fashion). This modification has been validated for use in other languages.24 Patients at high risk for delirium based on an AWOL score ≥2 received a multidisciplinary intervention with four components: (1) notifying the primary team by pager and electronic medical record (EMR), (2) a nurse-led, evidence-based, nonpharmacologic multicomponent intervention,25 (3) placement of a delirium order set by the physician, and (4) review of medications by the unit pharmacist who adjusted administration timing to occur during waking hours and placed a note in the EMR notifying the primary team of potentially deliriogenic medications. The delirium order set reinforced the nonpharmacologic multicomponent intervention through a nursing order, placed an automatic consult to occupational therapy, and included options to order physical therapy, order speech/language therapy, obtain vital signs three times daily with minimal night interruptions, remove an indwelling bladder catheter, and prescribe melatonin as a sleep aid.
The bedside nurse screened all patients for active delirium every 12-hour shift using the Nursing Delirium Screening Scale (NuDESC) and entered the results into the EMR.23,26 Capturing NuDESC results in the EMR allowed communication across medical providers as well as monitoring of screening adherence. Each nurse received two in-person trainings in staff meetings and one-to-one instruction during the first week of implementation. All nurses were required to complete a 15-minute training module and had the option of completing an additional 1-hour continuing medical education module. If a patient was transferred to the intensive care unit (ICU), delirium was identified through use of the ICU-specific Confusion Assessment Method (CAM-ICU) assessments, which the bedside nurse performed each shift throughout the intervention period.27 Nurses were instructed to call the primary team physician after every positive screen. Before each unit’s implementation start date, physicians with patients on that unit received education through a combination of grand rounds, resident lectures and seminars, and a pocket card on delirium evaluation and management.
Participants and Eligibility Criteria
We included all patients aged ≥50 years hospitalized for >1 day on each hospital unit (Figure). We included adults aged ≥50 years to maximize the number of participants for this study while also capturing a population at risk for delirium. Because the delirium care pathway was unit-based and the pathway was rolled out sequentially across units, only patients who were admitted to and discharged from the same unit were included to better isolate the effect of the pathway. Patients who were transferred to the ICU were only included if they were discharged from the original unit of admission. Only the first hospitalization was included for patients with multiple hospitalizations during the study period.
Patient Characteristics
Patient demographics and clinical data were collected after discharge through Clarity and Vizient electronic databases (Table 1 and Table 2). All Elixhauser comorbidities were included except for the following International Classification of Disease, Tenth Revision, Clinical Modification (ICD-10) codes that overlapped with a delirium diagnosis: G31.2, G93.89, G93.9, G94, R41.0, and R41.82 (Appendix Table 1). Severity of illness was obtained from Vizient, which calculates illness severity based on clinical and claims data (Appendix Table 1).
Delirium Metrics
Delirium screening was introduced as part of the multicomponent intervention, and therefore delirium rates before the intervention could not be determined. Trends in delirium prevalence and incidence after the intervention are reported. Prevalent delirium was defined as a single score of ≥2 on the nurse-administered NuDESC or a positive CAM-ICU at any point during the hospital stay. Incident delirium was identified if the first NuDESC score was negative and any subsequent NuDESC or CAM-ICU score was positive.
Outcomes
The primary study outcome was hospital LOS across all participants. Secondary outcomes included total direct cost and odds of 30-day hospital readmission. Readmissions tracked as part of hospital quality reporting were obtained from Vizient and were not captured if they occurred at another hospital. We also examined rates of safety attendant and restraint use during the study period, defined as the number of safety attendant days or restraint days per 1,000 patient days.
Because previous studies have demonstrated the effectiveness of multicomponent delirium interventions among elderly general medical patients,12 we also investigated these same outcomes in the medicine unit alone.
Statistical Analysis
The date of intervention implementation was determined for each hospital unit, which was defined as time(0) [t(0)]. The 12-month postintervention period was divided into four 3-month epochs to assess for trends. Data were aggregated across the seven units using t(0) as the start date, agnostic to the calendar month. Demographic and clinical characteristics were collected for the 12-months before t(0) and the four 3-month epochs after t(0). Univariate analysis of outcome variables comparing trends across the same epochs were conducted in the same manner, except for the rate of delirium, which was measured after t(0) and therefore could not be compared with the preintervention period.
Multivariable models were adjusted for age, sex, race/ethnicity, admission category, Elixhauser comorbidities, severity of illness quartile, and number days spent in the ICU. Admission category referred to whether the admission was emergent, urgent, or elective/unknown. Because it took 3 months after t(0) for each unit to reach a delirium screening compliance rate of 90%, the intervention was only considered fully implemented after this period. A ramp-up variable was set to 0 for admissions occurring prior to the intervention to t(0), 1/3 for admissions occurring 1 month post intervention, 2/3 for 2 months post intervention, and 1 for admissions occurring 3 to 12 months post intervention. In this way, the coefficient for the ramp-up variable estimated the postintervention versus preintervention effect. Numerical outcomes (LOS, cost) were log transformed to reduce skewness and analyzed using linear models. Coefficients were back-transformed to provide interpretations as proportional change in the median outcomes.
For LOS and readmission, we assessed secular trends by including admission date and admission date squared, in case the trend was nonlinear, as possible predictors; admission date was the specific date—not time from t(0)—to account for secular trends and allow contemporaneous controls in the analysis. To be conservative, we retained secular terms (first considering the quadratic and then the linear) if P <.10. The categorical outcome (30-day readmission) was analyzed using a logistic model. Count variables (delirium, safety attendants, restraints) were analyzed using Poisson regression models with a log link, and coefficients were back-transformed to provide rate ratio interpretations. Because delirium was not measured before t(0), and because the intervention was considered to take 3 months to become fully effective, baseline delirium rates were defined as those in the first 3 months adjusted by the ramp-up variable. For each outcome we included hospital unit, a ramp-up variable (measuring the pre- vs postintervention effect), and their interaction. If there was no statistically significant interaction, we presented the outcome for all units combined. If the interaction was statistically significant, we looked for consistency across units and reported results for all units combined when consistent, along with site-specific results. If the results were not consistent across the units, we provided site-specific results only. All statistical analyses were performed using SAS software, version 9.4 (SAS Institute Inc).
RESULTS
Participant Demographics and Clinical Characteristics
A total of 22,708 individuals were included in this study, with 11,018 in the preintervention period (Table 1 and Table 2). Most patients were cared for on the general surgery unit (n = 5,899), followed by the medicine unit (n = 4,923). The smallest number of patients were cared for on the hematology-oncology unit (n = 1,709). Across the five epochs, patients were of similar age and sex, and spent a similar number of days in the ICU. The population was diverse with regard to race and ethnicity; there were minor differences in admission category. There were also minor differences in severity of illness and some comorbidities between timepoints (Appendix Table 1).
Delirium Metrics
Delirium prevalence was 13.0% during the first epoch post intervention, followed by 12.0%, 11.7%, and 13.0% in the subsequent epochs (P = .91). Incident delirium occurred in 6.1% of patients during the first epoch post intervention, followed by 5.3%, 5.3%, and 5.8% in the subsequent epochs (P = .63).
Primary Outcome
Epoch-level data for LOS before and after the intervention is shown in Appendix Table 2. The mean unadjusted LOS for all units combined did not decrease after the intervention, but in the adjusted model, the mean LOS decreased by 2% after the intervention (P = .0087; Table 3).
Secondary Outcomes
The odds of 30-day readmission decreased by 14% (P = .0002) in the adjusted models for all units combined (Table 3). There was no statistically significant reduction in adjusted total direct hospitalization cost or rate of restraint use. The safety attendant results showed strong effect modification across sites; the site-specific estimates are provided in Appendix Table 3. However, the estimated values all showed reductions, and a number were large and statistically significant.
Medicine Unit Outcomes
On the medicine unit alone, we observed a statistically significant reduction in LOS of 9% after implementation of the delirium care pathway (P = .028) in the adjusted model (Table 3). There was an associated 7% proportional decrease in total direct cost (P = .0002). Reductions in 30-day readmission and safety attendant use did not remain statistically significant in the adjusted models.
DISCUSSION
Implementation of a hospital-wide multicomponent delirium care pathway was associated with reduced hospital LOS and 30-day hospital readmission in a study of 22,708 hospitalized adults at a tertiary care, university hospital in Northern California, encompassing both medical and surgical acute care patients. When evaluating general medicine patients alone, pathway implementation was associated with reductions in LOS and total direct cost. The cost savings of 7% among medical patients translates to median savings of $1,237 per hospitalization. This study—one of the largest to date examining implementation of a hospital-wide delirium care pathway—supports use of a multicomponent delirium care pathway for older adults hospitalized for a range of conditions.
Multicomponent pathways for delirium prevention and management are increasingly being used in hospital settings. The United Kingdom National Institute for Health and Care Excellence guidelines recommend delirium assessment and intervention by a multidisciplinary team within 24 hours of hospital admission for those at risk.25 These guidelines are based on evidence accumulated in clinical studies over the past 30 years suggesting that multicomponent interventions reduce incident delirium by 30% to 40% among medical and surgical patients.12,13,25,28
Although multicomponent delirium care pathways are associated with improved patient outcomes, the specific clinical benefits might vary across patient populations. Here, we found larger reductions in LOS and total direct cost among medicine patients. Medical patients might respond more robustly to nonpharmacologic multicomponent delirium interventions because of differing delirium etiologies (eg, constipation and sleep deprivation in a medical patient vs seizures or encephalitis in a neurosciences patient). Another explanation for the difference observed in total direct cost might be the inclusion of surgical units in the total study population. For example, not all hospital days are equivalent in cost for patients on a surgical unit.29 For patients requiring surgical care, most of the hospitalization cost might be incurred during the initial days of hospitalization, when there are perioperative costs; therefore, reduced LOS might have a lower economic impact.29 Multicomponent, nonpharmacologic delirium interventions encourage discontinuing restraints. As a result, one might expect a need for more frequent safety attendant use and an associated cost increase. However, we found that the estimated unit-specific values for safety attendant use showed reductions, which were large and highly statistically significant. For all units combined and the medicine unit alone, we found that the rate of restraint use decreased, although the change was not statistically significant. It is possible that some of the interventions taught to nurses and physicians as part of care pathway implementation, such as the use of family support for at-risk and delirious patients, led to a reduction in both safety attendants and restraints.
Our study had several strengths. This is one of the largest hospital-based delirium interventions studied, both in terms of its scope across seven diverse medical and surgical hospital units and the number of hospitalized patients studied. This intervention did not require additional staff or creating a specialized ward. Adherence to the pathway, as measured by risk assessment and delirium screening, was high (>90%) 3 months after implementation. This allowed for robust outcome ascertainment. The patient population’s characteristics and rates of delirium were stable over time. Because different hospital units incorporated the multicomponent delirium care pathway at different times, limiting enrollment to patients admitted and discharged from the same unit isolated the analysis to patients exposed to the pathway on each unit. This design also limited potential influence of other hospital quality improvement projects that might have occurred at the same time.
The primary limitation of this study is that screening for delirium was introduced as part of the multicomponent intervention. This decision was made to maximize buy-in from bedside nurses performing delirium screening because this addition to their workflow was explicitly linked to delirium prevention and management measures. Delirium could not be ascertained preintervention from the EMR because it is a clinical diagnosis and is coded inadequately.30 We could only measure the change in delirium metrics after implementation of the delirium care pathway. Because baseline delirium rates before the intervention were not measured systematically, conclusions about the intervention’s association with delirium metrics are limited. All other outcomes were measured before and after the intervention.
Although the comprehensive delirium screening program and high rate of adherence are a methodologic strength of this study, a second limitation is the use of the NuDESC. Our previous research demonstrated that the NuDESC has low sensitivity but high specificity and positive predictive value,26 which might underestimate delirium rates in this study. However, any underestimation should be stable over time and temporal trends should remain meaningful. This could allow more widespread study of delirium among hospitalized individuals. Because this care pathway was hospital-wide, it was important to ensure both consistency of screening and longevity of the initiative, and it was necessary to select a delirium assessment tool that was efficient and validated for nursing implementation. For these reasons, the NuDESC was an appropriate choice.
It is possible that our results could be influenced by unmeasured confounders. For example, although we incorporated Elixhauser medical comorbidities and illness severity into our model, we were unable to adjust for baseline functional status or frailty. Baseline functional status and frailty were not reliably recorded in the EMR, although these are potential confounders when investigating clinical outcomes including hospital readmission.
CONCLUSION
Implementation of a systematic, hospital-wide multicomponent delirium care pathway is associated with reductions in hospital LOS and 30-day readmission. In general medicine units, the reduction in LOS and associated cost savings were robust. These results demonstrate the feasibility and effectiveness of implementing an interprofessional, multidisciplinary multicomponent delirium care pathway through medical center funding to benefit patients and the hospital system.
Acknowledgments
The authors thank the many hospital staff members, especially the nurses, pharmacists, therapists, and patient care assistants, who helped implement the multicomponent delirium care pathway. All persons who have contributed significantly to this work are listed as authors of this work.
1. Bidwell J. Interventions for preventing delirium in hospitalized non-ICU patients: A Cochrane review summary. Int J Nurs Stud. 2017;70:142-143. https://doi.org/ 10.1016/j.ijnurstu.2016.11.010
2. Maldonado JR. Delirium in the acute care setting: characteristics, diagnosis and treatment. Crit Care Clin. 2008;24(4):657-722, vii. https://doi.org/10.1016/j.ccc.2008.05.008
3. Field RR, Wall MH. Delirium: past, present, and future. Semin Cardiothorac Vasc Anesth. 2013;17(3):170-179. https://doi.org/10.1177/1089253213476957
4. Oh ST, Park JY. Postoperative delirium. Korean J Anesthesiol. 2019;72(1):4-12. https://doi.org/10.4097/kja.d.18.00073.1
5. Francis J, Martin D, Kapoor WN. A prospective study of delirium in hospitalized elderly. JAMA. 1990;263(8):1097-1101.
6. Salluh JI, Soares M, Teles JM, et al. Delirium epidemiology in critical care (DECCA): an international study. Crit Care. 2010;14(6):R210. https://doi.org/10.1186/cc9333
7. Ely EW, Shintani A, Truman B, et al. Delirium as a predictor of mortality in mechanically ventilated patients in the intensive care unit. JAMA. 2004;291(14):1753-1762. https://doi.org/
8. McCusker J, Cole MG, Dendukuri N, Belzile E. Does delirium increase hospital stay? J Am Geriatr Soc. 2003;51(11):1539-1546. https://doi.org/10.1001/jama.291.14.1753
9. Inouye SK, Rushing JT, Foreman MD, Palmer RM, Pompei P. Does delirium contribute to poor hospital outcomes? A three-site epidemiologic study. J Gen Intern Med. 1998;13(4):234-242. https://doi.org/10.1046/j.1525-1497.1998.00073.x
10. Siddiqi N, House AO, Holmes JD. Occurrence and outcome of delirium in medical in-patients: a systematic literature review. Age Ageing. 2006;35(4):350-364. https://doi.org/10.1093/ageing/afl005
11. LaHue SC, Douglas VC, Kuo T, et al. Association between inpatient delirium and hospital readmission in patients >/= 65 years of age: a retrospective cohort study. J Hosp Med. 2019;14(4):201-206. https://doi.org/10.12788/jhm.3130
12. Hshieh TT, Yue J, Oh E, et al. Effectiveness of multicomponent nonpharmacological delirium interventions: a meta-analysis. JAMA Intern Med. 2015;175(4):512-520. https://doi.org/10.1001/jamainternmed.2014.7779
13. Inouye SK, Bogardus ST, Jr., Charpentier PA, et al. A multicomponent intervention to prevent delirium in hospitalized older patients. N Engl J Med. 1999;340(9):669-676. https://doi.org/10.1056/NEJM199903043400901
14. Marcantonio ER, Flacker JM, Wright RJ, Resnick NM. Reducing delirium after hip fracture: a randomized trial. J Am Geriatr Soc. 2001;49(5):516-522. https://doi.org/
15. Alhaidari AA, Allen-Narker RA. An evolving approach to delirium: A mixed-methods process evaluation of a hospital-wide delirium program in New Zealand. Australas J Ageing. 2017. https://doi.org/10.1046/j.1532-5415.2001.49108.x
16. Holroyd-Leduc JM, Khandwala F, Sink KM. How can delirium best be prevented and managed in older patients in hospital? CMAJ. 2010;182(5):465-470. https://doi.org/10.1503/cmaj.080519
17. Siddiqi N, Stockdale R, Britton AM, Holmes J. Interventions for preventing delirium in hospitalised patients. Cochrane Database Syst Rev. 2007(2):CD005563. https://doi.org/ 10.1002/14651858.CD005563.pub2
18. Siddiqi N, Harrison JK, Clegg A, et al. Interventions for preventing delirium in hospitalised non-ICU patients. Cochrane Database Syst Rev. 2016;3:CD005563. https://doi.org/10.1002/14651858.CD005563.pub3
19. Inouye SK, Westendorp RG, Saczynski JS. Delirium in elderly people. Lancet. 2014;383(9920):911-922. https://doi.org/10.1016/S0140-6736(13)60688-1
20. Inouye SK, Charpentier PA. Precipitating factors for delirium in hospitalized elderly persons. Predictive model and interrelationship with baseline vulnerability. JAMA. 1996;275(11):852-857.
21. LaHue SC, Liu VX. Loud and clear: sensory impairment, delirium, and functional recovery in critical illness. Am J Respir Crit Care Med. 2016;194(3):252-253. https://doi.org/10.1164/rccm.201602-0372ED
22. Ritter SRF, Cardoso AF, Lins MMP, Zoccoli TLV, Freitas MPD, Camargos EF. Underdiagnosis of delirium in the elderly in acute care hospital settings: lessons not learned. Psychogeriatrics. 2018;18(4):268-275. https://doi.org/10.1111/psyg.12324
23. Douglas VC, Hessler CS, Dhaliwal G, et al. The AWOL tool: derivation and validation of a delirium prediction rule. J Hosp Med. 2013;8(9):493-499. https://doi.org/10.1002/jhm.2062
24. Tombaugh TN, McDowell I, Kristjansson B, Hubley AM. Mini-Mental State Examination (MMSE) and the modified MMSE (3MS): A psychometric comparison and normative data. Psychol Assessment. 1996;8(1):48-59. https://doi.org/10.1037/1040-3590.8.1.48
25. Young J, Murthy L, Westby M, Akunne A, O’Mahony R, Guideline Development Group. Diagnosis, prevention, and management of delirium: summary of NICE guidance. BMJ. 2010;341:c3704. https://doi.org/10.1136/bmj.c3704
26. Hargrave A, Bastiaens J, Bourgeois JA, et al. Validation of a nurse-based delirium-screening tool for hospitalized patients. Psychosomatics. 2017;58(6):594-603. https://doi.org/10.1016/j.psym.2017.05.005
27. Ely EW, Inouye SK, Bernard GR, et al. Delirium in mechanically ventilated patients: validity and reliability of the confusion assessment method for the intensive care unit (CAM-ICU). JAMA. 2001;286(21):2703-2710. https://doi.org/10.1001/jama.286.21.2703
28. Strijbos MJ, Steunenberg B, van der Mast RC, Inouye SK, Schuurmans MJ. Design and methods of the Hospital Elder Life Program (HELP), a multicomponent targeted intervention to prevent delirium in hospitalized older patients: efficacy and cost-effectiveness in Dutch health care. BMC Geriatr. 2013;13:78. https://doi.org/10.1186/1471-2318-13-78
29. Taheri PA, Butz DA, Greenfield LJ. Length of stay has minimal impact on the cost of hospital admission. J Am Coll Surg. 2000;191(2):123-130. https://doi.org/10.1016/s1072-7515(00)00352-5
30. Fong TG, Tulebaev SR, Inouye SK. Delirium in elderly adults: diagnosis, prevention and treatment. Nat Rev Neurol. 2009;5(4):210-220. https://doi.org/10.1038/nrneurol.2009.24
© 2021 Society of Hospital Medicine
Limitations of Using Pediatric Respiratory Illness Readmissions to Compare Hospital Performance
Respiratory illnesses are the leading causes of pediatric hospitalizations in the United States.1 The 30-day hospital readmission rate for respiratory illnesses is being considered for implementation as a national hospital performance measure, as it may be an indicator of lower quality care (eg, poor hospital management of disease, inadequate patient/caretaker education prior to discharge). In adult populations, readmissions can be used to reliably identify variation in hospital performance and successfully drive efforts to improve the value of care.2, 3 In contrast, there are persistent concerns about using pediatric readmissions to identify variation in hospital performance, largely due to lower patient volumes.4-7 To increase the value of pediatric hospital care, it is important to develop ways to meaningfully measure quality of care and further, to better understand the relationship between measures of quality and healthcare costs.
In December 2016, the National Quality Forum (NQF) endorsed a Pediatric Lower Respiratory Infection (LRI) Readmission Measure.8 This measure was developed by the Pediatric Quality Measurement Program, through the Agency for Healthcare Research and Quality. The goal of this program was to “increase the portfolio of evidence-based, consensus pediatric quality measures available to public and private purchasers of children’s healthcare services, providers, and consumers.”9
In anticipation of the national implementation of pediatric readmission measures, we examined whether the Pediatric LRI Readmission Measure could meaningfully identify high and low performers across all types of hospitals admitting children (general hospitals and children’s hospitals) using an all-payer claims database. A recent analysis by Nakamura et al. identified high and low performers using this measure10 but limited the analysis to hospitals with >50 pediatric LRI admissions per year, an approach that excludes many general hospitals. Since general hospitals provide the majority of care for children hospitalized with respiratory infections,11 we aimed to evaluate the measure in a broadly inclusive analysis that included all hospital types. Because low patient volumes might limit use of the measure,4,6 we tested several broadened variations of the measure. We also examined the relationship between hospital performance in pediatric LRI readmissions and healthcare costs.
Our analysis is intended to inform utilizers of pediatric quality metrics and policy makers about the feasibility of using these metrics to publicly report hospital performance and/or identify exceptional hospitals for understanding best practices in pediatric inpatient care.12
METHODS
Study Design and Data Source
We conducted an observational, retrospective cohort analysis using the 2012-2014 California Office of Statewide Health Planning and Development (OSHPD) nonpublic inpatient and emergency department databases.13 The OSHPD databases are compiled annually through mandatory reporting by all licensed nonfederal hospitals in California. The databases contain demographic (eg, age, gender) and utilization data (eg, charges) and can track readmissions to hospitals other than the index hospital. The databases capture administrative claims from approximately 450 hospitals, composed of 16 million inpatients, emergency department patients, and ambulatory surgery patients annually. Data quality is monitored through the California OSHPD.
Study Population
Our study included children aged ≤18 years with LRI, defined using the NQF Pediatric LRI Readmissions Measure: a primary diagnosis of bronchiolitis, influenza, or pneumonia, or a secondary diagnosis of bronchiolitis, influenza, or pneumonia, with a primary diagnosis of asthma, respiratory failure, sepsis, or bacteremia.8 International classification of Diseases, 9th edition (ICD-9) diagnostic codes used are in Appendix 1.
Per the NQF measure specifications,8 records were excluded if they were from hospitals with <80% of records complete with core elements (unique patient identifier, admission date, end-of-service date, and ICD-9 primary diagnosis code). In addition, records were excluded for the following reasons: (1) individual record missing core elements, (2) discharge disposition “death,” (3) 30-day follow-up data not available, (4) primary “newborn” or mental health diagnosis, or (5) primary ICD-9 procedure code for a planned procedure or chemotherapy.
Patient characteristics for hospital admissions with and without 30-day readmissions or 30-day emergency department (ED) revisits were summarized. For the continuous variable age, mean and standard deviation for each group were calculated. For categorical variables (sex, race, payer, and number of chronic conditions), numbers and proportions were determined. Univariate tests of comparison were carried out using the Student’s t test for age and chi-square tests for all categorical variables. Categories of payer with small values were combined for ease of description (categories combined into “other:” workers’ compensation, county indigent programs, other government, other indigent, self-pay, other payer). We identified chronic conditions using the Agency for Healthcare Research and Quality Chronic Condition Indicator (CCI) system, which classifies ICD-9-CM diagnosis codes as chronic or acute and places each code into 1 of 18 mutually exclusive categories (organ systems, disease categories, or other categories). The case-mix adjustment model incorporates a binary variable for each CCI category (0-1, 2, 3, or >4 chronic conditions) per the NQF measure specifications.8 This study was approved by the University of California, San Francisco Institutional Review Board.
Outcomes
Our primary outcome was the hospital-level rate of 30-day readmission after hospital discharge, consistent with the NQF measure.8 We identified outlier hospitals for 30-day readmission rate using the Centers for Medicare and Medicaid Services (CMS) methodology, which defines outlier hospitals as those for whom adjusted readmission rate confidence intervals do not overlap with the overall group mean rate.5, 14
We also determined the hospital-level average cost per index hospitalization (not including costs of readmissions). Since costs of care often differ substantially from charges,15 costs were calculated using cost-to-charge ratios for each hospital (annual total operating expenses/total gross patient revenue, as reported to the OSHPD).16 Costs were subdivided into categories representing $5,000 increments and a top category of >$40,000. Outlier hospitals for costs were defined as those for whom the cost random effect was either greater than the third quartile of the distribution of values by more than 1.5 times the interquartile range or less than the first quartile of the distribution of values by more than 1.5 times the interquartile range.17
ANALYSIS
Primary Analysis
For our primary analysis of 30-day hospital readmission rates, we used hierarchical logistic regression models with hospitals as random effects, adjusting for patient age, sex, and the presence and number of body systems affected by chronic conditions.8 These 4 patient characteristics were selected by the NQF measure developers “because distributions of these characteristics vary across hospitals, and although they are associated with readmission risk, they are independent of hospital quality of care.”10
Because the Centers for Medicare and Medicaid Services (CMS) are in the process of selecting pediatric quality measures for meaningful use reporting,18 we utilized CMS hospital readmissions methodology to calculate risk-adjusted rates and identify outlier hospitals. The CMS modeling strategy stabilizes performance estimates for low-volume hospitals and avoids penalizing these hospitals for high readmission rates that may be due to chance (random effects logistic model to obtain best linear unbiased predictions). This is particularly important in pediatrics, given the low pediatric volumes in many hospitals admitting children.4,19 We then identified outlier hospitals for the 30-day readmission rate using CMS methodology (hospital’s adjusted readmission rate confidence interval does not overlap the overall group mean rate).5, 4 CMS uses this approach for public reporting on HospitalCompare.20
Sensitivity Analyses
We tested several broadening variations of the NQF measure: (1) addition of children admitted with a primary diagnosis of asthma (without requiring LRI as a secondary diagnosis) or a secondary diagnosis of asthma exacerbation (LRIA), (2) inclusion of 30-day ED revisits as an outcome, and (3) merging of 3 years of data. These analyses were all performed using the same modeling strategy as in our primary analysis.
Secondary Outcome Analyses
Our analysis of hospital costs used costs for index admissions over 3 years (2012–2014) and included admissions for asthma. We used hierarchical regression models with hospitals as random effects, adjusting for age, gender, and the presence and number of chronic conditions. The distribution of cost values was highly skewed, so ordinal models were selected after several other modeling approaches failed (log transformation linear model, gamma model, Poisson model, zero-truncated Poisson model).
The relationship between hospital-level costs and hospital-level 30-day readmission or ED revisit rates was analyzed using Spearman’s rank correlation coefficient. Statistical analysis was performed using SAS version 9.4 software (SAS Institute; Cary, North Carolina).
RESULTS
Primary Analysis of 30-day Readmissions (per National Quality Forum Measure)
Our analysis of the 2014 OSHPD database using the specifications of the NQF Pediatric LRI Readmission Measure included a total of 5550 hospitalizations from 174 hospitals, with a mean of 12 eligible hospitalizations per hospital. The mean risk-adjusted readmission rate was 6.5% (362 readmissions). There were no hospitals that were considered outliers based on the risk-adjusted readmission rates (Table 1).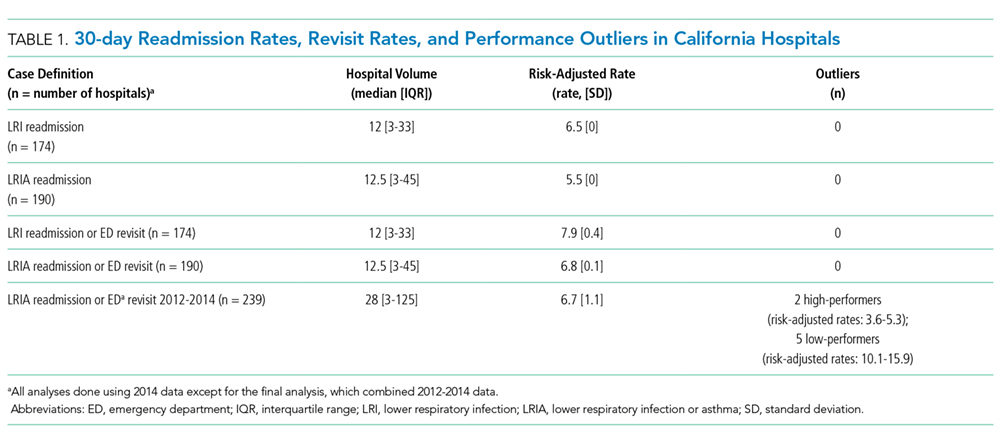
Sensitivity Analyses (Broadening Definitions of National Quality Forum Measure)
We report our testing of the broadened variations of the NQF measure in Table 1. Broadening the population to include children with asthma as a primary diagnosis and children with asthma exacerbations as a secondary diagnosis (LRIA) increased the size of our analysis to 8402 hospitalizations from 190 hospitals. The mean risk-adjusted readmission rate was 5.5%, and no outlier hospitals were identified.
Using the same inclusion criteria of the NQF measure but including 30-day ED revisits as an outcome, we analyzed a total of 5500 hospitalizations from 174 hospitals. The mean risk-adjusted event rate was higher at 7.9%, but there were still no outlier hospitals identified.
Using the broadened population definition (LRIA) and including 30-day ED revisits as an outcome, we analyzed a total of 8402 hospitalizations from 190 hospitals. The mean risk-adjusted event rate was 6.8%, but there were still no outlier hospitals identified.
In our final iteration, we merged 3 years of hospital data (2012-2014) using the broader population definition (LRIA) and including 30-day ED revisits as an outcome. This resulted in 27,873 admissions from 239 hospitals for this analysis, with a mean of 28 eligible hospitalizations per hospital. The mean risk-adjusted event rate was 6.7%, and this approach identified 2 high-performing (risk-adjusted rates: 3.6-5.3) and 7 low-performing hospitals (risk-adjusted rates: 10.1-15.9).
Table 2 presents the demographics of children included in this analysis. Children who had readmissions/revisits were younger, more likely to be white, less likely to have private insurance, and more likely to have a greater number of chronic conditions compared to children without readmissions/revisits.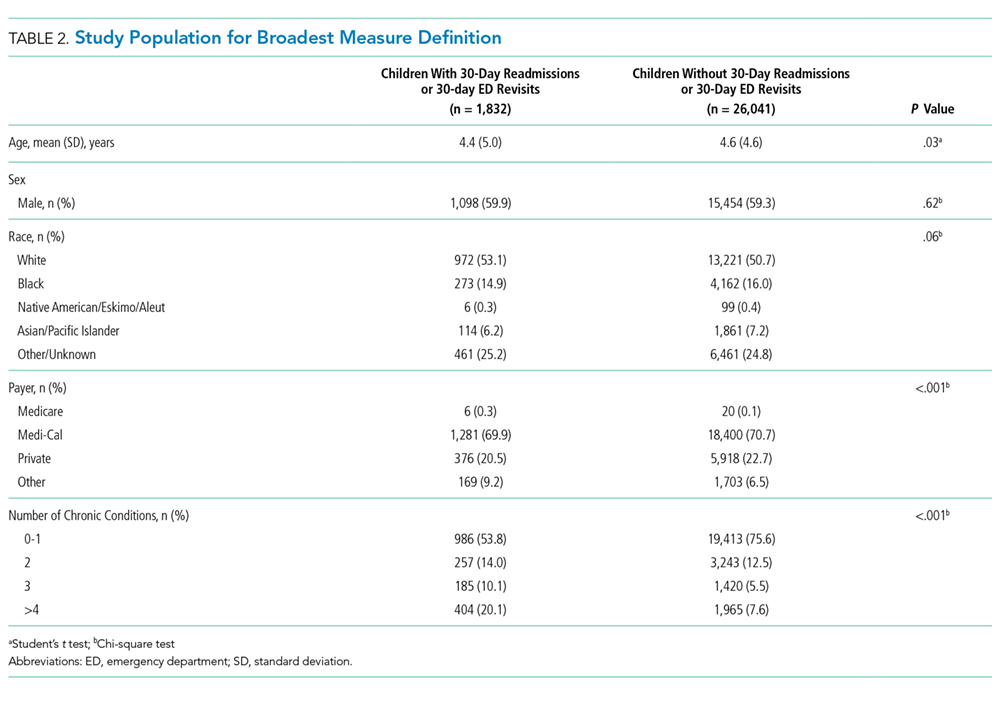
Secondary Outcome: Hospital Costs
In the analysis of hospital-level costs, we found only 1 outlier high-cost hospital. There was a 20% probability of a hospital respiratory admission costing ≥$40,000 at this hospital. We found no overall relationship between hospital 30-day respiratory readmission rate and hospital costs (Figure 1). However, the hospitals that were outliers for low readmission rates also had low probabilities of excessive hospital costs (3% probability of costs >$40,000; Figure 2).
DISCUSSION
We used a nationally endorsed pediatric quality measure to evaluate hospital performance, defined as 30-day readmission rates for children with respiratory illness. We examined all-payer data from California, which is the most populous state in the country and home to 1 in 8 American children. In this large California dataset, we were unable to identify meaningful variation in hospital performance due to low hospital volumes and event rates. However, when we broadened the measure definition, we were able to identify performance variation. Our findings underscore the importance of testing and potentially modifying existing quality measures in order to more accurately capture the quality of care delivered at hospitals with lower volumes of pediatric patients.21
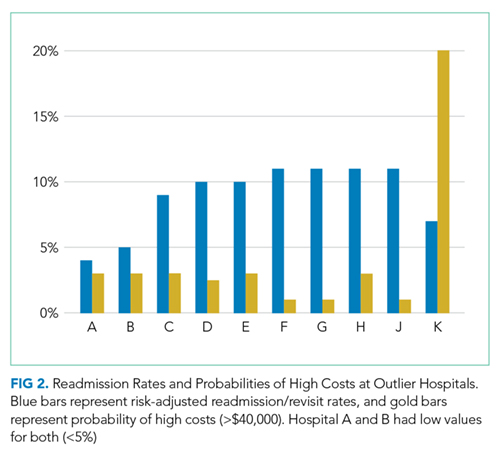
Our underlying assumption, in light of these prior studies, was that increasing the eligible sample in each hospital by combining respiratory diseases and by using an all-payer claims database rather than a Medicaid-only database would increase the number of detectable outlier hospitals. However, we found that these approaches did not ameliorate the limitations of small volumes. Only through aggregating data over 3 years was it possible to identify any outliers, and this approach identified only 3% of hospitals as outliers. Hence, our analysis reinforces concerns raised by several prior analyses4-7 regarding the limited ability of current pediatric readmission measures to detect meaningful, actionable differences in performance across all types of hospitals (including general/nonchildren’s hospitals). This issue is of particular concern for common pediatric conditions like respiratory illnesses, for which >70% of hospitalizations occur in general hospitals.11
Developers and utilizers of pediatric quality metrics should consider strategies for identifying meaningful, actionable variation in pediatric quality of care at general hospitals. These strategies might include our approach of combining several years of hospital data in order to reach adequate volumes for measuring performance. The potential downside to this approach is performance lag—specifically, hospitals implementing quality improvement readmissions programs may not see changes in their performance for a year or two on a measure aggregating 3 years of data. Alternatively, it is possible that the measure might be used more appropriately across a larger group of hospitals, either to assess performance for multihospital accountable care organization (ACO), or to assess performance for a service area or county. An aggregated group of hospitals would increase the eligible patient volume and, if there is an ACO relationship established, coordinated interventions could be implemented across the hospitals.
We examined the 30-day readmission rate because it is the current standard used by CMS and all NQF-endorsed readmission measures.22,23 Another potential approach is to analyze the 7- or 15-day readmission rate. However, these rates may be similarly limited in identifying hospital performance due to low volumes and event rates. An analysis by Wallace et al. of preventable readmissions to a tertiary children’s hospital found that, while many occurred within 7 days or 15 days, 27% occurred after 7 days and 22%, after 15.24 However, an analysis of several adult 30-day readmission measures used by CMS found that the contribution of hospital-level quality to the readmission rate (measured by intracluster correlation coefficient) reached a nadir at 7 days, which suggests that most readmissions after the seventh day postdischarge were explained by community- and household-level factors beyond hospitals’ control.22 Hence, though 7- or 15-day readmission rates may better represent preventable outcomes under the hospital’s control, the lower event rates and low hospital volumes likely similarly limit the feasibility of their use for performance measurement.
Pediatric quality measures are additionally intended to drive improvements in the value of pediatric care, defined as quality relative to costs.25 In order to better understand the relationship of hospital performance across both the domains of readmissions (quality) and costs, we examined hospital-level costs for care of pediatric respiratory illnesses. We found no overall relationship between hospital readmission rates and costs; however, we found 2 hospitals in California that had significantly lower readmission rates as well as low costs. Close examination of hospitals such as these, which demonstrate exceptional performance in quality and costs, may promote the discovery and dissemination of strategies to improve the value of pediatric care.12
Our study had several limitations. First, the OSHPD database lacked detailed clinical variables to correct for additional case-mix differences between hospitals. However, we used the approach of case-mix adjustment outlined by an NQF-endorsed national quality metric.8 Secondly, since our data were limited to a single state, analyses of other databases may have yielded different results. However, prior analyses using other multistate databases reported similar limitations,5,6 likely due to the limitations of patient volume that are generalizable to settings outside of California. In addition, our cost analysis was performed using cost-to-charge ratios that represent total annual expenses/revenue for the whole hospital.16 These ratios may not be reflective of the specific services provided for children in our analysis; however, service-specific costs were not available, and cost-to-charge ratios are commonly used to report costs.
CONCLUSION
The ability of a nationally-endorsed pediatric respiratory readmissions measure to meaningfully identify variation in hospital performance is limited. General hospitals, which provide the majority of pediatric care for common conditions such as LRI, likely cannot be accurately evaluated using national pediatric quality metrics as they are currently designed. Modifying measures in order to increase hospital-level pediatric patient volumes may facilitate more meaningful evaluation of the quality of pediatric care in general hospitals and identification of exceptional hospitals for understanding best practices in pediatric inpatient care.
Disclosures
Regina Lam consulted for Proximity Health doing market research during the course of developing this manuscript, but this work did not involve any content related to quality metrics, and this entity did not play any role in the development of this manuscript. The remaining authors have no conflicts of interest relevant to this article to disclose.
Funding
Supported by the Agency for Healthcare Research and Quality (K08 HS24592 to SVK and U18HS25297 to MDC and NSB) and the National Institute of Child Health and Human Development (K23HD065836 to NSB). The funding agency played no role in the study design; the collection, analysis, and interpretation of data; the writing of the report; or the decision to submit the manuscript for publication.
1. Agency for Healthcare Research and Quality. Overview of hospital stays for children in the United States. https://www.hcup-us.ahrq.gov/reports/statbriefs/sb187-Hospital-Stays-Children-2012.jsp. Accessed September 1, 2017; 2012. PubMed
2. Mendelson A, Kondo K, Damberg C, et al. The effects of pay-for-performance programs on health, health care use, and processes of care: A systematic review. Ann Intern Med. 2017;166(5):341-353. doi: 10.7326/M16-1881. PubMed
3. Zuckerman RB, Sheingold SH, Orav EJ, Ruhter J, Epstein AM. Readmissions, observation, and the hospital readmissions reduction program. N Engl J Med. 2016;374(16):1543-1551. doi: 10.1056/NEJMsa1513024. PubMed
4. Bardach NS, Chien AT, Dudley RA. Small numbers limit the use of the inpatient pediatric quality indicators for hospital comparison. Acad Pediatr. 2010;10(4):266-273. doi: 10.1016/j.acap.2010.04.025. PubMed
5. Bardach NS, Vittinghoff E, Asteria-Peñaloza R, et al. Measuring hospital quality using pediatric readmission and revisit rates. Pediatrics. 2013;132(3):429-436. doi: 10.1542/peds.2012-3527. PubMed
6. Berry JG, Zaslavsky AM, Toomey SL, et al. Recognizing differences in hospital quality performance for pediatric inpatient care. Pediatrics. 2015;136(2):251-262. doi: 10.1542/peds.2014-3131. PubMed
7. Hain PD, Gay JC, Berutti TW, Whitney GM, Wang W, Saville BR. Preventability of early readmissions at a children’s hospital. Pediatrics. 2013;131(1):e171-e181. doi: 10.1542/peds.2012-0820. PubMed
8. Agency for Healthcare Research and Quality. Pediatric lower respiratory infection readmission measure. https://www.ahrq.gov/sites/default/files/wysiwyg/policymakers/chipra/factsheets/chipra_1415-p008-2-ef.pdf. Accessed September 3, 2017.
9. Agency for Healthcare Research and Quality. CHIPRA Pediatric Quality Measures Program. https://archive.ahrq.gov/policymakers/chipra/pqmpback.html. Accessed October 10, 2017.
10. Nakamura MM, Zaslavsky AM, Toomey SL, et al. Pediatric readmissions After hospitalizations for lower respiratory infections. Pediatrics. 2017;140(2). doi: 10.1542/peds.2016-0938. PubMed
11. Leyenaar JK, Ralston SL, Shieh MS, Pekow PS, Mangione-Smith R, Lindenauer PK. Epidemiology of pediatric hospitalizations at general hospitals and freestanding children’s hospitals in the United States. J Hosp Med. 2016;11(11):743-749. doi: 10.1002/jhm.2624. PubMed
12. Bradley EH, Curry LA, Ramanadhan S, Rowe L, Nembhard IM, Krumholz HM. Research in action: using positive deviance to improve quality of health care. Implement Sci. 2009;4:25. doi: 10.1186/1748-5908-4-25. PubMed
13. California Office of Statewide Health Planning and Development. Data and reports. https://www.oshpd.ca.gov/HID/. Accessed September 3, 2017.
14. QualityNet. Measure methodology reports. https://www.qualitynet.org/dcs/ContentServer?c=Page&pagename=QnetPublic%2FPage%2FQnetTier4&cid=1219069855841. Accessed October 10, 2017.
15. Riley GF. Administrative and claims records as sources of health care cost data. Med Care. 2009;47(7 Suppl 1):S51-S55. doi: 10.1097/MLR.0b013e31819c95aa. PubMed
16. California Office of Statewide Health Planning and Development. Annual financial data. https://www.oshpd.ca.gov/HID/Hospital-Financial.asp. Accessed September 3, 2017.
17. Tukey J. Exploratory Data Analysis: Pearson; London, United Kingdom. 1977.
18. Centers for Medicare and Medicaid Services. Core measures. https://www.cms.gov/Medicare/Quality-Initiatives-Patient-Assessment-Instruments/QualityMeasures/Core-Measures.html. Accessed September 1, 2017.
19. Berry JG, Toomey SL, Zaslavsky AM, et al. Pediatric readmission prevalence and variability across hospitals. JAMA. 2013;309(4):372-380. doi: 10.1001/jama.2012.188351. PubMed
20. Centers for Medicare and Medicaid Services. HospitalCompare. https://www.medicare.gov/hospitalcompare/search.html. Accessed on October 10, 2017.
21. Mangione-Smith R. The challenges of addressing pediatric quality measurement gaps. Pediatrics. 2017;139(4). doi: 10.1542/peds.2017-0174. PubMed
22. Chin DL, Bang H, Manickam RN, Romano PS. Rethinking thirty-day hospital readmissions: shorter intervals might be better indicators of quality of care. Health Aff (Millwood). 2016;35(10):1867-1875. doi: 10.1377/hlthaff.2016.0205. PubMed
23. National Quality Forum. Measures, reports, and tools. http://www.qualityforum.org/Measures_Reports_Tools.aspx. Accessed March 1, 2018.
24. Wallace SS, Keller SL, Falco CN, et al. An examination of physician-, caregiver-, and disease-related factors associated With readmission From a pediatric hospital medicine service. Hosp Pediatr. 2015;5(11):566-573. doi: 10.1542/hpeds.2015-0015. PubMed
25. Porter ME. What is value in health care? N Engl J Med. 2010;363(26):2477-2481. doi: 10.1056/NEJMp1011024. PubMed
Respiratory illnesses are the leading causes of pediatric hospitalizations in the United States.1 The 30-day hospital readmission rate for respiratory illnesses is being considered for implementation as a national hospital performance measure, as it may be an indicator of lower quality care (eg, poor hospital management of disease, inadequate patient/caretaker education prior to discharge). In adult populations, readmissions can be used to reliably identify variation in hospital performance and successfully drive efforts to improve the value of care.2, 3 In contrast, there are persistent concerns about using pediatric readmissions to identify variation in hospital performance, largely due to lower patient volumes.4-7 To increase the value of pediatric hospital care, it is important to develop ways to meaningfully measure quality of care and further, to better understand the relationship between measures of quality and healthcare costs.
In December 2016, the National Quality Forum (NQF) endorsed a Pediatric Lower Respiratory Infection (LRI) Readmission Measure.8 This measure was developed by the Pediatric Quality Measurement Program, through the Agency for Healthcare Research and Quality. The goal of this program was to “increase the portfolio of evidence-based, consensus pediatric quality measures available to public and private purchasers of children’s healthcare services, providers, and consumers.”9
In anticipation of the national implementation of pediatric readmission measures, we examined whether the Pediatric LRI Readmission Measure could meaningfully identify high and low performers across all types of hospitals admitting children (general hospitals and children’s hospitals) using an all-payer claims database. A recent analysis by Nakamura et al. identified high and low performers using this measure10 but limited the analysis to hospitals with >50 pediatric LRI admissions per year, an approach that excludes many general hospitals. Since general hospitals provide the majority of care for children hospitalized with respiratory infections,11 we aimed to evaluate the measure in a broadly inclusive analysis that included all hospital types. Because low patient volumes might limit use of the measure,4,6 we tested several broadened variations of the measure. We also examined the relationship between hospital performance in pediatric LRI readmissions and healthcare costs.
Our analysis is intended to inform utilizers of pediatric quality metrics and policy makers about the feasibility of using these metrics to publicly report hospital performance and/or identify exceptional hospitals for understanding best practices in pediatric inpatient care.12
METHODS
Study Design and Data Source
We conducted an observational, retrospective cohort analysis using the 2012-2014 California Office of Statewide Health Planning and Development (OSHPD) nonpublic inpatient and emergency department databases.13 The OSHPD databases are compiled annually through mandatory reporting by all licensed nonfederal hospitals in California. The databases contain demographic (eg, age, gender) and utilization data (eg, charges) and can track readmissions to hospitals other than the index hospital. The databases capture administrative claims from approximately 450 hospitals, composed of 16 million inpatients, emergency department patients, and ambulatory surgery patients annually. Data quality is monitored through the California OSHPD.
Study Population
Our study included children aged ≤18 years with LRI, defined using the NQF Pediatric LRI Readmissions Measure: a primary diagnosis of bronchiolitis, influenza, or pneumonia, or a secondary diagnosis of bronchiolitis, influenza, or pneumonia, with a primary diagnosis of asthma, respiratory failure, sepsis, or bacteremia.8 International classification of Diseases, 9th edition (ICD-9) diagnostic codes used are in Appendix 1.
Per the NQF measure specifications,8 records were excluded if they were from hospitals with <80% of records complete with core elements (unique patient identifier, admission date, end-of-service date, and ICD-9 primary diagnosis code). In addition, records were excluded for the following reasons: (1) individual record missing core elements, (2) discharge disposition “death,” (3) 30-day follow-up data not available, (4) primary “newborn” or mental health diagnosis, or (5) primary ICD-9 procedure code for a planned procedure or chemotherapy.
Patient characteristics for hospital admissions with and without 30-day readmissions or 30-day emergency department (ED) revisits were summarized. For the continuous variable age, mean and standard deviation for each group were calculated. For categorical variables (sex, race, payer, and number of chronic conditions), numbers and proportions were determined. Univariate tests of comparison were carried out using the Student’s t test for age and chi-square tests for all categorical variables. Categories of payer with small values were combined for ease of description (categories combined into “other:” workers’ compensation, county indigent programs, other government, other indigent, self-pay, other payer). We identified chronic conditions using the Agency for Healthcare Research and Quality Chronic Condition Indicator (CCI) system, which classifies ICD-9-CM diagnosis codes as chronic or acute and places each code into 1 of 18 mutually exclusive categories (organ systems, disease categories, or other categories). The case-mix adjustment model incorporates a binary variable for each CCI category (0-1, 2, 3, or >4 chronic conditions) per the NQF measure specifications.8 This study was approved by the University of California, San Francisco Institutional Review Board.
Outcomes
Our primary outcome was the hospital-level rate of 30-day readmission after hospital discharge, consistent with the NQF measure.8 We identified outlier hospitals for 30-day readmission rate using the Centers for Medicare and Medicaid Services (CMS) methodology, which defines outlier hospitals as those for whom adjusted readmission rate confidence intervals do not overlap with the overall group mean rate.5, 14
We also determined the hospital-level average cost per index hospitalization (not including costs of readmissions). Since costs of care often differ substantially from charges,15 costs were calculated using cost-to-charge ratios for each hospital (annual total operating expenses/total gross patient revenue, as reported to the OSHPD).16 Costs were subdivided into categories representing $5,000 increments and a top category of >$40,000. Outlier hospitals for costs were defined as those for whom the cost random effect was either greater than the third quartile of the distribution of values by more than 1.5 times the interquartile range or less than the first quartile of the distribution of values by more than 1.5 times the interquartile range.17
ANALYSIS
Primary Analysis
For our primary analysis of 30-day hospital readmission rates, we used hierarchical logistic regression models with hospitals as random effects, adjusting for patient age, sex, and the presence and number of body systems affected by chronic conditions.8 These 4 patient characteristics were selected by the NQF measure developers “because distributions of these characteristics vary across hospitals, and although they are associated with readmission risk, they are independent of hospital quality of care.”10
Because the Centers for Medicare and Medicaid Services (CMS) are in the process of selecting pediatric quality measures for meaningful use reporting,18 we utilized CMS hospital readmissions methodology to calculate risk-adjusted rates and identify outlier hospitals. The CMS modeling strategy stabilizes performance estimates for low-volume hospitals and avoids penalizing these hospitals for high readmission rates that may be due to chance (random effects logistic model to obtain best linear unbiased predictions). This is particularly important in pediatrics, given the low pediatric volumes in many hospitals admitting children.4,19 We then identified outlier hospitals for the 30-day readmission rate using CMS methodology (hospital’s adjusted readmission rate confidence interval does not overlap the overall group mean rate).5, 4 CMS uses this approach for public reporting on HospitalCompare.20
Sensitivity Analyses
We tested several broadening variations of the NQF measure: (1) addition of children admitted with a primary diagnosis of asthma (without requiring LRI as a secondary diagnosis) or a secondary diagnosis of asthma exacerbation (LRIA), (2) inclusion of 30-day ED revisits as an outcome, and (3) merging of 3 years of data. These analyses were all performed using the same modeling strategy as in our primary analysis.
Secondary Outcome Analyses
Our analysis of hospital costs used costs for index admissions over 3 years (2012–2014) and included admissions for asthma. We used hierarchical regression models with hospitals as random effects, adjusting for age, gender, and the presence and number of chronic conditions. The distribution of cost values was highly skewed, so ordinal models were selected after several other modeling approaches failed (log transformation linear model, gamma model, Poisson model, zero-truncated Poisson model).
The relationship between hospital-level costs and hospital-level 30-day readmission or ED revisit rates was analyzed using Spearman’s rank correlation coefficient. Statistical analysis was performed using SAS version 9.4 software (SAS Institute; Cary, North Carolina).
RESULTS
Primary Analysis of 30-day Readmissions (per National Quality Forum Measure)
Our analysis of the 2014 OSHPD database using the specifications of the NQF Pediatric LRI Readmission Measure included a total of 5550 hospitalizations from 174 hospitals, with a mean of 12 eligible hospitalizations per hospital. The mean risk-adjusted readmission rate was 6.5% (362 readmissions). There were no hospitals that were considered outliers based on the risk-adjusted readmission rates (Table 1).
Sensitivity Analyses (Broadening Definitions of National Quality Forum Measure)
We report our testing of the broadened variations of the NQF measure in Table 1. Broadening the population to include children with asthma as a primary diagnosis and children with asthma exacerbations as a secondary diagnosis (LRIA) increased the size of our analysis to 8402 hospitalizations from 190 hospitals. The mean risk-adjusted readmission rate was 5.5%, and no outlier hospitals were identified.
Using the same inclusion criteria of the NQF measure but including 30-day ED revisits as an outcome, we analyzed a total of 5500 hospitalizations from 174 hospitals. The mean risk-adjusted event rate was higher at 7.9%, but there were still no outlier hospitals identified.
Using the broadened population definition (LRIA) and including 30-day ED revisits as an outcome, we analyzed a total of 8402 hospitalizations from 190 hospitals. The mean risk-adjusted event rate was 6.8%, but there were still no outlier hospitals identified.
In our final iteration, we merged 3 years of hospital data (2012-2014) using the broader population definition (LRIA) and including 30-day ED revisits as an outcome. This resulted in 27,873 admissions from 239 hospitals for this analysis, with a mean of 28 eligible hospitalizations per hospital. The mean risk-adjusted event rate was 6.7%, and this approach identified 2 high-performing (risk-adjusted rates: 3.6-5.3) and 7 low-performing hospitals (risk-adjusted rates: 10.1-15.9).
Table 2 presents the demographics of children included in this analysis. Children who had readmissions/revisits were younger, more likely to be white, less likely to have private insurance, and more likely to have a greater number of chronic conditions compared to children without readmissions/revisits.
Secondary Outcome: Hospital Costs
In the analysis of hospital-level costs, we found only 1 outlier high-cost hospital. There was a 20% probability of a hospital respiratory admission costing ≥$40,000 at this hospital. We found no overall relationship between hospital 30-day respiratory readmission rate and hospital costs (Figure 1). However, the hospitals that were outliers for low readmission rates also had low probabilities of excessive hospital costs (3% probability of costs >$40,000; Figure 2).
DISCUSSION
We used a nationally endorsed pediatric quality measure to evaluate hospital performance, defined as 30-day readmission rates for children with respiratory illness. We examined all-payer data from California, which is the most populous state in the country and home to 1 in 8 American children. In this large California dataset, we were unable to identify meaningful variation in hospital performance due to low hospital volumes and event rates. However, when we broadened the measure definition, we were able to identify performance variation. Our findings underscore the importance of testing and potentially modifying existing quality measures in order to more accurately capture the quality of care delivered at hospitals with lower volumes of pediatric patients.21
Our underlying assumption, in light of these prior studies, was that increasing the eligible sample in each hospital by combining respiratory diseases and by using an all-payer claims database rather than a Medicaid-only database would increase the number of detectable outlier hospitals. However, we found that these approaches did not ameliorate the limitations of small volumes. Only through aggregating data over 3 years was it possible to identify any outliers, and this approach identified only 3% of hospitals as outliers. Hence, our analysis reinforces concerns raised by several prior analyses4-7 regarding the limited ability of current pediatric readmission measures to detect meaningful, actionable differences in performance across all types of hospitals (including general/nonchildren’s hospitals). This issue is of particular concern for common pediatric conditions like respiratory illnesses, for which >70% of hospitalizations occur in general hospitals.11
Developers and utilizers of pediatric quality metrics should consider strategies for identifying meaningful, actionable variation in pediatric quality of care at general hospitals. These strategies might include our approach of combining several years of hospital data in order to reach adequate volumes for measuring performance. The potential downside to this approach is performance lag—specifically, hospitals implementing quality improvement readmissions programs may not see changes in their performance for a year or two on a measure aggregating 3 years of data. Alternatively, it is possible that the measure might be used more appropriately across a larger group of hospitals, either to assess performance for multihospital accountable care organization (ACO), or to assess performance for a service area or county. An aggregated group of hospitals would increase the eligible patient volume and, if there is an ACO relationship established, coordinated interventions could be implemented across the hospitals.
We examined the 30-day readmission rate because it is the current standard used by CMS and all NQF-endorsed readmission measures.22,23 Another potential approach is to analyze the 7- or 15-day readmission rate. However, these rates may be similarly limited in identifying hospital performance due to low volumes and event rates. An analysis by Wallace et al. of preventable readmissions to a tertiary children’s hospital found that, while many occurred within 7 days or 15 days, 27% occurred after 7 days and 22%, after 15.24 However, an analysis of several adult 30-day readmission measures used by CMS found that the contribution of hospital-level quality to the readmission rate (measured by intracluster correlation coefficient) reached a nadir at 7 days, which suggests that most readmissions after the seventh day postdischarge were explained by community- and household-level factors beyond hospitals’ control.22 Hence, though 7- or 15-day readmission rates may better represent preventable outcomes under the hospital’s control, the lower event rates and low hospital volumes likely similarly limit the feasibility of their use for performance measurement.
Pediatric quality measures are additionally intended to drive improvements in the value of pediatric care, defined as quality relative to costs.25 In order to better understand the relationship of hospital performance across both the domains of readmissions (quality) and costs, we examined hospital-level costs for care of pediatric respiratory illnesses. We found no overall relationship between hospital readmission rates and costs; however, we found 2 hospitals in California that had significantly lower readmission rates as well as low costs. Close examination of hospitals such as these, which demonstrate exceptional performance in quality and costs, may promote the discovery and dissemination of strategies to improve the value of pediatric care.12
Our study had several limitations. First, the OSHPD database lacked detailed clinical variables to correct for additional case-mix differences between hospitals. However, we used the approach of case-mix adjustment outlined by an NQF-endorsed national quality metric.8 Secondly, since our data were limited to a single state, analyses of other databases may have yielded different results. However, prior analyses using other multistate databases reported similar limitations,5,6 likely due to the limitations of patient volume that are generalizable to settings outside of California. In addition, our cost analysis was performed using cost-to-charge ratios that represent total annual expenses/revenue for the whole hospital.16 These ratios may not be reflective of the specific services provided for children in our analysis; however, service-specific costs were not available, and cost-to-charge ratios are commonly used to report costs.
CONCLUSION
The ability of a nationally-endorsed pediatric respiratory readmissions measure to meaningfully identify variation in hospital performance is limited. General hospitals, which provide the majority of pediatric care for common conditions such as LRI, likely cannot be accurately evaluated using national pediatric quality metrics as they are currently designed. Modifying measures in order to increase hospital-level pediatric patient volumes may facilitate more meaningful evaluation of the quality of pediatric care in general hospitals and identification of exceptional hospitals for understanding best practices in pediatric inpatient care.
Disclosures
Regina Lam consulted for Proximity Health doing market research during the course of developing this manuscript, but this work did not involve any content related to quality metrics, and this entity did not play any role in the development of this manuscript. The remaining authors have no conflicts of interest relevant to this article to disclose.
Funding
Supported by the Agency for Healthcare Research and Quality (K08 HS24592 to SVK and U18HS25297 to MDC and NSB) and the National Institute of Child Health and Human Development (K23HD065836 to NSB). The funding agency played no role in the study design; the collection, analysis, and interpretation of data; the writing of the report; or the decision to submit the manuscript for publication.
1. Agency for Healthcare Research and Quality. Overview of hospital stays for children in the United States. https://www.hcup-us.ahrq.gov/reports/statbriefs/sb187-Hospital-Stays-Children-2012.jsp. Accessed September 1, 2017; 2012. PubMed
2. Mendelson A, Kondo K, Damberg C, et al. The effects of pay-for-performance programs on health, health care use, and processes of care: A systematic review. Ann Intern Med. 2017;166(5):341-353. doi: 10.7326/M16-1881. PubMed
3. Zuckerman RB, Sheingold SH, Orav EJ, Ruhter J, Epstein AM. Readmissions, observation, and the hospital readmissions reduction program. N Engl J Med. 2016;374(16):1543-1551. doi: 10.1056/NEJMsa1513024. PubMed
4. Bardach NS, Chien AT, Dudley RA. Small numbers limit the use of the inpatient pediatric quality indicators for hospital comparison. Acad Pediatr. 2010;10(4):266-273. doi: 10.1016/j.acap.2010.04.025. PubMed
5. Bardach NS, Vittinghoff E, Asteria-Peñaloza R, et al. Measuring hospital quality using pediatric readmission and revisit rates. Pediatrics. 2013;132(3):429-436. doi: 10.1542/peds.2012-3527. PubMed
6. Berry JG, Zaslavsky AM, Toomey SL, et al. Recognizing differences in hospital quality performance for pediatric inpatient care. Pediatrics. 2015;136(2):251-262. doi: 10.1542/peds.2014-3131. PubMed
7. Hain PD, Gay JC, Berutti TW, Whitney GM, Wang W, Saville BR. Preventability of early readmissions at a children’s hospital. Pediatrics. 2013;131(1):e171-e181. doi: 10.1542/peds.2012-0820. PubMed
8. Agency for Healthcare Research and Quality. Pediatric lower respiratory infection readmission measure. https://www.ahrq.gov/sites/default/files/wysiwyg/policymakers/chipra/factsheets/chipra_1415-p008-2-ef.pdf. Accessed September 3, 2017.
9. Agency for Healthcare Research and Quality. CHIPRA Pediatric Quality Measures Program. https://archive.ahrq.gov/policymakers/chipra/pqmpback.html. Accessed October 10, 2017.
10. Nakamura MM, Zaslavsky AM, Toomey SL, et al. Pediatric readmissions After hospitalizations for lower respiratory infections. Pediatrics. 2017;140(2). doi: 10.1542/peds.2016-0938. PubMed
11. Leyenaar JK, Ralston SL, Shieh MS, Pekow PS, Mangione-Smith R, Lindenauer PK. Epidemiology of pediatric hospitalizations at general hospitals and freestanding children’s hospitals in the United States. J Hosp Med. 2016;11(11):743-749. doi: 10.1002/jhm.2624. PubMed
12. Bradley EH, Curry LA, Ramanadhan S, Rowe L, Nembhard IM, Krumholz HM. Research in action: using positive deviance to improve quality of health care. Implement Sci. 2009;4:25. doi: 10.1186/1748-5908-4-25. PubMed
13. California Office of Statewide Health Planning and Development. Data and reports. https://www.oshpd.ca.gov/HID/. Accessed September 3, 2017.
14. QualityNet. Measure methodology reports. https://www.qualitynet.org/dcs/ContentServer?c=Page&pagename=QnetPublic%2FPage%2FQnetTier4&cid=1219069855841. Accessed October 10, 2017.
15. Riley GF. Administrative and claims records as sources of health care cost data. Med Care. 2009;47(7 Suppl 1):S51-S55. doi: 10.1097/MLR.0b013e31819c95aa. PubMed
16. California Office of Statewide Health Planning and Development. Annual financial data. https://www.oshpd.ca.gov/HID/Hospital-Financial.asp. Accessed September 3, 2017.
17. Tukey J. Exploratory Data Analysis: Pearson; London, United Kingdom. 1977.
18. Centers for Medicare and Medicaid Services. Core measures. https://www.cms.gov/Medicare/Quality-Initiatives-Patient-Assessment-Instruments/QualityMeasures/Core-Measures.html. Accessed September 1, 2017.
19. Berry JG, Toomey SL, Zaslavsky AM, et al. Pediatric readmission prevalence and variability across hospitals. JAMA. 2013;309(4):372-380. doi: 10.1001/jama.2012.188351. PubMed
20. Centers for Medicare and Medicaid Services. HospitalCompare. https://www.medicare.gov/hospitalcompare/search.html. Accessed on October 10, 2017.
21. Mangione-Smith R. The challenges of addressing pediatric quality measurement gaps. Pediatrics. 2017;139(4). doi: 10.1542/peds.2017-0174. PubMed
22. Chin DL, Bang H, Manickam RN, Romano PS. Rethinking thirty-day hospital readmissions: shorter intervals might be better indicators of quality of care. Health Aff (Millwood). 2016;35(10):1867-1875. doi: 10.1377/hlthaff.2016.0205. PubMed
23. National Quality Forum. Measures, reports, and tools. http://www.qualityforum.org/Measures_Reports_Tools.aspx. Accessed March 1, 2018.
24. Wallace SS, Keller SL, Falco CN, et al. An examination of physician-, caregiver-, and disease-related factors associated With readmission From a pediatric hospital medicine service. Hosp Pediatr. 2015;5(11):566-573. doi: 10.1542/hpeds.2015-0015. PubMed
25. Porter ME. What is value in health care? N Engl J Med. 2010;363(26):2477-2481. doi: 10.1056/NEJMp1011024. PubMed
© 2018 Society of Hospital Medicine