User login
Limitations of Using Pediatric Respiratory Illness Readmissions to Compare Hospital Performance
Respiratory illnesses are the leading causes of pediatric hospitalizations in the United States.1 The 30-day hospital readmission rate for respiratory illnesses is being considered for implementation as a national hospital performance measure, as it may be an indicator of lower quality care (eg, poor hospital management of disease, inadequate patient/caretaker education prior to discharge). In adult populations, readmissions can be used to reliably identify variation in hospital performance and successfully drive efforts to improve the value of care.2, 3 In contrast, there are persistent concerns about using pediatric readmissions to identify variation in hospital performance, largely due to lower patient volumes.4-7 To increase the value of pediatric hospital care, it is important to develop ways to meaningfully measure quality of care and further, to better understand the relationship between measures of quality and healthcare costs.
In December 2016, the National Quality Forum (NQF) endorsed a Pediatric Lower Respiratory Infection (LRI) Readmission Measure.8 This measure was developed by the Pediatric Quality Measurement Program, through the Agency for Healthcare Research and Quality. The goal of this program was to “increase the portfolio of evidence-based, consensus pediatric quality measures available to public and private purchasers of children’s healthcare services, providers, and consumers.”9
In anticipation of the national implementation of pediatric readmission measures, we examined whether the Pediatric LRI Readmission Measure could meaningfully identify high and low performers across all types of hospitals admitting children (general hospitals and children’s hospitals) using an all-payer claims database. A recent analysis by Nakamura et al. identified high and low performers using this measure10 but limited the analysis to hospitals with >50 pediatric LRI admissions per year, an approach that excludes many general hospitals. Since general hospitals provide the majority of care for children hospitalized with respiratory infections,11 we aimed to evaluate the measure in a broadly inclusive analysis that included all hospital types. Because low patient volumes might limit use of the measure,4,6 we tested several broadened variations of the measure. We also examined the relationship between hospital performance in pediatric LRI readmissions and healthcare costs.
Our analysis is intended to inform utilizers of pediatric quality metrics and policy makers about the feasibility of using these metrics to publicly report hospital performance and/or identify exceptional hospitals for understanding best practices in pediatric inpatient care.12
METHODS
Study Design and Data Source
We conducted an observational, retrospective cohort analysis using the 2012-2014 California Office of Statewide Health Planning and Development (OSHPD) nonpublic inpatient and emergency department databases.13 The OSHPD databases are compiled annually through mandatory reporting by all licensed nonfederal hospitals in California. The databases contain demographic (eg, age, gender) and utilization data (eg, charges) and can track readmissions to hospitals other than the index hospital. The databases capture administrative claims from approximately 450 hospitals, composed of 16 million inpatients, emergency department patients, and ambulatory surgery patients annually. Data quality is monitored through the California OSHPD.
Study Population
Our study included children aged ≤18 years with LRI, defined using the NQF Pediatric LRI Readmissions Measure: a primary diagnosis of bronchiolitis, influenza, or pneumonia, or a secondary diagnosis of bronchiolitis, influenza, or pneumonia, with a primary diagnosis of asthma, respiratory failure, sepsis, or bacteremia.8 International classification of Diseases, 9th edition (ICD-9) diagnostic codes used are in Appendix 1.
Per the NQF measure specifications,8 records were excluded if they were from hospitals with <80% of records complete with core elements (unique patient identifier, admission date, end-of-service date, and ICD-9 primary diagnosis code). In addition, records were excluded for the following reasons: (1) individual record missing core elements, (2) discharge disposition “death,” (3) 30-day follow-up data not available, (4) primary “newborn” or mental health diagnosis, or (5) primary ICD-9 procedure code for a planned procedure or chemotherapy.
Patient characteristics for hospital admissions with and without 30-day readmissions or 30-day emergency department (ED) revisits were summarized. For the continuous variable age, mean and standard deviation for each group were calculated. For categorical variables (sex, race, payer, and number of chronic conditions), numbers and proportions were determined. Univariate tests of comparison were carried out using the Student’s t test for age and chi-square tests for all categorical variables. Categories of payer with small values were combined for ease of description (categories combined into “other:” workers’ compensation, county indigent programs, other government, other indigent, self-pay, other payer). We identified chronic conditions using the Agency for Healthcare Research and Quality Chronic Condition Indicator (CCI) system, which classifies ICD-9-CM diagnosis codes as chronic or acute and places each code into 1 of 18 mutually exclusive categories (organ systems, disease categories, or other categories). The case-mix adjustment model incorporates a binary variable for each CCI category (0-1, 2, 3, or >4 chronic conditions) per the NQF measure specifications.8 This study was approved by the University of California, San Francisco Institutional Review Board.
Outcomes
Our primary outcome was the hospital-level rate of 30-day readmission after hospital discharge, consistent with the NQF measure.8 We identified outlier hospitals for 30-day readmission rate using the Centers for Medicare and Medicaid Services (CMS) methodology, which defines outlier hospitals as those for whom adjusted readmission rate confidence intervals do not overlap with the overall group mean rate.5, 14
We also determined the hospital-level average cost per index hospitalization (not including costs of readmissions). Since costs of care often differ substantially from charges,15 costs were calculated using cost-to-charge ratios for each hospital (annual total operating expenses/total gross patient revenue, as reported to the OSHPD).16 Costs were subdivided into categories representing $5,000 increments and a top category of >$40,000. Outlier hospitals for costs were defined as those for whom the cost random effect was either greater than the third quartile of the distribution of values by more than 1.5 times the interquartile range or less than the first quartile of the distribution of values by more than 1.5 times the interquartile range.17
ANALYSIS
Primary Analysis
For our primary analysis of 30-day hospital readmission rates, we used hierarchical logistic regression models with hospitals as random effects, adjusting for patient age, sex, and the presence and number of body systems affected by chronic conditions.8 These 4 patient characteristics were selected by the NQF measure developers “because distributions of these characteristics vary across hospitals, and although they are associated with readmission risk, they are independent of hospital quality of care.”10
Because the Centers for Medicare and Medicaid Services (CMS) are in the process of selecting pediatric quality measures for meaningful use reporting,18 we utilized CMS hospital readmissions methodology to calculate risk-adjusted rates and identify outlier hospitals. The CMS modeling strategy stabilizes performance estimates for low-volume hospitals and avoids penalizing these hospitals for high readmission rates that may be due to chance (random effects logistic model to obtain best linear unbiased predictions). This is particularly important in pediatrics, given the low pediatric volumes in many hospitals admitting children.4,19 We then identified outlier hospitals for the 30-day readmission rate using CMS methodology (hospital’s adjusted readmission rate confidence interval does not overlap the overall group mean rate).5, 4 CMS uses this approach for public reporting on HospitalCompare.20
Sensitivity Analyses
We tested several broadening variations of the NQF measure: (1) addition of children admitted with a primary diagnosis of asthma (without requiring LRI as a secondary diagnosis) or a secondary diagnosis of asthma exacerbation (LRIA), (2) inclusion of 30-day ED revisits as an outcome, and (3) merging of 3 years of data. These analyses were all performed using the same modeling strategy as in our primary analysis.
Secondary Outcome Analyses
Our analysis of hospital costs used costs for index admissions over 3 years (2012–2014) and included admissions for asthma. We used hierarchical regression models with hospitals as random effects, adjusting for age, gender, and the presence and number of chronic conditions. The distribution of cost values was highly skewed, so ordinal models were selected after several other modeling approaches failed (log transformation linear model, gamma model, Poisson model, zero-truncated Poisson model).
The relationship between hospital-level costs and hospital-level 30-day readmission or ED revisit rates was analyzed using Spearman’s rank correlation coefficient. Statistical analysis was performed using SAS version 9.4 software (SAS Institute; Cary, North Carolina).
RESULTS
Primary Analysis of 30-day Readmissions (per National Quality Forum Measure)
Our analysis of the 2014 OSHPD database using the specifications of the NQF Pediatric LRI Readmission Measure included a total of 5550 hospitalizations from 174 hospitals, with a mean of 12 eligible hospitalizations per hospital. The mean risk-adjusted readmission rate was 6.5% (362 readmissions). There were no hospitals that were considered outliers based on the risk-adjusted readmission rates (Table 1).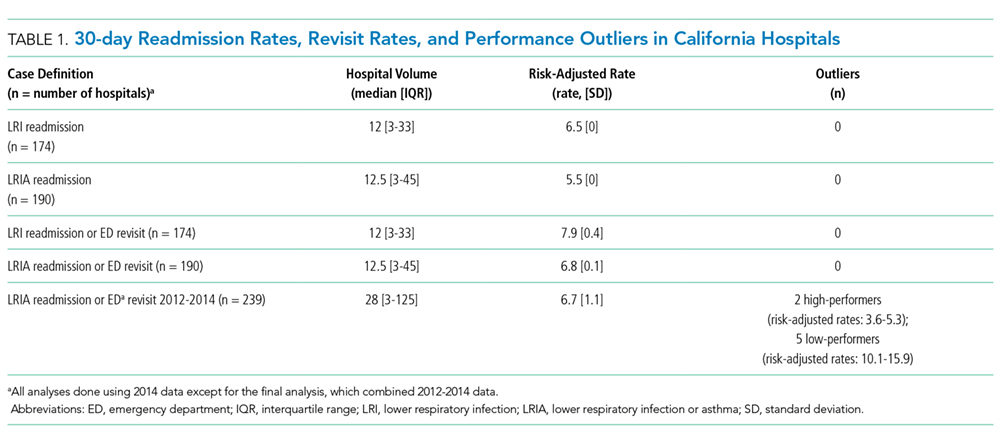
Sensitivity Analyses (Broadening Definitions of National Quality Forum Measure)
We report our testing of the broadened variations of the NQF measure in Table 1. Broadening the population to include children with asthma as a primary diagnosis and children with asthma exacerbations as a secondary diagnosis (LRIA) increased the size of our analysis to 8402 hospitalizations from 190 hospitals. The mean risk-adjusted readmission rate was 5.5%, and no outlier hospitals were identified.
Using the same inclusion criteria of the NQF measure but including 30-day ED revisits as an outcome, we analyzed a total of 5500 hospitalizations from 174 hospitals. The mean risk-adjusted event rate was higher at 7.9%, but there were still no outlier hospitals identified.
Using the broadened population definition (LRIA) and including 30-day ED revisits as an outcome, we analyzed a total of 8402 hospitalizations from 190 hospitals. The mean risk-adjusted event rate was 6.8%, but there were still no outlier hospitals identified.
In our final iteration, we merged 3 years of hospital data (2012-2014) using the broader population definition (LRIA) and including 30-day ED revisits as an outcome. This resulted in 27,873 admissions from 239 hospitals for this analysis, with a mean of 28 eligible hospitalizations per hospital. The mean risk-adjusted event rate was 6.7%, and this approach identified 2 high-performing (risk-adjusted rates: 3.6-5.3) and 7 low-performing hospitals (risk-adjusted rates: 10.1-15.9).
Table 2 presents the demographics of children included in this analysis. Children who had readmissions/revisits were younger, more likely to be white, less likely to have private insurance, and more likely to have a greater number of chronic conditions compared to children without readmissions/revisits.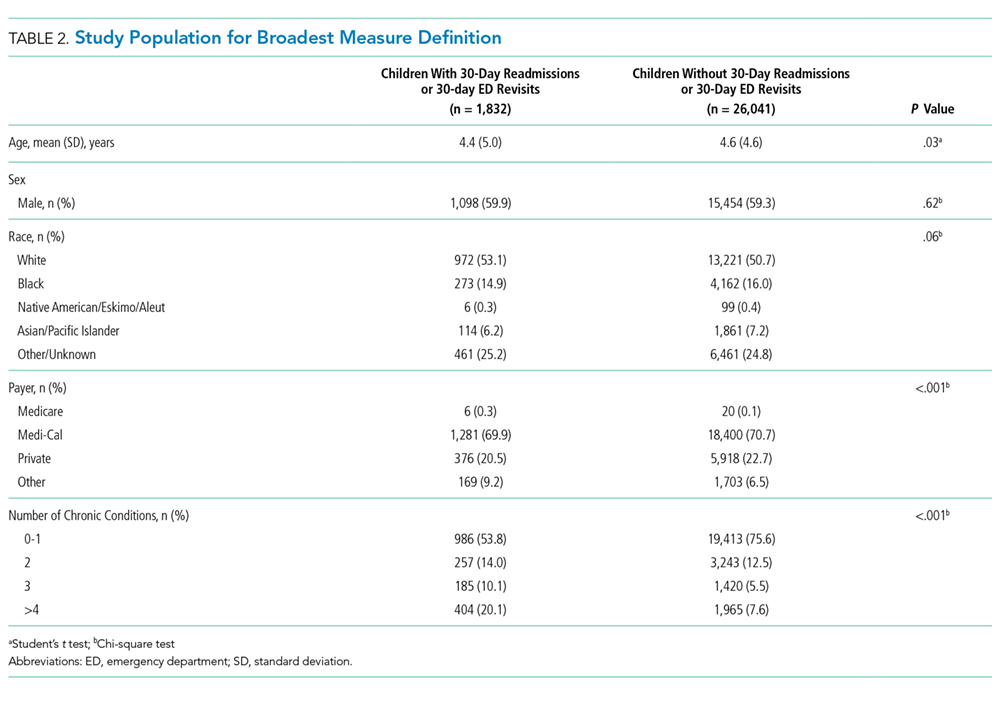
Secondary Outcome: Hospital Costs
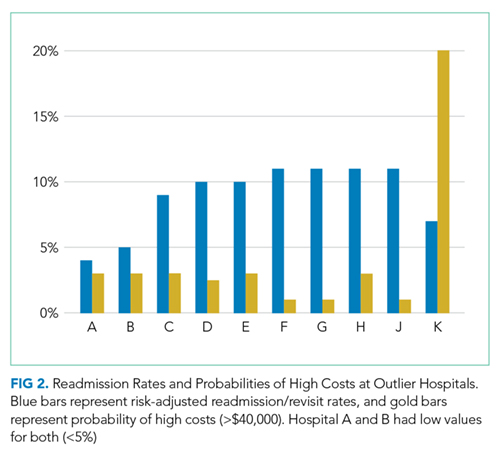
In the analysis of hospital-level costs, we found only 1 outlier high-cost hospital. There was a 20% probability of a hospital respiratory admission costing ≥$40,000 at this hospital. We found no overall relationship between hospital 30-day respiratory readmission rate and hospital costs (Figure 1). However, the hospitals that were outliers for low readmission rates also had low probabilities of excessive hospital costs (3% probability of costs >$40,000; Figure 2).
DISCUSSION
We used a nationally endorsed pediatric quality measure to evaluate hospital performance, defined as 30-day readmission rates for children with respiratory illness. We examined all-payer data from California, which is the most populous state in the country and home to 1 in 8 American children. In this large California dataset, we were unable to identify meaningful variation in hospital performance due to low hospital volumes and event rates. However, when we broadened the measure definition, we were able to identify performance variation. Our findings underscore the importance of testing and potentially modifying existing quality measures in order to more accurately capture the quality of care delivered at hospitals with lower volumes of pediatric patients.21
Our underlying assumption, in light of these prior studies, was that increasing the eligible sample in each hospital by combining respiratory diseases and by using an all-payer claims database rather than a Medicaid-only database would increase the number of detectable outlier hospitals. However, we found that these approaches did not ameliorate the limitations of small volumes. Only through aggregating data over 3 years was it possible to identify any outliers, and this approach identified only 3% of hospitals as outliers. Hence, our analysis reinforces concerns raised by several prior analyses4-7 regarding the limited ability of current pediatric readmission measures to detect meaningful, actionable differences in performance across all types of hospitals (including general/nonchildren’s hospitals). This issue is of particular concern for common pediatric conditions like respiratory illnesses, for which >70% of hospitalizations occur in general hospitals.11
Developers and utilizers of pediatric quality metrics should consider strategies for identifying meaningful, actionable variation in pediatric quality of care at general hospitals. These strategies might include our approach of combining several years of hospital data in order to reach adequate volumes for measuring performance. The potential downside to this approach is performance lag—specifically, hospitals implementing quality improvement readmissions programs may not see changes in their performance for a year or two on a measure aggregating 3 years of data. Alternatively, it is possible that the measure might be used more appropriately across a larger group of hospitals, either to assess performance for multihospital accountable care organization (ACO), or to assess performance for a service area or county. An aggregated group of hospitals would increase the eligible patient volume and, if there is an ACO relationship established, coordinated interventions could be implemented across the hospitals.
We examined the 30-day readmission rate because it is the current standard used by CMS and all NQF-endorsed readmission measures.22,23 Another potential approach is to analyze the 7- or 15-day readmission rate. However, these rates may be similarly limited in identifying hospital performance due to low volumes and event rates. An analysis by Wallace et al. of preventable readmissions to a tertiary children’s hospital found that, while many occurred within 7 days or 15 days, 27% occurred after 7 days and 22%, after 15.24 However, an analysis of several adult 30-day readmission measures used by CMS found that the contribution of hospital-level quality to the readmission rate (measured by intracluster correlation coefficient) reached a nadir at 7 days, which suggests that most readmissions after the seventh day postdischarge were explained by community- and household-level factors beyond hospitals’ control.22 Hence, though 7- or 15-day readmission rates may better represent preventable outcomes under the hospital’s control, the lower event rates and low hospital volumes likely similarly limit the feasibility of their use for performance measurement.
Pediatric quality measures are additionally intended to drive improvements in the value of pediatric care, defined as quality relative to costs.25 In order to better understand the relationship of hospital performance across both the domains of readmissions (quality) and costs, we examined hospital-level costs for care of pediatric respiratory illnesses. We found no overall relationship between hospital readmission rates and costs; however, we found 2 hospitals in California that had significantly lower readmission rates as well as low costs. Close examination of hospitals such as these, which demonstrate exceptional performance in quality and costs, may promote the discovery and dissemination of strategies to improve the value of pediatric care.12
Our study had several limitations. First, the OSHPD database lacked detailed clinical variables to correct for additional case-mix differences between hospitals. However, we used the approach of case-mix adjustment outlined by an NQF-endorsed national quality metric.8 Secondly, since our data were limited to a single state, analyses of other databases may have yielded different results. However, prior analyses using other multistate databases reported similar limitations,5,6 likely due to the limitations of patient volume that are generalizable to settings outside of California. In addition, our cost analysis was performed using cost-to-charge ratios that represent total annual expenses/revenue for the whole hospital.16 These ratios may not be reflective of the specific services provided for children in our analysis; however, service-specific costs were not available, and cost-to-charge ratios are commonly used to report costs.
CONCLUSION
The ability of a nationally-endorsed pediatric respiratory readmissions measure to meaningfully identify variation in hospital performance is limited. General hospitals, which provide the majority of pediatric care for common conditions such as LRI, likely cannot be accurately evaluated using national pediatric quality metrics as they are currently designed. Modifying measures in order to increase hospital-level pediatric patient volumes may facilitate more meaningful evaluation of the quality of pediatric care in general hospitals and identification of exceptional hospitals for understanding best practices in pediatric inpatient care.
Disclosures
Regina Lam consulted for Proximity Health doing market research during the course of developing this manuscript, but this work did not involve any content related to quality metrics, and this entity did not play any role in the development of this manuscript. The remaining authors have no conflicts of interest relevant to this article to disclose.
Funding
Supported by the Agency for Healthcare Research and Quality (K08 HS24592 to SVK and U18HS25297 to MDC and NSB) and the National Institute of Child Health and Human Development (K23HD065836 to NSB). The funding agency played no role in the study design; the collection, analysis, and interpretation of data; the writing of the report; or the decision to submit the manuscript for publication.
1. Agency for Healthcare Research and Quality. Overview of hospital stays for children in the United States. https://www.hcup-us.ahrq.gov/reports/statbriefs/sb187-Hospital-Stays-Children-2012.jsp. Accessed September 1, 2017; 2012. PubMed
2. Mendelson A, Kondo K, Damberg C, et al. The effects of pay-for-performance programs on health, health care use, and processes of care: A systematic review. Ann Intern Med. 2017;166(5):341-353. doi: 10.7326/M16-1881. PubMed
3. Zuckerman RB, Sheingold SH, Orav EJ, Ruhter J, Epstein AM. Readmissions, observation, and the hospital readmissions reduction program. N Engl J Med. 2016;374(16):1543-1551. doi: 10.1056/NEJMsa1513024. PubMed
4. Bardach NS, Chien AT, Dudley RA. Small numbers limit the use of the inpatient pediatric quality indicators for hospital comparison. Acad Pediatr. 2010;10(4):266-273. doi: 10.1016/j.acap.2010.04.025. PubMed
5. Bardach NS, Vittinghoff E, Asteria-Peñaloza R, et al. Measuring hospital quality using pediatric readmission and revisit rates. Pediatrics. 2013;132(3):429-436. doi: 10.1542/peds.2012-3527. PubMed
6. Berry JG, Zaslavsky AM, Toomey SL, et al. Recognizing differences in hospital quality performance for pediatric inpatient care. Pediatrics. 2015;136(2):251-262. doi: 10.1542/peds.2014-3131. PubMed
7. Hain PD, Gay JC, Berutti TW, Whitney GM, Wang W, Saville BR. Preventability of early readmissions at a children’s hospital. Pediatrics. 2013;131(1):e171-e181. doi: 10.1542/peds.2012-0820. PubMed
8. Agency for Healthcare Research and Quality. Pediatric lower respiratory infection readmission measure. https://www.ahrq.gov/sites/default/files/wysiwyg/policymakers/chipra/factsheets/chipra_1415-p008-2-ef.pdf. Accessed September 3, 2017.
9. Agency for Healthcare Research and Quality. CHIPRA Pediatric Quality Measures Program. https://archive.ahrq.gov/policymakers/chipra/pqmpback.html. Accessed October 10, 2017.
10. Nakamura MM, Zaslavsky AM, Toomey SL, et al. Pediatric readmissions After hospitalizations for lower respiratory infections. Pediatrics. 2017;140(2). doi: 10.1542/peds.2016-0938. PubMed
11. Leyenaar JK, Ralston SL, Shieh MS, Pekow PS, Mangione-Smith R, Lindenauer PK. Epidemiology of pediatric hospitalizations at general hospitals and freestanding children’s hospitals in the United States. J Hosp Med. 2016;11(11):743-749. doi: 10.1002/jhm.2624. PubMed
12. Bradley EH, Curry LA, Ramanadhan S, Rowe L, Nembhard IM, Krumholz HM. Research in action: using positive deviance to improve quality of health care. Implement Sci. 2009;4:25. doi: 10.1186/1748-5908-4-25. PubMed
13. California Office of Statewide Health Planning and Development. Data and reports. https://www.oshpd.ca.gov/HID/. Accessed September 3, 2017.
14. QualityNet. Measure methodology reports. https://www.qualitynet.org/dcs/ContentServer?c=Page&pagename=QnetPublic%2FPage%2FQnetTier4&cid=1219069855841. Accessed October 10, 2017.
15. Riley GF. Administrative and claims records as sources of health care cost data. Med Care. 2009;47(7 Suppl 1):S51-S55. doi: 10.1097/MLR.0b013e31819c95aa. PubMed
16. California Office of Statewide Health Planning and Development. Annual financial data. https://www.oshpd.ca.gov/HID/Hospital-Financial.asp. Accessed September 3, 2017.
17. Tukey J. Exploratory Data Analysis: Pearson; London, United Kingdom. 1977.
18. Centers for Medicare and Medicaid Services. Core measures. https://www.cms.gov/Medicare/Quality-Initiatives-Patient-Assessment-Instruments/QualityMeasures/Core-Measures.html. Accessed September 1, 2017.
19. Berry JG, Toomey SL, Zaslavsky AM, et al. Pediatric readmission prevalence and variability across hospitals. JAMA. 2013;309(4):372-380. doi: 10.1001/jama.2012.188351. PubMed
20. Centers for Medicare and Medicaid Services. HospitalCompare. https://www.medicare.gov/hospitalcompare/search.html. Accessed on October 10, 2017.
21. Mangione-Smith R. The challenges of addressing pediatric quality measurement gaps. Pediatrics. 2017;139(4). doi: 10.1542/peds.2017-0174. PubMed
22. Chin DL, Bang H, Manickam RN, Romano PS. Rethinking thirty-day hospital readmissions: shorter intervals might be better indicators of quality of care. Health Aff (Millwood). 2016;35(10):1867-1875. doi: 10.1377/hlthaff.2016.0205. PubMed
23. National Quality Forum. Measures, reports, and tools. http://www.qualityforum.org/Measures_Reports_Tools.aspx. Accessed March 1, 2018.
24. Wallace SS, Keller SL, Falco CN, et al. An examination of physician-, caregiver-, and disease-related factors associated With readmission From a pediatric hospital medicine service. Hosp Pediatr. 2015;5(11):566-573. doi: 10.1542/hpeds.2015-0015. PubMed
25. Porter ME. What is value in health care? N Engl J Med. 2010;363(26):2477-2481. doi: 10.1056/NEJMp1011024. PubMed
Respiratory illnesses are the leading causes of pediatric hospitalizations in the United States.1 The 30-day hospital readmission rate for respiratory illnesses is being considered for implementation as a national hospital performance measure, as it may be an indicator of lower quality care (eg, poor hospital management of disease, inadequate patient/caretaker education prior to discharge). In adult populations, readmissions can be used to reliably identify variation in hospital performance and successfully drive efforts to improve the value of care.2, 3 In contrast, there are persistent concerns about using pediatric readmissions to identify variation in hospital performance, largely due to lower patient volumes.4-7 To increase the value of pediatric hospital care, it is important to develop ways to meaningfully measure quality of care and further, to better understand the relationship between measures of quality and healthcare costs.
In December 2016, the National Quality Forum (NQF) endorsed a Pediatric Lower Respiratory Infection (LRI) Readmission Measure.8 This measure was developed by the Pediatric Quality Measurement Program, through the Agency for Healthcare Research and Quality. The goal of this program was to “increase the portfolio of evidence-based, consensus pediatric quality measures available to public and private purchasers of children’s healthcare services, providers, and consumers.”9
In anticipation of the national implementation of pediatric readmission measures, we examined whether the Pediatric LRI Readmission Measure could meaningfully identify high and low performers across all types of hospitals admitting children (general hospitals and children’s hospitals) using an all-payer claims database. A recent analysis by Nakamura et al. identified high and low performers using this measure10 but limited the analysis to hospitals with >50 pediatric LRI admissions per year, an approach that excludes many general hospitals. Since general hospitals provide the majority of care for children hospitalized with respiratory infections,11 we aimed to evaluate the measure in a broadly inclusive analysis that included all hospital types. Because low patient volumes might limit use of the measure,4,6 we tested several broadened variations of the measure. We also examined the relationship between hospital performance in pediatric LRI readmissions and healthcare costs.
Our analysis is intended to inform utilizers of pediatric quality metrics and policy makers about the feasibility of using these metrics to publicly report hospital performance and/or identify exceptional hospitals for understanding best practices in pediatric inpatient care.12
METHODS
Study Design and Data Source
We conducted an observational, retrospective cohort analysis using the 2012-2014 California Office of Statewide Health Planning and Development (OSHPD) nonpublic inpatient and emergency department databases.13 The OSHPD databases are compiled annually through mandatory reporting by all licensed nonfederal hospitals in California. The databases contain demographic (eg, age, gender) and utilization data (eg, charges) and can track readmissions to hospitals other than the index hospital. The databases capture administrative claims from approximately 450 hospitals, composed of 16 million inpatients, emergency department patients, and ambulatory surgery patients annually. Data quality is monitored through the California OSHPD.
Study Population
Our study included children aged ≤18 years with LRI, defined using the NQF Pediatric LRI Readmissions Measure: a primary diagnosis of bronchiolitis, influenza, or pneumonia, or a secondary diagnosis of bronchiolitis, influenza, or pneumonia, with a primary diagnosis of asthma, respiratory failure, sepsis, or bacteremia.8 International classification of Diseases, 9th edition (ICD-9) diagnostic codes used are in Appendix 1.
Per the NQF measure specifications,8 records were excluded if they were from hospitals with <80% of records complete with core elements (unique patient identifier, admission date, end-of-service date, and ICD-9 primary diagnosis code). In addition, records were excluded for the following reasons: (1) individual record missing core elements, (2) discharge disposition “death,” (3) 30-day follow-up data not available, (4) primary “newborn” or mental health diagnosis, or (5) primary ICD-9 procedure code for a planned procedure or chemotherapy.
Patient characteristics for hospital admissions with and without 30-day readmissions or 30-day emergency department (ED) revisits were summarized. For the continuous variable age, mean and standard deviation for each group were calculated. For categorical variables (sex, race, payer, and number of chronic conditions), numbers and proportions were determined. Univariate tests of comparison were carried out using the Student’s t test for age and chi-square tests for all categorical variables. Categories of payer with small values were combined for ease of description (categories combined into “other:” workers’ compensation, county indigent programs, other government, other indigent, self-pay, other payer). We identified chronic conditions using the Agency for Healthcare Research and Quality Chronic Condition Indicator (CCI) system, which classifies ICD-9-CM diagnosis codes as chronic or acute and places each code into 1 of 18 mutually exclusive categories (organ systems, disease categories, or other categories). The case-mix adjustment model incorporates a binary variable for each CCI category (0-1, 2, 3, or >4 chronic conditions) per the NQF measure specifications.8 This study was approved by the University of California, San Francisco Institutional Review Board.
Outcomes
Our primary outcome was the hospital-level rate of 30-day readmission after hospital discharge, consistent with the NQF measure.8 We identified outlier hospitals for 30-day readmission rate using the Centers for Medicare and Medicaid Services (CMS) methodology, which defines outlier hospitals as those for whom adjusted readmission rate confidence intervals do not overlap with the overall group mean rate.5, 14
We also determined the hospital-level average cost per index hospitalization (not including costs of readmissions). Since costs of care often differ substantially from charges,15 costs were calculated using cost-to-charge ratios for each hospital (annual total operating expenses/total gross patient revenue, as reported to the OSHPD).16 Costs were subdivided into categories representing $5,000 increments and a top category of >$40,000. Outlier hospitals for costs were defined as those for whom the cost random effect was either greater than the third quartile of the distribution of values by more than 1.5 times the interquartile range or less than the first quartile of the distribution of values by more than 1.5 times the interquartile range.17
ANALYSIS
Primary Analysis
For our primary analysis of 30-day hospital readmission rates, we used hierarchical logistic regression models with hospitals as random effects, adjusting for patient age, sex, and the presence and number of body systems affected by chronic conditions.8 These 4 patient characteristics were selected by the NQF measure developers “because distributions of these characteristics vary across hospitals, and although they are associated with readmission risk, they are independent of hospital quality of care.”10
Because the Centers for Medicare and Medicaid Services (CMS) are in the process of selecting pediatric quality measures for meaningful use reporting,18 we utilized CMS hospital readmissions methodology to calculate risk-adjusted rates and identify outlier hospitals. The CMS modeling strategy stabilizes performance estimates for low-volume hospitals and avoids penalizing these hospitals for high readmission rates that may be due to chance (random effects logistic model to obtain best linear unbiased predictions). This is particularly important in pediatrics, given the low pediatric volumes in many hospitals admitting children.4,19 We then identified outlier hospitals for the 30-day readmission rate using CMS methodology (hospital’s adjusted readmission rate confidence interval does not overlap the overall group mean rate).5, 4 CMS uses this approach for public reporting on HospitalCompare.20
Sensitivity Analyses
We tested several broadening variations of the NQF measure: (1) addition of children admitted with a primary diagnosis of asthma (without requiring LRI as a secondary diagnosis) or a secondary diagnosis of asthma exacerbation (LRIA), (2) inclusion of 30-day ED revisits as an outcome, and (3) merging of 3 years of data. These analyses were all performed using the same modeling strategy as in our primary analysis.
Secondary Outcome Analyses
Our analysis of hospital costs used costs for index admissions over 3 years (2012–2014) and included admissions for asthma. We used hierarchical regression models with hospitals as random effects, adjusting for age, gender, and the presence and number of chronic conditions. The distribution of cost values was highly skewed, so ordinal models were selected after several other modeling approaches failed (log transformation linear model, gamma model, Poisson model, zero-truncated Poisson model).
The relationship between hospital-level costs and hospital-level 30-day readmission or ED revisit rates was analyzed using Spearman’s rank correlation coefficient. Statistical analysis was performed using SAS version 9.4 software (SAS Institute; Cary, North Carolina).
RESULTS
Primary Analysis of 30-day Readmissions (per National Quality Forum Measure)
Our analysis of the 2014 OSHPD database using the specifications of the NQF Pediatric LRI Readmission Measure included a total of 5550 hospitalizations from 174 hospitals, with a mean of 12 eligible hospitalizations per hospital. The mean risk-adjusted readmission rate was 6.5% (362 readmissions). There were no hospitals that were considered outliers based on the risk-adjusted readmission rates (Table 1).
Sensitivity Analyses (Broadening Definitions of National Quality Forum Measure)
We report our testing of the broadened variations of the NQF measure in Table 1. Broadening the population to include children with asthma as a primary diagnosis and children with asthma exacerbations as a secondary diagnosis (LRIA) increased the size of our analysis to 8402 hospitalizations from 190 hospitals. The mean risk-adjusted readmission rate was 5.5%, and no outlier hospitals were identified.
Using the same inclusion criteria of the NQF measure but including 30-day ED revisits as an outcome, we analyzed a total of 5500 hospitalizations from 174 hospitals. The mean risk-adjusted event rate was higher at 7.9%, but there were still no outlier hospitals identified.
Using the broadened population definition (LRIA) and including 30-day ED revisits as an outcome, we analyzed a total of 8402 hospitalizations from 190 hospitals. The mean risk-adjusted event rate was 6.8%, but there were still no outlier hospitals identified.
In our final iteration, we merged 3 years of hospital data (2012-2014) using the broader population definition (LRIA) and including 30-day ED revisits as an outcome. This resulted in 27,873 admissions from 239 hospitals for this analysis, with a mean of 28 eligible hospitalizations per hospital. The mean risk-adjusted event rate was 6.7%, and this approach identified 2 high-performing (risk-adjusted rates: 3.6-5.3) and 7 low-performing hospitals (risk-adjusted rates: 10.1-15.9).
Table 2 presents the demographics of children included in this analysis. Children who had readmissions/revisits were younger, more likely to be white, less likely to have private insurance, and more likely to have a greater number of chronic conditions compared to children without readmissions/revisits.
Secondary Outcome: Hospital Costs
In the analysis of hospital-level costs, we found only 1 outlier high-cost hospital. There was a 20% probability of a hospital respiratory admission costing ≥$40,000 at this hospital. We found no overall relationship between hospital 30-day respiratory readmission rate and hospital costs (Figure 1). However, the hospitals that were outliers for low readmission rates also had low probabilities of excessive hospital costs (3% probability of costs >$40,000; Figure 2).
DISCUSSION
We used a nationally endorsed pediatric quality measure to evaluate hospital performance, defined as 30-day readmission rates for children with respiratory illness. We examined all-payer data from California, which is the most populous state in the country and home to 1 in 8 American children. In this large California dataset, we were unable to identify meaningful variation in hospital performance due to low hospital volumes and event rates. However, when we broadened the measure definition, we were able to identify performance variation. Our findings underscore the importance of testing and potentially modifying existing quality measures in order to more accurately capture the quality of care delivered at hospitals with lower volumes of pediatric patients.21
Our underlying assumption, in light of these prior studies, was that increasing the eligible sample in each hospital by combining respiratory diseases and by using an all-payer claims database rather than a Medicaid-only database would increase the number of detectable outlier hospitals. However, we found that these approaches did not ameliorate the limitations of small volumes. Only through aggregating data over 3 years was it possible to identify any outliers, and this approach identified only 3% of hospitals as outliers. Hence, our analysis reinforces concerns raised by several prior analyses4-7 regarding the limited ability of current pediatric readmission measures to detect meaningful, actionable differences in performance across all types of hospitals (including general/nonchildren’s hospitals). This issue is of particular concern for common pediatric conditions like respiratory illnesses, for which >70% of hospitalizations occur in general hospitals.11
Developers and utilizers of pediatric quality metrics should consider strategies for identifying meaningful, actionable variation in pediatric quality of care at general hospitals. These strategies might include our approach of combining several years of hospital data in order to reach adequate volumes for measuring performance. The potential downside to this approach is performance lag—specifically, hospitals implementing quality improvement readmissions programs may not see changes in their performance for a year or two on a measure aggregating 3 years of data. Alternatively, it is possible that the measure might be used more appropriately across a larger group of hospitals, either to assess performance for multihospital accountable care organization (ACO), or to assess performance for a service area or county. An aggregated group of hospitals would increase the eligible patient volume and, if there is an ACO relationship established, coordinated interventions could be implemented across the hospitals.
We examined the 30-day readmission rate because it is the current standard used by CMS and all NQF-endorsed readmission measures.22,23 Another potential approach is to analyze the 7- or 15-day readmission rate. However, these rates may be similarly limited in identifying hospital performance due to low volumes and event rates. An analysis by Wallace et al. of preventable readmissions to a tertiary children’s hospital found that, while many occurred within 7 days or 15 days, 27% occurred after 7 days and 22%, after 15.24 However, an analysis of several adult 30-day readmission measures used by CMS found that the contribution of hospital-level quality to the readmission rate (measured by intracluster correlation coefficient) reached a nadir at 7 days, which suggests that most readmissions after the seventh day postdischarge were explained by community- and household-level factors beyond hospitals’ control.22 Hence, though 7- or 15-day readmission rates may better represent preventable outcomes under the hospital’s control, the lower event rates and low hospital volumes likely similarly limit the feasibility of their use for performance measurement.
Pediatric quality measures are additionally intended to drive improvements in the value of pediatric care, defined as quality relative to costs.25 In order to better understand the relationship of hospital performance across both the domains of readmissions (quality) and costs, we examined hospital-level costs for care of pediatric respiratory illnesses. We found no overall relationship between hospital readmission rates and costs; however, we found 2 hospitals in California that had significantly lower readmission rates as well as low costs. Close examination of hospitals such as these, which demonstrate exceptional performance in quality and costs, may promote the discovery and dissemination of strategies to improve the value of pediatric care.12
Our study had several limitations. First, the OSHPD database lacked detailed clinical variables to correct for additional case-mix differences between hospitals. However, we used the approach of case-mix adjustment outlined by an NQF-endorsed national quality metric.8 Secondly, since our data were limited to a single state, analyses of other databases may have yielded different results. However, prior analyses using other multistate databases reported similar limitations,5,6 likely due to the limitations of patient volume that are generalizable to settings outside of California. In addition, our cost analysis was performed using cost-to-charge ratios that represent total annual expenses/revenue for the whole hospital.16 These ratios may not be reflective of the specific services provided for children in our analysis; however, service-specific costs were not available, and cost-to-charge ratios are commonly used to report costs.
CONCLUSION
The ability of a nationally-endorsed pediatric respiratory readmissions measure to meaningfully identify variation in hospital performance is limited. General hospitals, which provide the majority of pediatric care for common conditions such as LRI, likely cannot be accurately evaluated using national pediatric quality metrics as they are currently designed. Modifying measures in order to increase hospital-level pediatric patient volumes may facilitate more meaningful evaluation of the quality of pediatric care in general hospitals and identification of exceptional hospitals for understanding best practices in pediatric inpatient care.
Disclosures
Regina Lam consulted for Proximity Health doing market research during the course of developing this manuscript, but this work did not involve any content related to quality metrics, and this entity did not play any role in the development of this manuscript. The remaining authors have no conflicts of interest relevant to this article to disclose.
Funding
Supported by the Agency for Healthcare Research and Quality (K08 HS24592 to SVK and U18HS25297 to MDC and NSB) and the National Institute of Child Health and Human Development (K23HD065836 to NSB). The funding agency played no role in the study design; the collection, analysis, and interpretation of data; the writing of the report; or the decision to submit the manuscript for publication.
1. Agency for Healthcare Research and Quality. Overview of hospital stays for children in the United States. https://www.hcup-us.ahrq.gov/reports/statbriefs/sb187-Hospital-Stays-Children-2012.jsp. Accessed September 1, 2017; 2012. PubMed
2. Mendelson A, Kondo K, Damberg C, et al. The effects of pay-for-performance programs on health, health care use, and processes of care: A systematic review. Ann Intern Med. 2017;166(5):341-353. doi: 10.7326/M16-1881. PubMed
3. Zuckerman RB, Sheingold SH, Orav EJ, Ruhter J, Epstein AM. Readmissions, observation, and the hospital readmissions reduction program. N Engl J Med. 2016;374(16):1543-1551. doi: 10.1056/NEJMsa1513024. PubMed
4. Bardach NS, Chien AT, Dudley RA. Small numbers limit the use of the inpatient pediatric quality indicators for hospital comparison. Acad Pediatr. 2010;10(4):266-273. doi: 10.1016/j.acap.2010.04.025. PubMed
5. Bardach NS, Vittinghoff E, Asteria-Peñaloza R, et al. Measuring hospital quality using pediatric readmission and revisit rates. Pediatrics. 2013;132(3):429-436. doi: 10.1542/peds.2012-3527. PubMed
6. Berry JG, Zaslavsky AM, Toomey SL, et al. Recognizing differences in hospital quality performance for pediatric inpatient care. Pediatrics. 2015;136(2):251-262. doi: 10.1542/peds.2014-3131. PubMed
7. Hain PD, Gay JC, Berutti TW, Whitney GM, Wang W, Saville BR. Preventability of early readmissions at a children’s hospital. Pediatrics. 2013;131(1):e171-e181. doi: 10.1542/peds.2012-0820. PubMed
8. Agency for Healthcare Research and Quality. Pediatric lower respiratory infection readmission measure. https://www.ahrq.gov/sites/default/files/wysiwyg/policymakers/chipra/factsheets/chipra_1415-p008-2-ef.pdf. Accessed September 3, 2017.
9. Agency for Healthcare Research and Quality. CHIPRA Pediatric Quality Measures Program. https://archive.ahrq.gov/policymakers/chipra/pqmpback.html. Accessed October 10, 2017.
10. Nakamura MM, Zaslavsky AM, Toomey SL, et al. Pediatric readmissions After hospitalizations for lower respiratory infections. Pediatrics. 2017;140(2). doi: 10.1542/peds.2016-0938. PubMed
11. Leyenaar JK, Ralston SL, Shieh MS, Pekow PS, Mangione-Smith R, Lindenauer PK. Epidemiology of pediatric hospitalizations at general hospitals and freestanding children’s hospitals in the United States. J Hosp Med. 2016;11(11):743-749. doi: 10.1002/jhm.2624. PubMed
12. Bradley EH, Curry LA, Ramanadhan S, Rowe L, Nembhard IM, Krumholz HM. Research in action: using positive deviance to improve quality of health care. Implement Sci. 2009;4:25. doi: 10.1186/1748-5908-4-25. PubMed
13. California Office of Statewide Health Planning and Development. Data and reports. https://www.oshpd.ca.gov/HID/. Accessed September 3, 2017.
14. QualityNet. Measure methodology reports. https://www.qualitynet.org/dcs/ContentServer?c=Page&pagename=QnetPublic%2FPage%2FQnetTier4&cid=1219069855841. Accessed October 10, 2017.
15. Riley GF. Administrative and claims records as sources of health care cost data. Med Care. 2009;47(7 Suppl 1):S51-S55. doi: 10.1097/MLR.0b013e31819c95aa. PubMed
16. California Office of Statewide Health Planning and Development. Annual financial data. https://www.oshpd.ca.gov/HID/Hospital-Financial.asp. Accessed September 3, 2017.
17. Tukey J. Exploratory Data Analysis: Pearson; London, United Kingdom. 1977.
18. Centers for Medicare and Medicaid Services. Core measures. https://www.cms.gov/Medicare/Quality-Initiatives-Patient-Assessment-Instruments/QualityMeasures/Core-Measures.html. Accessed September 1, 2017.
19. Berry JG, Toomey SL, Zaslavsky AM, et al. Pediatric readmission prevalence and variability across hospitals. JAMA. 2013;309(4):372-380. doi: 10.1001/jama.2012.188351. PubMed
20. Centers for Medicare and Medicaid Services. HospitalCompare. https://www.medicare.gov/hospitalcompare/search.html. Accessed on October 10, 2017.
21. Mangione-Smith R. The challenges of addressing pediatric quality measurement gaps. Pediatrics. 2017;139(4). doi: 10.1542/peds.2017-0174. PubMed
22. Chin DL, Bang H, Manickam RN, Romano PS. Rethinking thirty-day hospital readmissions: shorter intervals might be better indicators of quality of care. Health Aff (Millwood). 2016;35(10):1867-1875. doi: 10.1377/hlthaff.2016.0205. PubMed
23. National Quality Forum. Measures, reports, and tools. http://www.qualityforum.org/Measures_Reports_Tools.aspx. Accessed March 1, 2018.
24. Wallace SS, Keller SL, Falco CN, et al. An examination of physician-, caregiver-, and disease-related factors associated With readmission From a pediatric hospital medicine service. Hosp Pediatr. 2015;5(11):566-573. doi: 10.1542/hpeds.2015-0015. PubMed
25. Porter ME. What is value in health care? N Engl J Med. 2010;363(26):2477-2481. doi: 10.1056/NEJMp1011024. PubMed
© 2018 Society of Hospital Medicine
It’s time for a strategic approach to observation care
After patients have experienced an illness requiring a hospital stay, they are increasingly finding that despite having received treatment in a hospital bed, they were never actually admitted—at least not from the perspective of their insurers. Instead, these patients were kept under observation, an outpatient designation that allows a hospital to bill for observation services without formally admitting a patient.
Recent studies have recorded significant increases in hospitals’ use of observation stays among the Medicare population,1-3 raising concerns about the financial ramifications for patients. Under observation, patients are potentially responsible for a greater share of the cost and bear the financial consequences of inappropriate observation stays. Currently, around 6% of Medicare patients hospitalized as outpatients spend more than 48 hours (or two midnights) in observation, sometimes much longer, exposing them to significant out-of-pocket costs.3 In addition, liberal use of observation can lead to increased hospital stays, for example among lower-severity emergency department (ED) patients who could have been safely discharged but were instead kept for a costly observation stay.4 At the same time, hospitals do not necessarily benefit from this cost shifting; in fact, hospital margin is worse for patients under Medicare observation care.5 Yet hospitals are obligated to be compliant with CMS observation regulations and may try to avoid the consequences (eg, audits, non-payment) for inpatient stays that are deemed inappropriate by CMS.
While the nuances of how CMS finances observation stays have made the practice controversial, the use of observation care in other payer groups that may not have the same reimbursement policies, and its impact on patients, have not been well studied. In this issue of the Journal of Hospital Medicine, Nuckols et al.6 begins to address this gap by carefully exploring trends in observation stays in a multipayer data set.
The authors use data for four states (Georgia, Nebraska, South Carolina, and Tennessee) from the Healthcare Cost and Utilization Project (Agency for Healthcare Quality and Research) and the American Community Survey (US Census Bureau) to calculate population based rates of ED visits, observation stays, and inpatient admissions. To date, this is the first study to examine and compare the use of observation stays in an all-payer data set. Similar to prior work that examined the Medicare population, the authors find increased rates of treat-and-release ED visits and observation stays over time with a corresponding decline in inpatient admissions. As this study clearly shows, observation stays are comprising a greater fraction of the total hospital care delivered to patients with acute illnesses.
In many ways, the findings of Nuckols et al.6 raise more questions than they answer. For example, does the rise in observation stays represent a fundamental shift in how hospitals deliver care, an alternative to costly inpatient admissions? Are changing payer incentives driving hospitals to be more prudent in their inpatient admission practices, or are similar services simply being delivered under a new billing designation? And, most important, does this shift have any repercussions for the quality and safety of patient care?
Ultimately, the answer to these questions is, “It depends.” As the authors mention, most US hospitals admit observation patients to general medical wards, where they receive care at the admitting provider’s discretion instead of utilizing specific care pathways or observation protocols.7 In some of these hospitals, there may be little to no difference in how the observation patient is treated compared with a similar patient who is hospitalized as an inpatient.
However, a minority of hospitals has been more strategic in their delivery of observation care and have developed observation units. While observation units vary in design, common features include a dedicated location in the hospital with dedicated staff, reliance on clear inclusion-exclusion criteria for admission to the unit, and the use of rapid diagnostic or treatment protocols for a limited number of conditions. About half of these observation units are ED-based, reducing transitions of care between services. Protocol-driven observation units have the potential to prevent unnecessary inpatient admissions, standardize evidence-based practice, and reduce practice variation and resource use, apparently without increasing adverse events.8 In addition, they may also lead to better experiences of care for many patients compared with inpatient admissions.
Medicare’s own policy on observation hospital care succinctly describes ED observation units: “Observation services are commonly ordered for patients who present to the emergency department and who then require a significant period of treatment in order to make a decision concerning their admission or discharge…usually in less than 24 hours.” Due to regulatory changes and auditing pressure, observation care has expanded beyond this definition in length of stay, scope, and practice such that much of observation care now occurs on general hospital wards. Ideally, observation policy must be realigned with its original intent and investment made in ED observation units.
The shifting landscape of hospital-based care as described by Nuckols et al.6 highlights the need for a more strategic approach to the delivery of acute care. Unfortunately, to date, there has been a lack of attention among policymakers towards promoting a system of emergent and urgent care that is coordinated and efficient. Observation stays are one major area for which innovations in the acute care delivery system may result in meaningful improvement in patient outcomes and greater value for the healthcare system. Incentivizing a system of high-value observation care, such as promoting the use of observation units that employ evidence-based practices, should be a key priority when considering approaches to reducing the cost of hospital-based and other acute care.
One strategy is to better define and possibly expand the cohort of patients likely to benefit from care in an observation unit. Hospitals with significant experience using observation units treat not only common observation conditions like chest pain, asthma, or cellulitis, but also higher-risk inpatient conditions like syncope and diabetic ketoacidosis using rapid diagnostic and treatment protocols.
Identifying high-value observation care also will require developing patient outcome measures specific for observation stays. Observation-specific quality measures will allow a comparison of hospitals that use different care pathways for observation patients or treat certain populations of patients in observation units. This necessitates looking beyond resource use (costs and length of stay), which most studies on observation units have focused on, and examining a broader range of patient outcomes like time to symptomatic resolution, quality of life, or return to productivity after an acute illness.
Finally, observation care is also a good target for payment redesign. For example, incentive payments could be provided to hospitals that choose to develop observation units, employ observation units that utilize best known practices for observation care (such as protocols and clearly defined patient cohorts), or deliver particularly good acute care outcomes for patients with observation-amenable conditions. On the consumer side, value-based contracting could be used to shunt patients with acute conditions that require evaluation in an urgent care center or ED to hospitals that use observation units.
While the declines in inpatient admission and increases in treat-and-release ED patients have been well-documented over time, perhaps the biggest contribution of this study from Nuckols et al.6 lies in its identification of the changes in observation care, which have been increasing in all payer groups. Our opportunity now is to shape whether these shifts toward observation care deliver greater value for patients.
Acknowledgment
The authors thank Joanna Guo, BA, for her editorial and technical assistance.
Disclosure
Nothing to report.
1. Feng Z, Wright B, Mor V. Sharp rise in Medicare enrollees being held in hospitals for observation raises concerns about causes and consequences. Health Aff (Millwood). 2012;31(6):1251-1259. PubMed
2. Zuckerman RB, Sheingold SH, Orav EJ, Ruhter J, Epstein AM. Readmissions, observation, and the Hospital Readmissions Reduction Program. N Engl J Med. 2016;374(16):1543-1551. PubMed
3. Office of Inspector General. Vulnerabilities Remain Under Medicare’s 2-Midnight Hospital Policy. US Department of Health & Human Services. Published 2016. https://oig.hhs.gov/oei/reports/oei-02-15-00020.pdf. Accessed April 25, 2017.
4. Blecker S, Gavin NP, Park H, Ladapo JA, Katz SD. Observation units as substitutes for hospitalization or home discharge. Ann Emerg Med. 2016;67(6):706-713.e702. PubMed
5. Medicare Payment Advisory Commission. Report to the Congress: Medicare Payment Policy. Published 2015. http://medpac.gov/docs/default-source/reports/mar2015_entirereport_revised.pdf?sfvrsn=0). Accessed April 25, 2017.
6. Nuckols TN, Fingar KR, Barrett M, Steiner C, Stocks C, Owens PL. The shifting landscape in utilization of inpatient, observation, and emergency department services across payers. J Hosp Med. 2017;12(6):444-446. PubMed
7. Ross MA, Hockenberry JM, Mutter R, Barrett M, Wheatley M, Pitts SR. Protocol-driven emergency department observation units offer savings, shorter stays, and reduced admissions. Health Aff (Millwood). 2013;32(12):2149-2156. PubMed
8. Ross MA, Aurora T, Graff L, et al. State of the art: emergency department observation units. Crit Pathw Cardiol. 2012;11(3):128-138. PubMed
After patients have experienced an illness requiring a hospital stay, they are increasingly finding that despite having received treatment in a hospital bed, they were never actually admitted—at least not from the perspective of their insurers. Instead, these patients were kept under observation, an outpatient designation that allows a hospital to bill for observation services without formally admitting a patient.
Recent studies have recorded significant increases in hospitals’ use of observation stays among the Medicare population,1-3 raising concerns about the financial ramifications for patients. Under observation, patients are potentially responsible for a greater share of the cost and bear the financial consequences of inappropriate observation stays. Currently, around 6% of Medicare patients hospitalized as outpatients spend more than 48 hours (or two midnights) in observation, sometimes much longer, exposing them to significant out-of-pocket costs.3 In addition, liberal use of observation can lead to increased hospital stays, for example among lower-severity emergency department (ED) patients who could have been safely discharged but were instead kept for a costly observation stay.4 At the same time, hospitals do not necessarily benefit from this cost shifting; in fact, hospital margin is worse for patients under Medicare observation care.5 Yet hospitals are obligated to be compliant with CMS observation regulations and may try to avoid the consequences (eg, audits, non-payment) for inpatient stays that are deemed inappropriate by CMS.
While the nuances of how CMS finances observation stays have made the practice controversial, the use of observation care in other payer groups that may not have the same reimbursement policies, and its impact on patients, have not been well studied. In this issue of the Journal of Hospital Medicine, Nuckols et al.6 begins to address this gap by carefully exploring trends in observation stays in a multipayer data set.
The authors use data for four states (Georgia, Nebraska, South Carolina, and Tennessee) from the Healthcare Cost and Utilization Project (Agency for Healthcare Quality and Research) and the American Community Survey (US Census Bureau) to calculate population based rates of ED visits, observation stays, and inpatient admissions. To date, this is the first study to examine and compare the use of observation stays in an all-payer data set. Similar to prior work that examined the Medicare population, the authors find increased rates of treat-and-release ED visits and observation stays over time with a corresponding decline in inpatient admissions. As this study clearly shows, observation stays are comprising a greater fraction of the total hospital care delivered to patients with acute illnesses.
In many ways, the findings of Nuckols et al.6 raise more questions than they answer. For example, does the rise in observation stays represent a fundamental shift in how hospitals deliver care, an alternative to costly inpatient admissions? Are changing payer incentives driving hospitals to be more prudent in their inpatient admission practices, or are similar services simply being delivered under a new billing designation? And, most important, does this shift have any repercussions for the quality and safety of patient care?
Ultimately, the answer to these questions is, “It depends.” As the authors mention, most US hospitals admit observation patients to general medical wards, where they receive care at the admitting provider’s discretion instead of utilizing specific care pathways or observation protocols.7 In some of these hospitals, there may be little to no difference in how the observation patient is treated compared with a similar patient who is hospitalized as an inpatient.
However, a minority of hospitals has been more strategic in their delivery of observation care and have developed observation units. While observation units vary in design, common features include a dedicated location in the hospital with dedicated staff, reliance on clear inclusion-exclusion criteria for admission to the unit, and the use of rapid diagnostic or treatment protocols for a limited number of conditions. About half of these observation units are ED-based, reducing transitions of care between services. Protocol-driven observation units have the potential to prevent unnecessary inpatient admissions, standardize evidence-based practice, and reduce practice variation and resource use, apparently without increasing adverse events.8 In addition, they may also lead to better experiences of care for many patients compared with inpatient admissions.
Medicare’s own policy on observation hospital care succinctly describes ED observation units: “Observation services are commonly ordered for patients who present to the emergency department and who then require a significant period of treatment in order to make a decision concerning their admission or discharge…usually in less than 24 hours.” Due to regulatory changes and auditing pressure, observation care has expanded beyond this definition in length of stay, scope, and practice such that much of observation care now occurs on general hospital wards. Ideally, observation policy must be realigned with its original intent and investment made in ED observation units.
The shifting landscape of hospital-based care as described by Nuckols et al.6 highlights the need for a more strategic approach to the delivery of acute care. Unfortunately, to date, there has been a lack of attention among policymakers towards promoting a system of emergent and urgent care that is coordinated and efficient. Observation stays are one major area for which innovations in the acute care delivery system may result in meaningful improvement in patient outcomes and greater value for the healthcare system. Incentivizing a system of high-value observation care, such as promoting the use of observation units that employ evidence-based practices, should be a key priority when considering approaches to reducing the cost of hospital-based and other acute care.
One strategy is to better define and possibly expand the cohort of patients likely to benefit from care in an observation unit. Hospitals with significant experience using observation units treat not only common observation conditions like chest pain, asthma, or cellulitis, but also higher-risk inpatient conditions like syncope and diabetic ketoacidosis using rapid diagnostic and treatment protocols.
Identifying high-value observation care also will require developing patient outcome measures specific for observation stays. Observation-specific quality measures will allow a comparison of hospitals that use different care pathways for observation patients or treat certain populations of patients in observation units. This necessitates looking beyond resource use (costs and length of stay), which most studies on observation units have focused on, and examining a broader range of patient outcomes like time to symptomatic resolution, quality of life, or return to productivity after an acute illness.
Finally, observation care is also a good target for payment redesign. For example, incentive payments could be provided to hospitals that choose to develop observation units, employ observation units that utilize best known practices for observation care (such as protocols and clearly defined patient cohorts), or deliver particularly good acute care outcomes for patients with observation-amenable conditions. On the consumer side, value-based contracting could be used to shunt patients with acute conditions that require evaluation in an urgent care center or ED to hospitals that use observation units.
While the declines in inpatient admission and increases in treat-and-release ED patients have been well-documented over time, perhaps the biggest contribution of this study from Nuckols et al.6 lies in its identification of the changes in observation care, which have been increasing in all payer groups. Our opportunity now is to shape whether these shifts toward observation care deliver greater value for patients.
Acknowledgment
The authors thank Joanna Guo, BA, for her editorial and technical assistance.
Disclosure
Nothing to report.
1. Feng Z, Wright B, Mor V. Sharp rise in Medicare enrollees being held in hospitals for observation raises concerns about causes and consequences. Health Aff (Millwood). 2012;31(6):1251-1259. PubMed
2. Zuckerman RB, Sheingold SH, Orav EJ, Ruhter J, Epstein AM. Readmissions, observation, and the Hospital Readmissions Reduction Program. N Engl J Med. 2016;374(16):1543-1551. PubMed
3. Office of Inspector General. Vulnerabilities Remain Under Medicare’s 2-Midnight Hospital Policy. US Department of Health & Human Services. Published 2016. https://oig.hhs.gov/oei/reports/oei-02-15-00020.pdf. Accessed April 25, 2017.
4. Blecker S, Gavin NP, Park H, Ladapo JA, Katz SD. Observation units as substitutes for hospitalization or home discharge. Ann Emerg Med. 2016;67(6):706-713.e702. PubMed
5. Medicare Payment Advisory Commission. Report to the Congress: Medicare Payment Policy. Published 2015. http://medpac.gov/docs/default-source/reports/mar2015_entirereport_revised.pdf?sfvrsn=0). Accessed April 25, 2017.
6. Nuckols TN, Fingar KR, Barrett M, Steiner C, Stocks C, Owens PL. The shifting landscape in utilization of inpatient, observation, and emergency department services across payers. J Hosp Med. 2017;12(6):444-446. PubMed
7. Ross MA, Hockenberry JM, Mutter R, Barrett M, Wheatley M, Pitts SR. Protocol-driven emergency department observation units offer savings, shorter stays, and reduced admissions. Health Aff (Millwood). 2013;32(12):2149-2156. PubMed
8. Ross MA, Aurora T, Graff L, et al. State of the art: emergency department observation units. Crit Pathw Cardiol. 2012;11(3):128-138. PubMed
© 2017 Society of Hospital Medicine
ED Observation
Over the past 3 decades, emergency department observation units (EDOUs) have been increasingly implemented in the United States to supplement emergency department (ED) care in a time of increasing patient volume and hospital crowding. Given the limited availability of hospital resources, EDOUs provide emergency clinicians an extended period of time to evaluate and risk‐stratify patients without necessitating difficult‐to‐obtain outpatient follow‐up or a short‐stay hospitalization. Changes in Medicare and insurer reimbursement policies have incentivized the adoption of EDOUs, and now, over one‐third of EDs nationally offer an observation unit.[1]
Much of the observation‐science literature has been condition and institution specific, showing benefits with respect to cost, quality of care, safety, and patient satisfaction.[2, 3, 4, 5] Until now, there had not been a national study on the impact of EDOUs to investigate important outcome: hospital admission rates. Capp and colleagues, using the National Hospital Ambulatory Care Survey (NHAMCS), attempt to answer a very important question: Do EDs with observation units have lower hospital admission rates?[6] To do so, they first standardize admission rates to sociodemographic and clinical features of the patients, while adjusting for hospital‐level factors. Then they compare the risk‐standardized hospital admission rate between EDs with and without an observation unit as reported in the NHAMCS. The authors make creative and elegant use of this publicly available, national dataset to suggest that EDOUs do not decrease hospital admissions.
The authors appropriately identify some limitations of using such data to answer questions where nuanced, countervailing forces drive the outcome of interest. It is important to note the basic statistical premise that the inability to disprove the null hypothesis is not the same thing as proving that the null hypothesis is true. In other words, although this study was not able to detect a difference between admission rates for hospitals with EDOUs and those without, it cannot be absolutely taken to mean that there is no relationship. The authors clearly state that this study was underpowered given that the difference of ED risk‐standardized hospital admission rates was small and therefore is at risk of type II error. In addition, unmeasured confounding may hide a true association between EDOUs and admission rates. Both static and dynamic measures of ED volume, crowding, and boarding, as well as changes in case mix or acuity may drive adoption of EDOUs,[7] while simultaneously associated with risk of hospitalization. Without balance between the EDs with and without observation units, or longitudinal measures of EDs over time as they are implemented, we are left with potentially biased estimates.
It is also important to highlight that not all EDOUs are created equal.[8] EDs may admit patients to the observation unit based on prespecified conditions or include all comers at physician discretion. Once placed in observation status, patients may or may not be managed by specific protocols to provide guidance on timing, order, and scope of testing and decision making.
Finally, care in EDOUs may be provided by emergency physicians, hospitalists, or other clinicians such as advanced practice providers (eg, physician assistants, nurse practitioners), a distinction that likely impacts the ultimate patient disposition. In fact, the NHAMCS asks the question, What type of physicians make decisions for patients in this observation or clinical decision unit? Capp et al., however, did not include this variable to further stratify the data. Although we do not know whether or not inclusion of this factor may have ultimately changed the results, it could have implications for how distinctions in who manages EDOUs could affect admission rates.
Still, the negative findings of this study seem to raise a number of questions, which should spark a broader discussion on EDOUs. The current analysis provides an important first step toward a national understanding of EDOUs and their role in acute care. Future inquiries should account for variation in observation units and the hospitals in which they are housed as well as inclusion of meaningful outcomes beyond admission rates. A number of methodological approaches can be considered to achieve this; propensity score matching within observational data may provide better balance between facilities with and without EDOUs, whereas multicenter impact analyses using controlled before‐and‐after or cluster‐randomized trials should be considered the gold standard for studying observation unit implementation. Outcomes in these studies should include long‐term changes in health, aggregate healthcare utilization, overuse of resources that do not provide high‐value care, and impacts on how care and costs may be redistributed when patients receive more care in observation units.
Although cost containment is often touted as a cornerstone of EDOUs, it is critical to know how the costs are measured and who is paying. For example, when an option to place a patient in observation exists, might clinicians utilize it for some patients who do not require further evaluation and testing and could have been safely discharged?[9] This observation creep may arise because clinicians can use EDOUs, not because they should. Motivations may include delaying difficult disposition decisions, avoiding uncertainty or liability when discharging patients, limited access to outpatient follow‐up, or a desire to utilize observation status to justify the existence of EDOUs within the institution. In this way, EDOUs may, in fact, provide low‐value care at a time of soaring healthcare costs.
Perhaps even more perplexing is the question of how costs are shifted through use of EDOUs.[10, 11] Much of the literature advertising its cost savings are only from the perspective of the insurers' or hospitals' perspective,[12] with 1 study estimating a potential annual cost savings of $4.6 million for each hospital, or $3 billion nationally, associated with the implementation of observation care.[5] But are medical centers just passing costs on to patients to avoid penalties and disincentives associated with short‐stay hospitalizations? Both private insurers and the Centers for Medicare and Medicaid Services may deny payments for admissions deemed unnecessary. Further, under the Affordable Care Act, avoiding hospitalizations may mean fewer penalties when Medicare patients later require admission for certain conditions. As such, hospitals may find huge incentives and cost savings associated with observation units. However, using EDOUs to avoid the Medicare readmission penalty may backfire when less‐sick patients requiring care beyond the ED are treated and discharged from observation, leaving more medically complex and ill patients for hospitalization, a group potentially more likely to be rehospitalized within 30 days, making readmission rates appear higher.
Nonetheless, because services provided during observation status are billed as an outpatient visit, patients may be liable for a proportion of the overall visit. In contrast to inpatient stays where, in general, patients owe a single copay for most or all of services rendered, outpatient visits typically involve a la carte billing. When accounting for costs related to professional and facilities fees, medications, laboratory tests, and advanced diagnostics and procedures, patient bills may be markedly higher when they are placed in observation status. This is especially true for patients covered by Medicare, where observation stays are not covered under Part A.
Research will need to simultaneously identify best practices for how EDOUs are implemented and administered while appraising their impact on patient‐centered outcomes and true costs, from multiple perspectives, including the patient, hospital, and healthcare system. There is reason to be optimistic about EDOUs as potentially high‐value components of the acute care delivery system. However, the widespread implementation of observation units with the assumption that it is cost saving to hospitals and insurers, without high‐quality population studies to inform their impact more broadly, may undermine acceptance by patients and health‐policy experts.
Disclosure
Nothing to report.
- , , . National study of emergency department observation services. Acad Emerg Med. 2011;18(9):959–965.
- , , . Emergency department observation units: a clinical and financial benefit for hospitals. Health Care Manag Rev. 2011;36(1):28–37.
- , , , et al. Randomised controlled trial and economic evaluation of a chest pain observation unit compared with routine care. BMJ. 2004;328(7434):254.
- , , , , . Patient satisfaction with an emergency department asthma observation unit. Acad Emerg Med. 1999;6(3):178–183.
- , , , , , . Making greater use of dedicated hospital observation units for many short‐stay patients could save $3.1 billion a year. Health Aff (Millwood). 2012;31(10):2314–2323.
- , , , . The Impact of emergency department observation units on U.S. emergency department admission rates. J Hosp Med. 2015;10(11):738–742.
- , . Systematic review of emergency department crowding: causes, effects, and solutions. Ann Emerg Med. 2008;52(2):126–136.
- , , , . A national survey of observation units in the United States. Am J Emerg Med. 2003;21(7):529–533.
- , , , . An evaluation of emergency physician selection of observation unit patients. Am J Emerg Med. 2006;24(3):271–279.
- , . Reducing patient financial liability for hospitalizations: the physician role. J Hosp Med. 2010;5(3):160–162.
- , , . Sharp rise in Medicare enrollees being held in hospitals for observation raises concerns about causes and consequences. Health Aff (Millwood). 2012;31(6):1251–1259.
- , , , , , . Revisiting the economic efficiencies of observation units. Manag Care. 2015;24(3):46–52.
Over the past 3 decades, emergency department observation units (EDOUs) have been increasingly implemented in the United States to supplement emergency department (ED) care in a time of increasing patient volume and hospital crowding. Given the limited availability of hospital resources, EDOUs provide emergency clinicians an extended period of time to evaluate and risk‐stratify patients without necessitating difficult‐to‐obtain outpatient follow‐up or a short‐stay hospitalization. Changes in Medicare and insurer reimbursement policies have incentivized the adoption of EDOUs, and now, over one‐third of EDs nationally offer an observation unit.[1]
Much of the observation‐science literature has been condition and institution specific, showing benefits with respect to cost, quality of care, safety, and patient satisfaction.[2, 3, 4, 5] Until now, there had not been a national study on the impact of EDOUs to investigate important outcome: hospital admission rates. Capp and colleagues, using the National Hospital Ambulatory Care Survey (NHAMCS), attempt to answer a very important question: Do EDs with observation units have lower hospital admission rates?[6] To do so, they first standardize admission rates to sociodemographic and clinical features of the patients, while adjusting for hospital‐level factors. Then they compare the risk‐standardized hospital admission rate between EDs with and without an observation unit as reported in the NHAMCS. The authors make creative and elegant use of this publicly available, national dataset to suggest that EDOUs do not decrease hospital admissions.
The authors appropriately identify some limitations of using such data to answer questions where nuanced, countervailing forces drive the outcome of interest. It is important to note the basic statistical premise that the inability to disprove the null hypothesis is not the same thing as proving that the null hypothesis is true. In other words, although this study was not able to detect a difference between admission rates for hospitals with EDOUs and those without, it cannot be absolutely taken to mean that there is no relationship. The authors clearly state that this study was underpowered given that the difference of ED risk‐standardized hospital admission rates was small and therefore is at risk of type II error. In addition, unmeasured confounding may hide a true association between EDOUs and admission rates. Both static and dynamic measures of ED volume, crowding, and boarding, as well as changes in case mix or acuity may drive adoption of EDOUs,[7] while simultaneously associated with risk of hospitalization. Without balance between the EDs with and without observation units, or longitudinal measures of EDs over time as they are implemented, we are left with potentially biased estimates.
It is also important to highlight that not all EDOUs are created equal.[8] EDs may admit patients to the observation unit based on prespecified conditions or include all comers at physician discretion. Once placed in observation status, patients may or may not be managed by specific protocols to provide guidance on timing, order, and scope of testing and decision making.
Finally, care in EDOUs may be provided by emergency physicians, hospitalists, or other clinicians such as advanced practice providers (eg, physician assistants, nurse practitioners), a distinction that likely impacts the ultimate patient disposition. In fact, the NHAMCS asks the question, What type of physicians make decisions for patients in this observation or clinical decision unit? Capp et al., however, did not include this variable to further stratify the data. Although we do not know whether or not inclusion of this factor may have ultimately changed the results, it could have implications for how distinctions in who manages EDOUs could affect admission rates.
Still, the negative findings of this study seem to raise a number of questions, which should spark a broader discussion on EDOUs. The current analysis provides an important first step toward a national understanding of EDOUs and their role in acute care. Future inquiries should account for variation in observation units and the hospitals in which they are housed as well as inclusion of meaningful outcomes beyond admission rates. A number of methodological approaches can be considered to achieve this; propensity score matching within observational data may provide better balance between facilities with and without EDOUs, whereas multicenter impact analyses using controlled before‐and‐after or cluster‐randomized trials should be considered the gold standard for studying observation unit implementation. Outcomes in these studies should include long‐term changes in health, aggregate healthcare utilization, overuse of resources that do not provide high‐value care, and impacts on how care and costs may be redistributed when patients receive more care in observation units.
Although cost containment is often touted as a cornerstone of EDOUs, it is critical to know how the costs are measured and who is paying. For example, when an option to place a patient in observation exists, might clinicians utilize it for some patients who do not require further evaluation and testing and could have been safely discharged?[9] This observation creep may arise because clinicians can use EDOUs, not because they should. Motivations may include delaying difficult disposition decisions, avoiding uncertainty or liability when discharging patients, limited access to outpatient follow‐up, or a desire to utilize observation status to justify the existence of EDOUs within the institution. In this way, EDOUs may, in fact, provide low‐value care at a time of soaring healthcare costs.
Perhaps even more perplexing is the question of how costs are shifted through use of EDOUs.[10, 11] Much of the literature advertising its cost savings are only from the perspective of the insurers' or hospitals' perspective,[12] with 1 study estimating a potential annual cost savings of $4.6 million for each hospital, or $3 billion nationally, associated with the implementation of observation care.[5] But are medical centers just passing costs on to patients to avoid penalties and disincentives associated with short‐stay hospitalizations? Both private insurers and the Centers for Medicare and Medicaid Services may deny payments for admissions deemed unnecessary. Further, under the Affordable Care Act, avoiding hospitalizations may mean fewer penalties when Medicare patients later require admission for certain conditions. As such, hospitals may find huge incentives and cost savings associated with observation units. However, using EDOUs to avoid the Medicare readmission penalty may backfire when less‐sick patients requiring care beyond the ED are treated and discharged from observation, leaving more medically complex and ill patients for hospitalization, a group potentially more likely to be rehospitalized within 30 days, making readmission rates appear higher.
Nonetheless, because services provided during observation status are billed as an outpatient visit, patients may be liable for a proportion of the overall visit. In contrast to inpatient stays where, in general, patients owe a single copay for most or all of services rendered, outpatient visits typically involve a la carte billing. When accounting for costs related to professional and facilities fees, medications, laboratory tests, and advanced diagnostics and procedures, patient bills may be markedly higher when they are placed in observation status. This is especially true for patients covered by Medicare, where observation stays are not covered under Part A.
Research will need to simultaneously identify best practices for how EDOUs are implemented and administered while appraising their impact on patient‐centered outcomes and true costs, from multiple perspectives, including the patient, hospital, and healthcare system. There is reason to be optimistic about EDOUs as potentially high‐value components of the acute care delivery system. However, the widespread implementation of observation units with the assumption that it is cost saving to hospitals and insurers, without high‐quality population studies to inform their impact more broadly, may undermine acceptance by patients and health‐policy experts.
Disclosure
Nothing to report.
- , , . National study of emergency department observation services. Acad Emerg Med. 2011;18(9):959–965.
- , , . Emergency department observation units: a clinical and financial benefit for hospitals. Health Care Manag Rev. 2011;36(1):28–37.
- , , , et al. Randomised controlled trial and economic evaluation of a chest pain observation unit compared with routine care. BMJ. 2004;328(7434):254.
- , , , , . Patient satisfaction with an emergency department asthma observation unit. Acad Emerg Med. 1999;6(3):178–183.
- , , , , , . Making greater use of dedicated hospital observation units for many short‐stay patients could save $3.1 billion a year. Health Aff (Millwood). 2012;31(10):2314–2323.
- , , , . The Impact of emergency department observation units on U.S. emergency department admission rates. J Hosp Med. 2015;10(11):738–742.
- , . Systematic review of emergency department crowding: causes, effects, and solutions. Ann Emerg Med. 2008;52(2):126–136.
- , , , . A national survey of observation units in the United States. Am J Emerg Med. 2003;21(7):529–533.
- , , , . An evaluation of emergency physician selection of observation unit patients. Am J Emerg Med. 2006;24(3):271–279.
- , . Reducing patient financial liability for hospitalizations: the physician role. J Hosp Med. 2010;5(3):160–162.
- , , . Sharp rise in Medicare enrollees being held in hospitals for observation raises concerns about causes and consequences. Health Aff (Millwood). 2012;31(6):1251–1259.
- , , , , , . Revisiting the economic efficiencies of observation units. Manag Care. 2015;24(3):46–52.