User login
Limitations of Using Pediatric Respiratory Illness Readmissions to Compare Hospital Performance
Respiratory illnesses are the leading causes of pediatric hospitalizations in the United States.1 The 30-day hospital readmission rate for respiratory illnesses is being considered for implementation as a national hospital performance measure, as it may be an indicator of lower quality care (eg, poor hospital management of disease, inadequate patient/caretaker education prior to discharge). In adult populations, readmissions can be used to reliably identify variation in hospital performance and successfully drive efforts to improve the value of care.2, 3 In contrast, there are persistent concerns about using pediatric readmissions to identify variation in hospital performance, largely due to lower patient volumes.4-7 To increase the value of pediatric hospital care, it is important to develop ways to meaningfully measure quality of care and further, to better understand the relationship between measures of quality and healthcare costs.
In December 2016, the National Quality Forum (NQF) endorsed a Pediatric Lower Respiratory Infection (LRI) Readmission Measure.8 This measure was developed by the Pediatric Quality Measurement Program, through the Agency for Healthcare Research and Quality. The goal of this program was to “increase the portfolio of evidence-based, consensus pediatric quality measures available to public and private purchasers of children’s healthcare services, providers, and consumers.”9
In anticipation of the national implementation of pediatric readmission measures, we examined whether the Pediatric LRI Readmission Measure could meaningfully identify high and low performers across all types of hospitals admitting children (general hospitals and children’s hospitals) using an all-payer claims database. A recent analysis by Nakamura et al. identified high and low performers using this measure10 but limited the analysis to hospitals with >50 pediatric LRI admissions per year, an approach that excludes many general hospitals. Since general hospitals provide the majority of care for children hospitalized with respiratory infections,11 we aimed to evaluate the measure in a broadly inclusive analysis that included all hospital types. Because low patient volumes might limit use of the measure,4,6 we tested several broadened variations of the measure. We also examined the relationship between hospital performance in pediatric LRI readmissions and healthcare costs.
Our analysis is intended to inform utilizers of pediatric quality metrics and policy makers about the feasibility of using these metrics to publicly report hospital performance and/or identify exceptional hospitals for understanding best practices in pediatric inpatient care.12
METHODS
Study Design and Data Source
We conducted an observational, retrospective cohort analysis using the 2012-2014 California Office of Statewide Health Planning and Development (OSHPD) nonpublic inpatient and emergency department databases.13 The OSHPD databases are compiled annually through mandatory reporting by all licensed nonfederal hospitals in California. The databases contain demographic (eg, age, gender) and utilization data (eg, charges) and can track readmissions to hospitals other than the index hospital. The databases capture administrative claims from approximately 450 hospitals, composed of 16 million inpatients, emergency department patients, and ambulatory surgery patients annually. Data quality is monitored through the California OSHPD.
Study Population
Our study included children aged ≤18 years with LRI, defined using the NQF Pediatric LRI Readmissions Measure: a primary diagnosis of bronchiolitis, influenza, or pneumonia, or a secondary diagnosis of bronchiolitis, influenza, or pneumonia, with a primary diagnosis of asthma, respiratory failure, sepsis, or bacteremia.8 International classification of Diseases, 9th edition (ICD-9) diagnostic codes used are in Appendix 1.
Per the NQF measure specifications,8 records were excluded if they were from hospitals with <80% of records complete with core elements (unique patient identifier, admission date, end-of-service date, and ICD-9 primary diagnosis code). In addition, records were excluded for the following reasons: (1) individual record missing core elements, (2) discharge disposition “death,” (3) 30-day follow-up data not available, (4) primary “newborn” or mental health diagnosis, or (5) primary ICD-9 procedure code for a planned procedure or chemotherapy.
Patient characteristics for hospital admissions with and without 30-day readmissions or 30-day emergency department (ED) revisits were summarized. For the continuous variable age, mean and standard deviation for each group were calculated. For categorical variables (sex, race, payer, and number of chronic conditions), numbers and proportions were determined. Univariate tests of comparison were carried out using the Student’s t test for age and chi-square tests for all categorical variables. Categories of payer with small values were combined for ease of description (categories combined into “other:” workers’ compensation, county indigent programs, other government, other indigent, self-pay, other payer). We identified chronic conditions using the Agency for Healthcare Research and Quality Chronic Condition Indicator (CCI) system, which classifies ICD-9-CM diagnosis codes as chronic or acute and places each code into 1 of 18 mutually exclusive categories (organ systems, disease categories, or other categories). The case-mix adjustment model incorporates a binary variable for each CCI category (0-1, 2, 3, or >4 chronic conditions) per the NQF measure specifications.8 This study was approved by the University of California, San Francisco Institutional Review Board.
Outcomes
Our primary outcome was the hospital-level rate of 30-day readmission after hospital discharge, consistent with the NQF measure.8 We identified outlier hospitals for 30-day readmission rate using the Centers for Medicare and Medicaid Services (CMS) methodology, which defines outlier hospitals as those for whom adjusted readmission rate confidence intervals do not overlap with the overall group mean rate.5, 14
We also determined the hospital-level average cost per index hospitalization (not including costs of readmissions). Since costs of care often differ substantially from charges,15 costs were calculated using cost-to-charge ratios for each hospital (annual total operating expenses/total gross patient revenue, as reported to the OSHPD).16 Costs were subdivided into categories representing $5,000 increments and a top category of >$40,000. Outlier hospitals for costs were defined as those for whom the cost random effect was either greater than the third quartile of the distribution of values by more than 1.5 times the interquartile range or less than the first quartile of the distribution of values by more than 1.5 times the interquartile range.17
ANALYSIS
Primary Analysis
For our primary analysis of 30-day hospital readmission rates, we used hierarchical logistic regression models with hospitals as random effects, adjusting for patient age, sex, and the presence and number of body systems affected by chronic conditions.8 These 4 patient characteristics were selected by the NQF measure developers “because distributions of these characteristics vary across hospitals, and although they are associated with readmission risk, they are independent of hospital quality of care.”10
Because the Centers for Medicare and Medicaid Services (CMS) are in the process of selecting pediatric quality measures for meaningful use reporting,18 we utilized CMS hospital readmissions methodology to calculate risk-adjusted rates and identify outlier hospitals. The CMS modeling strategy stabilizes performance estimates for low-volume hospitals and avoids penalizing these hospitals for high readmission rates that may be due to chance (random effects logistic model to obtain best linear unbiased predictions). This is particularly important in pediatrics, given the low pediatric volumes in many hospitals admitting children.4,19 We then identified outlier hospitals for the 30-day readmission rate using CMS methodology (hospital’s adjusted readmission rate confidence interval does not overlap the overall group mean rate).5, 4 CMS uses this approach for public reporting on HospitalCompare.20
Sensitivity Analyses
We tested several broadening variations of the NQF measure: (1) addition of children admitted with a primary diagnosis of asthma (without requiring LRI as a secondary diagnosis) or a secondary diagnosis of asthma exacerbation (LRIA), (2) inclusion of 30-day ED revisits as an outcome, and (3) merging of 3 years of data. These analyses were all performed using the same modeling strategy as in our primary analysis.
Secondary Outcome Analyses
Our analysis of hospital costs used costs for index admissions over 3 years (2012–2014) and included admissions for asthma. We used hierarchical regression models with hospitals as random effects, adjusting for age, gender, and the presence and number of chronic conditions. The distribution of cost values was highly skewed, so ordinal models were selected after several other modeling approaches failed (log transformation linear model, gamma model, Poisson model, zero-truncated Poisson model).
The relationship between hospital-level costs and hospital-level 30-day readmission or ED revisit rates was analyzed using Spearman’s rank correlation coefficient. Statistical analysis was performed using SAS version 9.4 software (SAS Institute; Cary, North Carolina).
RESULTS
Primary Analysis of 30-day Readmissions (per National Quality Forum Measure)
Our analysis of the 2014 OSHPD database using the specifications of the NQF Pediatric LRI Readmission Measure included a total of 5550 hospitalizations from 174 hospitals, with a mean of 12 eligible hospitalizations per hospital. The mean risk-adjusted readmission rate was 6.5% (362 readmissions). There were no hospitals that were considered outliers based on the risk-adjusted readmission rates (Table 1).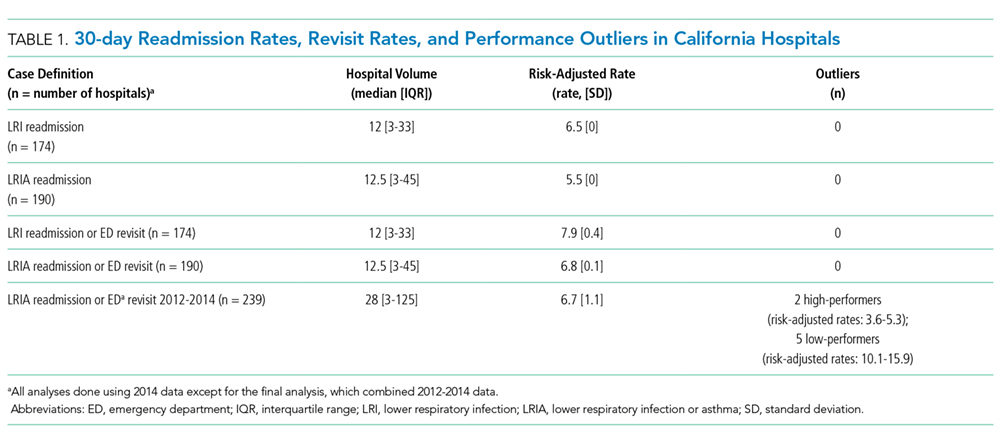
Sensitivity Analyses (Broadening Definitions of National Quality Forum Measure)
We report our testing of the broadened variations of the NQF measure in Table 1. Broadening the population to include children with asthma as a primary diagnosis and children with asthma exacerbations as a secondary diagnosis (LRIA) increased the size of our analysis to 8402 hospitalizations from 190 hospitals. The mean risk-adjusted readmission rate was 5.5%, and no outlier hospitals were identified.
Using the same inclusion criteria of the NQF measure but including 30-day ED revisits as an outcome, we analyzed a total of 5500 hospitalizations from 174 hospitals. The mean risk-adjusted event rate was higher at 7.9%, but there were still no outlier hospitals identified.
Using the broadened population definition (LRIA) and including 30-day ED revisits as an outcome, we analyzed a total of 8402 hospitalizations from 190 hospitals. The mean risk-adjusted event rate was 6.8%, but there were still no outlier hospitals identified.
In our final iteration, we merged 3 years of hospital data (2012-2014) using the broader population definition (LRIA) and including 30-day ED revisits as an outcome. This resulted in 27,873 admissions from 239 hospitals for this analysis, with a mean of 28 eligible hospitalizations per hospital. The mean risk-adjusted event rate was 6.7%, and this approach identified 2 high-performing (risk-adjusted rates: 3.6-5.3) and 7 low-performing hospitals (risk-adjusted rates: 10.1-15.9).
Table 2 presents the demographics of children included in this analysis. Children who had readmissions/revisits were younger, more likely to be white, less likely to have private insurance, and more likely to have a greater number of chronic conditions compared to children without readmissions/revisits.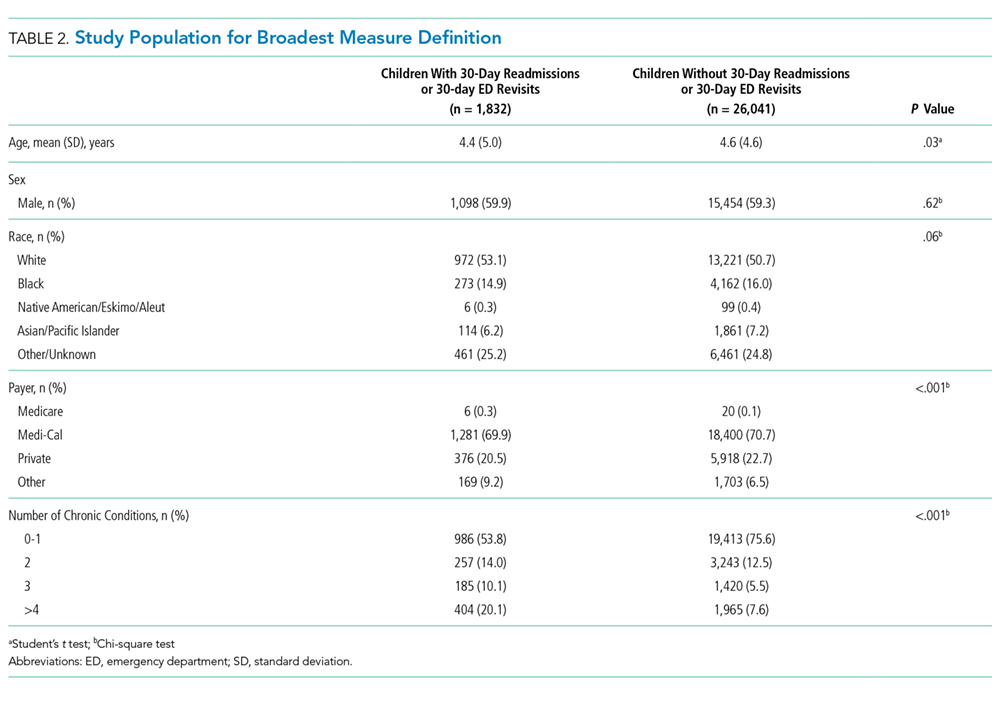
Secondary Outcome: Hospital Costs
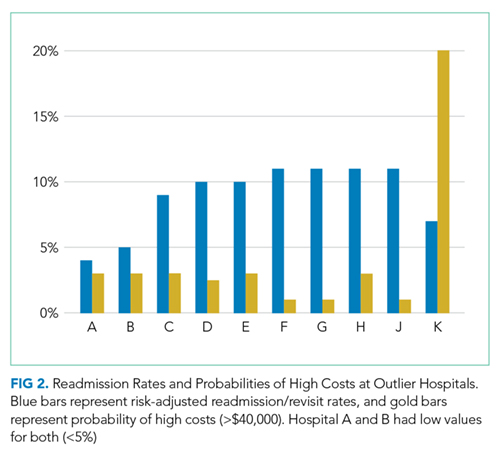
In the analysis of hospital-level costs, we found only 1 outlier high-cost hospital. There was a 20% probability of a hospital respiratory admission costing ≥$40,000 at this hospital. We found no overall relationship between hospital 30-day respiratory readmission rate and hospital costs (Figure 1). However, the hospitals that were outliers for low readmission rates also had low probabilities of excessive hospital costs (3% probability of costs >$40,000; Figure 2).
DISCUSSION
We used a nationally endorsed pediatric quality measure to evaluate hospital performance, defined as 30-day readmission rates for children with respiratory illness. We examined all-payer data from California, which is the most populous state in the country and home to 1 in 8 American children. In this large California dataset, we were unable to identify meaningful variation in hospital performance due to low hospital volumes and event rates. However, when we broadened the measure definition, we were able to identify performance variation. Our findings underscore the importance of testing and potentially modifying existing quality measures in order to more accurately capture the quality of care delivered at hospitals with lower volumes of pediatric patients.21
Our underlying assumption, in light of these prior studies, was that increasing the eligible sample in each hospital by combining respiratory diseases and by using an all-payer claims database rather than a Medicaid-only database would increase the number of detectable outlier hospitals. However, we found that these approaches did not ameliorate the limitations of small volumes. Only through aggregating data over 3 years was it possible to identify any outliers, and this approach identified only 3% of hospitals as outliers. Hence, our analysis reinforces concerns raised by several prior analyses4-7 regarding the limited ability of current pediatric readmission measures to detect meaningful, actionable differences in performance across all types of hospitals (including general/nonchildren’s hospitals). This issue is of particular concern for common pediatric conditions like respiratory illnesses, for which >70% of hospitalizations occur in general hospitals.11
Developers and utilizers of pediatric quality metrics should consider strategies for identifying meaningful, actionable variation in pediatric quality of care at general hospitals. These strategies might include our approach of combining several years of hospital data in order to reach adequate volumes for measuring performance. The potential downside to this approach is performance lag—specifically, hospitals implementing quality improvement readmissions programs may not see changes in their performance for a year or two on a measure aggregating 3 years of data. Alternatively, it is possible that the measure might be used more appropriately across a larger group of hospitals, either to assess performance for multihospital accountable care organization (ACO), or to assess performance for a service area or county. An aggregated group of hospitals would increase the eligible patient volume and, if there is an ACO relationship established, coordinated interventions could be implemented across the hospitals.
We examined the 30-day readmission rate because it is the current standard used by CMS and all NQF-endorsed readmission measures.22,23 Another potential approach is to analyze the 7- or 15-day readmission rate. However, these rates may be similarly limited in identifying hospital performance due to low volumes and event rates. An analysis by Wallace et al. of preventable readmissions to a tertiary children’s hospital found that, while many occurred within 7 days or 15 days, 27% occurred after 7 days and 22%, after 15.24 However, an analysis of several adult 30-day readmission measures used by CMS found that the contribution of hospital-level quality to the readmission rate (measured by intracluster correlation coefficient) reached a nadir at 7 days, which suggests that most readmissions after the seventh day postdischarge were explained by community- and household-level factors beyond hospitals’ control.22 Hence, though 7- or 15-day readmission rates may better represent preventable outcomes under the hospital’s control, the lower event rates and low hospital volumes likely similarly limit the feasibility of their use for performance measurement.
Pediatric quality measures are additionally intended to drive improvements in the value of pediatric care, defined as quality relative to costs.25 In order to better understand the relationship of hospital performance across both the domains of readmissions (quality) and costs, we examined hospital-level costs for care of pediatric respiratory illnesses. We found no overall relationship between hospital readmission rates and costs; however, we found 2 hospitals in California that had significantly lower readmission rates as well as low costs. Close examination of hospitals such as these, which demonstrate exceptional performance in quality and costs, may promote the discovery and dissemination of strategies to improve the value of pediatric care.12
Our study had several limitations. First, the OSHPD database lacked detailed clinical variables to correct for additional case-mix differences between hospitals. However, we used the approach of case-mix adjustment outlined by an NQF-endorsed national quality metric.8 Secondly, since our data were limited to a single state, analyses of other databases may have yielded different results. However, prior analyses using other multistate databases reported similar limitations,5,6 likely due to the limitations of patient volume that are generalizable to settings outside of California. In addition, our cost analysis was performed using cost-to-charge ratios that represent total annual expenses/revenue for the whole hospital.16 These ratios may not be reflective of the specific services provided for children in our analysis; however, service-specific costs were not available, and cost-to-charge ratios are commonly used to report costs.
CONCLUSION
The ability of a nationally-endorsed pediatric respiratory readmissions measure to meaningfully identify variation in hospital performance is limited. General hospitals, which provide the majority of pediatric care for common conditions such as LRI, likely cannot be accurately evaluated using national pediatric quality metrics as they are currently designed. Modifying measures in order to increase hospital-level pediatric patient volumes may facilitate more meaningful evaluation of the quality of pediatric care in general hospitals and identification of exceptional hospitals for understanding best practices in pediatric inpatient care.
Disclosures
Regina Lam consulted for Proximity Health doing market research during the course of developing this manuscript, but this work did not involve any content related to quality metrics, and this entity did not play any role in the development of this manuscript. The remaining authors have no conflicts of interest relevant to this article to disclose.
Funding
Supported by the Agency for Healthcare Research and Quality (K08 HS24592 to SVK and U18HS25297 to MDC and NSB) and the National Institute of Child Health and Human Development (K23HD065836 to NSB). The funding agency played no role in the study design; the collection, analysis, and interpretation of data; the writing of the report; or the decision to submit the manuscript for publication.
1. Agency for Healthcare Research and Quality. Overview of hospital stays for children in the United States. https://www.hcup-us.ahrq.gov/reports/statbriefs/sb187-Hospital-Stays-Children-2012.jsp. Accessed September 1, 2017; 2012. PubMed
2. Mendelson A, Kondo K, Damberg C, et al. The effects of pay-for-performance programs on health, health care use, and processes of care: A systematic review. Ann Intern Med. 2017;166(5):341-353. doi: 10.7326/M16-1881. PubMed
3. Zuckerman RB, Sheingold SH, Orav EJ, Ruhter J, Epstein AM. Readmissions, observation, and the hospital readmissions reduction program. N Engl J Med. 2016;374(16):1543-1551. doi: 10.1056/NEJMsa1513024. PubMed
4. Bardach NS, Chien AT, Dudley RA. Small numbers limit the use of the inpatient pediatric quality indicators for hospital comparison. Acad Pediatr. 2010;10(4):266-273. doi: 10.1016/j.acap.2010.04.025. PubMed
5. Bardach NS, Vittinghoff E, Asteria-Peñaloza R, et al. Measuring hospital quality using pediatric readmission and revisit rates. Pediatrics. 2013;132(3):429-436. doi: 10.1542/peds.2012-3527. PubMed
6. Berry JG, Zaslavsky AM, Toomey SL, et al. Recognizing differences in hospital quality performance for pediatric inpatient care. Pediatrics. 2015;136(2):251-262. doi: 10.1542/peds.2014-3131. PubMed
7. Hain PD, Gay JC, Berutti TW, Whitney GM, Wang W, Saville BR. Preventability of early readmissions at a children’s hospital. Pediatrics. 2013;131(1):e171-e181. doi: 10.1542/peds.2012-0820. PubMed
8. Agency for Healthcare Research and Quality. Pediatric lower respiratory infection readmission measure. https://www.ahrq.gov/sites/default/files/wysiwyg/policymakers/chipra/factsheets/chipra_1415-p008-2-ef.pdf. Accessed September 3, 2017.
9. Agency for Healthcare Research and Quality. CHIPRA Pediatric Quality Measures Program. https://archive.ahrq.gov/policymakers/chipra/pqmpback.html. Accessed October 10, 2017.
10. Nakamura MM, Zaslavsky AM, Toomey SL, et al. Pediatric readmissions After hospitalizations for lower respiratory infections. Pediatrics. 2017;140(2). doi: 10.1542/peds.2016-0938. PubMed
11. Leyenaar JK, Ralston SL, Shieh MS, Pekow PS, Mangione-Smith R, Lindenauer PK. Epidemiology of pediatric hospitalizations at general hospitals and freestanding children’s hospitals in the United States. J Hosp Med. 2016;11(11):743-749. doi: 10.1002/jhm.2624. PubMed
12. Bradley EH, Curry LA, Ramanadhan S, Rowe L, Nembhard IM, Krumholz HM. Research in action: using positive deviance to improve quality of health care. Implement Sci. 2009;4:25. doi: 10.1186/1748-5908-4-25. PubMed
13. California Office of Statewide Health Planning and Development. Data and reports. https://www.oshpd.ca.gov/HID/. Accessed September 3, 2017.
14. QualityNet. Measure methodology reports. https://www.qualitynet.org/dcs/ContentServer?c=Page&pagename=QnetPublic%2FPage%2FQnetTier4&cid=1219069855841. Accessed October 10, 2017.
15. Riley GF. Administrative and claims records as sources of health care cost data. Med Care. 2009;47(7 Suppl 1):S51-S55. doi: 10.1097/MLR.0b013e31819c95aa. PubMed
16. California Office of Statewide Health Planning and Development. Annual financial data. https://www.oshpd.ca.gov/HID/Hospital-Financial.asp. Accessed September 3, 2017.
17. Tukey J. Exploratory Data Analysis: Pearson; London, United Kingdom. 1977.
18. Centers for Medicare and Medicaid Services. Core measures. https://www.cms.gov/Medicare/Quality-Initiatives-Patient-Assessment-Instruments/QualityMeasures/Core-Measures.html. Accessed September 1, 2017.
19. Berry JG, Toomey SL, Zaslavsky AM, et al. Pediatric readmission prevalence and variability across hospitals. JAMA. 2013;309(4):372-380. doi: 10.1001/jama.2012.188351. PubMed
20. Centers for Medicare and Medicaid Services. HospitalCompare. https://www.medicare.gov/hospitalcompare/search.html. Accessed on October 10, 2017.
21. Mangione-Smith R. The challenges of addressing pediatric quality measurement gaps. Pediatrics. 2017;139(4). doi: 10.1542/peds.2017-0174. PubMed
22. Chin DL, Bang H, Manickam RN, Romano PS. Rethinking thirty-day hospital readmissions: shorter intervals might be better indicators of quality of care. Health Aff (Millwood). 2016;35(10):1867-1875. doi: 10.1377/hlthaff.2016.0205. PubMed
23. National Quality Forum. Measures, reports, and tools. http://www.qualityforum.org/Measures_Reports_Tools.aspx. Accessed March 1, 2018.
24. Wallace SS, Keller SL, Falco CN, et al. An examination of physician-, caregiver-, and disease-related factors associated With readmission From a pediatric hospital medicine service. Hosp Pediatr. 2015;5(11):566-573. doi: 10.1542/hpeds.2015-0015. PubMed
25. Porter ME. What is value in health care? N Engl J Med. 2010;363(26):2477-2481. doi: 10.1056/NEJMp1011024. PubMed
Respiratory illnesses are the leading causes of pediatric hospitalizations in the United States.1 The 30-day hospital readmission rate for respiratory illnesses is being considered for implementation as a national hospital performance measure, as it may be an indicator of lower quality care (eg, poor hospital management of disease, inadequate patient/caretaker education prior to discharge). In adult populations, readmissions can be used to reliably identify variation in hospital performance and successfully drive efforts to improve the value of care.2, 3 In contrast, there are persistent concerns about using pediatric readmissions to identify variation in hospital performance, largely due to lower patient volumes.4-7 To increase the value of pediatric hospital care, it is important to develop ways to meaningfully measure quality of care and further, to better understand the relationship between measures of quality and healthcare costs.
In December 2016, the National Quality Forum (NQF) endorsed a Pediatric Lower Respiratory Infection (LRI) Readmission Measure.8 This measure was developed by the Pediatric Quality Measurement Program, through the Agency for Healthcare Research and Quality. The goal of this program was to “increase the portfolio of evidence-based, consensus pediatric quality measures available to public and private purchasers of children’s healthcare services, providers, and consumers.”9
In anticipation of the national implementation of pediatric readmission measures, we examined whether the Pediatric LRI Readmission Measure could meaningfully identify high and low performers across all types of hospitals admitting children (general hospitals and children’s hospitals) using an all-payer claims database. A recent analysis by Nakamura et al. identified high and low performers using this measure10 but limited the analysis to hospitals with >50 pediatric LRI admissions per year, an approach that excludes many general hospitals. Since general hospitals provide the majority of care for children hospitalized with respiratory infections,11 we aimed to evaluate the measure in a broadly inclusive analysis that included all hospital types. Because low patient volumes might limit use of the measure,4,6 we tested several broadened variations of the measure. We also examined the relationship between hospital performance in pediatric LRI readmissions and healthcare costs.
Our analysis is intended to inform utilizers of pediatric quality metrics and policy makers about the feasibility of using these metrics to publicly report hospital performance and/or identify exceptional hospitals for understanding best practices in pediatric inpatient care.12
METHODS
Study Design and Data Source
We conducted an observational, retrospective cohort analysis using the 2012-2014 California Office of Statewide Health Planning and Development (OSHPD) nonpublic inpatient and emergency department databases.13 The OSHPD databases are compiled annually through mandatory reporting by all licensed nonfederal hospitals in California. The databases contain demographic (eg, age, gender) and utilization data (eg, charges) and can track readmissions to hospitals other than the index hospital. The databases capture administrative claims from approximately 450 hospitals, composed of 16 million inpatients, emergency department patients, and ambulatory surgery patients annually. Data quality is monitored through the California OSHPD.
Study Population
Our study included children aged ≤18 years with LRI, defined using the NQF Pediatric LRI Readmissions Measure: a primary diagnosis of bronchiolitis, influenza, or pneumonia, or a secondary diagnosis of bronchiolitis, influenza, or pneumonia, with a primary diagnosis of asthma, respiratory failure, sepsis, or bacteremia.8 International classification of Diseases, 9th edition (ICD-9) diagnostic codes used are in Appendix 1.
Per the NQF measure specifications,8 records were excluded if they were from hospitals with <80% of records complete with core elements (unique patient identifier, admission date, end-of-service date, and ICD-9 primary diagnosis code). In addition, records were excluded for the following reasons: (1) individual record missing core elements, (2) discharge disposition “death,” (3) 30-day follow-up data not available, (4) primary “newborn” or mental health diagnosis, or (5) primary ICD-9 procedure code for a planned procedure or chemotherapy.
Patient characteristics for hospital admissions with and without 30-day readmissions or 30-day emergency department (ED) revisits were summarized. For the continuous variable age, mean and standard deviation for each group were calculated. For categorical variables (sex, race, payer, and number of chronic conditions), numbers and proportions were determined. Univariate tests of comparison were carried out using the Student’s t test for age and chi-square tests for all categorical variables. Categories of payer with small values were combined for ease of description (categories combined into “other:” workers’ compensation, county indigent programs, other government, other indigent, self-pay, other payer). We identified chronic conditions using the Agency for Healthcare Research and Quality Chronic Condition Indicator (CCI) system, which classifies ICD-9-CM diagnosis codes as chronic or acute and places each code into 1 of 18 mutually exclusive categories (organ systems, disease categories, or other categories). The case-mix adjustment model incorporates a binary variable for each CCI category (0-1, 2, 3, or >4 chronic conditions) per the NQF measure specifications.8 This study was approved by the University of California, San Francisco Institutional Review Board.
Outcomes
Our primary outcome was the hospital-level rate of 30-day readmission after hospital discharge, consistent with the NQF measure.8 We identified outlier hospitals for 30-day readmission rate using the Centers for Medicare and Medicaid Services (CMS) methodology, which defines outlier hospitals as those for whom adjusted readmission rate confidence intervals do not overlap with the overall group mean rate.5, 14
We also determined the hospital-level average cost per index hospitalization (not including costs of readmissions). Since costs of care often differ substantially from charges,15 costs were calculated using cost-to-charge ratios for each hospital (annual total operating expenses/total gross patient revenue, as reported to the OSHPD).16 Costs were subdivided into categories representing $5,000 increments and a top category of >$40,000. Outlier hospitals for costs were defined as those for whom the cost random effect was either greater than the third quartile of the distribution of values by more than 1.5 times the interquartile range or less than the first quartile of the distribution of values by more than 1.5 times the interquartile range.17
ANALYSIS
Primary Analysis
For our primary analysis of 30-day hospital readmission rates, we used hierarchical logistic regression models with hospitals as random effects, adjusting for patient age, sex, and the presence and number of body systems affected by chronic conditions.8 These 4 patient characteristics were selected by the NQF measure developers “because distributions of these characteristics vary across hospitals, and although they are associated with readmission risk, they are independent of hospital quality of care.”10
Because the Centers for Medicare and Medicaid Services (CMS) are in the process of selecting pediatric quality measures for meaningful use reporting,18 we utilized CMS hospital readmissions methodology to calculate risk-adjusted rates and identify outlier hospitals. The CMS modeling strategy stabilizes performance estimates for low-volume hospitals and avoids penalizing these hospitals for high readmission rates that may be due to chance (random effects logistic model to obtain best linear unbiased predictions). This is particularly important in pediatrics, given the low pediatric volumes in many hospitals admitting children.4,19 We then identified outlier hospitals for the 30-day readmission rate using CMS methodology (hospital’s adjusted readmission rate confidence interval does not overlap the overall group mean rate).5, 4 CMS uses this approach for public reporting on HospitalCompare.20
Sensitivity Analyses
We tested several broadening variations of the NQF measure: (1) addition of children admitted with a primary diagnosis of asthma (without requiring LRI as a secondary diagnosis) or a secondary diagnosis of asthma exacerbation (LRIA), (2) inclusion of 30-day ED revisits as an outcome, and (3) merging of 3 years of data. These analyses were all performed using the same modeling strategy as in our primary analysis.
Secondary Outcome Analyses
Our analysis of hospital costs used costs for index admissions over 3 years (2012–2014) and included admissions for asthma. We used hierarchical regression models with hospitals as random effects, adjusting for age, gender, and the presence and number of chronic conditions. The distribution of cost values was highly skewed, so ordinal models were selected after several other modeling approaches failed (log transformation linear model, gamma model, Poisson model, zero-truncated Poisson model).
The relationship between hospital-level costs and hospital-level 30-day readmission or ED revisit rates was analyzed using Spearman’s rank correlation coefficient. Statistical analysis was performed using SAS version 9.4 software (SAS Institute; Cary, North Carolina).
RESULTS
Primary Analysis of 30-day Readmissions (per National Quality Forum Measure)
Our analysis of the 2014 OSHPD database using the specifications of the NQF Pediatric LRI Readmission Measure included a total of 5550 hospitalizations from 174 hospitals, with a mean of 12 eligible hospitalizations per hospital. The mean risk-adjusted readmission rate was 6.5% (362 readmissions). There were no hospitals that were considered outliers based on the risk-adjusted readmission rates (Table 1).
Sensitivity Analyses (Broadening Definitions of National Quality Forum Measure)
We report our testing of the broadened variations of the NQF measure in Table 1. Broadening the population to include children with asthma as a primary diagnosis and children with asthma exacerbations as a secondary diagnosis (LRIA) increased the size of our analysis to 8402 hospitalizations from 190 hospitals. The mean risk-adjusted readmission rate was 5.5%, and no outlier hospitals were identified.
Using the same inclusion criteria of the NQF measure but including 30-day ED revisits as an outcome, we analyzed a total of 5500 hospitalizations from 174 hospitals. The mean risk-adjusted event rate was higher at 7.9%, but there were still no outlier hospitals identified.
Using the broadened population definition (LRIA) and including 30-day ED revisits as an outcome, we analyzed a total of 8402 hospitalizations from 190 hospitals. The mean risk-adjusted event rate was 6.8%, but there were still no outlier hospitals identified.
In our final iteration, we merged 3 years of hospital data (2012-2014) using the broader population definition (LRIA) and including 30-day ED revisits as an outcome. This resulted in 27,873 admissions from 239 hospitals for this analysis, with a mean of 28 eligible hospitalizations per hospital. The mean risk-adjusted event rate was 6.7%, and this approach identified 2 high-performing (risk-adjusted rates: 3.6-5.3) and 7 low-performing hospitals (risk-adjusted rates: 10.1-15.9).
Table 2 presents the demographics of children included in this analysis. Children who had readmissions/revisits were younger, more likely to be white, less likely to have private insurance, and more likely to have a greater number of chronic conditions compared to children without readmissions/revisits.
Secondary Outcome: Hospital Costs
In the analysis of hospital-level costs, we found only 1 outlier high-cost hospital. There was a 20% probability of a hospital respiratory admission costing ≥$40,000 at this hospital. We found no overall relationship between hospital 30-day respiratory readmission rate and hospital costs (Figure 1). However, the hospitals that were outliers for low readmission rates also had low probabilities of excessive hospital costs (3% probability of costs >$40,000; Figure 2).
DISCUSSION
We used a nationally endorsed pediatric quality measure to evaluate hospital performance, defined as 30-day readmission rates for children with respiratory illness. We examined all-payer data from California, which is the most populous state in the country and home to 1 in 8 American children. In this large California dataset, we were unable to identify meaningful variation in hospital performance due to low hospital volumes and event rates. However, when we broadened the measure definition, we were able to identify performance variation. Our findings underscore the importance of testing and potentially modifying existing quality measures in order to more accurately capture the quality of care delivered at hospitals with lower volumes of pediatric patients.21
Our underlying assumption, in light of these prior studies, was that increasing the eligible sample in each hospital by combining respiratory diseases and by using an all-payer claims database rather than a Medicaid-only database would increase the number of detectable outlier hospitals. However, we found that these approaches did not ameliorate the limitations of small volumes. Only through aggregating data over 3 years was it possible to identify any outliers, and this approach identified only 3% of hospitals as outliers. Hence, our analysis reinforces concerns raised by several prior analyses4-7 regarding the limited ability of current pediatric readmission measures to detect meaningful, actionable differences in performance across all types of hospitals (including general/nonchildren’s hospitals). This issue is of particular concern for common pediatric conditions like respiratory illnesses, for which >70% of hospitalizations occur in general hospitals.11
Developers and utilizers of pediatric quality metrics should consider strategies for identifying meaningful, actionable variation in pediatric quality of care at general hospitals. These strategies might include our approach of combining several years of hospital data in order to reach adequate volumes for measuring performance. The potential downside to this approach is performance lag—specifically, hospitals implementing quality improvement readmissions programs may not see changes in their performance for a year or two on a measure aggregating 3 years of data. Alternatively, it is possible that the measure might be used more appropriately across a larger group of hospitals, either to assess performance for multihospital accountable care organization (ACO), or to assess performance for a service area or county. An aggregated group of hospitals would increase the eligible patient volume and, if there is an ACO relationship established, coordinated interventions could be implemented across the hospitals.
We examined the 30-day readmission rate because it is the current standard used by CMS and all NQF-endorsed readmission measures.22,23 Another potential approach is to analyze the 7- or 15-day readmission rate. However, these rates may be similarly limited in identifying hospital performance due to low volumes and event rates. An analysis by Wallace et al. of preventable readmissions to a tertiary children’s hospital found that, while many occurred within 7 days or 15 days, 27% occurred after 7 days and 22%, after 15.24 However, an analysis of several adult 30-day readmission measures used by CMS found that the contribution of hospital-level quality to the readmission rate (measured by intracluster correlation coefficient) reached a nadir at 7 days, which suggests that most readmissions after the seventh day postdischarge were explained by community- and household-level factors beyond hospitals’ control.22 Hence, though 7- or 15-day readmission rates may better represent preventable outcomes under the hospital’s control, the lower event rates and low hospital volumes likely similarly limit the feasibility of their use for performance measurement.
Pediatric quality measures are additionally intended to drive improvements in the value of pediatric care, defined as quality relative to costs.25 In order to better understand the relationship of hospital performance across both the domains of readmissions (quality) and costs, we examined hospital-level costs for care of pediatric respiratory illnesses. We found no overall relationship between hospital readmission rates and costs; however, we found 2 hospitals in California that had significantly lower readmission rates as well as low costs. Close examination of hospitals such as these, which demonstrate exceptional performance in quality and costs, may promote the discovery and dissemination of strategies to improve the value of pediatric care.12
Our study had several limitations. First, the OSHPD database lacked detailed clinical variables to correct for additional case-mix differences between hospitals. However, we used the approach of case-mix adjustment outlined by an NQF-endorsed national quality metric.8 Secondly, since our data were limited to a single state, analyses of other databases may have yielded different results. However, prior analyses using other multistate databases reported similar limitations,5,6 likely due to the limitations of patient volume that are generalizable to settings outside of California. In addition, our cost analysis was performed using cost-to-charge ratios that represent total annual expenses/revenue for the whole hospital.16 These ratios may not be reflective of the specific services provided for children in our analysis; however, service-specific costs were not available, and cost-to-charge ratios are commonly used to report costs.
CONCLUSION
The ability of a nationally-endorsed pediatric respiratory readmissions measure to meaningfully identify variation in hospital performance is limited. General hospitals, which provide the majority of pediatric care for common conditions such as LRI, likely cannot be accurately evaluated using national pediatric quality metrics as they are currently designed. Modifying measures in order to increase hospital-level pediatric patient volumes may facilitate more meaningful evaluation of the quality of pediatric care in general hospitals and identification of exceptional hospitals for understanding best practices in pediatric inpatient care.
Disclosures
Regina Lam consulted for Proximity Health doing market research during the course of developing this manuscript, but this work did not involve any content related to quality metrics, and this entity did not play any role in the development of this manuscript. The remaining authors have no conflicts of interest relevant to this article to disclose.
Funding
Supported by the Agency for Healthcare Research and Quality (K08 HS24592 to SVK and U18HS25297 to MDC and NSB) and the National Institute of Child Health and Human Development (K23HD065836 to NSB). The funding agency played no role in the study design; the collection, analysis, and interpretation of data; the writing of the report; or the decision to submit the manuscript for publication.
1. Agency for Healthcare Research and Quality. Overview of hospital stays for children in the United States. https://www.hcup-us.ahrq.gov/reports/statbriefs/sb187-Hospital-Stays-Children-2012.jsp. Accessed September 1, 2017; 2012. PubMed
2. Mendelson A, Kondo K, Damberg C, et al. The effects of pay-for-performance programs on health, health care use, and processes of care: A systematic review. Ann Intern Med. 2017;166(5):341-353. doi: 10.7326/M16-1881. PubMed
3. Zuckerman RB, Sheingold SH, Orav EJ, Ruhter J, Epstein AM. Readmissions, observation, and the hospital readmissions reduction program. N Engl J Med. 2016;374(16):1543-1551. doi: 10.1056/NEJMsa1513024. PubMed
4. Bardach NS, Chien AT, Dudley RA. Small numbers limit the use of the inpatient pediatric quality indicators for hospital comparison. Acad Pediatr. 2010;10(4):266-273. doi: 10.1016/j.acap.2010.04.025. PubMed
5. Bardach NS, Vittinghoff E, Asteria-Peñaloza R, et al. Measuring hospital quality using pediatric readmission and revisit rates. Pediatrics. 2013;132(3):429-436. doi: 10.1542/peds.2012-3527. PubMed
6. Berry JG, Zaslavsky AM, Toomey SL, et al. Recognizing differences in hospital quality performance for pediatric inpatient care. Pediatrics. 2015;136(2):251-262. doi: 10.1542/peds.2014-3131. PubMed
7. Hain PD, Gay JC, Berutti TW, Whitney GM, Wang W, Saville BR. Preventability of early readmissions at a children’s hospital. Pediatrics. 2013;131(1):e171-e181. doi: 10.1542/peds.2012-0820. PubMed
8. Agency for Healthcare Research and Quality. Pediatric lower respiratory infection readmission measure. https://www.ahrq.gov/sites/default/files/wysiwyg/policymakers/chipra/factsheets/chipra_1415-p008-2-ef.pdf. Accessed September 3, 2017.
9. Agency for Healthcare Research and Quality. CHIPRA Pediatric Quality Measures Program. https://archive.ahrq.gov/policymakers/chipra/pqmpback.html. Accessed October 10, 2017.
10. Nakamura MM, Zaslavsky AM, Toomey SL, et al. Pediatric readmissions After hospitalizations for lower respiratory infections. Pediatrics. 2017;140(2). doi: 10.1542/peds.2016-0938. PubMed
11. Leyenaar JK, Ralston SL, Shieh MS, Pekow PS, Mangione-Smith R, Lindenauer PK. Epidemiology of pediatric hospitalizations at general hospitals and freestanding children’s hospitals in the United States. J Hosp Med. 2016;11(11):743-749. doi: 10.1002/jhm.2624. PubMed
12. Bradley EH, Curry LA, Ramanadhan S, Rowe L, Nembhard IM, Krumholz HM. Research in action: using positive deviance to improve quality of health care. Implement Sci. 2009;4:25. doi: 10.1186/1748-5908-4-25. PubMed
13. California Office of Statewide Health Planning and Development. Data and reports. https://www.oshpd.ca.gov/HID/. Accessed September 3, 2017.
14. QualityNet. Measure methodology reports. https://www.qualitynet.org/dcs/ContentServer?c=Page&pagename=QnetPublic%2FPage%2FQnetTier4&cid=1219069855841. Accessed October 10, 2017.
15. Riley GF. Administrative and claims records as sources of health care cost data. Med Care. 2009;47(7 Suppl 1):S51-S55. doi: 10.1097/MLR.0b013e31819c95aa. PubMed
16. California Office of Statewide Health Planning and Development. Annual financial data. https://www.oshpd.ca.gov/HID/Hospital-Financial.asp. Accessed September 3, 2017.
17. Tukey J. Exploratory Data Analysis: Pearson; London, United Kingdom. 1977.
18. Centers for Medicare and Medicaid Services. Core measures. https://www.cms.gov/Medicare/Quality-Initiatives-Patient-Assessment-Instruments/QualityMeasures/Core-Measures.html. Accessed September 1, 2017.
19. Berry JG, Toomey SL, Zaslavsky AM, et al. Pediatric readmission prevalence and variability across hospitals. JAMA. 2013;309(4):372-380. doi: 10.1001/jama.2012.188351. PubMed
20. Centers for Medicare and Medicaid Services. HospitalCompare. https://www.medicare.gov/hospitalcompare/search.html. Accessed on October 10, 2017.
21. Mangione-Smith R. The challenges of addressing pediatric quality measurement gaps. Pediatrics. 2017;139(4). doi: 10.1542/peds.2017-0174. PubMed
22. Chin DL, Bang H, Manickam RN, Romano PS. Rethinking thirty-day hospital readmissions: shorter intervals might be better indicators of quality of care. Health Aff (Millwood). 2016;35(10):1867-1875. doi: 10.1377/hlthaff.2016.0205. PubMed
23. National Quality Forum. Measures, reports, and tools. http://www.qualityforum.org/Measures_Reports_Tools.aspx. Accessed March 1, 2018.
24. Wallace SS, Keller SL, Falco CN, et al. An examination of physician-, caregiver-, and disease-related factors associated With readmission From a pediatric hospital medicine service. Hosp Pediatr. 2015;5(11):566-573. doi: 10.1542/hpeds.2015-0015. PubMed
25. Porter ME. What is value in health care? N Engl J Med. 2010;363(26):2477-2481. doi: 10.1056/NEJMp1011024. PubMed
© 2018 Society of Hospital Medicine
Does continuity of care improve patient outcomes?
- Sustained continuity of care (SCOC) improves quality of care, by decreasing hospitalizations, decreasing emergency department use, and improving receipt of preventive services (SOR: B, based primarily on cohort studies).
- SCOC has been consistently documented to improve quality of care for patients with chronic conditions such as asthma and diabetes (SOR: B, primarily on cohort studies).
Objective Continuity of care is a cornerstone of primary care that has been promoted by recent trends in medical education and in the way health care delivery is organized. We sought to determine the effect of sustained continuity of care (SCOC) on the quality of patient care.
Data sources We conducted a systematic review of all articles in Medline (January, 1966 to January, 2002), Educational Resources Information Center (ERIC), and PSYCH INFO using the terms “continuity of care” or “continuity of patient care.” We identified additional titles of candidate articles by reviewing the bibliographies of articles from our original MEDLINE search, contacting experts in primary care, health care management, and health services research, and by reviewing bibliographies of textbooks of primary care and public health.
Study selection and data extraction Two investigators (MDC, SHJ) independently reviewed the full text to exclude articles that did not fulfill search criteria. Articles excluded were those that focused on physicians-in-training, on SCOC in a non–primary care setting, such as an inpatient ward, or on transitions from inpatient to the outpatient setting. We also excluded articles that did not correlate SCOC to a quality of care measure.
Data synthesis From 5070 candidate titles, we examined the full text of 260 articles and found 18 (12 cross-sectional studies, 5 cohort studies and 1 randomized controlled trial) that fulfilled our criteria. Five studies focused on patients with chronic illness (eg, asthma, diabetes).
Results No studies documented negative effects of increased SCOC on quality of care. SCOC is associated with patient satisfaction (4 studies), decreased hospitalizations and emergency department visits (7 studies), and improved receipt of preventive services (5 studies).
Conclusions SCOC improves quality of care, and this association is consistently documented for patients with chronic conditions. Programs to promote SCOC may best maximize impact by focusing on populations with chronic conditions.
Continuity of care (COC) has been promoted recently by such trends as the concept of the “medical home” for patients, use of gatekeepers in managed care organizations (MCOs), and “continuity clinics” for residency training.1-4 In assessing quality of care provided by MCOs, COC is indirectly measured through physician turnover rate.5 In addition, many states have enacted laws to guarantee patients’ rights to continue seeing their physician, when a physician’s contract with a MCO has been terminated.6
Continuity refers to “care over time by a single individual or team of health care professionals and to effective and timely communication of health information.”7 Previous work distinguishes continuity from longitudinality. Continuity refers to whether a patient sees the same clinician from one visit to the next. Longitudinality refers to whether the patient has an established, long-term relationship with a clinician.8 The term continuity is often used when actually describing longitudinality.
In this analysis, we distinguish between the 2 concepts and focus on the sustained continuity of care between a patient and a health care provider through a relationship over time. Since this focus most closely resembles the concept of longitudinality, we will distinguish this from COC as sustained continuity of care (SCOC).
SCOC may encourage communication between physician and patient throughout the course of a long-term relationship. As health care providers gain familiarity with a patient’s history, they may more effectively manage chronic conditions or monitor long-term development.
The advantage of SCOC lessens, however, as electronic medical information becomes more prevalent, allowing different providers to stay up to date on long-term issues. There are tradeoffs, too, with SCOC, such as not being able to see the next available provider in an urgent situation.9 Also, one provider voices one perspective or opinion; access to multiple perspectives can serve as a “check” for avoiding incorrect or delayed diagnoses.10 Providers with different expertise11 may be able to complement others’ skills and thus provide better services overall.12 Furthermore, SCOC could decrease communication if physicians or patients assume they know (or are known by) the other so well that new issues are not introduced or discussed.
Given these tradeoffs, it is not surprising that different studies suggest conflicting results regarding SCOC and quality.13, 15 Although Dietrich et al previously reviewed this topic, the following analysis incorporates new studies published since the previous analysis.16
Methods
Data sources
We conducted a systematic review to identify studies examining the relationship between SCOC and quality of care. We searched articles limited to the English language and human subjects, published from January 1, 1966, to January 1, 2002, using Medline, the Educational Resources Information Center (ERIC) and PSYCH INFO. Candidate articles were those with titles containing the medical subject heading (MeSH) descriptors “continuity of patient care” or “continuity of care.”
Additional titles were found in the bibliographies of articles accepted in our original search, through experts in primary care, health care management, and research, and in the bibliographies of relevant textbooks.
Data selection
Two investigators (MDC, SHJ) screened titles and full bibliographic citations to identify candidate articles. We excluded letters, editorials, and practice guidelines. We accepted randomized controlled trials (RCT), cross-sectional, case-control, and cohort studies.
We excluded articles in which a significant percentage of providers were physicians in training. Our focus was SCOC in the outpatient setting; we excluded articles that analyzed inpatient or chronic care facility settings, or transitions to or from an outpatient setting (eg, post-hospitalization discharge care).
In many RCTs, implementation of SCOC was part of a multifaceted intervention (eg, multidisciplinary clinic and home care).17, 18 Although these studies examined quality of care, the effect of SCOC was indistinguishable from that of broader intervention. If the effect of SCOC could not be distinguished, we excluded the study. Finally, we excluded articles that did not measure SCOC in relation to a quality of care endpoint or a cost of care endpoint, defined below.
Quality-of-care and cost endpoints for analysis
The definition of quality of care was based on a framework described by Donabedian.19Structure is part of this framework for quality and includes resources (such as buildings, equipment, staff) available to provide health care that may or not promote SCOC. Since SCOC itself is a product of structure, we did not include structure in our analysis.
We defined 4 possible endpoints: process of care, outcomes, satisfaction, and cost of care. Process of care refers to differences in the delivery of care or differences in the receipt of care by patients. Outcome is any change in the health status of a patient. Satisfaction is an individual’s (eg, patient, caregiver, or provider) emotional or cognitive evaluation of the structure, process, or outcome of health care.20Cost of care encompasses direct and indirect costs to patient, payer, and society.
Determination of SCOC
Though there is no standard method to determine SCOC, we accepted only studies that fulfilled the criteria below.
The method had to (i) measure SCOC at the provider-level. We did not use a site-based measure, since it is possible for a patient to visit the same clinic multiple times and see different providers.
The method had to (ii) determine SCOC over a time frame longer than one visit. We did not include studies that used “did you see the physician at the last visit?” as a method for determining SCOC. Although this fulfills definition for continuity used in other studies,8 the purpose of the current analysis was to examine the effect of SCOC (ie, longitudinality) on quality.
The method had to (iii) be applied consistently to all patients. We did not accept studies that used “number of physicians seen” if the study did not standardize the observation period. Patients observed for longer periods would likely have seen more physicians in general, and have been at greater risk for lower SCOC, than would patients observed for shorter periods. Since it is not clear if the SCOC measure would be consistently applied, a study using this type of measure was excluded.
Finally, the method had to (iv) account for the possibility of more than one provider during the observed time period. We did not include studies that used “duration of time that the patient has seen the provider” as a measure of SCOC. Theoretically, any number of other providers could have seen the patient during this time and affected the SCOC.
Two investigators (MDC, SHJ) independentlyreviewed the full text to exclude articles not fulfilling criteria. Differences were resolved by informal consensus. We calculated a kappa score to measure the degree of agreement in the selection process.
Data extraction and analysis
We abstracted study design, location, population, method to calculate SCOC, and the association of SCOC with a study endpoint. We grouped articles in relation to endpoint measured. Simple counts and descriptive statistics of the articles were calculated. If 2 articles used data from the same study, we used the more recent article.
Results
Search yield
We found 5087 candidate titles in our original search. We excluded 4891 titles after examination of the bibliographic citation, which left 196 articles. After examining the full text of these remaining articles, 18 fulfilled our criteria (Table 1). The kappa to measure the preconsensus inter-rater reliability for article selection was 0.93.
Study designs
Of the 18 articles in the final analysis, 12 (67%) were cross-sectional studies,21-32 five (28%) were cohort studies,33- 37 and one (6%) was an RCT.38 In the RCT, subjects were elderly men enrolled in a Veteran’s Administration outpatient clinic. Subjects randomized to the “discontinuity” group had a 33% chance of being scheduled with a different provider at each visit and were also scheduled with a different provider if they had seen the same provider for the previous 2 visits. Subjects in the “continuity” group were scheduled to see the same provider routinely.38
Study populations, providers, and settings
Fifteen of the 18 studies (83%) were conducted in the United States. Ten studies (56%) focused on specific groups of patients: those insured by Medicaid (n=4), adults with diabetes (n=2), multiethnic women, elderly men, adults with seizure disorder, children with chronic diseases, and children and adults with asthma (n=1 each).
Health care providers in these studies included different primary care specialties, such as family medicine (n=4), pediatrics (n=4), general practice (n=2), internal medicine (n=1), and mixed primary care physicians (n=5). One study included pediatric subspecialists. In 5, the SCOC was described for the patient’s “regular physician.”
Methods used to measure SCOC
Table 2 displays the different methods and data sources used to determine SCOC. Data sources included medical records (n=3), medical claims data (n=5), and surveys (n=10). One study calculated SCOC separately using both medical records and a patient survey.22
Six of the methods used formulas to account for different combinations of factors, such as number of visits, dispersion of providers, and number of visits to a particular provider (see Appendix). There were 8 different methods to determine SCOC based on survey responses, ranging from single item questions24, 32 to a 23-item perception of continuity scale.22
Associations between SCOC and quality or cost of care
Overall, we found no studies documenting any negative effects of increased SCOC on quality or care. Due to the heterogeneity of methods to calculate SCOC and endpoints, we were unable to combine results.
Costs. Two cross-sectional studies examined factors associated with cost of care (Table 1). Increased SCOC measured by the usual provider continuity (UPC) index correlated with increased provider or MCO cost of care (P<.05); however, the results were not significant when SCOC was measured using other indicies.22 Another study found that increased SCOC was associated with decreased total annual health care expenditures.23
Satisfaction. Although we could not pool results of studies due to heterogeneity, there is a consistent association between SCOC and patient satisfaction, based on the results of 4 studies (Table 1).
Three cross-sectional studies in different settings21, 22, 31 found a positive association between increased SCOC and patient satisfaction. However, all 3 studies used subjective methods to determine SCOC. One study that used quantitative methods to measure SCOC (ie, COC index, UPC scale) did not find a statistically significant association with patient satisfaction.22 One RCT found no effect on satisfaction with patient-provider interaction overall (P>.05).38
Patient outcomes. The effect of SCOC seems consistent across studies for patients with chronic conditions who were hospitalized or visited emergency departments (Table 1).
In one RCT, the continuity group had fewer hospital days (5.7 vs. 9.1, P=.02); fewer intensive care days (0.4 vs. 1.4, P=.01); shorter hospital length of stay (15.5 vs. 25.5, P=.008); and lower percentages of emergent hospitalization (20% vs 39%, P=.002) compared with the discontinuity group. Of note, the subjects were all elderly men, of whom 47% had cardiovascular disease and 18% had respiratory disease.38
In 2 cross-sectional and 4 cohort studies, SCOC led to decreased hospitalizations and emergency department use, and to some improvements in preventive health behavior. Half of the studies focused on patients with chronic conditions (asthma or diabetes).33, 34, 37 Medicaid claims data analyses suggest that higher SCOC is associated with decreased likelihood of making single and multiple emergency department visits, hospitalizations overall, and hospitalizations for chronic conditions.26, 36 However, higher SCOC did not decrease the risk of hospitalization for acute ambulatory care sensitive conditions (eg, gastroenteritis).36
Process of care. For preventive services, 5 cross-sectional studies found that increased SCOC improved receipt of preventive services (Table 1).24, 28-30, 32, 33, 35
Two cross-sectional studies examined the association between SCOC and patient-provider communication.35 One study found that increased SCOC improved communication and patient perception regarding the ability to influence treatment.27 One study on epilepsy care found greater patient ease in talking to the physician.25
One RCT found no differences in scheduled or unscheduled clinic visits, specialty referrals, or receipt of preventive care procedures such as blood pressure measurement, weight assessment, or assessment of smoking status (P>.05).38
Discussion
Increased SCOC has not had any negative effects on quality of care. Indeed, in many cases, increased SCOC heightens patient satisfaction, decreases hospitalizations and emergency department visits, and improves receipt of preventive services. The positive effect of SCOC on health care use has been well documented for patients with chronic conditions. Although our search strategy and exclusion criteria differed from a previous review by Dietrich et al, we report similar conclusions regarding SCOC and patient satisfaction.16
We observed that the association between SCOC and quality of care appears most consistent for patients with chronic conditions, and we think there are several reasons for this relationship. Improved care should evolve throughout the course of a long-term relationship. The time frame of most studies in our analysis was limited, with the longest being only 2 years. It is possible that the benefits of SCOC do not become manifest until a much longer time period or after many visits with the same primary care provider.
However, patients with chronic disease are more likely to use outpatient, emergency department, and hospital services than are otherwise healthy persons. The increased number of outpatient visits by a patient with chronic disease may establish SCOC more quickly in a relationship, compared with patients who have fewer outpatient visits in general. The increased frequency of emergency department use and hospitalizations for patients with chronic disease may also magnify the effects and benefits of SCOC. As a result, it may be easier to detect the positive effects of SCOC for patients with chronic disease.
Finally, low SCOC may simply be a marker for other factors (associated with the patient or health care system) that are linked to decreased quality of care or increased costs.
Limitations
Because this review included only published articles, it is susceptible to publication bias.40 We included only studies that looked at the effect of SCOC on quality of care, and excluded studies that considered SCOC as part of a larger intervention. It is not clear if this under- or overestimates the effect of SCOC. However, by including only such studies, we are underreporting the overall evidence base of the effect of SCOC on quality of care.
Benefits of SCOC may occur if a patient develops a consistent relationship with a specific clinic or practice site. Since we limited our analysis to the provider-level, our results might not reflect the benefits of SCOC in broader contexts.
Although SCOC has many positive effects on quality of care, absolute or complete SCOC may not necessarily be ideal. There may be tradeoffs between SCOC and patient access to care. One study suggested that in certain scenarios (ie, “minor problems”), convenience was more important than SCOC; however for chronic issues, SCOC was more valued.39 Although this analysis suggests that SCOC is associated with improved quality of care, it is beyond the scope of this study to suggest the ideal level of SCOC in relation to other factors such as access. The published studies in this analysis were not designed to address these issues.
Finally, patient satisfaction may not be an appropriate measure for quality in this particular analysis. Patients who are dissatisfied with care may be more likely to change physicians and thus have less continuity. However, in this analysis we examined quality-of-care endpoints separately from other endpoints.
Implications and future research
Based on our study criteria, our analysis suggests an association between SCOC and patient satisfaction, as well as improved process of care and patient outcomes.
Other areas remain to be investigated. We found few studies, for example, that examined the impact of SCOC on cost of care. Programs that attempt to maximize SCOC may require significant administrative resources and costs (ie, to improve scheduling or provider availability). In an era of limited resources, promoting increased investment in this area may necessitate a demonstration of the long-term financial effects of SCOC and the absence of any unintended consequences (eg, delays in diagnosis). Although there are specific expenditures associated with promoting SCOC, such changes should theoretically lower health care costs overall by decreasing avoidable hospitalizations or emergency department visits.
Future research should investigate which populations benefit most from SCOC. A significant portion of the evidence for the positive effects of SCOC on quality of care includes patients with chronic disease, such as asthma and diabetes. Programs or clinics with limited resources to promote SCOC may be able to maximize impact by focusing on such populations.
Acknowledgements
Presented in part at the Pediatric Academic Societies Annual Meeting, Seattle, Wash. May 6, 2003. Support (SHJ) provided by the National Institute of Child Health and Human Development T32 HD07534-03. The authors would like to thank Ms. Lucy M. Schiller and Ms. Kathryn L. Wheeler for their assistance in data collection, as well Ms. Kathryn Slish for her editorial assistance.
Corresponding author
Michael D. Cabana, MD, MPH, 6-D-19 NIB, Box 0456, 300 North Ingalls Street, Ann Arbor, MI 48109-0456. E-mail: mcabana@med.umich.edu
1. Starfield B. Primary Care: Concept Evaluation and Policy New York, NY: Oxford University Press 1998.;
2. American Academy of Pediatrics The Medical Home: Organizational Principles to Guide and Define the Child Health Care System and/or Improve the Health of All Children Pediatrics 2002;110:184-186.
3. Hunt CE, Kallenberg GA, Whitcomb ME. Trends in clinical education of medical students Arch Pediatr Adol Med 1999;153:297-302.
4. Halm EA, Causino N, Blumenthal D. Is gatekeeping better than traditional care? A survey of physicians’ attitudes JAMA 1997;278:1677-1681.
5. National Committee for Quality Assurance HEDIS 2003 Volume 2. Washington, DC: National Committee for Quality Assurance, 2003: Health Plan Stability pp. 151-158.
6. Guglielmo WJ. Mandated continuity of care: a solution in search of a problem? Med Econ December 1999;pp. 45-52.
7. Institute of Medicine Primary Care: America’s Health in a New Era Washington, DC: National Academy Press 1996.;
8. Starfield B. Continuous confusions? Am J Pub Health 1980;70-120.
9. Love MM, Mainous AG. Commitment to a regular physician: how long will patients wait to see their own physician for acute illness? J Fam Pract 1999;48:202-207.
10. Freeman G, Hjortdahl P. What future for continuity of care in general practice? BMJ 1997;314:1870.
11. Schroeder SA. Primary care at the crossroads Acad Med 2002;77:767-773.
12. Gallagher TC, Geling O, Comite F. Use of multiple providers for regular care and women’s receipt of hormone replacement therapy counseling Med Care 2001;39:1086-1096.
13. Christakis D. Consistent contact with a physician improves outcomes West J Med 2001;175:4.
14. Wachter RM. Discontinuity can improve patient care West J Med 2001;175:5.
15. Freeman G. What is the future for continuity of care in general practice? BMJ 1997;314:1870.
16. Dietrich AJ, Marton KI. Does continuous care from a physician make a difference? J Fam Pract 1982;15:929-937.
17. Becker MH, Drachman RH, Kirscht JP. A field experiment to evaluate various outcomes of continuity of physician care Am J Pub Health 1974;64:1062-1070.
18. Katz S, Vignos PJ, Moskowitz RW, Thompson HM, Svec KH. Comprehensive outpatient care in rheumatoid arthritis JAMA 1968;206:1249-1254.
19. Donabedian A. Evaluating the quality of medical care Milbank Quarterly 1966;44:166.
20. Campbell SM, Roland MO, Buetow S. Defining quality of care Soc Sci Med 2000;51:1611-1625.
21. Breslau N, Mortimer EA. Seeing the same doctor: determinants of satisfaction with specialty care for disabled children Med Care 1981;19:741-758.
22. Chao J. Continuity of care: incorporating patient perceptions Fam Med 1988;20:333-337.
23. Connelius LJ. The degree of usual provider continuity for African and Latino Americans J Health Care Poor Underserved 1997;8:170-185.
24. Ettner SL. The relationship between continuity of care and the health behaviors of patients: does having a usual physician make a difference? Med Care 1999;37:547-555.
25. Freeman GK, Richards SC. Personal continuity and the care of patients with epilepsy in general practice Brit J Gen Pract 1994;44:395-399.
26. Gill JM, Mainous AG, Nsereko M. The effect of continuity of care on emergency department use Arch Fam Med 2000;9:333-338.
27. Love MM, Mainous AG, Talbert JC, Hager GL. Continuity of care and the physician-patient relationship J Fam Pract 2000;49:998-1004.
28. O’Malley AS, Forrest CB. Continuity of care and delivery of ambulatory services to children in community health clinics J Comm Health 1996;21:159-173.
29. O’Malley AS, Mandelblatt J, Gold K, Cagney KA, Kerner J. Continuity of care and the use of breast and cervical cancer screening services in a multiethnic community Arch Intern Med 1997;157:1462-1470.
30. Strumberg JP, Schattner P. Personal doctoring: its impact on continuity of care as measured by the comprehensiveness of care score Austral Fam Physician 2001;30:513-518.
31. Weiss GL, Ramsey CA. Regular source of primary medical care and patient satisfaction QRB 1989;180-184.
32. Lambrew JM, DeFriese GH, Carey TS, Ricketts TC, Biddle AK. The effects of having a regular doctor on access to primary care Med Care 1996;34:138-151.
33. Christakis DA, Feudtner C, Pihoker C, Connell FA. Continuity and quality of care for children with diabetes who are covered by Medicaid Amb Peds 2001;1:99-103.
34. Christakis DA, Mell L, Koepsell TD, Zimmerman FJ, Connell FA. Association of lower continuity of care with greater risk of emergency department use and hospitalization in children Peds 2001;103:524-529.
35. Christakis DA, Mell L, Wright JA, Davis R, Connell FA. The association between greater continuity of care and timely measure-mumps-rubella vaccination Am J Pub Health 2000;90:962-965.
36. Gill JM, Mainous AG. The role of provider continuity in preventing hospitalizations Arch Fam Med 1998;7:352-357.
37. Parchman ML, Pugh JA, Noel PH, Larme AC. Continuity of care self managementbehaviors and glucose control in patients with type 2 diabetes Med Care 2002;40:137-144.
38. Wasson JH, Sauvigne AE, Mogielnicki P, et al. Continuity of outpatient medical care in elderly men. JAMA 1984;252:2413-2417.
39. Kearley KE, Freeman GK, Health A. An exploration of the value of the personal doctor patient relationship in general practice Brit J Gen Prac 2001;51:712-718.
40. Begg CB, Berlin JA. Publication bias: a problem in interpreting medical data J R Stat Soc 1988;151:419-463.
- Sustained continuity of care (SCOC) improves quality of care, by decreasing hospitalizations, decreasing emergency department use, and improving receipt of preventive services (SOR: B, based primarily on cohort studies).
- SCOC has been consistently documented to improve quality of care for patients with chronic conditions such as asthma and diabetes (SOR: B, primarily on cohort studies).
Objective Continuity of care is a cornerstone of primary care that has been promoted by recent trends in medical education and in the way health care delivery is organized. We sought to determine the effect of sustained continuity of care (SCOC) on the quality of patient care.
Data sources We conducted a systematic review of all articles in Medline (January, 1966 to January, 2002), Educational Resources Information Center (ERIC), and PSYCH INFO using the terms “continuity of care” or “continuity of patient care.” We identified additional titles of candidate articles by reviewing the bibliographies of articles from our original MEDLINE search, contacting experts in primary care, health care management, and health services research, and by reviewing bibliographies of textbooks of primary care and public health.
Study selection and data extraction Two investigators (MDC, SHJ) independently reviewed the full text to exclude articles that did not fulfill search criteria. Articles excluded were those that focused on physicians-in-training, on SCOC in a non–primary care setting, such as an inpatient ward, or on transitions from inpatient to the outpatient setting. We also excluded articles that did not correlate SCOC to a quality of care measure.
Data synthesis From 5070 candidate titles, we examined the full text of 260 articles and found 18 (12 cross-sectional studies, 5 cohort studies and 1 randomized controlled trial) that fulfilled our criteria. Five studies focused on patients with chronic illness (eg, asthma, diabetes).
Results No studies documented negative effects of increased SCOC on quality of care. SCOC is associated with patient satisfaction (4 studies), decreased hospitalizations and emergency department visits (7 studies), and improved receipt of preventive services (5 studies).
Conclusions SCOC improves quality of care, and this association is consistently documented for patients with chronic conditions. Programs to promote SCOC may best maximize impact by focusing on populations with chronic conditions.
Continuity of care (COC) has been promoted recently by such trends as the concept of the “medical home” for patients, use of gatekeepers in managed care organizations (MCOs), and “continuity clinics” for residency training.1-4 In assessing quality of care provided by MCOs, COC is indirectly measured through physician turnover rate.5 In addition, many states have enacted laws to guarantee patients’ rights to continue seeing their physician, when a physician’s contract with a MCO has been terminated.6
Continuity refers to “care over time by a single individual or team of health care professionals and to effective and timely communication of health information.”7 Previous work distinguishes continuity from longitudinality. Continuity refers to whether a patient sees the same clinician from one visit to the next. Longitudinality refers to whether the patient has an established, long-term relationship with a clinician.8 The term continuity is often used when actually describing longitudinality.
In this analysis, we distinguish between the 2 concepts and focus on the sustained continuity of care between a patient and a health care provider through a relationship over time. Since this focus most closely resembles the concept of longitudinality, we will distinguish this from COC as sustained continuity of care (SCOC).
SCOC may encourage communication between physician and patient throughout the course of a long-term relationship. As health care providers gain familiarity with a patient’s history, they may more effectively manage chronic conditions or monitor long-term development.
The advantage of SCOC lessens, however, as electronic medical information becomes more prevalent, allowing different providers to stay up to date on long-term issues. There are tradeoffs, too, with SCOC, such as not being able to see the next available provider in an urgent situation.9 Also, one provider voices one perspective or opinion; access to multiple perspectives can serve as a “check” for avoiding incorrect or delayed diagnoses.10 Providers with different expertise11 may be able to complement others’ skills and thus provide better services overall.12 Furthermore, SCOC could decrease communication if physicians or patients assume they know (or are known by) the other so well that new issues are not introduced or discussed.
Given these tradeoffs, it is not surprising that different studies suggest conflicting results regarding SCOC and quality.13, 15 Although Dietrich et al previously reviewed this topic, the following analysis incorporates new studies published since the previous analysis.16
Methods
Data sources
We conducted a systematic review to identify studies examining the relationship between SCOC and quality of care. We searched articles limited to the English language and human subjects, published from January 1, 1966, to January 1, 2002, using Medline, the Educational Resources Information Center (ERIC) and PSYCH INFO. Candidate articles were those with titles containing the medical subject heading (MeSH) descriptors “continuity of patient care” or “continuity of care.”
Additional titles were found in the bibliographies of articles accepted in our original search, through experts in primary care, health care management, and research, and in the bibliographies of relevant textbooks.
Data selection
Two investigators (MDC, SHJ) screened titles and full bibliographic citations to identify candidate articles. We excluded letters, editorials, and practice guidelines. We accepted randomized controlled trials (RCT), cross-sectional, case-control, and cohort studies.
We excluded articles in which a significant percentage of providers were physicians in training. Our focus was SCOC in the outpatient setting; we excluded articles that analyzed inpatient or chronic care facility settings, or transitions to or from an outpatient setting (eg, post-hospitalization discharge care).
In many RCTs, implementation of SCOC was part of a multifaceted intervention (eg, multidisciplinary clinic and home care).17, 18 Although these studies examined quality of care, the effect of SCOC was indistinguishable from that of broader intervention. If the effect of SCOC could not be distinguished, we excluded the study. Finally, we excluded articles that did not measure SCOC in relation to a quality of care endpoint or a cost of care endpoint, defined below.
Quality-of-care and cost endpoints for analysis
The definition of quality of care was based on a framework described by Donabedian.19Structure is part of this framework for quality and includes resources (such as buildings, equipment, staff) available to provide health care that may or not promote SCOC. Since SCOC itself is a product of structure, we did not include structure in our analysis.
We defined 4 possible endpoints: process of care, outcomes, satisfaction, and cost of care. Process of care refers to differences in the delivery of care or differences in the receipt of care by patients. Outcome is any change in the health status of a patient. Satisfaction is an individual’s (eg, patient, caregiver, or provider) emotional or cognitive evaluation of the structure, process, or outcome of health care.20Cost of care encompasses direct and indirect costs to patient, payer, and society.
Determination of SCOC
Though there is no standard method to determine SCOC, we accepted only studies that fulfilled the criteria below.
The method had to (i) measure SCOC at the provider-level. We did not use a site-based measure, since it is possible for a patient to visit the same clinic multiple times and see different providers.
The method had to (ii) determine SCOC over a time frame longer than one visit. We did not include studies that used “did you see the physician at the last visit?” as a method for determining SCOC. Although this fulfills definition for continuity used in other studies,8 the purpose of the current analysis was to examine the effect of SCOC (ie, longitudinality) on quality.
The method had to (iii) be applied consistently to all patients. We did not accept studies that used “number of physicians seen” if the study did not standardize the observation period. Patients observed for longer periods would likely have seen more physicians in general, and have been at greater risk for lower SCOC, than would patients observed for shorter periods. Since it is not clear if the SCOC measure would be consistently applied, a study using this type of measure was excluded.
Finally, the method had to (iv) account for the possibility of more than one provider during the observed time period. We did not include studies that used “duration of time that the patient has seen the provider” as a measure of SCOC. Theoretically, any number of other providers could have seen the patient during this time and affected the SCOC.
Two investigators (MDC, SHJ) independentlyreviewed the full text to exclude articles not fulfilling criteria. Differences were resolved by informal consensus. We calculated a kappa score to measure the degree of agreement in the selection process.
Data extraction and analysis
We abstracted study design, location, population, method to calculate SCOC, and the association of SCOC with a study endpoint. We grouped articles in relation to endpoint measured. Simple counts and descriptive statistics of the articles were calculated. If 2 articles used data from the same study, we used the more recent article.
Results
Search yield
We found 5087 candidate titles in our original search. We excluded 4891 titles after examination of the bibliographic citation, which left 196 articles. After examining the full text of these remaining articles, 18 fulfilled our criteria (Table 1). The kappa to measure the preconsensus inter-rater reliability for article selection was 0.93.
Study designs
Of the 18 articles in the final analysis, 12 (67%) were cross-sectional studies,21-32 five (28%) were cohort studies,33- 37 and one (6%) was an RCT.38 In the RCT, subjects were elderly men enrolled in a Veteran’s Administration outpatient clinic. Subjects randomized to the “discontinuity” group had a 33% chance of being scheduled with a different provider at each visit and were also scheduled with a different provider if they had seen the same provider for the previous 2 visits. Subjects in the “continuity” group were scheduled to see the same provider routinely.38
Study populations, providers, and settings
Fifteen of the 18 studies (83%) were conducted in the United States. Ten studies (56%) focused on specific groups of patients: those insured by Medicaid (n=4), adults with diabetes (n=2), multiethnic women, elderly men, adults with seizure disorder, children with chronic diseases, and children and adults with asthma (n=1 each).
Health care providers in these studies included different primary care specialties, such as family medicine (n=4), pediatrics (n=4), general practice (n=2), internal medicine (n=1), and mixed primary care physicians (n=5). One study included pediatric subspecialists. In 5, the SCOC was described for the patient’s “regular physician.”
Methods used to measure SCOC
Table 2 displays the different methods and data sources used to determine SCOC. Data sources included medical records (n=3), medical claims data (n=5), and surveys (n=10). One study calculated SCOC separately using both medical records and a patient survey.22
Six of the methods used formulas to account for different combinations of factors, such as number of visits, dispersion of providers, and number of visits to a particular provider (see Appendix). There were 8 different methods to determine SCOC based on survey responses, ranging from single item questions24, 32 to a 23-item perception of continuity scale.22
Associations between SCOC and quality or cost of care
Overall, we found no studies documenting any negative effects of increased SCOC on quality or care. Due to the heterogeneity of methods to calculate SCOC and endpoints, we were unable to combine results.
Costs. Two cross-sectional studies examined factors associated with cost of care (Table 1). Increased SCOC measured by the usual provider continuity (UPC) index correlated with increased provider or MCO cost of care (P<.05); however, the results were not significant when SCOC was measured using other indicies.22 Another study found that increased SCOC was associated with decreased total annual health care expenditures.23
Satisfaction. Although we could not pool results of studies due to heterogeneity, there is a consistent association between SCOC and patient satisfaction, based on the results of 4 studies (Table 1).
Three cross-sectional studies in different settings21, 22, 31 found a positive association between increased SCOC and patient satisfaction. However, all 3 studies used subjective methods to determine SCOC. One study that used quantitative methods to measure SCOC (ie, COC index, UPC scale) did not find a statistically significant association with patient satisfaction.22 One RCT found no effect on satisfaction with patient-provider interaction overall (P>.05).38
Patient outcomes. The effect of SCOC seems consistent across studies for patients with chronic conditions who were hospitalized or visited emergency departments (Table 1).
In one RCT, the continuity group had fewer hospital days (5.7 vs. 9.1, P=.02); fewer intensive care days (0.4 vs. 1.4, P=.01); shorter hospital length of stay (15.5 vs. 25.5, P=.008); and lower percentages of emergent hospitalization (20% vs 39%, P=.002) compared with the discontinuity group. Of note, the subjects were all elderly men, of whom 47% had cardiovascular disease and 18% had respiratory disease.38
In 2 cross-sectional and 4 cohort studies, SCOC led to decreased hospitalizations and emergency department use, and to some improvements in preventive health behavior. Half of the studies focused on patients with chronic conditions (asthma or diabetes).33, 34, 37 Medicaid claims data analyses suggest that higher SCOC is associated with decreased likelihood of making single and multiple emergency department visits, hospitalizations overall, and hospitalizations for chronic conditions.26, 36 However, higher SCOC did not decrease the risk of hospitalization for acute ambulatory care sensitive conditions (eg, gastroenteritis).36
Process of care. For preventive services, 5 cross-sectional studies found that increased SCOC improved receipt of preventive services (Table 1).24, 28-30, 32, 33, 35
Two cross-sectional studies examined the association between SCOC and patient-provider communication.35 One study found that increased SCOC improved communication and patient perception regarding the ability to influence treatment.27 One study on epilepsy care found greater patient ease in talking to the physician.25
One RCT found no differences in scheduled or unscheduled clinic visits, specialty referrals, or receipt of preventive care procedures such as blood pressure measurement, weight assessment, or assessment of smoking status (P>.05).38
Discussion
Increased SCOC has not had any negative effects on quality of care. Indeed, in many cases, increased SCOC heightens patient satisfaction, decreases hospitalizations and emergency department visits, and improves receipt of preventive services. The positive effect of SCOC on health care use has been well documented for patients with chronic conditions. Although our search strategy and exclusion criteria differed from a previous review by Dietrich et al, we report similar conclusions regarding SCOC and patient satisfaction.16
We observed that the association between SCOC and quality of care appears most consistent for patients with chronic conditions, and we think there are several reasons for this relationship. Improved care should evolve throughout the course of a long-term relationship. The time frame of most studies in our analysis was limited, with the longest being only 2 years. It is possible that the benefits of SCOC do not become manifest until a much longer time period or after many visits with the same primary care provider.
However, patients with chronic disease are more likely to use outpatient, emergency department, and hospital services than are otherwise healthy persons. The increased number of outpatient visits by a patient with chronic disease may establish SCOC more quickly in a relationship, compared with patients who have fewer outpatient visits in general. The increased frequency of emergency department use and hospitalizations for patients with chronic disease may also magnify the effects and benefits of SCOC. As a result, it may be easier to detect the positive effects of SCOC for patients with chronic disease.
Finally, low SCOC may simply be a marker for other factors (associated with the patient or health care system) that are linked to decreased quality of care or increased costs.
Limitations
Because this review included only published articles, it is susceptible to publication bias.40 We included only studies that looked at the effect of SCOC on quality of care, and excluded studies that considered SCOC as part of a larger intervention. It is not clear if this under- or overestimates the effect of SCOC. However, by including only such studies, we are underreporting the overall evidence base of the effect of SCOC on quality of care.
Benefits of SCOC may occur if a patient develops a consistent relationship with a specific clinic or practice site. Since we limited our analysis to the provider-level, our results might not reflect the benefits of SCOC in broader contexts.
Although SCOC has many positive effects on quality of care, absolute or complete SCOC may not necessarily be ideal. There may be tradeoffs between SCOC and patient access to care. One study suggested that in certain scenarios (ie, “minor problems”), convenience was more important than SCOC; however for chronic issues, SCOC was more valued.39 Although this analysis suggests that SCOC is associated with improved quality of care, it is beyond the scope of this study to suggest the ideal level of SCOC in relation to other factors such as access. The published studies in this analysis were not designed to address these issues.
Finally, patient satisfaction may not be an appropriate measure for quality in this particular analysis. Patients who are dissatisfied with care may be more likely to change physicians and thus have less continuity. However, in this analysis we examined quality-of-care endpoints separately from other endpoints.
Implications and future research
Based on our study criteria, our analysis suggests an association between SCOC and patient satisfaction, as well as improved process of care and patient outcomes.
Other areas remain to be investigated. We found few studies, for example, that examined the impact of SCOC on cost of care. Programs that attempt to maximize SCOC may require significant administrative resources and costs (ie, to improve scheduling or provider availability). In an era of limited resources, promoting increased investment in this area may necessitate a demonstration of the long-term financial effects of SCOC and the absence of any unintended consequences (eg, delays in diagnosis). Although there are specific expenditures associated with promoting SCOC, such changes should theoretically lower health care costs overall by decreasing avoidable hospitalizations or emergency department visits.
Future research should investigate which populations benefit most from SCOC. A significant portion of the evidence for the positive effects of SCOC on quality of care includes patients with chronic disease, such as asthma and diabetes. Programs or clinics with limited resources to promote SCOC may be able to maximize impact by focusing on such populations.
Acknowledgements
Presented in part at the Pediatric Academic Societies Annual Meeting, Seattle, Wash. May 6, 2003. Support (SHJ) provided by the National Institute of Child Health and Human Development T32 HD07534-03. The authors would like to thank Ms. Lucy M. Schiller and Ms. Kathryn L. Wheeler for their assistance in data collection, as well Ms. Kathryn Slish for her editorial assistance.
Corresponding author
Michael D. Cabana, MD, MPH, 6-D-19 NIB, Box 0456, 300 North Ingalls Street, Ann Arbor, MI 48109-0456. E-mail: mcabana@med.umich.edu
1. Starfield B. Primary Care: Concept Evaluation and Policy New York, NY: Oxford University Press 1998.;
2. American Academy of Pediatrics The Medical Home: Organizational Principles to Guide and Define the Child Health Care System and/or Improve the Health of All Children Pediatrics 2002;110:184-186.
3. Hunt CE, Kallenberg GA, Whitcomb ME. Trends in clinical education of medical students Arch Pediatr Adol Med 1999;153:297-302.
4. Halm EA, Causino N, Blumenthal D. Is gatekeeping better than traditional care? A survey of physicians’ attitudes JAMA 1997;278:1677-1681.
5. National Committee for Quality Assurance HEDIS 2003 Volume 2. Washington, DC: National Committee for Quality Assurance, 2003: Health Plan Stability pp. 151-158.
6. Guglielmo WJ. Mandated continuity of care: a solution in search of a problem? Med Econ December 1999;pp. 45-52.
7. Institute of Medicine Primary Care: America’s Health in a New Era Washington, DC: National Academy Press 1996.;
8. Starfield B. Continuous confusions? Am J Pub Health 1980;70-120.
9. Love MM, Mainous AG. Commitment to a regular physician: how long will patients wait to see their own physician for acute illness? J Fam Pract 1999;48:202-207.
10. Freeman G, Hjortdahl P. What future for continuity of care in general practice? BMJ 1997;314:1870.
11. Schroeder SA. Primary care at the crossroads Acad Med 2002;77:767-773.
12. Gallagher TC, Geling O, Comite F. Use of multiple providers for regular care and women’s receipt of hormone replacement therapy counseling Med Care 2001;39:1086-1096.
13. Christakis D. Consistent contact with a physician improves outcomes West J Med 2001;175:4.
14. Wachter RM. Discontinuity can improve patient care West J Med 2001;175:5.
15. Freeman G. What is the future for continuity of care in general practice? BMJ 1997;314:1870.
16. Dietrich AJ, Marton KI. Does continuous care from a physician make a difference? J Fam Pract 1982;15:929-937.
17. Becker MH, Drachman RH, Kirscht JP. A field experiment to evaluate various outcomes of continuity of physician care Am J Pub Health 1974;64:1062-1070.
18. Katz S, Vignos PJ, Moskowitz RW, Thompson HM, Svec KH. Comprehensive outpatient care in rheumatoid arthritis JAMA 1968;206:1249-1254.
19. Donabedian A. Evaluating the quality of medical care Milbank Quarterly 1966;44:166.
20. Campbell SM, Roland MO, Buetow S. Defining quality of care Soc Sci Med 2000;51:1611-1625.
21. Breslau N, Mortimer EA. Seeing the same doctor: determinants of satisfaction with specialty care for disabled children Med Care 1981;19:741-758.
22. Chao J. Continuity of care: incorporating patient perceptions Fam Med 1988;20:333-337.
23. Connelius LJ. The degree of usual provider continuity for African and Latino Americans J Health Care Poor Underserved 1997;8:170-185.
24. Ettner SL. The relationship between continuity of care and the health behaviors of patients: does having a usual physician make a difference? Med Care 1999;37:547-555.
25. Freeman GK, Richards SC. Personal continuity and the care of patients with epilepsy in general practice Brit J Gen Pract 1994;44:395-399.
26. Gill JM, Mainous AG, Nsereko M. The effect of continuity of care on emergency department use Arch Fam Med 2000;9:333-338.
27. Love MM, Mainous AG, Talbert JC, Hager GL. Continuity of care and the physician-patient relationship J Fam Pract 2000;49:998-1004.
28. O’Malley AS, Forrest CB. Continuity of care and delivery of ambulatory services to children in community health clinics J Comm Health 1996;21:159-173.
29. O’Malley AS, Mandelblatt J, Gold K, Cagney KA, Kerner J. Continuity of care and the use of breast and cervical cancer screening services in a multiethnic community Arch Intern Med 1997;157:1462-1470.
30. Strumberg JP, Schattner P. Personal doctoring: its impact on continuity of care as measured by the comprehensiveness of care score Austral Fam Physician 2001;30:513-518.
31. Weiss GL, Ramsey CA. Regular source of primary medical care and patient satisfaction QRB 1989;180-184.
32. Lambrew JM, DeFriese GH, Carey TS, Ricketts TC, Biddle AK. The effects of having a regular doctor on access to primary care Med Care 1996;34:138-151.
33. Christakis DA, Feudtner C, Pihoker C, Connell FA. Continuity and quality of care for children with diabetes who are covered by Medicaid Amb Peds 2001;1:99-103.
34. Christakis DA, Mell L, Koepsell TD, Zimmerman FJ, Connell FA. Association of lower continuity of care with greater risk of emergency department use and hospitalization in children Peds 2001;103:524-529.
35. Christakis DA, Mell L, Wright JA, Davis R, Connell FA. The association between greater continuity of care and timely measure-mumps-rubella vaccination Am J Pub Health 2000;90:962-965.
36. Gill JM, Mainous AG. The role of provider continuity in preventing hospitalizations Arch Fam Med 1998;7:352-357.
37. Parchman ML, Pugh JA, Noel PH, Larme AC. Continuity of care self managementbehaviors and glucose control in patients with type 2 diabetes Med Care 2002;40:137-144.
38. Wasson JH, Sauvigne AE, Mogielnicki P, et al. Continuity of outpatient medical care in elderly men. JAMA 1984;252:2413-2417.
39. Kearley KE, Freeman GK, Health A. An exploration of the value of the personal doctor patient relationship in general practice Brit J Gen Prac 2001;51:712-718.
40. Begg CB, Berlin JA. Publication bias: a problem in interpreting medical data J R Stat Soc 1988;151:419-463.