User login
Extracorporeal membrane oxygenation in adults: A practical guide for internists
Extracorporeal membrance oxygenation (ECMO) provides temporary cardiorespiratory support for patients with severe respiratory or cardiac failure refractory to conventional therapy.1 It can be configured to provide oxygen, remove carbon dioxide, support perfusion, or all of the above. It may provide a bridge to recovery in patients with acute cardiopulmonary failure or to heart or lung transplant.
Developed in the 1970s, ECMO has proven effective and is widely used in children with respiratory and cardiopulmonary failure.2 However, it remained little used in adults, as early randomized trials showed higher rates of complications in adults who received it and no survival advantage.3,4 Proponents of using it in adult patients believe that these poor outcomes were at least partially due to limited training, intensive anticoagulation, and excessive volume and pressure during mechanical ventilation. Although ECMO technology has improved substantially in the last decade and survival rates have improved (www.elso.org), evidence to support its routine use in adults remains limited.
Nevertheless, about 14,000 adult patients received ECMO between 1990 and 2014, with a rate of survival to discharge of 57% for those in respiratory failure and 41% for those in cardiac failure.5 Its use increased 433% in the United States from 2006 to 2011.6
A national survey of critical care physicians and trainees in the United States found they had limited knowledge about ECMO technology and wanted to include specific educational objectives about it in their training.7
This article summarizes the principles of ECMO, including practical aspects such as patient selection, monitoring, and complications.
LIMITED EVIDENCE OF BENEFIT FROM CONTROLLED TRIALS
There is limited evidence from randomized controlled trials that ECMO is beneficial in adults.
In acute respiratory failure, the first randomized trial of ECMO in adults was conducted in 1979 in multiple medical centers.3 The survival rate was no higher with ECMO than with mechanical ventilation alone, and complication rates were very high.
Similarly, Morris et al4 performed a single-center trial comparing pressure-controlled inverse-ratio ventilation and extracorporeal carbon dioxide removal in patients with acute respiratory distress syndrome, which showed no survival benefit.

After these two early trials, ECMO was largely abandoned, and not until 2009 did a multicenter randomized trial in acute respiratory distress syndrome8 rejuvenate interest in its use. Although the trial did not conclusively prove that ECMO was more effective than conventional mechanical ventilation, the findings supported early referral to tertiary care centers with ECMO expertise, and the survival rate was substantially higher than in previous studies. A concise summary of randomized trials and retrospective studies utilizing ECMO in respiratory failure is shown in Table 1.8–14
During the global pandemic of influenza H1N1 in 2009–2010, several centers reported survival benefits from ECMO in patients with severe acute respiratory distress syndrome secondary to influenza.9–12,15–19 Two retrospective case-control studies reported lower mortality rates when H1N1 patients were transferred to ECMO centers10 and among younger patients with H1N1 who received ECMO.12
Ongoing trials (ClinicalTrials.gov identifier NCT01470703) may provide definitive evidence for the effectiveness of ECMO as a rescue therapy in acute respiratory distress syndrome.
In cardiogenic shock, single-center retrospective and observational studies have reported better outcomes for patients who received ECMO for cardiogenic shock secondary to myocardial infarction, pulmonary embolism, sepsis-related cardiomyopathy, and even extracorporeal cardiopulmonary resuscitation.20
WHAT IS ECMO?

In ECMO, venous blood is shunted through a machine to add oxygen, remove carbon dioxide, and regulate temperature (Figure 1). The components of an ECMO circuit are as follows:
- Blood pump
- Membrane oxygenator
- Gas mixer
- Cannulas
- Heater/cooler
- Console.
TWO BASIC CONFIGURATIONS

Two basic ECMO configurations are used in adults: venoarterial and venovenous,21 although combinations of the two—hybrid configurations—are sometimes used (Figure 2).
Venoarterial ECMO
Venoarterial ECMO provides complete or partial support to the heart and lungs and is the configuration of choice in patients with isolated cardiac failure that is refractory to other treatments. It takes deoxygenated blood from the venous system and returns oxygenated blood to the arterial circulation.
In the central venoarterial configuration, the intake cannula is most often surgically placed in the right atrium and the return cannula is placed in the proximal ascending aorta.
In the peripheral femoral configuration, the drainage cannula is placed in the femoral vein and advanced to the right atrium, and the return cannula is placed in either the ipsilateral or contralateral femoral artery. However, this configuration provides the patient with retrograde flow (against the native cardiac output), and oxygen delivery to the upper body may be impeded.
Axillary cannulation, in which the return cannula is placed directly into the axillary artery to provide antegrade flow, has been used recently in patients with pulmonary hypertension or right ventricular failure.22
Venovenous ECMO
Venovenous ECMO provides complete or partial support to the lungs and is the configuration of choice in isolated respiratory failure when cardiac function is preserved. It takes deoxygenated blood from the central venous system—either the femoral vein or internal jugular vein—and returns oxygenated blood to the venous circulation directed into the right atrium. It can be delivered by different cannula configurations based on the patient’s size and clinical requirements.
In the past, the most commonly used configuration was the femoral-atrial, in which the drainage cannula was placed in the femoral vein with the tip advanced to the level of the diaphragm in the inferior vena cava, and the return cannula was placed in the right internal jugular vein with its tip at the junction of the superior vena cava and right atrium. In this configuration, some of the oxygenated blood delivered by the superior vena cava cannula reaches the inferior vena cava cannula, creating a “shunt,” also known as “recirculation.”
Currently, a double-lumen cannula is preferred. This type of cannula is placed in the right internal jugular vein with the tip advanced to the inferior vena cava so that blood is drained through one lumen from both the inferior and superior vena cavas and returned via the other lumen with the jet directed over the tricuspid valve. Advantages of this system are that as it delivers more oxygen to the pulmonary arteries it reduces recirculation, it requires only a single cannula to be inserted, and it facilitates ambulation and rehabilitation in patients requiring long-term ECMO.
A newer double-lumen cannula designed to drain venous blood from the right atrium and reinfuse it directly into the pulmonary artery may provide an alternative for patients with right ventricular failure.
Extracorporeal removal of carbon dioxide
ECMO can remove carbon dioxide in patients with hypercapneic respiratory failure. Early technology used a variation of venovenous ECMO with very low blood flow rates through the pump, which allowed use of smaller cannulas while efficiently removing carbon dioxide.23
Since then, a pumpless extracorporeal lung-assist device has been developed that uses an arteriovenous configuration with two smaller cannulas inserted into the femoral artery and vein (Novalung, Germany).24 Lacking a pump, it avoids the complications associated with pumps such as hemolysis and clotting. It effectively removes carbon dioxide and helps reduce the frequency and intensity of mechanical ventilation. Since the flow is driven by the patient’s arteriovenous pressure gradient, good cardiac output is a prerequisite for its use.
A portable low-blood-flow machine that uses a very small (ie, 15-F) catheter in the venovenous configuration is under investigation (Hemolung RAS, Alung Technologies).
WHO CAN BENEFIT FROM ECMO?

Although evidence to support the routine use of ECMO is limited, tools and guidelines have been developed to help clinicians decide if a patient might benefit from it. Indications for and contraindications to ECMO are shown in Table 2.
The Extracorporeal Life Support Organization recommends considering ECMO if the predicted risk of death is greater than 50% without it, and says ECMO is indicated if the predicted risk exceeds 80%. A scoring system has been developed to help predict the risk of death in patients on ECMO.14 This system has been validated using a historical cohort of patients, and current studies are ongoing for prospective validation.
Many centers are now using ECMO as a salvage therapy in patients with severe respiratory failure when conventional mechanical ventilation and adjunctive therapies such as neuromuscular blockade, inhaled nitric oxide, steroids, prone positioning, and high-frequency oscillation therapy fail to improve gas exchange.25,26
ECMO is also indicated in hypercapneic respiratory failure secondary to status asthmaticus and exacerbation of chronic obstructive pulmonary disease, permissive hypercapnea with a Paco2 greater than 80 mm Hg, or inability to achieve safe inflation pressures with plateau pressures of 30 cm H2O or higher, refractory to conventional therapy.27
Sometimes, delay in referral leads to irreversible ventilator-induced lung injury due to intense mechanical ventilation, thus limiting the utility of ECMO.8 Early referral should be considered if the patient does not improve after a few days on optimal ventilator settings. In centers where this technology is not available, referral to the nearest ECMO center should be considered. A list of certified ECMO centers is available at www.elso.org/Members/CenterDirectory.aspx.
Contraindications to ECMO
Advanced age, comorbid conditions such as malignancy, nonpulmonary organ dysfunction (including complications of critical illness), and immunodeficiency or pharmacologic immune suppression have been associated with poor outcomes in ECMO patients.28 Severe aortic incompetence and aortic dissection are contraindications, since ventricular end-diastolic pressure can be increased with resultant ventricular distention, compromised myocardial oxygenation, and worsening of left heart failure.
ECMO is increasingly being used in situations in which it was previously considered contraindicated. Pregnant and postpartum patients with cardiorespiratory failure were previously not considered for ECMO because of a possible increased risk of coagulopathy and complications. However, a recent review showed that the outcomes of ECMO in pregnancy and postpartum were similar to those in nonpregnant patients, and the risk of catastrophic bleeding was minor.29
Similarly, ECMO is also being used increasingly in posttrauma patients and patients with other bleeding risks.30

Morbid obesity was once considered a contraindication because of difficulty in cannulation, but with newer types of cannulas, even patients with a body mass index greater than 60 kg/m2 are receiving ECMO.31
HOW DO YOU DO IT?

Figures 3 and 4 depict clinical decision-making in starting and weaning from ECMO in respiratory failure and cardiogenic shock, respectively.
Management of patients on ECMO
Appropriate patient selection and initiation of ECMO are only the beginning of a tough journey. Successful management requires minimizing lung injury from mechanical ventilation, careful monitoring of anticoagulation, and instituting adequate physical therapy, including ambulation when possible (Table 3).
Initial ECMO settings and monitoring

The cannulas for venovenous ECMO are frequently inserted under fluoroscopic or transesophageal echocardiographic guidance, whereas venoarterial ECMO cannulation does not require imaging and can be performed at the bedside in the intensive care unit or operating room.
The initial ECMO settings are titrated according to the patient’s hemodynamic and respiratory needs. There are three main variables: blood flow, fraction of oxygen in the sweep gas, and sweep gas flow rate. These are adjusted to achieve desirable levels of oxygen and carbon dioxide in the blood.
Blood flow is determined by the revolutions per minute of the pump, preload, and afterload of the circuit. Common patient conditions that may reduce flow are systemic hypertension, hypovolemia, cardiac tamponade, and tension pneumothorax, depending on the modality. In addition, mechanical factors such as clots in the oxygenator or kinks in the circuit can increase resistance and reduce flow. Resistance to flow is directly proportional to cannula lengths and inversely proportional to cannula radius to the fourth power. The greater the flow, the greater the oxygen delivery.
Fraction of oxygen in the sweep gas. The oxygenator has a gas blender that mixes air and oxygen and allows for a range of oxygen concentrations. Increases in fraction of oxygen increase the partial pressure of oxygen in the blood.
Sweep gas flow rate. Venous blood in the extracorporeal circuit is exposed to fresh gas (or sweep gas) that oxygenates the blood and removes carbon dioxide by diffusion. Increasing the sweep gas flow rate results in greater carbon dioxide elimination from the blood.
Laboratory monitoring. During ECMO, the following values are monitored frequently:
- Arterial blood gases
- Blood gases in the ECMO circuit before and after going through the oxygenator— to monitor the efficacy of the oxygenator membrane
- Lactic acid—to monitor for tissue hypoxia
- Plasma free hemoglobin (a marker of hemolysis)—to monitor for hemolysis.
Mechanical ventilation on ECMO
Low tidal volume ventilation greatly reduces the risk of death in patients on ECMO by reducing ventilator-induced lung injury. Proponents of ECMO believe that ECMO provides “lung rest,” and thus it is imperative that lung-protective ventilation strategies be followed in patients on ECMO.8 In most cases, after ECMO is started, low tidal volume ventilation (6 mL/kg) is possible and should be used—or even very low tidal volume ventilation (3–6 mL/kg).32,33 Many cases have also been described in which patients have been safely extubated while on ECMO to prevent ventilator-induced lung injury.34,35
If hypoxemia persists
Despite full support with venovenous ECMO, some patients remain hypoxemic due to inadequate blood flow to match metabolic demands, eg, patients with morbid obesity or severe sepsis and fever. The physician should ensure there is no recirculation, maximize blood flow, optimize the hematocrit to increase oxygen delivery, and consider ways to decrease oxygen consumption, including sedation, paralysis, and hypothermia.
Recirculation can be calculated by measuring the oxygen saturation of the blood in the ECMO machine before and after it goes through the oxygenator, and also in the central venous blood. Recirculation has been reduced by using double-lumen cannulas but can also be reduced by manipulation of the reinfusion cannula or increasing the distance between drainage and reinfusion ports in other configurations of venovenous ECMO.
Expert opinion suggests that oxygen saturation of 86% or more and Pao2 of 55 mm Hg or more in patients on venovenous ECMO are sufficient to prevent hypoxia-related end-organ injury.36 Venoarterial ECMO should be considered in patients on venovenous ECMO with refractory hypoxemia with the above measures.
Harlequin syndrome is characterized by upper body hypoxia resulting in cerebral hypoxemia due to poorly oxygenated blood in the coronary and cerebral circulations, especially in patients on peripheral venoarterial ECMO. It can be detected by sampling the blood in the arm (where the oxygen isn’t going) instead of the leg (where the oxygen is going), and it can be corrected by adjusting the Fio2, using positive end-expiratory pressure, or both to increase oxygenation. If ventilator settings do not improve this syndrome, the arterial cannulation site can be switched from the femoral artery to the axillary or carotid artery.
Alternatively, a mixed-configuration venoarterial-venous ECMO can also be created, in which a portion of arterialized blood from the arterial outflow cannula is diverted via the right internal jugular artery to the right heart. This enriches the blood traveling through the pulmonary circulation and to the left ventricle to provide better oxygen delivery to the coronary and cerebral circulations.
Anticoagulation monitoring and transfusions
Anticoagulation is necessary to maintain a clot-free and functional circuit. Most clots develop in the oxygenator membrane, where they can prevent optimal gas exchange and, rarely, lead to embolization to the systemic circulation. However, reports have suggested that anticoagulation can be held for short periods on ECMO if necessary.
Unfractionated heparin is usually used for anticoagulation. Commonly used tests to monitor anticoagulation are the augmented partial thromboplastin time, activated clotting time, and anti-factor Xa levels. Lately, thromboelastography analysis is being used to comprehensively monitor various components of the coagulation cascade.37 Anticoagulation is usually tailored to whether there are clots in the circuit, coagulopathy, and bleeding while on ECMO.38
Traditionally, blood products were used liberally during ECMO to maintain a normal hematocrit and improve oxygen delivery, although recent data suggest that outcomes may be similar with conservative use of blood products.39,40
Fluid management on ECMO
ECMO patients are fluid-overloaded due to a profound inflammatory response, cardiac failure, or both. Studies have shown that conservative fluid management improve lung function and shortens the duration of mechanical ventilation and intensive care in patients with lung injury.41 Hence, the patient’s net fluid balance should be kept negative, provided renal and hemodynamic parameters remain stable.
There is a high incidence of acute kidney injury in ECMO patients, and fluid overload is one of the main indications for renal replacement therapy.42 Continuous renal replacement therapy can be provided either by an in-line hemofilter or by incorporating a standard continuous renal replacement therapy machine into the ECMO circuit. There are no studies comparing the efficacy of these techniques, but they allow for rapid improvement in fluid balance and electrolyte disturbances and are commonly used in ECMO patients.42,43
Physical rehabilitation and ambulation on ECMO
Physical rehabilitation in mechanically ventilated patients has been shown to reduce ventilator days and stay in the intensive care unit.44 With the use of internal jugular double-lumen cannulas for venovenous ECMO and improvement in durability of the ECMO circuit, several centers are implementing physical rehabilitation and ambulation for patients while on ECMO. Current data suggest that physical therapy is safe for patients receiving ECMO and may accelerate the weaning process and shorten length of stay in the hospital after ECMO.45,46 Aggressive rehabilitation is especially beneficial in patients awaiting lung transplant and may improve posttransplant recovery and outcomes.47
Weaning from ECMO
There are no standard guidelines for weaning from venovenous or venoarterial ECMO. Once the underlying condition for which ECMO was initiated has improved, weaning can begin by reducing the blood flow rate, the flow rate of the sweep gas, or both.
Weaning from venovenous ECMO should be started when there is improvement in lung compliance, tidal volumes, and oxygenation. Once the circuit flow rate is reduced to less than 3 L/minute, ventilator settings are adjusted to standard lung-protective settings. ECMO support is gradually decreased by reducing the flow rate of sweep gas to less than 2 L/minute. If tidal volumes, respiratory rate, and gas exchange remain adequate after approximately 2 to 4 hours on a low rate of sweep gas, the patient can be weaned off the venovenous ECMO circuit.
Weaning from venoarterial ECMO should be considered when there is myocardial recovery with improved pulse pressure and contractility on echocardiography. This is done by reducing flow rates in increments of 0.5 to 2 L/minute over 24 to 36 hours and monitoring mean arterial pressures, central venous pressure, and myocardial contractility. When acceptable, patients are mostly weaned in a surgical setting. Prolonged periods on a low rate of blood flow are avoided to prevent thrombus formation in the circuit.
COMPLICATIONS OF ECMO
ECMO use can be associated with a myriad of patient and mechanical complications.
Hemorrhage is the most common complication encountered in ECMO, occurring in approximately 43% of patients.29 It occurs most frequently from cannulation and surgical sites. Although rare, potentially life-threatening pulmonary hemorrhage (including bleeding at the tracheostomy site), intracranial hemorrhage, and gastrointestinal hemorrhage have also been reported.30
Infections, including new infection and worsening sepsis in patients with acute respiratory distress syndrome secondary to infection, are common in patients on ECMO.48
Renal failure secondary to acute tubular necrosis requiring hemodialysis has been reported to occur in 13% of patients on ECMO.30
Other complications of concern, especially in patients on venoarterial ECMO, are lower limb ischemia and thromboembolism associated with site of cannulation and direction of blood flow.49 Mechanical complications include inappropriate placement of the cannula leading to insufficient oxygenation, injury to vessel walls, and rarely myocardial wall rupture; thrombus formation within the circuit causing failure of the oxygenator and sometimes, pulmonary or systemic embolism; and air embolism from the circuit.36
NOT SUITED FOR ALL
Despite limited data to support its use, there has been a recent increase in utilization of ECMO to support critically ill adult patients with cardiopulmonary failure. ECMO support is not suited for all patients. Careful selection of patients should be done to optimize resource utilization and provide the best opportunity for recovery or transplant.
- MacLaren G, Combes A, Bartlett RH. Contemporary extracorporeal membrane oxygenation for adult respiratory failure: life support in the new era. Intensive Care Med 2012; 38:210–220.
- Maslach-Hubbard A, Bratton SL. Extracorporeal membrane oxygenation for pediatric respiratory failure: history, development and current status. World J Crit Care Med 2013; 2:29–39.
- Zapol WM, Snider MT, Hill JD, et al. Extracorporeal membrane oxygenation in severe acute respiratory failure. A randomized prospective study. JAMA 1979; 242:2193–2196.
- Morris AH, Wallace CJ, Menlove RL, et al. Randomized clinical trial of pressure-controlled inverse ratio ventilation and extracorporeal CO2 removal for adult respiratory distress syndrome. Am J Respir Crit Care Med 1994; 149:295–305.
- Extracorporeal Life Support Organization. ECLS registry report. International Summary. January 2016. https://www.elso.org/Registry.aspx. Accessed March 17, 2016.
- Sauer CM, Yuh DD, Bonde P. Extracorporeal membrane oxygenation use has increased by 433% in adults in the United States from 2006 to 2011. ASAIO J 2015; 61:31–36.
- Sharma N, Wille K, Bellot S, Brodie D, Diaz-Guzman E. Role of extracorporeal membrane oxygenation in management of refractory ARDS in the intensive care unit: a national survey on perspectives of the adult critical care physicians and trainees. Chest 2014. http://journal.publications.chestnet.org/article.aspx?articleid=1913336. Accessed March 17, 2016.
- Peek GJ, Mugford M, Tiruvoipati R, et al; CESAR trial collaboration. Efficacy and economic assessment of conventional ventilatory support versus extracorporeal membrane oxygenation for severe adult respiratory failure (CESAR): a multicentre randomised controlled trial. Lancet 2009; 374:1351–1363.
- Australia and New Zealand Extracorporeal Membrane Oxygenation (ANZ ECMO) Influenza Investigators; Davies A, Jones D, Bailey M, et al. Extracorporeal membrane oxygenation for 2009 influenza A(H1N1) acute respiratory distress syndrome. JAMA 2009; 302:1888–1895.
- Noah MA, Peek GJ, Finney SJ, et al. Referral to an extracorporeal membrane oxygenation center and mortality among patients with severe 2009 influenza A(H1N1). JAMA 2011; 306:1659–1668.
- Patroniti N, Zangrillo A, Pappalardo F, et al. The Italian ECMO network experience during the 2009 influenza A(H1N1) pandemic: preparation for severe respiratory emergency outbreaks. Intensive Care Med 2011; 37:1447–1457.
- Pham T, Combes A, Roze H, et al; REVA Research Network. Extracorporeal membrane oxygenation for pandemic influenza A(H1N1)-induced acute respiratory distress syndrome: a cohort study and propensity-matched analysis. Am J Respir Crit Care Med 2013; 187:276–285.
- Schmidt M, Zogheib E, Roze H, et al. The PRESERVE mortality risk score and analysis of long-term outcomes after extracorporeal membrane oxygenation for severe acute respiratory distress syndrome. Intensive Care Med 2013; 39; 532:1704–1713.
- Schmidt M, Bailey M, Sheldrake J, et al. Predicting survival after extracorporeal membrane oxygenation for severe acute respiratory failure. The Respiratory Extracorporeal Membrane Oxygenation Survival Prediction (RESP) score. Am J Respir Crit Care Med 2014; 189:1374–1382.
- Chan KK, Lee KL, Lam PK, Law KI, Joynt GM, Yan WW. Hong Kong's experience on the use of extracorporeal membrane oxygenation for the treatment of influenza A (H1N1). Hong Kong Med J 2010; 16:447–454.
- Freed DH, Henzler D, White CW, et al; Canadian Critical Care Trials Group. Extracorporeal lung support for patients who had severe respiratory failure secondary to influenza A (H1N1) 2009 infection in Canada. Can J Anaesth 2010; 57:240–247.
- Nair P, Davies AR, Beca J, et al. Extracorporeal membrane oxygenation for severe ARDS in pregnant and postpartum women during the 2009 H1N1 pandemic. Intensive Care Med 2011; 37:648–654.
- Turner DA, Rehder KJ, Peterson-Carmichael SL, et al. Extracorporeal membrane oxygenation for severe refractory respiratory failure secondary to 2009 H1N1 influenza A. Respir Care 2011; 56:941–946.
- Kumar A, Zarychanski R, Pinto R, et al; Canadian Critical Care Trials Group H1N1 Collaborative. Critically ill patients with 2009 influenza A(H1N1) infection in Canada. JAMA 2009; 302:1872–1879.
- Abrams D, Combes A, Brodie D. Extracorporeal membrane oxygenation in cardiopulmonary disease in adults. J Am Coll Cardiol 2014; 63:2769–2778.
- Marasco SF, Lukas G, McDonald M, McMillan J, Ihle B. Review of ECMO (extra corporeal membrane oxygenation) support in critically ill adult patients. Heart Lung Circ 2008; 17(suppl 4):S41–S47.
- Hysi I, Fabre O, Renaut C, Guesnier L. Extracorporeal membrane oxygenation with direct axillary artery perfusion. J Card Surg 2014; 29:268–269.
- Gattinoni L, Kolobow T, Agostoni A, et al. Clinical application of low frequency positive pressure ventilation with extracorporeal CO2 removal (LFPPV-ECCO2R) in treatment of adult respiratory distress syndrome (ARDS). Int J Artif Organs 1979; 2:282–283.
- Liebold A, Philipp A, Kaiser M, Merk J, Schmid FX, Birnbaum DE. Pumpless extracorporeal lung assist using an arterio-venous shunt. Applications and limitations. Minerva Anestesiol 2002; 68:387–391.
- Paden ML, Conrad SA, Rycus PT, Thiagarajan RR; ELSO Registry. Extracorporeal Life Support Organization Registry Report 2012. ASAIO J 2013; 59:202–210.
- Shekar K, Davies AR, Mullany DV, Tiruvoipati R, Fraser JF. To ventilate, oscillate, or cannulate? J Crit Care 2013; 28:655–662.
- Mikkelsen ME, Woo YJ, Sager JS, Fuchs BD, Christie JD. Outcomes using extracorporeal life support for adult respiratory failure due to status asthmaticus. ASAIO J 2009; 55:47–52.
- Turner DA, Cheifetz IM. Extracorporeal membrane oxygenation for adult respiratory failure. Respir Care 2013; 58:1038–1052.
- Sharma NS, Wille KM, Bellot SC, Diaz-Guzman E. Modern use of extracorporeal life support in pregnancy and postpartum. ASAIO J 2015; 61:110–114.
- Ried M, Bein T, Philipp A, et al. Extracorporeal lung support in trauma patients with severe chest injury and acute lung failure: a 10-year institutional experience. Crit Care 2013; 17:R110.
- Al-Soufi S, Buscher H, Nguyen ND, Rycus P, Nair P. Lack of association between body weight and mortality in patients on veno-venous extracorporeal membrane oxygenation. Intensive Care Med 2013; 39:1995–2002.
- Marhong JD, Telesnicki T, Munshi L, Del Sorbo L, Detsky M, Fan E. Mechanical ventilation during extracorporeal membrane oxygenation. An international survey. Ann Am Thorac Soc 2014; 11:956–961.
- Schmidt M, Pellegrino V, Combes A, Scheinkestel C, Cooper DJ, Hodgson C. Mechanical ventilation during extracorporeal membrane oxygenation. Crit Care 2014; 18:203.
- Bein T, Wittmann S, Philipp A, Nerlich M, Kuehnel T, Schlitt HJ. Successful extubation of an "unweanable" patient with severe ankylosing spondylitis (Bechterew's disease) using a pumpless extracorporeal lung assist. Intensive Care Med 2008; 34:2313–2314.
- Anton-Martin P, Thompson MT, Sheeran PD, Fischer AC, Taylor D, Thomas JA. Extubation during pediatric extracorporeal membrane oxygenation: a single-center experience. Pediatr Crit Care Med 2014; 15:861–869.
- Sidebotham D, McGeorge A, McGuinness S, Edwards M, Willcox T, Beca J. Extracorporeal membrane oxygenation for treating severe cardiac and respiratory failure in adults: part 2-technical considerations. J Cardiothorac Vasc Anesth 2010; 24:164–172.
- Stammers AH, Willett L, Fristoe L, et al. Coagulation monitoring during extracorporeal membrane oxygenation: the role of thrombelastography. J Extra Corpor Technol 1995; 27:137–145.
- Bembea MM, Schwartz JM, Shah N, et al. Anticoagulation monitoring during pediatric extracorporeal membrane oxygenation. ASAIO J 2013; 59:63–68.
- Agerstrand CL, Burkart KM, Abrams DC, Bacchetta MD, Brodie D. Blood conservation in extracorporeal membrane oxygenation for acute respiratory distress syndrome. Ann Thorac Surg 2015; 99:590–595.
- Voelker MT, Busch T, Bercker S, Fichtner F, Kaisers UX, Laudi S. Restrictive transfusion practice during extracorporeal membrane oxygenation therapy for severe acute respiratory distress syndrome. Artif Organs 2015; 39:374–378.
- National Heart, Lung, and Blood Institute Acute Respiratory Distress Syndrome (ARDS) Clinical Trials Network; Wiedemann HP, Wheeler AP, Bernard GR, et al. Comparison of two fluid-management strategies in acute lung injury. N Engl J Med 2006; 354:2564–2575.
- Fleming GM, Askenazi DJ, Bridges BC, et al. A multicenter international survey of renal supportive therapy during ECMO: the Kidney Intervention During Extracorporeal Membrane Oxygenation (KIDMO) group. ASAIO J 2012; 58:407–414.
- Askenazi DJ, Selewski DT, Paden ML, et al. Renal replacement therapy in critically ill patients receiving extracorporeal membrane oxygenation. Clin J Am Soc Nephrol 2012; 7:1328–1336.
- Schweickert WD, Pohlman MC, Pohlman AS, et al. Early physical and occupational therapy in mechanically ventilated, critically ill patients: a randomised controlled trial. Lancet 2009; 373:1874–1882.
- Abrams D, Javidfar J, Farrand E, et al. Early mobilization of patients receiving extracorporeal membrane oxygenation: a retrospective cohort study. Crit Care 2014; 18:R38.
- Thiagarajan RR, Teele SA, Teele KP, Beke DM. Physical therapy and rehabilitation issues for patients supported with extracorporeal membrane oxygenation. J Pediatr Rehabil Med 2012; 5:47–52.
- Hoopes CW, Kukreja J, Golden J, Davenport DL, Diaz-Guzman E, Zwischenberger JB. Extracorporeal membrane oxygenation as a bridge to pulmonary transplantation. J Thorac Cardiovasc Surg 2013; 145:862–868.
- Burket JS, Bartlett RH, Vander Hyde K, Chenoweth CE. Nosocomial infections in adult patients undergoing extracorporeal membrane oxygenation. Clin Infect Dis 1999; 28:828–833.
- Lafç G, Budak AB, Yener AÜ, Cicek OF. Use of extracorporeal membrane oxygenation in adults. Heart Lung Circ 2014; 23:10–23.
Extracorporeal membrance oxygenation (ECMO) provides temporary cardiorespiratory support for patients with severe respiratory or cardiac failure refractory to conventional therapy.1 It can be configured to provide oxygen, remove carbon dioxide, support perfusion, or all of the above. It may provide a bridge to recovery in patients with acute cardiopulmonary failure or to heart or lung transplant.
Developed in the 1970s, ECMO has proven effective and is widely used in children with respiratory and cardiopulmonary failure.2 However, it remained little used in adults, as early randomized trials showed higher rates of complications in adults who received it and no survival advantage.3,4 Proponents of using it in adult patients believe that these poor outcomes were at least partially due to limited training, intensive anticoagulation, and excessive volume and pressure during mechanical ventilation. Although ECMO technology has improved substantially in the last decade and survival rates have improved (www.elso.org), evidence to support its routine use in adults remains limited.
Nevertheless, about 14,000 adult patients received ECMO between 1990 and 2014, with a rate of survival to discharge of 57% for those in respiratory failure and 41% for those in cardiac failure.5 Its use increased 433% in the United States from 2006 to 2011.6
A national survey of critical care physicians and trainees in the United States found they had limited knowledge about ECMO technology and wanted to include specific educational objectives about it in their training.7
This article summarizes the principles of ECMO, including practical aspects such as patient selection, monitoring, and complications.
LIMITED EVIDENCE OF BENEFIT FROM CONTROLLED TRIALS
There is limited evidence from randomized controlled trials that ECMO is beneficial in adults.
In acute respiratory failure, the first randomized trial of ECMO in adults was conducted in 1979 in multiple medical centers.3 The survival rate was no higher with ECMO than with mechanical ventilation alone, and complication rates were very high.
Similarly, Morris et al4 performed a single-center trial comparing pressure-controlled inverse-ratio ventilation and extracorporeal carbon dioxide removal in patients with acute respiratory distress syndrome, which showed no survival benefit.
After these two early trials, ECMO was largely abandoned, and not until 2009 did a multicenter randomized trial in acute respiratory distress syndrome8 rejuvenate interest in its use. Although the trial did not conclusively prove that ECMO was more effective than conventional mechanical ventilation, the findings supported early referral to tertiary care centers with ECMO expertise, and the survival rate was substantially higher than in previous studies. A concise summary of randomized trials and retrospective studies utilizing ECMO in respiratory failure is shown in Table 1.8–14
During the global pandemic of influenza H1N1 in 2009–2010, several centers reported survival benefits from ECMO in patients with severe acute respiratory distress syndrome secondary to influenza.9–12,15–19 Two retrospective case-control studies reported lower mortality rates when H1N1 patients were transferred to ECMO centers10 and among younger patients with H1N1 who received ECMO.12
Ongoing trials (ClinicalTrials.gov identifier NCT01470703) may provide definitive evidence for the effectiveness of ECMO as a rescue therapy in acute respiratory distress syndrome.
In cardiogenic shock, single-center retrospective and observational studies have reported better outcomes for patients who received ECMO for cardiogenic shock secondary to myocardial infarction, pulmonary embolism, sepsis-related cardiomyopathy, and even extracorporeal cardiopulmonary resuscitation.20
WHAT IS ECMO?
In ECMO, venous blood is shunted through a machine to add oxygen, remove carbon dioxide, and regulate temperature (Figure 1). The components of an ECMO circuit are as follows:
- Blood pump
- Membrane oxygenator
- Gas mixer
- Cannulas
- Heater/cooler
- Console.
TWO BASIC CONFIGURATIONS
Two basic ECMO configurations are used in adults: venoarterial and venovenous,21 although combinations of the two—hybrid configurations—are sometimes used (Figure 2).
Venoarterial ECMO
Venoarterial ECMO provides complete or partial support to the heart and lungs and is the configuration of choice in patients with isolated cardiac failure that is refractory to other treatments. It takes deoxygenated blood from the venous system and returns oxygenated blood to the arterial circulation.
In the central venoarterial configuration, the intake cannula is most often surgically placed in the right atrium and the return cannula is placed in the proximal ascending aorta.
In the peripheral femoral configuration, the drainage cannula is placed in the femoral vein and advanced to the right atrium, and the return cannula is placed in either the ipsilateral or contralateral femoral artery. However, this configuration provides the patient with retrograde flow (against the native cardiac output), and oxygen delivery to the upper body may be impeded.
Axillary cannulation, in which the return cannula is placed directly into the axillary artery to provide antegrade flow, has been used recently in patients with pulmonary hypertension or right ventricular failure.22
Venovenous ECMO
Venovenous ECMO provides complete or partial support to the lungs and is the configuration of choice in isolated respiratory failure when cardiac function is preserved. It takes deoxygenated blood from the central venous system—either the femoral vein or internal jugular vein—and returns oxygenated blood to the venous circulation directed into the right atrium. It can be delivered by different cannula configurations based on the patient’s size and clinical requirements.
In the past, the most commonly used configuration was the femoral-atrial, in which the drainage cannula was placed in the femoral vein with the tip advanced to the level of the diaphragm in the inferior vena cava, and the return cannula was placed in the right internal jugular vein with its tip at the junction of the superior vena cava and right atrium. In this configuration, some of the oxygenated blood delivered by the superior vena cava cannula reaches the inferior vena cava cannula, creating a “shunt,” also known as “recirculation.”
Currently, a double-lumen cannula is preferred. This type of cannula is placed in the right internal jugular vein with the tip advanced to the inferior vena cava so that blood is drained through one lumen from both the inferior and superior vena cavas and returned via the other lumen with the jet directed over the tricuspid valve. Advantages of this system are that as it delivers more oxygen to the pulmonary arteries it reduces recirculation, it requires only a single cannula to be inserted, and it facilitates ambulation and rehabilitation in patients requiring long-term ECMO.
A newer double-lumen cannula designed to drain venous blood from the right atrium and reinfuse it directly into the pulmonary artery may provide an alternative for patients with right ventricular failure.
Extracorporeal removal of carbon dioxide
ECMO can remove carbon dioxide in patients with hypercapneic respiratory failure. Early technology used a variation of venovenous ECMO with very low blood flow rates through the pump, which allowed use of smaller cannulas while efficiently removing carbon dioxide.23
Since then, a pumpless extracorporeal lung-assist device has been developed that uses an arteriovenous configuration with two smaller cannulas inserted into the femoral artery and vein (Novalung, Germany).24 Lacking a pump, it avoids the complications associated with pumps such as hemolysis and clotting. It effectively removes carbon dioxide and helps reduce the frequency and intensity of mechanical ventilation. Since the flow is driven by the patient’s arteriovenous pressure gradient, good cardiac output is a prerequisite for its use.
A portable low-blood-flow machine that uses a very small (ie, 15-F) catheter in the venovenous configuration is under investigation (Hemolung RAS, Alung Technologies).
WHO CAN BENEFIT FROM ECMO?
Although evidence to support the routine use of ECMO is limited, tools and guidelines have been developed to help clinicians decide if a patient might benefit from it. Indications for and contraindications to ECMO are shown in Table 2.
The Extracorporeal Life Support Organization recommends considering ECMO if the predicted risk of death is greater than 50% without it, and says ECMO is indicated if the predicted risk exceeds 80%. A scoring system has been developed to help predict the risk of death in patients on ECMO.14 This system has been validated using a historical cohort of patients, and current studies are ongoing for prospective validation.
Many centers are now using ECMO as a salvage therapy in patients with severe respiratory failure when conventional mechanical ventilation and adjunctive therapies such as neuromuscular blockade, inhaled nitric oxide, steroids, prone positioning, and high-frequency oscillation therapy fail to improve gas exchange.25,26
ECMO is also indicated in hypercapneic respiratory failure secondary to status asthmaticus and exacerbation of chronic obstructive pulmonary disease, permissive hypercapnea with a Paco2 greater than 80 mm Hg, or inability to achieve safe inflation pressures with plateau pressures of 30 cm H2O or higher, refractory to conventional therapy.27
Sometimes, delay in referral leads to irreversible ventilator-induced lung injury due to intense mechanical ventilation, thus limiting the utility of ECMO.8 Early referral should be considered if the patient does not improve after a few days on optimal ventilator settings. In centers where this technology is not available, referral to the nearest ECMO center should be considered. A list of certified ECMO centers is available at www.elso.org/Members/CenterDirectory.aspx.
Contraindications to ECMO
Advanced age, comorbid conditions such as malignancy, nonpulmonary organ dysfunction (including complications of critical illness), and immunodeficiency or pharmacologic immune suppression have been associated with poor outcomes in ECMO patients.28 Severe aortic incompetence and aortic dissection are contraindications, since ventricular end-diastolic pressure can be increased with resultant ventricular distention, compromised myocardial oxygenation, and worsening of left heart failure.
ECMO is increasingly being used in situations in which it was previously considered contraindicated. Pregnant and postpartum patients with cardiorespiratory failure were previously not considered for ECMO because of a possible increased risk of coagulopathy and complications. However, a recent review showed that the outcomes of ECMO in pregnancy and postpartum were similar to those in nonpregnant patients, and the risk of catastrophic bleeding was minor.29
Similarly, ECMO is also being used increasingly in posttrauma patients and patients with other bleeding risks.30
Morbid obesity was once considered a contraindication because of difficulty in cannulation, but with newer types of cannulas, even patients with a body mass index greater than 60 kg/m2 are receiving ECMO.31
HOW DO YOU DO IT?
Figures 3 and 4 depict clinical decision-making in starting and weaning from ECMO in respiratory failure and cardiogenic shock, respectively.
Management of patients on ECMO
Appropriate patient selection and initiation of ECMO are only the beginning of a tough journey. Successful management requires minimizing lung injury from mechanical ventilation, careful monitoring of anticoagulation, and instituting adequate physical therapy, including ambulation when possible (Table 3).
Initial ECMO settings and monitoring
The cannulas for venovenous ECMO are frequently inserted under fluoroscopic or transesophageal echocardiographic guidance, whereas venoarterial ECMO cannulation does not require imaging and can be performed at the bedside in the intensive care unit or operating room.
The initial ECMO settings are titrated according to the patient’s hemodynamic and respiratory needs. There are three main variables: blood flow, fraction of oxygen in the sweep gas, and sweep gas flow rate. These are adjusted to achieve desirable levels of oxygen and carbon dioxide in the blood.
Blood flow is determined by the revolutions per minute of the pump, preload, and afterload of the circuit. Common patient conditions that may reduce flow are systemic hypertension, hypovolemia, cardiac tamponade, and tension pneumothorax, depending on the modality. In addition, mechanical factors such as clots in the oxygenator or kinks in the circuit can increase resistance and reduce flow. Resistance to flow is directly proportional to cannula lengths and inversely proportional to cannula radius to the fourth power. The greater the flow, the greater the oxygen delivery.
Fraction of oxygen in the sweep gas. The oxygenator has a gas blender that mixes air and oxygen and allows for a range of oxygen concentrations. Increases in fraction of oxygen increase the partial pressure of oxygen in the blood.
Sweep gas flow rate. Venous blood in the extracorporeal circuit is exposed to fresh gas (or sweep gas) that oxygenates the blood and removes carbon dioxide by diffusion. Increasing the sweep gas flow rate results in greater carbon dioxide elimination from the blood.
Laboratory monitoring. During ECMO, the following values are monitored frequently:
- Arterial blood gases
- Blood gases in the ECMO circuit before and after going through the oxygenator— to monitor the efficacy of the oxygenator membrane
- Lactic acid—to monitor for tissue hypoxia
- Plasma free hemoglobin (a marker of hemolysis)—to monitor for hemolysis.
Mechanical ventilation on ECMO
Low tidal volume ventilation greatly reduces the risk of death in patients on ECMO by reducing ventilator-induced lung injury. Proponents of ECMO believe that ECMO provides “lung rest,” and thus it is imperative that lung-protective ventilation strategies be followed in patients on ECMO.8 In most cases, after ECMO is started, low tidal volume ventilation (6 mL/kg) is possible and should be used—or even very low tidal volume ventilation (3–6 mL/kg).32,33 Many cases have also been described in which patients have been safely extubated while on ECMO to prevent ventilator-induced lung injury.34,35
If hypoxemia persists
Despite full support with venovenous ECMO, some patients remain hypoxemic due to inadequate blood flow to match metabolic demands, eg, patients with morbid obesity or severe sepsis and fever. The physician should ensure there is no recirculation, maximize blood flow, optimize the hematocrit to increase oxygen delivery, and consider ways to decrease oxygen consumption, including sedation, paralysis, and hypothermia.
Recirculation can be calculated by measuring the oxygen saturation of the blood in the ECMO machine before and after it goes through the oxygenator, and also in the central venous blood. Recirculation has been reduced by using double-lumen cannulas but can also be reduced by manipulation of the reinfusion cannula or increasing the distance between drainage and reinfusion ports in other configurations of venovenous ECMO.
Expert opinion suggests that oxygen saturation of 86% or more and Pao2 of 55 mm Hg or more in patients on venovenous ECMO are sufficient to prevent hypoxia-related end-organ injury.36 Venoarterial ECMO should be considered in patients on venovenous ECMO with refractory hypoxemia with the above measures.
Harlequin syndrome is characterized by upper body hypoxia resulting in cerebral hypoxemia due to poorly oxygenated blood in the coronary and cerebral circulations, especially in patients on peripheral venoarterial ECMO. It can be detected by sampling the blood in the arm (where the oxygen isn’t going) instead of the leg (where the oxygen is going), and it can be corrected by adjusting the Fio2, using positive end-expiratory pressure, or both to increase oxygenation. If ventilator settings do not improve this syndrome, the arterial cannulation site can be switched from the femoral artery to the axillary or carotid artery.
Alternatively, a mixed-configuration venoarterial-venous ECMO can also be created, in which a portion of arterialized blood from the arterial outflow cannula is diverted via the right internal jugular artery to the right heart. This enriches the blood traveling through the pulmonary circulation and to the left ventricle to provide better oxygen delivery to the coronary and cerebral circulations.
Anticoagulation monitoring and transfusions
Anticoagulation is necessary to maintain a clot-free and functional circuit. Most clots develop in the oxygenator membrane, where they can prevent optimal gas exchange and, rarely, lead to embolization to the systemic circulation. However, reports have suggested that anticoagulation can be held for short periods on ECMO if necessary.
Unfractionated heparin is usually used for anticoagulation. Commonly used tests to monitor anticoagulation are the augmented partial thromboplastin time, activated clotting time, and anti-factor Xa levels. Lately, thromboelastography analysis is being used to comprehensively monitor various components of the coagulation cascade.37 Anticoagulation is usually tailored to whether there are clots in the circuit, coagulopathy, and bleeding while on ECMO.38
Traditionally, blood products were used liberally during ECMO to maintain a normal hematocrit and improve oxygen delivery, although recent data suggest that outcomes may be similar with conservative use of blood products.39,40
Fluid management on ECMO
ECMO patients are fluid-overloaded due to a profound inflammatory response, cardiac failure, or both. Studies have shown that conservative fluid management improve lung function and shortens the duration of mechanical ventilation and intensive care in patients with lung injury.41 Hence, the patient’s net fluid balance should be kept negative, provided renal and hemodynamic parameters remain stable.
There is a high incidence of acute kidney injury in ECMO patients, and fluid overload is one of the main indications for renal replacement therapy.42 Continuous renal replacement therapy can be provided either by an in-line hemofilter or by incorporating a standard continuous renal replacement therapy machine into the ECMO circuit. There are no studies comparing the efficacy of these techniques, but they allow for rapid improvement in fluid balance and electrolyte disturbances and are commonly used in ECMO patients.42,43
Physical rehabilitation and ambulation on ECMO
Physical rehabilitation in mechanically ventilated patients has been shown to reduce ventilator days and stay in the intensive care unit.44 With the use of internal jugular double-lumen cannulas for venovenous ECMO and improvement in durability of the ECMO circuit, several centers are implementing physical rehabilitation and ambulation for patients while on ECMO. Current data suggest that physical therapy is safe for patients receiving ECMO and may accelerate the weaning process and shorten length of stay in the hospital after ECMO.45,46 Aggressive rehabilitation is especially beneficial in patients awaiting lung transplant and may improve posttransplant recovery and outcomes.47
Weaning from ECMO
There are no standard guidelines for weaning from venovenous or venoarterial ECMO. Once the underlying condition for which ECMO was initiated has improved, weaning can begin by reducing the blood flow rate, the flow rate of the sweep gas, or both.
Weaning from venovenous ECMO should be started when there is improvement in lung compliance, tidal volumes, and oxygenation. Once the circuit flow rate is reduced to less than 3 L/minute, ventilator settings are adjusted to standard lung-protective settings. ECMO support is gradually decreased by reducing the flow rate of sweep gas to less than 2 L/minute. If tidal volumes, respiratory rate, and gas exchange remain adequate after approximately 2 to 4 hours on a low rate of sweep gas, the patient can be weaned off the venovenous ECMO circuit.
Weaning from venoarterial ECMO should be considered when there is myocardial recovery with improved pulse pressure and contractility on echocardiography. This is done by reducing flow rates in increments of 0.5 to 2 L/minute over 24 to 36 hours and monitoring mean arterial pressures, central venous pressure, and myocardial contractility. When acceptable, patients are mostly weaned in a surgical setting. Prolonged periods on a low rate of blood flow are avoided to prevent thrombus formation in the circuit.
COMPLICATIONS OF ECMO
ECMO use can be associated with a myriad of patient and mechanical complications.
Hemorrhage is the most common complication encountered in ECMO, occurring in approximately 43% of patients.29 It occurs most frequently from cannulation and surgical sites. Although rare, potentially life-threatening pulmonary hemorrhage (including bleeding at the tracheostomy site), intracranial hemorrhage, and gastrointestinal hemorrhage have also been reported.30
Infections, including new infection and worsening sepsis in patients with acute respiratory distress syndrome secondary to infection, are common in patients on ECMO.48
Renal failure secondary to acute tubular necrosis requiring hemodialysis has been reported to occur in 13% of patients on ECMO.30
Other complications of concern, especially in patients on venoarterial ECMO, are lower limb ischemia and thromboembolism associated with site of cannulation and direction of blood flow.49 Mechanical complications include inappropriate placement of the cannula leading to insufficient oxygenation, injury to vessel walls, and rarely myocardial wall rupture; thrombus formation within the circuit causing failure of the oxygenator and sometimes, pulmonary or systemic embolism; and air embolism from the circuit.36
NOT SUITED FOR ALL
Despite limited data to support its use, there has been a recent increase in utilization of ECMO to support critically ill adult patients with cardiopulmonary failure. ECMO support is not suited for all patients. Careful selection of patients should be done to optimize resource utilization and provide the best opportunity for recovery or transplant.
- MacLaren G, Combes A, Bartlett RH. Contemporary extracorporeal membrane oxygenation for adult respiratory failure: life support in the new era. Intensive Care Med 2012; 38:210–220.
- Maslach-Hubbard A, Bratton SL. Extracorporeal membrane oxygenation for pediatric respiratory failure: history, development and current status. World J Crit Care Med 2013; 2:29–39.
- Zapol WM, Snider MT, Hill JD, et al. Extracorporeal membrane oxygenation in severe acute respiratory failure. A randomized prospective study. JAMA 1979; 242:2193–2196.
- Morris AH, Wallace CJ, Menlove RL, et al. Randomized clinical trial of pressure-controlled inverse ratio ventilation and extracorporeal CO2 removal for adult respiratory distress syndrome. Am J Respir Crit Care Med 1994; 149:295–305.
- Extracorporeal Life Support Organization. ECLS registry report. International Summary. January 2016. https://www.elso.org/Registry.aspx. Accessed March 17, 2016.
- Sauer CM, Yuh DD, Bonde P. Extracorporeal membrane oxygenation use has increased by 433% in adults in the United States from 2006 to 2011. ASAIO J 2015; 61:31–36.
- Sharma N, Wille K, Bellot S, Brodie D, Diaz-Guzman E. Role of extracorporeal membrane oxygenation in management of refractory ARDS in the intensive care unit: a national survey on perspectives of the adult critical care physicians and trainees. Chest 2014. http://journal.publications.chestnet.org/article.aspx?articleid=1913336. Accessed March 17, 2016.
- Peek GJ, Mugford M, Tiruvoipati R, et al; CESAR trial collaboration. Efficacy and economic assessment of conventional ventilatory support versus extracorporeal membrane oxygenation for severe adult respiratory failure (CESAR): a multicentre randomised controlled trial. Lancet 2009; 374:1351–1363.
- Australia and New Zealand Extracorporeal Membrane Oxygenation (ANZ ECMO) Influenza Investigators; Davies A, Jones D, Bailey M, et al. Extracorporeal membrane oxygenation for 2009 influenza A(H1N1) acute respiratory distress syndrome. JAMA 2009; 302:1888–1895.
- Noah MA, Peek GJ, Finney SJ, et al. Referral to an extracorporeal membrane oxygenation center and mortality among patients with severe 2009 influenza A(H1N1). JAMA 2011; 306:1659–1668.
- Patroniti N, Zangrillo A, Pappalardo F, et al. The Italian ECMO network experience during the 2009 influenza A(H1N1) pandemic: preparation for severe respiratory emergency outbreaks. Intensive Care Med 2011; 37:1447–1457.
- Pham T, Combes A, Roze H, et al; REVA Research Network. Extracorporeal membrane oxygenation for pandemic influenza A(H1N1)-induced acute respiratory distress syndrome: a cohort study and propensity-matched analysis. Am J Respir Crit Care Med 2013; 187:276–285.
- Schmidt M, Zogheib E, Roze H, et al. The PRESERVE mortality risk score and analysis of long-term outcomes after extracorporeal membrane oxygenation for severe acute respiratory distress syndrome. Intensive Care Med 2013; 39; 532:1704–1713.
- Schmidt M, Bailey M, Sheldrake J, et al. Predicting survival after extracorporeal membrane oxygenation for severe acute respiratory failure. The Respiratory Extracorporeal Membrane Oxygenation Survival Prediction (RESP) score. Am J Respir Crit Care Med 2014; 189:1374–1382.
- Chan KK, Lee KL, Lam PK, Law KI, Joynt GM, Yan WW. Hong Kong's experience on the use of extracorporeal membrane oxygenation for the treatment of influenza A (H1N1). Hong Kong Med J 2010; 16:447–454.
- Freed DH, Henzler D, White CW, et al; Canadian Critical Care Trials Group. Extracorporeal lung support for patients who had severe respiratory failure secondary to influenza A (H1N1) 2009 infection in Canada. Can J Anaesth 2010; 57:240–247.
- Nair P, Davies AR, Beca J, et al. Extracorporeal membrane oxygenation for severe ARDS in pregnant and postpartum women during the 2009 H1N1 pandemic. Intensive Care Med 2011; 37:648–654.
- Turner DA, Rehder KJ, Peterson-Carmichael SL, et al. Extracorporeal membrane oxygenation for severe refractory respiratory failure secondary to 2009 H1N1 influenza A. Respir Care 2011; 56:941–946.
- Kumar A, Zarychanski R, Pinto R, et al; Canadian Critical Care Trials Group H1N1 Collaborative. Critically ill patients with 2009 influenza A(H1N1) infection in Canada. JAMA 2009; 302:1872–1879.
- Abrams D, Combes A, Brodie D. Extracorporeal membrane oxygenation in cardiopulmonary disease in adults. J Am Coll Cardiol 2014; 63:2769–2778.
- Marasco SF, Lukas G, McDonald M, McMillan J, Ihle B. Review of ECMO (extra corporeal membrane oxygenation) support in critically ill adult patients. Heart Lung Circ 2008; 17(suppl 4):S41–S47.
- Hysi I, Fabre O, Renaut C, Guesnier L. Extracorporeal membrane oxygenation with direct axillary artery perfusion. J Card Surg 2014; 29:268–269.
- Gattinoni L, Kolobow T, Agostoni A, et al. Clinical application of low frequency positive pressure ventilation with extracorporeal CO2 removal (LFPPV-ECCO2R) in treatment of adult respiratory distress syndrome (ARDS). Int J Artif Organs 1979; 2:282–283.
- Liebold A, Philipp A, Kaiser M, Merk J, Schmid FX, Birnbaum DE. Pumpless extracorporeal lung assist using an arterio-venous shunt. Applications and limitations. Minerva Anestesiol 2002; 68:387–391.
- Paden ML, Conrad SA, Rycus PT, Thiagarajan RR; ELSO Registry. Extracorporeal Life Support Organization Registry Report 2012. ASAIO J 2013; 59:202–210.
- Shekar K, Davies AR, Mullany DV, Tiruvoipati R, Fraser JF. To ventilate, oscillate, or cannulate? J Crit Care 2013; 28:655–662.
- Mikkelsen ME, Woo YJ, Sager JS, Fuchs BD, Christie JD. Outcomes using extracorporeal life support for adult respiratory failure due to status asthmaticus. ASAIO J 2009; 55:47–52.
- Turner DA, Cheifetz IM. Extracorporeal membrane oxygenation for adult respiratory failure. Respir Care 2013; 58:1038–1052.
- Sharma NS, Wille KM, Bellot SC, Diaz-Guzman E. Modern use of extracorporeal life support in pregnancy and postpartum. ASAIO J 2015; 61:110–114.
- Ried M, Bein T, Philipp A, et al. Extracorporeal lung support in trauma patients with severe chest injury and acute lung failure: a 10-year institutional experience. Crit Care 2013; 17:R110.
- Al-Soufi S, Buscher H, Nguyen ND, Rycus P, Nair P. Lack of association between body weight and mortality in patients on veno-venous extracorporeal membrane oxygenation. Intensive Care Med 2013; 39:1995–2002.
- Marhong JD, Telesnicki T, Munshi L, Del Sorbo L, Detsky M, Fan E. Mechanical ventilation during extracorporeal membrane oxygenation. An international survey. Ann Am Thorac Soc 2014; 11:956–961.
- Schmidt M, Pellegrino V, Combes A, Scheinkestel C, Cooper DJ, Hodgson C. Mechanical ventilation during extracorporeal membrane oxygenation. Crit Care 2014; 18:203.
- Bein T, Wittmann S, Philipp A, Nerlich M, Kuehnel T, Schlitt HJ. Successful extubation of an "unweanable" patient with severe ankylosing spondylitis (Bechterew's disease) using a pumpless extracorporeal lung assist. Intensive Care Med 2008; 34:2313–2314.
- Anton-Martin P, Thompson MT, Sheeran PD, Fischer AC, Taylor D, Thomas JA. Extubation during pediatric extracorporeal membrane oxygenation: a single-center experience. Pediatr Crit Care Med 2014; 15:861–869.
- Sidebotham D, McGeorge A, McGuinness S, Edwards M, Willcox T, Beca J. Extracorporeal membrane oxygenation for treating severe cardiac and respiratory failure in adults: part 2-technical considerations. J Cardiothorac Vasc Anesth 2010; 24:164–172.
- Stammers AH, Willett L, Fristoe L, et al. Coagulation monitoring during extracorporeal membrane oxygenation: the role of thrombelastography. J Extra Corpor Technol 1995; 27:137–145.
- Bembea MM, Schwartz JM, Shah N, et al. Anticoagulation monitoring during pediatric extracorporeal membrane oxygenation. ASAIO J 2013; 59:63–68.
- Agerstrand CL, Burkart KM, Abrams DC, Bacchetta MD, Brodie D. Blood conservation in extracorporeal membrane oxygenation for acute respiratory distress syndrome. Ann Thorac Surg 2015; 99:590–595.
- Voelker MT, Busch T, Bercker S, Fichtner F, Kaisers UX, Laudi S. Restrictive transfusion practice during extracorporeal membrane oxygenation therapy for severe acute respiratory distress syndrome. Artif Organs 2015; 39:374–378.
- National Heart, Lung, and Blood Institute Acute Respiratory Distress Syndrome (ARDS) Clinical Trials Network; Wiedemann HP, Wheeler AP, Bernard GR, et al. Comparison of two fluid-management strategies in acute lung injury. N Engl J Med 2006; 354:2564–2575.
- Fleming GM, Askenazi DJ, Bridges BC, et al. A multicenter international survey of renal supportive therapy during ECMO: the Kidney Intervention During Extracorporeal Membrane Oxygenation (KIDMO) group. ASAIO J 2012; 58:407–414.
- Askenazi DJ, Selewski DT, Paden ML, et al. Renal replacement therapy in critically ill patients receiving extracorporeal membrane oxygenation. Clin J Am Soc Nephrol 2012; 7:1328–1336.
- Schweickert WD, Pohlman MC, Pohlman AS, et al. Early physical and occupational therapy in mechanically ventilated, critically ill patients: a randomised controlled trial. Lancet 2009; 373:1874–1882.
- Abrams D, Javidfar J, Farrand E, et al. Early mobilization of patients receiving extracorporeal membrane oxygenation: a retrospective cohort study. Crit Care 2014; 18:R38.
- Thiagarajan RR, Teele SA, Teele KP, Beke DM. Physical therapy and rehabilitation issues for patients supported with extracorporeal membrane oxygenation. J Pediatr Rehabil Med 2012; 5:47–52.
- Hoopes CW, Kukreja J, Golden J, Davenport DL, Diaz-Guzman E, Zwischenberger JB. Extracorporeal membrane oxygenation as a bridge to pulmonary transplantation. J Thorac Cardiovasc Surg 2013; 145:862–868.
- Burket JS, Bartlett RH, Vander Hyde K, Chenoweth CE. Nosocomial infections in adult patients undergoing extracorporeal membrane oxygenation. Clin Infect Dis 1999; 28:828–833.
- Lafç G, Budak AB, Yener AÜ, Cicek OF. Use of extracorporeal membrane oxygenation in adults. Heart Lung Circ 2014; 23:10–23.
KEY POINTS
- Two basic configurations of ECMO are used in adults: venoarterial, which can provide cardiac or cardiopulmonary support; and venovenous, which provides respiratory support only.
- ECMO is used in adults who are at very high risk of death without it.
- Because ECMO patients must receive anticoagulation, bleeding is a common complication. Others are infection, renal failure, and thrombosis.
- ECMO may provide “lung rest,” allowing lower tidal volumes and pressures and lower fractions of inspired oxygen to be used in mechanical ventilation, strategies associated with lower mortality rates.
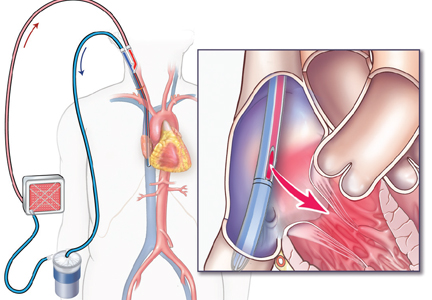
How to interpret surveys in medical research: A practical approach
Surveys are common in medical research. Although survey research may be subject to inherent self-report bias, surveys have a great impact on policies and practices in medicine, often forming the basis for recommendations or new guidelines.1,2 To interpret and use survey research results, clinicians should be familiar with key elements involved in the creation and validation of surveys.
The purpose of this article is to provide readers with a basic framework for evaluating surveys to allow them to be more informed as consumers of survey research.
IMPORTANT TOOLS IN MEDICAL RESEARCH
Surveys are important tools for answering questions on topics that are difficult to assess using other methods.3 They allow us to gather data systematically from subjects by asking questions, in order to make inferences about a larger population.3,4 Clinicians use surveys to explore the opinions, beliefs, and perceptions of a group, or to investigate physician practice patterns and adherence to clinical guidelines. They may also use surveys to better understand why patients are not engaging in recommended behavioral or lifestyle changes.
Survey methods include interviews (in person, by phone) and questionnaires (paper-and-pencil, e-mailed, online).4
A well-constructed, validated survey can provide powerful data that may influence clinical practice, guide future research development, or drive the development and provision of needed programs and services. Surveys have the potential to transform the ways in which we think about and practice medicine.
READER BEWARE
While survey research in health care appears to have grown exponentially, the quality of reported survey research has not necessarily increased over time.
For consumers of survey research, the adage “reader beware” is apt. Although a considerable number of studies have examined the effects of survey methodology on the validity, reliability, and generalizability of the results,4 medical journals differ in their requirements for reporting survey methods.
In an analysis of 117 articles, Bennett et al3 found that more than 80% did not fully describe the survey development process or pretesting methods. They also found limited guidance and lack of consensus about the best way to report survey research. Of 95 surveys requiring scoring, 66% did not report scoring practices.
Duffett et al5 noted that of 127 critical care medicine surveys, only 36% had been pretested or pilot-tested, and half of all surveys reviewed did not include participant demographics or included only minimal information.
Because journal reporting practices differ, physicians may be unaware of the steps involved in survey construction and validation. Knowledge of these steps is helpful not only in constructing surveys but also in assessing published articles that used survey research.
LIMITATIONS OF SURVEY RESEARCH
Indirect measures of attitudes and behaviors
Surveys that rely on participants’ self-reports of behaviors, attitudes, beliefs, or actions are indirect measures and are susceptible to self-report and social-desirability biases. Participants may overestimate their own expertise or knowledge in self-report surveys. They may wish to reduce embarrassment6 or answer in ways that would make them “look better,”7 resulting in social-desirability bias. These issues need to be mentioned in the limitations section in papers reporting survey research.
Questions and response choices
The data derived from surveys are only as good as the questions that are asked.8 Stone9 noted that questions should be intelligible, unambiguous, and unbiased. If respondents do not comprehend questions as researchers intended, if questionnaire response choices are inadequate, or if questions trigger unintended emotional responses,10–14 researchers may unwittingly introduce error, which will affect the validity of results. Even seemingly objective questions, such as those related to clinical algorithm use, practice patterns, or equipment available to hospital staff, may be interpreted differently by different respondents.
In their eagerness to launch a survey, clinician researchers may not realize that it must be carefully constructed. A focus on question development and validation is critical, as the questions determine the quality of the data derived from the survey.8 Even the position of the question or answer in the survey can affect how participants respond,15 as they may be guided to a response choice by preceding questions.16
WHAT DO YOU NEED TO KNOW ABOUT ASSESSING SURVEY RESEARCH?
What follows are questions and a basic framework that can be used to evaluate published survey research. Recommendations are based on the work of survey scientists,4,7,10,14,15,17,18 survey researchers in medicine and the social sciences, and national standards for test and questionnaire construction and validation (Table 1).4,19,20
Who created the survey? How did they do it?
How the survey was created should be sufficiently described to allow readers to judge the adequacy of instrument development.3–5 It is generally recommended that feedback from multiple sources be solicited during survey creation. Both questionnaire-design experts and subject-matter experts are considered critical in the process.4
What question was the survey designed to answer?
Is the objective of the study articulated in the paper? 3,20 To judge survey research, readers need to know if the survey appears to adequately address the research question or questions and the objectives of the study in terms of methods used.4
Was evidence on validity gathered?
Instrument pretesting and field testing are considered best practices by the American Association for Public Opinion Research, a professional organization for US survey scientists.4
Pretesting can include cognitive interviewing, the use of questionnaire appraisal tools, and hybrid methods, all of which are aimed at addressing validity issues.21 Pretesting with a group of participants similar to the target population allows for assessment of item ambiguity, instrument ease of use, adequacy of response categories (response choices), and time to completion.4,12
Cognitive interviewing is designed to explore respondents’ comprehension of questions, response processes, and decision processes governing how they answer questions.4,7,10,11 In cognitive interviewing, respondents are generally interviewed one on one. Techniques vary, but typically include “think alouds” (in which a respondent is asked to verbalize thoughts while responding to questions) and “verbal probing” (in which the respondent answers a question, then is asked follow-up questions as the interviewer probes for information related to the response choice or question itself).7 These techniques can provide evidence that researchers are actually measuring what they set out to measure and not an unrelated construct.4,19
Field testing of a survey under realistic conditions can help to uncover problems in administration, such as issues in standardization of key procedures, and to ensure that the survey was administered as the researchers intended.21,22 Field testing is vital before phone or in-person interviews to ensure standardization of any critical procedures. Pilot testing in a sample similar to the intended population allows for further refinement, with deletion of problem items, before the survey is launched.15
Because even “objective” questions can be somewhat subjective, all research surveys should go through some type of pretesting.4,21 Based on the results of pretesting and field testing, surveys should then be revised before launch.4,21 If an article on a self-report survey makes no mention of survey validation steps, readers may well question the validity of the results.
Are the survey questions and response choices understandable?
Is the meaning of each question unambiguous? Is the reading level appropriate for the sample population (a critical consideration in patient surveys)? Do any of the items actually ask two different questions?13 An example would be: “Was the representative courteous and prompt?” as it is possible to be courteous, but not prompt, and vice versa. If so, respondents may be confused or frustrated in attempting to answer it. If a rating scale is used throughout the questionnaire, are the anchors appropriate? For example, a question may be written in such a way that respondents want to answer “yes/no” or “agree/disagree,” but the scale used may include response options such as “poor,” “marginal,” “good,” and “excellent.” Items with Likert-response formats are commonly used in self-report surveys and allow participants to respond to a statement by choosing from a range of responses (eg, strongly disagree to strongly agree), often spaced horizontally under a line.
It is recommended that surveys also include options for answers beyond the response choices provided,20 such as comment boxes or fill-in-the-blank items. Surveys with a closed-response format may constrain the quality of data collected because investigators may not foresee all possible answers. Surveys need to be available for review either within the article itself, in an appendix, or as supplementary material that is available elsewhere.
Does the sample appear to be appropriate?
Articles that report the results of surveys should describe the target population, the sample design, and, in a demographic table, respondents and nonrespondents. To judge appropriateness, several questions can be asked regarding sampling:
Target population. Is the population of interest (ie, the target population) described, including regional demographics, if applicable? The relationship between the sample and the target population is important, as a nonrepresentative sample may result in misleading conclusions about the population of interest.
Sampling frame. Who had an opportunity to participate in the survey? At its simplest, the sampling frame establishes who (or what, in the case of institutions) should be included within the sample. This is typically a list of elements (Groves et al4) that acts to “frame” or define the sample to be selected. Where the target population may be all academic internal medicine physicians in the United States, the sampling frame may be all male and female US physicians who are members of particular internal medicine professional organizations, identified by their directory email addresses.
Sample design. How was the sample actually selected?4 For example, did investigators use a convenience sample of colleagues at other institutions or use a stratified random sample, ensuring adequate representation of respondents with certain characteristics?
Description of respondents. How is the sample of respondents described? Are demographic features reported, including statistics on regional or national representativeness?5 Does the sample of survey respondents appear to be representative of the researcher’s population of interest (ie, the target population)?3,23 If not, is this adequately described in the limitations section? Although outcomes will not be available on nonrespondents, demographic and baseline data often are available and should be reported. Are there systematic differences between respondents and nonrespondents?
Was the response rate adequate?
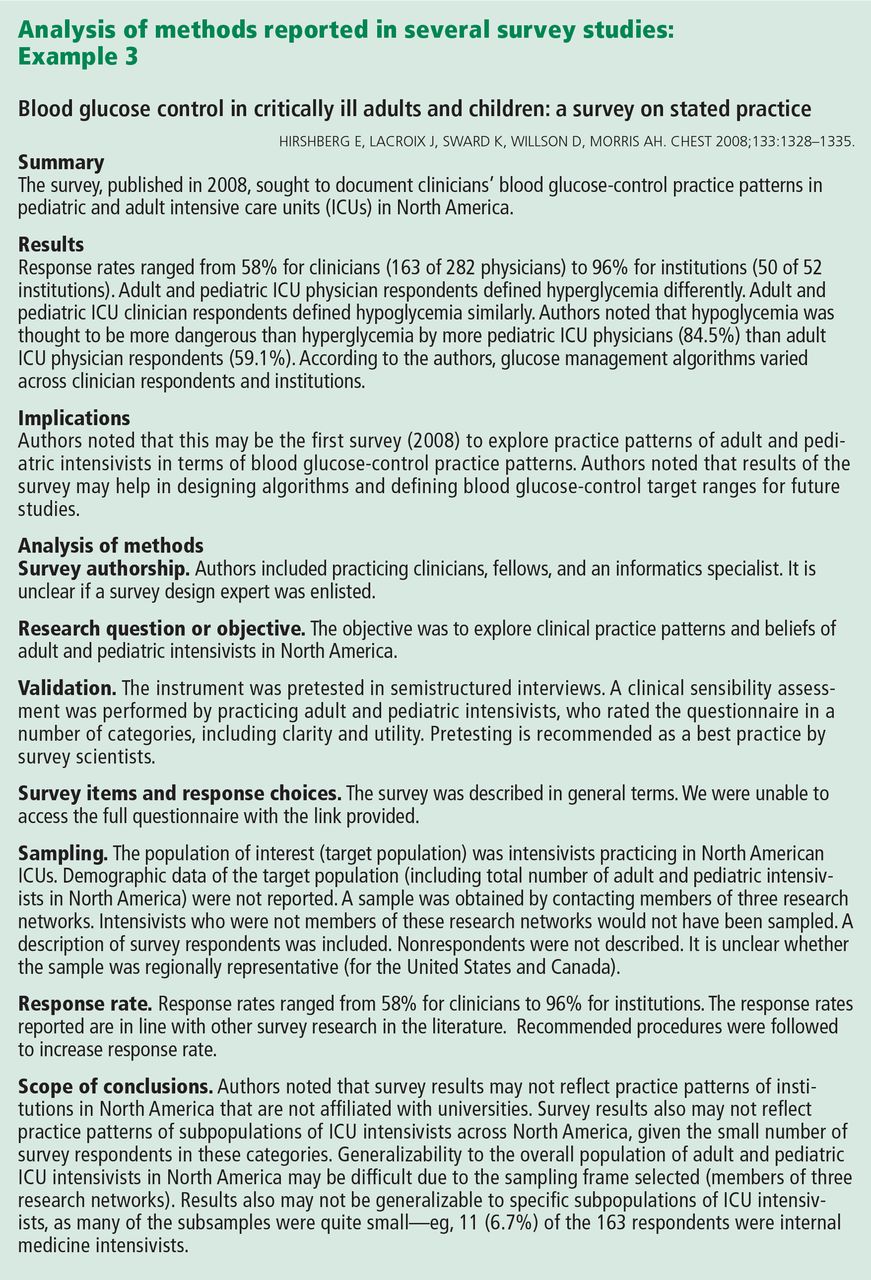
Was the response rate adequate, given the number of participants initially recruited? If the response rate was not adequate, did the researchers discuss this limitation?
Maximum response rate, defined as the total number of surveys returned divided by the total number of surveys sent,18 may be difficult to calculate with electronic or Web-based survey platforms. When the maximum response rate cannot be calculated, this issue needs to be addressed in the article’s limitations section.
The number of surveys has increased across fields over the past few decades, but survey response rates in general have decreased.17,21,24,25 In fields outside of clinical medicine, response rates in the 40% range are common.17 In the 1990s, the mean response rate for surveys published in medical journals (mailed surveys) was approximately 60%.26 A 2001 review of physician questionnaire studies found a similar average response rate (61%), with a 52% response rate for large-sample surveys.27 In 2002, Field et al28 examined the impact of incentives in physician survey studies and found response rates ranging from 8.5% to 80%.
Importantly, electronically delivered surveys (e-mail, Web-based) often have lower response rates than mailed surveys.24,29 Nominal financial incentives have been associated with enhanced response rates.28
A relatively low response rate does not necessarily mean you cannot trust the data. Survey scientists note that the representativeness of the sample may be more critical than response rate alone.17 Studies with small sample sizes may be more representative—and findings more valid—than those with large samples, if large samples are nonrepresentative when considering the target population.17
Do the conclusions go beyond the data?
Are the inferences overreaching, in view of the survey design? In studies with low response rates and nonrepresentative samples, researchers must be careful in interpreting the results. If the results cannot be generalized beyond the research sample, is this clear from the limitations, discussion, and conclusion sections?
In this review, we have summarized the findings of three published surveys1,2,30 and commented on how they appear to meet—or don’t quite meet—recommendations for survey development, validation, and use. The papers chosen were deemed strong examples in particular categories, such as description of survey authorship,1 instrument validation,30 sampling methodology,2 and response rate.1
It should be noted that even when surveys are conducted with the utmost rigor, survey reporting may leave out critical details. Survey methodology may not be adequately described for a variety of reasons, including researchers’ training in survey design and methodology; a lack of universally accepted journal-reporting guidelines3; and even journals’ space limitations. At times, journals may excise descriptions of survey development and validation, deeming these sections superfluous. Limitations sections can be critical to interpreting the results of survey research and evaluating the scope of conclusions.
- Jha AK, DesRoches CM, Campbell EG, et al. Use of electronic health records in US hospitals. N Engl J Med 2009; 360:1628–1638.
- Angus DC, Shorr AF, White A, Dremsizov TT, Schmitz RJ, Kelley MA; Committee on Manpower for Pulmonary and Critical Care Societies (COMPACCS). Critical care delivery in the United States: distribution of services and compliance with Leapfrog recommendations. Crit Care Med 2006; 34:1016–1024.
- Bennett C, Khangura S, Brehaut JC, et al. Reporting guidelines for survey research: an analysis of published guidance and reporting practices. PLoS Med 2010; 8:e1001069.
- Groves RM, Fowler FJ, Couper MP, Lepkowski JM, Singer E, Tourangeau R. Survey Methodology. 2nd ed. Hoboken, NJ: John Wiley and Sons, Inc; 2009.
- Duffett M, Burns KE, Adhikari NK, et al. Quality of reporting of surveys in critical care journals: a methodologic review. Crit Care Med 2012; 40:441–449.
- Mattell MS, Jacoby J. Is there an optimal number of alternatives for Likert-scale items? Effects of testing time and scale properties. J Appl Psychol 1972; 56:506–509.
- Willis GB. Cognitive Interviewing. A “How To” Guide. Research Triangle Institute. Presented at the meeting of the American Statistical Association; 1999. http://fog.its.uiowa.edu/~c07b209/interview.pdf. Accessed June 3, 2013.
- Schwarz N. Self-reports. How the questions shape the answers. Amer Psychol 1999; 54:93–105.
- Stone DH. Design a questionnaire. BMJ 1993; 307:1264–1266.
- Willis GB, Royston P, Bercini D. The use of verbal report methods in the development and testing of survey questionnaires. Appl Cogn Psychol 1991; 5:251–267.
- Desimone LM, LeFloch KC. Are we asking the right questions? Using cognitive interviews to improve surveys in education research. Educ Eval Policy Anal 2004; 26:1–22.
- Presser S, Couper MP, Lessler JT, et al. Methods for testing and evaluating survey questions. Public Opin Q 2004; 68:109–130.
- Rogers G. Accreditation Board for Engineering and Technology (ABET), Inc. Sample Protocol for Pilot Testing Survey Items. www.abet.org/WorkArea/DownloadAsset.aspx?id=1299. Accessed January 22, 2013.
- Schwarz N, Oyserman D. Asking questions about behavior: cognition, communication, and questionnaire construction. Am J Eval 2001; 22:127–160.
- Bradburn N, Sudman S, Wansink B. Asking Questions. The Definitive Guide to Questionnaire Design—For Market Research, Political Polls, and Social and Health Questionnaires. San Francisco, CA: Jossey-Bass; 2004.
- Stone AA, Broderick JE, Schwartz JE, Schwarz N. Context effects in survey ratings of health, symptoms, and satisfaction. Med Care 2008; 46:662–667.
- Cook C, Heath F, Thompson RL. A meta-analysis of response rates in Web or internet-based surveys. Educ Psychol Meas 2000; 60:821–836.
- Kaplowitz MD, Hadlock TD, Levine R. A comparison of Web and mail survey response rates. Public Opin Q 2004; 68:94–101.
- American Educational Research Association. Standards for Educational and Psychological Testing/American Educational Research Association, American Psychological Association, National Council on Measurement in Education. Washington, DC: American Educational Research Association; 1999.
- Burns KE, Duffett M, Kho ME, et al; ACCADEMY Group. A guide for the design and conduct of self-administered surveys of clinicians. CMAJ 2008; 179:245–252.
- American Association for Public Opinion Research (AAPOR). http://www.aapor.org/Home.htm. Accessed June 3, 2013.
- National Center for Education Statistics. Planning and Design of Surveys. http://nces.ed.gov/statprog/2002/std2_1.asp. Accessed January 22, 2013.
- Bordens KS, Abbott BB. Research Design and Methods. A Process Approach. 6th ed. New York, NY: McGraw-Hill; 2004.
- Sheehan K. Email survey response rates: a review. JCMC 2001. http://jcmc.indiana.edu/vol6/issue2/sheehan.html. Accessed January 22, 2013.
- Baruch Y, Holtom BC. Survey response rate levels and trends in organizational research. Hum Relat 2008; 61:1139–1160.
- Asch DA, Jedrziewski MK, Christakis NA. Response rates to mail surveys published in medical journals. J Clin Epidemiol 1997; 50:1129–1136.
- Cummings SM, Savitz LA, Konrad TR. Reported response rates to mailed physician questionnaires. Health Services Res 2001; 35:1347–1355.
- Field TS, Cadoret CA, Brown ML, et al. Surveying physicians. Do components of the “Total Design Approach” to optimizing survey response rates apply to physicians? Med Care 2002; 40:596–606.
- Converse PD, Wolfe EW, Huang X, Oswald FL. Response rates for mixed-mode surveys using mail and e-mail/Web. Am J Eval 2008; 29:99–107.
- Hirshberg E, Lacroix J, Sward K, Willson D, Morris AH. Blood glucose control in critically ill adults and children: a survey on stated practice. Chest 2008; 133:1328–1335.
Surveys are common in medical research. Although survey research may be subject to inherent self-report bias, surveys have a great impact on policies and practices in medicine, often forming the basis for recommendations or new guidelines.1,2 To interpret and use survey research results, clinicians should be familiar with key elements involved in the creation and validation of surveys.
The purpose of this article is to provide readers with a basic framework for evaluating surveys to allow them to be more informed as consumers of survey research.
IMPORTANT TOOLS IN MEDICAL RESEARCH
Surveys are important tools for answering questions on topics that are difficult to assess using other methods.3 They allow us to gather data systematically from subjects by asking questions, in order to make inferences about a larger population.3,4 Clinicians use surveys to explore the opinions, beliefs, and perceptions of a group, or to investigate physician practice patterns and adherence to clinical guidelines. They may also use surveys to better understand why patients are not engaging in recommended behavioral or lifestyle changes.
Survey methods include interviews (in person, by phone) and questionnaires (paper-and-pencil, e-mailed, online).4
A well-constructed, validated survey can provide powerful data that may influence clinical practice, guide future research development, or drive the development and provision of needed programs and services. Surveys have the potential to transform the ways in which we think about and practice medicine.
READER BEWARE
While survey research in health care appears to have grown exponentially, the quality of reported survey research has not necessarily increased over time.
For consumers of survey research, the adage “reader beware” is apt. Although a considerable number of studies have examined the effects of survey methodology on the validity, reliability, and generalizability of the results,4 medical journals differ in their requirements for reporting survey methods.
In an analysis of 117 articles, Bennett et al3 found that more than 80% did not fully describe the survey development process or pretesting methods. They also found limited guidance and lack of consensus about the best way to report survey research. Of 95 surveys requiring scoring, 66% did not report scoring practices.
Duffett et al5 noted that of 127 critical care medicine surveys, only 36% had been pretested or pilot-tested, and half of all surveys reviewed did not include participant demographics or included only minimal information.
Because journal reporting practices differ, physicians may be unaware of the steps involved in survey construction and validation. Knowledge of these steps is helpful not only in constructing surveys but also in assessing published articles that used survey research.
LIMITATIONS OF SURVEY RESEARCH
Indirect measures of attitudes and behaviors
Surveys that rely on participants’ self-reports of behaviors, attitudes, beliefs, or actions are indirect measures and are susceptible to self-report and social-desirability biases. Participants may overestimate their own expertise or knowledge in self-report surveys. They may wish to reduce embarrassment6 or answer in ways that would make them “look better,”7 resulting in social-desirability bias. These issues need to be mentioned in the limitations section in papers reporting survey research.
Questions and response choices
The data derived from surveys are only as good as the questions that are asked.8 Stone9 noted that questions should be intelligible, unambiguous, and unbiased. If respondents do not comprehend questions as researchers intended, if questionnaire response choices are inadequate, or if questions trigger unintended emotional responses,10–14 researchers may unwittingly introduce error, which will affect the validity of results. Even seemingly objective questions, such as those related to clinical algorithm use, practice patterns, or equipment available to hospital staff, may be interpreted differently by different respondents.
In their eagerness to launch a survey, clinician researchers may not realize that it must be carefully constructed. A focus on question development and validation is critical, as the questions determine the quality of the data derived from the survey.8 Even the position of the question or answer in the survey can affect how participants respond,15 as they may be guided to a response choice by preceding questions.16
WHAT DO YOU NEED TO KNOW ABOUT ASSESSING SURVEY RESEARCH?
What follows are questions and a basic framework that can be used to evaluate published survey research. Recommendations are based on the work of survey scientists,4,7,10,14,15,17,18 survey researchers in medicine and the social sciences, and national standards for test and questionnaire construction and validation (Table 1).4,19,20
Who created the survey? How did they do it?
How the survey was created should be sufficiently described to allow readers to judge the adequacy of instrument development.3–5 It is generally recommended that feedback from multiple sources be solicited during survey creation. Both questionnaire-design experts and subject-matter experts are considered critical in the process.4
What question was the survey designed to answer?
Is the objective of the study articulated in the paper? 3,20 To judge survey research, readers need to know if the survey appears to adequately address the research question or questions and the objectives of the study in terms of methods used.4
Was evidence on validity gathered?
Instrument pretesting and field testing are considered best practices by the American Association for Public Opinion Research, a professional organization for US survey scientists.4
Pretesting can include cognitive interviewing, the use of questionnaire appraisal tools, and hybrid methods, all of which are aimed at addressing validity issues.21 Pretesting with a group of participants similar to the target population allows for assessment of item ambiguity, instrument ease of use, adequacy of response categories (response choices), and time to completion.4,12
Cognitive interviewing is designed to explore respondents’ comprehension of questions, response processes, and decision processes governing how they answer questions.4,7,10,11 In cognitive interviewing, respondents are generally interviewed one on one. Techniques vary, but typically include “think alouds” (in which a respondent is asked to verbalize thoughts while responding to questions) and “verbal probing” (in which the respondent answers a question, then is asked follow-up questions as the interviewer probes for information related to the response choice or question itself).7 These techniques can provide evidence that researchers are actually measuring what they set out to measure and not an unrelated construct.4,19
Field testing of a survey under realistic conditions can help to uncover problems in administration, such as issues in standardization of key procedures, and to ensure that the survey was administered as the researchers intended.21,22 Field testing is vital before phone or in-person interviews to ensure standardization of any critical procedures. Pilot testing in a sample similar to the intended population allows for further refinement, with deletion of problem items, before the survey is launched.15
Because even “objective” questions can be somewhat subjective, all research surveys should go through some type of pretesting.4,21 Based on the results of pretesting and field testing, surveys should then be revised before launch.4,21 If an article on a self-report survey makes no mention of survey validation steps, readers may well question the validity of the results.
Are the survey questions and response choices understandable?
Is the meaning of each question unambiguous? Is the reading level appropriate for the sample population (a critical consideration in patient surveys)? Do any of the items actually ask two different questions?13 An example would be: “Was the representative courteous and prompt?” as it is possible to be courteous, but not prompt, and vice versa. If so, respondents may be confused or frustrated in attempting to answer it. If a rating scale is used throughout the questionnaire, are the anchors appropriate? For example, a question may be written in such a way that respondents want to answer “yes/no” or “agree/disagree,” but the scale used may include response options such as “poor,” “marginal,” “good,” and “excellent.” Items with Likert-response formats are commonly used in self-report surveys and allow participants to respond to a statement by choosing from a range of responses (eg, strongly disagree to strongly agree), often spaced horizontally under a line.
It is recommended that surveys also include options for answers beyond the response choices provided,20 such as comment boxes or fill-in-the-blank items. Surveys with a closed-response format may constrain the quality of data collected because investigators may not foresee all possible answers. Surveys need to be available for review either within the article itself, in an appendix, or as supplementary material that is available elsewhere.
Does the sample appear to be appropriate?
Articles that report the results of surveys should describe the target population, the sample design, and, in a demographic table, respondents and nonrespondents. To judge appropriateness, several questions can be asked regarding sampling:
Target population. Is the population of interest (ie, the target population) described, including regional demographics, if applicable? The relationship between the sample and the target population is important, as a nonrepresentative sample may result in misleading conclusions about the population of interest.
Sampling frame. Who had an opportunity to participate in the survey? At its simplest, the sampling frame establishes who (or what, in the case of institutions) should be included within the sample. This is typically a list of elements (Groves et al4) that acts to “frame” or define the sample to be selected. Where the target population may be all academic internal medicine physicians in the United States, the sampling frame may be all male and female US physicians who are members of particular internal medicine professional organizations, identified by their directory email addresses.
Sample design. How was the sample actually selected?4 For example, did investigators use a convenience sample of colleagues at other institutions or use a stratified random sample, ensuring adequate representation of respondents with certain characteristics?
Description of respondents. How is the sample of respondents described? Are demographic features reported, including statistics on regional or national representativeness?5 Does the sample of survey respondents appear to be representative of the researcher’s population of interest (ie, the target population)?3,23 If not, is this adequately described in the limitations section? Although outcomes will not be available on nonrespondents, demographic and baseline data often are available and should be reported. Are there systematic differences between respondents and nonrespondents?
Was the response rate adequate?
Was the response rate adequate, given the number of participants initially recruited? If the response rate was not adequate, did the researchers discuss this limitation?
Maximum response rate, defined as the total number of surveys returned divided by the total number of surveys sent,18 may be difficult to calculate with electronic or Web-based survey platforms. When the maximum response rate cannot be calculated, this issue needs to be addressed in the article’s limitations section.
The number of surveys has increased across fields over the past few decades, but survey response rates in general have decreased.17,21,24,25 In fields outside of clinical medicine, response rates in the 40% range are common.17 In the 1990s, the mean response rate for surveys published in medical journals (mailed surveys) was approximately 60%.26 A 2001 review of physician questionnaire studies found a similar average response rate (61%), with a 52% response rate for large-sample surveys.27 In 2002, Field et al28 examined the impact of incentives in physician survey studies and found response rates ranging from 8.5% to 80%.
Importantly, electronically delivered surveys (e-mail, Web-based) often have lower response rates than mailed surveys.24,29 Nominal financial incentives have been associated with enhanced response rates.28
A relatively low response rate does not necessarily mean you cannot trust the data. Survey scientists note that the representativeness of the sample may be more critical than response rate alone.17 Studies with small sample sizes may be more representative—and findings more valid—than those with large samples, if large samples are nonrepresentative when considering the target population.17
Do the conclusions go beyond the data?
Are the inferences overreaching, in view of the survey design? In studies with low response rates and nonrepresentative samples, researchers must be careful in interpreting the results. If the results cannot be generalized beyond the research sample, is this clear from the limitations, discussion, and conclusion sections?
In this review, we have summarized the findings of three published surveys1,2,30 and commented on how they appear to meet—or don’t quite meet—recommendations for survey development, validation, and use. The papers chosen were deemed strong examples in particular categories, such as description of survey authorship,1 instrument validation,30 sampling methodology,2 and response rate.1
It should be noted that even when surveys are conducted with the utmost rigor, survey reporting may leave out critical details. Survey methodology may not be adequately described for a variety of reasons, including researchers’ training in survey design and methodology; a lack of universally accepted journal-reporting guidelines3; and even journals’ space limitations. At times, journals may excise descriptions of survey development and validation, deeming these sections superfluous. Limitations sections can be critical to interpreting the results of survey research and evaluating the scope of conclusions.
- Jha AK, DesRoches CM, Campbell EG, et al. Use of electronic health records in US hospitals. N Engl J Med 2009; 360:1628–1638.
- Angus DC, Shorr AF, White A, Dremsizov TT, Schmitz RJ, Kelley MA; Committee on Manpower for Pulmonary and Critical Care Societies (COMPACCS). Critical care delivery in the United States: distribution of services and compliance with Leapfrog recommendations. Crit Care Med 2006; 34:1016–1024.
- Bennett C, Khangura S, Brehaut JC, et al. Reporting guidelines for survey research: an analysis of published guidance and reporting practices. PLoS Med 2010; 8:e1001069.
- Groves RM, Fowler FJ, Couper MP, Lepkowski JM, Singer E, Tourangeau R. Survey Methodology. 2nd ed. Hoboken, NJ: John Wiley and Sons, Inc; 2009.
- Duffett M, Burns KE, Adhikari NK, et al. Quality of reporting of surveys in critical care journals: a methodologic review. Crit Care Med 2012; 40:441–449.
- Mattell MS, Jacoby J. Is there an optimal number of alternatives for Likert-scale items? Effects of testing time and scale properties. J Appl Psychol 1972; 56:506–509.
- Willis GB. Cognitive Interviewing. A “How To” Guide. Research Triangle Institute. Presented at the meeting of the American Statistical Association; 1999. http://fog.its.uiowa.edu/~c07b209/interview.pdf. Accessed June 3, 2013.
- Schwarz N. Self-reports. How the questions shape the answers. Amer Psychol 1999; 54:93–105.
- Stone DH. Design a questionnaire. BMJ 1993; 307:1264–1266.
- Willis GB, Royston P, Bercini D. The use of verbal report methods in the development and testing of survey questionnaires. Appl Cogn Psychol 1991; 5:251–267.
- Desimone LM, LeFloch KC. Are we asking the right questions? Using cognitive interviews to improve surveys in education research. Educ Eval Policy Anal 2004; 26:1–22.
- Presser S, Couper MP, Lessler JT, et al. Methods for testing and evaluating survey questions. Public Opin Q 2004; 68:109–130.
- Rogers G. Accreditation Board for Engineering and Technology (ABET), Inc. Sample Protocol for Pilot Testing Survey Items. www.abet.org/WorkArea/DownloadAsset.aspx?id=1299. Accessed January 22, 2013.
- Schwarz N, Oyserman D. Asking questions about behavior: cognition, communication, and questionnaire construction. Am J Eval 2001; 22:127–160.
- Bradburn N, Sudman S, Wansink B. Asking Questions. The Definitive Guide to Questionnaire Design—For Market Research, Political Polls, and Social and Health Questionnaires. San Francisco, CA: Jossey-Bass; 2004.
- Stone AA, Broderick JE, Schwartz JE, Schwarz N. Context effects in survey ratings of health, symptoms, and satisfaction. Med Care 2008; 46:662–667.
- Cook C, Heath F, Thompson RL. A meta-analysis of response rates in Web or internet-based surveys. Educ Psychol Meas 2000; 60:821–836.
- Kaplowitz MD, Hadlock TD, Levine R. A comparison of Web and mail survey response rates. Public Opin Q 2004; 68:94–101.
- American Educational Research Association. Standards for Educational and Psychological Testing/American Educational Research Association, American Psychological Association, National Council on Measurement in Education. Washington, DC: American Educational Research Association; 1999.
- Burns KE, Duffett M, Kho ME, et al; ACCADEMY Group. A guide for the design and conduct of self-administered surveys of clinicians. CMAJ 2008; 179:245–252.
- American Association for Public Opinion Research (AAPOR). http://www.aapor.org/Home.htm. Accessed June 3, 2013.
- National Center for Education Statistics. Planning and Design of Surveys. http://nces.ed.gov/statprog/2002/std2_1.asp. Accessed January 22, 2013.
- Bordens KS, Abbott BB. Research Design and Methods. A Process Approach. 6th ed. New York, NY: McGraw-Hill; 2004.
- Sheehan K. Email survey response rates: a review. JCMC 2001. http://jcmc.indiana.edu/vol6/issue2/sheehan.html. Accessed January 22, 2013.
- Baruch Y, Holtom BC. Survey response rate levels and trends in organizational research. Hum Relat 2008; 61:1139–1160.
- Asch DA, Jedrziewski MK, Christakis NA. Response rates to mail surveys published in medical journals. J Clin Epidemiol 1997; 50:1129–1136.
- Cummings SM, Savitz LA, Konrad TR. Reported response rates to mailed physician questionnaires. Health Services Res 2001; 35:1347–1355.
- Field TS, Cadoret CA, Brown ML, et al. Surveying physicians. Do components of the “Total Design Approach” to optimizing survey response rates apply to physicians? Med Care 2002; 40:596–606.
- Converse PD, Wolfe EW, Huang X, Oswald FL. Response rates for mixed-mode surveys using mail and e-mail/Web. Am J Eval 2008; 29:99–107.
- Hirshberg E, Lacroix J, Sward K, Willson D, Morris AH. Blood glucose control in critically ill adults and children: a survey on stated practice. Chest 2008; 133:1328–1335.
KEY POINTS
- Most survey reports do not adequately describe their methods.
- Surveys that rely on participants’ self-reports of behaviors, attitudes, beliefs, or actions are indirect measures and are susceptible to self-report and social-desirability biases.
- Informed readers need to consider a survey’s authorship, objective, validation, items, response choices, sampling representativeness, response rate, generalizability, and scope of the conclusions.
Update in intensive care medicine: Studies that challenged our practice in the last 5 years
We have seen significant growth in clinical research in critical care medicine in the last decade. Advances have been made in many important areas in this field; of these, advances in treating septic shock and acute respiratory distress syndrome (ARDS), and also in supportive therapies for critically ill patients (eg, sedatives, insulin), have perhaps received the most attention.
Of note, several once-established therapies in these areas have failed the test of time, as the result of evidence from more-recent clinical trials. For example, recent studies have shown that a pulmonary arterial catheter does not improve outcomes in patients with ARDS. Similarly, what used to be “optimal” fluid management in patients with ARDS is no longer considered appropriate.
In this review, we summarize eight major studies in critical care medicine published in the last 5 years, studies that have contributed to changes in our practice in the intensive care unit (ICU).
FLUID MANAGEMENT IN ARDS
Key points
- In patients with acute lung injury (ALI) and ARDS, fluid restriction is associated with better outcomes than a liberal fluid policy.
- A pulmonary arterial catheter is not necessary and, compared with a central venous catheter, may result in more complications in patients with ALI and ARDS.
Background
Fluid management practices in patients with ARDS have been extremely variable. Two different approaches are commonly used: the liberal or “wet” approach to optimize tissue perfusion and the “dry” approach, which focuses on reducing lung edema. Given that most deaths attributed to ARDS result from extrapulmonary organ failure, aggressive fluid restriction has been the less popular approach.
Additionally, although earlier studies and meta-analyses suggested that the use of a pulmonary arterial catheter was not associated with better outcomes in critically ill patients,1 controversy remained regarding the value of a pulmonary arterial catheter compared with a central venous catheter in guiding fluid management in patients with ARDS, and data were insufficient to prove one strategy better than the other.
The Fluids and Catheter Treatment Trial (FACTT)
NATIONAL HEART, LUNG, AND BLOOD INSTITUTE ACUTE RESPIRATORY DISTRESS SYNDROME (ARDS) CLINICAL TRIALS NETWORK; WIEDEMANN HP, WHEELER AP, BERNARD GR, ET AL. COMPARISON OF TWO FLUID-MANAGEMENT STRATEGIES IN ACUTE LUNG INJURY. N ENGL J MED 2006; 354:2564–2575.
NATIONAL HEART, LUNG, AND BLOOD INSTITUTE ACUTE RESPIRATORY DISTRESS SYNDROME (ARDS) CLINICAL TRIALS NETWORK; WHEELER AP, BERNARD GR, THOMPSON BT, ET AL. PULMONARY-ARTERY VERSUS CENTRAL VENOUS CATHETER TO GUIDE TREATMENT OF ACUTE LUNG INJURY. N ENGL J MED 2006; 354:2213–2224.
The Fluids and Catheter Treatment Trial (FACTT) compared two fluid strategies2 and also the utility of a pulmonary arterial catheter vs a central venous catheter3 in patients with ALI or ARDS.
This two-by-two factorial trial randomized 1,000 patients to be treated according to either a conservative (fluid-restrictive or “dry”) or a liberal (“wet”) fluid management strategy for 7 days. Additionally, they were randomly assigned to receive either a central venous catheter or a pulmonary arterial catheter. The trial thus had four treatment groups:
- Fluid-restricted and a central venous catheter, with a goal of keeping the central venous pressure below 4 mm Hg
- Fluid-restricted and a pulmonary arterial catheter: fluids were restricted and diuretics were given to keep the pulmonary artery occlusion pressure below 8 mm Hg
- Fluid-liberal and a central venous catheter: fluids were given to keep the central venous pressure between 10 and 14 mm Hg
- Fluid-liberal and a pulmonary arterial catheter: fluids were given to keep the pulmonary artery occlusion pressure between 14 and 18 mm Hg.
The primary end point was the mortality rate at 60 days. Secondary end points included the number of ventilator-free days and organ-failure-free days and parameters of lung physiology. All patients were managed with a low-tidal-volume strategy.
The ‘dry’ strategy was better
The cumulative fluid balance was −136 mL ± 491 mL in the “dry” group and 6,992 mL ± 502 mL in the “wet” group, a difference of more than 7 L (P < .0001). Of note, before randomization, the patients were already fluid-positive, with a mean total fluid balance of +2,700 mL).2
At 60 days, no statistically significant difference in mortality rate was seen between the fluid-management groups (25.5% in the dry group vs 28.4% in the wet group (P = .30). Nevertheless, patients in the dry group had better oxygenation indices and lung injury scores (including lower plateau airway pressure), resulting in more ventilator-free days (14.6 ± 0.5 vs 12.1 ± 0.5; P = .0002) and ICU-free days (13.4 ± 0.4 vs 11.2 ± 0.4; P = .0003).2
Although those in the dry-strategy group had a slightly lower cardiac index and mean arterial pressure, they did not have a higher incidence of shock.
More importantly, the dry group did not have a higher rate of nonpulmonary organ failure. Serum creatinine and blood urea nitrogen concentrations were slightly higher in this group, but this was not associated with a higher incidence of renal failure or the use of dialysis: 10% in the dry-strategy group vs 14% in the wet-strategy group; P = .0642).2
No advantage with a pulmonary arterial catheter
The mortality rate did not differ between the catheter groups. However, the patients who received a pulmonary arterial catheter stayed in the ICU 0.2 days longer and had twice as many nonfatal cardiac arrhythmias as those who received a central venous catheter.3
Comments
The liberal fluid-strategy group had fluid balances similar to those seen in previous National Institutes of Health ARDS Network trials in which fluid management was not controlled. This suggests that the liberal fluid strategy reflects usual clinical practice.
Although the goals used in this study (central venous pressure < 4 mm Hg or pulmonary artery occlusion pressure < 8 mm Hg) could be difficult to achieve in clinical practice, a conservative strategy of fluid management is preferred in patients with ALI or ARDS, given the benefits observed in this trial.
A pulmonary arterial catheter is not indicated to guide hemodynamic management of patients with ARDS.
CORTICOSTEROID USE IN ARDS
Key points
- In selected patients with ARDS, the prolonged use of corticosteroids may result in better oxygenation and a shorter duration of mechanical ventilation.
- Late use of corticosteroids in patients with ARDS (> 14 days after diagnosis) is not indicated and may increase the risk of death.
- The role of corticosteroids in early ARDS (< 7 days after diagnosis) remains controversial.
Background
Systemic corticosteroid therapy was commonly used in ARDS patients in the 1970s and 1980s. However, a single-center study published in the late 1980s showed that a corticosteroid in high doses (methylprednisolone 30 mg/kg) resulted in more complications and was not associated with a lower mortality rate.4 On the other hand, a small study that included only patients with persistent ARDS (defined as ARDS lasting for more than 7 days) subsequently showed that oxygenation was significantly better and that fewer patients died while in the hospital with the use of methylprednisolone 2 mg/kg for 32 days.5
In view of these divergent findings, the ARDS Network decided to perform a study to help understand the role of corticosteroids in ARDS.
The Late Steroid Rescue Study (LaSRS)
STEINBERG KP, HUDSON LD, GOODMAN RB, ET AL; NATIONAL HEART, LUNG, AND BLOOD INSTITUTE ACUTE RESPIRATORY DISTRESS SYNDROME (ARDS) CLINICAL TRIALS NETWORK. EFFICACY AND SAFETY OF CORTICOSTEROIDS FOR PERSISTENT ACUTE RESPIRATORY DISTRESS SYNDROME. N ENGL J MED 2006; 354:1671–1684.
The Late Steroid Rescue Study (LaSRS),6 a double-blind, multicenter trial, randomly assigned 180 patients with persistent ARDS (defined as ongoing disease 7–28 days after its onset) to receive methylprednisolone or placebo for 21 days.
Methylprednisolone was given in an initial dose of 2 mg/kg of predicted body weight followed by a dose of 0.5 mg/kg every 6 hours for 14 days and then a dose of 0.5 mg/kg every 12 hours for 7 days, and then it was tapered over 2 to 4 days and discontinued. It could be discontinued if 21 days of treatment were completed or if the patient was able to breathe without assistance.
The primary end point was the mortality rate at 60 days. Secondary end points included the number of ventilator-free days, organ-failure-free days, and complications and the levels of biomarkers of inflammation.
No reduction in mortality rates with steroids
The mortality rates did not differ significantly in the corticosteroid group vs the placebo group at 60 days:
- 29.2% with methylprednisolone (95% confidence interval [CI] 20.8–39.4)
- 28.6% with placebo (95% CI 20.3–38.6, P = 1.0).
Mortality rates at 180 days were also similar between the groups:
- 31.5% with methylprednisolone (95% CI 22.8–41.7)
- 31.9% with placebo (95% CI 23.2–42.0, P = 1.0).
In patients randomized between 7 and 13 days after the onset of ARDS, the mortality rates were lower in the methylprednisolone group than in the placebo group but the differences were not statistically significant. The mortality rate in this subgroup was 27% vs 36% (P = .26) at 60 days and was 27% vs 39% (P = .14) at 180 days.
However, in patients randomized more than 14 days after the onset of ARDS, the mortality rate was significantly higher in the methylprednisolone group than in the placebo group at 60 days (35% vs 8%, P = .02) and at 180 days (44% vs 12%, P = .01).
Some benefit in secondary outcomes
At day 28, methylprednisolone was associated with:
- More ventilator-free days (11.2 ± 9.4 vs 6.8 ± 8.5, P < .001)
- More shock-free days (20.7 ± 8.9 vs 17.9 ± 10.2, P = .04)
- More ICU-free days (8.9 ± 8.2 vs 6.7 ± 7.8, P = .02).
Similarly, pulmonary physiologic indices were better with methylprednisolone, specifically:
- The ratio of Pao2 to the fraction of inspired oxygen at days 3, 4, and 14 (P < .05)
- Plateau pressure at days 4, 5, and 7 (P < .05)
- Static compliance at days 7 and 14 (P < .05).
In terms of side effects, methylprednisolone was associated with more events associated with myopathy or neuropathy (9 vs 0, P = .001), but there were no differences in the number of serious infections or in glycemic control.
Comments
Although other recent studies suggested that corticosteroid use may be associated with a reduction in mortality rates,7–9 LaSRS did not confirm this effect. Although the doses and length of therapy were similar in these studies, LaSRS was much larger and included patients from the ARDS Network.
Nevertheless, LaSRS was criticized because of strict exclusion criteria and poor enrollment (only 5% of eligible patients were included). Additionally, it was conducted over a period of time when some ICU practices varied significantly (eg, low vs high tidal volume ventilation, tight vs loose glucose control).
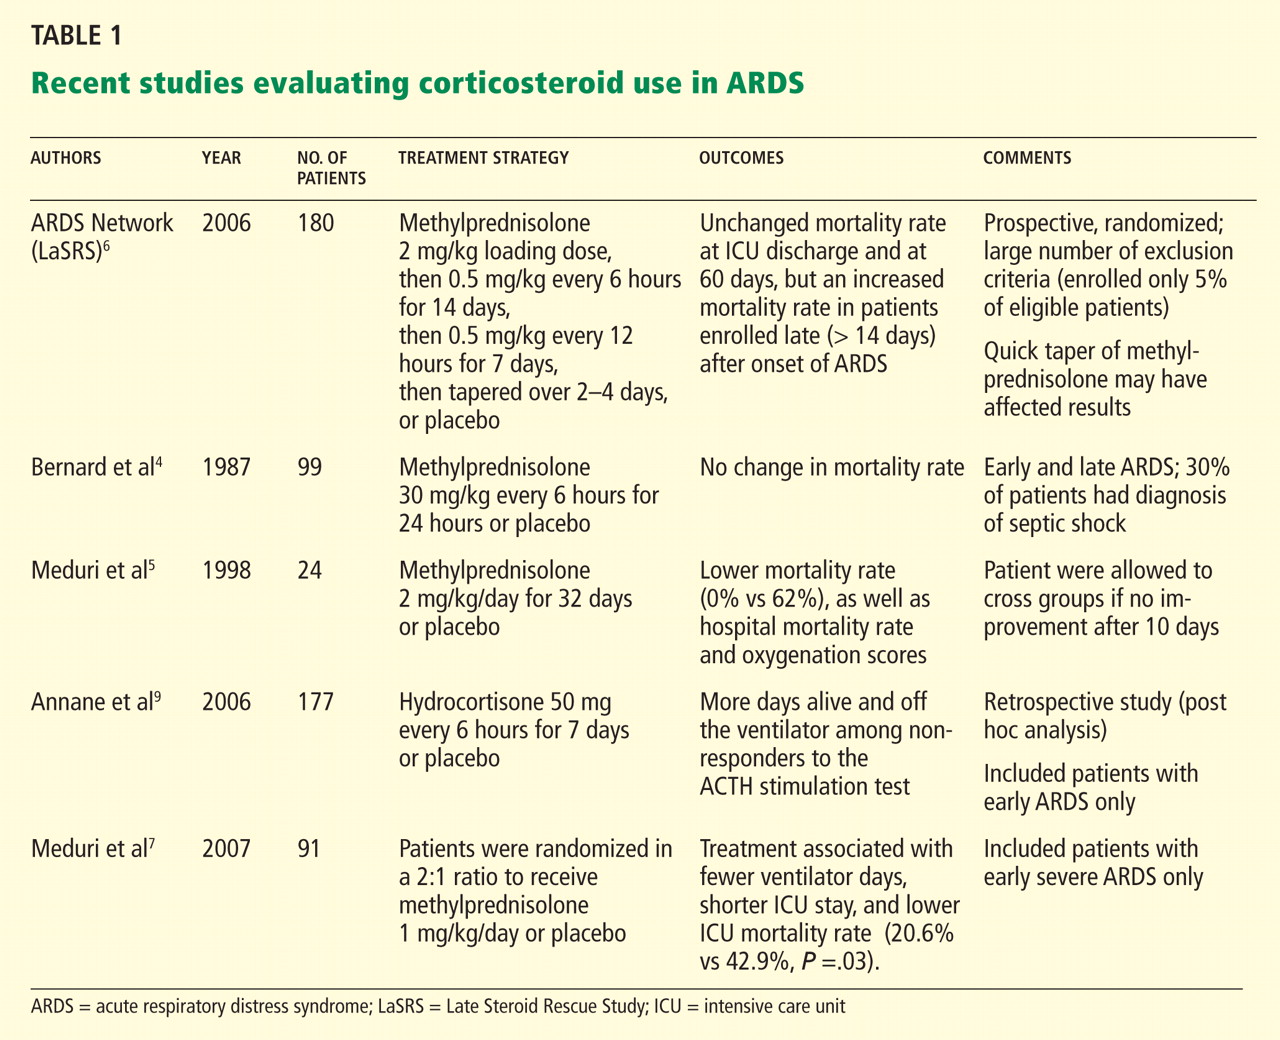
INTERRUPTING SEDATION DURING MECHANICAL VENTILATION
Key points
- Daily awakening of mechanically ventilated patients is safe.
- Daily interruption of sedation in mechanically ventilated patients is associated with a shorter length of mechanical ventilation.
Background
Sedatives are a central component of critical care. Continuous infusions of narcotics, benzodiazepines, and anesthetic agents are frequently used to promote comfort in patients receiving mechanical ventilation.
Despite its widespread use in the ICU, there is little evidence that such sedation improves outcomes. Observational and randomized trials10–12 have shown that patients who receive continuous infusions of sedatives need to be on mechanical ventilation longer than those who receive intermittent dosing. Additionally, an earlier randomized controlled trial13 showed that daily interruption of sedative drug infusions decreased the duration of mechanical ventilation by almost 50% and resulted in a reduction in the length of stay in the ICU.
Despite these findings, many ICU physicians remain skeptical of the value of daily interruption of sedative medications and question the safety of this practice.
The Awakening and Breathing Controlled (ABC) trial
GIRARD TD, KRESS JP, FUCHS BD, ET AL. EFFICACY AND SAFETY OF A PAIRED SEDATION AND VENTILATOR WEANING PROTOCOL FOR MECHANICALLY VENTILATED PATIENTS IN INTENSIVE CARE (AWAKENING AND BREATHING CONTROLLED TRIAL): A RANDOMISED CONTROLLED TRIAL. LANCET 2008; 371:126–134.
The Awakening and Breathing Controlled (ABC) trial14 was a multicenter, randomized controlled trial that included 336 patients who required at least 12 consecutive hours of mechanical ventilation. All patients had to be receiving patient-targeted sedation.
Those in the intervention group (n = 168) had their sedation interrupted every day, followed by a clinical assessment to determine whether they could be allowed to try breathing spontaneously. The control group (n = 168) also received a clinical assessment for a trial of spontaneous breathing, while their sedation was continued as usual.
In patients in the intervention group who failed the screening for a spontaneous breathing trial, the sedatives were resumed at half the previous dose. Criteria for failure on the spontaneous breathing trial included any of the following: anxiety, agitation, respiratory rate more than 35 breaths per minute for 5 minutes or longer, cardiac arrhythmia, oxygen saturation less than 88% for 5 minutes or longer, or two or more signs of respiratory distress, tachycardia, bradycardia, paradoxical breathing, accessory muscle use, diaphoresis, or marked dyspnea.
Interrupting sedation was superior
The combination of sedation interruption and a spontaneous breathing trial was superior to a spontaneous breathing trial alone. The mean number of ventilator-free days:
- 14.7 ± 0.9 with sedation interruption
- 11.6 ± 0.9 days with usual care (P = .02).
The median time to ICU discharge:
- 9.1 days with sedation interruption (interquartile range 5.1 to 17.8)
- 12.9 days with usual care (interquartile range 6.0 to 24.2, P = .01).
The mortality rate at 28 days:
- 28% with sedation interruption
- 35% with usual care (P = .21).
The mortality rate at 1 year:
- 44% with sedation interruption
- 58% with usual care (hazard ratio [HR] in the intervention group 0.68, 95% CI 0.50–0.92, P = .01).
Of note, patients in the intervention group had a higher rate of self-extubation (9.6% vs 3.6%, P = .03), but the rate of reintubation was similar between the groups (14% vs 13%, P = .47).
Comments
The addition of daily awakenings to spontaneous breathing trials results in a further reduction in the number of ICU days and increases the number of ventilator-free days.
Of note, the protocol allowed patients in the control group to undergo a spontaneous breathing trial while on sedatives (69% of the patients were receiving sedation at the time). Therefore, a bias effect in favor of the intervention group cannot be excluded. However, both groups had to meet criteria for readiness for spontaneous breathing.
The study demonstrates the safety of daily awakenings and confirms previous findings suggesting that a daily trial of spontaneous breathing results in better ICU outcomes.
GLUCOSE CONTROL IN THE ICU
Key points
- Although earlier studies suggested that intensive insulin therapy might be beneficial in critically ill patients, new findings show that strict glucose control can lead to complications without improving outcomes.
Background
A previous study15 found that intensive insulin therapy to maintain a blood glucose level between 80 and 110 mg/dL (compared with 180–200 mg/dL) reduced the mortality rate in surgical critical care patients. The mortality rate in the ICU was 4.6% with intensive insulin therapy vs 8.0% with conventional therapy (P < .04), and the effect was more robust for patients who remained longer than 5 days in the ICU (10.6% vs 20.2%).
Importantly, however, hypoglycemia (defined as blood glucose ≤ 40 mg/dL) occurred in 39 patients in the intensive-treatment group vs 6 patients in the conventional-treatment group.
The NICE-SUGAR trial
NICE-SUGAR STUDY INVESTIGATORS; FINFER S, CHITTOCK DR, SU SY, ET AL. INTENSIVE VERSUS CONVENTIONAL GLUCOSE CONTROL IN CRITICALLY ILL PATIENTS. N ENGL J MED 2009; 360:1283–1297.
The Normoglycemia in Intensive Care Evaluation-Survival Using Glucose Algorithm Regulation (NICE-SUGAR) trial16 randomized 6,104 patients in medical and surgical ICUs to receive either intensive glucose control (blood glucose 81–108 mg/dL) with insulin therapy or conventional glucose control (blood glucose < 180 mg/dL). In the conventional-control group, insulin was discontinued if the blood glucose level dropped below 144 mg/dL.
A higher mortality rate with intensive glucose control
As expected, the intensive-control group achieved lower blood glucose levels: 115 vs 144 mg/dL.
Nevertheless, intensive glucose control was associated with a higher incidence of severe hypoglycemia, defined as a blood glucose level lower than 40 mg/dL: 6.8% vs 0.5%.
More importantly, compared with conventional insulin therapy, intensive glucose control was associated with a higher 90-day mortality rate: 27.5% vs 24.9% (odds ratio 1.14, 95% CI 1.02–1.28). These findings were similar in the subgroup of surgical patients (24.4% vs 19.8%, odds ratio 1.31, 95% CI 1.07–1.61).
Comments
Of note, the conventional-control group had more patients who discontinued the treatment protocol prematurely. Additionally, more patients in this group received corticosteroids.
These results widely differ from those of a previous study by van den Berghe et al,15 which showed that tight glycemic control is associated with a survival benefit. The differences in outcomes are probably largely related to different patient populations, as van den Berghe et al included patients who had undergone cardiac surgery, who were more likely to benefit from strict blood glucose control.
The VISEP trial
BRUNKHORST FM, ENGEL C, BLOOS F, ET AL; GERMAN COMPETENCE NETWORK SEPSIS (SEPNET). INTENSIVE INSULIN THERAPY AND PENTASTARCH RESUSCITATION IN SEVERE SEPSIS. N ENGL J MED 2008; 358:125–139.
The Volume Substitution and Insulin Therapy in Severe Sepsis (VISEP) trial was a multicenter study designed to compare intensive insulin therapy (target blood glucose level 80–110 mg/dL) and conventional glucose control (target blood glucose level 180–200 mg/dL) in patients with severe sepsis.17 It also compared two fluids for volume resuscitation: 10% pentastarch vs modified Ringer's lactate. It included both medical and surgical patients.
Trial halted early for safety reasons
The mean morning blood glucose level was significantly lower in the intensive insulin group (112 vs 151 mg/dL).
Severe hypoglycemia (blood glucose ≤ 40 mg/dL) was more common in the group that received intensive insulin therapy (17% vs 4.1%, P < .001).
Mortality rates at 28 days did not differ significantly: 24.7% with intensive control vs 26.0% with conventional glucose control. The mortality rate at 90 days was 39.7% in the intensive therapy group and 35.4% in the conventional therapy group, but the difference was not statistically significant.
The intensive insulin arm of the trial was stopped after 488 patients were enrolled because of a higher rate of hypoglycemia (12.1% vs 2.1%) and of serious adverse events (10.9% vs 5.2%).
Additionally, the fluid resuscitation arm of the study was suspended at the first planned interim analysis because of a higher risk of organ failure in the 10% pentastarch group.
CORTICOSTEROID THERAPY IN SEPTIC SHOCK
Key points
- Corticosteroid therapy improves hemodynamic outcomes in patients with severe septic shock.
- Although meta-analyses suggest the mortality rate is lower with corticosteroid therapy, there is not enough evidence from randomized controlled trials to prove that the use of low-dose corticosteroids lowers the mortality rate in patients with septic shock.
- The corticotropin (ACTH) stimulation test should not be used to determine the need for corticosteroids in patients with septic shock.
Background
A previous multicenter study,18 performed in France, found that the use of corticosteroids in patients with septic shock resulted in lower rates of death at 28 days, in the ICU, and in the hospital and a shorter time to vasopressor withdrawal. Nevertheless, the beneficial effects were not observed in patients with adequate adrenal reserve (based on an ACTH stimulation test).
This study was criticized because of a high mortality rate in the placebo group.
The CORTICUS study
SPRUNG CL, ANNANE D, KEH D, ET AL; CORTICUS STUDY GROUP. HYDROCORTISONE THERAPY FOR PATIENTS WITH SEPTIC SHOCK. N ENGL J MED 2008; 358:111–124.
The Corticosteroid Therapy of Septic Shock (CORTICUS) study was a multicenter trial that randomly assigned 499 patients with septic shock to receive hydrocortisone (50 mg intravenously every 6 hours for 5 days, followed by a 6-day taper period) or placebo.19
Patients were eligible to be enrolled within 72 hours of onset of shock. Similar to previous studies, the CORTICUS trial classified patients on the basis of an ACTH stimulation test as having inadequate adrenal reserve (a cortisol increase of ≤ 9 μg/dL) or adequate adrenal reserve (a cortisol increase of > 9 μg/dL).
Faster reversal of shock with steroids
At baseline, the mean Simplified Acute Physiologic Score II (SAPS II) was 49 (the range of possible scores is 0 to 163; the higher the score the worse the organ dysfunction).
Hydrocortisone use resulted in a shorter duration of vasopressor use and a faster reversal of shock (3.3 days vs 5.8 days, P < .001).
This association was the same when patients were divided according to response to ACTH stimulation test. Time to reversal of shock in responders:
- 2.8 days with hydrocortisone
- 5.8 days with placebo (P < .001).
Time to reversal of shock in nonresponders:
- 3.9 days with hydrocortisone
- 6.0 days with placebo (P = .06).
Nevertheless, the treatment did not reduce the mortality rate at 28 days overall (34.3% vs 31.5% P = .51), or in the subgroups based on response to ACTH, or at any other time point. A post hoc analysis suggested that patients who had a systolic blood pressure of less than 90 mm Hg within 30 minutes of enrollment had a greater benefit in terms of mortality rate, but the effect was not statistically significant: the absolute difference was −11.2% (P = 0.28). Similarly, post hoc analyses also revealed a higher rate of death at 28 days in patients who received etomidate (Amidate) before randomization in both groups (P = .03).
Importantly, patients who received corticosteroids had a higher incidence of superinfections, including new episodes of sepsis or septic shock, with a combined odds ratio of 1.37 (95% CI 1.05–1.79).
Length of stay in the hospital or in the ICU was similar in patients who received corticosteroids and in those who received placebo. The ICU length of stay was 19 ± 31 days with hydrocortisone vs 18 ± 17 days with placebo (P = .51).
Comments
The CORTICUS trial showed that low-dose corticosteroid therapy results in faster reversal of shock in patients with severe septic shock. The hemodynamic benefits are present in all patients regardless of response to the ACTH stimulation test.
Nevertheless, contrary to previous findings,18 corticosteroid use was not associated with an improvement in mortality rates. Important differences exist between these two studies:
- The mortality rates in the placebo groups were significantly different (> 50% in the French study vs 30% in CORTICUS).
- The SAPS II scores were different in these two trials (55 vs 49), suggesting a greater severity of illness in the French study.
- The criteria for enrollment were different: the French study included patients who had a systolic blood pressure lower than 90 mm Hg for more than 1 hour despite fluid administration and vasopressor use, whereas the CORTICUS trial included patients who had a systolic blood pressure lower than 90 mm Hg for more than 1 hour despite fluid administration or vasopressor use.
- The time of enrollment was different: patients were enrolled much faster in the French study (within 8 hours) than in the CORTICUS trial (within 72 hours).
A recent meta-analysis of 17 randomized trials (including the CORTICUS study), found that, compared with those who received placebo, patients who received corticosteroids had a small reduction in the 28-day mortality rate (HR 0.84, 95% CI 0.71–1.00, P < .05).20 Of note, this meta-analysis has been criticized for possible publication bias and also for a large degree of heterogeneity in its results.21
VASOPRESSOR THERAPY IN SHOCK
Key points
- Vasopressin use in patients with severe septic shock is not associated with an improvement in mortality rates.
- Vasopressin should not be used as a first-line agent in patients with septic shock.
- Norepinephrine should be considered a first-line agent in patients with shock.
- Compared with norepinephrine, the use of dopamine in patients with shock is associated with similar mortality rates, although its use may result in a greater number of cardiac adverse events.
Background
Vasopressin gained popularity in critical care in the last 10 years because several small studies showed that adding it improves hemodynamics and results in a reduction in the doses of catecholamines in patients with refractory septic shock.22 Furthermore, the Surviving Sepsis Campaign guidelines recommended the use of vasopressin in patients who have refractory shock despite fluid resuscitation and the use of other “conventional” vasopressors.23
Despite these positive findings, it remained unknown if the use of vasopressin increases the survival rate in patients with septic shock.
The Vasopressin and Septic Shock Trial (VASST)
RUSSELL JA, WALLEY KR, SINGER J, ET AL; VASST INVESTIGATORS. VASOPRESSIN VERSUS NOREPINEPHRINE INFUSION IN PATIENTS WITH SEPTIC SHOCK. N ENGL J MED 2008; 358:877–887.
The Vasopressin and Septic Shock Trial (VASST)24 was a multicenter randomized, double-blind, controlled trial that included 778 patients with refractory septic shock. Refractory shock was defined as the lack of a response to a normal saline fluid bolus of 500 mL or the need for vasopressors (norepinephrine in doses of at least 5 μg/minute or its equivalent for 6 hours or more in the 24 hours before randomization).
Two subgroups were identified: those with severe septic shock (requiring norepinephrine in doses of 15 μg/minute or higher) and those with less-severe septic shock (needing norepinephrine in doses of 5 to 14 μg/minute). Patients with unstable coronary artery disease (acute myocardial infarction, angina) and severe congestive heart failure were excluded.
Patients were randomized to receive an intravenous infusion of vasopressin (0.01–0.03 U/minute) or norepinephrine (5–15 mg/minute) in addition to open-labeled vasopressors (excluding vasopressin). The primary outcome was the all-cause mortality rate at 28 days.
Results
At 28 days, fewer patients had died in the vasopressin group than in the norepinephrine group (35.4% vs 39.3%), but the difference was not statistically significant (P = .26). The trend was the same at 90 days (mortality rate 43.9% vs 49.6%, P = .11).
Subgroup analysis showed that in patients with less-severe septic shock, those who received vasopressin had a lower mortality rate at 28 days (26.5% vs 35.7%, P = .05; relative risk 0.74; 95% CI 0.55–1.01) and at 90 days (35.8% vs 46.1%, P = .04; relative risk 0.78, 95% CI 0.61–0.99).
There were no statistically significant differences in any of the other secondary outcomes or in serious adverse events.
Comments
The study has been criticized for several reasons:
- The mean arterial blood pressure at baseline before initiation of vasopressin was 72 mm Hg (and some argue that vasopressin was therefore not needed by the time it was started).
- The time from screening to infusion of the study drug was very long (12 hours).
- The observed mortality rate was lower than expected (37%).
Despite these considerations, the VASST trial showed that vasopressin is not associated with an increased number of adverse events in patients without active cardiovascular disease. The possible benefit in terms of the mortality rate in the subgroup of patients with less-severe septic shock requires further investigation.
Is dopamine equivalent to norepinephrine?
Previously, the Sepsis Occurrence in Acutely Ill Patients (SOAP) study, a multicenter, observational cohort study, found that dopamine use was associated with a higher all-cause mortality rate in the ICU compared with no dopamine.25 This finding had not been reproduced, as few well-designed studies had compared the effects of dopamine and norepinephrine.
The SOAP II study
DE BACKER D, BISTON P, DEVRIENDT J, ET AL; SOAP II INVESTIGATORS.. COMPARISON OF DOPAMINE AND NOREPINEPHRINE IN THE TREATMENT OF SHOCK. N ENGL J MED 2010; 362:779–789.
The SOAP II study,26 a multicenter, randomized trial, compared dopamine vs norepinephrine as first-line vasopressor therapy. In patients with refractory shock despite use of dopamine 20 μg/kg/minute or norepinephrine 0.19 μg/kg/minute, open-label norepinephrine, epinephrine, or vasopressin was added.
The primary outcome was the mortality rate at 28 days after randomization; secondary end points included the number of days without need for organ support and the occurrence of adverse events.
Results
A total of 1,679 patients were included; 858 were assigned to dopamine and 821 to norepinephrine. Most (1,044, 62%) of the patients had a diagnosis of septic shock.
No significant difference in mortality rates was noted at 28 days: 52.5% with dopamine vs 48.5% with norepinephrine (P = .10).
However, there were more arrhythmias in the patients treated with dopamine: 207 events (24.1%) vs 102 events (12.4%) (P < .001). The number of other adverse events such as renal failure, myocardial infarction, arterial occlusion, or skin necrosis was not different between the groups.
A subgroup analysis showed that dopamine was associated with more deaths at 28 days in patients with cardiogenic shock (P = .03) but not in patients with septic shock (P = .19) or with hypovolemic shock (P = .84).
Comments
The study was criticized because the patients may not have received adequate fluid resuscitation (the study considered adequate resuscitation to be equivalent to 1 L of crystalloids or 500 mL of colloids), as different degrees of volume depletion among patients make direct comparisons of vasopressor effects difficult.
Additionally, the study defined dopamine 20 μg/kg/minute as being equipotent with norepinephrine 0.19 μg/kg/minute. Comparisons of potency between drugs are difficult to establish, as there are no available data.
Nevertheless, this study further confirms previous findings suggesting that norepinephrine is not associated with more end-organ damage (such as renal failure or skin ischemia), and shows that dopamine may increase the number of adverse events, particularly in patients with cardiac disease.
- Shah MR, Hasselblad V, Stevenson LW, et al. Impact of the pulmonary artery catheter in critically ill patients: meta-analysis of randomized clinical trials. JAMA 2005; 294:1664–1670.
- National Heart, Lung, and Blood Institute Acute Respiratory Distress Syndrome (ARDS) Clinical Trials Network; Wiedemann HP, Wheeler AP, Bernard GR, et al. Comparison of two fluid-management strategies in acute lung injury. N Engl J Med 2006; 354:2564–2575.
- National Heart, Lung, and Blood Institute Acute Respiratory Distress Syndrome (ARDS) Clinical Trials Network; Wheeler AP, Bernard GR, Thompson BT, et al. Pulmonary-artery versus central venous catheter to guide treatment of acute lung injury. N Engl J Med 2006; 354:2213–2224.
- Bernard GR, Luce JM, Sprung CL, et al. High-dose corticosteroids in patients with the adult respiratory distress syndrome. N Engl J Med 1987; 317:1565–1570.
- Meduri GU, Headley AS, Golden E, et al. Effect of prolonged methylprednisolone therapy in unresolving acute respiratory distress syndrome: a randomized controlled trial. JAMA 1998; 280:159–165.
- Steinberg KP, Hudson LD, Goodman RB, et al; National Heart, Lung, and Blood Institute Acute Respiratory Distress Syndrome (ARDS) Clinical Trials Network. Efficacy and safety of corticosteroids for persistent acute respiratory distress syndrome. N Engl J Med 2006; 354:1671–1684.
- Meduri GU, Golden E, Freire AX, et al. Methylprednisolone infusion in early severe ARDS: results of a randomized controlled trial. Chest 2007; 131:954–963.
- Meduri GU, Golden E, Freire AX, et al. Methylprednisolone infusion in early severe ARDS results of a randomized controlled trial. 2007. Chest 2009; 136(suppl 5):e30.
- Annane D, Sébille V, Bellissant E; Ger-Inf-05 Study Group. Effect of low doses of corticosteroids in septic shock patients with or without early acute respiratory distress syndrome. Crit Care Med 2006; 34:22–30.
- Kollef MH, Levy NT, Ahrens TS, Schaiff R, Prentice D, Sherman G. The use of continuous i.v. sedation is associated with prolongation of mechanical ventilation. Chest 1998; 114:541–548.
- Carson SS, Kress JP, Rodgers JE, et al. A randomized trial of intermittent lorazepam versus propofol with daily interruption in mechanically ventilated patients. Crit Care Med 2006; 34:1326–1332.
- Brook AD, Ahrens TS, Schaiff R, et al. Effect of a nursing-implemented sedation protocol on the duration of mechanical ventilation. Crit Care Med 1999; 27:2609–2615.
- Kress JP, Pohlman AS, O’Connor MF, Hall JB. Daily interruption of sedative infusions in critically ill patients undergoing mechanical ventilation. N Engl J Med 2000; 342:1471–1477.
- Girard TD, Kress JP, Fuchs BD, et al. Efficacy and safety of a paired sedation and ventilator weaning protocol for mechanically ventilated patients in intensive care (Awakening and Breathing Controlled trial): a randomised controlled trial. Lancet 2008; 371:126–134.
- van den Berghe G, Wouters P, Weekers F, et al. Intensive insulin therapy in the critically ill patients. N Engl J Med 2001; 345:1359–1367.
- NICE-SUGAR Study Investigators; Finfer S, Chittock DR, Su SY, et al. Intensive versus conventional glucose control in critically ill patients. N Engl J Med 2009; 360:1283–1297.
- Brunkhorst FM, Engel C, Bloos F, et al; German Competence Network Sepsis (SepNet). Intensive insulin therapy and pentastarch resuscitation in severe sepsis. N Engl J Med 2008; 358:125–139.
- Annane D, Sébille V, Charpentier C, et al. Effect of treatment with low doses of hydrocortisone and fludrocortisone on mortality in patients with septic shock. JAMA 2002; 288:862–871.
- Sprung CL, Annane D, Keh D, et al; CORTICUS Study Group. Hydrocortisone therapy for patients with septic shock. N Engl J Med 2008; 358:111–124.
- Annane D, Bellissant E, Bollaert PE, et al. Corticosteroids in the treatment of severe sepsis and septic shock in adults: a systematic review. JAMA 2009; 301:2362–2375.
- Minneci PC, Deans KJ, Natanson C. Corticosteroid therapy for severe sepsis and septic shock [letter]. JAMA 2009; 302:16443–1644.
- Kampmeier TG, Rehberg S, Westphal M, Lange M. Vasopressin in sepsis and septic shock. Minerva Anestesiol 2010; 76:844–850.
- Dellinger RP, Levy MM, Carlet JM, et al; International Surviving Sepsis Campaign Guidelines Committee. Surviving Sepsis Campaign: international guidelines for management of severe sepsis and septic shock: 2008. Crit Care Med 2008; 36:296–327.
- Russell JA, Walley KR, Singer J, et al; VASST Investigators. Vasopressin versus norepinephrine infusion in patients with septic shock. N Engl J Med 2008; 358:877–887.
- Sakr Y, Reinhart K, Vincent JL, et al. Does dopamine administration in shock influence outcome? Results of the Sepsis Occurrence in Acutely Ill Patients (SOAP) Study. Crit Care Med 2006; 34:589–597.
- De Backer D, Biston P, Devriendt J, et al; SOAP II Investigators. Comparison of dopamine and norepinephrine in the treatment of shock. N Engl J Med 2010; 362:779–789.
We have seen significant growth in clinical research in critical care medicine in the last decade. Advances have been made in many important areas in this field; of these, advances in treating septic shock and acute respiratory distress syndrome (ARDS), and also in supportive therapies for critically ill patients (eg, sedatives, insulin), have perhaps received the most attention.
Of note, several once-established therapies in these areas have failed the test of time, as the result of evidence from more-recent clinical trials. For example, recent studies have shown that a pulmonary arterial catheter does not improve outcomes in patients with ARDS. Similarly, what used to be “optimal” fluid management in patients with ARDS is no longer considered appropriate.
In this review, we summarize eight major studies in critical care medicine published in the last 5 years, studies that have contributed to changes in our practice in the intensive care unit (ICU).
FLUID MANAGEMENT IN ARDS
Key points
- In patients with acute lung injury (ALI) and ARDS, fluid restriction is associated with better outcomes than a liberal fluid policy.
- A pulmonary arterial catheter is not necessary and, compared with a central venous catheter, may result in more complications in patients with ALI and ARDS.
Background
Fluid management practices in patients with ARDS have been extremely variable. Two different approaches are commonly used: the liberal or “wet” approach to optimize tissue perfusion and the “dry” approach, which focuses on reducing lung edema. Given that most deaths attributed to ARDS result from extrapulmonary organ failure, aggressive fluid restriction has been the less popular approach.
Additionally, although earlier studies and meta-analyses suggested that the use of a pulmonary arterial catheter was not associated with better outcomes in critically ill patients,1 controversy remained regarding the value of a pulmonary arterial catheter compared with a central venous catheter in guiding fluid management in patients with ARDS, and data were insufficient to prove one strategy better than the other.
The Fluids and Catheter Treatment Trial (FACTT)
NATIONAL HEART, LUNG, AND BLOOD INSTITUTE ACUTE RESPIRATORY DISTRESS SYNDROME (ARDS) CLINICAL TRIALS NETWORK; WIEDEMANN HP, WHEELER AP, BERNARD GR, ET AL. COMPARISON OF TWO FLUID-MANAGEMENT STRATEGIES IN ACUTE LUNG INJURY. N ENGL J MED 2006; 354:2564–2575.
NATIONAL HEART, LUNG, AND BLOOD INSTITUTE ACUTE RESPIRATORY DISTRESS SYNDROME (ARDS) CLINICAL TRIALS NETWORK; WHEELER AP, BERNARD GR, THOMPSON BT, ET AL. PULMONARY-ARTERY VERSUS CENTRAL VENOUS CATHETER TO GUIDE TREATMENT OF ACUTE LUNG INJURY. N ENGL J MED 2006; 354:2213–2224.
The Fluids and Catheter Treatment Trial (FACTT) compared two fluid strategies2 and also the utility of a pulmonary arterial catheter vs a central venous catheter3 in patients with ALI or ARDS.
This two-by-two factorial trial randomized 1,000 patients to be treated according to either a conservative (fluid-restrictive or “dry”) or a liberal (“wet”) fluid management strategy for 7 days. Additionally, they were randomly assigned to receive either a central venous catheter or a pulmonary arterial catheter. The trial thus had four treatment groups:
- Fluid-restricted and a central venous catheter, with a goal of keeping the central venous pressure below 4 mm Hg
- Fluid-restricted and a pulmonary arterial catheter: fluids were restricted and diuretics were given to keep the pulmonary artery occlusion pressure below 8 mm Hg
- Fluid-liberal and a central venous catheter: fluids were given to keep the central venous pressure between 10 and 14 mm Hg
- Fluid-liberal and a pulmonary arterial catheter: fluids were given to keep the pulmonary artery occlusion pressure between 14 and 18 mm Hg.
The primary end point was the mortality rate at 60 days. Secondary end points included the number of ventilator-free days and organ-failure-free days and parameters of lung physiology. All patients were managed with a low-tidal-volume strategy.
The ‘dry’ strategy was better
The cumulative fluid balance was −136 mL ± 491 mL in the “dry” group and 6,992 mL ± 502 mL in the “wet” group, a difference of more than 7 L (P < .0001). Of note, before randomization, the patients were already fluid-positive, with a mean total fluid balance of +2,700 mL).2
At 60 days, no statistically significant difference in mortality rate was seen between the fluid-management groups (25.5% in the dry group vs 28.4% in the wet group (P = .30). Nevertheless, patients in the dry group had better oxygenation indices and lung injury scores (including lower plateau airway pressure), resulting in more ventilator-free days (14.6 ± 0.5 vs 12.1 ± 0.5; P = .0002) and ICU-free days (13.4 ± 0.4 vs 11.2 ± 0.4; P = .0003).2
Although those in the dry-strategy group had a slightly lower cardiac index and mean arterial pressure, they did not have a higher incidence of shock.
More importantly, the dry group did not have a higher rate of nonpulmonary organ failure. Serum creatinine and blood urea nitrogen concentrations were slightly higher in this group, but this was not associated with a higher incidence of renal failure or the use of dialysis: 10% in the dry-strategy group vs 14% in the wet-strategy group; P = .0642).2
No advantage with a pulmonary arterial catheter
The mortality rate did not differ between the catheter groups. However, the patients who received a pulmonary arterial catheter stayed in the ICU 0.2 days longer and had twice as many nonfatal cardiac arrhythmias as those who received a central venous catheter.3
Comments
The liberal fluid-strategy group had fluid balances similar to those seen in previous National Institutes of Health ARDS Network trials in which fluid management was not controlled. This suggests that the liberal fluid strategy reflects usual clinical practice.
Although the goals used in this study (central venous pressure < 4 mm Hg or pulmonary artery occlusion pressure < 8 mm Hg) could be difficult to achieve in clinical practice, a conservative strategy of fluid management is preferred in patients with ALI or ARDS, given the benefits observed in this trial.
A pulmonary arterial catheter is not indicated to guide hemodynamic management of patients with ARDS.
CORTICOSTEROID USE IN ARDS
Key points
- In selected patients with ARDS, the prolonged use of corticosteroids may result in better oxygenation and a shorter duration of mechanical ventilation.
- Late use of corticosteroids in patients with ARDS (> 14 days after diagnosis) is not indicated and may increase the risk of death.
- The role of corticosteroids in early ARDS (< 7 days after diagnosis) remains controversial.
Background
Systemic corticosteroid therapy was commonly used in ARDS patients in the 1970s and 1980s. However, a single-center study published in the late 1980s showed that a corticosteroid in high doses (methylprednisolone 30 mg/kg) resulted in more complications and was not associated with a lower mortality rate.4 On the other hand, a small study that included only patients with persistent ARDS (defined as ARDS lasting for more than 7 days) subsequently showed that oxygenation was significantly better and that fewer patients died while in the hospital with the use of methylprednisolone 2 mg/kg for 32 days.5
In view of these divergent findings, the ARDS Network decided to perform a study to help understand the role of corticosteroids in ARDS.
The Late Steroid Rescue Study (LaSRS)
STEINBERG KP, HUDSON LD, GOODMAN RB, ET AL; NATIONAL HEART, LUNG, AND BLOOD INSTITUTE ACUTE RESPIRATORY DISTRESS SYNDROME (ARDS) CLINICAL TRIALS NETWORK. EFFICACY AND SAFETY OF CORTICOSTEROIDS FOR PERSISTENT ACUTE RESPIRATORY DISTRESS SYNDROME. N ENGL J MED 2006; 354:1671–1684.
The Late Steroid Rescue Study (LaSRS),6 a double-blind, multicenter trial, randomly assigned 180 patients with persistent ARDS (defined as ongoing disease 7–28 days after its onset) to receive methylprednisolone or placebo for 21 days.
Methylprednisolone was given in an initial dose of 2 mg/kg of predicted body weight followed by a dose of 0.5 mg/kg every 6 hours for 14 days and then a dose of 0.5 mg/kg every 12 hours for 7 days, and then it was tapered over 2 to 4 days and discontinued. It could be discontinued if 21 days of treatment were completed or if the patient was able to breathe without assistance.
The primary end point was the mortality rate at 60 days. Secondary end points included the number of ventilator-free days, organ-failure-free days, and complications and the levels of biomarkers of inflammation.
No reduction in mortality rates with steroids
The mortality rates did not differ significantly in the corticosteroid group vs the placebo group at 60 days:
- 29.2% with methylprednisolone (95% confidence interval [CI] 20.8–39.4)
- 28.6% with placebo (95% CI 20.3–38.6, P = 1.0).
Mortality rates at 180 days were also similar between the groups:
- 31.5% with methylprednisolone (95% CI 22.8–41.7)
- 31.9% with placebo (95% CI 23.2–42.0, P = 1.0).
In patients randomized between 7 and 13 days after the onset of ARDS, the mortality rates were lower in the methylprednisolone group than in the placebo group but the differences were not statistically significant. The mortality rate in this subgroup was 27% vs 36% (P = .26) at 60 days and was 27% vs 39% (P = .14) at 180 days.
However, in patients randomized more than 14 days after the onset of ARDS, the mortality rate was significantly higher in the methylprednisolone group than in the placebo group at 60 days (35% vs 8%, P = .02) and at 180 days (44% vs 12%, P = .01).
Some benefit in secondary outcomes
At day 28, methylprednisolone was associated with:
- More ventilator-free days (11.2 ± 9.4 vs 6.8 ± 8.5, P < .001)
- More shock-free days (20.7 ± 8.9 vs 17.9 ± 10.2, P = .04)
- More ICU-free days (8.9 ± 8.2 vs 6.7 ± 7.8, P = .02).
Similarly, pulmonary physiologic indices were better with methylprednisolone, specifically:
- The ratio of Pao2 to the fraction of inspired oxygen at days 3, 4, and 14 (P < .05)
- Plateau pressure at days 4, 5, and 7 (P < .05)
- Static compliance at days 7 and 14 (P < .05).
In terms of side effects, methylprednisolone was associated with more events associated with myopathy or neuropathy (9 vs 0, P = .001), but there were no differences in the number of serious infections or in glycemic control.
Comments
Although other recent studies suggested that corticosteroid use may be associated with a reduction in mortality rates,7–9 LaSRS did not confirm this effect. Although the doses and length of therapy were similar in these studies, LaSRS was much larger and included patients from the ARDS Network.
Nevertheless, LaSRS was criticized because of strict exclusion criteria and poor enrollment (only 5% of eligible patients were included). Additionally, it was conducted over a period of time when some ICU practices varied significantly (eg, low vs high tidal volume ventilation, tight vs loose glucose control).
INTERRUPTING SEDATION DURING MECHANICAL VENTILATION
Key points
- Daily awakening of mechanically ventilated patients is safe.
- Daily interruption of sedation in mechanically ventilated patients is associated with a shorter length of mechanical ventilation.
Background
Sedatives are a central component of critical care. Continuous infusions of narcotics, benzodiazepines, and anesthetic agents are frequently used to promote comfort in patients receiving mechanical ventilation.
Despite its widespread use in the ICU, there is little evidence that such sedation improves outcomes. Observational and randomized trials10–12 have shown that patients who receive continuous infusions of sedatives need to be on mechanical ventilation longer than those who receive intermittent dosing. Additionally, an earlier randomized controlled trial13 showed that daily interruption of sedative drug infusions decreased the duration of mechanical ventilation by almost 50% and resulted in a reduction in the length of stay in the ICU.
Despite these findings, many ICU physicians remain skeptical of the value of daily interruption of sedative medications and question the safety of this practice.
The Awakening and Breathing Controlled (ABC) trial
GIRARD TD, KRESS JP, FUCHS BD, ET AL. EFFICACY AND SAFETY OF A PAIRED SEDATION AND VENTILATOR WEANING PROTOCOL FOR MECHANICALLY VENTILATED PATIENTS IN INTENSIVE CARE (AWAKENING AND BREATHING CONTROLLED TRIAL): A RANDOMISED CONTROLLED TRIAL. LANCET 2008; 371:126–134.
The Awakening and Breathing Controlled (ABC) trial14 was a multicenter, randomized controlled trial that included 336 patients who required at least 12 consecutive hours of mechanical ventilation. All patients had to be receiving patient-targeted sedation.
Those in the intervention group (n = 168) had their sedation interrupted every day, followed by a clinical assessment to determine whether they could be allowed to try breathing spontaneously. The control group (n = 168) also received a clinical assessment for a trial of spontaneous breathing, while their sedation was continued as usual.
In patients in the intervention group who failed the screening for a spontaneous breathing trial, the sedatives were resumed at half the previous dose. Criteria for failure on the spontaneous breathing trial included any of the following: anxiety, agitation, respiratory rate more than 35 breaths per minute for 5 minutes or longer, cardiac arrhythmia, oxygen saturation less than 88% for 5 minutes or longer, or two or more signs of respiratory distress, tachycardia, bradycardia, paradoxical breathing, accessory muscle use, diaphoresis, or marked dyspnea.
Interrupting sedation was superior
The combination of sedation interruption and a spontaneous breathing trial was superior to a spontaneous breathing trial alone. The mean number of ventilator-free days:
- 14.7 ± 0.9 with sedation interruption
- 11.6 ± 0.9 days with usual care (P = .02).
The median time to ICU discharge:
- 9.1 days with sedation interruption (interquartile range 5.1 to 17.8)
- 12.9 days with usual care (interquartile range 6.0 to 24.2, P = .01).
The mortality rate at 28 days:
- 28% with sedation interruption
- 35% with usual care (P = .21).
The mortality rate at 1 year:
- 44% with sedation interruption
- 58% with usual care (hazard ratio [HR] in the intervention group 0.68, 95% CI 0.50–0.92, P = .01).
Of note, patients in the intervention group had a higher rate of self-extubation (9.6% vs 3.6%, P = .03), but the rate of reintubation was similar between the groups (14% vs 13%, P = .47).
Comments
The addition of daily awakenings to spontaneous breathing trials results in a further reduction in the number of ICU days and increases the number of ventilator-free days.
Of note, the protocol allowed patients in the control group to undergo a spontaneous breathing trial while on sedatives (69% of the patients were receiving sedation at the time). Therefore, a bias effect in favor of the intervention group cannot be excluded. However, both groups had to meet criteria for readiness for spontaneous breathing.
The study demonstrates the safety of daily awakenings and confirms previous findings suggesting that a daily trial of spontaneous breathing results in better ICU outcomes.
GLUCOSE CONTROL IN THE ICU
Key points
- Although earlier studies suggested that intensive insulin therapy might be beneficial in critically ill patients, new findings show that strict glucose control can lead to complications without improving outcomes.
Background
A previous study15 found that intensive insulin therapy to maintain a blood glucose level between 80 and 110 mg/dL (compared with 180–200 mg/dL) reduced the mortality rate in surgical critical care patients. The mortality rate in the ICU was 4.6% with intensive insulin therapy vs 8.0% with conventional therapy (P < .04), and the effect was more robust for patients who remained longer than 5 days in the ICU (10.6% vs 20.2%).
Importantly, however, hypoglycemia (defined as blood glucose ≤ 40 mg/dL) occurred in 39 patients in the intensive-treatment group vs 6 patients in the conventional-treatment group.
The NICE-SUGAR trial
NICE-SUGAR STUDY INVESTIGATORS; FINFER S, CHITTOCK DR, SU SY, ET AL. INTENSIVE VERSUS CONVENTIONAL GLUCOSE CONTROL IN CRITICALLY ILL PATIENTS. N ENGL J MED 2009; 360:1283–1297.
The Normoglycemia in Intensive Care Evaluation-Survival Using Glucose Algorithm Regulation (NICE-SUGAR) trial16 randomized 6,104 patients in medical and surgical ICUs to receive either intensive glucose control (blood glucose 81–108 mg/dL) with insulin therapy or conventional glucose control (blood glucose < 180 mg/dL). In the conventional-control group, insulin was discontinued if the blood glucose level dropped below 144 mg/dL.
A higher mortality rate with intensive glucose control
As expected, the intensive-control group achieved lower blood glucose levels: 115 vs 144 mg/dL.
Nevertheless, intensive glucose control was associated with a higher incidence of severe hypoglycemia, defined as a blood glucose level lower than 40 mg/dL: 6.8% vs 0.5%.
More importantly, compared with conventional insulin therapy, intensive glucose control was associated with a higher 90-day mortality rate: 27.5% vs 24.9% (odds ratio 1.14, 95% CI 1.02–1.28). These findings were similar in the subgroup of surgical patients (24.4% vs 19.8%, odds ratio 1.31, 95% CI 1.07–1.61).
Comments
Of note, the conventional-control group had more patients who discontinued the treatment protocol prematurely. Additionally, more patients in this group received corticosteroids.
These results widely differ from those of a previous study by van den Berghe et al,15 which showed that tight glycemic control is associated with a survival benefit. The differences in outcomes are probably largely related to different patient populations, as van den Berghe et al included patients who had undergone cardiac surgery, who were more likely to benefit from strict blood glucose control.
The VISEP trial
BRUNKHORST FM, ENGEL C, BLOOS F, ET AL; GERMAN COMPETENCE NETWORK SEPSIS (SEPNET). INTENSIVE INSULIN THERAPY AND PENTASTARCH RESUSCITATION IN SEVERE SEPSIS. N ENGL J MED 2008; 358:125–139.
The Volume Substitution and Insulin Therapy in Severe Sepsis (VISEP) trial was a multicenter study designed to compare intensive insulin therapy (target blood glucose level 80–110 mg/dL) and conventional glucose control (target blood glucose level 180–200 mg/dL) in patients with severe sepsis.17 It also compared two fluids for volume resuscitation: 10% pentastarch vs modified Ringer's lactate. It included both medical and surgical patients.
Trial halted early for safety reasons
The mean morning blood glucose level was significantly lower in the intensive insulin group (112 vs 151 mg/dL).
Severe hypoglycemia (blood glucose ≤ 40 mg/dL) was more common in the group that received intensive insulin therapy (17% vs 4.1%, P < .001).
Mortality rates at 28 days did not differ significantly: 24.7% with intensive control vs 26.0% with conventional glucose control. The mortality rate at 90 days was 39.7% in the intensive therapy group and 35.4% in the conventional therapy group, but the difference was not statistically significant.
The intensive insulin arm of the trial was stopped after 488 patients were enrolled because of a higher rate of hypoglycemia (12.1% vs 2.1%) and of serious adverse events (10.9% vs 5.2%).
Additionally, the fluid resuscitation arm of the study was suspended at the first planned interim analysis because of a higher risk of organ failure in the 10% pentastarch group.
CORTICOSTEROID THERAPY IN SEPTIC SHOCK
Key points
- Corticosteroid therapy improves hemodynamic outcomes in patients with severe septic shock.
- Although meta-analyses suggest the mortality rate is lower with corticosteroid therapy, there is not enough evidence from randomized controlled trials to prove that the use of low-dose corticosteroids lowers the mortality rate in patients with septic shock.
- The corticotropin (ACTH) stimulation test should not be used to determine the need for corticosteroids in patients with septic shock.
Background
A previous multicenter study,18 performed in France, found that the use of corticosteroids in patients with septic shock resulted in lower rates of death at 28 days, in the ICU, and in the hospital and a shorter time to vasopressor withdrawal. Nevertheless, the beneficial effects were not observed in patients with adequate adrenal reserve (based on an ACTH stimulation test).
This study was criticized because of a high mortality rate in the placebo group.
The CORTICUS study
SPRUNG CL, ANNANE D, KEH D, ET AL; CORTICUS STUDY GROUP. HYDROCORTISONE THERAPY FOR PATIENTS WITH SEPTIC SHOCK. N ENGL J MED 2008; 358:111–124.
The Corticosteroid Therapy of Septic Shock (CORTICUS) study was a multicenter trial that randomly assigned 499 patients with septic shock to receive hydrocortisone (50 mg intravenously every 6 hours for 5 days, followed by a 6-day taper period) or placebo.19
Patients were eligible to be enrolled within 72 hours of onset of shock. Similar to previous studies, the CORTICUS trial classified patients on the basis of an ACTH stimulation test as having inadequate adrenal reserve (a cortisol increase of ≤ 9 μg/dL) or adequate adrenal reserve (a cortisol increase of > 9 μg/dL).
Faster reversal of shock with steroids
At baseline, the mean Simplified Acute Physiologic Score II (SAPS II) was 49 (the range of possible scores is 0 to 163; the higher the score the worse the organ dysfunction).
Hydrocortisone use resulted in a shorter duration of vasopressor use and a faster reversal of shock (3.3 days vs 5.8 days, P < .001).
This association was the same when patients were divided according to response to ACTH stimulation test. Time to reversal of shock in responders:
- 2.8 days with hydrocortisone
- 5.8 days with placebo (P < .001).
Time to reversal of shock in nonresponders:
- 3.9 days with hydrocortisone
- 6.0 days with placebo (P = .06).
Nevertheless, the treatment did not reduce the mortality rate at 28 days overall (34.3% vs 31.5% P = .51), or in the subgroups based on response to ACTH, or at any other time point. A post hoc analysis suggested that patients who had a systolic blood pressure of less than 90 mm Hg within 30 minutes of enrollment had a greater benefit in terms of mortality rate, but the effect was not statistically significant: the absolute difference was −11.2% (P = 0.28). Similarly, post hoc analyses also revealed a higher rate of death at 28 days in patients who received etomidate (Amidate) before randomization in both groups (P = .03).
Importantly, patients who received corticosteroids had a higher incidence of superinfections, including new episodes of sepsis or septic shock, with a combined odds ratio of 1.37 (95% CI 1.05–1.79).
Length of stay in the hospital or in the ICU was similar in patients who received corticosteroids and in those who received placebo. The ICU length of stay was 19 ± 31 days with hydrocortisone vs 18 ± 17 days with placebo (P = .51).
Comments
The CORTICUS trial showed that low-dose corticosteroid therapy results in faster reversal of shock in patients with severe septic shock. The hemodynamic benefits are present in all patients regardless of response to the ACTH stimulation test.
Nevertheless, contrary to previous findings,18 corticosteroid use was not associated with an improvement in mortality rates. Important differences exist between these two studies:
- The mortality rates in the placebo groups were significantly different (> 50% in the French study vs 30% in CORTICUS).
- The SAPS II scores were different in these two trials (55 vs 49), suggesting a greater severity of illness in the French study.
- The criteria for enrollment were different: the French study included patients who had a systolic blood pressure lower than 90 mm Hg for more than 1 hour despite fluid administration and vasopressor use, whereas the CORTICUS trial included patients who had a systolic blood pressure lower than 90 mm Hg for more than 1 hour despite fluid administration or vasopressor use.
- The time of enrollment was different: patients were enrolled much faster in the French study (within 8 hours) than in the CORTICUS trial (within 72 hours).
A recent meta-analysis of 17 randomized trials (including the CORTICUS study), found that, compared with those who received placebo, patients who received corticosteroids had a small reduction in the 28-day mortality rate (HR 0.84, 95% CI 0.71–1.00, P < .05).20 Of note, this meta-analysis has been criticized for possible publication bias and also for a large degree of heterogeneity in its results.21
VASOPRESSOR THERAPY IN SHOCK
Key points
- Vasopressin use in patients with severe septic shock is not associated with an improvement in mortality rates.
- Vasopressin should not be used as a first-line agent in patients with septic shock.
- Norepinephrine should be considered a first-line agent in patients with shock.
- Compared with norepinephrine, the use of dopamine in patients with shock is associated with similar mortality rates, although its use may result in a greater number of cardiac adverse events.
Background
Vasopressin gained popularity in critical care in the last 10 years because several small studies showed that adding it improves hemodynamics and results in a reduction in the doses of catecholamines in patients with refractory septic shock.22 Furthermore, the Surviving Sepsis Campaign guidelines recommended the use of vasopressin in patients who have refractory shock despite fluid resuscitation and the use of other “conventional” vasopressors.23
Despite these positive findings, it remained unknown if the use of vasopressin increases the survival rate in patients with septic shock.
The Vasopressin and Septic Shock Trial (VASST)
RUSSELL JA, WALLEY KR, SINGER J, ET AL; VASST INVESTIGATORS. VASOPRESSIN VERSUS NOREPINEPHRINE INFUSION IN PATIENTS WITH SEPTIC SHOCK. N ENGL J MED 2008; 358:877–887.
The Vasopressin and Septic Shock Trial (VASST)24 was a multicenter randomized, double-blind, controlled trial that included 778 patients with refractory septic shock. Refractory shock was defined as the lack of a response to a normal saline fluid bolus of 500 mL or the need for vasopressors (norepinephrine in doses of at least 5 μg/minute or its equivalent for 6 hours or more in the 24 hours before randomization).
Two subgroups were identified: those with severe septic shock (requiring norepinephrine in doses of 15 μg/minute or higher) and those with less-severe septic shock (needing norepinephrine in doses of 5 to 14 μg/minute). Patients with unstable coronary artery disease (acute myocardial infarction, angina) and severe congestive heart failure were excluded.
Patients were randomized to receive an intravenous infusion of vasopressin (0.01–0.03 U/minute) or norepinephrine (5–15 mg/minute) in addition to open-labeled vasopressors (excluding vasopressin). The primary outcome was the all-cause mortality rate at 28 days.
Results
At 28 days, fewer patients had died in the vasopressin group than in the norepinephrine group (35.4% vs 39.3%), but the difference was not statistically significant (P = .26). The trend was the same at 90 days (mortality rate 43.9% vs 49.6%, P = .11).
Subgroup analysis showed that in patients with less-severe septic shock, those who received vasopressin had a lower mortality rate at 28 days (26.5% vs 35.7%, P = .05; relative risk 0.74; 95% CI 0.55–1.01) and at 90 days (35.8% vs 46.1%, P = .04; relative risk 0.78, 95% CI 0.61–0.99).
There were no statistically significant differences in any of the other secondary outcomes or in serious adverse events.
Comments
The study has been criticized for several reasons:
- The mean arterial blood pressure at baseline before initiation of vasopressin was 72 mm Hg (and some argue that vasopressin was therefore not needed by the time it was started).
- The time from screening to infusion of the study drug was very long (12 hours).
- The observed mortality rate was lower than expected (37%).
Despite these considerations, the VASST trial showed that vasopressin is not associated with an increased number of adverse events in patients without active cardiovascular disease. The possible benefit in terms of the mortality rate in the subgroup of patients with less-severe septic shock requires further investigation.
Is dopamine equivalent to norepinephrine?
Previously, the Sepsis Occurrence in Acutely Ill Patients (SOAP) study, a multicenter, observational cohort study, found that dopamine use was associated with a higher all-cause mortality rate in the ICU compared with no dopamine.25 This finding had not been reproduced, as few well-designed studies had compared the effects of dopamine and norepinephrine.
The SOAP II study
DE BACKER D, BISTON P, DEVRIENDT J, ET AL; SOAP II INVESTIGATORS.. COMPARISON OF DOPAMINE AND NOREPINEPHRINE IN THE TREATMENT OF SHOCK. N ENGL J MED 2010; 362:779–789.
The SOAP II study,26 a multicenter, randomized trial, compared dopamine vs norepinephrine as first-line vasopressor therapy. In patients with refractory shock despite use of dopamine 20 μg/kg/minute or norepinephrine 0.19 μg/kg/minute, open-label norepinephrine, epinephrine, or vasopressin was added.
The primary outcome was the mortality rate at 28 days after randomization; secondary end points included the number of days without need for organ support and the occurrence of adverse events.
Results
A total of 1,679 patients were included; 858 were assigned to dopamine and 821 to norepinephrine. Most (1,044, 62%) of the patients had a diagnosis of septic shock.
No significant difference in mortality rates was noted at 28 days: 52.5% with dopamine vs 48.5% with norepinephrine (P = .10).
However, there were more arrhythmias in the patients treated with dopamine: 207 events (24.1%) vs 102 events (12.4%) (P < .001). The number of other adverse events such as renal failure, myocardial infarction, arterial occlusion, or skin necrosis was not different between the groups.
A subgroup analysis showed that dopamine was associated with more deaths at 28 days in patients with cardiogenic shock (P = .03) but not in patients with septic shock (P = .19) or with hypovolemic shock (P = .84).
Comments
The study was criticized because the patients may not have received adequate fluid resuscitation (the study considered adequate resuscitation to be equivalent to 1 L of crystalloids or 500 mL of colloids), as different degrees of volume depletion among patients make direct comparisons of vasopressor effects difficult.
Additionally, the study defined dopamine 20 μg/kg/minute as being equipotent with norepinephrine 0.19 μg/kg/minute. Comparisons of potency between drugs are difficult to establish, as there are no available data.
Nevertheless, this study further confirms previous findings suggesting that norepinephrine is not associated with more end-organ damage (such as renal failure or skin ischemia), and shows that dopamine may increase the number of adverse events, particularly in patients with cardiac disease.
- Shah MR, Hasselblad V, Stevenson LW, et al. Impact of the pulmonary artery catheter in critically ill patients: meta-analysis of randomized clinical trials. JAMA 2005; 294:1664–1670.
- National Heart, Lung, and Blood Institute Acute Respiratory Distress Syndrome (ARDS) Clinical Trials Network; Wiedemann HP, Wheeler AP, Bernard GR, et al. Comparison of two fluid-management strategies in acute lung injury. N Engl J Med 2006; 354:2564–2575.
- National Heart, Lung, and Blood Institute Acute Respiratory Distress Syndrome (ARDS) Clinical Trials Network; Wheeler AP, Bernard GR, Thompson BT, et al. Pulmonary-artery versus central venous catheter to guide treatment of acute lung injury. N Engl J Med 2006; 354:2213–2224.
- Bernard GR, Luce JM, Sprung CL, et al. High-dose corticosteroids in patients with the adult respiratory distress syndrome. N Engl J Med 1987; 317:1565–1570.
- Meduri GU, Headley AS, Golden E, et al. Effect of prolonged methylprednisolone therapy in unresolving acute respiratory distress syndrome: a randomized controlled trial. JAMA 1998; 280:159–165.
- Steinberg KP, Hudson LD, Goodman RB, et al; National Heart, Lung, and Blood Institute Acute Respiratory Distress Syndrome (ARDS) Clinical Trials Network. Efficacy and safety of corticosteroids for persistent acute respiratory distress syndrome. N Engl J Med 2006; 354:1671–1684.
- Meduri GU, Golden E, Freire AX, et al. Methylprednisolone infusion in early severe ARDS: results of a randomized controlled trial. Chest 2007; 131:954–963.
- Meduri GU, Golden E, Freire AX, et al. Methylprednisolone infusion in early severe ARDS results of a randomized controlled trial. 2007. Chest 2009; 136(suppl 5):e30.
- Annane D, Sébille V, Bellissant E; Ger-Inf-05 Study Group. Effect of low doses of corticosteroids in septic shock patients with or without early acute respiratory distress syndrome. Crit Care Med 2006; 34:22–30.
- Kollef MH, Levy NT, Ahrens TS, Schaiff R, Prentice D, Sherman G. The use of continuous i.v. sedation is associated with prolongation of mechanical ventilation. Chest 1998; 114:541–548.
- Carson SS, Kress JP, Rodgers JE, et al. A randomized trial of intermittent lorazepam versus propofol with daily interruption in mechanically ventilated patients. Crit Care Med 2006; 34:1326–1332.
- Brook AD, Ahrens TS, Schaiff R, et al. Effect of a nursing-implemented sedation protocol on the duration of mechanical ventilation. Crit Care Med 1999; 27:2609–2615.
- Kress JP, Pohlman AS, O’Connor MF, Hall JB. Daily interruption of sedative infusions in critically ill patients undergoing mechanical ventilation. N Engl J Med 2000; 342:1471–1477.
- Girard TD, Kress JP, Fuchs BD, et al. Efficacy and safety of a paired sedation and ventilator weaning protocol for mechanically ventilated patients in intensive care (Awakening and Breathing Controlled trial): a randomised controlled trial. Lancet 2008; 371:126–134.
- van den Berghe G, Wouters P, Weekers F, et al. Intensive insulin therapy in the critically ill patients. N Engl J Med 2001; 345:1359–1367.
- NICE-SUGAR Study Investigators; Finfer S, Chittock DR, Su SY, et al. Intensive versus conventional glucose control in critically ill patients. N Engl J Med 2009; 360:1283–1297.
- Brunkhorst FM, Engel C, Bloos F, et al; German Competence Network Sepsis (SepNet). Intensive insulin therapy and pentastarch resuscitation in severe sepsis. N Engl J Med 2008; 358:125–139.
- Annane D, Sébille V, Charpentier C, et al. Effect of treatment with low doses of hydrocortisone and fludrocortisone on mortality in patients with septic shock. JAMA 2002; 288:862–871.
- Sprung CL, Annane D, Keh D, et al; CORTICUS Study Group. Hydrocortisone therapy for patients with septic shock. N Engl J Med 2008; 358:111–124.
- Annane D, Bellissant E, Bollaert PE, et al. Corticosteroids in the treatment of severe sepsis and septic shock in adults: a systematic review. JAMA 2009; 301:2362–2375.
- Minneci PC, Deans KJ, Natanson C. Corticosteroid therapy for severe sepsis and septic shock [letter]. JAMA 2009; 302:16443–1644.
- Kampmeier TG, Rehberg S, Westphal M, Lange M. Vasopressin in sepsis and septic shock. Minerva Anestesiol 2010; 76:844–850.
- Dellinger RP, Levy MM, Carlet JM, et al; International Surviving Sepsis Campaign Guidelines Committee. Surviving Sepsis Campaign: international guidelines for management of severe sepsis and septic shock: 2008. Crit Care Med 2008; 36:296–327.
- Russell JA, Walley KR, Singer J, et al; VASST Investigators. Vasopressin versus norepinephrine infusion in patients with septic shock. N Engl J Med 2008; 358:877–887.
- Sakr Y, Reinhart K, Vincent JL, et al. Does dopamine administration in shock influence outcome? Results of the Sepsis Occurrence in Acutely Ill Patients (SOAP) Study. Crit Care Med 2006; 34:589–597.
- De Backer D, Biston P, Devriendt J, et al; SOAP II Investigators. Comparison of dopamine and norepinephrine in the treatment of shock. N Engl J Med 2010; 362:779–789.
KEY POINTS
- In patients with acute respiratory distress syndrome (ARDS), fluid restriction is associated with better outcomes. A pulmonary arterial catheter is not indicated in the routine management of ARDS. Corticosteroid use can result in improved oxygenation but may be associated with worse outcomes if treatment is started late, ie, more than 14 days after the onset of the disease.
- Intensive insulin therapy is associated with hypoglycemia and may be associated with complications in medical patients.
- In patients with septic shock, corticosteroid therapy is associated with faster shock reversal, but its effects on mortality rates remain controversial. Vasopressin improves hemodynamic variables but is not associated with a lower mortality rate.
- Daily interruption of sedation and early awakening of mechanically ventilated patients result in better outcomes.
- Compared with norepinephrine, dopamine is associated with more cardiac adverse events in patients with shock.
Alternative modes of mechanical ventilation: A review for the hospitalist
Technologic advances and computerized control of mechanical ventilators have made it possible to deliver ventilatory assistance in new modes. Driving these innovations is the desire to prevent ventilator-induced lung injury, improve patient comfort, and liberate the patient from mechanical ventilation as soon as possible.
We call these innovations “alternative” modes to differentiate them from the plain volume-control and pressure-control modes. Some clinicians rarely use these new modes, but in some medical centers they have become the most common ones used, or are being used unknowingly (the operator misunderstands the mode name). The information we provide on these modes of ventilation is by no means an endorsement of their use, but rather a tool to help the clinician understand their physiologic, theoretical, and clinical effects.
We focused on two goals:
- Explain what the mode does
- Briefly review the theoretical benefits and the actual evidence supporting these alternative modes of ventilation.
STANDARD NOMENCLATURE NEEDED
Since its invention, mechanical ventilation has been plagued by multiple names being used to describe the same things. For example, volume-control ventilation is also called volume-cycled ventilation, assist-control ventilation, volume-limited ventilation, and controlled mechanical ventilation. Similarly, multiple abbreviations are used, each depending on the brand of ventilator, and new acronyms have been added in recent years as new modes have been developed. The vast number of names and modes can confuse even the most seasoned critical care physician.
Efforts to establish a common nomenclature are under way.1
WHAT IS A MODE?
A mode of mechanical ventilation has three essential components:
- The control variable
- The breath sequence
- The targeting scheme.
Similar modes may require more detailed descriptions to distinguish them, but the basic function can be explained by these three components.
The control variable
In general, inspiration is an active process, driven by the patient’s effort, the ventilator, or both, while expiration is passive. For simplicity, in this article a mechanical breath means the inspiratory phase of the breath.
The machine can only control the volume (and flow) or the pressure given. The breaths can be further described on the basis of what triggers the breath, what limits it (the maximum value of a control variable), and what ends (cycles) it.
The breath sequence
There are three possible breath sequences:
- Intermittent mandatory ventilation, in which the patient can take spontaneous breaths between mandatory breaths
- Continuous spontaneous ventilation, in which all breaths are spontaneous (Table 1).
The targeting scheme
The targeting or feedback scheme refers to the ventilator settings and programming that dictate its response to the patient’s lung compliance, lung resistance, and respiratory effort. The regulation can be as simple as controlling the pressure in pressure-control mode, or it can be based on a complicated algorithm.
ADAPTIVE PRESSURE CONTROL
Other names for adaptive pressure control
- Pressure Regulated Volume Control (Maquet Servo-i, Rastatt, Germany)
- AutoFlow (Dräger Medical AG, Lübeck, Germany)
- Adaptive Pressure Ventilation (Hamilton Galileo, Hamilton Medical AG, Bonaduz, Switzerland)
- Volume Control+ (Puritan Bennett, Tyco Healthcare; Mansfield, MA)
- Volume Targeted Pressure Control, Pressure Controlled Volume Guaranteed (Engström, General Electric, Madison, WI).
What does adaptive pressure control do?
The APC mode delivers pressure-controlled breaths with an adaptive targeting scheme (Table 2).
In pressure-control ventilation, tidal volumes depend on the lung’s physiologic mechanics (compliance and resistance) and patient effort (Figure 1). Therefore, the tidal volume varies with changes in lung physiology (ie, larger or smaller tidal volumes than targeted).
To overcome this effect, a machine in APC mode adjusts the inspiratory pressure to deliver the set minimal target tidal volume. If tidal volume increases, the machine decreases the inspiratory pressure, and if tidal volume decreases, the machine increases the inspiratory pressure. However, if the patient effort is large enough, the tidal volume will increase in spite of decreasing the inspiratory pressure (Figure 2). The adjustments to the inspiratory pressure occur after the tidal volume is off-target in a number of breaths.
Common sources of confusion with adaptive pressure control
First, APC is not a volume-control mode. In volume control, the tidal volume does not change; in APC the tidal volume can increase or decrease, and the ventilator will adjust the inflation pressure to achieve the target volume. Thus, APC guarantees an average minimum tidal volume but not a maximum tidal volume.
Second, a characteristic of pressure control (and hence, APC) is that the flow of gas varies to maintain constant airway pressure (ie, maintain the set inspiratory pressure). This characteristic allows a patient who generates an inspiratory effort to receive flow as demanded, which is likely more comfortable. This is essentially different from volume control, in which flow is set by the operator and hence is fixed. Thus, if the patient effort is strong enough (Figure 1), this leads to what is called flow asynchrony, in which the patient does not get the flow asked for in a breath.
Ventilator settings in adaptive pressure control
Ventilator settings in APC are:
- Tidal volume
- Time spent in inspiration (inspiratory time)
- Frequency
- Fraction of inspired oxygen (Fio2)
- Positive end-expiratory pressure (PEEP).
Some ventilators also require setting the speed to reach the peak pressure (also known as slope percent or inspiratory rise time).
Clinical applications of adaptive pressure control
This mode is designed to maintain a consistent tidal volume during pressure-control ventilation and to promote inspiratory flow synchrony. It is a means of automatically reducing ventilatory support (ie, weaning) as the patient’s inspiratory effort becomes stronger, as in awakening from anesthesia.
APC may not be ideal for patients who have an inappropriately increased respiratory drive (eg, in severe metabolic acidosis), since the inspiratory pressure will decrease to maintain the targeted average tidal volume, inappropriately shifting the work of breathing onto the patient.
Theoretical benefits of adaptive pressure control
APC guarantees a minimum average tidal volume (unless the pressure alarm threshold is set too low, so that the target tidal volume is not delivered). Other theoretical benefits are flow synchrony, less ventilator manipulation by the operator, and automatic weaning of ventilator support.
Evidence of benefit of adaptive pressure control
Physiologic benefits. This mode has lower peak inspiratory pressures than does volume-control ventilation,3,4 which is often reported as a positive finding. However, in volume-control mode (the usual comparator), the peak inspiratory pressure is a manifestation of both resistance and compliance. Hence, peak inspiratory pressure is expected to be higher but does not reflect actual lung-distending pressures. It is the plateau pressure, a manifestation of lung compliance, that is related to lung injury.
Patient comfort. APC may increase the work of breathing when using low tidal volume ventilation and when there is increased respiratory effort (drive).5 Interestingly, APC was less comfortable than pressure support ventilation in a small trial.6
Outcomes have not been studied.7
Adaptive pressure control: Bottom line
APC is widely available and widely used, sometimes unknowingly (eg, if the operator thinks it is volume control). It is relatively easy to use and to set; however, evidence of its benefit is scant.
ADAPTIVE SUPPORT VENTILATION
Adaptive support ventilation (ASV) evolved as a form of mandatory minute ventilation implemented with adaptive pressure control. Mandatory minute ventilation is a mode that allows the operator to preset a target minute ventilation, and the ventilator then supplies mandatory breaths, either volume- or pressure-controlled, if the patient’s spontaneous breaths generate a lower minute ventilation.
ASV automatically selects the appropriate tidal volume and frequency for mandatory breaths and the appropriate tidal volume for spontaneous breaths on the basis of the respiratory system mechanics and target minute alveolar ventilation.
Described in 1994 by Laubscher et al,8,9 ASV became commercially available in 1998 in Europe and in 2007 in the United States (Hamilton Galileo ventilator, Hamilton Medical AG). This is the first commercially available ventilator that uses an “optimal” targeting scheme (see below).
What does adaptive support ventilation do?
ASV delivers pressure-controlled breaths using an adaptive (optimal) scheme (Table 2). “Optimal,” in this context, means minimizing the mechanical work of breathing: the machine selects a tidal volume and frequency that the patient’s brain would presumably select if the patient were not connected to a ventilator. This pattern is assumed to encourage the patient to generate spontaneous breaths.
The ventilator calculates the normal required minute ventilation based on the patient’s ideal weight and estimated dead space volume (ie, 2.2 mL/kg). This calculation represents 100% of minute ventilation. The clinician at the bedside sets a target percent of minute ventilation that the ventilator will support—higher than 100% if the patient has increased requirements due, eg, to sepsis or increased dead space, or less than 100% during weaning.
The ventilator initially delivers test breaths, in which it measures the expiratory time constant for the respiratory system and then uses this along with the estimated dead space and normal minute ventilation to calculate an optimal breathing frequency in terms of mechanical work.
The optimal or target tidal volume is calculated as the normal minute ventilation divided by the optimal frequency. The target tidal volume is achieved by the use of APC (see above) (Figure 2). This means that the pressure limit is automatically adjusted to achieve an average delivered tidal volume equal to the target. The ventilator continuously monitors the respiratory system mechanics and adjusts its settings accordingly.
The ventilator adjusts its breaths to avoid air trapping by allowing enough time to exhale, to avoid hypoventilation by delivering tidal volume greater than the dead space, and to avoid volutrauma by avoiding large tidal volumes.
Ventilator settings in adaptive support ventilation
Ventilator settings in ASV are:
- Patient height (to calculate the ideal body weight)
- Sex
- Percent of normal predicted minute ventilation goal
- Fio2
- PEEP.
Clinical applications of adaptive support ventilation
ASV is intended as a sole mode of ventilation, from initial support to weaning.
Theoretical benefits of adaptive support ventilation
In theory, ASV offers automatic selection of ventilator settings, automatic adaptation to changing patient lung mechanics, less need for human manipulation of the machine, improved synchrony, and automatic weaning.
Evidence of benefit of adaptive support ventilation
Physiologic benefits. Ventilator settings are adjusted automatically. ASV selects different tidal volume-respiratory rate combinations based on respiratory mechanics in passive and paralyzed patients.10–12 In actively breathing patients, there was no difference in the ventilator settings chosen by ASV for different clinical scenarios (and lung physiology).10 Compared with pressure-controlled intermittent mandatory ventilation, with ASV, the inspiratory load is less and patient-ventilator interaction is better.13
Patient-ventilator synchrony and comfort have not been studied.
Outcomes. Two trials suggest that ASV may decrease time on mechanical ventilation.14,15 However, in another trial,16 compared with a standard protocol, ASV led to fewer ventilator adjustments but achieved similar postsurgical weaning outcomes. The effect of this mode on the death rate has not been examined.17,18
Adaptive support ventilation: Bottom line
ASV is the first commercially available mode that automatically selects all the ventilator settings except PEEP and Fio2. These seem appropriate for different clinical scenarios in patients with poor respiratory effort or in paralyzed patients. Evidence of the effect in actively breathing patients and on outcomes such as length of stay or death is still lacking.
PROPORTIONAL ASSIST VENTILATION
Patients who have normal respiratory drive but who have difficulty sustaining adequate spontaneous ventilation are often subjected to pressure support ventilation (PSV), in which the ventilator generates a constant pressure throughout inspiration regardless of the intensity of the patient’s effort.
In 1992, Younes and colleagues19,20 developed proportional assist ventilation (PAV) as an alternative in which the ventilator generates pressure in proportion to the patient’s effort. PAV became commercially available in Europe in 1999 and was approved in the United States in 2006, available on the Puritan Bennett 840 ventilator (Puritan Bennett Co, Boulder, CO). PAV has also been used for noninvasive ventilation, but this is not available in the United States.
Other names for proportional assist ventilation
Proportional Pressure Support (Dräger Medical; not yet available in the United States).
What does proportional assist ventilation do?
This mode delivers pressure-controlled breaths with a servo control scheme (Table 2).
To better understand PAV, we can compare it with PSV. With PSV, the pressure applied by the ventilator rises to a preset level that is held constant (a set-point scheme) until a cycling criterion (a percent of the maximum inspiratory flow value) is reached. The inspiratory flow and tidal volume are the result of the patient’s inspiratory effort, the level of pressure applied, and the respiratory system mechanics.
In PAV, as in PSV, all breaths are spontaneous (Table 1). The patient controls the timing and size of the breath. There are no preset pressure, flow, or volume goals, but safety limits on the volume and pressure delivered can be set.
Ventilator settings in proportional assist ventilation
Ventilator settings in PAV are:
- Airway type (endotracheal tube, tracheostomy)
- Airway size (inner diameter)
- Percentage of work supported (assist range 5%–95%)
- Tidal volume limit
- Pressure limit
- Expiratory sensitivity (normally, as inspiration ends, flow should stop; this parameter tells the ventilator at what flow to end inspiration).
Caution when assessing the literature. Earlier ventilator versions, ie, Dräger and Manitoba (University of Manitoba, Winnipeg, MB, Canada), which are not available in the United States, required the repeated calculation of the respiratory system mechanics and the manual setting of flow and volume assists (amplification factors) independently. To overcome this limitation, new software automatically adjusts the flow and volume amplification to support the loads imposed by the automatically measured values of resistance and elastance (inverse of compliance) of the respiratory system.21 This software is included in the model (Puritan Bennett) available in the United States.
Clinical applications of proportional assist ventilation
The PAV mode is indicated for maximizing ventilator patient synchrony for assisted spontaneous ventilation.
PAV is contraindicated in patients with respiratory depression (bradypnea) or large air leaks (eg, bronchopleural fistulas). It should be used with caution in patients with severe hyperinflation, in which the patient may still be exhaling but the ventilator doesn’t recognize it. Another group in which PAV should be used with caution is those with high ventilatory drives, in which the ventilator overestimates respiratory system mechanics. This situation can lead to overassistance due to the “runaway phenomenon,” in which the ventilator continues to provide support even if the patient has stopped inspiration.22
Theoretical benefits of proportional assist ventilation
In theory, PAV should reduce the work of breathing, improve synchrony, automatically adapt to changing patient lung mechanics and effort, decrease the need for ventilator intervention and manipulation, decrease the need for sedation, and improve sleep.
Evidence of benefit of proportional assist ventilation
Physiologic benefits. PAV reduces the work of breathing better than PSV,21 even in the face of changing respiratory mechanics or increased respiratory demand (hypercapnia).23–25 The hemodynamic profile is similar to that in PSV. Tidal volumes are variable; however, in recent reports the tidal volumes were within the lung-protective range (6–8 mL/kg, plateau pressure < 30 cm H20).26,27
Comfort. PAV entails less patient effort and discomfort that PSV does.23,25 PAV significantly reduces asynchrony,27 which in turn may favorably affect sleep in critically ill patients. 28
Outcomes. The probability of spontaneous breathing without assistance was significantly better in critically ill patients ventilated with PAV than with PSV. No trial has reported the effect of PAV on deaths.27,29
Proportional assist ventilation: Bottom line
Extensive basic research has been done with PAV in different forms of respiratory failure, such as obstructive lung disease, acute respiratory distress syndrome (ARDS), and chronic respiratory failure. It fulfills its main goal, which is to improve patient-ventilator synchrony. Clinical experience with PAV in the United States is limited, as it was only recently approved.
AIRWAY PRESSURE-RELEASE VENTILATION AND BIPHASIC POSITIVE AIRWAY PRESSURE
Airway pressure-release ventilation (APRV) was described in 1987 by Stock et al30 as a mode for delivering ventilation in acute lung injury while avoiding high airway pressures. APRV combines high constant positive airway pressure (improving oxygenation and promoting alveolar recruitment) with intermittent releases (causing exhalation).
Other names for biphasic positive airway pressure
Other names for biphasic positive airway pressure are:
- BiLevel (Puritan Bennett)
- BIPAP (Dräger Europe)
- Bi Vent (Siemens)
- BiPhasic (Avea, Cardinal Health, Inc, Dublin, OH)
- PCV+ (Dräger Medical)
- DuoPAP (Hamilton).
Caution—name confusion. In North America, BiPAP (Respironics, Murrysville, PA) and BiLevel are used to refer to noninvasive modes of ventilation.
APRV has no other name.
What do these modes do?
These modes deliver pressure-controlled, time-triggered, and time-cycled breaths using a set-point targeting scheme (Table 2). This means that the ventilator maintains a constant pressure (set point) even in the face of spontaneous breaths.
Caution—source of confusion. The term continuous positive airway pressure (CPAP) is often used to describe this mode. However, CPAP is pressure that is applied continuously at the same level; the patient generates all the work to maintain ventilation (“pressure-controlled continuous spontaneous ventilation” in the current nomenclature). In APRV, the airway pressure is intermittently released and reapplied, generating a tidal volume that supports ventilation. In other words, this is a pressure-controlled breath with a very prolonged inspiratory time and a short expiratory time in which spontaneous ventilation is possible at any point (“pressure-controlled intermittent mandatory ventilation” in the current nomenclature).
How these modes are set in the ventilator may also be a source of confusion. To describe the time spent in high and low airway pressures, we use the terms Thigh and Tlow, respectively. By convention, the difference between APRV and biphasic mode is the duration of Tlow (< 1.5 sec for APRV).
Similarly, Phigh and Plow are used to describe the high and low airway pressure. To better understand this concept, you can create the same mode in conventional pressure-control ventilation by thinking of the Thigh as the inspiratory time, the Tlow as the expiratory time, the Phigh as inspiratory pressure, and the Plow as PEEP.
Hence, APRV is an extreme form of inverse ratio ventilation, with an inspiration-to-expiration ratio of 4:1. This means a patient spends most of the time in Phigh and Thigh, and exhalations are short (Tlow and Plow). In contrast, the biphasic mode uses conventional inspiration-expiration ratios (Figure 4).
As with any form of pressure control, the tidal volume is generated by airway pressure rising above baseline (ie, the end-expiratory value). Hence, to ensure an increase in minute ventilation, the mandatory breath rate must be increased (ie, decreasing Thigh, Tlow, or both) or the tidal volume must be increased (ie, increasing the difference between Phigh and Plow). This means that in APRV the Tlow has to happen more often (by increasing the number of breaths) or be more prolonged (allowing more air to exhale). Because unrestricted spontaneous breaths are permitted at any point of the cycle, the patient contributes to the total minute ventilation (usually 10%–40%).
In APRV and biphasic mode, the operator’s set time and pressure in inspiration and expiration will be delivered regardless of the patient’s breathing efforts—the patient’s spontaneous breath does not trigger a mechanical breath. Some ventilators have automatic adjustments to improve the trigger synchrony.
Ventilator settings in APRV and biphasic mode
These modes require the setting of two pressure levels (Phigh and Plow) and two time durations (Thigh and Tlow). One can add pressure support or automatic tube compensation to assist spontaneous breaths. The difference in Tlow generates differences in the Thigh:Tlow ratio: APRV has a short Tlow (an inspiration-expiration ratio of 4:1). Biphasic mode has a conventional inspiration-expiration ratio of 1:1 to 1:4.
Clinical applications
APRV is used in acute lung injury and ARDS. This mode should be used with caution or not at all in patients with obstructive lung disease or inappropriately increased respiratory drive.32–35
Biphasic mode is intended for both ventilation and weaning. In a patient who has poor respiratory effort or who is paralyzed, biphasic is identical to pressure-control/continuous mandatory ventilation.
Theoretical benefits of APRV and biphasic mode
Multiple benefits have been ascribed to these modes. In theory, APRV will maximize and maintain alveolar recruitment, improve oxygenation, lower inflation pressures, and decrease overinflation. Both APRV and biphasic, by preserving spontaneous breathing, will improve ventilation-perfusion matching and gas diffusion, improve the hemodynamic profile (less need for vasopressors, higher cardiac output, reduced ventricular workload, improved organ perfusion), and improve synchrony (decrease the work of breathing and the need for sedation).
Evidence of benefit of APRV and biphasic mode
APRV and biphasic are different modes. However studies evaluating their effects are combined. This is in part the result of the nomenclature confusion and different practice in different countries.36
Physiologic benefits. In studies, spontaneous breaths contributed to 10% to 40% of minute ventilation,37,38 improved ventilation of dependent areas of the lung, improved ventilation-perfusion match and recruitment,39 and improved hemodynamic profile.40
Patient comfort. These modes are thought to decrease the need for analgesia and sedation,38 but a recent trial showed no difference with pressure-controlled intermittent mandatory ventilation.41 Patient ventilator synchrony and comfort have not been studied.32,42
Outcomes. In small trials, these modes made no difference in terms of deaths, but they may decrease the length of mechanical ventilation.38,41,43,44
APRV and biphasic mode: Bottom line
Maintaining spontaneous breathing while on mechanical ventilation has hemodynamic and ventilatory benefits.
APRV and biphasic mode are not the same thing. APRV’s main goal is to maximize mean airway pressure and, hence, lung recruitment, whereas the main goal of the biphasic mode is synchrony.
There is a plethora of ventilator settings and questions related to physiologic effects.33,34,36
Although these modes are widely used in some centers, there is no evidence yet that they are superior to conventional volume- or pressure-control ventilation with low tidal volume for ARDS and acute lung injury. There is no conclusive evidence that these modes improve synchrony, time to weaning, or patient comfort.
HIGH-FREQUENCY OSCILLATORY VENTILATION
High-frequency oscillatory ventilation (HFOV) was first described and patented in 1952 by Emerson and was clinically developed in the early 1970s by Lunkenheimer.45
The goal of HFOV is to minimize lung injury; its characteristics (discussed below) make it useful in patients with severe ARDS. The US Food and Drug Administration approved it for infants in 1991 and for children in 1995. The adult model has been available since 1993, but it was not approved until 2001 (SensorMedics 3100B, Cardinal Health, Inc).
Other names for high-frequency oscillatory ventilation
While HFOV has no alternative names, the following acronyms describe similar modes:
- HFPPV (high-frequency positive pressure ventilation)
- HFJV (high-frequency jet ventilation)
- HFFI (high-frequency flow interruption)
- HFPV (high-frequency percussive ventilation)
- HFCWO (high-frequency chest wall oscillation).
All of these modes require different specialized ventilators.
What does high-frequency oscillatory ventilation do?
Conceptually, HFOV is a form of pressure-controlled intermittent mandatory ventilation with a set-point control scheme. In contrast to conventional pressure-controlled intermittent mandatory ventilation, in which relatively small spontaneous breaths may be superimposed on relatively large mandatory breaths, HFOV superimposes very small mandatory breaths (oscillations) on top of spontaneous breaths.
Adult patients are usually paralyzed or deeply sedated, since deep spontaneous breathing will trigger alarms and affect ventilator performance.
To manage ventilation (CO2 clearance), one or several of the following maneuvers can be done: decrease the oscillation frequency, increase the amplitude of the oscillations, increase the inspiratory time, or increase bias flow (while allowing an endotracheal tube cuff leak). Oxygenation adjustments are controlled by manipulating the mean airway pressure and the Fio2.
Ventilator settings in high-frequency oscillatory ventilation
Ventilator settings in HFOV are46:
- Airway pressure amplitude (delta P or power)
- Mean airway pressure
- Percent inspiration
- Inspiratory bias flow
- Fio2.
Clinical applications of high-frequency oscillatory ventilation
This mode is usually reserved for ARDS patients for whom conventional ventilation is failing. A recently published protocol46 suggests considering HFOV when there is oxygenation failure (Fio2 ≥ 0.7 and PEEP ≥ 14 cm H2O) or ventilation failure (pH < 7.25 with tidal volume ≥ 6 mL/kg predicted body weight and plateau airway pressure ≥ 30 cm H2O).
This mode is contraindicated when there is known severe airflow obstruction or intracranial hypertension.
Theoretical benefits of high-frequency oscillatory ventilation
Conceptually, HFOV can provide the highest mean airway pressure paired with the lowest tidal volume of any mode. These benefits might make HFOV the ideal lung-protective ventilation strategy.
Evidence of benefit of high-frequency oscillatory ventilation
Physiologic benefits. Animal models have shown less histologic damage and lung inflammation with HFOV than with high-tidal-volume conventional ventilation47,48 and low-tidal-volume conventional ventilation.49
Patient comfort has not been studied. However, current technology does impose undue work of breathing in spontaneously breathing patients.50
Outcomes. Several retrospective case series have described better oxygenation with HFOV as rescue therapy for severe ARDS than with conventional mechanical ventilation. Two randomized controlled trials have studied HFOV vs high-tidal-volume conventional mechanical ventilation for early severe ARDS; HFOV was safe but made no difference in terms of deaths.42,51–54
High-frequency oscillatory ventilation: Bottom line
In theory, HFOV provides all the benefits of an ideal lung-protective strategy, at least for paralyzed or deeply sedated patients. Animal studies support these concepts. In human adults, HFOV has been shown to be safe and to provide better oxygenation but no improvement in death rates compared with conventional mechanical ventilation. Currently, HFOV is better reserved for patients with severe ARDS for whom conventional mechanical ventilation is failing.
- Chatburn RL. Classification of ventilator modes: update and proposal for implementation. Respir Care 2007; 52:301–323.
- Chatburn RL. Computer control of mechanical ventilation. Respir Care 2004; 49:507–517.
- Alvarez A, Subirana M, Benito S. Decelerating flow ventilation effects in acute respiratory failure. J Crit Care 1998; 13:21–25.
- Guldager H, Nielsen SL, Carl P, Soerensen MB. A comparison of volume control and pressure regulated volume control ventilation in acute respiratory failure. Crit Care 1997; 1:75–77.
- Kallet RH, Campbell AR, Dicker RA, Katz JA, Mackersie RC. Work of breathing during lung protective ventilation in patients with acute lung injury and acute respiratory distress syndrome: a comparison between volume and pressure regulated breathing modes. Respir Care 2005; 50:1623–1631.
- Betensley AD, Khalid I, Crawford J, Pensler RA, DiGiovine B. Patient comfort during pressure support and volume controlled continuous mandatory ventilation. Respir Care 2008; 53:897–902.
- Branson RD, Chatburn RL. Controversies in the critical care setting. Should adaptive pressure control modes be utilized for virtually all patients receiving mechanical ventilation? Respir Care 2007; 52:478–485.
- Laubscher TP, Frutiger A, Fanconi S, Jutzi H, Brunner JX. Automatic selection of tidal volume, respiratory frequency and minute ventilation in intubated ICU patients as start up procedure for closed-loop controlled ventilation. Int J Clin Monit Comput 1994; 11:19–30.
- Laubscher TP, Heinrichs W, Weiler N, Hartmann G, Brunner JX. An adaptive lung ventilation controller. IEEE Trans Biomed Eng 1994; 41:51–59.
- Arnal JM, Wysocki M, Nafati C, et al. Automatic selection of breathing pattern using adaptive support ventilation. Intensive Care Med 2008; 34:75–81.
- Campbell RS, Sinamban RP, Johannigman JA, et al. Clinical evaluation of a new closed loop ventilation mode: adaptive supportive ventilation (ASV). Crit Care 1999; 3( suppl 1):083.
- Belliato M, Palo A, Pasero D, Iotti GA, Mojoli F, Braschi A. Evaluation of adaptive support ventilation in paralysed patients and in a physical lung model. Int J Artif Organs 2004; 27:709–716.
- Tassaux D, Dalmas E, Gratadour P, Jolliet P. Patient ventilator interactions during partial ventilatory support: a preliminary study comparing the effects of adaptive support ventilation with synchronized intermittent mandatory ventilation plus inspiratory pressure support. Crit Care Med 2002; 30:801–807.
- Gruber PC, Gomersall CD, Leung P, et al. Randomized controlled trial comparing adaptive-support ventilation with pressure-regulated volume-controlled ventilation with automode in weaning patients after cardiac surgery. Anesthesiology 2008; 109:81–87.
- Sulzer CF, Chiolero R, Chassot PG, et al. Adaptive support ventilation for fast tracheal extubation after cardiac surgery: a randomized controlled study. Anesthesiology 2001; 95:1339–1345.
- Petter AH, Chiolèro RL, Cassina T, Chassot PG, Müller XM, Revelly JP. Automatic “respirator/weaning” with adaptive support ventilation: the effect on duration of endotracheal intubation and patient management. Anesth Analg 2003; 97:1743–1750.
- Brunner JX, Iotti GA. Adaptive support ventilation (ASV). Minerva Anestesiol 2002; 68:365–368.
- Campbell RS, Branson RD, Johannigman JA. Adaptive support ventilation. Respir Care Clin North Am 2001; 7:425–440.
- Younes M. Proportional assist ventilation, a new approach to ventilatory support. Theory. Am Rev Respir Dis 1992; 145:114–120.
- Younes M, Puddy A, Roberts D, et al. Proportional assist ventilation. Results of an initial clinical trial. Am Rev Respir Dis 1992; 145:121–129.
- Kondili E, Prinianakis G, Alexopoulou C, Vakouti E, Klimathianaki M, Georgopoulos D. Respiratory load compensation during mechanical ventilatio—proportional assist ventilation with load-adjustable gain factors versus pressure support. Intensive Care Med 2006; 32:692–699.
- Kondili E, Prinianakis G, Alexopoulou C, Vakouti E, Klimathianaki M, Georgopoulos D. Effect of different levels of pressure support and proportional assist ventilation on breathing pattern, work of breathing and gas exchange in mechanically ventilated hypercapnic COPD patients with acute respiratory failure. Respiration 2003; 70:355–361.
- Grasso S, Puntillo F, Mascia L, et al. Compensation for increase in respiratory workload during mechanical ventilation. Pressure support versus proportional assist ventilation. Am J Respir Crit Care Med 2000; 161:819–826.
- Wrigge H, Golisch W, Zinserling J, Sydow M, Almeling G, Burchardi H. Proportional assist versus pressure support ventilation: effects on breathing pattern and respiratory work of patients with chronic obstructive pulmonary disease. Intensive Care Med 1999; 25:790–798.
- Ranieri VM, Giuliani R, Mascia L, et al. Patient ventilator interaction during acute hypercapnia: pressure support vs. proportional assist ventilation. J Appl Physiol 1996; 81:426–436.
- Kondili E, Xirouchaki N, Vaporidi K, Klimathianaki M, Georgopoulos D. Short-term cardiorespiratory effects of proportional assist and pressure support ventilation in patients with acute lung injury/acute respiratory distress syndrome. Anesthesiology 2006; 105:703–708.
- Xirouchaki N, Kondili E, Vaporidi K, et al. Proportional assist ventilation with load-adjustable gain factors in critically ill patients: comparison with pressure support. Intensive Care Med 2008; 34:2026–2034.
- Bosma K, Ferreyra G, Ambrogio C, et al. Patient ventilator interaction and sleep in mechanically ventilated patients: pressure support versus proportional assist ventilation. Crit Care Med 2007; 35:1048–1054.
- Sinderby C, Beck J. Proportional assist ventilation and neurally adjusted ventilatory assist—better approaches to patient ventilator synchrony? Clin Chest Med 2008; 29:329–342.
- Stock MC, Downs JB, Frolicher DA. Airway pressure release ventilation. Crit Care Med 1987; 15:462–466.
- Baum M, Benzer H, Putensen C, Koller W, Putz G. [Biphasic positive airway pressure (BIPAP)—a new form of augmented ventilation]. Anaesthesist 1989; 38:452–458.
- Seymour CW, Frazer M, Reilly PM, Fuchs BD. Airway pressure release and biphasic intermittent positive airway pressure ventilation: are they ready for prime time? J Trauma 2007; 62:1298–1308.
- Myers TR, MacIntyre NR. Respiratory controversies in the critical care setting. Does airway pressure release ventilation offer important new advantages in mechanical ventilator support? Respir Care 2007; 52:452–458.
- Neumann P, Golisch W, Strohmeyer A, Buscher H, Burchardi H, Sydow M. Influence of different release times on spontaneous breathing pattern during airway pressure release ventilation. Intensive Care Med 2002; 28:1742–1749.
- Calzia E, Lindner KH, Witt S, et al. Pressure-time product and work of breathing during biphasic continuous positive airway pressure and assisted spontaneous breathing. Am J Respir Crit Care Med 1994; 150:904–910.
- Rose L, Hawkins M. Airway pressure release ventilation and biphasic positive airway pressure: a systematic review of definitional criteria. Intensive Care Med 2008; 34:1766–1773.
- Sydow M, Burchardi H, Ephraim E, Zielmann S, Crozier TA. Longterm effects of two different ventilatory modes on oxygenation in acute lung injury. Comparison of airway pressure release ventilation and volume-controlled inverse ratio ventilation. Am J Respir Crit Care Med 1994; 149:1550–1556.
- Putensen C, Zech S, Wrigge H, et al. Long-term effects of spontaneous breathing during ventilatory support in patients with acute lung injury. Am J Respir Crit Care Med 2001; 164:43–49.
- Davis K, Johnson DJ, Branson RD, Campbell RS, Johannigman JA, Porembka D. Airway pressure release ventilation. Arch Surg 1993; 128:1348–1352.
- Kaplan LJ, Bailey H, Formosa V. Airway pressure release ventilation increases cardiac performance in patients with acute lung injury/adult respiratory distress syndrome. Crit Care 2001; 5:221–226.
- Varpula T, Valta P, Niemi R, Takkunen O, Hynynen M, Pettilä VV. Airway pressure release ventilation as a primary ventilatory mode in acute respiratory distress syndrome. Acta Anaesthesiol Scand 2004; 48:722–731.
- Siau C, Stewart TE. Current role of high frequency oscillatory ventilation and airway pressure release ventilation in acute lung injury and acute respiratory distress syndrome. Clin Chest Med 2008; 29:265–275.
- Rathgeber J, Schorn B, Falk V, Kazmaier S, Spiegel T, Burchardi H. The influence of controlled mandatory ventilation (CMV), intermittent mandatory ventilation (IMV) and biphasic intermittent positive airway pressure (BIPAP) on duration of intubation and consumption of analgesics and sedatives. A prospective analysis in 596 patients following adult cardiac surgery. Eur J Anaesthesiol 1997; 14:576–582.
- Habashi NM. Other approaches to open lung ventilation: airway pressure release ventilation. Crit Care Med 2005; 33 suppl 3:S228–S240.
- Hess D, Mason S, Branson R. High-frequency ventilation design and equipment issues. Respir Care Clin North Am 2001; 7:577–598.
- Fessler HE, Derdak S, Ferguson ND, et al. A protocol for high frequency oscillatory ventilation in adults: results from a roundtable discussion. Crit Care Med 2007; 35:1649–1654.
- Hamilton PP, Onayemi A, Smyth JA, et al. Comparison of conventional and high-frequency ventilation: oxygenation and lung pathology. J Appl Physiol 1983; 55:131–138.
- Sedeek KA, Takeuchi M, Suchodolski K, et al. Open-lung protective ventilation with pressure control ventilation, high-frequency oscillation, and intratracheal pulmonary ventilation results in similar gas exchange, hemodynamics, and lung mechanics. Anesthesiology 2003; 99:1102–1111.
- Imai Y, Nakagawa S, Ito Y, Kawano T, Slutsky AS, Miyasaka K. Comparison of lung protection strategies using conventional and high-frequency oscillatory ventilation. J Appl Physiol 2001; 91:1836–1844.
- van Heerde M, Roubik K, Kopelent V, Plötz FB, Markhorst DG. Unloading work of breathing during high-frequency oscillatory ventilation: a bench study. Crit Care 2006; 10:R103.
- Derdak S, Mehta S, Stewart TE, et al., Multicenter Oscillatory Ventilation For Acute Respiratory Distress Syndrome Trial (MOAT) Study Investigators. High-frequency oscillatory ventilation for acute respiratory distress syndrome in adults: a randomized, controlled trial. Am J Respir Crit Care Med 2002; 166:801–808.
- Bollen CW, van Well GT, Sherry T, et al. High-frequency oscillatory ventilation compared with conventional mechanical ventilation in adult respiratory distress syndrome: a randomized controlled trial [ISRCTN24242669]. Crit Care 2005; 9:R430–R439.
- Mehta S, Granton J, MacDonald RJ, et al. High frequency oscillatory ventilation in adults: the Toronto experience. Chest 2004; 126:518–527.
- Chan KP, Stewart TE, Mehta S. High-frequency oscillatory ventilation for adult patients with ARDS. Chest 2007; 131:1907–1916.
Technologic advances and computerized control of mechanical ventilators have made it possible to deliver ventilatory assistance in new modes. Driving these innovations is the desire to prevent ventilator-induced lung injury, improve patient comfort, and liberate the patient from mechanical ventilation as soon as possible.
We call these innovations “alternative” modes to differentiate them from the plain volume-control and pressure-control modes. Some clinicians rarely use these new modes, but in some medical centers they have become the most common ones used, or are being used unknowingly (the operator misunderstands the mode name). The information we provide on these modes of ventilation is by no means an endorsement of their use, but rather a tool to help the clinician understand their physiologic, theoretical, and clinical effects.
We focused on two goals:
- Explain what the mode does
- Briefly review the theoretical benefits and the actual evidence supporting these alternative modes of ventilation.
STANDARD NOMENCLATURE NEEDED
Since its invention, mechanical ventilation has been plagued by multiple names being used to describe the same things. For example, volume-control ventilation is also called volume-cycled ventilation, assist-control ventilation, volume-limited ventilation, and controlled mechanical ventilation. Similarly, multiple abbreviations are used, each depending on the brand of ventilator, and new acronyms have been added in recent years as new modes have been developed. The vast number of names and modes can confuse even the most seasoned critical care physician.
Efforts to establish a common nomenclature are under way.1
WHAT IS A MODE?
A mode of mechanical ventilation has three essential components:
- The control variable
- The breath sequence
- The targeting scheme.
Similar modes may require more detailed descriptions to distinguish them, but the basic function can be explained by these three components.
The control variable
In general, inspiration is an active process, driven by the patient’s effort, the ventilator, or both, while expiration is passive. For simplicity, in this article a mechanical breath means the inspiratory phase of the breath.
The machine can only control the volume (and flow) or the pressure given. The breaths can be further described on the basis of what triggers the breath, what limits it (the maximum value of a control variable), and what ends (cycles) it.
The breath sequence
There are three possible breath sequences:
- Intermittent mandatory ventilation, in which the patient can take spontaneous breaths between mandatory breaths
- Continuous spontaneous ventilation, in which all breaths are spontaneous (Table 1).
The targeting scheme
The targeting or feedback scheme refers to the ventilator settings and programming that dictate its response to the patient’s lung compliance, lung resistance, and respiratory effort. The regulation can be as simple as controlling the pressure in pressure-control mode, or it can be based on a complicated algorithm.
ADAPTIVE PRESSURE CONTROL
Other names for adaptive pressure control
- Pressure Regulated Volume Control (Maquet Servo-i, Rastatt, Germany)
- AutoFlow (Dräger Medical AG, Lübeck, Germany)
- Adaptive Pressure Ventilation (Hamilton Galileo, Hamilton Medical AG, Bonaduz, Switzerland)
- Volume Control+ (Puritan Bennett, Tyco Healthcare; Mansfield, MA)
- Volume Targeted Pressure Control, Pressure Controlled Volume Guaranteed (Engström, General Electric, Madison, WI).
What does adaptive pressure control do?
The APC mode delivers pressure-controlled breaths with an adaptive targeting scheme (Table 2).
In pressure-control ventilation, tidal volumes depend on the lung’s physiologic mechanics (compliance and resistance) and patient effort (Figure 1). Therefore, the tidal volume varies with changes in lung physiology (ie, larger or smaller tidal volumes than targeted).
To overcome this effect, a machine in APC mode adjusts the inspiratory pressure to deliver the set minimal target tidal volume. If tidal volume increases, the machine decreases the inspiratory pressure, and if tidal volume decreases, the machine increases the inspiratory pressure. However, if the patient effort is large enough, the tidal volume will increase in spite of decreasing the inspiratory pressure (Figure 2). The adjustments to the inspiratory pressure occur after the tidal volume is off-target in a number of breaths.
Common sources of confusion with adaptive pressure control
First, APC is not a volume-control mode. In volume control, the tidal volume does not change; in APC the tidal volume can increase or decrease, and the ventilator will adjust the inflation pressure to achieve the target volume. Thus, APC guarantees an average minimum tidal volume but not a maximum tidal volume.
Second, a characteristic of pressure control (and hence, APC) is that the flow of gas varies to maintain constant airway pressure (ie, maintain the set inspiratory pressure). This characteristic allows a patient who generates an inspiratory effort to receive flow as demanded, which is likely more comfortable. This is essentially different from volume control, in which flow is set by the operator and hence is fixed. Thus, if the patient effort is strong enough (Figure 1), this leads to what is called flow asynchrony, in which the patient does not get the flow asked for in a breath.
Ventilator settings in adaptive pressure control
Ventilator settings in APC are:
- Tidal volume
- Time spent in inspiration (inspiratory time)
- Frequency
- Fraction of inspired oxygen (Fio2)
- Positive end-expiratory pressure (PEEP).
Some ventilators also require setting the speed to reach the peak pressure (also known as slope percent or inspiratory rise time).
Clinical applications of adaptive pressure control
This mode is designed to maintain a consistent tidal volume during pressure-control ventilation and to promote inspiratory flow synchrony. It is a means of automatically reducing ventilatory support (ie, weaning) as the patient’s inspiratory effort becomes stronger, as in awakening from anesthesia.
APC may not be ideal for patients who have an inappropriately increased respiratory drive (eg, in severe metabolic acidosis), since the inspiratory pressure will decrease to maintain the targeted average tidal volume, inappropriately shifting the work of breathing onto the patient.
Theoretical benefits of adaptive pressure control
APC guarantees a minimum average tidal volume (unless the pressure alarm threshold is set too low, so that the target tidal volume is not delivered). Other theoretical benefits are flow synchrony, less ventilator manipulation by the operator, and automatic weaning of ventilator support.
Evidence of benefit of adaptive pressure control
Physiologic benefits. This mode has lower peak inspiratory pressures than does volume-control ventilation,3,4 which is often reported as a positive finding. However, in volume-control mode (the usual comparator), the peak inspiratory pressure is a manifestation of both resistance and compliance. Hence, peak inspiratory pressure is expected to be higher but does not reflect actual lung-distending pressures. It is the plateau pressure, a manifestation of lung compliance, that is related to lung injury.
Patient comfort. APC may increase the work of breathing when using low tidal volume ventilation and when there is increased respiratory effort (drive).5 Interestingly, APC was less comfortable than pressure support ventilation in a small trial.6
Outcomes have not been studied.7
Adaptive pressure control: Bottom line
APC is widely available and widely used, sometimes unknowingly (eg, if the operator thinks it is volume control). It is relatively easy to use and to set; however, evidence of its benefit is scant.
ADAPTIVE SUPPORT VENTILATION
Adaptive support ventilation (ASV) evolved as a form of mandatory minute ventilation implemented with adaptive pressure control. Mandatory minute ventilation is a mode that allows the operator to preset a target minute ventilation, and the ventilator then supplies mandatory breaths, either volume- or pressure-controlled, if the patient’s spontaneous breaths generate a lower minute ventilation.
ASV automatically selects the appropriate tidal volume and frequency for mandatory breaths and the appropriate tidal volume for spontaneous breaths on the basis of the respiratory system mechanics and target minute alveolar ventilation.
Described in 1994 by Laubscher et al,8,9 ASV became commercially available in 1998 in Europe and in 2007 in the United States (Hamilton Galileo ventilator, Hamilton Medical AG). This is the first commercially available ventilator that uses an “optimal” targeting scheme (see below).
What does adaptive support ventilation do?
ASV delivers pressure-controlled breaths using an adaptive (optimal) scheme (Table 2). “Optimal,” in this context, means minimizing the mechanical work of breathing: the machine selects a tidal volume and frequency that the patient’s brain would presumably select if the patient were not connected to a ventilator. This pattern is assumed to encourage the patient to generate spontaneous breaths.
The ventilator calculates the normal required minute ventilation based on the patient’s ideal weight and estimated dead space volume (ie, 2.2 mL/kg). This calculation represents 100% of minute ventilation. The clinician at the bedside sets a target percent of minute ventilation that the ventilator will support—higher than 100% if the patient has increased requirements due, eg, to sepsis or increased dead space, or less than 100% during weaning.
The ventilator initially delivers test breaths, in which it measures the expiratory time constant for the respiratory system and then uses this along with the estimated dead space and normal minute ventilation to calculate an optimal breathing frequency in terms of mechanical work.
The optimal or target tidal volume is calculated as the normal minute ventilation divided by the optimal frequency. The target tidal volume is achieved by the use of APC (see above) (Figure 2). This means that the pressure limit is automatically adjusted to achieve an average delivered tidal volume equal to the target. The ventilator continuously monitors the respiratory system mechanics and adjusts its settings accordingly.
The ventilator adjusts its breaths to avoid air trapping by allowing enough time to exhale, to avoid hypoventilation by delivering tidal volume greater than the dead space, and to avoid volutrauma by avoiding large tidal volumes.
Ventilator settings in adaptive support ventilation
Ventilator settings in ASV are:
- Patient height (to calculate the ideal body weight)
- Sex
- Percent of normal predicted minute ventilation goal
- Fio2
- PEEP.
Clinical applications of adaptive support ventilation
ASV is intended as a sole mode of ventilation, from initial support to weaning.
Theoretical benefits of adaptive support ventilation
In theory, ASV offers automatic selection of ventilator settings, automatic adaptation to changing patient lung mechanics, less need for human manipulation of the machine, improved synchrony, and automatic weaning.
Evidence of benefit of adaptive support ventilation
Physiologic benefits. Ventilator settings are adjusted automatically. ASV selects different tidal volume-respiratory rate combinations based on respiratory mechanics in passive and paralyzed patients.10–12 In actively breathing patients, there was no difference in the ventilator settings chosen by ASV for different clinical scenarios (and lung physiology).10 Compared with pressure-controlled intermittent mandatory ventilation, with ASV, the inspiratory load is less and patient-ventilator interaction is better.13
Patient-ventilator synchrony and comfort have not been studied.
Outcomes. Two trials suggest that ASV may decrease time on mechanical ventilation.14,15 However, in another trial,16 compared with a standard protocol, ASV led to fewer ventilator adjustments but achieved similar postsurgical weaning outcomes. The effect of this mode on the death rate has not been examined.17,18
Adaptive support ventilation: Bottom line
ASV is the first commercially available mode that automatically selects all the ventilator settings except PEEP and Fio2. These seem appropriate for different clinical scenarios in patients with poor respiratory effort or in paralyzed patients. Evidence of the effect in actively breathing patients and on outcomes such as length of stay or death is still lacking.
PROPORTIONAL ASSIST VENTILATION
Patients who have normal respiratory drive but who have difficulty sustaining adequate spontaneous ventilation are often subjected to pressure support ventilation (PSV), in which the ventilator generates a constant pressure throughout inspiration regardless of the intensity of the patient’s effort.
In 1992, Younes and colleagues19,20 developed proportional assist ventilation (PAV) as an alternative in which the ventilator generates pressure in proportion to the patient’s effort. PAV became commercially available in Europe in 1999 and was approved in the United States in 2006, available on the Puritan Bennett 840 ventilator (Puritan Bennett Co, Boulder, CO). PAV has also been used for noninvasive ventilation, but this is not available in the United States.
Other names for proportional assist ventilation
Proportional Pressure Support (Dräger Medical; not yet available in the United States).
What does proportional assist ventilation do?
This mode delivers pressure-controlled breaths with a servo control scheme (Table 2).
To better understand PAV, we can compare it with PSV. With PSV, the pressure applied by the ventilator rises to a preset level that is held constant (a set-point scheme) until a cycling criterion (a percent of the maximum inspiratory flow value) is reached. The inspiratory flow and tidal volume are the result of the patient’s inspiratory effort, the level of pressure applied, and the respiratory system mechanics.
In PAV, as in PSV, all breaths are spontaneous (Table 1). The patient controls the timing and size of the breath. There are no preset pressure, flow, or volume goals, but safety limits on the volume and pressure delivered can be set.
Ventilator settings in proportional assist ventilation
Ventilator settings in PAV are:
- Airway type (endotracheal tube, tracheostomy)
- Airway size (inner diameter)
- Percentage of work supported (assist range 5%–95%)
- Tidal volume limit
- Pressure limit
- Expiratory sensitivity (normally, as inspiration ends, flow should stop; this parameter tells the ventilator at what flow to end inspiration).
Caution when assessing the literature. Earlier ventilator versions, ie, Dräger and Manitoba (University of Manitoba, Winnipeg, MB, Canada), which are not available in the United States, required the repeated calculation of the respiratory system mechanics and the manual setting of flow and volume assists (amplification factors) independently. To overcome this limitation, new software automatically adjusts the flow and volume amplification to support the loads imposed by the automatically measured values of resistance and elastance (inverse of compliance) of the respiratory system.21 This software is included in the model (Puritan Bennett) available in the United States.
Clinical applications of proportional assist ventilation
The PAV mode is indicated for maximizing ventilator patient synchrony for assisted spontaneous ventilation.
PAV is contraindicated in patients with respiratory depression (bradypnea) or large air leaks (eg, bronchopleural fistulas). It should be used with caution in patients with severe hyperinflation, in which the patient may still be exhaling but the ventilator doesn’t recognize it. Another group in which PAV should be used with caution is those with high ventilatory drives, in which the ventilator overestimates respiratory system mechanics. This situation can lead to overassistance due to the “runaway phenomenon,” in which the ventilator continues to provide support even if the patient has stopped inspiration.22
Theoretical benefits of proportional assist ventilation
In theory, PAV should reduce the work of breathing, improve synchrony, automatically adapt to changing patient lung mechanics and effort, decrease the need for ventilator intervention and manipulation, decrease the need for sedation, and improve sleep.
Evidence of benefit of proportional assist ventilation
Physiologic benefits. PAV reduces the work of breathing better than PSV,21 even in the face of changing respiratory mechanics or increased respiratory demand (hypercapnia).23–25 The hemodynamic profile is similar to that in PSV. Tidal volumes are variable; however, in recent reports the tidal volumes were within the lung-protective range (6–8 mL/kg, plateau pressure < 30 cm H20).26,27
Comfort. PAV entails less patient effort and discomfort that PSV does.23,25 PAV significantly reduces asynchrony,27 which in turn may favorably affect sleep in critically ill patients. 28
Outcomes. The probability of spontaneous breathing without assistance was significantly better in critically ill patients ventilated with PAV than with PSV. No trial has reported the effect of PAV on deaths.27,29
Proportional assist ventilation: Bottom line
Extensive basic research has been done with PAV in different forms of respiratory failure, such as obstructive lung disease, acute respiratory distress syndrome (ARDS), and chronic respiratory failure. It fulfills its main goal, which is to improve patient-ventilator synchrony. Clinical experience with PAV in the United States is limited, as it was only recently approved.
AIRWAY PRESSURE-RELEASE VENTILATION AND BIPHASIC POSITIVE AIRWAY PRESSURE
Airway pressure-release ventilation (APRV) was described in 1987 by Stock et al30 as a mode for delivering ventilation in acute lung injury while avoiding high airway pressures. APRV combines high constant positive airway pressure (improving oxygenation and promoting alveolar recruitment) with intermittent releases (causing exhalation).
Other names for biphasic positive airway pressure
Other names for biphasic positive airway pressure are:
- BiLevel (Puritan Bennett)
- BIPAP (Dräger Europe)
- Bi Vent (Siemens)
- BiPhasic (Avea, Cardinal Health, Inc, Dublin, OH)
- PCV+ (Dräger Medical)
- DuoPAP (Hamilton).
Caution—name confusion. In North America, BiPAP (Respironics, Murrysville, PA) and BiLevel are used to refer to noninvasive modes of ventilation.
APRV has no other name.
What do these modes do?
These modes deliver pressure-controlled, time-triggered, and time-cycled breaths using a set-point targeting scheme (Table 2). This means that the ventilator maintains a constant pressure (set point) even in the face of spontaneous breaths.
Caution—source of confusion. The term continuous positive airway pressure (CPAP) is often used to describe this mode. However, CPAP is pressure that is applied continuously at the same level; the patient generates all the work to maintain ventilation (“pressure-controlled continuous spontaneous ventilation” in the current nomenclature). In APRV, the airway pressure is intermittently released and reapplied, generating a tidal volume that supports ventilation. In other words, this is a pressure-controlled breath with a very prolonged inspiratory time and a short expiratory time in which spontaneous ventilation is possible at any point (“pressure-controlled intermittent mandatory ventilation” in the current nomenclature).
How these modes are set in the ventilator may also be a source of confusion. To describe the time spent in high and low airway pressures, we use the terms Thigh and Tlow, respectively. By convention, the difference between APRV and biphasic mode is the duration of Tlow (< 1.5 sec for APRV).
Similarly, Phigh and Plow are used to describe the high and low airway pressure. To better understand this concept, you can create the same mode in conventional pressure-control ventilation by thinking of the Thigh as the inspiratory time, the Tlow as the expiratory time, the Phigh as inspiratory pressure, and the Plow as PEEP.
Hence, APRV is an extreme form of inverse ratio ventilation, with an inspiration-to-expiration ratio of 4:1. This means a patient spends most of the time in Phigh and Thigh, and exhalations are short (Tlow and Plow). In contrast, the biphasic mode uses conventional inspiration-expiration ratios (Figure 4).
As with any form of pressure control, the tidal volume is generated by airway pressure rising above baseline (ie, the end-expiratory value). Hence, to ensure an increase in minute ventilation, the mandatory breath rate must be increased (ie, decreasing Thigh, Tlow, or both) or the tidal volume must be increased (ie, increasing the difference between Phigh and Plow). This means that in APRV the Tlow has to happen more often (by increasing the number of breaths) or be more prolonged (allowing more air to exhale). Because unrestricted spontaneous breaths are permitted at any point of the cycle, the patient contributes to the total minute ventilation (usually 10%–40%).
In APRV and biphasic mode, the operator’s set time and pressure in inspiration and expiration will be delivered regardless of the patient’s breathing efforts—the patient’s spontaneous breath does not trigger a mechanical breath. Some ventilators have automatic adjustments to improve the trigger synchrony.
Ventilator settings in APRV and biphasic mode
These modes require the setting of two pressure levels (Phigh and Plow) and two time durations (Thigh and Tlow). One can add pressure support or automatic tube compensation to assist spontaneous breaths. The difference in Tlow generates differences in the Thigh:Tlow ratio: APRV has a short Tlow (an inspiration-expiration ratio of 4:1). Biphasic mode has a conventional inspiration-expiration ratio of 1:1 to 1:4.
Clinical applications
APRV is used in acute lung injury and ARDS. This mode should be used with caution or not at all in patients with obstructive lung disease or inappropriately increased respiratory drive.32–35
Biphasic mode is intended for both ventilation and weaning. In a patient who has poor respiratory effort or who is paralyzed, biphasic is identical to pressure-control/continuous mandatory ventilation.
Theoretical benefits of APRV and biphasic mode
Multiple benefits have been ascribed to these modes. In theory, APRV will maximize and maintain alveolar recruitment, improve oxygenation, lower inflation pressures, and decrease overinflation. Both APRV and biphasic, by preserving spontaneous breathing, will improve ventilation-perfusion matching and gas diffusion, improve the hemodynamic profile (less need for vasopressors, higher cardiac output, reduced ventricular workload, improved organ perfusion), and improve synchrony (decrease the work of breathing and the need for sedation).
Evidence of benefit of APRV and biphasic mode
APRV and biphasic are different modes. However studies evaluating their effects are combined. This is in part the result of the nomenclature confusion and different practice in different countries.36
Physiologic benefits. In studies, spontaneous breaths contributed to 10% to 40% of minute ventilation,37,38 improved ventilation of dependent areas of the lung, improved ventilation-perfusion match and recruitment,39 and improved hemodynamic profile.40
Patient comfort. These modes are thought to decrease the need for analgesia and sedation,38 but a recent trial showed no difference with pressure-controlled intermittent mandatory ventilation.41 Patient ventilator synchrony and comfort have not been studied.32,42
Outcomes. In small trials, these modes made no difference in terms of deaths, but they may decrease the length of mechanical ventilation.38,41,43,44
APRV and biphasic mode: Bottom line
Maintaining spontaneous breathing while on mechanical ventilation has hemodynamic and ventilatory benefits.
APRV and biphasic mode are not the same thing. APRV’s main goal is to maximize mean airway pressure and, hence, lung recruitment, whereas the main goal of the biphasic mode is synchrony.
There is a plethora of ventilator settings and questions related to physiologic effects.33,34,36
Although these modes are widely used in some centers, there is no evidence yet that they are superior to conventional volume- or pressure-control ventilation with low tidal volume for ARDS and acute lung injury. There is no conclusive evidence that these modes improve synchrony, time to weaning, or patient comfort.
HIGH-FREQUENCY OSCILLATORY VENTILATION
High-frequency oscillatory ventilation (HFOV) was first described and patented in 1952 by Emerson and was clinically developed in the early 1970s by Lunkenheimer.45
The goal of HFOV is to minimize lung injury; its characteristics (discussed below) make it useful in patients with severe ARDS. The US Food and Drug Administration approved it for infants in 1991 and for children in 1995. The adult model has been available since 1993, but it was not approved until 2001 (SensorMedics 3100B, Cardinal Health, Inc).
Other names for high-frequency oscillatory ventilation
While HFOV has no alternative names, the following acronyms describe similar modes:
- HFPPV (high-frequency positive pressure ventilation)
- HFJV (high-frequency jet ventilation)
- HFFI (high-frequency flow interruption)
- HFPV (high-frequency percussive ventilation)
- HFCWO (high-frequency chest wall oscillation).
All of these modes require different specialized ventilators.
What does high-frequency oscillatory ventilation do?
Conceptually, HFOV is a form of pressure-controlled intermittent mandatory ventilation with a set-point control scheme. In contrast to conventional pressure-controlled intermittent mandatory ventilation, in which relatively small spontaneous breaths may be superimposed on relatively large mandatory breaths, HFOV superimposes very small mandatory breaths (oscillations) on top of spontaneous breaths.
Adult patients are usually paralyzed or deeply sedated, since deep spontaneous breathing will trigger alarms and affect ventilator performance.
To manage ventilation (CO2 clearance), one or several of the following maneuvers can be done: decrease the oscillation frequency, increase the amplitude of the oscillations, increase the inspiratory time, or increase bias flow (while allowing an endotracheal tube cuff leak). Oxygenation adjustments are controlled by manipulating the mean airway pressure and the Fio2.
Ventilator settings in high-frequency oscillatory ventilation
Ventilator settings in HFOV are46:
- Airway pressure amplitude (delta P or power)
- Mean airway pressure
- Percent inspiration
- Inspiratory bias flow
- Fio2.
Clinical applications of high-frequency oscillatory ventilation
This mode is usually reserved for ARDS patients for whom conventional ventilation is failing. A recently published protocol46 suggests considering HFOV when there is oxygenation failure (Fio2 ≥ 0.7 and PEEP ≥ 14 cm H2O) or ventilation failure (pH < 7.25 with tidal volume ≥ 6 mL/kg predicted body weight and plateau airway pressure ≥ 30 cm H2O).
This mode is contraindicated when there is known severe airflow obstruction or intracranial hypertension.
Theoretical benefits of high-frequency oscillatory ventilation
Conceptually, HFOV can provide the highest mean airway pressure paired with the lowest tidal volume of any mode. These benefits might make HFOV the ideal lung-protective ventilation strategy.
Evidence of benefit of high-frequency oscillatory ventilation
Physiologic benefits. Animal models have shown less histologic damage and lung inflammation with HFOV than with high-tidal-volume conventional ventilation47,48 and low-tidal-volume conventional ventilation.49
Patient comfort has not been studied. However, current technology does impose undue work of breathing in spontaneously breathing patients.50
Outcomes. Several retrospective case series have described better oxygenation with HFOV as rescue therapy for severe ARDS than with conventional mechanical ventilation. Two randomized controlled trials have studied HFOV vs high-tidal-volume conventional mechanical ventilation for early severe ARDS; HFOV was safe but made no difference in terms of deaths.42,51–54
High-frequency oscillatory ventilation: Bottom line
In theory, HFOV provides all the benefits of an ideal lung-protective strategy, at least for paralyzed or deeply sedated patients. Animal studies support these concepts. In human adults, HFOV has been shown to be safe and to provide better oxygenation but no improvement in death rates compared with conventional mechanical ventilation. Currently, HFOV is better reserved for patients with severe ARDS for whom conventional mechanical ventilation is failing.
- Chatburn RL. Classification of ventilator modes: update and proposal for implementation. Respir Care 2007; 52:301–323.
- Chatburn RL. Computer control of mechanical ventilation. Respir Care 2004; 49:507–517.
- Alvarez A, Subirana M, Benito S. Decelerating flow ventilation effects in acute respiratory failure. J Crit Care 1998; 13:21–25.
- Guldager H, Nielsen SL, Carl P, Soerensen MB. A comparison of volume control and pressure regulated volume control ventilation in acute respiratory failure. Crit Care 1997; 1:75–77.
- Kallet RH, Campbell AR, Dicker RA, Katz JA, Mackersie RC. Work of breathing during lung protective ventilation in patients with acute lung injury and acute respiratory distress syndrome: a comparison between volume and pressure regulated breathing modes. Respir Care 2005; 50:1623–1631.
- Betensley AD, Khalid I, Crawford J, Pensler RA, DiGiovine B. Patient comfort during pressure support and volume controlled continuous mandatory ventilation. Respir Care 2008; 53:897–902.
- Branson RD, Chatburn RL. Controversies in the critical care setting. Should adaptive pressure control modes be utilized for virtually all patients receiving mechanical ventilation? Respir Care 2007; 52:478–485.
- Laubscher TP, Frutiger A, Fanconi S, Jutzi H, Brunner JX. Automatic selection of tidal volume, respiratory frequency and minute ventilation in intubated ICU patients as start up procedure for closed-loop controlled ventilation. Int J Clin Monit Comput 1994; 11:19–30.
- Laubscher TP, Heinrichs W, Weiler N, Hartmann G, Brunner JX. An adaptive lung ventilation controller. IEEE Trans Biomed Eng 1994; 41:51–59.
- Arnal JM, Wysocki M, Nafati C, et al. Automatic selection of breathing pattern using adaptive support ventilation. Intensive Care Med 2008; 34:75–81.
- Campbell RS, Sinamban RP, Johannigman JA, et al. Clinical evaluation of a new closed loop ventilation mode: adaptive supportive ventilation (ASV). Crit Care 1999; 3( suppl 1):083.
- Belliato M, Palo A, Pasero D, Iotti GA, Mojoli F, Braschi A. Evaluation of adaptive support ventilation in paralysed patients and in a physical lung model. Int J Artif Organs 2004; 27:709–716.
- Tassaux D, Dalmas E, Gratadour P, Jolliet P. Patient ventilator interactions during partial ventilatory support: a preliminary study comparing the effects of adaptive support ventilation with synchronized intermittent mandatory ventilation plus inspiratory pressure support. Crit Care Med 2002; 30:801–807.
- Gruber PC, Gomersall CD, Leung P, et al. Randomized controlled trial comparing adaptive-support ventilation with pressure-regulated volume-controlled ventilation with automode in weaning patients after cardiac surgery. Anesthesiology 2008; 109:81–87.
- Sulzer CF, Chiolero R, Chassot PG, et al. Adaptive support ventilation for fast tracheal extubation after cardiac surgery: a randomized controlled study. Anesthesiology 2001; 95:1339–1345.
- Petter AH, Chiolèro RL, Cassina T, Chassot PG, Müller XM, Revelly JP. Automatic “respirator/weaning” with adaptive support ventilation: the effect on duration of endotracheal intubation and patient management. Anesth Analg 2003; 97:1743–1750.
- Brunner JX, Iotti GA. Adaptive support ventilation (ASV). Minerva Anestesiol 2002; 68:365–368.
- Campbell RS, Branson RD, Johannigman JA. Adaptive support ventilation. Respir Care Clin North Am 2001; 7:425–440.
- Younes M. Proportional assist ventilation, a new approach to ventilatory support. Theory. Am Rev Respir Dis 1992; 145:114–120.
- Younes M, Puddy A, Roberts D, et al. Proportional assist ventilation. Results of an initial clinical trial. Am Rev Respir Dis 1992; 145:121–129.
- Kondili E, Prinianakis G, Alexopoulou C, Vakouti E, Klimathianaki M, Georgopoulos D. Respiratory load compensation during mechanical ventilatio—proportional assist ventilation with load-adjustable gain factors versus pressure support. Intensive Care Med 2006; 32:692–699.
- Kondili E, Prinianakis G, Alexopoulou C, Vakouti E, Klimathianaki M, Georgopoulos D. Effect of different levels of pressure support and proportional assist ventilation on breathing pattern, work of breathing and gas exchange in mechanically ventilated hypercapnic COPD patients with acute respiratory failure. Respiration 2003; 70:355–361.
- Grasso S, Puntillo F, Mascia L, et al. Compensation for increase in respiratory workload during mechanical ventilation. Pressure support versus proportional assist ventilation. Am J Respir Crit Care Med 2000; 161:819–826.
- Wrigge H, Golisch W, Zinserling J, Sydow M, Almeling G, Burchardi H. Proportional assist versus pressure support ventilation: effects on breathing pattern and respiratory work of patients with chronic obstructive pulmonary disease. Intensive Care Med 1999; 25:790–798.
- Ranieri VM, Giuliani R, Mascia L, et al. Patient ventilator interaction during acute hypercapnia: pressure support vs. proportional assist ventilation. J Appl Physiol 1996; 81:426–436.
- Kondili E, Xirouchaki N, Vaporidi K, Klimathianaki M, Georgopoulos D. Short-term cardiorespiratory effects of proportional assist and pressure support ventilation in patients with acute lung injury/acute respiratory distress syndrome. Anesthesiology 2006; 105:703–708.
- Xirouchaki N, Kondili E, Vaporidi K, et al. Proportional assist ventilation with load-adjustable gain factors in critically ill patients: comparison with pressure support. Intensive Care Med 2008; 34:2026–2034.
- Bosma K, Ferreyra G, Ambrogio C, et al. Patient ventilator interaction and sleep in mechanically ventilated patients: pressure support versus proportional assist ventilation. Crit Care Med 2007; 35:1048–1054.
- Sinderby C, Beck J. Proportional assist ventilation and neurally adjusted ventilatory assist—better approaches to patient ventilator synchrony? Clin Chest Med 2008; 29:329–342.
- Stock MC, Downs JB, Frolicher DA. Airway pressure release ventilation. Crit Care Med 1987; 15:462–466.
- Baum M, Benzer H, Putensen C, Koller W, Putz G. [Biphasic positive airway pressure (BIPAP)—a new form of augmented ventilation]. Anaesthesist 1989; 38:452–458.
- Seymour CW, Frazer M, Reilly PM, Fuchs BD. Airway pressure release and biphasic intermittent positive airway pressure ventilation: are they ready for prime time? J Trauma 2007; 62:1298–1308.
- Myers TR, MacIntyre NR. Respiratory controversies in the critical care setting. Does airway pressure release ventilation offer important new advantages in mechanical ventilator support? Respir Care 2007; 52:452–458.
- Neumann P, Golisch W, Strohmeyer A, Buscher H, Burchardi H, Sydow M. Influence of different release times on spontaneous breathing pattern during airway pressure release ventilation. Intensive Care Med 2002; 28:1742–1749.
- Calzia E, Lindner KH, Witt S, et al. Pressure-time product and work of breathing during biphasic continuous positive airway pressure and assisted spontaneous breathing. Am J Respir Crit Care Med 1994; 150:904–910.
- Rose L, Hawkins M. Airway pressure release ventilation and biphasic positive airway pressure: a systematic review of definitional criteria. Intensive Care Med 2008; 34:1766–1773.
- Sydow M, Burchardi H, Ephraim E, Zielmann S, Crozier TA. Longterm effects of two different ventilatory modes on oxygenation in acute lung injury. Comparison of airway pressure release ventilation and volume-controlled inverse ratio ventilation. Am J Respir Crit Care Med 1994; 149:1550–1556.
- Putensen C, Zech S, Wrigge H, et al. Long-term effects of spontaneous breathing during ventilatory support in patients with acute lung injury. Am J Respir Crit Care Med 2001; 164:43–49.
- Davis K, Johnson DJ, Branson RD, Campbell RS, Johannigman JA, Porembka D. Airway pressure release ventilation. Arch Surg 1993; 128:1348–1352.
- Kaplan LJ, Bailey H, Formosa V. Airway pressure release ventilation increases cardiac performance in patients with acute lung injury/adult respiratory distress syndrome. Crit Care 2001; 5:221–226.
- Varpula T, Valta P, Niemi R, Takkunen O, Hynynen M, Pettilä VV. Airway pressure release ventilation as a primary ventilatory mode in acute respiratory distress syndrome. Acta Anaesthesiol Scand 2004; 48:722–731.
- Siau C, Stewart TE. Current role of high frequency oscillatory ventilation and airway pressure release ventilation in acute lung injury and acute respiratory distress syndrome. Clin Chest Med 2008; 29:265–275.
- Rathgeber J, Schorn B, Falk V, Kazmaier S, Spiegel T, Burchardi H. The influence of controlled mandatory ventilation (CMV), intermittent mandatory ventilation (IMV) and biphasic intermittent positive airway pressure (BIPAP) on duration of intubation and consumption of analgesics and sedatives. A prospective analysis in 596 patients following adult cardiac surgery. Eur J Anaesthesiol 1997; 14:576–582.
- Habashi NM. Other approaches to open lung ventilation: airway pressure release ventilation. Crit Care Med 2005; 33 suppl 3:S228–S240.
- Hess D, Mason S, Branson R. High-frequency ventilation design and equipment issues. Respir Care Clin North Am 2001; 7:577–598.
- Fessler HE, Derdak S, Ferguson ND, et al. A protocol for high frequency oscillatory ventilation in adults: results from a roundtable discussion. Crit Care Med 2007; 35:1649–1654.
- Hamilton PP, Onayemi A, Smyth JA, et al. Comparison of conventional and high-frequency ventilation: oxygenation and lung pathology. J Appl Physiol 1983; 55:131–138.
- Sedeek KA, Takeuchi M, Suchodolski K, et al. Open-lung protective ventilation with pressure control ventilation, high-frequency oscillation, and intratracheal pulmonary ventilation results in similar gas exchange, hemodynamics, and lung mechanics. Anesthesiology 2003; 99:1102–1111.
- Imai Y, Nakagawa S, Ito Y, Kawano T, Slutsky AS, Miyasaka K. Comparison of lung protection strategies using conventional and high-frequency oscillatory ventilation. J Appl Physiol 2001; 91:1836–1844.
- van Heerde M, Roubik K, Kopelent V, Plötz FB, Markhorst DG. Unloading work of breathing during high-frequency oscillatory ventilation: a bench study. Crit Care 2006; 10:R103.
- Derdak S, Mehta S, Stewart TE, et al., Multicenter Oscillatory Ventilation For Acute Respiratory Distress Syndrome Trial (MOAT) Study Investigators. High-frequency oscillatory ventilation for acute respiratory distress syndrome in adults: a randomized, controlled trial. Am J Respir Crit Care Med 2002; 166:801–808.
- Bollen CW, van Well GT, Sherry T, et al. High-frequency oscillatory ventilation compared with conventional mechanical ventilation in adult respiratory distress syndrome: a randomized controlled trial [ISRCTN24242669]. Crit Care 2005; 9:R430–R439.
- Mehta S, Granton J, MacDonald RJ, et al. High frequency oscillatory ventilation in adults: the Toronto experience. Chest 2004; 126:518–527.
- Chan KP, Stewart TE, Mehta S. High-frequency oscillatory ventilation for adult patients with ARDS. Chest 2007; 131:1907–1916.
KEY POINTS
- The alternative modes of ventilation were developed to prevent lung injury and asynchrony, promote better oxygenation and faster weaning, and be easier to use. However, evidence of their benefit is scant.
- Until now, we have lacked a standard nomenclature for mechanical ventilation, leading to confusion.
- Regardless of the mode used, the goals are to avoid lung injury, keep the patient comfortable, and wean the patient from mechanical ventilation as soon as possible.
Accuracy of the physical examination in evaluating pleural effusion
In detecting and evaluating pleural effusion, technology has not replaced clinical skills. Yet, despite centuries of lore, data are limited on the role of the physical examination and on its accuracy compared with other noninvasive tests such as conventional chest radiography or ultrasonography.
The following is an overview of the value of the clinical history and physical examination in detecting pleural effusion and a brief review of the available information regarding its accuracy compared with other diagnostic methods.
POTENTIAL CAUSES ARE MANY
The pleurae consist of two membranes that protect the lungs, allow them to move, contribute to their shape, and prevent the alveoli at the pleural surface from becoming overdistended. Between the visceral pleura (covering the lung) and the parietal pleura (covering the diaphragm and the chest wall) is the pleural space.
In healthy adults, the pleural space contains an estimated 5 to 10 mL of pleural fluid (0.1 mg/kg body weight).1 Pleural effusion is an accumulation of an abnormal amount of fluid in the pleural space.
Although the potential causes are many, the most common are congestive heart failure, pneumonia (40% of patients hospitalized with pneumonia have pleural effusion),2,3 cancer, and pulmonary embolism.4
Because many diseases affecting different organs can cause a pleural effusion, we cannot overemphasize the importance of a thorough history and physical examination to uncover clues that will help identify its cause and narrow the diagnostic workup. For example, significant weight loss and cachexia could be due to cancer, and joint, skin, or eye symptoms could be due to a connective tissue disorder.
A thorough review of the patient’s medications is mandatory, since several medications (eg, amiodarone [Cordarone], methotrexate [Rheumatrex, Trexall], and nitrofurantoin [Macrobid]) can be associated with exudative effusions. In addition, the patient’s occupational history must be ascertained, since exposure to asbestos can raise the suspicion of a malignant disease of the pleura such as mesothelioma.
SYMPTOMS ARE NEITHER SENSITIVE NOR SPECIFIC
The symptoms of pleural effusion are neither sensitive nor specific, and many patients have manifestations of the underlying process but not of the effusion itself. The most common symptoms directly related to effusion are cough, dyspnea, and pleuritic chest pain.5
Cough. Many patients with a pleural effusion have a dry, nonproductive cough, a consequence of inflammation of the pleurae or compression of the bronchial walls. Although this symptom is rarely helpful in diagnosing a pleural effusion, if accompanied by purulent sputum it suggests pneumonia, and if complicated by hemoptysis it suggests cancer or pulmonary embolism.
Dyspnea is a consequence of a combination of a restrictive lung defect, a ventilation-perfusion mismatch, and a decrease in cardiac output. Although large pleural effusions reduce lung volume and are generally associated with dyspnea, the symptoms may be out of proportion to the size of the effusion, and patients with small to moderate effusions may also have shortness of breath if their baseline lung function is poor.2
Chest pain accompanying a pleural effusion suggests inflammation of the parietal pleura,6 but could be due to cancer in the chest wall and ribs—or to a benign disease of the thoracic wall such as rib fracture or costo-chondritis.
Pain of pleural origin can remain localized to the adjacent area of the chest, but sometimes it is referred to other areas. If the diaphragmatic pleura is involved, the pain is in many cases referred to the ipsilateral shoulder.5 Pain may also be referred to the abdomen.
Pleuritic chest pain is described as being worse with deep inspiration or when lying down. It is common in patients with pulmonary embolism, parapneumonic effusion, or viral pleurisy, but it can also occur in patients with pneumothorax or pericarditis. A dull, aching chest pain may be due to an underlying pleural malignancy.7
PHYSICAL EXAMINATION: LONG TRADITION, FEW DATA
Our knowledge of the role of physical examination in detecting pleural effusion is still based mostly on expert opinion and on small case series.8,9
Patterson et al11 prospectively compared physical examination (including auscultation, percussion, and tactile fremitus) with bedside ultrasonography and found that physical examination had a lower sensitivity (53% vs 80%, respectively) but a similar specificity (71%).
Bigger effusions are easier to detect
The physical findings are related to the volume of fluid in the pleural effusion and its effects on the chest wall, diaphragm, and lungs. Physical findings are generally normal if less than 300 mL of fluid is present, whereas large effusions (> 1,500 mL) can be associated with significant asymmetry of chest expansion and bulging of intercostal spaces.
Inspection
Although inspection of the chest is not very helpful in detecting a pleural effusion, it can provide other relevant information such as the respiratory rate and the breathing position adopted by the patient (patients with a large pleural effusion may have orthopnea); it can also reveal abnormalities in the shape of the thorax such as the increased anteroposterior diameter (“barrel shape”) seen in patients with chronic obstructive pulmonary disease.18
In addition, by inspection we can assess the expansion of the thorax. The utility of inspecting chest expansion to detect lung restriction was first noted by Laennec19 in 1821. A simple method of evaluating chest expansion is to place a measuring tape around the chest at the level of the nipples to compare the circumference at end-inspiration and at end-expiration.20 In the absence of emphysema, the difference should be at least 2 inches. An expansion of 1.5 inches or less is considered abnormal.21 More relevant to pleural effusion than the amount of overall chest expansion is whether the expansion is symmetrical, which we can assess by palpation.
Palpation
Signs of pleural effusion that can be detected by palpation include asymmetric chest expansion and asymmetric tactile fremitus.

Other signs. Palpation of the chest can also help in detecting underlying disease of the thorax sometimes associated with pleurisy or pleural effusions. Chest wall tumors or skin abscesses may be related to underlying empyema, localized tenderness may be associated with rib fractures or costochondritis, and crepitus may be due to subcutaneous emphysema.
Percussion
The chest can be percussed directly with the tips of the fingers of one hand or indirectly by placing a third finger against the surface to be percussed. There are two main techniques used to detect pleural effusions: comparative percussion and auscultatory percussion.
Since other conditions such as consolidation of the lung and atelectasis can also be associated with dullness to percussion, some authors advocate percussion in the lateral supine position to detect a shift in the dullness that would indicate movement of fluid in the chest.25
The sensitivity of comparative chest percussion and its accuracy related to the size of the effusion are unknown. Kalantri et al10 found that dullness to percussion had a positive predictive value of only 55% but a negative predictive value of 97%, suggesting that the absence of the sign is very helpful in ruling out an effusion.
According to classic textbook descriptions,26 percussive sounds penetrate a maximum of 6 cm (2 cm of body wall thickness and 4 cm of lung), and at least 500 mL of fluid must be present in order to be able to detect an effusion by physical examination.2,8 Most of these descriptions are based on original studies done in cadavers more than 100 years ago.
The auscultatory percussion technique was first described by Laennec and used to delineate the size of several organs by placing the stethoscope directly above the structure to be outlined, followed by percussion from the periphery towards the organ of interest. The original technique was subsequently modified for the examination of the chest by Guarino.27

Although auscultatory percussion was used initially to try to detect lung lesions, masses and consolidations, Guarino and Guarino12 found this technique to be highly effective in detecting pleural effusion. In a prospective blinded study in 118 patients, this method was highly (95%) sensitive and 100% specific in detecting pleural effusion, even in patients with obesity, pneumonia, or other pleural abnormalities. Of note, their findings suggested that auscultatory percussion can detect as little as 50 mL of pleural fluid.
Bohadana et al13 compared auscultatory and conventional percussion with chest radiographic findings in 281 patients. They found that auscultatory percussion was 100% sensitive for detecting large pleural effusions.
However, when Bourke et al14 compared conventional and auscultatory percussion in 21 patients with abnormal radiographs, both methods had low sensitivity (15.4% vs 19.2%) but high specificity (97.3% vs 85.1%, respectively). It is important to mention that in this series only a few patients had a pleural effusion.
McDermott et al16 compared conventional and auscultatory percussion in detecting pleural effusion in 14 hospitalized patients, using ultrasonography instead of chest radiography as the gold standard for comparison. The findings on auscultatory percussion correlated better with the findings on ultrasonography than did those on conventional percussion. The authors gave no information about sensitivity or specificity.
Kalantri et al10 found that auscultatory percussion had a sensitivity of 58% and a specificity of 85%.
Auscultation
Originally described by Laennec (who invented the stethoscope),19 auscultation is perhaps the physical examination technique most used to detect pleural effusion.
Lichtenstein et al15 performed a study of auscultation in critically ill patients and found it to have a very low sensitivity (42%) but a higher specificity (90%), with an overall diagnostic accuracy of 60%. Of note, compared with chest radiography, auscultatory findings had similar sensitivity but higher accuracy.
Absent or diminished breath sounds strongly suggest an effusion.19
Egophonism. Laennec also described egophonism as a pathognomonic sign associated with a moderate degree of effusion. The word egophony comes from the Greek “ego,” which means goat; it is used to describe the change in the pronounced sound of E to A. The mechanism responsible for finding this sign in massive pleural effusions is probably upward displacement and compression or consolidation of the lung at the top of the effusion.
However, if the effusion is small, the consolidation will not be large enough to produce this sign. Similarly, other lung conditions associated with large consolidations may produce egophonism without a pleural effusion. Little is known about the predictive value of this sign, and significant interob-server variability needs to be taken into account.28
Pleural rub. Pleural effusions that result from any disease that causes direct inflammation of the pleurae can be associated with a pleural rub. This sound, classically described as rubbing of unoiled leather, is pathognomonic of pleural disease but not of pleural effusion. In fact, a pleural rub will disappear once an effusion develops. Little is known about the accuracy of this finding; in the study by Kalantri et al it had a very low sensitivity (5%) but a very high specificity (99%).10 The differential diagnosis includes pleuritis, pneumonia, mesothelioma, and tumors that metastasize to the pleura.
- Noppen M, De Waele M, Li R, et al. Volume and cellular content of normal pleural fluid in humans examined by pleural lavage. Am J Respir Crit Care Med 2000; 162:1023–1026.
- Bouros D. Pleural Disease. New York: Marcel Dekker, 2004.
- Light RW. Parapneumonic effusions and empyema. Proc Am Thorac Soc 2006; 3:75–80.
- Light RW. Clinical practice. Pleural effusion. N Engl J Med 2002; 346:1971–1977.
- Light RW. Pleural Diseases, 5th ed. Philadelphia: Lippincott Williams & Wilkins, 2007.
- Moore KL, Dalley AF, Agur AMR. Clinically Oriented Anatomy. 5th ed. Philadelphia: Lippincott Williams & Wilkins, 2006.
- Marel M, Stastny B, Melinova L, Svandova E, Light RW. Diagnosis of pleural effusions. Experience with clinical studies, 1986 to 1990. Chest 1995; 107:1598–1603.
- Leopold SS, Hopkins HU. Leopold’s Principles and Methods of Physical Diagnosis, 3d ed. Philadelphia: W.B. Saunders, 1965.
- Norris GW, Landis HRM, Montgomery CM, Krumbhaar EB. Diseases of the Chest and the Principles of Physical Diagnosis, 4th ed, rev. Philadelphia, W.B. Saunders, 1929.
- Kalantri S, Joshi R, Lokhande T, et al. Accuracy and reliability of physical signs in the diagnosis of pleural effusion. Respir Med 2007; 101:431–438.
- Patterson LA, Costantino TG, Satz WA. Diagnosing pleural effusion: a prospective comparison of physical examination with bedside ultra-sonography [abstract]. Ann Emerg Med 2004; 44:S112.
- Guarino JR, Guarino JC. Auscultatory percussion: a simple method to detect pleural effusion. J Gen Intern Med 1994; 9:71–74.
- Bohadana AB, Coimbra FT, Santiago JR. Detection of lung abnormalities by auscultatory percussion: a comparative study with conventional percussion. Respiration 1986; 50:218–225.
- Bourke S, Nunes D, Stafford F, Hurley G, Graham I. Percussion of the chest re-visited: a comparison of the diagnostic value of auscultatory and conventional chest percussion. Ir J Med Sci 1989; 158:82–84.
- Lichtenstein D, Goldstein I, Mourgeon E, Cluzel P, Grenier P, Rouby JJ. Comparative diagnostic performances of auscultation, chest radiography, and lung ultrasonography in acute respiratory distress syndrome. Anesthesiology 2004; 100:9–15.
- McDermott TD, McCarthy M, Chestnut T, Schumann L. A comparison of conventional percussion and auscultation percussion in the detection of pleural effusions of hospitalized patients. J Am Acad Nurse Pract 1997; 9:483–486.
- Diacon AH, Brutsche MH, Soler M. Accuracy of pleural puncture sites: a prospective comparison of clinical examination with ultrasound. Chest 2003; 123:436–441.
- Pierce JA, Ebert RV. The barrel deformity of the chest, the senile lung and obstructive pulmonary emphysema. Am J Med 1958; 25:13–22.
- Laennec RTH. A Treatise On the Disease[s] of the Chest. New York: Library of the New York Academy of Medicine and Hafner Publishing Company, 1962.
- Bockenhauer SE, Chen H, Julliard KN, Weedon J. Measuring thoracic excursion: reliability of the cloth tape measure technique. J Am Osteopath Assoc 2007; 107:191–196.
- Fries JF. The reactive enthesopathies. Dis Mon 1985; 31 1:1–46.
- McGee SR. Evidence-based physical diagnosis. Philadelphia: W.B. Saunders, 2001.
- Auenbrugger L, Forbes J. On percussion of the chest: being a translation of Auenbrugger’s original treatise entitled “Inventum novum ex percussione thoracis humani, ut signo abstrusos interni pectoris morbos detegendi” (Vienna, 1761). Baltimore: The Johns Hopkins Press, 1936.
- Auenbrugger L, Neuburger M. Inventum Novum. London: Reprinted for Dawsons of Pall Mall, 1966.
- Gilbert VE. Shifting percussion dullness of the chest: a sign of pleural effusion. South Med J 1997; 90:1255–1256.
- Weil A. Handbuch und Atlas der topographischen Percussion nebst einer Darstellung der Lehre vom Percussionsschall. Leipzig: Vogel, 1880.
- Guarino JR. Auscultatory percussion, a new aid in the examination of the chest. J Kansas Med Soc 1974; 75:193–194.
- Sapira JD. About egophony. Chest 1995; 108:865–867.
In detecting and evaluating pleural effusion, technology has not replaced clinical skills. Yet, despite centuries of lore, data are limited on the role of the physical examination and on its accuracy compared with other noninvasive tests such as conventional chest radiography or ultrasonography.
The following is an overview of the value of the clinical history and physical examination in detecting pleural effusion and a brief review of the available information regarding its accuracy compared with other diagnostic methods.
POTENTIAL CAUSES ARE MANY
The pleurae consist of two membranes that protect the lungs, allow them to move, contribute to their shape, and prevent the alveoli at the pleural surface from becoming overdistended. Between the visceral pleura (covering the lung) and the parietal pleura (covering the diaphragm and the chest wall) is the pleural space.
In healthy adults, the pleural space contains an estimated 5 to 10 mL of pleural fluid (0.1 mg/kg body weight).1 Pleural effusion is an accumulation of an abnormal amount of fluid in the pleural space.
Although the potential causes are many, the most common are congestive heart failure, pneumonia (40% of patients hospitalized with pneumonia have pleural effusion),2,3 cancer, and pulmonary embolism.4
Because many diseases affecting different organs can cause a pleural effusion, we cannot overemphasize the importance of a thorough history and physical examination to uncover clues that will help identify its cause and narrow the diagnostic workup. For example, significant weight loss and cachexia could be due to cancer, and joint, skin, or eye symptoms could be due to a connective tissue disorder.
A thorough review of the patient’s medications is mandatory, since several medications (eg, amiodarone [Cordarone], methotrexate [Rheumatrex, Trexall], and nitrofurantoin [Macrobid]) can be associated with exudative effusions. In addition, the patient’s occupational history must be ascertained, since exposure to asbestos can raise the suspicion of a malignant disease of the pleura such as mesothelioma.
SYMPTOMS ARE NEITHER SENSITIVE NOR SPECIFIC
The symptoms of pleural effusion are neither sensitive nor specific, and many patients have manifestations of the underlying process but not of the effusion itself. The most common symptoms directly related to effusion are cough, dyspnea, and pleuritic chest pain.5
Cough. Many patients with a pleural effusion have a dry, nonproductive cough, a consequence of inflammation of the pleurae or compression of the bronchial walls. Although this symptom is rarely helpful in diagnosing a pleural effusion, if accompanied by purulent sputum it suggests pneumonia, and if complicated by hemoptysis it suggests cancer or pulmonary embolism.
Dyspnea is a consequence of a combination of a restrictive lung defect, a ventilation-perfusion mismatch, and a decrease in cardiac output. Although large pleural effusions reduce lung volume and are generally associated with dyspnea, the symptoms may be out of proportion to the size of the effusion, and patients with small to moderate effusions may also have shortness of breath if their baseline lung function is poor.2
Chest pain accompanying a pleural effusion suggests inflammation of the parietal pleura,6 but could be due to cancer in the chest wall and ribs—or to a benign disease of the thoracic wall such as rib fracture or costo-chondritis.
Pain of pleural origin can remain localized to the adjacent area of the chest, but sometimes it is referred to other areas. If the diaphragmatic pleura is involved, the pain is in many cases referred to the ipsilateral shoulder.5 Pain may also be referred to the abdomen.
Pleuritic chest pain is described as being worse with deep inspiration or when lying down. It is common in patients with pulmonary embolism, parapneumonic effusion, or viral pleurisy, but it can also occur in patients with pneumothorax or pericarditis. A dull, aching chest pain may be due to an underlying pleural malignancy.7
PHYSICAL EXAMINATION: LONG TRADITION, FEW DATA
Our knowledge of the role of physical examination in detecting pleural effusion is still based mostly on expert opinion and on small case series.8,9
Patterson et al11 prospectively compared physical examination (including auscultation, percussion, and tactile fremitus) with bedside ultrasonography and found that physical examination had a lower sensitivity (53% vs 80%, respectively) but a similar specificity (71%).
Bigger effusions are easier to detect
The physical findings are related to the volume of fluid in the pleural effusion and its effects on the chest wall, diaphragm, and lungs. Physical findings are generally normal if less than 300 mL of fluid is present, whereas large effusions (> 1,500 mL) can be associated with significant asymmetry of chest expansion and bulging of intercostal spaces.
Inspection
Although inspection of the chest is not very helpful in detecting a pleural effusion, it can provide other relevant information such as the respiratory rate and the breathing position adopted by the patient (patients with a large pleural effusion may have orthopnea); it can also reveal abnormalities in the shape of the thorax such as the increased anteroposterior diameter (“barrel shape”) seen in patients with chronic obstructive pulmonary disease.18
In addition, by inspection we can assess the expansion of the thorax. The utility of inspecting chest expansion to detect lung restriction was first noted by Laennec19 in 1821. A simple method of evaluating chest expansion is to place a measuring tape around the chest at the level of the nipples to compare the circumference at end-inspiration and at end-expiration.20 In the absence of emphysema, the difference should be at least 2 inches. An expansion of 1.5 inches or less is considered abnormal.21 More relevant to pleural effusion than the amount of overall chest expansion is whether the expansion is symmetrical, which we can assess by palpation.
Palpation
Signs of pleural effusion that can be detected by palpation include asymmetric chest expansion and asymmetric tactile fremitus.
Other signs. Palpation of the chest can also help in detecting underlying disease of the thorax sometimes associated with pleurisy or pleural effusions. Chest wall tumors or skin abscesses may be related to underlying empyema, localized tenderness may be associated with rib fractures or costochondritis, and crepitus may be due to subcutaneous emphysema.
Percussion
The chest can be percussed directly with the tips of the fingers of one hand or indirectly by placing a third finger against the surface to be percussed. There are two main techniques used to detect pleural effusions: comparative percussion and auscultatory percussion.
Since other conditions such as consolidation of the lung and atelectasis can also be associated with dullness to percussion, some authors advocate percussion in the lateral supine position to detect a shift in the dullness that would indicate movement of fluid in the chest.25
The sensitivity of comparative chest percussion and its accuracy related to the size of the effusion are unknown. Kalantri et al10 found that dullness to percussion had a positive predictive value of only 55% but a negative predictive value of 97%, suggesting that the absence of the sign is very helpful in ruling out an effusion.
According to classic textbook descriptions,26 percussive sounds penetrate a maximum of 6 cm (2 cm of body wall thickness and 4 cm of lung), and at least 500 mL of fluid must be present in order to be able to detect an effusion by physical examination.2,8 Most of these descriptions are based on original studies done in cadavers more than 100 years ago.
The auscultatory percussion technique was first described by Laennec and used to delineate the size of several organs by placing the stethoscope directly above the structure to be outlined, followed by percussion from the periphery towards the organ of interest. The original technique was subsequently modified for the examination of the chest by Guarino.27
Although auscultatory percussion was used initially to try to detect lung lesions, masses and consolidations, Guarino and Guarino12 found this technique to be highly effective in detecting pleural effusion. In a prospective blinded study in 118 patients, this method was highly (95%) sensitive and 100% specific in detecting pleural effusion, even in patients with obesity, pneumonia, or other pleural abnormalities. Of note, their findings suggested that auscultatory percussion can detect as little as 50 mL of pleural fluid.
Bohadana et al13 compared auscultatory and conventional percussion with chest radiographic findings in 281 patients. They found that auscultatory percussion was 100% sensitive for detecting large pleural effusions.
However, when Bourke et al14 compared conventional and auscultatory percussion in 21 patients with abnormal radiographs, both methods had low sensitivity (15.4% vs 19.2%) but high specificity (97.3% vs 85.1%, respectively). It is important to mention that in this series only a few patients had a pleural effusion.
McDermott et al16 compared conventional and auscultatory percussion in detecting pleural effusion in 14 hospitalized patients, using ultrasonography instead of chest radiography as the gold standard for comparison. The findings on auscultatory percussion correlated better with the findings on ultrasonography than did those on conventional percussion. The authors gave no information about sensitivity or specificity.
Kalantri et al10 found that auscultatory percussion had a sensitivity of 58% and a specificity of 85%.
Auscultation
Originally described by Laennec (who invented the stethoscope),19 auscultation is perhaps the physical examination technique most used to detect pleural effusion.
Lichtenstein et al15 performed a study of auscultation in critically ill patients and found it to have a very low sensitivity (42%) but a higher specificity (90%), with an overall diagnostic accuracy of 60%. Of note, compared with chest radiography, auscultatory findings had similar sensitivity but higher accuracy.
Absent or diminished breath sounds strongly suggest an effusion.19
Egophonism. Laennec also described egophonism as a pathognomonic sign associated with a moderate degree of effusion. The word egophony comes from the Greek “ego,” which means goat; it is used to describe the change in the pronounced sound of E to A. The mechanism responsible for finding this sign in massive pleural effusions is probably upward displacement and compression or consolidation of the lung at the top of the effusion.
However, if the effusion is small, the consolidation will not be large enough to produce this sign. Similarly, other lung conditions associated with large consolidations may produce egophonism without a pleural effusion. Little is known about the predictive value of this sign, and significant interob-server variability needs to be taken into account.28
Pleural rub. Pleural effusions that result from any disease that causes direct inflammation of the pleurae can be associated with a pleural rub. This sound, classically described as rubbing of unoiled leather, is pathognomonic of pleural disease but not of pleural effusion. In fact, a pleural rub will disappear once an effusion develops. Little is known about the accuracy of this finding; in the study by Kalantri et al it had a very low sensitivity (5%) but a very high specificity (99%).10 The differential diagnosis includes pleuritis, pneumonia, mesothelioma, and tumors that metastasize to the pleura.
- Noppen M, De Waele M, Li R, et al. Volume and cellular content of normal pleural fluid in humans examined by pleural lavage. Am J Respir Crit Care Med 2000; 162:1023–1026.
- Bouros D. Pleural Disease. New York: Marcel Dekker, 2004.
- Light RW. Parapneumonic effusions and empyema. Proc Am Thorac Soc 2006; 3:75–80.
- Light RW. Clinical practice. Pleural effusion. N Engl J Med 2002; 346:1971–1977.
- Light RW. Pleural Diseases, 5th ed. Philadelphia: Lippincott Williams & Wilkins, 2007.
- Moore KL, Dalley AF, Agur AMR. Clinically Oriented Anatomy. 5th ed. Philadelphia: Lippincott Williams & Wilkins, 2006.
- Marel M, Stastny B, Melinova L, Svandova E, Light RW. Diagnosis of pleural effusions. Experience with clinical studies, 1986 to 1990. Chest 1995; 107:1598–1603.
- Leopold SS, Hopkins HU. Leopold’s Principles and Methods of Physical Diagnosis, 3d ed. Philadelphia: W.B. Saunders, 1965.
- Norris GW, Landis HRM, Montgomery CM, Krumbhaar EB. Diseases of the Chest and the Principles of Physical Diagnosis, 4th ed, rev. Philadelphia, W.B. Saunders, 1929.
- Kalantri S, Joshi R, Lokhande T, et al. Accuracy and reliability of physical signs in the diagnosis of pleural effusion. Respir Med 2007; 101:431–438.
- Patterson LA, Costantino TG, Satz WA. Diagnosing pleural effusion: a prospective comparison of physical examination with bedside ultra-sonography [abstract]. Ann Emerg Med 2004; 44:S112.
- Guarino JR, Guarino JC. Auscultatory percussion: a simple method to detect pleural effusion. J Gen Intern Med 1994; 9:71–74.
- Bohadana AB, Coimbra FT, Santiago JR. Detection of lung abnormalities by auscultatory percussion: a comparative study with conventional percussion. Respiration 1986; 50:218–225.
- Bourke S, Nunes D, Stafford F, Hurley G, Graham I. Percussion of the chest re-visited: a comparison of the diagnostic value of auscultatory and conventional chest percussion. Ir J Med Sci 1989; 158:82–84.
- Lichtenstein D, Goldstein I, Mourgeon E, Cluzel P, Grenier P, Rouby JJ. Comparative diagnostic performances of auscultation, chest radiography, and lung ultrasonography in acute respiratory distress syndrome. Anesthesiology 2004; 100:9–15.
- McDermott TD, McCarthy M, Chestnut T, Schumann L. A comparison of conventional percussion and auscultation percussion in the detection of pleural effusions of hospitalized patients. J Am Acad Nurse Pract 1997; 9:483–486.
- Diacon AH, Brutsche MH, Soler M. Accuracy of pleural puncture sites: a prospective comparison of clinical examination with ultrasound. Chest 2003; 123:436–441.
- Pierce JA, Ebert RV. The barrel deformity of the chest, the senile lung and obstructive pulmonary emphysema. Am J Med 1958; 25:13–22.
- Laennec RTH. A Treatise On the Disease[s] of the Chest. New York: Library of the New York Academy of Medicine and Hafner Publishing Company, 1962.
- Bockenhauer SE, Chen H, Julliard KN, Weedon J. Measuring thoracic excursion: reliability of the cloth tape measure technique. J Am Osteopath Assoc 2007; 107:191–196.
- Fries JF. The reactive enthesopathies. Dis Mon 1985; 31 1:1–46.
- McGee SR. Evidence-based physical diagnosis. Philadelphia: W.B. Saunders, 2001.
- Auenbrugger L, Forbes J. On percussion of the chest: being a translation of Auenbrugger’s original treatise entitled “Inventum novum ex percussione thoracis humani, ut signo abstrusos interni pectoris morbos detegendi” (Vienna, 1761). Baltimore: The Johns Hopkins Press, 1936.
- Auenbrugger L, Neuburger M. Inventum Novum. London: Reprinted for Dawsons of Pall Mall, 1966.
- Gilbert VE. Shifting percussion dullness of the chest: a sign of pleural effusion. South Med J 1997; 90:1255–1256.
- Weil A. Handbuch und Atlas der topographischen Percussion nebst einer Darstellung der Lehre vom Percussionsschall. Leipzig: Vogel, 1880.
- Guarino JR. Auscultatory percussion, a new aid in the examination of the chest. J Kansas Med Soc 1974; 75:193–194.
- Sapira JD. About egophony. Chest 1995; 108:865–867.
KEY POINTS
- The potential causes of pleural effusion are many and include congestive heart failure, pneumonia, cancer, and pulmonary embolism.
- Cardinal symptoms of pleural effusion are cough, chest pain, and dyspnea, but these are not very sensitive or specific.
- Common signs of pleural effusion are asymmetric chest expansion, asymmetric tactile fremitus, dullness to percussion, absent or diminished breath sounds, and rubs. The larger the effusion, the more sensitive these signs are.
- Some have advocated auscultatory percussion (tapping on the manubrium while listening on the patient’s back) as being more sensitive than conventional percussion for detecting the dullness to percussion of pleural effusion.