Opinion
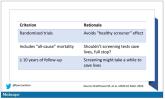
Really? Cancer screening doesn’t save lives?
The screening tests are unlikely to help most people because most people will not die of the particular type of cancer being screened for. But it...
News
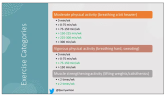
On the best way to exercise
If you are going to get activity, push on the vigorous activity if you’re physically able to do it. And of course, layering in the muscle-...
Opinion
A new and completely different pain medicine
Patients assigned to the highest dose of VX-548 had a statistically significant lower cumulative amount of pain in the 48 hours after surgery.
Opinion
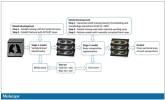
What AI can see in CT scans that humans can’t
This is a space where AI can make some massive gains – not by trying to do radiologists’ jobs better than radiologists, but by extracting...
Opinion
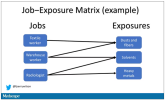
The surprising occupations with higher-than-expected ovarian cancer rates
This is how these types of studies work; they tend to raise more questions than they answer.
Opinion
The most important question in medicine
“What else could this be?”
Opinion
The cardiopulmonary effects of mask wearing
Clearly, this study lets us conclude that mask wearing at rest has less of an effect than mask wearing during exercise. But remember that, in...
Opinion
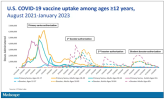
COVID boosters effective, but not for long
The question is: Does receipt of a bivalent COVID vaccine booster prevent hospitalizations, ICU stay, or death?
Opinion
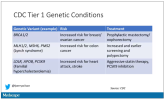
The 30th-birthday gift that could save a life
Imagine a future when, at 30, you get your genome sequenced and doctors tell you what needs to be done to save your life.
Opinion
Surprising brain activity moments before death
The electrical patterns of the brains in these patients looked very similar to the patterns seen in dreaming humans, as well as in patients with...
Opinion

Autism: Is it in the water?
The results show a rather steady and consistent association between higher lithium levels in groundwater and the prevalence of ASD in children.
Opinion
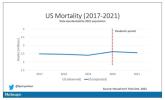
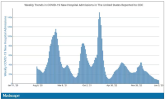
‘Excess’ deaths surging, but why?
‘The excess death gap between the United States and Western Europe has never been higher,’ according to a new study.
Opinion

Celebrity death finally solved – with locks of hair
Case: A 56-year-old musician presents with diffuse abdominal pain, cramping, and jaundice. His medical history is notable for years of diffuse...
Opinion
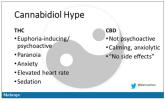
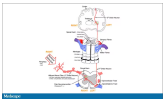
Joint effort: CBD not just innocent bystander in weed
‘I visited a legal cannabis dispensary in Massachusetts a few years ago, mostly to see what the hype was about.’
Opinion
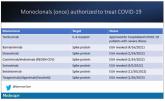
A new (old) drug joins the COVID fray, and guess what? It works
Part of the reason the monoclonals have failed lately is because of their specificity.