User login
Things We Do For No Reason: Blood Cultures for Uncomplicated Skin and Soft Tissue Infections in Children
The “Things We Do for No Reason” (TWDFNR) series reviews practices that have become common parts of hospital care but may provide little value to our patients. Practices reviewed in the TWDFNR series do not represent “black and white” conclusions or clinical practice standards but are meant as a starting place for research and active discussions among hospitalists and patients. We invite you to be part of that discussion. https://www.choosingwisely.org/

CLINICAL SCENARIO
An 8-year-old previously healthy girl presented to the emergency department (ED) with 2 days of warmth, swelling, and pain over her right upper thigh. Three days prior before presentation, a “pimple” appeared on her leg and drained a small amount of pus. Over the next 24 hours, the lesion became swollen, red, and painful. Her pediatrician prescribed trimethoprim-sulfamethoxazole. The patient took 3 doses of this medication but still experienced worsening pain and swelling.
In the ED, she had normal vital signs for her age except for temperature of 100.8 °F. A 2 cm × 3 cm area of fluctuance, erythema, and warmth was noted, and bedside ultrasound demonstrated a simple fluid collection. Incision and drainage was performed with expression of several milliliters of pus. The patient was referred for admission due to worsening symptoms despite outpatient antibiotic therapy. The ED providers ordered a blood culture at the time of admission.
BACKGROUND
Skin and soft tissue infections (SSTIs) are common pediatric diagnoses, which account for an estimated 390,000 ED visits annually1 and represent the 7th most common reason for pediatric hospital admission in the United States.2 The rates of SSTIs have increased over the past several decades partly due to the rise of methicillin-resistant Staphylococcus aureus (MRSA).3
Why You Might Think Blood Cultures are Helpful In Children with SSTIs?
Prior to the introduction of the Haemophilus influenzae vaccine, the rates of SSTI-associated bacteremia ranged from 8% to 20%.4,5 Although the rate of bacteremia has declined significantly, blood cultures are still commonly performed as part of the evaluation of uncomplicated SSTIs in children; studies have shown that blood culture rates are 46% in the combined outpatient/inpatient setting,6 34% in the ED setting,7 and 47%-94% in the inpatient setting.7-11 Clinicians still feel that bacteremia detection is important to guide the selection of antibiotics and treatment duration. Providers may also underestimate the risk of obtaining a contaminant result and associated charges. Lastly, clinicians may perform blood cultures due to cultural norms at their institution.
Why Blood Cultures are Unnecessary in Children with Uncomplicated SSTIs
Several decades into the post vaccine era, the current guidelines from the Infectious Diseases Society of America (IDSA) do not recommend blood cultures as part of the routine evaluation of uncomplicated SSTIs.12 Multiple single-center studies have failed to demonstrate the benefits of obtaining blood cultures in pediatric patients with uncomplicated SSTIs in the post-H. influenzae vaccine era.6–11
Sadow et al11 performed a retrospective case series of 381 children hospitalized with cellulitis to determine the rate and yield of blood cultures. Of the 266 (70%) patients who had a blood culture performed, 5 (1.9%) were true positives and 13 (5.4%) were contaminants. Notably, the true positive results included 3 children with active varicella infection and 2 children with septic joints; the latter would qualify as a complicated SSTI or as a separate infectious process altogether. No significant change in management resulted the positive blood cultures.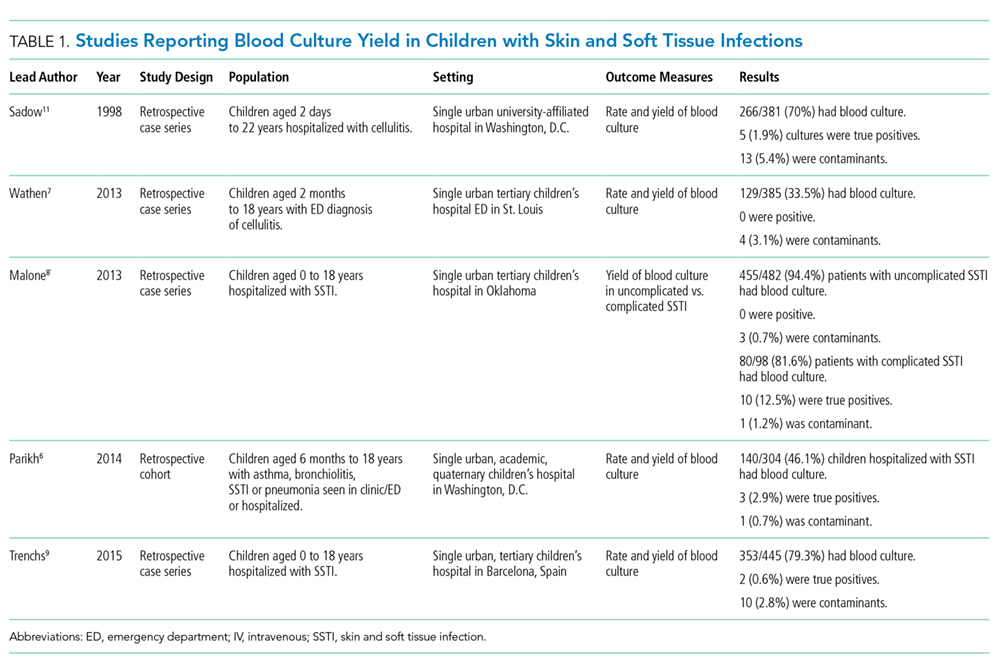
Wathen et al7 conducted a similar retrospective case series of 385 children with cellulitis who presented to the ED of a single tertiary-care children’s hospital to determine the rate and yield of blood cultures. Of the 129 (33.5%) blood cultures performed, there were no true positives and 4 (3.1%) contaminants. Obtaining a blood culture was also associated with high rates of ordering complete blood count and hospitalization.
Malone et al8 performed a retrospective case series of 580 children hospitalized with an SSTI at a single children’s hospital to determine the yield of blood cultures for uncomplicated versus complicated SSTIs. Of the 482 patients with uncomplicated SSTIs, 455 (94.4%) had a blood culture, with no true positive cultures and 3 (0.7%) contaminants. Obtaining a blood culture in this study was associated with an almost 1 day increase in length of stay (LOS; mean LOS 3.24 vs 2.33 days, P = .04).
Parikh et al6 conducted a retrospective cohort study of 304 children with SSTIs in both inpatient and outpatient settings to determine the yield and rate of blood cultures. Of this group, 140 (46.1%) patients had a blood culture performed, of which there were 3 (2.9%) true positives and 1 (0.7%) contaminant. True-positive bacteria included MRSA and Streptococcus pyogenes, neither of which was associated with a change in antibiotic regimen or increase in hospital LOS. The total charges associated with the original 140 blood cultures were estimated to be $42,450 annually in the authors’ institution.
Lastly, Trenchs et al9 performed a retrospective case series of 445 children hospitalized with SSTI in a Spanish children’s hospital and found 353 (79.3%) blood cultures with 2 (0.6%) true positives and 10 (2.8%) contaminants. Methicillin-sensitive Staphylococcus aureus (MSSA) and S. pyogenes were the sole true-positive bacteria, and no change in management was reported. Obtaining blood cultures was associated with an increased hospital LOS (median LOS 4 vs. 3 days, P
Across these studies, the reported rates of true-positive blood cultures ranged from 0%-2.9%. Of the 1997 patients included in the studies, only 10 (0.5%) had true-positive blood cultures. This rate decreased to 0.4% if the 2 patients with septic arthritis from the study of Sadow et al were excluded. Isolated organisms included MRSA, MSSA, S. pyogenes, and Streptococcus pneumoniae. No unusual organisms were isolated in uncomplicated SSTIs, and the true-positive results were not associated with any reported change in antibiotic management.6–9,11 False-positive blood culture results were found in 0%-5.4% of patients,6–9,11 accounting for 30 patients or 1.5% of the total patients.
Harms Associated With Unnecessary Blood Cultures in SSTIs
Blood cultures necessitate venipunctures, which are painful for children and families. The inevitable false-positive contaminants also lead to repeat venipunctures and, potentially, unnecessary antibiotic exposure. From a high-value care perspective, Parikh et al reported hospital charges of $300 per blood culture and $250 for identification and sensitivity of positives.6 Assuming that these single-center charges are representative of national charges and using 0.5% true positivity and 1.5% false positivity rates, subjecting all children with uncomplicated SSTIs to blood culture would result in $60,250 charges to find one true positive blood culture, with no resultant changes in management. Additionally, among the 200 children cultured to find one true positive, there would be 3 false positives, necessitating another $1650 in charges for identification, sensitivity analysis, and repeat culture. These amounts do not factor in the significant expenditures associated with increased LOS. The potential savings associated with forgoing blood cultures in children with SSTIs should be an incentive for institutional change.
When Blood Cultures May Be Reasonable
The current IDSA guidelines recommend blood cultures for SSTIs in patients with immunodeficiency, animal bites, and immersion injuries (soft tissue injuries occurring in fresh or saltwater).12 Previous studies also delineated criteria for “complicated” SSTIs, typically defined as surgical or traumatic wounds, infections requiring surgical intervention (not including simple incision and drainage), or infected ulcers or burns.8,9 In the study of Malone et al, 10 (12.5%) positives were found among 80 patients with complicated SSTIs who had blood cultures performed.8 Although this work had a single-center study design with a relatively small sample size, no unusual organisms were found; the grown cultures included MRSA, MSSA, and S. pneumoniae. In addition to patients with complicated SSTIs, immunocompromised children, such as those receiving chemotherapy or other immunosuppressive agents, were excluded from the studies of blood culture yield in SSTIs and may warrant blood cultures given the risk of overwhelming infection and susceptibility to rare or invasive organisms.12 In a study of 57 pediatric patients with leukemia and no central catheters who experienced skin or soft tissue complications, Demircioglu et al13 reported 6 positive blood cultures, including Klebsiella oxytoca, Pseudomonas aeruginosa, and Escherichia coli. These organisms would not be covered by typical SSTI antibiotic regimens, illustrating the value of blood cultures in this selected group of patients. Lastly, although the above studies included some infants, the data on utility of blood cultures in neonates are limited. Blood cultures may be reasonable in this group given the relative immunocompromised state of neonates compared with older children. Additionally, any infants aged
What You Should Do Instead Of Blood Cultures for Uncomplicated SSTIs
Gram stain and wound culture of any purulent material may assist with choice of empiric antibiotic therapy and appropriate narrowing of regimen for antibiotic stewardship. Wound cultures of purulent material can identify the causative organism in 58%-66% of the cases.9,14 The rate of wound culture varies widely from 29% to 81% in studies across different healthcare systems.9,10,15 The use of visually appealing posters advising clinicians to “culture pus, not blood” has been shown to significantly decreased the number of blood cultures performed at a single pediatric hospital.10
RECOMMENDATIONS
- Do not obtain blood cultures in pediatric patients with uncomplicated SSTIs.
- If purulent material is available spontaneously or after incision and drainage, then send it for Gram stain and bacterial culture.
- Blood cultures are reasonable in patients with complicated SSTIs and in immunocompromised patients with SSTIs.
- Despite limited data, blood cultures may be reasonable in neonates with SSTIs. Febrile infants with SSTIs aged less than 90 days should be managed under existing febrile infant guidelines.
CONCLUSIONS
Blood cultures in pediatric patients with uncomplicated SSTIs have no proven benefit and are associated with increased LOS, non-negligible false-positive rate, and associated increase in financial charges to the patient and healthcare system. The patient described in the clinical scenario would have an extremely low likelihood of having any meaningful clinical information provided by blood culture as part of her evaluation.
Do you think this is a low-value practice? Is this truly a “Thing We Do for No Reason?” Share what you do in your practice and join in the conversation online by retweeting it on Twitter (#TWDFNR) and liking it on Facebook. We invite you to propose ideas for other “Things We Do for No Reason” topics by emailing TWDFNR@hospitalmedicine.org.
DISCLOSURES
The authors have no conflicts of interest relevant to this article to disclose.
1. Mistry R, Shapiro D, Goyal M, et al. Clinical management of skin and soft tissue infections in the U.S. Emergency Departments. West J Emerg Med. 2014;15(4):491-498. doi:10.5811/westjem.2014.4.20583. PubMed
2. Witt WP, Weiss AJ, Elixhauser A. Overview of hospital stays for children in the United States, 2012; Statistical Brief #187. https://www.hcup-us.ahrq.gov/reports/statbriefs/sb187-Hospital-Stays-Children-2012.pdf.
3. Dukic VM, Lauderdale DS, Wilder J, Daum RS, David MZ. Epidemics of community-associated methicillin-resistant Staphylococcus aureus in the United States: a meta-analysis. Otto M, ed. PLoS One. 2013;8(1):e52722. doi: 10.1371/journal.pone.0052722. PubMed
4. Fleisher G, Ludwig S, Henretig F, Ruddy R, Henry W. Cellulitis: initial management. Ann Emerg Med. 1981;10(7):356-359. PubMed
5. Fleisher G, Ludwig S, Campos J. Cellulitis: bacterial etiology, clinical features, and laboratory findings. J Pediatr. 1980;97(4):591-593. doi: 10.1016/S0022-3476(80)80014-X http://www.ncbi.nlm.nih.gov/pubmed/6775063. Accessed July 26, 2017.
6. Parikh K, Davis AB, Pavuluri P. Do we need this blood culture? Hosp Pediatr. 2014;4(2):78-84. doi:10.1542/hpeds.2013-0053. PubMed
7. Wathen D, Halloran DR. Blood culture associations in children with a diagnosis of cellulitis in the era of methicillin-resistant Staphylococcus aureus. Hosp Pediatr. 2013;3(2):103-107. http://www.ncbi.nlm.nih.gov/pubmed/24340410. Accessed July 26, 2017.
8. Malone JR, Durica SR, Thompson DM, Bogie A, Naifeh M. Blood cultures in the evaluation of uncomplicated skin and soft tissue infections. Pediatrics. 2013;132(3):454-459. doi:10.1542/peds.2013-1384. PubMed
9. Trenchs V, Hernandez-Bou S, Bianchi C, Arnan M, Gene A, Luaces C. Blood cultures are not useful in the evaluation of children with uncomplicated superficial skin and soft tissue infections. Pediatr Infect Dis J. 2015;34(9):924-927. doi:10.1097/INF.0000000000000768. PubMed
10. Sloane AJ, Pressel DM. Culture pus, not blood: decreasing routine laboratory testing in patients with uncomplicated skin and soft tissue infections. Hosp Pediatr. 2016;6(7):394-398. doi:10.1542/hpeds.2015-0186. PubMed
11. Sadow KB, Chamberlain JM. Blood cultures in the evaluation of children with cellulitis. Pediatrics. 1998;101(3):E4. doi: 10.1542/peds.101.3.e4 http://www.ncbi.nlm.nih.gov/pubmed/9481023. Accessed July 26, 2017.
12. Stevens DL, Bisno AL, Chambers HF, et al. Executive Summary: practice guidelines for the diagnosis and management of skin and soft tissue infections: 2014 update by the infectious diseases society of America. Clin Infect Dis. 2014;59(2):147-159. doi:10.1093/cid/ciu444.
13. Demircioğlu F, Ylmaz S, Oren H, Ozgüven AA, Irken G. Skin and soft tissue complications in pediatric leukemia patients with and without central venous catheters. J Pediatr Hematol Oncol. 2008;30(1):32-35. doi:10.1097/MPH.0b013e31815cc429. PubMed
14. Ray GT, Suaya JA, Baxter R. Microbiology of skin and soft tissue infections in the age of community-acquired methicillin-resistant Staphylococcus aureus. Diagn Microbiol Infect Dis. 2013;76(1):24-30. doi:10.1016/j.diagmicrobio.2013.02.020. PubMed
15. Baumann BM, Russo CJ, Pavlik D, et al. Management of pediatric skin abscesses in pediatric, general academic and community emergency departments. West J Emerg Med. 2011;12(2):159-167. http://www.ncbi.nlm.nih.gov/pubmed/21691519. Accessed July 26, 2017.
The “Things We Do for No Reason” (TWDFNR) series reviews practices that have become common parts of hospital care but may provide little value to our patients. Practices reviewed in the TWDFNR series do not represent “black and white” conclusions or clinical practice standards but are meant as a starting place for research and active discussions among hospitalists and patients. We invite you to be part of that discussion. https://www.choosingwisely.org/
CLINICAL SCENARIO
An 8-year-old previously healthy girl presented to the emergency department (ED) with 2 days of warmth, swelling, and pain over her right upper thigh. Three days prior before presentation, a “pimple” appeared on her leg and drained a small amount of pus. Over the next 24 hours, the lesion became swollen, red, and painful. Her pediatrician prescribed trimethoprim-sulfamethoxazole. The patient took 3 doses of this medication but still experienced worsening pain and swelling.
In the ED, she had normal vital signs for her age except for temperature of 100.8 °F. A 2 cm × 3 cm area of fluctuance, erythema, and warmth was noted, and bedside ultrasound demonstrated a simple fluid collection. Incision and drainage was performed with expression of several milliliters of pus. The patient was referred for admission due to worsening symptoms despite outpatient antibiotic therapy. The ED providers ordered a blood culture at the time of admission.
BACKGROUND
Skin and soft tissue infections (SSTIs) are common pediatric diagnoses, which account for an estimated 390,000 ED visits annually1 and represent the 7th most common reason for pediatric hospital admission in the United States.2 The rates of SSTIs have increased over the past several decades partly due to the rise of methicillin-resistant Staphylococcus aureus (MRSA).3
Why You Might Think Blood Cultures are Helpful In Children with SSTIs?
Prior to the introduction of the Haemophilus influenzae vaccine, the rates of SSTI-associated bacteremia ranged from 8% to 20%.4,5 Although the rate of bacteremia has declined significantly, blood cultures are still commonly performed as part of the evaluation of uncomplicated SSTIs in children; studies have shown that blood culture rates are 46% in the combined outpatient/inpatient setting,6 34% in the ED setting,7 and 47%-94% in the inpatient setting.7-11 Clinicians still feel that bacteremia detection is important to guide the selection of antibiotics and treatment duration. Providers may also underestimate the risk of obtaining a contaminant result and associated charges. Lastly, clinicians may perform blood cultures due to cultural norms at their institution.
Why Blood Cultures are Unnecessary in Children with Uncomplicated SSTIs
Several decades into the post vaccine era, the current guidelines from the Infectious Diseases Society of America (IDSA) do not recommend blood cultures as part of the routine evaluation of uncomplicated SSTIs.12 Multiple single-center studies have failed to demonstrate the benefits of obtaining blood cultures in pediatric patients with uncomplicated SSTIs in the post-H. influenzae vaccine era.6–11
Sadow et al11 performed a retrospective case series of 381 children hospitalized with cellulitis to determine the rate and yield of blood cultures. Of the 266 (70%) patients who had a blood culture performed, 5 (1.9%) were true positives and 13 (5.4%) were contaminants. Notably, the true positive results included 3 children with active varicella infection and 2 children with septic joints; the latter would qualify as a complicated SSTI or as a separate infectious process altogether. No significant change in management resulted the positive blood cultures.
Wathen et al7 conducted a similar retrospective case series of 385 children with cellulitis who presented to the ED of a single tertiary-care children’s hospital to determine the rate and yield of blood cultures. Of the 129 (33.5%) blood cultures performed, there were no true positives and 4 (3.1%) contaminants. Obtaining a blood culture was also associated with high rates of ordering complete blood count and hospitalization.
Malone et al8 performed a retrospective case series of 580 children hospitalized with an SSTI at a single children’s hospital to determine the yield of blood cultures for uncomplicated versus complicated SSTIs. Of the 482 patients with uncomplicated SSTIs, 455 (94.4%) had a blood culture, with no true positive cultures and 3 (0.7%) contaminants. Obtaining a blood culture in this study was associated with an almost 1 day increase in length of stay (LOS; mean LOS 3.24 vs 2.33 days, P = .04).
Parikh et al6 conducted a retrospective cohort study of 304 children with SSTIs in both inpatient and outpatient settings to determine the yield and rate of blood cultures. Of this group, 140 (46.1%) patients had a blood culture performed, of which there were 3 (2.9%) true positives and 1 (0.7%) contaminant. True-positive bacteria included MRSA and Streptococcus pyogenes, neither of which was associated with a change in antibiotic regimen or increase in hospital LOS. The total charges associated with the original 140 blood cultures were estimated to be $42,450 annually in the authors’ institution.
Lastly, Trenchs et al9 performed a retrospective case series of 445 children hospitalized with SSTI in a Spanish children’s hospital and found 353 (79.3%) blood cultures with 2 (0.6%) true positives and 10 (2.8%) contaminants. Methicillin-sensitive Staphylococcus aureus (MSSA) and S. pyogenes were the sole true-positive bacteria, and no change in management was reported. Obtaining blood cultures was associated with an increased hospital LOS (median LOS 4 vs. 3 days, P
Across these studies, the reported rates of true-positive blood cultures ranged from 0%-2.9%. Of the 1997 patients included in the studies, only 10 (0.5%) had true-positive blood cultures. This rate decreased to 0.4% if the 2 patients with septic arthritis from the study of Sadow et al were excluded. Isolated organisms included MRSA, MSSA, S. pyogenes, and Streptococcus pneumoniae. No unusual organisms were isolated in uncomplicated SSTIs, and the true-positive results were not associated with any reported change in antibiotic management.6–9,11 False-positive blood culture results were found in 0%-5.4% of patients,6–9,11 accounting for 30 patients or 1.5% of the total patients.
Harms Associated With Unnecessary Blood Cultures in SSTIs
Blood cultures necessitate venipunctures, which are painful for children and families. The inevitable false-positive contaminants also lead to repeat venipunctures and, potentially, unnecessary antibiotic exposure. From a high-value care perspective, Parikh et al reported hospital charges of $300 per blood culture and $250 for identification and sensitivity of positives.6 Assuming that these single-center charges are representative of national charges and using 0.5% true positivity and 1.5% false positivity rates, subjecting all children with uncomplicated SSTIs to blood culture would result in $60,250 charges to find one true positive blood culture, with no resultant changes in management. Additionally, among the 200 children cultured to find one true positive, there would be 3 false positives, necessitating another $1650 in charges for identification, sensitivity analysis, and repeat culture. These amounts do not factor in the significant expenditures associated with increased LOS. The potential savings associated with forgoing blood cultures in children with SSTIs should be an incentive for institutional change.
When Blood Cultures May Be Reasonable
The current IDSA guidelines recommend blood cultures for SSTIs in patients with immunodeficiency, animal bites, and immersion injuries (soft tissue injuries occurring in fresh or saltwater).12 Previous studies also delineated criteria for “complicated” SSTIs, typically defined as surgical or traumatic wounds, infections requiring surgical intervention (not including simple incision and drainage), or infected ulcers or burns.8,9 In the study of Malone et al, 10 (12.5%) positives were found among 80 patients with complicated SSTIs who had blood cultures performed.8 Although this work had a single-center study design with a relatively small sample size, no unusual organisms were found; the grown cultures included MRSA, MSSA, and S. pneumoniae. In addition to patients with complicated SSTIs, immunocompromised children, such as those receiving chemotherapy or other immunosuppressive agents, were excluded from the studies of blood culture yield in SSTIs and may warrant blood cultures given the risk of overwhelming infection and susceptibility to rare or invasive organisms.12 In a study of 57 pediatric patients with leukemia and no central catheters who experienced skin or soft tissue complications, Demircioglu et al13 reported 6 positive blood cultures, including Klebsiella oxytoca, Pseudomonas aeruginosa, and Escherichia coli. These organisms would not be covered by typical SSTI antibiotic regimens, illustrating the value of blood cultures in this selected group of patients. Lastly, although the above studies included some infants, the data on utility of blood cultures in neonates are limited. Blood cultures may be reasonable in this group given the relative immunocompromised state of neonates compared with older children. Additionally, any infants aged
What You Should Do Instead Of Blood Cultures for Uncomplicated SSTIs
Gram stain and wound culture of any purulent material may assist with choice of empiric antibiotic therapy and appropriate narrowing of regimen for antibiotic stewardship. Wound cultures of purulent material can identify the causative organism in 58%-66% of the cases.9,14 The rate of wound culture varies widely from 29% to 81% in studies across different healthcare systems.9,10,15 The use of visually appealing posters advising clinicians to “culture pus, not blood” has been shown to significantly decreased the number of blood cultures performed at a single pediatric hospital.10
RECOMMENDATIONS
- Do not obtain blood cultures in pediatric patients with uncomplicated SSTIs.
- If purulent material is available spontaneously or after incision and drainage, then send it for Gram stain and bacterial culture.
- Blood cultures are reasonable in patients with complicated SSTIs and in immunocompromised patients with SSTIs.
- Despite limited data, blood cultures may be reasonable in neonates with SSTIs. Febrile infants with SSTIs aged less than 90 days should be managed under existing febrile infant guidelines.
CONCLUSIONS
Blood cultures in pediatric patients with uncomplicated SSTIs have no proven benefit and are associated with increased LOS, non-negligible false-positive rate, and associated increase in financial charges to the patient and healthcare system. The patient described in the clinical scenario would have an extremely low likelihood of having any meaningful clinical information provided by blood culture as part of her evaluation.
Do you think this is a low-value practice? Is this truly a “Thing We Do for No Reason?” Share what you do in your practice and join in the conversation online by retweeting it on Twitter (#TWDFNR) and liking it on Facebook. We invite you to propose ideas for other “Things We Do for No Reason” topics by emailing TWDFNR@hospitalmedicine.org.
DISCLOSURES
The authors have no conflicts of interest relevant to this article to disclose.
1. Mistry R, Shapiro D, Goyal M, et al. Clinical management of skin and soft tissue infections in the U.S. Emergency Departments. West J Emerg Med. 2014;15(4):491-498. doi:10.5811/westjem.2014.4.20583. PubMed
2. Witt WP, Weiss AJ, Elixhauser A. Overview of hospital stays for children in the United States, 2012; Statistical Brief #187. https://www.hcup-us.ahrq.gov/reports/statbriefs/sb187-Hospital-Stays-Children-2012.pdf.
3. Dukic VM, Lauderdale DS, Wilder J, Daum RS, David MZ. Epidemics of community-associated methicillin-resistant Staphylococcus aureus in the United States: a meta-analysis. Otto M, ed. PLoS One. 2013;8(1):e52722. doi: 10.1371/journal.pone.0052722. PubMed
4. Fleisher G, Ludwig S, Henretig F, Ruddy R, Henry W. Cellulitis: initial management. Ann Emerg Med. 1981;10(7):356-359. PubMed
5. Fleisher G, Ludwig S, Campos J. Cellulitis: bacterial etiology, clinical features, and laboratory findings. J Pediatr. 1980;97(4):591-593. doi: 10.1016/S0022-3476(80)80014-X http://www.ncbi.nlm.nih.gov/pubmed/6775063. Accessed July 26, 2017.
6. Parikh K, Davis AB, Pavuluri P. Do we need this blood culture? Hosp Pediatr. 2014;4(2):78-84. doi:10.1542/hpeds.2013-0053. PubMed
7. Wathen D, Halloran DR. Blood culture associations in children with a diagnosis of cellulitis in the era of methicillin-resistant Staphylococcus aureus. Hosp Pediatr. 2013;3(2):103-107. http://www.ncbi.nlm.nih.gov/pubmed/24340410. Accessed July 26, 2017.
8. Malone JR, Durica SR, Thompson DM, Bogie A, Naifeh M. Blood cultures in the evaluation of uncomplicated skin and soft tissue infections. Pediatrics. 2013;132(3):454-459. doi:10.1542/peds.2013-1384. PubMed
9. Trenchs V, Hernandez-Bou S, Bianchi C, Arnan M, Gene A, Luaces C. Blood cultures are not useful in the evaluation of children with uncomplicated superficial skin and soft tissue infections. Pediatr Infect Dis J. 2015;34(9):924-927. doi:10.1097/INF.0000000000000768. PubMed
10. Sloane AJ, Pressel DM. Culture pus, not blood: decreasing routine laboratory testing in patients with uncomplicated skin and soft tissue infections. Hosp Pediatr. 2016;6(7):394-398. doi:10.1542/hpeds.2015-0186. PubMed
11. Sadow KB, Chamberlain JM. Blood cultures in the evaluation of children with cellulitis. Pediatrics. 1998;101(3):E4. doi: 10.1542/peds.101.3.e4 http://www.ncbi.nlm.nih.gov/pubmed/9481023. Accessed July 26, 2017.
12. Stevens DL, Bisno AL, Chambers HF, et al. Executive Summary: practice guidelines for the diagnosis and management of skin and soft tissue infections: 2014 update by the infectious diseases society of America. Clin Infect Dis. 2014;59(2):147-159. doi:10.1093/cid/ciu444.
13. Demircioğlu F, Ylmaz S, Oren H, Ozgüven AA, Irken G. Skin and soft tissue complications in pediatric leukemia patients with and without central venous catheters. J Pediatr Hematol Oncol. 2008;30(1):32-35. doi:10.1097/MPH.0b013e31815cc429. PubMed
14. Ray GT, Suaya JA, Baxter R. Microbiology of skin and soft tissue infections in the age of community-acquired methicillin-resistant Staphylococcus aureus. Diagn Microbiol Infect Dis. 2013;76(1):24-30. doi:10.1016/j.diagmicrobio.2013.02.020. PubMed
15. Baumann BM, Russo CJ, Pavlik D, et al. Management of pediatric skin abscesses in pediatric, general academic and community emergency departments. West J Emerg Med. 2011;12(2):159-167. http://www.ncbi.nlm.nih.gov/pubmed/21691519. Accessed July 26, 2017.
© 2018 Society of Hospital Medicine
Things We Do for No Reason: Hospitalization for the Evaluation of Patients with Low-Risk Chest Pain
The “Things We Do for No Reason” (TWDFNR) series reviews practices that have become common parts of hospital care but may provide little value to our patients. Practices reviewed in the TWDFNR series do not represent “black and white” conclusions or clinical practice standards, but are meant as a starting place for research and active discussions among hospitalists and patients. We invite you to be part of that discussion. https://www.choosingwisely.org/

Chest pain is one of the most common complaints among patients presenting to the emergency department. Moreover, at least 30% of patients who present with chest pain are admitted for observation, and >70% of those admitted with chest pain undergo cardiac stress testing (CST) during hospitalization. Several clinical risk prediction models have validated evaluation processes for managing patients with chest pain, helping to identify those at a low risk of major adverse cardiac events. Among these, the Thrombolysis in Myocardial Infarction or HEART score can identify patients safe to be discharged with outpatient CST within 72 h. It is unnecessary to hospitalize all low-risk patients for cardiac testing because it may expose them to needless risk and avoidable care costs, with little additional benefit.
CLINICAL SCENARIO
A 60-year-old man with a history of osteoarthritis and depression presented to our emergency department (ED) with a 1-month history of left-sided chest pain that was present both at rest and exertion. There were no aggravating or relieving factors for the pain and no associated shortness of breath, diaphoresis, nausea, or lightheadedness. He smoked a half pack of cigarettes daily for 5 years in his twenties. The patient was taking aspirin 81 mg daily and paroxetine 40 mg daily, which he had been taking for 10 years. There was a family history of coronary artery disease in his mother, father, and sister. On examination, he was afebrile, with a blood pressure of 138/78 mm Hg and a heart rate of 62 beats/min; he appeared well, with no abnormal cardiopulmonary findings. Investigation revealed a normal initial troponin I level (<0.034 mg/mL) and normal electrocardiogram (ECG) with normal sinus rhythm (75 beats/min), normal axis, no ST changes, and no Q waves. He was therefore admitted to the hospital for further evaluation.
BACKGROUND
Each year, >7 million patients visit ED for chest pain in the United States,1 with approximately 13% diagnosed with acute coronary syndromes (ACSs).2 Over 30% of patients who present to ED with chest pain are hospitalized for observation, symptom evaluation, and risk stratification.3 In 2012, the mean Medicare reimbursement cost was $1,741 for in-hospital observation,4 with up to 70% of admitted patients undergoing cardiac stress testing (CST) before discharge.5
WHY YOU MIGHT THINK HOSPITALIZATION IS HELPFUL FOR THE EVALUATION OF LOW-RISK CHEST PAIN
A scientific statement by the American Heart Association in 2010 recommended that patients considered to be at low risk for ACS after initial evaluation (based on presenting symptoms, past history, ECG findings, and initial cardiac biomarkers) should undergo CST within 72 h (preferably within 24 h) of presentation to provoke ischemia or detect anatomic coronary artery disease.6 Early exercise treadmill testing as part of an accelerated diagnostic pathway can also reduce the length of stays (LOS) in hospital and lower the medical costs.7 Moreover, when there is noncompliance or poor accessibility, failure to pursue early exercise testing in a hospital could result in a loss of patients to follow-up. Hospitalization for testing through accelerated diagnostic pathways may improve access to care and reduce clinical and legal risks associated with a major adverse cardiac event (MACE).
WHY HOSPITALIZATION FOR THE EVALUATION OF LOW-RISK CHEST PAIN IS UNNECESSARY FOR MANY PATIENTS
Clinical Risk Prediction Models
When a patient initially presents with chest pain, it should be determined if the symptoms are related to ACS or some other diagnosis. Hospitalization is required for patients with ACS but may not be for those without ACS and those with a low risk of inducible ischemia. Clinical risk scores and risk prediction models, such as the Thrombolysis in Myocardial Infarction (TIMI) and HEART scores, have been used in accelerated diagnostic protocols to determine a patient’s likelihood of having ACS. Several large trials of these clinical risk prediction models have validated the processes for evaluating patients with chest pain.
The TIMI risk score, the most well-known model, assesses risk based on the presence or absence of 7 characteristics (Appendix 1). It should be noted that the patient population studied for initial validation of this model comprised high-risk patients with unstable angina or non-ST elevation myocardial infarction who would benefit from early or urgent invasive therapy.8 In this population, TIMI scores of 0-1 are associated with low risk, with a 4.7% risk of ACS at 14 days.8 In another study of patients presenting to ED with undifferentiated chest pain and a TIMI score of zero, the risk of MACE at 30 days was approximately 2%.9
The HEART score is also used for patients presenting to ED with undifferentiated chest pain and assesses 5 separate variables scored 0–2 (Appendix 2). The original research gave a score of 2 to a troponin I level greater than twice the upper limit of the normal level,10 whereas a subsequent validation study gave a score of 2 to a troponin I or T level greater than or equal to 3 times the upper limit of the normal level.11 Patients are considered at low, intermediate, and high risk based on scores of 0–3, 4–6, and 7–10, respectively.10,11 Backus et al. performed a prospective randomized trial of 2388 patients who presented to ED with chest pain to validate the HEART score and compare it to the TIMI risk score. The HEART score performed better than the TIMI risk score in low-risk patients, with TIMI scores of 0-1 and HEART scores of 0–3 having a 6-week MACE risk of 2.8% and 1.7%, respectively.11
A HEART pathway was developed that combines the HEART score with serial troponin I assays assessed at the time of initial presentation and approximately 3 h later.12 Mahler et al. randomized 282 patients presenting to ED with chest pain to either the HEART pathway or conventional care. Patients with low-risk HEART scores and an abnormal troponin I level were admitted for cardiology consultation, whereas discharge was recommended for those with low scores and a normal troponin I level. Despite nearly 20% of the study cohort having a history of myocardial infarction, percutaneous coronary intervention, or coronary artery bypass grafting, approximately 40% of patients in the HEART pathway were identified as low risk, increasing early discharge rates by 21.3% and decreasing the average LOS by 12 h. No low-risk patient suffered a MACE within 30 days, and the HEART pathway had a sensitivity and a negative predictive value of approximately 99%.
Costs and Harms of Hospitalization for Cardiac Testing
Hospitalization carries measurable risks.13,14 Between 2008 and 2013, Weinstock et al. evaluated the outcom
Outpatient CST can be reliably and safely performed for patients with chest pain.16-18 There is no clear evidence that earlier CST leads to improved patient outcomes, and CST in the absence of acute ischemia (or ACS) increases the rates of angiography and revascularization without improvements in the rate of myocardial infarction.19-21 Given the costs of in-hospital observation4 and the dubious benefits of providing CST for patients with low-risk chest pain, admitting all patients with low-risk chest pain exposes them to costs and harms with little potential benefit.
WHEN HOSPITALIZATION MAY BE REASONABLE TO EVALUATE LOW-RISK CHEST PAIN
Patients presenting with chest pain with either dynamic ECG changes or an elevated troponin level require hospitalization for further ACS diagnosis and treatment. When ACS cannot be clearly diagnosed at the initial evaluation, healthcare providers should use clinical risk prediction models to stratify patients. Those deemed to be at an intermediate or high risk by these models should be hospitalized for further evaluation, as should those at low risk but for whom access to outpatient follow-up is difficult (eg, those without health insurance).
WHAT YOU SHOULD DO INSTEAD OF HOSPITALIZATION FOR LOW-RISK CHEST PAIN
A complete history and physical examination, along with ECG and cardiac biomarker testing, are required for all patients presenting with chest pain. Validated clinical risk prediction models should then be used to determine the likelihood of a cardiac event. Fanaroff et al. reported that low-risk HEART scores of 0–3 and TIMI scores of 0-1 gave positive likelihood ratios of 0.2 and 0.31, respectively.22 Using a pre-test probability of 13%, as reported by Bhuiya et al.,2 the likelihood of ACS or MACE within 6 weeks is 2.9% for patients with low-risk HEART scores and 4.4% for those with low-risk TIMI scores.22 These risk prediction models allow clinicians to provide a shared decision-making plan with the patient and discuss the risks and benefits of in-hospital versus outpatient cardiac testing, especially among patients with access to appropriate outpatient follow-up.23 Low-risk patients can be referred for outpatient testing within 72 h, reducing hospitalization-associated costs and harms.
RECOMMENDATIONS
- Patients presenting with chest pain should undergo a complete history taking and physical examination, as well as ECG and cardiac biomarker testing (eg, troponin I level at presentation and approximately 3 h later).
- Clinical risk prediction models, such as TIMI or HEART scores, should then be used to determine the risk of MACE.
- Patients at a low risk may be safely discharged with outpatient CST performed within 72 h.
- Patients at an intermediate or high risk of MACE should be hospitalized for further evaluation, as should those with low-risk chest pain who are unable to attend follow-up for outpatient CST within 72 h.
- Clinicians should provide a shared decision-making plan with each patient, taking care to discuss the risks and benefits of in-hospital versus outpatient CST.
CONCLUSION
The risk of MACE should be assessed in all patients presenting to ED with low-risk chest pain to avoid unnecessary hospitalization that exposes them to potential costs and harms with few additional benefits. If the risk scoring system was applied to the patient described in our original clinical scenario, he would have had a HEART score of 3 (ie, 1 point for a moderately suspicious history, 1 point for the age of 60 years, and 1 point for a positive family history) and a TIMI score of 1 (ie, 1 point for aspirin use within past 7 days). Therefore, he could be stratified as having a low-risk presentation. With a second negative troponin I test at 3 h, discharge from ED with timely outpatient CST within 72 h would be an appropriate management strategy.
Do you think this is a low-value practice? Is this truly a “Thing We Do for No Reason”? Share what you do in your practice and join in the conversation online by retweeting it on Twitter (#TWDFNR) and liking it on Facebook. We invite you to propose ideas for other “Things We Do for No Reason” topics by emailing TWDFNR@hospitalmedicine.org.
Conflicts of Interest
The authors have no conflicts of interest relevant to this article to disclose.
1. Centers for Disease Control. National Hospital Ambulatory Medical Care Survey: 2011 Emergency Department Summary Tables. 2011. http://www.cdc.gov/nchs/data/ahcd/nhamcs_emergency/2011_ed_web_tables.pdf. Accessed October 7, 2015.
2. Bhuiya FA, Pitts SR, McCaig LF. Emergency department visits for chest pain and abdominal pain: United States, 1999-2008. NCHS Data Brief. 2010;(43):1-8. PubMed
3. Cotterill PG, Deb P, Shrank WH, Pines JM. Variation in chest pain emergency department admission rates and acute myocardial infarction and death within 30 days in the Medicare population. Acad Emerg Med. 2015;22(8):955-964. PubMed
4. Wright S. Hospitals’ Use of Observation Stays and Short Inpatient Stays for Medicare Beneficiaries, OEI-02-12-00040. 2013. https://oig.hhs.gov/oei/reports/oei-02-12-00040.pdf. Accessed May 15, 2017.
5. Penumetsa SC, Mallidi J, Friderici JL, Hiser W, Rothberg MB. Outcomes of patients admitted for observation of chest pain. Arch Inter Med. 2012;172(11):873-877. PubMed
6. Amsterdam EA, Kirk JD, Bluemke DA, et al. Testing of low-risk patients presenting to the emergency department with chest pain: a scientific statement from the American Heart Association. Circulation. 2010;122(17):1756-1776. PubMed
7. Hutter AM, Jr., Amsterdam EA, Jaffe AS. 31st Bethesda Conference. Emergency Cardiac Care. Task force 2: Acute coronary syndromes: Section 2B--Chest discomfort evaluation in the hospital. J Am Coll Cardiol. 2000;35(4):853-862. PubMed
8. Antman EM, Cohen M, Bernink PJ, et al. The TIMI risk score for unstable angina/non-ST elevation MI: A method for prognostication and therapeutic decision making. JAMA. 2000;284(7):835-842. PubMed
9. Pollack CV, Jr., Sites FD, Shofer FS, Sease KL, Hollander JE. Application of the TIMI risk score for unstable angina and non-ST elevation acute coronary syndrome to an unselected emergency department chest pain population. Acad Emerg Med. 2006;13(1):13-18. PubMed
10. Six AJ, Backus BE, Kelder JC. Chest pain in the emergency room: value of the HEART score. Neth Heart J. 2008; 16(6):191-196. PubMed
11. Backus BE, Six AJ, Kelder JC, et al. A prospective validation of the HEART score for chest pain patients at the emergency department. Int J Cardiol. 2013;168(3):2153-2158. PubMed
12. Mahler SA, Riley RF, Hiestand BC, et al. The HEART Pathway randomized trial: identifying emergency department patients with acute chest pain for early discharge. Circ Cardiovasc Qual Outcomes. 2015;8(2):195-203. PubMed
13. Forster AJ, Murff HJ, Peterson JF, Gandhi TK, Bates DW. The incidence and severity of adverse events affecting patients after discharge from the hospital. Ann Inter Med. 2003;138(3):161-167. PubMed
14. James JT. A new, evidence-based estimate of patient harms associated with hospital care. J Patient Saf. 2013;9(3):122-128. PubMed
15. Weinstock MB, Weingart S, Orth F, et al. Risk for clinically relevant adverse cardiac events in patients with chest pain at hospital admission. JAMA Intern Med. 2015;175(7):1207-1212. PubMed
16. Meyer MC, Mooney RP, Sekera AK. A critical pathway for patients with acute chest pain and low risk for short-term adverse cardiac events: role of outpatient stress testing. Ann Emerg Med. 2006;47(5):427-435. PubMed
17. Lai C, Noeller TP, Schmidt K, King P, Emerman CL. Short-term risk after initial observation for chest pain. J Emerg Med. 2003;25(4):357-362. PubMed
18. Scheuermeyer FX, Innes G, Grafstein E, et al. Safety and efficiency of a chest pain diagnostic algorithm with selective outpatient stress testing for emergency department patients with potential ischemic chest pain. Ann Emerg Med. 2012;59(4):256-264 e253. PubMed
19. Safavi KC, Li SX, Dharmarajan K, et al. Hospital variation in the use of noninvasive cardiac imaging and its association with downstream testing, interventions, and outcomes. JAMA Intern Med. 2014;174(4):546-553. PubMed
20. Foy AJ, Liu G, Davidson WR, Jr., Sciamanna C, Leslie DL. Comparative effectiveness of diagnostic testing strategies in emergency department patients with chest pain: an analysis of downstream testing, interventions, and outcomes. JAMA Intern Med. 2015; 175(3):428-436. PubMed
21. Sandhu AT, Heidenreich PA, Bhattacharya J, Bundorf MK. Cardiovascular testing and clinical outcomes in emergency department patients with chest pain. JAMA Intern Med. 2017;177(8):1175-1182. PubMed
22. Fanaroff AC, Rymer JA, Goldstein SA, Simel DL, Newby LK. Does this patient with chest pain have acute coronary syndrome?: The Rational Clinical Examination Systematic Review. JAMA. 2015;314(18):1955-1965. PubMed
23. Hess EP, Hollander JE, Schaffer JT, et al. Shared decision making in patients with low risk chest pain: prospective randomized pragmatic trial. BMJ. 2016;355:i6165. PubMed
The “Things We Do for No Reason” (TWDFNR) series reviews practices that have become common parts of hospital care but may provide little value to our patients. Practices reviewed in the TWDFNR series do not represent “black and white” conclusions or clinical practice standards, but are meant as a starting place for research and active discussions among hospitalists and patients. We invite you to be part of that discussion. https://www.choosingwisely.org/
Chest pain is one of the most common complaints among patients presenting to the emergency department. Moreover, at least 30% of patients who present with chest pain are admitted for observation, and >70% of those admitted with chest pain undergo cardiac stress testing (CST) during hospitalization. Several clinical risk prediction models have validated evaluation processes for managing patients with chest pain, helping to identify those at a low risk of major adverse cardiac events. Among these, the Thrombolysis in Myocardial Infarction or HEART score can identify patients safe to be discharged with outpatient CST within 72 h. It is unnecessary to hospitalize all low-risk patients for cardiac testing because it may expose them to needless risk and avoidable care costs, with little additional benefit.
CLINICAL SCENARIO
A 60-year-old man with a history of osteoarthritis and depression presented to our emergency department (ED) with a 1-month history of left-sided chest pain that was present both at rest and exertion. There were no aggravating or relieving factors for the pain and no associated shortness of breath, diaphoresis, nausea, or lightheadedness. He smoked a half pack of cigarettes daily for 5 years in his twenties. The patient was taking aspirin 81 mg daily and paroxetine 40 mg daily, which he had been taking for 10 years. There was a family history of coronary artery disease in his mother, father, and sister. On examination, he was afebrile, with a blood pressure of 138/78 mm Hg and a heart rate of 62 beats/min; he appeared well, with no abnormal cardiopulmonary findings. Investigation revealed a normal initial troponin I level (<0.034 mg/mL) and normal electrocardiogram (ECG) with normal sinus rhythm (75 beats/min), normal axis, no ST changes, and no Q waves. He was therefore admitted to the hospital for further evaluation.
BACKGROUND
Each year, >7 million patients visit ED for chest pain in the United States,1 with approximately 13% diagnosed with acute coronary syndromes (ACSs).2 Over 30% of patients who present to ED with chest pain are hospitalized for observation, symptom evaluation, and risk stratification.3 In 2012, the mean Medicare reimbursement cost was $1,741 for in-hospital observation,4 with up to 70% of admitted patients undergoing cardiac stress testing (CST) before discharge.5
WHY YOU MIGHT THINK HOSPITALIZATION IS HELPFUL FOR THE EVALUATION OF LOW-RISK CHEST PAIN
A scientific statement by the American Heart Association in 2010 recommended that patients considered to be at low risk for ACS after initial evaluation (based on presenting symptoms, past history, ECG findings, and initial cardiac biomarkers) should undergo CST within 72 h (preferably within 24 h) of presentation to provoke ischemia or detect anatomic coronary artery disease.6 Early exercise treadmill testing as part of an accelerated diagnostic pathway can also reduce the length of stays (LOS) in hospital and lower the medical costs.7 Moreover, when there is noncompliance or poor accessibility, failure to pursue early exercise testing in a hospital could result in a loss of patients to follow-up. Hospitalization for testing through accelerated diagnostic pathways may improve access to care and reduce clinical and legal risks associated with a major adverse cardiac event (MACE).
WHY HOSPITALIZATION FOR THE EVALUATION OF LOW-RISK CHEST PAIN IS UNNECESSARY FOR MANY PATIENTS
Clinical Risk Prediction Models
When a patient initially presents with chest pain, it should be determined if the symptoms are related to ACS or some other diagnosis. Hospitalization is required for patients with ACS but may not be for those without ACS and those with a low risk of inducible ischemia. Clinical risk scores and risk prediction models, such as the Thrombolysis in Myocardial Infarction (TIMI) and HEART scores, have been used in accelerated diagnostic protocols to determine a patient’s likelihood of having ACS. Several large trials of these clinical risk prediction models have validated the processes for evaluating patients with chest pain.
The TIMI risk score, the most well-known model, assesses risk based on the presence or absence of 7 characteristics (Appendix 1). It should be noted that the patient population studied for initial validation of this model comprised high-risk patients with unstable angina or non-ST elevation myocardial infarction who would benefit from early or urgent invasive therapy.8 In this population, TIMI scores of 0-1 are associated with low risk, with a 4.7% risk of ACS at 14 days.8 In another study of patients presenting to ED with undifferentiated chest pain and a TIMI score of zero, the risk of MACE at 30 days was approximately 2%.9
The HEART score is also used for patients presenting to ED with undifferentiated chest pain and assesses 5 separate variables scored 0–2 (Appendix 2). The original research gave a score of 2 to a troponin I level greater than twice the upper limit of the normal level,10 whereas a subsequent validation study gave a score of 2 to a troponin I or T level greater than or equal to 3 times the upper limit of the normal level.11 Patients are considered at low, intermediate, and high risk based on scores of 0–3, 4–6, and 7–10, respectively.10,11 Backus et al. performed a prospective randomized trial of 2388 patients who presented to ED with chest pain to validate the HEART score and compare it to the TIMI risk score. The HEART score performed better than the TIMI risk score in low-risk patients, with TIMI scores of 0-1 and HEART scores of 0–3 having a 6-week MACE risk of 2.8% and 1.7%, respectively.11
A HEART pathway was developed that combines the HEART score with serial troponin I assays assessed at the time of initial presentation and approximately 3 h later.12 Mahler et al. randomized 282 patients presenting to ED with chest pain to either the HEART pathway or conventional care. Patients with low-risk HEART scores and an abnormal troponin I level were admitted for cardiology consultation, whereas discharge was recommended for those with low scores and a normal troponin I level. Despite nearly 20% of the study cohort having a history of myocardial infarction, percutaneous coronary intervention, or coronary artery bypass grafting, approximately 40% of patients in the HEART pathway were identified as low risk, increasing early discharge rates by 21.3% and decreasing the average LOS by 12 h. No low-risk patient suffered a MACE within 30 days, and the HEART pathway had a sensitivity and a negative predictive value of approximately 99%.
Costs and Harms of Hospitalization for Cardiac Testing
Hospitalization carries measurable risks.13,14 Between 2008 and 2013, Weinstock et al. evaluated the outcom
Outpatient CST can be reliably and safely performed for patients with chest pain.16-18 There is no clear evidence that earlier CST leads to improved patient outcomes, and CST in the absence of acute ischemia (or ACS) increases the rates of angiography and revascularization without improvements in the rate of myocardial infarction.19-21 Given the costs of in-hospital observation4 and the dubious benefits of providing CST for patients with low-risk chest pain, admitting all patients with low-risk chest pain exposes them to costs and harms with little potential benefit.
WHEN HOSPITALIZATION MAY BE REASONABLE TO EVALUATE LOW-RISK CHEST PAIN
Patients presenting with chest pain with either dynamic ECG changes or an elevated troponin level require hospitalization for further ACS diagnosis and treatment. When ACS cannot be clearly diagnosed at the initial evaluation, healthcare providers should use clinical risk prediction models to stratify patients. Those deemed to be at an intermediate or high risk by these models should be hospitalized for further evaluation, as should those at low risk but for whom access to outpatient follow-up is difficult (eg, those without health insurance).
WHAT YOU SHOULD DO INSTEAD OF HOSPITALIZATION FOR LOW-RISK CHEST PAIN
A complete history and physical examination, along with ECG and cardiac biomarker testing, are required for all patients presenting with chest pain. Validated clinical risk prediction models should then be used to determine the likelihood of a cardiac event. Fanaroff et al. reported that low-risk HEART scores of 0–3 and TIMI scores of 0-1 gave positive likelihood ratios of 0.2 and 0.31, respectively.22 Using a pre-test probability of 13%, as reported by Bhuiya et al.,2 the likelihood of ACS or MACE within 6 weeks is 2.9% for patients with low-risk HEART scores and 4.4% for those with low-risk TIMI scores.22 These risk prediction models allow clinicians to provide a shared decision-making plan with the patient and discuss the risks and benefits of in-hospital versus outpatient cardiac testing, especially among patients with access to appropriate outpatient follow-up.23 Low-risk patients can be referred for outpatient testing within 72 h, reducing hospitalization-associated costs and harms.
RECOMMENDATIONS
- Patients presenting with chest pain should undergo a complete history taking and physical examination, as well as ECG and cardiac biomarker testing (eg, troponin I level at presentation and approximately 3 h later).
- Clinical risk prediction models, such as TIMI or HEART scores, should then be used to determine the risk of MACE.
- Patients at a low risk may be safely discharged with outpatient CST performed within 72 h.
- Patients at an intermediate or high risk of MACE should be hospitalized for further evaluation, as should those with low-risk chest pain who are unable to attend follow-up for outpatient CST within 72 h.
- Clinicians should provide a shared decision-making plan with each patient, taking care to discuss the risks and benefits of in-hospital versus outpatient CST.
CONCLUSION
The risk of MACE should be assessed in all patients presenting to ED with low-risk chest pain to avoid unnecessary hospitalization that exposes them to potential costs and harms with few additional benefits. If the risk scoring system was applied to the patient described in our original clinical scenario, he would have had a HEART score of 3 (ie, 1 point for a moderately suspicious history, 1 point for the age of 60 years, and 1 point for a positive family history) and a TIMI score of 1 (ie, 1 point for aspirin use within past 7 days). Therefore, he could be stratified as having a low-risk presentation. With a second negative troponin I test at 3 h, discharge from ED with timely outpatient CST within 72 h would be an appropriate management strategy.
Do you think this is a low-value practice? Is this truly a “Thing We Do for No Reason”? Share what you do in your practice and join in the conversation online by retweeting it on Twitter (#TWDFNR) and liking it on Facebook. We invite you to propose ideas for other “Things We Do for No Reason” topics by emailing TWDFNR@hospitalmedicine.org.
Conflicts of Interest
The authors have no conflicts of interest relevant to this article to disclose.
1. Centers for Disease Control. National Hospital Ambulatory Medical Care Survey: 2011 Emergency Department Summary Tables. 2011. http://www.cdc.gov/nchs/data/ahcd/nhamcs_emergency/2011_ed_web_tables.pdf. Accessed October 7, 2015.
2. Bhuiya FA, Pitts SR, McCaig LF. Emergency department visits for chest pain and abdominal pain: United States, 1999-2008. NCHS Data Brief. 2010;(43):1-8. PubMed
3. Cotterill PG, Deb P, Shrank WH, Pines JM. Variation in chest pain emergency department admission rates and acute myocardial infarction and death within 30 days in the Medicare population. Acad Emerg Med. 2015;22(8):955-964. PubMed
4. Wright S. Hospitals’ Use of Observation Stays and Short Inpatient Stays for Medicare Beneficiaries, OEI-02-12-00040. 2013. https://oig.hhs.gov/oei/reports/oei-02-12-00040.pdf. Accessed May 15, 2017.
5. Penumetsa SC, Mallidi J, Friderici JL, Hiser W, Rothberg MB. Outcomes of patients admitted for observation of chest pain. Arch Inter Med. 2012;172(11):873-877. PubMed
6. Amsterdam EA, Kirk JD, Bluemke DA, et al. Testing of low-risk patients presenting to the emergency department with chest pain: a scientific statement from the American Heart Association. Circulation. 2010;122(17):1756-1776. PubMed
7. Hutter AM, Jr., Amsterdam EA, Jaffe AS. 31st Bethesda Conference. Emergency Cardiac Care. Task force 2: Acute coronary syndromes: Section 2B--Chest discomfort evaluation in the hospital. J Am Coll Cardiol. 2000;35(4):853-862. PubMed
8. Antman EM, Cohen M, Bernink PJ, et al. The TIMI risk score for unstable angina/non-ST elevation MI: A method for prognostication and therapeutic decision making. JAMA. 2000;284(7):835-842. PubMed
9. Pollack CV, Jr., Sites FD, Shofer FS, Sease KL, Hollander JE. Application of the TIMI risk score for unstable angina and non-ST elevation acute coronary syndrome to an unselected emergency department chest pain population. Acad Emerg Med. 2006;13(1):13-18. PubMed
10. Six AJ, Backus BE, Kelder JC. Chest pain in the emergency room: value of the HEART score. Neth Heart J. 2008; 16(6):191-196. PubMed
11. Backus BE, Six AJ, Kelder JC, et al. A prospective validation of the HEART score for chest pain patients at the emergency department. Int J Cardiol. 2013;168(3):2153-2158. PubMed
12. Mahler SA, Riley RF, Hiestand BC, et al. The HEART Pathway randomized trial: identifying emergency department patients with acute chest pain for early discharge. Circ Cardiovasc Qual Outcomes. 2015;8(2):195-203. PubMed
13. Forster AJ, Murff HJ, Peterson JF, Gandhi TK, Bates DW. The incidence and severity of adverse events affecting patients after discharge from the hospital. Ann Inter Med. 2003;138(3):161-167. PubMed
14. James JT. A new, evidence-based estimate of patient harms associated with hospital care. J Patient Saf. 2013;9(3):122-128. PubMed
15. Weinstock MB, Weingart S, Orth F, et al. Risk for clinically relevant adverse cardiac events in patients with chest pain at hospital admission. JAMA Intern Med. 2015;175(7):1207-1212. PubMed
16. Meyer MC, Mooney RP, Sekera AK. A critical pathway for patients with acute chest pain and low risk for short-term adverse cardiac events: role of outpatient stress testing. Ann Emerg Med. 2006;47(5):427-435. PubMed
17. Lai C, Noeller TP, Schmidt K, King P, Emerman CL. Short-term risk after initial observation for chest pain. J Emerg Med. 2003;25(4):357-362. PubMed
18. Scheuermeyer FX, Innes G, Grafstein E, et al. Safety and efficiency of a chest pain diagnostic algorithm with selective outpatient stress testing for emergency department patients with potential ischemic chest pain. Ann Emerg Med. 2012;59(4):256-264 e253. PubMed
19. Safavi KC, Li SX, Dharmarajan K, et al. Hospital variation in the use of noninvasive cardiac imaging and its association with downstream testing, interventions, and outcomes. JAMA Intern Med. 2014;174(4):546-553. PubMed
20. Foy AJ, Liu G, Davidson WR, Jr., Sciamanna C, Leslie DL. Comparative effectiveness of diagnostic testing strategies in emergency department patients with chest pain: an analysis of downstream testing, interventions, and outcomes. JAMA Intern Med. 2015; 175(3):428-436. PubMed
21. Sandhu AT, Heidenreich PA, Bhattacharya J, Bundorf MK. Cardiovascular testing and clinical outcomes in emergency department patients with chest pain. JAMA Intern Med. 2017;177(8):1175-1182. PubMed
22. Fanaroff AC, Rymer JA, Goldstein SA, Simel DL, Newby LK. Does this patient with chest pain have acute coronary syndrome?: The Rational Clinical Examination Systematic Review. JAMA. 2015;314(18):1955-1965. PubMed
23. Hess EP, Hollander JE, Schaffer JT, et al. Shared decision making in patients with low risk chest pain: prospective randomized pragmatic trial. BMJ. 2016;355:i6165. PubMed
© 2018 Society of Hospital Medicine
Issues Identified by Postdischarge Contact after Pediatric Hospitalization: A Multisite Study
Many hospitals are considering or currently employing initiatives to contact patients after discharge. Whether conducted via telephone or other means, the purpose of the contact is to help patients adhere to discharge plans, fulfill discharge needs, and alleviate postdischarge issues (PDIs). The effectiveness of hospital-initiated postdischarge phone calls has been studied in adult patients after hospitalization, and though some studies report positive outcomes,1-3 a 2006 Cochrane review found insufficient evidence to recommend for or against the practice.4
Little is known about follow-up contact after hospitalization for children.5-11 Rates of PDI vary substantially across hospitals. For example, one single-center study of postdischarge telephone contact after hospitalization on a general pediatric ward identified PDIs in ~20% of patients.10 Another study identified PDIs in 84% of patients discharged from a pediatric rehabilitation facility.11 Telephone follow-up has been associated with reduced health resource utilization and improved patient satisfaction for children discharged after an elective surgical procedure6 and for children discharged home from the emergency department.7-9
More information is needed on the clinical experiences of postdischarge contact in hospitalized children to improve the understanding of how the contact is made, who makes it, and which patients are most likely to report a PDI. These experiences are crucial to understand given the expense and time commitment involved in postdischarge contact, as many hospitals may not be positioned to contact all discharged patients. Therefore, we conducted a pragmatic, retrospective, naturalistic study of differing approaches to postdischarge contact occurring in multiple hospitals. Our main objective was to describe the prevalence and types of PDIs identified by the different approaches for follow-up contact across 4 children’s hospitals. We also assessed the characteristics of children who have the highest likelihood of having a PDI identified from the contact within each hospital.
METHODS
Study Design, Setting, and Population
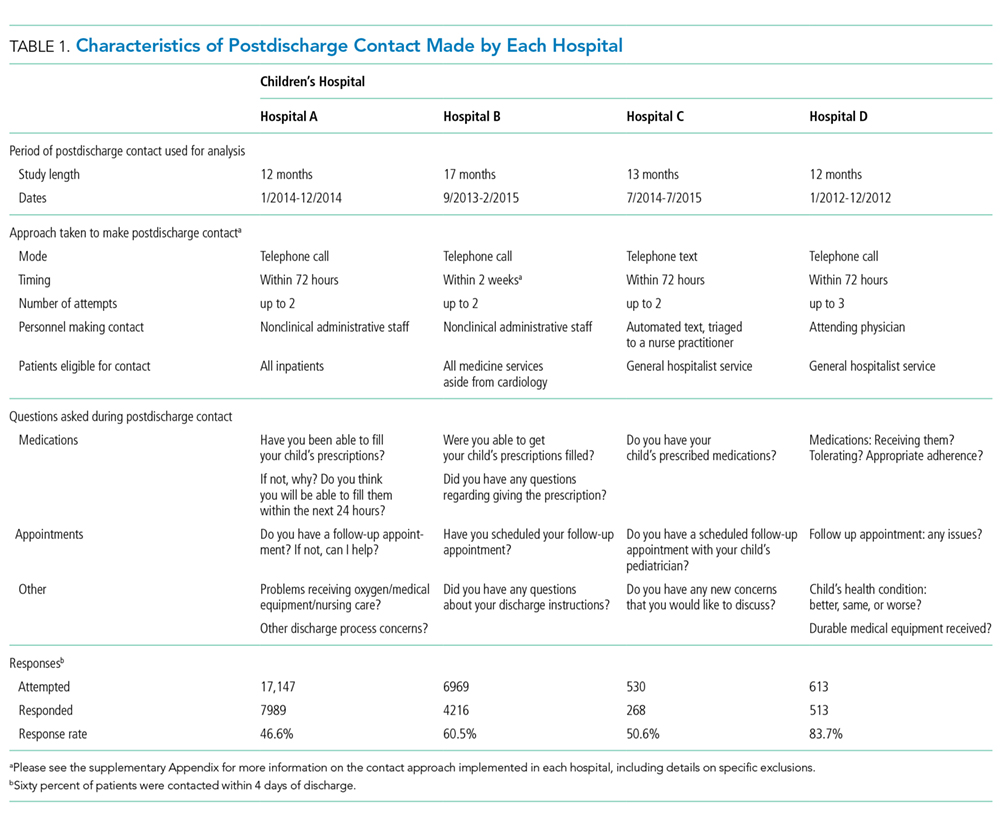
Main Outcome Measures
The main outcome measure was identification of a PDI, defined as a medication, appointment, or other discharge-related issue, that was reported and recorded by the child’s caregiver during conversation from the standardized questions that were asked during follow-up contact as part of routine discharge care (Table 1). Medication PDIs included issues filling prescriptions and tolerating medications. Appointment PDIs included not having a follow-up appointment scheduled. Other PDIs included issues with the child’s health condition, discharge instructions, or any other concerns. All PDIs had been recorded prospectively by hospital contact personnel (hospitals A, B, and D) or through an automated texting system into a database (hospital C). Where available, free text comments that were recorded by contact personnel were reviewed by one of the authors (KB) and categorized via an existing framework of PDI designed by Heath et al.10 in order to further understand the problems that were reported.
Patient Characteristics
Patient hospitalization, demographic, and clinical characteristics were obtained from administrative health data at each institution and compared between children with versus without a PDI. Hospitalization characteristics included length of stay, season of admission, and reason for admission. Reason for admission was categorized by using 3M Health’s All Patient Refined Diagnosis Related Groups (APR-DRG) (3M, Maplewood, MN). Demographic characteristics included age at admission in years, insurance type (eg, public, private, and other), and race/ethnicity (Asian/Pacific Islander, Hispanic, non-Hispanic black, non-Hispanic white, and other).
Clinical characteristics included a count of the different classes of medications (eg, antibiotics, antiepileptic medications, digestive motility medications, etc.) administered to the child during admission, the type and number of chronic conditions, and assistance with medical technology (eg, gastrostomy, tracheostomy, etc.). Except for medications, these characteristics were assessed with International Classification of Diseases, Ninth Revision-Clinical Modification (ICD-9-CM) diagnosis codes.
We used the Agency for Healthcare Research and Quality Chronic Condition Indicator classification system, which categorizes over 14,000 ICD-9-CM diagnosis codes into chronic versus nonchronic conditions to identify the presence and number of chronic conditions.12 Children hospitalized with a chronic condition were further classified as having a complex chronic condition (CCC) by using the ICD-9-CM diagnosis classification scheme of Feudtner et al.13 CCCs represent defined diagnosis groupings of conditions expected to last longer than 12 months and involve either multiple organ systems or a single organ system severely enough to require specialty pediatric care and hospitalization.13,14 Children requiring medical technology were identified by using ICD-9-CM codes indicating their use of a medical device to manage and treat a chronic illness (eg, ventricular shunt to treat hydrocephalus) or to maintain basic body functions necessary for sustaining life (eg a tracheostomy tube for breathing).15,16
Statistical Analysis
Given that the primary purpose for this study was to leverage the natural heterogeneity in the approach to follow-up contact across hospitals, we assessed and reported the prevalence and type of PDIs independently for each hospital. Relatedly, we assessed the relationship between patient characteristics and PDI likelihood independently within each hospital as well rather than pool the data and perform a central analysis across hospitals. Of note, APR-DRG and medication class were not assessed for hospital D, as this information was unavailable. We used χ2 tests for univariable analysis and logistic regression with a backwards elimination derivation process (for variables with P ≥ .05) for multivariable analysis; all patient demographic, clinical, and hospitalization characteristics were entered initially into the models. All statistical analyses were performed using SAS version 9.3 (SAS Institute, Cary, NC), and P < .05 was considered statistically significant. This study was approved by the institutional review board at all hospitals.
RESULTS
Study Population
There were 12,986 (51.4%) of 25,259 patients reached by follow-up contact after discharge across the 4 hospitals. Median age at admission for contacted patients was 4.0 years (interquartile range [IQR] 0-11). Of those contacted, 45.2% were female, 59.9% were non-Hispanic white, 51.0% used Medicaid, and 95.4% were discharged to home. Seventy-one percent had a chronic condition (of any complexity) and 40.8% had a CCC. Eighty percent received a prescribed medication during the hospitalization. Median (IQR) length of stay was 2.0 days (IQR 1-4 days). The top 5 most common reasons for admission were bronchiolitis (6.3%), pneumonia (6.2%), asthma (5.2%), seizure (4.9%), and tonsil and adenoid procedures (4.1%).
PDIs
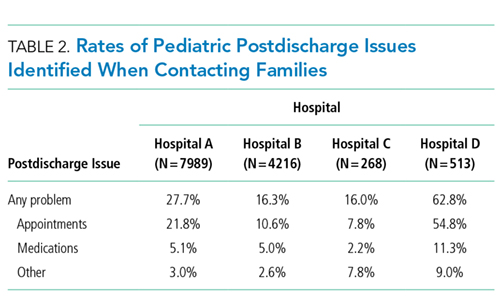
Characteristics Associated with PDIs
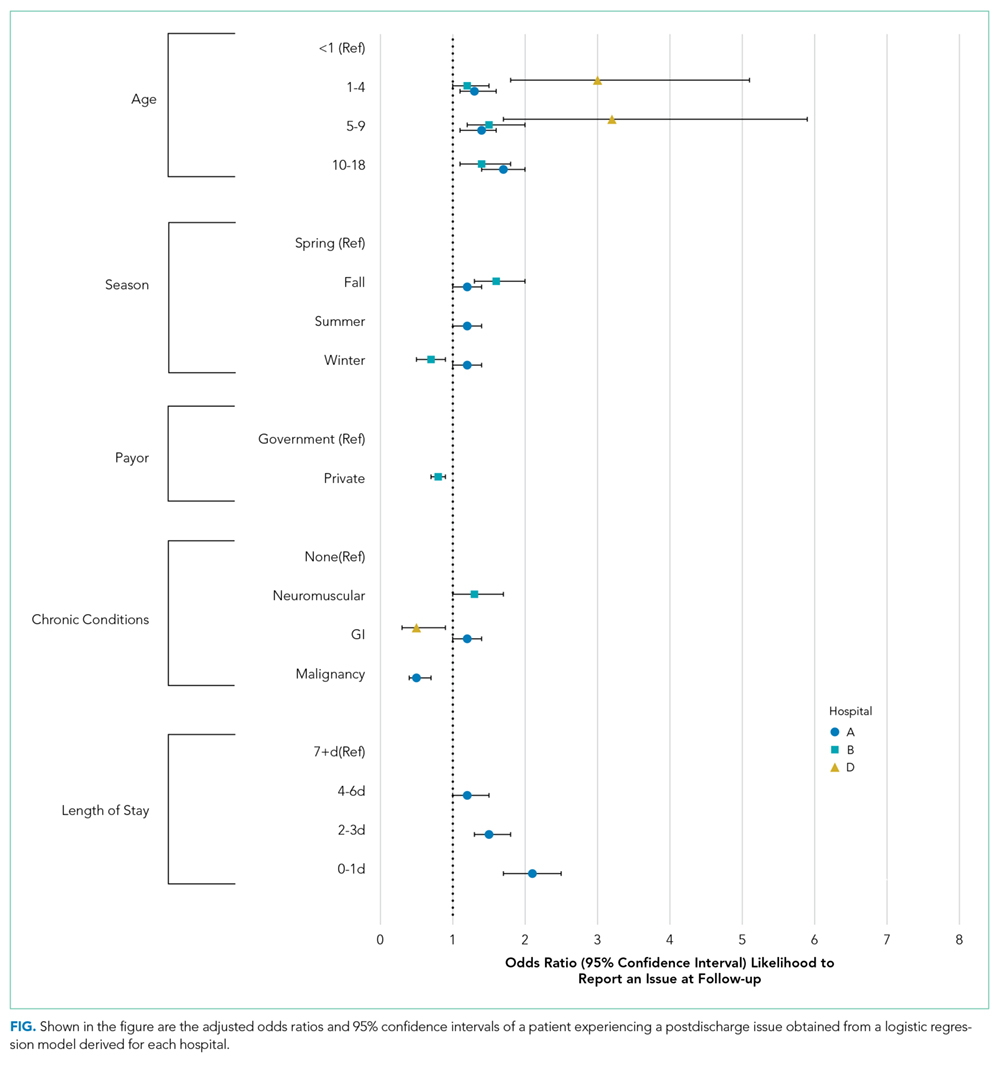
Age
Older age was a consistent characteristic associated with PDIs in 3 hospitals. For example, PDI rates in children 10 to 18 years versus <1 year were 30.8% versus 21.4% (P < .001) in hospital A, 19.4% versus 13.7% (P = .002) in hospital B, and 70.3% versus 62.8% (P < .001) in hospital D. In multivariable analysis, age 10 to 18 years versus <1 year at admission was associated with an increased likelihood of PDI in hospital A (odds ratio [OR] 1.7; 95% CI, 1.4-2.0), hospital B (OR 1.4; 95% CI, 1.1-1.8), and hospital D (OR 1.7; 95% CI, 0.9-3.0) (Table 3 and Figure).
Medications
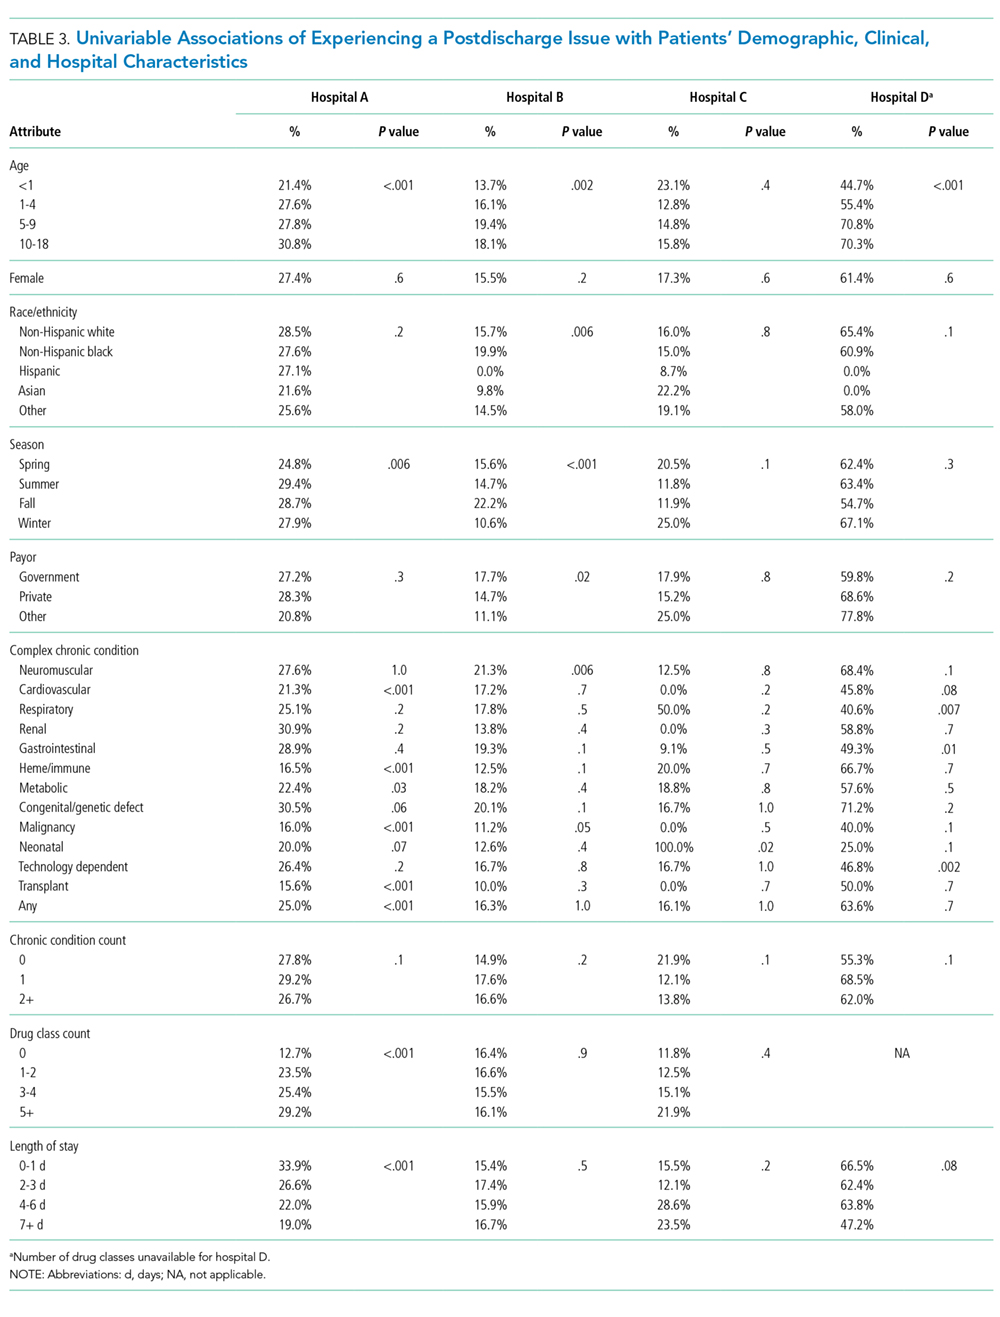
Length of Stay
Shorter length of stay was associated with PDI in 1 hospital. In hospital A, the PDI rate increased significantly (P < .001) from 19.0% to 33.9% as length of stay decreased from ≥7 days to ≤1 day (Table 3). In multivariable analysis, length of stay to ≤1 day versus ≥7 days was associated with increased likelihood of PDI (OR 2.1; 95% CI, 1.7-2.5) in hospital A (Table 3 and Figure).
CCCs
A neuromuscular CCC was associated with PDI in 2 hospitals. In hospital B, the PDI rate was higher in children with a neuromuscular CCC compared with a malignancy CCC (21.3% vs 11.2%). In hospital D, the PDI rates were higher in children with a neuromuscular CCC compared with a respiratory CCC (68.9% vs 40.6%) (Table 3). In multivariable analysis, children with versus without a neuromuscular CCC had an increased likelihood of PDI (OR 1.3; 95% CI, 1.0-1.7) in hospital B (Table 3 and Figure).
DISCUSSION
In this retrospective, pragmatic, multicentered study of follow-up contact with a standardized set of questions asked after discharge for hospitalized children, we found that PDIs were identified often, regardless of who made the contact or how the contact was made. The PDI rates varied substantially across hospitals and were likely influenced by the different follow-up approaches that were used. Most PDIs were related to appointments; fewer PDIs were related to medications and other problems. Older age, shorter length of stay, and neuromuscular CCCs were among the identified risk factors for PDIs.
Our assessment of PDIs was, by design, associated with variation in methods and approach for detection across sites. Further investigation is needed to understand how different approaches for follow-up contact after discharge may influence the identification of PDIs. For example, in the current study, the hospital with the highest PDI rate (hospital D) used hospitalists who provided inpatient care for the patient to make follow-up contact. Although not determined from the current study, this approach could have led the hospitalists to ask questions beyond the standardized ones when assessing for PDIs. Perhaps some of the hospitalists had a better understanding of how to probe for PDIs specific to each patient; this understanding may not have been forthcoming for staff in the other hospitals who were unfamiliar with the patients’ hospitalization course and medical history.
Similar to previous studies in adults, our study reported that appointment PDIs in children may be more common than other types of PDIs.17 Appointment PDIs could have been due to scheduling difficulties, inadequate discharge instructions, lack of adherence to recommended follow-up, or other reasons. Further investigation is needed to elucidate these reasons and to determine how to reduce PDIs related to postdischarge appointments. Some children’s hospitals schedule follow-up appointments prior to discharge to mitigate appointment PDIs that might arise.18 However, doing that for every hospitalized child is challenging, especially for very short admissions or for weekend discharges when many outpatient and community practices are not open to schedule appointments. Additional exploration is necessary to assess whether this might help explain why some children in the current study with a short versus long length of stay had a higher likelihood of PDI.
The rate of medication PDIs (5.2%) observed in the current study is lower than the rate that is reported in prior literature. Dudas et al.1 found that medication PDIs occurred in 21% of hospitalized adult patients. One reason for the lower rate of medication PDIs in children may be that they require the use of postdischarge medications less often than adults. Most medication PDIs in the current study involved problems filling a prescription. There was not enough information in the notes taken from the follow-up contact to distinguish the medication PDI etiologies (eg, a prescription was not sent from the hospital team to the pharmacy, prior authorization from an insurance company for a prescription was not obtained, the pharmacy did not stock the medication). To help overcome medication access barriers, some hospitals fill and deliver discharge medications to the patients’ bedside. One study found that children discharged with medication in hand were less likely to have emergency department revisits within 30 days of discharge.19 Further investigation is needed to assess whether initiatives like these help mitigate medication PDIs in children.
Hospitals may benefit from considering how risk factors for PDIs can be used to prioritize which patients receive follow-up contact, especially in hospitals where contact for all hospitalized patients is not feasible. In the current study, there was variation across hospitals in the profile of risk factors that correlated with increased likelihood of PDI. Some of the risk factors are easier to explain than others. For example, as mentioned above, for some hospitalized children, short length of stay might not permit enough time for hospital staff to set up discharge plans that may sufficiently prevent PDIs. Other risk factors, including older age and neuromuscular CCCs, may require additional assessment (eg, through chart review or in-depth patient and provider interviews) to discover the reasons why they were associated with increased likelihood of PDI. There are additional risk factors that might influence the likelihood of PDI that the current study was not positioned to assess, including health literacy, transportation availability, and language spoken.20-23
This study has several other limitations in addition to the ones already mentioned. Some children may have experienced PDIs that were not reported at contact (eg, the respondent was unaware that an issue was present), which may have led to an undercounting of PDIs. Alternatively, some caregivers may have been more likely to respond to the contact if their child was experiencing a PDI, which may have led to overcounting. PDIs of nonrespondents were not measured. PDIs identified by postdischarge outpatient and community providers or by families outside of contact were not measured. The current study was not positioned to assess the severity of the PDIs or what interventions (including additional health services) were needed to address them. Although we assessed medication use during admission, we were unable to assess the number and type of medications that were prescribed for use postdischarge. Information about the number and type of follow-up visits needed for each child was not assessed. Given the variety of approaches for follow-up contact, the findings may generalize best to individual hospitals by using an approach that best matches to one of them. The current study is not positioned to correlate quality of discharge care with the rate of PDI.
Despite these limitations, the findings from the current study reinforce that PDIs identified through follow-up contact in discharged patients appear to be common. Of PDIs identified, appointment problems were more prevalent than medication or other types of problems. Short length of stay, older age, and other patient and/or hospitalization attributes were associated with an increased likelihood of PDI. Hospitals caring for children may find this information useful as they strive to optimize their processes for follow-up contact after discharge. To help further evaluate the value and importance of contacting patients after discharge, additional study of PDI in children is warranted, including (1) actions taken to resolve PDIs, (2) the impact of identifying and addressing PDIs on hospital readmission, and (3) postdischarge experiences and health outcomes of children who responded versus those who did not respond to the follow-up contact. Moreover, future multisite, comparative effectiveness studies of PDI may wish to consider standardization of follow-up contact procedures with controlled manipulation of key processes (eg, contact by administrator vs nurse vs physician) to assess best practices.
Disclosure
Mr. Blaine, Ms. O’Neill, and Drs. Berry, Brittan, Rehm, and Steiner were supported by the Lucile Packard Foundation for Children’s Health. The authors have no financial relationships relative to this article to disclose. The authors have no conflicts of interest to disclose.
1. Dudas V, Bookwalter T, Kerr KM, Pantilat SZ. The impact of follow-up telephone calls to patients after hospitalization. Dis Mon. 2002;48(4):239-248. PubMed
2. Sanchez GM, Douglass MA, Mancuso MA. Revisiting Project Re-Engineered Discharge (RED): The Impact of a Pharmacist Telephone Intervention on Hospital Readmission Rates. Pharmacotherapy. 2015;35(9):805-812. PubMed
3. Jones J, Clark W, Bradford J, Dougherty J. Efficacy of a telephone follow-up system in the emergency department. J Emerg Med. 1988;6(3):249-254. PubMed
4. Mistiaen P, Poot E. Telephone follow-up, initiated by a hospital-based health professional, for postdischarge problems in patients discharged from hospital to home. Cochrane Database Syst Rev. 2006(4):CD004510. PubMed
5. Lushaj EB, Nelson K, Amond K, Kenny E, Badami A, Anagnostopoulos PV. Timely Post-discharge Telephone Follow-Up is a Useful Tool in Identifying Post-discharge Complications Patients After Congenital Heart Surgery. Pediatr Cardiol. 2016;37(6):1106-1110. PubMed
6. McVay MR, Kelley KR, Mathews DL, Jackson RJ, Kokoska ER, Smith SD. Postoperative follow-up: is a phone call enough? J Pediatr Surg. 2008;43(1):83-86. PubMed
7. Chande VT, Exum V. Follow-up phone calls after an emergency department visit. Pediatrics. 1994;93(3):513-514. PubMed
8. Sutton D, Stanley P, Babl FE, Phillips F. Preventing or accelerating emergency care for children with complex healthcare needs. Arch Dis Child. 2008;93(1):17-22. PubMed
9. Patel PB, Vinson DR. Physician e-mail and telephone contact after emergency department visit improves patient satisfaction: a crossover trial. Ann Emerg Med. 2013;61(6):631-637. PubMed
10. Heath J, Dancel R, Stephens JR. Postdischarge phone calls after pediatric hospitalization: an observational study. Hosp Pediatr. 2015;5(5):241-248. PubMed
11. Biffl SE, Biffl WL. Improving transitions of care for complex pediatric trauma patients from inpatient rehabilitation to home: an observational pilot study. Patient Saf Surg. 2015;9:33-37. PubMed
12. AHRQ. Clinical Classifications Software (CCS) for ICD-9-CM. http://www.hcup-us.ahrq.gov/toolssoftware/ccs/ccs.jsp. Accessed on January 31,2012.
13. Feudtner C, Christakis DA, Connell FA. Pediatric deaths attributable to complex chronic conditions: a population-based study of Washington State, 1980-1997. Pediatrics. 2000;106(1 Pt 2):205-209. PubMed
14. Berry JG, Hall DE, Kuo DZ, et al. Hospital utilization and characteristics of patients experiencing recurrent readmissions within children’s hospitals. JAMA. 2011;305(7):682-690. PubMed
15. Palfrey JS, Walker DK, Haynie M, et al. Technology’s children: report of a statewide census of children dependent on medical supports. Pediatrics. 1991;87(5):611-618. PubMed
16. Feudtner C, Villareale NL, Morray B, Sharp V, Hays RM, Neff JM. Technology-dependency among patients discharged from a children’s hospital: a retrospective cohort study. BMC Pediatr. 2005;5(1):8-15. PubMed
17. Arora VM, Prochaska ML, Farnan JM, et al. Problems after discharge and understanding of communication with their primary care physicians among hospitalized seniors: a mixed methods study. J Hosp Med. 2010;5(7):385-391. PubMed
18. Brittan M, Tyler A, Martin S, et al. A Discharge Planning Template for the Electronic Medical Record Improves Scheduling of Neurology Follow-up for Comanaged Seizure Patients. Hosp Pediatr. 2014;4(6):366-371. PubMed
19. Hatoun J, Bair-Merritt M, Cabral H, Moses J. Increasing Medication Possession at Discharge for Patients With Asthma: The Meds-in-Hand Project. Pediatrics. 2016;137(3):e20150461. doi:10.1542/peds.2015-0461. PubMed
20. Berry JG, Goldmann DA, Mandl KD, et al. Health information management and perceptions of the quality of care for children with tracheotomy: a qualitative study. BMC Health Serv Res. 2011;11:117-125. PubMed
21. Berry JG, Ziniel SI, Freeman L, et al. Hospital readmission and parent perceptions of their child’s hospital discharge. Int J Qual Health Care. 2013;25(5):573-581. PubMed
22. Carusone SC, O’Leary B, McWatt S, Stewart A, Craig S, Brennan DJ. The Lived Experience of the Hospital Discharge “Plan”: A Longitudinal Qualitative Study of Complex Patients. J Hosp Med. 2017;12(1):5-10. PubMed
23. Leyenaar JK, O’Brien ER, Leslie LK, Lindenauer PK, Mangione-Smith RM. Families’ Priorities Regarding Hospital-to-Home Transitions for Children With Medical Complexity. Pediatrics. 2017;139(1):e20161581. doi:10.1542/peds.2016-1581. PubMed
Many hospitals are considering or currently employing initiatives to contact patients after discharge. Whether conducted via telephone or other means, the purpose of the contact is to help patients adhere to discharge plans, fulfill discharge needs, and alleviate postdischarge issues (PDIs). The effectiveness of hospital-initiated postdischarge phone calls has been studied in adult patients after hospitalization, and though some studies report positive outcomes,1-3 a 2006 Cochrane review found insufficient evidence to recommend for or against the practice.4
Little is known about follow-up contact after hospitalization for children.5-11 Rates of PDI vary substantially across hospitals. For example, one single-center study of postdischarge telephone contact after hospitalization on a general pediatric ward identified PDIs in ~20% of patients.10 Another study identified PDIs in 84% of patients discharged from a pediatric rehabilitation facility.11 Telephone follow-up has been associated with reduced health resource utilization and improved patient satisfaction for children discharged after an elective surgical procedure6 and for children discharged home from the emergency department.7-9
More information is needed on the clinical experiences of postdischarge contact in hospitalized children to improve the understanding of how the contact is made, who makes it, and which patients are most likely to report a PDI. These experiences are crucial to understand given the expense and time commitment involved in postdischarge contact, as many hospitals may not be positioned to contact all discharged patients. Therefore, we conducted a pragmatic, retrospective, naturalistic study of differing approaches to postdischarge contact occurring in multiple hospitals. Our main objective was to describe the prevalence and types of PDIs identified by the different approaches for follow-up contact across 4 children’s hospitals. We also assessed the characteristics of children who have the highest likelihood of having a PDI identified from the contact within each hospital.
METHODS
Study Design, Setting, and Population
Main Outcome Measures
The main outcome measure was identification of a PDI, defined as a medication, appointment, or other discharge-related issue, that was reported and recorded by the child’s caregiver during conversation from the standardized questions that were asked during follow-up contact as part of routine discharge care (Table 1). Medication PDIs included issues filling prescriptions and tolerating medications. Appointment PDIs included not having a follow-up appointment scheduled. Other PDIs included issues with the child’s health condition, discharge instructions, or any other concerns. All PDIs had been recorded prospectively by hospital contact personnel (hospitals A, B, and D) or through an automated texting system into a database (hospital C). Where available, free text comments that were recorded by contact personnel were reviewed by one of the authors (KB) and categorized via an existing framework of PDI designed by Heath et al.10 in order to further understand the problems that were reported.
Patient Characteristics
Patient hospitalization, demographic, and clinical characteristics were obtained from administrative health data at each institution and compared between children with versus without a PDI. Hospitalization characteristics included length of stay, season of admission, and reason for admission. Reason for admission was categorized by using 3M Health’s All Patient Refined Diagnosis Related Groups (APR-DRG) (3M, Maplewood, MN). Demographic characteristics included age at admission in years, insurance type (eg, public, private, and other), and race/ethnicity (Asian/Pacific Islander, Hispanic, non-Hispanic black, non-Hispanic white, and other).
Clinical characteristics included a count of the different classes of medications (eg, antibiotics, antiepileptic medications, digestive motility medications, etc.) administered to the child during admission, the type and number of chronic conditions, and assistance with medical technology (eg, gastrostomy, tracheostomy, etc.). Except for medications, these characteristics were assessed with International Classification of Diseases, Ninth Revision-Clinical Modification (ICD-9-CM) diagnosis codes.
We used the Agency for Healthcare Research and Quality Chronic Condition Indicator classification system, which categorizes over 14,000 ICD-9-CM diagnosis codes into chronic versus nonchronic conditions to identify the presence and number of chronic conditions.12 Children hospitalized with a chronic condition were further classified as having a complex chronic condition (CCC) by using the ICD-9-CM diagnosis classification scheme of Feudtner et al.13 CCCs represent defined diagnosis groupings of conditions expected to last longer than 12 months and involve either multiple organ systems or a single organ system severely enough to require specialty pediatric care and hospitalization.13,14 Children requiring medical technology were identified by using ICD-9-CM codes indicating their use of a medical device to manage and treat a chronic illness (eg, ventricular shunt to treat hydrocephalus) or to maintain basic body functions necessary for sustaining life (eg a tracheostomy tube for breathing).15,16
Statistical Analysis
Given that the primary purpose for this study was to leverage the natural heterogeneity in the approach to follow-up contact across hospitals, we assessed and reported the prevalence and type of PDIs independently for each hospital. Relatedly, we assessed the relationship between patient characteristics and PDI likelihood independently within each hospital as well rather than pool the data and perform a central analysis across hospitals. Of note, APR-DRG and medication class were not assessed for hospital D, as this information was unavailable. We used χ2 tests for univariable analysis and logistic regression with a backwards elimination derivation process (for variables with P ≥ .05) for multivariable analysis; all patient demographic, clinical, and hospitalization characteristics were entered initially into the models. All statistical analyses were performed using SAS version 9.3 (SAS Institute, Cary, NC), and P < .05 was considered statistically significant. This study was approved by the institutional review board at all hospitals.
RESULTS
Study Population
There were 12,986 (51.4%) of 25,259 patients reached by follow-up contact after discharge across the 4 hospitals. Median age at admission for contacted patients was 4.0 years (interquartile range [IQR] 0-11). Of those contacted, 45.2% were female, 59.9% were non-Hispanic white, 51.0% used Medicaid, and 95.4% were discharged to home. Seventy-one percent had a chronic condition (of any complexity) and 40.8% had a CCC. Eighty percent received a prescribed medication during the hospitalization. Median (IQR) length of stay was 2.0 days (IQR 1-4 days). The top 5 most common reasons for admission were bronchiolitis (6.3%), pneumonia (6.2%), asthma (5.2%), seizure (4.9%), and tonsil and adenoid procedures (4.1%).
PDIs
Characteristics Associated with PDIs
Age
Older age was a consistent characteristic associated with PDIs in 3 hospitals. For example, PDI rates in children 10 to 18 years versus <1 year were 30.8% versus 21.4% (P < .001) in hospital A, 19.4% versus 13.7% (P = .002) in hospital B, and 70.3% versus 62.8% (P < .001) in hospital D. In multivariable analysis, age 10 to 18 years versus <1 year at admission was associated with an increased likelihood of PDI in hospital A (odds ratio [OR] 1.7; 95% CI, 1.4-2.0), hospital B (OR 1.4; 95% CI, 1.1-1.8), and hospital D (OR 1.7; 95% CI, 0.9-3.0) (Table 3 and Figure).
Medications
Length of Stay
Shorter length of stay was associated with PDI in 1 hospital. In hospital A, the PDI rate increased significantly (P < .001) from 19.0% to 33.9% as length of stay decreased from ≥7 days to ≤1 day (Table 3). In multivariable analysis, length of stay to ≤1 day versus ≥7 days was associated with increased likelihood of PDI (OR 2.1; 95% CI, 1.7-2.5) in hospital A (Table 3 and Figure).
CCCs
A neuromuscular CCC was associated with PDI in 2 hospitals. In hospital B, the PDI rate was higher in children with a neuromuscular CCC compared with a malignancy CCC (21.3% vs 11.2%). In hospital D, the PDI rates were higher in children with a neuromuscular CCC compared with a respiratory CCC (68.9% vs 40.6%) (Table 3). In multivariable analysis, children with versus without a neuromuscular CCC had an increased likelihood of PDI (OR 1.3; 95% CI, 1.0-1.7) in hospital B (Table 3 and Figure).
DISCUSSION
In this retrospective, pragmatic, multicentered study of follow-up contact with a standardized set of questions asked after discharge for hospitalized children, we found that PDIs were identified often, regardless of who made the contact or how the contact was made. The PDI rates varied substantially across hospitals and were likely influenced by the different follow-up approaches that were used. Most PDIs were related to appointments; fewer PDIs were related to medications and other problems. Older age, shorter length of stay, and neuromuscular CCCs were among the identified risk factors for PDIs.
Our assessment of PDIs was, by design, associated with variation in methods and approach for detection across sites. Further investigation is needed to understand how different approaches for follow-up contact after discharge may influence the identification of PDIs. For example, in the current study, the hospital with the highest PDI rate (hospital D) used hospitalists who provided inpatient care for the patient to make follow-up contact. Although not determined from the current study, this approach could have led the hospitalists to ask questions beyond the standardized ones when assessing for PDIs. Perhaps some of the hospitalists had a better understanding of how to probe for PDIs specific to each patient; this understanding may not have been forthcoming for staff in the other hospitals who were unfamiliar with the patients’ hospitalization course and medical history.
Similar to previous studies in adults, our study reported that appointment PDIs in children may be more common than other types of PDIs.17 Appointment PDIs could have been due to scheduling difficulties, inadequate discharge instructions, lack of adherence to recommended follow-up, or other reasons. Further investigation is needed to elucidate these reasons and to determine how to reduce PDIs related to postdischarge appointments. Some children’s hospitals schedule follow-up appointments prior to discharge to mitigate appointment PDIs that might arise.18 However, doing that for every hospitalized child is challenging, especially for very short admissions or for weekend discharges when many outpatient and community practices are not open to schedule appointments. Additional exploration is necessary to assess whether this might help explain why some children in the current study with a short versus long length of stay had a higher likelihood of PDI.
The rate of medication PDIs (5.2%) observed in the current study is lower than the rate that is reported in prior literature. Dudas et al.1 found that medication PDIs occurred in 21% of hospitalized adult patients. One reason for the lower rate of medication PDIs in children may be that they require the use of postdischarge medications less often than adults. Most medication PDIs in the current study involved problems filling a prescription. There was not enough information in the notes taken from the follow-up contact to distinguish the medication PDI etiologies (eg, a prescription was not sent from the hospital team to the pharmacy, prior authorization from an insurance company for a prescription was not obtained, the pharmacy did not stock the medication). To help overcome medication access barriers, some hospitals fill and deliver discharge medications to the patients’ bedside. One study found that children discharged with medication in hand were less likely to have emergency department revisits within 30 days of discharge.19 Further investigation is needed to assess whether initiatives like these help mitigate medication PDIs in children.
Hospitals may benefit from considering how risk factors for PDIs can be used to prioritize which patients receive follow-up contact, especially in hospitals where contact for all hospitalized patients is not feasible. In the current study, there was variation across hospitals in the profile of risk factors that correlated with increased likelihood of PDI. Some of the risk factors are easier to explain than others. For example, as mentioned above, for some hospitalized children, short length of stay might not permit enough time for hospital staff to set up discharge plans that may sufficiently prevent PDIs. Other risk factors, including older age and neuromuscular CCCs, may require additional assessment (eg, through chart review or in-depth patient and provider interviews) to discover the reasons why they were associated with increased likelihood of PDI. There are additional risk factors that might influence the likelihood of PDI that the current study was not positioned to assess, including health literacy, transportation availability, and language spoken.20-23
This study has several other limitations in addition to the ones already mentioned. Some children may have experienced PDIs that were not reported at contact (eg, the respondent was unaware that an issue was present), which may have led to an undercounting of PDIs. Alternatively, some caregivers may have been more likely to respond to the contact if their child was experiencing a PDI, which may have led to overcounting. PDIs of nonrespondents were not measured. PDIs identified by postdischarge outpatient and community providers or by families outside of contact were not measured. The current study was not positioned to assess the severity of the PDIs or what interventions (including additional health services) were needed to address them. Although we assessed medication use during admission, we were unable to assess the number and type of medications that were prescribed for use postdischarge. Information about the number and type of follow-up visits needed for each child was not assessed. Given the variety of approaches for follow-up contact, the findings may generalize best to individual hospitals by using an approach that best matches to one of them. The current study is not positioned to correlate quality of discharge care with the rate of PDI.
Despite these limitations, the findings from the current study reinforce that PDIs identified through follow-up contact in discharged patients appear to be common. Of PDIs identified, appointment problems were more prevalent than medication or other types of problems. Short length of stay, older age, and other patient and/or hospitalization attributes were associated with an increased likelihood of PDI. Hospitals caring for children may find this information useful as they strive to optimize their processes for follow-up contact after discharge. To help further evaluate the value and importance of contacting patients after discharge, additional study of PDI in children is warranted, including (1) actions taken to resolve PDIs, (2) the impact of identifying and addressing PDIs on hospital readmission, and (3) postdischarge experiences and health outcomes of children who responded versus those who did not respond to the follow-up contact. Moreover, future multisite, comparative effectiveness studies of PDI may wish to consider standardization of follow-up contact procedures with controlled manipulation of key processes (eg, contact by administrator vs nurse vs physician) to assess best practices.
Disclosure
Mr. Blaine, Ms. O’Neill, and Drs. Berry, Brittan, Rehm, and Steiner were supported by the Lucile Packard Foundation for Children’s Health. The authors have no financial relationships relative to this article to disclose. The authors have no conflicts of interest to disclose.
1. Dudas V, Bookwalter T, Kerr KM, Pantilat SZ. The impact of follow-up telephone calls to patients after hospitalization. Dis Mon. 2002;48(4):239-248. PubMed
2. Sanchez GM, Douglass MA, Mancuso MA. Revisiting Project Re-Engineered Discharge (RED): The Impact of a Pharmacist Telephone Intervention on Hospital Readmission Rates. Pharmacotherapy. 2015;35(9):805-812. PubMed
3. Jones J, Clark W, Bradford J, Dougherty J. Efficacy of a telephone follow-up system in the emergency department. J Emerg Med. 1988;6(3):249-254. PubMed
4. Mistiaen P, Poot E. Telephone follow-up, initiated by a hospital-based health professional, for postdischarge problems in patients discharged from hospital to home. Cochrane Database Syst Rev. 2006(4):CD004510. PubMed
5. Lushaj EB, Nelson K, Amond K, Kenny E, Badami A, Anagnostopoulos PV. Timely Post-discharge Telephone Follow-Up is a Useful Tool in Identifying Post-discharge Complications Patients After Congenital Heart Surgery. Pediatr Cardiol. 2016;37(6):1106-1110. PubMed
6. McVay MR, Kelley KR, Mathews DL, Jackson RJ, Kokoska ER, Smith SD. Postoperative follow-up: is a phone call enough? J Pediatr Surg. 2008;43(1):83-86. PubMed
7. Chande VT, Exum V. Follow-up phone calls after an emergency department visit. Pediatrics. 1994;93(3):513-514. PubMed
8. Sutton D, Stanley P, Babl FE, Phillips F. Preventing or accelerating emergency care for children with complex healthcare needs. Arch Dis Child. 2008;93(1):17-22. PubMed
9. Patel PB, Vinson DR. Physician e-mail and telephone contact after emergency department visit improves patient satisfaction: a crossover trial. Ann Emerg Med. 2013;61(6):631-637. PubMed
10. Heath J, Dancel R, Stephens JR. Postdischarge phone calls after pediatric hospitalization: an observational study. Hosp Pediatr. 2015;5(5):241-248. PubMed
11. Biffl SE, Biffl WL. Improving transitions of care for complex pediatric trauma patients from inpatient rehabilitation to home: an observational pilot study. Patient Saf Surg. 2015;9:33-37. PubMed
12. AHRQ. Clinical Classifications Software (CCS) for ICD-9-CM. http://www.hcup-us.ahrq.gov/toolssoftware/ccs/ccs.jsp. Accessed on January 31,2012.
13. Feudtner C, Christakis DA, Connell FA. Pediatric deaths attributable to complex chronic conditions: a population-based study of Washington State, 1980-1997. Pediatrics. 2000;106(1 Pt 2):205-209. PubMed
14. Berry JG, Hall DE, Kuo DZ, et al. Hospital utilization and characteristics of patients experiencing recurrent readmissions within children’s hospitals. JAMA. 2011;305(7):682-690. PubMed
15. Palfrey JS, Walker DK, Haynie M, et al. Technology’s children: report of a statewide census of children dependent on medical supports. Pediatrics. 1991;87(5):611-618. PubMed
16. Feudtner C, Villareale NL, Morray B, Sharp V, Hays RM, Neff JM. Technology-dependency among patients discharged from a children’s hospital: a retrospective cohort study. BMC Pediatr. 2005;5(1):8-15. PubMed
17. Arora VM, Prochaska ML, Farnan JM, et al. Problems after discharge and understanding of communication with their primary care physicians among hospitalized seniors: a mixed methods study. J Hosp Med. 2010;5(7):385-391. PubMed
18. Brittan M, Tyler A, Martin S, et al. A Discharge Planning Template for the Electronic Medical Record Improves Scheduling of Neurology Follow-up for Comanaged Seizure Patients. Hosp Pediatr. 2014;4(6):366-371. PubMed
19. Hatoun J, Bair-Merritt M, Cabral H, Moses J. Increasing Medication Possession at Discharge for Patients With Asthma: The Meds-in-Hand Project. Pediatrics. 2016;137(3):e20150461. doi:10.1542/peds.2015-0461. PubMed
20. Berry JG, Goldmann DA, Mandl KD, et al. Health information management and perceptions of the quality of care for children with tracheotomy: a qualitative study. BMC Health Serv Res. 2011;11:117-125. PubMed
21. Berry JG, Ziniel SI, Freeman L, et al. Hospital readmission and parent perceptions of their child’s hospital discharge. Int J Qual Health Care. 2013;25(5):573-581. PubMed
22. Carusone SC, O’Leary B, McWatt S, Stewart A, Craig S, Brennan DJ. The Lived Experience of the Hospital Discharge “Plan”: A Longitudinal Qualitative Study of Complex Patients. J Hosp Med. 2017;12(1):5-10. PubMed
23. Leyenaar JK, O’Brien ER, Leslie LK, Lindenauer PK, Mangione-Smith RM. Families’ Priorities Regarding Hospital-to-Home Transitions for Children With Medical Complexity. Pediatrics. 2017;139(1):e20161581. doi:10.1542/peds.2016-1581. PubMed
© 2018 Society of Hospital Medicine
Implementation of a Process for Initiating Naltrexone in Patients Hospitalized for Alcohol Detoxification or Withdrawal
Alcohol use disorders (AUDs) are common, with an estimated lifetime prevalence of 17.8% for alcohol dependence.1 Alcohol misuse is costly, accounting for $24.6 billion in annual healthcare expenditures, including $5.1 billion for alcohol-related hospitalizations.2 A number of trials have demonstrated that naltrexone can help patients with AUDs maintain abstinence or diminish heavy drinking.3-10 A recent meta-analysis of pharmacotherapy trials for patients with AUDs reported that for patients using 50 mg of naltrexone daily, the number needed to treat was 12 to prevent a return to heavy drinking and 20 to prevent a return to any drinking.11 Despite good evidence for its effectiveness, naltrexone is not prescribed to the majority of patients with AUDs. In a study of veterans with AUDs cared for in the Veterans Affairs health system, only 1.9% of patients were prescribed naltrexone over the 6-month study period.12 A 2003 survey of 2 professional organizations for addiction treatment specialists reported that a mean of 13% of providers prescribed naltrexone to their patients.13
When naltrexone is prescribed, it is most frequently in the outpatient setting.3-10 Data for initiation of naltrexone in the inpatient setting are more limited. Wei et al.14 reported on the implementation of a discharge protocol, including counseling about naltrexone, for hospitalized patients with AUDs at an urban academic medical center. They reported a significant increase in the prescription of naltrexone to eligible patients by the time of discharge that was associated with a significant decrease in 30-day readmissions. Initiation of naltrexone in the inpatient versus the outpatient setting has some potential advantages. First, patients hospitalized for alcohol withdrawal have AUDs, obviating the need for screening. Second, the outpatient trials of naltrexone typically required 3 days of sobriety before initiation, which is generally achieved during hospitalization for detoxification or withdrawal.
Previous work at our institution centered on standardizing the process of evaluating patients needing alcohol detoxification at the time of referral for admission.15 The use of a standardized protocol reduced the number of inpatient admissions for alcohol-related diagnoses but had no effect on the 30-day readmission rate (28%) for those patients who were hospitalized. Our hospitalist group had no standardized process for discharging hospitalized patients with AUDs, and the discharge process rarely included counseling on medications for maintenance of sobriety. In this manuscript, we describe the implementation and impact of a process for counseling patients hospitalized for alcohol detoxification or withdrawal about naltrexone for maintenance of sobriety by the time of hospital discharge.
METHODS
Study Setting
The University of North Carolina (UNC) Hospitals is an 803-bed tertiary academic center. UNC Hospital Medicine is staffed by 29 physicians and 3 advanced practice providers (APPs). During the study period, there were 3 hospital medicine services at UNC Hospitals with a combined average daily census of approximately 40 patients, and each service was staffed by one attending physician every day of the week and one APP Monday through Friday.
Study Design
We used a pre-post study design, in which we implemented a new process for standardizing the discharge of hospitalized patients with AUDs, including a process for counseling about naltrexone by the time of discharge. We sought and received institutional review board (IRB) approval for this study (UNC IRB 15-1441).
Interventions
We formed an improvement team that included 3 physicians and an APP in hospital medicine, a general internist and a psychiatrist, both with expertise in the use of medications for maintenance of sobriety, the director of UNC’s Alcohol and Substance Abuse Program, and 2 case managers. The team developed a number of interventions, including group education, a process for patient identification, and algorithms for counseling about, prescribing, and documenting the discussion of naltrexone.
Group Education
We presented evidence about medications for the maintenance of sobriety at a regularly scheduled hospitalist meeting. An hour-long session on motivational interviewing techniques was also presented at a separate meeting. All created algorithms were circulated to the group electronically and posted at workstations in the hospitalist work area. As data were generated postimplementation, control charts of process measures were created, posted in the hospitalist work area, and presented at subsequent group meetings.
Identification of Patients
We focused our interventions on patients admitted for alcohol detoxification or withdrawal (including withdrawal seizures). We asked our group to preferentially admit these patients to 1 of our 3 hospitalists services, on which the service APP (K.S.) was also an improvement team member.
Creation of Algorithms and Scripts for Counseling
We created a simple algorithm for evaluating patients for naltrexone. We recommended that all patients admitted for alcohol detoxification or withdrawal be counseled about naltrexone for the maintenance of sobriety before discharge. The contraindications to naltrexone we included were (1) concurrent opioid use, (2) documented cirrhosis, and/or (3) liver function tests greater than 3 times the upper limit of normal by the time of hospital discharge.
We also created a suggested script for motivational interviewing (supplemental Appendix 1). This was presented at a group meeting and circulated via e-mail. The actual counseling technique and process was left up to individual providers. In practice, counseling took place in the course of daily rounds, generally the day before or day of hospital discharge.
Prescription of Medication
For interested patients without contraindications, we recommended a prescription of naltrexone at 50 mg daily for 3 months. For patients prescribed naltrexone without medical insurance (n = 17), we utilized our existing pharmacy assistance program, whereby discharging patients can obtain an initial 14-day supply after applying to the program and then can fill subsequent prescriptions if they meet program financial requirements.
Follow-up Appointments
For patients with established outpatient providers, we asked patients to schedule follow-up appointments within a month of discharge. Patients prescribed naltrexone without primary providers (n = 16) were eligible for an existing program, the UNC Transitions Program, whereby patients identified as having moderate-to-high risk of hospital readmission can receive a follow-up appointment at UNC Internal Medicine or UNC Family Medicine within 2 weeks of discharge.
Creation of “Smart Phrases”
To aid in documentation, we created “smart phrases” (easily accessed, previously created phrases that can be adopted by all users) within the hospital electronic health record. We created one smart phrase for documentation of counseling about naltrexone, which included dropdown menus for contraindications and the patient’s preference and one for discharge instructions for patients started on naltrexone (supplemental Appendix 2).
Implementation
After the presentation of suggested interventions in July 2015 and the subsequent dissemination of educational materials, we implemented our new process on August 1, 2015.
Data Collection
Patients were identified for inclusion in the study analysis by querying UNC Hospitals’ billing database for the inpatient diagnosis codes (diagnosis-related groupings) 896 and 897, “alcohol/drug abuse or dependence without rehabilitation therapy,” with and without major comorbidity or complication, respectively, and with hospital medicine as the discharging service. All encounters were then manually reviewed by 2 investigators (J.S. and C.M.). Encounters were included if the history and physical indicated that the primary reason for admission was alcohol detoxification or withdrawal. Encounters with other primary reasons for admission (eg, pancreatitis, gastrointestinal bleeding) were excluded. For patients with multiple encounters, only the first eligible encounter in the pre- and/or postimplementation period was included. Comorbidities for identified patients were assessed via the search of study encounters for the International Classification of Diseases, 9th Revision-Clinical Modification codes for hypertension, anxiety, depression, cirrhosis, diabetes, and congestive heart failure.
Process, Outcomes, and Balancing Measures
The study process measures included the percentage of patients hospitalized for alcohol detoxification or withdrawal with documentation of counseling about naltrexone by the time of discharge, before and after process intervention. Documentation was defined as the description of counseling about naltrexone in the discharge summary or progress notes of identified encounters. We also measured the percentage of patients started on naltrexone before and after intervention. Lastly, we measured the percentage of patients prescribed naltrexone who filled at least 1 prescription for the medication, assessed by calls to the pharmacy where the medication was prescribed. Prescriptions that could not be confirmed (ie, paper rather than electronic prescriptions) were counted as not filled.
For outcome measures, we recorded the percentages of study patients who returned to the emergency department (ED) and were readmitted to UNC Hospitals (inpatient or observation) for any reason within 30 days of discharge. These outcomes were determined by a manual chart review.
In order to ensure the new process was not associated with delays in patient discharge, we measured the mean length of stay in days for study patient encounters before and after intervention as a balancing measure.
Statistical Analysis
Demographic and clinical characteristics for included patients were compared for the 16 months preimplementation (April 1, 2014 through July 31, 2015) and the 19 months postimplementation (August 1, 2015 through February 28, 2017). Descriptive statistics were calculated by using the Student t test for continuous variables and the χ2 test for dichotomous variables. We used multivariate logistic regression to evaluate the associations between the intervention arms (pre- vs postintervention) and study outcomes, adjusting for age, gender, race, insurance type, and medical comorbidities. We chose these variables for inclusion based on their association with study outcomes at the P ≤ .20 level in bivariate analyses. P < .05 was considered statistically significant. All analyses were performed by using Stata version 13.1 (StataCorp LLC, College Station, TX).
For 2 process measures, the percentages of patients counseled about and started on naltrexone, we plotted consecutive samples of 10 patients before and after intervention on a control chart, using preintervention data to calculate means and control limits.
Subgroup Analysis
We used multivariate logistic regression to evaluate the associations between counseling versus no counseling and prescription of naltrexone versus no prescription for study outcomes in the postintervention subgroup, adjusting for age, gender, race, insurance type, and medical comorbidities.
RESULTS
Patients
We identified 188 preimplementation encounters and excluded 12 patients (6.4%) for primary admission reasons other than alcohol withdrawal or detoxification and 48 (25.5%) repeat hospitalizations, leaving 128 unique patient encounters. We identified 166 postimplementation encounters and excluded 25 (15.1%) hospitalizations for admission reason and 27 repeat hospitalizations (16.3%), leaving 114 unique patient encounters (flow diagram in supplemental Appendix 3). The most common admission reason for the exclusion of encounters was withdrawal from a substance other than alcohol (supplemental Appendix 4). The percentages of encounters excluded in preimplementation and postimplementation periods were similar at 31.9% and 31.4%, respectively.
The majority of patients were male and white, and almost half were uninsured (Table 1). There were no demographic differences between patients in the pre- versus postimplementation groups. For studied comorbidities, postintervention patients were more likely to have hypertension, anxiety, and depression.
Process Measures
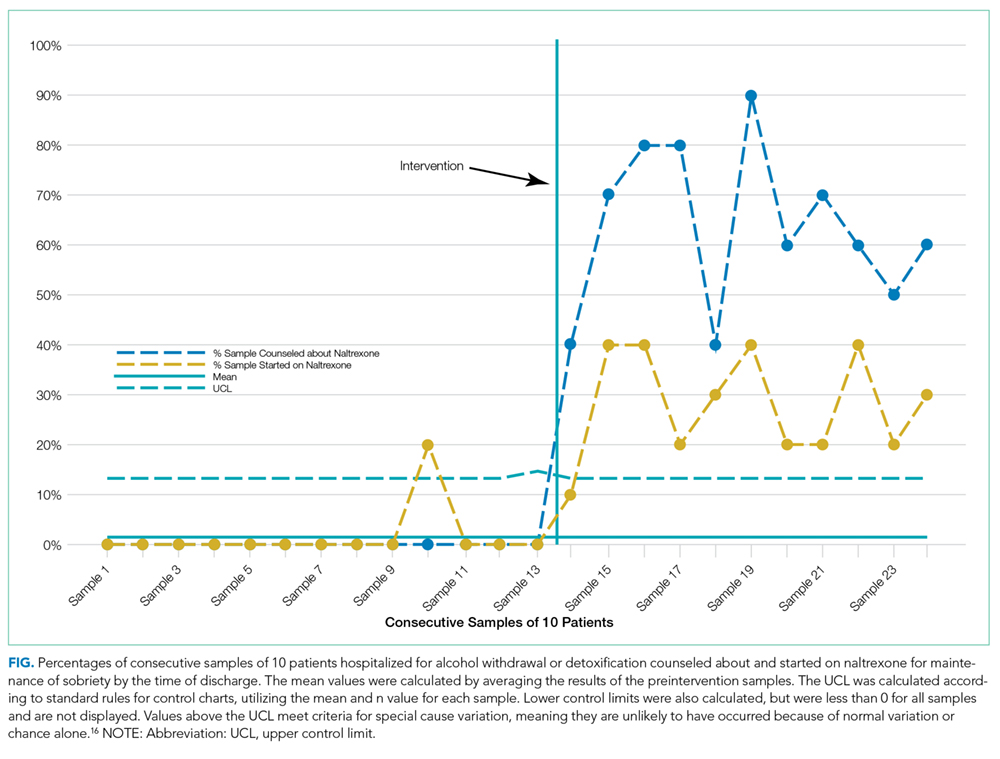
Among those counseled about naltrexone before discharge, 34 of 74 patients (45.9%) had no contraindications to naltrexone and were interested in taking the medication. Among the 40 patients who were counseled about but not prescribed naltrexone, 19 (47.5%) declined, 9 (22.5%) had liver function tests elevated more than 3 times the upper limit of the reference range, 9 (22.5%) had concurrent opiate use, and 3 (7.5%) had multiple contraindications.
Among the 34 patients who were prescribed naltrexone, 25 (73.5%) filled at least 1 prescription as confirmed by phone call to the relevant pharmacy.
Outcome Measures
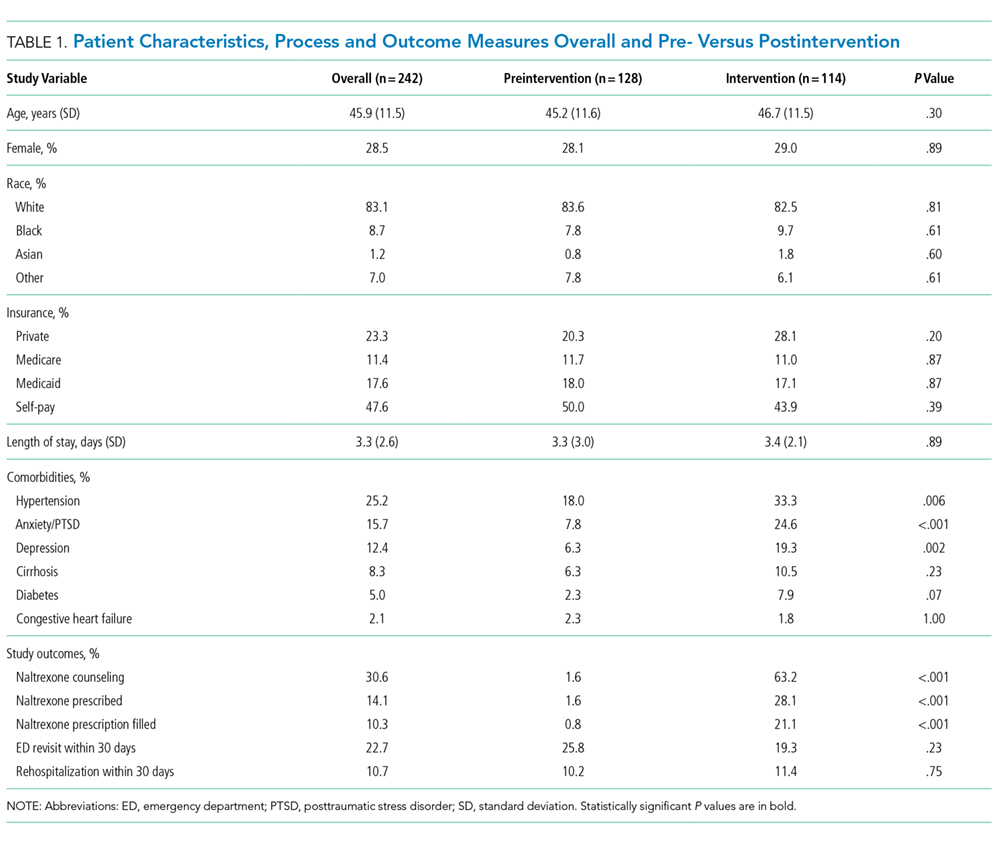
Subgroup Analysis
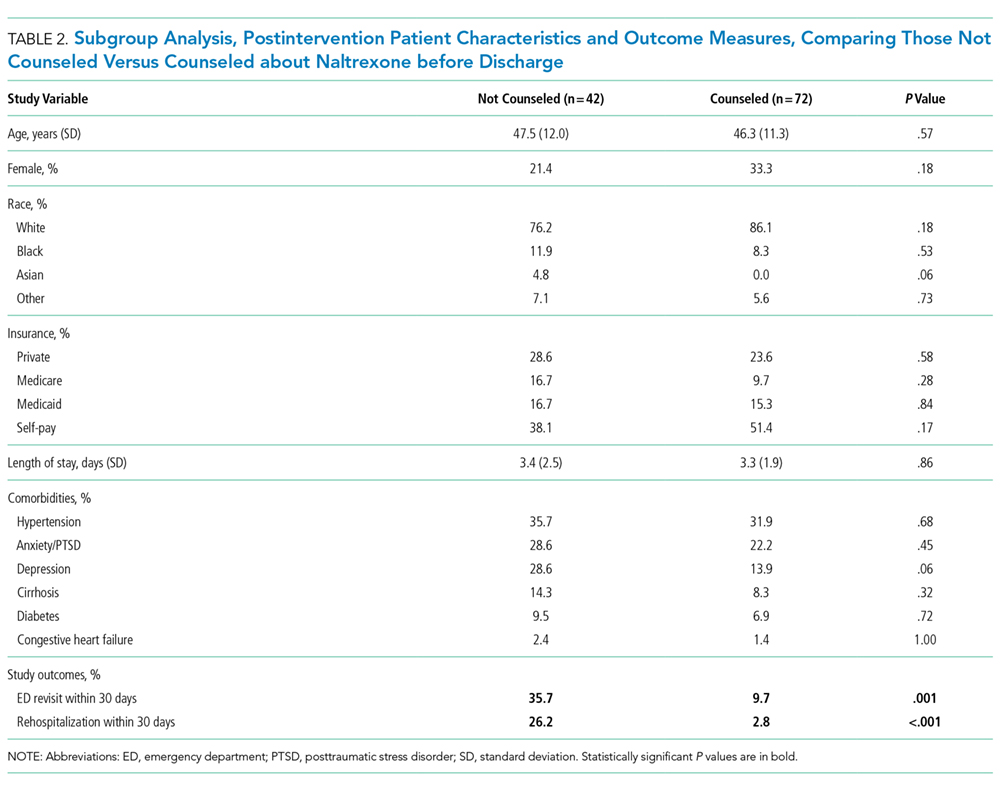
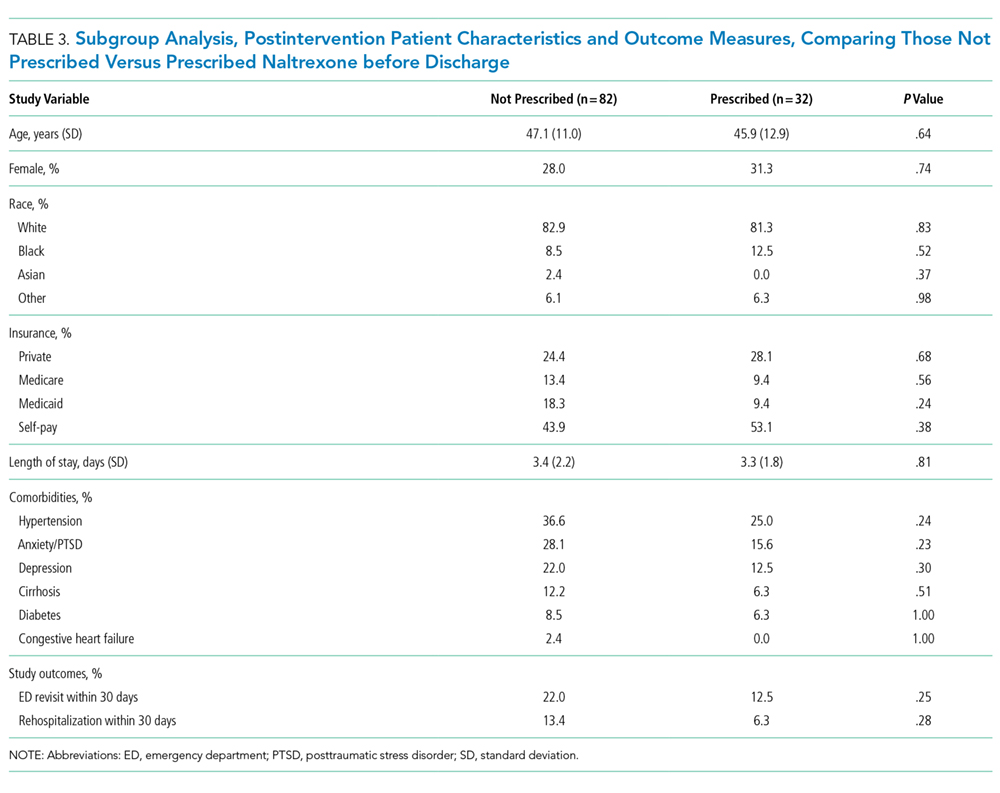
Balancing Measure
The mean length of stay for all patient encounters was 3.3 days. There were no differences in length of stay comparing pre- with postintervention patient encounters (Table 1) or those postintervention patients counseled versus not counseled (Table 2).
DISCUSSION
Our study demonstrates that counseling about medications for the maintenance of sobriety can be implemented as part of the routine care of hospitalized patients with AUDs. In our experience, about half of the patients counseled had no contraindications to naltrexone and were willing to take it at discharge. Almost three-fourths of those who were prescribed naltrexone filled the prescription at least once. The counseling process was not associated with increased length of stay. In the adjusted analysis, postintervention patients had significantly lower odds of 30-day ED returns. Additionally, in subgroup analysis, postintervention patients counseled about naltrexone had significantly lower rates of subsequent healthcare utilization compared with those not counseled, with absolute differences of 26% for ED revisits and 22% for rehospitalizations within 30 days.
The failure to demonstrate a difference in adjusted rehospitalization rates in the postintervention versus the preintervention group has several possible explanations. First, we had incomplete fidelity to our interventions, documenting counseling about naltrexone before discharge in over 60% of postintervention patients, raising the possibility that better fidelity may have resulted in improved outcomes. Related to this, only 28% of postintervention patients were prescribed naltrexone, which may be an inadequate sample size to demonstrate positive effects from the medication. Another possible explanation is that the postintervention group had higher rates of some of the comorbidities we assessed, namely, anxiety, depression, and hypertension, which could have negatively impacted the effectiveness of the interventions to prevent rehospitalization; however, after adjusting for comorbidities, the odds of rehospitalization were still not significantly different. It is interesting that the odds of postintervention ED revisits (but not rehospitalizations) were lower in the adjusted analysis. It may be that patients who revisit the ED and are not rehospitalized are different in important ways from those who are readmitted. Alternately, the larger number of ED revisits overall (about twice the rate of rehospitalization) may have made it easier to identify positive effects from the intervention for this outcome than rehospitalization (ie, the study may have been underpowered to detect a relatively small reduction in rehospitalization). It is also possible, however, that the interventions were simply insufficient to prevent rehospitalization.
The subgroup analysis, however, did find significant differences in both outcome measures for postintervention patients counseled versus not counseled about naltrexone before discharge. There are several possible explanations for these results. First, there may have been unmeasured differences in those counseled versus not counseled that explain the reductions observed in subsequent healthcare utilization. For example, the counseled patients could have been more motivated to change and, thus, more readily approached by providers for counseling. The lack of any demographic differences between the 2 groups and the relative simplicity of the counseling part of the intervention occurring as part of daily rounds argue against this hypothesis, but there are many potential unmeasured confounders (eg, homelessness, ability to afford medications), and this possibility remains. A second possible explanation is that patients counseled about naltrexone could have been more likely than those not counseled to seek subsequent care at other institutions. A third possibility is that that the counseling about (and prescribing when appropriate) naltrexone itself led to the observed decreases in subsequent ED visits and hospitalizations. This hypothesis would have been more supported had we been able to demonstrate a statistically significant reduction in healthcare utilization in those prescribed versus not prescribed naltrexone. But there were nonsignificant trends in the reduction of ED revisits and rehospitalizations among those prescribed the medication, suggesting we may have been able to demonstrate statistically significant reductions with a larger sample size.
Comparing our results with existing literature is challenging. The majority of randomized trials of naltrexone for AUDs were conducted in the outpatient setting.3-10 Most of these trials utilized some type of psychosocial intervention in addition to naltrexone.3-5,8-10 The 1 prior naltrexone study we identified conducted in the inpatient setting by Wei et al.14 is the most similar to our study. The authors reported the effects of a new process for assessing hospitalized patients with AUDs, including the use of a discharge planning tool for all patients admitted with alcohol dependence. The discharge tool included prompts for naltrexone in appropriate patients. The measured outcomes included the percentage of eligible patients prescribed naltrexone at discharge and the percentages of ED revisits and rehospitalizations within 30 days. Postintervention, 64% of eligible patients were prescribed naltrexone compared with 0% before, very similar to our results. There were significant decreases among all discharged patients with alcohol dependence for 30-day ED revisits (18.8% pre- vs 6.1% postimplementation) and rehospitalizations (23.4% vs 8.2%). The study differed from ours in a number of important respects, including a location in a large urban setting and implementation on a teaching service rather than an attending-only hospitalist service. Additionally, the authors studied 1 month of process implementation and compared it to another month 1 year before the new process, with an overall smaller sample size of 64 patients before and 49 patients after implementation. Potential reasons why Wei et al.14 were able to document lower rehospitalization rates postintervention when we did not include the differences in patient population (eg, high homeless rate, lower percentage of female patients in Wei study) and secular trends unrelated to interventions in either study.
Limitations of our study include the nonrandomized and uncontrolled design, which introduces the possibility of unmeasured confounding factors leading to the decrease we observed in healthcare utilization. Additionally, the single-center design precludes our ability to assess for healthcare utilization outcomes in other nearby facilities. We had incomplete implementation of our new process, counseling just over 60% of patients. As our primary outcomes relied on documentation in the medical record, both undersampling (not documenting some interventions) and reporting bias (being more likely to record positive sessions from intervention) are possible. Lastly, despite a moderate total sample size of almost 250 patients, the relatively small numbers of patients who were actually prescribed naltrexone in our study lessens our ability to show direct impact.
In conclusion, our study demonstrates a practical process for counseling about and prescribing naltrexone to patients hospitalized for alcohol detoxification or withdrawal. We demonstrate that many of these patients will be interested in starting naltrexone at discharge and will reliably fill the prescriptions if written. Counseling was associated with a significant reduction in subsequent healthcare utilization. These results have a wide potential impact given the ubiquitous nature of AUDs among hospitalized patients in community and academic settings.
Disclosure
The authors have no conflicts of interest relevant to this article to disclose. There were no sources of funding for this work.
1. Hasin DS, Stinson FS, Ogburn E, Grant BF. Prevalence, correlates, disability, and comorbidity of DSM-IV alcohol abuse and dependence in the United States: results from the National Epidemiologic Survey on Alcohol and Related Conditions. Arch Gen Psychiatry. 2007;64(7):830-842. PubMed
2. Bouchery EE, Harwood HJ, Sacks JJ, Simon CJ, Brewer RD. Economic costs of excessive alcohol consumption in the U.S., 2006. Am J Prev Med. 2011;41(5):516-524. PubMed
3. Anton RF, Moak DH, Waid LR, Latham PK, Malcolm RJ, Dias JK. Naltrexone and cognitive behavioral therapy for the treatment of outpatient alcoholics: results of a placebo-controlled trial. Am J Psychiatry. 1999;156(11):1758-1764. PubMed
4. Anton RF, Moak DH, Latham P, et al. Naltrexone combined with either cognitive behavioral or motivational enhancement therapy for alcohol dependence. J Clin Psychopharmacol. 2005;25(4):349-357. PubMed
5. Guardia J, Caso C, Arias F, et al. A double-blind, placebo-controlled study of naltrexone in the treatment of alcohol-dependence disorder: results from a multicenter clinical trial. Alcohol Clin Exp Res. 2002;26(9):1381-1387. PubMed
6. Kiefer F, Jahn H, Tarnaske T, et al. Comparing and combining naltrexone and acamprosate in relapse prevention of alcoholism: a double-blind, placebo-controlled study. Arch Gen Psychiatry. 2003;60(1):92-99. PubMed
7. Latt NC, Jurd S, Houseman J, Wutzke SE. Naltrexone in alcohol dependence: a randomised controlled trial of effectiveness in a standard clinical setting. Med J Aust. 2002;176(11):530-534. PubMed
8. Morris PL, Hopwood M, Whelan G, Gardiner J, Drummond E. Naltrexone for alcohol dependence: a randomized controlled trial. Addiction. 2001;96(11):1565-1573. PubMed
9. O’Malley SS, Jaffe AJ, Chang G, Schottenfeld RS, Meyer RE, Rounsaville B. Naltrexone and coping skills therapy for alcohol dependence. A controlled study. Arch Gen Psychiatry. 1992;49(11):881-887. PubMed
10. O’Malley SS, Robin RW, Levenson AL, et al. Naltrexone alone and with sertraline for the treatment of alcohol dependence in Alaska natives and non-natives residing in rural settings: a randomized controlled trial. Alcohol Clin Exp Res. 2008;32(7):1271-1283. PubMed
11. Jonas DE, Amick HR, Feltner C, et al. Pharmacotherapy for adults with alcohol use disorders in outpatient settings: a systematic review and meta-analysis. JAMA 2014;311(18):1889-1900. PubMed
12. Petrakis IL, Leslie D, Rosenheck R. Use of naltrexone in the treatment of alcoholism nationally in the Department of Veterans Affairs. Alcohol Clin Exp Res. 2003;27(11):1780-1784. PubMed
13. Mark TL, Kranzler HR, Song X. Understanding US addiction physicians’ low rate of naltrexone prescription. Drug Alcohol Depend. 2003;71(3):219-228. PubMed
14. Wei J, Defries T, Lozada M, Young N, Huen W, Tulsky J. An inpatient treatment and discharge planning protocol for alcohol dependence: efficacy in reducing 30-day readmissions and emergency department visits. J Gen Intern Med. 2015;30(3):365-370. PubMed
15. Stephens JR, Liles EA, Dancel R, Gilchrist M, Kirsch J, DeWalt DA. Who needs inpatient detox? Development and implementation of a hospitalist protocol for the evaluation of patients for alcohol detoxification. J Gen Intern Med. 2014;29(4):587-593. PubMed
16. Provost LP, Murray SK. The Health Care Data Guide: Learning from Data for Improvement. San Francisco: Jossey-Bass; 2011.
Alcohol use disorders (AUDs) are common, with an estimated lifetime prevalence of 17.8% for alcohol dependence.1 Alcohol misuse is costly, accounting for $24.6 billion in annual healthcare expenditures, including $5.1 billion for alcohol-related hospitalizations.2 A number of trials have demonstrated that naltrexone can help patients with AUDs maintain abstinence or diminish heavy drinking.3-10 A recent meta-analysis of pharmacotherapy trials for patients with AUDs reported that for patients using 50 mg of naltrexone daily, the number needed to treat was 12 to prevent a return to heavy drinking and 20 to prevent a return to any drinking.11 Despite good evidence for its effectiveness, naltrexone is not prescribed to the majority of patients with AUDs. In a study of veterans with AUDs cared for in the Veterans Affairs health system, only 1.9% of patients were prescribed naltrexone over the 6-month study period.12 A 2003 survey of 2 professional organizations for addiction treatment specialists reported that a mean of 13% of providers prescribed naltrexone to their patients.13
When naltrexone is prescribed, it is most frequently in the outpatient setting.3-10 Data for initiation of naltrexone in the inpatient setting are more limited. Wei et al.14 reported on the implementation of a discharge protocol, including counseling about naltrexone, for hospitalized patients with AUDs at an urban academic medical center. They reported a significant increase in the prescription of naltrexone to eligible patients by the time of discharge that was associated with a significant decrease in 30-day readmissions. Initiation of naltrexone in the inpatient versus the outpatient setting has some potential advantages. First, patients hospitalized for alcohol withdrawal have AUDs, obviating the need for screening. Second, the outpatient trials of naltrexone typically required 3 days of sobriety before initiation, which is generally achieved during hospitalization for detoxification or withdrawal.
Previous work at our institution centered on standardizing the process of evaluating patients needing alcohol detoxification at the time of referral for admission.15 The use of a standardized protocol reduced the number of inpatient admissions for alcohol-related diagnoses but had no effect on the 30-day readmission rate (28%) for those patients who were hospitalized. Our hospitalist group had no standardized process for discharging hospitalized patients with AUDs, and the discharge process rarely included counseling on medications for maintenance of sobriety. In this manuscript, we describe the implementation and impact of a process for counseling patients hospitalized for alcohol detoxification or withdrawal about naltrexone for maintenance of sobriety by the time of hospital discharge.
METHODS
Study Setting
The University of North Carolina (UNC) Hospitals is an 803-bed tertiary academic center. UNC Hospital Medicine is staffed by 29 physicians and 3 advanced practice providers (APPs). During the study period, there were 3 hospital medicine services at UNC Hospitals with a combined average daily census of approximately 40 patients, and each service was staffed by one attending physician every day of the week and one APP Monday through Friday.
Study Design
We used a pre-post study design, in which we implemented a new process for standardizing the discharge of hospitalized patients with AUDs, including a process for counseling about naltrexone by the time of discharge. We sought and received institutional review board (IRB) approval for this study (UNC IRB 15-1441).
Interventions
We formed an improvement team that included 3 physicians and an APP in hospital medicine, a general internist and a psychiatrist, both with expertise in the use of medications for maintenance of sobriety, the director of UNC’s Alcohol and Substance Abuse Program, and 2 case managers. The team developed a number of interventions, including group education, a process for patient identification, and algorithms for counseling about, prescribing, and documenting the discussion of naltrexone.
Group Education
We presented evidence about medications for the maintenance of sobriety at a regularly scheduled hospitalist meeting. An hour-long session on motivational interviewing techniques was also presented at a separate meeting. All created algorithms were circulated to the group electronically and posted at workstations in the hospitalist work area. As data were generated postimplementation, control charts of process measures were created, posted in the hospitalist work area, and presented at subsequent group meetings.
Identification of Patients
We focused our interventions on patients admitted for alcohol detoxification or withdrawal (including withdrawal seizures). We asked our group to preferentially admit these patients to 1 of our 3 hospitalists services, on which the service APP (K.S.) was also an improvement team member.
Creation of Algorithms and Scripts for Counseling
We created a simple algorithm for evaluating patients for naltrexone. We recommended that all patients admitted for alcohol detoxification or withdrawal be counseled about naltrexone for the maintenance of sobriety before discharge. The contraindications to naltrexone we included were (1) concurrent opioid use, (2) documented cirrhosis, and/or (3) liver function tests greater than 3 times the upper limit of normal by the time of hospital discharge.
We also created a suggested script for motivational interviewing (supplemental Appendix 1). This was presented at a group meeting and circulated via e-mail. The actual counseling technique and process was left up to individual providers. In practice, counseling took place in the course of daily rounds, generally the day before or day of hospital discharge.
Prescription of Medication
For interested patients without contraindications, we recommended a prescription of naltrexone at 50 mg daily for 3 months. For patients prescribed naltrexone without medical insurance (n = 17), we utilized our existing pharmacy assistance program, whereby discharging patients can obtain an initial 14-day supply after applying to the program and then can fill subsequent prescriptions if they meet program financial requirements.
Follow-up Appointments
For patients with established outpatient providers, we asked patients to schedule follow-up appointments within a month of discharge. Patients prescribed naltrexone without primary providers (n = 16) were eligible for an existing program, the UNC Transitions Program, whereby patients identified as having moderate-to-high risk of hospital readmission can receive a follow-up appointment at UNC Internal Medicine or UNC Family Medicine within 2 weeks of discharge.
Creation of “Smart Phrases”
To aid in documentation, we created “smart phrases” (easily accessed, previously created phrases that can be adopted by all users) within the hospital electronic health record. We created one smart phrase for documentation of counseling about naltrexone, which included dropdown menus for contraindications and the patient’s preference and one for discharge instructions for patients started on naltrexone (supplemental Appendix 2).
Implementation
After the presentation of suggested interventions in July 2015 and the subsequent dissemination of educational materials, we implemented our new process on August 1, 2015.
Data Collection
Patients were identified for inclusion in the study analysis by querying UNC Hospitals’ billing database for the inpatient diagnosis codes (diagnosis-related groupings) 896 and 897, “alcohol/drug abuse or dependence without rehabilitation therapy,” with and without major comorbidity or complication, respectively, and with hospital medicine as the discharging service. All encounters were then manually reviewed by 2 investigators (J.S. and C.M.). Encounters were included if the history and physical indicated that the primary reason for admission was alcohol detoxification or withdrawal. Encounters with other primary reasons for admission (eg, pancreatitis, gastrointestinal bleeding) were excluded. For patients with multiple encounters, only the first eligible encounter in the pre- and/or postimplementation period was included. Comorbidities for identified patients were assessed via the search of study encounters for the International Classification of Diseases, 9th Revision-Clinical Modification codes for hypertension, anxiety, depression, cirrhosis, diabetes, and congestive heart failure.
Process, Outcomes, and Balancing Measures
The study process measures included the percentage of patients hospitalized for alcohol detoxification or withdrawal with documentation of counseling about naltrexone by the time of discharge, before and after process intervention. Documentation was defined as the description of counseling about naltrexone in the discharge summary or progress notes of identified encounters. We also measured the percentage of patients started on naltrexone before and after intervention. Lastly, we measured the percentage of patients prescribed naltrexone who filled at least 1 prescription for the medication, assessed by calls to the pharmacy where the medication was prescribed. Prescriptions that could not be confirmed (ie, paper rather than electronic prescriptions) were counted as not filled.
For outcome measures, we recorded the percentages of study patients who returned to the emergency department (ED) and were readmitted to UNC Hospitals (inpatient or observation) for any reason within 30 days of discharge. These outcomes were determined by a manual chart review.
In order to ensure the new process was not associated with delays in patient discharge, we measured the mean length of stay in days for study patient encounters before and after intervention as a balancing measure.
Statistical Analysis
Demographic and clinical characteristics for included patients were compared for the 16 months preimplementation (April 1, 2014 through July 31, 2015) and the 19 months postimplementation (August 1, 2015 through February 28, 2017). Descriptive statistics were calculated by using the Student t test for continuous variables and the χ2 test for dichotomous variables. We used multivariate logistic regression to evaluate the associations between the intervention arms (pre- vs postintervention) and study outcomes, adjusting for age, gender, race, insurance type, and medical comorbidities. We chose these variables for inclusion based on their association with study outcomes at the P ≤ .20 level in bivariate analyses. P < .05 was considered statistically significant. All analyses were performed by using Stata version 13.1 (StataCorp LLC, College Station, TX).
For 2 process measures, the percentages of patients counseled about and started on naltrexone, we plotted consecutive samples of 10 patients before and after intervention on a control chart, using preintervention data to calculate means and control limits.
Subgroup Analysis
We used multivariate logistic regression to evaluate the associations between counseling versus no counseling and prescription of naltrexone versus no prescription for study outcomes in the postintervention subgroup, adjusting for age, gender, race, insurance type, and medical comorbidities.
RESULTS
Patients
We identified 188 preimplementation encounters and excluded 12 patients (6.4%) for primary admission reasons other than alcohol withdrawal or detoxification and 48 (25.5%) repeat hospitalizations, leaving 128 unique patient encounters. We identified 166 postimplementation encounters and excluded 25 (15.1%) hospitalizations for admission reason and 27 repeat hospitalizations (16.3%), leaving 114 unique patient encounters (flow diagram in supplemental Appendix 3). The most common admission reason for the exclusion of encounters was withdrawal from a substance other than alcohol (supplemental Appendix 4). The percentages of encounters excluded in preimplementation and postimplementation periods were similar at 31.9% and 31.4%, respectively.
The majority of patients were male and white, and almost half were uninsured (Table 1). There were no demographic differences between patients in the pre- versus postimplementation groups. For studied comorbidities, postintervention patients were more likely to have hypertension, anxiety, and depression.
Process Measures
Among those counseled about naltrexone before discharge, 34 of 74 patients (45.9%) had no contraindications to naltrexone and were interested in taking the medication. Among the 40 patients who were counseled about but not prescribed naltrexone, 19 (47.5%) declined, 9 (22.5%) had liver function tests elevated more than 3 times the upper limit of the reference range, 9 (22.5%) had concurrent opiate use, and 3 (7.5%) had multiple contraindications.
Among the 34 patients who were prescribed naltrexone, 25 (73.5%) filled at least 1 prescription as confirmed by phone call to the relevant pharmacy.
Outcome Measures
Subgroup Analysis
Balancing Measure
The mean length of stay for all patient encounters was 3.3 days. There were no differences in length of stay comparing pre- with postintervention patient encounters (Table 1) or those postintervention patients counseled versus not counseled (Table 2).
DISCUSSION
Our study demonstrates that counseling about medications for the maintenance of sobriety can be implemented as part of the routine care of hospitalized patients with AUDs. In our experience, about half of the patients counseled had no contraindications to naltrexone and were willing to take it at discharge. Almost three-fourths of those who were prescribed naltrexone filled the prescription at least once. The counseling process was not associated with increased length of stay. In the adjusted analysis, postintervention patients had significantly lower odds of 30-day ED returns. Additionally, in subgroup analysis, postintervention patients counseled about naltrexone had significantly lower rates of subsequent healthcare utilization compared with those not counseled, with absolute differences of 26% for ED revisits and 22% for rehospitalizations within 30 days.
The failure to demonstrate a difference in adjusted rehospitalization rates in the postintervention versus the preintervention group has several possible explanations. First, we had incomplete fidelity to our interventions, documenting counseling about naltrexone before discharge in over 60% of postintervention patients, raising the possibility that better fidelity may have resulted in improved outcomes. Related to this, only 28% of postintervention patients were prescribed naltrexone, which may be an inadequate sample size to demonstrate positive effects from the medication. Another possible explanation is that the postintervention group had higher rates of some of the comorbidities we assessed, namely, anxiety, depression, and hypertension, which could have negatively impacted the effectiveness of the interventions to prevent rehospitalization; however, after adjusting for comorbidities, the odds of rehospitalization were still not significantly different. It is interesting that the odds of postintervention ED revisits (but not rehospitalizations) were lower in the adjusted analysis. It may be that patients who revisit the ED and are not rehospitalized are different in important ways from those who are readmitted. Alternately, the larger number of ED revisits overall (about twice the rate of rehospitalization) may have made it easier to identify positive effects from the intervention for this outcome than rehospitalization (ie, the study may have been underpowered to detect a relatively small reduction in rehospitalization). It is also possible, however, that the interventions were simply insufficient to prevent rehospitalization.
The subgroup analysis, however, did find significant differences in both outcome measures for postintervention patients counseled versus not counseled about naltrexone before discharge. There are several possible explanations for these results. First, there may have been unmeasured differences in those counseled versus not counseled that explain the reductions observed in subsequent healthcare utilization. For example, the counseled patients could have been more motivated to change and, thus, more readily approached by providers for counseling. The lack of any demographic differences between the 2 groups and the relative simplicity of the counseling part of the intervention occurring as part of daily rounds argue against this hypothesis, but there are many potential unmeasured confounders (eg, homelessness, ability to afford medications), and this possibility remains. A second possible explanation is that patients counseled about naltrexone could have been more likely than those not counseled to seek subsequent care at other institutions. A third possibility is that that the counseling about (and prescribing when appropriate) naltrexone itself led to the observed decreases in subsequent ED visits and hospitalizations. This hypothesis would have been more supported had we been able to demonstrate a statistically significant reduction in healthcare utilization in those prescribed versus not prescribed naltrexone. But there were nonsignificant trends in the reduction of ED revisits and rehospitalizations among those prescribed the medication, suggesting we may have been able to demonstrate statistically significant reductions with a larger sample size.
Comparing our results with existing literature is challenging. The majority of randomized trials of naltrexone for AUDs were conducted in the outpatient setting.3-10 Most of these trials utilized some type of psychosocial intervention in addition to naltrexone.3-5,8-10 The 1 prior naltrexone study we identified conducted in the inpatient setting by Wei et al.14 is the most similar to our study. The authors reported the effects of a new process for assessing hospitalized patients with AUDs, including the use of a discharge planning tool for all patients admitted with alcohol dependence. The discharge tool included prompts for naltrexone in appropriate patients. The measured outcomes included the percentage of eligible patients prescribed naltrexone at discharge and the percentages of ED revisits and rehospitalizations within 30 days. Postintervention, 64% of eligible patients were prescribed naltrexone compared with 0% before, very similar to our results. There were significant decreases among all discharged patients with alcohol dependence for 30-day ED revisits (18.8% pre- vs 6.1% postimplementation) and rehospitalizations (23.4% vs 8.2%). The study differed from ours in a number of important respects, including a location in a large urban setting and implementation on a teaching service rather than an attending-only hospitalist service. Additionally, the authors studied 1 month of process implementation and compared it to another month 1 year before the new process, with an overall smaller sample size of 64 patients before and 49 patients after implementation. Potential reasons why Wei et al.14 were able to document lower rehospitalization rates postintervention when we did not include the differences in patient population (eg, high homeless rate, lower percentage of female patients in Wei study) and secular trends unrelated to interventions in either study.
Limitations of our study include the nonrandomized and uncontrolled design, which introduces the possibility of unmeasured confounding factors leading to the decrease we observed in healthcare utilization. Additionally, the single-center design precludes our ability to assess for healthcare utilization outcomes in other nearby facilities. We had incomplete implementation of our new process, counseling just over 60% of patients. As our primary outcomes relied on documentation in the medical record, both undersampling (not documenting some interventions) and reporting bias (being more likely to record positive sessions from intervention) are possible. Lastly, despite a moderate total sample size of almost 250 patients, the relatively small numbers of patients who were actually prescribed naltrexone in our study lessens our ability to show direct impact.
In conclusion, our study demonstrates a practical process for counseling about and prescribing naltrexone to patients hospitalized for alcohol detoxification or withdrawal. We demonstrate that many of these patients will be interested in starting naltrexone at discharge and will reliably fill the prescriptions if written. Counseling was associated with a significant reduction in subsequent healthcare utilization. These results have a wide potential impact given the ubiquitous nature of AUDs among hospitalized patients in community and academic settings.
Disclosure
The authors have no conflicts of interest relevant to this article to disclose. There were no sources of funding for this work.
1. Hasin DS, Stinson FS, Ogburn E, Grant BF. Prevalence, correlates, disability, and comorbidity of DSM-IV alcohol abuse and dependence in the United States: results from the National Epidemiologic Survey on Alcohol and Related Conditions. Arch Gen Psychiatry. 2007;64(7):830-842. PubMed
2. Bouchery EE, Harwood HJ, Sacks JJ, Simon CJ, Brewer RD. Economic costs of excessive alcohol consumption in the U.S., 2006. Am J Prev Med. 2011;41(5):516-524. PubMed
3. Anton RF, Moak DH, Waid LR, Latham PK, Malcolm RJ, Dias JK. Naltrexone and cognitive behavioral therapy for the treatment of outpatient alcoholics: results of a placebo-controlled trial. Am J Psychiatry. 1999;156(11):1758-1764. PubMed
4. Anton RF, Moak DH, Latham P, et al. Naltrexone combined with either cognitive behavioral or motivational enhancement therapy for alcohol dependence. J Clin Psychopharmacol. 2005;25(4):349-357. PubMed
5. Guardia J, Caso C, Arias F, et al. A double-blind, placebo-controlled study of naltrexone in the treatment of alcohol-dependence disorder: results from a multicenter clinical trial. Alcohol Clin Exp Res. 2002;26(9):1381-1387. PubMed
6. Kiefer F, Jahn H, Tarnaske T, et al. Comparing and combining naltrexone and acamprosate in relapse prevention of alcoholism: a double-blind, placebo-controlled study. Arch Gen Psychiatry. 2003;60(1):92-99. PubMed
7. Latt NC, Jurd S, Houseman J, Wutzke SE. Naltrexone in alcohol dependence: a randomised controlled trial of effectiveness in a standard clinical setting. Med J Aust. 2002;176(11):530-534. PubMed
8. Morris PL, Hopwood M, Whelan G, Gardiner J, Drummond E. Naltrexone for alcohol dependence: a randomized controlled trial. Addiction. 2001;96(11):1565-1573. PubMed
9. O’Malley SS, Jaffe AJ, Chang G, Schottenfeld RS, Meyer RE, Rounsaville B. Naltrexone and coping skills therapy for alcohol dependence. A controlled study. Arch Gen Psychiatry. 1992;49(11):881-887. PubMed
10. O’Malley SS, Robin RW, Levenson AL, et al. Naltrexone alone and with sertraline for the treatment of alcohol dependence in Alaska natives and non-natives residing in rural settings: a randomized controlled trial. Alcohol Clin Exp Res. 2008;32(7):1271-1283. PubMed
11. Jonas DE, Amick HR, Feltner C, et al. Pharmacotherapy for adults with alcohol use disorders in outpatient settings: a systematic review and meta-analysis. JAMA 2014;311(18):1889-1900. PubMed
12. Petrakis IL, Leslie D, Rosenheck R. Use of naltrexone in the treatment of alcoholism nationally in the Department of Veterans Affairs. Alcohol Clin Exp Res. 2003;27(11):1780-1784. PubMed
13. Mark TL, Kranzler HR, Song X. Understanding US addiction physicians’ low rate of naltrexone prescription. Drug Alcohol Depend. 2003;71(3):219-228. PubMed
14. Wei J, Defries T, Lozada M, Young N, Huen W, Tulsky J. An inpatient treatment and discharge planning protocol for alcohol dependence: efficacy in reducing 30-day readmissions and emergency department visits. J Gen Intern Med. 2015;30(3):365-370. PubMed
15. Stephens JR, Liles EA, Dancel R, Gilchrist M, Kirsch J, DeWalt DA. Who needs inpatient detox? Development and implementation of a hospitalist protocol for the evaluation of patients for alcohol detoxification. J Gen Intern Med. 2014;29(4):587-593. PubMed
16. Provost LP, Murray SK. The Health Care Data Guide: Learning from Data for Improvement. San Francisco: Jossey-Bass; 2011.
© 2018 Society of Hospital Medicine
Things We Do For No Reason: Echocardiogram in Unselected Patients with Syncope
The “Things We Do for No Reason” (TWDFNR) series reviews practices that have become common parts of hospital care but which may provide little value to our patients. Practices reviewed in the TWDFNR series do not represent “black and white” conclusions or clinical practice standards, but are meant as a starting place for research and active discussions among hospitalists and patients. We invite you to be part of that discussion. https://www.choosingwisely.org/
Syncope is a common cause of emergency department (ED) visits and hospitalizations. Echocardiogram is frequently used as a diagnostic tool in the evaluation of syncope, performed in 39%-91% of patients.
CLINICAL SCENARIO
A 57-year-old woman presented to the ED after a syncopal episode. She had just eaten dinner when she slumped over and became unresponsive. Her husband estimated that she regained consciousness 30 seconds later and quickly returned to baseline mental status. She denied chest pain, shortness of breath, or palpitations. Her medical history included hypertension and hypothyroidism. Her medication regimen was unchanged.
Vital signs, including orthostatic blood pressures, were within normal ranges. A physical examination revealed regular heart sounds without murmur, rub, or gallop. ECG showed normal sinus rhythm, normal axis, and normal intervals. Chest radiograph, complete blood count, chemistry, pro-brain natriuretic peptide (pro-BNP), and troponin were within normal ranges.
BACKGROUND
Syncope, defined as “abrupt, transient, complete loss of consciousness, associated with inability to maintain postural tone, with rapid and spontaneous recovery,”1 is a common clinical problem, accounting for 1% of ED visits in the United States.2 As syncope has been shown to be associated with increased mortality,3 the primary goal of syncope evaluation is to identify modifiable underlying causes, particularly cardiac causes. Current guidelines recommend a complete history and physical, orthostatic blood pressure measurement, and ECG as the initial evaluation for syncope.1 Echocardiogram is a frequent additional test, performed in 39%-91% of patients.4-8
WHY YOU MAY THINK ECHOCARDIOGRAM IS HELPFUL
Echocardiogram may identify depressed ejection fraction, a risk factor for ventricular arrhythmias, along with structural causes of syncope, including aortic stenosis, pulmonary hypertension, and hypertrophic cardiomyopathy.9 Structural heart disease is the underlying etiology in about 3% of patients with syncope.10
Prior guidelines stated that “an echocardiogram is a helpful screening test if the history, physical examination, and ECG do not provide a diagnosis or if underlying heart disease is suspected.”11 A separate guideline for the appropriate use of echocardiogram assigned a score of appropriateness on a 1-9 scale based on increasing indication.12 Echocardiogram for syncope was scored a 7 in patients with “no other symptoms or signs of cardiovascular disease.”12 Only 25%-40% of patients with syncope will have a cause identified after the history, physical examination, and ECG,13,14 creating diagnostic uncertainty that often leads to further testing.
WHY ECHOCARDIOGRAM IS NOT NECESSARY IN ALL PATIENTS
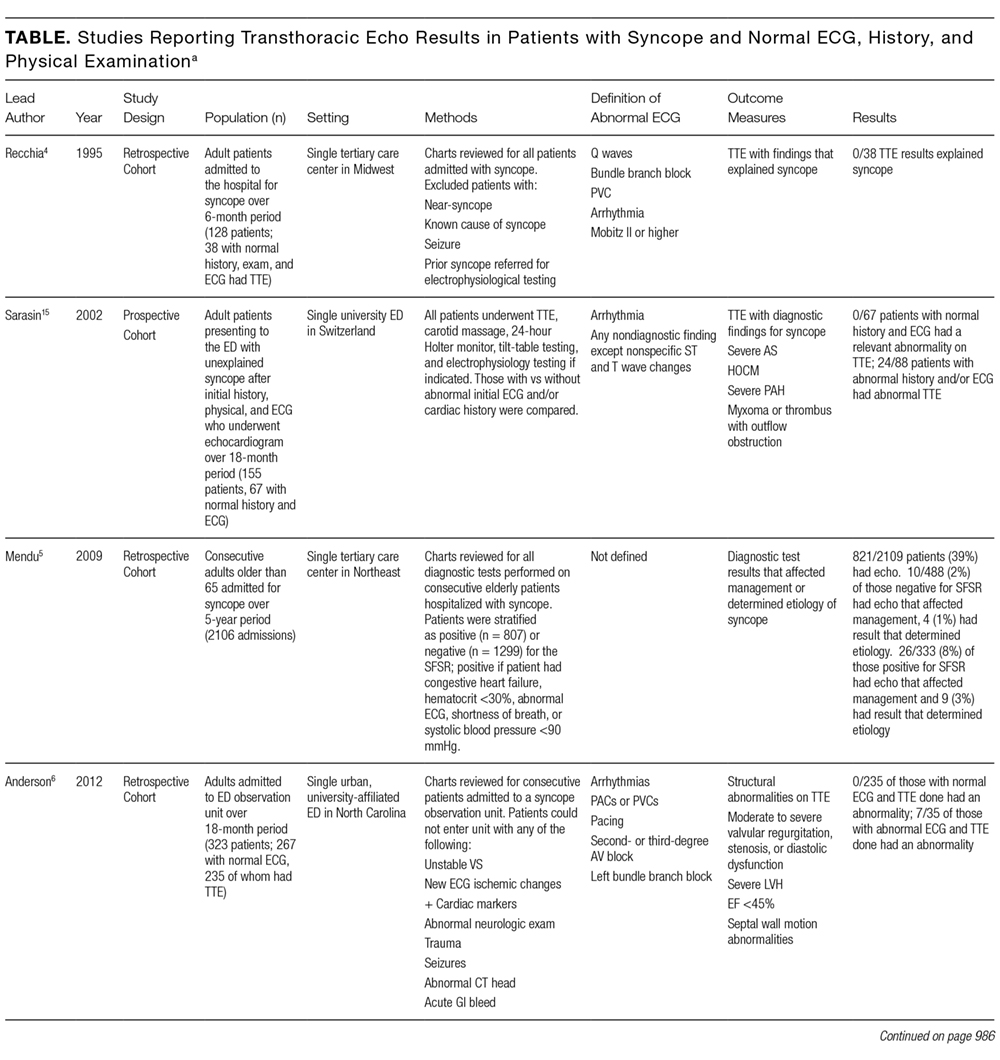

Mendu et al.5 performed a single-center, retrospective study of the diagnostic yield of testing for syncope in 2106 consecutive patients older than 65 admitted over the course of 5 years. They retrospectively applied the San Francisco Syncope Rule (SFSR), which patients met if they had congestive heart failure, hematocrit <30%, abnormal ECG, shortness of breath, or systolic blood pressure <90 mm Hg. There were 821 patients (39%) who underwent echocardiogram. Among the 488 with no SFSR criteria, 10 patients (2%) had echocardiogram results that affected management, and 4 patients (1%) had results that helped determine the etiology of syncope.
Anderson et al. studied 323 syncope patients in a single ED observation unit over 18 months.6 Patients with high-risk features, including unstable vital signs, abnormal cardiac biomarkers, or ischemic ECG changes, were excluded from the unit. The initial ECG was considered abnormal if it contained arrhythmia, premature atrial or ventricular contractions, pacing, second- or third-degree heart block, or left bundle branch block. Of the 235 patients with a normal ECG who underwent echocardiogram, none had an abnormal study.
Chang et al.7 performed a retrospective review of 468 patients admitted with syncope at a single hospital. Charts were reviewed for ECG and echocardiogram results. Abnormal ECGs were defined as those containing arrhythmias, Q waves, ischemic changes, second- and third-degree heart block, paced rhythm, corrected QT interval (QTc) >500 ms, left bundle branch or bifasicular block, Brugada pattern, or abnormal axis. Among 321 patients with normal ECGs, echocardiograms were performed in 192. Eleven of those echocardiograms were abnormal: 3 demonstrated aortic stenosis in patients who already carried the diagnosis, and the other 8 abnormal echocardiograms revealed unexpected left ventricular ejection fractions <45% or other nonaortic valvular pathology. None of the findings were felt to be the cause of syncope.
Han et al.8 performed a retrospective cohort study of all syncope patients presenting to a single ED over the course of 1 year. Patients were stratified as high risk if they had chest pain, palpitations, a history of cardiac disease (defined as prior arrhythmia, heart failure, coronary artery disease, or structural heart disease), abnormal cardiac biomarkers, or an abnormal ECG (defined as sinus bradycardia, arrhythmia, premature beats, second- or third-degree heart block, ventricular hypertrophy, ischemic Q or ST changes, or abnormal QT interval). Patients with none of those symptoms or findings were considered low risk. Of those categorized as low risk (n = 115), 47 underwent echocardiogram, only 1 of which was abnormal.
Across studies, the percentage of patients with a normal cardiac history, examination, and ECG with new, significant abnormalities on echocardiogram was 0% in 3 studies (n = 340),4,6,15 2% in 1 study (10/488 patients),5 2.1% in 1 study (1/47 patients),8 and 4.2% in 1 study (8/192 patients).7 The 11 echocardiograms with significant findings in the studies by Mendu et al.5 and Han et al.8 were not further described. The 8 patients with abnormal echocardiograms reported by Chang et al.7 had depressed left ventricular ejection fraction or nonaortic valvular disease that did not represent a definitive etiology of their syncope. Given the cost of $1,000 to $2,220 per study,16 routine echocardiograms in patients with a normal history, examination, and ECG would thus require $60,000 to $132,000 in spending to find 1 new significant abnormality, which may be unrelated to the actual cause of syncope.
SITUATIONS IN WHICH ECHOCARDIOGRAM MAY BE HELPFUL
The diagnostic yield of echocardiogram is higher in patients with a positive cardiac history or abnormal ECG. In the prospective study by Sarasin et al.15 a total of 27% of patients with a positive cardiac history or abnormal ECG were found to have an ejection fraction less than or equal to 40%. Other studies reporting percentages of abnormal echocardiograms in patients with abnormal history, ECG, or examination found rates of 8% (26/333),5 20% (7/35),6 28% (27/97),8 and 29% (27/93).7 It should be noted that not all of these abnormalities were felt to be the cause of syncope. For example, Sarasin et al.15 reported that only half of the patients with newly identified depressed ejection fraction were diagnosed with arrhythmia-related syncope. Chang et al7 reported that 6 of the 27 patients (22%) with abnormal ECG and echocardiogram had the cause of syncope established by echocardiogram.
Finally, some syncope patients will have cardiac biomarkers sent in the ED. Han et al.8 found that among patients with syncope, those with abnormal versus normal echocardiogram were more likely to have elevated BNP (70% vs 23%) and troponin (36% vs 12.4%). Thus, obtaining an echocardiogram in patients with syncope and abnormal cardiac biomarkers may be reasonable. It should be noted, however, that while some studies have suggested a role for biomarkers in differentiating cardiac from noncardiac syncope,17-20 current guidelines state that the usefulness of these tests is uncertain.1
WHAT YOU SHOULD DO INSTEAD OF ECHOCARDIOGRAM FOR ALL PATIENTS
Clinicians should carefully screen patients with syncope for abnormal findings suggesting cardiac disease on history, physical examination, and ECG. Relevant cardiac history includes known coronary artery disease, valvular heart disease, arrhythmia, congestive heart failure, and risk factors for cardiac syncope (supplemental Appendix). The definition of abnormal ECG varies among studies, but abnormalities that should prompt an echocardiogram include arrhythmia, premature atrial or ventricular contractions, second- or third-degree heart block, sinus bradycardia, bundle branch or fascicular blocks, left ventricular hypertrophy, ischemic ST or T wave changes, Q waves, or a prolonged QTc interval. New guidelines from the American College of Cardiology state, “Routine cardiac imaging is not useful in the evaluation of patients with syncope unless cardiac etiology is suspected on the basis of an initial evaluation, including history, physical examination, or ECG.”1
RECOMMENDATIONS
- All patients with syncope should receive a complete history, physical examination, orthostatic vital signs, and ECG.
- Perform echocardiogram on patients with syncope and a history of cardiac disease, examination suggestive of structural heart disease or congestive heart failure, or abnormal ECG.
- Echocardiogram may be reasonable in patients with syncope and abnormal cardiac biomarkers.
CONCLUSIONS
While commonly performed as part of syncope evaluations, echocardiogram has a very low diagnostic yield in patients with a normal history, physical, and ECG. The patient described in the initial case scenario would have an extremely low likelihood of having important diagnostic information found on echocardiogram.
Disclosure
The authors have no conflicts of interest relevant to this article.
1. Shen WK, Sheldon RS, Benditt DG, et al. 2017 ACC/AHA/HRS Guideline for the Evaluation and Management of Patients With Syncope: A Report of the American College of Cardiology/American Heart Association Task Force on Clinical Practice Guidelines, and the Heart Rhythm Society. J Am Coll Cardiol. 2017;70(5):620-633. PubMed
2. Sun BC, Emond JA, Camargo CA Jr. Characteristics and admission patterns of patients presenting with syncope to U.S. emergency departments, 1992-2000. Acad Emerg Med. 2004;11(10):1029-1034. PubMed
3. Soteriades ES, Evans JC, Larson MG, et al. Incidence and prognosis of syncope. N Engl J Med. 2002;347(12):878-885. PubMed
4. Recchia D, Barzilai B. Echocardiography in the evaluation of patients with syncope. J Gen Intern Med. 1995;10(12):649-655. PubMed
5. Mendu ML, McAvay G, Lampert R, Stoehr J, Tinetti ME. Yield of diagnostic tests in evaluating syncopal episodes in older patients. Arch Intern Med. 2009;169(14):1299-1305. PubMed
6. Anderson KL, Limkakeng A, Damuth E, Chandra A. Cardiac evaluation for structural abnormalities may not be required in patients presenting with syncope and a normal ECG result in an observation unit setting. Ann Emerg Med. 2012;60(4):478-484.e1. PubMed
7. Chang NL, Shah P, Bajaj S, Virk H, Bikkina M, Shamoon F. Diagnostic Yield of Echocardiography in Syncope Patients with Normal ECG. Cardiol Res Pract. 2016;2016:1251637. PubMed
8. Han SK, Yeom SR, Lee SH, et al. Transthoracic echocardiogram in syncope patients with normal initial evaluation. Am J Emerg Med. 2017;35(2):281-284. PubMed
9. Task Force for the Diagnosis and Management of Syncope, European Society of Cardiology, European Heart Rhythm Association, et al. Guidelines for the diagnosis and management of syncope (version 2009). Eur Heart J. 2009;30(21):2631-2671.
10. Alboni P, Brignole M, Menozzi C, et al. Diagnostic value of history in patients with syncope with or without heart disease. J Am Coll Cardiol. 2001;37(7):1921-1928. PubMed
11. Strickberger SA, Benson DW, Biaggioni I, et al. AHA/ACCF Scientific Statement on the evaluation of syncope: from the American Heart Association Councils on Clinical Cardiology, Cardiovascular Nursing, Cardiovascular Disease in the Young, and Stroke, and the Quality of Care and Outcomes Research Interdisciplinary Working Group; and the American College of Cardiology Foundation: in collaboration with the Heart Rhythm Society: endorsed by the American Autonomic Society. Circulation. 2006;113(2):316-327. PubMed
12. American College of Cardiology Foundation Appropriate Use Criteria Task Force, American Society of Echocardiography, American Heart Association, et al. ACCF/ASE/AHA/ASNC/HFSA/HRS/SCAI/SCCM/SCCT/SCMR 2011 Appropriate Use Criteria for Echocardiography. A Report of the American College of Cardiology Foundation Appropriate Use Criteria Task Force, American Society of Echocardiography, American Heart Association, American Society of Nuclear Cardiology, Heart Failure Society of America, Heart Rhythm Society, Society for Cardiovascular Angiography and Interventions, Society of Critical Care Medicine, Society of Cardiovascular Computed Tomography, and Society for Cardiovascular Magnetic Resonance Endorsed by the American College of Chest Physicians. J Am Coll Cardiol. 2011;57(9):1126-1166. PubMed
13. Crane SD. Risk stratification of patients with syncope in an accident and emergency department. Emerg Med J. 2002;19(1):23-27. PubMed
14. Croci F, Brignole M, Alboni P, et al. The application of a standardized strategy of evaluation in patients with syncope referred to three syncope units. Europace. 2002;4(4):351-355. PubMed
15. Sarasin FP, Junod AF, Carballo D, Slama S, Unger PF, Louis-Simonet M. Role of echocardiography in the evaluation of syncope: a prospective study. Heart. 2002;88(4):363-367. PubMed
16. Echocardiogram Cost. http://health.costhelper.com/echocardiograms.html. 2017. Accessed January 26, 2017.
17. Thiruganasambandamoorthy V, Ramaekers R, Rahman MO, et al. Prognostic value of cardiac biomarkers in the risk stratification of syncope: a systematic review. Intern Emerg Med. 2015;10(8):1003-1014. PubMed
18. Pfister R, Diedrichs H, Larbig R, Erdmann E, Schneider CA. NT-pro-BNP for differential diagnosis in patients with syncope. Int J Cardiol. 2009;133(1):51-54. PubMed
19. Reed MJ, Mills NL, Weir CJ. Sensitive troponin assay predicts outcome in syncope. Emerg Med J. 2012;29(12):1001-1003. PubMed
20. Tanimoto K, Yukiiri K, Mizushige K, et al. Usefulness of brain natriuretic peptide as a marker for separating cardiac and noncardiac causes of syncope. Am J Cardiol. 2004;93(2):228-230. PubMed
The “Things We Do for No Reason” (TWDFNR) series reviews practices that have become common parts of hospital care but which may provide little value to our patients. Practices reviewed in the TWDFNR series do not represent “black and white” conclusions or clinical practice standards, but are meant as a starting place for research and active discussions among hospitalists and patients. We invite you to be part of that discussion. https://www.choosingwisely.org/
Syncope is a common cause of emergency department (ED) visits and hospitalizations. Echocardiogram is frequently used as a diagnostic tool in the evaluation of syncope, performed in 39%-91% of patients.
CLINICAL SCENARIO
A 57-year-old woman presented to the ED after a syncopal episode. She had just eaten dinner when she slumped over and became unresponsive. Her husband estimated that she regained consciousness 30 seconds later and quickly returned to baseline mental status. She denied chest pain, shortness of breath, or palpitations. Her medical history included hypertension and hypothyroidism. Her medication regimen was unchanged.
Vital signs, including orthostatic blood pressures, were within normal ranges. A physical examination revealed regular heart sounds without murmur, rub, or gallop. ECG showed normal sinus rhythm, normal axis, and normal intervals. Chest radiograph, complete blood count, chemistry, pro-brain natriuretic peptide (pro-BNP), and troponin were within normal ranges.
BACKGROUND
Syncope, defined as “abrupt, transient, complete loss of consciousness, associated with inability to maintain postural tone, with rapid and spontaneous recovery,”1 is a common clinical problem, accounting for 1% of ED visits in the United States.2 As syncope has been shown to be associated with increased mortality,3 the primary goal of syncope evaluation is to identify modifiable underlying causes, particularly cardiac causes. Current guidelines recommend a complete history and physical, orthostatic blood pressure measurement, and ECG as the initial evaluation for syncope.1 Echocardiogram is a frequent additional test, performed in 39%-91% of patients.4-8
WHY YOU MAY THINK ECHOCARDIOGRAM IS HELPFUL
Echocardiogram may identify depressed ejection fraction, a risk factor for ventricular arrhythmias, along with structural causes of syncope, including aortic stenosis, pulmonary hypertension, and hypertrophic cardiomyopathy.9 Structural heart disease is the underlying etiology in about 3% of patients with syncope.10
Prior guidelines stated that “an echocardiogram is a helpful screening test if the history, physical examination, and ECG do not provide a diagnosis or if underlying heart disease is suspected.”11 A separate guideline for the appropriate use of echocardiogram assigned a score of appropriateness on a 1-9 scale based on increasing indication.12 Echocardiogram for syncope was scored a 7 in patients with “no other symptoms or signs of cardiovascular disease.”12 Only 25%-40% of patients with syncope will have a cause identified after the history, physical examination, and ECG,13,14 creating diagnostic uncertainty that often leads to further testing.
WHY ECHOCARDIOGRAM IS NOT NECESSARY IN ALL PATIENTS
Mendu et al.5 performed a single-center, retrospective study of the diagnostic yield of testing for syncope in 2106 consecutive patients older than 65 admitted over the course of 5 years. They retrospectively applied the San Francisco Syncope Rule (SFSR), which patients met if they had congestive heart failure, hematocrit <30%, abnormal ECG, shortness of breath, or systolic blood pressure <90 mm Hg. There were 821 patients (39%) who underwent echocardiogram. Among the 488 with no SFSR criteria, 10 patients (2%) had echocardiogram results that affected management, and 4 patients (1%) had results that helped determine the etiology of syncope.
Anderson et al. studied 323 syncope patients in a single ED observation unit over 18 months.6 Patients with high-risk features, including unstable vital signs, abnormal cardiac biomarkers, or ischemic ECG changes, were excluded from the unit. The initial ECG was considered abnormal if it contained arrhythmia, premature atrial or ventricular contractions, pacing, second- or third-degree heart block, or left bundle branch block. Of the 235 patients with a normal ECG who underwent echocardiogram, none had an abnormal study.
Chang et al.7 performed a retrospective review of 468 patients admitted with syncope at a single hospital. Charts were reviewed for ECG and echocardiogram results. Abnormal ECGs were defined as those containing arrhythmias, Q waves, ischemic changes, second- and third-degree heart block, paced rhythm, corrected QT interval (QTc) >500 ms, left bundle branch or bifasicular block, Brugada pattern, or abnormal axis. Among 321 patients with normal ECGs, echocardiograms were performed in 192. Eleven of those echocardiograms were abnormal: 3 demonstrated aortic stenosis in patients who already carried the diagnosis, and the other 8 abnormal echocardiograms revealed unexpected left ventricular ejection fractions <45% or other nonaortic valvular pathology. None of the findings were felt to be the cause of syncope.
Han et al.8 performed a retrospective cohort study of all syncope patients presenting to a single ED over the course of 1 year. Patients were stratified as high risk if they had chest pain, palpitations, a history of cardiac disease (defined as prior arrhythmia, heart failure, coronary artery disease, or structural heart disease), abnormal cardiac biomarkers, or an abnormal ECG (defined as sinus bradycardia, arrhythmia, premature beats, second- or third-degree heart block, ventricular hypertrophy, ischemic Q or ST changes, or abnormal QT interval). Patients with none of those symptoms or findings were considered low risk. Of those categorized as low risk (n = 115), 47 underwent echocardiogram, only 1 of which was abnormal.
Across studies, the percentage of patients with a normal cardiac history, examination, and ECG with new, significant abnormalities on echocardiogram was 0% in 3 studies (n = 340),4,6,15 2% in 1 study (10/488 patients),5 2.1% in 1 study (1/47 patients),8 and 4.2% in 1 study (8/192 patients).7 The 11 echocardiograms with significant findings in the studies by Mendu et al.5 and Han et al.8 were not further described. The 8 patients with abnormal echocardiograms reported by Chang et al.7 had depressed left ventricular ejection fraction or nonaortic valvular disease that did not represent a definitive etiology of their syncope. Given the cost of $1,000 to $2,220 per study,16 routine echocardiograms in patients with a normal history, examination, and ECG would thus require $60,000 to $132,000 in spending to find 1 new significant abnormality, which may be unrelated to the actual cause of syncope.
SITUATIONS IN WHICH ECHOCARDIOGRAM MAY BE HELPFUL
The diagnostic yield of echocardiogram is higher in patients with a positive cardiac history or abnormal ECG. In the prospective study by Sarasin et al.15 a total of 27% of patients with a positive cardiac history or abnormal ECG were found to have an ejection fraction less than or equal to 40%. Other studies reporting percentages of abnormal echocardiograms in patients with abnormal history, ECG, or examination found rates of 8% (26/333),5 20% (7/35),6 28% (27/97),8 and 29% (27/93).7 It should be noted that not all of these abnormalities were felt to be the cause of syncope. For example, Sarasin et al.15 reported that only half of the patients with newly identified depressed ejection fraction were diagnosed with arrhythmia-related syncope. Chang et al7 reported that 6 of the 27 patients (22%) with abnormal ECG and echocardiogram had the cause of syncope established by echocardiogram.
Finally, some syncope patients will have cardiac biomarkers sent in the ED. Han et al.8 found that among patients with syncope, those with abnormal versus normal echocardiogram were more likely to have elevated BNP (70% vs 23%) and troponin (36% vs 12.4%). Thus, obtaining an echocardiogram in patients with syncope and abnormal cardiac biomarkers may be reasonable. It should be noted, however, that while some studies have suggested a role for biomarkers in differentiating cardiac from noncardiac syncope,17-20 current guidelines state that the usefulness of these tests is uncertain.1
WHAT YOU SHOULD DO INSTEAD OF ECHOCARDIOGRAM FOR ALL PATIENTS
Clinicians should carefully screen patients with syncope for abnormal findings suggesting cardiac disease on history, physical examination, and ECG. Relevant cardiac history includes known coronary artery disease, valvular heart disease, arrhythmia, congestive heart failure, and risk factors for cardiac syncope (supplemental Appendix). The definition of abnormal ECG varies among studies, but abnormalities that should prompt an echocardiogram include arrhythmia, premature atrial or ventricular contractions, second- or third-degree heart block, sinus bradycardia, bundle branch or fascicular blocks, left ventricular hypertrophy, ischemic ST or T wave changes, Q waves, or a prolonged QTc interval. New guidelines from the American College of Cardiology state, “Routine cardiac imaging is not useful in the evaluation of patients with syncope unless cardiac etiology is suspected on the basis of an initial evaluation, including history, physical examination, or ECG.”1
RECOMMENDATIONS
- All patients with syncope should receive a complete history, physical examination, orthostatic vital signs, and ECG.
- Perform echocardiogram on patients with syncope and a history of cardiac disease, examination suggestive of structural heart disease or congestive heart failure, or abnormal ECG.
- Echocardiogram may be reasonable in patients with syncope and abnormal cardiac biomarkers.
CONCLUSIONS
While commonly performed as part of syncope evaluations, echocardiogram has a very low diagnostic yield in patients with a normal history, physical, and ECG. The patient described in the initial case scenario would have an extremely low likelihood of having important diagnostic information found on echocardiogram.
Disclosure
The authors have no conflicts of interest relevant to this article.
1. Shen WK, Sheldon RS, Benditt DG, et al. 2017 ACC/AHA/HRS Guideline for the Evaluation and Management of Patients With Syncope: A Report of the American College of Cardiology/American Heart Association Task Force on Clinical Practice Guidelines, and the Heart Rhythm Society. J Am Coll Cardiol. 2017;70(5):620-633. PubMed
2. Sun BC, Emond JA, Camargo CA Jr. Characteristics and admission patterns of patients presenting with syncope to U.S. emergency departments, 1992-2000. Acad Emerg Med. 2004;11(10):1029-1034. PubMed
3. Soteriades ES, Evans JC, Larson MG, et al. Incidence and prognosis of syncope. N Engl J Med. 2002;347(12):878-885. PubMed
4. Recchia D, Barzilai B. Echocardiography in the evaluation of patients with syncope. J Gen Intern Med. 1995;10(12):649-655. PubMed
5. Mendu ML, McAvay G, Lampert R, Stoehr J, Tinetti ME. Yield of diagnostic tests in evaluating syncopal episodes in older patients. Arch Intern Med. 2009;169(14):1299-1305. PubMed
6. Anderson KL, Limkakeng A, Damuth E, Chandra A. Cardiac evaluation for structural abnormalities may not be required in patients presenting with syncope and a normal ECG result in an observation unit setting. Ann Emerg Med. 2012;60(4):478-484.e1. PubMed
7. Chang NL, Shah P, Bajaj S, Virk H, Bikkina M, Shamoon F. Diagnostic Yield of Echocardiography in Syncope Patients with Normal ECG. Cardiol Res Pract. 2016;2016:1251637. PubMed
8. Han SK, Yeom SR, Lee SH, et al. Transthoracic echocardiogram in syncope patients with normal initial evaluation. Am J Emerg Med. 2017;35(2):281-284. PubMed
9. Task Force for the Diagnosis and Management of Syncope, European Society of Cardiology, European Heart Rhythm Association, et al. Guidelines for the diagnosis and management of syncope (version 2009). Eur Heart J. 2009;30(21):2631-2671.
10. Alboni P, Brignole M, Menozzi C, et al. Diagnostic value of history in patients with syncope with or without heart disease. J Am Coll Cardiol. 2001;37(7):1921-1928. PubMed
11. Strickberger SA, Benson DW, Biaggioni I, et al. AHA/ACCF Scientific Statement on the evaluation of syncope: from the American Heart Association Councils on Clinical Cardiology, Cardiovascular Nursing, Cardiovascular Disease in the Young, and Stroke, and the Quality of Care and Outcomes Research Interdisciplinary Working Group; and the American College of Cardiology Foundation: in collaboration with the Heart Rhythm Society: endorsed by the American Autonomic Society. Circulation. 2006;113(2):316-327. PubMed
12. American College of Cardiology Foundation Appropriate Use Criteria Task Force, American Society of Echocardiography, American Heart Association, et al. ACCF/ASE/AHA/ASNC/HFSA/HRS/SCAI/SCCM/SCCT/SCMR 2011 Appropriate Use Criteria for Echocardiography. A Report of the American College of Cardiology Foundation Appropriate Use Criteria Task Force, American Society of Echocardiography, American Heart Association, American Society of Nuclear Cardiology, Heart Failure Society of America, Heart Rhythm Society, Society for Cardiovascular Angiography and Interventions, Society of Critical Care Medicine, Society of Cardiovascular Computed Tomography, and Society for Cardiovascular Magnetic Resonance Endorsed by the American College of Chest Physicians. J Am Coll Cardiol. 2011;57(9):1126-1166. PubMed
13. Crane SD. Risk stratification of patients with syncope in an accident and emergency department. Emerg Med J. 2002;19(1):23-27. PubMed
14. Croci F, Brignole M, Alboni P, et al. The application of a standardized strategy of evaluation in patients with syncope referred to three syncope units. Europace. 2002;4(4):351-355. PubMed
15. Sarasin FP, Junod AF, Carballo D, Slama S, Unger PF, Louis-Simonet M. Role of echocardiography in the evaluation of syncope: a prospective study. Heart. 2002;88(4):363-367. PubMed
16. Echocardiogram Cost. http://health.costhelper.com/echocardiograms.html. 2017. Accessed January 26, 2017.
17. Thiruganasambandamoorthy V, Ramaekers R, Rahman MO, et al. Prognostic value of cardiac biomarkers in the risk stratification of syncope: a systematic review. Intern Emerg Med. 2015;10(8):1003-1014. PubMed
18. Pfister R, Diedrichs H, Larbig R, Erdmann E, Schneider CA. NT-pro-BNP for differential diagnosis in patients with syncope. Int J Cardiol. 2009;133(1):51-54. PubMed
19. Reed MJ, Mills NL, Weir CJ. Sensitive troponin assay predicts outcome in syncope. Emerg Med J. 2012;29(12):1001-1003. PubMed
20. Tanimoto K, Yukiiri K, Mizushige K, et al. Usefulness of brain natriuretic peptide as a marker for separating cardiac and noncardiac causes of syncope. Am J Cardiol. 2004;93(2):228-230. PubMed
© 2017 Society of Hospital Medicine
Empiric <i>Listeria monocytogenes</i> antibiotic coverage for febrile infants (age, 0-90 days)
The “Things We Do for No Reason” series reviews practices which have become common parts of hospital care but which may provide little value to our patients. Practices reviewed in the TWDFNR series do not represent “black and white” conclusions or clinical practice standards, but are meant as a starting place for research and active discussions among hospitalists and patients. We invite you to be part of that discussion. https://www.choosingwisely.org/

Evaluation and treatment of the febrile infant 0 to 90 days of age are common clinical issues in pediatrics, family medicine, emergency medicine, and pediatric hospital medicine. Traditional teaching has been that Listeria monocytogenes is 1 of the 3 most common pathogens causing neonatal sepsis. Many practitioners routinely use antibiotic regimens, including ampicillin, to specifically target Listeria. However, a large body of evidence, including a meta-analysis and several multicenter studies, has shown that listeriosis is extremely rare in the United States. The practice of empiric ampicillin thus exposes the patient to harms and costs with little if any potential benefit, while increasing pressure on the bacterial flora in the community to generate antibiotic resistance. Empiric ampicillin for all infants admitted for sepsis evaluation is a tradition-based practice no longer founded on the best available evidence.
CASE REPORT
A 32-day-old, full-term, previously healthy girl presented with fever of 1 day’s duration. Her parents reported she had appeared well until the evening before admission, when she became a bit less active and spent less time breastfeeding. The morning of admission, she was fussier than usual. Rectal temperature, taken by her parents, was 101°F. There were no other symptoms and no sick contacts.
On examination, the patient’s rectal temperature was 101.5°F. Her other vitals and the physical examination findings were unremarkable. Laboratory test results included a normal urinalysis and a peripheral white blood cell (WBC) count of 21,300 cells/µL. Cerebrospinal fluid (CSF) analysis revealed normal protein and glucose levels with 3 WBCs/µL and a negative gram stain. Due to stratifying at higher risk for serious bacterial infection (SBI), the child was admitted and started on ampicillin and cefotaxime while awaiting culture results.
BACKGROUND
Evaluation and treatment of febrile infants are common clinical issues in pediatrics, emergency medicine, and general practice. Practice guidelines for evaluation of febrile infants recommend hospitalization and parenteral antibiotics for children younger than 28 days and children 29 to 90 days old if stratified at high risk for SBI.1,2 Recommendations for empiric antibiotic regimens include ampicillin in addition to either gentamicin or cefotaxime.1,2
WHY YOU MIGHT THINK AMPICILLIN IS HELPFUL
Generations of pediatrics students have been taught that the 3 pathogens most likely to cause bacterial sepsis in infants are group B Streptococcus (GBS), Escherichia coli, and Listeria monocytogenes. This teaching is still espoused in the latest editions of pediatrics textbooks.3 Ampicillin is specifically recommended for covering Listeria, and studies have found that 62% to 78% of practitioners choose empiric ampicillin-containing antibiotic regimens for the treatment of febrile infants.4-6
WHY EMPIRIC AMPICILLIN IS UNNECESSARY
In the past, Listeria was a potential though still uncommon infant pathogen. Over the past few decades, however, the epidemiology of infant sepsis has changed significantly. Estimates of the rate of infection with Listeria now range from extremely rare to nonexistent across multiple studies4,7-15 (Table). In a 4-year retrospective case series at a single urban academic center in Washington, DC, Sadow et al.4 reported no instances of Listeria among 121 positive bacterial cultures in infants younger than 60 days seen in the emergency department (ED). Byington et al.7 examined all positive cultures for infants 0 to 90 days old at a large academic referral center in Utah over a 3-year period and reported no cases of Listeria (1298 patients, 105 SBI cases). A study at a North Carolina academic center found 1 case of Listeria meningitis among 72 SBIs (668 febrile infants) without a localizing source.8 At a large group-practice in northern California, Greenhow et al.9 examined all blood cultures (N = 4255) performed over 4 years for otherwise healthy infants 1 week to 3 months old and found no cases of Listeria. In a follow-up study, the same authors examined all blood (n = 5396), urine (n = 4599), and CSF (n = 1796) cultures in the same population and found no Listeria cases.10 Hassoun et al.11 studied SBI rates among infants younger than 28 days with any blood, urine, or CSF culture performed over 4 years at two Michigan EDs. One (0.08%) of the 1192 infants evaluated had bacteremia caused by Listeria.

Multicenter studies have reported similar results. In a study of 6 hospital systems in geographically diverse areas of the United States, Biondi et al.12 examined all positive blood cultures (N = 181) for febrile infants younger than 90 days admitted to a general pediatric ward, and found no listeriosis. Mischler et al.13 examined all positive blood cultures (N = 392) for otherwise healthy febrile infants 0 to 90 days old admitted to a hospital in 1 of 17 geographically diverse healthcare systems and found no cases of Listeria. A recent meta-analysis of studies that reported SBI rates for febrile infants 0 to 90 days old found the weighted prevalence of Listeria bacteremia to be 0.03% (2/20,703) and that of meningitis to be 0.02% (3/13,375).14 Veesenmeyer and Edmonson15 used a national inpatient database to identify all Listeria cases among infants over a 6-year period and estimated listeriosis rates for the US population. Over the 6 years, there were 212 total cases, which were extrapolated to 344 in the United States during that period, yielding a pooled annual incidence rate of 1.41 in 100,000 births.
Ampicillin offers no significant improvement in coverage for GBS or E coli beyond other β-lactam antibiotics, such as cefotaxime. Therefore, though the cost and potential harms of 24 to 48 hours of intravenous ampicillin are low for the individual patient, there is almost no potential benefit. Using the weighted prevalence of 0.03% for Listeria bacteremia reported in the recent meta-analysis,14 the number needed to treat to cover 1 case of Listeria bacteremia would be 3333. In addition, the increasing incidence of ampicillin resistance, particularly among gram-negative organisms,4,7,9 argues strongly for better antibiotic stewardship on a national level. A number of expert authors have advocated dropping empiric Listeria coverage as part of the treatment of febrile infants, particularly infants 29 to 90 days old.16,17 Some authors continue to advocate empiric Listeria coverage.6 It is interesting to note, however, that the incidence of Staph aureus bacteremia in recent case series is much higher than that reported for Listeria, accounting for 6-9% of bacteremia cases.9,11,13 Yet few if any authors advocate for empiric S. aureus coverage.
WHEN EMPIRIC AMPICILLIN COVERAGE MAY BE REASONABLE
The rate of listeriosis remains low across age groups in recent studies, but the rate is slightly higher in very young infants. In the recent national database study of listeriosis cases over a 6-year period, almost half involved infants younger than 7 days, and most of these infants showed no evidence of meningitis.15 Therefore, it may be reasonable to include empiric Listeria coverage in febrile infants younger than 7 days, though the study authors estimated 22.5 annual cases of Listeria in this age range in the United States. Eighty percent of the Listeria cases were in infants younger than 28 days, but more than 85% of infants 7 to 28 days old had meningitis. Therefore, broad antimicrobial coverage for infants with CSF pleocytosis and/or a high bacterial meningitis score is reasonable, especially for infants younger than 28 days.
Other potential indications for ampicillin are enterococcal infections. Though enteroccocal SBI rates in febrile infants are also quite low,7-9,11,12 if Enterococcus were highly suspected, such as in an infant with pyuria and gram positive organisms on gram stain, ampicillin offers good additional coverage. In the case of a local outbreak of listeriosis, or a specific exposure to Listeria-contaminated products on a patient history, antibiotics with efficacy against Listeria should be used. Last, in cases in which gentamicin is used as empiric coverage for gram-negative organisms, ampicillin offers important additional coverage for GBS.
Some practitioners advocate ampicillin and gentamicin over cefotaxime regimens on the basis of an often cited study that found a survival benefit for febrile neonates in the intensive care setting.18 There are a number of reasons that this study should not influence care for typical infants admitted with possible sepsis. First, the study was retrospective and limited by its use of administrative data. The authors acknowledged that a potential explanation for their results is unmeasured confounding. Second, the patients included in the study were dramatically different from the group of well infants admitted with possible sepsis; the study included neonatal critical care unit patients treated with antibiotics within the first 3 days of life. Third, the study’s results have not been replicated in otherwise healthy febrile infants.
WHAT YOU SHOULD USE INSTEAD OF AMPICILLIN FOR EMPIRIC LISTERIA COVERAGE
For febrile children 0 to 90 days old, empiric antibiotic coverage should be aimed at covering the current predominant pathogens, which include E coli and GBS. Therefore, for most children and US regions, a third-generation cephalosporin (eg, cefotaxime) is sufficient.
RECOMMENDATIONS
- Empiric antibiotics for treatment of febrile children 0-90 days should target E. coli and GBS; a third generation cephalosporin, (e.g. cefotaxime) alone is a reasonable choice for most patients.
- Prescribing ampicillin to specifically cover Listeria is unnecessary for the vast majority of febrile infants
- Prescribing ampicillin is reasonable in certain subgroups of febrile infants: those less than seven days of age, those with evidence of bacterial meningitis (especially if also <28 days of age), those in whom enterococcal infection is strongly suspected, and those with specific Listeria exposures related to local outbreaks.
CONCLUSION
The 32-day-old infant described in the clinical scenario was at extremely low risk for listeriosis. Antibiotic coverage with a third-generation cephalosporin is sufficient for the most likely pathogens. The common practice of empirically covering Listeria in otherwise healthy febrile infants considered to be at higher risk for SBI is no longer based on best available evidence and represents overtreatment with at least theoretical harms. Avoidance of the risks associated with the side effects of antibiotics, costs saved by forgoing multiple antibiotics, a decrease in medication dosing frequency, and improved antibiotic stewardship for the general population all argue forcefully for making empiric Listeria coverage a thing of the past.
Disclosure
Nothing to report.
Do you think this is a low-value practice? Is this truly a “Thing We Do for No Reason?” Share what you do in your practice and join in the conversation online by retweeting it on Twitter (#TWDFNR) and Liking It on Facebook. We invite you to propose ideas for other “Things We Do for No Reason” topics by emailing TWDFNR@hospitalmedicine.org.
1. Baraff LJ, Bass JW, Fleisher GR, et al. Practice guideline for the management of infants and children 0 to 36 months of age with fever without source. Agency for Health Care Policy and Research. Ann Emerg Med. 1993;22(7):1198-1210. PubMed
2. American College of Emergency Physicians Clinical Policies Committee; American College of Emergency Physicians Clinical Policies Subcommittee on Pediatric Fever. Clinical policy for children younger than three years presenting to the emergency department with fever. Ann Emerg Med. 2003;42(4):530-545. PubMed
3. Nield L, Kamat D. Fever without a focus. In: Kliegman R, Stanton B, eds. Nelson’s Textbook of Pediatrics. 20th ed. Philadelphia, PA: Elsevier; 2016.
4. Sadow KB, Derr R, Teach SJ. Bacterial infections in infants 60 days and younger: epidemiology, resistance, and implications for treatment. Arch Pediatr Adolesc Med. 1999;153(6):611-614. PubMed
5. Aronson PL, Thurm C, Alpern ER, et al. Variation in care of the febrile young infant <90 days in US pediatric emergency departments. Pediatrics. 2014;134(4):667-677. PubMed
6. Cantey JB, Lopez-Medina E, Nguyen S, Doern C, Garcia C. Empiric antibiotics for serious bacterial infection in young infants: opportunities for stewardship. Pediatr Emerg Care. 2015;31(8):568-571. PubMed
7. Byington CL, Rittichier KK, Bassett KE, et al. Serious bacterial infections in febrile infants younger than 90 days of age: the importance of ampicillin-resistant pathogens. Pediatrics. 2003;111(5 pt 1):964-968. PubMed
8. Watt K, Waddle E, Jhaveri R. Changing epidemiology of serious bacterial infections in febrile infants without localizing signs. PLoS One. 2010;5(8):e12448. PubMed
9. Greenhow TL, Hung YY, Herz AM. Changing epidemiology of bacteremia in infants aged 1 week to 3 months. Pediatrics. 2012;129(3):e590-e596. PubMed
10. Greenhow TL, Hung YY, Herz AM, Losada E, Pantell RH. The changing epidemiology of serious bacterial infections in young infants. Pediatr Infect Dis J. 2014;33(6):595-599. PubMed
11. Hassoun A, Stankovic C, Rogers A, et al. Listeria and enterococcal infections in neonates 28 days of age and younger: is empiric parenteral ampicillin still indicated? Pediatr Emerg Care. 2014;30(4):240-243. PubMed
12. Biondi E, Evans R, Mischler M, et al. Epidemiology of bacteremia in febrile infants in the United States. Pediatrics. 2013;132(6):990-996. PubMed
13. Mischler M, Ryan MS, Leyenaar JK, et al. Epidemiology of bacteremia in previously healthy febrile infants: a follow-up study. Hosp Pediatr. 2015;5(6):293-300. PubMed
14. Leazer R, Perkins AM, Shomaker K, Fine B. A meta-analysis of the rates of Listeria monocytogenes and Enterococcus in febrile infants. Hosp Pediatr. 2016;6(4):187-195. PubMed
15. Veesenmeyer AF, Edmonson MB. Trends in US hospital stays for listeriosis in infants. Hosp Pediatr. 2016;6(4):196-203. PubMed
16. Schroeder AR, Roberts KB. Is tradition trumping evidence in the treatment of young, febrile infants? Hosp Pediatr. 2016;6(4):252-253. PubMed
17. Cioffredi LA, Jhaveri R. Evaluation and management of febrile children: a review. JAMA Pediatr. 2016;170(8):794-800. PubMed
18. Clark RH, Bloom BT, Spitzer AR, Gerstmann DR. Empiric use of ampicillin and cefotaxime, compared with ampicillin and gentamicin, for neonates at risk for sepsis is associated with an increased risk of neonatal death. Pediatrics. 2006;117(1):67-74. PubMed
The “Things We Do for No Reason” series reviews practices which have become common parts of hospital care but which may provide little value to our patients. Practices reviewed in the TWDFNR series do not represent “black and white” conclusions or clinical practice standards, but are meant as a starting place for research and active discussions among hospitalists and patients. We invite you to be part of that discussion. https://www.choosingwisely.org/
Evaluation and treatment of the febrile infant 0 to 90 days of age are common clinical issues in pediatrics, family medicine, emergency medicine, and pediatric hospital medicine. Traditional teaching has been that Listeria monocytogenes is 1 of the 3 most common pathogens causing neonatal sepsis. Many practitioners routinely use antibiotic regimens, including ampicillin, to specifically target Listeria. However, a large body of evidence, including a meta-analysis and several multicenter studies, has shown that listeriosis is extremely rare in the United States. The practice of empiric ampicillin thus exposes the patient to harms and costs with little if any potential benefit, while increasing pressure on the bacterial flora in the community to generate antibiotic resistance. Empiric ampicillin for all infants admitted for sepsis evaluation is a tradition-based practice no longer founded on the best available evidence.
CASE REPORT
A 32-day-old, full-term, previously healthy girl presented with fever of 1 day’s duration. Her parents reported she had appeared well until the evening before admission, when she became a bit less active and spent less time breastfeeding. The morning of admission, she was fussier than usual. Rectal temperature, taken by her parents, was 101°F. There were no other symptoms and no sick contacts.
On examination, the patient’s rectal temperature was 101.5°F. Her other vitals and the physical examination findings were unremarkable. Laboratory test results included a normal urinalysis and a peripheral white blood cell (WBC) count of 21,300 cells/µL. Cerebrospinal fluid (CSF) analysis revealed normal protein and glucose levels with 3 WBCs/µL and a negative gram stain. Due to stratifying at higher risk for serious bacterial infection (SBI), the child was admitted and started on ampicillin and cefotaxime while awaiting culture results.
BACKGROUND
Evaluation and treatment of febrile infants are common clinical issues in pediatrics, emergency medicine, and general practice. Practice guidelines for evaluation of febrile infants recommend hospitalization and parenteral antibiotics for children younger than 28 days and children 29 to 90 days old if stratified at high risk for SBI.1,2 Recommendations for empiric antibiotic regimens include ampicillin in addition to either gentamicin or cefotaxime.1,2
WHY YOU MIGHT THINK AMPICILLIN IS HELPFUL
Generations of pediatrics students have been taught that the 3 pathogens most likely to cause bacterial sepsis in infants are group B Streptococcus (GBS), Escherichia coli, and Listeria monocytogenes. This teaching is still espoused in the latest editions of pediatrics textbooks.3 Ampicillin is specifically recommended for covering Listeria, and studies have found that 62% to 78% of practitioners choose empiric ampicillin-containing antibiotic regimens for the treatment of febrile infants.4-6
WHY EMPIRIC AMPICILLIN IS UNNECESSARY
In the past, Listeria was a potential though still uncommon infant pathogen. Over the past few decades, however, the epidemiology of infant sepsis has changed significantly. Estimates of the rate of infection with Listeria now range from extremely rare to nonexistent across multiple studies4,7-15 (Table). In a 4-year retrospective case series at a single urban academic center in Washington, DC, Sadow et al.4 reported no instances of Listeria among 121 positive bacterial cultures in infants younger than 60 days seen in the emergency department (ED). Byington et al.7 examined all positive cultures for infants 0 to 90 days old at a large academic referral center in Utah over a 3-year period and reported no cases of Listeria (1298 patients, 105 SBI cases). A study at a North Carolina academic center found 1 case of Listeria meningitis among 72 SBIs (668 febrile infants) without a localizing source.8 At a large group-practice in northern California, Greenhow et al.9 examined all blood cultures (N = 4255) performed over 4 years for otherwise healthy infants 1 week to 3 months old and found no cases of Listeria. In a follow-up study, the same authors examined all blood (n = 5396), urine (n = 4599), and CSF (n = 1796) cultures in the same population and found no Listeria cases.10 Hassoun et al.11 studied SBI rates among infants younger than 28 days with any blood, urine, or CSF culture performed over 4 years at two Michigan EDs. One (0.08%) of the 1192 infants evaluated had bacteremia caused by Listeria.
Multicenter studies have reported similar results. In a study of 6 hospital systems in geographically diverse areas of the United States, Biondi et al.12 examined all positive blood cultures (N = 181) for febrile infants younger than 90 days admitted to a general pediatric ward, and found no listeriosis. Mischler et al.13 examined all positive blood cultures (N = 392) for otherwise healthy febrile infants 0 to 90 days old admitted to a hospital in 1 of 17 geographically diverse healthcare systems and found no cases of Listeria. A recent meta-analysis of studies that reported SBI rates for febrile infants 0 to 90 days old found the weighted prevalence of Listeria bacteremia to be 0.03% (2/20,703) and that of meningitis to be 0.02% (3/13,375).14 Veesenmeyer and Edmonson15 used a national inpatient database to identify all Listeria cases among infants over a 6-year period and estimated listeriosis rates for the US population. Over the 6 years, there were 212 total cases, which were extrapolated to 344 in the United States during that period, yielding a pooled annual incidence rate of 1.41 in 100,000 births.
Ampicillin offers no significant improvement in coverage for GBS or E coli beyond other β-lactam antibiotics, such as cefotaxime. Therefore, though the cost and potential harms of 24 to 48 hours of intravenous ampicillin are low for the individual patient, there is almost no potential benefit. Using the weighted prevalence of 0.03% for Listeria bacteremia reported in the recent meta-analysis,14 the number needed to treat to cover 1 case of Listeria bacteremia would be 3333. In addition, the increasing incidence of ampicillin resistance, particularly among gram-negative organisms,4,7,9 argues strongly for better antibiotic stewardship on a national level. A number of expert authors have advocated dropping empiric Listeria coverage as part of the treatment of febrile infants, particularly infants 29 to 90 days old.16,17 Some authors continue to advocate empiric Listeria coverage.6 It is interesting to note, however, that the incidence of Staph aureus bacteremia in recent case series is much higher than that reported for Listeria, accounting for 6-9% of bacteremia cases.9,11,13 Yet few if any authors advocate for empiric S. aureus coverage.
WHEN EMPIRIC AMPICILLIN COVERAGE MAY BE REASONABLE
The rate of listeriosis remains low across age groups in recent studies, but the rate is slightly higher in very young infants. In the recent national database study of listeriosis cases over a 6-year period, almost half involved infants younger than 7 days, and most of these infants showed no evidence of meningitis.15 Therefore, it may be reasonable to include empiric Listeria coverage in febrile infants younger than 7 days, though the study authors estimated 22.5 annual cases of Listeria in this age range in the United States. Eighty percent of the Listeria cases were in infants younger than 28 days, but more than 85% of infants 7 to 28 days old had meningitis. Therefore, broad antimicrobial coverage for infants with CSF pleocytosis and/or a high bacterial meningitis score is reasonable, especially for infants younger than 28 days.
Other potential indications for ampicillin are enterococcal infections. Though enteroccocal SBI rates in febrile infants are also quite low,7-9,11,12 if Enterococcus were highly suspected, such as in an infant with pyuria and gram positive organisms on gram stain, ampicillin offers good additional coverage. In the case of a local outbreak of listeriosis, or a specific exposure to Listeria-contaminated products on a patient history, antibiotics with efficacy against Listeria should be used. Last, in cases in which gentamicin is used as empiric coverage for gram-negative organisms, ampicillin offers important additional coverage for GBS.
Some practitioners advocate ampicillin and gentamicin over cefotaxime regimens on the basis of an often cited study that found a survival benefit for febrile neonates in the intensive care setting.18 There are a number of reasons that this study should not influence care for typical infants admitted with possible sepsis. First, the study was retrospective and limited by its use of administrative data. The authors acknowledged that a potential explanation for their results is unmeasured confounding. Second, the patients included in the study were dramatically different from the group of well infants admitted with possible sepsis; the study included neonatal critical care unit patients treated with antibiotics within the first 3 days of life. Third, the study’s results have not been replicated in otherwise healthy febrile infants.
WHAT YOU SHOULD USE INSTEAD OF AMPICILLIN FOR EMPIRIC LISTERIA COVERAGE
For febrile children 0 to 90 days old, empiric antibiotic coverage should be aimed at covering the current predominant pathogens, which include E coli and GBS. Therefore, for most children and US regions, a third-generation cephalosporin (eg, cefotaxime) is sufficient.
RECOMMENDATIONS
- Empiric antibiotics for treatment of febrile children 0-90 days should target E. coli and GBS; a third generation cephalosporin, (e.g. cefotaxime) alone is a reasonable choice for most patients.
- Prescribing ampicillin to specifically cover Listeria is unnecessary for the vast majority of febrile infants
- Prescribing ampicillin is reasonable in certain subgroups of febrile infants: those less than seven days of age, those with evidence of bacterial meningitis (especially if also <28 days of age), those in whom enterococcal infection is strongly suspected, and those with specific Listeria exposures related to local outbreaks.
CONCLUSION
The 32-day-old infant described in the clinical scenario was at extremely low risk for listeriosis. Antibiotic coverage with a third-generation cephalosporin is sufficient for the most likely pathogens. The common practice of empirically covering Listeria in otherwise healthy febrile infants considered to be at higher risk for SBI is no longer based on best available evidence and represents overtreatment with at least theoretical harms. Avoidance of the risks associated with the side effects of antibiotics, costs saved by forgoing multiple antibiotics, a decrease in medication dosing frequency, and improved antibiotic stewardship for the general population all argue forcefully for making empiric Listeria coverage a thing of the past.
Disclosure
Nothing to report.
Do you think this is a low-value practice? Is this truly a “Thing We Do for No Reason?” Share what you do in your practice and join in the conversation online by retweeting it on Twitter (#TWDFNR) and Liking It on Facebook. We invite you to propose ideas for other “Things We Do for No Reason” topics by emailing TWDFNR@hospitalmedicine.org.
1. Baraff LJ, Bass JW, Fleisher GR, et al. Practice guideline for the management of infants and children 0 to 36 months of age with fever without source. Agency for Health Care Policy and Research. Ann Emerg Med. 1993;22(7):1198-1210. PubMed
2. American College of Emergency Physicians Clinical Policies Committee; American College of Emergency Physicians Clinical Policies Subcommittee on Pediatric Fever. Clinical policy for children younger than three years presenting to the emergency department with fever. Ann Emerg Med. 2003;42(4):530-545. PubMed
3. Nield L, Kamat D. Fever without a focus. In: Kliegman R, Stanton B, eds. Nelson’s Textbook of Pediatrics. 20th ed. Philadelphia, PA: Elsevier; 2016.
4. Sadow KB, Derr R, Teach SJ. Bacterial infections in infants 60 days and younger: epidemiology, resistance, and implications for treatment. Arch Pediatr Adolesc Med. 1999;153(6):611-614. PubMed
5. Aronson PL, Thurm C, Alpern ER, et al. Variation in care of the febrile young infant <90 days in US pediatric emergency departments. Pediatrics. 2014;134(4):667-677. PubMed
6. Cantey JB, Lopez-Medina E, Nguyen S, Doern C, Garcia C. Empiric antibiotics for serious bacterial infection in young infants: opportunities for stewardship. Pediatr Emerg Care. 2015;31(8):568-571. PubMed
7. Byington CL, Rittichier KK, Bassett KE, et al. Serious bacterial infections in febrile infants younger than 90 days of age: the importance of ampicillin-resistant pathogens. Pediatrics. 2003;111(5 pt 1):964-968. PubMed
8. Watt K, Waddle E, Jhaveri R. Changing epidemiology of serious bacterial infections in febrile infants without localizing signs. PLoS One. 2010;5(8):e12448. PubMed
9. Greenhow TL, Hung YY, Herz AM. Changing epidemiology of bacteremia in infants aged 1 week to 3 months. Pediatrics. 2012;129(3):e590-e596. PubMed
10. Greenhow TL, Hung YY, Herz AM, Losada E, Pantell RH. The changing epidemiology of serious bacterial infections in young infants. Pediatr Infect Dis J. 2014;33(6):595-599. PubMed
11. Hassoun A, Stankovic C, Rogers A, et al. Listeria and enterococcal infections in neonates 28 days of age and younger: is empiric parenteral ampicillin still indicated? Pediatr Emerg Care. 2014;30(4):240-243. PubMed
12. Biondi E, Evans R, Mischler M, et al. Epidemiology of bacteremia in febrile infants in the United States. Pediatrics. 2013;132(6):990-996. PubMed
13. Mischler M, Ryan MS, Leyenaar JK, et al. Epidemiology of bacteremia in previously healthy febrile infants: a follow-up study. Hosp Pediatr. 2015;5(6):293-300. PubMed
14. Leazer R, Perkins AM, Shomaker K, Fine B. A meta-analysis of the rates of Listeria monocytogenes and Enterococcus in febrile infants. Hosp Pediatr. 2016;6(4):187-195. PubMed
15. Veesenmeyer AF, Edmonson MB. Trends in US hospital stays for listeriosis in infants. Hosp Pediatr. 2016;6(4):196-203. PubMed
16. Schroeder AR, Roberts KB. Is tradition trumping evidence in the treatment of young, febrile infants? Hosp Pediatr. 2016;6(4):252-253. PubMed
17. Cioffredi LA, Jhaveri R. Evaluation and management of febrile children: a review. JAMA Pediatr. 2016;170(8):794-800. PubMed
18. Clark RH, Bloom BT, Spitzer AR, Gerstmann DR. Empiric use of ampicillin and cefotaxime, compared with ampicillin and gentamicin, for neonates at risk for sepsis is associated with an increased risk of neonatal death. Pediatrics. 2006;117(1):67-74. PubMed
© 2017 Society of Hospital Medicine
Getting Hip to Vitamin D
Hip fracture is a common clinical problem, with an incidence of 957 cases/100,000 adults in the United States.[1] Studies have found a high prevalence of vitamin D deficiency among elderly patients with fragility fractures, though many of these studies were performed in high latitude regions.[2, 3, 4, 5, 6, 7, 8, 9, 10] Endocrine Society clinical practice guidelines recommend screening patients with fragility fractures for vitamin D deficiency.[11]
Our hospitalist group practices in an academic tertiary care facility in the southeastern United States. Beginning in June 2010, all patients with acute hip fracture were admitted to our service with consultative comanagement from orthopedics. Our group did not have a standardized approach for the assessment or treatment of vitamin D deficiency in this population. Preliminary analysis of a subgroup of our patients with acute hip fracture revealed that only 29% had been screened for vitamin D deficiency. Of these patients, 68% were deficient or insufficient, yet less than half had been discharged on an appropriate dose of vitamin D. We concluded that our group practice was both varied and substandard.
In this report we describe the creation and implementation of a process for improving the assessment and treatment of vitamin D deficiency in elderly patients with fragility hip fracture. We evaluated the effect of our process on the percentages of patients screened and treated appropriately for vitamin D deficiency.
METHODS
Creation of Intervention
We assembled a task force, consisting of 4 hospitalist physicians. The task force reviewed available literature on the prevalence of vitamin D deficiency in elderly patients with fragility fracture and major practice guidelines related to vitamin D. We utilized Endocrine Society clinical practice guidelines to define vitamin D deficiency, insufficiency, and recommended treatment dosing for each condition[11] (Table 1).
| Vitamin D Level (25‐OH) | Vitamin D Status | Treatment Dose Recommendation |
|---|---|---|
| 019 ng/mL | Deficient | 50,000 IU/week for 68 weeks |
| 2029 ng/mL | Insufficient | 1,000 to 2,000 IU/day or 50,000 IU/month |
We developed 2 processes for improving group practice. First, we presented a review of evidence and preliminary data from our group practice at a meeting of hospitalist staff. Second, we revised the computerized physician order entry (CPOE) set for patients with hip fractures to include 2 new orders: (1) an automatic order for 25‐OH vitamin D level to be drawn the morning after admission and (2) an order for initiation of 1000 IU daily of vitamin D at admission.
The reasons for starting empiric vitamin D supplementation were 2fold. First was to prompt dosing of vitamin D at the time of discharge by already having it on the patient's medication list. Second was to conform to US Preventive Services Task Force guidelines for fall prevention.[12] The dose of 1000 IU was selected due to its being adequate treatment for insufficient (though not deficient) patients, and yet a low enough dose to minimize risk of toxicity.
Providers
Our hospitalist group includes 21 physicians and 3 physician extenders. Two nocturnist positions were added to our group in July 2013, part way through our intervention. There were no other additions or subtractions to the staff during the study period.
Patients
Patients were identified by search of University of North Carolina (UNC) Hospitals' database using International Classification of Diseases, 9th Revision codes for femoral neck fracture (821.x) and femur fracture NOS (820.x), linked to hospital services covered by our group. Exclusion criteria included age 50 years, fracture due to high‐speed trauma, fracture due to malignancy, end‐stage renal disease, and death or transition to comfort care during the index hospitalization.
Outcome Measures
Primary outcome measures were the percentage of patients with acute hip fracture with vitamin D level checked during hospitalization and the percentage of deficient patients discharged on the recommended dose of vitamin D. Outcomes were measured for the 28 months before intervention (when our group assumed direct care for hip fracture patients) and were compared with the 12 months after intervention. We also report the prevalence of vitamin D deficiency in our population.
Laboratory Methodology
25‐OH vitamin D assays were performed by UNC Hospitals' core laboratories. Assays were performed using liquid chromatography tandem mass spectroscopy technique. Methodology remained constant through the study period.
During implementation of the project, we identified slow turnaround time in reporting of the vitamin D assays as an issue. We subsequently plotted the percentage of assays returned within 48 hours for each month of the study period on a run chart.
Analysis
Primary outcome measures and demographic data were tested for statistical significance with the 2 test. As a separate means of analysis, we plotted a control chart for the percentage of patients with vitamin D level checked and a run chart for the percentage of deficient or insufficient patients discharged on the recommended dose of vitamin D. To ensure a constant sample size, consecutive samples of patients were plotted in chronologic order. Results were interpreted with standard Shewhart rules.[13] 2 testing and plotting of control and run charts were performed using Microsoft Excel (Microsoft Corp., Redmond, WA) and QI Charts (Process Improvement Products, Austin, TX).
Implementation
In October 2012, we presented the review of evidence and preliminary data to the hospitalist group and made the new CPOE hip fracture order set available. Implementation was monitored by solicitation of qualitative feedback from group physicians and analysis of outcome data every 6 months. Issues that arose during implementation are described in a project timeline (Figure 1) and discussed in detail in manuscript discussion. We received institutional review board approval to study the project's implementation.

RESULTS
Patients
There were 220 patients identified in the 28 months before implementation. Twenty‐four were excluded by criteria, leaving 196 for analysis. One hundred thirteen patients were identified after implementation. Six patients were excluded by criteria, leaving 107 for analysis.
The mean patient age was 80 years, and the median age was 83 years. Seventy‐five percent were female. Race categories were 85% Caucasian, 8% African American, 3% Asian, 1% Native American, 1% Hispanic, and 3% other.
The preintervention group had mean and median ages of 80 and 82 years, respectively, compared with 81 and 84 years, respectively, in the postintervention group. Seventy‐five percent of the preintervention group was female, compared with 74% postintervention. The only statistically significant difference was in the percentage of Caucasian patients81% of preintervention group compared with 91% of the postintervention group (P = 0.028).
Primary Outcomes
The percentage of patients with acute hip fracture with vitamin D level checked before project implementation was 37.2% (n = 196). After implementation, the percentage improved to 93.5% (n = 107, P < 0.001).
The proportion chart plot of the same data (Figure 2) shows evidence of a fundamental change after intervention. Data points showing the proportion of consecutive samples of 15 patients were plotted chronologically. All points after implementation were above the upper control limit, meeting Shewhart control chart rules for special cause variation.[13]
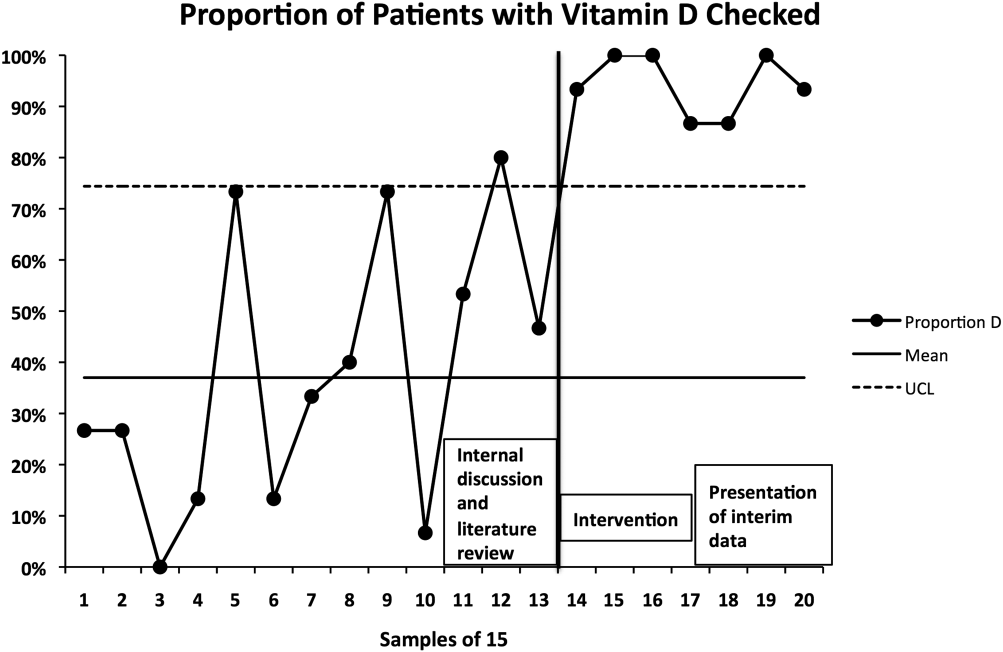
The percentage of vitamin D deficient/emnsufficient patients discharged on the recommended dose of vitamin D also improved, rising from 40.9% (n = 44) before to 68.0% (n = 50) after implementation (P = 0.008). Because there were fewer candidates for this outcome, we plotted samples of 10 patients consecutively on a run chart (Figure 3). Although there were insufficient data to establish a trend by run chart rules, the last 4 consecutive data points showed sequential improvement.
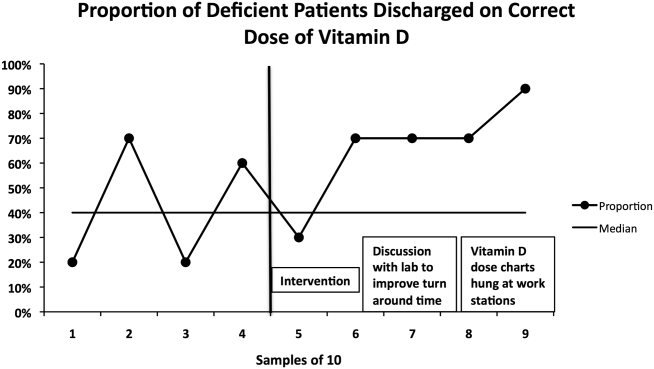
Prevalence of Vitamin D Insufficiency and Deficiency
Before implementation, 44 of the 73 patients (60.3%) with vitamin D levels checked were deficient or insufficient (25‐OH vitamin D <30 ng/mL); of those 44 patients, 21 (28.8% of total checked) had 25‐OH vitamin D levels <20 ng/mL. After implementation, 50 of 100 patients with levels checked were identified as deficient or insufficient (50%); of those 50 patients, 23 (23% of total) had 25‐OH vitamin D levels <20 ng/mL.
DISCUSSION
Our interventions correlated with significant improvements in the assessment and treatment of vitamin D deficiency in elderly patients with fragility hip fractures. Our study demonstrates a systematic method groups may use to adopt and reliably implement practice guidelines. Moreover, we report several steps to implementation that enhanced our ability to standardize clinical care.
The prevalence of vitamin D deficiency and insufficiency we identified50.0% after change implementationis within the range reported in prior studies, though our result is notable for being in a southern region of the United States. The prevalence we found before implementation (60.3%) may have been subject to selection bias in screening, so 50.0% is likely the more correct prevalence. Other US studies of vitamin D deficiency prevalence in hip fracture patients report rates from 50% to 65.8%.[2, 8, 10]
The percentage of hip fracture patients screened for vitamin D deficiency showed significant improvement after our interventions, rising to 93.5%. As a comparison with our results, a 2008 study after implementation of a hip fracture pathway reported only screening 37% of patients for vitamin D deficiency.[14] The main barrier we identified was occasional failure to use the electronic order set. This was in large part due to moonlighting physicians, who occasionally cover hospitalist shifts. They accounted for 5 of the 7 missed patients. The other 2 misses were due to group physicians not using the order set. These findings were first identified after 6 months of data were analyzed. These data were presented to the hospitalist group, with reminders to reinforce order set use with moonlighters and to manually order levels after admission if the order set was not utilized.
We found more difficulty with discharging deficient patients on the recommended dose of vitamin D. Our low level at the time of implementation40.9%was actually higher than a recent Swiss study, which found that only 27% of patients with acute hip fracture were discharged on any vitamin D, despite 91% of patients having 25‐OH vitamin D levels <30 ng/mL.[15] However, our proportion of deficient patients discharged on the recommended vitamin D dose only improved to 68.0% during our interventions. This is similar to Glowacki et al., who reported discharging 76% of hip fracture patients on vitamin D and/or calcium through utilization of a discharge pathway, though they did not differentiate vitamin D from calcium in results or attempt to identify patient‐specific vitamin D dosing based on serum levels.[14]
We did identify and address several barriers to discharging patients on the recommended dose. First, we experienced slow turnaround time in measurement of 25‐OH vitamin D. Early into the project, we received several reports of patients being discharged before vitamin D levels had returned. We communicated with the director of UNC Hospitals' core laboratories. A major issue was that the special chemistry section of the core laboratory did not report results directly into the hospital's main electronic reporting system, so that the results had to be hand entered. Over several months, the laboratory worked to improve turnaround times. A run chart plot of the percentage of assays reported within 48 hours for each month showed significant improvement with these efforts (see Supporting Information, Figure 1, in the online version of this article). All 9 data points after our initial discussion with the laboratory director were above the mean established during the prior 4 months, meeting run chart rules for a fundamental change in the system.[13]
The second issue identified was that the ranges for deficiency and insufficiency recommended by Endocrine Society guidelines did not match the reference ranges provided by UNC Hospitals. UNC Hospitals reported levels of 25‐OH vitamin D as normal if above 24, whereas the Endocrine Society defined normal as above 29. When analyzing data after 6 months, we found several patients who had been screened appropriately with results available and noted by the discharging physician, but with results in the normal range per our laboratory. Several of these patients, though low in vitamin D by Endocrine Society standards, were not treated. The laboratory director was again contacted, who noted that the UNC reference ranges had been formed before the Endocrine Society guidelines had been published. We elected to continue with the more conservative ranges recommended by the Endocrine Society. We presented results to the group after 6 months of data had been collected and emphasized our recommended reference ranges and vitamin D dosing (Table 1). We also created reference charts with this information and hung them by all computer workstations in the hospitalist office. With this continued assessment of data and provider education, we did note further improvement through the implementation period, with 90.0% of the last sample of deficient/emnsufficient patients discharged on the recommended dose of vitamin D (Figure 3).
We debated whether to include calcium supplementation as part of our intervention, but given known potential harms from calcium supplementation, including nephrolithiasis and possible increased cardiovascular risk,[16] we elected to focus exclusively on vitamin D. Although studies of primary and secondary fragility fracture prevention with vitamin D have not demonstrated consistently positive results, the studies were not specifically targeted to vitamin D‐deficient patients.[17, 18] Even in the absence of definitively proven secondary fracture prevention, given the multiple health issues associated with vitamin D deficiency, we believe that screening high prevalence populations and treating appropriately is best practice. With minimal patient costs (our institution charges $93 per assay) and a high prevalence (50% in our population), we believe universal screening of elderly patients with hip fracture for vitamin D deficiency is also cost‐effective.
Our project was specifically designed to address the issue of vitamin D deficiency in elderly hip fracture patients, but most of these patients also have osteoporosis. Although vitamin D deficiency contributes to osteoporosis, it is certainly not the only factor. It is also recognized that a minority of patients with fragility fractures receives subsequent evaluation and treatment for osteoporosis, <20% in a recent large population‐based study.[19] The American Orthopedic Association has recently launched a website and campaign entitled Own the Bone to improve the quality of care for patients after osteoporotic fracture.[20] A number of measures have been studied to improve the deficit in care, often termed the osteoporosis treatment gap. Edwards and colleagues recently described an intervention based on their institutional electronic medical record.[21] The intervention included order sets for diagnosing osteoporosis and educational materials for patients and providers, but did not demonstrate any change in percentage of patients evaluated for osteoporosis after fragility fracture. Successful randomized controlled trials have been reported using mail notification of physicians and patients after osteoporotic fracture[22]; multifaceted telephone, education and mail notification interventions after wrist fracture[23]; and through the use of a central osteoporosis coordinator to coordinate osteoporosis treatment after a fragility fracture.[24] These successful trials were broad in scope and yet reported modest (10%20%) gains in improvement.
Although bisphophonate therapy is of proven benefit in secondary fracture prevention, there are a number of barriers to initiating it in the acute setting after fragility fracture, as the difficulty in getting large improvement during the above trials suggests. These include recommendations from some experts for bone density testing before starting treatment and theoretic concerns of impairing fracture healing in the initial weeks after acute fracture. Both of these concerns make a hospitalist‐based intervention for osteoporosis evaluation and treatment challenging and beyond the scope of our project's quality improvement efforts.
Our study has some limitations. It was conducted in a single institution and electronic order entry system, which could limit the ability to generalize the results. We did not assess vitamin D compliance or follow‐up after hospitalization, so we are unable to determine if patients successfully completed treatment after it was prescribed. We also found slight differences in race between the pre‐ and postintervention groups. Although we did not perform multivariable regression to account for these differences, we feel such analyses would be unlikely to alter our results. Last, it should be noted that there may be unintended consequences from preselected orders, such as the ones we utilized for vitamin D assays and empiric supplementation. For example, patients with a recently checked vitamin D assay would have duplication of that lab. Similarly, patients who were already taking vitamin D could theoretically be placed on double therapy at admission. With safeguards in the electronic system to flag duplicate medications, low toxicity of standard doses of vitamin D, and minimal economic harm with duplicate laboratory therapy in the context of a hospitalization for hip fracture, we believe the risks are outweighed by the benefits of screening.
In summary, with review of evidence, modification of a computerized physician order set, provider education and feedback, and collaboration with our clinical laboratory, we were able to standardize and improve group practice for the assessment and treatment of vitamin D deficiency in elderly patients with hip fracture. We believe that our model could be applied to other institutions to further improve patient care. Given the extremely high incidence of hip fracture and consistently high prevalence of vitamin D deficiency in this population across studies, these findings have important implications for the care of this commonly encountered and vulnerable group of patients.
Disclosures: Data from this project were presented in abstract form at the Society of Hospital Medicine Annual Meetings in 2013 and 2014 and as an abstract at the Society of General Internal Medicine Annual Meeting in 2014. Dr. Catherine Hammett‐Stabler, Director of UNC Hospitals McLendon Core Laboratories, provided data on vitamin D assay turnaround times. The authors report no conflicts of interest.
- , , , . Incidence and mortality of hip fractures in the United States. JAMA. 2009;302(14):1573–1579.
- , , , , , . Occult vitamin D deficiency in postmenopausal US women with acute hip fracture. JAMA. 1999;281(16):1505–1511.
- , , , , , . Prevalence of vitamin D inadequacy in Scottish adults with non‐vertebral fragility fractures. Curr Med Res Opin. 2005;21(9):1355–1361.
- , , . Prevalence of vitamin D inadequacy in osteoporotic hip fracture patients in London. Curr Med Res Opin. 2005;21(12):1891–1894.
- , , , et al. Half of the patients with an acute hip fracture suffer from hypovitaminosis D: a prospective study in southeastern Finland. Osteoporos Int. 2005;16(12):2018–2024.
- , , , et al. Prevalence of vitamin D inadequacy in Belfast following fragility fracture. Curr Med Res Opin. 2006;22(1):101–105.
- , , , , , . High prevalence of hypovitaminosis D and K in patients with hip fracture. Asia Pac J Clin Nutr. 2011;20(1):56–61.
- , , , . Vitamin D insufficiency in patients with acute hip fractures of all ages and both sexes in a sunny climate. J Orthop Trauma. 2013;27(12):e275–e280.
- , , , et al. Vitamin D and intact PTH status in patients with hip fracture. Osteoporos Int. 2006;17(11):1608–1614.
- , , , et al. Distribution and correlates of serum 25‐hydroxyvitamin D levels in a sample of patients with hip fracture. Am J Geriatr Pharmacother. 2007;5(4):335–340.
- , , , et al. Evaluation, treatment, and prevention of vitamin D deficiency: an Endocrine Society clinical practice guideline. J Clin Endocrinol Metab. 2011;96(7):1911–1930.
- , . Prevention of falls in community‐dwelling older adults: U.S. Preventive Services Task Force recommendation statement. Ann Intern Med. 2012;157(3):197–204.
- , . The Health Care Data Guide: Learning From Data for Improvement. 1st ed. San Francisco, CA: Jossey‐Bass; 2011.
- , , , , . Importance of vitamin D in hospital‐based fracture care pathways. J Nutr Health Aging. 2008;12(5):291–293.
- , , , et al. Before and after hip fracture, vitamin D deficiency may not be treated sufficiently. Osteoporos Int. 2013;24(11):2765–2773.
- , , , et al. Effect of calcium supplements on risk of myocardial infarction and cardiovascular events: meta‐analysis. BMJ. 2010;341:c3691.
- , , , et al. A pooled analysis of vitamin D dose requirements for fracture prevention. N Engl J Med. 2012;367(1):40–49.
- , , , et al. Oral vitamin D3 and calcium for secondary prevention of low‐trauma fractures in elderly people (Randomised Evaluation of Calcium Or vitamin D, RECORD): a randomised placebo‐controlled trial. Lancet. 2005;365(9471):1621–1628.
- , , , et al. A population‐based analysis of the post‐fracture care gap 1996–2008: the situation is not improving. Osteoporos Int. 2012;23(5):1623–1629.
- American Orthopedic Association. Own the Bone website. 2011. Available at: http://www.ownthebone.org. Accessed August 1, 2014.
- , , , et al. Development of an electronic medical record based intervention to improve medical care of osteoporosis. Osteoporos Int. 2012;23(10):2489–2498.
- , , , , . Closing the gap in postfracture care at the population level: a randomized controlled trial. CMAJ. 2012;184(3):290–296.
- , , , et al. Multifaceted intervention to improve diagnosis and treatment of osteoporosis in patients with recent wrist fracture: a randomized controlled trial. CMAJ. 2008;178(5):569–575.
- , , , et al. Impact of a centralized osteoporosis coordinator on post‐fracture osteoporosis management: a cluster randomized trial. Osteoporos Int. 2012;23(1):87–95.
Hip fracture is a common clinical problem, with an incidence of 957 cases/100,000 adults in the United States.[1] Studies have found a high prevalence of vitamin D deficiency among elderly patients with fragility fractures, though many of these studies were performed in high latitude regions.[2, 3, 4, 5, 6, 7, 8, 9, 10] Endocrine Society clinical practice guidelines recommend screening patients with fragility fractures for vitamin D deficiency.[11]
Our hospitalist group practices in an academic tertiary care facility in the southeastern United States. Beginning in June 2010, all patients with acute hip fracture were admitted to our service with consultative comanagement from orthopedics. Our group did not have a standardized approach for the assessment or treatment of vitamin D deficiency in this population. Preliminary analysis of a subgroup of our patients with acute hip fracture revealed that only 29% had been screened for vitamin D deficiency. Of these patients, 68% were deficient or insufficient, yet less than half had been discharged on an appropriate dose of vitamin D. We concluded that our group practice was both varied and substandard.
In this report we describe the creation and implementation of a process for improving the assessment and treatment of vitamin D deficiency in elderly patients with fragility hip fracture. We evaluated the effect of our process on the percentages of patients screened and treated appropriately for vitamin D deficiency.
METHODS
Creation of Intervention
We assembled a task force, consisting of 4 hospitalist physicians. The task force reviewed available literature on the prevalence of vitamin D deficiency in elderly patients with fragility fracture and major practice guidelines related to vitamin D. We utilized Endocrine Society clinical practice guidelines to define vitamin D deficiency, insufficiency, and recommended treatment dosing for each condition[11] (Table 1).
| Vitamin D Level (25‐OH) | Vitamin D Status | Treatment Dose Recommendation |
|---|---|---|
| 019 ng/mL | Deficient | 50,000 IU/week for 68 weeks |
| 2029 ng/mL | Insufficient | 1,000 to 2,000 IU/day or 50,000 IU/month |
We developed 2 processes for improving group practice. First, we presented a review of evidence and preliminary data from our group practice at a meeting of hospitalist staff. Second, we revised the computerized physician order entry (CPOE) set for patients with hip fractures to include 2 new orders: (1) an automatic order for 25‐OH vitamin D level to be drawn the morning after admission and (2) an order for initiation of 1000 IU daily of vitamin D at admission.
The reasons for starting empiric vitamin D supplementation were 2fold. First was to prompt dosing of vitamin D at the time of discharge by already having it on the patient's medication list. Second was to conform to US Preventive Services Task Force guidelines for fall prevention.[12] The dose of 1000 IU was selected due to its being adequate treatment for insufficient (though not deficient) patients, and yet a low enough dose to minimize risk of toxicity.
Providers
Our hospitalist group includes 21 physicians and 3 physician extenders. Two nocturnist positions were added to our group in July 2013, part way through our intervention. There were no other additions or subtractions to the staff during the study period.
Patients
Patients were identified by search of University of North Carolina (UNC) Hospitals' database using International Classification of Diseases, 9th Revision codes for femoral neck fracture (821.x) and femur fracture NOS (820.x), linked to hospital services covered by our group. Exclusion criteria included age 50 years, fracture due to high‐speed trauma, fracture due to malignancy, end‐stage renal disease, and death or transition to comfort care during the index hospitalization.
Outcome Measures
Primary outcome measures were the percentage of patients with acute hip fracture with vitamin D level checked during hospitalization and the percentage of deficient patients discharged on the recommended dose of vitamin D. Outcomes were measured for the 28 months before intervention (when our group assumed direct care for hip fracture patients) and were compared with the 12 months after intervention. We also report the prevalence of vitamin D deficiency in our population.
Laboratory Methodology
25‐OH vitamin D assays were performed by UNC Hospitals' core laboratories. Assays were performed using liquid chromatography tandem mass spectroscopy technique. Methodology remained constant through the study period.
During implementation of the project, we identified slow turnaround time in reporting of the vitamin D assays as an issue. We subsequently plotted the percentage of assays returned within 48 hours for each month of the study period on a run chart.
Analysis
Primary outcome measures and demographic data were tested for statistical significance with the 2 test. As a separate means of analysis, we plotted a control chart for the percentage of patients with vitamin D level checked and a run chart for the percentage of deficient or insufficient patients discharged on the recommended dose of vitamin D. To ensure a constant sample size, consecutive samples of patients were plotted in chronologic order. Results were interpreted with standard Shewhart rules.[13] 2 testing and plotting of control and run charts were performed using Microsoft Excel (Microsoft Corp., Redmond, WA) and QI Charts (Process Improvement Products, Austin, TX).
Implementation
In October 2012, we presented the review of evidence and preliminary data to the hospitalist group and made the new CPOE hip fracture order set available. Implementation was monitored by solicitation of qualitative feedback from group physicians and analysis of outcome data every 6 months. Issues that arose during implementation are described in a project timeline (Figure 1) and discussed in detail in manuscript discussion. We received institutional review board approval to study the project's implementation.
RESULTS
Patients
There were 220 patients identified in the 28 months before implementation. Twenty‐four were excluded by criteria, leaving 196 for analysis. One hundred thirteen patients were identified after implementation. Six patients were excluded by criteria, leaving 107 for analysis.
The mean patient age was 80 years, and the median age was 83 years. Seventy‐five percent were female. Race categories were 85% Caucasian, 8% African American, 3% Asian, 1% Native American, 1% Hispanic, and 3% other.
The preintervention group had mean and median ages of 80 and 82 years, respectively, compared with 81 and 84 years, respectively, in the postintervention group. Seventy‐five percent of the preintervention group was female, compared with 74% postintervention. The only statistically significant difference was in the percentage of Caucasian patients81% of preintervention group compared with 91% of the postintervention group (P = 0.028).
Primary Outcomes
The percentage of patients with acute hip fracture with vitamin D level checked before project implementation was 37.2% (n = 196). After implementation, the percentage improved to 93.5% (n = 107, P < 0.001).
The proportion chart plot of the same data (Figure 2) shows evidence of a fundamental change after intervention. Data points showing the proportion of consecutive samples of 15 patients were plotted chronologically. All points after implementation were above the upper control limit, meeting Shewhart control chart rules for special cause variation.[13]
The percentage of vitamin D deficient/emnsufficient patients discharged on the recommended dose of vitamin D also improved, rising from 40.9% (n = 44) before to 68.0% (n = 50) after implementation (P = 0.008). Because there were fewer candidates for this outcome, we plotted samples of 10 patients consecutively on a run chart (Figure 3). Although there were insufficient data to establish a trend by run chart rules, the last 4 consecutive data points showed sequential improvement.
Prevalence of Vitamin D Insufficiency and Deficiency
Before implementation, 44 of the 73 patients (60.3%) with vitamin D levels checked were deficient or insufficient (25‐OH vitamin D <30 ng/mL); of those 44 patients, 21 (28.8% of total checked) had 25‐OH vitamin D levels <20 ng/mL. After implementation, 50 of 100 patients with levels checked were identified as deficient or insufficient (50%); of those 50 patients, 23 (23% of total) had 25‐OH vitamin D levels <20 ng/mL.
DISCUSSION
Our interventions correlated with significant improvements in the assessment and treatment of vitamin D deficiency in elderly patients with fragility hip fractures. Our study demonstrates a systematic method groups may use to adopt and reliably implement practice guidelines. Moreover, we report several steps to implementation that enhanced our ability to standardize clinical care.
The prevalence of vitamin D deficiency and insufficiency we identified50.0% after change implementationis within the range reported in prior studies, though our result is notable for being in a southern region of the United States. The prevalence we found before implementation (60.3%) may have been subject to selection bias in screening, so 50.0% is likely the more correct prevalence. Other US studies of vitamin D deficiency prevalence in hip fracture patients report rates from 50% to 65.8%.[2, 8, 10]
The percentage of hip fracture patients screened for vitamin D deficiency showed significant improvement after our interventions, rising to 93.5%. As a comparison with our results, a 2008 study after implementation of a hip fracture pathway reported only screening 37% of patients for vitamin D deficiency.[14] The main barrier we identified was occasional failure to use the electronic order set. This was in large part due to moonlighting physicians, who occasionally cover hospitalist shifts. They accounted for 5 of the 7 missed patients. The other 2 misses were due to group physicians not using the order set. These findings were first identified after 6 months of data were analyzed. These data were presented to the hospitalist group, with reminders to reinforce order set use with moonlighters and to manually order levels after admission if the order set was not utilized.
We found more difficulty with discharging deficient patients on the recommended dose of vitamin D. Our low level at the time of implementation40.9%was actually higher than a recent Swiss study, which found that only 27% of patients with acute hip fracture were discharged on any vitamin D, despite 91% of patients having 25‐OH vitamin D levels <30 ng/mL.[15] However, our proportion of deficient patients discharged on the recommended vitamin D dose only improved to 68.0% during our interventions. This is similar to Glowacki et al., who reported discharging 76% of hip fracture patients on vitamin D and/or calcium through utilization of a discharge pathway, though they did not differentiate vitamin D from calcium in results or attempt to identify patient‐specific vitamin D dosing based on serum levels.[14]
We did identify and address several barriers to discharging patients on the recommended dose. First, we experienced slow turnaround time in measurement of 25‐OH vitamin D. Early into the project, we received several reports of patients being discharged before vitamin D levels had returned. We communicated with the director of UNC Hospitals' core laboratories. A major issue was that the special chemistry section of the core laboratory did not report results directly into the hospital's main electronic reporting system, so that the results had to be hand entered. Over several months, the laboratory worked to improve turnaround times. A run chart plot of the percentage of assays reported within 48 hours for each month showed significant improvement with these efforts (see Supporting Information, Figure 1, in the online version of this article). All 9 data points after our initial discussion with the laboratory director were above the mean established during the prior 4 months, meeting run chart rules for a fundamental change in the system.[13]
The second issue identified was that the ranges for deficiency and insufficiency recommended by Endocrine Society guidelines did not match the reference ranges provided by UNC Hospitals. UNC Hospitals reported levels of 25‐OH vitamin D as normal if above 24, whereas the Endocrine Society defined normal as above 29. When analyzing data after 6 months, we found several patients who had been screened appropriately with results available and noted by the discharging physician, but with results in the normal range per our laboratory. Several of these patients, though low in vitamin D by Endocrine Society standards, were not treated. The laboratory director was again contacted, who noted that the UNC reference ranges had been formed before the Endocrine Society guidelines had been published. We elected to continue with the more conservative ranges recommended by the Endocrine Society. We presented results to the group after 6 months of data had been collected and emphasized our recommended reference ranges and vitamin D dosing (Table 1). We also created reference charts with this information and hung them by all computer workstations in the hospitalist office. With this continued assessment of data and provider education, we did note further improvement through the implementation period, with 90.0% of the last sample of deficient/emnsufficient patients discharged on the recommended dose of vitamin D (Figure 3).
We debated whether to include calcium supplementation as part of our intervention, but given known potential harms from calcium supplementation, including nephrolithiasis and possible increased cardiovascular risk,[16] we elected to focus exclusively on vitamin D. Although studies of primary and secondary fragility fracture prevention with vitamin D have not demonstrated consistently positive results, the studies were not specifically targeted to vitamin D‐deficient patients.[17, 18] Even in the absence of definitively proven secondary fracture prevention, given the multiple health issues associated with vitamin D deficiency, we believe that screening high prevalence populations and treating appropriately is best practice. With minimal patient costs (our institution charges $93 per assay) and a high prevalence (50% in our population), we believe universal screening of elderly patients with hip fracture for vitamin D deficiency is also cost‐effective.
Our project was specifically designed to address the issue of vitamin D deficiency in elderly hip fracture patients, but most of these patients also have osteoporosis. Although vitamin D deficiency contributes to osteoporosis, it is certainly not the only factor. It is also recognized that a minority of patients with fragility fractures receives subsequent evaluation and treatment for osteoporosis, <20% in a recent large population‐based study.[19] The American Orthopedic Association has recently launched a website and campaign entitled Own the Bone to improve the quality of care for patients after osteoporotic fracture.[20] A number of measures have been studied to improve the deficit in care, often termed the osteoporosis treatment gap. Edwards and colleagues recently described an intervention based on their institutional electronic medical record.[21] The intervention included order sets for diagnosing osteoporosis and educational materials for patients and providers, but did not demonstrate any change in percentage of patients evaluated for osteoporosis after fragility fracture. Successful randomized controlled trials have been reported using mail notification of physicians and patients after osteoporotic fracture[22]; multifaceted telephone, education and mail notification interventions after wrist fracture[23]; and through the use of a central osteoporosis coordinator to coordinate osteoporosis treatment after a fragility fracture.[24] These successful trials were broad in scope and yet reported modest (10%20%) gains in improvement.
Although bisphophonate therapy is of proven benefit in secondary fracture prevention, there are a number of barriers to initiating it in the acute setting after fragility fracture, as the difficulty in getting large improvement during the above trials suggests. These include recommendations from some experts for bone density testing before starting treatment and theoretic concerns of impairing fracture healing in the initial weeks after acute fracture. Both of these concerns make a hospitalist‐based intervention for osteoporosis evaluation and treatment challenging and beyond the scope of our project's quality improvement efforts.
Our study has some limitations. It was conducted in a single institution and electronic order entry system, which could limit the ability to generalize the results. We did not assess vitamin D compliance or follow‐up after hospitalization, so we are unable to determine if patients successfully completed treatment after it was prescribed. We also found slight differences in race between the pre‐ and postintervention groups. Although we did not perform multivariable regression to account for these differences, we feel such analyses would be unlikely to alter our results. Last, it should be noted that there may be unintended consequences from preselected orders, such as the ones we utilized for vitamin D assays and empiric supplementation. For example, patients with a recently checked vitamin D assay would have duplication of that lab. Similarly, patients who were already taking vitamin D could theoretically be placed on double therapy at admission. With safeguards in the electronic system to flag duplicate medications, low toxicity of standard doses of vitamin D, and minimal economic harm with duplicate laboratory therapy in the context of a hospitalization for hip fracture, we believe the risks are outweighed by the benefits of screening.
In summary, with review of evidence, modification of a computerized physician order set, provider education and feedback, and collaboration with our clinical laboratory, we were able to standardize and improve group practice for the assessment and treatment of vitamin D deficiency in elderly patients with hip fracture. We believe that our model could be applied to other institutions to further improve patient care. Given the extremely high incidence of hip fracture and consistently high prevalence of vitamin D deficiency in this population across studies, these findings have important implications for the care of this commonly encountered and vulnerable group of patients.
Disclosures: Data from this project were presented in abstract form at the Society of Hospital Medicine Annual Meetings in 2013 and 2014 and as an abstract at the Society of General Internal Medicine Annual Meeting in 2014. Dr. Catherine Hammett‐Stabler, Director of UNC Hospitals McLendon Core Laboratories, provided data on vitamin D assay turnaround times. The authors report no conflicts of interest.
- , , , . Incidence and mortality of hip fractures in the United States. JAMA. 2009;302(14):1573–1579.
- , , , , , . Occult vitamin D deficiency in postmenopausal US women with acute hip fracture. JAMA. 1999;281(16):1505–1511.
- , , , , , . Prevalence of vitamin D inadequacy in Scottish adults with non‐vertebral fragility fractures. Curr Med Res Opin. 2005;21(9):1355–1361.
- , , . Prevalence of vitamin D inadequacy in osteoporotic hip fracture patients in London. Curr Med Res Opin. 2005;21(12):1891–1894.
- , , , et al. Half of the patients with an acute hip fracture suffer from hypovitaminosis D: a prospective study in southeastern Finland. Osteoporos Int. 2005;16(12):2018–2024.
- , , , et al. Prevalence of vitamin D inadequacy in Belfast following fragility fracture. Curr Med Res Opin. 2006;22(1):101–105.
- , , , , , . High prevalence of hypovitaminosis D and K in patients with hip fracture. Asia Pac J Clin Nutr. 2011;20(1):56–61.
- , , , . Vitamin D insufficiency in patients with acute hip fractures of all ages and both sexes in a sunny climate. J Orthop Trauma. 2013;27(12):e275–e280.
- , , , et al. Vitamin D and intact PTH status in patients with hip fracture. Osteoporos Int. 2006;17(11):1608–1614.
- , , , et al. Distribution and correlates of serum 25‐hydroxyvitamin D levels in a sample of patients with hip fracture. Am J Geriatr Pharmacother. 2007;5(4):335–340.
- , , , et al. Evaluation, treatment, and prevention of vitamin D deficiency: an Endocrine Society clinical practice guideline. J Clin Endocrinol Metab. 2011;96(7):1911–1930.
- , . Prevention of falls in community‐dwelling older adults: U.S. Preventive Services Task Force recommendation statement. Ann Intern Med. 2012;157(3):197–204.
- , . The Health Care Data Guide: Learning From Data for Improvement. 1st ed. San Francisco, CA: Jossey‐Bass; 2011.
- , , , , . Importance of vitamin D in hospital‐based fracture care pathways. J Nutr Health Aging. 2008;12(5):291–293.
- , , , et al. Before and after hip fracture, vitamin D deficiency may not be treated sufficiently. Osteoporos Int. 2013;24(11):2765–2773.
- , , , et al. Effect of calcium supplements on risk of myocardial infarction and cardiovascular events: meta‐analysis. BMJ. 2010;341:c3691.
- , , , et al. A pooled analysis of vitamin D dose requirements for fracture prevention. N Engl J Med. 2012;367(1):40–49.
- , , , et al. Oral vitamin D3 and calcium for secondary prevention of low‐trauma fractures in elderly people (Randomised Evaluation of Calcium Or vitamin D, RECORD): a randomised placebo‐controlled trial. Lancet. 2005;365(9471):1621–1628.
- , , , et al. A population‐based analysis of the post‐fracture care gap 1996–2008: the situation is not improving. Osteoporos Int. 2012;23(5):1623–1629.
- American Orthopedic Association. Own the Bone website. 2011. Available at: http://www.ownthebone.org. Accessed August 1, 2014.
- , , , et al. Development of an electronic medical record based intervention to improve medical care of osteoporosis. Osteoporos Int. 2012;23(10):2489–2498.
- , , , , . Closing the gap in postfracture care at the population level: a randomized controlled trial. CMAJ. 2012;184(3):290–296.
- , , , et al. Multifaceted intervention to improve diagnosis and treatment of osteoporosis in patients with recent wrist fracture: a randomized controlled trial. CMAJ. 2008;178(5):569–575.
- , , , et al. Impact of a centralized osteoporosis coordinator on post‐fracture osteoporosis management: a cluster randomized trial. Osteoporos Int. 2012;23(1):87–95.
© 2014 Society of Hospital Medicine