User login
Impact of Medicaid expansion on inpatient outcomes
The Affordable Care Act (ACA) has greatly increased the number of Medicaid enrollees since it expanded eligibility criteria on Jan. 1, 2014. Nearly 9 million additional U.S. adults now have Medicaid coverage, mostly in the 31 states and Washington, which have opted into Medicaid expansion.
The ACA has also had an important impact on hospital payer mix, mainly by decreasing the amount of uncompensated care in Medicaid-expansion states. Previous studies have shown disparities in the quality of inpatient care based on insurance type. Patients with Medicaid insurance often have longer hospitalizations and higher in-hospital mortality than commercially-insured patients and occasionally even than uninsured patients.
In our study published in the Journal of Hospital Medicine (2016 Dec. doi: 10.1002/jhm.2649), we evaluated the impact of state Medicaid expansion status on payer mix, length of stay, and in-hospital mortality for general medicine patients discharged from U.S. academic medical centers. We considered Jan. 1, 2014, to be the date of ACA implementation for all states except Michigan, New Hampshire, Pennsylvania, and Indiana, which had unique dates of Medicaid expansion.
We were able to identify 3,144,488 discharges from 156 hospitals in 24 Medicaid-expansion states and Washington, and 1,114,464 discharges from 55 hospitals in 14 nonexpansion states between October 2012 and September 2015.
Despite this difference in payer mix trends, state Medicaid expansion status was not associated with differences in overall length of stay or in-hospital mortality in our study. More precisely, we looked at the length of stay and mortality indices, or ratio of observed to expected values, to control for such potential confounders as disease severity and comorbid conditions.
One possible explanation for our findings is that the higher proportion of Medicare and commercially-insured patients overshadowed the contribution of Medicaid patients to the overall length of stay and mortality indices.
To our knowledge, our study is the first to look at the effect of ACA implementation on inpatient outcomes. Early evidence suggests that Medicaid expansion has improved outpatient outcomes. Low-income adults in Medicaid-expansion states have shown greater gains in access to primary care clinics and medications and in the diagnosis of certain chronic health conditions than those in non-expansion states. However, these changes would not necessarily lead to improvements in the length of stay or mortality indices for Medicaid-expansion hospitals, since the measures account for patient acuity on admission.
The take-home message from our study for health policy makers is that state Medicaid expansion status had a neutral effect on both length of stay and mortality indices. This should be reassuring for states considering expansion of their Medicaid programs in the future.
As a next step, it would be useful to see research on the impact of ACA implementation on other inpatient outcomes that may vary with insurance type, such as readmissions or hospital-acquired complications.
The take-home message for hospitalists is that there is more work to be done in reducing disparities in inpatient care based on payer status. Though not a primary focus of our study, we did see variation in the length of stay and mortality indices based on insurance type.
It is unclear whether these differences occurred because of variation in the expertise of inpatient providers, access to invasive procedures or medical therapies, the timeliness of discharge to post-acute care facilities, or other patient- or system-level factors. However, these disparities warrant our improvement efforts moving forward.
Mary Anderson, MD, and Christine Jones, MD, are hospitalists at the University of Colorado (Aurora) Hospital and assistant professors in the department of medicine at the University of Colorado.
State Medicaid Expansion Status
On January 1, 2014, several major provisions of the Affordable Care Act (ACA) took effect, including introduction of the individual mandate for health insurance coverage, opening of the Health Insurance Marketplace, and expansion of Medicaid eligibility to Americans earning up to 133% of the federal poverty level.[1] Nearly 9 million US adults have enrolled in Medicaid since that time, primarily in the 31 states and Washington, DC that have opted into Medicaid expansion.[2, 3] ACA implementation has also had a significant impact on hospital payer mix, primarily by reducing the volume of uncompensated care in Medicaid‐expansion states.[4, 5]
The differential shift in payer mix in Medicaid‐expansion versus nonexpansion states may be relevant to hospitals beyond reimbursement. Medicaid insurance has historically been associated with longer hospitalizations and higher in‐hospital mortality in diverse patient populations, more so than commercial insurance and often even uninsured payer status.[6, 7, 8, 9, 10, 11, 12, 13, 14, 15] The disparity in outcomes between patients with Medicaid versus other insurance persists even after adjustment for disease severity and baseline comorbidities. Insurance type may influence the delivery of inpatient care through variation in access to invasive procedures and adherence to guideline‐concordant medical therapies.[9, 10, 11, 12] Medicaid patients may be more likely than uninsured patients to remain hospitalized pending postacute care placement rather than be discharged home with family support.[16] Medicaid patients are also less likely to leave against medical advice than uninsured patients.[17]
Currently, little is known about the impact of state Medicaid expansion status on length of stay (LOS) or mortality nationally. It is possible that hospitals in Medicaid‐expansion states have experienced relative worsening in LOS and mortality as their share of Medicaid patients has grown. Determining the impact of ACA implementation on payer mix and patient outcomes is particularly important for academic medical centers (AMCs), as they traditionally care for the greatest percentage of both Medicaid and uninsured patients.[18] We sought to characterize the impact of state Medicaid expansion status on payer mix, LOS, and in‐hospital mortality for general medicine patients at AMCs in the United States.
METHODS
The University HealthSystem Consortium (UHC) is an alliance of 117 AMCs and 310 affiliated hospitals, representing >90% of such institutions in the US. We queried the online UHC Clinical Data Base/Resource Manager (CDB/RM) to obtain hospital‐level insurance, LOS, and mortality data for inpatients discharged from a general medicine service between October 1, 2012 and September 30, 2015. We excluded hospitals that were missing data for any month within the study period. No patient‐level data were accessed.
Our outcomes of interest were the proportion of discharges by primary payer (Medicare, commercial, Medicaid, uninsured, or other [eg, Tri‐Care or Workers' Compensation]), as well as the LOS index and mortality index. Both indices were defined as the ratio of the observed to expected values. To determine the expected LOS and mortality, the UHC 2015 risk adjustment models were applied to all cases, adjusting for variables such as patient demographics, low socioeconomic status, admit source and status, severity of illness, and comorbid conditions, as described by International Classification of Diseases, Ninth Revision codes. These models have been validated and are used for research and quality benchmarking for member institutions.[19]
We next stratified hospitals according to state Medicaid expansion status. We defined Medicaid‐expansion states as those that had expanded Medicaid by the end of the study period: Arizona, Arkansas, California, Colorado, Connecticut, Illinois, Indiana, Iowa, Kentucky, Maryland, Massachusetts, Michigan, Minnesota, Nevada, New Hampshire, New Jersey, New Mexico, New York, Ohio, Oregon, Pennsylvania, Rhode Island, Washington, Washington DC, and West Virginia. Nonexpansion states included Alabama, Florida, Georgia, Kansas, Louisiana, Missouri, Nebraska, North Carolina, South Carolina, Tennessee, Texas, Utah, Virginia, and Wisconsin. We excluded 12 states due to incomplete data: Alaska, Delaware, Hawaii, Idaho, North Dakota, Maine, Mississippi, Montana, Oklahoma, South Dakota, Vermont, and Wyoming.
We then identified our pre‐ and post‐ACA implementation periods. Medicaid coverage expansion took effect in all expansion states on January 1, 2014, with the exception of Michigan (April 1, 2014), New Hampshire (August 15, 2014), Pennsylvania (January 1, 2015), and Indiana (February 1, 2015).[3] We therefore defined October 1, 2012 to December 31, 2013 as the pre‐ACA implementation period and January 1, 2014 to September 30, 2015 as the post‐ACA implementation period for all states except for Michigan, New Hampshire, Pennsylvania, and Indiana. For these 4 states, we customized the pre‐ and post‐ACA implementation periods to their respective dates of Medicaid expansion; for New Hampshire, we designated October 1, 2012 to July 31, 2014 as the pre‐ACA implementation period and September 1, 2014 to September 30, 2015 as the post‐ACA implementation period, as we were unable to distinguish before versus after data in August 2014 based on the midmonth expansion of Medicaid.
After stratifying hospitals into groups based on whether they were located in Medicaid‐expansion or nonexpansion states, the proportion of discharges by payer was compared between pre‐ and post‐ACA implementation periods both graphically by quarter and using linear regression models weighted for the number of cases from each hospital. Next, for both Medicaid‐expansion and nonexpansion hospitals, LOS index and mortality index were compared before and after ACA implementation using linear regression models weighted for the number of cases from each hospital, both overall and by payer. Difference‐in‐differences estimations were then completed to compare the proportion of discharges by payer, LOS index, and mortality index between Medicaid‐expansion and nonexpansion hospitals before and after ACA implementation. Post hoc linear regression analyses were completed to evaluate the effect of clustering by state level strata on payer mix and LOS and mortality indices. A 2‐sided P value of <0.05 was considered statistically significant. Data analyses were performed using Stata 12.0 (StataCorp, College Station, TX).
RESULTS
We identified 4,258,952 discharges among general medicine patients from 211 hospitals in 38 states and Washington, DC between October 1, 2012, and September 30, 2015. This included 3,144,488 discharges from 156 hospitals in 24 Medicaid‐expansion states and Washington, DC and 1,114,464 discharges from 55 hospitals in 14 nonexpansion states.
Figure 1 shows the trends in payer mix over time for hospitals in both Medicaid‐expansion and nonexpansion states. As summarized in Table 1, hospitals in Medicaid‐expansion states experienced a significant 3.7‐percentage point increase in Medicaid discharges (P = 0.013) and 2.9‐percentage point decrease in uninsured discharges (P < 0.001) after ACA implementation. This represented an approximately 19% jump and 60% drop in Medicaid and uninsured discharges, respectively. Hospitals in nonexpansion states saw no significant change in the proportion of discharges by payer after ACA implementation. In the difference‐in‐differences analysis, there was a trend toward a greater change in the proportion of Medicaid discharges pre‐ to post‐ACA implementation among hospitals in Medicaid‐expansion states compared to hospitals in nonexpansion states (mean difference‐in‐differences 4.1%, 95% confidence interval [CI]: 0.3%, 8.6%, P = 0.070).
| Medicaid‐expansion n=156 hospitals; 3,144,488 cases | Non‐expansion n=55 hospitals; 1,114,464 cases | |||||||||
|---|---|---|---|---|---|---|---|---|---|---|
| Pre‐ACA Implementation (1,453,090 Cases) | Post‐ACA Implementation (1,691,398 Cases) | Mean Difference | P Value | Pre‐ACA Implementation (455,440 Cases) | Post‐ACA Implementation (659,024 Cases) | Mean Difference | P Value | Mean Difference‐in‐Differences | P Value | |
| ||||||||||
| Payer mix, % (95% CI) | ||||||||||
| Medicare | 48.6 (46.2, 51.0)* | 48.3 (45.9, 50.7) | 0.3 (3.6, 3.1) | 0.865 | 44.3 (40.7, 47.7)* | 45.3 (41.9, 48.6) | 1.0 (3.8, 5.8) | 0.671 | 1.3 (7.1, 4.5) | 0.655 |
| Commercial | 23.1 (21.4, 24.7) | 23.2 (21.8, 24.6) | 0.2 (2.0, 2.3) | 0.882 | 21.5 (18.5, 24.6) | 22.7 (19.7, 25.8) | 1.2 (3.0, 5.4) | 0.574 | 1.0 (5.7, 3.6) | 0.662 |
| Medicaid | 19.6 (17.6, 21.6) | 23.3 (21.2, 25.5) | 3.7 (0.8, 6.6) | 0.013 | 19.4 (16.9, 21.9) | 19.0 (16.5, 21.4) | 0.4 (3.8, 3.0) | 0.812 | 4.1 (0.3, 8.6) | 0.070 |
| Uninsured | 5.0 (4.0, 5.9) | 2.0 (1.7, 2.3) | 2.9 (3.9, 2.0) | <0.001 | 10.9 (8.1, 13.7) | 9.4 (7.0, 11.7) | 1.5 (5.1, 2.1) | 0.407 | 1.4 (5.1, 2.2) | 0.442 |
| Other | 3.8 (2.6, 4.9) | 3.1 (2.0, 4.3) | 0.7 (2.3, 1.0) | 0.435 | 4.0 (2.9, 5.0) | 3.7 (2.6, 4.7) | 0.3 (1.7, 1.1) | 0.662 | 0.3 (2.5, 1.8) | 0.762 |
| LOS index, mean (95% CI) | ||||||||||
| Overall | 1.017 (0.996, 1.038) | 1.006 (0.981, 1.031) | 0.011 (0.044, 0.021) | 0.488 | 1.008 (0.974, 1.042) | 0.995 (0.961, 1.029) | 0.013 (0.061, 0.034) | 0.574 | 0.002 (0.055, 0.059) | 0.943 |
| Medicare | 1.012 (0.989, 1.035) | 0.999 (0.971, 1.027) | 0.013 (0.049, 0.023) | 0.488 | 0.982 (0.946, 1.017) | 0.979 (0.944, 1.013) | 0.003 (0.052, 0.046) | 0.899 | 0.010 (0.070, 0.051) | 0.754 |
| Commercial | 0.993 (0.974, 1.012) | 0.977 (0.955, 0.998) | 0.016 (0.045, 0.013) | 0.271 | 1.009 (0.978, 1.039) | 0.986 (0.956, 1.016) | 0.022 (0.065, 0.020) | 0.298 | 0.006 (0.044, 0.057) | 0.809 |
| Medicaid | 1.059 (1.036, 1.082) | 1.043 (1.018, 1.067) | 0.016 (0.049, 0.017) | 0.349 | 1.064 (1.020, 1.108) | 1.060 (1.015, 1.106) | 0.004 (0.066, 0.059) | 0.911 | 0.012 (0.082, 0.057) | 0.727 |
| Uninsured | 0.960 (0.933, 0.988) | 0.925 (0.890, 0.961) | 0.035 (0.080, 0.010) | 0.126 | 0.972 (0.935, 1.009) | 0.944 (0.909, 0.979) | 0.028 (0.078, 0.022) | 0.273 | 0.007 (0.074, 0.060) | 0.835 |
| Other | 0.988 (0.960, 1.017) | 0.984 (0.952, 1.015) | 0.005 (0.047, 0.037) | 0.822 | 1.022 (0.973, 1.071) | 0.984 (0.944, 1.024) | 0.038 (0.100, 0.024) | 0.232 | 0.033 (0.042, 0.107) | 0.386 |
| Mortality index, mean (95% CI) | ||||||||||
| Overall | 1.000 (0.955, 1.045) | 0.878 (0.836, 0.921) | 0.122 (0.183, 0.061) | <0.001 | 0.997 (0.931, 1.062) | 0.850 (0.800, 0.900) | 0.147 (0.227, 0.066) | 0.001 | 0.025 (0.076, 0.125) | 0.628 |
| Medicare | 0.990 (0.942, 1.038) | 0.871 (0.826, 0.917) | 0.119 (0.185, 0.053) | <0.001 | 1.000 (0.925, 1.076) | 0.844 (0.788, 0.900) | 0.156 (0.249, 0.064) | 0.001 | 0.038 (0.075, 0.150) | 0.513 |
| Commercial | 1.045 (0.934, 1.155) | 0.908 (0.842, 0.975) | 0.136 (0.264, 0.008) | 0.037 | 1.023 (0.935, 1.111) | 0.820 (0.758, 0.883) | 0.203 (0.309, 0.096) | <0.001 | 0.067 (0.099, 0.232) | 0.430 |
| Medicaid | 0.894 (0.845, 0.942) | 0.786 (0.748, 0.824) | 0.107 (0.168, 0.046) | 0.001 | 0.937 (0.861, 1.013) | 0.789 (0.733, 0.844) | 0.148 (0.242, 0.055) | 0.002 | 0.041 (0.069, 0.151) | 0.464 |
| Uninsured | 1.172 (1.007, 1.337)∥ | 1.136 (0.968, 1.303) | 0.037 (0.271, 0.197) | 0.758 | 0.868 (0.768, 0.968)∥ | 0.850 (0.761, 0.939) | 0.017 (0.149, 0.115) | 0.795 | 0.019 (0.287, 0.248) | 0.887 |
| Other | 1.376 (1.052, 1.700)# | 1.156 (0.910, 1.402) | 0.220 (0.624, 0.184) | 0.285 | 1.009 (0.868, 1.150) # | 0.874 (0.682, 1.066) | 0.135 (0.369, 0.099) | 0.254 | 0.085 (0.555, 0.380) | 0.720 |

Table 1 shows that the overall LOS index remained unchanged pre‐ to post‐ACA implementation for both Medicaid‐expansion (1.017 to 1.006, P = 0.488) and nonexpansion hospitals (1.008 to 0.995, P = 0.574). LOS indices for each payer type also remained unchanged. The overall mortality index significantly improved pre‐ to post‐ACA implementation for both Medicaid‐expansion (1.000 to 0.878, P < 0.001) and nonexpansion hospitals (0.997 to 0.850, P = 0.001). Among both Medicaid‐expansion and nonexpansion hospitals, the mortality index significantly improved for Medicare, commercial, and Medicaid discharges but not for uninsured or other discharges. In the difference‐in‐differences analysis, the changes in LOS indices and mortality indices pre‐ to post‐ACA implementation did not differ significantly between hospitals in Medicaid‐expansion versus nonexpansion states.
In post hoc linear regression analyses of payer mix and LOS and mortality indices clustered by state‐level strata, point estimates were minimally changed. Although 95% CIs were slightly wider, statistical significance was unchanged from our primary analyses (data not shown).
DISCUSSION
We found that ACA implementation had a significant impact on payer mix for general medicine patients at AMCs in the United States, primarily by increasing the number of Medicaid beneficiaries and by decreasing the number of uninsured patients in Medicaid‐expansion states. State Medicaid expansion status did not appear to influence either LOS or in‐hospital mortality.
Our study offers some of the longest‐term data currently available on the impact of ACA implementation on payer mix trends and encompasses more states than others have previously. Although we uniquely focused on general medicine patients at AMCs, our results are similar to those seen for US hospitals overall. Nikpay and colleagues evaluated payer mix trends for non‐Medicare adult inpatient stays in 16 states through the second quarter of 2014 using the Healthcare Cost and Utilization Project database through the Agency for Healthcare Research and Quality.[4] They found a relative 20% increase and 50% decrease in Medicaid and uninsured discharges in Medicaid‐expansion states, along with nonsignificant changes in nonexpansion states. Hempstead and Cantor assessed payer mix for non‐Medicare discharges using state hospital association data from 21 states through the fourth quarter of 2014 and found a significant increase in Medicaid patients as well as a nearly significant decrease in uninsured patients in expansion states relative to nonexpansion states.[5] The Department of Health and Human Services also reported that uninsured/self‐pay discharges fell substantially (65%73%) in Medicaid‐expansion states by the end of 2014, with slight decreases in nonexpansion states.[20]
In contrast to our hypothesis, the overall LOS and in‐hospital mortality indices were not influenced by state Medicaid expansion status. From a purely mathematical standpoint, the contribution of Medicaid patients to the overall LOS and mortality indices may have been eclipsed by Medicare and commercially insured patients, who represented a higher proportion of total discharges. The lack of impact of state Medicaid expansion status on overall LOS and mortality indices did not appear to occur as a result of indices for Medicaid patients trending toward the mean. As predicted based on observational studies, Medicaid patients in our study tended to have a higher LOS index than those with other insurance types. Medicaid patients actually tended to have a lower mortality index in our analysis; the reason for this latter finding is unclear and in contrast to other published studies.[6, 7, 8, 9, 10, 11, 12, 13, 14, 15, 21]
To our knowledge, no other studies have evaluated the effect of payer mix changes under the ACA on inpatient outcomes. However, new evidence is emerging on outpatient outcomes. Low‐income adults in Medicaid‐expansion states have reported greater gains in access to primary care services and in the diagnosis of certain chronic health conditions than those in nonexpansion states as a result of ACA implementation.[22, 23] Such improvements in the outpatient setting might be expected to reduce patient acuity on admission. However, they would not necessarily translate to relative improvements in LOS or mortality indices for Medicaid‐expansion hospitals, as the UHC risk adjustment models controlled for disease severity on admission.
Similarly, few studies have assessed the impact of payer mix changes under previous state Medicaid expansions on inpatient outcomes. After Massachusetts expanded Medicaid and enacted near‐universal healthcare coverage in 2006, a minimal LOS reduction of just 0.05 days was observed.[24] New York expanded Medicaid eligibility to nondisabled childless adults with incomes below 100% of the federal poverty level in September 2001, whereas Arizona did so in November 2001 and Maine in October 2002. A study comparing outcomes in these states to 4 neighboring nonexpansion states found a relative reduction in annual all‐cause mortality of 6.1% population wide; however, it did not assess in‐hospital mortality.[25] The Oregon Health Insurance Experiment that randomized low‐income adults to expanded Medicaid coverage or not in 2008 has also reported on outpatient rather than inpatient outcomes.[26]
Our findings have potential implications for health policymakers. That Medicaid expansion status had a neutral effect on both LOS and mortality indices in our analysis should be reassuring for states contemplating Medicaid expansion in the future. Our results also highlight the need for further efforts to reduce disparities in inpatient care based on payer status. For example, although Medicare, commercially insured, and Medicaid patients witnessed significant improvements in mortality indices pre‐ to post‐ACA implementation in hospitals in both Medicaid‐expansion and nonexpansion states, uninsured patients did not.
This study has several limitations. First, our analysis of the impact of ACA implementation on payer mix did not account for concurrent socioeconomic trends that may have influenced insurance coverage across the United States. However, the main goal of this analysis was to demonstrate that changes in payer mix did in fact occur over time, to provide rationale for our subsequent LOS and mortality analyses. Second, we could not control for variation in the design and implementation of Medicaid expansions across states as permitted under the federal Section 1115 waiver process. Third, we only had access to hospital‐level data through the UHC CDB/RM, rather than individual patient data. We attempted to mitigate this limitation by weighting data according to the number of cases per hospital. Lastly, additional patient‐level factors that may influence LOS or mortality may not be included in the UHC risk adjustment models.
In summary, the differential shift in payer mix between Medicaid‐expansion and nonexpansion states did not influence overall LOS or in‐hospital mortality for general medicine patients at AMCs in the United States. Additional research could help to determine the impact of ACA implementation on other patient outcomes that may be dependent on insurance status, such as readmissions or hospital‐acquired complications.
Disclosures: M.E.A. conceived of the study concept and design, assisted with data acquisition, and drafted the manuscript. J.J.G. assisted with study design and made critical revisions to the manuscript. D.A. assisted with study design and made critical revisions to the manuscript. R.P. assisted with study design and made critical revisions to the manuscript. M.L. assisted with study design and data acquisition and made critical revisions to the manuscript. C.D.J. assisted with study design, performed data analyses, and made critical revisions to the manuscript. A modified abstract was presented in poster format at the University HealthSystem Consortium Annual Conference held September 30 to October 2, 2015 in Orlando, Florida, as well as at the Society of Hospital Medicine Research, Innovations, and Vignettes 2016 Annual Meeting held March 69, 2016, in San Diego, California. The authors report no conflicts of interest.
- Department of Health and Human Services. Key features of the Affordable Care Act by year. Available at: http://www.hhs.gov/healthcare/facts‐and‐features/key‐features‐of‐aca‐by‐year/index.html#2014. Accessed April 4, 2016.
- Centers for Medicare and Medicaid Services. Medicaid enrollment data collected through MBES. Available at: https://www.medicaid.gov/medicaid‐chip‐program‐information/program‐information/medicaid‐and‐chip‐enrollment‐data/medicaid‐enrollment‐data‐collected‐through‐mbes.html. Accessed April 4, 2016.
- The Henry J. Kaiser Family Foundation. Status of state action on the Medicaid expansion decision. Available at: http://kff.org/health‐reform/state‐indicator/state‐activity‐around‐expanding‐medicaid‐under‐the‐affordable‐care‐act. Accessed April 4, 2016.
- , , . Affordable Care Act Medicaid expansion reduced uninsured hospital stays in 2014. Health Aff (Millwood). 2016;35(1):106–110.
- , . State Medicaid expansion and changes in hospital volume according to payer. N Engl J Med. 2016;374(2):196–198.
- , , , , , . Understanding predictors of prolonged hospitalizations among general medicine patients: a guide and preliminary analysis. J Hosp Med. 2015;10(9):623–626.
- , , , . Impact of insurance and hospital ownership on hospital length of stay among patients with ambulatory care‐sensitive conditions. Ann Fam Med. 2011;9:489–495.
- , , . Insurance status and hospital care for myocardial infarction, stroke, and pneumonia. J Hosp Med. 2010;5:452–459.
- , , , , , . Payment source, quality of care, and outcomes in patients hospitalized with heart failure. J Am Coll Cardiol. 2011;58(14):1465–1471.
- , , , , . The inpatient experience and predictors of length of stay for patients hospitalized with systolic heart failure: comparison by commercial, Medicaid, and Medicare payer type. J Med Econ. 2013;16(1):43–54.
- , , et al. Insurance coverage and care of patients with non‐ST‐segment elevation acute coronary syndromes. Ann Intern Med. 2006;145:739–748.
- , , , et al. Association of insurance status with inpatient treatment for coronary artery disease: findings from the Get with the Guidelines Program. Am Heart J. 2010;159:1026–1036.
- , , , et al. Primary payer status affects mortality for major surgical operations. Ann Surg. 2010;252:544–551.
- , , . Medicaid payer status is associated with in‐hospital morbidity and resource utilization following primary total joint arthroplasty. J Bone Joint Surg Am. 2014;96(21):e180.
- , , . The quality of care delivered to patients within the same hospital varies by insurance type. Health Aff (Millwood). 2013;32(10):1731–1739.
- , , , , . Effect of insurance status on postacute care among working age stroke survivors. Neurology. 2012;78(20):1590–1595.
- , , , . Hospitalizations in which patients leave the hospital against medical advice (AMA), 2007. HCUP statistical brief #78. August 2009. Rockville, MD: Agency for Healthcare Research and Quality; 2009. Available at: http://www.hcup‐us.ahrq.gov/reports/statbriefs/sb78.pdf. Accessed May 12, 2016.
- , , , . Characteristics of Medicaid and uninsured hospitalizations, 2012. HCUP statistical brief #182. Rockville, MD: Agency for Healthcare Research and Quality; 2014. Available at: http://www.hcup‐us.ahrq.gov/reports/statbriefs/sb182‐Medicaid‐Uninsured‐Hospitalizations‐2012.pdf. Accessed March 9, 2016.
- Agency for Healthcare Research and Quality. Mortality measurement: mortality risk adjustment methodology for University HealthSystem Consortium. Available at: http://archive.ahrq.gov/professionals/quality‐patient‐safety/quality‐resources/tools/mortality/Meurer.pdf. Accessed May 10, 2016.
- Department of Health and Human Services. Insurance expansion, hospital uncompensated care, and the Affordable Care Act. Available at: https://aspe.hhs.gov/pdf‐report/insurance‐expansion‐hospital‐uncompensated‐care‐and‐affordable‐care‐act. Accessed May 27, 2016.
- , , , . Our flawed but beneficial Medicaid program. N Engl J Med. 2011;364(16):e31.
- , , , . Changes in self‐reported insurance coverage, access to care, and health under the Affordable Care Act. JAMA. 2015;314(4):366–374.
- , . Early coverage, access, utilization, and health effects associated with the Affordable Care Act Medicaid Expansions: a quasi‐experimental study. Ann Intern Med. 2016;164(12):795–803.
- , . The impact of health care reform on hospital and preventive care: evidence from Massachusetts. J Public Econ. 2012;96(11–12):909–929.
- , , . Mortality and access to care among adults after state Medicaid expansions. N Engl J Med. 2012;367:1025–1034.
- , , , et al. The Oregon Experiment—effects of Medicaid on clinical outcomes. N Engl J Med. 2013;368(18):1713–1722.
On January 1, 2014, several major provisions of the Affordable Care Act (ACA) took effect, including introduction of the individual mandate for health insurance coverage, opening of the Health Insurance Marketplace, and expansion of Medicaid eligibility to Americans earning up to 133% of the federal poverty level.[1] Nearly 9 million US adults have enrolled in Medicaid since that time, primarily in the 31 states and Washington, DC that have opted into Medicaid expansion.[2, 3] ACA implementation has also had a significant impact on hospital payer mix, primarily by reducing the volume of uncompensated care in Medicaid‐expansion states.[4, 5]
The differential shift in payer mix in Medicaid‐expansion versus nonexpansion states may be relevant to hospitals beyond reimbursement. Medicaid insurance has historically been associated with longer hospitalizations and higher in‐hospital mortality in diverse patient populations, more so than commercial insurance and often even uninsured payer status.[6, 7, 8, 9, 10, 11, 12, 13, 14, 15] The disparity in outcomes between patients with Medicaid versus other insurance persists even after adjustment for disease severity and baseline comorbidities. Insurance type may influence the delivery of inpatient care through variation in access to invasive procedures and adherence to guideline‐concordant medical therapies.[9, 10, 11, 12] Medicaid patients may be more likely than uninsured patients to remain hospitalized pending postacute care placement rather than be discharged home with family support.[16] Medicaid patients are also less likely to leave against medical advice than uninsured patients.[17]
Currently, little is known about the impact of state Medicaid expansion status on length of stay (LOS) or mortality nationally. It is possible that hospitals in Medicaid‐expansion states have experienced relative worsening in LOS and mortality as their share of Medicaid patients has grown. Determining the impact of ACA implementation on payer mix and patient outcomes is particularly important for academic medical centers (AMCs), as they traditionally care for the greatest percentage of both Medicaid and uninsured patients.[18] We sought to characterize the impact of state Medicaid expansion status on payer mix, LOS, and in‐hospital mortality for general medicine patients at AMCs in the United States.
METHODS
The University HealthSystem Consortium (UHC) is an alliance of 117 AMCs and 310 affiliated hospitals, representing >90% of such institutions in the US. We queried the online UHC Clinical Data Base/Resource Manager (CDB/RM) to obtain hospital‐level insurance, LOS, and mortality data for inpatients discharged from a general medicine service between October 1, 2012 and September 30, 2015. We excluded hospitals that were missing data for any month within the study period. No patient‐level data were accessed.
Our outcomes of interest were the proportion of discharges by primary payer (Medicare, commercial, Medicaid, uninsured, or other [eg, Tri‐Care or Workers' Compensation]), as well as the LOS index and mortality index. Both indices were defined as the ratio of the observed to expected values. To determine the expected LOS and mortality, the UHC 2015 risk adjustment models were applied to all cases, adjusting for variables such as patient demographics, low socioeconomic status, admit source and status, severity of illness, and comorbid conditions, as described by International Classification of Diseases, Ninth Revision codes. These models have been validated and are used for research and quality benchmarking for member institutions.[19]
We next stratified hospitals according to state Medicaid expansion status. We defined Medicaid‐expansion states as those that had expanded Medicaid by the end of the study period: Arizona, Arkansas, California, Colorado, Connecticut, Illinois, Indiana, Iowa, Kentucky, Maryland, Massachusetts, Michigan, Minnesota, Nevada, New Hampshire, New Jersey, New Mexico, New York, Ohio, Oregon, Pennsylvania, Rhode Island, Washington, Washington DC, and West Virginia. Nonexpansion states included Alabama, Florida, Georgia, Kansas, Louisiana, Missouri, Nebraska, North Carolina, South Carolina, Tennessee, Texas, Utah, Virginia, and Wisconsin. We excluded 12 states due to incomplete data: Alaska, Delaware, Hawaii, Idaho, North Dakota, Maine, Mississippi, Montana, Oklahoma, South Dakota, Vermont, and Wyoming.
We then identified our pre‐ and post‐ACA implementation periods. Medicaid coverage expansion took effect in all expansion states on January 1, 2014, with the exception of Michigan (April 1, 2014), New Hampshire (August 15, 2014), Pennsylvania (January 1, 2015), and Indiana (February 1, 2015).[3] We therefore defined October 1, 2012 to December 31, 2013 as the pre‐ACA implementation period and January 1, 2014 to September 30, 2015 as the post‐ACA implementation period for all states except for Michigan, New Hampshire, Pennsylvania, and Indiana. For these 4 states, we customized the pre‐ and post‐ACA implementation periods to their respective dates of Medicaid expansion; for New Hampshire, we designated October 1, 2012 to July 31, 2014 as the pre‐ACA implementation period and September 1, 2014 to September 30, 2015 as the post‐ACA implementation period, as we were unable to distinguish before versus after data in August 2014 based on the midmonth expansion of Medicaid.
After stratifying hospitals into groups based on whether they were located in Medicaid‐expansion or nonexpansion states, the proportion of discharges by payer was compared between pre‐ and post‐ACA implementation periods both graphically by quarter and using linear regression models weighted for the number of cases from each hospital. Next, for both Medicaid‐expansion and nonexpansion hospitals, LOS index and mortality index were compared before and after ACA implementation using linear regression models weighted for the number of cases from each hospital, both overall and by payer. Difference‐in‐differences estimations were then completed to compare the proportion of discharges by payer, LOS index, and mortality index between Medicaid‐expansion and nonexpansion hospitals before and after ACA implementation. Post hoc linear regression analyses were completed to evaluate the effect of clustering by state level strata on payer mix and LOS and mortality indices. A 2‐sided P value of <0.05 was considered statistically significant. Data analyses were performed using Stata 12.0 (StataCorp, College Station, TX).
RESULTS
We identified 4,258,952 discharges among general medicine patients from 211 hospitals in 38 states and Washington, DC between October 1, 2012, and September 30, 2015. This included 3,144,488 discharges from 156 hospitals in 24 Medicaid‐expansion states and Washington, DC and 1,114,464 discharges from 55 hospitals in 14 nonexpansion states.
Figure 1 shows the trends in payer mix over time for hospitals in both Medicaid‐expansion and nonexpansion states. As summarized in Table 1, hospitals in Medicaid‐expansion states experienced a significant 3.7‐percentage point increase in Medicaid discharges (P = 0.013) and 2.9‐percentage point decrease in uninsured discharges (P < 0.001) after ACA implementation. This represented an approximately 19% jump and 60% drop in Medicaid and uninsured discharges, respectively. Hospitals in nonexpansion states saw no significant change in the proportion of discharges by payer after ACA implementation. In the difference‐in‐differences analysis, there was a trend toward a greater change in the proportion of Medicaid discharges pre‐ to post‐ACA implementation among hospitals in Medicaid‐expansion states compared to hospitals in nonexpansion states (mean difference‐in‐differences 4.1%, 95% confidence interval [CI]: 0.3%, 8.6%, P = 0.070).
| Medicaid‐expansion n=156 hospitals; 3,144,488 cases | Non‐expansion n=55 hospitals; 1,114,464 cases | |||||||||
|---|---|---|---|---|---|---|---|---|---|---|
| Pre‐ACA Implementation (1,453,090 Cases) | Post‐ACA Implementation (1,691,398 Cases) | Mean Difference | P Value | Pre‐ACA Implementation (455,440 Cases) | Post‐ACA Implementation (659,024 Cases) | Mean Difference | P Value | Mean Difference‐in‐Differences | P Value | |
| ||||||||||
| Payer mix, % (95% CI) | ||||||||||
| Medicare | 48.6 (46.2, 51.0)* | 48.3 (45.9, 50.7) | 0.3 (3.6, 3.1) | 0.865 | 44.3 (40.7, 47.7)* | 45.3 (41.9, 48.6) | 1.0 (3.8, 5.8) | 0.671 | 1.3 (7.1, 4.5) | 0.655 |
| Commercial | 23.1 (21.4, 24.7) | 23.2 (21.8, 24.6) | 0.2 (2.0, 2.3) | 0.882 | 21.5 (18.5, 24.6) | 22.7 (19.7, 25.8) | 1.2 (3.0, 5.4) | 0.574 | 1.0 (5.7, 3.6) | 0.662 |
| Medicaid | 19.6 (17.6, 21.6) | 23.3 (21.2, 25.5) | 3.7 (0.8, 6.6) | 0.013 | 19.4 (16.9, 21.9) | 19.0 (16.5, 21.4) | 0.4 (3.8, 3.0) | 0.812 | 4.1 (0.3, 8.6) | 0.070 |
| Uninsured | 5.0 (4.0, 5.9) | 2.0 (1.7, 2.3) | 2.9 (3.9, 2.0) | <0.001 | 10.9 (8.1, 13.7) | 9.4 (7.0, 11.7) | 1.5 (5.1, 2.1) | 0.407 | 1.4 (5.1, 2.2) | 0.442 |
| Other | 3.8 (2.6, 4.9) | 3.1 (2.0, 4.3) | 0.7 (2.3, 1.0) | 0.435 | 4.0 (2.9, 5.0) | 3.7 (2.6, 4.7) | 0.3 (1.7, 1.1) | 0.662 | 0.3 (2.5, 1.8) | 0.762 |
| LOS index, mean (95% CI) | ||||||||||
| Overall | 1.017 (0.996, 1.038) | 1.006 (0.981, 1.031) | 0.011 (0.044, 0.021) | 0.488 | 1.008 (0.974, 1.042) | 0.995 (0.961, 1.029) | 0.013 (0.061, 0.034) | 0.574 | 0.002 (0.055, 0.059) | 0.943 |
| Medicare | 1.012 (0.989, 1.035) | 0.999 (0.971, 1.027) | 0.013 (0.049, 0.023) | 0.488 | 0.982 (0.946, 1.017) | 0.979 (0.944, 1.013) | 0.003 (0.052, 0.046) | 0.899 | 0.010 (0.070, 0.051) | 0.754 |
| Commercial | 0.993 (0.974, 1.012) | 0.977 (0.955, 0.998) | 0.016 (0.045, 0.013) | 0.271 | 1.009 (0.978, 1.039) | 0.986 (0.956, 1.016) | 0.022 (0.065, 0.020) | 0.298 | 0.006 (0.044, 0.057) | 0.809 |
| Medicaid | 1.059 (1.036, 1.082) | 1.043 (1.018, 1.067) | 0.016 (0.049, 0.017) | 0.349 | 1.064 (1.020, 1.108) | 1.060 (1.015, 1.106) | 0.004 (0.066, 0.059) | 0.911 | 0.012 (0.082, 0.057) | 0.727 |
| Uninsured | 0.960 (0.933, 0.988) | 0.925 (0.890, 0.961) | 0.035 (0.080, 0.010) | 0.126 | 0.972 (0.935, 1.009) | 0.944 (0.909, 0.979) | 0.028 (0.078, 0.022) | 0.273 | 0.007 (0.074, 0.060) | 0.835 |
| Other | 0.988 (0.960, 1.017) | 0.984 (0.952, 1.015) | 0.005 (0.047, 0.037) | 0.822 | 1.022 (0.973, 1.071) | 0.984 (0.944, 1.024) | 0.038 (0.100, 0.024) | 0.232 | 0.033 (0.042, 0.107) | 0.386 |
| Mortality index, mean (95% CI) | ||||||||||
| Overall | 1.000 (0.955, 1.045) | 0.878 (0.836, 0.921) | 0.122 (0.183, 0.061) | <0.001 | 0.997 (0.931, 1.062) | 0.850 (0.800, 0.900) | 0.147 (0.227, 0.066) | 0.001 | 0.025 (0.076, 0.125) | 0.628 |
| Medicare | 0.990 (0.942, 1.038) | 0.871 (0.826, 0.917) | 0.119 (0.185, 0.053) | <0.001 | 1.000 (0.925, 1.076) | 0.844 (0.788, 0.900) | 0.156 (0.249, 0.064) | 0.001 | 0.038 (0.075, 0.150) | 0.513 |
| Commercial | 1.045 (0.934, 1.155) | 0.908 (0.842, 0.975) | 0.136 (0.264, 0.008) | 0.037 | 1.023 (0.935, 1.111) | 0.820 (0.758, 0.883) | 0.203 (0.309, 0.096) | <0.001 | 0.067 (0.099, 0.232) | 0.430 |
| Medicaid | 0.894 (0.845, 0.942) | 0.786 (0.748, 0.824) | 0.107 (0.168, 0.046) | 0.001 | 0.937 (0.861, 1.013) | 0.789 (0.733, 0.844) | 0.148 (0.242, 0.055) | 0.002 | 0.041 (0.069, 0.151) | 0.464 |
| Uninsured | 1.172 (1.007, 1.337)∥ | 1.136 (0.968, 1.303) | 0.037 (0.271, 0.197) | 0.758 | 0.868 (0.768, 0.968)∥ | 0.850 (0.761, 0.939) | 0.017 (0.149, 0.115) | 0.795 | 0.019 (0.287, 0.248) | 0.887 |
| Other | 1.376 (1.052, 1.700)# | 1.156 (0.910, 1.402) | 0.220 (0.624, 0.184) | 0.285 | 1.009 (0.868, 1.150) # | 0.874 (0.682, 1.066) | 0.135 (0.369, 0.099) | 0.254 | 0.085 (0.555, 0.380) | 0.720 |
Table 1 shows that the overall LOS index remained unchanged pre‐ to post‐ACA implementation for both Medicaid‐expansion (1.017 to 1.006, P = 0.488) and nonexpansion hospitals (1.008 to 0.995, P = 0.574). LOS indices for each payer type also remained unchanged. The overall mortality index significantly improved pre‐ to post‐ACA implementation for both Medicaid‐expansion (1.000 to 0.878, P < 0.001) and nonexpansion hospitals (0.997 to 0.850, P = 0.001). Among both Medicaid‐expansion and nonexpansion hospitals, the mortality index significantly improved for Medicare, commercial, and Medicaid discharges but not for uninsured or other discharges. In the difference‐in‐differences analysis, the changes in LOS indices and mortality indices pre‐ to post‐ACA implementation did not differ significantly between hospitals in Medicaid‐expansion versus nonexpansion states.
In post hoc linear regression analyses of payer mix and LOS and mortality indices clustered by state‐level strata, point estimates were minimally changed. Although 95% CIs were slightly wider, statistical significance was unchanged from our primary analyses (data not shown).
DISCUSSION
We found that ACA implementation had a significant impact on payer mix for general medicine patients at AMCs in the United States, primarily by increasing the number of Medicaid beneficiaries and by decreasing the number of uninsured patients in Medicaid‐expansion states. State Medicaid expansion status did not appear to influence either LOS or in‐hospital mortality.
Our study offers some of the longest‐term data currently available on the impact of ACA implementation on payer mix trends and encompasses more states than others have previously. Although we uniquely focused on general medicine patients at AMCs, our results are similar to those seen for US hospitals overall. Nikpay and colleagues evaluated payer mix trends for non‐Medicare adult inpatient stays in 16 states through the second quarter of 2014 using the Healthcare Cost and Utilization Project database through the Agency for Healthcare Research and Quality.[4] They found a relative 20% increase and 50% decrease in Medicaid and uninsured discharges in Medicaid‐expansion states, along with nonsignificant changes in nonexpansion states. Hempstead and Cantor assessed payer mix for non‐Medicare discharges using state hospital association data from 21 states through the fourth quarter of 2014 and found a significant increase in Medicaid patients as well as a nearly significant decrease in uninsured patients in expansion states relative to nonexpansion states.[5] The Department of Health and Human Services also reported that uninsured/self‐pay discharges fell substantially (65%73%) in Medicaid‐expansion states by the end of 2014, with slight decreases in nonexpansion states.[20]
In contrast to our hypothesis, the overall LOS and in‐hospital mortality indices were not influenced by state Medicaid expansion status. From a purely mathematical standpoint, the contribution of Medicaid patients to the overall LOS and mortality indices may have been eclipsed by Medicare and commercially insured patients, who represented a higher proportion of total discharges. The lack of impact of state Medicaid expansion status on overall LOS and mortality indices did not appear to occur as a result of indices for Medicaid patients trending toward the mean. As predicted based on observational studies, Medicaid patients in our study tended to have a higher LOS index than those with other insurance types. Medicaid patients actually tended to have a lower mortality index in our analysis; the reason for this latter finding is unclear and in contrast to other published studies.[6, 7, 8, 9, 10, 11, 12, 13, 14, 15, 21]
To our knowledge, no other studies have evaluated the effect of payer mix changes under the ACA on inpatient outcomes. However, new evidence is emerging on outpatient outcomes. Low‐income adults in Medicaid‐expansion states have reported greater gains in access to primary care services and in the diagnosis of certain chronic health conditions than those in nonexpansion states as a result of ACA implementation.[22, 23] Such improvements in the outpatient setting might be expected to reduce patient acuity on admission. However, they would not necessarily translate to relative improvements in LOS or mortality indices for Medicaid‐expansion hospitals, as the UHC risk adjustment models controlled for disease severity on admission.
Similarly, few studies have assessed the impact of payer mix changes under previous state Medicaid expansions on inpatient outcomes. After Massachusetts expanded Medicaid and enacted near‐universal healthcare coverage in 2006, a minimal LOS reduction of just 0.05 days was observed.[24] New York expanded Medicaid eligibility to nondisabled childless adults with incomes below 100% of the federal poverty level in September 2001, whereas Arizona did so in November 2001 and Maine in October 2002. A study comparing outcomes in these states to 4 neighboring nonexpansion states found a relative reduction in annual all‐cause mortality of 6.1% population wide; however, it did not assess in‐hospital mortality.[25] The Oregon Health Insurance Experiment that randomized low‐income adults to expanded Medicaid coverage or not in 2008 has also reported on outpatient rather than inpatient outcomes.[26]
Our findings have potential implications for health policymakers. That Medicaid expansion status had a neutral effect on both LOS and mortality indices in our analysis should be reassuring for states contemplating Medicaid expansion in the future. Our results also highlight the need for further efforts to reduce disparities in inpatient care based on payer status. For example, although Medicare, commercially insured, and Medicaid patients witnessed significant improvements in mortality indices pre‐ to post‐ACA implementation in hospitals in both Medicaid‐expansion and nonexpansion states, uninsured patients did not.
This study has several limitations. First, our analysis of the impact of ACA implementation on payer mix did not account for concurrent socioeconomic trends that may have influenced insurance coverage across the United States. However, the main goal of this analysis was to demonstrate that changes in payer mix did in fact occur over time, to provide rationale for our subsequent LOS and mortality analyses. Second, we could not control for variation in the design and implementation of Medicaid expansions across states as permitted under the federal Section 1115 waiver process. Third, we only had access to hospital‐level data through the UHC CDB/RM, rather than individual patient data. We attempted to mitigate this limitation by weighting data according to the number of cases per hospital. Lastly, additional patient‐level factors that may influence LOS or mortality may not be included in the UHC risk adjustment models.
In summary, the differential shift in payer mix between Medicaid‐expansion and nonexpansion states did not influence overall LOS or in‐hospital mortality for general medicine patients at AMCs in the United States. Additional research could help to determine the impact of ACA implementation on other patient outcomes that may be dependent on insurance status, such as readmissions or hospital‐acquired complications.
Disclosures: M.E.A. conceived of the study concept and design, assisted with data acquisition, and drafted the manuscript. J.J.G. assisted with study design and made critical revisions to the manuscript. D.A. assisted with study design and made critical revisions to the manuscript. R.P. assisted with study design and made critical revisions to the manuscript. M.L. assisted with study design and data acquisition and made critical revisions to the manuscript. C.D.J. assisted with study design, performed data analyses, and made critical revisions to the manuscript. A modified abstract was presented in poster format at the University HealthSystem Consortium Annual Conference held September 30 to October 2, 2015 in Orlando, Florida, as well as at the Society of Hospital Medicine Research, Innovations, and Vignettes 2016 Annual Meeting held March 69, 2016, in San Diego, California. The authors report no conflicts of interest.
- Department of Health and Human Services. Key features of the Affordable Care Act by year. Available at: http://www.hhs.gov/healthcare/facts‐and‐features/key‐features‐of‐aca‐by‐year/index.html#2014. Accessed April 4, 2016.
- Centers for Medicare and Medicaid Services. Medicaid enrollment data collected through MBES. Available at: https://www.medicaid.gov/medicaid‐chip‐program‐information/program‐information/medicaid‐and‐chip‐enrollment‐data/medicaid‐enrollment‐data‐collected‐through‐mbes.html. Accessed April 4, 2016.
- The Henry J. Kaiser Family Foundation. Status of state action on the Medicaid expansion decision. Available at: http://kff.org/health‐reform/state‐indicator/state‐activity‐around‐expanding‐medicaid‐under‐the‐affordable‐care‐act. Accessed April 4, 2016.
- , , . Affordable Care Act Medicaid expansion reduced uninsured hospital stays in 2014. Health Aff (Millwood). 2016;35(1):106–110.
- , . State Medicaid expansion and changes in hospital volume according to payer. N Engl J Med. 2016;374(2):196–198.
- , , , , , . Understanding predictors of prolonged hospitalizations among general medicine patients: a guide and preliminary analysis. J Hosp Med. 2015;10(9):623–626.
- , , , . Impact of insurance and hospital ownership on hospital length of stay among patients with ambulatory care‐sensitive conditions. Ann Fam Med. 2011;9:489–495.
- , , . Insurance status and hospital care for myocardial infarction, stroke, and pneumonia. J Hosp Med. 2010;5:452–459.
- , , , , , . Payment source, quality of care, and outcomes in patients hospitalized with heart failure. J Am Coll Cardiol. 2011;58(14):1465–1471.
- , , , , . The inpatient experience and predictors of length of stay for patients hospitalized with systolic heart failure: comparison by commercial, Medicaid, and Medicare payer type. J Med Econ. 2013;16(1):43–54.
- , , et al. Insurance coverage and care of patients with non‐ST‐segment elevation acute coronary syndromes. Ann Intern Med. 2006;145:739–748.
- , , , et al. Association of insurance status with inpatient treatment for coronary artery disease: findings from the Get with the Guidelines Program. Am Heart J. 2010;159:1026–1036.
- , , , et al. Primary payer status affects mortality for major surgical operations. Ann Surg. 2010;252:544–551.
- , , . Medicaid payer status is associated with in‐hospital morbidity and resource utilization following primary total joint arthroplasty. J Bone Joint Surg Am. 2014;96(21):e180.
- , , . The quality of care delivered to patients within the same hospital varies by insurance type. Health Aff (Millwood). 2013;32(10):1731–1739.
- , , , , . Effect of insurance status on postacute care among working age stroke survivors. Neurology. 2012;78(20):1590–1595.
- , , , . Hospitalizations in which patients leave the hospital against medical advice (AMA), 2007. HCUP statistical brief #78. August 2009. Rockville, MD: Agency for Healthcare Research and Quality; 2009. Available at: http://www.hcup‐us.ahrq.gov/reports/statbriefs/sb78.pdf. Accessed May 12, 2016.
- , , , . Characteristics of Medicaid and uninsured hospitalizations, 2012. HCUP statistical brief #182. Rockville, MD: Agency for Healthcare Research and Quality; 2014. Available at: http://www.hcup‐us.ahrq.gov/reports/statbriefs/sb182‐Medicaid‐Uninsured‐Hospitalizations‐2012.pdf. Accessed March 9, 2016.
- Agency for Healthcare Research and Quality. Mortality measurement: mortality risk adjustment methodology for University HealthSystem Consortium. Available at: http://archive.ahrq.gov/professionals/quality‐patient‐safety/quality‐resources/tools/mortality/Meurer.pdf. Accessed May 10, 2016.
- Department of Health and Human Services. Insurance expansion, hospital uncompensated care, and the Affordable Care Act. Available at: https://aspe.hhs.gov/pdf‐report/insurance‐expansion‐hospital‐uncompensated‐care‐and‐affordable‐care‐act. Accessed May 27, 2016.
- , , , . Our flawed but beneficial Medicaid program. N Engl J Med. 2011;364(16):e31.
- , , , . Changes in self‐reported insurance coverage, access to care, and health under the Affordable Care Act. JAMA. 2015;314(4):366–374.
- , . Early coverage, access, utilization, and health effects associated with the Affordable Care Act Medicaid Expansions: a quasi‐experimental study. Ann Intern Med. 2016;164(12):795–803.
- , . The impact of health care reform on hospital and preventive care: evidence from Massachusetts. J Public Econ. 2012;96(11–12):909–929.
- , , . Mortality and access to care among adults after state Medicaid expansions. N Engl J Med. 2012;367:1025–1034.
- , , , et al. The Oregon Experiment—effects of Medicaid on clinical outcomes. N Engl J Med. 2013;368(18):1713–1722.
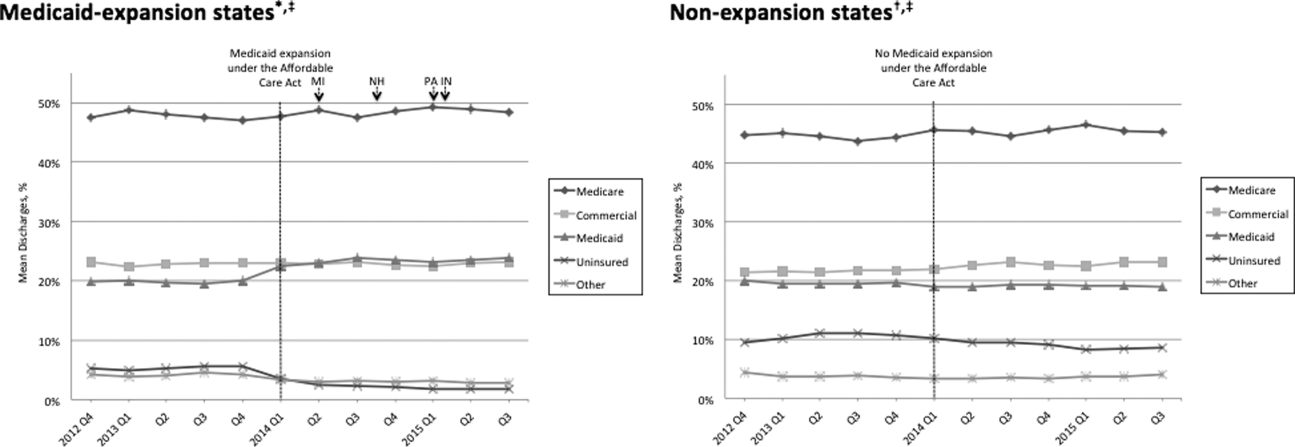
Predictors of Prolonged Hospitalizations
Hospitalizations frequently last longer than warranted by medical necessity alone, due to inefficiencies within the US healthcare system.[1, 2] Discharge delays place patients at risk for hospital‐acquired complications and increase costs. With the growing emphasis on high‐value care, hospital length of stay (LOS) has emerged as a key metric for inpatient care and will remain a central focus of hospital‐based improvement initiatives for the foreseeable future.
Hospitals may find it difficult to identify the primary drivers of inpatient LOS in a dynamic and increasingly complex healthcare system. Multiple recent policy changes have affected inpatient care. The Health Information Technology for Economic and Clinical Health Act of 2009 has led to widespread adoption of electronic health records (EHRs) that have markedly impacted provider workflows.[3] In October 2013, the Centers for Medicare & Medicaid Services implemented the 2‐midnight rule, which reclassified lower acuity inpatients with an expected stay <48 hours to observation status.[4] In January 2014, expansion of insurance coverage under the Affordable Care Act (ACA) altered payer mix for hospitals nationwide.[5] At a local level, hospitals that are rapidly adjusting resource allocation, capital investments, and marketing efforts and making complex operational decisions (eg, to open new units or change admission or referral algorithms) may simultaneously experience shifts in patient volumes, case‐mix index, and staffing ratios with downstream effects on LOS.
Given the myriad factors influencing inpatient LOS, hospital leaders may encounter real challenges in designing effective LOS reduction strategies. For example, they may expend significant resources on real‐time demand‐capacity management systems to improve hospital‐wide patient flow, but the resultant emphasis on bed placement and early discharges may shave only hours off average LOS.[6, 7] An alternative approach may be to target the small percentage of patients with prolonged hospitalizations who contribute disproportionately to the average LOS, as other initiatives focused on high utilizers have done.[8, 9, 10]
Our institution noted an increase in the average inpatient LOS for general medicine patients from 2012 to 2014, prompting a call to action by hospital leaders. We sought to characterize the predictors of prolonged hospitalizations among medicine patients to guide future efforts aimed at mitigating the contribution of prolonged LOS to overall LOS.
METHODS
Study Design
We performed a retrospective analysis of medicine patients discharged between January 1, 2012 and December 31, 2014, from the University of Colorado Hospital, a 551‐bed urban, quaternary‐care academic medical center in Aurora, Colorado. Patients were included if they were admitted under inpatient status, 18 years of age, and discharged from 1 of our 10 medicine services: 7 services with residents, staffed by hospitalists, general internists, or subspecialists; and 3 services with advanced practice providers, staffed by hospitalists.
Data Collection
We obtained LOS, calendar year of discharge, demographic data, insurance type, discharge disposition, number of medications, consults, intensive care unit (ICU) stays, surgeries (ie, procedures requiring anesthesia), and primary diagnosis by International Classification of Diseases, Ninth Revision codes from an administrative database that had been developed, validated, and maintained by our hospital medicine group. This database was populated with variables from our EHR, which was implemented in September 2011; to minimize variability in data input during the EHR rollout, we excluded data from September 2011 through December 2011. The Colorado Multiple Institutional Review Board reviewed and exempted this database (protocol 13‐2953) as a program evaluation.
Outcomes
We defined a prolonged hospitalization or LOS as >21 days in duration. This represented approximately 2 standard deviations above the mean LOS in our cohort. This cutoff also helped to remove provider‐level variability, as each medicine service was staffed by 2 attendings per month, each working approximately 7 days on and 7 days off. We examined LOS >14 and >30 days in sensitivity analyses to ensure that the selection of >21 days did not impose an arbitrary and invalid limitation on our statistical analysis.
Statistical Analysis
Demographic and clinical data were compared in the group with LOS 21 days versus the group with LOS >21 days with a 2 test for dichotomous variables and Student t test for continuous variables. We then built a multivariable logistic regression model to predict LOS >21 days using the variables that were significantly different between groups in bivariate analyses. A two‐sided P value of <0.05 was considered statistically significant. All data analyses were performed using Stata 12.0 (StataCorp, College Station, TX).
RESULTS
We identified 18,363 inpatient discharges among 12,511 medicine patients between January 1, 2012 and December 31, 2014. Of these discharges, 416 (2.3%) demonstrated prolonged LOS. Prolonged hospitalizations accounted for 18.6% of total inpatient days. The average LOS during the study period was 4.8 days including patients with prolonged LOS and 4.0 days excluding patients with prolonged LOS, a contribution of 0.8 days.
Table 1 compares the characteristics of patients with and without prolonged LOS. Age, insurance, discharge disposition, palliative care consults, ICU stays, and surgeries were among the variables that differed significantly between the 2 groups. Among patients undergoing surgery, those with prolonged LOS were more likely to have surgery >24 hours after admission than those without prolonged LOS (85.7% vs 51.4%, P<0.001).
| Variable | LOS 21 Days, N=17,947 | LOS >21 Days, N=416 | P Value |
|---|---|---|---|
| |||
| Age, y, mean (SD) | 56.4 (18.7) | 54.4 (17.1) | 0.030 |
| Female | 9,256 (52%) | 199 (48%) | 0.132 |
| Year of discharge | <0.001 | ||
| 2012 | 5,486 (31%) | 69 (17%) | |
| 2013 | 6,193 (35%) | 162 (39%) | |
| 2014 | 6,268 (35%) | 185 (44%) | |
| Race/ethnicity | 0.003 | ||
| White non‐Hispanic | 9,702 (54%) | 242 (58%) | |
| Black non‐Hispanic | 4,000 (22%) | 68 (16%) | |
| Hispanic | 2,872(16%) | 67 (16%) | |
| Asian | 578 (3%) | 9 (2%) | |
| Other or unknown | 795 (4%) | 30 (7%) | |
| Language preference | 0.795 | ||
| English | 16,049 (89%) | 376 (90%) | |
| Spanish | 1,052 (6%) | 23 (6%) | |
| Other | 846 (5%) | 17 (4%) | |
| Insurance | <0.001 | ||
| Medicare | 5,462 (30%) | 109 (26%) | |
| Medicaid | 3,406 (19%) | 126 (30%) | |
| Dual | 2,815 (16%) | 64 (15%) | |
| Private | 2,714 (15%) | 60 (14%) | |
| Indigent/self‐pay | 2,829 (16%) | 42 (10%) | |
| Other | 721 (4%) | 15 (4%) | |
| Length of stay, d (SD) | 4.0 (3.5) | 39.5 (37.3) | <0.001 |
| Discharge disposition | <0.001 | ||
| Home with self‐care | 13,276 (74%) | 115 (28%) | |
| Home with home health | 1,584 (9%) | 79 (19%) | |
| Hospicehome or inpatient | 369 (2%) | 19 (5%) | |
| Postacute‐care facility or LTAC | 1,761 (10%) | 141 (34%) | |
| Expired | 113 (1%) | 18 (4%) | |
| Other | 844 (5%) | 44 (11%) | |
| No. of admission medications (SD) | 9.7 (7.4) | 10.9 (7.8) | 0.002 |
| Primary diagnosis by ICD‐9 code* | |||
| Sepsis, unspecified | 1,548 (9%) | 55 (13%) | 0.001 |
| Acute respiratory failure | 293 (2%) | 9 (2%) | 0.400 |
| MSSA septicemia | 36 (0.2%) | 8 (2%) | <0.001 |
| MRSA septicemia | 13 (0.1%) | 7 (2%) | <0.001 |
| Alcoholic cirrhosis of the liver | 111 (1%) | 7 (2%) | 0.007 |
| Palliative care consult | 398 (2%) | 64 (15%) | <0.001 |
| ICU stay | 2,030 (11%) | 246 (59%) | <0.001 |
| Surgical procedure | 1,800 (10%) | 182 (44%) | <0.001 |
Unspecified sepsis was the most frequent primary diagnosis, regardless of LOS category (Table 2). However, the second through fifth most frequent diagnoses differed for patients with and without prolonged LOS.
| N | % | |
|---|---|---|
| ||
| LOS 21 days | ||
| 1. Sepsis, unspecified | 1,548 | 8.6% |
| 2. Acute pancreatitis | 435 | 2.4% |
| 3. Pneumonia | 431 | 2.4% |
| 4. Acute kidney failure | 363 | 2.0% |
| 5. COPD exacerbation | 320 | 1.8% |
| LOS >21 days | ||
| 1. Sepsis, unspecified | 55 | 13.0% |
| 2. Acute respiratory failure | 9 | 2.2% |
| 3. Methicillin‐sensitive Staphylococcus aureus septicemia | 8 | 1.9% |
| 4. Methicillin‐resistant Staphylococcus aureus septicemia | 7 | 1.7% |
| 5. Alcoholic cirrhosis of the liver | 7 | 1.7% |
In an adjusted logistic regression model (Table 3), we found lower odds of prolonged LOS for each 10‐year increase in age and higher odds of prolonged LOS for Medicaid insurance, discharge to home with home health, discharge to a postacute‐care or long‐term acute‐care facility, and in‐hospital death. Methicillin‐resistant Staphylococcus aureus (MRSA) septicemia, palliative care consults, ICU stays, and surgeries were all also associated with increased odds of prolonged LOS. We identified a statistically significant interaction between ICU stay and surgical procedure (odds ratio: 2.53, 95% confidence interval: 1.51‐4.26, P<0.001).
| Outcome: LOS >21 Days | Odds Ratio | 95% CI | P Value |
|---|---|---|---|
| |||
| Age, per 10 years increase in age | 0.80 | 0.73‐0.87 | <0.001 |
| Year of discharge | |||
| 2012 | 0.47 | 0.34‐0.67 | <0.001 |
| 2013 | 1.10 | 0.84‐1.43 | 0.493 |
| 2014 | Ref | ||
| Race/ethnicity | |||
| White non‐Hispanic | Ref | ||
| Black non‐Hispanic | 0.89 | 0.64‐1.22 | 0.454 |
| Hispanic | 1.01 | 0.70‐1.46 | 0.952 |
| Asian | 0.85 | 0.40‐1.83 | 0.679 |
| Other or unknown | 1.29 | 0.73‐2.26 | 0.378 |
| Insurance | |||
| Medicare | Ref | ||
| Medicaid | 1.99 | 1.29‐3.05 | 0.002 |
| Dual | 1.06 | 0.72‐1.57 | 0.765 |
| Private | 1.13 | 0.70‐1.82 | 0.620 |
| Indigent/self‐pay | 1.66 | 0.95‐2.88 | 0.073 |
| Other | 0.96 | 0.47‐1.96 | 0.908 |
| Discharge disposition | |||
| Home with self‐care | Ref | ||
| Home with home health | 4.48 | 3.10‐6.48 | <0.001 |
| Hospicehome or inpatient | 2.11 | 0.98‐4.55 | 0.057 |
| Postacute‐care facility or LTAC | 10.37 | 6.92‐15.56 | <0.001 |
| Expired | 5.38 | 2.27‐12.75 | <0.001 |
| Other | 4.04 | 2.64‐6.18 | <0.001 |
| No. of admission medications | 1.00 | 0.99‐1.02 | 0.775 |
| Primary diagnosis by ICD‐9 code | |||
| Sepsis, unspecified | 1.11 | 0.78‐1.58 | 0.575 |
| MSSA septicemia | 2.44 | 0.68‐8.67 | 0.074 |
| MRSA septicemia | 8.83 | 1.72‐45.36 | 0.009 |
| Alcoholic cirrhosis of the liver | 1.25 | 0.43‐3.65 | 0.687 |
| Palliative care consult | 4.63 | 2.86‐7.49 | <0.001 |
| ICU stay | 6.66 | 5.22‐8.50 | <0.001 |
| Surgical procedure | 5.04 | 3.90‐6.52 | <0.001 |
Sensitivity analyses using LOS >14 and >30 days yielded similar results to LOS >21 days (see Supporting Appendix Table 1 in the online version of this article).
DISCUSSION
We found that a small proportion of medicine patients with prolonged hospitalizations contributed substantially to both total inpatient days and average inpatient LOS. Such disproportionate healthcare utilization is concerning in light of the Institute of Medicine's charge for health systems to deliver timely, efficient, and equitable care.[11]
Few studies in the United States have analyzed patient characteristics that predict prolonged LOS, and to our knowledge, none have evaluated prolonged LOS specifically in general medicine patients.[12, 13, 14] Among selected surgical populations, prolonged hospitalizations are most often related to placement difficulties, operational delays, and payer‐related issues, rather than severity of illness, baseline comorbidities, or in‐hospital complications.[12, 13] In our study, we found that patients with prolonged LOS were more likely to require a palliative care consult, ICU stay, or surgery, all proxies for disease severity. Patients with prolonged LOS were also more likely to undergo surgery >24 hours after admission than those without prolonged LOS, suggesting that the former were either too unstable to proceed directly to surgery or developed complications later during their hospitalization. Even after controlling for palliative care consults, ICU stays, and surgeries, placement at a postacute‐care facility was strongly associated with prolonged LOS. Patients with prolonged LOS were also more likely to have Medicaid compared to other insurance types.
Our findings have several potential implications for efforts aimed at decreasing the number of and length of prolonged hospitalizations. Although demographic and clinical factors such as Medicaid insurance, ICU stays, and surgeries are generally not modifiable, they could, particularly in combination, be used to trigger earlier and more intensive case management involvement. A streamlined insurance approval process for Medicaid pending inpatients could be beneficial, given the recent expansion of Medicaid eligibility under the ACA. Hospital partnerships with postacute‐care facilities could also relieve bottlenecks in placement.[8] Chart review of the patients with MRSA septicemia and prolonged LOS indicated that development of an intensive outpatient parenteral antimicrobial therapy pathway with substance abuse counseling could provide an alternative to extended inpatient treatment for intravenous drug users with complicated infections.[15]
This study has several limitations. First, given the lack of consensus in the literature regarding the definition of a prolonged hospitalization, it is difficult to directly compare our results with existing studies.[8, 12, 13, 14] However, we believe LOS >21 days to be a meaningful cutoff for our cohort. Most demographic and clinical variables that were predictive at >21 days were also predictive at >14 and >30 days, which reassured us that the relationship between variables and prolonged LOS was stable at different thresholds. Second, our database did not allow us to fully adjust for baseline comorbidities or categorize the reasons for discharge delays. Finally, this was a single‐center program evaluation. Although this limits generalization to other institutions, we believe our approach may serve as a guide for others interested in reducing prolonged hospitalizations.
In summary, prolonged hospitalizations represent a potentially high‐yield target for LOS reduction efforts. Prolonged hospitalizations among medicine patients at our institution particularly affected Medicaid enrollees with complex hospital stays who were not discharged home. Further studies are needed to determine the specific reasons for unnecessary hospital days in this population.
Acknowledgements
The authors thank Essey Yirdaw for her contributions to the building and management of the database that informed this work.
Disclosure: M.E.A. conceived of the study concept and design and drafted the manuscript. J.J.G. assisted with the study design and made critical revisions to the final manuscript. D.A., R.P., and R.C. assisted with the study design and made critical revisions to the manuscript. C.D.J. assisted with the study design, performed data analyses, and made critical revisions to the manuscript. RC has disclosed that her time is funded by a National Institutes of Health grant unrelated to this study. A modified abstract was presented in poster format at the Society of Hospital Medicine Research, Innovations, and Vignettes Competition 2015 Annual Meeting, held March 29 April 1, 2015, in National Harbor, Maryland. The authors have no conflicts of interest to disclose.
- , , , et al. Excess hospitalization days in an academic medical center: perceptions of hospitalists and discharge planners. Am J Manag Care. 2011;17(2):e34–e42.
- , , A prospective study of reasons for prolonged hospitalizations on a general medicine teaching service. J Gen Intern Med. 2005;20(2):108–115.
- , , , et al. Adoption of electronic health records grows rapidly, but fewer than half of U.S. hospitals had at least a basic system in 2012. Health Aff (Millwood). 2013;32(8):1478–1485.
- , , , et al. Observation and inpatient status: clinical impact of the 2‐midnight rule. J Hosp Med. 2014;9(4):203–209.
- , , Impact of insurance expansion on hospital uncompensated care costs in 2014. Department of Health and Human Services Office of the Assistant Secretary for Planning and Evaluation. Available at: http://aspe.hhs.gov/health/reports/2014/uncompensatedcare/ib_uncompensatedcare.pdf. Accessed March 28, 2015.
- , , , Using real‐time demand capacity management to improve hospital‐wide patient flow. Jt Comm J Qual Patient Saf. 2011;37(5):217–227.
- , , , , , Natural history of late discharges from a general medical ward. J Hosp Med. 2009;4(4):226–233.
- , , , Addressing hospital length of stay outlier patients: a community‐wide approach. Adv Biosci Biotechol. 2014;5:188–196.
- , American medical home runs. Health Aff (Millwood). 2009;28(5):1317–1326.
- The hot spotters: can we lower medical costs by giving the neediest patients better care? New Yorker. January 2011:40–51.
- Institute of Medicine. Crossing the Quality Chasm. Washington, DC: National Academies Press; 2001.
- , , , et al. Excessively long hospital stays after trauma are not related to the severity of illness: let's aim to the right target! JAMA Surg. 2013;148(1):956–961.
- , , Extended length of stay after surgery: complications, inefficient practice, or sick patients? JAMA Surg. 2014;149(8):815–820.
- , , , , Nonmedical factors associated with prolonged hospital length of stay in an urban homebound population. J Hosp Med. 2012;7(2):73–78.
- , , , Safe and successful treatment of intravenous drug users with a peripherally inserted central catheter in an outpatient parenteral antibiotic treatment service. J Antimicrob Chemother. 2010;65(12):2641–2644.
Hospitalizations frequently last longer than warranted by medical necessity alone, due to inefficiencies within the US healthcare system.[1, 2] Discharge delays place patients at risk for hospital‐acquired complications and increase costs. With the growing emphasis on high‐value care, hospital length of stay (LOS) has emerged as a key metric for inpatient care and will remain a central focus of hospital‐based improvement initiatives for the foreseeable future.
Hospitals may find it difficult to identify the primary drivers of inpatient LOS in a dynamic and increasingly complex healthcare system. Multiple recent policy changes have affected inpatient care. The Health Information Technology for Economic and Clinical Health Act of 2009 has led to widespread adoption of electronic health records (EHRs) that have markedly impacted provider workflows.[3] In October 2013, the Centers for Medicare & Medicaid Services implemented the 2‐midnight rule, which reclassified lower acuity inpatients with an expected stay <48 hours to observation status.[4] In January 2014, expansion of insurance coverage under the Affordable Care Act (ACA) altered payer mix for hospitals nationwide.[5] At a local level, hospitals that are rapidly adjusting resource allocation, capital investments, and marketing efforts and making complex operational decisions (eg, to open new units or change admission or referral algorithms) may simultaneously experience shifts in patient volumes, case‐mix index, and staffing ratios with downstream effects on LOS.
Given the myriad factors influencing inpatient LOS, hospital leaders may encounter real challenges in designing effective LOS reduction strategies. For example, they may expend significant resources on real‐time demand‐capacity management systems to improve hospital‐wide patient flow, but the resultant emphasis on bed placement and early discharges may shave only hours off average LOS.[6, 7] An alternative approach may be to target the small percentage of patients with prolonged hospitalizations who contribute disproportionately to the average LOS, as other initiatives focused on high utilizers have done.[8, 9, 10]
Our institution noted an increase in the average inpatient LOS for general medicine patients from 2012 to 2014, prompting a call to action by hospital leaders. We sought to characterize the predictors of prolonged hospitalizations among medicine patients to guide future efforts aimed at mitigating the contribution of prolonged LOS to overall LOS.
METHODS
Study Design
We performed a retrospective analysis of medicine patients discharged between January 1, 2012 and December 31, 2014, from the University of Colorado Hospital, a 551‐bed urban, quaternary‐care academic medical center in Aurora, Colorado. Patients were included if they were admitted under inpatient status, 18 years of age, and discharged from 1 of our 10 medicine services: 7 services with residents, staffed by hospitalists, general internists, or subspecialists; and 3 services with advanced practice providers, staffed by hospitalists.
Data Collection
We obtained LOS, calendar year of discharge, demographic data, insurance type, discharge disposition, number of medications, consults, intensive care unit (ICU) stays, surgeries (ie, procedures requiring anesthesia), and primary diagnosis by International Classification of Diseases, Ninth Revision codes from an administrative database that had been developed, validated, and maintained by our hospital medicine group. This database was populated with variables from our EHR, which was implemented in September 2011; to minimize variability in data input during the EHR rollout, we excluded data from September 2011 through December 2011. The Colorado Multiple Institutional Review Board reviewed and exempted this database (protocol 13‐2953) as a program evaluation.
Outcomes
We defined a prolonged hospitalization or LOS as >21 days in duration. This represented approximately 2 standard deviations above the mean LOS in our cohort. This cutoff also helped to remove provider‐level variability, as each medicine service was staffed by 2 attendings per month, each working approximately 7 days on and 7 days off. We examined LOS >14 and >30 days in sensitivity analyses to ensure that the selection of >21 days did not impose an arbitrary and invalid limitation on our statistical analysis.
Statistical Analysis
Demographic and clinical data were compared in the group with LOS 21 days versus the group with LOS >21 days with a 2 test for dichotomous variables and Student t test for continuous variables. We then built a multivariable logistic regression model to predict LOS >21 days using the variables that were significantly different between groups in bivariate analyses. A two‐sided P value of <0.05 was considered statistically significant. All data analyses were performed using Stata 12.0 (StataCorp, College Station, TX).
RESULTS
We identified 18,363 inpatient discharges among 12,511 medicine patients between January 1, 2012 and December 31, 2014. Of these discharges, 416 (2.3%) demonstrated prolonged LOS. Prolonged hospitalizations accounted for 18.6% of total inpatient days. The average LOS during the study period was 4.8 days including patients with prolonged LOS and 4.0 days excluding patients with prolonged LOS, a contribution of 0.8 days.
Table 1 compares the characteristics of patients with and without prolonged LOS. Age, insurance, discharge disposition, palliative care consults, ICU stays, and surgeries were among the variables that differed significantly between the 2 groups. Among patients undergoing surgery, those with prolonged LOS were more likely to have surgery >24 hours after admission than those without prolonged LOS (85.7% vs 51.4%, P<0.001).
| Variable | LOS 21 Days, N=17,947 | LOS >21 Days, N=416 | P Value |
|---|---|---|---|
| |||
| Age, y, mean (SD) | 56.4 (18.7) | 54.4 (17.1) | 0.030 |
| Female | 9,256 (52%) | 199 (48%) | 0.132 |
| Year of discharge | <0.001 | ||
| 2012 | 5,486 (31%) | 69 (17%) | |
| 2013 | 6,193 (35%) | 162 (39%) | |
| 2014 | 6,268 (35%) | 185 (44%) | |
| Race/ethnicity | 0.003 | ||
| White non‐Hispanic | 9,702 (54%) | 242 (58%) | |
| Black non‐Hispanic | 4,000 (22%) | 68 (16%) | |
| Hispanic | 2,872(16%) | 67 (16%) | |
| Asian | 578 (3%) | 9 (2%) | |
| Other or unknown | 795 (4%) | 30 (7%) | |
| Language preference | 0.795 | ||
| English | 16,049 (89%) | 376 (90%) | |
| Spanish | 1,052 (6%) | 23 (6%) | |
| Other | 846 (5%) | 17 (4%) | |
| Insurance | <0.001 | ||
| Medicare | 5,462 (30%) | 109 (26%) | |
| Medicaid | 3,406 (19%) | 126 (30%) | |
| Dual | 2,815 (16%) | 64 (15%) | |
| Private | 2,714 (15%) | 60 (14%) | |
| Indigent/self‐pay | 2,829 (16%) | 42 (10%) | |
| Other | 721 (4%) | 15 (4%) | |
| Length of stay, d (SD) | 4.0 (3.5) | 39.5 (37.3) | <0.001 |
| Discharge disposition | <0.001 | ||
| Home with self‐care | 13,276 (74%) | 115 (28%) | |
| Home with home health | 1,584 (9%) | 79 (19%) | |
| Hospicehome or inpatient | 369 (2%) | 19 (5%) | |
| Postacute‐care facility or LTAC | 1,761 (10%) | 141 (34%) | |
| Expired | 113 (1%) | 18 (4%) | |
| Other | 844 (5%) | 44 (11%) | |
| No. of admission medications (SD) | 9.7 (7.4) | 10.9 (7.8) | 0.002 |
| Primary diagnosis by ICD‐9 code* | |||
| Sepsis, unspecified | 1,548 (9%) | 55 (13%) | 0.001 |
| Acute respiratory failure | 293 (2%) | 9 (2%) | 0.400 |
| MSSA septicemia | 36 (0.2%) | 8 (2%) | <0.001 |
| MRSA septicemia | 13 (0.1%) | 7 (2%) | <0.001 |
| Alcoholic cirrhosis of the liver | 111 (1%) | 7 (2%) | 0.007 |
| Palliative care consult | 398 (2%) | 64 (15%) | <0.001 |
| ICU stay | 2,030 (11%) | 246 (59%) | <0.001 |
| Surgical procedure | 1,800 (10%) | 182 (44%) | <0.001 |
Unspecified sepsis was the most frequent primary diagnosis, regardless of LOS category (Table 2). However, the second through fifth most frequent diagnoses differed for patients with and without prolonged LOS.
| N | % | |
|---|---|---|
| ||
| LOS 21 days | ||
| 1. Sepsis, unspecified | 1,548 | 8.6% |
| 2. Acute pancreatitis | 435 | 2.4% |
| 3. Pneumonia | 431 | 2.4% |
| 4. Acute kidney failure | 363 | 2.0% |
| 5. COPD exacerbation | 320 | 1.8% |
| LOS >21 days | ||
| 1. Sepsis, unspecified | 55 | 13.0% |
| 2. Acute respiratory failure | 9 | 2.2% |
| 3. Methicillin‐sensitive Staphylococcus aureus septicemia | 8 | 1.9% |
| 4. Methicillin‐resistant Staphylococcus aureus septicemia | 7 | 1.7% |
| 5. Alcoholic cirrhosis of the liver | 7 | 1.7% |
In an adjusted logistic regression model (Table 3), we found lower odds of prolonged LOS for each 10‐year increase in age and higher odds of prolonged LOS for Medicaid insurance, discharge to home with home health, discharge to a postacute‐care or long‐term acute‐care facility, and in‐hospital death. Methicillin‐resistant Staphylococcus aureus (MRSA) septicemia, palliative care consults, ICU stays, and surgeries were all also associated with increased odds of prolonged LOS. We identified a statistically significant interaction between ICU stay and surgical procedure (odds ratio: 2.53, 95% confidence interval: 1.51‐4.26, P<0.001).
| Outcome: LOS >21 Days | Odds Ratio | 95% CI | P Value |
|---|---|---|---|
| |||
| Age, per 10 years increase in age | 0.80 | 0.73‐0.87 | <0.001 |
| Year of discharge | |||
| 2012 | 0.47 | 0.34‐0.67 | <0.001 |
| 2013 | 1.10 | 0.84‐1.43 | 0.493 |
| 2014 | Ref | ||
| Race/ethnicity | |||
| White non‐Hispanic | Ref | ||
| Black non‐Hispanic | 0.89 | 0.64‐1.22 | 0.454 |
| Hispanic | 1.01 | 0.70‐1.46 | 0.952 |
| Asian | 0.85 | 0.40‐1.83 | 0.679 |
| Other or unknown | 1.29 | 0.73‐2.26 | 0.378 |
| Insurance | |||
| Medicare | Ref | ||
| Medicaid | 1.99 | 1.29‐3.05 | 0.002 |
| Dual | 1.06 | 0.72‐1.57 | 0.765 |
| Private | 1.13 | 0.70‐1.82 | 0.620 |
| Indigent/self‐pay | 1.66 | 0.95‐2.88 | 0.073 |
| Other | 0.96 | 0.47‐1.96 | 0.908 |
| Discharge disposition | |||
| Home with self‐care | Ref | ||
| Home with home health | 4.48 | 3.10‐6.48 | <0.001 |
| Hospicehome or inpatient | 2.11 | 0.98‐4.55 | 0.057 |
| Postacute‐care facility or LTAC | 10.37 | 6.92‐15.56 | <0.001 |
| Expired | 5.38 | 2.27‐12.75 | <0.001 |
| Other | 4.04 | 2.64‐6.18 | <0.001 |
| No. of admission medications | 1.00 | 0.99‐1.02 | 0.775 |
| Primary diagnosis by ICD‐9 code | |||
| Sepsis, unspecified | 1.11 | 0.78‐1.58 | 0.575 |
| MSSA septicemia | 2.44 | 0.68‐8.67 | 0.074 |
| MRSA septicemia | 8.83 | 1.72‐45.36 | 0.009 |
| Alcoholic cirrhosis of the liver | 1.25 | 0.43‐3.65 | 0.687 |
| Palliative care consult | 4.63 | 2.86‐7.49 | <0.001 |
| ICU stay | 6.66 | 5.22‐8.50 | <0.001 |
| Surgical procedure | 5.04 | 3.90‐6.52 | <0.001 |
Sensitivity analyses using LOS >14 and >30 days yielded similar results to LOS >21 days (see Supporting Appendix Table 1 in the online version of this article).
DISCUSSION
We found that a small proportion of medicine patients with prolonged hospitalizations contributed substantially to both total inpatient days and average inpatient LOS. Such disproportionate healthcare utilization is concerning in light of the Institute of Medicine's charge for health systems to deliver timely, efficient, and equitable care.[11]
Few studies in the United States have analyzed patient characteristics that predict prolonged LOS, and to our knowledge, none have evaluated prolonged LOS specifically in general medicine patients.[12, 13, 14] Among selected surgical populations, prolonged hospitalizations are most often related to placement difficulties, operational delays, and payer‐related issues, rather than severity of illness, baseline comorbidities, or in‐hospital complications.[12, 13] In our study, we found that patients with prolonged LOS were more likely to require a palliative care consult, ICU stay, or surgery, all proxies for disease severity. Patients with prolonged LOS were also more likely to undergo surgery >24 hours after admission than those without prolonged LOS, suggesting that the former were either too unstable to proceed directly to surgery or developed complications later during their hospitalization. Even after controlling for palliative care consults, ICU stays, and surgeries, placement at a postacute‐care facility was strongly associated with prolonged LOS. Patients with prolonged LOS were also more likely to have Medicaid compared to other insurance types.
Our findings have several potential implications for efforts aimed at decreasing the number of and length of prolonged hospitalizations. Although demographic and clinical factors such as Medicaid insurance, ICU stays, and surgeries are generally not modifiable, they could, particularly in combination, be used to trigger earlier and more intensive case management involvement. A streamlined insurance approval process for Medicaid pending inpatients could be beneficial, given the recent expansion of Medicaid eligibility under the ACA. Hospital partnerships with postacute‐care facilities could also relieve bottlenecks in placement.[8] Chart review of the patients with MRSA septicemia and prolonged LOS indicated that development of an intensive outpatient parenteral antimicrobial therapy pathway with substance abuse counseling could provide an alternative to extended inpatient treatment for intravenous drug users with complicated infections.[15]
This study has several limitations. First, given the lack of consensus in the literature regarding the definition of a prolonged hospitalization, it is difficult to directly compare our results with existing studies.[8, 12, 13, 14] However, we believe LOS >21 days to be a meaningful cutoff for our cohort. Most demographic and clinical variables that were predictive at >21 days were also predictive at >14 and >30 days, which reassured us that the relationship between variables and prolonged LOS was stable at different thresholds. Second, our database did not allow us to fully adjust for baseline comorbidities or categorize the reasons for discharge delays. Finally, this was a single‐center program evaluation. Although this limits generalization to other institutions, we believe our approach may serve as a guide for others interested in reducing prolonged hospitalizations.
In summary, prolonged hospitalizations represent a potentially high‐yield target for LOS reduction efforts. Prolonged hospitalizations among medicine patients at our institution particularly affected Medicaid enrollees with complex hospital stays who were not discharged home. Further studies are needed to determine the specific reasons for unnecessary hospital days in this population.
Acknowledgements
The authors thank Essey Yirdaw for her contributions to the building and management of the database that informed this work.
Disclosure: M.E.A. conceived of the study concept and design and drafted the manuscript. J.J.G. assisted with the study design and made critical revisions to the final manuscript. D.A., R.P., and R.C. assisted with the study design and made critical revisions to the manuscript. C.D.J. assisted with the study design, performed data analyses, and made critical revisions to the manuscript. RC has disclosed that her time is funded by a National Institutes of Health grant unrelated to this study. A modified abstract was presented in poster format at the Society of Hospital Medicine Research, Innovations, and Vignettes Competition 2015 Annual Meeting, held March 29 April 1, 2015, in National Harbor, Maryland. The authors have no conflicts of interest to disclose.
- , , , et al. Excess hospitalization days in an academic medical center: perceptions of hospitalists and discharge planners. Am J Manag Care. 2011;17(2):e34–e42.
- , , A prospective study of reasons for prolonged hospitalizations on a general medicine teaching service. J Gen Intern Med. 2005;20(2):108–115.
- , , , et al. Adoption of electronic health records grows rapidly, but fewer than half of U.S. hospitals had at least a basic system in 2012. Health Aff (Millwood). 2013;32(8):1478–1485.
- , , , et al. Observation and inpatient status: clinical impact of the 2‐midnight rule. J Hosp Med. 2014;9(4):203–209.
- , , Impact of insurance expansion on hospital uncompensated care costs in 2014. Department of Health and Human Services Office of the Assistant Secretary for Planning and Evaluation. Available at: http://aspe.hhs.gov/health/reports/2014/uncompensatedcare/ib_uncompensatedcare.pdf. Accessed March 28, 2015.
- , , , Using real‐time demand capacity management to improve hospital‐wide patient flow. Jt Comm J Qual Patient Saf. 2011;37(5):217–227.
- , , , , , Natural history of late discharges from a general medical ward. J Hosp Med. 2009;4(4):226–233.
- , , , Addressing hospital length of stay outlier patients: a community‐wide approach. Adv Biosci Biotechol. 2014;5:188–196.
- , American medical home runs. Health Aff (Millwood). 2009;28(5):1317–1326.
- The hot spotters: can we lower medical costs by giving the neediest patients better care? New Yorker. January 2011:40–51.
- Institute of Medicine. Crossing the Quality Chasm. Washington, DC: National Academies Press; 2001.
- , , , et al. Excessively long hospital stays after trauma are not related to the severity of illness: let's aim to the right target! JAMA Surg. 2013;148(1):956–961.
- , , Extended length of stay after surgery: complications, inefficient practice, or sick patients? JAMA Surg. 2014;149(8):815–820.
- , , , , Nonmedical factors associated with prolonged hospital length of stay in an urban homebound population. J Hosp Med. 2012;7(2):73–78.
- , , , Safe and successful treatment of intravenous drug users with a peripherally inserted central catheter in an outpatient parenteral antibiotic treatment service. J Antimicrob Chemother. 2010;65(12):2641–2644.