User login
Impact of a Safety Huddle–Based Intervention on Monitor Alarm Rates in Low-Acuity Pediatric Intensive Care Unit Patients
BACKGROUND
Physiologic monitors are intended to prevent cardiac and respiratory arrest by generating alarms to alert clinicians to signs of instability. To minimize the probability that monitors will miss signs of deterioration, alarm algorithms and default parameters are often set to maximize sensitivity while sacrificing specificity.1 As a result, monitors generate large numbers of nonactionable alarms—alarms that are either invalid and do not accurately represent the physiologic status of the patient or are valid but do not warrant clinical intervention.2 Prior research has demonstrated that the pediatric intensive care unit (PICU) is responsible for a higher proportion of alarms than pediatric wards3 and a large proportion of these alarms, 87% - 97%, are nonactionable.4-8 In national surveys of healthcare staff, respondents report that high alarm rates interrupt patient care and can lead clinicians to disable alarms entirely.9 Recent research has supported this, demonstrating that nurses who are exposed to higher numbers of alarms have slower response times to alarms.4,10 In an attempt to mitigate safety risks, the Joint Commission in 2012 issued recommendations for hospitals to (a) establish guidelines for tailoring alarm settings and limits for individual patients and (b) identify situations in which alarms are not clinically necessary.11
In order to address these recommendations within our PICU, we sought to evaluate the impact of a focused physiologic monitor alarm reduction intervention integrated into safety huddles. Safety huddles are brief, structured discussions among physicians, nurses, and other staff aiming to identify safety concerns.12 Huddles offer an appropriate forum for reviewing alarm data and identifying patients whose high alarm rates may necessitate safe tailoring of alarm limits. Pilot data demonstrating high alarm rates among low-acuity PICU patients led us to hypothesize that low-acuity, high-alarm PICU patients would be a safe and effective target for an alarm huddle-based intervention.
In this study, we aimed to measure the impact of a structured safety huddle review of low-acuity PICU patients with high rates of priority alarms who were randomized to intervention compared with other low-acuity, high-alarm, concurrent, and historical control patients in the PICU.
METHODS
Study Definitions
Priority alarm activation rate. We conceptualized priority alarms as any alarm for a clinical condition that requires a timely response to determine if intervention is necessary to save a patient’s life,4 yet little empirical data support its existence in the hospital. We operationally defined these alarms on the General Electric Solar physiologic monitoring devices as any potentially life-threatening events including lethal arrhythmias (asystole, ventricular tachycardia, and ventricular fibrillation) and alarms for vital signs (heart rate, respiratory rate, and oxygen saturation) outside of the set parameter limits. These alarms produced audible tones in the patient room and automatically sent text messages to the nurse’s phone and had the potential to contribute to alarm fatigue regardless of the nurse’s location.
High-alarm patients. High-alarm patients were those who had more than 40 priority alarms in the preceding 4 hours, representing the top 20% of alarm rates in the PICU according to prior quality improvement projects completed in our PICU.
Low-acuity patients. Prior to and during this study, patient acuity was determined using the OptiLink Patient Classification System (OptiLink Healthcare Management Systems, Inc.; Tigard, OR; www.optilinkhealthcare.com; see Appendix 1) for the PICU twice daily. Low-acuity patients comprised on average 16% of the PICU patients.
Setting and Subjects
This study was performed in the PICU at The Children’s Hospital of Philadelphia.
The PICU is made up of 3 separate wings: east, south, and west. Bed availability was the only factor determining patient placement on the east, south, or west wing; the physical bed location was not preferentially assigned based on diagnosis or disease severity. The east wing was the intervention unit where the huddles occurred.
The PICU is composed of 3 different geographical teams. Two of the teams are composed of 4 to 5 pediatric or emergency medicine residents, 1 fellow, and 1 attending covering the south and west wings. The third team, located on the east wing, is composed of 1 to 2 pediatric residents, 2 to 3 nurse practitioners, 1 fellow, and 1 attending. Bedside family-centered rounds are held at each patient room, with the bedside nurse participating by reading a nursing rounding script that includes vital signs, vascular access, continuous medications, and additional questions or concerns.
Control subjects were any monitored patients on any of the 3 wings of the PICU between April 1, 2015, and October 31, 2015. The control patients were in 2 categories: historical controls from April 1, 2015, to May 31, 2015, and concurrent controls from June 1, 2015, to October 31, 2015, who were located anywhere in the PICU. On each nonholiday weekday beginning June 1, 2015, we randomly selected up to 2 patients to receive the intervention. These were high-alarm, low-acuity patients on the east wing to be discussed in the daily morning huddle. If more than 2 high-alarm, low-acuity patients were eligible for intervention, they were randomly selected by using the RAND function in Microsoft Excel. The other low-acuity, high-alarm patients in the PICU were included as control patients. Patients were eligible for the study if they were present for the 4 hours prior to huddle and present past noon on the day of huddle. If patients met criteria as high-alarm, low-acuity patients on multiple days, they could be enrolled as intervention or control patients multiple times. Patients’ alarm rates were calculated by dividing the number of alarms by their length of stay to the minute. There was no adjustment made for patients enrolled more than once.
Human Subjects Protection
The Institutional Review Board of The Children’s Hospital of Philadelphia approved this study with a waiver of informed consent.
Alarm Capture
We used BedMasterEx (Excel Medical Electronics; Jupiter, FL, http://excel-medical.com/products/bedmaster-ex) software connected to the General Electric monitor network to measure alarm rates. The software captured, in near real time, every alarm that occurred on every monitor in the PICU. Alarm rates over the preceding 4 hours for all PICU patients were exported and summarized by alarm type and level as set by hospital policy (crisis, warning, advisory, and system warning). Crisis and warning alarms were included as they represented potential life-threatening events meeting the definition of priority alarms. Physicians used an order within the PICU admission order-set to order monitoring based on preset age parameters (see online Appendix 1 for default settings). Physician orders were required for nurses to change alarm parameters. Daily electrode changes to reduce false alarms were standard of care.
Primary Outcome
The primary outcome was the change in priority alarm activation rate (the number of priority alarms per day) from prehuddle period (24 hours before morning huddle) to posthuddle period (the 24 hours following morning huddle) for intervention cases as compared with controls.
Primary Intervention
The intervention consisted of integrating a short script to facilitate the discussion of the alarm data during existing safety huddle and rounding workflows. The discussion and subsequent workflow proceeded as follows: A member of the research team who was not involved in patient care brought an alarm data sheet for each randomly selected intervention patient on the east wing to each safety huddle. The huddles were attended by the outgoing night charge nurse, the day charge nurse, and all bedside nurses working on the east wing that day. The alarm data sheet provided to the charge nurse displayed data on the 1 to 2 alarm parameters (respiratory rate, heart rate, or pulse oximetry) that generated the highest number of alarms. The charge nurse listed the high-alarm patients by room number during huddle, and the alarm data sheet was given to the bedside nurse responsible for the patient to facilitate further scripted discussion during bedside rounds with patient-specific information to reduce the alarm rates of individual patients throughout the adjustment of physiologic monitor parameters (see Appendix 2 for sample data sheet and script).
Data Collection
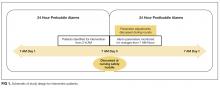
Intervention patients were high-alarm, low-acuity patients on the east wing from June 1, 2015, through October 31, 2015. Two months of baseline data were gathered prior to intervention on all 3 wings; therefore, control patients were high-alarm, low-acuity patients throughout the PICU from April 1, 2015, to May 31, 2015, as historical controls and from June 1, 2015, to October 31, 2015, as concurrent controls. Alarm rates for the 24 hours prior to huddle and the 24 hours following huddle were collected and analyzed. See Figure 1 for schematic of study design.
We collected data on patient characteristics, including patient location, age, sex, and intervention date. Information regarding changes to monitor alarm parameters for both intervention and control patients during the posthuddle period (the period following morning huddle until noon on intervention day) was also collected. We monitored for code blue events and unexpected changes in acuity until discharge or transfer out of the PICU.
Data Analysis
We compared the priority alarm activation rates of individual patients in the 24 hours before and the 24 hours after the huddle intervention and contrasted the differences in rates between intervention and control patients, both concurrent and historical controls. We also divided the intervention and control groups into 2 additional groups each—those patients whose alarm parameters were changed, compared with those whose parameters did not change. We evaluated for possible contamination by comparing alarm rates of historical and concurrent controls, as well as evaluating alarm rates by location. We used mixed-effects regression models to evaluate the effect of the intervention and control type (historical or concurrent) on alarm rates, adjusted for patient age and sex. Analysis was performed using Stata version 10.3 (StataCorp, LLC, College Station, TX) and SAS version 9.4 (SAS Institute Inc., Cary, NC).
RESULTS
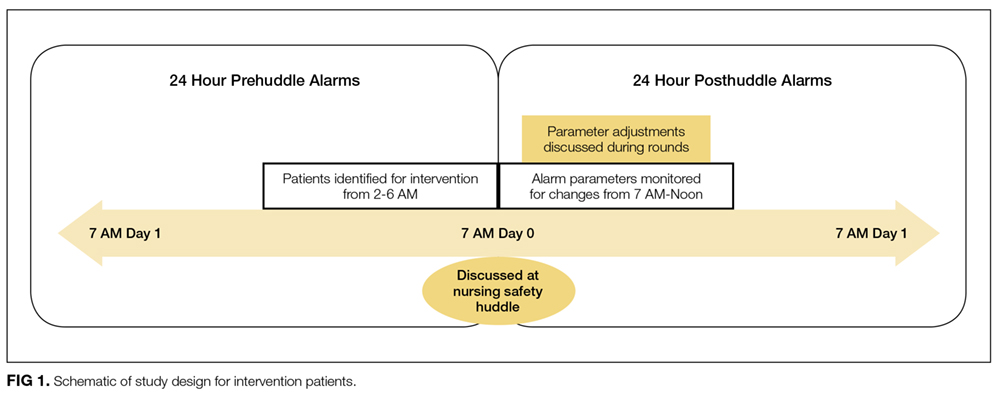
Because patients could be enrolled more than once, we refer to the instances when they were included in the study as “events” (huddle discussions for intervention patients and huddle opportunities for controls) below. We identified 49 historical control events between April 1, 2015, and May 31, 2015. During the intervention period, we identified 88 intervention events and 163 concurrent control events between June 1, 2015, and October 31, 2015 (total n = 300; see Table 1 for event characteristics). A total of 6 patients were enrolled more than once as either intervention or control patients.
UNADJUSTED ANALYSIS OF CHANGES IN ALARM RATES
The average priority alarm activation rate for intervention patients was 433 alarms (95% confidence interval [CI], 392-472) per day in the 24 hours leading up to the intervention and 223 alarms (95% CI, 182-265) per day in the 24 hours following the intervention, a 48.5% unadjusted decrease (95% CI, 38.1%-58.9%). In contrast, priority alarm activation rates for concurrent control patients averaged 412 alarms (95% CI, 383-442) per day in the 24 hours leading up to the morning huddle and 323 alarms (95% CI, 270-375) per day in the 24 hours following huddle, a 21.6% unadjusted decrease (95% CI, 15.3%-27.9%). For historical controls, priority alarm activation rates averaged 369 alarms (95% CI, 339-399) per day in the 24 hours leading up to the morning huddle and 242 alarms (95% CI, 164-320) per day in the 24 hours following huddle, a 34.4% unadjusted decrease (95% CI, 13.5%-55.0%). When we compared historical versus concurrent controls in the unadjusted analysis, concurrent controls had 37 more alarms per day (95% CI, 59 fewer to 134 more; P = 0.45) than historical controls. There was no significant difference between concurrent and historical controls, demonstrating no evidence of contamination.
Adjusted Analysis of Changes in Alarm Rates
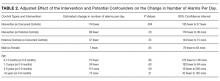
The overall estimate of the effect of the intervention adjusted for age and sex compared with concurrent controls was a reduction of 116 priority alarms per day (95% CI, 37-194; P = 0.004, Table 2). The adjusted percent decrease was 29.0% (95% CI, 12.1%-46.0%). There were no unexpected changes in patient acuity or code blue events related to the intervention.
Fidelity Analysis
We tracked changes in alarm parameter settings for evidence of intervention fidelity to determine if the team carried out the recommendations made. We found that 42% of intervention patients and 24% of combined control patients had alarm parameters changed during the posthuddle period (P = 0.002).
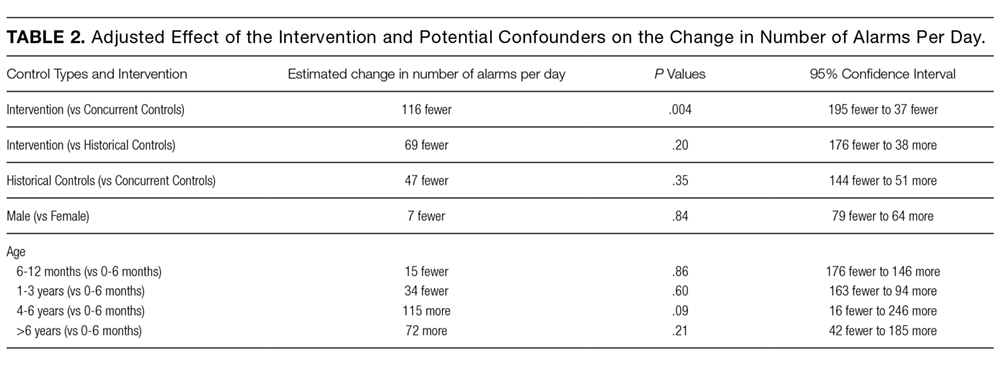
For those intervention patients who had parameters changed during the posthuddle period (N = 37), the mean effect was greater at a 54.9% decrease (95% CI, 38.8%-70.8%) in priority alarms as compared with control patients who had parameters adjusted during the posthuddle period (n = 50), having a mean decrease of only 12.2% (95% CI, –18.1%-42.3%). There was a 43.2% decrease (95% CI, 29.3%-57.0%) for intervention patients who were discussed but did not have parameters adjusted during the time window of observation (n = 51), as compared with combined control patients who did not have parameters adjusted (N = 162) who had a 28.1% decrease (95% CI, 16.8%-39.1%); see Figure 2.
This study is the first to demonstrate a successful and safe intervention to reduce the alarm rates of PICU patients. In addition, we observed a more significant reduction in priority alarm activation rates for intervention patients who had their alarm parameters changed during the monitored time period, leading us to hypothesize that providing patient-specific data regarding types of alarms was a key component of the intervention.
In control patients, we observed a reduction in alarm rates over time as well. There are 2 potential explanations for this. First, it is possible that as patients stabilize in the PICU, their vital signs become less extreme and generate fewer alarms even if the alarm parameters are not changed. The second is that parameters were changed within or outside of the time windows during which we evaluated for alarm parameter changes. Nevertheless, the decline over time observed in the intervention patients was greater than in both control groups. This change was even more noticeable in the intervention patients who had their alarm parameters changed during the posthuddle period as compared with controls who had their alarm parameters changed following the posthuddle period. This may have been due to the data provided during the huddle intervention, pointing the team to the cause of the high alarm rate.
Prior successful research regarding reduction of pediatric alarms has often shown decreased use of physiological monitors as 1 approach to reducing unnecessary alarms. The single prior pediatric alarm intervention study conducted on a pediatric ward involved instituting a cardiac monitor care process that included the ordering of age-based parameters, daily replacement of electrodes, individualized assessment of parameters, and a reliable method to discontinue monitoring.13 Because most patients in the PICU are critically ill, the reliance on monitor discontinuation as a main approach to decreasing alarms is not feasible in this setting. Instead, the use of targeted alarm parameter adjustments for low-acuity patients demonstrated a safe and feasible approach to decreasing alarms in PICU patients. The daily electrode change and age-based parameters were already in place at our institution.
There are a few limitations to this study. First, we focused only on low-acuity PICU patients. We believe that focusing on low-acuity patients allows for reduction in nonactionable alarms with limited potential for adverse events; however, this approach excludes many critically ill patients who might be at highest risk for harm from alarm fatigue if important alarms are ignored. Second, many of our patients were not present for the full 24 hours pre- and posthuddle due to their low acuity limiting our ability to follow alarm rates over time. Third, changes in alarm parameters were only monitored for a set period of 5 hours following the huddle to determine the effect of the recommended rounding script on changes to alarms. It is possible the changes to alarm parameters outside of the observed posthuddle period affected the alarm rates of both intervention and control patients. Lastly, the balancing metrics of unexpected changes in OptiLink status and code blue events are rare events, and therefore we may have been underpowered to find them. The effects of the huddle intervention on safety huddle length and rounding length were not measured.
CONCLUSION
Integrating a data-driven monitor alarm discussion into safety huddles was a safe and effective approach to reduce alarms in low-acuity, high-alarm PICU patients. Innovative approaches to make data-driven alarm decisions using informatics tools integrated into monitoring systems and electronic health records have the potential to facilitate cost-effective spread of this intervention.
Disclosure
This work was supported by a pilot grant from the Center for Pediatric Clinical Effectiveness, The Children’s Hospital of Philadelphia. Dr. Bonafide is supported by a Mentored Patient-Oriented Research Career Development Award from the National Heart, Lung, and Blood Institute of the National Institutes of Health under Award Number K23HL116427. The content is solely the responsibility of the authors and does not necessarily represent the official views of the funding organizations or employers. The funding organizations had no role in the design, preparation, review, or approval of this paper, nor the decision to submit for publication.
1. Drew BJ, Califf RM, Funk M, et al. Practice standards for electrocardiographic monitoring in hospital settings: An American Heart Association scientific statement from the councils on cardiovascular nursing, clinical cardiology, and cardiovascular disease in the young. Circulation. 2004;110(17):2721-2746; DOI:10.1161/01.CIR.0000145144.56673.59. PubMed
2. Paine CW, Goel V V, Ely E, et al. Systematic Review of Physiologic Monitor Alarm Characteristics and Pragmatic Interventions to Reduce Alarm Frequency. J Hosp Med. 2016;11(2):136-144; DOI:10.1002/jhm.2520. PubMed
3. Schondelmeyer AC, Bonafide CP, Goel V V, et al. The frequency of physiologic monitor alarms in a children’s hospital. J Hosp Med. 2016;11(11):796-798; DOI:10.1002/jhm.2612. PubMed
4. Bonafide CP, Lin R, Zander M, et al. Association between exposure to nonactionable physiologic monitor alarms and response time in a children’s hospital. J Hosp Med. 2015;10(6):345-351; DOI:10.1002/jhm.2331. PubMed
5. Lawless ST. Crying wolf: false alarms in a pediatric intensive care unit. Crit Care Med. 1994;22(6):981-985; DOI:10.1016/0025-326X(92)90542-E. PubMed
6. Tsien CL, Fackler JC. Poor prognosis for existing monitors in the intensive care unit. Crit Care Med. 1997;25(4):614-619 DOI:10.1097/00003246-199704000-00010. PubMed
7. Talley LB, Hooper J, Jacobs B, et al. Cardiopulmonary monitors and clinically significant events in critically ill children. Biomed Instrum Technol. 2011;45(SPRING):38-45; DOI:10.2345/0899-8205-45.s1.38. PubMed
8. Rosman EC, Blaufox AD, Menco A, Trope R, Seiden HS. What are we missing? Arrhythmia detection in the pediatric intensive care unit. J Pediatr. 2013;163(2):511-514; DOI:10.1016/j.jpeds.2013.01.053. PubMed
9. Korniewicz DM, Clark T, David Y. A national online survey on the effectiveness of clinical alarms. Am J Crit Care. 2008;17(1):36-41; DOI:17/1/36 [pii]. PubMed
10. Voepel-Lewis T, Parker ML, Burke CN, et al. Pulse oximetry desaturation alarms on a general postoperative adult unit: A prospective observational study of nurse response time. Int J Nurs Stud. 2013;50(10):1351-1358; DOI:10.1016/j.ijnurstu.2013.02.006. PubMed
11. Joint Commission on Accreditation of Healthcare Organizations. Medical device alarm safety in hospitals. Sentin Event Alert. 2012:1-3. PubMed
12. Goldenhar LM, Brady PW, Sutcliffe KM, Muething SE, Anderson JM. Huddling for high reliability and situation awareness. BMJ Qual Saf. 2013;22:899-906; DOI:10.1136/bmjqs-2012-001467. PubMed
13. Dandoy CE, Davies SM, Flesch L, et al. A Team-Based Approach to Reducing Cardiac Monitor Alarms. Pediatrics. 2014;134(6):E1686-E1694. DOI: 10.1542/peds.2014-1162. PubMed
BACKGROUND
Physiologic monitors are intended to prevent cardiac and respiratory arrest by generating alarms to alert clinicians to signs of instability. To minimize the probability that monitors will miss signs of deterioration, alarm algorithms and default parameters are often set to maximize sensitivity while sacrificing specificity.1 As a result, monitors generate large numbers of nonactionable alarms—alarms that are either invalid and do not accurately represent the physiologic status of the patient or are valid but do not warrant clinical intervention.2 Prior research has demonstrated that the pediatric intensive care unit (PICU) is responsible for a higher proportion of alarms than pediatric wards3 and a large proportion of these alarms, 87% - 97%, are nonactionable.4-8 In national surveys of healthcare staff, respondents report that high alarm rates interrupt patient care and can lead clinicians to disable alarms entirely.9 Recent research has supported this, demonstrating that nurses who are exposed to higher numbers of alarms have slower response times to alarms.4,10 In an attempt to mitigate safety risks, the Joint Commission in 2012 issued recommendations for hospitals to (a) establish guidelines for tailoring alarm settings and limits for individual patients and (b) identify situations in which alarms are not clinically necessary.11
In order to address these recommendations within our PICU, we sought to evaluate the impact of a focused physiologic monitor alarm reduction intervention integrated into safety huddles. Safety huddles are brief, structured discussions among physicians, nurses, and other staff aiming to identify safety concerns.12 Huddles offer an appropriate forum for reviewing alarm data and identifying patients whose high alarm rates may necessitate safe tailoring of alarm limits. Pilot data demonstrating high alarm rates among low-acuity PICU patients led us to hypothesize that low-acuity, high-alarm PICU patients would be a safe and effective target for an alarm huddle-based intervention.
In this study, we aimed to measure the impact of a structured safety huddle review of low-acuity PICU patients with high rates of priority alarms who were randomized to intervention compared with other low-acuity, high-alarm, concurrent, and historical control patients in the PICU.
METHODS
Study Definitions
Priority alarm activation rate. We conceptualized priority alarms as any alarm for a clinical condition that requires a timely response to determine if intervention is necessary to save a patient’s life,4 yet little empirical data support its existence in the hospital. We operationally defined these alarms on the General Electric Solar physiologic monitoring devices as any potentially life-threatening events including lethal arrhythmias (asystole, ventricular tachycardia, and ventricular fibrillation) and alarms for vital signs (heart rate, respiratory rate, and oxygen saturation) outside of the set parameter limits. These alarms produced audible tones in the patient room and automatically sent text messages to the nurse’s phone and had the potential to contribute to alarm fatigue regardless of the nurse’s location.
High-alarm patients. High-alarm patients were those who had more than 40 priority alarms in the preceding 4 hours, representing the top 20% of alarm rates in the PICU according to prior quality improvement projects completed in our PICU.
Low-acuity patients. Prior to and during this study, patient acuity was determined using the OptiLink Patient Classification System (OptiLink Healthcare Management Systems, Inc.; Tigard, OR; www.optilinkhealthcare.com; see Appendix 1) for the PICU twice daily. Low-acuity patients comprised on average 16% of the PICU patients.
Setting and Subjects
This study was performed in the PICU at The Children’s Hospital of Philadelphia.
The PICU is made up of 3 separate wings: east, south, and west. Bed availability was the only factor determining patient placement on the east, south, or west wing; the physical bed location was not preferentially assigned based on diagnosis or disease severity. The east wing was the intervention unit where the huddles occurred.
The PICU is composed of 3 different geographical teams. Two of the teams are composed of 4 to 5 pediatric or emergency medicine residents, 1 fellow, and 1 attending covering the south and west wings. The third team, located on the east wing, is composed of 1 to 2 pediatric residents, 2 to 3 nurse practitioners, 1 fellow, and 1 attending. Bedside family-centered rounds are held at each patient room, with the bedside nurse participating by reading a nursing rounding script that includes vital signs, vascular access, continuous medications, and additional questions or concerns.
Control subjects were any monitored patients on any of the 3 wings of the PICU between April 1, 2015, and October 31, 2015. The control patients were in 2 categories: historical controls from April 1, 2015, to May 31, 2015, and concurrent controls from June 1, 2015, to October 31, 2015, who were located anywhere in the PICU. On each nonholiday weekday beginning June 1, 2015, we randomly selected up to 2 patients to receive the intervention. These were high-alarm, low-acuity patients on the east wing to be discussed in the daily morning huddle. If more than 2 high-alarm, low-acuity patients were eligible for intervention, they were randomly selected by using the RAND function in Microsoft Excel. The other low-acuity, high-alarm patients in the PICU were included as control patients. Patients were eligible for the study if they were present for the 4 hours prior to huddle and present past noon on the day of huddle. If patients met criteria as high-alarm, low-acuity patients on multiple days, they could be enrolled as intervention or control patients multiple times. Patients’ alarm rates were calculated by dividing the number of alarms by their length of stay to the minute. There was no adjustment made for patients enrolled more than once.
Human Subjects Protection
The Institutional Review Board of The Children’s Hospital of Philadelphia approved this study with a waiver of informed consent.
Alarm Capture
We used BedMasterEx (Excel Medical Electronics; Jupiter, FL, http://excel-medical.com/products/bedmaster-ex) software connected to the General Electric monitor network to measure alarm rates. The software captured, in near real time, every alarm that occurred on every monitor in the PICU. Alarm rates over the preceding 4 hours for all PICU patients were exported and summarized by alarm type and level as set by hospital policy (crisis, warning, advisory, and system warning). Crisis and warning alarms were included as they represented potential life-threatening events meeting the definition of priority alarms. Physicians used an order within the PICU admission order-set to order monitoring based on preset age parameters (see online Appendix 1 for default settings). Physician orders were required for nurses to change alarm parameters. Daily electrode changes to reduce false alarms were standard of care.
Primary Outcome
The primary outcome was the change in priority alarm activation rate (the number of priority alarms per day) from prehuddle period (24 hours before morning huddle) to posthuddle period (the 24 hours following morning huddle) for intervention cases as compared with controls.
Primary Intervention
The intervention consisted of integrating a short script to facilitate the discussion of the alarm data during existing safety huddle and rounding workflows. The discussion and subsequent workflow proceeded as follows: A member of the research team who was not involved in patient care brought an alarm data sheet for each randomly selected intervention patient on the east wing to each safety huddle. The huddles were attended by the outgoing night charge nurse, the day charge nurse, and all bedside nurses working on the east wing that day. The alarm data sheet provided to the charge nurse displayed data on the 1 to 2 alarm parameters (respiratory rate, heart rate, or pulse oximetry) that generated the highest number of alarms. The charge nurse listed the high-alarm patients by room number during huddle, and the alarm data sheet was given to the bedside nurse responsible for the patient to facilitate further scripted discussion during bedside rounds with patient-specific information to reduce the alarm rates of individual patients throughout the adjustment of physiologic monitor parameters (see Appendix 2 for sample data sheet and script).
Data Collection
Intervention patients were high-alarm, low-acuity patients on the east wing from June 1, 2015, through October 31, 2015. Two months of baseline data were gathered prior to intervention on all 3 wings; therefore, control patients were high-alarm, low-acuity patients throughout the PICU from April 1, 2015, to May 31, 2015, as historical controls and from June 1, 2015, to October 31, 2015, as concurrent controls. Alarm rates for the 24 hours prior to huddle and the 24 hours following huddle were collected and analyzed. See Figure 1 for schematic of study design.
We collected data on patient characteristics, including patient location, age, sex, and intervention date. Information regarding changes to monitor alarm parameters for both intervention and control patients during the posthuddle period (the period following morning huddle until noon on intervention day) was also collected. We monitored for code blue events and unexpected changes in acuity until discharge or transfer out of the PICU.
Data Analysis
We compared the priority alarm activation rates of individual patients in the 24 hours before and the 24 hours after the huddle intervention and contrasted the differences in rates between intervention and control patients, both concurrent and historical controls. We also divided the intervention and control groups into 2 additional groups each—those patients whose alarm parameters were changed, compared with those whose parameters did not change. We evaluated for possible contamination by comparing alarm rates of historical and concurrent controls, as well as evaluating alarm rates by location. We used mixed-effects regression models to evaluate the effect of the intervention and control type (historical or concurrent) on alarm rates, adjusted for patient age and sex. Analysis was performed using Stata version 10.3 (StataCorp, LLC, College Station, TX) and SAS version 9.4 (SAS Institute Inc., Cary, NC).
RESULTS
Because patients could be enrolled more than once, we refer to the instances when they were included in the study as “events” (huddle discussions for intervention patients and huddle opportunities for controls) below. We identified 49 historical control events between April 1, 2015, and May 31, 2015. During the intervention period, we identified 88 intervention events and 163 concurrent control events between June 1, 2015, and October 31, 2015 (total n = 300; see Table 1 for event characteristics). A total of 6 patients were enrolled more than once as either intervention or control patients.
UNADJUSTED ANALYSIS OF CHANGES IN ALARM RATES
The average priority alarm activation rate for intervention patients was 433 alarms (95% confidence interval [CI], 392-472) per day in the 24 hours leading up to the intervention and 223 alarms (95% CI, 182-265) per day in the 24 hours following the intervention, a 48.5% unadjusted decrease (95% CI, 38.1%-58.9%). In contrast, priority alarm activation rates for concurrent control patients averaged 412 alarms (95% CI, 383-442) per day in the 24 hours leading up to the morning huddle and 323 alarms (95% CI, 270-375) per day in the 24 hours following huddle, a 21.6% unadjusted decrease (95% CI, 15.3%-27.9%). For historical controls, priority alarm activation rates averaged 369 alarms (95% CI, 339-399) per day in the 24 hours leading up to the morning huddle and 242 alarms (95% CI, 164-320) per day in the 24 hours following huddle, a 34.4% unadjusted decrease (95% CI, 13.5%-55.0%). When we compared historical versus concurrent controls in the unadjusted analysis, concurrent controls had 37 more alarms per day (95% CI, 59 fewer to 134 more; P = 0.45) than historical controls. There was no significant difference between concurrent and historical controls, demonstrating no evidence of contamination.
Adjusted Analysis of Changes in Alarm Rates
The overall estimate of the effect of the intervention adjusted for age and sex compared with concurrent controls was a reduction of 116 priority alarms per day (95% CI, 37-194; P = 0.004, Table 2). The adjusted percent decrease was 29.0% (95% CI, 12.1%-46.0%). There were no unexpected changes in patient acuity or code blue events related to the intervention.
Fidelity Analysis
We tracked changes in alarm parameter settings for evidence of intervention fidelity to determine if the team carried out the recommendations made. We found that 42% of intervention patients and 24% of combined control patients had alarm parameters changed during the posthuddle period (P = 0.002).
For those intervention patients who had parameters changed during the posthuddle period (N = 37), the mean effect was greater at a 54.9% decrease (95% CI, 38.8%-70.8%) in priority alarms as compared with control patients who had parameters adjusted during the posthuddle period (n = 50), having a mean decrease of only 12.2% (95% CI, –18.1%-42.3%). There was a 43.2% decrease (95% CI, 29.3%-57.0%) for intervention patients who were discussed but did not have parameters adjusted during the time window of observation (n = 51), as compared with combined control patients who did not have parameters adjusted (N = 162) who had a 28.1% decrease (95% CI, 16.8%-39.1%); see Figure 2.
This study is the first to demonstrate a successful and safe intervention to reduce the alarm rates of PICU patients. In addition, we observed a more significant reduction in priority alarm activation rates for intervention patients who had their alarm parameters changed during the monitored time period, leading us to hypothesize that providing patient-specific data regarding types of alarms was a key component of the intervention.
In control patients, we observed a reduction in alarm rates over time as well. There are 2 potential explanations for this. First, it is possible that as patients stabilize in the PICU, their vital signs become less extreme and generate fewer alarms even if the alarm parameters are not changed. The second is that parameters were changed within or outside of the time windows during which we evaluated for alarm parameter changes. Nevertheless, the decline over time observed in the intervention patients was greater than in both control groups. This change was even more noticeable in the intervention patients who had their alarm parameters changed during the posthuddle period as compared with controls who had their alarm parameters changed following the posthuddle period. This may have been due to the data provided during the huddle intervention, pointing the team to the cause of the high alarm rate.
Prior successful research regarding reduction of pediatric alarms has often shown decreased use of physiological monitors as 1 approach to reducing unnecessary alarms. The single prior pediatric alarm intervention study conducted on a pediatric ward involved instituting a cardiac monitor care process that included the ordering of age-based parameters, daily replacement of electrodes, individualized assessment of parameters, and a reliable method to discontinue monitoring.13 Because most patients in the PICU are critically ill, the reliance on monitor discontinuation as a main approach to decreasing alarms is not feasible in this setting. Instead, the use of targeted alarm parameter adjustments for low-acuity patients demonstrated a safe and feasible approach to decreasing alarms in PICU patients. The daily electrode change and age-based parameters were already in place at our institution.
There are a few limitations to this study. First, we focused only on low-acuity PICU patients. We believe that focusing on low-acuity patients allows for reduction in nonactionable alarms with limited potential for adverse events; however, this approach excludes many critically ill patients who might be at highest risk for harm from alarm fatigue if important alarms are ignored. Second, many of our patients were not present for the full 24 hours pre- and posthuddle due to their low acuity limiting our ability to follow alarm rates over time. Third, changes in alarm parameters were only monitored for a set period of 5 hours following the huddle to determine the effect of the recommended rounding script on changes to alarms. It is possible the changes to alarm parameters outside of the observed posthuddle period affected the alarm rates of both intervention and control patients. Lastly, the balancing metrics of unexpected changes in OptiLink status and code blue events are rare events, and therefore we may have been underpowered to find them. The effects of the huddle intervention on safety huddle length and rounding length were not measured.
CONCLUSION
Integrating a data-driven monitor alarm discussion into safety huddles was a safe and effective approach to reduce alarms in low-acuity, high-alarm PICU patients. Innovative approaches to make data-driven alarm decisions using informatics tools integrated into monitoring systems and electronic health records have the potential to facilitate cost-effective spread of this intervention.
Disclosure
This work was supported by a pilot grant from the Center for Pediatric Clinical Effectiveness, The Children’s Hospital of Philadelphia. Dr. Bonafide is supported by a Mentored Patient-Oriented Research Career Development Award from the National Heart, Lung, and Blood Institute of the National Institutes of Health under Award Number K23HL116427. The content is solely the responsibility of the authors and does not necessarily represent the official views of the funding organizations or employers. The funding organizations had no role in the design, preparation, review, or approval of this paper, nor the decision to submit for publication.
1. Drew BJ, Califf RM, Funk M, et al. Practice standards for electrocardiographic monitoring in hospital settings: An American Heart Association scientific statement from the councils on cardiovascular nursing, clinical cardiology, and cardiovascular disease in the young. Circulation. 2004;110(17):2721-2746; DOI:10.1161/01.CIR.0000145144.56673.59. PubMed
2. Paine CW, Goel V V, Ely E, et al. Systematic Review of Physiologic Monitor Alarm Characteristics and Pragmatic Interventions to Reduce Alarm Frequency. J Hosp Med. 2016;11(2):136-144; DOI:10.1002/jhm.2520. PubMed
3. Schondelmeyer AC, Bonafide CP, Goel V V, et al. The frequency of physiologic monitor alarms in a children’s hospital. J Hosp Med. 2016;11(11):796-798; DOI:10.1002/jhm.2612. PubMed
4. Bonafide CP, Lin R, Zander M, et al. Association between exposure to nonactionable physiologic monitor alarms and response time in a children’s hospital. J Hosp Med. 2015;10(6):345-351; DOI:10.1002/jhm.2331. PubMed
5. Lawless ST. Crying wolf: false alarms in a pediatric intensive care unit. Crit Care Med. 1994;22(6):981-985; DOI:10.1016/0025-326X(92)90542-E. PubMed
6. Tsien CL, Fackler JC. Poor prognosis for existing monitors in the intensive care unit. Crit Care Med. 1997;25(4):614-619 DOI:10.1097/00003246-199704000-00010. PubMed
7. Talley LB, Hooper J, Jacobs B, et al. Cardiopulmonary monitors and clinically significant events in critically ill children. Biomed Instrum Technol. 2011;45(SPRING):38-45; DOI:10.2345/0899-8205-45.s1.38. PubMed
8. Rosman EC, Blaufox AD, Menco A, Trope R, Seiden HS. What are we missing? Arrhythmia detection in the pediatric intensive care unit. J Pediatr. 2013;163(2):511-514; DOI:10.1016/j.jpeds.2013.01.053. PubMed
9. Korniewicz DM, Clark T, David Y. A national online survey on the effectiveness of clinical alarms. Am J Crit Care. 2008;17(1):36-41; DOI:17/1/36 [pii]. PubMed
10. Voepel-Lewis T, Parker ML, Burke CN, et al. Pulse oximetry desaturation alarms on a general postoperative adult unit: A prospective observational study of nurse response time. Int J Nurs Stud. 2013;50(10):1351-1358; DOI:10.1016/j.ijnurstu.2013.02.006. PubMed
11. Joint Commission on Accreditation of Healthcare Organizations. Medical device alarm safety in hospitals. Sentin Event Alert. 2012:1-3. PubMed
12. Goldenhar LM, Brady PW, Sutcliffe KM, Muething SE, Anderson JM. Huddling for high reliability and situation awareness. BMJ Qual Saf. 2013;22:899-906; DOI:10.1136/bmjqs-2012-001467. PubMed
13. Dandoy CE, Davies SM, Flesch L, et al. A Team-Based Approach to Reducing Cardiac Monitor Alarms. Pediatrics. 2014;134(6):E1686-E1694. DOI: 10.1542/peds.2014-1162. PubMed
© 2017 Society of Hospital Medicine
Monitor Alarms and Response Time
Hospital physiologic monitors can alert clinicians to early signs of physiologic deterioration, and thus have great potential to save lives. However, monitors generate frequent alarms,[1, 2, 3, 4, 5, 6, 7, 8] and most are not relevant to the patient's safety (over 90% of pediatric intensive care unit (PICU)[1, 2] and over 70% of adult intensive care alarms).[5, 6] In psychology experiments, humans rapidly learn to ignore or respond more slowly to alarms when exposed to high false‐alarm rates, exhibiting alarm fatigue.[9, 10] In 2013, The Joint Commission named alarm fatigue the most common contributing factor to alarm‐related sentinel events in hospitals.[11, 12]
Although alarm fatigue has been implicated as a major threat to patient safety, little empirical data support its existence in hospitals. In this study, we aimed to determine if there was an association between nurses' recent exposure to nonactionable physiologic monitor alarms and their response time to future alarms for the same patients. This exploratory work was designed to inform future research in this area, acknowledging that the sample size would be too small for multivariable modeling.
METHODS
Study Definitions
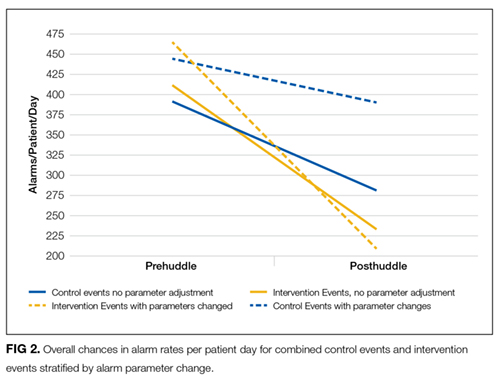
The alarm classification scheme is shown in Figure 1. Note that, for clarity, we have intentionally avoided using the terms true and false alarms because their interpretations vary across studies and can be misleading.
Potentially Critical Alarm
A potentially critical alarm is any alarm for a clinical condition for which a timely response is important to determine if the alarm requires intervention to save the patient's life. This is based on the alarm type alone, including alarms for life‐threatening arrhythmias such as asystole and ventricular tachycardia, as well as alarms for vital signs outside the set limits. Supporting Table 1 in the online version of this article lists the breakdown of alarm types that we defined a priori as potentially and not potentially critical.
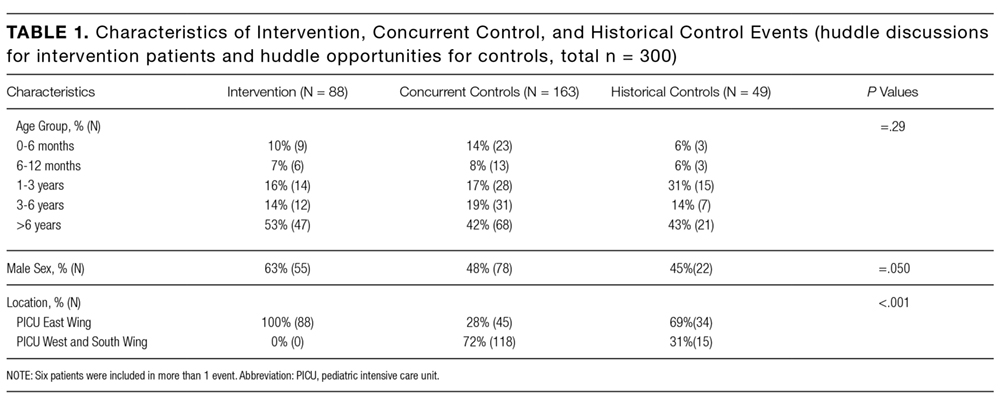
| PICU | Ward | |||||||
|---|---|---|---|---|---|---|---|---|
| Alarm type | No. | % of Total | % Valid | % Actionable | No. | % of Total | % Valid | % Actionable |
| ||||||||
| Oxygen saturation | 197 | 19.4 | 82.7 | 38.6 | 590 | 41.2 | 24.4 | 1.9 |
| Heart rate | 194 | 19.1 | 95.4 | 1.0 | 266 | 18.6 | 87.2 | 0.0 |
| Respiratory rate | 229 | 22.6 | 80.8 | 13.5 | 316 | 22.1 | 48.1 | 1.0 |
| Blood pressure | 259 | 25.5 | 83.8 | 5.8 | 11 | 0.8 | 72.7 | 0.0 |
| Critical arrhythmia | 1 | 0.1 | 0.0 | 0.0 | 4 | 0.3 | 0.0 | 0.0 |
| Noncritical arrhythmia | 71 | 7.0 | 2.8 | 0.0 | 244 | 17.1 | 8.6 | 0.0 |
| Central venous pressure | 49 | 4.8 | 0.0 | 0.0 | 0 | 0.0 | N/A | N/A |
| Exhaled carbon dioxide | 14 | 1.4 | 92.9 | 50.0 | 0 | 0.0 | N/A | N/A |
| Total | 1014 | 100.0 | 75.6 | 12.9 | 1,431 | 100.0 | 38.9 | 1.0 |
Valid Alarm
A valid alarm is any alarm that correctly identifies the physiologic status of the patient. Validity was based on waveform quality, lead signal strength indicators, and artifact conditions, referencing each monitor's operator's manual.
Actionable Alarm
An actionable alarm is any valid alarm for a clinical condition that either: (1) leads to a clinical intervention; (2) leads to a consultation with another clinician at the bedside (and thus visible on camera); or (3) is a situation that should have led to intervention or consultation, but the alarm was unwitnessed or misinterpreted by the staff at the bedside.
Nonactionable Alarm
An unactionable alarm is any alarm that does not meet the actionable definition above, including invalid alarms such as those caused by motion artifact, equipment/technical alarms, and alarms that are valid but nonactionable (nuisance alarms).[13]
Response Time
The response time is the time elapsed from when the alarm fired at the bedside to when the nurse entered the room or peered through a window or door, measured in seconds.
Setting and Subjects
We performed this study between August 2012 and July 2013 at a freestanding children's hospital. We evaluated nurses caring for 2 populations: (1) PICU patients with heart and/or lung failure (requiring inotropic support and/or invasive mechanical ventilation), and (2) medical patients on a general inpatient ward. Nurses caring for heart and/or lung failure patients in the PICU typically were assigned 1 to 2 total patients. Nurses on the medical ward typically were assigned 2 to 4 patients. We identified subjects from the population of nurses caring for eligible patients with parents available to provide in‐person consent in each setting. Our primary interest was to evaluate the association between nonactionable alarms and response time, and not to study the epidemiology of alarms in a random sample. Therefore, when alarm data were available prior to screening, we first approached nurses caring for patients in the top 25% of alarm rates for that unit over the preceding 4 hours. We identified preceding alarm rates using BedMasterEx (Excel Medical Electronics, Jupiter, FL).
Human Subjects Protection
This study was approved by the institutional review board of The Children's Hospital of Philadelphia. We obtained written in‐person consent from the patient's parent and the nurse subject. We obtained a Certificate of Confidentiality from the National Institutes of Health to further protect study participants.[14]
Monitoring Equipment
All patients in the PICU were monitored continuously using General Electric (GE) (Fairfield, CT) solar devices. All bed spaces on the wards include GE Dash monitors that are used if ordered. On the ward we studied, 30% to 50% of patients are typically monitored at any given time. In addition to alarming at the bedside, most clinical alarms also generated a text message sent to the nurse's wireless phone listing the room number and the word monitor. Messages did not provide any clinical information about the alarm or patient's status. There were no technicians reviewing alarms centrally.
Physicians used an order set to order monitoring, selecting 1 of 4 available preconfigured profiles: infant <6 months, infant 6 months to 1 year, child, and adult. The parameters for each age group are in Supporting Figure 1, available in the online version of this article. A physician order is required for a nurse to change the parameters. Participating in the study did not affect this workflow.
Primary Outcome
The primary outcome was the nurse's response time to potentially critical monitor alarms that occurred while neither they nor any other clinicians were in the patient's room.
Primary Exposure and Alarm Classification
The primary exposure was the number of nonactionable alarms in the same patient over the preceding 120 minutes (rolling and updated each minute). The alarm classification scheme is shown in Figure 1.
Due to technical limitations with obtaining time‐stamped alarm data from the different ventilators in use during the study period, we were unable to identify the causes of all ventilator alarms. Therefore, we included ventilator alarms that did not lead to clinical interventions as nonactionable alarm exposures, but we did not evaluate the response time to any ventilator alarms.
Data Collection
We combined video recordings with monitor time‐stamp data to evaluate the association between nonactionable alarms and the nurse's response time. Our detailed video recording and annotation methods have been published separately.[15] Briefly, we mounted up to 6 small video cameras in patients' rooms and recorded up to 6 hours per session. The cameras captured the monitor display, a wide view of the room, a close‐up view of the patient, and all windows and doors through which staff could visually assess the patient without entering the room.
Video Processing, Review, and Annotation
The first 5 video sessions were reviewed in a group training setting. Research assistants received instruction on how to determine alarm validity and actionability in accordance with the study definitions. Following the training period, the review workflow was as follows. First, a research assistant entered basic information and a preliminary assessment of the alarm's clinical validity and actionability into a REDCap (Research Electronic Data Capture; Vanderbilt University, Nashville, TN) database.[16] Later, a physician investigator secondarily reviewed all alarms and confirmed the assessments of the research assistants or, when disagreements occurred, discussed and reconciled the database. Alarms that remained unresolved after secondary review were flagged for review with an additional physician or nurse investigator in a team meeting.
Data Analysis
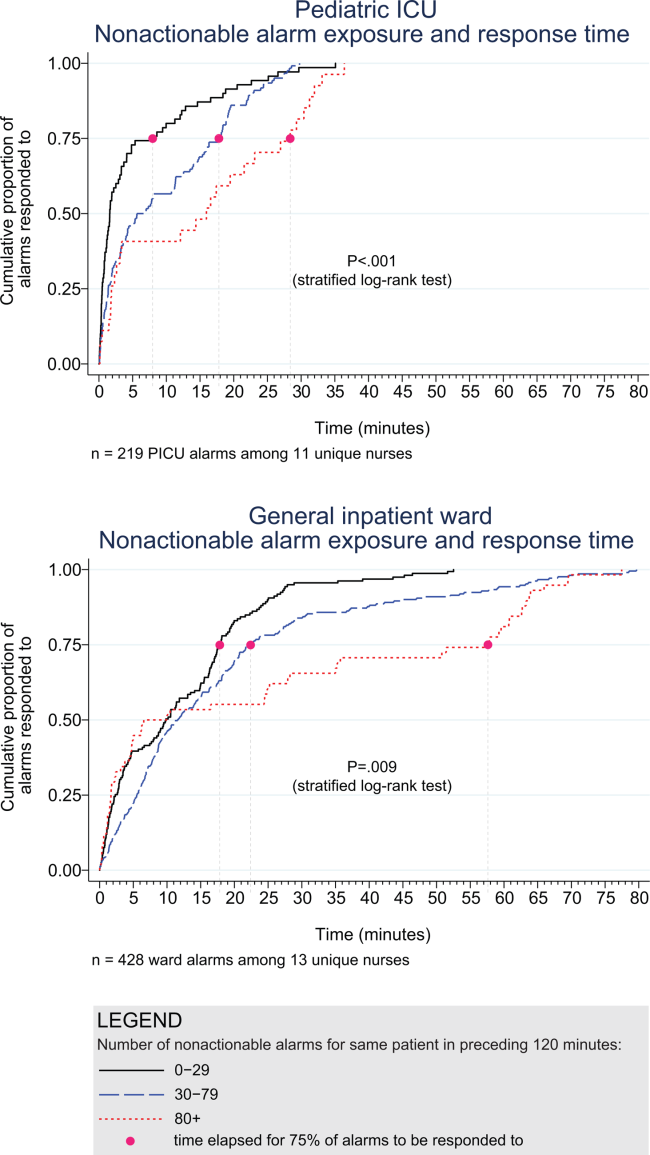
We summarized the patient and nurse subjects, the distributions of alarms, and the response times to potentially critical monitor alarms that occurred while neither the nurse nor any other clinicians were in the patient's room. We explored the data using plots of alarms and response times occurring within individual video sessions as well as with simple linear regression. Hypothesizing that any alarm fatigue effect would be strongest in the highest alarm patients, and having observed that alarms are distributed very unevenly across patients in both the PICU and ward, we made the decision not to use quartiles, but rather to form clinically meaningful categories. We also hypothesized that nurses might not exhibit alarm fatigue unless they were inundated with alarms. We thus divided the nonactionable alarm counts over the preceding 120 minutes into 3 categories: 0 to 29 alarms to represent a low to average alarm rate exhibited by the bottom 50% of the patients, 30 to 79 alarms to represent an elevated alarm rate, and 80+ alarms to represent an extremely high alarm rate exhibited by the top 5%. Because the exposure time was 120 minutes, we conducted the analysis on the alarms occurring after a nurse had been video recorded for at least 120 minutes.
We further evaluated the relationship between nonactionable alarms and nurse response time with Kaplan‐Meier plots by nonactionable alarm count category using the observed response‐time data. The Kaplan‐Meier plots compared response time across the nonactionable alarm exposure group, without any statistical modeling. A log‐rank test stratified by nurse evaluated whether the distributions of response time in the Kaplan‐Meier plots differed across the 3 alarm exposure groups, accounting for within‐nurse clustering.
Accelerated failure‐time regression based on the Weibull distribution then allowed us to compare response time across each alarm exposure group and provided confidence intervals. Accelerated failure‐time models are comparable to Cox models, but emphasize time to event rather than hazards.[17, 18] We determined that the Weibull distribution was suitable by evaluating smoothed hazard and log‐hazard plots, the confidence intervals of the shape parameters in the Weibull models that did not include 1, and by demonstrating that the Weibull model had better fit than an alternative (exponential) model using the likelihood‐ratio test (P<0.0001 for PICU, P=0.02 for ward). Due to the small sample size of nurses and patients, we could not adjust for nurse‐ or patient‐level covariates in the model. When comparing the nonactionable alarm exposure groups in the regression model (029 vs 3079, 3079 vs 80+, and 029 vs 80+), we Bonferroni corrected the critical P value for the 3 comparisons, for a critical P value of 0.05/3=0.0167.
Nurse Questionnaire
At the session's conclusion, nurses completed a questionnaire that included demographics and asked, Did you respond more quickly to monitor alarms during this study because you knew you were being filmed? to measure if nurses would report experiencing a Hawthorne‐like effect.[19, 20, 21]
RESULTS
We performed 40 sessions among 40 patients and 36 nurses over 210 hours. We performed 20 sessions in children with heart and/or lung failure in the PICU and 20 sessions in children on a general ward. Sessions took place on weekdays between 9:00 am and 6:00 pm. There were 3 occasions when we filmed 2 patients cared for by the same nurse at the same time.
Nurses were mostly female (94.4%) and had between 2 months and 28 years of experience (median, 4.8 years). Patients on the ward ranged from 5 days to 5.4 years old (median, 6 months). Patients in the PICU ranged from 5 months to 16 years old (median, 2.5 years). Among the PICU patients, 14 (70%) were receiving mechanical ventilation only, 3 (15%) were receiving vasopressors only, and 3 (15%) were receiving mechanical ventilation and vasopressors.
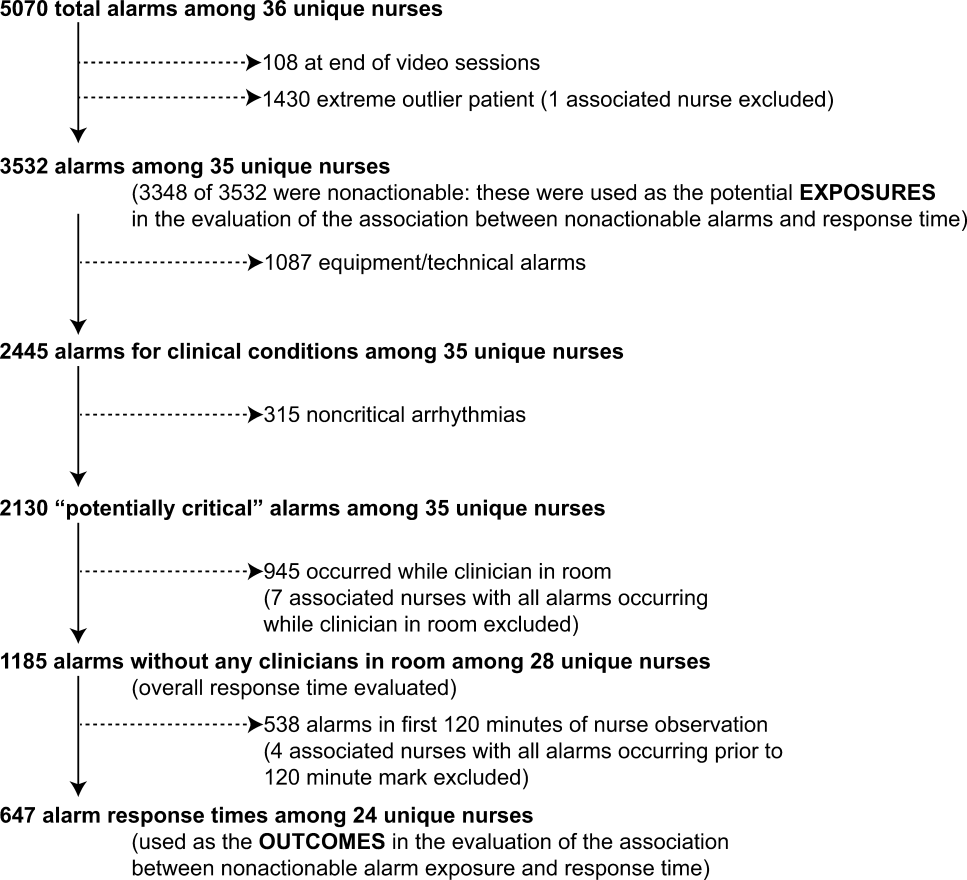
We observed 5070 alarms during the 40 sessions. We excluded 108 (2.1%) that occurred at the end of video recording sessions with the nurse absent from the room because the nurse's response could not be determined. Alarms per session ranged from 10 to 1430 (median, 75; interquartile range [IQR], 35138). We excluded the outlier PICU patient with 1430 alarms in 5 hours from the analysis to avoid the potential for biasing the results. Figure 2 depicts the data flow.
Following the 5 training sessions, research assistants independently reviewed and made preliminary assessments on 4674 alarms; these alarms were all secondarily reviewed by a physician. Using the physician reviewer as the gold standard, the research assistant's sensitivity (assess alarm as actionable when physician also assesses as actionable) was 96.8% and specificity (assess alarm as nonactionable when physician also assesses as nonactionable) was 96.9%. We had to review 54 of 4674 alarms (1.2%) with an additional physician or nurse investigator to achieve consensus.
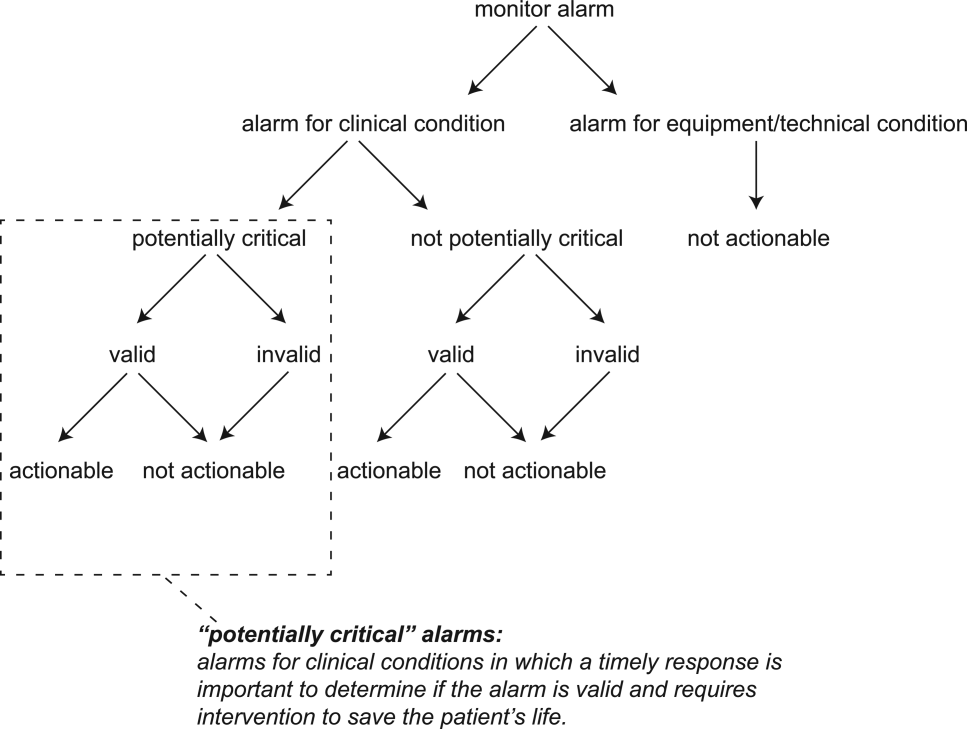
Characteristics of the 2445 alarms for clinical conditions are shown in Table 1. Only 12.9% of alarms in heart‐ and/or lung‐failure patients in the PICU were actionable, and only 1.0% of alarms in medical patients on a general inpatient ward were actionable.
Overall Response Times for Out‐of‐Room Alarms
We first evaluated response times without excluding alarms occurring prior to the 120‐minute mark. Of the 2445 clinical condition alarms, we excluded the 315 noncritical arrhythmia types from analysis of response time because they did not meet our definition of potentially critical alarms. Of the 2130 potentially critical alarms, 1185 (55.6%) occurred while neither the nurse nor any other clinician was in the patient's room. We proceeded to analyze the response time to these 1185 alarms (307 in the PICU and 878 on the ward). In the PICU, median response time was 3.3 minutes (IQR, 0.814.4). On the ward, median response time was 9.8 minutes (IQR, 3.222.4).
Response‐Time Association With Nonactionable Alarm Exposure
Next, we analyzed the association between response time to potentially critical alarms that occurred when the nurse was not in the patient's room and the number of nonactionable alarms occurring over the preceding 120‐minute window. This required excluding the alarms that occurred in the first 120 minutes of each session, leaving 647 alarms with eligible response times to evaluate the exposure between prior nonactionable alarm exposure and response time: 219 in the PICU and 428 on the ward. Kaplan‐Meier plots and tabulated response times demonstrated the incremental relationships between each nonactionable alarm exposure category in the observed data, with the effects most prominent as the Kaplan‐Meier plots diverged beyond the median (Figure 3 and Table 2). Excluding the extreme outlier patient had no effect on the results, because 1378 of the 1430 alarms occurred with the nurse present at the bedside, and only 2 of the remaining alarms were potentially critical.
| Observed Data | Accelerated Failure‐Time Model | |||||||
|---|---|---|---|---|---|---|---|---|
| Number of Potentially Critical Alarms | Minutes Elapsed Until This Percentage of Alarms Was Responded to | Modeled Response Time, min | 95% CI, min | P Value* | ||||
| 50% (Median) | 75% | 90% | 95% | |||||
| ||||||||
| PICU | ||||||||
| 029 nonactionable alarms | 70 | 1.6 | 8.0 | 18.6 | 25.1 | 2.8 | 1.9‐3.8 | Reference |
| 3079 nonactionable alarms | 122 | 6.3 | 17.8 | 22.5 | 26.0 | 5.3 | 4.06.7 | 0.001 (vs 029) |
| 80+ nonactionable alarms | 27 | 16.0 | 28.4 | 32.0 | 33.1 | 8.5 | 4.312.7 | 0.009 (vs 029), 0.15 (vs 3079) |
| Ward | ||||||||
| 029 nonactionable alarms | 159 | 9.8 | 17.8 | 25.0 | 28.9 | 7.7 | 6.39.1 | Reference |
| 3079 nonactionable alarms | 211 | 11.6 | 22.4 | 44.6 | 63.2 | 11.5 | 9.613.3 | 0.001 (vs 029) |
| 80+ nonactionable alarms | 58 | 8.3 | 57.6 | 63.8 | 69.5 | 15.6 | 11.020.1 | 0.001 (vs 029), 0.09 (vs 3079) |
Accelerated failure‐time regressions revealed significant incremental increases in the modeled response time as the number of preceding nonactionable alarms increased in both the PICU and ward settings (Table 2).
Hawthorne‐like Effects
Four of the 36 nurses reported that they responded more quickly to monitor alarms because they knew they were being filmed.
DISCUSSION
Alarm fatigue has recently generated interest among nurses,[22] physicians,[23] regulatory bodies,[24] patient safety organizations,[25] and even attorneys,[26] despite a lack of prior evidence linking nonactionable alarm exposure to response time or other adverse patient‐relevant outcomes. This study's main findings were that (1) the vast majority of alarms were nonactionable, (2) response time to alarms occurring while the nurse was out of the room increased as the number of nonactionable alarms over the preceding 120 minutes increased. These findings may be explained by alarm fatigue.
Our results build upon the findings of other related studies. The nonactionable alarm proportions we found were similar to other pediatric studies, reporting greater than 90% nonactionable alarms.[1, 2] One other study has reported a relationship between alarm exposure and response time. In that study, Voepel‐Lewis and colleagues evaluated nurse responses to pulse oximetry desaturation alarms in adult orthopedic surgery patients using time‐stamp data from their monitor notification system.[27] They found that alarm response time was significantly longer for patients in the highest quartile of alarms compared to those in lower quartiles. Our study provides new data suggesting a relationship between nonactionable alarm exposure and nurse response time.
Our study has several limitations. First, as a preliminary study to investigate feasibility and possible association, the sample of patients and nurses was necessarily limited and did not permit adjustment for nurse‐ or patient‐level covariates. A multivariable analysis with a larger sample might provide insight into alternate explanations for these findings other than alarm fatigue, including measures of nurse workload and patient factors (such as age and illness severity). Additional factors that are not as easily measured can also contribute to the complex decision of when and how to respond to alarms.[28, 29] Second, nurses were aware that they were being video recorded as part of a study of nonactionable alarms, although they did not know the specific details of measurement. Although this lack of blinding might lead to a Hawthorne‐like effect, our positive results suggest that this effect, if present, did not fully obscure the association. Third, all sessions took place on weekdays during daytime hours, but effects of nonactionable alarms might vary by time and day. Finally, we suspect that when nurses experience critical alarms that require them to intervene and rescue a patient, their response times to that patient's alarms that occur later in their shift will be quicker due to a heightened concern for the alarm being actionable. We were unable to explore that relationship in this analysis because the number of critical alarms requiring intervention was very small. This is a topic of future study.
CONCLUSIONS
We identified an association between a nurse's prior exposure to nonactionable alarms and response time to future alarms. This finding is consistent with alarm fatigue, but requires further study to more clearly delineate other factors that might confound or modify that relationship.
Disclosures
This project was funded by the Health Research Formula Fund Grant 4100050891 from the Pennsylvania Department of Public Health Commonwealth Universal Research Enhancement Program (awarded to Drs. Keren and Bonafide). Dr. Bonafide is also supported by the National Heart, Lung, and Blood Institute of the National Institutes of Health under award number K23HL116427. The content is solely the responsibility of the authors and does not necessarily represent the official views of the National Institutes of Health. The authors have no financial relationships or conflicts of interest relevant to this article to disclose.
- . Crying wolf: false alarms in a pediatric intensive care unit. Crit Care Med. 1994;22(6):981–985.
- , . Poor prognosis for existing monitors in the intensive care unit. Crit Care Med. 1997;25(4):614–619.
- , , , , . Clinical evaluation of alarm efficiency in intensive care [in French]. Ann Fr Anesth Reanim. 2000;19:459–466.
- , , , . Reducing false alarms of intensive care online‐monitoring systems: an evaluation of two signal extraction algorithms. Comput Math Methods Med. 2011;2011:143480.
- , , , , , . Multicentric study of monitoring alarms in the adult intensive care unit (ICU): a descriptive analysis. Intensive Care Med. 1999;25:1360–1366.
- , , . Improving alarm performance in the medical intensive care unit using delays and clinical context. Anesth Analg. 2009;108:1546–1552.
- , . Monitor alarm fatigue: standardizing use of physiological monitors and decreasing nuisance alarms. Am J Crit Care. 2010;19:28–34.
- , , , , , . Intensive care unit alarms—how many do we need? Crit Care Med. 2010;38:451–456.
- , , , . System operator response to warnings of danger: a laboratory investigation of the effects of the predictive value of a warning on human response time. J Exp Psychol Appl. 1995;1:19–33.
- , , . Human probability matching behaviour in response to alarms of varying reliability. Ergonomics. 1995;38:2300–2312.
- The Joint Commission. Sentinel event alert: medical device alarm safety in hospitals. 2013. Available at: http://www.jointcommission.org/sea_issue_50/. Accessed October 9, 2014.
- . Joint commission warns of alarm fatigue: multitude of alarms from monitoring devices problematic. JAMA. 2013;309(22):2315–2316.
- . Monitor alarm fatigue: an integrative review. Biomed Instrum Technol. 2012;46(4):268–277.
- NIH Certificates of Confidentiality Kiosk. Available at: http://grants.nih.gov/grants/policy/coc/. Accessed April 21, 2014.
- , , , et al. Video methods for evaluating physiologic monitor alarms and alarm responses. Biomed Instrum Technol. 2014;48(3):220–230.
- , , , , , . Research electronic data capture (REDCap)—a metadata‐driven methodology and workflow process for providing translational research informatics support. J Biomed Inf. 2009;42:377–381.
- . Accelerated failure time and other parametric models. In: Modelling Survival Data in Medical Research. 2nd ed. Boca Raton, FL: Chapman 2003:197–229.
- , , , . Parametric models. In: An Introduction to Survival Analysis Using Stata, 3rd ed. College Station, TX: Stata Press; 2010:229–244.
- , . Management and the Worker. Cambridge, MA: Harvard University Press; 1939.
- . What happened at Hawthorne? Science. 1974;183(4128):922–932.
- , , , , . Validation of the Work Observation Method By Activity Timing (WOMBAT) method of conducting time‐motion observations in critical care settings: an observational study. BMC Med Inf Decis Mak. 2011;11:32.
- , . Alarm fatigue: a patient safety concern. AACN Adv Crit Care. 2013;24(4):378–386.
- , . Redesigning hospital alarms for patient safety: alarmed and potentially dangerous. JAMA. 2014;311(12):1199–1200.
- The Joint Commission. The Joint Commission announces 2014 National Patient Safety Goal. Jt Comm Perspect. 2013;33:1–4.
- Top 10 health technology hazards for 2014. Health Devices. 2013;42(11):354–380.
- My Philly Lawyer. Medical malpractice: alarm fatigue threatens patient safety. 2014. Available at: http://www.myphillylawyer.com/Resources/Legal-Articles/Medical-Malpractice-Alarm-Fatigue-Threatens-Patient-Safety.shtml. Accessed April 4, 2014.
- , , , et al. Pulse oximetry desaturation alarms on a general postoperative adult unit: a prospective observational study of nurse response time. Int J Nurs Stud. 2013;50(10):1351–1358.
- , , , , . A description of nurses' decision‐making in managing electrocardiographic monitor alarms [published online ahead of print May 10, 2014]. J Clin Nurs. doi:10.1111/jocn.12625.
- . Nurses' response to frequency and types of electrocardiography alarms in a non‐critical care setting: a descriptive study. Int J Nurs Stud. 2014;51(2):190–197.
Hospital physiologic monitors can alert clinicians to early signs of physiologic deterioration, and thus have great potential to save lives. However, monitors generate frequent alarms,[1, 2, 3, 4, 5, 6, 7, 8] and most are not relevant to the patient's safety (over 90% of pediatric intensive care unit (PICU)[1, 2] and over 70% of adult intensive care alarms).[5, 6] In psychology experiments, humans rapidly learn to ignore or respond more slowly to alarms when exposed to high false‐alarm rates, exhibiting alarm fatigue.[9, 10] In 2013, The Joint Commission named alarm fatigue the most common contributing factor to alarm‐related sentinel events in hospitals.[11, 12]
Although alarm fatigue has been implicated as a major threat to patient safety, little empirical data support its existence in hospitals. In this study, we aimed to determine if there was an association between nurses' recent exposure to nonactionable physiologic monitor alarms and their response time to future alarms for the same patients. This exploratory work was designed to inform future research in this area, acknowledging that the sample size would be too small for multivariable modeling.
METHODS
Study Definitions
The alarm classification scheme is shown in Figure 1. Note that, for clarity, we have intentionally avoided using the terms true and false alarms because their interpretations vary across studies and can be misleading.
Potentially Critical Alarm
A potentially critical alarm is any alarm for a clinical condition for which a timely response is important to determine if the alarm requires intervention to save the patient's life. This is based on the alarm type alone, including alarms for life‐threatening arrhythmias such as asystole and ventricular tachycardia, as well as alarms for vital signs outside the set limits. Supporting Table 1 in the online version of this article lists the breakdown of alarm types that we defined a priori as potentially and not potentially critical.
| PICU | Ward | |||||||
|---|---|---|---|---|---|---|---|---|
| Alarm type | No. | % of Total | % Valid | % Actionable | No. | % of Total | % Valid | % Actionable |
| ||||||||
| Oxygen saturation | 197 | 19.4 | 82.7 | 38.6 | 590 | 41.2 | 24.4 | 1.9 |
| Heart rate | 194 | 19.1 | 95.4 | 1.0 | 266 | 18.6 | 87.2 | 0.0 |
| Respiratory rate | 229 | 22.6 | 80.8 | 13.5 | 316 | 22.1 | 48.1 | 1.0 |
| Blood pressure | 259 | 25.5 | 83.8 | 5.8 | 11 | 0.8 | 72.7 | 0.0 |
| Critical arrhythmia | 1 | 0.1 | 0.0 | 0.0 | 4 | 0.3 | 0.0 | 0.0 |
| Noncritical arrhythmia | 71 | 7.0 | 2.8 | 0.0 | 244 | 17.1 | 8.6 | 0.0 |
| Central venous pressure | 49 | 4.8 | 0.0 | 0.0 | 0 | 0.0 | N/A | N/A |
| Exhaled carbon dioxide | 14 | 1.4 | 92.9 | 50.0 | 0 | 0.0 | N/A | N/A |
| Total | 1014 | 100.0 | 75.6 | 12.9 | 1,431 | 100.0 | 38.9 | 1.0 |
Valid Alarm
A valid alarm is any alarm that correctly identifies the physiologic status of the patient. Validity was based on waveform quality, lead signal strength indicators, and artifact conditions, referencing each monitor's operator's manual.
Actionable Alarm
An actionable alarm is any valid alarm for a clinical condition that either: (1) leads to a clinical intervention; (2) leads to a consultation with another clinician at the bedside (and thus visible on camera); or (3) is a situation that should have led to intervention or consultation, but the alarm was unwitnessed or misinterpreted by the staff at the bedside.
Nonactionable Alarm
An unactionable alarm is any alarm that does not meet the actionable definition above, including invalid alarms such as those caused by motion artifact, equipment/technical alarms, and alarms that are valid but nonactionable (nuisance alarms).[13]
Response Time
The response time is the time elapsed from when the alarm fired at the bedside to when the nurse entered the room or peered through a window or door, measured in seconds.
Setting and Subjects
We performed this study between August 2012 and July 2013 at a freestanding children's hospital. We evaluated nurses caring for 2 populations: (1) PICU patients with heart and/or lung failure (requiring inotropic support and/or invasive mechanical ventilation), and (2) medical patients on a general inpatient ward. Nurses caring for heart and/or lung failure patients in the PICU typically were assigned 1 to 2 total patients. Nurses on the medical ward typically were assigned 2 to 4 patients. We identified subjects from the population of nurses caring for eligible patients with parents available to provide in‐person consent in each setting. Our primary interest was to evaluate the association between nonactionable alarms and response time, and not to study the epidemiology of alarms in a random sample. Therefore, when alarm data were available prior to screening, we first approached nurses caring for patients in the top 25% of alarm rates for that unit over the preceding 4 hours. We identified preceding alarm rates using BedMasterEx (Excel Medical Electronics, Jupiter, FL).
Human Subjects Protection
This study was approved by the institutional review board of The Children's Hospital of Philadelphia. We obtained written in‐person consent from the patient's parent and the nurse subject. We obtained a Certificate of Confidentiality from the National Institutes of Health to further protect study participants.[14]
Monitoring Equipment
All patients in the PICU were monitored continuously using General Electric (GE) (Fairfield, CT) solar devices. All bed spaces on the wards include GE Dash monitors that are used if ordered. On the ward we studied, 30% to 50% of patients are typically monitored at any given time. In addition to alarming at the bedside, most clinical alarms also generated a text message sent to the nurse's wireless phone listing the room number and the word monitor. Messages did not provide any clinical information about the alarm or patient's status. There were no technicians reviewing alarms centrally.
Physicians used an order set to order monitoring, selecting 1 of 4 available preconfigured profiles: infant <6 months, infant 6 months to 1 year, child, and adult. The parameters for each age group are in Supporting Figure 1, available in the online version of this article. A physician order is required for a nurse to change the parameters. Participating in the study did not affect this workflow.
Primary Outcome
The primary outcome was the nurse's response time to potentially critical monitor alarms that occurred while neither they nor any other clinicians were in the patient's room.
Primary Exposure and Alarm Classification
The primary exposure was the number of nonactionable alarms in the same patient over the preceding 120 minutes (rolling and updated each minute). The alarm classification scheme is shown in Figure 1.
Due to technical limitations with obtaining time‐stamped alarm data from the different ventilators in use during the study period, we were unable to identify the causes of all ventilator alarms. Therefore, we included ventilator alarms that did not lead to clinical interventions as nonactionable alarm exposures, but we did not evaluate the response time to any ventilator alarms.
Data Collection
We combined video recordings with monitor time‐stamp data to evaluate the association between nonactionable alarms and the nurse's response time. Our detailed video recording and annotation methods have been published separately.[15] Briefly, we mounted up to 6 small video cameras in patients' rooms and recorded up to 6 hours per session. The cameras captured the monitor display, a wide view of the room, a close‐up view of the patient, and all windows and doors through which staff could visually assess the patient without entering the room.
Video Processing, Review, and Annotation
The first 5 video sessions were reviewed in a group training setting. Research assistants received instruction on how to determine alarm validity and actionability in accordance with the study definitions. Following the training period, the review workflow was as follows. First, a research assistant entered basic information and a preliminary assessment of the alarm's clinical validity and actionability into a REDCap (Research Electronic Data Capture; Vanderbilt University, Nashville, TN) database.[16] Later, a physician investigator secondarily reviewed all alarms and confirmed the assessments of the research assistants or, when disagreements occurred, discussed and reconciled the database. Alarms that remained unresolved after secondary review were flagged for review with an additional physician or nurse investigator in a team meeting.
Data Analysis
We summarized the patient and nurse subjects, the distributions of alarms, and the response times to potentially critical monitor alarms that occurred while neither the nurse nor any other clinicians were in the patient's room. We explored the data using plots of alarms and response times occurring within individual video sessions as well as with simple linear regression. Hypothesizing that any alarm fatigue effect would be strongest in the highest alarm patients, and having observed that alarms are distributed very unevenly across patients in both the PICU and ward, we made the decision not to use quartiles, but rather to form clinically meaningful categories. We also hypothesized that nurses might not exhibit alarm fatigue unless they were inundated with alarms. We thus divided the nonactionable alarm counts over the preceding 120 minutes into 3 categories: 0 to 29 alarms to represent a low to average alarm rate exhibited by the bottom 50% of the patients, 30 to 79 alarms to represent an elevated alarm rate, and 80+ alarms to represent an extremely high alarm rate exhibited by the top 5%. Because the exposure time was 120 minutes, we conducted the analysis on the alarms occurring after a nurse had been video recorded for at least 120 minutes.
We further evaluated the relationship between nonactionable alarms and nurse response time with Kaplan‐Meier plots by nonactionable alarm count category using the observed response‐time data. The Kaplan‐Meier plots compared response time across the nonactionable alarm exposure group, without any statistical modeling. A log‐rank test stratified by nurse evaluated whether the distributions of response time in the Kaplan‐Meier plots differed across the 3 alarm exposure groups, accounting for within‐nurse clustering.
Accelerated failure‐time regression based on the Weibull distribution then allowed us to compare response time across each alarm exposure group and provided confidence intervals. Accelerated failure‐time models are comparable to Cox models, but emphasize time to event rather than hazards.[17, 18] We determined that the Weibull distribution was suitable by evaluating smoothed hazard and log‐hazard plots, the confidence intervals of the shape parameters in the Weibull models that did not include 1, and by demonstrating that the Weibull model had better fit than an alternative (exponential) model using the likelihood‐ratio test (P<0.0001 for PICU, P=0.02 for ward). Due to the small sample size of nurses and patients, we could not adjust for nurse‐ or patient‐level covariates in the model. When comparing the nonactionable alarm exposure groups in the regression model (029 vs 3079, 3079 vs 80+, and 029 vs 80+), we Bonferroni corrected the critical P value for the 3 comparisons, for a critical P value of 0.05/3=0.0167.
Nurse Questionnaire
At the session's conclusion, nurses completed a questionnaire that included demographics and asked, Did you respond more quickly to monitor alarms during this study because you knew you were being filmed? to measure if nurses would report experiencing a Hawthorne‐like effect.[19, 20, 21]
RESULTS
We performed 40 sessions among 40 patients and 36 nurses over 210 hours. We performed 20 sessions in children with heart and/or lung failure in the PICU and 20 sessions in children on a general ward. Sessions took place on weekdays between 9:00 am and 6:00 pm. There were 3 occasions when we filmed 2 patients cared for by the same nurse at the same time.
Nurses were mostly female (94.4%) and had between 2 months and 28 years of experience (median, 4.8 years). Patients on the ward ranged from 5 days to 5.4 years old (median, 6 months). Patients in the PICU ranged from 5 months to 16 years old (median, 2.5 years). Among the PICU patients, 14 (70%) were receiving mechanical ventilation only, 3 (15%) were receiving vasopressors only, and 3 (15%) were receiving mechanical ventilation and vasopressors.
We observed 5070 alarms during the 40 sessions. We excluded 108 (2.1%) that occurred at the end of video recording sessions with the nurse absent from the room because the nurse's response could not be determined. Alarms per session ranged from 10 to 1430 (median, 75; interquartile range [IQR], 35138). We excluded the outlier PICU patient with 1430 alarms in 5 hours from the analysis to avoid the potential for biasing the results. Figure 2 depicts the data flow.
Following the 5 training sessions, research assistants independently reviewed and made preliminary assessments on 4674 alarms; these alarms were all secondarily reviewed by a physician. Using the physician reviewer as the gold standard, the research assistant's sensitivity (assess alarm as actionable when physician also assesses as actionable) was 96.8% and specificity (assess alarm as nonactionable when physician also assesses as nonactionable) was 96.9%. We had to review 54 of 4674 alarms (1.2%) with an additional physician or nurse investigator to achieve consensus.
Characteristics of the 2445 alarms for clinical conditions are shown in Table 1. Only 12.9% of alarms in heart‐ and/or lung‐failure patients in the PICU were actionable, and only 1.0% of alarms in medical patients on a general inpatient ward were actionable.
Overall Response Times for Out‐of‐Room Alarms
We first evaluated response times without excluding alarms occurring prior to the 120‐minute mark. Of the 2445 clinical condition alarms, we excluded the 315 noncritical arrhythmia types from analysis of response time because they did not meet our definition of potentially critical alarms. Of the 2130 potentially critical alarms, 1185 (55.6%) occurred while neither the nurse nor any other clinician was in the patient's room. We proceeded to analyze the response time to these 1185 alarms (307 in the PICU and 878 on the ward). In the PICU, median response time was 3.3 minutes (IQR, 0.814.4). On the ward, median response time was 9.8 minutes (IQR, 3.222.4).
Response‐Time Association With Nonactionable Alarm Exposure
Next, we analyzed the association between response time to potentially critical alarms that occurred when the nurse was not in the patient's room and the number of nonactionable alarms occurring over the preceding 120‐minute window. This required excluding the alarms that occurred in the first 120 minutes of each session, leaving 647 alarms with eligible response times to evaluate the exposure between prior nonactionable alarm exposure and response time: 219 in the PICU and 428 on the ward. Kaplan‐Meier plots and tabulated response times demonstrated the incremental relationships between each nonactionable alarm exposure category in the observed data, with the effects most prominent as the Kaplan‐Meier plots diverged beyond the median (Figure 3 and Table 2). Excluding the extreme outlier patient had no effect on the results, because 1378 of the 1430 alarms occurred with the nurse present at the bedside, and only 2 of the remaining alarms were potentially critical.
| Observed Data | Accelerated Failure‐Time Model | |||||||
|---|---|---|---|---|---|---|---|---|
| Number of Potentially Critical Alarms | Minutes Elapsed Until This Percentage of Alarms Was Responded to | Modeled Response Time, min | 95% CI, min | P Value* | ||||
| 50% (Median) | 75% | 90% | 95% | |||||
| ||||||||
| PICU | ||||||||
| 029 nonactionable alarms | 70 | 1.6 | 8.0 | 18.6 | 25.1 | 2.8 | 1.9‐3.8 | Reference |
| 3079 nonactionable alarms | 122 | 6.3 | 17.8 | 22.5 | 26.0 | 5.3 | 4.06.7 | 0.001 (vs 029) |
| 80+ nonactionable alarms | 27 | 16.0 | 28.4 | 32.0 | 33.1 | 8.5 | 4.312.7 | 0.009 (vs 029), 0.15 (vs 3079) |
| Ward | ||||||||
| 029 nonactionable alarms | 159 | 9.8 | 17.8 | 25.0 | 28.9 | 7.7 | 6.39.1 | Reference |
| 3079 nonactionable alarms | 211 | 11.6 | 22.4 | 44.6 | 63.2 | 11.5 | 9.613.3 | 0.001 (vs 029) |
| 80+ nonactionable alarms | 58 | 8.3 | 57.6 | 63.8 | 69.5 | 15.6 | 11.020.1 | 0.001 (vs 029), 0.09 (vs 3079) |
Accelerated failure‐time regressions revealed significant incremental increases in the modeled response time as the number of preceding nonactionable alarms increased in both the PICU and ward settings (Table 2).
Hawthorne‐like Effects
Four of the 36 nurses reported that they responded more quickly to monitor alarms because they knew they were being filmed.
DISCUSSION
Alarm fatigue has recently generated interest among nurses,[22] physicians,[23] regulatory bodies,[24] patient safety organizations,[25] and even attorneys,[26] despite a lack of prior evidence linking nonactionable alarm exposure to response time or other adverse patient‐relevant outcomes. This study's main findings were that (1) the vast majority of alarms were nonactionable, (2) response time to alarms occurring while the nurse was out of the room increased as the number of nonactionable alarms over the preceding 120 minutes increased. These findings may be explained by alarm fatigue.
Our results build upon the findings of other related studies. The nonactionable alarm proportions we found were similar to other pediatric studies, reporting greater than 90% nonactionable alarms.[1, 2] One other study has reported a relationship between alarm exposure and response time. In that study, Voepel‐Lewis and colleagues evaluated nurse responses to pulse oximetry desaturation alarms in adult orthopedic surgery patients using time‐stamp data from their monitor notification system.[27] They found that alarm response time was significantly longer for patients in the highest quartile of alarms compared to those in lower quartiles. Our study provides new data suggesting a relationship between nonactionable alarm exposure and nurse response time.
Our study has several limitations. First, as a preliminary study to investigate feasibility and possible association, the sample of patients and nurses was necessarily limited and did not permit adjustment for nurse‐ or patient‐level covariates. A multivariable analysis with a larger sample might provide insight into alternate explanations for these findings other than alarm fatigue, including measures of nurse workload and patient factors (such as age and illness severity). Additional factors that are not as easily measured can also contribute to the complex decision of when and how to respond to alarms.[28, 29] Second, nurses were aware that they were being video recorded as part of a study of nonactionable alarms, although they did not know the specific details of measurement. Although this lack of blinding might lead to a Hawthorne‐like effect, our positive results suggest that this effect, if present, did not fully obscure the association. Third, all sessions took place on weekdays during daytime hours, but effects of nonactionable alarms might vary by time and day. Finally, we suspect that when nurses experience critical alarms that require them to intervene and rescue a patient, their response times to that patient's alarms that occur later in their shift will be quicker due to a heightened concern for the alarm being actionable. We were unable to explore that relationship in this analysis because the number of critical alarms requiring intervention was very small. This is a topic of future study.
CONCLUSIONS
We identified an association between a nurse's prior exposure to nonactionable alarms and response time to future alarms. This finding is consistent with alarm fatigue, but requires further study to more clearly delineate other factors that might confound or modify that relationship.
Disclosures
This project was funded by the Health Research Formula Fund Grant 4100050891 from the Pennsylvania Department of Public Health Commonwealth Universal Research Enhancement Program (awarded to Drs. Keren and Bonafide). Dr. Bonafide is also supported by the National Heart, Lung, and Blood Institute of the National Institutes of Health under award number K23HL116427. The content is solely the responsibility of the authors and does not necessarily represent the official views of the National Institutes of Health. The authors have no financial relationships or conflicts of interest relevant to this article to disclose.
- . Crying wolf: false alarms in a pediatric intensive care unit. Crit Care Med. 1994;22(6):981–985.
- , . Poor prognosis for existing monitors in the intensive care unit. Crit Care Med. 1997;25(4):614–619.
- , , , , . Clinical evaluation of alarm efficiency in intensive care [in French]. Ann Fr Anesth Reanim. 2000;19:459–466.
- , , , . Reducing false alarms of intensive care online‐monitoring systems: an evaluation of two signal extraction algorithms. Comput Math Methods Med. 2011;2011:143480.
- , , , , , . Multicentric study of monitoring alarms in the adult intensive care unit (ICU): a descriptive analysis. Intensive Care Med. 1999;25:1360–1366.
- , , . Improving alarm performance in the medical intensive care unit using delays and clinical context. Anesth Analg. 2009;108:1546–1552.
- , . Monitor alarm fatigue: standardizing use of physiological monitors and decreasing nuisance alarms. Am J Crit Care. 2010;19:28–34.
- , , , , , . Intensive care unit alarms—how many do we need? Crit Care Med. 2010;38:451–456.
- , , , . System operator response to warnings of danger: a laboratory investigation of the effects of the predictive value of a warning on human response time. J Exp Psychol Appl. 1995;1:19–33.
- , , . Human probability matching behaviour in response to alarms of varying reliability. Ergonomics. 1995;38:2300–2312.
- The Joint Commission. Sentinel event alert: medical device alarm safety in hospitals. 2013. Available at: http://www.jointcommission.org/sea_issue_50/. Accessed October 9, 2014.
- . Joint commission warns of alarm fatigue: multitude of alarms from monitoring devices problematic. JAMA. 2013;309(22):2315–2316.
- . Monitor alarm fatigue: an integrative review. Biomed Instrum Technol. 2012;46(4):268–277.
- NIH Certificates of Confidentiality Kiosk. Available at: http://grants.nih.gov/grants/policy/coc/. Accessed April 21, 2014.
- , , , et al. Video methods for evaluating physiologic monitor alarms and alarm responses. Biomed Instrum Technol. 2014;48(3):220–230.
- , , , , , . Research electronic data capture (REDCap)—a metadata‐driven methodology and workflow process for providing translational research informatics support. J Biomed Inf. 2009;42:377–381.
- . Accelerated failure time and other parametric models. In: Modelling Survival Data in Medical Research. 2nd ed. Boca Raton, FL: Chapman 2003:197–229.
- , , , . Parametric models. In: An Introduction to Survival Analysis Using Stata, 3rd ed. College Station, TX: Stata Press; 2010:229–244.
- , . Management and the Worker. Cambridge, MA: Harvard University Press; 1939.
- . What happened at Hawthorne? Science. 1974;183(4128):922–932.
- , , , , . Validation of the Work Observation Method By Activity Timing (WOMBAT) method of conducting time‐motion observations in critical care settings: an observational study. BMC Med Inf Decis Mak. 2011;11:32.
- , . Alarm fatigue: a patient safety concern. AACN Adv Crit Care. 2013;24(4):378–386.
- , . Redesigning hospital alarms for patient safety: alarmed and potentially dangerous. JAMA. 2014;311(12):1199–1200.
- The Joint Commission. The Joint Commission announces 2014 National Patient Safety Goal. Jt Comm Perspect. 2013;33:1–4.
- Top 10 health technology hazards for 2014. Health Devices. 2013;42(11):354–380.
- My Philly Lawyer. Medical malpractice: alarm fatigue threatens patient safety. 2014. Available at: http://www.myphillylawyer.com/Resources/Legal-Articles/Medical-Malpractice-Alarm-Fatigue-Threatens-Patient-Safety.shtml. Accessed April 4, 2014.
- , , , et al. Pulse oximetry desaturation alarms on a general postoperative adult unit: a prospective observational study of nurse response time. Int J Nurs Stud. 2013;50(10):1351–1358.
- , , , , . A description of nurses' decision‐making in managing electrocardiographic monitor alarms [published online ahead of print May 10, 2014]. J Clin Nurs. doi:10.1111/jocn.12625.
- . Nurses' response to frequency and types of electrocardiography alarms in a non‐critical care setting: a descriptive study. Int J Nurs Stud. 2014;51(2):190–197.
© 2015 Society of Hospital Medicine

Bed Utilization in the PICU
Patient flow refers to the management and movement of patients in health care settings and is linked to quality, safety, and cost.16 The intensive care unit (ICU) is crucial in patient flow.7, 8 The limited number of beds and the resource‐intensive services and staffing associated with them require that hospitals optimize their utilization, as is increasingly true of all hospital resources. To maximize delivery of services to patients who need them and minimize real and opportunity losses (eg, postponed surgery, diverted transports, or inability to accept patients), patients in ICU beds should receive critical care medicine/nursing services while there and be transferred or discharged when appropriate.
The time between arrival and departure from any area of the hospital, including the ICU, is considered the time when a patient is receiving needed clinical carethe value‐added portion of health care operationsand time waiting to move on to the next step.911 This period includes both necessary logistics (eg, signing out a patient or waiting a reasonable amount of time for room cleaning) and nonvalue‐added time (eg, an excessively long amount of time for room cleaning). Operations management labels nonvalue‐added time as waste, and its reduction is vital for high‐quality health care.9, 12, 13 As in other industries, one important way to understand value versus waste is through direct observation.11, 14 Although operating rooms have been the subject of several published process improvement projects to improve efficiency,1518 inpatient beds have not been the subject of such scrutiny. The objectives of this study were to generate a direct observation method and use it to describe pediatric ICU (PICU) bed utilization from a value‐added perspective.
METHODS
An interdisciplinary work group of physicians, nurses, quality improvement specialists, and 1 operations management expert developed an Excel spreadsheet to categorize hour‐by‐hour status of PICU beds. The clinicians generated a list of 27 activities. A critical care nurse trained in quality improvement piloted the list for 3 separate 4‐hour blocks over 2 weeks adding 18 activities; 2 additional activities were added during the 5 weeks of observation (Table 1). (The recording tool is provided in the Supporting Information Appendix.) Three observers with knowledge of medical terminology (2 third‐year medical students and 1 premedical student with years of experience as an emergency medical technician) were trained over 12 hours to conduct the observations. Prior to the observations, the 3 observers also spent time in the PICU, and terminology used for recordings was reviewed. Interobserver reliability was checked during 3 sets of observation circuits by all 3 observers and the principal investigator, as well as by spot checks during the study.
| Activity Description | Activity Code | Total Hours Over 5 Weeks | % Total Hours Over 5 Weeks* | Mean Hours per Week* |
|---|---|---|---|---|
| ||||
| Ventilated patient | Vent | 8996 | 45 | 1799 |
| CCSs not otherwise specified | NOS | 2982 | 15 | 596 |
| Neurosurgery patient with ICU needs | NeurosurgICU | 1534 | 8 | 307 |
| Room empty and unassigned | Empty‐unassigned | 1511 | 8 | 302 |
| Patient on continuous infusion | ContinInfus | 958 | 5 | 192 |
| Awaiting floor bed assignment | Floorbedassign | 919 | 5 | 184 |
| Patient with arterial line | ArtLine | 508 | 3 | 102 |
| Patient on high‐flow nasal cannula | HFNC | 475 | 2 | 95 |
| Room cleaning | EVS | 318 | 2 | 64 |
| Patient <12 hours after extubation | PostVent | 226 | 1 | 45 |
| Patient in OR, bed being held | OR | 210 | 1 | 42 |
| Neurosurgery patient, post‐ICU needs | NeurosurgPostICU | 164 | 0.8 | 33 |
| No clear ICU need, but no other accepting floor or service | Unclear | 163 | 0.8 | 33 |
| Patient at procedure, bed being held | Proced | 133 | 0.7 | 27 |
| Patient awaiting a rehabilitation bed | Rehab | 99 | 0.5 | 20 |
| Patient with ventriculostomy | Ventriculostomy | 82 | 0.4 | 16 |
| Patient eligible to be in NICU | NICU | 76 | 0.4 | 15 |
| Patient awaiting social work, case management, prescriptions before discharge | AwaitingOtherServ | 66 | 0.3 | 13 |
| Empty bed, assigned to ED patient | Empty‐ED | 40 | 0.2 | 8 |
| Empty bed, assigned to incoming transport patient | Empty‐Transport | 37 | 0.2 | 7 |
| Patient awaiting transport to another facility | Transport | 37 | 0.2 | 7 |
| Patient awaiting consult to determine transfer | Consult | 33 | 0.2 | 7 |
| Patient awaiting physician or NP sign‐out to floor before transfer | CallMDNP | 30 | 0.2 | 6 |
| PICU room needs a bed for next patient | Bed | 26 | 0.1 | 5 |
| Patient eligible to be in CCU | CCU | 24 | 0.1 | 5 |
| Patient eligible to be in CICU | CICU | 24 | 0.1 | 5 |
| Patient awaiting laboratory result to determine transfer or discharge | LabResult | 21 | 0.1 | 4 |
| Patient awaiting a ride home | Ride | 21 | 0.1 | 4 |
| Empty bed, assigned to floor patient | Empty‐floor | 19 | 0.1 | 4 |
| Patient awaiting nursing report to floor for transfer | Callnurse | 18 | 0.1 | 4 |
| Patient eligible to be in PCU | PCU | 18 | 0.1 | 4 |
| Patient on cardiac pressor | Pressor | 16 | 0.1 | 3 |
| Patient actively coding | Code | 15 | 0.1 | 3 |
| Patient on continuous veno‐venous hemofiltration | CVVH | 15 | 0.1 | 3 |
| Nursing work needed to enable transfer out | Nursing | 11 | 0.1 | 2 |
| Patient awaiting order for transfer to floor | Order | 11 | 0.1 | 2 |
| Patient in interventional radiology, bed being held | IR | 10 | 0.1 | 2 |
| Patient deceased in PICU room | Deceased | 9 | 0.1 | 2 |
| Awaiting radiology result to clear transfer or discharge | RadResult | 9 | 0.1 | 2 |
| Patient awaiting a floor bed to be cleaned for transfer out | Floorbedclean | 7 | <0.1 | 1 |
| Other logistical need for an empty room | Logistics | 7 | <0.1 | 1 |
| Disagreement among services for disposition | Disagreement | 4 | <0.1 | 1 |
| Family request to stay in PICU | Family | 3 | <0.1 | 1 |
| Awaiting accepting attending/fellow for transfer out | Accept | 1 | <0.1 | <1 |
| PICU room needs a crib for next patient | Crib | 1 | <0.1 | <1 |
| Patient with preventable reason for being in PICU | Prev | 0 | 0 | 0 |
| PICU room needs specialty bed for next patient | SpecialBed | 0 | 0 | 0 |
| Total | 19,887 | 100 | ||
The targeted area included 24 single‐patient rooms. The activity of each bed was recorded hourly. Real‐time recording in to the Excel spreadsheet on a dedicated laptop occurred from 8:00 AM until 11:00 PM. The most visible or critical event was recorded. Although some activities were not mutually exclusive (eg, a patient could be ventilated and on a continuous infusion simultaneously), the objective was to identify when a room was being used for any critical care service, not enumerate all of them. The observers noted overnight events that occurred from 11:00 PM to 8:00 AM in the morning by reviewing the bedside record and talking to the staff to complete each day's 24‐hour recording. The observers also recorded the hospital‐wide census and the census for the other half of the PICU every 4 hours. The observations occurred over 5 noncontiguous weeks between January 2009 and April 2009.
After all observations were complete, activities were classified as critical care services (CCS) or noncritical‐care services (NCCS). NCCSs were further divided into necessary logistics (defined for analysis purposes as the first hour of any NCCS activity) or nonvalue‐added (the second or greater hour of NCCS). A time limit of 1 hour was chosen to define necessary logistics based on a consensus that nonclinical activities optimally would not take more than 1 hour each. We also analyzed results with 2 hours as the cutoff for necessary logistics. Admission, discharge, and transfer records were reviewed to check for returns to the PICU or hospital within 48 hours of transfer or discharge from the PICU.
Analyses were conducted using Microsoft Excel (Microsoft, Redmond, WA) and Stata 10.0 (StataCorp, College Station, TX). The study was approved by the Children's Hospital of Philadelphia Institutional Review Board with waiver of consent.
RESULTS
A total of 824 hours of recordings included 19,887 bed‐hours with 219 unique patients; among them, 2 remained from the first day of recording in January to the last day in April (sample recording in Figure 1). A total of 50 patients (range, 812 per week) stayed for the entirety of each 1‐week observation period. Of the 47 possible activities, 45 of them were recorded for at least 1 hour in the 5 weeks. Overall, 14 activities accounted for 95% of the observed bed‐hours and 31 activities accounted for the remaining 5%. CCS accounted for 82% of observed bed‐hours, NCCS accounted for 10.4%, and empty unassigned accounted for 8% (Figure 2). Using the 1‐hour cutoff for necessary services, 77% of NCCS time was nonvalue‐added, whereas 23% of it was necessary logistics; using the 2‐hour cutoff, 54% was nonvalue‐added, and 46% was necessary logistics.
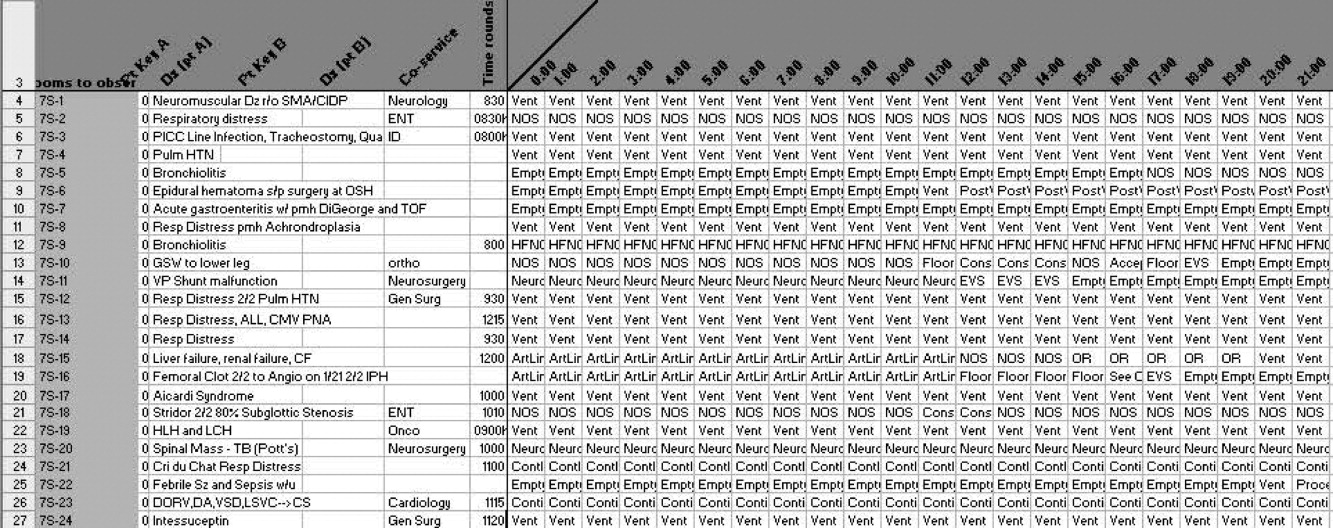
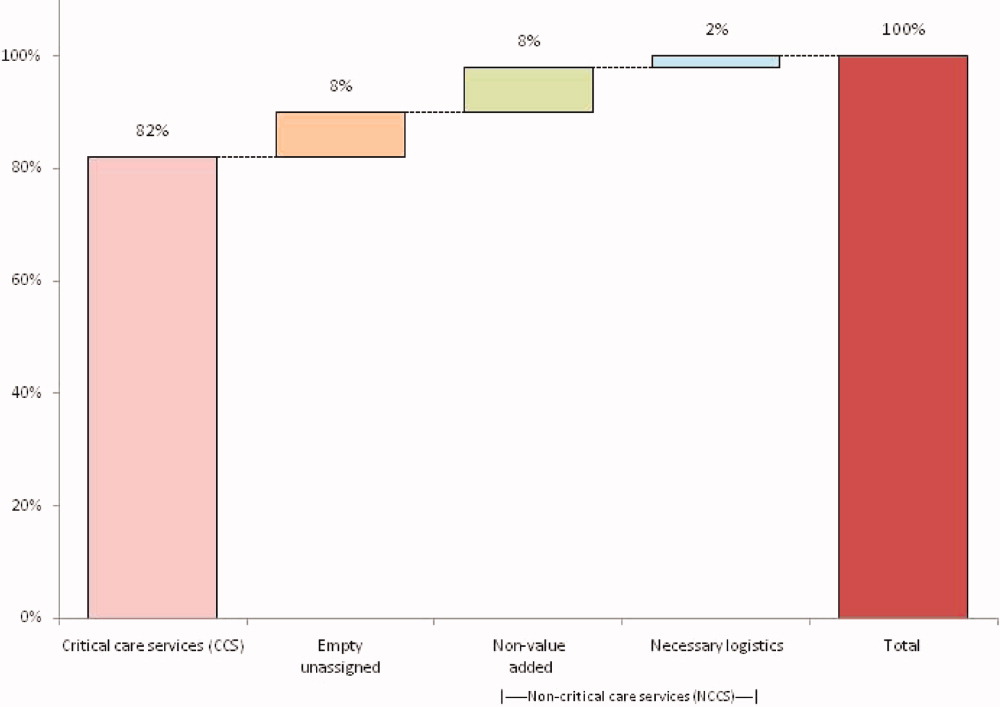
During the observation period, <1% of bed‐hours were used for CCS for overflow patients from the neonatal ICU (NICU), cardiac care unit (CCU), cardiac ICU (CICU), or progressive care unit (PCU; tracheostomy/ventilator unit). Although only 4 patients required transport to a rehabilitation facility, their wait time comprised 99 hours (<1%) of total recordings. Eight patients waited a mean of 2.6 hours for transportation home (maximum, 10 hours).
To demonstrate the cycle of room use, activities were divided into 4 categories: room preparation, critical care services, disposition pending, and postcritical care services (Figure 3). As an example of detailed data revealed by direct observation, we identified 102 instances totaling 919 hours when a patient was waiting for a bed assignment on another floor (5% of all bed‐hours). The mean wait time was 9 hours (range, 188 hours) and the median time was 5.5 hours. There were only 15 instances when floor bed assignment took 1 hour or less, and only 9 instances when it took 12 hours. Similarly, considerable time was spent on cleaning rooms between patients: only 66 of 146 instances of cleaning took 1 hour or less. The mean time for cleaning was 2.2 hours (range, 115), and the median was 2 hours. (There were 136 recorded instances of room cleaning and 10 additional episodes that were not recorded but had to be completed for the room to turnover from one patient to the next, yielding a total of 146 instances of cleaning.)
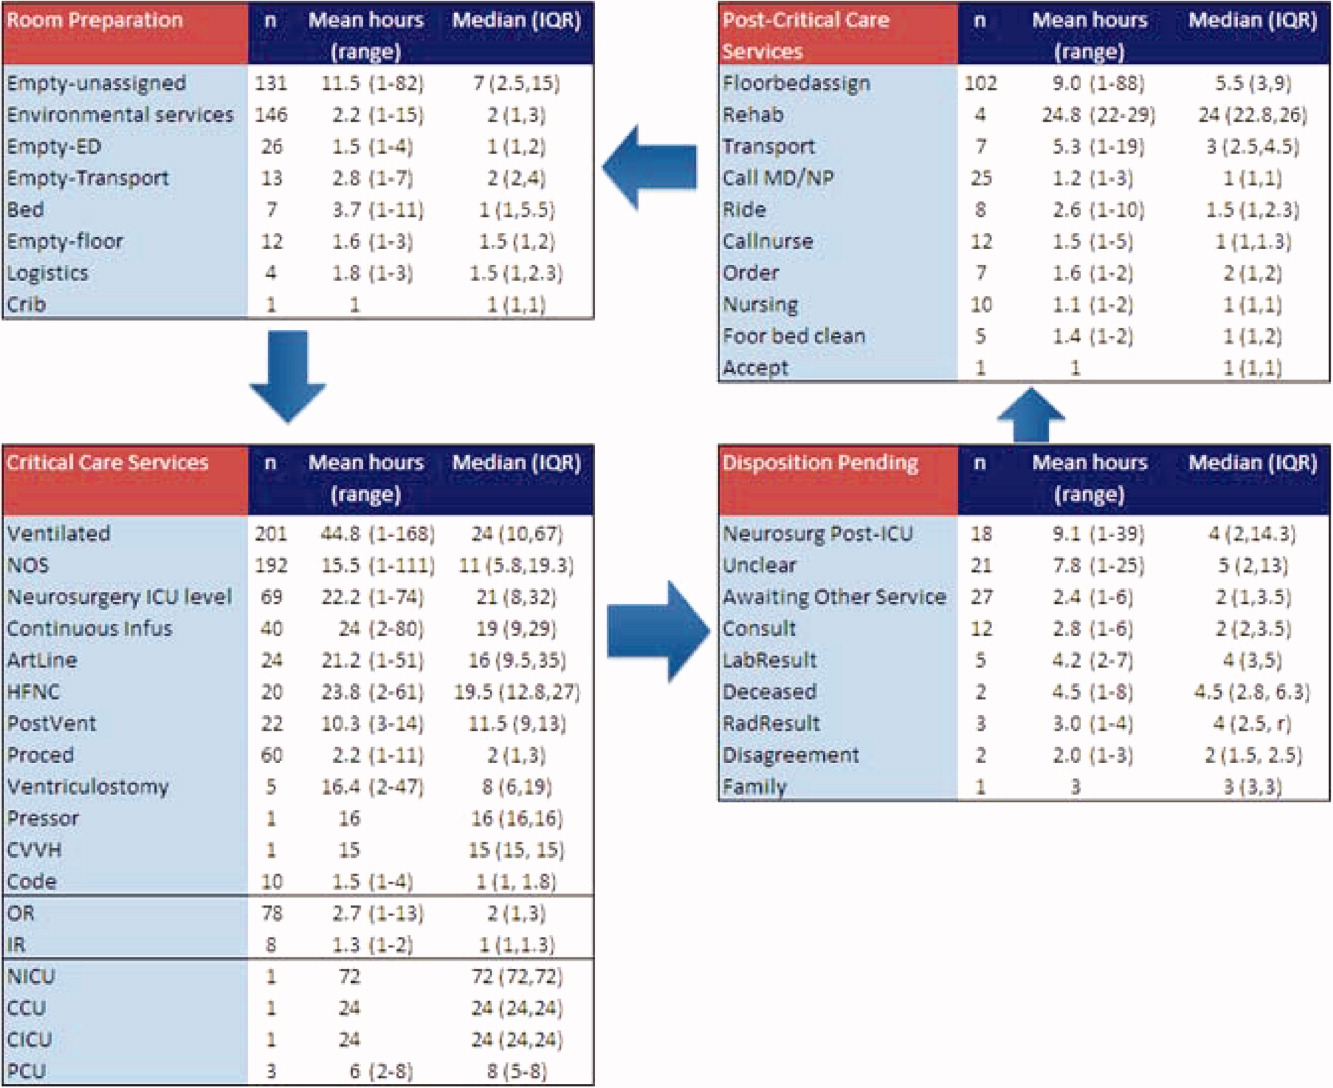
From the 824 hours of recording, we identified 200 hours (25% of time) when there were zero empty unassigned beds available in the section of the PICU being observed. Episodes of full occupancy occurred mostly on weekdays, with 23% of hours of full capacity on Thursdays, 21% on Mondays, and 21% on Wednesdays; only 8% were on Saturdays and <1% on Sundays. These 200 hours fell into 36 separate episodes of complete occupancy, each lasting 122 hours. Each patient, on average, received 3.1 hours of NCCS during each episode of full occupancy (range, 111 hours). Within these 200 hours at capacity, we identified only 15 hours (8%) when all 24 beds were used for CCS. For 72% of the time, there was at least 1 bed with NCCS, and for 37% at least 2 beds. A small portion of the time (7%), the lack of beds was affected by occupancy by patients who should have been in the NICU, CICU, CCU, or PCU.
Data collected through direct observation can be used to understand aggregated and averaged experiences, but also more specific time periods. For example, we identified 1 week with the highest consistent level of occupancy and turnover: March 915 had empty unassigned beds for only 4% of the week. Of the 168 hours in the week, 68 (40%) had full capacity. However, for 90% of the time, at least 1 bed was used for a NCCS. Other analytic options included varying the assumptions around time needed for logistics. Overall, NCCS time on necessary logistics changes from 23% to 46% using 1 hour versus 2 hours as the cutoff. For floor bed assignments, assuming that the first hour of this activity is necessary logistics and any hour thereafter is not, 817 hours were wasted. Even after assuming 2 hours of necessary logistical time (which may also include steps such as nursing and physician sign‐out to the receiving team, often not recorded in the observations), this left 715 hours of NCCS time in which patients waited to be placed elsewhere in the hospital. For room cleaning, because recordings were hourly, but room cleaning could take less time, we performed a sensitivity analysis, converting all 1‐hour recordings to half‐hour recordings to half‐hour recordings (an exaggerated shortening since industry‐standard cleaning may take longer).
Of the 219 patients directly observed, 15 were noted to be waiting for a transfer out of the PICU but experienced a change in disposition before the transfer. On average, these patients waited 8 hours for a floor bed assignment (range, 221) before reverting to a CCS, which then lasted an average of 16.5 hours (range, 149). (Included in this group are 2 patients who experienced this change in disposition twice.) In post hoc review across the 5 weeks, no patients were transferred back to the PICU within 48 hours after being transferred out. During the study period, 19 patients were discharged directly from the PICU (8 to home, 7 by transport to another facility, and 4 to rehabilitation). One patient returned to the hospital (but not the PICU) within 48 hours of being discharged home from the PICU.
During the study period, using the highest census value for recorded for each 24‐hour period and the number of beds available that day, median hospital‐wide occupancy was 93% (interquartile range, 90%96%). During the 35 days of observation, 71% of the days had occupancy >90%, 29% of days had occupancy >95%, and 3% of days had occupancy >100%.
DISCUSSION
In this direct observation of a PICU, we found high usage of beds for delivery of CCS. We identified many episodes in which the half of the PICU we observed was fully occupied (200 of 824 hours), but not necessarily delivering PICU‐level care to all patients. In fact, 75% of the full‐capacity hours had at least 1 patient receiving NCCS and 37% had at least 2. Patients waiting for a floor bed assignment represented nearly 5% of bed‐hours observed (mean 9 hours per patient). That full occupancy was not random, but rather clustered on weekdays, is consistent with other work showing that hospitals are at greater risk for midweek crowding due to the way in which scheduled admissions enter and leave.1925
Our methods provide the basis for operational analysis and improvement to patient flow, such as value stream mapping.9, 26 Process improvement work could be directed to areas of delay uncovered through this analysis and inform clinical and nonclinical management. For example, one of the key problems faced by the PICU was finding floor bed assignments for patients leaving the unit. Simply building more beds in the PICU will not solve this problemand at an estimated cost of $2 million to add a bed, it is likely not an efficient means of responding to poor flow. In these cases, the problem seems to lie downstream, and could suggest shortage of regular floor beds or inefficient bed assignment procedures within the hospital. The output also suggests that variation in nonclinical processes should be a target for improvement, such as time to clean rooms, because variation is known to be a source of nonvalue‐added time in many operations.9, 26 High occupancy on weekdays but low occupancy on weekends also emphasizes the potential for smoothing occupancy to reduce the risk of midweek crowding and to better manage bed utilization and staffing.24, 25
When seeking to reduce nonvalue‐added time, one must weigh the risks of increased efficiency against clinical outcomes. For example, if patients could be transferred out of the PICU faster, would the risk of returns to the PICU be higher? In this study, 15 patients (7%) had a change in disposition from awaiting transfer back to a CCS. The fact that transfers did not happen instantaneously may serve as a safety check to reduce rapid returns, but it is not possible for us to evaluate the reasons why patients did not actually complete the pending transfers. Specifically, we cannot determine whether the patient's clinical status objectively deteriorated, the ICU team made a judgment call to hold the patient, or the floor team refused to accept the transfer. Given this fact, although it appears in this study (and in the health care system more broadly) that there are opportunities to increase efficiency and reduce nonvalue‐added time, it is not realistic (nor advisable) that such time be reduced to zero. Along this line, one must consider separately purely nonclinical functions such as room cleaning and those that include some clinical element, such as time waiting for a patient to be transferred.
Beyond the direct findings of this study, the method should be replicable in other settings and can reveal important information about health care efficiency, capacity, and flexibility. The bottlenecks identified would have been difficult to identify through administrative record review. The exact amount of time to spend on observation may vary from place to place and would depend on the expected variation over time and the level of detail sought. In general, the more common the event and the less variation, the less time needed to observe it.
This study has several limitations that should be considered in terms of interpreting the results and in seeking to reproduce the approach. First, hourly recordings may not be discrete enough for events that took less than 1 hour. To assess the degree to which this would affect our results, we reanalyzed all NCCS by subtracting 30 minutes (0.5 hour) from all recordings, which increased total CCS from 82% to 87% and decreased NCCS by the same 5 percentage points. In a related fashion, our recordings were truncated at the start and end of each 1‐week period, so we could only observe a maximum of 168 hours for any given activity and did not record how long an activity was happening before or after the recordings started or stopped, respectively. Second, each recording could only be for 1 activity per hour. Separate from the level of granularity already noted, this also limits interpretation of critical care activities that may have been simultaneous. However, because the goal of the study was not to describe the provision of critical care services, but rather the times when they were not being delivered, this does not influence our conclusions. For movement of patients, however, we missed instances of physician and nursing calling sign‐out on patients to receiving units, as these events last less than 1 hour (and in the case of surgical patients, generally do not occur as the team provides continuous coverage). The time for such events is then included in other activities. To the extent that this may influence the results, it would increase the perceived time for nonvalue‐added services, but to a limited degree, and never by more than 59 minutes. Third, the overnight hours (11:00 PM to 8:00 AM) were not directly observed, but retrospectively recorded each morning by reviewing the records and discussing the overnight events with the clinical staff. For example, if a patient was intubated at 11:00 PM and at 8:00 AM, the observer would confirm this and record that status for the intervening hours. This is unlikely to result in a substantial impact on the findings, because the overnight hours have a relative degree of stability even for unstable patients in terms of their status of needing or not needing a CCS. Fourth, we did not evaluate the appropriateness of CCS delivered (eg, how long a patient was ventilated). Our definitions for CCS and NCSS were based on Children's Hospital of Philadelphia practices, which may not be the same as those of other facilities. The categorization of CCS was objective for activities such as ventilation or continuous infusion, but was less clear for the not otherwise specified recordings, which represented patients with a complex illness or projected organ, respiratory, cardiac, or neurological failure. These patients were not receiving a specific critical care intervention, but were deemed to need to be in the PICU as opposed to a regular floor (eg, for frequent monitoring of potential respiratory failure). It would also include patients receiving combinations of therapies more efficiently delivered in the PICU. For that, the observers relied on the judgment of clinicians (primarily nurses) to determine whether the patient needed to be in the PICU or not; if no specific reason could be provided, not otherwise specified was applied. These 192 instances accounted for 2982 aggregate bed‐hours (15% of total). It is difficult to judge the direction of bias, because overestimation of need to be in the PICU may be as likely to occur as underestimation. Fifth, the very presence of the observers may have changed behavior. Knowing that they were being observed staff may have acted with greater efficiency than otherwise. We expect that such a finding would lead to less time appearing as necessary logistics or NCCS. Finally, results may not be generalizable to other hospitals or hospital settings. There are clearly important contextual factors, not only for the location but also for the duration. For example, staffing was never an issue during the 5 weeks of observation, but there are locations where an empty bed is not necessarily usable due to lack of staffing. Nonetheless, we believe the results provide a generalizable approach and methodology for other settings (and staffing could be a reason for an empty bed).
In terms of the setting, as noted, we observed one discrete 24‐bed unit, which comprises half of the total PICU. Thus, statements that the PICU was at full capacity must be interpreted in the context that additional rooms may have been available on the other side. Patients are generally admitted alternately to each unit, so the occupancies should parallel each other. We recorded the census every 4 hours for both sides from the electronic system (Sunrise Clinical Manager [SCM]). However, this only accounts for patients physically in beds, not beds held for patients in other locations. Thus, we would expect a discrepancy between direct observation and the SCM value. Through analysis of the entire pediatric intensive care unit,* that part which observed directly, and that which we did not observe directly using census data, we think it reasonable to assert that both units of the total PICU had constrained capacity during the times we directly observed and recorded such constraint on one side.
This study demonstrates the use of direct observation for inpatient settings to learn about resource utilization and identification of value‐added services. PubMed searches for the terms efficiency, flow, process redesign, and time management bring up many more references for operating rooms than for ICUs or inpatient beds. Some examples of ICU‐directed work include videography of an ICU in Australia27 and human factor analysis in ICU nursing.5 Time‐motion studies have also been conducted on clinical staff, such as physicians.28, 29
In conclusion, we found that direct observation provided important insights into the utilization of patient rooms in an important inpatient setting. Data such as these are valuable for clinical and process improvement work, as well as understanding how best to match capacity to patient need. Finally, the methodology is reproducible for other settings and would be an additional tool to measuring and improving the efficiency and value of the health system. When appropriate, this approach can also evaluate the effectiveness of process improvement, help identify and reduce waste,13 and contribute to the growing field that merges operations management with hospital administration and clinical care: in other words, evidence‐based management.30
Acknowledgements
The authors thank Paula Agosto, Patricia Hubbs, Heidi Martin, and Annette Bollig for contributions to the study design.
In comparing direct observation to the SCM count, we found perfect concordance for 110 hours (55%) during which 0 beds were available. For the other 90 hours, SCM reported 1 bed being available in 46 hours (23%), 2 beds being available in 24 hours (12%), 3 beds being available in 17 hours (9%), and 4 beds being available in 3 hours (2%)all while we directly observed 0 beds being available. Thus, cumulatively, 90% of the hours observed with no beds had an SCM report availability of 02 beds; 99% of the time that was 03 beds. Applying this rate of mismatch to the unit that we did not observe directly, SCM reported 0 beds for 46 (23%) of the 200 hours the observation unit was full; SCM reported 1 bed available in 70 hours (35%), 2 beds open in 42 hours (21%), 3 beds open in 26 hours (13%), and 4 beds open in 16 hours (8%). Cumulatively, that is 79% of the time with 02 beds and 92% at 03 beds. From this, we conclude that the combined PICU for both sides was likely functionally full at least 158 of the 200 hours that the side we observed was full (79% 200 hours) and likely had very constrained capacity during the other 42 hours.
- ,,,,.The effect of hospital occupancy on emergency department length of stay and patient disposition.Acad Emerg Med.2003;10:127–133.
- ,,,.The effect of hospital bed occupancy on throughput in the pediatric emergency department.Ann Emerg Med.2009;53:767–776.
- ,,,.A Comparison of in‐hospital mortality risk conferred by high hospital occupancy, differences in nurse staffing levels, weekend admission, and seasonal influenza.Medical Care.2010;48:224–232.
- .Intensive care unit occupancy: making room for more patients.Crit Care Med.2009;37:1794–1795.
- ,.A human factors engineering conceptual framework of nursing workload and patient safety in intensive care units.Intensive Crit Care Nurs.2005;21:284–301.
- ,,, et al.High level of burnout in intensivists: prevalence and associated factors.Am J Respir Crit Care Med.2007;175:686–692.
- ,,.Length of stay and efficiency in pediatric intensive care units.J Pediatr.1998;133:79–85.
- ,.Variability in duration of stay in pediatric intensive care units: a multiinstitutional study.J Pediatr.1996;128:35–44.
- ,.Matching Supply with Demand: An Introduction to Operations Management.New York, NY:McGraw‐Hill;2006.
- ,.Impact of workload on service time and patient safety: an econometric analysis of hospital operations.Management Science.2009;55:1486–1498.
- .OPIM 631: Operations Management.Philadelphia, PA:Wharton School, University of Pennsylvania;2008.
- ,,.From waste to value in health care.JAMA.2008;299:568–571.
- .Eliminating “waste” in health care.JAMA.2009;302:2481–2482.
- .Toyota Production System: Beyond Large‐scale Production.London, UK:Productivity Press;1995.
- ,.Interdisciplinary work flow assessment and redesign decreases operating room turnover time and allows for additional caseload.Arch Surg.2006;141:65–69.
- ,,,.Improving operating room efficiency through process redesign.Surgery.2006;140:509–514.
- ,,,.Successful strategies for improving operating room efficiency at academic institutions.Anesth Analg.1998year="1998"1998;86:896–906.
- ,,.Efficiency of the operating room suite.Am J Surg.2003;185:244–250.
- ,,, et al.Children's hospitals do not acutely respond to high occupancy.Pediatrics.2010;125:974–981.
- Institute for Healthcare Improvement. Smoothing elective surgical admissions. Available at: http://www.ihi.org/IHI/Topics/Flow/Patient Flow/EmergingContent/SmoothingElectiveSurgicalAdmissions.htm. Accessed October 24,2008.
- Boston Hospital Sees Big Impact from Smoothing Elective Schedule.OR Manager. Volume 20, no. 12,2004.
- ,.Rethinking rapid response teams.JAMA.2010;304:1375–1376.
- Litvak E, ed.Managing Patient Flow in Hospitals: Strategies and Solutions.2nd ed.Oak Brook, IL:Joint Commission Resources;2009.
- ,,,,,.Scheduled admissions and high occupancy at a children's hospital.J Hosp Med.2011;6:81–87.
- ,,, et al.Addressing inpatient crowding by smoothing occupancy at children's hospitals.J Hosp Med.2011;6:466–473.
- ,.Learning to See: Value Stream Mapping to Add Value and Eliminate MUDA.Cambridge, MA:Lean Enterprise Institute;1999.
- ,,.Reshaping ICU ward round practices using video‐reflexive ethnography.Qual Health Res.2008;18:380–390.
- ,,.How hospitalists spend their time: insights on efficiency and safety.J Hosp Med.2006;1:88–93.
- ,,, et al.Where did the day go? A time‐motion study of hospitalists.J Hosp Med2010;5:323–238.
- ,,.Improving patient care by linking evidence‐based medicine and evidence‐based management.JAMA.2007;298:673–676.
Patient flow refers to the management and movement of patients in health care settings and is linked to quality, safety, and cost.16 The intensive care unit (ICU) is crucial in patient flow.7, 8 The limited number of beds and the resource‐intensive services and staffing associated with them require that hospitals optimize their utilization, as is increasingly true of all hospital resources. To maximize delivery of services to patients who need them and minimize real and opportunity losses (eg, postponed surgery, diverted transports, or inability to accept patients), patients in ICU beds should receive critical care medicine/nursing services while there and be transferred or discharged when appropriate.
The time between arrival and departure from any area of the hospital, including the ICU, is considered the time when a patient is receiving needed clinical carethe value‐added portion of health care operationsand time waiting to move on to the next step.911 This period includes both necessary logistics (eg, signing out a patient or waiting a reasonable amount of time for room cleaning) and nonvalue‐added time (eg, an excessively long amount of time for room cleaning). Operations management labels nonvalue‐added time as waste, and its reduction is vital for high‐quality health care.9, 12, 13 As in other industries, one important way to understand value versus waste is through direct observation.11, 14 Although operating rooms have been the subject of several published process improvement projects to improve efficiency,1518 inpatient beds have not been the subject of such scrutiny. The objectives of this study were to generate a direct observation method and use it to describe pediatric ICU (PICU) bed utilization from a value‐added perspective.
METHODS
An interdisciplinary work group of physicians, nurses, quality improvement specialists, and 1 operations management expert developed an Excel spreadsheet to categorize hour‐by‐hour status of PICU beds. The clinicians generated a list of 27 activities. A critical care nurse trained in quality improvement piloted the list for 3 separate 4‐hour blocks over 2 weeks adding 18 activities; 2 additional activities were added during the 5 weeks of observation (Table 1). (The recording tool is provided in the Supporting Information Appendix.) Three observers with knowledge of medical terminology (2 third‐year medical students and 1 premedical student with years of experience as an emergency medical technician) were trained over 12 hours to conduct the observations. Prior to the observations, the 3 observers also spent time in the PICU, and terminology used for recordings was reviewed. Interobserver reliability was checked during 3 sets of observation circuits by all 3 observers and the principal investigator, as well as by spot checks during the study.
| Activity Description | Activity Code | Total Hours Over 5 Weeks | % Total Hours Over 5 Weeks* | Mean Hours per Week* |
|---|---|---|---|---|
| ||||
| Ventilated patient | Vent | 8996 | 45 | 1799 |
| CCSs not otherwise specified | NOS | 2982 | 15 | 596 |
| Neurosurgery patient with ICU needs | NeurosurgICU | 1534 | 8 | 307 |
| Room empty and unassigned | Empty‐unassigned | 1511 | 8 | 302 |
| Patient on continuous infusion | ContinInfus | 958 | 5 | 192 |
| Awaiting floor bed assignment | Floorbedassign | 919 | 5 | 184 |
| Patient with arterial line | ArtLine | 508 | 3 | 102 |
| Patient on high‐flow nasal cannula | HFNC | 475 | 2 | 95 |
| Room cleaning | EVS | 318 | 2 | 64 |
| Patient <12 hours after extubation | PostVent | 226 | 1 | 45 |
| Patient in OR, bed being held | OR | 210 | 1 | 42 |
| Neurosurgery patient, post‐ICU needs | NeurosurgPostICU | 164 | 0.8 | 33 |
| No clear ICU need, but no other accepting floor or service | Unclear | 163 | 0.8 | 33 |
| Patient at procedure, bed being held | Proced | 133 | 0.7 | 27 |
| Patient awaiting a rehabilitation bed | Rehab | 99 | 0.5 | 20 |
| Patient with ventriculostomy | Ventriculostomy | 82 | 0.4 | 16 |
| Patient eligible to be in NICU | NICU | 76 | 0.4 | 15 |
| Patient awaiting social work, case management, prescriptions before discharge | AwaitingOtherServ | 66 | 0.3 | 13 |
| Empty bed, assigned to ED patient | Empty‐ED | 40 | 0.2 | 8 |
| Empty bed, assigned to incoming transport patient | Empty‐Transport | 37 | 0.2 | 7 |
| Patient awaiting transport to another facility | Transport | 37 | 0.2 | 7 |
| Patient awaiting consult to determine transfer | Consult | 33 | 0.2 | 7 |
| Patient awaiting physician or NP sign‐out to floor before transfer | CallMDNP | 30 | 0.2 | 6 |
| PICU room needs a bed for next patient | Bed | 26 | 0.1 | 5 |
| Patient eligible to be in CCU | CCU | 24 | 0.1 | 5 |
| Patient eligible to be in CICU | CICU | 24 | 0.1 | 5 |
| Patient awaiting laboratory result to determine transfer or discharge | LabResult | 21 | 0.1 | 4 |
| Patient awaiting a ride home | Ride | 21 | 0.1 | 4 |
| Empty bed, assigned to floor patient | Empty‐floor | 19 | 0.1 | 4 |
| Patient awaiting nursing report to floor for transfer | Callnurse | 18 | 0.1 | 4 |
| Patient eligible to be in PCU | PCU | 18 | 0.1 | 4 |
| Patient on cardiac pressor | Pressor | 16 | 0.1 | 3 |
| Patient actively coding | Code | 15 | 0.1 | 3 |
| Patient on continuous veno‐venous hemofiltration | CVVH | 15 | 0.1 | 3 |
| Nursing work needed to enable transfer out | Nursing | 11 | 0.1 | 2 |
| Patient awaiting order for transfer to floor | Order | 11 | 0.1 | 2 |
| Patient in interventional radiology, bed being held | IR | 10 | 0.1 | 2 |
| Patient deceased in PICU room | Deceased | 9 | 0.1 | 2 |
| Awaiting radiology result to clear transfer or discharge | RadResult | 9 | 0.1 | 2 |
| Patient awaiting a floor bed to be cleaned for transfer out | Floorbedclean | 7 | <0.1 | 1 |
| Other logistical need for an empty room | Logistics | 7 | <0.1 | 1 |
| Disagreement among services for disposition | Disagreement | 4 | <0.1 | 1 |
| Family request to stay in PICU | Family | 3 | <0.1 | 1 |
| Awaiting accepting attending/fellow for transfer out | Accept | 1 | <0.1 | <1 |
| PICU room needs a crib for next patient | Crib | 1 | <0.1 | <1 |
| Patient with preventable reason for being in PICU | Prev | 0 | 0 | 0 |
| PICU room needs specialty bed for next patient | SpecialBed | 0 | 0 | 0 |
| Total | 19,887 | 100 | ||
The targeted area included 24 single‐patient rooms. The activity of each bed was recorded hourly. Real‐time recording in to the Excel spreadsheet on a dedicated laptop occurred from 8:00 AM until 11:00 PM. The most visible or critical event was recorded. Although some activities were not mutually exclusive (eg, a patient could be ventilated and on a continuous infusion simultaneously), the objective was to identify when a room was being used for any critical care service, not enumerate all of them. The observers noted overnight events that occurred from 11:00 PM to 8:00 AM in the morning by reviewing the bedside record and talking to the staff to complete each day's 24‐hour recording. The observers also recorded the hospital‐wide census and the census for the other half of the PICU every 4 hours. The observations occurred over 5 noncontiguous weeks between January 2009 and April 2009.
After all observations were complete, activities were classified as critical care services (CCS) or noncritical‐care services (NCCS). NCCSs were further divided into necessary logistics (defined for analysis purposes as the first hour of any NCCS activity) or nonvalue‐added (the second or greater hour of NCCS). A time limit of 1 hour was chosen to define necessary logistics based on a consensus that nonclinical activities optimally would not take more than 1 hour each. We also analyzed results with 2 hours as the cutoff for necessary logistics. Admission, discharge, and transfer records were reviewed to check for returns to the PICU or hospital within 48 hours of transfer or discharge from the PICU.
Analyses were conducted using Microsoft Excel (Microsoft, Redmond, WA) and Stata 10.0 (StataCorp, College Station, TX). The study was approved by the Children's Hospital of Philadelphia Institutional Review Board with waiver of consent.
RESULTS
A total of 824 hours of recordings included 19,887 bed‐hours with 219 unique patients; among them, 2 remained from the first day of recording in January to the last day in April (sample recording in Figure 1). A total of 50 patients (range, 812 per week) stayed for the entirety of each 1‐week observation period. Of the 47 possible activities, 45 of them were recorded for at least 1 hour in the 5 weeks. Overall, 14 activities accounted for 95% of the observed bed‐hours and 31 activities accounted for the remaining 5%. CCS accounted for 82% of observed bed‐hours, NCCS accounted for 10.4%, and empty unassigned accounted for 8% (Figure 2). Using the 1‐hour cutoff for necessary services, 77% of NCCS time was nonvalue‐added, whereas 23% of it was necessary logistics; using the 2‐hour cutoff, 54% was nonvalue‐added, and 46% was necessary logistics.
During the observation period, <1% of bed‐hours were used for CCS for overflow patients from the neonatal ICU (NICU), cardiac care unit (CCU), cardiac ICU (CICU), or progressive care unit (PCU; tracheostomy/ventilator unit). Although only 4 patients required transport to a rehabilitation facility, their wait time comprised 99 hours (<1%) of total recordings. Eight patients waited a mean of 2.6 hours for transportation home (maximum, 10 hours).
To demonstrate the cycle of room use, activities were divided into 4 categories: room preparation, critical care services, disposition pending, and postcritical care services (Figure 3). As an example of detailed data revealed by direct observation, we identified 102 instances totaling 919 hours when a patient was waiting for a bed assignment on another floor (5% of all bed‐hours). The mean wait time was 9 hours (range, 188 hours) and the median time was 5.5 hours. There were only 15 instances when floor bed assignment took 1 hour or less, and only 9 instances when it took 12 hours. Similarly, considerable time was spent on cleaning rooms between patients: only 66 of 146 instances of cleaning took 1 hour or less. The mean time for cleaning was 2.2 hours (range, 115), and the median was 2 hours. (There were 136 recorded instances of room cleaning and 10 additional episodes that were not recorded but had to be completed for the room to turnover from one patient to the next, yielding a total of 146 instances of cleaning.)
From the 824 hours of recording, we identified 200 hours (25% of time) when there were zero empty unassigned beds available in the section of the PICU being observed. Episodes of full occupancy occurred mostly on weekdays, with 23% of hours of full capacity on Thursdays, 21% on Mondays, and 21% on Wednesdays; only 8% were on Saturdays and <1% on Sundays. These 200 hours fell into 36 separate episodes of complete occupancy, each lasting 122 hours. Each patient, on average, received 3.1 hours of NCCS during each episode of full occupancy (range, 111 hours). Within these 200 hours at capacity, we identified only 15 hours (8%) when all 24 beds were used for CCS. For 72% of the time, there was at least 1 bed with NCCS, and for 37% at least 2 beds. A small portion of the time (7%), the lack of beds was affected by occupancy by patients who should have been in the NICU, CICU, CCU, or PCU.
Data collected through direct observation can be used to understand aggregated and averaged experiences, but also more specific time periods. For example, we identified 1 week with the highest consistent level of occupancy and turnover: March 915 had empty unassigned beds for only 4% of the week. Of the 168 hours in the week, 68 (40%) had full capacity. However, for 90% of the time, at least 1 bed was used for a NCCS. Other analytic options included varying the assumptions around time needed for logistics. Overall, NCCS time on necessary logistics changes from 23% to 46% using 1 hour versus 2 hours as the cutoff. For floor bed assignments, assuming that the first hour of this activity is necessary logistics and any hour thereafter is not, 817 hours were wasted. Even after assuming 2 hours of necessary logistical time (which may also include steps such as nursing and physician sign‐out to the receiving team, often not recorded in the observations), this left 715 hours of NCCS time in which patients waited to be placed elsewhere in the hospital. For room cleaning, because recordings were hourly, but room cleaning could take less time, we performed a sensitivity analysis, converting all 1‐hour recordings to half‐hour recordings to half‐hour recordings (an exaggerated shortening since industry‐standard cleaning may take longer).
Of the 219 patients directly observed, 15 were noted to be waiting for a transfer out of the PICU but experienced a change in disposition before the transfer. On average, these patients waited 8 hours for a floor bed assignment (range, 221) before reverting to a CCS, which then lasted an average of 16.5 hours (range, 149). (Included in this group are 2 patients who experienced this change in disposition twice.) In post hoc review across the 5 weeks, no patients were transferred back to the PICU within 48 hours after being transferred out. During the study period, 19 patients were discharged directly from the PICU (8 to home, 7 by transport to another facility, and 4 to rehabilitation). One patient returned to the hospital (but not the PICU) within 48 hours of being discharged home from the PICU.
During the study period, using the highest census value for recorded for each 24‐hour period and the number of beds available that day, median hospital‐wide occupancy was 93% (interquartile range, 90%96%). During the 35 days of observation, 71% of the days had occupancy >90%, 29% of days had occupancy >95%, and 3% of days had occupancy >100%.
DISCUSSION
In this direct observation of a PICU, we found high usage of beds for delivery of CCS. We identified many episodes in which the half of the PICU we observed was fully occupied (200 of 824 hours), but not necessarily delivering PICU‐level care to all patients. In fact, 75% of the full‐capacity hours had at least 1 patient receiving NCCS and 37% had at least 2. Patients waiting for a floor bed assignment represented nearly 5% of bed‐hours observed (mean 9 hours per patient). That full occupancy was not random, but rather clustered on weekdays, is consistent with other work showing that hospitals are at greater risk for midweek crowding due to the way in which scheduled admissions enter and leave.1925
Our methods provide the basis for operational analysis and improvement to patient flow, such as value stream mapping.9, 26 Process improvement work could be directed to areas of delay uncovered through this analysis and inform clinical and nonclinical management. For example, one of the key problems faced by the PICU was finding floor bed assignments for patients leaving the unit. Simply building more beds in the PICU will not solve this problemand at an estimated cost of $2 million to add a bed, it is likely not an efficient means of responding to poor flow. In these cases, the problem seems to lie downstream, and could suggest shortage of regular floor beds or inefficient bed assignment procedures within the hospital. The output also suggests that variation in nonclinical processes should be a target for improvement, such as time to clean rooms, because variation is known to be a source of nonvalue‐added time in many operations.9, 26 High occupancy on weekdays but low occupancy on weekends also emphasizes the potential for smoothing occupancy to reduce the risk of midweek crowding and to better manage bed utilization and staffing.24, 25
When seeking to reduce nonvalue‐added time, one must weigh the risks of increased efficiency against clinical outcomes. For example, if patients could be transferred out of the PICU faster, would the risk of returns to the PICU be higher? In this study, 15 patients (7%) had a change in disposition from awaiting transfer back to a CCS. The fact that transfers did not happen instantaneously may serve as a safety check to reduce rapid returns, but it is not possible for us to evaluate the reasons why patients did not actually complete the pending transfers. Specifically, we cannot determine whether the patient's clinical status objectively deteriorated, the ICU team made a judgment call to hold the patient, or the floor team refused to accept the transfer. Given this fact, although it appears in this study (and in the health care system more broadly) that there are opportunities to increase efficiency and reduce nonvalue‐added time, it is not realistic (nor advisable) that such time be reduced to zero. Along this line, one must consider separately purely nonclinical functions such as room cleaning and those that include some clinical element, such as time waiting for a patient to be transferred.
Beyond the direct findings of this study, the method should be replicable in other settings and can reveal important information about health care efficiency, capacity, and flexibility. The bottlenecks identified would have been difficult to identify through administrative record review. The exact amount of time to spend on observation may vary from place to place and would depend on the expected variation over time and the level of detail sought. In general, the more common the event and the less variation, the less time needed to observe it.
This study has several limitations that should be considered in terms of interpreting the results and in seeking to reproduce the approach. First, hourly recordings may not be discrete enough for events that took less than 1 hour. To assess the degree to which this would affect our results, we reanalyzed all NCCS by subtracting 30 minutes (0.5 hour) from all recordings, which increased total CCS from 82% to 87% and decreased NCCS by the same 5 percentage points. In a related fashion, our recordings were truncated at the start and end of each 1‐week period, so we could only observe a maximum of 168 hours for any given activity and did not record how long an activity was happening before or after the recordings started or stopped, respectively. Second, each recording could only be for 1 activity per hour. Separate from the level of granularity already noted, this also limits interpretation of critical care activities that may have been simultaneous. However, because the goal of the study was not to describe the provision of critical care services, but rather the times when they were not being delivered, this does not influence our conclusions. For movement of patients, however, we missed instances of physician and nursing calling sign‐out on patients to receiving units, as these events last less than 1 hour (and in the case of surgical patients, generally do not occur as the team provides continuous coverage). The time for such events is then included in other activities. To the extent that this may influence the results, it would increase the perceived time for nonvalue‐added services, but to a limited degree, and never by more than 59 minutes. Third, the overnight hours (11:00 PM to 8:00 AM) were not directly observed, but retrospectively recorded each morning by reviewing the records and discussing the overnight events with the clinical staff. For example, if a patient was intubated at 11:00 PM and at 8:00 AM, the observer would confirm this and record that status for the intervening hours. This is unlikely to result in a substantial impact on the findings, because the overnight hours have a relative degree of stability even for unstable patients in terms of their status of needing or not needing a CCS. Fourth, we did not evaluate the appropriateness of CCS delivered (eg, how long a patient was ventilated). Our definitions for CCS and NCSS were based on Children's Hospital of Philadelphia practices, which may not be the same as those of other facilities. The categorization of CCS was objective for activities such as ventilation or continuous infusion, but was less clear for the not otherwise specified recordings, which represented patients with a complex illness or projected organ, respiratory, cardiac, or neurological failure. These patients were not receiving a specific critical care intervention, but were deemed to need to be in the PICU as opposed to a regular floor (eg, for frequent monitoring of potential respiratory failure). It would also include patients receiving combinations of therapies more efficiently delivered in the PICU. For that, the observers relied on the judgment of clinicians (primarily nurses) to determine whether the patient needed to be in the PICU or not; if no specific reason could be provided, not otherwise specified was applied. These 192 instances accounted for 2982 aggregate bed‐hours (15% of total). It is difficult to judge the direction of bias, because overestimation of need to be in the PICU may be as likely to occur as underestimation. Fifth, the very presence of the observers may have changed behavior. Knowing that they were being observed staff may have acted with greater efficiency than otherwise. We expect that such a finding would lead to less time appearing as necessary logistics or NCCS. Finally, results may not be generalizable to other hospitals or hospital settings. There are clearly important contextual factors, not only for the location but also for the duration. For example, staffing was never an issue during the 5 weeks of observation, but there are locations where an empty bed is not necessarily usable due to lack of staffing. Nonetheless, we believe the results provide a generalizable approach and methodology for other settings (and staffing could be a reason for an empty bed).
In terms of the setting, as noted, we observed one discrete 24‐bed unit, which comprises half of the total PICU. Thus, statements that the PICU was at full capacity must be interpreted in the context that additional rooms may have been available on the other side. Patients are generally admitted alternately to each unit, so the occupancies should parallel each other. We recorded the census every 4 hours for both sides from the electronic system (Sunrise Clinical Manager [SCM]). However, this only accounts for patients physically in beds, not beds held for patients in other locations. Thus, we would expect a discrepancy between direct observation and the SCM value. Through analysis of the entire pediatric intensive care unit,* that part which observed directly, and that which we did not observe directly using census data, we think it reasonable to assert that both units of the total PICU had constrained capacity during the times we directly observed and recorded such constraint on one side.
This study demonstrates the use of direct observation for inpatient settings to learn about resource utilization and identification of value‐added services. PubMed searches for the terms efficiency, flow, process redesign, and time management bring up many more references for operating rooms than for ICUs or inpatient beds. Some examples of ICU‐directed work include videography of an ICU in Australia27 and human factor analysis in ICU nursing.5 Time‐motion studies have also been conducted on clinical staff, such as physicians.28, 29
In conclusion, we found that direct observation provided important insights into the utilization of patient rooms in an important inpatient setting. Data such as these are valuable for clinical and process improvement work, as well as understanding how best to match capacity to patient need. Finally, the methodology is reproducible for other settings and would be an additional tool to measuring and improving the efficiency and value of the health system. When appropriate, this approach can also evaluate the effectiveness of process improvement, help identify and reduce waste,13 and contribute to the growing field that merges operations management with hospital administration and clinical care: in other words, evidence‐based management.30
Acknowledgements
The authors thank Paula Agosto, Patricia Hubbs, Heidi Martin, and Annette Bollig for contributions to the study design.
In comparing direct observation to the SCM count, we found perfect concordance for 110 hours (55%) during which 0 beds were available. For the other 90 hours, SCM reported 1 bed being available in 46 hours (23%), 2 beds being available in 24 hours (12%), 3 beds being available in 17 hours (9%), and 4 beds being available in 3 hours (2%)all while we directly observed 0 beds being available. Thus, cumulatively, 90% of the hours observed with no beds had an SCM report availability of 02 beds; 99% of the time that was 03 beds. Applying this rate of mismatch to the unit that we did not observe directly, SCM reported 0 beds for 46 (23%) of the 200 hours the observation unit was full; SCM reported 1 bed available in 70 hours (35%), 2 beds open in 42 hours (21%), 3 beds open in 26 hours (13%), and 4 beds open in 16 hours (8%). Cumulatively, that is 79% of the time with 02 beds and 92% at 03 beds. From this, we conclude that the combined PICU for both sides was likely functionally full at least 158 of the 200 hours that the side we observed was full (79% 200 hours) and likely had very constrained capacity during the other 42 hours.
- ,,,,.The effect of hospital occupancy on emergency department length of stay and patient disposition.Acad Emerg Med.2003;10:127–133.
- ,,,.The effect of hospital bed occupancy on throughput in the pediatric emergency department.Ann Emerg Med.2009;53:767–776.
- ,,,.A Comparison of in‐hospital mortality risk conferred by high hospital occupancy, differences in nurse staffing levels, weekend admission, and seasonal influenza.Medical Care.2010;48:224–232.
- .Intensive care unit occupancy: making room for more patients.Crit Care Med.2009;37:1794–1795.
- ,.A human factors engineering conceptual framework of nursing workload and patient safety in intensive care units.Intensive Crit Care Nurs.2005;21:284–301.
- ,,, et al.High level of burnout in intensivists: prevalence and associated factors.Am J Respir Crit Care Med.2007;175:686–692.
- ,,.Length of stay and efficiency in pediatric intensive care units.J Pediatr.1998;133:79–85.
- ,.Variability in duration of stay in pediatric intensive care units: a multiinstitutional study.J Pediatr.1996;128:35–44.
- ,.Matching Supply with Demand: An Introduction to Operations Management.New York, NY:McGraw‐Hill;2006.
- ,.Impact of workload on service time and patient safety: an econometric analysis of hospital operations.Management Science.2009;55:1486–1498.
- .OPIM 631: Operations Management.Philadelphia, PA:Wharton School, University of Pennsylvania;2008.
- ,,.From waste to value in health care.JAMA.2008;299:568–571.
- .Eliminating “waste” in health care.JAMA.2009;302:2481–2482.
- .Toyota Production System: Beyond Large‐scale Production.London, UK:Productivity Press;1995.
- ,.Interdisciplinary work flow assessment and redesign decreases operating room turnover time and allows for additional caseload.Arch Surg.2006;141:65–69.
- ,,,.Improving operating room efficiency through process redesign.Surgery.2006;140:509–514.
- ,,,.Successful strategies for improving operating room efficiency at academic institutions.Anesth Analg.1998year="1998"1998;86:896–906.
- ,,.Efficiency of the operating room suite.Am J Surg.2003;185:244–250.
- ,,, et al.Children's hospitals do not acutely respond to high occupancy.Pediatrics.2010;125:974–981.
- Institute for Healthcare Improvement. Smoothing elective surgical admissions. Available at: http://www.ihi.org/IHI/Topics/Flow/Patient Flow/EmergingContent/SmoothingElectiveSurgicalAdmissions.htm. Accessed October 24,2008.
- Boston Hospital Sees Big Impact from Smoothing Elective Schedule.OR Manager. Volume 20, no. 12,2004.
- ,.Rethinking rapid response teams.JAMA.2010;304:1375–1376.
- Litvak E, ed.Managing Patient Flow in Hospitals: Strategies and Solutions.2nd ed.Oak Brook, IL:Joint Commission Resources;2009.
- ,,,,,.Scheduled admissions and high occupancy at a children's hospital.J Hosp Med.2011;6:81–87.
- ,,, et al.Addressing inpatient crowding by smoothing occupancy at children's hospitals.J Hosp Med.2011;6:466–473.
- ,.Learning to See: Value Stream Mapping to Add Value and Eliminate MUDA.Cambridge, MA:Lean Enterprise Institute;1999.
- ,,.Reshaping ICU ward round practices using video‐reflexive ethnography.Qual Health Res.2008;18:380–390.
- ,,.How hospitalists spend their time: insights on efficiency and safety.J Hosp Med.2006;1:88–93.
- ,,, et al.Where did the day go? A time‐motion study of hospitalists.J Hosp Med2010;5:323–238.
- ,,.Improving patient care by linking evidence‐based medicine and evidence‐based management.JAMA.2007;298:673–676.
Copyright © 2011 Society of Hospital Medicine

Pediatric Deterioration Risk Score
Thousands of hospitals have implemented rapid response systems in recent years in attempts to reduce mortality outside the intensive care unit (ICU).1 These systems have 2 components, a response arm and an identification arm. The response arm is usually comprised of a multidisciplinary critical care team that responds to calls for urgent assistance outside the ICU; this team is often called a rapid response team or a medical emergency team. The identification arm comes in 2 forms, predictive and detective. Predictive tools estimate a patient's risk of deterioration over time based on factors that are not rapidly changing, such as elements of the patient's history. In contrast, detective tools include highly time‐varying signs of active deterioration, such as vital sign abnormalities.2 To date, most pediatric studies have focused on developing detective tools, including several early warning scores.38
In this study, we sought to identify the characteristics that increase the probability that a hospitalized child will deteriorate, and combine these characteristics into a predictive score. Tools like this may be helpful in identifying and triaging the subset of high‐risk children who should be intensively monitored for early signs of deterioration at the time of admission, as well as in identifying very low‐risk children who, in the absence of other clinical concerns, may be monitored less intensively.
METHODS
Detailed methods, including the inclusion/exclusion criteria, the matching procedures, and a full description of the statistical analysis are provided as an appendix (see Supporting Online Appendix: Supplement to Methods Section in the online version of this article). An abbreviated version follows.
Design
We performed a case‐control study among children, younger than 18 years old, hospitalized for >24 hours between January 1, 2005 and December 31, 2008. The case group consisted of children who experienced clinical deterioration, a composite outcome defined as cardiopulmonary arrest (CPA), acute respiratory compromise (ARC), or urgent ICU transfer, while on a non‐ICU unit. ICU transfers were considered urgent if they included at least one of the following outcomes in the 12 hours after transfer: death, CPA, intubation, initiation of noninvasive ventilation, or administration of a vasoactive medication infusion used for the treatment of shock. The control group consisted of a random sample of patients matched 3:1 to cases if they met the criteria of being on a non‐ICU unit at the same time as their matched case.
Variables and Measurements
We collected data on demographics, complex chronic conditions (CCCs), other patient characteristics, and laboratory studies. CCCs were specific diagnoses divided into the following 9 categories according to an established framework: neuromuscular, cardiovascular, respiratory, renal, gastrointestinal, hematologic/emmmunologic, metabolic, malignancy, and genetic/congenital defects.9 Other patient characteristics evaluated included age, weight‐for‐age, gestational age, history of transplant, time from hospital admission to event, recent ICU stays, administration of total parenteral nutrition, use of a patient‐controlled analgesia pump, and presence of medical devices including central venous lines and enteral tubes (naso‐gastric, gastrostomy, or jejunostomy).
Laboratory studies evaluated included hemoglobin value, white blood cell count, and blood culture drawn in the preceding 72 hours. We included these laboratory studies in this predictive score because we hypothesized that they represented factors that increased a child's risk of deterioration over time, as opposed to signs of acute deterioration that would be more appropriate for a detective score.
Statistical Analysis
We used conditional logistic regression for the bivariable and multivariable analyses to account for the matching. We derived the predictive score using an established method10 in which the regression coefficients for each covariate were divided by the smallest coefficient, and then rounded to the nearest integer, to establish each variable's sub‐score. We grouped the total scores into very low, low, intermediate, and high‐risk groups, calculated overall stratum‐specific likelihood ratios (SSLRs), and estimated stratum‐specific probabilities of deterioration for each group.
RESULTS
Patient Characteristics
We identified 12 CPAs, 41 ARCs, and 699 urgent ICU transfers during the study period. A total of 141 cases met our strict criteria for inclusion (see Figure in Supporting Online Appendix: Supplement to Methods Section in the online version of this article) among approximately 96,000 admissions during the study period, making the baseline incidence of events (pre‐test probability) approximately 0.15%. The case and control groups were similar in age, sex, and family‐reported race/ethnicity. Cases had been hospitalized longer than controls at the time of their event, were less likely to have been on a surgical service, and were less likely to survive to hospital discharge (Table 1). There was a high prevalence of CCCs among both cases and controls; 78% of cases and 52% of controls had at least 1 CCC.
| Cases (n = 141) | Controls (n = 423) | ||
|---|---|---|---|
| n (%) | n (%) | P Value | |
| |||
| Type of event | |||
| Cardiopulmonary arrest | 4 (3) | 0 | NA |
| Acute respiratory compromise | 29 (20) | 0 | NA |
| Urgent ICU transfer | 108 (77) | 0 | NA |
| Demographics | |||
| Age | 0.34 | ||
| 0‐<6 mo | 17 (12) | 62 (15) | |
| 6‐<12 mo | 22 (16) | 41 (10) | |
| 1‐<4 yr | 34 (24) | 97 (23) | |
| 4‐<10 yr | 26 (18) | 78 (18) | |
| 10‐<18 yr | 42 (30) | 145 (34) | |
| Sex | 0.70 | ||
| Female | 60 (43) | 188 (44) | |
| Male | 81 (57) | 235 (56) | |
| Race | 0.40 | ||
| White | 69 (49) | 189 (45) | |
| Black/African‐American | 49 (35) | 163 (38) | |
| Asian/Pacific Islander | 0 (0) | 7 (2) | |
| Other | 23 (16) | 62 (15) | |
| Not reported | 0 (0) | 2 (<1) | |
| Ethnicity | 0.53 | ||
| Non‐Hispanic | 127 (90) | 388 (92) | |
| Hispanic | 14 (10) | 33 (8) | |
| Unknown/not reported | 0 (0) | 2 (<1) | |
| Hospitalization | |||
| Length of stay in days, median (interquartile range) | 7.8 (2.6‐18.2) | 3.9 (1.9‐11.2) | <0.001 |
| Surgical service | 4 (3) | 67 (16) | <0.001 |
| Survived to hospital discharge | 107 (76) | 421 (99.5) | <0.001 |
Unadjusted (Bivariable) Analysis
Results of bivariable analysis are shown in Table 2.
| Variable | Cases n (%) | Controls n (%) | OR* | 95% CI | P Value |
|---|---|---|---|---|---|
| |||||
| Complex chronic conditions categories | |||||
| Congenital/genetic | 19 (13) | 21 (5) | 3.0 | 1.6‐5.8 | 0.001 |
| Neuromuscular | 31 (22) | 48 (11) | 2.2 | 1.3‐3.7 | 0.002 |
| Respiratory | 18 (13) | 27 (6) | 2.0 | 1.1‐3.7 | 0.02 |
| Cardiovascular | 15 (10) | 24 (6) | 2.0 | 1.0‐3.9 | 0.05 |
| Metabolic | 5 (3) | 6 (1) | 2.5 | 0.8‐8.2 | 0.13 |
| Gastrointestinal | 10 (7) | 24 (6) | 1.3 | 0.6‐2.7 | 0.54 |
| Renal | 3 (2) | 8 (2) | 1.1 | 0.3‐4.2 | 0.86 |
| Hematology/emmmunodeficiency | 6 (4) | 19 (4) | 0.9 | 0.4‐2.4 | 0.91 |
| Specific conditions | |||||
| Mental retardation | 21 (15) | 25 (6) | 2.7 | 1.5‐4.9 | 0.001 |
| Malignancy | 49 (35) | 90 (21) | 1.9 | 1.3‐2.8 | 0.002 |
| Epilepsy | 22 (15) | 30 (7) | 2.4 | 1.3‐4.3 | 0.004 |
| Cardiac malformations | 14 (10) | 19 (4) | 2.2 | 1.1‐4.4 | 0.02 |
| Chronic respiratory disease arising in the perinatal period | 11 (8) | 15 (4) | 2.2 | 1.0‐4.8 | 0.05 |
| Cerebral palsy | 7 (5) | 13 (3) | 1.7 | 0.6‐4.2 | 0.30 |
| Cystic fibrosis | 1 (1) | 9 (2) | 0.3 | <0.1‐2.6 | 0.30 |
| Other patient characteristics | |||||
| Time from hospital admission to event 7 days | 74 (52) | 146 (35) | 2.1 | 1.4‐3.1 | <0.001 |
| History of any transplant | 27 (19) | 17 (4) | 5.7 | 2.9‐11.1 | <0.001 |
| Enteral tube | 65 (46) | 102 (24) | 2.6 | 1.8‐3.9 | <0.001 |
| Hospitalized in an intensive care unit during the same admission | 43 (31) | 77 (18) | 2.0 | 1.3‐3.1 | 0.002 |
| Administration of TPN in preceding 24 hr | 26 (18) | 36 (9) | 2.3 | 1.4‐3.9 | 0.002 |
| Administration of an opioid via a patient‐controlled analgesia pump in the preceding 24 hr | 14 (9) | 14 (3) | 3.6 | 1.6‐8.3 | 0.002 |
| Weight‐for‐age <5th percentile | 49 (35) | 94 (22) | 1.9 | 1.2‐2.9 | 0.003 |
| Central venous line | 55 (39) | 113 (27) | 1.8 | 1.2‐2.7 | 0.005 |
| Age <1 yr | 39 (28) | 103 (24) | 1.2 | 0.8‐1.9 | 0.42 |
| Gestational age <37 wk or documentation of prematurity | 21 (15) | 60 (14) | 1.1 | 0.6‐1.8 | 0.84 |
| Laboratory studies | |||||
| Hemoglobin in preceding 72 hr | |||||
| Not tested | 28 (20) | 190 (45) | 1.0 | [reference] | |
| 10 g/dL | 42 (30) | 144 (34) | 2.0 | 1.2‐3.5 | 0.01 |
| <10 g/dL | 71 (50) | 89 (21) | 5.6 | 3.3‐9.5 | <0.001 |
| White blood cell count in preceding 72 hr | |||||
| Not tested | 28 (20) | 190 (45) | 1.0 | [reference] | |
| 5000 to <15,000/l | 45 (32) | 131 (31) | 2.4 | 1.4‐4.1 | 0.001 |
| 15,000/l | 19 (13) | 25 (6) | 5.7 | 2.7‐12.0 | <0.001 |
| <5000/l | 49 (35) | 77 (18) | 4.5 | 2.6‐7.8 | <0.001 |
| Blood culture drawn in preceding 72 hr | 78 (55) | 85 (20) | 5.2 | 3.3‐8.1 | <0.001 |
Adjusted (Multivariable) Analysis
The multivariable conditional logistic regression model included 7 independent risk factors for deterioration (Table 3): age <1 year, epilepsy, congenital/genetic defects, history of transplant, enteral tubes, hemoglobin <10 g/dL, and blood culture drawn in the preceding 72 hours.
| Predictor | Adjusted OR (95% CI) | P Value | Regression Coefficient (95% CI) | Score* |
|---|---|---|---|---|
| ||||
| Age <1 yr | 1.9 (1.0‐3.4) | 0.038 | 0.6 (<0.1‐1.2) | 1 |
| Epilepsy | 4.4 (1.9‐9.8) | <0.001 | 1.5 (0.7‐2.3) | 2 |
| Congenital/genetic defects | 2.1 (0.9‐4.9) | 0.075 | 0.8 (0.1‐1.6) | 1 |
| History of any transplant | 3.0 (1.3‐6.9) | 0.010 | 1.1 (0.3‐1.9) | 2 |
| Enteral tube | 2.1 (1.3‐3.6) | 0.003 | 0.8 (0.3‐1.3) | 1 |
| Hemoglobin <10 g/dL in preceding 72 hr | 3.0 (1.8‐5.1) | <0.001 | 1.1 (0.6‐1.6) | 2 |
| Blood culture drawn in preceding 72 hr | 5.8 (3.3‐10.3) | <0.001 | 1.8 (1.2‐2.3) | 3 |
Predictive Score
The range of the resulting predictive score was 0 to 12. The median score among cases was 4, and the median score among controls was 1 (P < 0.001). The area under the receiver operating characteristic curve was 0.78 (95% confidence interval 0.74‐0.83).
We grouped the scores by SSLRs into 4 risk strata and calculated each group's estimated post‐test probability of deterioration based on the pre‐test probability of deterioration of 0.15% (Table 4). The very low‐risk group had a probability of deterioration of 0.06%, less than one‐half the pre‐test probability. The low‐risk group had a probability of deterioration of 0.18%, similar to the pre‐test probability. The intermediate‐risk group had a probability of deterioration of 0.39%, 2.6 times higher than the pre‐test probability. The high‐risk group had a probability of deterioration of 12.60%, 84 times higher than the pre‐test probability.
| Risk stratum | Score range | Cases in stratumn (%) | Controls in stratumn (%) | SSLR (95% CI) | Probability of deterioration (%)* |
|---|---|---|---|---|---|
| |||||
| Very low | 0‐2 | 37 (26) | 288 (68) | 0.4 (0.3‐0.5) | 0.06 |
| Low | 3‐4 | 37 (26) | 94 (22) | 1.2 (0.9‐1.6) | 0.2 |
| Intermediate | 5‐6 | 35 (25) | 40 (9) | 2.6 (1.7‐4.0) | 0.4 |
| High | 7‐12 | 32 (23) | 1 (<1) | 96.0 (13.2‐696.2) | 12.6 |
DISCUSSION
Despite the widespread adoption of rapid response systems, we know little about the optimal methods to identify patients whose clinical characteristics alone put them at increased risk of deterioration, and triage the care they receive based on this risk. Pediatric case series have suggested that younger children and those with chronic illnesses are more likely to require assistance from a medical emergency team,1112 but this is the first study to measure their association with this outcome in children.
Most studies with the objective of identifying patients at risk have focused on tools designed to detect symptoms of deterioration that have already begun, using single‐parameter medical emergency team calling criteria1316 or multi‐parameter early warning scores.38 Rather than create a tool to detect deterioration that has already begun, we developed a predictive score that incorporates patient characteristics independently associated with deterioration in hospitalized children, including age <1 year, epilepsy, congenital/genetic defects, history of transplant, enteral tube, hemoglobin <10 g/dL, and blood culture drawn in the preceding 72 hours. The score has the potential to help clinicians identify the children at highest risk of deterioration who might benefit most from the use of vital sign‐based methods to detect deterioration, as well as the children at lowest risk for whom monitoring may be unnecessary. For example, this score could be performed at the time of admission, and those at very low risk of deterioration and without other clinically concerning findings might be considered for a low‐intensity schedule of vital signs and monitoring (such as vital signs every 8 hours, no continuous cardiorespiratory monitoring or pulse oximetry, and early warning score calculation daily), while patients in the intermediate and high‐risk groups might be considered for a more intensive schedule of vital signs and monitoring (such as vital signs every 4 hours, continuous cardiorespiratory monitoring and pulse oximetry, and early warning score calculation every 4 hours). It should be noted, however, that 37 cases (26%) fell into the very low‐risk category, raising the importance of external validation at the point of admission from the emergency department, before the score can be implemented for the potential clinical use described above. If the score performs well in validation studies, then its use in tailoring monitoring parameters has the potential to reduce the amount of time nurses spend responding to false monitor alarms and calculating early warning scores on patients at very low risk of deterioration.
Of note, we excluded children hospitalized for fewer than 24 hours, resulting in the exclusion of 31% of the potentially eligible events. We also excluded 40% of the potentially eligible ICU transfers because they did not meet urgent criteria. These may be limitations because: (1) the first 24 hours of hospitalization may be a high‐risk period; and (2) patients who were on trajectories toward severe deterioration and received interventions that prevented further deterioration, but did not meet urgent criteria, were excluded. It may be that the children we included as cases were at increased risk of deterioration that is either more difficult to recognize early, or more difficult to treat effectively without ICU interventions. In addition, the population of patients meeting urgent criteria may vary across hospitals, limiting generalizability of this score.
In summary, we developed a predictive score and risk stratification tool that may be useful in triaging the intensity of monitoring and surveillance for deterioration that children receive when hospitalized on non‐ICU units. External validation using the setting and frequency of score measurement that would be most valuable clinically (for example, in the emergency department at the time of admission) is needed before clinical use can be recommended.
Acknowledgements
The authors thank Annie Chung, BA, Emily Huang, and Susan Lipsett, MD, for their assistance with data collection.
- Institute for Healthcare Improvement. About IHI. Available at: http://www.ihi.org/ihi/about. Accessed July 18,2010.
- ,,, et al.“Identifying the hospitalised patient in crisis”—a consensus conference on the afferent limb of Rapid Response Systems.Resuscitation.2010;81(4):375–382.
- ,,.The Pediatric Early Warning System score: a severity of illness score to predict urgent medical need in hospitalized children.J Crit Care.2006;21(3):271–278.
- ,,.Development and initial validation of the Bedside Paediatric Early Warning System score.Crit Care.2009;13(4):R135.
- .Detecting and managing deterioration in children.Paediatr Nurs.2005;17(1):32–35.
- ,,.Promoting care for acutely ill children—development and evaluation of a Paediatric Early Warning Tool.Intensive Crit Care Nurs.2006;22(2):73–81.
- ,,,,.Prospective evaluation of a pediatric inpatient early warning scoring system.J Spec Pediatr Nurs.2009;14(2):79–85.
- ,,,.Prospective cohort study to test the predictability of the Cardiff and Vale paediatric early warning system.Arch Dis Child.2009;94(8):602–606.
- ,,,,,.Deaths attributed to pediatric complex chronic conditions: national trends and implications for supportive care services.Pediatrics.2001;107(6):e99.
- ,,,,.Early prediction of neurological sequelae or death after bacterial meningitis.Acta Paediatr.2002;91(4):391–398.
- ,,,,.Retrospective review of emergency response activations during a 13‐year period at a tertiary care children's hospital.J Hosp Med.2011;6(3):131–135.
- ,,,.Clinical profile of hospitalized children provided with urgent assistance from a medical emergency team.Pediatrics.2008;121(6):e1577–e1584.
- ,,, et al.Implementation of a medical emergency team in a large pediatric teaching hospital prevents respiratory and cardiopulmonary arrests outside the intensive care unit.Pediatr Crit Care Med.2007;8(3):236–246.
- ,,, et al.Effect of a rapid response team on hospital‐wide mortality and code rates outside the ICU in a children's hospital.JAMA.2007;298(19):2267–2274.
- ,,, et al.Transition from a traditional code team to a medical emergency team and categorization of cardiopulmonary arrests in a children's center.Arch Pediatr Adolesc Med.2008;162(2):117–122.
- ,.Reduction of hospital mortality and of preventable cardiac arrest and death on introduction of a pediatric medical emergency team.Pediatr Crit Care Med.2009;10(3):306–312.
Thousands of hospitals have implemented rapid response systems in recent years in attempts to reduce mortality outside the intensive care unit (ICU).1 These systems have 2 components, a response arm and an identification arm. The response arm is usually comprised of a multidisciplinary critical care team that responds to calls for urgent assistance outside the ICU; this team is often called a rapid response team or a medical emergency team. The identification arm comes in 2 forms, predictive and detective. Predictive tools estimate a patient's risk of deterioration over time based on factors that are not rapidly changing, such as elements of the patient's history. In contrast, detective tools include highly time‐varying signs of active deterioration, such as vital sign abnormalities.2 To date, most pediatric studies have focused on developing detective tools, including several early warning scores.38
In this study, we sought to identify the characteristics that increase the probability that a hospitalized child will deteriorate, and combine these characteristics into a predictive score. Tools like this may be helpful in identifying and triaging the subset of high‐risk children who should be intensively monitored for early signs of deterioration at the time of admission, as well as in identifying very low‐risk children who, in the absence of other clinical concerns, may be monitored less intensively.
METHODS
Detailed methods, including the inclusion/exclusion criteria, the matching procedures, and a full description of the statistical analysis are provided as an appendix (see Supporting Online Appendix: Supplement to Methods Section in the online version of this article). An abbreviated version follows.
Design
We performed a case‐control study among children, younger than 18 years old, hospitalized for >24 hours between January 1, 2005 and December 31, 2008. The case group consisted of children who experienced clinical deterioration, a composite outcome defined as cardiopulmonary arrest (CPA), acute respiratory compromise (ARC), or urgent ICU transfer, while on a non‐ICU unit. ICU transfers were considered urgent if they included at least one of the following outcomes in the 12 hours after transfer: death, CPA, intubation, initiation of noninvasive ventilation, or administration of a vasoactive medication infusion used for the treatment of shock. The control group consisted of a random sample of patients matched 3:1 to cases if they met the criteria of being on a non‐ICU unit at the same time as their matched case.
Variables and Measurements
We collected data on demographics, complex chronic conditions (CCCs), other patient characteristics, and laboratory studies. CCCs were specific diagnoses divided into the following 9 categories according to an established framework: neuromuscular, cardiovascular, respiratory, renal, gastrointestinal, hematologic/emmmunologic, metabolic, malignancy, and genetic/congenital defects.9 Other patient characteristics evaluated included age, weight‐for‐age, gestational age, history of transplant, time from hospital admission to event, recent ICU stays, administration of total parenteral nutrition, use of a patient‐controlled analgesia pump, and presence of medical devices including central venous lines and enteral tubes (naso‐gastric, gastrostomy, or jejunostomy).
Laboratory studies evaluated included hemoglobin value, white blood cell count, and blood culture drawn in the preceding 72 hours. We included these laboratory studies in this predictive score because we hypothesized that they represented factors that increased a child's risk of deterioration over time, as opposed to signs of acute deterioration that would be more appropriate for a detective score.
Statistical Analysis
We used conditional logistic regression for the bivariable and multivariable analyses to account for the matching. We derived the predictive score using an established method10 in which the regression coefficients for each covariate were divided by the smallest coefficient, and then rounded to the nearest integer, to establish each variable's sub‐score. We grouped the total scores into very low, low, intermediate, and high‐risk groups, calculated overall stratum‐specific likelihood ratios (SSLRs), and estimated stratum‐specific probabilities of deterioration for each group.
RESULTS
Patient Characteristics
We identified 12 CPAs, 41 ARCs, and 699 urgent ICU transfers during the study period. A total of 141 cases met our strict criteria for inclusion (see Figure in Supporting Online Appendix: Supplement to Methods Section in the online version of this article) among approximately 96,000 admissions during the study period, making the baseline incidence of events (pre‐test probability) approximately 0.15%. The case and control groups were similar in age, sex, and family‐reported race/ethnicity. Cases had been hospitalized longer than controls at the time of their event, were less likely to have been on a surgical service, and were less likely to survive to hospital discharge (Table 1). There was a high prevalence of CCCs among both cases and controls; 78% of cases and 52% of controls had at least 1 CCC.
| Cases (n = 141) | Controls (n = 423) | ||
|---|---|---|---|
| n (%) | n (%) | P Value | |
| |||
| Type of event | |||
| Cardiopulmonary arrest | 4 (3) | 0 | NA |
| Acute respiratory compromise | 29 (20) | 0 | NA |
| Urgent ICU transfer | 108 (77) | 0 | NA |
| Demographics | |||
| Age | 0.34 | ||
| 0‐<6 mo | 17 (12) | 62 (15) | |
| 6‐<12 mo | 22 (16) | 41 (10) | |
| 1‐<4 yr | 34 (24) | 97 (23) | |
| 4‐<10 yr | 26 (18) | 78 (18) | |
| 10‐<18 yr | 42 (30) | 145 (34) | |
| Sex | 0.70 | ||
| Female | 60 (43) | 188 (44) | |
| Male | 81 (57) | 235 (56) | |
| Race | 0.40 | ||
| White | 69 (49) | 189 (45) | |
| Black/African‐American | 49 (35) | 163 (38) | |
| Asian/Pacific Islander | 0 (0) | 7 (2) | |
| Other | 23 (16) | 62 (15) | |
| Not reported | 0 (0) | 2 (<1) | |
| Ethnicity | 0.53 | ||
| Non‐Hispanic | 127 (90) | 388 (92) | |
| Hispanic | 14 (10) | 33 (8) | |
| Unknown/not reported | 0 (0) | 2 (<1) | |
| Hospitalization | |||
| Length of stay in days, median (interquartile range) | 7.8 (2.6‐18.2) | 3.9 (1.9‐11.2) | <0.001 |
| Surgical service | 4 (3) | 67 (16) | <0.001 |
| Survived to hospital discharge | 107 (76) | 421 (99.5) | <0.001 |
Unadjusted (Bivariable) Analysis
Results of bivariable analysis are shown in Table 2.
| Variable | Cases n (%) | Controls n (%) | OR* | 95% CI | P Value |
|---|---|---|---|---|---|
| |||||
| Complex chronic conditions categories | |||||
| Congenital/genetic | 19 (13) | 21 (5) | 3.0 | 1.6‐5.8 | 0.001 |
| Neuromuscular | 31 (22) | 48 (11) | 2.2 | 1.3‐3.7 | 0.002 |
| Respiratory | 18 (13) | 27 (6) | 2.0 | 1.1‐3.7 | 0.02 |
| Cardiovascular | 15 (10) | 24 (6) | 2.0 | 1.0‐3.9 | 0.05 |
| Metabolic | 5 (3) | 6 (1) | 2.5 | 0.8‐8.2 | 0.13 |
| Gastrointestinal | 10 (7) | 24 (6) | 1.3 | 0.6‐2.7 | 0.54 |
| Renal | 3 (2) | 8 (2) | 1.1 | 0.3‐4.2 | 0.86 |
| Hematology/emmmunodeficiency | 6 (4) | 19 (4) | 0.9 | 0.4‐2.4 | 0.91 |
| Specific conditions | |||||
| Mental retardation | 21 (15) | 25 (6) | 2.7 | 1.5‐4.9 | 0.001 |
| Malignancy | 49 (35) | 90 (21) | 1.9 | 1.3‐2.8 | 0.002 |
| Epilepsy | 22 (15) | 30 (7) | 2.4 | 1.3‐4.3 | 0.004 |
| Cardiac malformations | 14 (10) | 19 (4) | 2.2 | 1.1‐4.4 | 0.02 |
| Chronic respiratory disease arising in the perinatal period | 11 (8) | 15 (4) | 2.2 | 1.0‐4.8 | 0.05 |
| Cerebral palsy | 7 (5) | 13 (3) | 1.7 | 0.6‐4.2 | 0.30 |
| Cystic fibrosis | 1 (1) | 9 (2) | 0.3 | <0.1‐2.6 | 0.30 |
| Other patient characteristics | |||||
| Time from hospital admission to event 7 days | 74 (52) | 146 (35) | 2.1 | 1.4‐3.1 | <0.001 |
| History of any transplant | 27 (19) | 17 (4) | 5.7 | 2.9‐11.1 | <0.001 |
| Enteral tube | 65 (46) | 102 (24) | 2.6 | 1.8‐3.9 | <0.001 |
| Hospitalized in an intensive care unit during the same admission | 43 (31) | 77 (18) | 2.0 | 1.3‐3.1 | 0.002 |
| Administration of TPN in preceding 24 hr | 26 (18) | 36 (9) | 2.3 | 1.4‐3.9 | 0.002 |
| Administration of an opioid via a patient‐controlled analgesia pump in the preceding 24 hr | 14 (9) | 14 (3) | 3.6 | 1.6‐8.3 | 0.002 |
| Weight‐for‐age <5th percentile | 49 (35) | 94 (22) | 1.9 | 1.2‐2.9 | 0.003 |
| Central venous line | 55 (39) | 113 (27) | 1.8 | 1.2‐2.7 | 0.005 |
| Age <1 yr | 39 (28) | 103 (24) | 1.2 | 0.8‐1.9 | 0.42 |
| Gestational age <37 wk or documentation of prematurity | 21 (15) | 60 (14) | 1.1 | 0.6‐1.8 | 0.84 |
| Laboratory studies | |||||
| Hemoglobin in preceding 72 hr | |||||
| Not tested | 28 (20) | 190 (45) | 1.0 | [reference] | |
| 10 g/dL | 42 (30) | 144 (34) | 2.0 | 1.2‐3.5 | 0.01 |
| <10 g/dL | 71 (50) | 89 (21) | 5.6 | 3.3‐9.5 | <0.001 |
| White blood cell count in preceding 72 hr | |||||
| Not tested | 28 (20) | 190 (45) | 1.0 | [reference] | |
| 5000 to <15,000/l | 45 (32) | 131 (31) | 2.4 | 1.4‐4.1 | 0.001 |
| 15,000/l | 19 (13) | 25 (6) | 5.7 | 2.7‐12.0 | <0.001 |
| <5000/l | 49 (35) | 77 (18) | 4.5 | 2.6‐7.8 | <0.001 |
| Blood culture drawn in preceding 72 hr | 78 (55) | 85 (20) | 5.2 | 3.3‐8.1 | <0.001 |
Adjusted (Multivariable) Analysis
The multivariable conditional logistic regression model included 7 independent risk factors for deterioration (Table 3): age <1 year, epilepsy, congenital/genetic defects, history of transplant, enteral tubes, hemoglobin <10 g/dL, and blood culture drawn in the preceding 72 hours.
| Predictor | Adjusted OR (95% CI) | P Value | Regression Coefficient (95% CI) | Score* |
|---|---|---|---|---|
| ||||
| Age <1 yr | 1.9 (1.0‐3.4) | 0.038 | 0.6 (<0.1‐1.2) | 1 |
| Epilepsy | 4.4 (1.9‐9.8) | <0.001 | 1.5 (0.7‐2.3) | 2 |
| Congenital/genetic defects | 2.1 (0.9‐4.9) | 0.075 | 0.8 (0.1‐1.6) | 1 |
| History of any transplant | 3.0 (1.3‐6.9) | 0.010 | 1.1 (0.3‐1.9) | 2 |
| Enteral tube | 2.1 (1.3‐3.6) | 0.003 | 0.8 (0.3‐1.3) | 1 |
| Hemoglobin <10 g/dL in preceding 72 hr | 3.0 (1.8‐5.1) | <0.001 | 1.1 (0.6‐1.6) | 2 |
| Blood culture drawn in preceding 72 hr | 5.8 (3.3‐10.3) | <0.001 | 1.8 (1.2‐2.3) | 3 |
Predictive Score
The range of the resulting predictive score was 0 to 12. The median score among cases was 4, and the median score among controls was 1 (P < 0.001). The area under the receiver operating characteristic curve was 0.78 (95% confidence interval 0.74‐0.83).
We grouped the scores by SSLRs into 4 risk strata and calculated each group's estimated post‐test probability of deterioration based on the pre‐test probability of deterioration of 0.15% (Table 4). The very low‐risk group had a probability of deterioration of 0.06%, less than one‐half the pre‐test probability. The low‐risk group had a probability of deterioration of 0.18%, similar to the pre‐test probability. The intermediate‐risk group had a probability of deterioration of 0.39%, 2.6 times higher than the pre‐test probability. The high‐risk group had a probability of deterioration of 12.60%, 84 times higher than the pre‐test probability.
| Risk stratum | Score range | Cases in stratumn (%) | Controls in stratumn (%) | SSLR (95% CI) | Probability of deterioration (%)* |
|---|---|---|---|---|---|
| |||||
| Very low | 0‐2 | 37 (26) | 288 (68) | 0.4 (0.3‐0.5) | 0.06 |
| Low | 3‐4 | 37 (26) | 94 (22) | 1.2 (0.9‐1.6) | 0.2 |
| Intermediate | 5‐6 | 35 (25) | 40 (9) | 2.6 (1.7‐4.0) | 0.4 |
| High | 7‐12 | 32 (23) | 1 (<1) | 96.0 (13.2‐696.2) | 12.6 |
DISCUSSION
Despite the widespread adoption of rapid response systems, we know little about the optimal methods to identify patients whose clinical characteristics alone put them at increased risk of deterioration, and triage the care they receive based on this risk. Pediatric case series have suggested that younger children and those with chronic illnesses are more likely to require assistance from a medical emergency team,1112 but this is the first study to measure their association with this outcome in children.
Most studies with the objective of identifying patients at risk have focused on tools designed to detect symptoms of deterioration that have already begun, using single‐parameter medical emergency team calling criteria1316 or multi‐parameter early warning scores.38 Rather than create a tool to detect deterioration that has already begun, we developed a predictive score that incorporates patient characteristics independently associated with deterioration in hospitalized children, including age <1 year, epilepsy, congenital/genetic defects, history of transplant, enteral tube, hemoglobin <10 g/dL, and blood culture drawn in the preceding 72 hours. The score has the potential to help clinicians identify the children at highest risk of deterioration who might benefit most from the use of vital sign‐based methods to detect deterioration, as well as the children at lowest risk for whom monitoring may be unnecessary. For example, this score could be performed at the time of admission, and those at very low risk of deterioration and without other clinically concerning findings might be considered for a low‐intensity schedule of vital signs and monitoring (such as vital signs every 8 hours, no continuous cardiorespiratory monitoring or pulse oximetry, and early warning score calculation daily), while patients in the intermediate and high‐risk groups might be considered for a more intensive schedule of vital signs and monitoring (such as vital signs every 4 hours, continuous cardiorespiratory monitoring and pulse oximetry, and early warning score calculation every 4 hours). It should be noted, however, that 37 cases (26%) fell into the very low‐risk category, raising the importance of external validation at the point of admission from the emergency department, before the score can be implemented for the potential clinical use described above. If the score performs well in validation studies, then its use in tailoring monitoring parameters has the potential to reduce the amount of time nurses spend responding to false monitor alarms and calculating early warning scores on patients at very low risk of deterioration.
Of note, we excluded children hospitalized for fewer than 24 hours, resulting in the exclusion of 31% of the potentially eligible events. We also excluded 40% of the potentially eligible ICU transfers because they did not meet urgent criteria. These may be limitations because: (1) the first 24 hours of hospitalization may be a high‐risk period; and (2) patients who were on trajectories toward severe deterioration and received interventions that prevented further deterioration, but did not meet urgent criteria, were excluded. It may be that the children we included as cases were at increased risk of deterioration that is either more difficult to recognize early, or more difficult to treat effectively without ICU interventions. In addition, the population of patients meeting urgent criteria may vary across hospitals, limiting generalizability of this score.
In summary, we developed a predictive score and risk stratification tool that may be useful in triaging the intensity of monitoring and surveillance for deterioration that children receive when hospitalized on non‐ICU units. External validation using the setting and frequency of score measurement that would be most valuable clinically (for example, in the emergency department at the time of admission) is needed before clinical use can be recommended.
Acknowledgements
The authors thank Annie Chung, BA, Emily Huang, and Susan Lipsett, MD, for their assistance with data collection.
- Institute for Healthcare Improvement. About IHI. Available at: http://www.ihi.org/ihi/about. Accessed July 18,2010.
- ,,, et al.“Identifying the hospitalised patient in crisis”—a consensus conference on the afferent limb of Rapid Response Systems.Resuscitation.2010;81(4):375–382.
- ,,.The Pediatric Early Warning System score: a severity of illness score to predict urgent medical need in hospitalized children.J Crit Care.2006;21(3):271–278.
- ,,.Development and initial validation of the Bedside Paediatric Early Warning System score.Crit Care.2009;13(4):R135.
- .Detecting and managing deterioration in children.Paediatr Nurs.2005;17(1):32–35.
- ,,.Promoting care for acutely ill children—development and evaluation of a Paediatric Early Warning Tool.Intensive Crit Care Nurs.2006;22(2):73–81.
- ,,,,.Prospective evaluation of a pediatric inpatient early warning scoring system.J Spec Pediatr Nurs.2009;14(2):79–85.
- ,,,.Prospective cohort study to test the predictability of the Cardiff and Vale paediatric early warning system.Arch Dis Child.2009;94(8):602–606.
- ,,,,,.Deaths attributed to pediatric complex chronic conditions: national trends and implications for supportive care services.Pediatrics.2001;107(6):e99.
- ,,,,.Early prediction of neurological sequelae or death after bacterial meningitis.Acta Paediatr.2002;91(4):391–398.
- ,,,,.Retrospective review of emergency response activations during a 13‐year period at a tertiary care children's hospital.J Hosp Med.2011;6(3):131–135.
- ,,,.Clinical profile of hospitalized children provided with urgent assistance from a medical emergency team.Pediatrics.2008;121(6):e1577–e1584.
- ,,, et al.Implementation of a medical emergency team in a large pediatric teaching hospital prevents respiratory and cardiopulmonary arrests outside the intensive care unit.Pediatr Crit Care Med.2007;8(3):236–246.
- ,,, et al.Effect of a rapid response team on hospital‐wide mortality and code rates outside the ICU in a children's hospital.JAMA.2007;298(19):2267–2274.
- ,,, et al.Transition from a traditional code team to a medical emergency team and categorization of cardiopulmonary arrests in a children's center.Arch Pediatr Adolesc Med.2008;162(2):117–122.
- ,.Reduction of hospital mortality and of preventable cardiac arrest and death on introduction of a pediatric medical emergency team.Pediatr Crit Care Med.2009;10(3):306–312.