User login
Trends in Use of Postdischarge Intravenous Antibiotic Therapy for Children
In recent years, mounting evidence has emerged questioning the practice of using prolonged intravenous antibiotic therapy to treat certain serious bacterial infections in children, including complicated appendicitis, osteomyelitis, and complicated pneumonia. Historically, treatment of these conditions was often completed intravenously after hospital discharge using peripherally inserted central catheters (PICCs). Line infections, clots, mechanical problems, and general discomfort complicate PICCs, which led to their removal in more than 20% of children in one study.1 Oral antibiotics avoid these complications and are less burdensome to families.2 Recently, a series of multicenter studies showed no difference in outcomes between oral and postdischarge intravenous antibiotic therapy (PD-IV) for complicated appendicitis, osteomyelitis, and complicated pneumonia.3-5
Despite a growing body of evidence suggesting that oral therapy ought to be the default treatment strategy rather than PD-IV, the extent to which practices have changed is unknown. In this study, we measured national trends in PD-IV use and variation by hospital for complicated appendicitis, osteomyelitis, and complicated pneumonia.
METHODS
We performed a retrospective cohort study of children discharged from hospitals that contributed data to the Pediatric Health Information System (PHIS) database from January 2000 through December 2018. PHIS is an administrative database of children’s hospitals managed by the Children’s Hospital Association (Lenexa, Kansas) and contains deidentified patient-level demographic data, discharge diagnosis and procedure codes, and detailed billing information, including medical supply charges.
The cohorts were defined using International Classification of Diseases, 9th and 10th Revisions (ICD-9 and ICD-10) discharge diagnosis and procedure codes. Patients admitted through September 2015 were identified using ICD-9 codes and patients admitted from October 2015 through December 2018 were identified using ICD-10 codes. The Centers for Medicaid & Medicare Services crosswalk was used to align ICD-9 and ICD-10 codes.6 Inclusion and exclusion criteria identifying cohorts of children hospitalized for complicated appendicitis, osteomyelitis, or complicated pneumonia were based on prior studies using the PHIS database.3-5 These studies augmented the PHIS administrative dataset with local chart review to identify patients from 2009-2012 with the following inclusion and exclusion criteria: Patients with complicated appendicitis were defined by a diagnosis code for acute appendicitis and a procedure code for appendectomy, with postoperative length of stay lasting between 3 and 7 days. Patients with osteomyelitis had a diagnosis code of acute or unspecified osteomyelitis with a hospital length of stay between 2 and 14 days. Patients with complicated pneumonia were defined by a diagnosis code for both pneumonia and pleural effusion with one of these as the primary diagnosis. Patients were excluded if they were older than 18 years or if they were younger than 2 months for osteomyelitis and complicated pneumonia or younger than 3 years for appendicitis. For all three conditions, children with a complex chronic condition7 were excluded. Only the index encounter meeting inclusion and exclusion criteria for each patient was included. PD-IV therapy was defined using procedure codes and hospital charges during the index hospitalization. This definition for PD-IV therapy has been validated among children with complicated pneumonia, demonstrating positive and negative predictive values for PICC exposure of 85% and 99%, respectively.8
Trends in the percentage of patients receiving PD-IV were adjusted for age, race, insurance type, intensive care unit days, and hospital-level case mix index with use of Poisson regression. Calculated risk ratios represent the change in PD-IV across the entire 19-year study period for each condition (as opposed to an annual rate of change). An inflection point for each condition was identified using piecewise linear regression in which the line slope has one value up to a point in time and a second value after that point. The transition point is determined by maximizing model fit.
Some hospitals were added to the database throughout the time period and therefore did not have data for all years of the study. To account for the possibility of a group of high– or low–PD-IV use hospitals entering the cohort and biasing the overall trend, we performed a sensitivity analysis restricted to hospitals continuously contributing data to PHIS every year between 2004 (when a majority of hospitals joined PHIS) and 2018. Significance testing for individual hospital trends was conducted among continuously contributing hospitals, with each hospital tested in the above Poisson model independently.
For the most recent year of 2018, we reported the distribution of adjusted percentages of PD-IV at the individual hospital level. Only hospitals with at least five patients for a given condition are included in the percent PD-IV calculations for 2018. To examine the extent to which an individual hospital might be a low– or high–PD-IV user across conditions, we divided hospitals into quartiles based on PD-IV use for each condition in 2017-2018 and calculated the percent of hospitals in the lowest- and highest-use quartiles for all three conditions. All statistics were performed using Stata 15 (StataCorp).
RESULTS
Among 52 hospitals over a 19-year study period, there were 60,575 hospitalizations for complicated appendicitis, 24,753 hospitalizations for osteomyelitis, and 13,700 hospitalizations for complicated pneumonia. From 2000 to 2018, PD-IV decreased from 13% to 2% (RR, 0.15; 95% CI, 0.14-0.16) for complicated appendicitis, from 61% to 22% (RR, 0.41; 95% CI, 0.39-0.43) for osteomyelitis, and from 29% to 19% (RR, 0.63; 95% CI, 0.58-0.69) for complicated pneumonia (Figure 1). The inflection points occurred in 2009 for complicated appendicitis, 2009 for complicated pneumonia, and 2010 for osteomyelitis. The sensitivity analysis included 31 hospitals that contributed data to PHIS for every year between 2004-2018 and revealed similar findings for all three conditions: Complicated appendicitis had an RR of 0.15 (95% CI, 0.14-0.17), osteomyelitis had an RR of 0.34 (95% CI, 0.32-0.36), and complicated pneumonia had an RR of 0.55 (95% CI, 0.49-0.61). Most individual hospitals decreased PD-IV use (complicated appendicitis: 21 decreased, 8 no change, 2 increased; osteomyelitis: 25 decreased, 6 no change; complicated pneumonia: 14 decreased, 16 no change, 1 increased). While overall decreases in PD-IV were observed for all three conditions, considerable variation remained in 2018 for use of PD-IV (Figure 2), particularly for osteomyelitis (median, 18%; interquartile range [IQR] 9%-40%) and complicated pneumonia (median, 13%; IQR, 3%-30%). In 2017-2018, 1 out of 52 hospitals was in the lowest PD-IV–use quartile for all three conditions, and three hospitals were in the highest-use quartile for all three conditions.

DISCUSSION
Over a 19-year period, we observed a national decline in use of PD-IV for three serious and common bacterial infections. The decline in PD-IV is notable given that it has occurred largely in the absence of nationally coordinated guidelines or improvement efforts. Despite the overall declines, substantial variation in the use of PD-IV for these conditions persists across children’s hospitals.
 use among hospitals across the three conditions in 2000 and in 2018")
The observed decrease in PD-IV use is a natural example of deimplementation, the abandonment of medical practices found to be harmful or ineffective.9 What is most compelling about the deimplementation of PD-IV for these infectious conditions is the seemingly organic motivation that propelled it. Studies of physician practice patterns for interventions that have undergone evidence reversals demonstrate that physicians might readily implement new interventions with an early evidence base but be less willing to deimplement them when more definitive evidence later questions their efficacy.10 Therefore, concerted improvement efforts backed by national guidelines are often needed to reduce the use of a widely accepted medical practice. For example, as evidence questioning the efficacy of steroid use in bronchiolitis mounted,11 bronchiolitis guidelines recommended against steroid use12 and a national quality improvement effort led to reductions in exposure to steroids among patients hospitalized with bronchiolitis.13 Complicated intra-abdominal infection guidelines acknowledge oral antibiotic therapy as an option,14 but no such national guidelines or improvement projects exist for osteomyelitis or complicated pneumonia PD-IV.
What is it about PD-IV for complicated appendicitis, osteomyelitis, and complicated pneumonia that fostered the observed organic deimplementation? Our findings that few hospitals were in the top or bottom quartile of PD-IV across all three conditions suggest that the impetus to decrease PD-IV was not likely the product of a broad hospital-wide practice shift. Most deimplementation frameworks suggest that successful deimplementation must be supported by high-quality evidence that the intervention is not only ineffective, but also harmful.15 In this case, the inflection point for osteomyelitis occurred in 2009, the same year that the first large multicenter study suggesting efficacy and decreased complications of early oral therapy for osteomyelitis was published.16 A direct link between a publication and inflection points for complicated pneumonia and appendicitis is less clear. It is possible that growth of the field of pediatric hospital medicine,17 with a stated emphasis on healthcare value,18 played a role. Greater understanding of the drivers and barriers to deimplementation in this and similar contexts will be important.
Our study has some important limitations. While inclusion and exclusion criteria were consistent over the study period, practice patterns (ie, length of stay in uncomplicated patients) change and could alter the case-mix of patients over time. Additionally, the PHIS database largely comprises children’s hospitals, and the trends we observed in PD-IV may not generalize to community settings.
The degree of deimplementation of PD-IV observed across children’s hospitals is impressive, but opportunity for further improvement likely remains. We found that marked hospital-level variation in use of PD-IV still exists, with some hospitals almost never using PD-IV and others using it for most patients. While the ideal amount of PD-IV is probably not zero, a portion of the observed variation likely represents overuse of PD-IV. To reduce costs and complications associated with antibiotic therapy, national guidelines and a targeted national improvement collaborative may be necessary to achieve further reductions in PD-IV.
1. Jumani K, Advani S, Reich NG, Gosey L, Milstone AM. Risk factors for peripherally inserted central venous catheter complications in children. JAMA Pediatr. 2013;167(5):429-435. https://doi.org/10.1001/jamapediatrics.2013.775
2. Krah NM, Bardsley T, Nelson R, et al. Economic burden of home antimicrobial therapy: OPAT versus oral therapy. Hosp Pediatr. 2019;9(4):234-240. https://doi.org/10.1542/hpeds.2018-0193
3. Keren R, Shah SS, Srivastava R, et al. Comparative effectiveness of intravenous vs oral antibiotics for postdischarge treatment of acute osteomyelitis in children. JAMA Pediatr. 2015;169(2):120-128. https://doi.org/10.1001/jamapediatrics.2014.2822
4. Rangel SJ, Anderson BR, Srivastava R, et al. Intravenous versus oral antibiotics for the prevention of treatment failure in children with complicated appendicitis: has the abandonment of peripherally inserted catheters been justified? Ann Surg. 2017;266(2):361-368. https://doi.org/10.1097/SLA.0000000000001923
5. Shah SS, Srivastava R, Wu S, et al. Intravenous versus oral antibiotics for postdischarge treatment of complicated pneumonia. Pediatrics. 2016;138(6):e20161692. https://doi.org/10.1542/peds.2016-1692
6. Roth J. CMS’ ICD-9-CM to and from ICD-10-CM and ICD-10-PCS Crosswalk or General Equivalence Mappings. National Bureau of Economic Research. May 11, 2016. Accessed June 6, 2018. http://www.nber.org/data/icd9-icd-10-cm-and-pcs-crosswalk-general-equivalence-mapping.html
7. Feudtner C, Hays RM, Haynes G, Geyer JR, Neff JM, Koepsell TD. Deaths attributed to pediatric complex chronic conditions: national trends and implications for supportive care services. Pediatrics. 2001;107(6):E99. https://doi.org/10.1542/peds.107.6.e99
8. Coon ER, Srivastava R, Stoddard G, Wilkes J, Pavia AT, Shah SS. Shortened IV antibiotic course for uncomplicated, late-onset group B streptococcal bacteremia. Pediatrics. 2018;142(5):e20180345. https://doi.org/10.1542/peds.2018-0345
9. Niven DJ, Mrklas KJ, Holodinsky JK, et al. Towards understanding the de-adoption of low-value clinical practices: a scoping review. BMC Med. 2015;13:255. https://doi.org/10.1186/s12916-015-0488-z
10. Niven DJ, Rubenfeld GD, Kramer AA, Stelfox HT. Effect of published scientific evidence on glycemic control in adult intensive care units. JAMA Intern Med. 2015;175(5):801-809. https://doi.org/10.1001/jamainternmed.2015.0157
11. Fernandes RM, Bialy LM, Vandermeer B, et al. Glucocorticoids for acute viral bronchiolitis in infants and young children. Cochrane Database Syst Rev. 2013(6):CD004878. https://doi.org/10.1002/14651858.CD004878.pub4
12. Ralston SL, Lieberthal AS, Meissner HC, et al. Clinical practice guideline: the diagnosis, management, and prevention of bronchiolitis. Pediatrics. 2014;134(5):e1474-e1502. https://doi.org/10.1542/peds.2014-2742
13. Ralston SL, Garber MD, Rice-Conboy E, et al. A multicenter collaborative to reduce unnecessary care in inpatient bronchiolitis. Pediatrics. 2016;137(1):10. https://doi.org/10.1542/peds.2015-0851
14. Solomkin JS, Mazuski JE, Bradley JS, et al. Diagnosis and management of complicated intra-abdominal infection in adults and children: guidelines by the Surgical Infection Society and the Infectious Diseases Society of America. Clin Infect Dis. 2010;50(2):133-164. https://doi.org/10.1086/649554
15. Norton WE, Chambers DA, Kramer BS. Conceptualizing de-implementation in cancer care delivery. J Clin Oncol. 2019;37(2):93-96. https://doi.org/10.1200/JCO.18.00589
16. Zaoutis T, Localio AR, Leckerman K, Saddlemire S, Bertoch D, Keren R. Prolonged intravenous therapy versus early transition to oral antimicrobial therapy for acute osteomyelitis in children. Pediatrics. 2009;123(2):636-642. https://doi.org/10.1542/peds.2008-0596
17. Fisher ES. Pediatric hospital medicine: historical perspectives, inspired future. Curr Probl Pediatr Adolesc Health Care. 2012;42(5):107-112. https://doi.org/10.1016/j.cppeds.2012.01.001
18. Landrigan CP, Conway PH, Edwards S, Srivastava R. Pediatric hospitalists: a systematic review of the literature. Pediatrics. 2006;117(5):1736-1744. https://doi.org/10.1542/peds.2005-0609
In recent years, mounting evidence has emerged questioning the practice of using prolonged intravenous antibiotic therapy to treat certain serious bacterial infections in children, including complicated appendicitis, osteomyelitis, and complicated pneumonia. Historically, treatment of these conditions was often completed intravenously after hospital discharge using peripherally inserted central catheters (PICCs). Line infections, clots, mechanical problems, and general discomfort complicate PICCs, which led to their removal in more than 20% of children in one study.1 Oral antibiotics avoid these complications and are less burdensome to families.2 Recently, a series of multicenter studies showed no difference in outcomes between oral and postdischarge intravenous antibiotic therapy (PD-IV) for complicated appendicitis, osteomyelitis, and complicated pneumonia.3-5
Despite a growing body of evidence suggesting that oral therapy ought to be the default treatment strategy rather than PD-IV, the extent to which practices have changed is unknown. In this study, we measured national trends in PD-IV use and variation by hospital for complicated appendicitis, osteomyelitis, and complicated pneumonia.
METHODS
We performed a retrospective cohort study of children discharged from hospitals that contributed data to the Pediatric Health Information System (PHIS) database from January 2000 through December 2018. PHIS is an administrative database of children’s hospitals managed by the Children’s Hospital Association (Lenexa, Kansas) and contains deidentified patient-level demographic data, discharge diagnosis and procedure codes, and detailed billing information, including medical supply charges.
The cohorts were defined using International Classification of Diseases, 9th and 10th Revisions (ICD-9 and ICD-10) discharge diagnosis and procedure codes. Patients admitted through September 2015 were identified using ICD-9 codes and patients admitted from October 2015 through December 2018 were identified using ICD-10 codes. The Centers for Medicaid & Medicare Services crosswalk was used to align ICD-9 and ICD-10 codes.6 Inclusion and exclusion criteria identifying cohorts of children hospitalized for complicated appendicitis, osteomyelitis, or complicated pneumonia were based on prior studies using the PHIS database.3-5 These studies augmented the PHIS administrative dataset with local chart review to identify patients from 2009-2012 with the following inclusion and exclusion criteria: Patients with complicated appendicitis were defined by a diagnosis code for acute appendicitis and a procedure code for appendectomy, with postoperative length of stay lasting between 3 and 7 days. Patients with osteomyelitis had a diagnosis code of acute or unspecified osteomyelitis with a hospital length of stay between 2 and 14 days. Patients with complicated pneumonia were defined by a diagnosis code for both pneumonia and pleural effusion with one of these as the primary diagnosis. Patients were excluded if they were older than 18 years or if they were younger than 2 months for osteomyelitis and complicated pneumonia or younger than 3 years for appendicitis. For all three conditions, children with a complex chronic condition7 were excluded. Only the index encounter meeting inclusion and exclusion criteria for each patient was included. PD-IV therapy was defined using procedure codes and hospital charges during the index hospitalization. This definition for PD-IV therapy has been validated among children with complicated pneumonia, demonstrating positive and negative predictive values for PICC exposure of 85% and 99%, respectively.8
Trends in the percentage of patients receiving PD-IV were adjusted for age, race, insurance type, intensive care unit days, and hospital-level case mix index with use of Poisson regression. Calculated risk ratios represent the change in PD-IV across the entire 19-year study period for each condition (as opposed to an annual rate of change). An inflection point for each condition was identified using piecewise linear regression in which the line slope has one value up to a point in time and a second value after that point. The transition point is determined by maximizing model fit.
Some hospitals were added to the database throughout the time period and therefore did not have data for all years of the study. To account for the possibility of a group of high– or low–PD-IV use hospitals entering the cohort and biasing the overall trend, we performed a sensitivity analysis restricted to hospitals continuously contributing data to PHIS every year between 2004 (when a majority of hospitals joined PHIS) and 2018. Significance testing for individual hospital trends was conducted among continuously contributing hospitals, with each hospital tested in the above Poisson model independently.
For the most recent year of 2018, we reported the distribution of adjusted percentages of PD-IV at the individual hospital level. Only hospitals with at least five patients for a given condition are included in the percent PD-IV calculations for 2018. To examine the extent to which an individual hospital might be a low– or high–PD-IV user across conditions, we divided hospitals into quartiles based on PD-IV use for each condition in 2017-2018 and calculated the percent of hospitals in the lowest- and highest-use quartiles for all three conditions. All statistics were performed using Stata 15 (StataCorp).
RESULTS
Among 52 hospitals over a 19-year study period, there were 60,575 hospitalizations for complicated appendicitis, 24,753 hospitalizations for osteomyelitis, and 13,700 hospitalizations for complicated pneumonia. From 2000 to 2018, PD-IV decreased from 13% to 2% (RR, 0.15; 95% CI, 0.14-0.16) for complicated appendicitis, from 61% to 22% (RR, 0.41; 95% CI, 0.39-0.43) for osteomyelitis, and from 29% to 19% (RR, 0.63; 95% CI, 0.58-0.69) for complicated pneumonia (Figure 1). The inflection points occurred in 2009 for complicated appendicitis, 2009 for complicated pneumonia, and 2010 for osteomyelitis. The sensitivity analysis included 31 hospitals that contributed data to PHIS for every year between 2004-2018 and revealed similar findings for all three conditions: Complicated appendicitis had an RR of 0.15 (95% CI, 0.14-0.17), osteomyelitis had an RR of 0.34 (95% CI, 0.32-0.36), and complicated pneumonia had an RR of 0.55 (95% CI, 0.49-0.61). Most individual hospitals decreased PD-IV use (complicated appendicitis: 21 decreased, 8 no change, 2 increased; osteomyelitis: 25 decreased, 6 no change; complicated pneumonia: 14 decreased, 16 no change, 1 increased). While overall decreases in PD-IV were observed for all three conditions, considerable variation remained in 2018 for use of PD-IV (Figure 2), particularly for osteomyelitis (median, 18%; interquartile range [IQR] 9%-40%) and complicated pneumonia (median, 13%; IQR, 3%-30%). In 2017-2018, 1 out of 52 hospitals was in the lowest PD-IV–use quartile for all three conditions, and three hospitals were in the highest-use quartile for all three conditions.
DISCUSSION
Over a 19-year period, we observed a national decline in use of PD-IV for three serious and common bacterial infections. The decline in PD-IV is notable given that it has occurred largely in the absence of nationally coordinated guidelines or improvement efforts. Despite the overall declines, substantial variation in the use of PD-IV for these conditions persists across children’s hospitals.
The observed decrease in PD-IV use is a natural example of deimplementation, the abandonment of medical practices found to be harmful or ineffective.9 What is most compelling about the deimplementation of PD-IV for these infectious conditions is the seemingly organic motivation that propelled it. Studies of physician practice patterns for interventions that have undergone evidence reversals demonstrate that physicians might readily implement new interventions with an early evidence base but be less willing to deimplement them when more definitive evidence later questions their efficacy.10 Therefore, concerted improvement efforts backed by national guidelines are often needed to reduce the use of a widely accepted medical practice. For example, as evidence questioning the efficacy of steroid use in bronchiolitis mounted,11 bronchiolitis guidelines recommended against steroid use12 and a national quality improvement effort led to reductions in exposure to steroids among patients hospitalized with bronchiolitis.13 Complicated intra-abdominal infection guidelines acknowledge oral antibiotic therapy as an option,14 but no such national guidelines or improvement projects exist for osteomyelitis or complicated pneumonia PD-IV.
What is it about PD-IV for complicated appendicitis, osteomyelitis, and complicated pneumonia that fostered the observed organic deimplementation? Our findings that few hospitals were in the top or bottom quartile of PD-IV across all three conditions suggest that the impetus to decrease PD-IV was not likely the product of a broad hospital-wide practice shift. Most deimplementation frameworks suggest that successful deimplementation must be supported by high-quality evidence that the intervention is not only ineffective, but also harmful.15 In this case, the inflection point for osteomyelitis occurred in 2009, the same year that the first large multicenter study suggesting efficacy and decreased complications of early oral therapy for osteomyelitis was published.16 A direct link between a publication and inflection points for complicated pneumonia and appendicitis is less clear. It is possible that growth of the field of pediatric hospital medicine,17 with a stated emphasis on healthcare value,18 played a role. Greater understanding of the drivers and barriers to deimplementation in this and similar contexts will be important.
Our study has some important limitations. While inclusion and exclusion criteria were consistent over the study period, practice patterns (ie, length of stay in uncomplicated patients) change and could alter the case-mix of patients over time. Additionally, the PHIS database largely comprises children’s hospitals, and the trends we observed in PD-IV may not generalize to community settings.
The degree of deimplementation of PD-IV observed across children’s hospitals is impressive, but opportunity for further improvement likely remains. We found that marked hospital-level variation in use of PD-IV still exists, with some hospitals almost never using PD-IV and others using it for most patients. While the ideal amount of PD-IV is probably not zero, a portion of the observed variation likely represents overuse of PD-IV. To reduce costs and complications associated with antibiotic therapy, national guidelines and a targeted national improvement collaborative may be necessary to achieve further reductions in PD-IV.
1. Jumani K, Advani S, Reich NG, Gosey L, Milstone AM. Risk factors for peripherally inserted central venous catheter complications in children. JAMA Pediatr. 2013;167(5):429-435. https://doi.org/10.1001/jamapediatrics.2013.775
2. Krah NM, Bardsley T, Nelson R, et al. Economic burden of home antimicrobial therapy: OPAT versus oral therapy. Hosp Pediatr. 2019;9(4):234-240. https://doi.org/10.1542/hpeds.2018-0193
3. Keren R, Shah SS, Srivastava R, et al. Comparative effectiveness of intravenous vs oral antibiotics for postdischarge treatment of acute osteomyelitis in children. JAMA Pediatr. 2015;169(2):120-128. https://doi.org/10.1001/jamapediatrics.2014.2822
4. Rangel SJ, Anderson BR, Srivastava R, et al. Intravenous versus oral antibiotics for the prevention of treatment failure in children with complicated appendicitis: has the abandonment of peripherally inserted catheters been justified? Ann Surg. 2017;266(2):361-368. https://doi.org/10.1097/SLA.0000000000001923
5. Shah SS, Srivastava R, Wu S, et al. Intravenous versus oral antibiotics for postdischarge treatment of complicated pneumonia. Pediatrics. 2016;138(6):e20161692. https://doi.org/10.1542/peds.2016-1692
6. Roth J. CMS’ ICD-9-CM to and from ICD-10-CM and ICD-10-PCS Crosswalk or General Equivalence Mappings. National Bureau of Economic Research. May 11, 2016. Accessed June 6, 2018. http://www.nber.org/data/icd9-icd-10-cm-and-pcs-crosswalk-general-equivalence-mapping.html
7. Feudtner C, Hays RM, Haynes G, Geyer JR, Neff JM, Koepsell TD. Deaths attributed to pediatric complex chronic conditions: national trends and implications for supportive care services. Pediatrics. 2001;107(6):E99. https://doi.org/10.1542/peds.107.6.e99
8. Coon ER, Srivastava R, Stoddard G, Wilkes J, Pavia AT, Shah SS. Shortened IV antibiotic course for uncomplicated, late-onset group B streptococcal bacteremia. Pediatrics. 2018;142(5):e20180345. https://doi.org/10.1542/peds.2018-0345
9. Niven DJ, Mrklas KJ, Holodinsky JK, et al. Towards understanding the de-adoption of low-value clinical practices: a scoping review. BMC Med. 2015;13:255. https://doi.org/10.1186/s12916-015-0488-z
10. Niven DJ, Rubenfeld GD, Kramer AA, Stelfox HT. Effect of published scientific evidence on glycemic control in adult intensive care units. JAMA Intern Med. 2015;175(5):801-809. https://doi.org/10.1001/jamainternmed.2015.0157
11. Fernandes RM, Bialy LM, Vandermeer B, et al. Glucocorticoids for acute viral bronchiolitis in infants and young children. Cochrane Database Syst Rev. 2013(6):CD004878. https://doi.org/10.1002/14651858.CD004878.pub4
12. Ralston SL, Lieberthal AS, Meissner HC, et al. Clinical practice guideline: the diagnosis, management, and prevention of bronchiolitis. Pediatrics. 2014;134(5):e1474-e1502. https://doi.org/10.1542/peds.2014-2742
13. Ralston SL, Garber MD, Rice-Conboy E, et al. A multicenter collaborative to reduce unnecessary care in inpatient bronchiolitis. Pediatrics. 2016;137(1):10. https://doi.org/10.1542/peds.2015-0851
14. Solomkin JS, Mazuski JE, Bradley JS, et al. Diagnosis and management of complicated intra-abdominal infection in adults and children: guidelines by the Surgical Infection Society and the Infectious Diseases Society of America. Clin Infect Dis. 2010;50(2):133-164. https://doi.org/10.1086/649554
15. Norton WE, Chambers DA, Kramer BS. Conceptualizing de-implementation in cancer care delivery. J Clin Oncol. 2019;37(2):93-96. https://doi.org/10.1200/JCO.18.00589
16. Zaoutis T, Localio AR, Leckerman K, Saddlemire S, Bertoch D, Keren R. Prolonged intravenous therapy versus early transition to oral antimicrobial therapy for acute osteomyelitis in children. Pediatrics. 2009;123(2):636-642. https://doi.org/10.1542/peds.2008-0596
17. Fisher ES. Pediatric hospital medicine: historical perspectives, inspired future. Curr Probl Pediatr Adolesc Health Care. 2012;42(5):107-112. https://doi.org/10.1016/j.cppeds.2012.01.001
18. Landrigan CP, Conway PH, Edwards S, Srivastava R. Pediatric hospitalists: a systematic review of the literature. Pediatrics. 2006;117(5):1736-1744. https://doi.org/10.1542/peds.2005-0609
© 2020 Society of Hospital Medicine
Safety Huddle Intervention for Reducing Physiologic Monitor Alarms: A Hybrid Effectiveness-Implementation Cluster Randomized Trial
Physiologic monitor alarms occur frequently in the hospital environment, with average rates on pediatric wards between 42 and 155 alarms per monitored patient-day.1 However, average rates do not depict the full story, because only 9%–25% of patients are responsible for most alarms on inpatient wards.1,2 In addition, only 0.5%–1% of alarms on pediatric wards warrant action.3,4 Downstream consequences of high alarm rates include interruptions5,6 and alarm fatigue.3,4,7
Alarm customization, the process of reviewing individual patients’ alarm data and using that data to implement patient-specific alarm reduction interventions, has emerged as a potential approach to unit-wide alarm management.8-11 Potential customizations include broadening alarm thresholds, instituting delays between the time the alarm condition is met and the time the alarm sounds, and changing electrodes.8-11 However, the workflows within which to identify the patients who will benefit from customization, make decisions about how to customize, and implement customizations have not been delineated.
Safety huddles are brief structured discussions among physicians, nurses, and other staff aiming to identify and mitigate threats to patient safety.11-13 In this study, we aimed to evaluate the influence of a safety huddle-based alarm intervention strategy targeting high alarm pediatric ward patients on (a) unit-level alarm rates and (b) patient-level alarm rates, as well as to (c) evaluate implementation outcomes. We hypothesized that patients discussed in huddles would have greater reductions in alarm rates in the 24 hours following their huddle than patients who were not discussed. Given that most alarms are generated by a small fraction of patients,1,2 we hypothesized that patient-level reductions would translate to unit-level reductions.
METHODS
Human Subject Protection
The Institutional Review Board of Children’s Hospital of Philadelphia approved this study with a waiver of informed consent. We registered the study at ClinicalTrials.gov (identifier NCT02458872). The original protocol is available as an Online Supplement.
Design and Framework

For our secondary effectiveness outcome evaluating the effect of the intervention on the alarm rates of the individual patients discussed in huddles, we used a cohort design embedded within the trial to analyze patient-specific alarm data collected only on randomly selected “intensive data collection days,” described below and in Figure 1.
Setting and Subjects
All patients hospitalized on 8 units that admit general pediatric and medical subspecialty patients at Children’s Hospital of Philadelphia between June 15, 2015 and May 8, 2016 were included in the primary (unit-level) analysis. Every patient’s bedside included a General Electric Dash 3000 physiologic monitor. Decisions to monitor patients were made by physicians and required orders. Default alarm settings are available in Supplementary Table 1; these settings required orders to change.
All 8 units were already convening scheduled safety huddles led by the charge nurse each day. All nurses and at least one resident were expected to attend; attending physicians and fellows were welcome but not expected to attend. Huddles focused on discussing safety concerns and patient flow. None of the preexisting huddles included alarm discussion.
Intervention
For each nonholiday weekday, we generated customized paper-based alarm huddle data “dashboards” (Supplementary Figure 1) displaying data from the patients (up to a maximum of 4) on each intervention unit with the highest numbers of high-acuity alarms (“crisis” and “warning” audible alarms, see Supplementary Table 2 for detailed listing of alarm types) in the preceding 4 hours by reviewing data from the monitor network using BedMasterEx v4.2 (Excel Medical Electronics). Dashboards listed the most frequent types of alarms, alarm settings, and included a script for discussing the alarms with checkboxes to indicate changes agreed upon by the team during the huddle. Patients with fewer than 20 alarms in the preceding 4h were not included; thus, sometimes fewer than 4 patients’ data were available for discussion. We hand-delivered dashboards to the charge nurses leading huddles, and they facilitated the multidisciplinary alarm discussions focused on reviewing alarm data and customizing settings to reduce unnecessary alarms.
Study Periods
The study had 3 periods as shown in Supplementary Figure 2: (1) 16-week baseline data collection, (2) phased intervention implementation during which we serially spent 2-8 weeks on each of the 4 intervention units implementing the intervention, and (3) 16-week postimplementation data collection.
Outcomes
The primary effectiveness outcome was the change in unit-level alarms per patient-day between the baseline and postimplementation periods in intervention versus control units, with all patients on the units included. The secondary effectiveness outcome (analyzed using the embedded cohort design) was the change in individual patient-level alarms between the 24 hours leading up to a huddle and the 24 hours following huddles in patients who were versus patients who were not discussed in huddles.
Implementation outcomes included adoption and fidelity measures. To measure adoption (defined as “intention to try” the intervention),16 we measured the frequency of discussions attended by patients’ nurses and physicians. We evaluated 3 elements of fidelity: adherence, dose, and quality of delivery.17 We measured adherence as the incorporation of alarm discussion into huddles when there were eligible patients to discuss. We measured dose as the average number of patients discussed on each unit per calendar day during the postimplementation period. We measured quality of delivery as the extent to which changes to monitoring that were agreed upon in the huddles were made at the bedside.
Safety Measures
To surveil for unintended consequences of reduced monitoring, we screened the hospital’s rapid response and code blue team database weekly for any events in patients previously discussed in huddles that occurred between huddle and hospital discharge. We reviewed charts to determine if the events were related to the intervention.
Randomization
Prior to randomization, the 8 units were divided into pairs based on participation in hospital-wide Joint Commission alarm management activities, use of alarm middleware that relayed detailed alarm information to nurses’ mobile phones, and baseline alarm rates. One unit in each pair was randomized to intervention and the other to control by coin flip.
Data Collection
We used Research Electronic Data Capture (REDCap)18 database tools.
Data for Unit-Level Analyses
We captured all alarms occurring on the study units during the study period using data from BedMasterEx. We obtained census data accurate to the hour from the Clinical Data Warehouse.
Data Captured in All Huddles
During each huddle, we collected the number of patients whose alarms were discussed, patient characteristics, presence of nurses and physicians, and monitoring changes agreed upon. We then followed up 4 hours later to determine if changes were made at the bedside by examining monitor settings.
Data Captured Only During Intensive Data Collection Days
We randomly selected 1 day during each of the 16 weeks of the postimplementation period to obtain additional patient-level data. On each intensive data collection day, the 4 monitored patients on each intervention and control unit with the most high-acuity alarms in the 4 hours prior to huddles occurring — regardless of whether or not these patients were later discussed in huddles — were identified for data collection. On these dates, a member of the research team reviewed each patient’s alarm counts in 4-hour blocks during the 24 hours before and after the huddle. Given that the huddles were not always at the same time every day (ranging between 10:00 and 13:00), we operationally set the huddle time as 12:00 for all units.
Data Analysis
We used Stata/SE 14.2 for all analyses.
Unit-Level Alarm Rates
To compare unit-level rates, we performed an interrupted time series analysis using segmented (piecewise) regression to evaluate the impact of the intervention.19,20 We used a multivariable generalized estimating equation model with the negative binomial distribution21 and clustering by unit. We bootstrapped the model and generated percentile-based 95% confidence intervals. We then used the model to estimate the alarm rate difference in differences between the baseline data collection period and the postimplementation data collection period for intervention versus control units.
Patient-Level Alarm Rates
In contrast to unit-level analysis, we used an embedded cohort design to model the change in individual patients’ alarms between the 24 hours leading up to huddles and the 24 hours following huddles in patients who were versus patients who were not discussed in huddles. The analysis was restricted to the patients included in intensive data collection days. We performed bootstrapped linear regression and generated percentile-based 95% confidence intervals using the difference in 4-hour block alarm rate between pre- and posthuddle as the outcome. We clustered within patients. We stratified by unit and preceding alarm rate. We modeled the alarm rate difference between the 24-hour prehuddle and the 24-hour posthuddle for huddled and nonhuddled patients and the difference in differences between exposure groups.
Implementation Outcomes
We summarized adoption and fidelity using proportions.
RESULTS
Alarm dashboards informed 580 structured alarm discussions during 353 safety huddles (huddles often included discussion of more than one patient).
Unit-Level Alarm Rates
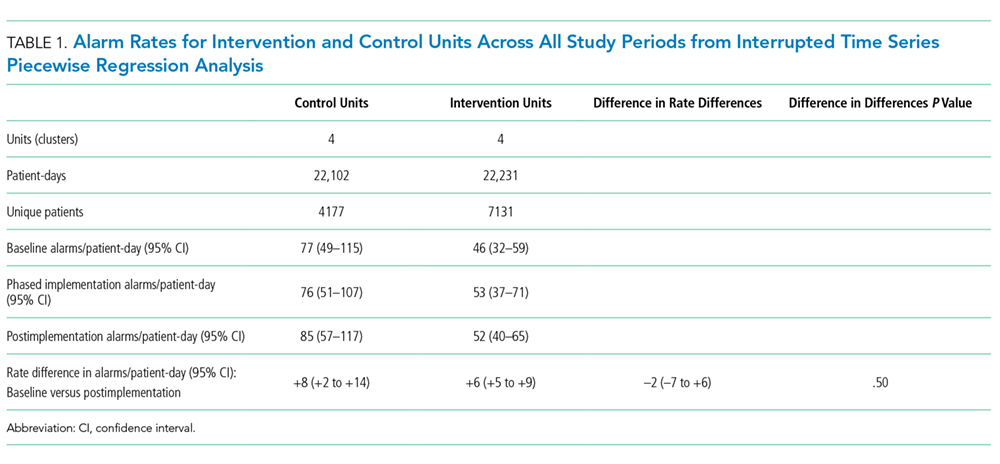
Visually, alarm rates over time on each individual unit appeared flat despite the intervention (Supplementary Figure 3). Using piecewise regression, we found that intervention and control units had small increases in alarm rates between the baseline and postimplementation periods with a nonsignificant difference in these differences between the control and intervention groups (Table 1).
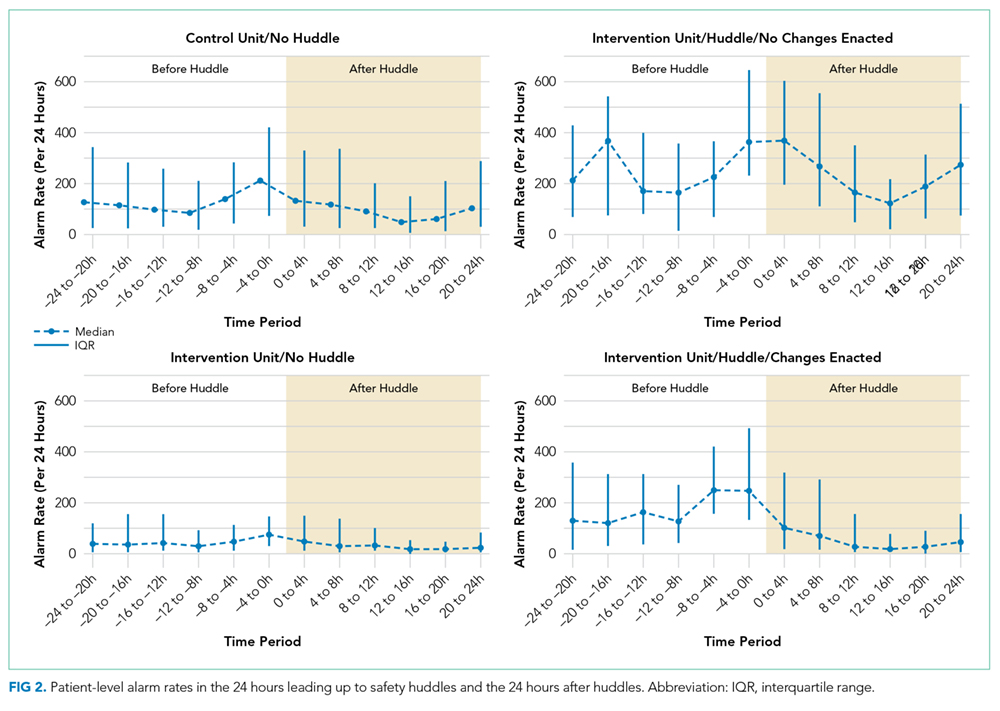
Patient-Level Alarm Rates
We then restricted the analysis to the patients whose data were collected during intensive data collection days. We obtained data from 1974 pre-post pairs of 4-hour time periods.

Implementation Outcomes
Adoption
The patient’s nurse attended 482 of the 580 huddle discussions (83.1%), and at least one of the patient’s physicians (resident, fellow, or attending) attended 394 (67.9%).
Fidelity: Adherence
In addition to the 353 huddles that included alarm discussion, 123 instances had no patients with ≥20 high acuity alarms in the preceding 4 hours therefore, no data were brought to the huddle. There were an additional 30 instances when a huddle did not occur or there was no alarm discussion in the huddle despite data being available. Thus, adherence occurred in 353 of 383 huddles (92.2%).
Fidelity: Dose
During the 112 calendar day postimplementation period, 379 patients’ alarms were discussed in huddles for an average intervention dose of 0.85 discussions per unit per calendar day.
Fidelity: Quality of Delivery
In 362 of the 580 huddle discussions (62.4%), changes were agreed upon. The most frequently agreed upon changes were discontinuing monitoring (32.0%), monitoring only when asleep or unsupervised (23.8%), widening heart rate parameters (12.7%), changing electrocardiographic leads/wires (8.6%), changing the pulse oximetry probe (8.0%), and increasing the delay time between when oxygen desaturation was detected and when the alarm was generated (4.7%). Of the huddle discussions with changes agreed upon, 346 (95.6%) changes were enacted at the bedside.
Safety Measures
There were 0 code blue events and 26 rapid response team activations for patients discussed in huddles. None were related to the intervention.
Discussion
Our main finding was that the huddle strategy was effective in safely reducing the burden of alarms for the high alarm pediatric ward patients whose alarms were discussed, but it did not reduce unit-level alarm rates. Implementation outcomes explained this finding. Although adoption and adherence were high, the overall dose of the intervention was low.
We also found that 36% of alarms had technical causes, the majority of which were related to the pulse oximetry probe detecting that it was off the patient or searching for a pulse. Although these alarms are likely perceived differently by clinical staff (most monitors generate different sounds for technical alarms), they still represent a substantial contribution to the alarm environment. Minimizing them in patients who must remain continuously monitored requires more intensive effort to implement other types of interventions than the main focus of this study, such as changing pulse oximetry probes and electrocardiographic leads/wires.
In one-third of huddles, monitoring was simply discontinued. We observed in many cases that, while these patients may have had legitimate indications for monitoring upon admission, their conditions had improved; after brief multidisciplinary discussion, the team concluded that monitoring was no longer indicated. This observation may suggest interventions at the ordering phase, such as prespecifying a monitoring duration.22,23
This study’s findings were consistent with a quasi-experimental study of safety huddle-based alarm discussions in a pediatric intensive care unit that showed a patient-level reduction of 116 alarms per patient-day in those discussed in huddles relative to controls.11 A smaller quasi-experimental study of implementing a nighttime alarm “ward round” in an adult intensive care unit showed a significant reduction in unit-level alarms/patient-day from 168 to 84.9 In a quality improvement report, a monitoring care process bundle that included discussion of alarm settings showed a reduction in unit-level alarms/patient-day from 180 to 40.10 Our study strengthens the body of literature using a cluster-randomized design, measuring patient- and unit-level outcomes, and including implementation outcomes that explain effectiveness findings.
On a hypothetical unit similar to the ones we studied with 20 occupied beds and 60 alarms/patient-day, an average of 1200 alarms would occur each day. We delivered the intervention to 0.85 patients per day. Changes were made at the bedside in 60% of those with the intervention delivered, and those patients had a difference in differences of 119 fewer alarms compared with the comparison patients on control units. In this scenario, we could expect a relative reduction of 0.85 x 0.60 x 119 = 61 fewer alarms/day total on the unit or a 5% reduction. However, that estimated reduction did not account for the arrival of new patients with high alarm rates, which certainly occurred in this study and explained the lack of effect at the unit level.
As described above, the intervention dose was low, which translated into a lack of effect at the unit level despite a strong effect at the patient level. This result was partly due to the manual process required to produce the alarm dashboards that restricted their availability to nonholiday weekdays. The study was performed at one hospital, which limited generalizability. The study hospital was already convening daily safety huddles that were well attended by nurses and physicians. Other hospitals without existing huddle structures may face challenges in implementing similar multidisciplinary alarm discussions. In addition, the study design was randomized at the unit (rather than patient) level, which limited our ability to balance potential confounders at the patient level.
Conclusion
A safety huddle intervention strategy to drive alarm customization was effective in safely reducing alarms for individual children discussed. However, unit-level alarm rates were not affected by the intervention due to a low dose. Leaders of efforts to reduce alarms should consider beginning with passive interventions (such as changes to default settings and alarm delays) and use huddle-based discussion as a second-line intervention to address remaining patients with high alarm rates.
Acknowledgments
We thank Matthew MacMurchy, BA, for his assistance with data collection.
Funding/Support
This study was supported by a Young Investigator Award (Bonafide, PI) from the Academic Pediatric Association.
Role of the Funder/Sponsor
The Academic Pediatric Association had no role in the design or conduct of the study; collection, management, analysis, or interpretation of the data; preparation, review, or approval of the manuscript; or decision to submit for publication.
Disclosures
No relevant financial activities, aside from the grant funding from the Academic Pediatric Association listed above, are reported.
1. Schondelmeyer AC, Brady PW, Goel VV, et al. Physiologic monitor alarm rates at 5 children’s hospitals. J Hosp Med. 2018;In press. PubMed
2. Cvach M, Kitchens M, Smith K, Harris P, Flack MN. Customizing alarm limits based on specific needs of patients. Biomed Instrum Technol. 2017;51(3):227-234. PubMed
3. Bonafide CP, Lin R, Zander M, et al. Association between exposure to nonactionable physiologic monitor alarms and response time in a children’s hospital. J Hosp Med. 2015;10(6):345-351. PubMed
4. Bonafide CP, Localio AR, Holmes JH, et al. Video analysis of factors associated with response time to physiologic monitor alarms in a children’s hospital. JAMA Pediatr. 2017;171(6):524-531. PubMed
5. Lange K, Nowak M, Zoller R, Lauer W. Boundary conditions for safe detection of clinical alarms: An observational study to identify the cognitive and perceptual demands on an Intensive Care Unit. In: In: D. de Waard, K.A. Brookhuis, A. Toffetti, A. Stuiver, C. Weikert, D. Coelho, D. Manzey, A.B. Ünal, S. Röttger, and N. Merat (Eds.) Proceedings of the Human Factors and Ergonomics Society Europe Chapter 2015 Annual Conference. Groningen, Netherlands; 2016.
6. Westbrook JI, Li L, Hooper TD, Raban MZ, Middleton S, Lehnbom EC. Effectiveness of a ‘Do not interrupt’ bundled intervention to reduce interruptions during medication administration: a cluster randomised controlled feasibility study. BMJ Qual Saf. 2017;26:734-742. PubMed
7. Chopra V, McMahon LF Jr. Redesigning hospital alarms for patient safety: alarmed and potentially dangerous. JAMA. 2014;311(12):1199-1200. PubMed
8. Turmell JW, Coke L, Catinella R, Hosford T, Majeski A. Alarm fatigue: use of an evidence-based alarm management strategy. J Nurs Care Qual. 2017;32(1):47-54. PubMed
9. Koerber JP, Walker J, Worsley M, Thorpe CM. An alarm ward round reduces the frequency of false alarms on the ICU at night. J Intensive Care Soc. 2011;12(1):75-76.
10. Dandoy CE, Davies SM, Flesch L, et al. A team-based approach to reducing cardiac monitor alarms. Pediatrics. 2014;134(6):e1686-1694. PubMed
11. Dewan M, Wolfe H, Lin R, et al. Impact of a safety huddle–based intervention on monitor alarm rates in low-acuity pediatric intensive care unit patients. J Hosp Med. 2017;12(8):652-657. PubMed
12. Goldenhar LM, Brady PW, Sutcliffe KM, Muething SE. Huddling for high reliability and situation awareness. BMJ Qual Saf. 2013;22(11):899-906. PubMed
13. Brady PW, Muething S, Kotagal U, et al. Improving situation awareness to reduce unrecognized clinical deterioration and serious safety events. Pediatrics. 2013;131:e298-308. PubMed
14. Curran GM, Bauer M, Mittman B, Pyne JM, Stetler C. Effectiveness-implementation hybrid designs: combining elements of clinical effectiveness and implementation research to enhance public health impact. Med Care. 2012;50(3):217-226. PubMed
15. Damschroder LJ, Aron DC, Keith RE, Kirsh SR, Alexander JA, Lowery JC. Fostering implementation of health services research findings into practice: a consolidated framework for advancing implementation science. Implement Sci. 2009;4(1):50. PubMed
16. Proctor E, Silmere H, Raghavan R, et al. Outcomes for implementation research: conceptual distinctions, measurement challenges, and research agenda. Adm Policy Ment Health. 2011;38(2):65-76. PubMed
17. Allen JD, Linnan LA, Emmons KM. Fidelity and its relationship to implementation effectiveness, adaptation, and dissemination. In: Dissemination and Implementation Research in Health: Translating Science to Practice (Brownson RC, Proctor EK, Colditz GA Eds.). Oxford University Press; 2012:281-304.
18. Harris PA, Taylor R, Thielke R, Payne J, Gonzalez N, Conde JG. Research electronic data capture (REDCap)—a metadata-driven methodology and workflow process for providing translational research informatics support. J Biomed Inf. 2009;42:377-381. PubMed
19. Singer JD, Willett JB. Applied Longitudinal Data Analysis: Modeling Change and Event Occurrence. New York: Oxford University Press; 2003.
20. Wagner AK, Soumerai SB, Zhang F, Ross-Degnan D. Segmented regression analysis of interrupted time series studies in medication use research. J Clin Pharm Ther. 2002;27:299-309. PubMed
21. Gardner W, Mulvey EP, Shaw EC. Regression analyses of counts and rates: Poisson, overdispersed Poisson, and negative binomial models. Psychol Bull. 1995;118:392-404. PubMed
22. Dressler R, Dryer MM, Coletti C, Mahoney D, Doorey AJ. Altering overuse of cardiac telemetry in non-intensive care unit settings by hardwiring the use of American Heart Association guidelines. JAMA Intern Med. 2014;174(11):1852-1854. PubMed
23. Boggan JC, Navar-Boggan AM, Patel V, Schulteis RD, Simel DL. Reductions in telemetry order duration do not reduce telemetry utilization. J Hosp Med. 2014;9(12):795-796. PubMed
Physiologic monitor alarms occur frequently in the hospital environment, with average rates on pediatric wards between 42 and 155 alarms per monitored patient-day.1 However, average rates do not depict the full story, because only 9%–25% of patients are responsible for most alarms on inpatient wards.1,2 In addition, only 0.5%–1% of alarms on pediatric wards warrant action.3,4 Downstream consequences of high alarm rates include interruptions5,6 and alarm fatigue.3,4,7
Alarm customization, the process of reviewing individual patients’ alarm data and using that data to implement patient-specific alarm reduction interventions, has emerged as a potential approach to unit-wide alarm management.8-11 Potential customizations include broadening alarm thresholds, instituting delays between the time the alarm condition is met and the time the alarm sounds, and changing electrodes.8-11 However, the workflows within which to identify the patients who will benefit from customization, make decisions about how to customize, and implement customizations have not been delineated.
Safety huddles are brief structured discussions among physicians, nurses, and other staff aiming to identify and mitigate threats to patient safety.11-13 In this study, we aimed to evaluate the influence of a safety huddle-based alarm intervention strategy targeting high alarm pediatric ward patients on (a) unit-level alarm rates and (b) patient-level alarm rates, as well as to (c) evaluate implementation outcomes. We hypothesized that patients discussed in huddles would have greater reductions in alarm rates in the 24 hours following their huddle than patients who were not discussed. Given that most alarms are generated by a small fraction of patients,1,2 we hypothesized that patient-level reductions would translate to unit-level reductions.
METHODS
Human Subject Protection
The Institutional Review Board of Children’s Hospital of Philadelphia approved this study with a waiver of informed consent. We registered the study at ClinicalTrials.gov (identifier NCT02458872). The original protocol is available as an Online Supplement.
Design and Framework
For our secondary effectiveness outcome evaluating the effect of the intervention on the alarm rates of the individual patients discussed in huddles, we used a cohort design embedded within the trial to analyze patient-specific alarm data collected only on randomly selected “intensive data collection days,” described below and in Figure 1.
Setting and Subjects
All patients hospitalized on 8 units that admit general pediatric and medical subspecialty patients at Children’s Hospital of Philadelphia between June 15, 2015 and May 8, 2016 were included in the primary (unit-level) analysis. Every patient’s bedside included a General Electric Dash 3000 physiologic monitor. Decisions to monitor patients were made by physicians and required orders. Default alarm settings are available in Supplementary Table 1; these settings required orders to change.
All 8 units were already convening scheduled safety huddles led by the charge nurse each day. All nurses and at least one resident were expected to attend; attending physicians and fellows were welcome but not expected to attend. Huddles focused on discussing safety concerns and patient flow. None of the preexisting huddles included alarm discussion.
Intervention
For each nonholiday weekday, we generated customized paper-based alarm huddle data “dashboards” (Supplementary Figure 1) displaying data from the patients (up to a maximum of 4) on each intervention unit with the highest numbers of high-acuity alarms (“crisis” and “warning” audible alarms, see Supplementary Table 2 for detailed listing of alarm types) in the preceding 4 hours by reviewing data from the monitor network using BedMasterEx v4.2 (Excel Medical Electronics). Dashboards listed the most frequent types of alarms, alarm settings, and included a script for discussing the alarms with checkboxes to indicate changes agreed upon by the team during the huddle. Patients with fewer than 20 alarms in the preceding 4h were not included; thus, sometimes fewer than 4 patients’ data were available for discussion. We hand-delivered dashboards to the charge nurses leading huddles, and they facilitated the multidisciplinary alarm discussions focused on reviewing alarm data and customizing settings to reduce unnecessary alarms.
Study Periods
The study had 3 periods as shown in Supplementary Figure 2: (1) 16-week baseline data collection, (2) phased intervention implementation during which we serially spent 2-8 weeks on each of the 4 intervention units implementing the intervention, and (3) 16-week postimplementation data collection.
Outcomes
The primary effectiveness outcome was the change in unit-level alarms per patient-day between the baseline and postimplementation periods in intervention versus control units, with all patients on the units included. The secondary effectiveness outcome (analyzed using the embedded cohort design) was the change in individual patient-level alarms between the 24 hours leading up to a huddle and the 24 hours following huddles in patients who were versus patients who were not discussed in huddles.
Implementation outcomes included adoption and fidelity measures. To measure adoption (defined as “intention to try” the intervention),16 we measured the frequency of discussions attended by patients’ nurses and physicians. We evaluated 3 elements of fidelity: adherence, dose, and quality of delivery.17 We measured adherence as the incorporation of alarm discussion into huddles when there were eligible patients to discuss. We measured dose as the average number of patients discussed on each unit per calendar day during the postimplementation period. We measured quality of delivery as the extent to which changes to monitoring that were agreed upon in the huddles were made at the bedside.
Safety Measures
To surveil for unintended consequences of reduced monitoring, we screened the hospital’s rapid response and code blue team database weekly for any events in patients previously discussed in huddles that occurred between huddle and hospital discharge. We reviewed charts to determine if the events were related to the intervention.
Randomization
Prior to randomization, the 8 units were divided into pairs based on participation in hospital-wide Joint Commission alarm management activities, use of alarm middleware that relayed detailed alarm information to nurses’ mobile phones, and baseline alarm rates. One unit in each pair was randomized to intervention and the other to control by coin flip.
Data Collection
We used Research Electronic Data Capture (REDCap)18 database tools.
Data for Unit-Level Analyses
We captured all alarms occurring on the study units during the study period using data from BedMasterEx. We obtained census data accurate to the hour from the Clinical Data Warehouse.
Data Captured in All Huddles
During each huddle, we collected the number of patients whose alarms were discussed, patient characteristics, presence of nurses and physicians, and monitoring changes agreed upon. We then followed up 4 hours later to determine if changes were made at the bedside by examining monitor settings.
Data Captured Only During Intensive Data Collection Days
We randomly selected 1 day during each of the 16 weeks of the postimplementation period to obtain additional patient-level data. On each intensive data collection day, the 4 monitored patients on each intervention and control unit with the most high-acuity alarms in the 4 hours prior to huddles occurring — regardless of whether or not these patients were later discussed in huddles — were identified for data collection. On these dates, a member of the research team reviewed each patient’s alarm counts in 4-hour blocks during the 24 hours before and after the huddle. Given that the huddles were not always at the same time every day (ranging between 10:00 and 13:00), we operationally set the huddle time as 12:00 for all units.
Data Analysis
We used Stata/SE 14.2 for all analyses.
Unit-Level Alarm Rates
To compare unit-level rates, we performed an interrupted time series analysis using segmented (piecewise) regression to evaluate the impact of the intervention.19,20 We used a multivariable generalized estimating equation model with the negative binomial distribution21 and clustering by unit. We bootstrapped the model and generated percentile-based 95% confidence intervals. We then used the model to estimate the alarm rate difference in differences between the baseline data collection period and the postimplementation data collection period for intervention versus control units.
Patient-Level Alarm Rates
In contrast to unit-level analysis, we used an embedded cohort design to model the change in individual patients’ alarms between the 24 hours leading up to huddles and the 24 hours following huddles in patients who were versus patients who were not discussed in huddles. The analysis was restricted to the patients included in intensive data collection days. We performed bootstrapped linear regression and generated percentile-based 95% confidence intervals using the difference in 4-hour block alarm rate between pre- and posthuddle as the outcome. We clustered within patients. We stratified by unit and preceding alarm rate. We modeled the alarm rate difference between the 24-hour prehuddle and the 24-hour posthuddle for huddled and nonhuddled patients and the difference in differences between exposure groups.
Implementation Outcomes
We summarized adoption and fidelity using proportions.
RESULTS
Alarm dashboards informed 580 structured alarm discussions during 353 safety huddles (huddles often included discussion of more than one patient).
Unit-Level Alarm Rates
Visually, alarm rates over time on each individual unit appeared flat despite the intervention (Supplementary Figure 3). Using piecewise regression, we found that intervention and control units had small increases in alarm rates between the baseline and postimplementation periods with a nonsignificant difference in these differences between the control and intervention groups (Table 1).
Patient-Level Alarm Rates
We then restricted the analysis to the patients whose data were collected during intensive data collection days. We obtained data from 1974 pre-post pairs of 4-hour time periods.
Implementation Outcomes
Adoption
The patient’s nurse attended 482 of the 580 huddle discussions (83.1%), and at least one of the patient’s physicians (resident, fellow, or attending) attended 394 (67.9%).
Fidelity: Adherence
In addition to the 353 huddles that included alarm discussion, 123 instances had no patients with ≥20 high acuity alarms in the preceding 4 hours therefore, no data were brought to the huddle. There were an additional 30 instances when a huddle did not occur or there was no alarm discussion in the huddle despite data being available. Thus, adherence occurred in 353 of 383 huddles (92.2%).
Fidelity: Dose
During the 112 calendar day postimplementation period, 379 patients’ alarms were discussed in huddles for an average intervention dose of 0.85 discussions per unit per calendar day.
Fidelity: Quality of Delivery
In 362 of the 580 huddle discussions (62.4%), changes were agreed upon. The most frequently agreed upon changes were discontinuing monitoring (32.0%), monitoring only when asleep or unsupervised (23.8%), widening heart rate parameters (12.7%), changing electrocardiographic leads/wires (8.6%), changing the pulse oximetry probe (8.0%), and increasing the delay time between when oxygen desaturation was detected and when the alarm was generated (4.7%). Of the huddle discussions with changes agreed upon, 346 (95.6%) changes were enacted at the bedside.
Safety Measures
There were 0 code blue events and 26 rapid response team activations for patients discussed in huddles. None were related to the intervention.
Discussion
Our main finding was that the huddle strategy was effective in safely reducing the burden of alarms for the high alarm pediatric ward patients whose alarms were discussed, but it did not reduce unit-level alarm rates. Implementation outcomes explained this finding. Although adoption and adherence were high, the overall dose of the intervention was low.
We also found that 36% of alarms had technical causes, the majority of which were related to the pulse oximetry probe detecting that it was off the patient or searching for a pulse. Although these alarms are likely perceived differently by clinical staff (most monitors generate different sounds for technical alarms), they still represent a substantial contribution to the alarm environment. Minimizing them in patients who must remain continuously monitored requires more intensive effort to implement other types of interventions than the main focus of this study, such as changing pulse oximetry probes and electrocardiographic leads/wires.
In one-third of huddles, monitoring was simply discontinued. We observed in many cases that, while these patients may have had legitimate indications for monitoring upon admission, their conditions had improved; after brief multidisciplinary discussion, the team concluded that monitoring was no longer indicated. This observation may suggest interventions at the ordering phase, such as prespecifying a monitoring duration.22,23
This study’s findings were consistent with a quasi-experimental study of safety huddle-based alarm discussions in a pediatric intensive care unit that showed a patient-level reduction of 116 alarms per patient-day in those discussed in huddles relative to controls.11 A smaller quasi-experimental study of implementing a nighttime alarm “ward round” in an adult intensive care unit showed a significant reduction in unit-level alarms/patient-day from 168 to 84.9 In a quality improvement report, a monitoring care process bundle that included discussion of alarm settings showed a reduction in unit-level alarms/patient-day from 180 to 40.10 Our study strengthens the body of literature using a cluster-randomized design, measuring patient- and unit-level outcomes, and including implementation outcomes that explain effectiveness findings.
On a hypothetical unit similar to the ones we studied with 20 occupied beds and 60 alarms/patient-day, an average of 1200 alarms would occur each day. We delivered the intervention to 0.85 patients per day. Changes were made at the bedside in 60% of those with the intervention delivered, and those patients had a difference in differences of 119 fewer alarms compared with the comparison patients on control units. In this scenario, we could expect a relative reduction of 0.85 x 0.60 x 119 = 61 fewer alarms/day total on the unit or a 5% reduction. However, that estimated reduction did not account for the arrival of new patients with high alarm rates, which certainly occurred in this study and explained the lack of effect at the unit level.
As described above, the intervention dose was low, which translated into a lack of effect at the unit level despite a strong effect at the patient level. This result was partly due to the manual process required to produce the alarm dashboards that restricted their availability to nonholiday weekdays. The study was performed at one hospital, which limited generalizability. The study hospital was already convening daily safety huddles that were well attended by nurses and physicians. Other hospitals without existing huddle structures may face challenges in implementing similar multidisciplinary alarm discussions. In addition, the study design was randomized at the unit (rather than patient) level, which limited our ability to balance potential confounders at the patient level.
Conclusion
A safety huddle intervention strategy to drive alarm customization was effective in safely reducing alarms for individual children discussed. However, unit-level alarm rates were not affected by the intervention due to a low dose. Leaders of efforts to reduce alarms should consider beginning with passive interventions (such as changes to default settings and alarm delays) and use huddle-based discussion as a second-line intervention to address remaining patients with high alarm rates.
Acknowledgments
We thank Matthew MacMurchy, BA, for his assistance with data collection.
Funding/Support
This study was supported by a Young Investigator Award (Bonafide, PI) from the Academic Pediatric Association.
Role of the Funder/Sponsor
The Academic Pediatric Association had no role in the design or conduct of the study; collection, management, analysis, or interpretation of the data; preparation, review, or approval of the manuscript; or decision to submit for publication.
Disclosures
No relevant financial activities, aside from the grant funding from the Academic Pediatric Association listed above, are reported.
1. Schondelmeyer AC, Brady PW, Goel VV, et al. Physiologic monitor alarm rates at 5 children’s hospitals. J Hosp Med. 2018;In press. PubMed
2. Cvach M, Kitchens M, Smith K, Harris P, Flack MN. Customizing alarm limits based on specific needs of patients. Biomed Instrum Technol. 2017;51(3):227-234. PubMed
3. Bonafide CP, Lin R, Zander M, et al. Association between exposure to nonactionable physiologic monitor alarms and response time in a children’s hospital. J Hosp Med. 2015;10(6):345-351. PubMed
4. Bonafide CP, Localio AR, Holmes JH, et al. Video analysis of factors associated with response time to physiologic monitor alarms in a children’s hospital. JAMA Pediatr. 2017;171(6):524-531. PubMed
5. Lange K, Nowak M, Zoller R, Lauer W. Boundary conditions for safe detection of clinical alarms: An observational study to identify the cognitive and perceptual demands on an Intensive Care Unit. In: In: D. de Waard, K.A. Brookhuis, A. Toffetti, A. Stuiver, C. Weikert, D. Coelho, D. Manzey, A.B. Ünal, S. Röttger, and N. Merat (Eds.) Proceedings of the Human Factors and Ergonomics Society Europe Chapter 2015 Annual Conference. Groningen, Netherlands; 2016.
6. Westbrook JI, Li L, Hooper TD, Raban MZ, Middleton S, Lehnbom EC. Effectiveness of a ‘Do not interrupt’ bundled intervention to reduce interruptions during medication administration: a cluster randomised controlled feasibility study. BMJ Qual Saf. 2017;26:734-742. PubMed
7. Chopra V, McMahon LF Jr. Redesigning hospital alarms for patient safety: alarmed and potentially dangerous. JAMA. 2014;311(12):1199-1200. PubMed
8. Turmell JW, Coke L, Catinella R, Hosford T, Majeski A. Alarm fatigue: use of an evidence-based alarm management strategy. J Nurs Care Qual. 2017;32(1):47-54. PubMed
9. Koerber JP, Walker J, Worsley M, Thorpe CM. An alarm ward round reduces the frequency of false alarms on the ICU at night. J Intensive Care Soc. 2011;12(1):75-76.
10. Dandoy CE, Davies SM, Flesch L, et al. A team-based approach to reducing cardiac monitor alarms. Pediatrics. 2014;134(6):e1686-1694. PubMed
11. Dewan M, Wolfe H, Lin R, et al. Impact of a safety huddle–based intervention on monitor alarm rates in low-acuity pediatric intensive care unit patients. J Hosp Med. 2017;12(8):652-657. PubMed
12. Goldenhar LM, Brady PW, Sutcliffe KM, Muething SE. Huddling for high reliability and situation awareness. BMJ Qual Saf. 2013;22(11):899-906. PubMed
13. Brady PW, Muething S, Kotagal U, et al. Improving situation awareness to reduce unrecognized clinical deterioration and serious safety events. Pediatrics. 2013;131:e298-308. PubMed
14. Curran GM, Bauer M, Mittman B, Pyne JM, Stetler C. Effectiveness-implementation hybrid designs: combining elements of clinical effectiveness and implementation research to enhance public health impact. Med Care. 2012;50(3):217-226. PubMed
15. Damschroder LJ, Aron DC, Keith RE, Kirsh SR, Alexander JA, Lowery JC. Fostering implementation of health services research findings into practice: a consolidated framework for advancing implementation science. Implement Sci. 2009;4(1):50. PubMed
16. Proctor E, Silmere H, Raghavan R, et al. Outcomes for implementation research: conceptual distinctions, measurement challenges, and research agenda. Adm Policy Ment Health. 2011;38(2):65-76. PubMed
17. Allen JD, Linnan LA, Emmons KM. Fidelity and its relationship to implementation effectiveness, adaptation, and dissemination. In: Dissemination and Implementation Research in Health: Translating Science to Practice (Brownson RC, Proctor EK, Colditz GA Eds.). Oxford University Press; 2012:281-304.
18. Harris PA, Taylor R, Thielke R, Payne J, Gonzalez N, Conde JG. Research electronic data capture (REDCap)—a metadata-driven methodology and workflow process for providing translational research informatics support. J Biomed Inf. 2009;42:377-381. PubMed
19. Singer JD, Willett JB. Applied Longitudinal Data Analysis: Modeling Change and Event Occurrence. New York: Oxford University Press; 2003.
20. Wagner AK, Soumerai SB, Zhang F, Ross-Degnan D. Segmented regression analysis of interrupted time series studies in medication use research. J Clin Pharm Ther. 2002;27:299-309. PubMed
21. Gardner W, Mulvey EP, Shaw EC. Regression analyses of counts and rates: Poisson, overdispersed Poisson, and negative binomial models. Psychol Bull. 1995;118:392-404. PubMed
22. Dressler R, Dryer MM, Coletti C, Mahoney D, Doorey AJ. Altering overuse of cardiac telemetry in non-intensive care unit settings by hardwiring the use of American Heart Association guidelines. JAMA Intern Med. 2014;174(11):1852-1854. PubMed
23. Boggan JC, Navar-Boggan AM, Patel V, Schulteis RD, Simel DL. Reductions in telemetry order duration do not reduce telemetry utilization. J Hosp Med. 2014;9(12):795-796. PubMed
© 2018 Society of Hospital Medicine
Monitor Alarms and Response Time
Hospital physiologic monitors can alert clinicians to early signs of physiologic deterioration, and thus have great potential to save lives. However, monitors generate frequent alarms,[1, 2, 3, 4, 5, 6, 7, 8] and most are not relevant to the patient's safety (over 90% of pediatric intensive care unit (PICU)[1, 2] and over 70% of adult intensive care alarms).[5, 6] In psychology experiments, humans rapidly learn to ignore or respond more slowly to alarms when exposed to high false‐alarm rates, exhibiting alarm fatigue.[9, 10] In 2013, The Joint Commission named alarm fatigue the most common contributing factor to alarm‐related sentinel events in hospitals.[11, 12]
Although alarm fatigue has been implicated as a major threat to patient safety, little empirical data support its existence in hospitals. In this study, we aimed to determine if there was an association between nurses' recent exposure to nonactionable physiologic monitor alarms and their response time to future alarms for the same patients. This exploratory work was designed to inform future research in this area, acknowledging that the sample size would be too small for multivariable modeling.
METHODS
Study Definitions
The alarm classification scheme is shown in Figure 1. Note that, for clarity, we have intentionally avoided using the terms true and false alarms because their interpretations vary across studies and can be misleading.
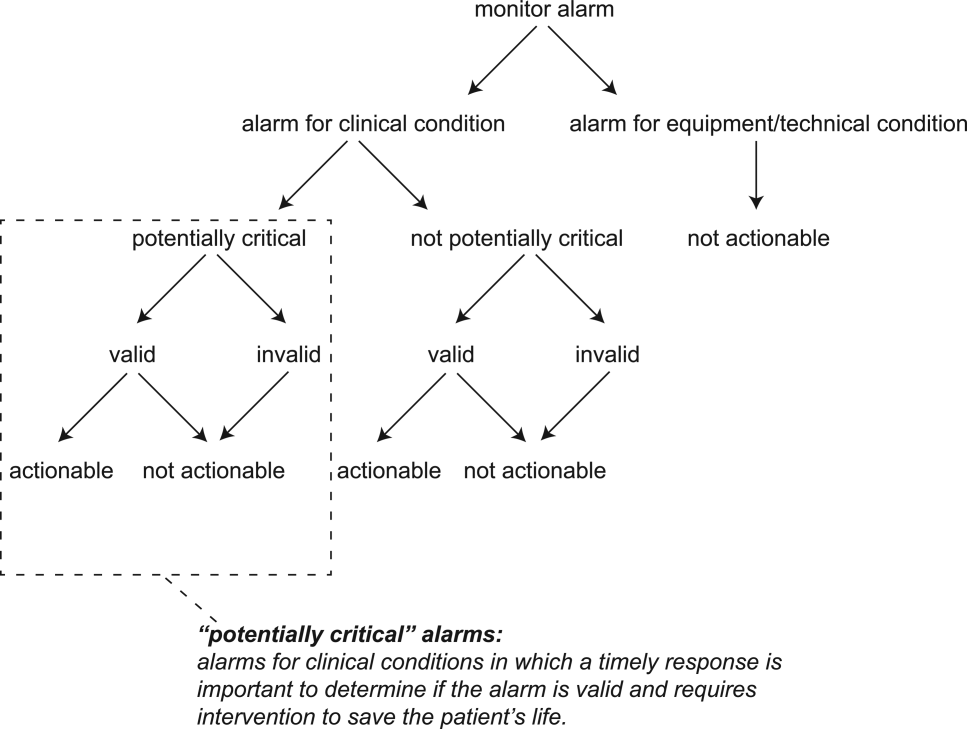
Potentially Critical Alarm
A potentially critical alarm is any alarm for a clinical condition for which a timely response is important to determine if the alarm requires intervention to save the patient's life. This is based on the alarm type alone, including alarms for life‐threatening arrhythmias such as asystole and ventricular tachycardia, as well as alarms for vital signs outside the set limits. Supporting Table 1 in the online version of this article lists the breakdown of alarm types that we defined a priori as potentially and not potentially critical.
| PICU | Ward | |||||||
|---|---|---|---|---|---|---|---|---|
| Alarm type | No. | % of Total | % Valid | % Actionable | No. | % of Total | % Valid | % Actionable |
| ||||||||
| Oxygen saturation | 197 | 19.4 | 82.7 | 38.6 | 590 | 41.2 | 24.4 | 1.9 |
| Heart rate | 194 | 19.1 | 95.4 | 1.0 | 266 | 18.6 | 87.2 | 0.0 |
| Respiratory rate | 229 | 22.6 | 80.8 | 13.5 | 316 | 22.1 | 48.1 | 1.0 |
| Blood pressure | 259 | 25.5 | 83.8 | 5.8 | 11 | 0.8 | 72.7 | 0.0 |
| Critical arrhythmia | 1 | 0.1 | 0.0 | 0.0 | 4 | 0.3 | 0.0 | 0.0 |
| Noncritical arrhythmia | 71 | 7.0 | 2.8 | 0.0 | 244 | 17.1 | 8.6 | 0.0 |
| Central venous pressure | 49 | 4.8 | 0.0 | 0.0 | 0 | 0.0 | N/A | N/A |
| Exhaled carbon dioxide | 14 | 1.4 | 92.9 | 50.0 | 0 | 0.0 | N/A | N/A |
| Total | 1014 | 100.0 | 75.6 | 12.9 | 1,431 | 100.0 | 38.9 | 1.0 |
Valid Alarm
A valid alarm is any alarm that correctly identifies the physiologic status of the patient. Validity was based on waveform quality, lead signal strength indicators, and artifact conditions, referencing each monitor's operator's manual.
Actionable Alarm
An actionable alarm is any valid alarm for a clinical condition that either: (1) leads to a clinical intervention; (2) leads to a consultation with another clinician at the bedside (and thus visible on camera); or (3) is a situation that should have led to intervention or consultation, but the alarm was unwitnessed or misinterpreted by the staff at the bedside.
Nonactionable Alarm
An unactionable alarm is any alarm that does not meet the actionable definition above, including invalid alarms such as those caused by motion artifact, equipment/technical alarms, and alarms that are valid but nonactionable (nuisance alarms).[13]
Response Time
The response time is the time elapsed from when the alarm fired at the bedside to when the nurse entered the room or peered through a window or door, measured in seconds.
Setting and Subjects
We performed this study between August 2012 and July 2013 at a freestanding children's hospital. We evaluated nurses caring for 2 populations: (1) PICU patients with heart and/or lung failure (requiring inotropic support and/or invasive mechanical ventilation), and (2) medical patients on a general inpatient ward. Nurses caring for heart and/or lung failure patients in the PICU typically were assigned 1 to 2 total patients. Nurses on the medical ward typically were assigned 2 to 4 patients. We identified subjects from the population of nurses caring for eligible patients with parents available to provide in‐person consent in each setting. Our primary interest was to evaluate the association between nonactionable alarms and response time, and not to study the epidemiology of alarms in a random sample. Therefore, when alarm data were available prior to screening, we first approached nurses caring for patients in the top 25% of alarm rates for that unit over the preceding 4 hours. We identified preceding alarm rates using BedMasterEx (Excel Medical Electronics, Jupiter, FL).
Human Subjects Protection
This study was approved by the institutional review board of The Children's Hospital of Philadelphia. We obtained written in‐person consent from the patient's parent and the nurse subject. We obtained a Certificate of Confidentiality from the National Institutes of Health to further protect study participants.[14]
Monitoring Equipment
All patients in the PICU were monitored continuously using General Electric (GE) (Fairfield, CT) solar devices. All bed spaces on the wards include GE Dash monitors that are used if ordered. On the ward we studied, 30% to 50% of patients are typically monitored at any given time. In addition to alarming at the bedside, most clinical alarms also generated a text message sent to the nurse's wireless phone listing the room number and the word monitor. Messages did not provide any clinical information about the alarm or patient's status. There were no technicians reviewing alarms centrally.
Physicians used an order set to order monitoring, selecting 1 of 4 available preconfigured profiles: infant <6 months, infant 6 months to 1 year, child, and adult. The parameters for each age group are in Supporting Figure 1, available in the online version of this article. A physician order is required for a nurse to change the parameters. Participating in the study did not affect this workflow.
Primary Outcome
The primary outcome was the nurse's response time to potentially critical monitor alarms that occurred while neither they nor any other clinicians were in the patient's room.
Primary Exposure and Alarm Classification
The primary exposure was the number of nonactionable alarms in the same patient over the preceding 120 minutes (rolling and updated each minute). The alarm classification scheme is shown in Figure 1.
Due to technical limitations with obtaining time‐stamped alarm data from the different ventilators in use during the study period, we were unable to identify the causes of all ventilator alarms. Therefore, we included ventilator alarms that did not lead to clinical interventions as nonactionable alarm exposures, but we did not evaluate the response time to any ventilator alarms.
Data Collection
We combined video recordings with monitor time‐stamp data to evaluate the association between nonactionable alarms and the nurse's response time. Our detailed video recording and annotation methods have been published separately.[15] Briefly, we mounted up to 6 small video cameras in patients' rooms and recorded up to 6 hours per session. The cameras captured the monitor display, a wide view of the room, a close‐up view of the patient, and all windows and doors through which staff could visually assess the patient without entering the room.
Video Processing, Review, and Annotation
The first 5 video sessions were reviewed in a group training setting. Research assistants received instruction on how to determine alarm validity and actionability in accordance with the study definitions. Following the training period, the review workflow was as follows. First, a research assistant entered basic information and a preliminary assessment of the alarm's clinical validity and actionability into a REDCap (Research Electronic Data Capture; Vanderbilt University, Nashville, TN) database.[16] Later, a physician investigator secondarily reviewed all alarms and confirmed the assessments of the research assistants or, when disagreements occurred, discussed and reconciled the database. Alarms that remained unresolved after secondary review were flagged for review with an additional physician or nurse investigator in a team meeting.
Data Analysis
We summarized the patient and nurse subjects, the distributions of alarms, and the response times to potentially critical monitor alarms that occurred while neither the nurse nor any other clinicians were in the patient's room. We explored the data using plots of alarms and response times occurring within individual video sessions as well as with simple linear regression. Hypothesizing that any alarm fatigue effect would be strongest in the highest alarm patients, and having observed that alarms are distributed very unevenly across patients in both the PICU and ward, we made the decision not to use quartiles, but rather to form clinically meaningful categories. We also hypothesized that nurses might not exhibit alarm fatigue unless they were inundated with alarms. We thus divided the nonactionable alarm counts over the preceding 120 minutes into 3 categories: 0 to 29 alarms to represent a low to average alarm rate exhibited by the bottom 50% of the patients, 30 to 79 alarms to represent an elevated alarm rate, and 80+ alarms to represent an extremely high alarm rate exhibited by the top 5%. Because the exposure time was 120 minutes, we conducted the analysis on the alarms occurring after a nurse had been video recorded for at least 120 minutes.
We further evaluated the relationship between nonactionable alarms and nurse response time with Kaplan‐Meier plots by nonactionable alarm count category using the observed response‐time data. The Kaplan‐Meier plots compared response time across the nonactionable alarm exposure group, without any statistical modeling. A log‐rank test stratified by nurse evaluated whether the distributions of response time in the Kaplan‐Meier plots differed across the 3 alarm exposure groups, accounting for within‐nurse clustering.
Accelerated failure‐time regression based on the Weibull distribution then allowed us to compare response time across each alarm exposure group and provided confidence intervals. Accelerated failure‐time models are comparable to Cox models, but emphasize time to event rather than hazards.[17, 18] We determined that the Weibull distribution was suitable by evaluating smoothed hazard and log‐hazard plots, the confidence intervals of the shape parameters in the Weibull models that did not include 1, and by demonstrating that the Weibull model had better fit than an alternative (exponential) model using the likelihood‐ratio test (P<0.0001 for PICU, P=0.02 for ward). Due to the small sample size of nurses and patients, we could not adjust for nurse‐ or patient‐level covariates in the model. When comparing the nonactionable alarm exposure groups in the regression model (029 vs 3079, 3079 vs 80+, and 029 vs 80+), we Bonferroni corrected the critical P value for the 3 comparisons, for a critical P value of 0.05/3=0.0167.
Nurse Questionnaire
At the session's conclusion, nurses completed a questionnaire that included demographics and asked, Did you respond more quickly to monitor alarms during this study because you knew you were being filmed? to measure if nurses would report experiencing a Hawthorne‐like effect.[19, 20, 21]
RESULTS
We performed 40 sessions among 40 patients and 36 nurses over 210 hours. We performed 20 sessions in children with heart and/or lung failure in the PICU and 20 sessions in children on a general ward. Sessions took place on weekdays between 9:00 am and 6:00 pm. There were 3 occasions when we filmed 2 patients cared for by the same nurse at the same time.
Nurses were mostly female (94.4%) and had between 2 months and 28 years of experience (median, 4.8 years). Patients on the ward ranged from 5 days to 5.4 years old (median, 6 months). Patients in the PICU ranged from 5 months to 16 years old (median, 2.5 years). Among the PICU patients, 14 (70%) were receiving mechanical ventilation only, 3 (15%) were receiving vasopressors only, and 3 (15%) were receiving mechanical ventilation and vasopressors.
We observed 5070 alarms during the 40 sessions. We excluded 108 (2.1%) that occurred at the end of video recording sessions with the nurse absent from the room because the nurse's response could not be determined. Alarms per session ranged from 10 to 1430 (median, 75; interquartile range [IQR], 35138). We excluded the outlier PICU patient with 1430 alarms in 5 hours from the analysis to avoid the potential for biasing the results. Figure 2 depicts the data flow.
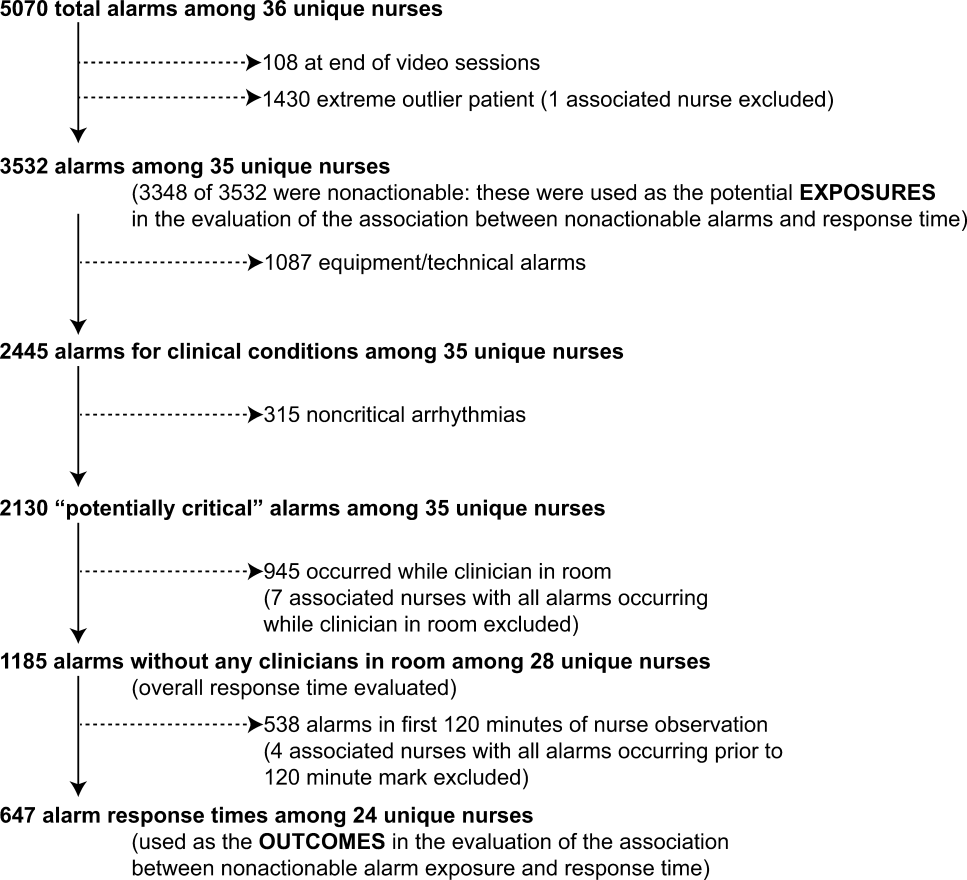
Following the 5 training sessions, research assistants independently reviewed and made preliminary assessments on 4674 alarms; these alarms were all secondarily reviewed by a physician. Using the physician reviewer as the gold standard, the research assistant's sensitivity (assess alarm as actionable when physician also assesses as actionable) was 96.8% and specificity (assess alarm as nonactionable when physician also assesses as nonactionable) was 96.9%. We had to review 54 of 4674 alarms (1.2%) with an additional physician or nurse investigator to achieve consensus.
Characteristics of the 2445 alarms for clinical conditions are shown in Table 1. Only 12.9% of alarms in heart‐ and/or lung‐failure patients in the PICU were actionable, and only 1.0% of alarms in medical patients on a general inpatient ward were actionable.
Overall Response Times for Out‐of‐Room Alarms
We first evaluated response times without excluding alarms occurring prior to the 120‐minute mark. Of the 2445 clinical condition alarms, we excluded the 315 noncritical arrhythmia types from analysis of response time because they did not meet our definition of potentially critical alarms. Of the 2130 potentially critical alarms, 1185 (55.6%) occurred while neither the nurse nor any other clinician was in the patient's room. We proceeded to analyze the response time to these 1185 alarms (307 in the PICU and 878 on the ward). In the PICU, median response time was 3.3 minutes (IQR, 0.814.4). On the ward, median response time was 9.8 minutes (IQR, 3.222.4).
Response‐Time Association With Nonactionable Alarm Exposure
Next, we analyzed the association between response time to potentially critical alarms that occurred when the nurse was not in the patient's room and the number of nonactionable alarms occurring over the preceding 120‐minute window. This required excluding the alarms that occurred in the first 120 minutes of each session, leaving 647 alarms with eligible response times to evaluate the exposure between prior nonactionable alarm exposure and response time: 219 in the PICU and 428 on the ward. Kaplan‐Meier plots and tabulated response times demonstrated the incremental relationships between each nonactionable alarm exposure category in the observed data, with the effects most prominent as the Kaplan‐Meier plots diverged beyond the median (Figure 3 and Table 2). Excluding the extreme outlier patient had no effect on the results, because 1378 of the 1430 alarms occurred with the nurse present at the bedside, and only 2 of the remaining alarms were potentially critical.
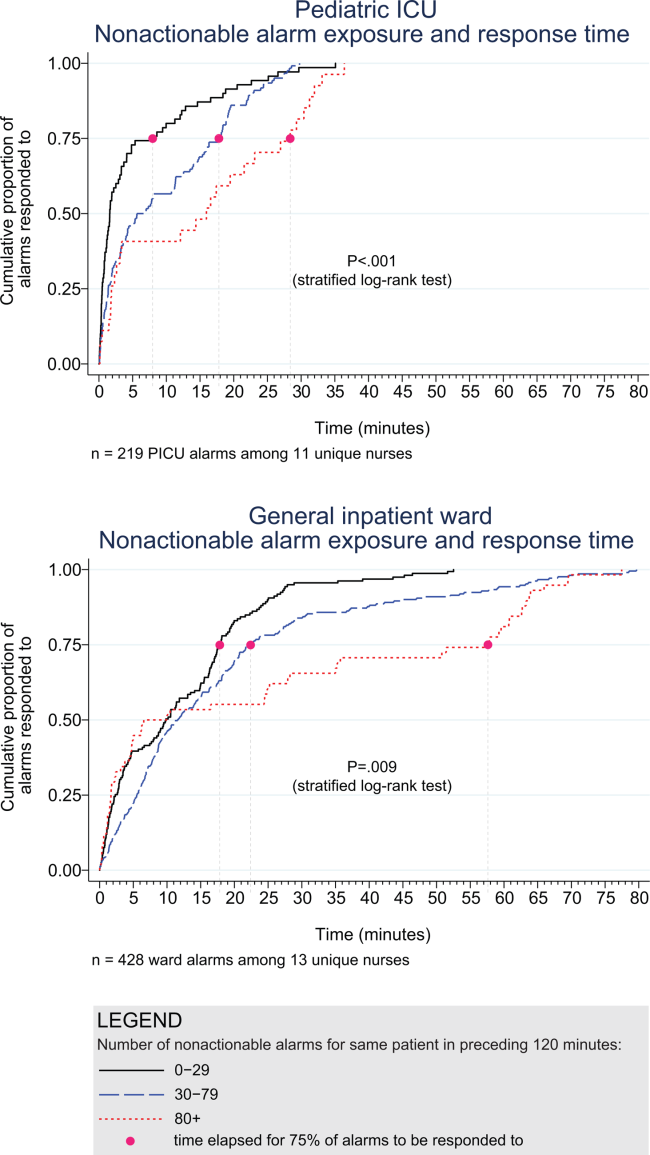
| Observed Data | Accelerated Failure‐Time Model | |||||||
|---|---|---|---|---|---|---|---|---|
| Number of Potentially Critical Alarms | Minutes Elapsed Until This Percentage of Alarms Was Responded to | Modeled Response Time, min | 95% CI, min | P Value* | ||||
| 50% (Median) | 75% | 90% | 95% | |||||
| ||||||||
| PICU | ||||||||
| 029 nonactionable alarms | 70 | 1.6 | 8.0 | 18.6 | 25.1 | 2.8 | 1.9‐3.8 | Reference |
| 3079 nonactionable alarms | 122 | 6.3 | 17.8 | 22.5 | 26.0 | 5.3 | 4.06.7 | 0.001 (vs 029) |
| 80+ nonactionable alarms | 27 | 16.0 | 28.4 | 32.0 | 33.1 | 8.5 | 4.312.7 | 0.009 (vs 029), 0.15 (vs 3079) |
| Ward | ||||||||
| 029 nonactionable alarms | 159 | 9.8 | 17.8 | 25.0 | 28.9 | 7.7 | 6.39.1 | Reference |
| 3079 nonactionable alarms | 211 | 11.6 | 22.4 | 44.6 | 63.2 | 11.5 | 9.613.3 | 0.001 (vs 029) |
| 80+ nonactionable alarms | 58 | 8.3 | 57.6 | 63.8 | 69.5 | 15.6 | 11.020.1 | 0.001 (vs 029), 0.09 (vs 3079) |
Accelerated failure‐time regressions revealed significant incremental increases in the modeled response time as the number of preceding nonactionable alarms increased in both the PICU and ward settings (Table 2).
Hawthorne‐like Effects
Four of the 36 nurses reported that they responded more quickly to monitor alarms because they knew they were being filmed.
DISCUSSION
Alarm fatigue has recently generated interest among nurses,[22] physicians,[23] regulatory bodies,[24] patient safety organizations,[25] and even attorneys,[26] despite a lack of prior evidence linking nonactionable alarm exposure to response time or other adverse patient‐relevant outcomes. This study's main findings were that (1) the vast majority of alarms were nonactionable, (2) response time to alarms occurring while the nurse was out of the room increased as the number of nonactionable alarms over the preceding 120 minutes increased. These findings may be explained by alarm fatigue.
Our results build upon the findings of other related studies. The nonactionable alarm proportions we found were similar to other pediatric studies, reporting greater than 90% nonactionable alarms.[1, 2] One other study has reported a relationship between alarm exposure and response time. In that study, Voepel‐Lewis and colleagues evaluated nurse responses to pulse oximetry desaturation alarms in adult orthopedic surgery patients using time‐stamp data from their monitor notification system.[27] They found that alarm response time was significantly longer for patients in the highest quartile of alarms compared to those in lower quartiles. Our study provides new data suggesting a relationship between nonactionable alarm exposure and nurse response time.
Our study has several limitations. First, as a preliminary study to investigate feasibility and possible association, the sample of patients and nurses was necessarily limited and did not permit adjustment for nurse‐ or patient‐level covariates. A multivariable analysis with a larger sample might provide insight into alternate explanations for these findings other than alarm fatigue, including measures of nurse workload and patient factors (such as age and illness severity). Additional factors that are not as easily measured can also contribute to the complex decision of when and how to respond to alarms.[28, 29] Second, nurses were aware that they were being video recorded as part of a study of nonactionable alarms, although they did not know the specific details of measurement. Although this lack of blinding might lead to a Hawthorne‐like effect, our positive results suggest that this effect, if present, did not fully obscure the association. Third, all sessions took place on weekdays during daytime hours, but effects of nonactionable alarms might vary by time and day. Finally, we suspect that when nurses experience critical alarms that require them to intervene and rescue a patient, their response times to that patient's alarms that occur later in their shift will be quicker due to a heightened concern for the alarm being actionable. We were unable to explore that relationship in this analysis because the number of critical alarms requiring intervention was very small. This is a topic of future study.
CONCLUSIONS
We identified an association between a nurse's prior exposure to nonactionable alarms and response time to future alarms. This finding is consistent with alarm fatigue, but requires further study to more clearly delineate other factors that might confound or modify that relationship.
Disclosures
This project was funded by the Health Research Formula Fund Grant 4100050891 from the Pennsylvania Department of Public Health Commonwealth Universal Research Enhancement Program (awarded to Drs. Keren and Bonafide). Dr. Bonafide is also supported by the National Heart, Lung, and Blood Institute of the National Institutes of Health under award number K23HL116427. The content is solely the responsibility of the authors and does not necessarily represent the official views of the National Institutes of Health. The authors have no financial relationships or conflicts of interest relevant to this article to disclose.
- . Crying wolf: false alarms in a pediatric intensive care unit. Crit Care Med. 1994;22(6):981–985.
- , . Poor prognosis for existing monitors in the intensive care unit. Crit Care Med. 1997;25(4):614–619.
- , , , , . Clinical evaluation of alarm efficiency in intensive care [in French]. Ann Fr Anesth Reanim. 2000;19:459–466.
- , , , . Reducing false alarms of intensive care online‐monitoring systems: an evaluation of two signal extraction algorithms. Comput Math Methods Med. 2011;2011:143480.
- , , , , , . Multicentric study of monitoring alarms in the adult intensive care unit (ICU): a descriptive analysis. Intensive Care Med. 1999;25:1360–1366.
- , , . Improving alarm performance in the medical intensive care unit using delays and clinical context. Anesth Analg. 2009;108:1546–1552.
- , . Monitor alarm fatigue: standardizing use of physiological monitors and decreasing nuisance alarms. Am J Crit Care. 2010;19:28–34.
- , , , , , . Intensive care unit alarms—how many do we need? Crit Care Med. 2010;38:451–456.
- , , , . System operator response to warnings of danger: a laboratory investigation of the effects of the predictive value of a warning on human response time. J Exp Psychol Appl. 1995;1:19–33.
- , , . Human probability matching behaviour in response to alarms of varying reliability. Ergonomics. 1995;38:2300–2312.
- The Joint Commission. Sentinel event alert: medical device alarm safety in hospitals. 2013. Available at: http://www.jointcommission.org/sea_issue_50/. Accessed October 9, 2014.
- . Joint commission warns of alarm fatigue: multitude of alarms from monitoring devices problematic. JAMA. 2013;309(22):2315–2316.
- . Monitor alarm fatigue: an integrative review. Biomed Instrum Technol. 2012;46(4):268–277.
- NIH Certificates of Confidentiality Kiosk. Available at: http://grants.nih.gov/grants/policy/coc/. Accessed April 21, 2014.
- , , , et al. Video methods for evaluating physiologic monitor alarms and alarm responses. Biomed Instrum Technol. 2014;48(3):220–230.
- , , , , , . Research electronic data capture (REDCap)—a metadata‐driven methodology and workflow process for providing translational research informatics support. J Biomed Inf. 2009;42:377–381.
- . Accelerated failure time and other parametric models. In: Modelling Survival Data in Medical Research. 2nd ed. Boca Raton, FL: Chapman 2003:197–229.
- , , , . Parametric models. In: An Introduction to Survival Analysis Using Stata, 3rd ed. College Station, TX: Stata Press; 2010:229–244.
- , . Management and the Worker. Cambridge, MA: Harvard University Press; 1939.
- . What happened at Hawthorne? Science. 1974;183(4128):922–932.
- , , , , . Validation of the Work Observation Method By Activity Timing (WOMBAT) method of conducting time‐motion observations in critical care settings: an observational study. BMC Med Inf Decis Mak. 2011;11:32.
- , . Alarm fatigue: a patient safety concern. AACN Adv Crit Care. 2013;24(4):378–386.
- , . Redesigning hospital alarms for patient safety: alarmed and potentially dangerous. JAMA. 2014;311(12):1199–1200.
- The Joint Commission. The Joint Commission announces 2014 National Patient Safety Goal. Jt Comm Perspect. 2013;33:1–4.
- Top 10 health technology hazards for 2014. Health Devices. 2013;42(11):354–380.
- My Philly Lawyer. Medical malpractice: alarm fatigue threatens patient safety. 2014. Available at: http://www.myphillylawyer.com/Resources/Legal-Articles/Medical-Malpractice-Alarm-Fatigue-Threatens-Patient-Safety.shtml. Accessed April 4, 2014.
- , , , et al. Pulse oximetry desaturation alarms on a general postoperative adult unit: a prospective observational study of nurse response time. Int J Nurs Stud. 2013;50(10):1351–1358.
- , , , , . A description of nurses' decision‐making in managing electrocardiographic monitor alarms [published online ahead of print May 10, 2014]. J Clin Nurs. doi:10.1111/jocn.12625.
- . Nurses' response to frequency and types of electrocardiography alarms in a non‐critical care setting: a descriptive study. Int J Nurs Stud. 2014;51(2):190–197.
Hospital physiologic monitors can alert clinicians to early signs of physiologic deterioration, and thus have great potential to save lives. However, monitors generate frequent alarms,[1, 2, 3, 4, 5, 6, 7, 8] and most are not relevant to the patient's safety (over 90% of pediatric intensive care unit (PICU)[1, 2] and over 70% of adult intensive care alarms).[5, 6] In psychology experiments, humans rapidly learn to ignore or respond more slowly to alarms when exposed to high false‐alarm rates, exhibiting alarm fatigue.[9, 10] In 2013, The Joint Commission named alarm fatigue the most common contributing factor to alarm‐related sentinel events in hospitals.[11, 12]
Although alarm fatigue has been implicated as a major threat to patient safety, little empirical data support its existence in hospitals. In this study, we aimed to determine if there was an association between nurses' recent exposure to nonactionable physiologic monitor alarms and their response time to future alarms for the same patients. This exploratory work was designed to inform future research in this area, acknowledging that the sample size would be too small for multivariable modeling.
METHODS
Study Definitions
The alarm classification scheme is shown in Figure 1. Note that, for clarity, we have intentionally avoided using the terms true and false alarms because their interpretations vary across studies and can be misleading.
Potentially Critical Alarm
A potentially critical alarm is any alarm for a clinical condition for which a timely response is important to determine if the alarm requires intervention to save the patient's life. This is based on the alarm type alone, including alarms for life‐threatening arrhythmias such as asystole and ventricular tachycardia, as well as alarms for vital signs outside the set limits. Supporting Table 1 in the online version of this article lists the breakdown of alarm types that we defined a priori as potentially and not potentially critical.
| PICU | Ward | |||||||
|---|---|---|---|---|---|---|---|---|
| Alarm type | No. | % of Total | % Valid | % Actionable | No. | % of Total | % Valid | % Actionable |
| ||||||||
| Oxygen saturation | 197 | 19.4 | 82.7 | 38.6 | 590 | 41.2 | 24.4 | 1.9 |
| Heart rate | 194 | 19.1 | 95.4 | 1.0 | 266 | 18.6 | 87.2 | 0.0 |
| Respiratory rate | 229 | 22.6 | 80.8 | 13.5 | 316 | 22.1 | 48.1 | 1.0 |
| Blood pressure | 259 | 25.5 | 83.8 | 5.8 | 11 | 0.8 | 72.7 | 0.0 |
| Critical arrhythmia | 1 | 0.1 | 0.0 | 0.0 | 4 | 0.3 | 0.0 | 0.0 |
| Noncritical arrhythmia | 71 | 7.0 | 2.8 | 0.0 | 244 | 17.1 | 8.6 | 0.0 |
| Central venous pressure | 49 | 4.8 | 0.0 | 0.0 | 0 | 0.0 | N/A | N/A |
| Exhaled carbon dioxide | 14 | 1.4 | 92.9 | 50.0 | 0 | 0.0 | N/A | N/A |
| Total | 1014 | 100.0 | 75.6 | 12.9 | 1,431 | 100.0 | 38.9 | 1.0 |
Valid Alarm
A valid alarm is any alarm that correctly identifies the physiologic status of the patient. Validity was based on waveform quality, lead signal strength indicators, and artifact conditions, referencing each monitor's operator's manual.
Actionable Alarm
An actionable alarm is any valid alarm for a clinical condition that either: (1) leads to a clinical intervention; (2) leads to a consultation with another clinician at the bedside (and thus visible on camera); or (3) is a situation that should have led to intervention or consultation, but the alarm was unwitnessed or misinterpreted by the staff at the bedside.
Nonactionable Alarm
An unactionable alarm is any alarm that does not meet the actionable definition above, including invalid alarms such as those caused by motion artifact, equipment/technical alarms, and alarms that are valid but nonactionable (nuisance alarms).[13]
Response Time
The response time is the time elapsed from when the alarm fired at the bedside to when the nurse entered the room or peered through a window or door, measured in seconds.
Setting and Subjects
We performed this study between August 2012 and July 2013 at a freestanding children's hospital. We evaluated nurses caring for 2 populations: (1) PICU patients with heart and/or lung failure (requiring inotropic support and/or invasive mechanical ventilation), and (2) medical patients on a general inpatient ward. Nurses caring for heart and/or lung failure patients in the PICU typically were assigned 1 to 2 total patients. Nurses on the medical ward typically were assigned 2 to 4 patients. We identified subjects from the population of nurses caring for eligible patients with parents available to provide in‐person consent in each setting. Our primary interest was to evaluate the association between nonactionable alarms and response time, and not to study the epidemiology of alarms in a random sample. Therefore, when alarm data were available prior to screening, we first approached nurses caring for patients in the top 25% of alarm rates for that unit over the preceding 4 hours. We identified preceding alarm rates using BedMasterEx (Excel Medical Electronics, Jupiter, FL).
Human Subjects Protection
This study was approved by the institutional review board of The Children's Hospital of Philadelphia. We obtained written in‐person consent from the patient's parent and the nurse subject. We obtained a Certificate of Confidentiality from the National Institutes of Health to further protect study participants.[14]
Monitoring Equipment
All patients in the PICU were monitored continuously using General Electric (GE) (Fairfield, CT) solar devices. All bed spaces on the wards include GE Dash monitors that are used if ordered. On the ward we studied, 30% to 50% of patients are typically monitored at any given time. In addition to alarming at the bedside, most clinical alarms also generated a text message sent to the nurse's wireless phone listing the room number and the word monitor. Messages did not provide any clinical information about the alarm or patient's status. There were no technicians reviewing alarms centrally.
Physicians used an order set to order monitoring, selecting 1 of 4 available preconfigured profiles: infant <6 months, infant 6 months to 1 year, child, and adult. The parameters for each age group are in Supporting Figure 1, available in the online version of this article. A physician order is required for a nurse to change the parameters. Participating in the study did not affect this workflow.
Primary Outcome
The primary outcome was the nurse's response time to potentially critical monitor alarms that occurred while neither they nor any other clinicians were in the patient's room.
Primary Exposure and Alarm Classification
The primary exposure was the number of nonactionable alarms in the same patient over the preceding 120 minutes (rolling and updated each minute). The alarm classification scheme is shown in Figure 1.
Due to technical limitations with obtaining time‐stamped alarm data from the different ventilators in use during the study period, we were unable to identify the causes of all ventilator alarms. Therefore, we included ventilator alarms that did not lead to clinical interventions as nonactionable alarm exposures, but we did not evaluate the response time to any ventilator alarms.
Data Collection
We combined video recordings with monitor time‐stamp data to evaluate the association between nonactionable alarms and the nurse's response time. Our detailed video recording and annotation methods have been published separately.[15] Briefly, we mounted up to 6 small video cameras in patients' rooms and recorded up to 6 hours per session. The cameras captured the monitor display, a wide view of the room, a close‐up view of the patient, and all windows and doors through which staff could visually assess the patient without entering the room.
Video Processing, Review, and Annotation
The first 5 video sessions were reviewed in a group training setting. Research assistants received instruction on how to determine alarm validity and actionability in accordance with the study definitions. Following the training period, the review workflow was as follows. First, a research assistant entered basic information and a preliminary assessment of the alarm's clinical validity and actionability into a REDCap (Research Electronic Data Capture; Vanderbilt University, Nashville, TN) database.[16] Later, a physician investigator secondarily reviewed all alarms and confirmed the assessments of the research assistants or, when disagreements occurred, discussed and reconciled the database. Alarms that remained unresolved after secondary review were flagged for review with an additional physician or nurse investigator in a team meeting.
Data Analysis
We summarized the patient and nurse subjects, the distributions of alarms, and the response times to potentially critical monitor alarms that occurred while neither the nurse nor any other clinicians were in the patient's room. We explored the data using plots of alarms and response times occurring within individual video sessions as well as with simple linear regression. Hypothesizing that any alarm fatigue effect would be strongest in the highest alarm patients, and having observed that alarms are distributed very unevenly across patients in both the PICU and ward, we made the decision not to use quartiles, but rather to form clinically meaningful categories. We also hypothesized that nurses might not exhibit alarm fatigue unless they were inundated with alarms. We thus divided the nonactionable alarm counts over the preceding 120 minutes into 3 categories: 0 to 29 alarms to represent a low to average alarm rate exhibited by the bottom 50% of the patients, 30 to 79 alarms to represent an elevated alarm rate, and 80+ alarms to represent an extremely high alarm rate exhibited by the top 5%. Because the exposure time was 120 minutes, we conducted the analysis on the alarms occurring after a nurse had been video recorded for at least 120 minutes.
We further evaluated the relationship between nonactionable alarms and nurse response time with Kaplan‐Meier plots by nonactionable alarm count category using the observed response‐time data. The Kaplan‐Meier plots compared response time across the nonactionable alarm exposure group, without any statistical modeling. A log‐rank test stratified by nurse evaluated whether the distributions of response time in the Kaplan‐Meier plots differed across the 3 alarm exposure groups, accounting for within‐nurse clustering.
Accelerated failure‐time regression based on the Weibull distribution then allowed us to compare response time across each alarm exposure group and provided confidence intervals. Accelerated failure‐time models are comparable to Cox models, but emphasize time to event rather than hazards.[17, 18] We determined that the Weibull distribution was suitable by evaluating smoothed hazard and log‐hazard plots, the confidence intervals of the shape parameters in the Weibull models that did not include 1, and by demonstrating that the Weibull model had better fit than an alternative (exponential) model using the likelihood‐ratio test (P<0.0001 for PICU, P=0.02 for ward). Due to the small sample size of nurses and patients, we could not adjust for nurse‐ or patient‐level covariates in the model. When comparing the nonactionable alarm exposure groups in the regression model (029 vs 3079, 3079 vs 80+, and 029 vs 80+), we Bonferroni corrected the critical P value for the 3 comparisons, for a critical P value of 0.05/3=0.0167.
Nurse Questionnaire
At the session's conclusion, nurses completed a questionnaire that included demographics and asked, Did you respond more quickly to monitor alarms during this study because you knew you were being filmed? to measure if nurses would report experiencing a Hawthorne‐like effect.[19, 20, 21]
RESULTS
We performed 40 sessions among 40 patients and 36 nurses over 210 hours. We performed 20 sessions in children with heart and/or lung failure in the PICU and 20 sessions in children on a general ward. Sessions took place on weekdays between 9:00 am and 6:00 pm. There were 3 occasions when we filmed 2 patients cared for by the same nurse at the same time.
Nurses were mostly female (94.4%) and had between 2 months and 28 years of experience (median, 4.8 years). Patients on the ward ranged from 5 days to 5.4 years old (median, 6 months). Patients in the PICU ranged from 5 months to 16 years old (median, 2.5 years). Among the PICU patients, 14 (70%) were receiving mechanical ventilation only, 3 (15%) were receiving vasopressors only, and 3 (15%) were receiving mechanical ventilation and vasopressors.
We observed 5070 alarms during the 40 sessions. We excluded 108 (2.1%) that occurred at the end of video recording sessions with the nurse absent from the room because the nurse's response could not be determined. Alarms per session ranged from 10 to 1430 (median, 75; interquartile range [IQR], 35138). We excluded the outlier PICU patient with 1430 alarms in 5 hours from the analysis to avoid the potential for biasing the results. Figure 2 depicts the data flow.
Following the 5 training sessions, research assistants independently reviewed and made preliminary assessments on 4674 alarms; these alarms were all secondarily reviewed by a physician. Using the physician reviewer as the gold standard, the research assistant's sensitivity (assess alarm as actionable when physician also assesses as actionable) was 96.8% and specificity (assess alarm as nonactionable when physician also assesses as nonactionable) was 96.9%. We had to review 54 of 4674 alarms (1.2%) with an additional physician or nurse investigator to achieve consensus.
Characteristics of the 2445 alarms for clinical conditions are shown in Table 1. Only 12.9% of alarms in heart‐ and/or lung‐failure patients in the PICU were actionable, and only 1.0% of alarms in medical patients on a general inpatient ward were actionable.
Overall Response Times for Out‐of‐Room Alarms
We first evaluated response times without excluding alarms occurring prior to the 120‐minute mark. Of the 2445 clinical condition alarms, we excluded the 315 noncritical arrhythmia types from analysis of response time because they did not meet our definition of potentially critical alarms. Of the 2130 potentially critical alarms, 1185 (55.6%) occurred while neither the nurse nor any other clinician was in the patient's room. We proceeded to analyze the response time to these 1185 alarms (307 in the PICU and 878 on the ward). In the PICU, median response time was 3.3 minutes (IQR, 0.814.4). On the ward, median response time was 9.8 minutes (IQR, 3.222.4).
Response‐Time Association With Nonactionable Alarm Exposure
Next, we analyzed the association between response time to potentially critical alarms that occurred when the nurse was not in the patient's room and the number of nonactionable alarms occurring over the preceding 120‐minute window. This required excluding the alarms that occurred in the first 120 minutes of each session, leaving 647 alarms with eligible response times to evaluate the exposure between prior nonactionable alarm exposure and response time: 219 in the PICU and 428 on the ward. Kaplan‐Meier plots and tabulated response times demonstrated the incremental relationships between each nonactionable alarm exposure category in the observed data, with the effects most prominent as the Kaplan‐Meier plots diverged beyond the median (Figure 3 and Table 2). Excluding the extreme outlier patient had no effect on the results, because 1378 of the 1430 alarms occurred with the nurse present at the bedside, and only 2 of the remaining alarms were potentially critical.
| Observed Data | Accelerated Failure‐Time Model | |||||||
|---|---|---|---|---|---|---|---|---|
| Number of Potentially Critical Alarms | Minutes Elapsed Until This Percentage of Alarms Was Responded to | Modeled Response Time, min | 95% CI, min | P Value* | ||||
| 50% (Median) | 75% | 90% | 95% | |||||
| ||||||||
| PICU | ||||||||
| 029 nonactionable alarms | 70 | 1.6 | 8.0 | 18.6 | 25.1 | 2.8 | 1.9‐3.8 | Reference |
| 3079 nonactionable alarms | 122 | 6.3 | 17.8 | 22.5 | 26.0 | 5.3 | 4.06.7 | 0.001 (vs 029) |
| 80+ nonactionable alarms | 27 | 16.0 | 28.4 | 32.0 | 33.1 | 8.5 | 4.312.7 | 0.009 (vs 029), 0.15 (vs 3079) |
| Ward | ||||||||
| 029 nonactionable alarms | 159 | 9.8 | 17.8 | 25.0 | 28.9 | 7.7 | 6.39.1 | Reference |
| 3079 nonactionable alarms | 211 | 11.6 | 22.4 | 44.6 | 63.2 | 11.5 | 9.613.3 | 0.001 (vs 029) |
| 80+ nonactionable alarms | 58 | 8.3 | 57.6 | 63.8 | 69.5 | 15.6 | 11.020.1 | 0.001 (vs 029), 0.09 (vs 3079) |
Accelerated failure‐time regressions revealed significant incremental increases in the modeled response time as the number of preceding nonactionable alarms increased in both the PICU and ward settings (Table 2).
Hawthorne‐like Effects
Four of the 36 nurses reported that they responded more quickly to monitor alarms because they knew they were being filmed.
DISCUSSION
Alarm fatigue has recently generated interest among nurses,[22] physicians,[23] regulatory bodies,[24] patient safety organizations,[25] and even attorneys,[26] despite a lack of prior evidence linking nonactionable alarm exposure to response time or other adverse patient‐relevant outcomes. This study's main findings were that (1) the vast majority of alarms were nonactionable, (2) response time to alarms occurring while the nurse was out of the room increased as the number of nonactionable alarms over the preceding 120 minutes increased. These findings may be explained by alarm fatigue.
Our results build upon the findings of other related studies. The nonactionable alarm proportions we found were similar to other pediatric studies, reporting greater than 90% nonactionable alarms.[1, 2] One other study has reported a relationship between alarm exposure and response time. In that study, Voepel‐Lewis and colleagues evaluated nurse responses to pulse oximetry desaturation alarms in adult orthopedic surgery patients using time‐stamp data from their monitor notification system.[27] They found that alarm response time was significantly longer for patients in the highest quartile of alarms compared to those in lower quartiles. Our study provides new data suggesting a relationship between nonactionable alarm exposure and nurse response time.
Our study has several limitations. First, as a preliminary study to investigate feasibility and possible association, the sample of patients and nurses was necessarily limited and did not permit adjustment for nurse‐ or patient‐level covariates. A multivariable analysis with a larger sample might provide insight into alternate explanations for these findings other than alarm fatigue, including measures of nurse workload and patient factors (such as age and illness severity). Additional factors that are not as easily measured can also contribute to the complex decision of when and how to respond to alarms.[28, 29] Second, nurses were aware that they were being video recorded as part of a study of nonactionable alarms, although they did not know the specific details of measurement. Although this lack of blinding might lead to a Hawthorne‐like effect, our positive results suggest that this effect, if present, did not fully obscure the association. Third, all sessions took place on weekdays during daytime hours, but effects of nonactionable alarms might vary by time and day. Finally, we suspect that when nurses experience critical alarms that require them to intervene and rescue a patient, their response times to that patient's alarms that occur later in their shift will be quicker due to a heightened concern for the alarm being actionable. We were unable to explore that relationship in this analysis because the number of critical alarms requiring intervention was very small. This is a topic of future study.
CONCLUSIONS
We identified an association between a nurse's prior exposure to nonactionable alarms and response time to future alarms. This finding is consistent with alarm fatigue, but requires further study to more clearly delineate other factors that might confound or modify that relationship.
Disclosures
This project was funded by the Health Research Formula Fund Grant 4100050891 from the Pennsylvania Department of Public Health Commonwealth Universal Research Enhancement Program (awarded to Drs. Keren and Bonafide). Dr. Bonafide is also supported by the National Heart, Lung, and Blood Institute of the National Institutes of Health under award number K23HL116427. The content is solely the responsibility of the authors and does not necessarily represent the official views of the National Institutes of Health. The authors have no financial relationships or conflicts of interest relevant to this article to disclose.
- . Crying wolf: false alarms in a pediatric intensive care unit. Crit Care Med. 1994;22(6):981–985.
- , . Poor prognosis for existing monitors in the intensive care unit. Crit Care Med. 1997;25(4):614–619.
- , , , , . Clinical evaluation of alarm efficiency in intensive care [in French]. Ann Fr Anesth Reanim. 2000;19:459–466.
- , , , . Reducing false alarms of intensive care online‐monitoring systems: an evaluation of two signal extraction algorithms. Comput Math Methods Med. 2011;2011:143480.
- , , , , , . Multicentric study of monitoring alarms in the adult intensive care unit (ICU): a descriptive analysis. Intensive Care Med. 1999;25:1360–1366.
- , , . Improving alarm performance in the medical intensive care unit using delays and clinical context. Anesth Analg. 2009;108:1546–1552.
- , . Monitor alarm fatigue: standardizing use of physiological monitors and decreasing nuisance alarms. Am J Crit Care. 2010;19:28–34.
- , , , , , . Intensive care unit alarms—how many do we need? Crit Care Med. 2010;38:451–456.
- , , , . System operator response to warnings of danger: a laboratory investigation of the effects of the predictive value of a warning on human response time. J Exp Psychol Appl. 1995;1:19–33.
- , , . Human probability matching behaviour in response to alarms of varying reliability. Ergonomics. 1995;38:2300–2312.
- The Joint Commission. Sentinel event alert: medical device alarm safety in hospitals. 2013. Available at: http://www.jointcommission.org/sea_issue_50/. Accessed October 9, 2014.
- . Joint commission warns of alarm fatigue: multitude of alarms from monitoring devices problematic. JAMA. 2013;309(22):2315–2316.
- . Monitor alarm fatigue: an integrative review. Biomed Instrum Technol. 2012;46(4):268–277.
- NIH Certificates of Confidentiality Kiosk. Available at: http://grants.nih.gov/grants/policy/coc/. Accessed April 21, 2014.
- , , , et al. Video methods for evaluating physiologic monitor alarms and alarm responses. Biomed Instrum Technol. 2014;48(3):220–230.
- , , , , , . Research electronic data capture (REDCap)—a metadata‐driven methodology and workflow process for providing translational research informatics support. J Biomed Inf. 2009;42:377–381.
- . Accelerated failure time and other parametric models. In: Modelling Survival Data in Medical Research. 2nd ed. Boca Raton, FL: Chapman 2003:197–229.
- , , , . Parametric models. In: An Introduction to Survival Analysis Using Stata, 3rd ed. College Station, TX: Stata Press; 2010:229–244.
- , . Management and the Worker. Cambridge, MA: Harvard University Press; 1939.
- . What happened at Hawthorne? Science. 1974;183(4128):922–932.
- , , , , . Validation of the Work Observation Method By Activity Timing (WOMBAT) method of conducting time‐motion observations in critical care settings: an observational study. BMC Med Inf Decis Mak. 2011;11:32.
- , . Alarm fatigue: a patient safety concern. AACN Adv Crit Care. 2013;24(4):378–386.
- , . Redesigning hospital alarms for patient safety: alarmed and potentially dangerous. JAMA. 2014;311(12):1199–1200.
- The Joint Commission. The Joint Commission announces 2014 National Patient Safety Goal. Jt Comm Perspect. 2013;33:1–4.
- Top 10 health technology hazards for 2014. Health Devices. 2013;42(11):354–380.
- My Philly Lawyer. Medical malpractice: alarm fatigue threatens patient safety. 2014. Available at: http://www.myphillylawyer.com/Resources/Legal-Articles/Medical-Malpractice-Alarm-Fatigue-Threatens-Patient-Safety.shtml. Accessed April 4, 2014.
- , , , et al. Pulse oximetry desaturation alarms on a general postoperative adult unit: a prospective observational study of nurse response time. Int J Nurs Stud. 2013;50(10):1351–1358.
- , , , , . A description of nurses' decision‐making in managing electrocardiographic monitor alarms [published online ahead of print May 10, 2014]. J Clin Nurs. doi:10.1111/jocn.12625.
- . Nurses' response to frequency and types of electrocardiography alarms in a non‐critical care setting: a descriptive study. Int J Nurs Stud. 2014;51(2):190–197.
© 2015 Society of Hospital Medicine

Pediatric Inpatient Guidelines Quality
Researchers from the Pediatric Research in Inpatient Settings (PRIS) network, an open pediatric hospitalist research network,[1] have identified inpatient pediatric medical and surgical conditions considered high priority for quality improvement (QI) initiatives and/or comparative effectiveness research based on prevalence, cost, and interhospital variation in resource utilization.[2] One approach for improving the quality of care within hospitals is to operationalize evidence‐based guidelines into practice.[3] Although guidelines may be used by individual clinicians, systematic adoption by hospitals into clinical workflow has the potential to influence providers to adhere to evidence‐based care, reduce unwarranted variation, and ultimately improve patient outcomes.[3, 4, 5, 6]
There are critical appraisal tools to measure the methodological quality, as defined by the Institute of Medicine (IOM) and others in their guidelines.[7, 8, 9, 10, 11, 12] One such validated tool is the AGREE II instrument, created by the AGREE (Appraisal of Guidelines for REsearch and Evaluation) collaboration.[13, 14] It defines methodological quality as the confidence that the biases linked to the rigor of development, presentation, and applicability of a clinical practice guideline have been minimized and that each step of the development process is clearly reported.[13]
The objective of our study was to rate the methodological quality of national guidelines for 20 of the PRIS priority pediatric inpatient conditions.[2] Our intent in pursuing this project was 2‐fold: first, to inform pediatric inpatient QI initiatives, and second, to call out priority pediatric inpatient conditions for which high methodological‐quality guidelines are currently lacking.
METHODS
The study methods involved (1) prioritizing pediatric inpatient conditions, (2) identifying national guidelines for the priority conditions, and (3) rating the methodological quality of available guidelines. This study was considered nonhuman‐subject research (A. Johnson, personal e‐mail communication, November 14, 2012), and the original prioritization study was deemed exempt from review by the institutional review board of the Children's Hospital of Philadelphia under 45 CFR 46.102(f).[2]
Prioritizing Pediatric Inpatient Conditions
Methods for developing the prioritization list are published elsewhere in detail and briefly described here.[1] An International Classification of Diseases, 9th Revision, Clinical Modification‐based clinical condition grouper was created for primary discharge diagnosis codes for inpatient, ambulatory surgery, and observation unit encounters accounting for either 80% of all encounters or 80% of all charges for over 3.4 million discharges from 2004 to 2009 for 38 children's hospitals in the Pediatric Health Information Systems (PHIS) database, which includes administrative and billing data.[15] A standardized cost master index was created to assign the same unit cost for each billable item (calculated as the median of median hospital unit costs) to allow for comparisons of resource utilization across hospitals (eg, the cost of a chest x‐ray was set to be the same across all hospitals in 2009 dollars). Total hospital costs were then recalculated for every admission by multiplying the standardized cost master index by the number of units for each item in the hospital bill, and then summing the standardized costs of each line item in every bill. Conditions were ranked based on prevalence and total cost across all hospitals in the study period. The variation in standardized costs across hospitals for each condition was determined.
For the current study, conditions were considered if they had a top 20 prevalence rank, a top 20 cost rank, high variation (intraclass correlation coefficient >0.1) in standardized costs across hospitals, a minimum number of PHIS hospitals with annualized overexpenditures (using the standardized cost master) of at least $50,000 when compared to the mean, or a minimum median of 200 cases per hospital over the 6‐year study period to assure sufficient hospital volume for future interventions. This resulted in 29 conditions; the selected 20 conditions matched the top 20 prevalence rank (see Supporting Information, Table 1, in the online version of this article).[2]
| Condition by PRIS Priority Rank | Guidelines Meeting Inclusion Criteriaa | Guidelines Citation | Mean Overall Reviewer Methodological Quality Rating (Rater 1, Rater 2)b | Recommended for Use in the Pediatric Inpatient Setting, Mean (Rater 1, Rater 2)c | Weighted Kappa(95% Confidence Interval) |
|---|---|---|---|---|---|
| |||||
| Otitis media, unspecified, s | 1 | American Academy of Family Physicians; American Academy of Otolaryngology‐Head and Neck Surgery; American Academy of Pediatrics Subcommittee on Otitis Media With Effusion. Clinical Practice Guidelines: Otitis media with effusion. Pediatrics. 2004 May;113(5):1412‐29. | 6 (6, 6) | 3 (3, 3) | 0.76 (0.490.93) |
| Hypertrophy of tonsils and adenoids, s | 1 | Baugh RF et al. Clinical practice guideline: tonsillectomy in children. Otolaryngol Head Neck Surg. 2011;144(1 suppl):S1S30. | 6.5 (7, 6) | 3 (3, 3) | 0.49 (0.050.81) |
| Asthma, m | 1 | National Heart, Lung, and Blood Institute; National Asthma Education and Prevention Program. Expert panel report 3 (EPR‐3): guidelines for the diagnosis and management of asthma‐full report 2007. Pages 1‐440. Available at: | 7 (7, 7) | 3 (3, 3) | 0.62 (0.210.87) |
| Bronchiolitis, m | 1 | American Academy of Pediatrics Subcommittee on Diagnosis and Management of Bronchiolitis. Diagnosis and management of bronchiolitis. Pediatrics. 2006;118:17741793. | 6.5 (6, 7) | 3 (3, 3) | 0.95 (0.871.00) |
| Pneumonia, m | 1 | Bradley JS et al.The management of community‐acquired pneumonia in infants and children older than 3 months of age: clinical practice guidelines by the Pediatric Infectious Diseases Society and the Infectious Diseases Society of America. Clin Infect Dis. 2011;53(7):e25e76. | 6 (6, 6) | 3 (3, 3) | 0.82 (0.640.96) |
| Dental caries, s | 1 | American Academy on Pediatric Dentistry Clinical Affairs CommitteePulp Therapy Subcommittee; American Academy on Pediatric Dentistry Council on Clinical Affairs. Guideline on pulp therapy for primary and young permanent teeth. Pediatr Dent. 2008;30:170174. | 3 (3, 3) | 1.5 (1, 2) | 0.51 (0.140.83) |
| Chemotherapy, m | 0 | ||||
| Cellulitis, m | 1 | Stevens DL et al. Practice guidelines for the diagnosis and management of skin and softtissue infections. Clin Infect Dis. 2005;41:13731406. | 4.5 (4, 5) | 2.5 (2, 3) | 0.52 (0.150.79) |
| Inguinal hernia, s | 0 | ||||
| Gastroesophageal reflux and esophagitis, m, s | 2 | Vandenplas Y et al. Pediatric gastroesophageal reflux clinical practice guidelines: joint recommendations of NASPGHAN and ESPGHAN. J Pediatr Gastroenterol Nutr. 2009;49(4):498547. | 5 (5, 5) | 3 (3, 3) | 0.69 (0.450.87) |
| Furuta GT et al. Eosinophilic esophagitis in children and adults: a systematic review and consensus recommendations for diagnosis and treatment. Gastroenterology. 2007;133:13421363. | 5 (5, 5) | 2.5 (2, 3) | 0.93 (0.850.98) | ||
| Dehydration, m | 0 | ||||
| Redundant prepuce and phimosis, s | 1 | American Academy of Pediatrics Task Force on Circumcision. Male circumcision. Pediatrics. 2012;130(3):e756e785. | 6 (6, 6) | 3 (3, 3) | 0.66 (0.250.89) |
| Abdominal pain, m | 0 | ||||
| Other convulsions, m | 0 | ||||
| Urinary tract infection, m | 1 | Roberts KB et al. Urinary tract infection: clinical practice guideline for the diagnosis and management of the initial UTI in febrile infants and children 2 to 24 months. Pediatrics. 2011;128:595610. | 5.5 (5, 6) | 2.5 (2, 3) | 0.62 (0.230.84) |
| Acute appendicitis without peritonitis, s | 1 | Solomkin JS et al. Diagnosis and management of complicated intra‐abdominal infection in adults and children: guidelines by the Surgical Infection Society and the Infectious Diseases Society of America. Clin Infect Dis. 2010;50:133164. | 4.5 (5, 4) | 2.5 (3, 2) | 0.37 (0.110.81) |
| Eso‐ exo‐ hetero‐, and hypertropia, s | 0 | ||||
| Fever, m | 0 | ||||
| Seizures with and without intractable epilepsy, m | 3 | Brophy GM et al; Neurocritical Care Society Status Epilepticus Guideline Writing Committee. Guidelines for the evaluation and management of status epilepticus. Neurocrit Care. 2012;17:323. | 5 (5, 5) | 3 (3, 3) | 0.95 (0.870.99) |
| Hirtz D et al. Practice parameter: treatment of the child with a first unprovoked seizure: report of the Quality Standards Subcommittee of the American Academy of Neurology and the Practice Committee of the Child Neurology Society. Neurology. 2003;60:166175. | 5 (5, 5) | 2.5 (2, 3) | 0.73 (0.410.94) | ||
| Riviello JJ Jr et al. Practice parameter: diagnostic assessment of the child with status epilepticus (an evidence‐based review): report of the Quality Standards Subcommittee of the American Academy of Neurology and the Practice Committee of the Child Neurology Society. Neurology. 2006;67:15421550. | 5 (4, 6) | 2.5 (2, 3) | 0.80 (0.630.94) | ||
| Sickle cell disease with crisis, m | 2 | Section on Hematology/Oncology Committee on Genetics; American Academy of Pediatrics. Health supervision for children with sickle cell disease. Pediatrics. 2002;109:526535. | 3.5 (3, 4) | 1.5 (1, 2) | 0.92 (0.800.98) |
| National Heart, Lung, and Blood Institute, National Institutes of Health. The management of sickle cell disease. National Heart, Lung, and Blood Institute, National Institutes of Health, Bethesda, MD. Available at: | 4 (4, 4) | 2.5 (2, 3) | 0.91 (0.800.97) | ||
Identifying National Guidelines
We developed a search protocol (see Supporting Information, Table 2, in the online version of this article) using condition‐specific keywords and the following criteria: guideline, pediatric, 2002 to 2012. A medical librarian (E.E.) used the protocol to search PubMed, National Guidelines Clearing House, and the American Academy of Pediatrics website for guidelines for the 20 selected conditions.
We limited our study to US national guidelines published or updated from 2002 to 2012 to be most relevant to the 38 US children's hospitals in the original study. Guidelines had to address either medical or surgical or both types of inpatient management for the condition, depending on how the condition was categorized on the PRIS prioritization list. For example, to target inpatient issues, otitis media was treated as a surgical condition when the prioritization list was created, therefore guidelines included in our study needed to address surgical management (ie, myringotomy or tympanostomy tubes).[2] Guidelines specific to 1 organism, test, or treatment were a priori excluded, as they would not map well to the prioritization list, and would be difficult to interpret. Guidelines focusing exclusively on condition prevention were also excluded. Guidelines with a broad subject matter (eg, abdominal infection) or unclear age were included if they contained a significant focus on the condition of interest (eg, appendicitis without peritonitis), such that the course of pediatric inpatient care was described for that condition. Retracted or outdated (superseded by a more current version) guidelines were excluded.
An investigator (G.H.) reviewed potentially relevant results from the librarian's search. For example, the search for tonsillectomy guidelines retrieved a guideline on the use of polysomnography prior to tonsillectomy in children but did not cover the inpatient management or tonsillectomy procedure.[16] This guideline was excluded from our study, as it focused on a specific test and did not discuss surgical management of the condition.
Rating Methodological Quality of Guidelines
Methodological quality of guidelines was rated with the AGREE II tool by 2 investigators (G.H. and K.N.).[13, 17] This tool has 2 overall guideline assessments and 23 subcomponents within 6 domains, reflecting many of the IOM's recommendations for methodological quality in guidelines: scope and purpose, stakeholder involvement, rigor of development, clarity of presentation, applicability, and editorial independence.[8, 17]
The AGREE II tool rates each of the 23 subcomponent questions using a 7‐point scale (1=strongly disagree7=strongly agree). We followed the AGREE II user's manual suggestion in rating subcomponents as 1, indicating an absence of information for that question if the question was not addressed within the guideline.[13] The AGREE II user's manual describes the option of creating standardized domain scores; however, as the objective of our study was to assess the overall methodological quality of the guideline and not to highlight particular areas of strengths/weaknesses in the domains, we elected to present raw scores only.[13]
For the overall guideline rating item 1 (Rate the overall quality of this guideline.) the AGREE II tool instructs that a score of 1 indicates lowest possible quality and 7 indicates highest possible quality.[13] As these score anchors are far apart with no guide for interpretation of intermediate results, we modified the descriptive terms on the tool to define scores <3 as low quality, scores 3 to 5 as moderate quality, and scores >5 as high quality to allow for easier interpretation of our results. We also modified the final overall recommendation score (on a 3‐point scale) from I would recommend this guideline for use to I would recommend this guideline for use in the pediatric inpatient setting.[13, 17] A score of 1 indicated to not recommend, 2 indicated to recommend with modifications, and 3 indicated to recommend without modification.
Significant discrepancies (>2‐point difference on overall rating) between the 2 raters were to be settled by consensus scoring by 3 senior investigators blinded to previous reviews, using a modified Delphi technique.[18]
Inter‐rater reliability was measured using a weighted kappa coefficient and reported using a bootstrapped method with 95% confidence intervals. Interpretation of kappa is such that 0 is the amount of agreement that would be expected by chance, and 1 is perfect agreement, with previous researchers stating scores >0.81 indicate almost perfect agreement.[19]
RESULTS
The librarian's search retrieved 2869 potential results (Figure 1). Seventeen guidelines met inclusion criteria for 13 of the 20 priority conditions. Seven conditions did not have national guidelines meeting inclusion criteria. Table 1 displays the 20 medical and surgical conditions on the modified PRIS prioritization list, including overall guideline scoring, recommendation scores, and kappa results for each guideline. The highest methodological‐quality guidelines were for asthma,[20] tonsillectomy,[21] and bronchiolitis[22] (mean overall rating 7, 6.5, and 6.5, respectively). The lowest methodological‐quality guidelines were for 2 sickle cell disease guidelines[23, 24] and 1 dental caries guideline[25] (mean overall rating 4, 3.5, and 3, respectively). Seven guidelines were rated as high overall quality, and 10 guidelines were rated as moderate overall quality. Eight of the 17 guidelines[20, 21, 22, 26, 27, 28, 29, 30] were recommended for use in the pediatric inpatient setting without modification by both reviewers. Two guidelines (for dental caries[25] and sickle cell[23]) were not recommended for use by 1 reviewer.

As an example of scoring, a national guideline for asthma had high overall scores (7 from each reviewer) and high scores across most AGREE II subcomponents. The guideline was found by both reviewers to be systematic in describing guideline development with clearly stated recommendations linked to the available evidence (including strengths and limitations) and implementation considerations.[20] Conversely, a national guideline for sickle cell disease had moderate overall scores (scores of 3 and 4) and low‐moderate scores across the majority of the subcomponent items.[23] The reviewers believe that this guideline would have been strengthened by increased transparency in guideline development, discussion of the evidence surrounding recommendations, and discussion of implementation factors. A table with detailed scoring of each guideline is available (see Supporting Information, Table 3, in the online version of this article).
Agreement between the 2 raters was almost perfect,[19] with an overall boot‐strapped weighted kappa of 0.83 (95% confidence interval 0.780.87) across 850 scores. There were no discrepancies between reviewers in overall scoring requiring consensus scoring.
DISCUSSION
Using a modified version of a published prioritization list for inpatient pediatric conditions, we found national guidelines for 13 of 20 conditions with high prevalence, cost, and interhospital variation in resource utilization. Seven conditions had no national guidelines published within the past 10 years applicable for use in the pediatric inpatient setting. Of 17 guidelines for 13 conditions, 10 had moderate and 7 had high methodological quality.
Our findings add to the literature describing methodological quality of guidelines. Many publications focus on the methodological quality of guidelines as a group and use a standardized instrument (eg, the AGREE II tool) to rate within domains (eg, domain 1: scope and purpose) across guidelines in an effort to encourage improvement in developing and reporting in guidelines.[31, 32] Our study differs in that we chose to focus on the overall quality rating of individual guidelines for specific prioritized conditions to allow hospitals to guide QI initiatives. One study that had a similar aim to ours surveyed Dutch pediatricians to select priority conditions and used the AGREE II tool to rate 17 guidelines, recommending 14 for use in the Netherlands.[33]
Identifying high methodological‐quality guidelines is only 1 in a series of steps prior to successful guideline implementation in hospitals. Other aspects of guidelines, including the strength of the evidence (eg, from randomized controlled trials) and subsequent force and clarity (eg, use of must instead of consider) of recommendations, may affect clinician or patient adherence, work processes, and ultimately patient outcomes. Strong evidence should translate into forceful and clear recommendations. Authors with the Yale Guideline Recommendation Corpus describe significant variation in reporting of guideline recommendations, and further studies have shown that the force and clarity of a recommendation is associated with adherence rates.[34, 35, 36, 37] Unfortunately, current guideline appraisal tools lack the means to score the strength of evidence, and force and clarity of recommendations.[10]
Implementation science demonstrates that there are many important factors in translating best practice into improvements in clinical care. In addition to implementation considerations such as adherence, patient preferences, and work processes, variability in methodological quality, strength of evidence, and force and clarity of recommendations may be additional reasons why evidence for the impact of guidelines on patient outcomes remains mixed in the literature.[38] One recent study found that adherence to antibiotics recommended within a national pediatric community‐acquired pneumonia guideline, which had a high methodological‐quality score in our study, did not change hospital length of stay or readmissions.[29, 39] There are several possible interpretations for this. Recommendations may not have been based upon strong evidence, research methodology assessing how adherence to recommendations impacts patient outcomes may have been limited, or the outcomes measured in current studies (such as readmission) are not the outcomes that may be improved by adherence to these recommendations (such as decreasing antimicrobial resistance). These are important considerations when hospitals are incorporating recommendations from guidelines into practice. Hospitals should assess the multiple aspects of guidelines, including methodological quality, which our study helps to identify, strength of evidence, and force and clarity of recommendations, as well as adherence, patient preferences, work processes, and key outcome measures when implementing guidelines into clinical practice. A study utilizing a robust QI methodology demonstrated that clinician adherence to several elements in an asthma guideline, which also had a high methodological‐quality score in our study, led to a significant decrease in 6‐month hospital and emergency department readmission for asthma.[6, 20]
Our study also highlights that several pediatric conditions with high prevalence, cost, and interhospital resource utilization variation lack recent national pediatric guidelines applicable to the inpatient setting. If strong evidence exists for these priority conditions, professional societies should create high methodological‐quality guidelines with strong and clear recommendations. If evidence is lacking for these priority conditions, then investigators should focus on generating research in these areas.
There are several limitations to this study. The AGREE II tool does not have a mechanism to measure the strength of evidence used in a guideline. Methodological quality of a guideline alone may not translate into improved outcomes. Conditions may have national guidelines published before 2002, institution‐specific or international guidelines, or adult guidelines that might be amenable to use in the pediatric inpatient setting but were not included in this study. Several conditions on the prioritization list are broad in nature (eg, dehydration) and may not be amenable to the creation of guidelines. Other conditions on the prioritization list (eg, chemotherapy or cellulitis) may have useful guidelines within the context of specific conditions (eg, acute lymphoblastic leukemia) or for specific organisms (eg, methicillin‐resistant Staphylococcus aureus). We elected to exclude these narrower guidelines to focus on broad and comprehensive guidelines applicable to a wider range of clinical situations. Additionally, although use of a validated tool attempts to objectively guide ratings, the rating of quality is to some degree subjective. Finally, our study used a previously published prioritization list using data from children's hospitals, and the list likely under‐represents conditions commonly managed in community hospitals (eg, hyperbilirubinemia).[2] Exclusion of these conditions was not reflective of importance or quality of available national guidelines.
CONCLUSIONS
Our study adds to recent publications on the need to prioritize conditions for QI in children's hospitals. We identified a group of moderate to high methodological‐quality national guidelines for pediatric inpatient conditions with high prevalence, cost, and variation in interhospital resource utilization. Not all prioritized conditions have national high methodological‐quality guidelines available. Hospitals should prioritize conditions with high methodological‐quality guidelines to allocate resources for QI initiatives. Professional societies should focus their efforts on producing methodologically sound guidelines for prioritized conditions currently lacking high‐quality guidelines if sufficient evidence exists.
Acknowledgements
The authors thank Christopher G. Maloney, MD, PhD, for critical review of the manuscript, and Gregory J. Stoddard, MS, for statistical support. Mr. Stoddard's work is supported by the University of Utah Study Design and Biostatistics Center, with funding in part from the National Center for Research Resources and the National Center for Advancing Translational Sciences, National Institutes of Health, through grant 8UL1TR000105 (formerly UL1RR025764).
Disclosures
Sanjay Mahant, Ron Keren, and Raj Srivastava are all Executive Council members of the Pediatric Research in Inpatient Settings (PRIS) Network. PRIS, Sanjay Mahant, Ron Keren, and Raj Srivastava are all supported by grants from the Children's Hospital Association. Sanjay Mahant is also supported by research grants from the Canadian Institute of Health Research and Physician Services Incorporated. Ron Keren and Raj Srivastava also serve as medical legal consultants. The remaining authors have no financial relationships relevant to this article to disclose.
- , . Development of the Pediatric Research in Inpatient Settings (PRIS) Network: lessons learned. J Hosp Med. 2012;7(8):661–664.
- , , , et al. Prioritization of comparative effectiveness research topics in hospital pediatrics. Arch Pediatr Adolesc Med. 2012;166(12):1–10.
- , . How Intermountain trimmed health care costs through robust quality improvement efforts. Health Aff (Millwood). 2011;30(6):1185–1191.
- . Making it easy to do it right. N Engl J Med. 2001;345(13):991–993.
- , , , , . Clinical guidelines: potential benefits, limitations, and harms of clinical guidelines. BMJ. 1999;318(7182):527–530.
- , , , et al. The Joint Commission Children's Asthma Care quality measures and asthma readmissions. Pediatrics. 2012;130(3):482–491.
- , , , et al. Toward transparent clinical policies. Pediatrics. 2008;121(3):643–646.
- Field MJ, Lohr KN, eds.; Committee to Advise the Public Health Service on Clinical Practice Guidelines, Institute of Medicine. Clinical Practice Guidelines: Directions for a New Program. Washington, DC: National Academies Press; 1990.
- , , , , . Development and application of a generic methodology to assess the quality of clinical guidelines. Int J Qual Health Care. 1999;11(1):21–28.
- , , , , . A systematic review of appraisal tools for clinical practice guidelines: multiple similarities and one common deficit. Int J Qual Health Care. 2005;17(3):235–242.
- , , . How to decide whether a clinical practice guideline is trustworthy. JAMA. 2013;309(2):139–140.
- Field MJ, Lohr KN, eds.; Committee to Advise the Public Health Service on Clinical Practice Guidelines, Institute of Medicine. Guidelines for Clinical Practice: From Development to Use. Washington, DC: National Academies Press; 1992.
- The AGREE Collaboration. Development and validation of an international appraisal instrument for assessing the quality of clinical practice guidelines: the AGREE project. Qual Saf Health Care. 2003;12:18–23.
- . AGREE II‐improving the quality of clinical care. Lancet. 2010;376(9747):1128–1129.
- , , , . Corticosteroids and mortality in children with bacterial meningitis. JAMA. 2008;299(17):2048–2055.
- , , , et al. Clinical practice guideline: polysomnography for sleep‐disordered breathing prior to tonsillectomy in children. Otolaryngol Head Neck Surg. 2011;145(1 suppl):S1–S15.
- , , , et al. AGREE II: advancing guideline development, reporting and evaluation in health care. CMAJ. 2010;182(18):E839–E842.
- , . The Delphi method as a research tool: an example, design considerations and applications. Inform Manag. 2004;42(1):15–29.
- , . The measurement of observer agreement for categorical data. Biometrics. 1977;33:159–174.
- National Heart, Lung, and Blood Institute; National Asthma Education and Prevention Program. Expert panel report 3 (EPR‐3): guidelines for the diagnosis and management of asthma‐full report 2007. Pages 1–440. Available at: http://www.nhlbi.nih.gov/guidelines/asthma/asthgdln.pdf. Accessed on 24 August 2012.
- , , , et al. Clinical practice guideline: tonsillectomy in children. Otolaryngol Head Neck Surg. 2011;144(1 suppl):S1–S30.
- American Academy of Pediatrics Subcommittee on Diagnosis and Management of Bronchiolitis. Diagnosis and management of bronchiolitis. Pediatrics. 2006;118:1774–1793.
- Health supervision for children with sickle cell disease. Pediatrics. 2002;109(3):526–535.
- National Heart, Lung, and Blood Institute, National Institutes of Health. The management of sickle cell disease. National Heart, Lung, and Blood Institute, National Institutes of Health, Bethesda, MD. Available at: http://www.nhlbi.nih.gov/health/prof/blood/sickle/sc_mngt.pdf. Revised June 2002. Accessed on 13 October 2012.
- American Academy on Pediatric Dentistry Clinical Affairs Committee–Pulp Therapy Subcommittee; American Academy on Pediatric Dentistry Council on Clinical Affairs. Guideline on pulp therapy for primary and young permanent teeth. Pediatr Dent. 2008;30:170–174.
- , , , et al.; Neurocritical Care Society Status Epilepticus Guideline Writing Committee. Guidelines for the evaluation and management of status epilepticus. Neurocrit Care. 2012;17:3–23.
- American Academy of Pediatrics Task Force on Circumcision. Male circumcision. Pediatrics. 2012;130(3):e756–e785.
- , , , et al. Pediatric gastroesophageal reflux clinical practice guidelines: joint recommendations of the North American Society for Pediatric Gastroenterology, Hepatology, and Nutrition (NASPGHAN) and the European Society for Pediatric Gastroenterology, Hepatology, and Nutrition (ESPGHAN). J Pediatr Gastroenterol Nutr. 2009;49(4):498–547.
- , , , et al. The management of community‐acquired pneumonia in infants and children older than 3 months of age: clinical practice guidelines by the Pediatric Infectious Diseases Society and the Infectious Diseases Society of America. Clin Infect Dis. 2011;53(7):e25–e76.
- American Academy of Family Physicians; American Academy of Otolaryngology‐Head and Neck Surgery; American Academy of Pediatrics Subcommittee on Otitis Media With Effusion. Clinical Practice Guidelines: Otitis media with effusion. Pediatrics. 2004 May;113(5):1412–29.
- , , . Are guidelines following guidelines? The methodological quality of clinical practice guidelines in the peer‐reviewed medical literature. JAMA. 1999;281(20):1900–1905.
- , , , . Quality of reporting and evidence in American Academy of Pediatrics guidelines. Pediatrics. 2013;131(4):732–738.
- , , . Quality of evidence‐based pediatric guidelines. Pediatrics. 2005;115(5):1378–1391.
- , , . The Yale Guideline Recommendation Corpus: a representative sample of the knowledge content of guidelines. Int J Med Inform. 2009;78(5):354–363.
- , , . How often is strength of recommendation indicated in guidelines? Analysis of the Yale Guideline Recommendation Corpus. AMIA Annu Symp Proc. 2008:984.
- , , . Clinical practice guideline development manual, third edition: a quality‐driven approach for translating evidence into action. Otolaryngol Head Neck Surg. 2013;148(1 suppl):S1–S55.
- , , , , , . Attributes of clinical guidelines that influence use of guidelines in general practice: observational study. BMJ. 1998;317(7162):858–861.
- , , , et al. Toward evidence‐based quality improvement. Evidence (and its limitations) of the effectiveness of guideline dissemination and implementation strategies 1966–1998. J Gen Intern Med. 2006;21(suppl 2):S14–S20.
- , , , . Effectiveness of antimicrobial guidelines for community‐acquired pneumonia in children. Pediatrics. 2012;129(5):e1326–e1333.
Researchers from the Pediatric Research in Inpatient Settings (PRIS) network, an open pediatric hospitalist research network,[1] have identified inpatient pediatric medical and surgical conditions considered high priority for quality improvement (QI) initiatives and/or comparative effectiveness research based on prevalence, cost, and interhospital variation in resource utilization.[2] One approach for improving the quality of care within hospitals is to operationalize evidence‐based guidelines into practice.[3] Although guidelines may be used by individual clinicians, systematic adoption by hospitals into clinical workflow has the potential to influence providers to adhere to evidence‐based care, reduce unwarranted variation, and ultimately improve patient outcomes.[3, 4, 5, 6]
There are critical appraisal tools to measure the methodological quality, as defined by the Institute of Medicine (IOM) and others in their guidelines.[7, 8, 9, 10, 11, 12] One such validated tool is the AGREE II instrument, created by the AGREE (Appraisal of Guidelines for REsearch and Evaluation) collaboration.[13, 14] It defines methodological quality as the confidence that the biases linked to the rigor of development, presentation, and applicability of a clinical practice guideline have been minimized and that each step of the development process is clearly reported.[13]
The objective of our study was to rate the methodological quality of national guidelines for 20 of the PRIS priority pediatric inpatient conditions.[2] Our intent in pursuing this project was 2‐fold: first, to inform pediatric inpatient QI initiatives, and second, to call out priority pediatric inpatient conditions for which high methodological‐quality guidelines are currently lacking.
METHODS
The study methods involved (1) prioritizing pediatric inpatient conditions, (2) identifying national guidelines for the priority conditions, and (3) rating the methodological quality of available guidelines. This study was considered nonhuman‐subject research (A. Johnson, personal e‐mail communication, November 14, 2012), and the original prioritization study was deemed exempt from review by the institutional review board of the Children's Hospital of Philadelphia under 45 CFR 46.102(f).[2]
Prioritizing Pediatric Inpatient Conditions
Methods for developing the prioritization list are published elsewhere in detail and briefly described here.[1] An International Classification of Diseases, 9th Revision, Clinical Modification‐based clinical condition grouper was created for primary discharge diagnosis codes for inpatient, ambulatory surgery, and observation unit encounters accounting for either 80% of all encounters or 80% of all charges for over 3.4 million discharges from 2004 to 2009 for 38 children's hospitals in the Pediatric Health Information Systems (PHIS) database, which includes administrative and billing data.[15] A standardized cost master index was created to assign the same unit cost for each billable item (calculated as the median of median hospital unit costs) to allow for comparisons of resource utilization across hospitals (eg, the cost of a chest x‐ray was set to be the same across all hospitals in 2009 dollars). Total hospital costs were then recalculated for every admission by multiplying the standardized cost master index by the number of units for each item in the hospital bill, and then summing the standardized costs of each line item in every bill. Conditions were ranked based on prevalence and total cost across all hospitals in the study period. The variation in standardized costs across hospitals for each condition was determined.
For the current study, conditions were considered if they had a top 20 prevalence rank, a top 20 cost rank, high variation (intraclass correlation coefficient >0.1) in standardized costs across hospitals, a minimum number of PHIS hospitals with annualized overexpenditures (using the standardized cost master) of at least $50,000 when compared to the mean, or a minimum median of 200 cases per hospital over the 6‐year study period to assure sufficient hospital volume for future interventions. This resulted in 29 conditions; the selected 20 conditions matched the top 20 prevalence rank (see Supporting Information, Table 1, in the online version of this article).[2]
| Condition by PRIS Priority Rank | Guidelines Meeting Inclusion Criteriaa | Guidelines Citation | Mean Overall Reviewer Methodological Quality Rating (Rater 1, Rater 2)b | Recommended for Use in the Pediatric Inpatient Setting, Mean (Rater 1, Rater 2)c | Weighted Kappa(95% Confidence Interval) |
|---|---|---|---|---|---|
| |||||
| Otitis media, unspecified, s | 1 | American Academy of Family Physicians; American Academy of Otolaryngology‐Head and Neck Surgery; American Academy of Pediatrics Subcommittee on Otitis Media With Effusion. Clinical Practice Guidelines: Otitis media with effusion. Pediatrics. 2004 May;113(5):1412‐29. | 6 (6, 6) | 3 (3, 3) | 0.76 (0.490.93) |
| Hypertrophy of tonsils and adenoids, s | 1 | Baugh RF et al. Clinical practice guideline: tonsillectomy in children. Otolaryngol Head Neck Surg. 2011;144(1 suppl):S1S30. | 6.5 (7, 6) | 3 (3, 3) | 0.49 (0.050.81) |
| Asthma, m | 1 | National Heart, Lung, and Blood Institute; National Asthma Education and Prevention Program. Expert panel report 3 (EPR‐3): guidelines for the diagnosis and management of asthma‐full report 2007. Pages 1‐440. Available at: | 7 (7, 7) | 3 (3, 3) | 0.62 (0.210.87) |
| Bronchiolitis, m | 1 | American Academy of Pediatrics Subcommittee on Diagnosis and Management of Bronchiolitis. Diagnosis and management of bronchiolitis. Pediatrics. 2006;118:17741793. | 6.5 (6, 7) | 3 (3, 3) | 0.95 (0.871.00) |
| Pneumonia, m | 1 | Bradley JS et al.The management of community‐acquired pneumonia in infants and children older than 3 months of age: clinical practice guidelines by the Pediatric Infectious Diseases Society and the Infectious Diseases Society of America. Clin Infect Dis. 2011;53(7):e25e76. | 6 (6, 6) | 3 (3, 3) | 0.82 (0.640.96) |
| Dental caries, s | 1 | American Academy on Pediatric Dentistry Clinical Affairs CommitteePulp Therapy Subcommittee; American Academy on Pediatric Dentistry Council on Clinical Affairs. Guideline on pulp therapy for primary and young permanent teeth. Pediatr Dent. 2008;30:170174. | 3 (3, 3) | 1.5 (1, 2) | 0.51 (0.140.83) |
| Chemotherapy, m | 0 | ||||
| Cellulitis, m | 1 | Stevens DL et al. Practice guidelines for the diagnosis and management of skin and softtissue infections. Clin Infect Dis. 2005;41:13731406. | 4.5 (4, 5) | 2.5 (2, 3) | 0.52 (0.150.79) |
| Inguinal hernia, s | 0 | ||||
| Gastroesophageal reflux and esophagitis, m, s | 2 | Vandenplas Y et al. Pediatric gastroesophageal reflux clinical practice guidelines: joint recommendations of NASPGHAN and ESPGHAN. J Pediatr Gastroenterol Nutr. 2009;49(4):498547. | 5 (5, 5) | 3 (3, 3) | 0.69 (0.450.87) |
| Furuta GT et al. Eosinophilic esophagitis in children and adults: a systematic review and consensus recommendations for diagnosis and treatment. Gastroenterology. 2007;133:13421363. | 5 (5, 5) | 2.5 (2, 3) | 0.93 (0.850.98) | ||
| Dehydration, m | 0 | ||||
| Redundant prepuce and phimosis, s | 1 | American Academy of Pediatrics Task Force on Circumcision. Male circumcision. Pediatrics. 2012;130(3):e756e785. | 6 (6, 6) | 3 (3, 3) | 0.66 (0.250.89) |
| Abdominal pain, m | 0 | ||||
| Other convulsions, m | 0 | ||||
| Urinary tract infection, m | 1 | Roberts KB et al. Urinary tract infection: clinical practice guideline for the diagnosis and management of the initial UTI in febrile infants and children 2 to 24 months. Pediatrics. 2011;128:595610. | 5.5 (5, 6) | 2.5 (2, 3) | 0.62 (0.230.84) |
| Acute appendicitis without peritonitis, s | 1 | Solomkin JS et al. Diagnosis and management of complicated intra‐abdominal infection in adults and children: guidelines by the Surgical Infection Society and the Infectious Diseases Society of America. Clin Infect Dis. 2010;50:133164. | 4.5 (5, 4) | 2.5 (3, 2) | 0.37 (0.110.81) |
| Eso‐ exo‐ hetero‐, and hypertropia, s | 0 | ||||
| Fever, m | 0 | ||||
| Seizures with and without intractable epilepsy, m | 3 | Brophy GM et al; Neurocritical Care Society Status Epilepticus Guideline Writing Committee. Guidelines for the evaluation and management of status epilepticus. Neurocrit Care. 2012;17:323. | 5 (5, 5) | 3 (3, 3) | 0.95 (0.870.99) |
| Hirtz D et al. Practice parameter: treatment of the child with a first unprovoked seizure: report of the Quality Standards Subcommittee of the American Academy of Neurology and the Practice Committee of the Child Neurology Society. Neurology. 2003;60:166175. | 5 (5, 5) | 2.5 (2, 3) | 0.73 (0.410.94) | ||
| Riviello JJ Jr et al. Practice parameter: diagnostic assessment of the child with status epilepticus (an evidence‐based review): report of the Quality Standards Subcommittee of the American Academy of Neurology and the Practice Committee of the Child Neurology Society. Neurology. 2006;67:15421550. | 5 (4, 6) | 2.5 (2, 3) | 0.80 (0.630.94) | ||
| Sickle cell disease with crisis, m | 2 | Section on Hematology/Oncology Committee on Genetics; American Academy of Pediatrics. Health supervision for children with sickle cell disease. Pediatrics. 2002;109:526535. | 3.5 (3, 4) | 1.5 (1, 2) | 0.92 (0.800.98) |
| National Heart, Lung, and Blood Institute, National Institutes of Health. The management of sickle cell disease. National Heart, Lung, and Blood Institute, National Institutes of Health, Bethesda, MD. Available at: | 4 (4, 4) | 2.5 (2, 3) | 0.91 (0.800.97) | ||
Identifying National Guidelines
We developed a search protocol (see Supporting Information, Table 2, in the online version of this article) using condition‐specific keywords and the following criteria: guideline, pediatric, 2002 to 2012. A medical librarian (E.E.) used the protocol to search PubMed, National Guidelines Clearing House, and the American Academy of Pediatrics website for guidelines for the 20 selected conditions.
We limited our study to US national guidelines published or updated from 2002 to 2012 to be most relevant to the 38 US children's hospitals in the original study. Guidelines had to address either medical or surgical or both types of inpatient management for the condition, depending on how the condition was categorized on the PRIS prioritization list. For example, to target inpatient issues, otitis media was treated as a surgical condition when the prioritization list was created, therefore guidelines included in our study needed to address surgical management (ie, myringotomy or tympanostomy tubes).[2] Guidelines specific to 1 organism, test, or treatment were a priori excluded, as they would not map well to the prioritization list, and would be difficult to interpret. Guidelines focusing exclusively on condition prevention were also excluded. Guidelines with a broad subject matter (eg, abdominal infection) or unclear age were included if they contained a significant focus on the condition of interest (eg, appendicitis without peritonitis), such that the course of pediatric inpatient care was described for that condition. Retracted or outdated (superseded by a more current version) guidelines were excluded.
An investigator (G.H.) reviewed potentially relevant results from the librarian's search. For example, the search for tonsillectomy guidelines retrieved a guideline on the use of polysomnography prior to tonsillectomy in children but did not cover the inpatient management or tonsillectomy procedure.[16] This guideline was excluded from our study, as it focused on a specific test and did not discuss surgical management of the condition.
Rating Methodological Quality of Guidelines
Methodological quality of guidelines was rated with the AGREE II tool by 2 investigators (G.H. and K.N.).[13, 17] This tool has 2 overall guideline assessments and 23 subcomponents within 6 domains, reflecting many of the IOM's recommendations for methodological quality in guidelines: scope and purpose, stakeholder involvement, rigor of development, clarity of presentation, applicability, and editorial independence.[8, 17]
The AGREE II tool rates each of the 23 subcomponent questions using a 7‐point scale (1=strongly disagree7=strongly agree). We followed the AGREE II user's manual suggestion in rating subcomponents as 1, indicating an absence of information for that question if the question was not addressed within the guideline.[13] The AGREE II user's manual describes the option of creating standardized domain scores; however, as the objective of our study was to assess the overall methodological quality of the guideline and not to highlight particular areas of strengths/weaknesses in the domains, we elected to present raw scores only.[13]
For the overall guideline rating item 1 (Rate the overall quality of this guideline.) the AGREE II tool instructs that a score of 1 indicates lowest possible quality and 7 indicates highest possible quality.[13] As these score anchors are far apart with no guide for interpretation of intermediate results, we modified the descriptive terms on the tool to define scores <3 as low quality, scores 3 to 5 as moderate quality, and scores >5 as high quality to allow for easier interpretation of our results. We also modified the final overall recommendation score (on a 3‐point scale) from I would recommend this guideline for use to I would recommend this guideline for use in the pediatric inpatient setting.[13, 17] A score of 1 indicated to not recommend, 2 indicated to recommend with modifications, and 3 indicated to recommend without modification.
Significant discrepancies (>2‐point difference on overall rating) between the 2 raters were to be settled by consensus scoring by 3 senior investigators blinded to previous reviews, using a modified Delphi technique.[18]
Inter‐rater reliability was measured using a weighted kappa coefficient and reported using a bootstrapped method with 95% confidence intervals. Interpretation of kappa is such that 0 is the amount of agreement that would be expected by chance, and 1 is perfect agreement, with previous researchers stating scores >0.81 indicate almost perfect agreement.[19]
RESULTS
The librarian's search retrieved 2869 potential results (Figure 1). Seventeen guidelines met inclusion criteria for 13 of the 20 priority conditions. Seven conditions did not have national guidelines meeting inclusion criteria. Table 1 displays the 20 medical and surgical conditions on the modified PRIS prioritization list, including overall guideline scoring, recommendation scores, and kappa results for each guideline. The highest methodological‐quality guidelines were for asthma,[20] tonsillectomy,[21] and bronchiolitis[22] (mean overall rating 7, 6.5, and 6.5, respectively). The lowest methodological‐quality guidelines were for 2 sickle cell disease guidelines[23, 24] and 1 dental caries guideline[25] (mean overall rating 4, 3.5, and 3, respectively). Seven guidelines were rated as high overall quality, and 10 guidelines were rated as moderate overall quality. Eight of the 17 guidelines[20, 21, 22, 26, 27, 28, 29, 30] were recommended for use in the pediatric inpatient setting without modification by both reviewers. Two guidelines (for dental caries[25] and sickle cell[23]) were not recommended for use by 1 reviewer.
As an example of scoring, a national guideline for asthma had high overall scores (7 from each reviewer) and high scores across most AGREE II subcomponents. The guideline was found by both reviewers to be systematic in describing guideline development with clearly stated recommendations linked to the available evidence (including strengths and limitations) and implementation considerations.[20] Conversely, a national guideline for sickle cell disease had moderate overall scores (scores of 3 and 4) and low‐moderate scores across the majority of the subcomponent items.[23] The reviewers believe that this guideline would have been strengthened by increased transparency in guideline development, discussion of the evidence surrounding recommendations, and discussion of implementation factors. A table with detailed scoring of each guideline is available (see Supporting Information, Table 3, in the online version of this article).
Agreement between the 2 raters was almost perfect,[19] with an overall boot‐strapped weighted kappa of 0.83 (95% confidence interval 0.780.87) across 850 scores. There were no discrepancies between reviewers in overall scoring requiring consensus scoring.
DISCUSSION
Using a modified version of a published prioritization list for inpatient pediatric conditions, we found national guidelines for 13 of 20 conditions with high prevalence, cost, and interhospital variation in resource utilization. Seven conditions had no national guidelines published within the past 10 years applicable for use in the pediatric inpatient setting. Of 17 guidelines for 13 conditions, 10 had moderate and 7 had high methodological quality.
Our findings add to the literature describing methodological quality of guidelines. Many publications focus on the methodological quality of guidelines as a group and use a standardized instrument (eg, the AGREE II tool) to rate within domains (eg, domain 1: scope and purpose) across guidelines in an effort to encourage improvement in developing and reporting in guidelines.[31, 32] Our study differs in that we chose to focus on the overall quality rating of individual guidelines for specific prioritized conditions to allow hospitals to guide QI initiatives. One study that had a similar aim to ours surveyed Dutch pediatricians to select priority conditions and used the AGREE II tool to rate 17 guidelines, recommending 14 for use in the Netherlands.[33]
Identifying high methodological‐quality guidelines is only 1 in a series of steps prior to successful guideline implementation in hospitals. Other aspects of guidelines, including the strength of the evidence (eg, from randomized controlled trials) and subsequent force and clarity (eg, use of must instead of consider) of recommendations, may affect clinician or patient adherence, work processes, and ultimately patient outcomes. Strong evidence should translate into forceful and clear recommendations. Authors with the Yale Guideline Recommendation Corpus describe significant variation in reporting of guideline recommendations, and further studies have shown that the force and clarity of a recommendation is associated with adherence rates.[34, 35, 36, 37] Unfortunately, current guideline appraisal tools lack the means to score the strength of evidence, and force and clarity of recommendations.[10]
Implementation science demonstrates that there are many important factors in translating best practice into improvements in clinical care. In addition to implementation considerations such as adherence, patient preferences, and work processes, variability in methodological quality, strength of evidence, and force and clarity of recommendations may be additional reasons why evidence for the impact of guidelines on patient outcomes remains mixed in the literature.[38] One recent study found that adherence to antibiotics recommended within a national pediatric community‐acquired pneumonia guideline, which had a high methodological‐quality score in our study, did not change hospital length of stay or readmissions.[29, 39] There are several possible interpretations for this. Recommendations may not have been based upon strong evidence, research methodology assessing how adherence to recommendations impacts patient outcomes may have been limited, or the outcomes measured in current studies (such as readmission) are not the outcomes that may be improved by adherence to these recommendations (such as decreasing antimicrobial resistance). These are important considerations when hospitals are incorporating recommendations from guidelines into practice. Hospitals should assess the multiple aspects of guidelines, including methodological quality, which our study helps to identify, strength of evidence, and force and clarity of recommendations, as well as adherence, patient preferences, work processes, and key outcome measures when implementing guidelines into clinical practice. A study utilizing a robust QI methodology demonstrated that clinician adherence to several elements in an asthma guideline, which also had a high methodological‐quality score in our study, led to a significant decrease in 6‐month hospital and emergency department readmission for asthma.[6, 20]
Our study also highlights that several pediatric conditions with high prevalence, cost, and interhospital resource utilization variation lack recent national pediatric guidelines applicable to the inpatient setting. If strong evidence exists for these priority conditions, professional societies should create high methodological‐quality guidelines with strong and clear recommendations. If evidence is lacking for these priority conditions, then investigators should focus on generating research in these areas.
There are several limitations to this study. The AGREE II tool does not have a mechanism to measure the strength of evidence used in a guideline. Methodological quality of a guideline alone may not translate into improved outcomes. Conditions may have national guidelines published before 2002, institution‐specific or international guidelines, or adult guidelines that might be amenable to use in the pediatric inpatient setting but were not included in this study. Several conditions on the prioritization list are broad in nature (eg, dehydration) and may not be amenable to the creation of guidelines. Other conditions on the prioritization list (eg, chemotherapy or cellulitis) may have useful guidelines within the context of specific conditions (eg, acute lymphoblastic leukemia) or for specific organisms (eg, methicillin‐resistant Staphylococcus aureus). We elected to exclude these narrower guidelines to focus on broad and comprehensive guidelines applicable to a wider range of clinical situations. Additionally, although use of a validated tool attempts to objectively guide ratings, the rating of quality is to some degree subjective. Finally, our study used a previously published prioritization list using data from children's hospitals, and the list likely under‐represents conditions commonly managed in community hospitals (eg, hyperbilirubinemia).[2] Exclusion of these conditions was not reflective of importance or quality of available national guidelines.
CONCLUSIONS
Our study adds to recent publications on the need to prioritize conditions for QI in children's hospitals. We identified a group of moderate to high methodological‐quality national guidelines for pediatric inpatient conditions with high prevalence, cost, and variation in interhospital resource utilization. Not all prioritized conditions have national high methodological‐quality guidelines available. Hospitals should prioritize conditions with high methodological‐quality guidelines to allocate resources for QI initiatives. Professional societies should focus their efforts on producing methodologically sound guidelines for prioritized conditions currently lacking high‐quality guidelines if sufficient evidence exists.
Acknowledgements
The authors thank Christopher G. Maloney, MD, PhD, for critical review of the manuscript, and Gregory J. Stoddard, MS, for statistical support. Mr. Stoddard's work is supported by the University of Utah Study Design and Biostatistics Center, with funding in part from the National Center for Research Resources and the National Center for Advancing Translational Sciences, National Institutes of Health, through grant 8UL1TR000105 (formerly UL1RR025764).
Disclosures
Sanjay Mahant, Ron Keren, and Raj Srivastava are all Executive Council members of the Pediatric Research in Inpatient Settings (PRIS) Network. PRIS, Sanjay Mahant, Ron Keren, and Raj Srivastava are all supported by grants from the Children's Hospital Association. Sanjay Mahant is also supported by research grants from the Canadian Institute of Health Research and Physician Services Incorporated. Ron Keren and Raj Srivastava also serve as medical legal consultants. The remaining authors have no financial relationships relevant to this article to disclose.
- , . Development of the Pediatric Research in Inpatient Settings (PRIS) Network: lessons learned. J Hosp Med. 2012;7(8):661–664.
- , , , et al. Prioritization of comparative effectiveness research topics in hospital pediatrics. Arch Pediatr Adolesc Med. 2012;166(12):1–10.
- , . How Intermountain trimmed health care costs through robust quality improvement efforts. Health Aff (Millwood). 2011;30(6):1185–1191.
- . Making it easy to do it right. N Engl J Med. 2001;345(13):991–993.
- , , , , . Clinical guidelines: potential benefits, limitations, and harms of clinical guidelines. BMJ. 1999;318(7182):527–530.
- , , , et al. The Joint Commission Children's Asthma Care quality measures and asthma readmissions. Pediatrics. 2012;130(3):482–491.
- , , , et al. Toward transparent clinical policies. Pediatrics. 2008;121(3):643–646.
- Field MJ, Lohr KN, eds.; Committee to Advise the Public Health Service on Clinical Practice Guidelines, Institute of Medicine. Clinical Practice Guidelines: Directions for a New Program. Washington, DC: National Academies Press; 1990.
- , , , , . Development and application of a generic methodology to assess the quality of clinical guidelines. Int J Qual Health Care. 1999;11(1):21–28.
- , , , , . A systematic review of appraisal tools for clinical practice guidelines: multiple similarities and one common deficit. Int J Qual Health Care. 2005;17(3):235–242.
- , , . How to decide whether a clinical practice guideline is trustworthy. JAMA. 2013;309(2):139–140.
- Field MJ, Lohr KN, eds.; Committee to Advise the Public Health Service on Clinical Practice Guidelines, Institute of Medicine. Guidelines for Clinical Practice: From Development to Use. Washington, DC: National Academies Press; 1992.
- The AGREE Collaboration. Development and validation of an international appraisal instrument for assessing the quality of clinical practice guidelines: the AGREE project. Qual Saf Health Care. 2003;12:18–23.
- . AGREE II‐improving the quality of clinical care. Lancet. 2010;376(9747):1128–1129.
- , , , . Corticosteroids and mortality in children with bacterial meningitis. JAMA. 2008;299(17):2048–2055.
- , , , et al. Clinical practice guideline: polysomnography for sleep‐disordered breathing prior to tonsillectomy in children. Otolaryngol Head Neck Surg. 2011;145(1 suppl):S1–S15.
- , , , et al. AGREE II: advancing guideline development, reporting and evaluation in health care. CMAJ. 2010;182(18):E839–E842.
- , . The Delphi method as a research tool: an example, design considerations and applications. Inform Manag. 2004;42(1):15–29.
- , . The measurement of observer agreement for categorical data. Biometrics. 1977;33:159–174.
- National Heart, Lung, and Blood Institute; National Asthma Education and Prevention Program. Expert panel report 3 (EPR‐3): guidelines for the diagnosis and management of asthma‐full report 2007. Pages 1–440. Available at: http://www.nhlbi.nih.gov/guidelines/asthma/asthgdln.pdf. Accessed on 24 August 2012.
- , , , et al. Clinical practice guideline: tonsillectomy in children. Otolaryngol Head Neck Surg. 2011;144(1 suppl):S1–S30.
- American Academy of Pediatrics Subcommittee on Diagnosis and Management of Bronchiolitis. Diagnosis and management of bronchiolitis. Pediatrics. 2006;118:1774–1793.
- Health supervision for children with sickle cell disease. Pediatrics. 2002;109(3):526–535.
- National Heart, Lung, and Blood Institute, National Institutes of Health. The management of sickle cell disease. National Heart, Lung, and Blood Institute, National Institutes of Health, Bethesda, MD. Available at: http://www.nhlbi.nih.gov/health/prof/blood/sickle/sc_mngt.pdf. Revised June 2002. Accessed on 13 October 2012.
- American Academy on Pediatric Dentistry Clinical Affairs Committee–Pulp Therapy Subcommittee; American Academy on Pediatric Dentistry Council on Clinical Affairs. Guideline on pulp therapy for primary and young permanent teeth. Pediatr Dent. 2008;30:170–174.
- , , , et al.; Neurocritical Care Society Status Epilepticus Guideline Writing Committee. Guidelines for the evaluation and management of status epilepticus. Neurocrit Care. 2012;17:3–23.
- American Academy of Pediatrics Task Force on Circumcision. Male circumcision. Pediatrics. 2012;130(3):e756–e785.
- , , , et al. Pediatric gastroesophageal reflux clinical practice guidelines: joint recommendations of the North American Society for Pediatric Gastroenterology, Hepatology, and Nutrition (NASPGHAN) and the European Society for Pediatric Gastroenterology, Hepatology, and Nutrition (ESPGHAN). J Pediatr Gastroenterol Nutr. 2009;49(4):498–547.
- , , , et al. The management of community‐acquired pneumonia in infants and children older than 3 months of age: clinical practice guidelines by the Pediatric Infectious Diseases Society and the Infectious Diseases Society of America. Clin Infect Dis. 2011;53(7):e25–e76.
- American Academy of Family Physicians; American Academy of Otolaryngology‐Head and Neck Surgery; American Academy of Pediatrics Subcommittee on Otitis Media With Effusion. Clinical Practice Guidelines: Otitis media with effusion. Pediatrics. 2004 May;113(5):1412–29.
- , , . Are guidelines following guidelines? The methodological quality of clinical practice guidelines in the peer‐reviewed medical literature. JAMA. 1999;281(20):1900–1905.
- , , , . Quality of reporting and evidence in American Academy of Pediatrics guidelines. Pediatrics. 2013;131(4):732–738.
- , , . Quality of evidence‐based pediatric guidelines. Pediatrics. 2005;115(5):1378–1391.
- , , . The Yale Guideline Recommendation Corpus: a representative sample of the knowledge content of guidelines. Int J Med Inform. 2009;78(5):354–363.
- , , . How often is strength of recommendation indicated in guidelines? Analysis of the Yale Guideline Recommendation Corpus. AMIA Annu Symp Proc. 2008:984.
- , , . Clinical practice guideline development manual, third edition: a quality‐driven approach for translating evidence into action. Otolaryngol Head Neck Surg. 2013;148(1 suppl):S1–S55.
- , , , , , . Attributes of clinical guidelines that influence use of guidelines in general practice: observational study. BMJ. 1998;317(7162):858–861.
- , , , et al. Toward evidence‐based quality improvement. Evidence (and its limitations) of the effectiveness of guideline dissemination and implementation strategies 1966–1998. J Gen Intern Med. 2006;21(suppl 2):S14–S20.
- , , , . Effectiveness of antimicrobial guidelines for community‐acquired pneumonia in children. Pediatrics. 2012;129(5):e1326–e1333.
© 2014 Society of Hospital Medicine
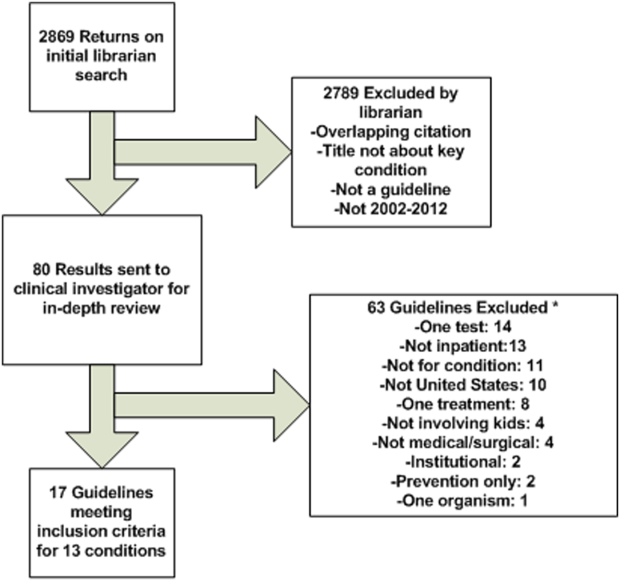
Medications and Pediatric Deterioration
In recent years, many hospitals have implemented rapid response systems (RRSs) in efforts to reduce mortality outside the intensive care unit (ICU). Rapid response systems include 2 clinical components (efferent and afferent limbs) and 2 organizational components (process improvement and administrative limbs).[1, 2] The efferent limb includes medical emergency teams (METs) that can be summoned to hospital wards to rescue deteriorating patients. The afferent limb identifies patients at risk of deterioration using tools such as early warning scores and triggers a MET response when appropriate.[2] The process‐improvement limb evaluates and optimizes the RRS. The administrative limb implements the RRS and supports its ongoing operation. The effectiveness of most RRSs depends upon the ward team making the decision to escalate care by activating the MET. Barriers to activating the MET may include reduced situational awareness,[3, 4] hierarchical barriers to calling for help,[3, 4, 5, 6, 7, 8] fear of criticism,[3, 8, 9] and other hospital safety cultural barriers.[3, 4, 8]
Proactive critical‐care outreach[10, 11, 12, 13] or rover[14] teams seek to reduce barriers to activation and improve outcomes by systematically identifying and evaluating at‐risk patients without relying on requests for assistance from the ward team. Structured similarly to early warning scores, surveillance tools intended for rover teams might improve their ability to rapidly identify at‐risk patients throughout a hospital. They could combine vital signs with other variables, such as diagnostic and therapeutic interventions that reflect the ward team's early, evolving concern. In particular, the incorporation of medications associated with deterioration may enhance the performance of surveillance tools.
Medications may be associated with deterioration in one of several ways. They could play a causal role in deterioration (ie, opioids causing respiratory insufficiency), represent clinical worsening and anticipation of possible deterioration (ie, broad‐spectrum antibiotics for a positive blood culture), or represent rescue therapies for early deterioration (ie, antihistamines for allergic reactions). In each case, the associated therapeutic classes could be considered sentinel markers of clinical deterioration.
Combined with vital signs and other risk factors, therapeutic classes could serve as useful components of surveillance tools to detect signs of early, evolving deterioration and flag at‐risk patients for evaluation. As a first step, we sought to identify therapeutic classes associated with clinical deterioration. This effort to improve existing afferent tools falls within the process‐improvement limb of RRSs.
PATIENTS AND METHODS
Study Design
We performed a case‐crossover study of children who experienced clinical deterioration. An alternative to the matched case‐control design, the case‐crossover design involves longitudinal within‐subject comparisons exclusively of case subjects such that an individual serves as his or her own control. It is most effective when studying intermittent exposures that result in transient changes in the risk of an acute event,[15, 16, 17] making it appropriate for our study.
Using the case‐crossover design, we compared a discrete time period in close proximity to the deterioration event, called the hazard interval, with earlier time periods in the hospitalization, called the control intervals.[15, 16, 17] In our primary analysis (Figure 1B), we defined the durations of these intervals as follows: We first censored the 2 hours immediately preceding the clinical deterioration event (hours 0 to 2). We made this decision a priori to exclude medications used after deterioration was recognized and resuscitation had already begun. The 12‐hour period immediately preceding the censored interval was the hazard interval (hours 2 to 14). Each 12‐hour period immediately preceding the hazard interval was a control interval (hours 14 to 26, 26 to 38, 38 to 50, and 50 to 62). Depending on the child's length of stay prior to the deterioration event, each hazard interval had 14 control intervals for comparison. In sensitivity analysis, we altered the durations of these intervals (see below).
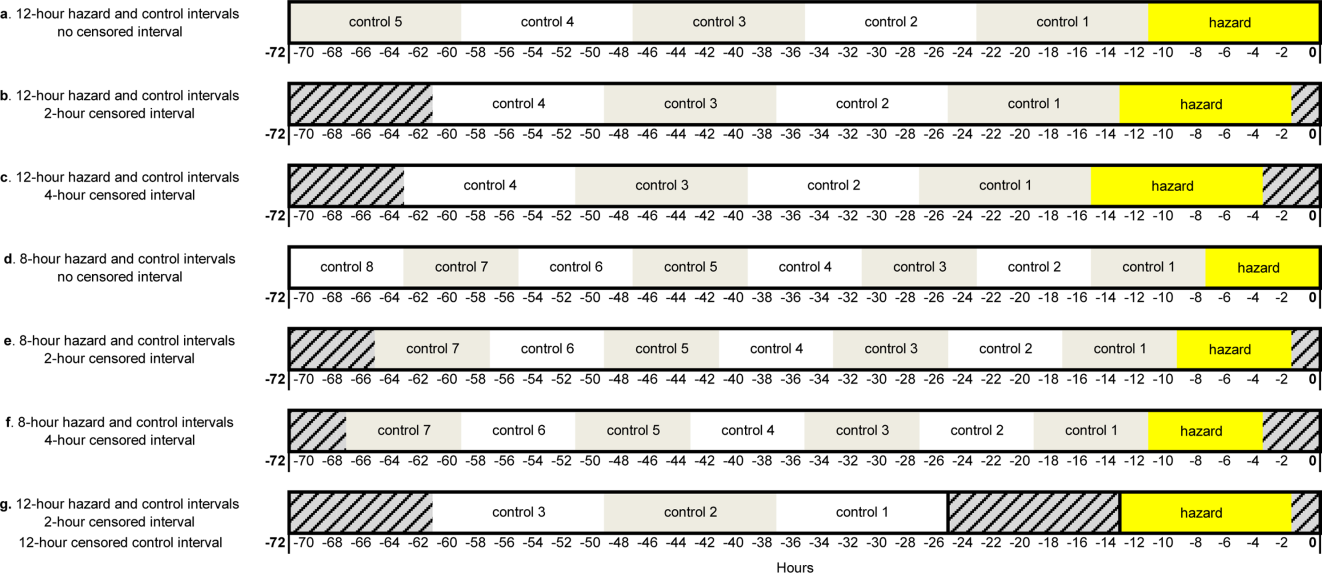
Study Setting and Participants
We performed this study among children age <18 years who experienced clinical deterioration between January 1, 2005, and December 31, 2008, after being hospitalized on a general medical or surgical unit at The Children's Hospital of Philadelphia for 24 hours. Clinical deterioration was a composite outcome defined as cardiopulmonary arrest (CPA), acute respiratory compromise (ARC), or urgent ICU transfer. Cardiopulmonary arrest events required either pulselessness or a pulse with inadequate perfusion treated with chest compressions and/or defibrillation. Acute respiratory compromise events required respiratory insufficiency treated with bag‐valve‐mask or invasive airway interventions. Urgent ICU transfers included 1 of the following outcomes in the 12 hours after transfer: death, CPA, intubation, initiation of noninvasive ventilation, or administration of a vasoactive medication infusion used for the treatment of shock. Time zero was the time of the CPA/ARC, or the time at which the child arrived in the ICU for urgent transfers. These subjects also served as the cases for a previously published case‐control study evaluating different risk factors for deterioration.[18] The institutional review board of The Children's Hospital of Philadelphia approved the study.
At the time of the study, the hospital did not have a formal RRS. An immediate‐response code‐blue team was available throughout the study period for emergencies occurring outside the ICU. Physicians could also page the pediatric ICU fellow to discuss patients who did not require immediate assistance from the code‐blue team but were clinically deteriorating. There were no established triggering criteria.
Medication Exposures
Intravenous (IV) medications administered in the 72 hours prior to clinical deterioration were considered the exposures of interest. Each medication was included in 1 therapeutic classes assigned in the hospital's formulary (Lexicomp, Hudson, OH).[19] In order to determine which therapeutic classes to evaluate, we performed a power calculation using the sampsi_mcc package for Stata 12 (StataCorp, College Station, TX). We estimated that we would have 3 matched control intervals per hazard interval. We found that, in order to detect a minimum odds ratio of 3.0 with 80% power, a therapeutic class had to be administered in 5% of control periods. All therapeutic classes meeting that requirement were included in the analysis and are listed in Table 1. (See lists of the individual medications comprising each class in the Supporting Information, Tables 124, in the online version of this article.)
| Therapeutic Class | No. of Control Intervals | % |
|---|---|---|
| ||
| Sedatives | 107 | 25 |
| Antiemetics | 92 | 22 |
| Third‐ and fourth‐generation cephalosporins | 83 | 20 |
| Antihistamines | 74 | 17 |
| Antidotes to hypersensitivity reactions (diphenhydramine) | 65 | 15 |
| Gastric acid secretion inhibitors | 62 | 15 |
| Loop diuretics | 62 | 15 |
| Anti‐inflammatory agents | 61 | 14 |
| Penicillin antibiotics | 61 | 14 |
| Benzodiazepines | 59 | 14 |
| Hypnotics | 58 | 14 |
| Narcotic analgesics (full opioid agonists) | 54 | 13 |
| Antianxiety agents | 53 | 13 |
| Systemic corticosteroids | 53 | 13 |
| Glycopeptide antibiotics (vancomycin) | 46 | 11 |
| Anaerobic antibiotics | 45 | 11 |
| Histamine H2 antagonists | 41 | 10 |
| Antifungal agents | 37 | 9 |
| Phenothiazine derivatives | 37 | 9 |
| Adrenal corticosteroids | 35 | 8 |
| Antiviral agents | 30 | 7 |
| Aminoglycoside antibiotics | 26 | 6 |
| Narcotic analgesics (partial opioid agonists) | 26 | 6 |
| PPIs | 26 | 6 |
Data Collection
Data were abstracted from the electronic medication administration record (Sunrise Clinical Manager; Allscripts, Chicago, IL) into a database. For each subject, we recorded the name and time of administration of each IV medication given in the 72 hours preceding deterioration, as well as demographic, event, and hospitalization characteristics.
Statistical Analysis
We used univariable conditional logistic regression to evaluate the association between each therapeutic class and the composite outcome of clinical deterioration in the primary analysis. Because cases serve as their own controls in the case‐crossover design, this method inherently adjusts for all subject‐specific time‐invariant confounding variables, such as patient demographics, disease, and hospital‐ward characteristics.[15]
Sensitivity Analysis
Our primary analysis used a 2‐hour censored interval and 12‐hour hazard and control intervals. Excluding the censored interval from analysis was a conservative approach that we chose because our goal was to identify therapeutic classes associated with deterioration during a phase in which adverse outcomes may be prevented with early intervention. In order to test whether our findings were stable across different lengths of censored, hazard, and control intervals, we performed a sensitivity analysis, also using conditional logistic regression, on all therapeutic classes that were significant (P<0.05) in primary analysis. In 6 iterations of the sensitivity analysis, we varied the length of the hazard and control intervals between 8 and 12 hours, and the length of the censored interval between 0 and 4 hours (Figure 1AF). In a seventh iteration, we used a variant of the primary analysis in which we censored the first control interval (Figure 1G).
RESULTS
We identified 12 CPAs, 41 ARCs, and 699 ICU transfers during the study period. Of these 752 events, 141 (19%) were eligible as cases according to our inclusion criteria.[18] (A flowchart demonstrating the identification of eligible cases is provided in Supporting Table 25 in the online version of this article.) Of the 81% excluded, 37% were ICU transfers who did not meet urgent criteria. Another 31% were excluded because they were hospitalized for <24 hours at the time of the event, making their analysis in a case‐crossover design using 12‐hour periods impossible. Event characteristics, demographics, and hospitalization characteristics are shown in Table 2.
| n | % | |
|---|---|---|
| ||
| Type of event | ||
| CPA | 4 | 3 |
| ARC | 29 | 20 |
| Urgent ICU transfer | 108 | 77 |
| Demographics | ||
| Age | ||
| 0<6 months | 17 | 12 |
| 6<12 months | 22 | 16 |
| 1<4 years | 34 | 24 |
| 4<10 years | 26 | 18 |
| 10<18 years | 42 | 30 |
| Sex | ||
| F | 60 | 43 |
| M | 81 | 57 |
| Race | ||
| White | 69 | 49 |
| Black/African American | 49 | 35 |
| Asian/Pacific Islander | 0 | 0 |
| Other | 23 | 16 |
| Ethnicity | ||
| Non‐Hispanic | 127 | 90 |
| Hispanic | 14 | 10 |
| Hospitalization | ||
| Surgical service | 4 | 3 |
| Survived to hospital discharge | 107 | 76 |
Primary Analysis
A total of 141 hazard intervals and 487 control intervals were included in the primary analysis, the results of which are shown in Table 3. Among the antimicrobial therapeutic classes, glycopeptide antibiotics (vancomycin), anaerobic antibiotics, third‐generation and fourth‐generation cephalosporins, and aminoglycoside antibiotics were significant. All of the anti‐inflammatory therapeutic classes, including systemic corticosteroids, anti‐inflammatory agents, and adrenal corticosteroids, were significant. All of the sedatives, hypnotics, and antianxiety therapeutic classes, including sedatives, benzodiazepines, hypnotics, and antianxiety agents, were significant. Among the narcotic analgesic therapeutic classes, only 1 class, narcotic analgesics (full opioid agonists), was significant. None of the gastrointestinal therapeutic classes were significant. Among the classes classified as other, loop diuretics and antidotes to hypersensitivity reactions (diphenhydramine) were significant.
| OR | LCI | UCI | P Value | |
|---|---|---|---|---|
| ||||
| Antimicrobial therapeutic classes | ||||
| Glycopeptide antibiotics (vancomycin) | 5.84 | 2.01 | 16.98 | 0.001 |
| Anaerobic antibiotics | 5.33 | 1.36 | 20.94 | 0.02 |
| Third‐ and fourth‐generation cephalosporins | 2.78 | 1.15 | 6.69 | 0.02 |
| Aminoglycoside antibiotics | 2.90 | 1.11 | 7.56 | 0.03 |
| Penicillin antibiotics | 2.40 | 0.9 | 6.4 | 0.08 |
| Antiviral agents | 1.52 | 0.20 | 11.46 | 0.68 |
| Antifungal agents | 1.06 | 0.44 | 2.58 | 0.89 |
| Corticosteroids and other anti‐inflammatory therapeutic classes* | ||||
| Systemic corticosteroids | 3.69 | 1.09 | 12.55 | 0.04 |
| Anti‐inflammatory agents | 3.69 | 1.09 | 12.55 | 0.04 |
| Adrenal corticosteroids | 3.69 | 1.09 | 12.55 | 0.04 |
| Sedatives, hypnotics, and antianxiety therapeutic classes | ||||
| Sedatives | 3.48 | 1.78 | 6.78 | <0.001 |
| Benzodiazepines | 2.71 | 1.36 | 5.40 | 0.01 |
| Hypnotics | 2.54 | 1.27 | 5.09 | 0.01 |
| Antianxiety agents | 2.28 | 1.06 | 4.91 | 0.04 |
| Narcotic analgesic therapeutic classes | ||||
| Narcotic analgesics (full opioid agonists) | 2.48 | 1.07 | 5.73 | 0.03 |
| Narcotic analgesics (partial opioid agonists) | 1.97 | 0.57 | 6.85 | 0.29 |
| GI therapeutic classes | ||||
| Antiemetics | 0.57 | 0.22 | 1.48 | 0.25 |
| PPIs | 2.05 | 0.58 | 7.25 | 0.26 |
| Phenothiazine derivatives | 0.47 | 0.12 | 1.83 | 0.27 |
| Gastric acid secretion inhibitors | 1.71 | 0.61 | 4.81 | 0.31 |
| Histamine H2 antagonists | 0.95 | 0.17 | 5.19 | 0.95 |
| Other therapeutic classes | ||||
| Loop diuretics | 2.87 | 1.28 | 6.47 | 0.01 |
| Antidotes to hypersensitivity reactions (diphenhydramine) | 2.45 | 1.15 | 5.23 | 0.02 |
| Antihistamines | 2.00 | 0.97 | 4.12 | 0.06 |
Sensitivity Analysis
Of the 14 classes that were significant in primary analysis, we carried 9 forward to sensitivity analysis. The 5 that were not carried forward overlapped substantially with other classes that were carried forward. The decision of which overlapping class to carry forward was based upon (1) parsimony and (2) clinical relevance. This is described briefly in the footnotes to Table 3 (see Supporting information in the online version of this article for a full description of this process). Figure 2 presents the odds ratios and their 95% confidence intervals for the sensitivity analysis of each therapeutic class that was significant in primary analysis. Loop diuretics remained significantly associated with deterioration in all 7 iterations. Glycopeptide antibiotics (vancomycin), third‐generation and fourth‐generation cephalosporins, systemic corticosteroids, and benzodiazepines were significant in 6. Anaerobic antibiotics and narcotic analgesics (full opioid agonists) were significant in 5, and aminoglycoside antibiotics and antidotes to hypersensitivity reactions (diphenhydramine) in 4.
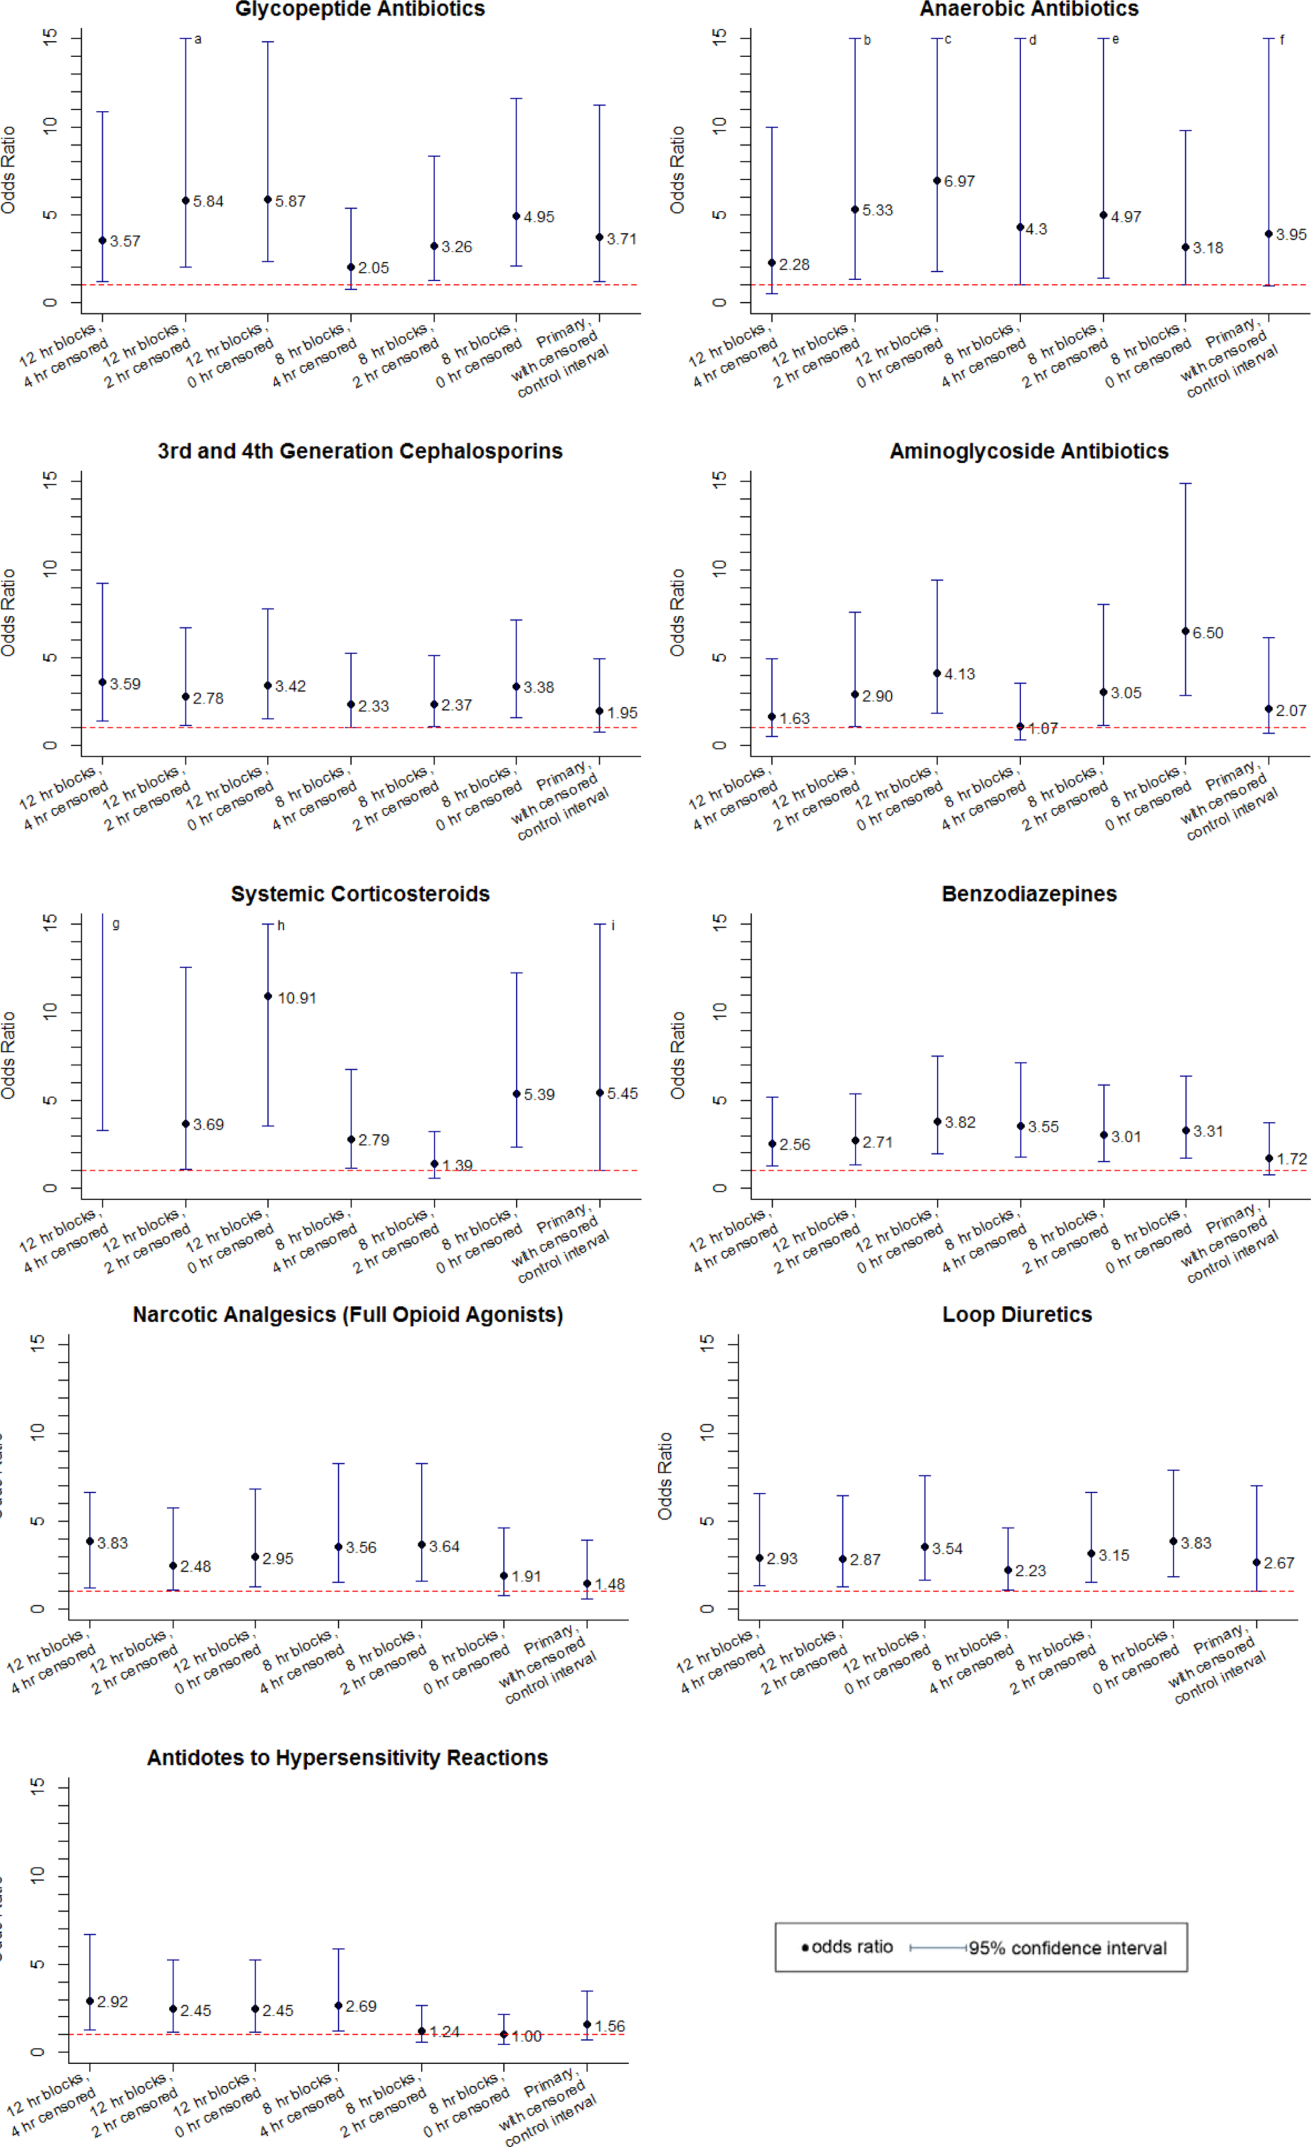
DISCUSSION
We identified 9 therapeutic classes which were associated with a 2.5‐fold to 5.8‐fold increased risk of clinical deterioration. The results were robust to sensitivity analysis. Given their temporal association to the deterioration events, these therapeutic classes may serve as sentinels of early deterioration and are candidate variables to combine with vital signs and other risk factors in a surveillance tool for rover teams or an early warning score.
Although most early warning scores intended for use at the bedside are based upon vital signs and clinical observations, a few also include medications. Monaghan's Pediatric Early Warning Score, the basis for many modified scores used in children's hospitals throughout the world, assigns points for children requiring frequent doses of nebulized medication.[20, 21, 22] Nebulized epinephrine is a component of the Bristol Paediatric Early Warning Tool.[23] The number of medications administered in the preceding 24 hours was included in an early version of the Bedside Paediatric Early Warning System Score.[24] Adding IV antibiotics to the Maximum Modified Early Warning Score improved prediction of the need for higher care utilization among hospitalized adults.[25]
In order to determine the role of the IV medications we found to be associated with clinical deterioration, the necessary next step is to develop a multivariable predictive model to determine if they improve the performance of existing early warning scores in identifying deteriorating patients. Although simplicity is an important characteristic of hand‐calculated early warning scores, integration of a more complex scoring system with more variables, such as these medications, into the electronic health record would allow for automated scoring, eliminating the need to sacrifice score performance to keep the tool simple. Integration into the electronic health record would have the additional benefit of making the score available to clinicians who are not at the bedside. Such tools would be especially useful for remote surveillance for deterioration by critical‐care outreach or rover teams.
Our study has several limitations. First, the sample size was small, and although we sought to minimize the likelihood of chance associations by performing sensitivity analysis, these findings should be confirmed in a larger study. Second, we only evaluated IV medications. Medications administered by other routes could also be associated with clinical deterioration and should be analyzed in future studies. Third, we excluded children hospitalized for <24 hours, as well as transfers that did not meet urgent criteria. These may be limitations because (1) the first 24 hours of hospitalization may be a high‐risk period, and (2) patients who were on trajectories toward severe deterioration and received interventions that prevented further deterioration but did not meet urgent transfer criteria were excluded. It may be that the children we included as cases were at increased risk of deterioration that is either more difficult to recognize early, or more difficult to treat effectively without ICU interventions. Finally, we acknowledge that in some cases the therapeutic classes were associated with deterioration in a causal fashion, and in others the medications administered did not cause deterioration but were signs of therapeutic interventions that were initiated in response to clinical worsening. Identifying the specific indications for administration of drugs used in response to clinical worsening may have resulted in stronger associations with deterioration. However, these indications are often complex, multifactorial, and poorly documented in real time. This limits the ability to automate their detection using the electronic health record, the ultimate goal of this line of research.
CONCLUSION
We used a case‐crossover approach to identify therapeutic classes that are associated with increased risk of clinical deterioration in hospitalized children on pediatric wards. These sentinel therapeutic classes may serve as useful components of electronic health recordbased surveillance tools to detect signs of early, evolving deterioration and flag at‐risk patients for critical‐care outreach or rover team review. Future research should focus on evaluating whether including these therapeutic classes in early warning scores improves their accuracy in detecting signs of deterioration and determining if providing this information as clinical decision support improves patient outcomes.
Acknowledgments
Disclosures: This study was funded by The Children's Hospital of Philadelphia Center for Pediatric Clinical Effectiveness Pilot Grant and the University of Pennsylvania Provost's Undergraduate Research Mentoring Program. Drs. Bonafide and Keren also receive funding from the Pennsylvania Health Research Formula Fund Award from the Pennsylvania Department of Health for research in pediatric hospital quality, safety, and costs. The authors have no other conflicts of interest to report.
- , , , et al. Findings of the first consensus conference on medical emergency teams. Crit Care Med. 2006;34(9):2463–2478.
- , , , et al. “Identifying the hospitalised patient in crisis”—a consensus conference on the afferent limb of rapid response systems. Resuscitation. 2010;81(4):375–382.
- , , , . Attitudes and barriers to a medical emergency team system at a tertiary paediatric hospital. Resuscitation. 2011;82(2):167–174.
- , , , et al. Why don't hospital staff activate the rapid response system (RRS)? How frequently is it needed and can the process be improved? Implement Sci. 2011;6:39.
- , . Failure of the afferent limb: a persistent problem in rapid response systems. Resuscitation. 2011;82(7):797–798.
- , , . Understanding how rapid response systems may improve safety for the acutely ill patient: learning from the frontline. BMJ Qual Saf. 2012;21(2):135–144.
- , , . How RNs rescue patients: a qualitative study of RNs' perceived involvement in rapid response teams. Qual Saf Health Care. 2010;19(5):1–4.
- , , , et al. A survey of nurses' beliefs about the medical emergency team system in a Canadian tertiary hospital. Am J Crit Care. 2010;19(1):74–83.
- , , , et al. Nurses' attitudes to a medical emergency team service in a teaching hospital. Qual Saf Health Care. 2006;15(6):427–432.
- , , , et al. Introducing critical care outreach: a ward‐randomised trial of phased introduction in a general hospital. Intensive Care Med. 2004;30(7):1398–1404.
- . Out of our reach? Assessing the impact of introducing a critical care outreach service. Anaesthesia. 2003;58(9):882–885.
- , , . Effect of the critical care outreach team on patient survival to discharge from hospital and readmission to critical care: non‐randomised population based study. BMJ. 2003;327(7422):1014.
- , , , et al. Successful implementation of a family and patient activated rapid response team in an adult level 1 trauma center. Resuscitation. 2010;81(12):1676–1681.
- , , , et al. Beyond rapid response teams: instituting a “Rover Team” improves the management of at‐risk patients, facilitates proactive interventions, and improves outcomes. In: Henriksen K, Battles JB, Keyes MA, Grady ML, eds. Advances in Patient Safety: New Directions and Alternative Approaches. Rockville, MD: Agency for Healthcare Research and Quality; 2008.
- , . The case‐crossover study design in pharmacoepidemiology. Stat Methods Med Res. 2009;18(1):53–65.
- , , , et al. Comparison of the statistical efficiency of case‐crossover and case‐control designs: application to severe cutaneous adverse reactions. J Clin Epidemiol. 2001;54(12):1218–1227.
- . The case‐crossover design: a method for studying transient effects on the risk of acute events. Am J Epidemiol. 1991;133(2):144–153.
- , , , , , . Development of a score to predict clinical deterioration in hospitalized children. J Hosp Med. 2012;7(4):345–349.
- Lexicomp. Available at: http://www.lexi.com. Accessed July 26, 2012.
- , , , , , . Sensitivity of the Pediatric Early Warning Score to identify patient deterioration. Pediatrics. 2010;125(4):e763–e769.
- . Detecting and managing deterioration in children. Paediatr Nurs. 2005;17(1):32–35.
- , , , , . Prospective evaluation of a pediatric inpatient early warning scoring system. J Spec Pediatr Nurs. 2009;14(2):79–85.
- , , . Promoting care for acutely ill children—development and evaluation of a Paediatric Early Warning Tool. Intensive Crit Care Nurs. 2006;22(2):73–81.
- , , . The Pediatric Early Warning System Score: a severity of illness score to predict urgent medical need in hospitalized children. J Crit Care. 2006;21(3):271–278.
- , , , , , . Performance of the maximum modified early warning score to predict the need for higher care utilization among admitted emergency department patients. J Hosp Med. 2010;5(1):E46–E52.
In recent years, many hospitals have implemented rapid response systems (RRSs) in efforts to reduce mortality outside the intensive care unit (ICU). Rapid response systems include 2 clinical components (efferent and afferent limbs) and 2 organizational components (process improvement and administrative limbs).[1, 2] The efferent limb includes medical emergency teams (METs) that can be summoned to hospital wards to rescue deteriorating patients. The afferent limb identifies patients at risk of deterioration using tools such as early warning scores and triggers a MET response when appropriate.[2] The process‐improvement limb evaluates and optimizes the RRS. The administrative limb implements the RRS and supports its ongoing operation. The effectiveness of most RRSs depends upon the ward team making the decision to escalate care by activating the MET. Barriers to activating the MET may include reduced situational awareness,[3, 4] hierarchical barriers to calling for help,[3, 4, 5, 6, 7, 8] fear of criticism,[3, 8, 9] and other hospital safety cultural barriers.[3, 4, 8]
Proactive critical‐care outreach[10, 11, 12, 13] or rover[14] teams seek to reduce barriers to activation and improve outcomes by systematically identifying and evaluating at‐risk patients without relying on requests for assistance from the ward team. Structured similarly to early warning scores, surveillance tools intended for rover teams might improve their ability to rapidly identify at‐risk patients throughout a hospital. They could combine vital signs with other variables, such as diagnostic and therapeutic interventions that reflect the ward team's early, evolving concern. In particular, the incorporation of medications associated with deterioration may enhance the performance of surveillance tools.
Medications may be associated with deterioration in one of several ways. They could play a causal role in deterioration (ie, opioids causing respiratory insufficiency), represent clinical worsening and anticipation of possible deterioration (ie, broad‐spectrum antibiotics for a positive blood culture), or represent rescue therapies for early deterioration (ie, antihistamines for allergic reactions). In each case, the associated therapeutic classes could be considered sentinel markers of clinical deterioration.
Combined with vital signs and other risk factors, therapeutic classes could serve as useful components of surveillance tools to detect signs of early, evolving deterioration and flag at‐risk patients for evaluation. As a first step, we sought to identify therapeutic classes associated with clinical deterioration. This effort to improve existing afferent tools falls within the process‐improvement limb of RRSs.
PATIENTS AND METHODS
Study Design
We performed a case‐crossover study of children who experienced clinical deterioration. An alternative to the matched case‐control design, the case‐crossover design involves longitudinal within‐subject comparisons exclusively of case subjects such that an individual serves as his or her own control. It is most effective when studying intermittent exposures that result in transient changes in the risk of an acute event,[15, 16, 17] making it appropriate for our study.
Using the case‐crossover design, we compared a discrete time period in close proximity to the deterioration event, called the hazard interval, with earlier time periods in the hospitalization, called the control intervals.[15, 16, 17] In our primary analysis (Figure 1B), we defined the durations of these intervals as follows: We first censored the 2 hours immediately preceding the clinical deterioration event (hours 0 to 2). We made this decision a priori to exclude medications used after deterioration was recognized and resuscitation had already begun. The 12‐hour period immediately preceding the censored interval was the hazard interval (hours 2 to 14). Each 12‐hour period immediately preceding the hazard interval was a control interval (hours 14 to 26, 26 to 38, 38 to 50, and 50 to 62). Depending on the child's length of stay prior to the deterioration event, each hazard interval had 14 control intervals for comparison. In sensitivity analysis, we altered the durations of these intervals (see below).
Study Setting and Participants
We performed this study among children age <18 years who experienced clinical deterioration between January 1, 2005, and December 31, 2008, after being hospitalized on a general medical or surgical unit at The Children's Hospital of Philadelphia for 24 hours. Clinical deterioration was a composite outcome defined as cardiopulmonary arrest (CPA), acute respiratory compromise (ARC), or urgent ICU transfer. Cardiopulmonary arrest events required either pulselessness or a pulse with inadequate perfusion treated with chest compressions and/or defibrillation. Acute respiratory compromise events required respiratory insufficiency treated with bag‐valve‐mask or invasive airway interventions. Urgent ICU transfers included 1 of the following outcomes in the 12 hours after transfer: death, CPA, intubation, initiation of noninvasive ventilation, or administration of a vasoactive medication infusion used for the treatment of shock. Time zero was the time of the CPA/ARC, or the time at which the child arrived in the ICU for urgent transfers. These subjects also served as the cases for a previously published case‐control study evaluating different risk factors for deterioration.[18] The institutional review board of The Children's Hospital of Philadelphia approved the study.
At the time of the study, the hospital did not have a formal RRS. An immediate‐response code‐blue team was available throughout the study period for emergencies occurring outside the ICU. Physicians could also page the pediatric ICU fellow to discuss patients who did not require immediate assistance from the code‐blue team but were clinically deteriorating. There were no established triggering criteria.
Medication Exposures
Intravenous (IV) medications administered in the 72 hours prior to clinical deterioration were considered the exposures of interest. Each medication was included in 1 therapeutic classes assigned in the hospital's formulary (Lexicomp, Hudson, OH).[19] In order to determine which therapeutic classes to evaluate, we performed a power calculation using the sampsi_mcc package for Stata 12 (StataCorp, College Station, TX). We estimated that we would have 3 matched control intervals per hazard interval. We found that, in order to detect a minimum odds ratio of 3.0 with 80% power, a therapeutic class had to be administered in 5% of control periods. All therapeutic classes meeting that requirement were included in the analysis and are listed in Table 1. (See lists of the individual medications comprising each class in the Supporting Information, Tables 124, in the online version of this article.)
| Therapeutic Class | No. of Control Intervals | % |
|---|---|---|
| ||
| Sedatives | 107 | 25 |
| Antiemetics | 92 | 22 |
| Third‐ and fourth‐generation cephalosporins | 83 | 20 |
| Antihistamines | 74 | 17 |
| Antidotes to hypersensitivity reactions (diphenhydramine) | 65 | 15 |
| Gastric acid secretion inhibitors | 62 | 15 |
| Loop diuretics | 62 | 15 |
| Anti‐inflammatory agents | 61 | 14 |
| Penicillin antibiotics | 61 | 14 |
| Benzodiazepines | 59 | 14 |
| Hypnotics | 58 | 14 |
| Narcotic analgesics (full opioid agonists) | 54 | 13 |
| Antianxiety agents | 53 | 13 |
| Systemic corticosteroids | 53 | 13 |
| Glycopeptide antibiotics (vancomycin) | 46 | 11 |
| Anaerobic antibiotics | 45 | 11 |
| Histamine H2 antagonists | 41 | 10 |
| Antifungal agents | 37 | 9 |
| Phenothiazine derivatives | 37 | 9 |
| Adrenal corticosteroids | 35 | 8 |
| Antiviral agents | 30 | 7 |
| Aminoglycoside antibiotics | 26 | 6 |
| Narcotic analgesics (partial opioid agonists) | 26 | 6 |
| PPIs | 26 | 6 |
Data Collection
Data were abstracted from the electronic medication administration record (Sunrise Clinical Manager; Allscripts, Chicago, IL) into a database. For each subject, we recorded the name and time of administration of each IV medication given in the 72 hours preceding deterioration, as well as demographic, event, and hospitalization characteristics.
Statistical Analysis
We used univariable conditional logistic regression to evaluate the association between each therapeutic class and the composite outcome of clinical deterioration in the primary analysis. Because cases serve as their own controls in the case‐crossover design, this method inherently adjusts for all subject‐specific time‐invariant confounding variables, such as patient demographics, disease, and hospital‐ward characteristics.[15]
Sensitivity Analysis
Our primary analysis used a 2‐hour censored interval and 12‐hour hazard and control intervals. Excluding the censored interval from analysis was a conservative approach that we chose because our goal was to identify therapeutic classes associated with deterioration during a phase in which adverse outcomes may be prevented with early intervention. In order to test whether our findings were stable across different lengths of censored, hazard, and control intervals, we performed a sensitivity analysis, also using conditional logistic regression, on all therapeutic classes that were significant (P<0.05) in primary analysis. In 6 iterations of the sensitivity analysis, we varied the length of the hazard and control intervals between 8 and 12 hours, and the length of the censored interval between 0 and 4 hours (Figure 1AF). In a seventh iteration, we used a variant of the primary analysis in which we censored the first control interval (Figure 1G).
RESULTS
We identified 12 CPAs, 41 ARCs, and 699 ICU transfers during the study period. Of these 752 events, 141 (19%) were eligible as cases according to our inclusion criteria.[18] (A flowchart demonstrating the identification of eligible cases is provided in Supporting Table 25 in the online version of this article.) Of the 81% excluded, 37% were ICU transfers who did not meet urgent criteria. Another 31% were excluded because they were hospitalized for <24 hours at the time of the event, making their analysis in a case‐crossover design using 12‐hour periods impossible. Event characteristics, demographics, and hospitalization characteristics are shown in Table 2.
| n | % | |
|---|---|---|
| ||
| Type of event | ||
| CPA | 4 | 3 |
| ARC | 29 | 20 |
| Urgent ICU transfer | 108 | 77 |
| Demographics | ||
| Age | ||
| 0<6 months | 17 | 12 |
| 6<12 months | 22 | 16 |
| 1<4 years | 34 | 24 |
| 4<10 years | 26 | 18 |
| 10<18 years | 42 | 30 |
| Sex | ||
| F | 60 | 43 |
| M | 81 | 57 |
| Race | ||
| White | 69 | 49 |
| Black/African American | 49 | 35 |
| Asian/Pacific Islander | 0 | 0 |
| Other | 23 | 16 |
| Ethnicity | ||
| Non‐Hispanic | 127 | 90 |
| Hispanic | 14 | 10 |
| Hospitalization | ||
| Surgical service | 4 | 3 |
| Survived to hospital discharge | 107 | 76 |
Primary Analysis
A total of 141 hazard intervals and 487 control intervals were included in the primary analysis, the results of which are shown in Table 3. Among the antimicrobial therapeutic classes, glycopeptide antibiotics (vancomycin), anaerobic antibiotics, third‐generation and fourth‐generation cephalosporins, and aminoglycoside antibiotics were significant. All of the anti‐inflammatory therapeutic classes, including systemic corticosteroids, anti‐inflammatory agents, and adrenal corticosteroids, were significant. All of the sedatives, hypnotics, and antianxiety therapeutic classes, including sedatives, benzodiazepines, hypnotics, and antianxiety agents, were significant. Among the narcotic analgesic therapeutic classes, only 1 class, narcotic analgesics (full opioid agonists), was significant. None of the gastrointestinal therapeutic classes were significant. Among the classes classified as other, loop diuretics and antidotes to hypersensitivity reactions (diphenhydramine) were significant.
| OR | LCI | UCI | P Value | |
|---|---|---|---|---|
| ||||
| Antimicrobial therapeutic classes | ||||
| Glycopeptide antibiotics (vancomycin) | 5.84 | 2.01 | 16.98 | 0.001 |
| Anaerobic antibiotics | 5.33 | 1.36 | 20.94 | 0.02 |
| Third‐ and fourth‐generation cephalosporins | 2.78 | 1.15 | 6.69 | 0.02 |
| Aminoglycoside antibiotics | 2.90 | 1.11 | 7.56 | 0.03 |
| Penicillin antibiotics | 2.40 | 0.9 | 6.4 | 0.08 |
| Antiviral agents | 1.52 | 0.20 | 11.46 | 0.68 |
| Antifungal agents | 1.06 | 0.44 | 2.58 | 0.89 |
| Corticosteroids and other anti‐inflammatory therapeutic classes* | ||||
| Systemic corticosteroids | 3.69 | 1.09 | 12.55 | 0.04 |
| Anti‐inflammatory agents | 3.69 | 1.09 | 12.55 | 0.04 |
| Adrenal corticosteroids | 3.69 | 1.09 | 12.55 | 0.04 |
| Sedatives, hypnotics, and antianxiety therapeutic classes | ||||
| Sedatives | 3.48 | 1.78 | 6.78 | <0.001 |
| Benzodiazepines | 2.71 | 1.36 | 5.40 | 0.01 |
| Hypnotics | 2.54 | 1.27 | 5.09 | 0.01 |
| Antianxiety agents | 2.28 | 1.06 | 4.91 | 0.04 |
| Narcotic analgesic therapeutic classes | ||||
| Narcotic analgesics (full opioid agonists) | 2.48 | 1.07 | 5.73 | 0.03 |
| Narcotic analgesics (partial opioid agonists) | 1.97 | 0.57 | 6.85 | 0.29 |
| GI therapeutic classes | ||||
| Antiemetics | 0.57 | 0.22 | 1.48 | 0.25 |
| PPIs | 2.05 | 0.58 | 7.25 | 0.26 |
| Phenothiazine derivatives | 0.47 | 0.12 | 1.83 | 0.27 |
| Gastric acid secretion inhibitors | 1.71 | 0.61 | 4.81 | 0.31 |
| Histamine H2 antagonists | 0.95 | 0.17 | 5.19 | 0.95 |
| Other therapeutic classes | ||||
| Loop diuretics | 2.87 | 1.28 | 6.47 | 0.01 |
| Antidotes to hypersensitivity reactions (diphenhydramine) | 2.45 | 1.15 | 5.23 | 0.02 |
| Antihistamines | 2.00 | 0.97 | 4.12 | 0.06 |
Sensitivity Analysis
Of the 14 classes that were significant in primary analysis, we carried 9 forward to sensitivity analysis. The 5 that were not carried forward overlapped substantially with other classes that were carried forward. The decision of which overlapping class to carry forward was based upon (1) parsimony and (2) clinical relevance. This is described briefly in the footnotes to Table 3 (see Supporting information in the online version of this article for a full description of this process). Figure 2 presents the odds ratios and their 95% confidence intervals for the sensitivity analysis of each therapeutic class that was significant in primary analysis. Loop diuretics remained significantly associated with deterioration in all 7 iterations. Glycopeptide antibiotics (vancomycin), third‐generation and fourth‐generation cephalosporins, systemic corticosteroids, and benzodiazepines were significant in 6. Anaerobic antibiotics and narcotic analgesics (full opioid agonists) were significant in 5, and aminoglycoside antibiotics and antidotes to hypersensitivity reactions (diphenhydramine) in 4.
DISCUSSION
We identified 9 therapeutic classes which were associated with a 2.5‐fold to 5.8‐fold increased risk of clinical deterioration. The results were robust to sensitivity analysis. Given their temporal association to the deterioration events, these therapeutic classes may serve as sentinels of early deterioration and are candidate variables to combine with vital signs and other risk factors in a surveillance tool for rover teams or an early warning score.
Although most early warning scores intended for use at the bedside are based upon vital signs and clinical observations, a few also include medications. Monaghan's Pediatric Early Warning Score, the basis for many modified scores used in children's hospitals throughout the world, assigns points for children requiring frequent doses of nebulized medication.[20, 21, 22] Nebulized epinephrine is a component of the Bristol Paediatric Early Warning Tool.[23] The number of medications administered in the preceding 24 hours was included in an early version of the Bedside Paediatric Early Warning System Score.[24] Adding IV antibiotics to the Maximum Modified Early Warning Score improved prediction of the need for higher care utilization among hospitalized adults.[25]
In order to determine the role of the IV medications we found to be associated with clinical deterioration, the necessary next step is to develop a multivariable predictive model to determine if they improve the performance of existing early warning scores in identifying deteriorating patients. Although simplicity is an important characteristic of hand‐calculated early warning scores, integration of a more complex scoring system with more variables, such as these medications, into the electronic health record would allow for automated scoring, eliminating the need to sacrifice score performance to keep the tool simple. Integration into the electronic health record would have the additional benefit of making the score available to clinicians who are not at the bedside. Such tools would be especially useful for remote surveillance for deterioration by critical‐care outreach or rover teams.
Our study has several limitations. First, the sample size was small, and although we sought to minimize the likelihood of chance associations by performing sensitivity analysis, these findings should be confirmed in a larger study. Second, we only evaluated IV medications. Medications administered by other routes could also be associated with clinical deterioration and should be analyzed in future studies. Third, we excluded children hospitalized for <24 hours, as well as transfers that did not meet urgent criteria. These may be limitations because (1) the first 24 hours of hospitalization may be a high‐risk period, and (2) patients who were on trajectories toward severe deterioration and received interventions that prevented further deterioration but did not meet urgent transfer criteria were excluded. It may be that the children we included as cases were at increased risk of deterioration that is either more difficult to recognize early, or more difficult to treat effectively without ICU interventions. Finally, we acknowledge that in some cases the therapeutic classes were associated with deterioration in a causal fashion, and in others the medications administered did not cause deterioration but were signs of therapeutic interventions that were initiated in response to clinical worsening. Identifying the specific indications for administration of drugs used in response to clinical worsening may have resulted in stronger associations with deterioration. However, these indications are often complex, multifactorial, and poorly documented in real time. This limits the ability to automate their detection using the electronic health record, the ultimate goal of this line of research.
CONCLUSION
We used a case‐crossover approach to identify therapeutic classes that are associated with increased risk of clinical deterioration in hospitalized children on pediatric wards. These sentinel therapeutic classes may serve as useful components of electronic health recordbased surveillance tools to detect signs of early, evolving deterioration and flag at‐risk patients for critical‐care outreach or rover team review. Future research should focus on evaluating whether including these therapeutic classes in early warning scores improves their accuracy in detecting signs of deterioration and determining if providing this information as clinical decision support improves patient outcomes.
Acknowledgments
Disclosures: This study was funded by The Children's Hospital of Philadelphia Center for Pediatric Clinical Effectiveness Pilot Grant and the University of Pennsylvania Provost's Undergraduate Research Mentoring Program. Drs. Bonafide and Keren also receive funding from the Pennsylvania Health Research Formula Fund Award from the Pennsylvania Department of Health for research in pediatric hospital quality, safety, and costs. The authors have no other conflicts of interest to report.
- , , , et al. Findings of the first consensus conference on medical emergency teams. Crit Care Med. 2006;34(9):2463–2478.
- , , , et al. “Identifying the hospitalised patient in crisis”—a consensus conference on the afferent limb of rapid response systems. Resuscitation. 2010;81(4):375–382.
- , , , . Attitudes and barriers to a medical emergency team system at a tertiary paediatric hospital. Resuscitation. 2011;82(2):167–174.
- , , , et al. Why don't hospital staff activate the rapid response system (RRS)? How frequently is it needed and can the process be improved? Implement Sci. 2011;6:39.
- , . Failure of the afferent limb: a persistent problem in rapid response systems. Resuscitation. 2011;82(7):797–798.
- , , . Understanding how rapid response systems may improve safety for the acutely ill patient: learning from the frontline. BMJ Qual Saf. 2012;21(2):135–144.
- , , . How RNs rescue patients: a qualitative study of RNs' perceived involvement in rapid response teams. Qual Saf Health Care. 2010;19(5):1–4.
- , , , et al. A survey of nurses' beliefs about the medical emergency team system in a Canadian tertiary hospital. Am J Crit Care. 2010;19(1):74–83.
- , , , et al. Nurses' attitudes to a medical emergency team service in a teaching hospital. Qual Saf Health Care. 2006;15(6):427–432.
- , , , et al. Introducing critical care outreach: a ward‐randomised trial of phased introduction in a general hospital. Intensive Care Med. 2004;30(7):1398–1404.
- . Out of our reach? Assessing the impact of introducing a critical care outreach service. Anaesthesia. 2003;58(9):882–885.
- , , . Effect of the critical care outreach team on patient survival to discharge from hospital and readmission to critical care: non‐randomised population based study. BMJ. 2003;327(7422):1014.
- , , , et al. Successful implementation of a family and patient activated rapid response team in an adult level 1 trauma center. Resuscitation. 2010;81(12):1676–1681.
- , , , et al. Beyond rapid response teams: instituting a “Rover Team” improves the management of at‐risk patients, facilitates proactive interventions, and improves outcomes. In: Henriksen K, Battles JB, Keyes MA, Grady ML, eds. Advances in Patient Safety: New Directions and Alternative Approaches. Rockville, MD: Agency for Healthcare Research and Quality; 2008.
- , . The case‐crossover study design in pharmacoepidemiology. Stat Methods Med Res. 2009;18(1):53–65.
- , , , et al. Comparison of the statistical efficiency of case‐crossover and case‐control designs: application to severe cutaneous adverse reactions. J Clin Epidemiol. 2001;54(12):1218–1227.
- . The case‐crossover design: a method for studying transient effects on the risk of acute events. Am J Epidemiol. 1991;133(2):144–153.
- , , , , , . Development of a score to predict clinical deterioration in hospitalized children. J Hosp Med. 2012;7(4):345–349.
- Lexicomp. Available at: http://www.lexi.com. Accessed July 26, 2012.
- , , , , , . Sensitivity of the Pediatric Early Warning Score to identify patient deterioration. Pediatrics. 2010;125(4):e763–e769.
- . Detecting and managing deterioration in children. Paediatr Nurs. 2005;17(1):32–35.
- , , , , . Prospective evaluation of a pediatric inpatient early warning scoring system. J Spec Pediatr Nurs. 2009;14(2):79–85.
- , , . Promoting care for acutely ill children—development and evaluation of a Paediatric Early Warning Tool. Intensive Crit Care Nurs. 2006;22(2):73–81.
- , , . The Pediatric Early Warning System Score: a severity of illness score to predict urgent medical need in hospitalized children. J Crit Care. 2006;21(3):271–278.
- , , , , , . Performance of the maximum modified early warning score to predict the need for higher care utilization among admitted emergency department patients. J Hosp Med. 2010;5(1):E46–E52.
Copyright © 2013 Society of Hospital Medicine

Early Warning Score Qualitative Study
Thousands of hospitals have recently implemented rapid response systems (RRSs), attempting to reduce mortality outside of intensive care units (ICUs).[1, 2] These systems have 2 clinical components, a response (efferent) arm and an identification (afferent) arm.[3] The response arm is usually composed of a medical emergency team (MET) that responds to calls for urgent assistance. The identification arm includes tools to help clinicians recognize patients who require assistance from the MET. In many hospitals, the identification arm includes an early warning score (EWS). In pediatric patients, EWSs assign point values to vital signs that fall outside of age‐based ranges, among other clinical observations. They then generate a total score intended to help clinicians identify patients exhibiting early signs of deterioration.[4, 5, 6, 7, 8, 9, 10, 11]
When experimentally applied to vital sign datasets, the test characteristics of pediatric EWSs in detecting clinical deterioration are highly variable across studies, with major tradeoffs between sensitivity, specificity, and predictive values that differ by outcome, score, and cut‐point (Table 1). This reflects the difficulty of identifying deteriorating patients using only objective measures. However, in real‐world settings, EWSs are used by clinicians in conjunction with their clinical judgment. We hypothesized that EWSs have benefits that extend beyond their ability to predict deterioration, and thus have value not demonstrated by test characteristics alone. In order to further explore this issue, we aimed to qualitatively evaluate mechanisms beyond their statistical ability to predict deterioration by which physicians and nurses use EWSs to support their decision making.
| Score and Citation | Outcome Measure | Score Cut‐point | Sens | Spec | PPV | NPV |
|---|---|---|---|---|---|---|
| ||||||
| Brighton Paediatric Early Warning Score[5] | RRT or code blue call | 4 | 86% | NR | NR | NR |
| Bristol Paediatric Early Warning Tool[6, 11] | Escalation to higher level of care | 1 | ER | ER | 63% | NR |
| Cardiff and Vale Paediatric Early Warning System[7] | Respiratory or cardiac arrest, HDU/ICU admission, or death | 1 | 89% | 64% | 2% | >99% |
| Bedside Paediatric Early Warning System score, original version[8] | Code blue call | 5 | 78% | 95% | 4% | NR |
| Bedside Paediatric Early Warning System score, simplified version[9] | Urgent ICU admission without a code blue call | 8 | 82% | 93% | NR | NR |
| Bedside Paediatric Early Warning System score, simplified version[10] | Urgent ICU admission or code blue call | 7 | 64% | 91% | 9% | NR |
METHODS
Overview
As 1 component of a larger study, we conducted semistructured interviews with nurses and physicians at The Children's Hospital of Philadelphia (CHOP) between May and October 2011. In separate subprojects using the same participants, the larger study also aimed to identify residual barriers to calling for urgent assistance and assess the role of families in the recognition of deterioration and MET activation.
Setting
The Children's Hospital of Philadelphia is an urban, tertiary‐care pediatric hospital with 504 beds. Surgical patients hospitalized outside of ICUs are cared for by surgeons and surgical nurses without pediatrician co‐management. Implementation of a RRS was prompted by serious safety events in which clinical deterioration was either not recognized or was recognized and not escalated. Prior to RRS implementation, a code blue team could be activated for patients in immediate need of resuscitation, or, for less‐urgent needs, a pediatric ICU fellow could be paged by physicians for informal consults.
A multidisciplinary team developed and pilot‐tested the RRS, then implemented it hospital‐wide in February 2010. Representing an aspect of a multipronged approach to improve safety culture, the RRS consisted of (1) an EWS based upon Parshuram's Bedside Paediatric Early Warning System,[8, 9, 10] calculated by hand on a paper form (see online supplementary content) at the same frequency as vital signs (usually every 4 hours), and (2) a 30‐minute response MET available for activation by any clinician for any concern, 24 hours per day, 7 days per week. Escalation guidelines included a prompt to activate the MET for a score that increased to the red zone (9). For concerns that could not wait 30 minutes, any hospital employee could activate the immediate‐response code blue team.
Utilization of the RRS at CHOP is high, with 23 calls to the MET per day and a combined MET/code‐blue team call rate of 27.8 per 1000 admissions.[12] Previously reported pediatric call rates range from 2.8 to 44.0, with a median of 9.6 per 1000 admissions across 6 studies.[13, 14, 15, 16, 17, 18, 19] Since implementation, there has been a statistically significant net reduction in critical deterioration events (unpublished data).
Participants
We recruited nurses and physicians who had recently cared for children age 18 years on general medical or surgical wards with false‐negative or false‐positive EWSs (instances when the score failed to predict deterioration). Recruitment ceased when we reached thematic data saturation (a qualitative research term for the point at which no new themes emerge with additional interviews).[20]
Data Collection
Through a detailed review of the relevant literature and consultation with experts, we developed a semistructured interview guide (see online supplementary content) to elicit nurses' and physicians' viewpoints regarding the mechanisms by which they use EWSs to support their decision making.
Experienced qualitative research scientists (F.K.B. and J.H.H.) trained 2 study interviewers (B.P. and K.M.T.). In order to minimize social‐desirability bias, the interviewers were not clinicians and were not involved in RRS operations. Each interview was recorded, professionally transcribed, and imported into NVivo 8.0 software for analysis (QSR International, Melbourne, Australia).
Data Analysis
We coded the interviews inductively, without using a predetermined set of themes. This approach is known as grounded theory methodology.[21] Two team members coded each interview independently. They then reviewed their coding together and discussed discrepancies until reaching consensus. In weekly meetings while the interviews were ongoing, we compared newly collected data with themes that had previously emerged in order to guide further thematic development and refinement (the constant comparative method).[22] After all of the interviews were completed and consensus had been reached for each individual interview, the study team convened a series of additional meetings to further refine and finalize the themes.
Human Subjects
The CHOP Institutional Review Board approved this study. All participants provided written informed consent.
RESULTS
Participants
We recruited 27 nurses and 30 physicians before reaching thematic data saturation. Because surgical patients are underrepresented relative to medical patients among the population with false‐positive and false‐negative scores in our hospital, this included 3 randomly selected surgical nurses and 7 randomly selected surgical physicians recruited to ensure thematic data saturation for surgical settings. Characteristics of the participants are displayed in Table 2.
| Physicians (n=30) | Nurses (n=27) | |||
|---|---|---|---|---|
| ||||
| N | % | N | % | |
| Race | ||||
| Asian | 2 | 6.7 | 1 | 3.7 |
| Black | 0 | 0.0 | 2 | 7.4 |
| White | 26 | 86.7 | 22 | 81.5 |
| Prefer not to say | 1 | 3.3 | 1 | 3.7 |
| >1 race | 1 | 3.3 | 1 | 3.7 |
| Ethnicity | ||||
| Hispanic/Latino | 2 | 6.7 | 1 | 3.7 |
| Not Hispanic/Latino | 23 | 76.7 | 25 | 92.6 |
| Prefer not to say | 5 | 16.7 | 1 | 3.7 |
| Sex | ||||
| F | 16 | 53.3 | 25 | 92.6 |
| M | 14 | 46.7 | 2 | 7.4 |
| Practice setting | ||||
| Medical | 21 | 70.0 | 22 | 81.5 |
| Surgical | 9 | 30.0 | 5 | 18.5 |
| Among physicians only, experience level | ||||
| Intern | 7 | 23.3 | ||
| Senior resident | 7 | 23.3 | ||
| Attending physician | 16 | 53.3 | ||
| Among attending physicians only, no. of years practicing | ||||
| <5 | 8 | 50.0 | ||
| 5<10 | 3 | 18.8 | ||
| 10 | 5 | 31.3 | ||
| Among nurses only, no. of years practicing | ||||
| <1 | 5 | 18.5 | ||
| 1<2 | 5 | 18.5 | ||
| 2<5 | 9 | 33.3 | ||
| 5<10 | 4 | 14.8 | ||
| 10<20 | 1 | 3.7 | ||
| 20 | 3 | 11.1 | ||
| Recruitment method | ||||
| Cared for patient with false‐positive score | 10 | 33.3 | 14 | 51.9 |
| Cared for patient with false‐negative score | 13 | 43.3 | 10 | 37.0 |
| Randomly selected to ensure data saturation for surgical settings | 7 | 23.3 | 3 | 11.1 |
Thematic Analysis
We provide the final themes, associated subthemes, and representative quotations below, with additional supporting quotations in Table 3. Because CHOP's MET is named the Critical Assessment Team, the term CAT appears in some quotations.
|
| Theme 1: The EWS facilitates patient safety by alerting nurses and physicians to concerning vital sign changes and prompting them to think critically about the possibility of deterioration. |
| I think [the EWS] helps us to be focused and gives us definite criteria to look for if there is an issue or change. It hopefully gives us a head start if there is going to be a change. They have a way of tracking it with the different color‐coding system they use Like, Oh geez, the heart rate is a little bit higher, that changes the color from yellow to orange, then I have to let the charge nurse know because that is a change from where they were earlier it kind of organizes it, I feel like, from where it was before. (medical nurse with 23 years of experience) |
| I think for myself, as a new clinician, one of our main goals is to help judge sick versus not sick. So to have a concrete system for thinking about that is helpful. (medical intern) |
| I think [the EWS] can help put things together for us. When you are really busy, you don't always get to focus on a lot of details. It is like another red flag to say you might have not realized that the child's heart rates went up further, but now here's some evidence that they did. (medical senior resident) |
| I think that the ability to use the EWS to watch the progression of a patient over time is really helpful. I've had a few patients that have gotten sicker from a respiratory standpoint. We can have multiple on the floor at the same time, and what's nice is that sometimes nurses have been able to come to me and we can really see through the score that we are at the point where a higher level of care is needed, whereas, in the old system, without that, we would have had to essentially wait for true clinical decompensation before the ICU would have been involved. I think that does help to deliver better care. (medical senior resident) |
| Theme 2: The EWS provides less‐experienced nurses with helpful age‐based reference ranges for vital signs that they use when caring for hospitalized children. |
| Sometimes you just write down the vitals and maybe you are not really thinking, and then when you go to do the EWS you looked at the score and it's really off in their age range. It kind of gives you 1 more step to recognize that there's a problem. (medical nurse with <1 year of experience) |
| I see the role [of the EWS] more broadly as a guide of where your patient should fall with their vital signs according to their age. I think that has been the biggest help for me, to be able to visualize, I have a 3‐year‐old; this is where they should be for their respiratory rate or heart rate. I think it has been good to be able to see that they are falling within the range appropriate for their age. (surgical nurse with 9 years of experience) |
| Theme 3: The EWS provides concrete evidence of clinical changes in the form of a score. This empowers nurses to overcome escalation barriers and communicate their concerns, helping them take action to rescue their deteriorating patients. |
| The times when I think the EWS helped me out the most are when there is a little bit of disagreement maybe the doctors and the nurses don't see eye‐to‐eye on how the patient is doing and so a higher score can sometimes be a way to say, I know there is nothing specifically going on, but if you take a look at the EWSs they are turning up very significantly. That might be enough to at least get a second opinion on that patient or to start some kind of change in their care. (medical nurse with <1 year of experience) |
| If we have the EWS to back us up, we can use that to say, Look, I don't feel comfortable with this patient, the EWS is 7 and I know you are saying they are okay, but I would feel more comfortable calling. Having that protocol in place I feel like it really gives us a voice it kind of gives us the, not that they don't trust us, but if they say, Oh, I think the child is fine but if I tell them Look, their EWS is an 8 or a 9, they are like, Oh, okay. It is not just you freaking out. There is an issue. (medical nurse with 3 years of experience) |
| I think that since it has been instituted nursing is coming to residents more than they did beforehand Can you reassess this patient? Do you think that we should call CAT? I think that it encourages residents to reevaluate patients at times when things are changing, and quicker than it did without the system in place. (medical senior resident) |
| I view [the EWS] as a tool, like if I have someone managing my patients when I am on service this would be a good tool because it mandates the nurses to notify and it also mandates the residents to understand what's going on. I think that was done on purpose. (medical attending physician in practice for 8 years) |
| Theme 4: In some patients, the EWS may not help with decision‐making. These include patients who are very stable and have a low likelihood of deterioration, and patients with abnormal physiology at baseline who consistently have very high EWSs. |
| The patient I took care of in this situation was a really sick kid to begin with, and it wasn't so much they were concerned about his EWS because, unless there was a really serious event, he would probably be staying on our floor anyway in some cases we just have some really sick kids whose scores may constantly be high all the time, so it wouldn't be helpful for the doctors or us to really bring it up. (medical nurse with 1 year of experience) |
Of note, after interviewing 9 surgeons, we found that they were not very familiar with the EWS and had little to say either positively or negatively about the system. For example, when asked what they thought about the EWS, a surgical intern said, I have no idea. I don't have enough experience with it. This is probably the first time that I ever had anybody telling me that the system is in place. Therefore, surgeons did not contribute meaningfully to the themes below.
Theme 1: The EWS facilitates patient safety by alerting nurses and physicians to concerning vital sign changes and prompting them to think critically about the possibility of deterioration
Nurses and physicians frequently discussed the direct role of the EWS in revealing changes consistent with early signs of deterioration. A medical nurse with <1 year of experience said, The higher the number gets, the more it sets off a red flag to you to kind of keep an eye on certain things. They are just as important as taking a set of vitals. When asked if the EWS had ever helped to identify deterioration, a medical attending physician in practice for 5 years said, I think sometimes we will blow off, so to speak, certain things, but when you look at the numbers and you see a big [EWS] change versus if you were [just] looking at individual vital signs, then yeah, I think it has made a difference.
Nurses and physicians also discussed the role of the EWSs in prompting them to closely examine individual vital signs and think critically about whether or not a patient is exhibiting early signs of deterioration. A surgical nurse with <1 year of experience said, Sometimes I feel like if you want things to be okay you can kind of write them off, but when you have to write [the EWS] down it kind of jogs you to think, maybe something is going on or maybe someone else needs to know about this. A medical senior resident commented, I think it has alerted me earlier to changes in vital signs that I might not necessarily have known. I think there are nurses that use it and they see that there is an elevation and they call you about it. Then it makes me go back and look through and see what their vital signs are and if it happens in timewe only go through and look at everyone's vital signs about twice a dayit can be very helpful.
Theme 2: The EWS provides less‐experienced nurses with helpful age‐based reference ranges for vital signs that they use when caring for hospitalized children
Although this theme did not appear among physicians, nurses frequently noted that they referred to the scoring sheet as a reference for vital signs appropriate for hospitalized children. A surgical nurse with <1 year of experience said, In nursing school, I mostly dealt with adults. So, to figure out the different ranges for normal vital signs, it helps to have it listed on paper so I can see, 'Oh, I didn't realize that this 10‐year‐old's heart rate is higher than it should be.' A medical nurse with 14 years of experience cited the benefits for less‐experienced nurses, noting, [The EWS helps] newer nurses who don't know the ranges. Where it's Oh, my kid's blood pressure is 81 [mm Hg] over something, then they can look at their age and say, Oh, that is completely normal for a 2‐month‐old. But [before the EWS] there was nowhere to look to see the ranges. Unless you were [Pediatric Advanced Life Support] certified where you would know that stuff, there was a lot of anxiety related to vital signs.
Theme 3: The EWS provides concrete evidence of clinical changes in the form of a score. This empowers nurses to overcome escalation barriers and communicate their concerns, helping them take action to rescue their deteriorating patients
Nurses and physicians often described the role of the EWS as a source of objective evidence that a patient was exhibiting a concerning change. They shared the ways in which the EWS was used to convey concerns, noting most commonly that this was used as a communication tool by nurses to raise their concerns with physicians. A medical nurse with 23 years of experience said, [With the EWS] you feel like you have concrete evidence. It's not just a feeling [that] they are not looking as well as they were it feels scientific. Building upon this concept, a medical attending physician in practice for 2 years said, The EWS is a number that certainly gives people a sense of Here's the data behind why I am really coming to you and insisting on this. It is not calling and saying, I just have a bad feeling, it is, I have a bad feeling and his EWS has gone to a 9.
Theme 4: In some patients, the EWS may not help with decision making. These include patients who are very stable and have a low likelihood of deterioration, patients with abnormal physiology at baseline who consistently have very high EWSs, and patients experiencing neurologic deterioration
Nurses and physicians described some patient scenarios in which the EWS may not help with decision making. Discussing postoperative patients, a surgical nurse with 1 year of experience said, I love doing [the EWS] for some patients. I think it makes perfect sense. Then there are some patients [for whom] I am doing it just to do it because they are only here for 24 hours. They are completely stable. They never had 1 vital sign that was even a little bit off. It's kind of like we are just filling it out to fill it out. Commenting on patients at the other end of the spectrum, a medical attending physician in practice for 2 years said, [The EWS] can be a useful composite tool, but for specialty patients with abnormal baselines, I think it is much more a question of making sure you pay attention to the specific changes, whether it is the EWS or heart rate or vital signs or pain score or any of those things. A final area in which nurses and physicians identified weaknesses in the EWS surrounded neurologic deterioration. Specifically, nurses and physicians described experiences when the EWS increased minimally or not at all in patients with sudden seizures or concerning mental status changes that warranted escalation of care.
DISCUSSION
This study is the first to analyze viewpoints on the mechanisms by which EWSs impact decision making among physicians and nurses who had recently experienced score failures. Our study, performed in a children's hospital, builds upon the findings of related studies performed in hospitals that care primarily for adults.[23, 24, 25, 26, 27, 28] Andrews and Waterman found that nurses consider the utility of EWSs to extend beyond detecting deterioration by providing quantifiable evidence, packaged in the form of a score that improves communication between nurses and physicians.[23] Mackintosh and colleagues found that a RRS that included an EWS helped to formalize the way nurses and physicians understand deterioration, enable them to overcome hierarchical boundaries through structured discussions, and empower them to call for help.[24] In a quasi‐experimental study, McDonnell and colleagues found that an EWS improved self‐assessed knowledge, skills, and confidence of nursing staff to detect and manage deteriorating patients.[25] In addition, we describe novel findings, including the use of EWS parameters as reference ranges independent of the score, and specific situations when the EWS fails to support decision making. The weaknesses we identified could be used to drive EWS optimization for low‐risk patients who are stable as well as higher‐risk patients with abnormal baseline physiology and those at risk of neurologic deterioration.
This study has several limitations. Although the interviewers were not involved in RRS operations, it is possible that social desirability bias influenced responses. Next, we identified a knowledge gap among surgeons, and they contributed minimally to our findings. This is most likely because (1) surgical patients deteriorate on the wards less often than medical patients in our hospital, so surgeons are rarely presented with EWSs; (2) surgeons spend less time on the wards compared with medical physicians; and (3) surgical residents rotate in short blocks interspersed with rotations at other hospitals and may be less engaged in hospital safety initiatives.
CONCLUSIONS
Although EWSs perform only marginally well as statistical tools to predict clinical deterioration, nurses and physicians who recently experienced score failures described substantial benefits in using them to help identify deteriorating patients and transcend barriers to escalation of care by serving as objective communication tools. Combining an EWS with a clinician's judgment may result in a system better equipped to respond to deterioration than previous EWS studies focused on their test characteristics alone suggest. Future research should seek to compare and prospectively evaluate the clinical effectiveness of EWSs in real‐world settings.
Acknowledgments
Disclosures: This project was funded by the Pennsylvania Health Research Formula Fund Award (awarded to Keren and Bonafide) and the CHOP Nursing Research and Evidence‐Based Practice Award (awarded to Roberts). The funders did not influence the study design; the collection, analysis, or interpretation of data; the writing of the report; or the decision to submit the article for publication. The authors have no other conflicts to report.
- Institute for Healthcare Improvement. Overview of the Institute for Healthcare Improvement Five Million Lives Campaign. Available at: http://www.ihi.org/offerings/Initiatives/PastStrategicInitiatives/5MillionLivesCampaign/Pages/default.aspx. Accessed June 21, 2012.
- UK National Institute for Health and Clinical Excellence (NICE). Acutely Ill Patients in Hospital: Recognition of and Response to Acute Illness in Adults in Hospital. Available at: http://publications.nice.org.uk/acutely‐ill‐patients‐in‐hospital‐cg50. Published July 2007. Accessed June 21, 2012.
- , , , et al. Findings of the first consensus conference on medical emergency teams. Crit Care Med. 2006; 34(9):2463–2478.
- . Detecting and managing deterioration in children. Paediatr Nurs. 2005;17(1):32–35.
- , , , , , . Sensitivity of the Pediatric Early Warning Score to identify patient deterioration. Pediatrics. 2010;125(4):e763–e769.
- , , . Promoting care for acutely ill children—development and evaluation of a paediatric early warning tool. Intensive Crit Care Nurs. 2006;22(2):73–81.
- , , , . Prospective cohort study to test the predictability of the Cardiff and Vale paediatric early warning system. Arch Dis Child. 2009;94(8):602–606.
- , , . The Pediatric Early Warning System Score: a severity of illness score to predict urgent medical need in hospitalized children. J Crit Care. 2006;21(3):271–278.
- , , . Development and initial validation of the Bedside Paediatric Early Warning System score. Crit Care. 2009;13(4):R135.
- , , , et al. Multi‐centre validation of the Bedside Paediatric Early Warning System Score: a severity of illness score to detect evolving critical illness in hospitalized children. Crit Care. 2011;15(4):R184.
- , . Evaluation of a paediatric early warning tool—claims unsubstantiated. Intensive Crit Care Nurs. 2006;22(6):315–316.
- , , , et al. Development of a pragmatic measure for evaluating and optimizing rapid response systems. Pediatrics. 2012;129(4):e874–e881.
- , , , et al. Implementation of a multicenter rapid response system in pediatric academic hospitals is effective. Pediatrics. 2011;128(1):72–78.
- , , , , . Rapid response teams: a systematic review and meta‐analysis. Arch Intern Med. 2010;170(1):18–26.
- , , , et al. Implementation of a medical emergency team in a large pediatric teaching hospital prevents respiratory and cardiopulmonary arrests outside the intensive care unit. Pediatr Crit Care Med. 2007;8(3):236–246.
- , , , et al. Transition from a traditional code team to a medical emergency team and categorization of cardiopulmonary arrests in a children's center. Arch Pediatr Adolesc Med. 2008;162(2):117–122.
- , , , et al. Effect of a rapid response team on hospital‐wide mortality and code rates outside the ICU in a children's hospital. JAMA. 2007;298(19):2267–2274.
- , . Reduction of hospital mortality and of preventable cardiac arrest and death on introduction of a pediatric medical emergency team. Pediatr Crit Care Med. 2009;10(3):306–312.
- , , , et al. Implementation and impact of a rapid response team in a children's hospital. Jt Comm J Qual Patient Saf. 2007;33(7):418–425.
- , , . How many interviews are enough? An experiment with data saturation and variability. Field Methods. 2006;18(1):59–82.
- . Different approaches in grounded theory. In: Bryant A, Charmaz K, eds. The Sage Handbook of Grounded Theory. Los Angeles, CA: Sage; 2007:191–213.
- , . The Discovery of Grounded Theory: Strategies for Qualitative Research. New York, NY: Aldine De Gruyter; 1967.
- , . Packaging: a grounded theory of how to report physiological deterioration effectively. J Adv Nurs. 2005;52(5):473–481.
- , , . Understanding how rapid response systems may improve safety for the acutely ill patient: learning from the frontline. BMJ Qual Saf. 2012;21(2):135–144.
- , , , , , . A before and after study assessing the impact of a new model for recognizing and responding to early signs of deterioration in an acute hospital. J Adv Nurs. 2013;69(1):41–52.
- , . Overcoming gendered and professional hierarchies in order to facilitate escalation of care in emergency situations: the role of standardised communication protocols. Soc Sci Med. 2010;71(9):1683–1686.
- , , , , . Defining impact of a rapid response team: qualitative study with nurses, physicians and hospital administrators. BMJ Qual Saf. 2012;21(5):391–398.
- , , , , . Leading successful rapid response teams: a multisite implementation evaluation. J Nurs Adm. 2009;39(4):176–181.
Thousands of hospitals have recently implemented rapid response systems (RRSs), attempting to reduce mortality outside of intensive care units (ICUs).[1, 2] These systems have 2 clinical components, a response (efferent) arm and an identification (afferent) arm.[3] The response arm is usually composed of a medical emergency team (MET) that responds to calls for urgent assistance. The identification arm includes tools to help clinicians recognize patients who require assistance from the MET. In many hospitals, the identification arm includes an early warning score (EWS). In pediatric patients, EWSs assign point values to vital signs that fall outside of age‐based ranges, among other clinical observations. They then generate a total score intended to help clinicians identify patients exhibiting early signs of deterioration.[4, 5, 6, 7, 8, 9, 10, 11]
When experimentally applied to vital sign datasets, the test characteristics of pediatric EWSs in detecting clinical deterioration are highly variable across studies, with major tradeoffs between sensitivity, specificity, and predictive values that differ by outcome, score, and cut‐point (Table 1). This reflects the difficulty of identifying deteriorating patients using only objective measures. However, in real‐world settings, EWSs are used by clinicians in conjunction with their clinical judgment. We hypothesized that EWSs have benefits that extend beyond their ability to predict deterioration, and thus have value not demonstrated by test characteristics alone. In order to further explore this issue, we aimed to qualitatively evaluate mechanisms beyond their statistical ability to predict deterioration by which physicians and nurses use EWSs to support their decision making.
| Score and Citation | Outcome Measure | Score Cut‐point | Sens | Spec | PPV | NPV |
|---|---|---|---|---|---|---|
| ||||||
| Brighton Paediatric Early Warning Score[5] | RRT or code blue call | 4 | 86% | NR | NR | NR |
| Bristol Paediatric Early Warning Tool[6, 11] | Escalation to higher level of care | 1 | ER | ER | 63% | NR |
| Cardiff and Vale Paediatric Early Warning System[7] | Respiratory or cardiac arrest, HDU/ICU admission, or death | 1 | 89% | 64% | 2% | >99% |
| Bedside Paediatric Early Warning System score, original version[8] | Code blue call | 5 | 78% | 95% | 4% | NR |
| Bedside Paediatric Early Warning System score, simplified version[9] | Urgent ICU admission without a code blue call | 8 | 82% | 93% | NR | NR |
| Bedside Paediatric Early Warning System score, simplified version[10] | Urgent ICU admission or code blue call | 7 | 64% | 91% | 9% | NR |
METHODS
Overview
As 1 component of a larger study, we conducted semistructured interviews with nurses and physicians at The Children's Hospital of Philadelphia (CHOP) between May and October 2011. In separate subprojects using the same participants, the larger study also aimed to identify residual barriers to calling for urgent assistance and assess the role of families in the recognition of deterioration and MET activation.
Setting
The Children's Hospital of Philadelphia is an urban, tertiary‐care pediatric hospital with 504 beds. Surgical patients hospitalized outside of ICUs are cared for by surgeons and surgical nurses without pediatrician co‐management. Implementation of a RRS was prompted by serious safety events in which clinical deterioration was either not recognized or was recognized and not escalated. Prior to RRS implementation, a code blue team could be activated for patients in immediate need of resuscitation, or, for less‐urgent needs, a pediatric ICU fellow could be paged by physicians for informal consults.
A multidisciplinary team developed and pilot‐tested the RRS, then implemented it hospital‐wide in February 2010. Representing an aspect of a multipronged approach to improve safety culture, the RRS consisted of (1) an EWS based upon Parshuram's Bedside Paediatric Early Warning System,[8, 9, 10] calculated by hand on a paper form (see online supplementary content) at the same frequency as vital signs (usually every 4 hours), and (2) a 30‐minute response MET available for activation by any clinician for any concern, 24 hours per day, 7 days per week. Escalation guidelines included a prompt to activate the MET for a score that increased to the red zone (9). For concerns that could not wait 30 minutes, any hospital employee could activate the immediate‐response code blue team.
Utilization of the RRS at CHOP is high, with 23 calls to the MET per day and a combined MET/code‐blue team call rate of 27.8 per 1000 admissions.[12] Previously reported pediatric call rates range from 2.8 to 44.0, with a median of 9.6 per 1000 admissions across 6 studies.[13, 14, 15, 16, 17, 18, 19] Since implementation, there has been a statistically significant net reduction in critical deterioration events (unpublished data).
Participants
We recruited nurses and physicians who had recently cared for children age 18 years on general medical or surgical wards with false‐negative or false‐positive EWSs (instances when the score failed to predict deterioration). Recruitment ceased when we reached thematic data saturation (a qualitative research term for the point at which no new themes emerge with additional interviews).[20]
Data Collection
Through a detailed review of the relevant literature and consultation with experts, we developed a semistructured interview guide (see online supplementary content) to elicit nurses' and physicians' viewpoints regarding the mechanisms by which they use EWSs to support their decision making.
Experienced qualitative research scientists (F.K.B. and J.H.H.) trained 2 study interviewers (B.P. and K.M.T.). In order to minimize social‐desirability bias, the interviewers were not clinicians and were not involved in RRS operations. Each interview was recorded, professionally transcribed, and imported into NVivo 8.0 software for analysis (QSR International, Melbourne, Australia).
Data Analysis
We coded the interviews inductively, without using a predetermined set of themes. This approach is known as grounded theory methodology.[21] Two team members coded each interview independently. They then reviewed their coding together and discussed discrepancies until reaching consensus. In weekly meetings while the interviews were ongoing, we compared newly collected data with themes that had previously emerged in order to guide further thematic development and refinement (the constant comparative method).[22] After all of the interviews were completed and consensus had been reached for each individual interview, the study team convened a series of additional meetings to further refine and finalize the themes.
Human Subjects
The CHOP Institutional Review Board approved this study. All participants provided written informed consent.
RESULTS
Participants
We recruited 27 nurses and 30 physicians before reaching thematic data saturation. Because surgical patients are underrepresented relative to medical patients among the population with false‐positive and false‐negative scores in our hospital, this included 3 randomly selected surgical nurses and 7 randomly selected surgical physicians recruited to ensure thematic data saturation for surgical settings. Characteristics of the participants are displayed in Table 2.
| Physicians (n=30) | Nurses (n=27) | |||
|---|---|---|---|---|
| ||||
| N | % | N | % | |
| Race | ||||
| Asian | 2 | 6.7 | 1 | 3.7 |
| Black | 0 | 0.0 | 2 | 7.4 |
| White | 26 | 86.7 | 22 | 81.5 |
| Prefer not to say | 1 | 3.3 | 1 | 3.7 |
| >1 race | 1 | 3.3 | 1 | 3.7 |
| Ethnicity | ||||
| Hispanic/Latino | 2 | 6.7 | 1 | 3.7 |
| Not Hispanic/Latino | 23 | 76.7 | 25 | 92.6 |
| Prefer not to say | 5 | 16.7 | 1 | 3.7 |
| Sex | ||||
| F | 16 | 53.3 | 25 | 92.6 |
| M | 14 | 46.7 | 2 | 7.4 |
| Practice setting | ||||
| Medical | 21 | 70.0 | 22 | 81.5 |
| Surgical | 9 | 30.0 | 5 | 18.5 |
| Among physicians only, experience level | ||||
| Intern | 7 | 23.3 | ||
| Senior resident | 7 | 23.3 | ||
| Attending physician | 16 | 53.3 | ||
| Among attending physicians only, no. of years practicing | ||||
| <5 | 8 | 50.0 | ||
| 5<10 | 3 | 18.8 | ||
| 10 | 5 | 31.3 | ||
| Among nurses only, no. of years practicing | ||||
| <1 | 5 | 18.5 | ||
| 1<2 | 5 | 18.5 | ||
| 2<5 | 9 | 33.3 | ||
| 5<10 | 4 | 14.8 | ||
| 10<20 | 1 | 3.7 | ||
| 20 | 3 | 11.1 | ||
| Recruitment method | ||||
| Cared for patient with false‐positive score | 10 | 33.3 | 14 | 51.9 |
| Cared for patient with false‐negative score | 13 | 43.3 | 10 | 37.0 |
| Randomly selected to ensure data saturation for surgical settings | 7 | 23.3 | 3 | 11.1 |
Thematic Analysis
We provide the final themes, associated subthemes, and representative quotations below, with additional supporting quotations in Table 3. Because CHOP's MET is named the Critical Assessment Team, the term CAT appears in some quotations.
|
| Theme 1: The EWS facilitates patient safety by alerting nurses and physicians to concerning vital sign changes and prompting them to think critically about the possibility of deterioration. |
| I think [the EWS] helps us to be focused and gives us definite criteria to look for if there is an issue or change. It hopefully gives us a head start if there is going to be a change. They have a way of tracking it with the different color‐coding system they use Like, Oh geez, the heart rate is a little bit higher, that changes the color from yellow to orange, then I have to let the charge nurse know because that is a change from where they were earlier it kind of organizes it, I feel like, from where it was before. (medical nurse with 23 years of experience) |
| I think for myself, as a new clinician, one of our main goals is to help judge sick versus not sick. So to have a concrete system for thinking about that is helpful. (medical intern) |
| I think [the EWS] can help put things together for us. When you are really busy, you don't always get to focus on a lot of details. It is like another red flag to say you might have not realized that the child's heart rates went up further, but now here's some evidence that they did. (medical senior resident) |
| I think that the ability to use the EWS to watch the progression of a patient over time is really helpful. I've had a few patients that have gotten sicker from a respiratory standpoint. We can have multiple on the floor at the same time, and what's nice is that sometimes nurses have been able to come to me and we can really see through the score that we are at the point where a higher level of care is needed, whereas, in the old system, without that, we would have had to essentially wait for true clinical decompensation before the ICU would have been involved. I think that does help to deliver better care. (medical senior resident) |
| Theme 2: The EWS provides less‐experienced nurses with helpful age‐based reference ranges for vital signs that they use when caring for hospitalized children. |
| Sometimes you just write down the vitals and maybe you are not really thinking, and then when you go to do the EWS you looked at the score and it's really off in their age range. It kind of gives you 1 more step to recognize that there's a problem. (medical nurse with <1 year of experience) |
| I see the role [of the EWS] more broadly as a guide of where your patient should fall with their vital signs according to their age. I think that has been the biggest help for me, to be able to visualize, I have a 3‐year‐old; this is where they should be for their respiratory rate or heart rate. I think it has been good to be able to see that they are falling within the range appropriate for their age. (surgical nurse with 9 years of experience) |
| Theme 3: The EWS provides concrete evidence of clinical changes in the form of a score. This empowers nurses to overcome escalation barriers and communicate their concerns, helping them take action to rescue their deteriorating patients. |
| The times when I think the EWS helped me out the most are when there is a little bit of disagreement maybe the doctors and the nurses don't see eye‐to‐eye on how the patient is doing and so a higher score can sometimes be a way to say, I know there is nothing specifically going on, but if you take a look at the EWSs they are turning up very significantly. That might be enough to at least get a second opinion on that patient or to start some kind of change in their care. (medical nurse with <1 year of experience) |
| If we have the EWS to back us up, we can use that to say, Look, I don't feel comfortable with this patient, the EWS is 7 and I know you are saying they are okay, but I would feel more comfortable calling. Having that protocol in place I feel like it really gives us a voice it kind of gives us the, not that they don't trust us, but if they say, Oh, I think the child is fine but if I tell them Look, their EWS is an 8 or a 9, they are like, Oh, okay. It is not just you freaking out. There is an issue. (medical nurse with 3 years of experience) |
| I think that since it has been instituted nursing is coming to residents more than they did beforehand Can you reassess this patient? Do you think that we should call CAT? I think that it encourages residents to reevaluate patients at times when things are changing, and quicker than it did without the system in place. (medical senior resident) |
| I view [the EWS] as a tool, like if I have someone managing my patients when I am on service this would be a good tool because it mandates the nurses to notify and it also mandates the residents to understand what's going on. I think that was done on purpose. (medical attending physician in practice for 8 years) |
| Theme 4: In some patients, the EWS may not help with decision‐making. These include patients who are very stable and have a low likelihood of deterioration, and patients with abnormal physiology at baseline who consistently have very high EWSs. |
| The patient I took care of in this situation was a really sick kid to begin with, and it wasn't so much they were concerned about his EWS because, unless there was a really serious event, he would probably be staying on our floor anyway in some cases we just have some really sick kids whose scores may constantly be high all the time, so it wouldn't be helpful for the doctors or us to really bring it up. (medical nurse with 1 year of experience) |
Of note, after interviewing 9 surgeons, we found that they were not very familiar with the EWS and had little to say either positively or negatively about the system. For example, when asked what they thought about the EWS, a surgical intern said, I have no idea. I don't have enough experience with it. This is probably the first time that I ever had anybody telling me that the system is in place. Therefore, surgeons did not contribute meaningfully to the themes below.
Theme 1: The EWS facilitates patient safety by alerting nurses and physicians to concerning vital sign changes and prompting them to think critically about the possibility of deterioration
Nurses and physicians frequently discussed the direct role of the EWS in revealing changes consistent with early signs of deterioration. A medical nurse with <1 year of experience said, The higher the number gets, the more it sets off a red flag to you to kind of keep an eye on certain things. They are just as important as taking a set of vitals. When asked if the EWS had ever helped to identify deterioration, a medical attending physician in practice for 5 years said, I think sometimes we will blow off, so to speak, certain things, but when you look at the numbers and you see a big [EWS] change versus if you were [just] looking at individual vital signs, then yeah, I think it has made a difference.
Nurses and physicians also discussed the role of the EWSs in prompting them to closely examine individual vital signs and think critically about whether or not a patient is exhibiting early signs of deterioration. A surgical nurse with <1 year of experience said, Sometimes I feel like if you want things to be okay you can kind of write them off, but when you have to write [the EWS] down it kind of jogs you to think, maybe something is going on or maybe someone else needs to know about this. A medical senior resident commented, I think it has alerted me earlier to changes in vital signs that I might not necessarily have known. I think there are nurses that use it and they see that there is an elevation and they call you about it. Then it makes me go back and look through and see what their vital signs are and if it happens in timewe only go through and look at everyone's vital signs about twice a dayit can be very helpful.
Theme 2: The EWS provides less‐experienced nurses with helpful age‐based reference ranges for vital signs that they use when caring for hospitalized children
Although this theme did not appear among physicians, nurses frequently noted that they referred to the scoring sheet as a reference for vital signs appropriate for hospitalized children. A surgical nurse with <1 year of experience said, In nursing school, I mostly dealt with adults. So, to figure out the different ranges for normal vital signs, it helps to have it listed on paper so I can see, 'Oh, I didn't realize that this 10‐year‐old's heart rate is higher than it should be.' A medical nurse with 14 years of experience cited the benefits for less‐experienced nurses, noting, [The EWS helps] newer nurses who don't know the ranges. Where it's Oh, my kid's blood pressure is 81 [mm Hg] over something, then they can look at their age and say, Oh, that is completely normal for a 2‐month‐old. But [before the EWS] there was nowhere to look to see the ranges. Unless you were [Pediatric Advanced Life Support] certified where you would know that stuff, there was a lot of anxiety related to vital signs.
Theme 3: The EWS provides concrete evidence of clinical changes in the form of a score. This empowers nurses to overcome escalation barriers and communicate their concerns, helping them take action to rescue their deteriorating patients
Nurses and physicians often described the role of the EWS as a source of objective evidence that a patient was exhibiting a concerning change. They shared the ways in which the EWS was used to convey concerns, noting most commonly that this was used as a communication tool by nurses to raise their concerns with physicians. A medical nurse with 23 years of experience said, [With the EWS] you feel like you have concrete evidence. It's not just a feeling [that] they are not looking as well as they were it feels scientific. Building upon this concept, a medical attending physician in practice for 2 years said, The EWS is a number that certainly gives people a sense of Here's the data behind why I am really coming to you and insisting on this. It is not calling and saying, I just have a bad feeling, it is, I have a bad feeling and his EWS has gone to a 9.
Theme 4: In some patients, the EWS may not help with decision making. These include patients who are very stable and have a low likelihood of deterioration, patients with abnormal physiology at baseline who consistently have very high EWSs, and patients experiencing neurologic deterioration
Nurses and physicians described some patient scenarios in which the EWS may not help with decision making. Discussing postoperative patients, a surgical nurse with 1 year of experience said, I love doing [the EWS] for some patients. I think it makes perfect sense. Then there are some patients [for whom] I am doing it just to do it because they are only here for 24 hours. They are completely stable. They never had 1 vital sign that was even a little bit off. It's kind of like we are just filling it out to fill it out. Commenting on patients at the other end of the spectrum, a medical attending physician in practice for 2 years said, [The EWS] can be a useful composite tool, but for specialty patients with abnormal baselines, I think it is much more a question of making sure you pay attention to the specific changes, whether it is the EWS or heart rate or vital signs or pain score or any of those things. A final area in which nurses and physicians identified weaknesses in the EWS surrounded neurologic deterioration. Specifically, nurses and physicians described experiences when the EWS increased minimally or not at all in patients with sudden seizures or concerning mental status changes that warranted escalation of care.
DISCUSSION
This study is the first to analyze viewpoints on the mechanisms by which EWSs impact decision making among physicians and nurses who had recently experienced score failures. Our study, performed in a children's hospital, builds upon the findings of related studies performed in hospitals that care primarily for adults.[23, 24, 25, 26, 27, 28] Andrews and Waterman found that nurses consider the utility of EWSs to extend beyond detecting deterioration by providing quantifiable evidence, packaged in the form of a score that improves communication between nurses and physicians.[23] Mackintosh and colleagues found that a RRS that included an EWS helped to formalize the way nurses and physicians understand deterioration, enable them to overcome hierarchical boundaries through structured discussions, and empower them to call for help.[24] In a quasi‐experimental study, McDonnell and colleagues found that an EWS improved self‐assessed knowledge, skills, and confidence of nursing staff to detect and manage deteriorating patients.[25] In addition, we describe novel findings, including the use of EWS parameters as reference ranges independent of the score, and specific situations when the EWS fails to support decision making. The weaknesses we identified could be used to drive EWS optimization for low‐risk patients who are stable as well as higher‐risk patients with abnormal baseline physiology and those at risk of neurologic deterioration.
This study has several limitations. Although the interviewers were not involved in RRS operations, it is possible that social desirability bias influenced responses. Next, we identified a knowledge gap among surgeons, and they contributed minimally to our findings. This is most likely because (1) surgical patients deteriorate on the wards less often than medical patients in our hospital, so surgeons are rarely presented with EWSs; (2) surgeons spend less time on the wards compared with medical physicians; and (3) surgical residents rotate in short blocks interspersed with rotations at other hospitals and may be less engaged in hospital safety initiatives.
CONCLUSIONS
Although EWSs perform only marginally well as statistical tools to predict clinical deterioration, nurses and physicians who recently experienced score failures described substantial benefits in using them to help identify deteriorating patients and transcend barriers to escalation of care by serving as objective communication tools. Combining an EWS with a clinician's judgment may result in a system better equipped to respond to deterioration than previous EWS studies focused on their test characteristics alone suggest. Future research should seek to compare and prospectively evaluate the clinical effectiveness of EWSs in real‐world settings.
Acknowledgments
Disclosures: This project was funded by the Pennsylvania Health Research Formula Fund Award (awarded to Keren and Bonafide) and the CHOP Nursing Research and Evidence‐Based Practice Award (awarded to Roberts). The funders did not influence the study design; the collection, analysis, or interpretation of data; the writing of the report; or the decision to submit the article for publication. The authors have no other conflicts to report.
- Institute for Healthcare Improvement. Overview of the Institute for Healthcare Improvement Five Million Lives Campaign. Available at: http://www.ihi.org/offerings/Initiatives/PastStrategicInitiatives/5MillionLivesCampaign/Pages/default.aspx. Accessed June 21, 2012.
- UK National Institute for Health and Clinical Excellence (NICE). Acutely Ill Patients in Hospital: Recognition of and Response to Acute Illness in Adults in Hospital. Available at: http://publications.nice.org.uk/acutely‐ill‐patients‐in‐hospital‐cg50. Published July 2007. Accessed June 21, 2012.
- , , , et al. Findings of the first consensus conference on medical emergency teams. Crit Care Med. 2006; 34(9):2463–2478.
- . Detecting and managing deterioration in children. Paediatr Nurs. 2005;17(1):32–35.
- , , , , , . Sensitivity of the Pediatric Early Warning Score to identify patient deterioration. Pediatrics. 2010;125(4):e763–e769.
- , , . Promoting care for acutely ill children—development and evaluation of a paediatric early warning tool. Intensive Crit Care Nurs. 2006;22(2):73–81.
- , , , . Prospective cohort study to test the predictability of the Cardiff and Vale paediatric early warning system. Arch Dis Child. 2009;94(8):602–606.
- , , . The Pediatric Early Warning System Score: a severity of illness score to predict urgent medical need in hospitalized children. J Crit Care. 2006;21(3):271–278.
- , , . Development and initial validation of the Bedside Paediatric Early Warning System score. Crit Care. 2009;13(4):R135.
- , , , et al. Multi‐centre validation of the Bedside Paediatric Early Warning System Score: a severity of illness score to detect evolving critical illness in hospitalized children. Crit Care. 2011;15(4):R184.
- , . Evaluation of a paediatric early warning tool—claims unsubstantiated. Intensive Crit Care Nurs. 2006;22(6):315–316.
- , , , et al. Development of a pragmatic measure for evaluating and optimizing rapid response systems. Pediatrics. 2012;129(4):e874–e881.
- , , , et al. Implementation of a multicenter rapid response system in pediatric academic hospitals is effective. Pediatrics. 2011;128(1):72–78.
- , , , , . Rapid response teams: a systematic review and meta‐analysis. Arch Intern Med. 2010;170(1):18–26.
- , , , et al. Implementation of a medical emergency team in a large pediatric teaching hospital prevents respiratory and cardiopulmonary arrests outside the intensive care unit. Pediatr Crit Care Med. 2007;8(3):236–246.
- , , , et al. Transition from a traditional code team to a medical emergency team and categorization of cardiopulmonary arrests in a children's center. Arch Pediatr Adolesc Med. 2008;162(2):117–122.
- , , , et al. Effect of a rapid response team on hospital‐wide mortality and code rates outside the ICU in a children's hospital. JAMA. 2007;298(19):2267–2274.
- , . Reduction of hospital mortality and of preventable cardiac arrest and death on introduction of a pediatric medical emergency team. Pediatr Crit Care Med. 2009;10(3):306–312.
- , , , et al. Implementation and impact of a rapid response team in a children's hospital. Jt Comm J Qual Patient Saf. 2007;33(7):418–425.
- , , . How many interviews are enough? An experiment with data saturation and variability. Field Methods. 2006;18(1):59–82.
- . Different approaches in grounded theory. In: Bryant A, Charmaz K, eds. The Sage Handbook of Grounded Theory. Los Angeles, CA: Sage; 2007:191–213.
- , . The Discovery of Grounded Theory: Strategies for Qualitative Research. New York, NY: Aldine De Gruyter; 1967.
- , . Packaging: a grounded theory of how to report physiological deterioration effectively. J Adv Nurs. 2005;52(5):473–481.
- , , . Understanding how rapid response systems may improve safety for the acutely ill patient: learning from the frontline. BMJ Qual Saf. 2012;21(2):135–144.
- , , , , , . A before and after study assessing the impact of a new model for recognizing and responding to early signs of deterioration in an acute hospital. J Adv Nurs. 2013;69(1):41–52.
- , . Overcoming gendered and professional hierarchies in order to facilitate escalation of care in emergency situations: the role of standardised communication protocols. Soc Sci Med. 2010;71(9):1683–1686.
- , , , , . Defining impact of a rapid response team: qualitative study with nurses, physicians and hospital administrators. BMJ Qual Saf. 2012;21(5):391–398.
- , , , , . Leading successful rapid response teams: a multisite implementation evaluation. J Nurs Adm. 2009;39(4):176–181.
Copyright © 2013 Society of Hospital Medicine
Pediatric Deterioration Risk Score
Thousands of hospitals have implemented rapid response systems in recent years in attempts to reduce mortality outside the intensive care unit (ICU).1 These systems have 2 components, a response arm and an identification arm. The response arm is usually comprised of a multidisciplinary critical care team that responds to calls for urgent assistance outside the ICU; this team is often called a rapid response team or a medical emergency team. The identification arm comes in 2 forms, predictive and detective. Predictive tools estimate a patient's risk of deterioration over time based on factors that are not rapidly changing, such as elements of the patient's history. In contrast, detective tools include highly time‐varying signs of active deterioration, such as vital sign abnormalities.2 To date, most pediatric studies have focused on developing detective tools, including several early warning scores.38
In this study, we sought to identify the characteristics that increase the probability that a hospitalized child will deteriorate, and combine these characteristics into a predictive score. Tools like this may be helpful in identifying and triaging the subset of high‐risk children who should be intensively monitored for early signs of deterioration at the time of admission, as well as in identifying very low‐risk children who, in the absence of other clinical concerns, may be monitored less intensively.
METHODS
Detailed methods, including the inclusion/exclusion criteria, the matching procedures, and a full description of the statistical analysis are provided as an appendix (see Supporting Online Appendix: Supplement to Methods Section in the online version of this article). An abbreviated version follows.
Design
We performed a case‐control study among children, younger than 18 years old, hospitalized for >24 hours between January 1, 2005 and December 31, 2008. The case group consisted of children who experienced clinical deterioration, a composite outcome defined as cardiopulmonary arrest (CPA), acute respiratory compromise (ARC), or urgent ICU transfer, while on a non‐ICU unit. ICU transfers were considered urgent if they included at least one of the following outcomes in the 12 hours after transfer: death, CPA, intubation, initiation of noninvasive ventilation, or administration of a vasoactive medication infusion used for the treatment of shock. The control group consisted of a random sample of patients matched 3:1 to cases if they met the criteria of being on a non‐ICU unit at the same time as their matched case.
Variables and Measurements
We collected data on demographics, complex chronic conditions (CCCs), other patient characteristics, and laboratory studies. CCCs were specific diagnoses divided into the following 9 categories according to an established framework: neuromuscular, cardiovascular, respiratory, renal, gastrointestinal, hematologic/emmmunologic, metabolic, malignancy, and genetic/congenital defects.9 Other patient characteristics evaluated included age, weight‐for‐age, gestational age, history of transplant, time from hospital admission to event, recent ICU stays, administration of total parenteral nutrition, use of a patient‐controlled analgesia pump, and presence of medical devices including central venous lines and enteral tubes (naso‐gastric, gastrostomy, or jejunostomy).
Laboratory studies evaluated included hemoglobin value, white blood cell count, and blood culture drawn in the preceding 72 hours. We included these laboratory studies in this predictive score because we hypothesized that they represented factors that increased a child's risk of deterioration over time, as opposed to signs of acute deterioration that would be more appropriate for a detective score.
Statistical Analysis
We used conditional logistic regression for the bivariable and multivariable analyses to account for the matching. We derived the predictive score using an established method10 in which the regression coefficients for each covariate were divided by the smallest coefficient, and then rounded to the nearest integer, to establish each variable's sub‐score. We grouped the total scores into very low, low, intermediate, and high‐risk groups, calculated overall stratum‐specific likelihood ratios (SSLRs), and estimated stratum‐specific probabilities of deterioration for each group.
RESULTS
Patient Characteristics
We identified 12 CPAs, 41 ARCs, and 699 urgent ICU transfers during the study period. A total of 141 cases met our strict criteria for inclusion (see Figure in Supporting Online Appendix: Supplement to Methods Section in the online version of this article) among approximately 96,000 admissions during the study period, making the baseline incidence of events (pre‐test probability) approximately 0.15%. The case and control groups were similar in age, sex, and family‐reported race/ethnicity. Cases had been hospitalized longer than controls at the time of their event, were less likely to have been on a surgical service, and were less likely to survive to hospital discharge (Table 1). There was a high prevalence of CCCs among both cases and controls; 78% of cases and 52% of controls had at least 1 CCC.
| Cases (n = 141) | Controls (n = 423) | ||
|---|---|---|---|
| n (%) | n (%) | P Value | |
| |||
| Type of event | |||
| Cardiopulmonary arrest | 4 (3) | 0 | NA |
| Acute respiratory compromise | 29 (20) | 0 | NA |
| Urgent ICU transfer | 108 (77) | 0 | NA |
| Demographics | |||
| Age | 0.34 | ||
| 0‐<6 mo | 17 (12) | 62 (15) | |
| 6‐<12 mo | 22 (16) | 41 (10) | |
| 1‐<4 yr | 34 (24) | 97 (23) | |
| 4‐<10 yr | 26 (18) | 78 (18) | |
| 10‐<18 yr | 42 (30) | 145 (34) | |
| Sex | 0.70 | ||
| Female | 60 (43) | 188 (44) | |
| Male | 81 (57) | 235 (56) | |
| Race | 0.40 | ||
| White | 69 (49) | 189 (45) | |
| Black/African‐American | 49 (35) | 163 (38) | |
| Asian/Pacific Islander | 0 (0) | 7 (2) | |
| Other | 23 (16) | 62 (15) | |
| Not reported | 0 (0) | 2 (<1) | |
| Ethnicity | 0.53 | ||
| Non‐Hispanic | 127 (90) | 388 (92) | |
| Hispanic | 14 (10) | 33 (8) | |
| Unknown/not reported | 0 (0) | 2 (<1) | |
| Hospitalization | |||
| Length of stay in days, median (interquartile range) | 7.8 (2.6‐18.2) | 3.9 (1.9‐11.2) | <0.001 |
| Surgical service | 4 (3) | 67 (16) | <0.001 |
| Survived to hospital discharge | 107 (76) | 421 (99.5) | <0.001 |
Unadjusted (Bivariable) Analysis
Results of bivariable analysis are shown in Table 2.
| Variable | Cases n (%) | Controls n (%) | OR* | 95% CI | P Value |
|---|---|---|---|---|---|
| |||||
| Complex chronic conditions categories | |||||
| Congenital/genetic | 19 (13) | 21 (5) | 3.0 | 1.6‐5.8 | 0.001 |
| Neuromuscular | 31 (22) | 48 (11) | 2.2 | 1.3‐3.7 | 0.002 |
| Respiratory | 18 (13) | 27 (6) | 2.0 | 1.1‐3.7 | 0.02 |
| Cardiovascular | 15 (10) | 24 (6) | 2.0 | 1.0‐3.9 | 0.05 |
| Metabolic | 5 (3) | 6 (1) | 2.5 | 0.8‐8.2 | 0.13 |
| Gastrointestinal | 10 (7) | 24 (6) | 1.3 | 0.6‐2.7 | 0.54 |
| Renal | 3 (2) | 8 (2) | 1.1 | 0.3‐4.2 | 0.86 |
| Hematology/emmmunodeficiency | 6 (4) | 19 (4) | 0.9 | 0.4‐2.4 | 0.91 |
| Specific conditions | |||||
| Mental retardation | 21 (15) | 25 (6) | 2.7 | 1.5‐4.9 | 0.001 |
| Malignancy | 49 (35) | 90 (21) | 1.9 | 1.3‐2.8 | 0.002 |
| Epilepsy | 22 (15) | 30 (7) | 2.4 | 1.3‐4.3 | 0.004 |
| Cardiac malformations | 14 (10) | 19 (4) | 2.2 | 1.1‐4.4 | 0.02 |
| Chronic respiratory disease arising in the perinatal period | 11 (8) | 15 (4) | 2.2 | 1.0‐4.8 | 0.05 |
| Cerebral palsy | 7 (5) | 13 (3) | 1.7 | 0.6‐4.2 | 0.30 |
| Cystic fibrosis | 1 (1) | 9 (2) | 0.3 | <0.1‐2.6 | 0.30 |
| Other patient characteristics | |||||
| Time from hospital admission to event 7 days | 74 (52) | 146 (35) | 2.1 | 1.4‐3.1 | <0.001 |
| History of any transplant | 27 (19) | 17 (4) | 5.7 | 2.9‐11.1 | <0.001 |
| Enteral tube | 65 (46) | 102 (24) | 2.6 | 1.8‐3.9 | <0.001 |
| Hospitalized in an intensive care unit during the same admission | 43 (31) | 77 (18) | 2.0 | 1.3‐3.1 | 0.002 |
| Administration of TPN in preceding 24 hr | 26 (18) | 36 (9) | 2.3 | 1.4‐3.9 | 0.002 |
| Administration of an opioid via a patient‐controlled analgesia pump in the preceding 24 hr | 14 (9) | 14 (3) | 3.6 | 1.6‐8.3 | 0.002 |
| Weight‐for‐age <5th percentile | 49 (35) | 94 (22) | 1.9 | 1.2‐2.9 | 0.003 |
| Central venous line | 55 (39) | 113 (27) | 1.8 | 1.2‐2.7 | 0.005 |
| Age <1 yr | 39 (28) | 103 (24) | 1.2 | 0.8‐1.9 | 0.42 |
| Gestational age <37 wk or documentation of prematurity | 21 (15) | 60 (14) | 1.1 | 0.6‐1.8 | 0.84 |
| Laboratory studies | |||||
| Hemoglobin in preceding 72 hr | |||||
| Not tested | 28 (20) | 190 (45) | 1.0 | [reference] | |
| 10 g/dL | 42 (30) | 144 (34) | 2.0 | 1.2‐3.5 | 0.01 |
| <10 g/dL | 71 (50) | 89 (21) | 5.6 | 3.3‐9.5 | <0.001 |
| White blood cell count in preceding 72 hr | |||||
| Not tested | 28 (20) | 190 (45) | 1.0 | [reference] | |
| 5000 to <15,000/l | 45 (32) | 131 (31) | 2.4 | 1.4‐4.1 | 0.001 |
| 15,000/l | 19 (13) | 25 (6) | 5.7 | 2.7‐12.0 | <0.001 |
| <5000/l | 49 (35) | 77 (18) | 4.5 | 2.6‐7.8 | <0.001 |
| Blood culture drawn in preceding 72 hr | 78 (55) | 85 (20) | 5.2 | 3.3‐8.1 | <0.001 |
Adjusted (Multivariable) Analysis
The multivariable conditional logistic regression model included 7 independent risk factors for deterioration (Table 3): age <1 year, epilepsy, congenital/genetic defects, history of transplant, enteral tubes, hemoglobin <10 g/dL, and blood culture drawn in the preceding 72 hours.
| Predictor | Adjusted OR (95% CI) | P Value | Regression Coefficient (95% CI) | Score* |
|---|---|---|---|---|
| ||||
| Age <1 yr | 1.9 (1.0‐3.4) | 0.038 | 0.6 (<0.1‐1.2) | 1 |
| Epilepsy | 4.4 (1.9‐9.8) | <0.001 | 1.5 (0.7‐2.3) | 2 |
| Congenital/genetic defects | 2.1 (0.9‐4.9) | 0.075 | 0.8 (0.1‐1.6) | 1 |
| History of any transplant | 3.0 (1.3‐6.9) | 0.010 | 1.1 (0.3‐1.9) | 2 |
| Enteral tube | 2.1 (1.3‐3.6) | 0.003 | 0.8 (0.3‐1.3) | 1 |
| Hemoglobin <10 g/dL in preceding 72 hr | 3.0 (1.8‐5.1) | <0.001 | 1.1 (0.6‐1.6) | 2 |
| Blood culture drawn in preceding 72 hr | 5.8 (3.3‐10.3) | <0.001 | 1.8 (1.2‐2.3) | 3 |
Predictive Score
The range of the resulting predictive score was 0 to 12. The median score among cases was 4, and the median score among controls was 1 (P < 0.001). The area under the receiver operating characteristic curve was 0.78 (95% confidence interval 0.74‐0.83).
We grouped the scores by SSLRs into 4 risk strata and calculated each group's estimated post‐test probability of deterioration based on the pre‐test probability of deterioration of 0.15% (Table 4). The very low‐risk group had a probability of deterioration of 0.06%, less than one‐half the pre‐test probability. The low‐risk group had a probability of deterioration of 0.18%, similar to the pre‐test probability. The intermediate‐risk group had a probability of deterioration of 0.39%, 2.6 times higher than the pre‐test probability. The high‐risk group had a probability of deterioration of 12.60%, 84 times higher than the pre‐test probability.
| Risk stratum | Score range | Cases in stratumn (%) | Controls in stratumn (%) | SSLR (95% CI) | Probability of deterioration (%)* |
|---|---|---|---|---|---|
| |||||
| Very low | 0‐2 | 37 (26) | 288 (68) | 0.4 (0.3‐0.5) | 0.06 |
| Low | 3‐4 | 37 (26) | 94 (22) | 1.2 (0.9‐1.6) | 0.2 |
| Intermediate | 5‐6 | 35 (25) | 40 (9) | 2.6 (1.7‐4.0) | 0.4 |
| High | 7‐12 | 32 (23) | 1 (<1) | 96.0 (13.2‐696.2) | 12.6 |
DISCUSSION
Despite the widespread adoption of rapid response systems, we know little about the optimal methods to identify patients whose clinical characteristics alone put them at increased risk of deterioration, and triage the care they receive based on this risk. Pediatric case series have suggested that younger children and those with chronic illnesses are more likely to require assistance from a medical emergency team,1112 but this is the first study to measure their association with this outcome in children.
Most studies with the objective of identifying patients at risk have focused on tools designed to detect symptoms of deterioration that have already begun, using single‐parameter medical emergency team calling criteria1316 or multi‐parameter early warning scores.38 Rather than create a tool to detect deterioration that has already begun, we developed a predictive score that incorporates patient characteristics independently associated with deterioration in hospitalized children, including age <1 year, epilepsy, congenital/genetic defects, history of transplant, enteral tube, hemoglobin <10 g/dL, and blood culture drawn in the preceding 72 hours. The score has the potential to help clinicians identify the children at highest risk of deterioration who might benefit most from the use of vital sign‐based methods to detect deterioration, as well as the children at lowest risk for whom monitoring may be unnecessary. For example, this score could be performed at the time of admission, and those at very low risk of deterioration and without other clinically concerning findings might be considered for a low‐intensity schedule of vital signs and monitoring (such as vital signs every 8 hours, no continuous cardiorespiratory monitoring or pulse oximetry, and early warning score calculation daily), while patients in the intermediate and high‐risk groups might be considered for a more intensive schedule of vital signs and monitoring (such as vital signs every 4 hours, continuous cardiorespiratory monitoring and pulse oximetry, and early warning score calculation every 4 hours). It should be noted, however, that 37 cases (26%) fell into the very low‐risk category, raising the importance of external validation at the point of admission from the emergency department, before the score can be implemented for the potential clinical use described above. If the score performs well in validation studies, then its use in tailoring monitoring parameters has the potential to reduce the amount of time nurses spend responding to false monitor alarms and calculating early warning scores on patients at very low risk of deterioration.
Of note, we excluded children hospitalized for fewer than 24 hours, resulting in the exclusion of 31% of the potentially eligible events. We also excluded 40% of the potentially eligible ICU transfers because they did not meet urgent criteria. These may be limitations because: (1) the first 24 hours of hospitalization may be a high‐risk period; and (2) patients who were on trajectories toward severe deterioration and received interventions that prevented further deterioration, but did not meet urgent criteria, were excluded. It may be that the children we included as cases were at increased risk of deterioration that is either more difficult to recognize early, or more difficult to treat effectively without ICU interventions. In addition, the population of patients meeting urgent criteria may vary across hospitals, limiting generalizability of this score.
In summary, we developed a predictive score and risk stratification tool that may be useful in triaging the intensity of monitoring and surveillance for deterioration that children receive when hospitalized on non‐ICU units. External validation using the setting and frequency of score measurement that would be most valuable clinically (for example, in the emergency department at the time of admission) is needed before clinical use can be recommended.
Acknowledgements
The authors thank Annie Chung, BA, Emily Huang, and Susan Lipsett, MD, for their assistance with data collection.
- Institute for Healthcare Improvement. About IHI. Available at: http://www.ihi.org/ihi/about. Accessed July 18,2010.
- ,,, et al.“Identifying the hospitalised patient in crisis”—a consensus conference on the afferent limb of Rapid Response Systems.Resuscitation.2010;81(4):375–382.
- ,,.The Pediatric Early Warning System score: a severity of illness score to predict urgent medical need in hospitalized children.J Crit Care.2006;21(3):271–278.
- ,,.Development and initial validation of the Bedside Paediatric Early Warning System score.Crit Care.2009;13(4):R135.
- .Detecting and managing deterioration in children.Paediatr Nurs.2005;17(1):32–35.
- ,,.Promoting care for acutely ill children—development and evaluation of a Paediatric Early Warning Tool.Intensive Crit Care Nurs.2006;22(2):73–81.
- ,,,,.Prospective evaluation of a pediatric inpatient early warning scoring system.J Spec Pediatr Nurs.2009;14(2):79–85.
- ,,,.Prospective cohort study to test the predictability of the Cardiff and Vale paediatric early warning system.Arch Dis Child.2009;94(8):602–606.
- ,,,,,.Deaths attributed to pediatric complex chronic conditions: national trends and implications for supportive care services.Pediatrics.2001;107(6):e99.
- ,,,,.Early prediction of neurological sequelae or death after bacterial meningitis.Acta Paediatr.2002;91(4):391–398.
- ,,,,.Retrospective review of emergency response activations during a 13‐year period at a tertiary care children's hospital.J Hosp Med.2011;6(3):131–135.
- ,,,.Clinical profile of hospitalized children provided with urgent assistance from a medical emergency team.Pediatrics.2008;121(6):e1577–e1584.
- ,,, et al.Implementation of a medical emergency team in a large pediatric teaching hospital prevents respiratory and cardiopulmonary arrests outside the intensive care unit.Pediatr Crit Care Med.2007;8(3):236–246.
- ,,, et al.Effect of a rapid response team on hospital‐wide mortality and code rates outside the ICU in a children's hospital.JAMA.2007;298(19):2267–2274.
- ,,, et al.Transition from a traditional code team to a medical emergency team and categorization of cardiopulmonary arrests in a children's center.Arch Pediatr Adolesc Med.2008;162(2):117–122.
- ,.Reduction of hospital mortality and of preventable cardiac arrest and death on introduction of a pediatric medical emergency team.Pediatr Crit Care Med.2009;10(3):306–312.
Thousands of hospitals have implemented rapid response systems in recent years in attempts to reduce mortality outside the intensive care unit (ICU).1 These systems have 2 components, a response arm and an identification arm. The response arm is usually comprised of a multidisciplinary critical care team that responds to calls for urgent assistance outside the ICU; this team is often called a rapid response team or a medical emergency team. The identification arm comes in 2 forms, predictive and detective. Predictive tools estimate a patient's risk of deterioration over time based on factors that are not rapidly changing, such as elements of the patient's history. In contrast, detective tools include highly time‐varying signs of active deterioration, such as vital sign abnormalities.2 To date, most pediatric studies have focused on developing detective tools, including several early warning scores.38
In this study, we sought to identify the characteristics that increase the probability that a hospitalized child will deteriorate, and combine these characteristics into a predictive score. Tools like this may be helpful in identifying and triaging the subset of high‐risk children who should be intensively monitored for early signs of deterioration at the time of admission, as well as in identifying very low‐risk children who, in the absence of other clinical concerns, may be monitored less intensively.
METHODS
Detailed methods, including the inclusion/exclusion criteria, the matching procedures, and a full description of the statistical analysis are provided as an appendix (see Supporting Online Appendix: Supplement to Methods Section in the online version of this article). An abbreviated version follows.
Design
We performed a case‐control study among children, younger than 18 years old, hospitalized for >24 hours between January 1, 2005 and December 31, 2008. The case group consisted of children who experienced clinical deterioration, a composite outcome defined as cardiopulmonary arrest (CPA), acute respiratory compromise (ARC), or urgent ICU transfer, while on a non‐ICU unit. ICU transfers were considered urgent if they included at least one of the following outcomes in the 12 hours after transfer: death, CPA, intubation, initiation of noninvasive ventilation, or administration of a vasoactive medication infusion used for the treatment of shock. The control group consisted of a random sample of patients matched 3:1 to cases if they met the criteria of being on a non‐ICU unit at the same time as their matched case.
Variables and Measurements
We collected data on demographics, complex chronic conditions (CCCs), other patient characteristics, and laboratory studies. CCCs were specific diagnoses divided into the following 9 categories according to an established framework: neuromuscular, cardiovascular, respiratory, renal, gastrointestinal, hematologic/emmmunologic, metabolic, malignancy, and genetic/congenital defects.9 Other patient characteristics evaluated included age, weight‐for‐age, gestational age, history of transplant, time from hospital admission to event, recent ICU stays, administration of total parenteral nutrition, use of a patient‐controlled analgesia pump, and presence of medical devices including central venous lines and enteral tubes (naso‐gastric, gastrostomy, or jejunostomy).
Laboratory studies evaluated included hemoglobin value, white blood cell count, and blood culture drawn in the preceding 72 hours. We included these laboratory studies in this predictive score because we hypothesized that they represented factors that increased a child's risk of deterioration over time, as opposed to signs of acute deterioration that would be more appropriate for a detective score.
Statistical Analysis
We used conditional logistic regression for the bivariable and multivariable analyses to account for the matching. We derived the predictive score using an established method10 in which the regression coefficients for each covariate were divided by the smallest coefficient, and then rounded to the nearest integer, to establish each variable's sub‐score. We grouped the total scores into very low, low, intermediate, and high‐risk groups, calculated overall stratum‐specific likelihood ratios (SSLRs), and estimated stratum‐specific probabilities of deterioration for each group.
RESULTS
Patient Characteristics
We identified 12 CPAs, 41 ARCs, and 699 urgent ICU transfers during the study period. A total of 141 cases met our strict criteria for inclusion (see Figure in Supporting Online Appendix: Supplement to Methods Section in the online version of this article) among approximately 96,000 admissions during the study period, making the baseline incidence of events (pre‐test probability) approximately 0.15%. The case and control groups were similar in age, sex, and family‐reported race/ethnicity. Cases had been hospitalized longer than controls at the time of their event, were less likely to have been on a surgical service, and were less likely to survive to hospital discharge (Table 1). There was a high prevalence of CCCs among both cases and controls; 78% of cases and 52% of controls had at least 1 CCC.
| Cases (n = 141) | Controls (n = 423) | ||
|---|---|---|---|
| n (%) | n (%) | P Value | |
| |||
| Type of event | |||
| Cardiopulmonary arrest | 4 (3) | 0 | NA |
| Acute respiratory compromise | 29 (20) | 0 | NA |
| Urgent ICU transfer | 108 (77) | 0 | NA |
| Demographics | |||
| Age | 0.34 | ||
| 0‐<6 mo | 17 (12) | 62 (15) | |
| 6‐<12 mo | 22 (16) | 41 (10) | |
| 1‐<4 yr | 34 (24) | 97 (23) | |
| 4‐<10 yr | 26 (18) | 78 (18) | |
| 10‐<18 yr | 42 (30) | 145 (34) | |
| Sex | 0.70 | ||
| Female | 60 (43) | 188 (44) | |
| Male | 81 (57) | 235 (56) | |
| Race | 0.40 | ||
| White | 69 (49) | 189 (45) | |
| Black/African‐American | 49 (35) | 163 (38) | |
| Asian/Pacific Islander | 0 (0) | 7 (2) | |
| Other | 23 (16) | 62 (15) | |
| Not reported | 0 (0) | 2 (<1) | |
| Ethnicity | 0.53 | ||
| Non‐Hispanic | 127 (90) | 388 (92) | |
| Hispanic | 14 (10) | 33 (8) | |
| Unknown/not reported | 0 (0) | 2 (<1) | |
| Hospitalization | |||
| Length of stay in days, median (interquartile range) | 7.8 (2.6‐18.2) | 3.9 (1.9‐11.2) | <0.001 |
| Surgical service | 4 (3) | 67 (16) | <0.001 |
| Survived to hospital discharge | 107 (76) | 421 (99.5) | <0.001 |
Unadjusted (Bivariable) Analysis
Results of bivariable analysis are shown in Table 2.
| Variable | Cases n (%) | Controls n (%) | OR* | 95% CI | P Value |
|---|---|---|---|---|---|
| |||||
| Complex chronic conditions categories | |||||
| Congenital/genetic | 19 (13) | 21 (5) | 3.0 | 1.6‐5.8 | 0.001 |
| Neuromuscular | 31 (22) | 48 (11) | 2.2 | 1.3‐3.7 | 0.002 |
| Respiratory | 18 (13) | 27 (6) | 2.0 | 1.1‐3.7 | 0.02 |
| Cardiovascular | 15 (10) | 24 (6) | 2.0 | 1.0‐3.9 | 0.05 |
| Metabolic | 5 (3) | 6 (1) | 2.5 | 0.8‐8.2 | 0.13 |
| Gastrointestinal | 10 (7) | 24 (6) | 1.3 | 0.6‐2.7 | 0.54 |
| Renal | 3 (2) | 8 (2) | 1.1 | 0.3‐4.2 | 0.86 |
| Hematology/emmmunodeficiency | 6 (4) | 19 (4) | 0.9 | 0.4‐2.4 | 0.91 |
| Specific conditions | |||||
| Mental retardation | 21 (15) | 25 (6) | 2.7 | 1.5‐4.9 | 0.001 |
| Malignancy | 49 (35) | 90 (21) | 1.9 | 1.3‐2.8 | 0.002 |
| Epilepsy | 22 (15) | 30 (7) | 2.4 | 1.3‐4.3 | 0.004 |
| Cardiac malformations | 14 (10) | 19 (4) | 2.2 | 1.1‐4.4 | 0.02 |
| Chronic respiratory disease arising in the perinatal period | 11 (8) | 15 (4) | 2.2 | 1.0‐4.8 | 0.05 |
| Cerebral palsy | 7 (5) | 13 (3) | 1.7 | 0.6‐4.2 | 0.30 |
| Cystic fibrosis | 1 (1) | 9 (2) | 0.3 | <0.1‐2.6 | 0.30 |
| Other patient characteristics | |||||
| Time from hospital admission to event 7 days | 74 (52) | 146 (35) | 2.1 | 1.4‐3.1 | <0.001 |
| History of any transplant | 27 (19) | 17 (4) | 5.7 | 2.9‐11.1 | <0.001 |
| Enteral tube | 65 (46) | 102 (24) | 2.6 | 1.8‐3.9 | <0.001 |
| Hospitalized in an intensive care unit during the same admission | 43 (31) | 77 (18) | 2.0 | 1.3‐3.1 | 0.002 |
| Administration of TPN in preceding 24 hr | 26 (18) | 36 (9) | 2.3 | 1.4‐3.9 | 0.002 |
| Administration of an opioid via a patient‐controlled analgesia pump in the preceding 24 hr | 14 (9) | 14 (3) | 3.6 | 1.6‐8.3 | 0.002 |
| Weight‐for‐age <5th percentile | 49 (35) | 94 (22) | 1.9 | 1.2‐2.9 | 0.003 |
| Central venous line | 55 (39) | 113 (27) | 1.8 | 1.2‐2.7 | 0.005 |
| Age <1 yr | 39 (28) | 103 (24) | 1.2 | 0.8‐1.9 | 0.42 |
| Gestational age <37 wk or documentation of prematurity | 21 (15) | 60 (14) | 1.1 | 0.6‐1.8 | 0.84 |
| Laboratory studies | |||||
| Hemoglobin in preceding 72 hr | |||||
| Not tested | 28 (20) | 190 (45) | 1.0 | [reference] | |
| 10 g/dL | 42 (30) | 144 (34) | 2.0 | 1.2‐3.5 | 0.01 |
| <10 g/dL | 71 (50) | 89 (21) | 5.6 | 3.3‐9.5 | <0.001 |
| White blood cell count in preceding 72 hr | |||||
| Not tested | 28 (20) | 190 (45) | 1.0 | [reference] | |
| 5000 to <15,000/l | 45 (32) | 131 (31) | 2.4 | 1.4‐4.1 | 0.001 |
| 15,000/l | 19 (13) | 25 (6) | 5.7 | 2.7‐12.0 | <0.001 |
| <5000/l | 49 (35) | 77 (18) | 4.5 | 2.6‐7.8 | <0.001 |
| Blood culture drawn in preceding 72 hr | 78 (55) | 85 (20) | 5.2 | 3.3‐8.1 | <0.001 |
Adjusted (Multivariable) Analysis
The multivariable conditional logistic regression model included 7 independent risk factors for deterioration (Table 3): age <1 year, epilepsy, congenital/genetic defects, history of transplant, enteral tubes, hemoglobin <10 g/dL, and blood culture drawn in the preceding 72 hours.
| Predictor | Adjusted OR (95% CI) | P Value | Regression Coefficient (95% CI) | Score* |
|---|---|---|---|---|
| ||||
| Age <1 yr | 1.9 (1.0‐3.4) | 0.038 | 0.6 (<0.1‐1.2) | 1 |
| Epilepsy | 4.4 (1.9‐9.8) | <0.001 | 1.5 (0.7‐2.3) | 2 |
| Congenital/genetic defects | 2.1 (0.9‐4.9) | 0.075 | 0.8 (0.1‐1.6) | 1 |
| History of any transplant | 3.0 (1.3‐6.9) | 0.010 | 1.1 (0.3‐1.9) | 2 |
| Enteral tube | 2.1 (1.3‐3.6) | 0.003 | 0.8 (0.3‐1.3) | 1 |
| Hemoglobin <10 g/dL in preceding 72 hr | 3.0 (1.8‐5.1) | <0.001 | 1.1 (0.6‐1.6) | 2 |
| Blood culture drawn in preceding 72 hr | 5.8 (3.3‐10.3) | <0.001 | 1.8 (1.2‐2.3) | 3 |
Predictive Score
The range of the resulting predictive score was 0 to 12. The median score among cases was 4, and the median score among controls was 1 (P < 0.001). The area under the receiver operating characteristic curve was 0.78 (95% confidence interval 0.74‐0.83).
We grouped the scores by SSLRs into 4 risk strata and calculated each group's estimated post‐test probability of deterioration based on the pre‐test probability of deterioration of 0.15% (Table 4). The very low‐risk group had a probability of deterioration of 0.06%, less than one‐half the pre‐test probability. The low‐risk group had a probability of deterioration of 0.18%, similar to the pre‐test probability. The intermediate‐risk group had a probability of deterioration of 0.39%, 2.6 times higher than the pre‐test probability. The high‐risk group had a probability of deterioration of 12.60%, 84 times higher than the pre‐test probability.
| Risk stratum | Score range | Cases in stratumn (%) | Controls in stratumn (%) | SSLR (95% CI) | Probability of deterioration (%)* |
|---|---|---|---|---|---|
| |||||
| Very low | 0‐2 | 37 (26) | 288 (68) | 0.4 (0.3‐0.5) | 0.06 |
| Low | 3‐4 | 37 (26) | 94 (22) | 1.2 (0.9‐1.6) | 0.2 |
| Intermediate | 5‐6 | 35 (25) | 40 (9) | 2.6 (1.7‐4.0) | 0.4 |
| High | 7‐12 | 32 (23) | 1 (<1) | 96.0 (13.2‐696.2) | 12.6 |
DISCUSSION
Despite the widespread adoption of rapid response systems, we know little about the optimal methods to identify patients whose clinical characteristics alone put them at increased risk of deterioration, and triage the care they receive based on this risk. Pediatric case series have suggested that younger children and those with chronic illnesses are more likely to require assistance from a medical emergency team,1112 but this is the first study to measure their association with this outcome in children.
Most studies with the objective of identifying patients at risk have focused on tools designed to detect symptoms of deterioration that have already begun, using single‐parameter medical emergency team calling criteria1316 or multi‐parameter early warning scores.38 Rather than create a tool to detect deterioration that has already begun, we developed a predictive score that incorporates patient characteristics independently associated with deterioration in hospitalized children, including age <1 year, epilepsy, congenital/genetic defects, history of transplant, enteral tube, hemoglobin <10 g/dL, and blood culture drawn in the preceding 72 hours. The score has the potential to help clinicians identify the children at highest risk of deterioration who might benefit most from the use of vital sign‐based methods to detect deterioration, as well as the children at lowest risk for whom monitoring may be unnecessary. For example, this score could be performed at the time of admission, and those at very low risk of deterioration and without other clinically concerning findings might be considered for a low‐intensity schedule of vital signs and monitoring (such as vital signs every 8 hours, no continuous cardiorespiratory monitoring or pulse oximetry, and early warning score calculation daily), while patients in the intermediate and high‐risk groups might be considered for a more intensive schedule of vital signs and monitoring (such as vital signs every 4 hours, continuous cardiorespiratory monitoring and pulse oximetry, and early warning score calculation every 4 hours). It should be noted, however, that 37 cases (26%) fell into the very low‐risk category, raising the importance of external validation at the point of admission from the emergency department, before the score can be implemented for the potential clinical use described above. If the score performs well in validation studies, then its use in tailoring monitoring parameters has the potential to reduce the amount of time nurses spend responding to false monitor alarms and calculating early warning scores on patients at very low risk of deterioration.
Of note, we excluded children hospitalized for fewer than 24 hours, resulting in the exclusion of 31% of the potentially eligible events. We also excluded 40% of the potentially eligible ICU transfers because they did not meet urgent criteria. These may be limitations because: (1) the first 24 hours of hospitalization may be a high‐risk period; and (2) patients who were on trajectories toward severe deterioration and received interventions that prevented further deterioration, but did not meet urgent criteria, were excluded. It may be that the children we included as cases were at increased risk of deterioration that is either more difficult to recognize early, or more difficult to treat effectively without ICU interventions. In addition, the population of patients meeting urgent criteria may vary across hospitals, limiting generalizability of this score.
In summary, we developed a predictive score and risk stratification tool that may be useful in triaging the intensity of monitoring and surveillance for deterioration that children receive when hospitalized on non‐ICU units. External validation using the setting and frequency of score measurement that would be most valuable clinically (for example, in the emergency department at the time of admission) is needed before clinical use can be recommended.
Acknowledgements
The authors thank Annie Chung, BA, Emily Huang, and Susan Lipsett, MD, for their assistance with data collection.
- Institute for Healthcare Improvement. About IHI. Available at: http://www.ihi.org/ihi/about. Accessed July 18,2010.
- ,,, et al.“Identifying the hospitalised patient in crisis”—a consensus conference on the afferent limb of Rapid Response Systems.Resuscitation.2010;81(4):375–382.
- ,,.The Pediatric Early Warning System score: a severity of illness score to predict urgent medical need in hospitalized children.J Crit Care.2006;21(3):271–278.
- ,,.Development and initial validation of the Bedside Paediatric Early Warning System score.Crit Care.2009;13(4):R135.
- .Detecting and managing deterioration in children.Paediatr Nurs.2005;17(1):32–35.
- ,,.Promoting care for acutely ill children—development and evaluation of a Paediatric Early Warning Tool.Intensive Crit Care Nurs.2006;22(2):73–81.
- ,,,,.Prospective evaluation of a pediatric inpatient early warning scoring system.J Spec Pediatr Nurs.2009;14(2):79–85.
- ,,,.Prospective cohort study to test the predictability of the Cardiff and Vale paediatric early warning system.Arch Dis Child.2009;94(8):602–606.
- ,,,,,.Deaths attributed to pediatric complex chronic conditions: national trends and implications for supportive care services.Pediatrics.2001;107(6):e99.
- ,,,,.Early prediction of neurological sequelae or death after bacterial meningitis.Acta Paediatr.2002;91(4):391–398.
- ,,,,.Retrospective review of emergency response activations during a 13‐year period at a tertiary care children's hospital.J Hosp Med.2011;6(3):131–135.
- ,,,.Clinical profile of hospitalized children provided with urgent assistance from a medical emergency team.Pediatrics.2008;121(6):e1577–e1584.
- ,,, et al.Implementation of a medical emergency team in a large pediatric teaching hospital prevents respiratory and cardiopulmonary arrests outside the intensive care unit.Pediatr Crit Care Med.2007;8(3):236–246.
- ,,, et al.Effect of a rapid response team on hospital‐wide mortality and code rates outside the ICU in a children's hospital.JAMA.2007;298(19):2267–2274.
- ,,, et al.Transition from a traditional code team to a medical emergency team and categorization of cardiopulmonary arrests in a children's center.Arch Pediatr Adolesc Med.2008;162(2):117–122.
- ,.Reduction of hospital mortality and of preventable cardiac arrest and death on introduction of a pediatric medical emergency team.Pediatr Crit Care Med.2009;10(3):306–312.
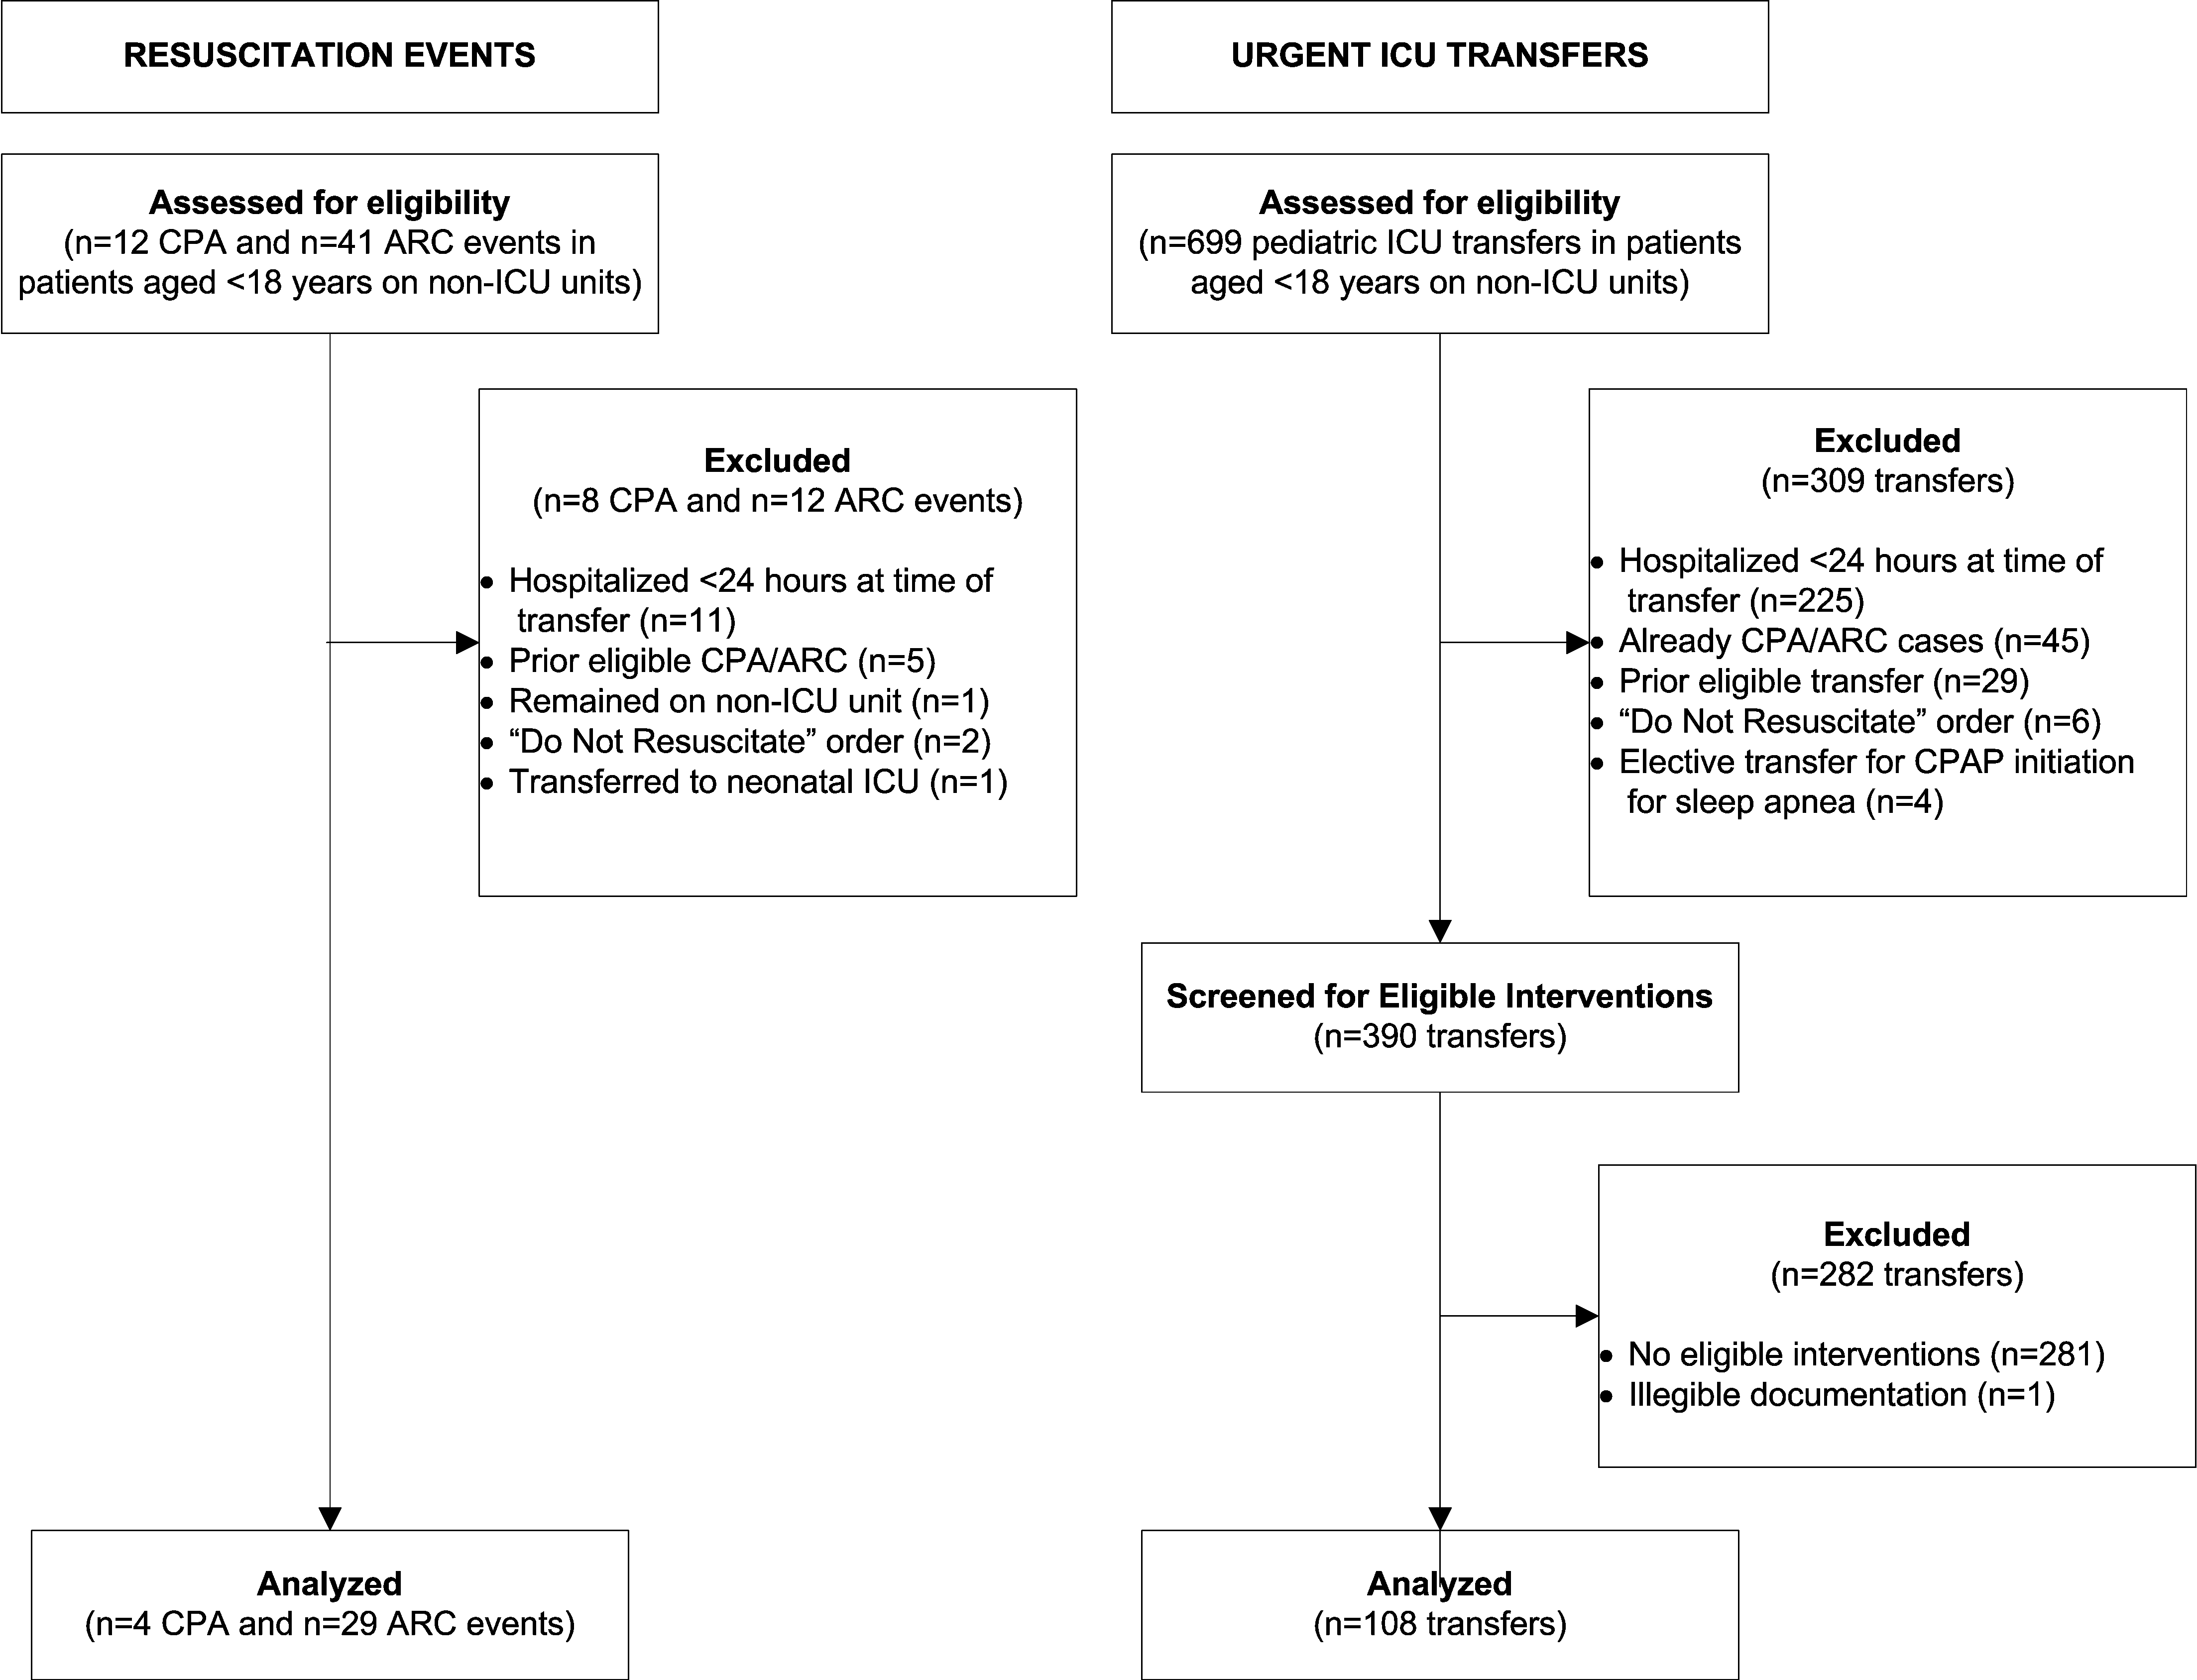
Oseltamivir in Children with CA‐LCI
Influenza is a common cause of acute respiratory illness in children, resulting in hospitalization of both healthy and chronically ill children due to influenza‐related complications.1, 2 Currently, amantadine, rimantadine, oseltamivir, and zanamivir are approved for use in children to treat influenza. In early 2006, more than 90% of influenza isolates tested in the US were found to be resistant to the adamantanes, suggesting that these medications might be of limited benefit during future influenza seasons.3 To date, most isolates of influenza remain susceptible to neuraminidase inhibitors, zanamivir and oseltamivir. Zanamivir has not been used extensively in pediatrics because it is delivered by aerosolization, and is only approved by the US Food and Drug Administration (FDA) for children 7 years of age. Oseltamivir is administered orally and is FDA‐approved for use in children 1 year of age within 48 hours of onset of symptoms of influenza virus infection.
Studies performed in outpatient settings have shown that oseltamivir can lessen the severity and reduce the length of influenza illness by 36 hours when therapy is initiated within 2 days of the onset of symptoms.4 Treatment also reduced the frequency of new diagnoses of otitis media and decreased physician‐prescribed antibiotics.4
To date, there are limited data evaluating the use of oseltamivir in either adult or pediatric patients hospitalized with influenza. We sought to describe the use of antiviral medications among children hospitalized with community‐acquired laboratory‐confirmed influenza (CA‐LCI) and to evaluate the effect of a computer‐based electronic reminder to increase the rate of on‐label use of oseltamivir among hospitalized children.
PATIENTS AND METHODS
We performed a retrospective cohort study of patients 21 years of age who were hospitalized with CA‐LCI during 5 consecutive seasons from July 2000 through June 2005 (seasons 1‐5) at the Children's Hospital of Philadelphia (CHOP). CHOP is a 418‐bed tertiary care hospital with about 24,000 hospital admissions each year. Viral diagnostic studies are performed routinely on children hospitalized with acute respiratory symptoms of unknown etiology, which aids in assigning patients to cohorts. Patients who had laboratory confirmation of influenza performed at an outside institution were excluded from this analysis.
From June 2005 through May 2006 (season 6), an observational trial of an electronic clinical decision reminder was performed to assess a mechanism to increase the proportion of eligible children treated with oseltamivir. Patients were included in this analysis if they were 21 years of age and had a diagnostic specimen for influenza obtained less than 72 hours after admission. The CHOP Institutional Review Board approved this study with a waiver of informed consent.
Viral Diagnostic Testing
During the winter months from seasons 1‐5, nasopharyngeal aspirate specimens were initially tested using immunochromatographic membrane assays (IA) for respiratory syncytial virus (RSV) (NOW RSV; Binax, Inc., Scarborough, ME) and, if negative, for influenza virus types A and B (NOW Flu A, NOW Flu B; Binax). If negative, specimens were tested by direct fluorescent antibody (DFA) testing for multiple respiratory viruses, including influenza A and B. During the winter season, IA testing was performed multiple times each day, and DFA was performed once or twice daily with an 8 to 24 hour turnaround time after a specimen was obtained. For season 6, the testing algorithm was revised: a panel of real‐time polymerase chain reaction (PCR) assays were performed to detect nucleic acids from multiple respiratory viruses, including influenza virus types A and B, on specimens that tested negative for influenza and RSV by IA. PCR testing was performed multiple times each day, and specimen results were available within 24 hours of specimen submission. Comprehensive viral tube cultures were performed on specimens that were negative by IA and DFA (seasons 1‐5) or respiratory virus PCR panel (season 6).
Study Definitions
Patients were considered to have CA‐LCI if the first diagnostic specimen positive for influenza was obtained less than 72 hours after hospital admission. Prescriptions for oseltamivir that were consistent with the FDA recommendations were considered to be on‐label prescriptions. Prescriptions for oseltamivir given to patients who did not meet these FDA criteria were considered off‐label prescriptions.5 Patients were considered oseltamivir‐eligible if they were met the criteria for FDA approval for treatment with oseltamivir: at least 1 year of age with influenza symptoms of less than 48 hours duration. Patients who either by age and/or symptom duration were inconsistent with FDA labeling criteria for oseltamivir were deemed oseltamivir‐ineligible. This included those patients for whom influenza test results were received by the clinician more than 48 hours after symptom onset. Patients who were positive for influenza only by viral culture were considered oseltamivir‐ineligible since the time needed to culture influenza virus was >48 hours. Because of the abrupt onset of influenza symptoms, the duration of influenza symptoms was defined by chart review of the emergency room or admission note. A hierarchy of symptoms was used to define the initial onset of influenza‐related symptoms and include the following: (1) For all patients with a history of fever, onset of influenza was defined as the onset of fever as recorded in the first physician note. (2) For patients without a history of fever, the onset of respiratory symptoms was recorded as the onset of influenza. (3) For patients without a history of fever but in whom multiple respiratory symptoms were noted, the onset of symptoms was assigned as the beginning of the increased work of breathing.
Because influenza IA were performed at least 4 times a day during the influenza season, the date of result to clinician was determined to be the same date as specimen collection for patients who had a positive influenza IA. Patients were identified as having a positive influenza result to the clinician 1 day after specimen collection if the test was positive by DFA or PCR. A neurologic adverse event was defined as the occurrence of a seizure after initiation of oseltamivir therapy. A neuropsychiatric adverse event was defined as any significant new neuropsychiatric symptom (psychosis, encephalopathy) recorded after the initiation of oseltamivir therapy. We defined a dermatologic adverse event as the report of any skin findings recorded after the initiation of oseltamivir therapy.
Chronic medical conditions
Information from detailed chart review was used to identify children with Advisory Committee on Immunization Practices (ACIP) high‐risk medical conditions as previously described by our group (asthma, chronic pulmonary disease, cardiac disease, immunosuppression, hemoglobinopathies, chronic renal dysfunction, diabetes mellitus, inborn errors of metabolism, long‐term salicylate therapy, pregnancy, and neurological and neuromuscular disease [NNMD]).6
Electronic Reminder
During season 6, a computer‐based electronic reminder was designed. The reminder stated Consider OSELTAMIVIR if Age >1 year AND symptoms <48 hours. May shorten illness by 36 hours. Page ID approval for more info. The reminder was embedded within the influenza results for all positive determinations, so a clinician would see the reminder when viewing positive laboratory results (Meditech, Westwood, MA).
At the initiation of season 6, we determined prescription rates of oseltamivir in patients with CA‐LCI to measure the baseline rate of oseltamivir prescription. The electronic reminder was initiated during week 11 of influenza activity at our institution and continued through the end of the influenza season.
Data Collection
Two sources of antiviral prescription data were used. Inpatient prescription of antiviral medications was extracted from billing records and chart review; a 10% audit of the medication administration records showed that the billing records correctly identified oseltamivir prescription status in all cases reviewed. Patients with incomplete pharmacy data were removed from the analysis of prescription practices (n = 8). During all seasons studied, the infectious diseases pharmacist (T.A.M.) and an infectious diseases physician (T.E.Z.) reviewed requests for inpatient prescriptions for antiviral medications.
For season 6, daily review of infection control records was performed to conduct surveillance for children hospitalized with CA‐LCI. To determine symptom duration and use of antiviral medications, inpatient medical charts were reviewed at the time of initial identification and then daily thereafter.
Statistical Analysis
Dichotomous variables were created for prescription of oseltamivir, age 1 year and symptom duration of <48 hours at time of clinician receipt of influenza results. Descriptive analyses included calculating the frequencies for categorical variables. Categorical variables were compared using Fisher's exact test. The Cochrane‐Armitage test was employed to test for a trend in the prescription of oseltamivir by season. A 2‐tailed P value of <0.05 was considered significant for all statistical tests. All statistical calculations were performed using standard programs in SAS 9.1 (SAS Institute, Cary, NC), STATA 8.2 (Stata Corp., College Station, TX), and Excel (Microsoft, Redmond, WA).
Prior to the start of season 6, we determined that if the rate of oseltamivir prescription was 40% before initiation of the reminder, we would need 20 eligible patients to detect a difference of 40% or greater in subsequent prescription rates (with 80% power and an alpha of 0.05). Once this enrollment goal was met, an electronic reminder of the eligibility for oseltamivir was initiated.
RESULTS
Use of Antiviral Medications in Children Hospitalized with Influenza, 2000‐2005
From July 2000 to June 2005, 1,058 patients were admitted with laboratory confirmed influenza; 8 were excluded because confirmatory testing was done at an outside institution, 24 were repeat hospitalizations, 89 nosocomial cases, and 8 cases were in patients >21 years. Thus, 929 patients had CA‐LCI and were eligible for inclusion in this study. Most children were infected with influenza A and were 1 year of age (Table 1). During this study period, only 9.3% of study subjects were treated with antiviral medications, most of whom (91%) received oseltamivir. Eight patients received amantadine over all seasons studied.
| Characteristics | Patients Hospitalized with CA‐LCI (n = 929)* | Eligible to Receive Oseltamivir (n = 305)* |
|---|---|---|
| ||
| Age (years) | ||
| <1 | 342 (37) | 0 |
| 1 | 587 (63) | 305 (100) |
| Season | ||
| 2000‐2001 | 107 (11.5) | 32 (10) |
| 2001‐2002 | 252 (27) | 78 (26) |
| 2002‐2003 | 135 (14.5) | 31 (10) |
| 2003‐2004 | 243 (26) | 86 (28) |
| 2004‐2005 | 192 (21) | 78 (26) |
| Influenza type | ||
| A | 692 (75) | |
| B | 237 (25) | |
Overall, one‐third of patients (305/929; 33%) were eligible for treatment with oseltamivir. Among patients 1 year of age, approximately one‐half (305/587; 52%) were oseltamivir‐eligible. The additional 282 patients 1 year were ineligible because test results were returned to the clinician >48 hours after hospital admission. Only 49 (16.1%) of oseltamivir‐eligible patients were prescribed oseltamivir during hospitalization (Figure 1). The rate of prescription of oseltamivir increased over all seasons from 0% in 2000‐2001 to 20% in 2004‐2005. On‐label prescription rates increased from 0% in 2000‐2001 to 37.2% in 2004‐2005 (P < 0.0001; Figure 2).
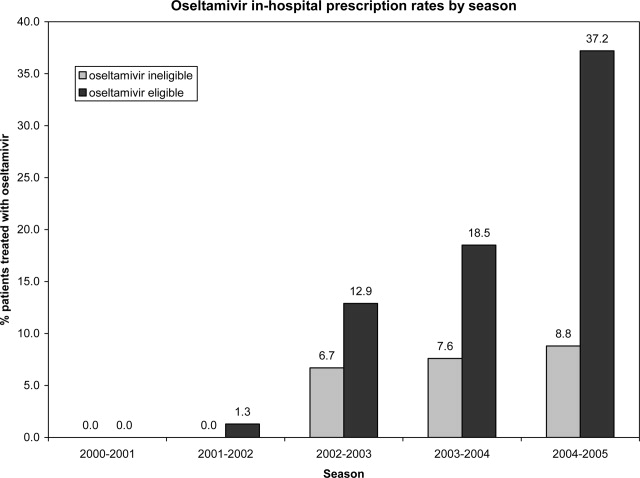
Off‐Label Oseltamivir Prescription
Oseltamivir was prescribed to 29 of the 624 patients who were determined to be oseltamivir‐ineligible. The rate of off‐label use increased over the seasons from 2000 to 2005 from 0% to 8.8% (P < 0.0001; Figure 1). Ineligible patients who received oseltamivir were 1 year of age (n = 11), had test results returned to the clinician 48 hours after hospital admission (n = 18), or both (n = 4). Most off‐label prescriptions occurred in patients who had chronic medical conditions (21/29; 72%), including cardiac disease (n = 9), asthma (n = 6), or prematurity (n = 5). Four of 11 patients 1 year of age who were treated with oseltamivir had influenza‐related respiratory failure. The oseltamivir dose for all patients 1 year of age was 2 mg/kg twice a day, all of whom survived to discharge.
Evaluation of a Computer‐Based Electronic Reminder Designed to Enhance the On‐Label Prescription of Oseltamivir
During season 6, an electronic reminder about the labeled use of oseltamivir was evaluated to determine its ability to increase the rate of prescription of oseltamivir among eligible children hospitalized with CA‐LCI. During season 6, most patients (226/311; 73%) were 1 year of age. A total of 84 patients were determined to be oseltamivir‐eligible (age 1 year and test results back to the clinician within 48 hours of symptom onset).
During the initial 10 weeks of local influenza activity, 20 oseltamivir‐eligible patients were admitted to our institution, and 8 received oseltamivir (40% prescription rate) (Table 2). In addition, 2 of 54 (3.7%) oseltamivir‐ineligible patients were also treated. The computer‐based electronic reminder was initiated in week 11 of the influenza season. After initiation of the reminder, 237 additional children with CA‐LCI were hospitalized, of whom 64 (27%) were determined to be oseltamivir‐eligible. The rate of on‐label prescription of oseltamivir was similar to that observed prior to initiation of the reminder: 16 of 64 patients eligible for antiviral therapy received oseltamivir (25% prescription rate) (Figure 3). An additional 8 patients were prescribed oseltamivir off‐label. The rate of oseltamivir prescription did not change significantly for either oseltamivir‐eligible (40‐25%) or oseltamivir‐ineligible (3.7‐4.6%) (Figure 4).
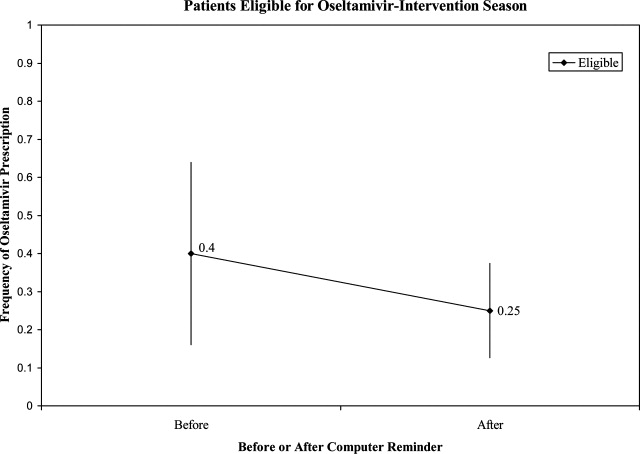
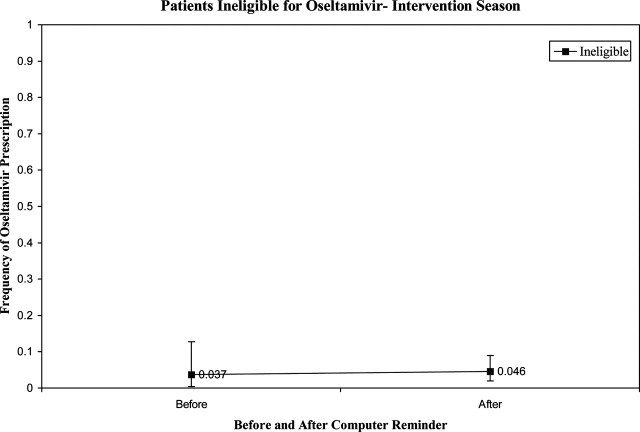
| Prompt Active? | Oseltamivir Use | Total | |
|---|---|---|---|
| Yes* | No | ||
| |||
| No | |||
| Eligible | 8 (40) | 12 | 20 |
| Ineligible | 2 (3.7) | 52 | 54 |
| Yes | |||
| Eligible | 16 (25) | 48 | 64 |
| Ineligible | 8 (4.6) | 165 | 173 |
| Total | 34 | 277 | 311 |
Dermatologic, Neurologic, and Neuropsychiatric Adverse Events
We reviewed the medical records of all patients treated with oseltamivir during the 6 study seasons to identify dermatologic, neurologic, and neuropsychiatric adverse outcomes that developed after the initiation of oseltamivir therapy. No new‐onset seizures, neuropsychiatric, or dermatologic reactions were identified among the children treated with oseltamivir.
DISCUSSION AND CONCLUSION
In this report, we describe the use of oseltamivir over 6 seasons in a cohort of children hospitalized with CA‐LCI at 1 tertiary care pediatric hospital and examine the impact of a mechanism designed to increase prescription among those eligible for oseltamivir. We found that only one‐third of patients hospitalized at our institution were eligible for oseltamivir treatment based on FDA‐approved indications. Of the eligible patients, few were prescribed oseltamivir during their hospitalization. During the sixth season, we employed a computer reminder system for oseltamivir prescription, which had no appreciable effect upon prescription rates. Despite the lack of effect of the electronic reminder system, we observed an increase of on‐label oseltamivir prescriptions over the entire study period. Finally, we identified 11 patients <1 year of age (3%) who were treated with oseltamivir. There were no adverse events identified in this group.
Although previous studies have addressed prescription rates of oseltamivir in children with influenza, few, if any, have looked at how these prescriptions correspond with FDA label criteria. In our cohort, only one‐third of hospitalized children were eligible for treatment with oseltamivir based upon their age and symptom duration at the time the results of rapid laboratory testing became available. Of those patients in our cohort eligible for oseltamivir, few were treated. The prescription of oseltamivir in seasons falls within the ranges found by Schrag et al.7 in their multistate review of pediatric influenza hospitalizations in 2003‐2004. They noted that use of antiviral medications varied by location of surveillance ranging from 3% in Connecticut to 34% in Colorado, indicating significant regional differences in prescription practices.7 Potential causes of low rates of appropriate use of oseltamivir include the observation that many physicians remain unaware of the potential severity of influenza infection in children.8 Additionally, physicians may differ on how to define the onset of influenza infection in children. A recent study published by Ohmit and Monto9 indicated that a fever and cough predicted 83% of children 5 to 12 years old who were determined to be influenza‐positive. Finally, many physicians who do not prescribe antiviral therapy may believe that their patients present too late for appropriate initiation of therapy.10
We identified 29 patients who received oseltamivir although they did not meet the FDA label criteria, of whom 72% had a chronic underlying condition. Moore et al.11 in their surveillance of influenza admissions in Canada found a similar trend. They described 26 of 29 (90%) hospitalized patients receiving antiinfluenza drugs had an underlying disease, and of those without a chronic condition, all had severe influenza‐related complications such as encephalopathy.11
Implementation of a computerized reminder to improve use of oseltamivir had no statistically significant effect on prescribing practice. Our sample size calculation was based on detecting a 40% difference in prescription rates, which limited our power to detect a smaller difference in prescription rates. A systematic review by Garg et al.12 identified barriers to the success of computer‐based decision support systems (CDS), which included failure of practitioners to use the system, poor integration of the system to the physician's workflow, and disagreement with what was recommended. Future enhancements to our inpatient electronic hospital record may allow for more targeted and robust CDS interventions.
We observed an increase in on‐label prescription rates of oseltamivir over the entire study period. We hypothesize that increased use of oseltamivir might be associated with growing concerns of pandemic influenza and attention to fatal influenza in children,13 as evidenced by the recent addition of influenza‐associated deaths in children to the list of nationally notifiable conditions in 2004.14
There has been considerable focus upon potential adverse events associated with treatment with oseltamivir in children. Reports have emerged, primarily from Japan, of neuropsychiatric and dermatologic adverse events of oseltamivir treatment.15 In the fall of 2006, the FDA added a precaution to the labeling of oseltamivir due to these neuropsychiatric events.16 In our treated cohort, no neurologic, neuropsychiatric, or dermatologic adverse events were identified. However, this finding is not surprising given the rarity of these adverse events and the limited number of children treated with oseltamivir in this study.
The strengths of this current study include a large cohort of laboratory‐confirmed influenza in hospitalized children over multiple influenza seasons. In addition, this is the first study of which we are aware that has assessed the number of children eligible for oseltamivir but not treated. The limitations of this study include misclassification bias related to the retrospective study design. Because of this design, onset of influenza symptoms was collected through chart review, and the time of receipt of influenza results from virology was based upon known laboratory turnover time, rather than actual knowledge of time of physician awareness of the result. To address this issue we used a conservative estimate of the time of receipt of influenza test results. In addition, the retrospective design prevented us from assessing the clinical decision‐making process, which led some patients to be treated with oseltamivir and others not. Our evaluation of the electronic reminder was designed to show a large change in prescription practices (ie, 40%), so it had insufficient power to detect a smaller impact. Finally, ascertainment bias may have limited our ability to identify adverse effects.
This study demonstrates that oseltamivir is prescribed infrequently among hospitalized children. Future studies are needed to determine whether appropriate use of oseltamivir improves outcomes among hospitalized children. Additional study of the safety and efficacy of oseltamivir in children aged <1 year is also needed given the large burden of disease in this age group.
Acknowledgements
We thank Michelle Precourt for her assistance with the computer‐based prompt. We also thank Drs. Anna Wheeler Rosenquist and Melissa Donovan for the original data collection for this project. This project was supported in part by the Centers for Disease Control and Prevention, grant H23/CCH32253‐02.
- ,,, et al.Influenza and the rates of hospitalization for respiratory disease among infants and young children.N Engl J Med.2000;342:232–239.
- ,,,,.The effect of influenza on hospitalizations, outpatient visits and courses of antibiotics in children.N Engl J Med.2000;342:225–231.
- Centers for Disease Control and Prevention (CDC). Diseases and Conditions. Seasonal Flu. CDC Health Alert: CDC recommends against the use of amantadine and rimantadine for the treatment or prophylaxis of influenza in the United States during the 2005–06 influenza season. January 14, 2006. Available at http://www.cdc.gov/flu/han011406.htm. Accessed November2008.
- ,,, et al.Oral oseltamivir treatment of influenza in children.Pediatr Infect Dis J.2001;20(2):127–133.
- ,,, et al.Off‐label drug use in hospitalized children.Arch Pediatr Adolesc Med.2007;161(3):282–290.
- ,,, et al.Neurological and neuromuscular disease as a risk factor for respiratory failure in children hospitalized with influenza infection.JAMA.2005;294:2188–2194.
- ,,, et al.Multistate surveillance for laboratory‐confirmed influenza‐associated hospitalizations in children 2003–2004.Pediatr Infect Dis J.2006;25(5):395–400.
- ,.Physician knowledge and perspectives regarding influenza and influenza vaccination.Hum Vaccin.2005;1(2):74–79.
- ,.Symptomatic predictors of influenza virus positivity in children during the influenza season.Clin Infect Dis.2006;43:564–568.
- ,,,,,.Effects of local variation, specialty, and beliefs on antiviral prescribing for influenza.Clin Infect Dis.2006;42:95–99.
- ,,, et al.Surveillance for influenza admissions among children hospitalized in Canadian immunization monitoring program active centers, 2003–2004.Pediatrics.2006;118:e610–e619.
- ,,, et al.Effects of computerized clinical decision support systems on practitioner performance and patient outcomes: a systematic review.JAMA.2005;293:1223–1238.
- ,,, et al.Influenza‐associated deaths among children in the United States, 2003–2004.N Engl J Med.2005;353(24):2559–2567.
- Centers for Disease Control and Prevention (CDC). Diseases and Conditions. Seasonal Flu. Flu Activity 25(6):572.
- ,,.Post‐Marketing Adverse Event Reports. Review of Central Nervous System/Psychiatric Disorders Associated with the Use of Tamiflu, Drug: Oseltamivir Phosphate. Department of Health and Human Services, Public Health Service, Food and Drug Administration, Center for Drug Evaluation and Research, Office of Surveillance and Epidemiology.2006. OSE PID #D060393 Oseltamivir—Neuropsychiatric Events.
Influenza is a common cause of acute respiratory illness in children, resulting in hospitalization of both healthy and chronically ill children due to influenza‐related complications.1, 2 Currently, amantadine, rimantadine, oseltamivir, and zanamivir are approved for use in children to treat influenza. In early 2006, more than 90% of influenza isolates tested in the US were found to be resistant to the adamantanes, suggesting that these medications might be of limited benefit during future influenza seasons.3 To date, most isolates of influenza remain susceptible to neuraminidase inhibitors, zanamivir and oseltamivir. Zanamivir has not been used extensively in pediatrics because it is delivered by aerosolization, and is only approved by the US Food and Drug Administration (FDA) for children 7 years of age. Oseltamivir is administered orally and is FDA‐approved for use in children 1 year of age within 48 hours of onset of symptoms of influenza virus infection.
Studies performed in outpatient settings have shown that oseltamivir can lessen the severity and reduce the length of influenza illness by 36 hours when therapy is initiated within 2 days of the onset of symptoms.4 Treatment also reduced the frequency of new diagnoses of otitis media and decreased physician‐prescribed antibiotics.4
To date, there are limited data evaluating the use of oseltamivir in either adult or pediatric patients hospitalized with influenza. We sought to describe the use of antiviral medications among children hospitalized with community‐acquired laboratory‐confirmed influenza (CA‐LCI) and to evaluate the effect of a computer‐based electronic reminder to increase the rate of on‐label use of oseltamivir among hospitalized children.
PATIENTS AND METHODS
We performed a retrospective cohort study of patients 21 years of age who were hospitalized with CA‐LCI during 5 consecutive seasons from July 2000 through June 2005 (seasons 1‐5) at the Children's Hospital of Philadelphia (CHOP). CHOP is a 418‐bed tertiary care hospital with about 24,000 hospital admissions each year. Viral diagnostic studies are performed routinely on children hospitalized with acute respiratory symptoms of unknown etiology, which aids in assigning patients to cohorts. Patients who had laboratory confirmation of influenza performed at an outside institution were excluded from this analysis.
From June 2005 through May 2006 (season 6), an observational trial of an electronic clinical decision reminder was performed to assess a mechanism to increase the proportion of eligible children treated with oseltamivir. Patients were included in this analysis if they were 21 years of age and had a diagnostic specimen for influenza obtained less than 72 hours after admission. The CHOP Institutional Review Board approved this study with a waiver of informed consent.
Viral Diagnostic Testing
During the winter months from seasons 1‐5, nasopharyngeal aspirate specimens were initially tested using immunochromatographic membrane assays (IA) for respiratory syncytial virus (RSV) (NOW RSV; Binax, Inc., Scarborough, ME) and, if negative, for influenza virus types A and B (NOW Flu A, NOW Flu B; Binax). If negative, specimens were tested by direct fluorescent antibody (DFA) testing for multiple respiratory viruses, including influenza A and B. During the winter season, IA testing was performed multiple times each day, and DFA was performed once or twice daily with an 8 to 24 hour turnaround time after a specimen was obtained. For season 6, the testing algorithm was revised: a panel of real‐time polymerase chain reaction (PCR) assays were performed to detect nucleic acids from multiple respiratory viruses, including influenza virus types A and B, on specimens that tested negative for influenza and RSV by IA. PCR testing was performed multiple times each day, and specimen results were available within 24 hours of specimen submission. Comprehensive viral tube cultures were performed on specimens that were negative by IA and DFA (seasons 1‐5) or respiratory virus PCR panel (season 6).
Study Definitions
Patients were considered to have CA‐LCI if the first diagnostic specimen positive for influenza was obtained less than 72 hours after hospital admission. Prescriptions for oseltamivir that were consistent with the FDA recommendations were considered to be on‐label prescriptions. Prescriptions for oseltamivir given to patients who did not meet these FDA criteria were considered off‐label prescriptions.5 Patients were considered oseltamivir‐eligible if they were met the criteria for FDA approval for treatment with oseltamivir: at least 1 year of age with influenza symptoms of less than 48 hours duration. Patients who either by age and/or symptom duration were inconsistent with FDA labeling criteria for oseltamivir were deemed oseltamivir‐ineligible. This included those patients for whom influenza test results were received by the clinician more than 48 hours after symptom onset. Patients who were positive for influenza only by viral culture were considered oseltamivir‐ineligible since the time needed to culture influenza virus was >48 hours. Because of the abrupt onset of influenza symptoms, the duration of influenza symptoms was defined by chart review of the emergency room or admission note. A hierarchy of symptoms was used to define the initial onset of influenza‐related symptoms and include the following: (1) For all patients with a history of fever, onset of influenza was defined as the onset of fever as recorded in the first physician note. (2) For patients without a history of fever, the onset of respiratory symptoms was recorded as the onset of influenza. (3) For patients without a history of fever but in whom multiple respiratory symptoms were noted, the onset of symptoms was assigned as the beginning of the increased work of breathing.
Because influenza IA were performed at least 4 times a day during the influenza season, the date of result to clinician was determined to be the same date as specimen collection for patients who had a positive influenza IA. Patients were identified as having a positive influenza result to the clinician 1 day after specimen collection if the test was positive by DFA or PCR. A neurologic adverse event was defined as the occurrence of a seizure after initiation of oseltamivir therapy. A neuropsychiatric adverse event was defined as any significant new neuropsychiatric symptom (psychosis, encephalopathy) recorded after the initiation of oseltamivir therapy. We defined a dermatologic adverse event as the report of any skin findings recorded after the initiation of oseltamivir therapy.
Chronic medical conditions
Information from detailed chart review was used to identify children with Advisory Committee on Immunization Practices (ACIP) high‐risk medical conditions as previously described by our group (asthma, chronic pulmonary disease, cardiac disease, immunosuppression, hemoglobinopathies, chronic renal dysfunction, diabetes mellitus, inborn errors of metabolism, long‐term salicylate therapy, pregnancy, and neurological and neuromuscular disease [NNMD]).6
Electronic Reminder
During season 6, a computer‐based electronic reminder was designed. The reminder stated Consider OSELTAMIVIR if Age >1 year AND symptoms <48 hours. May shorten illness by 36 hours. Page ID approval for more info. The reminder was embedded within the influenza results for all positive determinations, so a clinician would see the reminder when viewing positive laboratory results (Meditech, Westwood, MA).
At the initiation of season 6, we determined prescription rates of oseltamivir in patients with CA‐LCI to measure the baseline rate of oseltamivir prescription. The electronic reminder was initiated during week 11 of influenza activity at our institution and continued through the end of the influenza season.
Data Collection
Two sources of antiviral prescription data were used. Inpatient prescription of antiviral medications was extracted from billing records and chart review; a 10% audit of the medication administration records showed that the billing records correctly identified oseltamivir prescription status in all cases reviewed. Patients with incomplete pharmacy data were removed from the analysis of prescription practices (n = 8). During all seasons studied, the infectious diseases pharmacist (T.A.M.) and an infectious diseases physician (T.E.Z.) reviewed requests for inpatient prescriptions for antiviral medications.
For season 6, daily review of infection control records was performed to conduct surveillance for children hospitalized with CA‐LCI. To determine symptom duration and use of antiviral medications, inpatient medical charts were reviewed at the time of initial identification and then daily thereafter.
Statistical Analysis
Dichotomous variables were created for prescription of oseltamivir, age 1 year and symptom duration of <48 hours at time of clinician receipt of influenza results. Descriptive analyses included calculating the frequencies for categorical variables. Categorical variables were compared using Fisher's exact test. The Cochrane‐Armitage test was employed to test for a trend in the prescription of oseltamivir by season. A 2‐tailed P value of <0.05 was considered significant for all statistical tests. All statistical calculations were performed using standard programs in SAS 9.1 (SAS Institute, Cary, NC), STATA 8.2 (Stata Corp., College Station, TX), and Excel (Microsoft, Redmond, WA).
Prior to the start of season 6, we determined that if the rate of oseltamivir prescription was 40% before initiation of the reminder, we would need 20 eligible patients to detect a difference of 40% or greater in subsequent prescription rates (with 80% power and an alpha of 0.05). Once this enrollment goal was met, an electronic reminder of the eligibility for oseltamivir was initiated.
RESULTS
Use of Antiviral Medications in Children Hospitalized with Influenza, 2000‐2005
From July 2000 to June 2005, 1,058 patients were admitted with laboratory confirmed influenza; 8 were excluded because confirmatory testing was done at an outside institution, 24 were repeat hospitalizations, 89 nosocomial cases, and 8 cases were in patients >21 years. Thus, 929 patients had CA‐LCI and were eligible for inclusion in this study. Most children were infected with influenza A and were 1 year of age (Table 1). During this study period, only 9.3% of study subjects were treated with antiviral medications, most of whom (91%) received oseltamivir. Eight patients received amantadine over all seasons studied.
| Characteristics | Patients Hospitalized with CA‐LCI (n = 929)* | Eligible to Receive Oseltamivir (n = 305)* |
|---|---|---|
| ||
| Age (years) | ||
| <1 | 342 (37) | 0 |
| 1 | 587 (63) | 305 (100) |
| Season | ||
| 2000‐2001 | 107 (11.5) | 32 (10) |
| 2001‐2002 | 252 (27) | 78 (26) |
| 2002‐2003 | 135 (14.5) | 31 (10) |
| 2003‐2004 | 243 (26) | 86 (28) |
| 2004‐2005 | 192 (21) | 78 (26) |
| Influenza type | ||
| A | 692 (75) | |
| B | 237 (25) | |
Overall, one‐third of patients (305/929; 33%) were eligible for treatment with oseltamivir. Among patients 1 year of age, approximately one‐half (305/587; 52%) were oseltamivir‐eligible. The additional 282 patients 1 year were ineligible because test results were returned to the clinician >48 hours after hospital admission. Only 49 (16.1%) of oseltamivir‐eligible patients were prescribed oseltamivir during hospitalization (Figure 1). The rate of prescription of oseltamivir increased over all seasons from 0% in 2000‐2001 to 20% in 2004‐2005. On‐label prescription rates increased from 0% in 2000‐2001 to 37.2% in 2004‐2005 (P < 0.0001; Figure 2).
Off‐Label Oseltamivir Prescription
Oseltamivir was prescribed to 29 of the 624 patients who were determined to be oseltamivir‐ineligible. The rate of off‐label use increased over the seasons from 2000 to 2005 from 0% to 8.8% (P < 0.0001; Figure 1). Ineligible patients who received oseltamivir were 1 year of age (n = 11), had test results returned to the clinician 48 hours after hospital admission (n = 18), or both (n = 4). Most off‐label prescriptions occurred in patients who had chronic medical conditions (21/29; 72%), including cardiac disease (n = 9), asthma (n = 6), or prematurity (n = 5). Four of 11 patients 1 year of age who were treated with oseltamivir had influenza‐related respiratory failure. The oseltamivir dose for all patients 1 year of age was 2 mg/kg twice a day, all of whom survived to discharge.
Evaluation of a Computer‐Based Electronic Reminder Designed to Enhance the On‐Label Prescription of Oseltamivir
During season 6, an electronic reminder about the labeled use of oseltamivir was evaluated to determine its ability to increase the rate of prescription of oseltamivir among eligible children hospitalized with CA‐LCI. During season 6, most patients (226/311; 73%) were 1 year of age. A total of 84 patients were determined to be oseltamivir‐eligible (age 1 year and test results back to the clinician within 48 hours of symptom onset).
During the initial 10 weeks of local influenza activity, 20 oseltamivir‐eligible patients were admitted to our institution, and 8 received oseltamivir (40% prescription rate) (Table 2). In addition, 2 of 54 (3.7%) oseltamivir‐ineligible patients were also treated. The computer‐based electronic reminder was initiated in week 11 of the influenza season. After initiation of the reminder, 237 additional children with CA‐LCI were hospitalized, of whom 64 (27%) were determined to be oseltamivir‐eligible. The rate of on‐label prescription of oseltamivir was similar to that observed prior to initiation of the reminder: 16 of 64 patients eligible for antiviral therapy received oseltamivir (25% prescription rate) (Figure 3). An additional 8 patients were prescribed oseltamivir off‐label. The rate of oseltamivir prescription did not change significantly for either oseltamivir‐eligible (40‐25%) or oseltamivir‐ineligible (3.7‐4.6%) (Figure 4).
| Prompt Active? | Oseltamivir Use | Total | |
|---|---|---|---|
| Yes* | No | ||
| |||
| No | |||
| Eligible | 8 (40) | 12 | 20 |
| Ineligible | 2 (3.7) | 52 | 54 |
| Yes | |||
| Eligible | 16 (25) | 48 | 64 |
| Ineligible | 8 (4.6) | 165 | 173 |
| Total | 34 | 277 | 311 |
Dermatologic, Neurologic, and Neuropsychiatric Adverse Events
We reviewed the medical records of all patients treated with oseltamivir during the 6 study seasons to identify dermatologic, neurologic, and neuropsychiatric adverse outcomes that developed after the initiation of oseltamivir therapy. No new‐onset seizures, neuropsychiatric, or dermatologic reactions were identified among the children treated with oseltamivir.
DISCUSSION AND CONCLUSION
In this report, we describe the use of oseltamivir over 6 seasons in a cohort of children hospitalized with CA‐LCI at 1 tertiary care pediatric hospital and examine the impact of a mechanism designed to increase prescription among those eligible for oseltamivir. We found that only one‐third of patients hospitalized at our institution were eligible for oseltamivir treatment based on FDA‐approved indications. Of the eligible patients, few were prescribed oseltamivir during their hospitalization. During the sixth season, we employed a computer reminder system for oseltamivir prescription, which had no appreciable effect upon prescription rates. Despite the lack of effect of the electronic reminder system, we observed an increase of on‐label oseltamivir prescriptions over the entire study period. Finally, we identified 11 patients <1 year of age (3%) who were treated with oseltamivir. There were no adverse events identified in this group.
Although previous studies have addressed prescription rates of oseltamivir in children with influenza, few, if any, have looked at how these prescriptions correspond with FDA label criteria. In our cohort, only one‐third of hospitalized children were eligible for treatment with oseltamivir based upon their age and symptom duration at the time the results of rapid laboratory testing became available. Of those patients in our cohort eligible for oseltamivir, few were treated. The prescription of oseltamivir in seasons falls within the ranges found by Schrag et al.7 in their multistate review of pediatric influenza hospitalizations in 2003‐2004. They noted that use of antiviral medications varied by location of surveillance ranging from 3% in Connecticut to 34% in Colorado, indicating significant regional differences in prescription practices.7 Potential causes of low rates of appropriate use of oseltamivir include the observation that many physicians remain unaware of the potential severity of influenza infection in children.8 Additionally, physicians may differ on how to define the onset of influenza infection in children. A recent study published by Ohmit and Monto9 indicated that a fever and cough predicted 83% of children 5 to 12 years old who were determined to be influenza‐positive. Finally, many physicians who do not prescribe antiviral therapy may believe that their patients present too late for appropriate initiation of therapy.10
We identified 29 patients who received oseltamivir although they did not meet the FDA label criteria, of whom 72% had a chronic underlying condition. Moore et al.11 in their surveillance of influenza admissions in Canada found a similar trend. They described 26 of 29 (90%) hospitalized patients receiving antiinfluenza drugs had an underlying disease, and of those without a chronic condition, all had severe influenza‐related complications such as encephalopathy.11
Implementation of a computerized reminder to improve use of oseltamivir had no statistically significant effect on prescribing practice. Our sample size calculation was based on detecting a 40% difference in prescription rates, which limited our power to detect a smaller difference in prescription rates. A systematic review by Garg et al.12 identified barriers to the success of computer‐based decision support systems (CDS), which included failure of practitioners to use the system, poor integration of the system to the physician's workflow, and disagreement with what was recommended. Future enhancements to our inpatient electronic hospital record may allow for more targeted and robust CDS interventions.
We observed an increase in on‐label prescription rates of oseltamivir over the entire study period. We hypothesize that increased use of oseltamivir might be associated with growing concerns of pandemic influenza and attention to fatal influenza in children,13 as evidenced by the recent addition of influenza‐associated deaths in children to the list of nationally notifiable conditions in 2004.14
There has been considerable focus upon potential adverse events associated with treatment with oseltamivir in children. Reports have emerged, primarily from Japan, of neuropsychiatric and dermatologic adverse events of oseltamivir treatment.15 In the fall of 2006, the FDA added a precaution to the labeling of oseltamivir due to these neuropsychiatric events.16 In our treated cohort, no neurologic, neuropsychiatric, or dermatologic adverse events were identified. However, this finding is not surprising given the rarity of these adverse events and the limited number of children treated with oseltamivir in this study.
The strengths of this current study include a large cohort of laboratory‐confirmed influenza in hospitalized children over multiple influenza seasons. In addition, this is the first study of which we are aware that has assessed the number of children eligible for oseltamivir but not treated. The limitations of this study include misclassification bias related to the retrospective study design. Because of this design, onset of influenza symptoms was collected through chart review, and the time of receipt of influenza results from virology was based upon known laboratory turnover time, rather than actual knowledge of time of physician awareness of the result. To address this issue we used a conservative estimate of the time of receipt of influenza test results. In addition, the retrospective design prevented us from assessing the clinical decision‐making process, which led some patients to be treated with oseltamivir and others not. Our evaluation of the electronic reminder was designed to show a large change in prescription practices (ie, 40%), so it had insufficient power to detect a smaller impact. Finally, ascertainment bias may have limited our ability to identify adverse effects.
This study demonstrates that oseltamivir is prescribed infrequently among hospitalized children. Future studies are needed to determine whether appropriate use of oseltamivir improves outcomes among hospitalized children. Additional study of the safety and efficacy of oseltamivir in children aged <1 year is also needed given the large burden of disease in this age group.
Acknowledgements
We thank Michelle Precourt for her assistance with the computer‐based prompt. We also thank Drs. Anna Wheeler Rosenquist and Melissa Donovan for the original data collection for this project. This project was supported in part by the Centers for Disease Control and Prevention, grant H23/CCH32253‐02.
- ,,, et al.Influenza and the rates of hospitalization for respiratory disease among infants and young children.N Engl J Med.2000;342:232–239.
- ,,,,.The effect of influenza on hospitalizations, outpatient visits and courses of antibiotics in children.N Engl J Med.2000;342:225–231.
- Centers for Disease Control and Prevention (CDC). Diseases and Conditions. Seasonal Flu. CDC Health Alert: CDC recommends against the use of amantadine and rimantadine for the treatment or prophylaxis of influenza in the United States during the 2005–06 influenza season. January 14, 2006. Available at http://www.cdc.gov/flu/han011406.htm. Accessed November2008.
- ,,, et al.Oral oseltamivir treatment of influenza in children.Pediatr Infect Dis J.2001;20(2):127–133.
- ,,, et al.Off‐label drug use in hospitalized children.Arch Pediatr Adolesc Med.2007;161(3):282–290.
- ,,, et al.Neurological and neuromuscular disease as a risk factor for respiratory failure in children hospitalized with influenza infection.JAMA.2005;294:2188–2194.
- ,,, et al.Multistate surveillance for laboratory‐confirmed influenza‐associated hospitalizations in children 2003–2004.Pediatr Infect Dis J.2006;25(5):395–400.
- ,.Physician knowledge and perspectives regarding influenza and influenza vaccination.Hum Vaccin.2005;1(2):74–79.
- ,.Symptomatic predictors of influenza virus positivity in children during the influenza season.Clin Infect Dis.2006;43:564–568.
- ,,,,,.Effects of local variation, specialty, and beliefs on antiviral prescribing for influenza.Clin Infect Dis.2006;42:95–99.
- ,,, et al.Surveillance for influenza admissions among children hospitalized in Canadian immunization monitoring program active centers, 2003–2004.Pediatrics.2006;118:e610–e619.
- ,,, et al.Effects of computerized clinical decision support systems on practitioner performance and patient outcomes: a systematic review.JAMA.2005;293:1223–1238.
- ,,, et al.Influenza‐associated deaths among children in the United States, 2003–2004.N Engl J Med.2005;353(24):2559–2567.
- Centers for Disease Control and Prevention (CDC). Diseases and Conditions. Seasonal Flu. Flu Activity 25(6):572.
- ,,.Post‐Marketing Adverse Event Reports. Review of Central Nervous System/Psychiatric Disorders Associated with the Use of Tamiflu, Drug: Oseltamivir Phosphate. Department of Health and Human Services, Public Health Service, Food and Drug Administration, Center for Drug Evaluation and Research, Office of Surveillance and Epidemiology.2006. OSE PID #D060393 Oseltamivir—Neuropsychiatric Events.
Copyright © 2009 Society of Hospital Medicine
