User login
Caring Wisely: A Program to Support Frontline Clinicians and Staff in Improving Healthcare Delivery and Reducing Costs
© 2017 Society of Hospital Medicine
Strategies are needed to empower frontline clinicians to work with organizational leadership to reduce healthcare costs and improve high-value care. Caring Wisely® is a program developed by the University of California, San Francisco’s (UCSF) Center for Healthcare Value (CHV), aimed at engaging frontline clinicians and staff, connecting them with implementation experts, and supporting the development of targeted interventions to improve value. Financial savings from the program more than cover program costs. Caring Wisely® provides an institutional model for implementing robust interventions to address areas of low-value care.
Launched in 2013, the annual Caring Wisely® program consists of 3 stages for identifying projects that meet the following criteria:
- Potential to measurably reduce UCSF Health’s costs of care without transferring costs to patients, insurers, or other providers
- Plan for ensuring that health outcomes are maintained or improved
- Envision disseminating the intervention within and beyond UCSF
- Demonstrate commitment and engagement of clinical leadership and frontline staff.
The first stage is the Ideas Contest, a UCSF Health-wide call (to learn more about UCSF Health: https://www.ucsf.edu/sites/default/files/052516_About_UCSF.pdf) to identify areas that may be targeted to reduce unnecessary services, inefficiencies, and healthcare costs. We use a crowdsourcing platform—Open Proposals—to solicit the best ideas from frontline clinicians and staff.1 Open Proposals is a secure, web-based platform for transparent and collaborative proposal development that displays threads of comments, responses, and revisions, and allows submissions to be “liked.” Open Proposals is managed by the UCSF Clinical and Translational Science Institute, funded by the National Center for Advancing Translational Sciences (Grant Number UL1 TR000004) at the National Institutes of Health. Using institutional e-mail lists for faculty, staff and residents, as well as described at monthly managers and directors meetings, the Ideas Contest is announced each year by the Chief Medical Officer and the CHV leadership. The Caring Wisely® Executive Steering Committee, which consists of CHV and senior UCSF Health system leaders, selects the top 5-10 ideas based on the above criteria. Each winning idea receives a $100 gift certificate for a popular restaurant in San Francisco, and the list of winners is announced to the entire UCSF community.
The second stage is the Request for Proposals. The Caring Wisely® program solicits proposals that outline implementation plans to target specific areas identified through the Ideas Contest. Finalists from the Ideas Contest are encouraged to submit proposals that address the problem they identified, but anyone affiliated with UCSF Health may submit a proposal on a winning idea. There is an approximately 4-week open submission period during which applicants submit brief 2-page proposals on the Open Proposal platform. This is followed by a period of optimization that leverages the social media aspect of the Open Proposals platform in which the UCSF Health community asks clarifying questions, make suggestions, and modifications can be made to the proposals. All submissions receive written feedback from at least one Steering Committee member. In addition, the Caring Wisely® Director directly invites relevant UCSF colleagues, administrators, or program leaders to comment on proposals and make suggestions for improvement. Plans for assessing financial and health care delivery impacts are developed in collaboration with the UCSF Health Finance department. UCSF Health managers and leaders who are stakeholders in project proposal areas are consulted to provide input and finalize proposal plans, including the identification of existing personnel who can support and drive the project forward. Proposers use this feedback to revise their applications throughout this stage.
The third stage is Project Implementation. The Caring Wisely® Executive Steering Committee selects up to 3 winners from the submitted proposals. Using the program criteria above, each project is scored independently, discussed in committee, and rescored to identify the top proposals. Each selected project receives a maximum budget of $50,000 that can be used for project materials, activities, and salary support for project leaders or staff. In addition to funding, each project team receives input from the implementation science team to co-develop and implement the intervention with a goal of creating a first-test-of-change within 3-6 months. A key feature of Caring Wisely® is the partnership between project teams and the Caring Wisely® implementation team, which includes a director, program manager, data analysts, and implementation scientists (Table 1).
The $150,000 administrative budget for the Caring Wisely® program provides 20% support of the medical director, 50% support of a program manager/analyst, and 10% support of an implementation scientist. Approximately 5% support is donated from additional senior implementation scientists and various UCSF Health experts based on project needs. To make most efficient use of the Caring Wisely® program staff time with the project teams, there is a weekly 60-90 minute works-in-progress session attended by all 3 teams with a rotating schedule for lead presenter during the first 6 months; these meetings occur every 2-3 weeks during the second 6 months. Caring Wisely® program staff and the implementation scientist are also available for 1:1 meetings as needed. The Caring Wisely® Executive Steering Committee is not paid and meets for 90 minutes quarterly. Custom reports and modifications of the electronic health record are provided by the UCSF Health clinical informatics department as part of their operating budget.
The collaboration between the project teams and the implementation science team is guided by the Consolidated Framework for Implementation Research (CFIR)2 and PRECEDE-PROCEED model—a logic model and evaluation tool that is based on a composite of individual behavior change theory and social ecology.3 Table 2 illustrates how we weave PRECEDE-PROCEED and Plan-Do-Study-Act frameworks into project design and strategy. Each funded team is required to submit an end-of-year progress report.
Cost and cost savings estimates were based on administrative financial data obtained through the assistance of the Decision Support Services unit of the Finance Department of UCSF Health. All costs reflect direct institutional costs, rather than charges. For some projects, costs are directly available through computerized dashboards that provide year-to-year comparisons of specific costs of materials, supplies, and services (eg, blood transfusion reduction, surgical supplies project, OR efficiency program). This same dashboard also allows calculation of CMI-adjusted direct costs of hospital care by service line, as used in the perioperative pathways program evaluation. In other cases, the Decision Support Services and/or Caring Wisely® program manager created custom cost reports based on the key performance indicator (eg, nebulizer therapy costs consist of medication costs plus respiratory therapist time; CT scan utilization for suspected pulmonary embolus in emergency department; and antimicrobial utilization for suspected neonatal sepsis).
Ongoing monitoring and sustainability of Caring Wisely® projects is supported by the Caring Wisely® program leaders. Monitoring of ongoing cost savings is based on automated service-line level dashboards related to cost, utilization, and quality outcomes with quarterly updates provided to the Caring Wisely® Steering Committee. Depending on the project or program, appropriate UCSF Health senior leaders determine the level of support within their departments that is required to sustain the program(s). Ongoing monitoring of each program is also included in the strategic deployment visibility room with regular rounding by senior health system executives.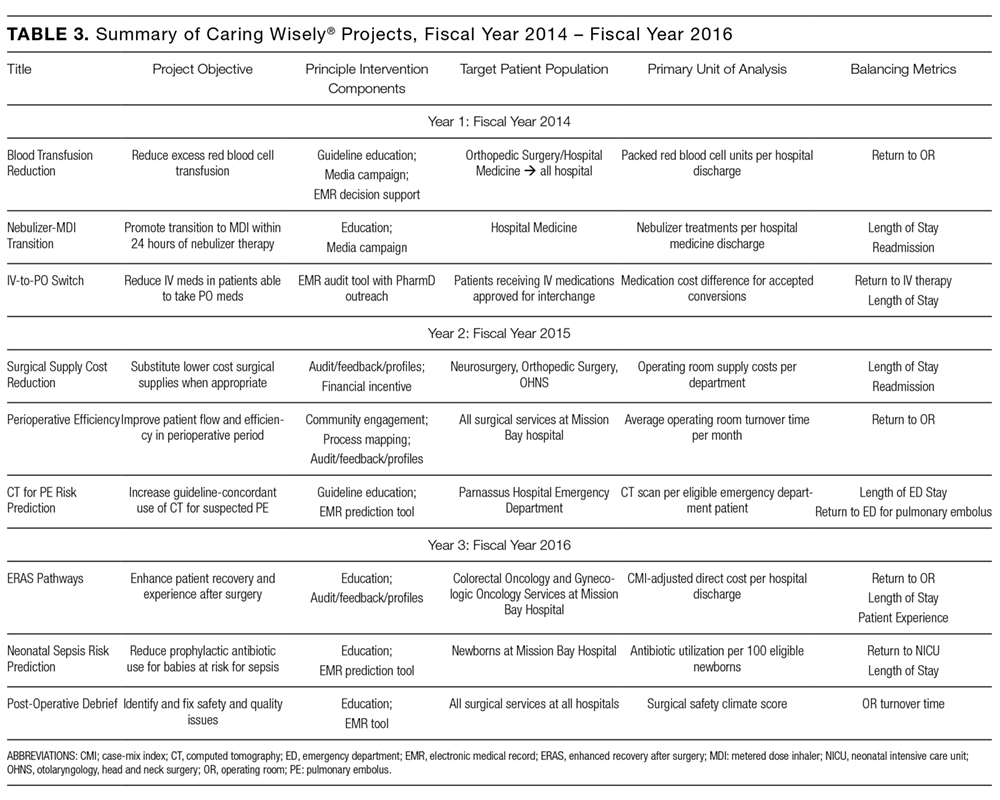
Since 2013, there have been 3 complete Caring Wisely® cycles. The Ideas Contest generated more than 75 ideas in each of the past 3 cycles, ranging from eliminating redundant laboratory or radiological studies to reducing linen and food waste. We received between 13-20 full proposals in each of the request for proposal stages, and 9 projects have been implemented, 3 in each year. Funded projects have been led by a variety of individuals including physicians, nurses, pharmacists, administrators and residents, and topics have ranged from reducing overutilization of tests, supplies and treatments, to improving patient throughput during the perioperative period (Table 3). Estimated cumulative savings to date from Caring Wisely® projects has exceeded $4 million, based on the four projects shown in Table 4. The IV-to-PO switch program and the neonatal sepsis risk prediction project (Table 3) have been successful in reducing unnecessary utilization, but cost and savings estimates are not yet finalized. Three funded projects were equivocal in cost savings but were successful in their primary aims: (1) increasing the appropriateness of CT scan ordering for suspected pulmonary embolus; (2) shortening operating room turnover times; and (3) implementing a postoperative debrief program for the systematic documentation of safety events, waste, and inefficiencies related to surgery.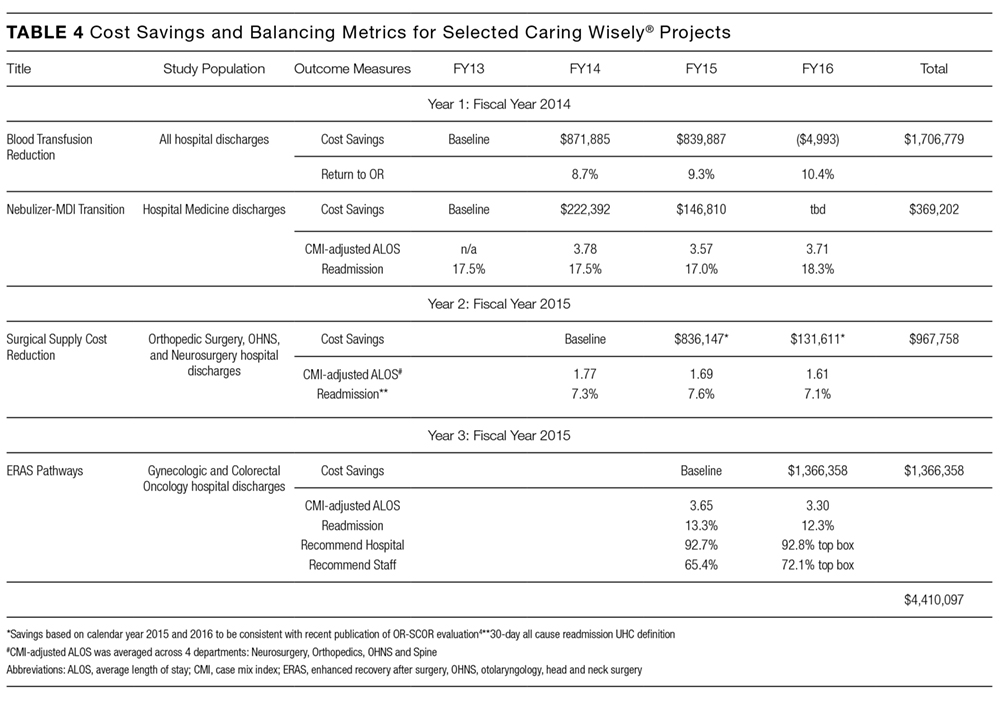
We developed an innovative program that reduces hospital costs through crowdsourcing of ideas from frontline clinicians and staff, and by connecting these ideas to project and implementation science teams. At a time when healthcare costs have reached unsustainable levels, the Caring Wisely® program provides a process for healthcare personnel to make a positive impact on healthcare costs in areas under their direct control. Through the Open Proposals platform, we have tapped a growing desire among frontline providers to reduce medical waste.
A key criterion for the Caring Wisely® program is to propose changes that reduce cost without adversely affect healthcare quality or outcomes. While this is an important consideration in selecting projects, there is limited power to detect many of the most clinically relevant outcomes. We find this acceptable because many of the sponsored Caring Wisely® project goals were to increase compliance with evidence-based practice guidelines and reduce harms associated with unnecessary treatments (eg, blood transfusion, nebulizer therapy, CT scan, antimicrobial therapy). Selected balancing metrics for each project are reported by established quality and safety programs at UCSF Health, but we acknowledge that many factors that can affect these clinical outcomes are not related to the cost-reduction intervention and are not possible to control outside of a clinical research study. Therefore, any response to changes in these outcome and balancing measures requires further analysis beyond the Caring Wisely® project alone.
We believe one of the key factors in the success of the Caring Wisely® program is the application of implementation science principles to the intervention design strategies (Table 1). These principles included stakeholder engagement, behavior change theory, market (target audience) segmentation, and process measurement and feedback. Because we are conducting this program in an academic health center, resident and fellow education and engagement are also critical to success. In each project, we utilize the PRECEDE model as a guide to ensure that each intervention design includes complementary elements of effective behavior change, intended to increase awareness and motivation to change, to make change “easy,” and to reinforce change(Table 2).3
The Caring Wisely® program—itself a multifaceted intervention—embodies the same PRECEDE dimensions we apply to each specific project. The Ideas Contest serves as a tool for increasing awareness, attitudes, and motivation across the clinical enterprise for reducing healthcare costs. The support provided to the project teams by the Caring Wisely® program is an enabling factor that makes it “easier” for frontline teams to design and implement interventions with a greater likelihood of achieving early success. Timely measurement and feedback of results to the hospital leadership and broadcasting to the larger community reinforces the support of the program at both the leadership and frontline levels.
Collaboration between project teams and the Caring Wisely® program also provides frontline clinicians and staff with practical experience and lessons that they can apply to future improvement work. Project teams learn implementation science principles such as constructing a pragmatic theoretical framework to guide implementation design using CFIR model.2 Incorporating multiple, rapid-cycle tests of change allows teams to modify and adapt final interventions as they learn how the target audience and environment responds to specific intervention components. Access to real-time, actionable data and a data analyst is essential to rapid cycle adaptation that allows teams to focus on specific units or providers. We also find that cross-fertilization between project teams working in different areas helps to share resources and minimize duplication of efforts from the clinical and staff champions. Partnering with UCSF Health system leaders at every phase of project development—from proposal selection, development, and final evaluation of results—enhances sustainable transition of successful projects into clinical operations.
The costs and coordination for the first cycle of Caring Wisely® were supported by the UCSF Center for Healthcare Value. Upon completion of the evaluation of the first cycle, UCSF Health agreed to fund the program going forward, with the expectation that Caring Wisely would continue to achieve direct cost-savings for the organization. The Caring Wisely team provides a final report each year detailing the impact of each project on utilization and associated costs. Currently, program costs are approximately $150,000 for the Caring Wisely program leaders, staff, and other resources, and $50,000 for each of 3 projects for a total program cost of $300,000 per year. Projects included in the first three cycles have already saved more than $4 million, representing a strong return on investment. This program could be a model for other academic health centers to engage frontline clinicians and staff in addressing healthcare costs, and lends itself to being scaled-up into a multi-system collaborative.
LIST OF ABBREVIATIONS
UCSF—University of California, San Francisco; PRECEDE—Predisposing, Reinforcing, and Enabling Constructs in Educational Diagnosis and Evaluation; PROCEED—Policy, Regulatory and Organizational Constructs in Educational and Environmental Development
Acknowledgments
Other participants in blood transfusion reduction project (D. Johnson, K. Curcione); IV-to-PO Switch (C. Tsourounis, A. Pollock); Surgical Supply Cost Reduction (C. Zygourakis); Perioperative Efficiency (L. Hampson); CT for PE Risk Prediction (E. Weber); ERAS Pathways (L. Chen); Neonatal Sepsis Risk Prediction (T. Newman); Post-Operative Debrief (S. Imershein). Caring Wisely Executive Steering Committee (J. Adler, S. Antrum, A Auerbach, J. Bennan, M. Blum, C. Ritchie, C. Tsourounis). This Center for Healthcare Value is funded in part by a grant from the Grove Foundation. We appreciate additional review and comments to the manuscript provided by George Sawaya and Adams Dudley.
Disclosures
Christopher Moriates has accepted royalties from McGraw-Hill for textbook, Understanding Value-Based Healthcare. Alvin Rajkomar has received fees as a research adviser from Google, Inc.
1. Kahlon M, Yuan L, Gologorskaya O, Johnston SC. Crowdsourcing the CTSA innovation mission. Clin Transl Sci. 2014;7:89-92. PubMed
2. Damschroder LJ, Aron DC, Keith RE, Kirsh SR, Alexander JA, Lowery JC. Fostering implementation of health services research findings into practice: a consolidated framework for advancing implementation science. Implement Sci. 2009;4:50. PubMed
3. Green LW and Kreuter. Health Program Planning: An Educational and Ecological Approach. 4th Ed. McGraw-Hill. New York, NY. 2005.
4. Zygourakis CC, Valencia V, Moriates C et al. Association between surgeon scorecard use and operating room costs. JAMA Surg. 2016 Dec 7. doi: 10.1001/jamasurg.2016.4674. [Epub ahead of print] PubMed
© 2017 Society of Hospital Medicine
Strategies are needed to empower frontline clinicians to work with organizational leadership to reduce healthcare costs and improve high-value care. Caring Wisely® is a program developed by the University of California, San Francisco’s (UCSF) Center for Healthcare Value (CHV), aimed at engaging frontline clinicians and staff, connecting them with implementation experts, and supporting the development of targeted interventions to improve value. Financial savings from the program more than cover program costs. Caring Wisely® provides an institutional model for implementing robust interventions to address areas of low-value care.
Launched in 2013, the annual Caring Wisely® program consists of 3 stages for identifying projects that meet the following criteria:
- Potential to measurably reduce UCSF Health’s costs of care without transferring costs to patients, insurers, or other providers
- Plan for ensuring that health outcomes are maintained or improved
- Envision disseminating the intervention within and beyond UCSF
- Demonstrate commitment and engagement of clinical leadership and frontline staff.
The first stage is the Ideas Contest, a UCSF Health-wide call (to learn more about UCSF Health: https://www.ucsf.edu/sites/default/files/052516_About_UCSF.pdf) to identify areas that may be targeted to reduce unnecessary services, inefficiencies, and healthcare costs. We use a crowdsourcing platform—Open Proposals—to solicit the best ideas from frontline clinicians and staff.1 Open Proposals is a secure, web-based platform for transparent and collaborative proposal development that displays threads of comments, responses, and revisions, and allows submissions to be “liked.” Open Proposals is managed by the UCSF Clinical and Translational Science Institute, funded by the National Center for Advancing Translational Sciences (Grant Number UL1 TR000004) at the National Institutes of Health. Using institutional e-mail lists for faculty, staff and residents, as well as described at monthly managers and directors meetings, the Ideas Contest is announced each year by the Chief Medical Officer and the CHV leadership. The Caring Wisely® Executive Steering Committee, which consists of CHV and senior UCSF Health system leaders, selects the top 5-10 ideas based on the above criteria. Each winning idea receives a $100 gift certificate for a popular restaurant in San Francisco, and the list of winners is announced to the entire UCSF community.
The second stage is the Request for Proposals. The Caring Wisely® program solicits proposals that outline implementation plans to target specific areas identified through the Ideas Contest. Finalists from the Ideas Contest are encouraged to submit proposals that address the problem they identified, but anyone affiliated with UCSF Health may submit a proposal on a winning idea. There is an approximately 4-week open submission period during which applicants submit brief 2-page proposals on the Open Proposal platform. This is followed by a period of optimization that leverages the social media aspect of the Open Proposals platform in which the UCSF Health community asks clarifying questions, make suggestions, and modifications can be made to the proposals. All submissions receive written feedback from at least one Steering Committee member. In addition, the Caring Wisely® Director directly invites relevant UCSF colleagues, administrators, or program leaders to comment on proposals and make suggestions for improvement. Plans for assessing financial and health care delivery impacts are developed in collaboration with the UCSF Health Finance department. UCSF Health managers and leaders who are stakeholders in project proposal areas are consulted to provide input and finalize proposal plans, including the identification of existing personnel who can support and drive the project forward. Proposers use this feedback to revise their applications throughout this stage.
The third stage is Project Implementation. The Caring Wisely® Executive Steering Committee selects up to 3 winners from the submitted proposals. Using the program criteria above, each project is scored independently, discussed in committee, and rescored to identify the top proposals. Each selected project receives a maximum budget of $50,000 that can be used for project materials, activities, and salary support for project leaders or staff. In addition to funding, each project team receives input from the implementation science team to co-develop and implement the intervention with a goal of creating a first-test-of-change within 3-6 months. A key feature of Caring Wisely® is the partnership between project teams and the Caring Wisely® implementation team, which includes a director, program manager, data analysts, and implementation scientists (Table 1).
The $150,000 administrative budget for the Caring Wisely® program provides 20% support of the medical director, 50% support of a program manager/analyst, and 10% support of an implementation scientist. Approximately 5% support is donated from additional senior implementation scientists and various UCSF Health experts based on project needs. To make most efficient use of the Caring Wisely® program staff time with the project teams, there is a weekly 60-90 minute works-in-progress session attended by all 3 teams with a rotating schedule for lead presenter during the first 6 months; these meetings occur every 2-3 weeks during the second 6 months. Caring Wisely® program staff and the implementation scientist are also available for 1:1 meetings as needed. The Caring Wisely® Executive Steering Committee is not paid and meets for 90 minutes quarterly. Custom reports and modifications of the electronic health record are provided by the UCSF Health clinical informatics department as part of their operating budget.
The collaboration between the project teams and the implementation science team is guided by the Consolidated Framework for Implementation Research (CFIR)2 and PRECEDE-PROCEED model—a logic model and evaluation tool that is based on a composite of individual behavior change theory and social ecology.3 Table 2 illustrates how we weave PRECEDE-PROCEED and Plan-Do-Study-Act frameworks into project design and strategy. Each funded team is required to submit an end-of-year progress report.
Cost and cost savings estimates were based on administrative financial data obtained through the assistance of the Decision Support Services unit of the Finance Department of UCSF Health. All costs reflect direct institutional costs, rather than charges. For some projects, costs are directly available through computerized dashboards that provide year-to-year comparisons of specific costs of materials, supplies, and services (eg, blood transfusion reduction, surgical supplies project, OR efficiency program). This same dashboard also allows calculation of CMI-adjusted direct costs of hospital care by service line, as used in the perioperative pathways program evaluation. In other cases, the Decision Support Services and/or Caring Wisely® program manager created custom cost reports based on the key performance indicator (eg, nebulizer therapy costs consist of medication costs plus respiratory therapist time; CT scan utilization for suspected pulmonary embolus in emergency department; and antimicrobial utilization for suspected neonatal sepsis).
Ongoing monitoring and sustainability of Caring Wisely® projects is supported by the Caring Wisely® program leaders. Monitoring of ongoing cost savings is based on automated service-line level dashboards related to cost, utilization, and quality outcomes with quarterly updates provided to the Caring Wisely® Steering Committee. Depending on the project or program, appropriate UCSF Health senior leaders determine the level of support within their departments that is required to sustain the program(s). Ongoing monitoring of each program is also included in the strategic deployment visibility room with regular rounding by senior health system executives.
Since 2013, there have been 3 complete Caring Wisely® cycles. The Ideas Contest generated more than 75 ideas in each of the past 3 cycles, ranging from eliminating redundant laboratory or radiological studies to reducing linen and food waste. We received between 13-20 full proposals in each of the request for proposal stages, and 9 projects have been implemented, 3 in each year. Funded projects have been led by a variety of individuals including physicians, nurses, pharmacists, administrators and residents, and topics have ranged from reducing overutilization of tests, supplies and treatments, to improving patient throughput during the perioperative period (Table 3). Estimated cumulative savings to date from Caring Wisely® projects has exceeded $4 million, based on the four projects shown in Table 4. The IV-to-PO switch program and the neonatal sepsis risk prediction project (Table 3) have been successful in reducing unnecessary utilization, but cost and savings estimates are not yet finalized. Three funded projects were equivocal in cost savings but were successful in their primary aims: (1) increasing the appropriateness of CT scan ordering for suspected pulmonary embolus; (2) shortening operating room turnover times; and (3) implementing a postoperative debrief program for the systematic documentation of safety events, waste, and inefficiencies related to surgery.
We developed an innovative program that reduces hospital costs through crowdsourcing of ideas from frontline clinicians and staff, and by connecting these ideas to project and implementation science teams. At a time when healthcare costs have reached unsustainable levels, the Caring Wisely® program provides a process for healthcare personnel to make a positive impact on healthcare costs in areas under their direct control. Through the Open Proposals platform, we have tapped a growing desire among frontline providers to reduce medical waste.
A key criterion for the Caring Wisely® program is to propose changes that reduce cost without adversely affect healthcare quality or outcomes. While this is an important consideration in selecting projects, there is limited power to detect many of the most clinically relevant outcomes. We find this acceptable because many of the sponsored Caring Wisely® project goals were to increase compliance with evidence-based practice guidelines and reduce harms associated with unnecessary treatments (eg, blood transfusion, nebulizer therapy, CT scan, antimicrobial therapy). Selected balancing metrics for each project are reported by established quality and safety programs at UCSF Health, but we acknowledge that many factors that can affect these clinical outcomes are not related to the cost-reduction intervention and are not possible to control outside of a clinical research study. Therefore, any response to changes in these outcome and balancing measures requires further analysis beyond the Caring Wisely® project alone.
We believe one of the key factors in the success of the Caring Wisely® program is the application of implementation science principles to the intervention design strategies (Table 1). These principles included stakeholder engagement, behavior change theory, market (target audience) segmentation, and process measurement and feedback. Because we are conducting this program in an academic health center, resident and fellow education and engagement are also critical to success. In each project, we utilize the PRECEDE model as a guide to ensure that each intervention design includes complementary elements of effective behavior change, intended to increase awareness and motivation to change, to make change “easy,” and to reinforce change(Table 2).3
The Caring Wisely® program—itself a multifaceted intervention—embodies the same PRECEDE dimensions we apply to each specific project. The Ideas Contest serves as a tool for increasing awareness, attitudes, and motivation across the clinical enterprise for reducing healthcare costs. The support provided to the project teams by the Caring Wisely® program is an enabling factor that makes it “easier” for frontline teams to design and implement interventions with a greater likelihood of achieving early success. Timely measurement and feedback of results to the hospital leadership and broadcasting to the larger community reinforces the support of the program at both the leadership and frontline levels.
Collaboration between project teams and the Caring Wisely® program also provides frontline clinicians and staff with practical experience and lessons that they can apply to future improvement work. Project teams learn implementation science principles such as constructing a pragmatic theoretical framework to guide implementation design using CFIR model.2 Incorporating multiple, rapid-cycle tests of change allows teams to modify and adapt final interventions as they learn how the target audience and environment responds to specific intervention components. Access to real-time, actionable data and a data analyst is essential to rapid cycle adaptation that allows teams to focus on specific units or providers. We also find that cross-fertilization between project teams working in different areas helps to share resources and minimize duplication of efforts from the clinical and staff champions. Partnering with UCSF Health system leaders at every phase of project development—from proposal selection, development, and final evaluation of results—enhances sustainable transition of successful projects into clinical operations.
The costs and coordination for the first cycle of Caring Wisely® were supported by the UCSF Center for Healthcare Value. Upon completion of the evaluation of the first cycle, UCSF Health agreed to fund the program going forward, with the expectation that Caring Wisely would continue to achieve direct cost-savings for the organization. The Caring Wisely team provides a final report each year detailing the impact of each project on utilization and associated costs. Currently, program costs are approximately $150,000 for the Caring Wisely program leaders, staff, and other resources, and $50,000 for each of 3 projects for a total program cost of $300,000 per year. Projects included in the first three cycles have already saved more than $4 million, representing a strong return on investment. This program could be a model for other academic health centers to engage frontline clinicians and staff in addressing healthcare costs, and lends itself to being scaled-up into a multi-system collaborative.
LIST OF ABBREVIATIONS
UCSF—University of California, San Francisco; PRECEDE—Predisposing, Reinforcing, and Enabling Constructs in Educational Diagnosis and Evaluation; PROCEED—Policy, Regulatory and Organizational Constructs in Educational and Environmental Development
Acknowledgments
Other participants in blood transfusion reduction project (D. Johnson, K. Curcione); IV-to-PO Switch (C. Tsourounis, A. Pollock); Surgical Supply Cost Reduction (C. Zygourakis); Perioperative Efficiency (L. Hampson); CT for PE Risk Prediction (E. Weber); ERAS Pathways (L. Chen); Neonatal Sepsis Risk Prediction (T. Newman); Post-Operative Debrief (S. Imershein). Caring Wisely Executive Steering Committee (J. Adler, S. Antrum, A Auerbach, J. Bennan, M. Blum, C. Ritchie, C. Tsourounis). This Center for Healthcare Value is funded in part by a grant from the Grove Foundation. We appreciate additional review and comments to the manuscript provided by George Sawaya and Adams Dudley.
Disclosures
Christopher Moriates has accepted royalties from McGraw-Hill for textbook, Understanding Value-Based Healthcare. Alvin Rajkomar has received fees as a research adviser from Google, Inc.
1. Kahlon M, Yuan L, Gologorskaya O, Johnston SC. Crowdsourcing the CTSA innovation mission. Clin Transl Sci. 2014;7:89-92. PubMed
2. Damschroder LJ, Aron DC, Keith RE, Kirsh SR, Alexander JA, Lowery JC. Fostering implementation of health services research findings into practice: a consolidated framework for advancing implementation science. Implement Sci. 2009;4:50. PubMed
3. Green LW and Kreuter. Health Program Planning: An Educational and Ecological Approach. 4th Ed. McGraw-Hill. New York, NY. 2005.
4. Zygourakis CC, Valencia V, Moriates C et al. Association between surgeon scorecard use and operating room costs. JAMA Surg. 2016 Dec 7. doi: 10.1001/jamasurg.2016.4674. [Epub ahead of print] PubMed
A Validated Delirium Prediction Rule
Delirium is characterized by fluctuating disturbances in cognition and consciousness and is a common complication of hospitalization in medical and surgical patients. Studies estimate the prevalence of delirium in hospitalized patients[1] to be 14% to 56%, and up to 70% in critically ill elderly patients.[2] Estimates of total healthcare costs associated with delirium range from $38 to $152 billion per year in the United States.[3] Delirious patients are more likely to be discharged to a nursing home and have increased hospital mortality and longer lengths of stay.[4, 5, 6] Recent data suggest long‐term effects of delirium including cognitive impairments up to 1 year following the illness[7] and an increased likelihood of developing[8] or worsening dementia.[9]
It is estimated that one‐third of hospital‐acquired delirium cases could be prevented with appropriate interventions.[10] A prediction rule that easily and accurately identifies high‐risk patients upon admission could therefore have a substantial clinical impact. In addition, a prediction rule could be used to identify patients in whom new targeted interventions for delirium prevention could be investigated. A number of risk factors for delirium have been identified, including older age, preexisting cognitive dysfunction, vision and hearing impairment, severe illness, dehydration, electrolyte abnormalities, overmedication, and alcohol abuse.[11, 12, 13, 14, 15, 16] Existing prediction rules using various combinations of these measures have been limited by their complexity,[17] do not predict incident delirium,[18, 19] or are restricted to surgical[20, 21, 22] or intensive care[23] patients and therefore are not broadly applicable to the general medical population, which is particularly susceptible to developing delirium.
We conducted this study to develop a simple, efficient, and accurate prediction rule for hospital‐acquired delirium in adult medical inpatients assessed at the time of admission. Our a priori hypothesis was that a delirium prediction rule would consist of a combination of known risk factors and most likely incorporate old age, illness severity, and preexisting cognitive dysfunction.
METHODS
Design and Setting
This was a prospective cohort study with a derivation phase from May 2010 to November 2010 at 2 hospitals at the University of California, San Francisco (UCSF) (Moffitt‐Long and Mount Zion Hospitals) and a validation phase from October 2011 to March 2012 at the San Francisco Veterans Affairs Medical Center (SFVAMC).
Participants and Measurements
Subject identification, recruitment, and inclusion and exclusion criteria were identical for the derivation and validation cohorts. Subjects were identified by reviewing daily admission logs. All non‐intensive care unit patients aged 50 years or older admitted through the emergency department to the medicine, cardiology, or neurology services were screened for eligibility through chart review or in person within 24 hours of admission by a trained research assistant. One research assistant, a college graduate, conducted all screening for the derivation cohort, and 2 research assistants, 1 a fourth‐year medical student and the other a third‐year psychology graduate student, conducted screening for the validation cohort. In‐person screening included an assessment for delirium using the long version of the Confusion Assessment Method (CAM).[24] To minimize the possibility of enrolling delirious subjects, research assistants were instructed to notify the study supervisor (V.C.D.), a board‐certified neurologist, to discuss every case in which any yes checkbox was marked on the CAM score sheet. Subjects delirious upon initial evaluation, admitted for alcohol withdrawal, admitted for comfort care, who were aphasic or who could not speak English were excluded. For all patients, or if they were unable to provide consent, their surrogates provided written informed consent, and the study was approved by the institutional review boards at UCSF and SFVAMC.
In the derivation cohort, 1241 patients were screened, and 439 were eligible for enrollment. Of these, 180 declined, 50 were discharged prior to the first follow‐up visit, and 209 were included. In the validation cohort, 420 patients were screened, and 368 were eligible for enrollment. Of these, 144 declined, 59 were discharged prior to the first follow‐up visit, and 165 were included.
Baseline data regarding known delirium risk factors[11, 12, 13, 14, 15, 16] were collected from subjects in the derivation cohort. Cognitive performance was assessed with the Mini Mental Status Examination (MMSE),[25] forward digit span,[26] and clock draw.[27] Permission for administration of the MMSE was granted by Psychological Assessment Resources, Inc., and each administration was paid for. A structured interview was conducted with validated questions regarding visual and hearing impairment, pain, mobility, place of residence, and alcohol, tobacco, and drug use.[28, 29, 30, 31] A whisper test for hearing loss was performed.[32] Subjects' charts were reviewed for demographic, clinical, and laboratory data. Illness severity was assessed by asking each subject's nurse to rate their patient on a scale from not ill to mildly ill, moderately ill, severely ill, or moribund.[33] Each nurse was shown these 5 choices, but more specific definitions of what each level of illness severity meant were not provided. We chose this method to assess illness severity because this rating scale was incorporated into a previous validated and widely cited delirium prediction rule.[17] This illness severity scale has been validated as a predictor of outcomes and correlates with other measures of illness severity and comorbidity when graded by physicians.[33, 34] Nurse and physician ratings of illness severity have been shown to be comparable,[35] and therefore if the scale were incorporated into the prediction rule it would allow nurses to perform it independently. In the validation cohort, only data required to complete the baseline CAM and apply the prediction rule were collected.
Assessment of Outcomes
All subjects were assessed for delirium daily for 6 days after enrollment or until discharge, whichever came first. Follow‐up was limited to 6 days, based on the assumption that delirium occurring beyond 1 week is more likely due to events during the hospitalization as opposed to factors measurable at admission. Delirium was assessed using the short CAM, an internationally recognized and validated tool.[24] To complete the CAM during follow‐up visits, subjects and their nurses were interviewed using a written script, and an MMSE and forward digit span were performed.
Daily follow‐up assessments were performed by research assistants who were not blinded to the initial assessment but who, in the validation phase, were blinded to the prediction rule score. Some weekend follow‐ups were performed by postgraduate year 2, 3, or 4 neurology residents, or internal medicine faculty experienced in the assessment of delirium and blinded to both the initial assessment and prediction rule score. Neurology residents and internists read the CAM training manual and were educated in the administration and scoring of the CAM by 1 of the senior investigators (V.C.D.) prior to their first shift; these nonstudy personnel covered 17 of 189 days of follow‐up in the derivation cohort and 21 of 169 days of follow‐up in the validation cohort. To maximize sensitivity of delirium detection, for any change in cognition, MMSE score, or forward digit span compared to baseline, a board‐certified neurologist blinded to the initial assessment was notified to discuss the case and validate the diagnosis of delirium in person (derivation cohort) or over the phone (validation cohort). All research assistants were trained by a board‐certified neurologist (V.C.D.) in the administration and interpretation of the CAM using published methods prior to enrollment of any subjects.[36] Training included the performance of independent long‐version CAMs by the trainer and the trainee on a series of delirious and nondelirious patients until there was consistent agreement for each item on the CAM in 5 consecutive patients. In addition, a board‐certified neurologist supervised the first 5 administrations of the CAM performed by each research assistant.
Statistical Analysis
Sample size for the derivation cohort was based on the predicted ability to detect a difference in rates of delirium among those with and without cognitive impairment, the strongest risk factor for delirium. Using a [2] test with an of 0.05 and of 0.80, we estimated we would need to enroll 260 subjects, assuming a prevalence of cognitive dysfunction in our cohort of 10% and an estimated rate of delirium of 24% and 6% among those with and without cognitive dysfunction respectively.[14, 16, 17, 20] We were unable to reach enrollment targets because of a short funding period and slower than expected recruitment.
To construct the prediction rule in the derivation cohort, all variables were dichotomized. Age was dichotomized at 80 years because old age is a known risk factor for delirium, and only 1 of 46 subjects between the ages of 70 and 80 years became delirious in the derivation cohort. Components of the MMSE were dichotomized as correct/emncorrect, with a correct response requiring perfect performance based on expert consensus. For 3 subjects who would not attempt to spell world backward (2 in the derivation and 1 in the validation cohort), their score on serial 7s was used instead. The total MMSE score was not used because our objective was to develop a prediction rule using elements that could be assessed quickly in the fast‐paced environment of the hospital. Illness severity was dichotomized at moderate or worse/mild or better because there were only 15 subjects in the severe illness category, and the majority of delirium (22 outcomes) occurred in the moderate illness category. High blood urea nitrogen:creatinine ratio was defined as >18.[37]
The association between predictor variables and occurrence of delirium was analyzed using univariate logistic regression. A forward stepwise logistic regression was then performed using the variables associated with the outcome at a significance level of P<0.05 in univariate analysis. Variables were eligible for addition to the multivariable model if they were associated with the outcome at a significance level of <0.05. The 4 independent predictors thus identified were combined into a prediction rule by assigning each predictor 1 point if present. The performance of the prediction rule was assessed by using Cuzick's nonparametric test for a trend across groups ordered by score.[38]
The prediction rule was tested in the validation cohort using the nonparametric test for trend. Receiver operating characteristic (ROC) curves were compared between the derivation and validation cohorts. All statistical analysis was performed using Stata software (StataCorp, College Station, TX).
RESULTS
The derivation cohort consisted of elderly patients (mean age, 68.0811.96 years; interquartile range, 5096 years), and included more males than females (54.1% vs 45.9%). Subjects were predominantly white (73.7%) and lived at home (90%) (Table 1). The mean admission MMSE score was 27.0 (standard deviation [SD], 3.4; range, 730). Median follow‐up was 2 days (interquartile range, 13). Delirium developed in 12% (n=25) of the cohort.
| Derivation Cohort, N=209 | Validation Cohort, N=165 | |
|---|---|---|
| ||
| Gender, No. (%) | ||
| Male | 113 (54) | 157 (95) |
| Female | 96 (46) | 8 (4.8) |
| Race, No. (%) | ||
| White | 154 (74) | 125 (76) |
| African American | 34 (16) | 25 (15) |
| Asian | 21 (10.0) | 13 (7.9) |
| Native American | 0 | 2 (1.2) |
| Illness severity, No. (%) | ||
| Not ill | 1 (0.5) | 0 |
| Mildly ill | 49 (23) | 62 (38) |
| Moderately ill | 129 (62) | 86 (52) |
| Severely ill | 15 (7.2) | 17 (10) |
| Moribund | 0 | 0 |
| Living situation, No. (%) | ||
| Home | 188 (90) | 147 (89) |
| Assisted living | 11 (5.3) | 6 (3.6) |
| Hotel | 4 (1.9) | 5 (3.0) |
| SNF | 1 (0.5) | 3 (1.8) |
| Homeless | 4 (1.9) | 4 (2.4) |
| Developed delirium | 25 (12) | 14 (8.5) |
Univariate analysis of the derivation study identified 10 variables significantly associated (P<0.05) with delirium (Table 2). Predictors of delirium included abnormal scores on 4 subtests of the MMSE, low score on the Mini‐Cog, living in an assisted living or skilled nursing facility, moderate to severe illness, old age, a past history of dementia, and hearing loss as assessed by the whisper test. These predictors were then entered into a stepwise logistic regression analysis that identified 4 independent predictors of delirium (Table 3).
| Variable | No. (%) Without Delirium | No. (%) With Delirium | Odds Ratio | P Value | 95% Confidence Interval |
|---|---|---|---|---|---|
| |||||
| Age 80 years | 30 (16) | 13 (52) | 5.6 | <0.001 | 2.313.4 |
| Male sex | 99 (54) | 14 (56) | 1.1 | 0.84 | 0.52.5 |
| White race | 135 (73) | 19 (76) | 1.2 | 0.78 | 0.433.1 |
| Score <5 on date questions of MMSE | 37 (20) | 12 (48) | 3.7 | 0.003 | 1.68.7 |
| Score <5 on place questions of MMSE | 50 (27) | 14 (56) | 3.4 | 0.005 | 1.58.0 |
| Score <3 on MMSE recall | 89 (48) | 18 (72) | 2.7 | 0.03 | 1.16.9 |
| Score <5 on MMSE W‐O‐R‐L‐D backward | 37 (20) | 13 (52) | 4.3 | 0.001 | 1.810.2 |
| Score 0 on MMSE pentagon copy, n=203 | 53 (30) | 12 (48) | 2.2 | 0.07 | 0.935.1 |
| Score 0 on clock draw, n=203 | 70 (39) | 15 (60) | 2.3 | 0.05 | 0.985.4 |
| MiniCog score 02, n=203[27] | 46 (26) | 12 (48) | 2.7 | 0.03 | 1.16.2 |
| Self‐rated vision fair, poor, or very poor | 55 (30) | 8 (32) | 1.1 | 0.83 | 0.452.7 |
| Endorses hearing loss | 89 (48) | 12 (48) | 0.99 | 0.97 | 0.432.3 |
| Uses hearing aid | 19 (10) | 2 (8) | 0.76 | 0.72 | 0.173.5 |
| Fails whisper test in either ear | 39 (21) | 10 (40) | 2.5 | 0.04 | 1.05.9 |
| Prior episode of delirium per patient or informant | 70 (38) | 13 (52) | 1.8 | 0.19 | 0.764.1 |
| Dementia in past medical history | 3 (2) | 3 (12) | 8.2 | 0.01 | 1.643.3 |
| Depression in past medical history | 16 (9) | 1 (4) | 0.44 | 0.43 | 0.063.5 |
| Lives in assisted living or SNF | 8 (4) | 4 (16) | 4.2 | 0.03 | 1.215.1 |
| Endorses pain | 82 (45) | 7 (28) | 0.48 | 0.12 | 0.191.2 |
| Less than independent for transfers | 11 (6) | 3 (12) | 2.1 | 0.27 | 0.568.3 |
| Less than independent for mobility on a level surface | 36 (20) | 7 (28) | 1.6 | 0.33 | 0.624.1 |
| Score of 24 on CAGE questionnaire[29] | 5 (3) | 0 (0) | No outcomes | ||
| Drinks any alcohol | 84 (46) | 10 (40) | 0.79 | 0.60 | 0.341.9 |
| Current smoker | 20 (11) | 2 (8) | 0.71 | 0.66 | 0.164.1 |
| Uses illicit drugs | 13 (7) | 2 (8) | 1.2 | 0.83 | 0.255.6 |
| Moderately or severely ill on nursing assessment, n=194 | 121 (71) | 23 (96) | 9.3 | 0.031 | 1.270.9 |
| Fever | 8 (4) | 0 (0) | No outcomes | ||
| Serum sodium <134mmol/L | 38 (21) | 3 (12) | 0.52 | 0.31 | 0.151.8 |
| WBC count>10109/L, n=208 | 57 (31) | 6 (24) | 0.70 | 0.47 | 0.261.8 |
| AST>41 U/L, n=131 | 27 (23) | 2 (15) | 0.61 | 0.54 | 0.132.9 |
| BUN:Cr>18, n=208 | 66 (36) | 13 (52) | 1.9 | 0.13 | 0.834.5 |
| Infection as admission diagnosis | 28 (15) | 4 (16) | 1.1 | 0.92 | 0.343.3 |
| Variable | Odds Ratio | 95% Confidence Interval | P Value | Points Toward AWOL Score |
|---|---|---|---|---|
| Age 80 years | 5.7 | 2.115.6 | 0.001 | 1 |
| Unable to correctly spell world backward | 3.5 | 1.39.6 | 0.01 | 1 |
| Not oriented to city, state, county, hospital name, and floor | 2.9 | 1.17.9 | 0.03 | 1 |
| Nursing illness severity assessment of moderately ill, severely ill, or moribund (as opposed to not ill or mildly ill) | 10.5 | 1.386.9 | 0.03 | 1 |
These 4 independent predictors were assigned 1 point each if present to create a prediction rule with a range of possible scores from 0 to 4. There was a significant trend predicting higher rates of delirium with higher scores, with no subjects who scored 0 becoming delirious, compared to 40% of those subjects scoring 3 or 4 (P for trend<0.001) (Table 4).
| Derivation Cohorta | Validation Cohort | Combined Cohorts | ||||
|---|---|---|---|---|---|---|
| AWOL Score | Not Delirious | Delirious | Not Delirious | Delirious | Not Delirious | Delirious |
| ||||||
| 0 | 26 (100%) | 0 (0%) | 24 (96%) | 1 (4%) | 49 (98%) | 1 (2%) |
| 1 | 86 (95%) | 5 (5%) | 57 (97%) | 2 (3%) | 136 (96%) | 5 (4%) |
| 2 | 41 (85%) | 7 (15%) | 44 (90%) | 5 (10%) | 92 (86%) | 15 (14%) |
| 3 | 17 (74%) | 6 (26%) | 22 (79%) | 6 (21%) | 40 (80%) | 10 (20%) |
| 4 | 0 (0%) | 6 (100%) | 4 (100%) | 0 (0%) | 4 (36%) | 7 (64%) |
| Total | 170 | 24 | 151 | 14 | 321 | 38 |
| P<0.001 | P=0.025 | P<0.001 | ||||
The validation cohort consisted of adults with a mean age of 70.7210.6 years, (interquartile range, 5194 years), who were predominantly white (75.8%) and overwhelmingly male (95.2%) (Table 1). The mean admission MMSE score was 26.75 (SD, 2.8; range, 1730). Median follow‐up was 2 days (interquartile range, 15). Delirium developed in 8.5% (n=14) of the cohort. In the validation cohort, 4% of subjects with a score of 0 became delirious, whereas 19% of those scoring 3 or 4 became delirious (P for trend 0.025) (Table 4).
ROC curves were compared for the derivation and validation cohorts. The area under the ROC curve for the derivation cohort (0.81, 95% confidence interval [CI]: 0.720.90) was slightly better than that in the validation cohort (0.69, 95% CI: 0.540.83), but the difference did not reach statistical significance (P=0.14) (Figure 1).

DISCUSSION
We derived and validated a prediction rule to assess the risk of developing delirium in hospitalized adult medical patients. Four variables easily assessed on admission in a screen lasting less than 2 minutes were independently associated with the development of delirium. The prediction rule can be remembered with the following mnemonic: AWOL (Age80 years; unable to spell World backward; not fully Oriented to place; and moderate or severe iLlness severity).
It is estimated up to a third of hospital acquired delirium cases can be prevented.[10] Recent guidelines recommend the use of a multicomponent intervention to prevent delirium and provide evidence that such a strategy would be cost‐effective.[39] Nevertheless, such interventions are resource intense, requiring specialized nurse training and staffing[40] and have not been widely implemented. Acute care for the elderly units, where interventions to prevent delirium might logically be implemented, also require physical remodeling to provide carpeted hallways, handrails, and elevated toilet seats and door levers.[41] A method of risk stratification to identify the patients who would benefit most from resource‐intensive prevention strategies would be valuable.
The AWOL tool may provide a practical alternative to existing delirium prediction rules for adult medical inpatients. Because it can be completed by a nurse in <2 minutes, the AWOL tool may be easier to apply and disseminate than a previously described score relying on the MMSE, Acute Physiology and Chronic Health Evaluation scores, and measured visual acuity.[17] Two other tools, 1 based on chart abstraction[18] and the other based on clinical variables measured at admission,[19] are similarly easy to apply but only predict prevalent and not incident delirium, making them less clinically useful.
This study's strengths include its prospective cohort design and the derivation and validation being performed in different hospitals. The derivation cohort consisted of patients admitted to a tertiary care academic medical center or an affiliated hospital where routine mixed gender general medical patients are treated, whereas validation was performed at the SFVAMC, where patients are predominantly older men with a high incidence of vascular risk factors. The outcome was assessed on a daily basis, and the likelihood any cases were missed was low. Although there is some potential for bias because the outcome was assessed by a research assistant not blinded to baseline characteristics, this was mitigated by having each outcome validated by a blinded neurologist and in the validation cohort having the research assistant blinded to the AWOL score. Other strengths are the broad inclusion criteria, with both middle‐aged and elderly patients having a wide range of medical and neurological conditions, allowing for wide application of the results. Although many studies of delirium focus on patients over age 70 years, we chose to include patients aged 50 years or older because hospital‐acquired delirium still occurs in this age group (17 of 195 [8%] patients aged 5069 years became delirious in this study), and risk factors such as severe illness and cognitive dysfunction are likely to be predictors of delirium even at younger ages. Additionally, the inclusion of nurses' clinical judgment to assess illness severity using a straightforward rating scale allows bedside nurses to readily administer the prediction rule in practice.[34]
This study has several potential limitations. The number of outcomes in the derivation cohort was small compared to the number of predictors chosen for the prediction rule. This could potentially have led to overfitting the model in the derivation cohort and thus an overly optimistic estimation of the model's performance. In the validation cohort, the area under the ROC curve was lower than in the derivation cohort, and although the difference did not reach statistical significance, this may have been due to the small sample size. In addition, none of the 4 subjects with an AWOL score of 4 became delirious, potentially reflecting poor calibration of the prediction rule. However, the trend of higher rates of delirium among subjects with higher AWOL scores still reached statistical significance, and the prediction rule demonstrated good discrimination between patients at high and low risk for developing delirium.
To test whether a better prediction tool could be derived from our data, we combined the derivation and validation cohorts and repeated a stepwise multivariable logistic regression with the same variables used for derivation of the AWOL tool (with the exception of the whisper test of hearing and a past medical history of dementia, because these data were not collected in the validation cohort). This model produced the same 4 independent predictors of delirium used in the AWOL tool. We then used bootstrapping to internally validate the prediction rule, suggesting that the predictors in the AWOL tool were the best fit for the available data. However, given the small number of outcomes in our study, the AWOL tool may benefit from further validation in a larger independent cohort to more precisely calibrate the number of expected outcomes with each score.
Although the majority of medical inpatients were eligible for enrollment in our study, some populations were excluded, and our results may not generalize to these populations. Non‐English speaking patients were excluded to preserve the validity of our study instruments. In addition, patients with profound aphasia or an admission diagnosis of alcohol withdrawal were excluded. Patients discharged on the first day of their hospitalization were excluded either because they were discharged prior to screening or prior to their first follow‐up visit. Therefore, our results may only be valid in patients who remained in the hospital for over 24 hours. In addition, because we only included medical patients, our results cannot necessarily be generalized to the surgical population.
Finally, parts of the prediction rule (orientation and spelling world backward) are also components of the CAM and were used in the assessment of the outcome, and this may introduce a potential tautology: if patients are disoriented or have poor attention because they cannot spell world backward at admission, they already have fulfilled part of the criteria for delirium. However, a diagnosis of delirium using the CAM involves a comprehensive patient and caregiver interview, and in addition to poor attention, requires the presence of an acute change in mental status and disorganized thinking or altered level of consciousness. Therefore, it is possible, and common, for patients to be disoriented to place and/or unable to spell world backward, yet not be delirious, and predicting a subsequent change in cognition during the hospitalization is still clinically important. It is possible the AWOL tool works by identifying patients with impaired attention and subclinical delirium, but one could argue this makes a strong case for its validity because these patients especially should be triaged to an inpatient unit that specializes in delirium prevention. It is also possible the cognitive tasks that are part of the AWOL tool detect preexisting cognitive impairment, which is in turn a major risk factor for delirium.
Recognizing and classifying the risk of delirium during hospitalization is imperative, considering the illness' significant contribution to healthcare costs, morbidity, and mortality. The cost‐effectiveness of proven interventions to detect and prevent delirium could be magnified with focused implementation in those patients at highest risk.[39, 40, 41] Further research is required to determine whether the combination of delirium prediction rules such as those developed here and prevention strategies will result in decreased rates of delirium and economic savings for the healthcare system.
Acknowledgments
The following University of California, San Francisco neurology residents provided follow‐up of study subjects on weekends and were financially compensated: Amar Dhand, MD, DPhil; Tim West, MD; Sarah Shalev, MD; Karen DaSilva, MD; Mark Burish, MD, PhD; Maggie Waung, MD, PhD; Raquel Gardner, MD; Molly Burnett, MD; Adam Ziemann, MD, PhD; Kathryn Kvam, MD; Neel Singhal, MD, PhD; James Orengo, MD, PhD; Kelly Mills, MD; and Joanna Hellmuth, MD, MHS. The authors are grateful to Dr. Douglas Bauer for assisting with the study design.
Disclosures
Drs. Douglas, Hessler, Dhaliwal, Betjemann, Lucatorto, Johnston, Josephson, and Ms. Fukuda and Ms. Alameddine have no conflicts of interest or financial disclosures. This research was made possible by the Ruth E. Raskin Fund and a UCSF Dean's Research Scholarship. These funding agencies had no role in the design and conduct of the study; collection, management, analysis, and interpretation of the data; and preparation, review, or approval of the manuscript.
- , , . Occurrence and outcome of delirium in medical in‐patients: a systematic literature review. Age Ageing. 2006;35(4):350–364.
- , , , , , . Delirium in the intensive care unit: occurrence and clinical course in older patients. J Am Geriatr Soc. 2003;51(5):591–598.
- , , , , . One‐year health care costs associated with delirium in the elderly population. Arch Intern Med. 2008;168(1):27–32.
- , , , , . Does delirium contribute to poor hospital outcomes? A three‐site epidemiologic study. J Gen Intern Med. 1998;13(4):234–242.
- , , , , , . Delirium duration and mortality in lightly sedated, mechanically ventilated intensive care patients. Crit Care Med. 2010;38(12):2311–2318.
- , , , et al. Delirium epidemiology in critical care (DECCA): an international study. Crit Care. 2010;14(6):R210.
- , , , et al. Delirium as a predictor of long‐term cognitive impairment in survivors of critical illness. Crit Care Med. 2010;38(7):1513–1520.
- , , , , , . Delirium in elderly patients and the risk of postdischarge mortality, institutionalization, and dementia: a meta‐analysis. JAMA. 2010;304(4):443–451.
- , , , et al. Adverse outcomes after hospitalization and delirium in persons with Alzheimer disease. Ann Intern Med. 2012;156(12):848–856.
- , , , et al. A multicomponent intervention to prevent delirium in hospitalized older patients. N Engl J Med. 1999;340(9):669–676.
- , , , et al. Simple cognitive testing (Mini‐Cog) predicts in‐hospital delirium in the elderly. J Am Geriatr Soc. 2007;55(2):314–316.
- , , . A prospective study of delirium in hospitalized elderly. JAMA. 1990;263(8):1097–1101.
- , . Precipitating factors for delirium in hospitalized elderly persons. Predictive model and interrelationship with baseline vulnerability. JAMA. 1996;275(11):852–857.
- , , , , , . Risk factors for delirium at discharge: development and validation of a predictive model. Arch Intern Med. 2007;167(13):1406–1413.
- , . Delirium in vascular surgery. Eur J Vasc Endovasc Surg. 2007;34(2):131–134.
- , , , , , . Delirium in hospitalized older persons: outcomes and predictors. J Am Geriatr Soc. 1994;42(8):809–815.
- , , , , . A predictive model for delirium in hospitalized elderly medical patients based on admission characteristics. Ann Intern Med. 1993;119(6):474–481.
- , , , , , . Validation of a medical record‐based delirium risk assessment. J Am Geriatr Soc. 2011;59(suppl 2):S289–S294.
- , , , et al. Derivation and validation of a clinical prediction rule for delirium in patients admitted to a medical ward: an observational study. BMJ Open. 2012;2(5) pii: e001599.
- , , , et al. A clinical prediction rule for delirium after elective noncardiac surgery. JAMA. 1994;271(2):134–139.
- , , , , , . Prediction of postoperative delirium after abdominal surgery in the elderly. J Anesth. 2009;23(1):51–56.
- , , , et al. Derivation and validation of a preoperative prediction rule for delirium after cardiac surgery. Circulation. 2009;119(2):229–236.
- , , , et al. Development and validation of PRE‐DELIRIC (PREdiction of DELIRium in ICu patients) delirium prediction model for intensive care patients: observational multicentre study. BMJ. 2012;344:e420.
- , , , , , . Clarifying confusion: the confusion assessment method. A new method for detection of delirium. Ann Intern Med. 1990;113(12):941–948.
- , , . “Mini‐mental state”. A practical method for grading the cognitive state of patients for the clinician. J Psychiatr Res. 1975;12(3):189–198.
- . Wechsler Memory Scale‐III. New York, NY: Psychological Corp.; 1997.
- , , , , . The mini‐cog: a cognitive 'vital signs' measure for dementia screening in multi‐lingual elderly. Int J Geriatr Psychiatry. 2000;15(11):1021–1027.
- , . Functional evaluation: the Barthel index. Md State Med J. 1965;14:61–65.
- , , . The CAGE questionnaire: validation of a new alcoholism screening instrument. Am J Psychiatry. 1974;131(10):1121–1123.
- , , , , , . Is the NEI‐VFQ‐25 a useful tool in identifying visual impairment in an elderly population? BMC Ophthalmol. 2006;6:24.
- , , , et al. Validation of self‐reported hearing loss. The Blue Mountains Hearing Study. Int J Epidemiol. 2001;30(6):1371–1378.
- , , . Does this patient have hearing impairment? JAMA. 2006;295(4):416–428.
- , , , , , . Realizing the potential of clinical judgment: a real‐time strategy for predicting outcomes and cost for medical inpatients. Am J Med. 2000;109(3):189–195.
- , , , , , . Assessing illness severity: does clinical judgment work? J Chronic Dis. 1986;39(6):439–452.
- , , , , , . Prognostication in acutely admitted older patients by nurses and physicians. J Gen Intern Med. 2008;23(11):1883–1889.
- . The Confusion Assessment Method (CAM): Training Manual and Coding Guide. New Haven, CT: Yale University School of Medicine; 2003.
- , , , . Acute confusional states and dementia in the elderly: the role of dehydration/volume depletion, physical illness and age. Age Ageing. 1980;9(3):137–146.
- . A Wilcoxon‐type test for trend. Stat Med. 1985;4(1):87–90.
- , , , . Synopsis of the National Institute for Health and Clinical Excellence guideline for prevention of delirium. Ann Intern Med. 2011;154(11):746–751.
- , , , , . The Hospital Elder Life Program: a model of care to prevent cognitive and functional decline in older hospitalized patients. Hospital Elder Life Program. J Am Geriatr Soc. 2000;48(12):1697–1706.
- , , , , . A randomized trial of care in a hospital medical unit especially designed to improve the functional outcomes of acutely ill older patients. N Engl J Med. 1995;332(20):1338–1344.
Delirium is characterized by fluctuating disturbances in cognition and consciousness and is a common complication of hospitalization in medical and surgical patients. Studies estimate the prevalence of delirium in hospitalized patients[1] to be 14% to 56%, and up to 70% in critically ill elderly patients.[2] Estimates of total healthcare costs associated with delirium range from $38 to $152 billion per year in the United States.[3] Delirious patients are more likely to be discharged to a nursing home and have increased hospital mortality and longer lengths of stay.[4, 5, 6] Recent data suggest long‐term effects of delirium including cognitive impairments up to 1 year following the illness[7] and an increased likelihood of developing[8] or worsening dementia.[9]
It is estimated that one‐third of hospital‐acquired delirium cases could be prevented with appropriate interventions.[10] A prediction rule that easily and accurately identifies high‐risk patients upon admission could therefore have a substantial clinical impact. In addition, a prediction rule could be used to identify patients in whom new targeted interventions for delirium prevention could be investigated. A number of risk factors for delirium have been identified, including older age, preexisting cognitive dysfunction, vision and hearing impairment, severe illness, dehydration, electrolyte abnormalities, overmedication, and alcohol abuse.[11, 12, 13, 14, 15, 16] Existing prediction rules using various combinations of these measures have been limited by their complexity,[17] do not predict incident delirium,[18, 19] or are restricted to surgical[20, 21, 22] or intensive care[23] patients and therefore are not broadly applicable to the general medical population, which is particularly susceptible to developing delirium.
We conducted this study to develop a simple, efficient, and accurate prediction rule for hospital‐acquired delirium in adult medical inpatients assessed at the time of admission. Our a priori hypothesis was that a delirium prediction rule would consist of a combination of known risk factors and most likely incorporate old age, illness severity, and preexisting cognitive dysfunction.
METHODS
Design and Setting
This was a prospective cohort study with a derivation phase from May 2010 to November 2010 at 2 hospitals at the University of California, San Francisco (UCSF) (Moffitt‐Long and Mount Zion Hospitals) and a validation phase from October 2011 to March 2012 at the San Francisco Veterans Affairs Medical Center (SFVAMC).
Participants and Measurements
Subject identification, recruitment, and inclusion and exclusion criteria were identical for the derivation and validation cohorts. Subjects were identified by reviewing daily admission logs. All non‐intensive care unit patients aged 50 years or older admitted through the emergency department to the medicine, cardiology, or neurology services were screened for eligibility through chart review or in person within 24 hours of admission by a trained research assistant. One research assistant, a college graduate, conducted all screening for the derivation cohort, and 2 research assistants, 1 a fourth‐year medical student and the other a third‐year psychology graduate student, conducted screening for the validation cohort. In‐person screening included an assessment for delirium using the long version of the Confusion Assessment Method (CAM).[24] To minimize the possibility of enrolling delirious subjects, research assistants were instructed to notify the study supervisor (V.C.D.), a board‐certified neurologist, to discuss every case in which any yes checkbox was marked on the CAM score sheet. Subjects delirious upon initial evaluation, admitted for alcohol withdrawal, admitted for comfort care, who were aphasic or who could not speak English were excluded. For all patients, or if they were unable to provide consent, their surrogates provided written informed consent, and the study was approved by the institutional review boards at UCSF and SFVAMC.
In the derivation cohort, 1241 patients were screened, and 439 were eligible for enrollment. Of these, 180 declined, 50 were discharged prior to the first follow‐up visit, and 209 were included. In the validation cohort, 420 patients were screened, and 368 were eligible for enrollment. Of these, 144 declined, 59 were discharged prior to the first follow‐up visit, and 165 were included.
Baseline data regarding known delirium risk factors[11, 12, 13, 14, 15, 16] were collected from subjects in the derivation cohort. Cognitive performance was assessed with the Mini Mental Status Examination (MMSE),[25] forward digit span,[26] and clock draw.[27] Permission for administration of the MMSE was granted by Psychological Assessment Resources, Inc., and each administration was paid for. A structured interview was conducted with validated questions regarding visual and hearing impairment, pain, mobility, place of residence, and alcohol, tobacco, and drug use.[28, 29, 30, 31] A whisper test for hearing loss was performed.[32] Subjects' charts were reviewed for demographic, clinical, and laboratory data. Illness severity was assessed by asking each subject's nurse to rate their patient on a scale from not ill to mildly ill, moderately ill, severely ill, or moribund.[33] Each nurse was shown these 5 choices, but more specific definitions of what each level of illness severity meant were not provided. We chose this method to assess illness severity because this rating scale was incorporated into a previous validated and widely cited delirium prediction rule.[17] This illness severity scale has been validated as a predictor of outcomes and correlates with other measures of illness severity and comorbidity when graded by physicians.[33, 34] Nurse and physician ratings of illness severity have been shown to be comparable,[35] and therefore if the scale were incorporated into the prediction rule it would allow nurses to perform it independently. In the validation cohort, only data required to complete the baseline CAM and apply the prediction rule were collected.
Assessment of Outcomes
All subjects were assessed for delirium daily for 6 days after enrollment or until discharge, whichever came first. Follow‐up was limited to 6 days, based on the assumption that delirium occurring beyond 1 week is more likely due to events during the hospitalization as opposed to factors measurable at admission. Delirium was assessed using the short CAM, an internationally recognized and validated tool.[24] To complete the CAM during follow‐up visits, subjects and their nurses were interviewed using a written script, and an MMSE and forward digit span were performed.
Daily follow‐up assessments were performed by research assistants who were not blinded to the initial assessment but who, in the validation phase, were blinded to the prediction rule score. Some weekend follow‐ups were performed by postgraduate year 2, 3, or 4 neurology residents, or internal medicine faculty experienced in the assessment of delirium and blinded to both the initial assessment and prediction rule score. Neurology residents and internists read the CAM training manual and were educated in the administration and scoring of the CAM by 1 of the senior investigators (V.C.D.) prior to their first shift; these nonstudy personnel covered 17 of 189 days of follow‐up in the derivation cohort and 21 of 169 days of follow‐up in the validation cohort. To maximize sensitivity of delirium detection, for any change in cognition, MMSE score, or forward digit span compared to baseline, a board‐certified neurologist blinded to the initial assessment was notified to discuss the case and validate the diagnosis of delirium in person (derivation cohort) or over the phone (validation cohort). All research assistants were trained by a board‐certified neurologist (V.C.D.) in the administration and interpretation of the CAM using published methods prior to enrollment of any subjects.[36] Training included the performance of independent long‐version CAMs by the trainer and the trainee on a series of delirious and nondelirious patients until there was consistent agreement for each item on the CAM in 5 consecutive patients. In addition, a board‐certified neurologist supervised the first 5 administrations of the CAM performed by each research assistant.
Statistical Analysis
Sample size for the derivation cohort was based on the predicted ability to detect a difference in rates of delirium among those with and without cognitive impairment, the strongest risk factor for delirium. Using a [2] test with an of 0.05 and of 0.80, we estimated we would need to enroll 260 subjects, assuming a prevalence of cognitive dysfunction in our cohort of 10% and an estimated rate of delirium of 24% and 6% among those with and without cognitive dysfunction respectively.[14, 16, 17, 20] We were unable to reach enrollment targets because of a short funding period and slower than expected recruitment.
To construct the prediction rule in the derivation cohort, all variables were dichotomized. Age was dichotomized at 80 years because old age is a known risk factor for delirium, and only 1 of 46 subjects between the ages of 70 and 80 years became delirious in the derivation cohort. Components of the MMSE were dichotomized as correct/emncorrect, with a correct response requiring perfect performance based on expert consensus. For 3 subjects who would not attempt to spell world backward (2 in the derivation and 1 in the validation cohort), their score on serial 7s was used instead. The total MMSE score was not used because our objective was to develop a prediction rule using elements that could be assessed quickly in the fast‐paced environment of the hospital. Illness severity was dichotomized at moderate or worse/mild or better because there were only 15 subjects in the severe illness category, and the majority of delirium (22 outcomes) occurred in the moderate illness category. High blood urea nitrogen:creatinine ratio was defined as >18.[37]
The association between predictor variables and occurrence of delirium was analyzed using univariate logistic regression. A forward stepwise logistic regression was then performed using the variables associated with the outcome at a significance level of P<0.05 in univariate analysis. Variables were eligible for addition to the multivariable model if they were associated with the outcome at a significance level of <0.05. The 4 independent predictors thus identified were combined into a prediction rule by assigning each predictor 1 point if present. The performance of the prediction rule was assessed by using Cuzick's nonparametric test for a trend across groups ordered by score.[38]
The prediction rule was tested in the validation cohort using the nonparametric test for trend. Receiver operating characteristic (ROC) curves were compared between the derivation and validation cohorts. All statistical analysis was performed using Stata software (StataCorp, College Station, TX).
RESULTS
The derivation cohort consisted of elderly patients (mean age, 68.0811.96 years; interquartile range, 5096 years), and included more males than females (54.1% vs 45.9%). Subjects were predominantly white (73.7%) and lived at home (90%) (Table 1). The mean admission MMSE score was 27.0 (standard deviation [SD], 3.4; range, 730). Median follow‐up was 2 days (interquartile range, 13). Delirium developed in 12% (n=25) of the cohort.
| Derivation Cohort, N=209 | Validation Cohort, N=165 | |
|---|---|---|
| ||
| Gender, No. (%) | ||
| Male | 113 (54) | 157 (95) |
| Female | 96 (46) | 8 (4.8) |
| Race, No. (%) | ||
| White | 154 (74) | 125 (76) |
| African American | 34 (16) | 25 (15) |
| Asian | 21 (10.0) | 13 (7.9) |
| Native American | 0 | 2 (1.2) |
| Illness severity, No. (%) | ||
| Not ill | 1 (0.5) | 0 |
| Mildly ill | 49 (23) | 62 (38) |
| Moderately ill | 129 (62) | 86 (52) |
| Severely ill | 15 (7.2) | 17 (10) |
| Moribund | 0 | 0 |
| Living situation, No. (%) | ||
| Home | 188 (90) | 147 (89) |
| Assisted living | 11 (5.3) | 6 (3.6) |
| Hotel | 4 (1.9) | 5 (3.0) |
| SNF | 1 (0.5) | 3 (1.8) |
| Homeless | 4 (1.9) | 4 (2.4) |
| Developed delirium | 25 (12) | 14 (8.5) |
Univariate analysis of the derivation study identified 10 variables significantly associated (P<0.05) with delirium (Table 2). Predictors of delirium included abnormal scores on 4 subtests of the MMSE, low score on the Mini‐Cog, living in an assisted living or skilled nursing facility, moderate to severe illness, old age, a past history of dementia, and hearing loss as assessed by the whisper test. These predictors were then entered into a stepwise logistic regression analysis that identified 4 independent predictors of delirium (Table 3).
| Variable | No. (%) Without Delirium | No. (%) With Delirium | Odds Ratio | P Value | 95% Confidence Interval |
|---|---|---|---|---|---|
| |||||
| Age 80 years | 30 (16) | 13 (52) | 5.6 | <0.001 | 2.313.4 |
| Male sex | 99 (54) | 14 (56) | 1.1 | 0.84 | 0.52.5 |
| White race | 135 (73) | 19 (76) | 1.2 | 0.78 | 0.433.1 |
| Score <5 on date questions of MMSE | 37 (20) | 12 (48) | 3.7 | 0.003 | 1.68.7 |
| Score <5 on place questions of MMSE | 50 (27) | 14 (56) | 3.4 | 0.005 | 1.58.0 |
| Score <3 on MMSE recall | 89 (48) | 18 (72) | 2.7 | 0.03 | 1.16.9 |
| Score <5 on MMSE W‐O‐R‐L‐D backward | 37 (20) | 13 (52) | 4.3 | 0.001 | 1.810.2 |
| Score 0 on MMSE pentagon copy, n=203 | 53 (30) | 12 (48) | 2.2 | 0.07 | 0.935.1 |
| Score 0 on clock draw, n=203 | 70 (39) | 15 (60) | 2.3 | 0.05 | 0.985.4 |
| MiniCog score 02, n=203[27] | 46 (26) | 12 (48) | 2.7 | 0.03 | 1.16.2 |
| Self‐rated vision fair, poor, or very poor | 55 (30) | 8 (32) | 1.1 | 0.83 | 0.452.7 |
| Endorses hearing loss | 89 (48) | 12 (48) | 0.99 | 0.97 | 0.432.3 |
| Uses hearing aid | 19 (10) | 2 (8) | 0.76 | 0.72 | 0.173.5 |
| Fails whisper test in either ear | 39 (21) | 10 (40) | 2.5 | 0.04 | 1.05.9 |
| Prior episode of delirium per patient or informant | 70 (38) | 13 (52) | 1.8 | 0.19 | 0.764.1 |
| Dementia in past medical history | 3 (2) | 3 (12) | 8.2 | 0.01 | 1.643.3 |
| Depression in past medical history | 16 (9) | 1 (4) | 0.44 | 0.43 | 0.063.5 |
| Lives in assisted living or SNF | 8 (4) | 4 (16) | 4.2 | 0.03 | 1.215.1 |
| Endorses pain | 82 (45) | 7 (28) | 0.48 | 0.12 | 0.191.2 |
| Less than independent for transfers | 11 (6) | 3 (12) | 2.1 | 0.27 | 0.568.3 |
| Less than independent for mobility on a level surface | 36 (20) | 7 (28) | 1.6 | 0.33 | 0.624.1 |
| Score of 24 on CAGE questionnaire[29] | 5 (3) | 0 (0) | No outcomes | ||
| Drinks any alcohol | 84 (46) | 10 (40) | 0.79 | 0.60 | 0.341.9 |
| Current smoker | 20 (11) | 2 (8) | 0.71 | 0.66 | 0.164.1 |
| Uses illicit drugs | 13 (7) | 2 (8) | 1.2 | 0.83 | 0.255.6 |
| Moderately or severely ill on nursing assessment, n=194 | 121 (71) | 23 (96) | 9.3 | 0.031 | 1.270.9 |
| Fever | 8 (4) | 0 (0) | No outcomes | ||
| Serum sodium <134mmol/L | 38 (21) | 3 (12) | 0.52 | 0.31 | 0.151.8 |
| WBC count>10109/L, n=208 | 57 (31) | 6 (24) | 0.70 | 0.47 | 0.261.8 |
| AST>41 U/L, n=131 | 27 (23) | 2 (15) | 0.61 | 0.54 | 0.132.9 |
| BUN:Cr>18, n=208 | 66 (36) | 13 (52) | 1.9 | 0.13 | 0.834.5 |
| Infection as admission diagnosis | 28 (15) | 4 (16) | 1.1 | 0.92 | 0.343.3 |
| Variable | Odds Ratio | 95% Confidence Interval | P Value | Points Toward AWOL Score |
|---|---|---|---|---|
| Age 80 years | 5.7 | 2.115.6 | 0.001 | 1 |
| Unable to correctly spell world backward | 3.5 | 1.39.6 | 0.01 | 1 |
| Not oriented to city, state, county, hospital name, and floor | 2.9 | 1.17.9 | 0.03 | 1 |
| Nursing illness severity assessment of moderately ill, severely ill, or moribund (as opposed to not ill or mildly ill) | 10.5 | 1.386.9 | 0.03 | 1 |
These 4 independent predictors were assigned 1 point each if present to create a prediction rule with a range of possible scores from 0 to 4. There was a significant trend predicting higher rates of delirium with higher scores, with no subjects who scored 0 becoming delirious, compared to 40% of those subjects scoring 3 or 4 (P for trend<0.001) (Table 4).
| Derivation Cohorta | Validation Cohort | Combined Cohorts | ||||
|---|---|---|---|---|---|---|
| AWOL Score | Not Delirious | Delirious | Not Delirious | Delirious | Not Delirious | Delirious |
| ||||||
| 0 | 26 (100%) | 0 (0%) | 24 (96%) | 1 (4%) | 49 (98%) | 1 (2%) |
| 1 | 86 (95%) | 5 (5%) | 57 (97%) | 2 (3%) | 136 (96%) | 5 (4%) |
| 2 | 41 (85%) | 7 (15%) | 44 (90%) | 5 (10%) | 92 (86%) | 15 (14%) |
| 3 | 17 (74%) | 6 (26%) | 22 (79%) | 6 (21%) | 40 (80%) | 10 (20%) |
| 4 | 0 (0%) | 6 (100%) | 4 (100%) | 0 (0%) | 4 (36%) | 7 (64%) |
| Total | 170 | 24 | 151 | 14 | 321 | 38 |
| P<0.001 | P=0.025 | P<0.001 | ||||
The validation cohort consisted of adults with a mean age of 70.7210.6 years, (interquartile range, 5194 years), who were predominantly white (75.8%) and overwhelmingly male (95.2%) (Table 1). The mean admission MMSE score was 26.75 (SD, 2.8; range, 1730). Median follow‐up was 2 days (interquartile range, 15). Delirium developed in 8.5% (n=14) of the cohort. In the validation cohort, 4% of subjects with a score of 0 became delirious, whereas 19% of those scoring 3 or 4 became delirious (P for trend 0.025) (Table 4).
ROC curves were compared for the derivation and validation cohorts. The area under the ROC curve for the derivation cohort (0.81, 95% confidence interval [CI]: 0.720.90) was slightly better than that in the validation cohort (0.69, 95% CI: 0.540.83), but the difference did not reach statistical significance (P=0.14) (Figure 1).
DISCUSSION
We derived and validated a prediction rule to assess the risk of developing delirium in hospitalized adult medical patients. Four variables easily assessed on admission in a screen lasting less than 2 minutes were independently associated with the development of delirium. The prediction rule can be remembered with the following mnemonic: AWOL (Age80 years; unable to spell World backward; not fully Oriented to place; and moderate or severe iLlness severity).
It is estimated up to a third of hospital acquired delirium cases can be prevented.[10] Recent guidelines recommend the use of a multicomponent intervention to prevent delirium and provide evidence that such a strategy would be cost‐effective.[39] Nevertheless, such interventions are resource intense, requiring specialized nurse training and staffing[40] and have not been widely implemented. Acute care for the elderly units, where interventions to prevent delirium might logically be implemented, also require physical remodeling to provide carpeted hallways, handrails, and elevated toilet seats and door levers.[41] A method of risk stratification to identify the patients who would benefit most from resource‐intensive prevention strategies would be valuable.
The AWOL tool may provide a practical alternative to existing delirium prediction rules for adult medical inpatients. Because it can be completed by a nurse in <2 minutes, the AWOL tool may be easier to apply and disseminate than a previously described score relying on the MMSE, Acute Physiology and Chronic Health Evaluation scores, and measured visual acuity.[17] Two other tools, 1 based on chart abstraction[18] and the other based on clinical variables measured at admission,[19] are similarly easy to apply but only predict prevalent and not incident delirium, making them less clinically useful.
This study's strengths include its prospective cohort design and the derivation and validation being performed in different hospitals. The derivation cohort consisted of patients admitted to a tertiary care academic medical center or an affiliated hospital where routine mixed gender general medical patients are treated, whereas validation was performed at the SFVAMC, where patients are predominantly older men with a high incidence of vascular risk factors. The outcome was assessed on a daily basis, and the likelihood any cases were missed was low. Although there is some potential for bias because the outcome was assessed by a research assistant not blinded to baseline characteristics, this was mitigated by having each outcome validated by a blinded neurologist and in the validation cohort having the research assistant blinded to the AWOL score. Other strengths are the broad inclusion criteria, with both middle‐aged and elderly patients having a wide range of medical and neurological conditions, allowing for wide application of the results. Although many studies of delirium focus on patients over age 70 years, we chose to include patients aged 50 years or older because hospital‐acquired delirium still occurs in this age group (17 of 195 [8%] patients aged 5069 years became delirious in this study), and risk factors such as severe illness and cognitive dysfunction are likely to be predictors of delirium even at younger ages. Additionally, the inclusion of nurses' clinical judgment to assess illness severity using a straightforward rating scale allows bedside nurses to readily administer the prediction rule in practice.[34]
This study has several potential limitations. The number of outcomes in the derivation cohort was small compared to the number of predictors chosen for the prediction rule. This could potentially have led to overfitting the model in the derivation cohort and thus an overly optimistic estimation of the model's performance. In the validation cohort, the area under the ROC curve was lower than in the derivation cohort, and although the difference did not reach statistical significance, this may have been due to the small sample size. In addition, none of the 4 subjects with an AWOL score of 4 became delirious, potentially reflecting poor calibration of the prediction rule. However, the trend of higher rates of delirium among subjects with higher AWOL scores still reached statistical significance, and the prediction rule demonstrated good discrimination between patients at high and low risk for developing delirium.
To test whether a better prediction tool could be derived from our data, we combined the derivation and validation cohorts and repeated a stepwise multivariable logistic regression with the same variables used for derivation of the AWOL tool (with the exception of the whisper test of hearing and a past medical history of dementia, because these data were not collected in the validation cohort). This model produced the same 4 independent predictors of delirium used in the AWOL tool. We then used bootstrapping to internally validate the prediction rule, suggesting that the predictors in the AWOL tool were the best fit for the available data. However, given the small number of outcomes in our study, the AWOL tool may benefit from further validation in a larger independent cohort to more precisely calibrate the number of expected outcomes with each score.
Although the majority of medical inpatients were eligible for enrollment in our study, some populations were excluded, and our results may not generalize to these populations. Non‐English speaking patients were excluded to preserve the validity of our study instruments. In addition, patients with profound aphasia or an admission diagnosis of alcohol withdrawal were excluded. Patients discharged on the first day of their hospitalization were excluded either because they were discharged prior to screening or prior to their first follow‐up visit. Therefore, our results may only be valid in patients who remained in the hospital for over 24 hours. In addition, because we only included medical patients, our results cannot necessarily be generalized to the surgical population.
Finally, parts of the prediction rule (orientation and spelling world backward) are also components of the CAM and were used in the assessment of the outcome, and this may introduce a potential tautology: if patients are disoriented or have poor attention because they cannot spell world backward at admission, they already have fulfilled part of the criteria for delirium. However, a diagnosis of delirium using the CAM involves a comprehensive patient and caregiver interview, and in addition to poor attention, requires the presence of an acute change in mental status and disorganized thinking or altered level of consciousness. Therefore, it is possible, and common, for patients to be disoriented to place and/or unable to spell world backward, yet not be delirious, and predicting a subsequent change in cognition during the hospitalization is still clinically important. It is possible the AWOL tool works by identifying patients with impaired attention and subclinical delirium, but one could argue this makes a strong case for its validity because these patients especially should be triaged to an inpatient unit that specializes in delirium prevention. It is also possible the cognitive tasks that are part of the AWOL tool detect preexisting cognitive impairment, which is in turn a major risk factor for delirium.
Recognizing and classifying the risk of delirium during hospitalization is imperative, considering the illness' significant contribution to healthcare costs, morbidity, and mortality. The cost‐effectiveness of proven interventions to detect and prevent delirium could be magnified with focused implementation in those patients at highest risk.[39, 40, 41] Further research is required to determine whether the combination of delirium prediction rules such as those developed here and prevention strategies will result in decreased rates of delirium and economic savings for the healthcare system.
Acknowledgments
The following University of California, San Francisco neurology residents provided follow‐up of study subjects on weekends and were financially compensated: Amar Dhand, MD, DPhil; Tim West, MD; Sarah Shalev, MD; Karen DaSilva, MD; Mark Burish, MD, PhD; Maggie Waung, MD, PhD; Raquel Gardner, MD; Molly Burnett, MD; Adam Ziemann, MD, PhD; Kathryn Kvam, MD; Neel Singhal, MD, PhD; James Orengo, MD, PhD; Kelly Mills, MD; and Joanna Hellmuth, MD, MHS. The authors are grateful to Dr. Douglas Bauer for assisting with the study design.
Disclosures
Drs. Douglas, Hessler, Dhaliwal, Betjemann, Lucatorto, Johnston, Josephson, and Ms. Fukuda and Ms. Alameddine have no conflicts of interest or financial disclosures. This research was made possible by the Ruth E. Raskin Fund and a UCSF Dean's Research Scholarship. These funding agencies had no role in the design and conduct of the study; collection, management, analysis, and interpretation of the data; and preparation, review, or approval of the manuscript.
- , , . Occurrence and outcome of delirium in medical in‐patients: a systematic literature review. Age Ageing. 2006;35(4):350–364.
- , , , , , . Delirium in the intensive care unit: occurrence and clinical course in older patients. J Am Geriatr Soc. 2003;51(5):591–598.
- , , , , . One‐year health care costs associated with delirium in the elderly population. Arch Intern Med. 2008;168(1):27–32.
- , , , , . Does delirium contribute to poor hospital outcomes? A three‐site epidemiologic study. J Gen Intern Med. 1998;13(4):234–242.
- , , , , , . Delirium duration and mortality in lightly sedated, mechanically ventilated intensive care patients. Crit Care Med. 2010;38(12):2311–2318.
- , , , et al. Delirium epidemiology in critical care (DECCA): an international study. Crit Care. 2010;14(6):R210.
- , , , et al. Delirium as a predictor of long‐term cognitive impairment in survivors of critical illness. Crit Care Med. 2010;38(7):1513–1520.
- , , , , , . Delirium in elderly patients and the risk of postdischarge mortality, institutionalization, and dementia: a meta‐analysis. JAMA. 2010;304(4):443–451.
- , , , et al. Adverse outcomes after hospitalization and delirium in persons with Alzheimer disease. Ann Intern Med. 2012;156(12):848–856.
- , , , et al. A multicomponent intervention to prevent delirium in hospitalized older patients. N Engl J Med. 1999;340(9):669–676.
- , , , et al. Simple cognitive testing (Mini‐Cog) predicts in‐hospital delirium in the elderly. J Am Geriatr Soc. 2007;55(2):314–316.
- , , . A prospective study of delirium in hospitalized elderly. JAMA. 1990;263(8):1097–1101.
- , . Precipitating factors for delirium in hospitalized elderly persons. Predictive model and interrelationship with baseline vulnerability. JAMA. 1996;275(11):852–857.
- , , , , , . Risk factors for delirium at discharge: development and validation of a predictive model. Arch Intern Med. 2007;167(13):1406–1413.
- , . Delirium in vascular surgery. Eur J Vasc Endovasc Surg. 2007;34(2):131–134.
- , , , , , . Delirium in hospitalized older persons: outcomes and predictors. J Am Geriatr Soc. 1994;42(8):809–815.
- , , , , . A predictive model for delirium in hospitalized elderly medical patients based on admission characteristics. Ann Intern Med. 1993;119(6):474–481.
- , , , , , . Validation of a medical record‐based delirium risk assessment. J Am Geriatr Soc. 2011;59(suppl 2):S289–S294.
- , , , et al. Derivation and validation of a clinical prediction rule for delirium in patients admitted to a medical ward: an observational study. BMJ Open. 2012;2(5) pii: e001599.
- , , , et al. A clinical prediction rule for delirium after elective noncardiac surgery. JAMA. 1994;271(2):134–139.
- , , , , , . Prediction of postoperative delirium after abdominal surgery in the elderly. J Anesth. 2009;23(1):51–56.
- , , , et al. Derivation and validation of a preoperative prediction rule for delirium after cardiac surgery. Circulation. 2009;119(2):229–236.
- , , , et al. Development and validation of PRE‐DELIRIC (PREdiction of DELIRium in ICu patients) delirium prediction model for intensive care patients: observational multicentre study. BMJ. 2012;344:e420.
- , , , , , . Clarifying confusion: the confusion assessment method. A new method for detection of delirium. Ann Intern Med. 1990;113(12):941–948.
- , , . “Mini‐mental state”. A practical method for grading the cognitive state of patients for the clinician. J Psychiatr Res. 1975;12(3):189–198.
- . Wechsler Memory Scale‐III. New York, NY: Psychological Corp.; 1997.
- , , , , . The mini‐cog: a cognitive 'vital signs' measure for dementia screening in multi‐lingual elderly. Int J Geriatr Psychiatry. 2000;15(11):1021–1027.
- , . Functional evaluation: the Barthel index. Md State Med J. 1965;14:61–65.
- , , . The CAGE questionnaire: validation of a new alcoholism screening instrument. Am J Psychiatry. 1974;131(10):1121–1123.
- , , , , , . Is the NEI‐VFQ‐25 a useful tool in identifying visual impairment in an elderly population? BMC Ophthalmol. 2006;6:24.
- , , , et al. Validation of self‐reported hearing loss. The Blue Mountains Hearing Study. Int J Epidemiol. 2001;30(6):1371–1378.
- , , . Does this patient have hearing impairment? JAMA. 2006;295(4):416–428.
- , , , , , . Realizing the potential of clinical judgment: a real‐time strategy for predicting outcomes and cost for medical inpatients. Am J Med. 2000;109(3):189–195.
- , , , , , . Assessing illness severity: does clinical judgment work? J Chronic Dis. 1986;39(6):439–452.
- , , , , , . Prognostication in acutely admitted older patients by nurses and physicians. J Gen Intern Med. 2008;23(11):1883–1889.
- . The Confusion Assessment Method (CAM): Training Manual and Coding Guide. New Haven, CT: Yale University School of Medicine; 2003.
- , , , . Acute confusional states and dementia in the elderly: the role of dehydration/volume depletion, physical illness and age. Age Ageing. 1980;9(3):137–146.
- . A Wilcoxon‐type test for trend. Stat Med. 1985;4(1):87–90.
- , , , . Synopsis of the National Institute for Health and Clinical Excellence guideline for prevention of delirium. Ann Intern Med. 2011;154(11):746–751.
- , , , , . The Hospital Elder Life Program: a model of care to prevent cognitive and functional decline in older hospitalized patients. Hospital Elder Life Program. J Am Geriatr Soc. 2000;48(12):1697–1706.
- , , , , . A randomized trial of care in a hospital medical unit especially designed to improve the functional outcomes of acutely ill older patients. N Engl J Med. 1995;332(20):1338–1344.
Copyright © 2013 Society of Hospital Medicine
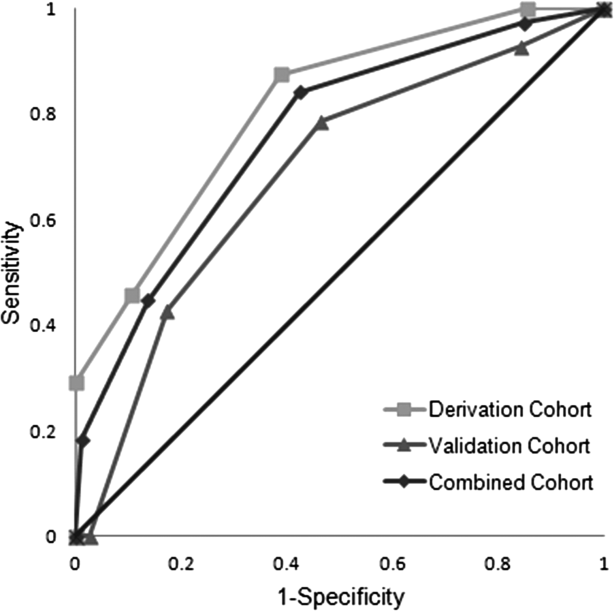
Physician Specialty and Ischemic Stroke Outcomes
The appropriate role of specialists in hospital management of common medical conditions has been vigorously debated.13 Few argue that specialists serve an important role as consultants, but whether patients with specific conditions should be admitted to the care of specialists or generalists is unresolved. This is demonstrated by the large degree of hospital‐to‐hospital variability in the proportion of patients with myocardial infarction admitted to cardiologists,4 patients with asthma exacerbations admitted to pulmonologists,5 and patients with renal failure admitted to nephrologists.6
Stroke is another common diagnosis, with variable rates of admission to specialists and generalists. Several prior studies have suggested that outcomes after ischemic stroke are better if a neurologist is the attending physician.710 However, these observational studies could not rule out the possibility that differences in outcome were a result of prognosis at the time of admission rather than improvements in medical care. Although these studies have controlled for known prognostic variables, it is possible that unknown, unmeasured, or inadequately measured variables were different in the groups admitted to neurologists and the groups admitted to generalists. These differences, in turn, might account for outcome differences rather than specialist care.
This form of selection bias, a type of confounding by indication, is a constant threat to validity in observational studies. Randomized trials avoid it because the randomization process balances all prognostic variables, both known and unknown, in the treatment groups.11 Observational studies cannot guarantee the same balance of unmeasured risk factors.12 Multivariate modeling is meant to account for prognostic differences between groups in observational studies, but confounding by indication may remain if all the factors that determine prognosis are not accurately measured. We developed a method to avoid confounding by indication by evaluating individual outcome differences associated with practice variability.13 This technique, termed grouped‐treatment (GT) analysis, is related to the instrumental variable approach developed by economists and occasionally applied to health services research.14
In multivariate GT analyses, the institutional proportion of cases admitted to the care of a neurologist is used as a predictor of outcomes rather than whether an individual patient was admitted to neurology. For example, at a hospital where three‐fourths of acute stroke patients are admitted to neurology, all patients are treated as having a 75% chance of admission to neurology. Rather than denoting whether each patient's specialist attending was a neurologist or a generalist, the 0.75 probability of admission to neurology is used for analysis. If admission to an attending neurologist improves ischemic stroke care, then GT analysis should demonstrate that hospitals admitting higher proportions of stroke patients to neurologists have improved outcomes regardless of whether there is selection bias at the individual patient level. In this way, the method bypasses unmeasured confounders at the individual level in its estimates of treatment effects. The method is susceptible to confounding at the group level; that is, unmeasured prognostic differences in patients admitted to hospitals that rely more heavily on neurologists could bias the GT estimate of treatment effect. The GT estimates are accurate if it can be assumed that a hospital's rate of treatment is not associated (in an unmeasured way) with its patient population's intrinsic, pretreatment prognosis. However, practice variability is very common between hospitals and is generally poorly associated with systematic differences in prognosis of treated patients,15, 16 and in this setting GT provides an independent assessment of treatment effect that may either confirm or refute an association found at the individual level, where confounding is nearly always an important issue.
In this study, we evaluated the impact of admission to a neurologist or generalist on outcomes of ischemic stroke patients treated at academic medical centers throughout the United States. We also compared traditional analysis to GT analysis. In doing so, we demonstrate the influence of unmeasured confounders on observational assessments of specialist care and may provide a more accurate measure of the impact of care by a neurologist on outcomes after ischemic stroke.
MATERIALS AND METHODS
We used the University HealthSystem Consortium (UHC) administrative database, which contained patient information from 84 large academic health centers and their 39 associate hospitals, with more than 2.1 million discharges each year.17 We obtained UHC discharge abstracts for all ischemic stroke patients admitted through emergency departments from 1997 through 1999. Discharge abstracts included patient demographics, urgency status (emergent, urgent, elective), illness severity class, admitting and discharge specialties, discharge diagnoses, procedure codes, in‐hospital mortality, length of stay, and total hospital charges. Patients were identified using International Classification of Diseases, Ninth Revision (ICD‐9) codes that were previously recognized as specific indicators of acute ischemic stroke (ICD‐9 433.01, 433.11, 433.21, 433.31, 433.81, 433.91, 434.01, 434.11, 434.91, 436).1820 We limited the cohort to emergency department admissions in order to reduce the likelihood of referral bias.
Variables in the discharge database were validated by comparison with a detailed medical record review. Between June and December 1999, 42 institutions participating in a quality improvement project identified 30 consecutive ischemic stroke cases. Trained analysts or clinicians abstracted information on demographics, medical history, and treatment. Kappa statistics have been previously reported for all individual characteristics except hospital charges, for which medical record review data were not available.21 Demographic and clinical variables in the administrative database tended to agree well with medical record review, with agreement ranging from 85% to 100% (kappa 0.581.00). Because the admitting attending likely directed acute stroke management, this was used to define a patient's attending physician specialty in all analyses. Administrative coding of tissue plasminogen activator (tPA) use was imperfect, with a sensitivity of 50% but a specificity of 100%.22
Institutional rate of admission to neurologists versus generalists was calculated as the percentage over the entire study duration. Unadjusted logistic regression was used to compare the distribution of patient pretreatment prognostic factors between institutions above and below the 50th percentile to determine a rate of admission to neurology because generalized estimating equations that could account for clustering were unable to support these models as a result of diverging estimates. We calculated the yearly volume of ischemic strokes treated at an institution from discharge abstracts, including admissions from all sources, because all treated cases would be expected to increase physician experience.
In‐hospital mortality was chosen as the primary outcome because of its frequency, importance, and coding reliability. Univariate predictors of in‐hospital mortality were identified using Pearson's chi‐square and the Wilcoxon rank sum tests.23 Length of stay (LOS), total hospital charges, and receipt of tPA were secondary outcomes. LOS and total hospital charges were compared using the Wilcoxon rank sum test. LOS and total charge calculations included only those patients surviving to discharge so that early mortality would not be confused with more efficient care. Similarly, we compared demographics and clinical variables of patients admitted to the care of neurologists with those of patients admitted to the care of generalists. To evaluate variability between institutions, we determined the proportion of patients with specific characteristics and outcomes at each institution and report median values and the 10th‐ to 90th‐percentile range among the institutions. The correlation between institutional rate of admission and institutional rate of mortality was evaluated.
In standard multivariate analysis, we assessed physician specialty as a predictor of in‐hospital mortality of individual patients after adjustment for demographic characteristics, admission status (emergent, urgent, elective), comorbid illness severity score (range 04, from 0 = no substantial comorbid illness to 4 = catastrophic comorbid illness), and annual institutional treatment volume of ischemic stroke. UHC defined severity class to represent an individual's overall calculated risk of illness; its value was dependent on the refinement of the Health Care Facility Administration's diagnosis‐related groups (DRGs) and the Sach's Complication Profiler count of total comorbidities present.24, 25 Effects on LOS and total charges, as well as the ability of physician specialty to predict tPA use in individual patients, were similarly evaluated. Analysis of tPA use was restricted to patients admitted to universities that ever coded tPA use, which increased the sensitivity of the indicator to 57%.22 Residual misclassification error of tPA use would be expected to obscure a true underlying association between its use and physician specialty.
In multivariate GT calculations, we used the institutional proportion of cases admitted to a neurologist as a predictor of outcomes. GT analysis is based on the observation that if a treatment is effective, hospitals that use it more frequently should have better patient outcomes and that this association should persist regardless of whether individual‐level selection bias is present. The method assumes that hospital rates of admission to neurology are independent on the patient population's pretreatment prognosis. Because utilization differences between hospitals likely reflect practice variability rather than differences in patient prognosis,15, 16 the influence of unmeasured confounders at the hospital level is expected to be small. Measured variables that proved significant in univariate analyses or were thought to be responsible for an association between overall patient prognosis and modalities and frequencies of acute stroke treatments used, such as institutional treatment volume, were included in the multivariate GT model in order to isolate the effect of increasing rates of admission to neurologists.
We included both institutional and individual data to more accurately specify individual outcomes and covariates compared with an analysis that simply compared institutions' characteristics and their outcomes.26 Generalized estimating equations (GEE) were used in order to account for institutional clustering of predictor variables and outcomes. GEE is similar to logistic regression but produces broader confidence intervals (CIs) because logistic regression ignores the possibility that individuals at institutions are more similar to each other than would be expected by chance alone. We used a compound symmetry correlation structure, which initiates modeling by assuming a constant correlation between observations within each institution as well as between institutions, and used a logistic link function for binary outcomes in order to mimic logistic regression. The natural log transformations of LOS and hospital charges were modeled to reduce positive skew and approximate a normal distribution, and an identity link function was used in GEE to mimic linear regression for these analyses. To evaluate the impact of adjustment, both unadjusted and adjusted analyses were conducted. Methods to calculate power of GT analysis are not available. The Stata statistical package was used for all analyses (version 8.0; Stata Corporation, College Station, TX).
RESULTS
A total of 26,925 patients with ischemic strokes were admitted to neurologists or generalists through the emergency department at 113 institutions participating in the study. Patients admitted to neurologists rather than generalists (Table 1) were younger and more likely to be male, but less likely to have a serious comorbid illness. Institutions varied widely in the demographics of treated patients as well as in the markers of pretreatment prognosis. Institutional annual case volume of all ischemic strokes ranged from 1 to 741. Mortality rate, mean LOS, and mean hospital charges also varied broadly between institutions (Table 1). Patients treated at institutions whose rate of admissions to a neurologist's care was in the upper 50th percentile were younger and more often male, but did not differ in illness severity class (Table 2).
| Characteristic | Neurologist (n = 16,287) | Generalist (n = 10,638) | Institutional (n = 113) median (10th90th percentiles) |
|---|---|---|---|
| |||
| Age (years), mean (SD) | 66.2 (14.7) | 69.3 (15.2) | 67.7 (62.174.8) |
| Female, n (%) | 8291 (51) | 5904 (56) | 54% (46%67%) |
| Ethnicity | |||
| African American, n (%) | 4516 (28) | 3335 (31) | 19% (0%71%) |
| Asian American, n (%) | 570 (4) | 201 (2) | 0.7% (0%8%) |
| Hispanic, n (%) | 906 (6) | 458 (4) | 0.7% (0%16%) |
| Native American, Eskimo, n (%) | 48 (0) | 21 (0) | 0% (0%1%) |
| White, n (%) | 9012 (55) | 5851 (55) | 65% (10%95%) |
| Other ethnicity, n (%) | 398 (2) | 157 (1) | 0.3% (0%4%) |
| Unknown, n (%) | 837 (5) | 615 (6) | 0.1% (0%9%) |
| Comorbid illness severity score,* median (interquartile range) | 1 (01) | 1 (01) | 0.83 (0.650.95) |
| Treatment and outcome | |||
| tPA administered, n (%) | 132 (3) | 51 (2) | 1.9% (0.6%6.5%) |
| In‐hospital deaths, n (%) | 755 (5) | 1005 (9) | 6.1% (3%10%) |
| Discharges to home, n (%) | 9504 (59) | 5235 (49) | 52% (38%72%) |
| Length of stay (days), mean (SD) | 6.6 (7.2) | 7.9 (9.9) | 6.6 (4.210.0) |
| Total charges | $16,600 ($20,500) | $18,700 ($26,300) | $15,000 ($9000$30,000) |
| Characteristic | <50th percentile | >50th percentile | P value |
|---|---|---|---|
| |||
| Age (years), mean (SD) | 66.7 (15.2) | 69.4 (14.3) | <.001 |
| Female, n (%) | 5288 (54) | 8907 (52) | .001 |
| Comorbid illness severity score*, median (interquartile range) | 1 (01) | 1 (01) | .87 |
There were 1760 in‐hospital deaths (7.0%). In univariate analysis, older age (P < .001), white ethnicity (P < .001), emergent stroke (P < .001), and increased illness severity (P < .001) were associated with greater risk of death, whereas African‐American (P < .001) and Hispanic (P = .007) ethnicities were protective. No other patient characteristics were important, and institutional annual case volume showed no association with mortality risk.
Overall, 60% of patients with ischemic stroke were admitted to a neurologist's care. In univariate analysis (Table 3), a lower risk of in‐hospital mortality was observed in cases admitted to neurologists (4.6%) compared with those admitted to generalists (9.5%; P < .001). After adjustment in standard multivariable models, the association between neurologist admission and lower risk of death persisted (OR 0.60; 95% CI, 0.500.72; P < .001).
| Characteristics | Unadjusted | Adjusted | ||
|---|---|---|---|---|
| Odds ratio (95% CI) | P value | Odds ratio (95% CI) | P value | |
| ||||
| Mortality | ||||
| Attending neurologist | 0.32 (0.260.39) | <.001 | 0.60 (0.500.72) | <.001 |
| Proportion of admissions to neurology | 1.05 (0.851.31) | .64 | 1.02 (0.791.30) | .90 |
| tPA Use | ||||
| Attending neurologist | 1.87 (1.302.69) | .001 | 2.56 (1.723.78) | <.001 |
| Proportion of admissions to neurology | 2.32 (0.985.49) | .06 | 2.47 (1.085.65) | .03 |
The institutional rate of admission of ischemic stroke patients to neurologists ranged from 0% to 90%, and higher rates were seen at hospitals with higher institutional case volumes (P < .001). There was no correlation between the institutional rate of admission to neurology and the institutional mortality rate (0.33; P = .73). At the individual‐level, greater rates of admission to neurologists had no significant impact on mortality (OR 1.05; 95% CI, 0.851.31; P = .64; Table 3) in unadjusted analysis. After adjustment for patient demographics, comorbid illness severity score, urgency status, and institutional case volume in GT analysis, there remained no association between death and proportion of ischemic stroke cases admitted to neurologists (OR 1.02; 95% CI, 0.791.30; P = .90), consistent with the absence of an association between neurologist care and in‐hospital mortality.
Patients treated by neurologists were likely to have shorter stays (P < .001) and lower charges (P = .01) in univariate analysis (Table 4). In traditional adjusted multivariable analysis, the same associations were seen for LOS (P < .001) and charges (P = .05). However, in adjusted GT analyses, increased institutional rate of admission to neurologists was not associated with briefer LOS (P = .36) and was associated with greater hospital charges (P = .044).
| Characteristic | Unadjusted Analysis | Adjusted ratio* | |||
|---|---|---|---|---|---|
| Neurologist | Generalist | P value | Ratio (95% CI) | P value | |
| |||||
| LOS (days), n = 25,094 | |||||
| Standard analysis | 6.6 | 8.0 | <.001 | 0.92 (0.880.96) | <.001 |
| Group‐treatment analysis | 7.2 | 7.1 | .80 | 1.06 (0.941.19) | .35 |
| Total Charges, n = 21,812 | |||||
| Standard analysis | $16,600 | $18,700 | .01 | 0.95 (0.911.00) | .05 |
| Group‐treatment analysis | $17,800 | $16,900 | <.001 | 1.26 (1.011.57) | .04 |
In 1999, 190 (2.2%) ischemic stroke patients received tPA at the 64 universities that had ever coded tPA use. In univariate analysis, patients admitted to a neurologist were more likely to have received tPA (P = .001; Table 3), and this association persisted after adjustment (P < .001). In adjusted GT analysis, institutions admitting a higher proportion of ischemic stroke patients to neurologists also treated patients with tPA more frequently (P = .033).
DISCUSSION
Several prior studies found that ischemic stroke outcomes were better when an attending neurologist was responsible for patient care.710 Traditional analyses of our data also indicate that care by a neurologist lowers inpatient mortality, LOS, and total charges. By contrast, a GT analysis that bypasses selection bias at the patient level suggests there is no independent benefit of neurologist care on mortality or LOS and actually shows higher associated charges.
The discrepancy between standard and GT analyses suggests that healthier patients may have been preferentially admitted to the care of neurologists. Measured pretreatment prognostic factors in our data present a mixed picture. Patients admitted to a neurologist's care were younger, more often male, more often emergently admitted, and less likely to have serious comorbid illnesses. These patient factors were controlled for in all adjusted analyses. Although traditional multivariate analysis attempts to adjust for variations between the 2 patient populations, it cannot adjust for inaccurately measured or unmeasured differences. Using the institutional proportion of admissions to neurologists as a predictor of patient outcomes, we were better able to control for the selection bias associated with differential distribution of patients to teams led by attending neurologists versus generalists.13, 14
Petty et al.7 studied 299 ischemic stroke patients and showed equivalent survival among stroke patients admitted to neurology inpatient teams versus generalist teams with neurologic consultation. However, patients cared for by generalist teams without neurologic consultation fared worse. Their subjects were treated at both academic and community hospitals. In our study, contributing hospitals were solely academic institutions. Because specialty cross talk may be more frequent at university‐based hospitals, academic‐based generalist physicians may be more familiar with recent stroke literature and guidelines than are their community‐based peers. Further, restricting analysis to academic centers in our study should have reduced the potential confounding influences of differences between other aspects of institutional care. Although no information was available on neurologist consultation in our database, informal consultation is believed to play a large but hidden role at academic medical centers. Thus, the inclusion of a formal consultation variable may be misleading at academic medical centers.
Analyzing claims data on 44,099 Medicare beneficiaries with acute ischemic strokes cared for at both academic and community hospitals, Smith et al.10 also recently reported a 10% lower risk of 30‐day mortality and 12% lower risk of rehospitalization for infections and aspiration pneumonitis among patients admitted to the care of neurologists compared with those admitted to the care of generalists. However, the upper 95% confidence interval limits for these 2 findings nearly crossed 1 (ranging from 0.9980.999). The study also concluded that patients cared for collaboratively by generalists and neurologists had a 16% lower 30‐day mortality risk (hazard ratio 0.84; 95% CI, 0.790.90) than those cared for by generalists alone but simultaneously noted that patients admitted to generalists only had more comorbidities than either the collaborative care or neurologist‐only patient groups. If sicker patients were triaged to generalist admission, as occurs in confounding by indication (also known as channeling bias), then incomplete adjustment for comorbid disease may bias outcomes in favor of neurologist involvement. The GT analysis we employed is specifically designed to overcome this exact type of selection bias.
In our study, patients admitted to neurologists received tPA significantly more often than those admitted to generalists. GT analysis also found that hospitals admitting a higher proportion of strokes to neurologists treated more patients with tPA. This result is consistent with a prior study demonstrating that academic institutions employing a vascular neurologist had significantly higher odds of administering tPA.21 Since tPA must be administered within 3 hours of symptom onset,27 it is commonly delivered in the emergency department prior to admission. Thus, patients may be preferentially selected for admission to neurologic services because of their receipt of tPA, rather than that this association reflects an actual increased use of tPA by neurologists over generalists. Alternatively, institutions with a higher rate of stroke admissions to neurology may simply be more familiar with tPA protocols. Importantly, the poor sensitivity of our data for actual tPA administration may affect the analysis of its use by physician specialty; however, the failure to administratively code tPA use is unlikely to be differentially biased based on physician specialty. Thus, undercoding of tPA use would be expected to bias these analyses toward the null.
The potential advantage and efficacy of stroke centers, stroke units, stroke services, and other institutional processes of care are not addressed by our data. Previously, among academic hospitals, we found that acute ischemic stroke mortality was lower at hospitals employing a vascular neurologist and at those whose guidelines allowed only neurologists to administer tPA.21 A later analysis evaluated the impact of all elements of stroke center care supported by the original Brain Attack Coalition consensus28 and found that no single element improved mortality.29 However, recent studies have found significant mortality benefit associated with stroke units30, 31 and stroke services.32 Clearly, the debate continues over these important questions.
Our study had several limitations. First, generalizability may be lessened because only academic medical centers contributed data and only admissions through the ED were included. However, limiting the study population to academic centers provided a homogenous study population and greatly reduced the potential for confounding at the institutional level. Although the selection of ED cases mitigated the effects of referral bias and the use of only academic hospitals minimized interinstitutional differences, institutions whose rate of admissions to neurology was above the 50th percentile differed from those whose rate admissions to neurology was below the 50th percentile. However, this difference did not consistently result in patients with worse pretreatment prognostic factors being cared for at hospitals with higher rates of admission to neurology. Second, there are important limitations to using administrative data. In our study, patients were selected based on diagnostic coding of records analysts at discharge, and the diagnostic accuracy of such coding for stroke is imperfect.33 Furthermore, missing or incomplete information could have impaired adjustments for patient differences. Third, details of patient treatment were limited. The lack of information about formal and informal consultations may have obscured a true difference in outcomes among specialties.7 Additionally, academic institutions may use systematized care plans more often than do community hospitals, potentially minimizing differences between specialties. Fourth, at the time of our study, tPA had been recently introduced into stroke care. Current rates of tPA use among neurologists and generalists may be more similar. Fifth, the ability of in‐hospital mortality to adequately assess quality of care is limited, and longer‐term and functional outcomes would be better measures and more clinically relevant.
After controlling for selection bias using GT analysis, we found stroke outcomes to be similar regardless of whether a neurologist or a generalist was the admitting physician. This result contrasts with the findings of several previous studies that suggested admitting stroke patients to a neurologist resulted in better clinical outcomes.710 Because only 1 neurologist is employed for approximately every 19.8 generalists in the United States34 and 40% of acute strokes were cared for by generalists, even in this sample entirely restricted to university hospitals, such findings would suggest that many U.S. stroke patients receive inferior care. Because the role of the neurologist as consultant rather than as attending physician is significantly more feasible in most practice settings, the demonstration of equivalent outcomes by both types of physicians is reassuring and certainly reinforces the important role that unmeasured confounders may play in observational studies.
However, these results do imply that it is vital that generalists remain fully trained in the current best practices of acute stroke management in order to maintain the equivalence of care suggested here. Given how common acute stroke is, any proposed future hospitalist training, certification, and recertification programs should include a focus on acute stroke management.
- ,,.Knowledge, patterns of care, and outcomes of care for generalists and specialists.J Gen Intern Med.1999;14:499–511.
- ,,,,.The generalist role of specialty physicians: is there a hidden system of primary care?JAMA.1998;279:1364–1370.
- .Primary care: specialists or generalists.Mayo Clin Proc.1996;71:415–419.
- ,,, et al.Consultation between cardiologists and generalists in the management of acute myocardial infarction: implications for quality of care.Arch Intern Med.1998;158:1778–1783.
- ,,, et al.Quality of care and outcomes of adults with asthma treated by specialists and generalists in managed care.Arch Intern Med.2001;161:2554–2560.
- ,,, et al.Nephrologist care and mortality in patients with chronic renal insufficiency.Arch Intern Med.2002;162:2002–2006.
- ,,,,,.Ischemic stroke: outcomes, patient mix, and practice variation for neurologists and generalists in a community.Neurology.1998;50:1699–1678.
- ,,.Where and how should elderly stroke patients be treated? A randomized trial.Stroke.1995;26:249–253.
- ,,,,,.What role do neurologists play in determining the costs and outcomes of stroke patients?Stroke.1996;27:1937–1943.
- ,,,.30‐Day survival and rehospitalization for stroke patients according to physician specialty.Cerebrovasc Dis.2006;22:21–26.
- .The need for randomization in the study of intended effects.Stat Med.1983;2:267–271.
- ,.Modern Epidemiology.Philadelphia, PA:Lippincott‐Raven;1998.
- ,,,.Modeling treatment effects on binary outcomes with grouped‐treatment variables and individual covariates.Am J Epidemiol.2002;156:753–760.
- ,,.Does more intensive treatment of acute myocardial infarction in the elderly reduce mortality? Analysis using instrumental variables.JAMA.1994;272:859–866.
- .The Cochrane Lecture. The best and the enemy of the good: randomised controlled trials, uncertainty, and assessing the role of patient choice in medical decision making.J Epidemiol Community Health.1994;48:6–15.
- ,.Uses of ecologic studies in the assessment of intended treatment effects.J Clin Epidemiol.1999;52:7–12.
- University HealthSystem Consortium. Available at: http://www.uhc.edu. Accessed April 11,2007.
- ,,,.Identification of incident stroke in Norway: hospital discharge data compared with a population‐based stroke register.Stroke.1999;30:56–60.
- .Accuracy of ICD‐9‐CM coding for the identification of patients with acute ischemic stroke: effect of modifier codes.Stroke.1998;29:1602–1604.
- ,,,.Accuracy of hospital discharge abstracts for identifying stroke.Stroke.1994;25:2348–2355.
- ,.Characteristics of academic medical centers and ischemic stroke outcomes.Stroke.2001;32:2137–2142.
- ,,, et al.Utilization of intravenous tissue‐type plasminogen activator for ischemic stroke at academic medical centers: the influence of ethnicity.Stroke.2001;32:1061–1068.
- .Biostatistics: a Foundation for Analysis in the Health Sciences.New York:John Wiley 1995.
- Sachs Group.Sachs Complications Profiler, version 1.0, User's Guide.Evanston, IL,1995.
- University HealthSystem Consortium Services Corporation.Clinical information management: risk adjustment of the UHC clinical database.Oak Brook, IL,1997.
- .Combining ecological and individual variables to reduce confounding by indication: case study—subarachnoid hemorrhage treatment.J Clin Epidemiol.2000;53:1236–1241.
- The National Institute of Neurological Disorders and Stroke rt‐PA Stroke Study Group.Tissue plasminogen activator for acute ischemic stroke.N Engl J Med.1995;333:1581–1588.
- ,,, et al.Recommendations for the establishment of primary stroke centers. Brain Attack Coalition.JAMA.2000;283:3102–3109.
- ,,, et al.Do the Brain Attack Coalition's criteria for stroke centers improve care for ischemic stroke?Neurology.2005;64:422–427.
- Organised inpatient (stroke unit) care for stroke.Cochrane Database Syst Rev2002:CD000197.
- ,,,,,.Stroke‐unit care for acute stroke patients: an observational follow‐up study.Lancet.2007;369:299–305.
- ,,,.Multispecialty stroke services in California hospitals are associated with reduced mortality.Neurology.2006;66:1527–32.
- ,,,,,.Inaccuracy of the International Classification of Diseases (ICD‐9‐CM) in identifying the diagnosis of ischemic cerebrovascular disease.Neurology.1997;49:660–664.
- .Physician characteristics and distribution in the US. 2006 ed. In: Department of Data Quality and Measurement, ed. Physician Characteristics and Distribution in the US. Washington, DC: American Medical Association,2006:312.
The appropriate role of specialists in hospital management of common medical conditions has been vigorously debated.13 Few argue that specialists serve an important role as consultants, but whether patients with specific conditions should be admitted to the care of specialists or generalists is unresolved. This is demonstrated by the large degree of hospital‐to‐hospital variability in the proportion of patients with myocardial infarction admitted to cardiologists,4 patients with asthma exacerbations admitted to pulmonologists,5 and patients with renal failure admitted to nephrologists.6
Stroke is another common diagnosis, with variable rates of admission to specialists and generalists. Several prior studies have suggested that outcomes after ischemic stroke are better if a neurologist is the attending physician.710 However, these observational studies could not rule out the possibility that differences in outcome were a result of prognosis at the time of admission rather than improvements in medical care. Although these studies have controlled for known prognostic variables, it is possible that unknown, unmeasured, or inadequately measured variables were different in the groups admitted to neurologists and the groups admitted to generalists. These differences, in turn, might account for outcome differences rather than specialist care.
This form of selection bias, a type of confounding by indication, is a constant threat to validity in observational studies. Randomized trials avoid it because the randomization process balances all prognostic variables, both known and unknown, in the treatment groups.11 Observational studies cannot guarantee the same balance of unmeasured risk factors.12 Multivariate modeling is meant to account for prognostic differences between groups in observational studies, but confounding by indication may remain if all the factors that determine prognosis are not accurately measured. We developed a method to avoid confounding by indication by evaluating individual outcome differences associated with practice variability.13 This technique, termed grouped‐treatment (GT) analysis, is related to the instrumental variable approach developed by economists and occasionally applied to health services research.14
In multivariate GT analyses, the institutional proportion of cases admitted to the care of a neurologist is used as a predictor of outcomes rather than whether an individual patient was admitted to neurology. For example, at a hospital where three‐fourths of acute stroke patients are admitted to neurology, all patients are treated as having a 75% chance of admission to neurology. Rather than denoting whether each patient's specialist attending was a neurologist or a generalist, the 0.75 probability of admission to neurology is used for analysis. If admission to an attending neurologist improves ischemic stroke care, then GT analysis should demonstrate that hospitals admitting higher proportions of stroke patients to neurologists have improved outcomes regardless of whether there is selection bias at the individual patient level. In this way, the method bypasses unmeasured confounders at the individual level in its estimates of treatment effects. The method is susceptible to confounding at the group level; that is, unmeasured prognostic differences in patients admitted to hospitals that rely more heavily on neurologists could bias the GT estimate of treatment effect. The GT estimates are accurate if it can be assumed that a hospital's rate of treatment is not associated (in an unmeasured way) with its patient population's intrinsic, pretreatment prognosis. However, practice variability is very common between hospitals and is generally poorly associated with systematic differences in prognosis of treated patients,15, 16 and in this setting GT provides an independent assessment of treatment effect that may either confirm or refute an association found at the individual level, where confounding is nearly always an important issue.
In this study, we evaluated the impact of admission to a neurologist or generalist on outcomes of ischemic stroke patients treated at academic medical centers throughout the United States. We also compared traditional analysis to GT analysis. In doing so, we demonstrate the influence of unmeasured confounders on observational assessments of specialist care and may provide a more accurate measure of the impact of care by a neurologist on outcomes after ischemic stroke.
MATERIALS AND METHODS
We used the University HealthSystem Consortium (UHC) administrative database, which contained patient information from 84 large academic health centers and their 39 associate hospitals, with more than 2.1 million discharges each year.17 We obtained UHC discharge abstracts for all ischemic stroke patients admitted through emergency departments from 1997 through 1999. Discharge abstracts included patient demographics, urgency status (emergent, urgent, elective), illness severity class, admitting and discharge specialties, discharge diagnoses, procedure codes, in‐hospital mortality, length of stay, and total hospital charges. Patients were identified using International Classification of Diseases, Ninth Revision (ICD‐9) codes that were previously recognized as specific indicators of acute ischemic stroke (ICD‐9 433.01, 433.11, 433.21, 433.31, 433.81, 433.91, 434.01, 434.11, 434.91, 436).1820 We limited the cohort to emergency department admissions in order to reduce the likelihood of referral bias.
Variables in the discharge database were validated by comparison with a detailed medical record review. Between June and December 1999, 42 institutions participating in a quality improvement project identified 30 consecutive ischemic stroke cases. Trained analysts or clinicians abstracted information on demographics, medical history, and treatment. Kappa statistics have been previously reported for all individual characteristics except hospital charges, for which medical record review data were not available.21 Demographic and clinical variables in the administrative database tended to agree well with medical record review, with agreement ranging from 85% to 100% (kappa 0.581.00). Because the admitting attending likely directed acute stroke management, this was used to define a patient's attending physician specialty in all analyses. Administrative coding of tissue plasminogen activator (tPA) use was imperfect, with a sensitivity of 50% but a specificity of 100%.22
Institutional rate of admission to neurologists versus generalists was calculated as the percentage over the entire study duration. Unadjusted logistic regression was used to compare the distribution of patient pretreatment prognostic factors between institutions above and below the 50th percentile to determine a rate of admission to neurology because generalized estimating equations that could account for clustering were unable to support these models as a result of diverging estimates. We calculated the yearly volume of ischemic strokes treated at an institution from discharge abstracts, including admissions from all sources, because all treated cases would be expected to increase physician experience.
In‐hospital mortality was chosen as the primary outcome because of its frequency, importance, and coding reliability. Univariate predictors of in‐hospital mortality were identified using Pearson's chi‐square and the Wilcoxon rank sum tests.23 Length of stay (LOS), total hospital charges, and receipt of tPA were secondary outcomes. LOS and total hospital charges were compared using the Wilcoxon rank sum test. LOS and total charge calculations included only those patients surviving to discharge so that early mortality would not be confused with more efficient care. Similarly, we compared demographics and clinical variables of patients admitted to the care of neurologists with those of patients admitted to the care of generalists. To evaluate variability between institutions, we determined the proportion of patients with specific characteristics and outcomes at each institution and report median values and the 10th‐ to 90th‐percentile range among the institutions. The correlation between institutional rate of admission and institutional rate of mortality was evaluated.
In standard multivariate analysis, we assessed physician specialty as a predictor of in‐hospital mortality of individual patients after adjustment for demographic characteristics, admission status (emergent, urgent, elective), comorbid illness severity score (range 04, from 0 = no substantial comorbid illness to 4 = catastrophic comorbid illness), and annual institutional treatment volume of ischemic stroke. UHC defined severity class to represent an individual's overall calculated risk of illness; its value was dependent on the refinement of the Health Care Facility Administration's diagnosis‐related groups (DRGs) and the Sach's Complication Profiler count of total comorbidities present.24, 25 Effects on LOS and total charges, as well as the ability of physician specialty to predict tPA use in individual patients, were similarly evaluated. Analysis of tPA use was restricted to patients admitted to universities that ever coded tPA use, which increased the sensitivity of the indicator to 57%.22 Residual misclassification error of tPA use would be expected to obscure a true underlying association between its use and physician specialty.
In multivariate GT calculations, we used the institutional proportion of cases admitted to a neurologist as a predictor of outcomes. GT analysis is based on the observation that if a treatment is effective, hospitals that use it more frequently should have better patient outcomes and that this association should persist regardless of whether individual‐level selection bias is present. The method assumes that hospital rates of admission to neurology are independent on the patient population's pretreatment prognosis. Because utilization differences between hospitals likely reflect practice variability rather than differences in patient prognosis,15, 16 the influence of unmeasured confounders at the hospital level is expected to be small. Measured variables that proved significant in univariate analyses or were thought to be responsible for an association between overall patient prognosis and modalities and frequencies of acute stroke treatments used, such as institutional treatment volume, were included in the multivariate GT model in order to isolate the effect of increasing rates of admission to neurologists.
We included both institutional and individual data to more accurately specify individual outcomes and covariates compared with an analysis that simply compared institutions' characteristics and their outcomes.26 Generalized estimating equations (GEE) were used in order to account for institutional clustering of predictor variables and outcomes. GEE is similar to logistic regression but produces broader confidence intervals (CIs) because logistic regression ignores the possibility that individuals at institutions are more similar to each other than would be expected by chance alone. We used a compound symmetry correlation structure, which initiates modeling by assuming a constant correlation between observations within each institution as well as between institutions, and used a logistic link function for binary outcomes in order to mimic logistic regression. The natural log transformations of LOS and hospital charges were modeled to reduce positive skew and approximate a normal distribution, and an identity link function was used in GEE to mimic linear regression for these analyses. To evaluate the impact of adjustment, both unadjusted and adjusted analyses were conducted. Methods to calculate power of GT analysis are not available. The Stata statistical package was used for all analyses (version 8.0; Stata Corporation, College Station, TX).
RESULTS
A total of 26,925 patients with ischemic strokes were admitted to neurologists or generalists through the emergency department at 113 institutions participating in the study. Patients admitted to neurologists rather than generalists (Table 1) were younger and more likely to be male, but less likely to have a serious comorbid illness. Institutions varied widely in the demographics of treated patients as well as in the markers of pretreatment prognosis. Institutional annual case volume of all ischemic strokes ranged from 1 to 741. Mortality rate, mean LOS, and mean hospital charges also varied broadly between institutions (Table 1). Patients treated at institutions whose rate of admissions to a neurologist's care was in the upper 50th percentile were younger and more often male, but did not differ in illness severity class (Table 2).
| Characteristic | Neurologist (n = 16,287) | Generalist (n = 10,638) | Institutional (n = 113) median (10th90th percentiles) |
|---|---|---|---|
| |||
| Age (years), mean (SD) | 66.2 (14.7) | 69.3 (15.2) | 67.7 (62.174.8) |
| Female, n (%) | 8291 (51) | 5904 (56) | 54% (46%67%) |
| Ethnicity | |||
| African American, n (%) | 4516 (28) | 3335 (31) | 19% (0%71%) |
| Asian American, n (%) | 570 (4) | 201 (2) | 0.7% (0%8%) |
| Hispanic, n (%) | 906 (6) | 458 (4) | 0.7% (0%16%) |
| Native American, Eskimo, n (%) | 48 (0) | 21 (0) | 0% (0%1%) |
| White, n (%) | 9012 (55) | 5851 (55) | 65% (10%95%) |
| Other ethnicity, n (%) | 398 (2) | 157 (1) | 0.3% (0%4%) |
| Unknown, n (%) | 837 (5) | 615 (6) | 0.1% (0%9%) |
| Comorbid illness severity score,* median (interquartile range) | 1 (01) | 1 (01) | 0.83 (0.650.95) |
| Treatment and outcome | |||
| tPA administered, n (%) | 132 (3) | 51 (2) | 1.9% (0.6%6.5%) |
| In‐hospital deaths, n (%) | 755 (5) | 1005 (9) | 6.1% (3%10%) |
| Discharges to home, n (%) | 9504 (59) | 5235 (49) | 52% (38%72%) |
| Length of stay (days), mean (SD) | 6.6 (7.2) | 7.9 (9.9) | 6.6 (4.210.0) |
| Total charges | $16,600 ($20,500) | $18,700 ($26,300) | $15,000 ($9000$30,000) |
| Characteristic | <50th percentile | >50th percentile | P value |
|---|---|---|---|
| |||
| Age (years), mean (SD) | 66.7 (15.2) | 69.4 (14.3) | <.001 |
| Female, n (%) | 5288 (54) | 8907 (52) | .001 |
| Comorbid illness severity score*, median (interquartile range) | 1 (01) | 1 (01) | .87 |
There were 1760 in‐hospital deaths (7.0%). In univariate analysis, older age (P < .001), white ethnicity (P < .001), emergent stroke (P < .001), and increased illness severity (P < .001) were associated with greater risk of death, whereas African‐American (P < .001) and Hispanic (P = .007) ethnicities were protective. No other patient characteristics were important, and institutional annual case volume showed no association with mortality risk.
Overall, 60% of patients with ischemic stroke were admitted to a neurologist's care. In univariate analysis (Table 3), a lower risk of in‐hospital mortality was observed in cases admitted to neurologists (4.6%) compared with those admitted to generalists (9.5%; P < .001). After adjustment in standard multivariable models, the association between neurologist admission and lower risk of death persisted (OR 0.60; 95% CI, 0.500.72; P < .001).
| Characteristics | Unadjusted | Adjusted | ||
|---|---|---|---|---|
| Odds ratio (95% CI) | P value | Odds ratio (95% CI) | P value | |
| ||||
| Mortality | ||||
| Attending neurologist | 0.32 (0.260.39) | <.001 | 0.60 (0.500.72) | <.001 |
| Proportion of admissions to neurology | 1.05 (0.851.31) | .64 | 1.02 (0.791.30) | .90 |
| tPA Use | ||||
| Attending neurologist | 1.87 (1.302.69) | .001 | 2.56 (1.723.78) | <.001 |
| Proportion of admissions to neurology | 2.32 (0.985.49) | .06 | 2.47 (1.085.65) | .03 |
The institutional rate of admission of ischemic stroke patients to neurologists ranged from 0% to 90%, and higher rates were seen at hospitals with higher institutional case volumes (P < .001). There was no correlation between the institutional rate of admission to neurology and the institutional mortality rate (0.33; P = .73). At the individual‐level, greater rates of admission to neurologists had no significant impact on mortality (OR 1.05; 95% CI, 0.851.31; P = .64; Table 3) in unadjusted analysis. After adjustment for patient demographics, comorbid illness severity score, urgency status, and institutional case volume in GT analysis, there remained no association between death and proportion of ischemic stroke cases admitted to neurologists (OR 1.02; 95% CI, 0.791.30; P = .90), consistent with the absence of an association between neurologist care and in‐hospital mortality.
Patients treated by neurologists were likely to have shorter stays (P < .001) and lower charges (P = .01) in univariate analysis (Table 4). In traditional adjusted multivariable analysis, the same associations were seen for LOS (P < .001) and charges (P = .05). However, in adjusted GT analyses, increased institutional rate of admission to neurologists was not associated with briefer LOS (P = .36) and was associated with greater hospital charges (P = .044).
| Characteristic | Unadjusted Analysis | Adjusted ratio* | |||
|---|---|---|---|---|---|
| Neurologist | Generalist | P value | Ratio (95% CI) | P value | |
| |||||
| LOS (days), n = 25,094 | |||||
| Standard analysis | 6.6 | 8.0 | <.001 | 0.92 (0.880.96) | <.001 |
| Group‐treatment analysis | 7.2 | 7.1 | .80 | 1.06 (0.941.19) | .35 |
| Total Charges, n = 21,812 | |||||
| Standard analysis | $16,600 | $18,700 | .01 | 0.95 (0.911.00) | .05 |
| Group‐treatment analysis | $17,800 | $16,900 | <.001 | 1.26 (1.011.57) | .04 |
In 1999, 190 (2.2%) ischemic stroke patients received tPA at the 64 universities that had ever coded tPA use. In univariate analysis, patients admitted to a neurologist were more likely to have received tPA (P = .001; Table 3), and this association persisted after adjustment (P < .001). In adjusted GT analysis, institutions admitting a higher proportion of ischemic stroke patients to neurologists also treated patients with tPA more frequently (P = .033).
DISCUSSION
Several prior studies found that ischemic stroke outcomes were better when an attending neurologist was responsible for patient care.710 Traditional analyses of our data also indicate that care by a neurologist lowers inpatient mortality, LOS, and total charges. By contrast, a GT analysis that bypasses selection bias at the patient level suggests there is no independent benefit of neurologist care on mortality or LOS and actually shows higher associated charges.
The discrepancy between standard and GT analyses suggests that healthier patients may have been preferentially admitted to the care of neurologists. Measured pretreatment prognostic factors in our data present a mixed picture. Patients admitted to a neurologist's care were younger, more often male, more often emergently admitted, and less likely to have serious comorbid illnesses. These patient factors were controlled for in all adjusted analyses. Although traditional multivariate analysis attempts to adjust for variations between the 2 patient populations, it cannot adjust for inaccurately measured or unmeasured differences. Using the institutional proportion of admissions to neurologists as a predictor of patient outcomes, we were better able to control for the selection bias associated with differential distribution of patients to teams led by attending neurologists versus generalists.13, 14
Petty et al.7 studied 299 ischemic stroke patients and showed equivalent survival among stroke patients admitted to neurology inpatient teams versus generalist teams with neurologic consultation. However, patients cared for by generalist teams without neurologic consultation fared worse. Their subjects were treated at both academic and community hospitals. In our study, contributing hospitals were solely academic institutions. Because specialty cross talk may be more frequent at university‐based hospitals, academic‐based generalist physicians may be more familiar with recent stroke literature and guidelines than are their community‐based peers. Further, restricting analysis to academic centers in our study should have reduced the potential confounding influences of differences between other aspects of institutional care. Although no information was available on neurologist consultation in our database, informal consultation is believed to play a large but hidden role at academic medical centers. Thus, the inclusion of a formal consultation variable may be misleading at academic medical centers.
Analyzing claims data on 44,099 Medicare beneficiaries with acute ischemic strokes cared for at both academic and community hospitals, Smith et al.10 also recently reported a 10% lower risk of 30‐day mortality and 12% lower risk of rehospitalization for infections and aspiration pneumonitis among patients admitted to the care of neurologists compared with those admitted to the care of generalists. However, the upper 95% confidence interval limits for these 2 findings nearly crossed 1 (ranging from 0.9980.999). The study also concluded that patients cared for collaboratively by generalists and neurologists had a 16% lower 30‐day mortality risk (hazard ratio 0.84; 95% CI, 0.790.90) than those cared for by generalists alone but simultaneously noted that patients admitted to generalists only had more comorbidities than either the collaborative care or neurologist‐only patient groups. If sicker patients were triaged to generalist admission, as occurs in confounding by indication (also known as channeling bias), then incomplete adjustment for comorbid disease may bias outcomes in favor of neurologist involvement. The GT analysis we employed is specifically designed to overcome this exact type of selection bias.
In our study, patients admitted to neurologists received tPA significantly more often than those admitted to generalists. GT analysis also found that hospitals admitting a higher proportion of strokes to neurologists treated more patients with tPA. This result is consistent with a prior study demonstrating that academic institutions employing a vascular neurologist had significantly higher odds of administering tPA.21 Since tPA must be administered within 3 hours of symptom onset,27 it is commonly delivered in the emergency department prior to admission. Thus, patients may be preferentially selected for admission to neurologic services because of their receipt of tPA, rather than that this association reflects an actual increased use of tPA by neurologists over generalists. Alternatively, institutions with a higher rate of stroke admissions to neurology may simply be more familiar with tPA protocols. Importantly, the poor sensitivity of our data for actual tPA administration may affect the analysis of its use by physician specialty; however, the failure to administratively code tPA use is unlikely to be differentially biased based on physician specialty. Thus, undercoding of tPA use would be expected to bias these analyses toward the null.
The potential advantage and efficacy of stroke centers, stroke units, stroke services, and other institutional processes of care are not addressed by our data. Previously, among academic hospitals, we found that acute ischemic stroke mortality was lower at hospitals employing a vascular neurologist and at those whose guidelines allowed only neurologists to administer tPA.21 A later analysis evaluated the impact of all elements of stroke center care supported by the original Brain Attack Coalition consensus28 and found that no single element improved mortality.29 However, recent studies have found significant mortality benefit associated with stroke units30, 31 and stroke services.32 Clearly, the debate continues over these important questions.
Our study had several limitations. First, generalizability may be lessened because only academic medical centers contributed data and only admissions through the ED were included. However, limiting the study population to academic centers provided a homogenous study population and greatly reduced the potential for confounding at the institutional level. Although the selection of ED cases mitigated the effects of referral bias and the use of only academic hospitals minimized interinstitutional differences, institutions whose rate of admissions to neurology was above the 50th percentile differed from those whose rate admissions to neurology was below the 50th percentile. However, this difference did not consistently result in patients with worse pretreatment prognostic factors being cared for at hospitals with higher rates of admission to neurology. Second, there are important limitations to using administrative data. In our study, patients were selected based on diagnostic coding of records analysts at discharge, and the diagnostic accuracy of such coding for stroke is imperfect.33 Furthermore, missing or incomplete information could have impaired adjustments for patient differences. Third, details of patient treatment were limited. The lack of information about formal and informal consultations may have obscured a true difference in outcomes among specialties.7 Additionally, academic institutions may use systematized care plans more often than do community hospitals, potentially minimizing differences between specialties. Fourth, at the time of our study, tPA had been recently introduced into stroke care. Current rates of tPA use among neurologists and generalists may be more similar. Fifth, the ability of in‐hospital mortality to adequately assess quality of care is limited, and longer‐term and functional outcomes would be better measures and more clinically relevant.
After controlling for selection bias using GT analysis, we found stroke outcomes to be similar regardless of whether a neurologist or a generalist was the admitting physician. This result contrasts with the findings of several previous studies that suggested admitting stroke patients to a neurologist resulted in better clinical outcomes.710 Because only 1 neurologist is employed for approximately every 19.8 generalists in the United States34 and 40% of acute strokes were cared for by generalists, even in this sample entirely restricted to university hospitals, such findings would suggest that many U.S. stroke patients receive inferior care. Because the role of the neurologist as consultant rather than as attending physician is significantly more feasible in most practice settings, the demonstration of equivalent outcomes by both types of physicians is reassuring and certainly reinforces the important role that unmeasured confounders may play in observational studies.
However, these results do imply that it is vital that generalists remain fully trained in the current best practices of acute stroke management in order to maintain the equivalence of care suggested here. Given how common acute stroke is, any proposed future hospitalist training, certification, and recertification programs should include a focus on acute stroke management.
- ,,.Knowledge, patterns of care, and outcomes of care for generalists and specialists.J Gen Intern Med.1999;14:499–511.
- ,,,,.The generalist role of specialty physicians: is there a hidden system of primary care?JAMA.1998;279:1364–1370.
- .Primary care: specialists or generalists.Mayo Clin Proc.1996;71:415–419.
- ,,, et al.Consultation between cardiologists and generalists in the management of acute myocardial infarction: implications for quality of care.Arch Intern Med.1998;158:1778–1783.
- ,,, et al.Quality of care and outcomes of adults with asthma treated by specialists and generalists in managed care.Arch Intern Med.2001;161:2554–2560.
- ,,, et al.Nephrologist care and mortality in patients with chronic renal insufficiency.Arch Intern Med.2002;162:2002–2006.
- ,,,,,.Ischemic stroke: outcomes, patient mix, and practice variation for neurologists and generalists in a community.Neurology.1998;50:1699–1678.
- ,,.Where and how should elderly stroke patients be treated? A randomized trial.Stroke.1995;26:249–253.
- ,,,,,.What role do neurologists play in determining the costs and outcomes of stroke patients?Stroke.1996;27:1937–1943.
- ,,,.30‐Day survival and rehospitalization for stroke patients according to physician specialty.Cerebrovasc Dis.2006;22:21–26.
- .The need for randomization in the study of intended effects.Stat Med.1983;2:267–271.
- ,.Modern Epidemiology.Philadelphia, PA:Lippincott‐Raven;1998.
- ,,,.Modeling treatment effects on binary outcomes with grouped‐treatment variables and individual covariates.Am J Epidemiol.2002;156:753–760.
- ,,.Does more intensive treatment of acute myocardial infarction in the elderly reduce mortality? Analysis using instrumental variables.JAMA.1994;272:859–866.
- .The Cochrane Lecture. The best and the enemy of the good: randomised controlled trials, uncertainty, and assessing the role of patient choice in medical decision making.J Epidemiol Community Health.1994;48:6–15.
- ,.Uses of ecologic studies in the assessment of intended treatment effects.J Clin Epidemiol.1999;52:7–12.
- University HealthSystem Consortium. Available at: http://www.uhc.edu. Accessed April 11,2007.
- ,,,.Identification of incident stroke in Norway: hospital discharge data compared with a population‐based stroke register.Stroke.1999;30:56–60.
- .Accuracy of ICD‐9‐CM coding for the identification of patients with acute ischemic stroke: effect of modifier codes.Stroke.1998;29:1602–1604.
- ,,,.Accuracy of hospital discharge abstracts for identifying stroke.Stroke.1994;25:2348–2355.
- ,.Characteristics of academic medical centers and ischemic stroke outcomes.Stroke.2001;32:2137–2142.
- ,,, et al.Utilization of intravenous tissue‐type plasminogen activator for ischemic stroke at academic medical centers: the influence of ethnicity.Stroke.2001;32:1061–1068.
- .Biostatistics: a Foundation for Analysis in the Health Sciences.New York:John Wiley 1995.
- Sachs Group.Sachs Complications Profiler, version 1.0, User's Guide.Evanston, IL,1995.
- University HealthSystem Consortium Services Corporation.Clinical information management: risk adjustment of the UHC clinical database.Oak Brook, IL,1997.
- .Combining ecological and individual variables to reduce confounding by indication: case study—subarachnoid hemorrhage treatment.J Clin Epidemiol.2000;53:1236–1241.
- The National Institute of Neurological Disorders and Stroke rt‐PA Stroke Study Group.Tissue plasminogen activator for acute ischemic stroke.N Engl J Med.1995;333:1581–1588.
- ,,, et al.Recommendations for the establishment of primary stroke centers. Brain Attack Coalition.JAMA.2000;283:3102–3109.
- ,,, et al.Do the Brain Attack Coalition's criteria for stroke centers improve care for ischemic stroke?Neurology.2005;64:422–427.
- Organised inpatient (stroke unit) care for stroke.Cochrane Database Syst Rev2002:CD000197.
- ,,,,,.Stroke‐unit care for acute stroke patients: an observational follow‐up study.Lancet.2007;369:299–305.
- ,,,.Multispecialty stroke services in California hospitals are associated with reduced mortality.Neurology.2006;66:1527–32.
- ,,,,,.Inaccuracy of the International Classification of Diseases (ICD‐9‐CM) in identifying the diagnosis of ischemic cerebrovascular disease.Neurology.1997;49:660–664.
- .Physician characteristics and distribution in the US. 2006 ed. In: Department of Data Quality and Measurement, ed. Physician Characteristics and Distribution in the US. Washington, DC: American Medical Association,2006:312.
Copyright © 2008 Society of Hospital Medicine
Short-term prognosis after a TIA: A simple score predicts risk
Lipid Management during Stroke Hospitalization
Aortocervicocephalic atherosclerotic disease and coronary artery disease share common risk factors, and patients with one condition are at high risk of harboring or developing the other.1, 2 Over the past decade, several randomized clinical trials of lipid‐lowering medications designed to reduce low‐density lipoprotein cholesterol (LDL‐C) have shown a significant decrease in the risk of coronary events and ischemic stroke among patients who have a history of or are at risk for coronary artery disease, regardless of whether serum cholesterol is elevated.3, 4 Results from more than 3000 stroke patients enrolled in the Heart Protection Study also provide evidence that aggressive lipid‐lowering therapy may prevent recurrent vascular events in individuals who have a total cholesterol level as low as 135 mg/dL and cerebrovascular disease, with or without known coronary artery disease.5
Guidelines from the National Cholesterol Evaluation Program Adult Treatment Panel (ATP) provide target LDL‐C levels for persons with atherosclerotic disease depending on the extent of their vascular risk.6 However, despite the broad dissemination of these guidelines, several published studies of patients with coronary artery disease or dyslipidemia have shown that a large proportion of patients with high vascular risk continue to be underscreened, underdiagnosed, and undertreated for dyslipidemia.79
Few studies have evaluated the quality of cholesterol management among hospitalized patients who have experienced an acute ischemic cerebrovascular event10, 11 So the data are scarce on the management of patients hospitalized for ischemic stroke or transient ischemic attack (TIA) who are, according to ATP criteria, at high risk for future coronary events and on the factors that may govern that management. Systematic reviews have suggested that incorporating a lipid profile during acute stroke presentation could assure baseline assessment and serve as a potential cue for physicians to change their behavior,12 and an American Stroke Association advisory recommends lipid treatment during hospitalization for most patients with ischemic stroke or TIA as it may increase the rate of long‐term use.13
The objectives of this study were to determine the rates of testing for and treatment of dyslipidemia according to national cholesterol guidelines among individuals hospitalized with acute ischemic stroke or TIA and to identify predictors of performance.
METHODS
The California Acute Stroke Prototype Registry (CASPR) is a Centers for Disease Controlsponsored cohort that captured detailed data on patients admitted to 11 hospitals over a 2‐year period. The methods of study have been described elsewhere.14 In brief, CASPR prospectively collected information on acute stroke care at 11 representative hospitals in 5 major population regions of California. Data were collected on diagnostic evaluation, appropriate use of treatment strategies, and disposition on discharge from the hospital. The main goal of CASPR was to pilot‐test a prototype prospective registry of acute stroke and transient ischemic attack to be used as a quality improvement tool. The study population was patients with an admitting or discharge diagnosis of suspected stroke or TIA from November 1, 2002, through January 31, 2003, and from November 1, 2003, through January 31, 2004. The human subjects review board at each participating center approved the study.
For the present analysis, data on all patients with a discharge diagnosis of ischemic stroke or TIA who were admitted during either period were included. We examined the possible association of several variables with 2 primary outcomes: (1) testing lipid profile during hospitalization (as indicated by a documented LDL‐C level) and (2) prescribing lipid‐lowering medication at discharge. In those analyses in which lipid profile testing was the outcome, no variables were considered acceptable reasons for not performing an LDL‐C assessment.
The distribution of LDL‐C levels in this portion of the cohort was determined. Patients were then categorized according to their risk for future coronary events. Patients were classified as at risk for coronary events (ACE) if they either had a documented history of myocardial infarction, coronary artery disease, or diabetes or had undergone carotid endarterectomy or carotid angioplasty/stenting during hospitalization. Criteria for initiating lipid‐lowering therapy were defined according to the ATP III guidelines,6 which were in effect during both CASPR study periods. Continuing the recommendation in ATP II, the ATP III recommendations emphasized that persons with documented coronary artery disease (CAD) receive the most aggressive lipid‐lowering treatment. But this recommendation was expanded to include patients without established CAD, whose coronary risk is equivalent to that of patients with diagnosed CAD.6
As per the ATP III guidelines, CASPR‐ACE patients were considered optimally treated if they were prescribed a lipid‐lowering agent at discharge or if their documented LDL‐C was less than 130 mg/dL. A concurrent history of liver disease, abnormal prothrombin time, life expectancy of less than 1 year, and terminal illness were each considered a valid contraindication to treatment with lipid‐lowering medication. Optimal treatment for non‐ACE patients was defined as receipt of lipid‐lowering medication at discharge or a documented LDL‐C of 160 mg/dL. The rate of optimal treatment of ACE patients was compared to that of non‐ACE patients. The ACE and non‐ACE patients were then further categorized into 1 of 4 groups according to LDL‐C level<100, 100130, 130160, and >160 mg/dLand an assessment for trend of the rate of treatment in each of the 4 categories in the ACE and non‐ACE groups was performed.
Data Analysis
Univariate analyses of potential risk factors with lipid testing and treatment were performed using generalized estimating equations (GEEs) in order to account for both within‐hospital and between‐hospital variance and to acknowledge the impact of clustered observations on confidence intervals. Variables significant at the = .10 level were included in the multivariate models. In the subanalyses of patients with documented LDL‐C tests, GEE models were also used to examine factors associated with having an LDL‐C level below 100 mg/dL. A chi‐square test was used to compare the rate of optimal treatment (as defined above) in the group at risk for coronary disease with that in the group not at risk. The Mantel‐Haenszel chi‐squared test was used to compare trends in treatment rate with increasing LDL‐C level. All analyses were performed using SAS (version 8e, SAS Institute, Cary, NC).
RESULTS
Data were available from the 11 CASPR hospitals for 764 patients diagnosed with either ischemic stroke or TIA. Overall, 53.4% of subjects were women, and the average age at hospitalization of 70.4 ( 15.4) years. In the cohort, 55.3% of the patients were non‐Hispanic white, 9.7% were African American, 13.4% were Hispanic, 13% were Asian, and 8.6% were classified as other. Three hundred and nine individuals (40.5% of the cohort) were classified as at risk for coronary events. Of these, 148 (47.8%) had diabetes only, and 160 (51.8%) had a history of MI, CAD, or both. One patient (0.4%) had undergone angioplasty/stenting during hospitalization but had no history of MI, CAD, or diabetes. Only 4 patients (0.52% of the entire cohort) had undergone a carotid endarterectomy or angioplasty/stenting during hospitalization. Rates of lipid assessment and optimal treatment varied widely between hospitals, but testing and treatment were correlated for each hospital. Overall, however, testing and treatment were correlated (Pearson correlation coefficient = 0.35, P < .0001). On an individual hospital level, the correlation was positive and significant for 6 hospitals, positive but not significant for 2 hospitals, and negative but not significant for 3 hospitals.
Overall, LDL‐C levels were determined in 383 patients (50.1%). The likelihood that a patient would have an LDL‐C test performed during hospitalization varied widely by hospital, ranging from 12% to 88% (P < .0001). Univariate variables significantly associated with documented LDL‐C measurement in the overall cohort at the = .10 level were diagnosis of ischemic stroke (as compared to TIA) and history of dyslipidemia (Table 1). In the CASPR cohort, 53% of the ACE subjects received a lipid profile assessment compared to 48% in the rest of the cohort (P = .14). In multivariate analysis, diagnosis of ischemic stroke and history of dyslipidemia remained significantly associated with documented LDL‐C measurement (Table 1).
| Characteristic | n | With LDL‐C | Univariatea | P value | Adjusteda | P value | |||
|---|---|---|---|---|---|---|---|---|---|
| no. | % | OR | (95% CI) | OR | (95% CI) | ||||
| |||||||||
| Median age | |||||||||
| 73 years | 385 | 210 | (54.5) | Ref | |||||
| > 73 years | 379 | 173 | (45.6) | 0.95 | (0.68, 1.34) | .78 | |||
| Sex | |||||||||
| Female | 408 | 189 | (46.3) | Ref | |||||
| Male | 356 | 194 | (54.5) | 1.05 | (0.84, 1.39) | .53 | |||
| Ethnicity | |||||||||
| Other | 341 | 190 | (56.3) | Ref | |||||
| White | 423 | 193 | (45.6) | 0.88 | (0.60, 1.30) | .53 | |||
| Event type | |||||||||
| TIA | 172 | 62 | (36) | Ref | Ref | ||||
| Ischemic stroke | 592 | 321 | (54) | 1.70 | (1.14, 2.54) | .01 | 1.52 | (1.06, 2.19) | .02 |
| Risk of coronary events | 309 | 165 | (53.4) | 1.14 | (0.78, 1.68) | .50 | |||
| History of:b | |||||||||
| Stroke/TIA | 277 | 122 | (44.0) | 0.85 | (0.58, 1.24) | .39 | |||
| Dyslipidemia | 67 | 32 | (47.8) | 0.94 | (0.47, 1.90) | .86 | |||
| MI | 132 | 63 | (47.7) | 0.84 | (0.65, 1.08) | .17 | |||
| CAD | 158 | 96 | (60.8) | 0.95 | (0.67, 1.34) | .76 | |||
| Smoking | 83 | 31 | (37.3) | 0.67 | (0.40, 1.10) | .12 | |||
| Heart failure | 199 | 109 | (54.8) | 1.13 | (0.74, 1.73) | .58 | |||
| Diabetes | 516 | 259 | (50.2) | 1.09 | (0.83, 1.44) | .54 | |||
| Hypertension | 243 | 140 | (57.6) | 1.45 | (0.98, 2.14) | .07 | 1.41 | (1.01, 1.97) | .05 |
| Atrial fibrillation | 125 | 56 | (44.8) | 0.95 | (0.69, 1.32) | .76 | |||
| Received tPA | |||||||||
| No | 748 | 371 | (49.6) | Ref | |||||
| Yes | 16 | 12 | (75.0) | 2.01 | (0.79, 5.11) | .14 | |||
Lipid‐lowering drugs were prescribed at discharge to 370 patients (48.4%); however, treatment rate varied among hospitals, from a low of 13% of patients to a high of 84% of patients (P < .0001). Univariate factors associated with a higher treatment rate at the = .10 level were diagnosis of ischemic stroke, history of stroke/TIA, history of diabetes, hypertension, history of dyslipidemia, independent ambulation at discharge, and ACE status (Table 2). Patients were less likely to receive lipid‐lowering medication if they had a history of heart failure. Fifty‐nine percent of the CASPR ACE subjects were discharged on lipid‐modifying agents compared to 42% in the rest of the cohort (P = .0006). Multivariate analyses revealed several independent predictors of treatment with lipid‐lowering medication. Diagnosis of ischemic stroke, ACE status, and history of heart failure were negative predictors (less likely to be treated), and history of dyslipidemia was a positive predictor (Table 2). Status as an academic hospital was a hospital characteristic for which a significant association was found. Academic hospitals were significantly more likely to both perform LDL profiles and administer lipid‐lowering medications at discharge than were nonacademic hospitals. This association was found in a logistic regression analysis that did not account for between‐hospital variance. However, when we used GEE analysis, which adjusted for the variance, the difference between academic and nonacademic hospitals was no longer significant.
| Characteristic | n | Use of lipid‐lowering medication | Univariatea | P value | Adjusteda | P value | |||
|---|---|---|---|---|---|---|---|---|---|
| no. | % | OR | (95% CI) | OR | (95% CI) | ||||
| |||||||||
| Median age | |||||||||
| 73 years | 385 | 208 | (54.0) | Ref | |||||
| > 73 years | 379 | 162 | (42.7) | 0.79 | (0.59, 1.06) | .11 | |||
| Sex | |||||||||
| Female | 408 | 184 | (45.1) | Ref | |||||
| Male | 356 | 186 | (52.2) | 1.05 | (0.89, 1.25) | .55 | |||
| Ethnicity | |||||||||
| Other | 341 | 190 | (55.7) | Ref | |||||
| White | 423 | 193 | (45.6) | 0.88 | (0.61, 1.27) | .55 | |||
| Event type | |||||||||
| TIA | 172 | 58 | (34) | Ref | Ref | ||||
| Ischemic stroke | 592 | 312 | (53) | 1.92 | (1.39, 2.65) | < .0001 | 1.95 | (1.33, 2.85) | .0009 |
| At risk, coronary events | 309 | 181 | (58.6) | 1.83 | (1.30, 2.59) | .0006 | 1.49 | (1.06, 2.10) | .02 |
| History of:b | |||||||||
| Stroke/TIA | 277 | 141 | (50.9) | 1.43 | (0.97, 2.12) | .07 | 1.30 | 4(0.87, 2.08) | .18 |
| Dyslipidemia | 243 | 192 | (79.0) | 6.62 | (3.28, 13.36) | < .00 01 | 5.77 | 2.65, 12.54) | < .0001 |
| MI | 67 | 42 | (62.7) | 1.77 | (0.90, 3.45) | .10 | a | ||
| CAD | 132 | 28 | (21.2) | 1.49 | (0.87, 2.54) | .14 | |||
| Smoking | 158 | 89 | (56.3) | 1.00 | (0.74, 1.28) | .86 | |||
| Heart failure | 83 | 28 | (33.7) | 0.60 | (0.41, 0.87) | .007 | 0.40 | 0.26, 0.61) | < .0001 |
| Diabetes | 199 | 119 | (59.8) | 1.67 | (1.26, 2.20) | .007 | a | ||
| Hypertension | 516 | 271 | (52.5)1.82 | (1.45, 2.27) | < .0001 | 1.36 | 7(0.88, 2.212) | .16 | |
| Atrial fibrillation | 125 | 51 | (40.8) | 0.79 | (0.55, 1.12) | 18 | |||
| Received lipid profile | 383 | 253 | (66.1) | 2.77 | (1.75, 4.38) | < .0001 | 2.46 | (1.53, 3.97) | .0002 |
| Received tPA | |||||||||
| No | 748 | 360 | (48.1) | Ref | |||||
| Yes | 16 | 9 | (56.3) | 1.26 | (0.58, 2.71) | .56 | |||
| Ambulatory at discharge | 400 | 206 | (51.5) | 1.36 | (1.05, 1.78) | .02 | 1.33 | (0.96, 1.80) | 0.09 |
Three of the patients with documented LDL‐C levels (0.8%) had documented contraindications to therapy. Among all those who had documented LDL‐C levels, the rate of appropriate treatment with lipid‐lowering medications was high in both the ACE and non‐ACE groups (94.6% and 98.6%, respectively; P = .02). However, because only a small number of patients did not receive optimal treatment, the odds ratio of 0.24 had a fairly wide confidence interval (95% CI = 0.06, 0.91). Although a trend toward a higher rate of treatment with increasing LDL‐C level was seen in both the ACE and non‐ACE groups, this trend was only significant for the group with non‐ACE patients (Figure 1).
DISCUSSION
We found that only half the patients hospitalized for ischemic stroke or TIA had LDL‐C levels tested while in the hospital, even among those identified by the ATP guidelines as at high risk for future coronary events. Our findings are in accord with those of the Coverdell Project, which evaluated key features of acute stroke care from 4 prototype registries, those in Georgia, Massachusetts, Michigan, and Ohio, finding that fewer than 40% of acute stroke patients had had lipid profiles checked during hospitalization.11 Our study also evaluated predictors for in‐hospital lipid testing and lipid‐lowering treatment during hospitalization for an acute ischemic cerebrovascular event. We found that lipid testing was correlated with treatment during stroke or TIA hospitalization, suggesting that in‐hospital lipid management is related to an overall appreciation of the importance of lipids.
Understanding the factors resulting in such underperformance is critical for improving patient care and outcomes. Lipid assessment and treatment rates varied widely between CASPR hospitals, reflecting dramatic differences in hospital practice. This finding is similar to that noted in a recent study performed in Europe10 and underscores the need to promote a more uniform approach to in‐hospital care of patients with ischemic stroke or TIA. Our study also found that ischemic stroke patients were much more likely to have their lipid level measured and to be discharged on a lipid‐lowering agent than were TIA patients. This may be so because many treating health care professionals perceive TIAs as benign events that carry a more favorable prognosis than do strokes, or it could be that the length of stay for a TIA, often shorter than that for a stroke, limited in‐hospital testing or planning for patient follow‐up.
A high proportion of non‐ACE, lipid‐tested stroke/TIA patients received lipid‐lowering drug treatment, even when their lipid levels were within the treatment range categorized as nonpharmacologic by the national guidelines. This finding could be a result of one of the goals of the primary study.15 In the primary study, the effect of standardized orders implemented during the second observational period were analyzed by comparing them to those in place during the first observational period to see if they had improved the in‐hospital stroke care process. One of the study goals was optimal discharge utilization of a lipid‐lowering agent, defined as prescription of a lipid modifier or an LDL < 100 mg/dL. There was a significant increase in the number of prescriptions for lipid modifiers at discharge after implementing the standardized orders.15 However, as this study has shown, when existing national cholesterol guidelines were strictly applied to all the patients,6 overall there was a suboptimal rate of utilization of lipid modifiers at discharge.
Lipid profile assessment during stroke admission is one of the 10 performance measures in the performance measure set of the Joint Commission on Accreditation of Healthcare Organizations (JCAHO) Stroke Disease‐Specific Care.16 Initiating therapy with lipid‐lowering agents before discharge may help to maintain continuity of care and clarify therapeutic intent, especially when a different physician is responsible for care after discharge from the hospital. Recent studies indicated that in‐hospital initiation of medication following admission for a vascular event tends to improve longer‐term patient adherence to treatment,17, 18 as well as vascular outcomes,19, 20 and is a strategy favored by the American Stroke Association.13, 21
This study had several limitations. Our definitions of dyslipidemia and of adherence to ATP III goals were based on single measurements of LDL‐C, rather than multiple determinations of lipoprotein subfractions. However, we believe that this approach parallels actual clinical practice more closely. Although LDL‐C is the most important of all the components of the lipid profile,6 because lipid subfractions other than LDL‐C were not collected in the CASPR registry, we may have misclassified a few patients. For instance, extremely high trigylceride levels can render LDL‐C levels inaccurate, and as such, not having a documented LDL‐C may not have always indicated that a lipid panel was not performed. It is also conceivable that physicians might actually have been more thorough in measuring LDL‐C, identifying contraindications to lipid‐lowering therapy, or instituting lipid‐lowering therapy than were noted in the hospital charts. However, for quality assurance purposes, what is documented is the only traceable record of what was actually asked for or done. As such, health care professionals are frequently encouraged to keep updated chart notes. This study was an assessment of in‐hospital behavior; the low utilization of lipid‐lowering agents observed may underestimate the final treatment rate, as we did not evaluate the postdischarge rate of therapy. However, recent data suggest in‐hospital prescription patterns are a major predictor of longer‐term care in the community.17, 22 Last, the CASPR investigators did not collect data on the rate of utilization of lipid agents prior to hospitalization or on the mechanisms by which the strokes and TIAs had occurred. Prehospital utilization of lipid agents has previously been revealed to influence the prescribing of lipid‐lowering agents at discharge.10 Knowledge of the mechanisms of the stroke and TIA events would have increased the number of those eligible for lipid treatment, particularly those whose events were to the result of an atherosclerotic mechanism per ATP III's more expansive definition of CHD risk equivalents, which includes carotid and other forms of clinical atherosclerotic disease.6 However, because the results of other studies that evaluated lipid management in all hospitalized stroke patients (regardless of mechanism)11, 23 or in all patients with any form of clinical atherosclerotic disease24 were in accord with those of our study, it would appear unlikely that such information would have made an overwhelming difference to our results.
In conclusion, the results of the present study suggest that considerable improvement is needed in identifying appropriate candidates among those who have had stroke or TIA and treating them with lipid‐lowering agents. Performing lipid testing in individuals hospitalized with ischemic stroke or TIA is important because it may inform the identification of persons for whom treatment should be initiated or modified. Lipid assessment during hospitalization for stroke/TIA and initiation of lipid‐lowering therapy when indicated are major management steps that all patients with ischemic cerebrovascular events should receive.
- ,,, et al.Thrombus formation on atherosclerotic plaques: pathogenesis and clinical consequences.Ann Intern Med.2001;134:224–238.
- ,,, et al.Manifestations of atherosclerosis in various vascular regions. Similarities and differences regarding epidemiology, etiology and prognosis [in German].Med Klin.2002;97:221–228.
- ,,,.Hypolipemic agents for stroke prevention.Clin Exp Hypertens.2002;24:573–594.
- ,,,,,.Differential effects of lipid‐lowering therapies on stroke prevention: a meta‐analysis of randomized trials.Arch Intern Med.2003;163:669–676.
- Heart Protection Study Collaborative Group.Effects of cholesterol‐lowering with simvastatin on stroke and other major vascular events in 20,536 people with cerebrovascular disease or other high‐risk conditions.Lancet.2004;363:757–767.
- Executive Summary of the Third Report of the National Cholesterol Education Program (NCEP) Expert Panel on Detection, Evaluation, and Treatment of High Blood Cholesterol in Adults (Adult Treatment Panel III).JAMA.2001;285:2486–2497.
- ,,,.The lipid treatment assessment project (L‐TAP): a multicenter survey to evaluate the percentages of dyslipidemic patients receiving lipid‐lowering therapy and achieving low‐density lipoprotein cholesterol goals.Arch Intern Med.2000;160:459–467.
- ,,, et al.Analysis of the degree of undertreatment of hyperlipidemia and congestive heart failure secondary to coronary artery disease.Am J Cardiol.1999;83:1303–1307.
- .Statin therapy after acute myocardial infarction: are we adequately treating high‐risk patients?Curr Atheroscler Rep.2002;4:99–106.
- ,,,.Determination of lipid profiles and use of statins in patients with ischemic stroke or transient ischemic attack.Stroke.2003;34:105–110.
- ,,, et al.Acute stroke care in the US: results from 4 pilot prototypes of the Paul Coverdell National Acute Stroke Registry.Stroke.2005;36:1232–1240.
- ,,.Stroke prevention: narrowing the evidence‐practice gap.Neurology.2000;54:1899–1906.
- Statins after ischemic stroke and transient ischemic attack: an advisory statement from the Stroke Council, American Heart Association and American Stroke Association.Stroke.2004;35:1023.
- California Acute Stroke Pilot Registry (CASPR) Investigators.Prioritizing interventions to improve rates of thrombolysis for ischemic stroke.Neurology.2005;64:654–659.
- California Acute Stroke Pilot Registry (CASPR) Investigators.The impact of standardized stroke orders on adherence to best practices.Neurology.2005;65:360–365.
- JCAHO Stroke Disease‐Specific Care performance measure set. Available at: www.jcaho.org/dscc/dsc/performance+measures/stroke+measure+set.htm. Accessed November 20,2005.
- .The role of in‐hospital initiation of cardiovascular protective therapies to improve treatment rates and clinical outcomes.Rev Cardiovasc Med.2003;4(Suppl 3):S37–S46.
- ,,, et al.In‐hospital initiation of secondary stroke prevention therapies yields high rates of adherence at follow‐up.Stroke.2004;35:2879–2883.
- ,,,.Improved treatment of coronary heart disease by implementation of a Cardiac Hospitalization Atherosclerosis Management Program (CHAMP).Am J Cardiol.2001;87:819–822.
- ,,, et al.Impact of combination evidence‐based medical therapy on mortality in patients with acute coronary syndromes.Circulation.2004;109:745–749.
- American Heart Association Get with the Guidelines Program—Coronary Artery Disease Pilot Test Results. Available at: http://www.americanheart.org/presenter.jhtml?identifier=699. Accessed November 30,2003.
- ,,, et al.In‐hospital initiation of lipid‐lowering therapy after coronary intervention as a predictor of long‐term utilization: a propensity analysis.Arch Intern Med.2003;163:2576–2582.
- University HealthSystem Consortium Ischemic Stroke Clinical Benchmarking Project Clinical Database Analysis—2001. University HealthSystem Consortium Ischemic Stroke Database Report #3.
- ,,.Expanding indications for statins in cerebral ischemia: a quantitative study.Arch Neurol.2005;62:67–72.
Aortocervicocephalic atherosclerotic disease and coronary artery disease share common risk factors, and patients with one condition are at high risk of harboring or developing the other.1, 2 Over the past decade, several randomized clinical trials of lipid‐lowering medications designed to reduce low‐density lipoprotein cholesterol (LDL‐C) have shown a significant decrease in the risk of coronary events and ischemic stroke among patients who have a history of or are at risk for coronary artery disease, regardless of whether serum cholesterol is elevated.3, 4 Results from more than 3000 stroke patients enrolled in the Heart Protection Study also provide evidence that aggressive lipid‐lowering therapy may prevent recurrent vascular events in individuals who have a total cholesterol level as low as 135 mg/dL and cerebrovascular disease, with or without known coronary artery disease.5
Guidelines from the National Cholesterol Evaluation Program Adult Treatment Panel (ATP) provide target LDL‐C levels for persons with atherosclerotic disease depending on the extent of their vascular risk.6 However, despite the broad dissemination of these guidelines, several published studies of patients with coronary artery disease or dyslipidemia have shown that a large proportion of patients with high vascular risk continue to be underscreened, underdiagnosed, and undertreated for dyslipidemia.79
Few studies have evaluated the quality of cholesterol management among hospitalized patients who have experienced an acute ischemic cerebrovascular event10, 11 So the data are scarce on the management of patients hospitalized for ischemic stroke or transient ischemic attack (TIA) who are, according to ATP criteria, at high risk for future coronary events and on the factors that may govern that management. Systematic reviews have suggested that incorporating a lipid profile during acute stroke presentation could assure baseline assessment and serve as a potential cue for physicians to change their behavior,12 and an American Stroke Association advisory recommends lipid treatment during hospitalization for most patients with ischemic stroke or TIA as it may increase the rate of long‐term use.13
The objectives of this study were to determine the rates of testing for and treatment of dyslipidemia according to national cholesterol guidelines among individuals hospitalized with acute ischemic stroke or TIA and to identify predictors of performance.
METHODS
The California Acute Stroke Prototype Registry (CASPR) is a Centers for Disease Controlsponsored cohort that captured detailed data on patients admitted to 11 hospitals over a 2‐year period. The methods of study have been described elsewhere.14 In brief, CASPR prospectively collected information on acute stroke care at 11 representative hospitals in 5 major population regions of California. Data were collected on diagnostic evaluation, appropriate use of treatment strategies, and disposition on discharge from the hospital. The main goal of CASPR was to pilot‐test a prototype prospective registry of acute stroke and transient ischemic attack to be used as a quality improvement tool. The study population was patients with an admitting or discharge diagnosis of suspected stroke or TIA from November 1, 2002, through January 31, 2003, and from November 1, 2003, through January 31, 2004. The human subjects review board at each participating center approved the study.
For the present analysis, data on all patients with a discharge diagnosis of ischemic stroke or TIA who were admitted during either period were included. We examined the possible association of several variables with 2 primary outcomes: (1) testing lipid profile during hospitalization (as indicated by a documented LDL‐C level) and (2) prescribing lipid‐lowering medication at discharge. In those analyses in which lipid profile testing was the outcome, no variables were considered acceptable reasons for not performing an LDL‐C assessment.
The distribution of LDL‐C levels in this portion of the cohort was determined. Patients were then categorized according to their risk for future coronary events. Patients were classified as at risk for coronary events (ACE) if they either had a documented history of myocardial infarction, coronary artery disease, or diabetes or had undergone carotid endarterectomy or carotid angioplasty/stenting during hospitalization. Criteria for initiating lipid‐lowering therapy were defined according to the ATP III guidelines,6 which were in effect during both CASPR study periods. Continuing the recommendation in ATP II, the ATP III recommendations emphasized that persons with documented coronary artery disease (CAD) receive the most aggressive lipid‐lowering treatment. But this recommendation was expanded to include patients without established CAD, whose coronary risk is equivalent to that of patients with diagnosed CAD.6
As per the ATP III guidelines, CASPR‐ACE patients were considered optimally treated if they were prescribed a lipid‐lowering agent at discharge or if their documented LDL‐C was less than 130 mg/dL. A concurrent history of liver disease, abnormal prothrombin time, life expectancy of less than 1 year, and terminal illness were each considered a valid contraindication to treatment with lipid‐lowering medication. Optimal treatment for non‐ACE patients was defined as receipt of lipid‐lowering medication at discharge or a documented LDL‐C of 160 mg/dL. The rate of optimal treatment of ACE patients was compared to that of non‐ACE patients. The ACE and non‐ACE patients were then further categorized into 1 of 4 groups according to LDL‐C level<100, 100130, 130160, and >160 mg/dLand an assessment for trend of the rate of treatment in each of the 4 categories in the ACE and non‐ACE groups was performed.
Data Analysis
Univariate analyses of potential risk factors with lipid testing and treatment were performed using generalized estimating equations (GEEs) in order to account for both within‐hospital and between‐hospital variance and to acknowledge the impact of clustered observations on confidence intervals. Variables significant at the = .10 level were included in the multivariate models. In the subanalyses of patients with documented LDL‐C tests, GEE models were also used to examine factors associated with having an LDL‐C level below 100 mg/dL. A chi‐square test was used to compare the rate of optimal treatment (as defined above) in the group at risk for coronary disease with that in the group not at risk. The Mantel‐Haenszel chi‐squared test was used to compare trends in treatment rate with increasing LDL‐C level. All analyses were performed using SAS (version 8e, SAS Institute, Cary, NC).
RESULTS
Data were available from the 11 CASPR hospitals for 764 patients diagnosed with either ischemic stroke or TIA. Overall, 53.4% of subjects were women, and the average age at hospitalization of 70.4 ( 15.4) years. In the cohort, 55.3% of the patients were non‐Hispanic white, 9.7% were African American, 13.4% were Hispanic, 13% were Asian, and 8.6% were classified as other. Three hundred and nine individuals (40.5% of the cohort) were classified as at risk for coronary events. Of these, 148 (47.8%) had diabetes only, and 160 (51.8%) had a history of MI, CAD, or both. One patient (0.4%) had undergone angioplasty/stenting during hospitalization but had no history of MI, CAD, or diabetes. Only 4 patients (0.52% of the entire cohort) had undergone a carotid endarterectomy or angioplasty/stenting during hospitalization. Rates of lipid assessment and optimal treatment varied widely between hospitals, but testing and treatment were correlated for each hospital. Overall, however, testing and treatment were correlated (Pearson correlation coefficient = 0.35, P < .0001). On an individual hospital level, the correlation was positive and significant for 6 hospitals, positive but not significant for 2 hospitals, and negative but not significant for 3 hospitals.
Overall, LDL‐C levels were determined in 383 patients (50.1%). The likelihood that a patient would have an LDL‐C test performed during hospitalization varied widely by hospital, ranging from 12% to 88% (P < .0001). Univariate variables significantly associated with documented LDL‐C measurement in the overall cohort at the = .10 level were diagnosis of ischemic stroke (as compared to TIA) and history of dyslipidemia (Table 1). In the CASPR cohort, 53% of the ACE subjects received a lipid profile assessment compared to 48% in the rest of the cohort (P = .14). In multivariate analysis, diagnosis of ischemic stroke and history of dyslipidemia remained significantly associated with documented LDL‐C measurement (Table 1).
| Characteristic | n | With LDL‐C | Univariatea | P value | Adjusteda | P value | |||
|---|---|---|---|---|---|---|---|---|---|
| no. | % | OR | (95% CI) | OR | (95% CI) | ||||
| |||||||||
| Median age | |||||||||
| 73 years | 385 | 210 | (54.5) | Ref | |||||
| > 73 years | 379 | 173 | (45.6) | 0.95 | (0.68, 1.34) | .78 | |||
| Sex | |||||||||
| Female | 408 | 189 | (46.3) | Ref | |||||
| Male | 356 | 194 | (54.5) | 1.05 | (0.84, 1.39) | .53 | |||
| Ethnicity | |||||||||
| Other | 341 | 190 | (56.3) | Ref | |||||
| White | 423 | 193 | (45.6) | 0.88 | (0.60, 1.30) | .53 | |||
| Event type | |||||||||
| TIA | 172 | 62 | (36) | Ref | Ref | ||||
| Ischemic stroke | 592 | 321 | (54) | 1.70 | (1.14, 2.54) | .01 | 1.52 | (1.06, 2.19) | .02 |
| Risk of coronary events | 309 | 165 | (53.4) | 1.14 | (0.78, 1.68) | .50 | |||
| History of:b | |||||||||
| Stroke/TIA | 277 | 122 | (44.0) | 0.85 | (0.58, 1.24) | .39 | |||
| Dyslipidemia | 67 | 32 | (47.8) | 0.94 | (0.47, 1.90) | .86 | |||
| MI | 132 | 63 | (47.7) | 0.84 | (0.65, 1.08) | .17 | |||
| CAD | 158 | 96 | (60.8) | 0.95 | (0.67, 1.34) | .76 | |||
| Smoking | 83 | 31 | (37.3) | 0.67 | (0.40, 1.10) | .12 | |||
| Heart failure | 199 | 109 | (54.8) | 1.13 | (0.74, 1.73) | .58 | |||
| Diabetes | 516 | 259 | (50.2) | 1.09 | (0.83, 1.44) | .54 | |||
| Hypertension | 243 | 140 | (57.6) | 1.45 | (0.98, 2.14) | .07 | 1.41 | (1.01, 1.97) | .05 |
| Atrial fibrillation | 125 | 56 | (44.8) | 0.95 | (0.69, 1.32) | .76 | |||
| Received tPA | |||||||||
| No | 748 | 371 | (49.6) | Ref | |||||
| Yes | 16 | 12 | (75.0) | 2.01 | (0.79, 5.11) | .14 | |||
Lipid‐lowering drugs were prescribed at discharge to 370 patients (48.4%); however, treatment rate varied among hospitals, from a low of 13% of patients to a high of 84% of patients (P < .0001). Univariate factors associated with a higher treatment rate at the = .10 level were diagnosis of ischemic stroke, history of stroke/TIA, history of diabetes, hypertension, history of dyslipidemia, independent ambulation at discharge, and ACE status (Table 2). Patients were less likely to receive lipid‐lowering medication if they had a history of heart failure. Fifty‐nine percent of the CASPR ACE subjects were discharged on lipid‐modifying agents compared to 42% in the rest of the cohort (P = .0006). Multivariate analyses revealed several independent predictors of treatment with lipid‐lowering medication. Diagnosis of ischemic stroke, ACE status, and history of heart failure were negative predictors (less likely to be treated), and history of dyslipidemia was a positive predictor (Table 2). Status as an academic hospital was a hospital characteristic for which a significant association was found. Academic hospitals were significantly more likely to both perform LDL profiles and administer lipid‐lowering medications at discharge than were nonacademic hospitals. This association was found in a logistic regression analysis that did not account for between‐hospital variance. However, when we used GEE analysis, which adjusted for the variance, the difference between academic and nonacademic hospitals was no longer significant.
| Characteristic | n | Use of lipid‐lowering medication | Univariatea | P value | Adjusteda | P value | |||
|---|---|---|---|---|---|---|---|---|---|
| no. | % | OR | (95% CI) | OR | (95% CI) | ||||
| |||||||||
| Median age | |||||||||
| 73 years | 385 | 208 | (54.0) | Ref | |||||
| > 73 years | 379 | 162 | (42.7) | 0.79 | (0.59, 1.06) | .11 | |||
| Sex | |||||||||
| Female | 408 | 184 | (45.1) | Ref | |||||
| Male | 356 | 186 | (52.2) | 1.05 | (0.89, 1.25) | .55 | |||
| Ethnicity | |||||||||
| Other | 341 | 190 | (55.7) | Ref | |||||
| White | 423 | 193 | (45.6) | 0.88 | (0.61, 1.27) | .55 | |||
| Event type | |||||||||
| TIA | 172 | 58 | (34) | Ref | Ref | ||||
| Ischemic stroke | 592 | 312 | (53) | 1.92 | (1.39, 2.65) | < .0001 | 1.95 | (1.33, 2.85) | .0009 |
| At risk, coronary events | 309 | 181 | (58.6) | 1.83 | (1.30, 2.59) | .0006 | 1.49 | (1.06, 2.10) | .02 |
| History of:b | |||||||||
| Stroke/TIA | 277 | 141 | (50.9) | 1.43 | (0.97, 2.12) | .07 | 1.30 | 4(0.87, 2.08) | .18 |
| Dyslipidemia | 243 | 192 | (79.0) | 6.62 | (3.28, 13.36) | < .00 01 | 5.77 | 2.65, 12.54) | < .0001 |
| MI | 67 | 42 | (62.7) | 1.77 | (0.90, 3.45) | .10 | a | ||
| CAD | 132 | 28 | (21.2) | 1.49 | (0.87, 2.54) | .14 | |||
| Smoking | 158 | 89 | (56.3) | 1.00 | (0.74, 1.28) | .86 | |||
| Heart failure | 83 | 28 | (33.7) | 0.60 | (0.41, 0.87) | .007 | 0.40 | 0.26, 0.61) | < .0001 |
| Diabetes | 199 | 119 | (59.8) | 1.67 | (1.26, 2.20) | .007 | a | ||
| Hypertension | 516 | 271 | (52.5)1.82 | (1.45, 2.27) | < .0001 | 1.36 | 7(0.88, 2.212) | .16 | |
| Atrial fibrillation | 125 | 51 | (40.8) | 0.79 | (0.55, 1.12) | 18 | |||
| Received lipid profile | 383 | 253 | (66.1) | 2.77 | (1.75, 4.38) | < .0001 | 2.46 | (1.53, 3.97) | .0002 |
| Received tPA | |||||||||
| No | 748 | 360 | (48.1) | Ref | |||||
| Yes | 16 | 9 | (56.3) | 1.26 | (0.58, 2.71) | .56 | |||
| Ambulatory at discharge | 400 | 206 | (51.5) | 1.36 | (1.05, 1.78) | .02 | 1.33 | (0.96, 1.80) | 0.09 |
Three of the patients with documented LDL‐C levels (0.8%) had documented contraindications to therapy. Among all those who had documented LDL‐C levels, the rate of appropriate treatment with lipid‐lowering medications was high in both the ACE and non‐ACE groups (94.6% and 98.6%, respectively; P = .02). However, because only a small number of patients did not receive optimal treatment, the odds ratio of 0.24 had a fairly wide confidence interval (95% CI = 0.06, 0.91). Although a trend toward a higher rate of treatment with increasing LDL‐C level was seen in both the ACE and non‐ACE groups, this trend was only significant for the group with non‐ACE patients (Figure 1).
DISCUSSION
We found that only half the patients hospitalized for ischemic stroke or TIA had LDL‐C levels tested while in the hospital, even among those identified by the ATP guidelines as at high risk for future coronary events. Our findings are in accord with those of the Coverdell Project, which evaluated key features of acute stroke care from 4 prototype registries, those in Georgia, Massachusetts, Michigan, and Ohio, finding that fewer than 40% of acute stroke patients had had lipid profiles checked during hospitalization.11 Our study also evaluated predictors for in‐hospital lipid testing and lipid‐lowering treatment during hospitalization for an acute ischemic cerebrovascular event. We found that lipid testing was correlated with treatment during stroke or TIA hospitalization, suggesting that in‐hospital lipid management is related to an overall appreciation of the importance of lipids.
Understanding the factors resulting in such underperformance is critical for improving patient care and outcomes. Lipid assessment and treatment rates varied widely between CASPR hospitals, reflecting dramatic differences in hospital practice. This finding is similar to that noted in a recent study performed in Europe10 and underscores the need to promote a more uniform approach to in‐hospital care of patients with ischemic stroke or TIA. Our study also found that ischemic stroke patients were much more likely to have their lipid level measured and to be discharged on a lipid‐lowering agent than were TIA patients. This may be so because many treating health care professionals perceive TIAs as benign events that carry a more favorable prognosis than do strokes, or it could be that the length of stay for a TIA, often shorter than that for a stroke, limited in‐hospital testing or planning for patient follow‐up.
A high proportion of non‐ACE, lipid‐tested stroke/TIA patients received lipid‐lowering drug treatment, even when their lipid levels were within the treatment range categorized as nonpharmacologic by the national guidelines. This finding could be a result of one of the goals of the primary study.15 In the primary study, the effect of standardized orders implemented during the second observational period were analyzed by comparing them to those in place during the first observational period to see if they had improved the in‐hospital stroke care process. One of the study goals was optimal discharge utilization of a lipid‐lowering agent, defined as prescription of a lipid modifier or an LDL < 100 mg/dL. There was a significant increase in the number of prescriptions for lipid modifiers at discharge after implementing the standardized orders.15 However, as this study has shown, when existing national cholesterol guidelines were strictly applied to all the patients,6 overall there was a suboptimal rate of utilization of lipid modifiers at discharge.
Lipid profile assessment during stroke admission is one of the 10 performance measures in the performance measure set of the Joint Commission on Accreditation of Healthcare Organizations (JCAHO) Stroke Disease‐Specific Care.16 Initiating therapy with lipid‐lowering agents before discharge may help to maintain continuity of care and clarify therapeutic intent, especially when a different physician is responsible for care after discharge from the hospital. Recent studies indicated that in‐hospital initiation of medication following admission for a vascular event tends to improve longer‐term patient adherence to treatment,17, 18 as well as vascular outcomes,19, 20 and is a strategy favored by the American Stroke Association.13, 21
This study had several limitations. Our definitions of dyslipidemia and of adherence to ATP III goals were based on single measurements of LDL‐C, rather than multiple determinations of lipoprotein subfractions. However, we believe that this approach parallels actual clinical practice more closely. Although LDL‐C is the most important of all the components of the lipid profile,6 because lipid subfractions other than LDL‐C were not collected in the CASPR registry, we may have misclassified a few patients. For instance, extremely high trigylceride levels can render LDL‐C levels inaccurate, and as such, not having a documented LDL‐C may not have always indicated that a lipid panel was not performed. It is also conceivable that physicians might actually have been more thorough in measuring LDL‐C, identifying contraindications to lipid‐lowering therapy, or instituting lipid‐lowering therapy than were noted in the hospital charts. However, for quality assurance purposes, what is documented is the only traceable record of what was actually asked for or done. As such, health care professionals are frequently encouraged to keep updated chart notes. This study was an assessment of in‐hospital behavior; the low utilization of lipid‐lowering agents observed may underestimate the final treatment rate, as we did not evaluate the postdischarge rate of therapy. However, recent data suggest in‐hospital prescription patterns are a major predictor of longer‐term care in the community.17, 22 Last, the CASPR investigators did not collect data on the rate of utilization of lipid agents prior to hospitalization or on the mechanisms by which the strokes and TIAs had occurred. Prehospital utilization of lipid agents has previously been revealed to influence the prescribing of lipid‐lowering agents at discharge.10 Knowledge of the mechanisms of the stroke and TIA events would have increased the number of those eligible for lipid treatment, particularly those whose events were to the result of an atherosclerotic mechanism per ATP III's more expansive definition of CHD risk equivalents, which includes carotid and other forms of clinical atherosclerotic disease.6 However, because the results of other studies that evaluated lipid management in all hospitalized stroke patients (regardless of mechanism)11, 23 or in all patients with any form of clinical atherosclerotic disease24 were in accord with those of our study, it would appear unlikely that such information would have made an overwhelming difference to our results.
In conclusion, the results of the present study suggest that considerable improvement is needed in identifying appropriate candidates among those who have had stroke or TIA and treating them with lipid‐lowering agents. Performing lipid testing in individuals hospitalized with ischemic stroke or TIA is important because it may inform the identification of persons for whom treatment should be initiated or modified. Lipid assessment during hospitalization for stroke/TIA and initiation of lipid‐lowering therapy when indicated are major management steps that all patients with ischemic cerebrovascular events should receive.
- ,,, et al.Thrombus formation on atherosclerotic plaques: pathogenesis and clinical consequences.Ann Intern Med.2001;134:224–238.
- ,,, et al.Manifestations of atherosclerosis in various vascular regions. Similarities and differences regarding epidemiology, etiology and prognosis [in German].Med Klin.2002;97:221–228.
- ,,,.Hypolipemic agents for stroke prevention.Clin Exp Hypertens.2002;24:573–594.
- ,,,,,.Differential effects of lipid‐lowering therapies on stroke prevention: a meta‐analysis of randomized trials.Arch Intern Med.2003;163:669–676.
- Heart Protection Study Collaborative Group.Effects of cholesterol‐lowering with simvastatin on stroke and other major vascular events in 20,536 people with cerebrovascular disease or other high‐risk conditions.Lancet.2004;363:757–767.
- Executive Summary of the Third Report of the National Cholesterol Education Program (NCEP) Expert Panel on Detection, Evaluation, and Treatment of High Blood Cholesterol in Adults (Adult Treatment Panel III).JAMA.2001;285:2486–2497.
- ,,,.The lipid treatment assessment project (L‐TAP): a multicenter survey to evaluate the percentages of dyslipidemic patients receiving lipid‐lowering therapy and achieving low‐density lipoprotein cholesterol goals.Arch Intern Med.2000;160:459–467.
- ,,, et al.Analysis of the degree of undertreatment of hyperlipidemia and congestive heart failure secondary to coronary artery disease.Am J Cardiol.1999;83:1303–1307.
- .Statin therapy after acute myocardial infarction: are we adequately treating high‐risk patients?Curr Atheroscler Rep.2002;4:99–106.
- ,,,.Determination of lipid profiles and use of statins in patients with ischemic stroke or transient ischemic attack.Stroke.2003;34:105–110.
- ,,, et al.Acute stroke care in the US: results from 4 pilot prototypes of the Paul Coverdell National Acute Stroke Registry.Stroke.2005;36:1232–1240.
- ,,.Stroke prevention: narrowing the evidence‐practice gap.Neurology.2000;54:1899–1906.
- Statins after ischemic stroke and transient ischemic attack: an advisory statement from the Stroke Council, American Heart Association and American Stroke Association.Stroke.2004;35:1023.
- California Acute Stroke Pilot Registry (CASPR) Investigators.Prioritizing interventions to improve rates of thrombolysis for ischemic stroke.Neurology.2005;64:654–659.
- California Acute Stroke Pilot Registry (CASPR) Investigators.The impact of standardized stroke orders on adherence to best practices.Neurology.2005;65:360–365.
- JCAHO Stroke Disease‐Specific Care performance measure set. Available at: www.jcaho.org/dscc/dsc/performance+measures/stroke+measure+set.htm. Accessed November 20,2005.
- .The role of in‐hospital initiation of cardiovascular protective therapies to improve treatment rates and clinical outcomes.Rev Cardiovasc Med.2003;4(Suppl 3):S37–S46.
- ,,, et al.In‐hospital initiation of secondary stroke prevention therapies yields high rates of adherence at follow‐up.Stroke.2004;35:2879–2883.
- ,,,.Improved treatment of coronary heart disease by implementation of a Cardiac Hospitalization Atherosclerosis Management Program (CHAMP).Am J Cardiol.2001;87:819–822.
- ,,, et al.Impact of combination evidence‐based medical therapy on mortality in patients with acute coronary syndromes.Circulation.2004;109:745–749.
- American Heart Association Get with the Guidelines Program—Coronary Artery Disease Pilot Test Results. Available at: http://www.americanheart.org/presenter.jhtml?identifier=699. Accessed November 30,2003.
- ,,, et al.In‐hospital initiation of lipid‐lowering therapy after coronary intervention as a predictor of long‐term utilization: a propensity analysis.Arch Intern Med.2003;163:2576–2582.
- University HealthSystem Consortium Ischemic Stroke Clinical Benchmarking Project Clinical Database Analysis—2001. University HealthSystem Consortium Ischemic Stroke Database Report #3.
- ,,.Expanding indications for statins in cerebral ischemia: a quantitative study.Arch Neurol.2005;62:67–72.
Copyright © 2006 Society of Hospital Medicine
