User login
Role of Shock Index in ICU Transfers
The decision to transfer a patient to the intensive care unit (ICU) from a general care setting is complex and based not only on clinical findings and patient wishes but also on the understanding that ICU resources are limited and costly.1 Adding to the decision‐making complexity is the knowledge that patients who transfer to an ICU from a general medical unit comprise the highest mortality group of ICU patients, with the mortality rate directly proportional to both the time spent on the general medical unit1, 2 and the number of physiologic abnormalities before ICU admission.3, 4
Prior studies have shown that cardiac arrest and unplanned (unexpected) transfers to the ICU are preceded by a period of physiologic instability reflected in the vital signs.510 However, vital signs alone may not accurately indicate clinical condition. For example, a person may be able to maintain normal blood pressure and heart rate despite severe illness or may have abnormal vital signs at baseline, which may be the case for an otherwise healthy young woman who has baseline low systolic blood pressure. Also, noncritical conditions commonly seen in hospitalized medical or surgical patients, such as anxiety or pain, may increase the respiratory rate or heart rate. Conversely, certain common medications, such as ‐blockers, may mask or blunt the normal physiologic response to illness. Overall, the prevalence of abnormal physiologic variables is high among hospitalized adult patients irrespective of the presence of serious adverse events.11 This prevalence may be a reason why 2 recent studies of inpatient medical emergency teams (METs) or rapid response teams (RRTs), which generally rely on vital signs for activation, failed to show a decrease in adult mortality rates.12, 13
Given the complexity of interpreting single vital sign readings, we evaluated a simple and clinically intuitive variable, the shock index (SI) (heart rate/systolic blood pressure, a noninvasive indication of left ventricular function),14 as a potential marker of the need for intensive care. Allgwer and Burri14 first developed the SI in studies of patients with acute blood loss, intraabdominal bleeding, fat emboli, and severe infections. They observed that a healthy adult had a mean SI of 0.54 (standard deviation [SD], 0.021), while an index of 1.0 indicated threatened shock and indices greater than 1.5 were seen in volume‐deficient shock.
We hypothesized that an elevated SI is a differentiating factor between a patient who had an unplanned ICU transfer and a general medical patient who did not require this higher level of care. To our knowledge, the SI has not been studied for this application previously.
Patients and Methods
Study Design
We conducted a retrospective case‐control study of 50 consecutive general medical patients who had unplanned transfers to the ICU and 50 matched control patients, with the approval of the Mayo Clinic Institutional Review Board. All patients were admitted to a general medical unit, and only patients who previously provided permission for their records to be used in research were included in the study.
Patients
This study enrolled patients who were at least 18 years old and who were admitted to a single general medical unit for 24 hours or longer. Patients were excluded if they required a surgical intervention, were transferred from another hospital, received care on a different general medical unit at any time during the hospitalization, or were pregnant. Our data collection began at the patients' (cases and controls) arrival on the general medical unit; we did not include data from any evaluation (outpatient or emergency department) before hospital admission.
Case Definition
An unplanned transfer was defined as an episode of unexpected clinical deterioration in a general medical patient that necessitated transfer to the ICU, as opposed to a preemptive or elective transfer following a procedure. Patients with unplanned transfers from December 9, 2003, to December 29, 2004, were eligible for the study. Only the first transfer to the ICU was considered for patients who had multiple ICU transfers during a single hospitalization. Because these data were collected before METs or RRTs were introduced at our institution, the recommendation for ICU transfer was a joint decision by the primary care team and the ICU team.
Control Definition
The matched controls were identified from among patients admitted to the general medical unit from January 16, 2002, to December 13, 2004. To reduce the effect of the heterogeneity inherent in general medical patients, we matched controls for age (within 5 years of age of the corresponding case), admission diagnosis code, and patient care unit of admission and required that they were admitted for at least 24 hours before dismissal. Patients who had an ICU stay during the same admission were excluded. The median difference in admission dates between the cases and the controls was 327 days, and 26 of the 50 matched pairs had admission dates within 1 year of each other. This lengthy interval between cases and controls was a consequence of the low incidence of patients who met the matching criteria.
Setting
This study involved the general medical units and ICUs of the 1157‐bed Saint Mary's Hospital, an academic tertiary care facility at Mayo Clinic in Rochester, Minnesota.
Vital Sign Determination
Vital signs abstracted for this study included blood pressure, heart rate, respiratory rate, oxygen saturation, and temperature. The SI was calculated for each set of abstracted vital signs. Staff nurses were responsible for the routine measurement and recording of vital signs at least once every 8 hours, although in several instances not all parameters were checked. In accordance with nursing policy, values outside the defined parameters were rechecked by the nursing supervisor of each care unit and, if found to be abnormal, were conveyed to the patient's physician. This system meant that abnormal results were checked by numerous observers, with differences in the frequency of recordings for individual patients.
Data Collection
Demographic data and information on the vital signs were abstracted through a comprehensive chart review. Demographic data included age, sex, ethnicity, comorbid conditions, hospital care unit, date and time of admission, admission diagnosis, date and time of transfer to the ICU, length of stay, dismissal date, and disposition at discharge. Comorbid conditions were scored using the Charlson Comorbidity Index.15
Statistical Analysis
A sample size of 50 matched pairs provided 81% power to detect an odds ratio of 3.0 or greater between cases and controls, with a 0.05, 2‐tailed level of significance with McNemar test. Patient demographic characteristics were summarized by the frequencies for categorical data and by mean and SD for continuous data. Consistent with the study design, the McNemar test and conditional logistic model analyses were used to determine the association between the SI and the risk of unplanned ICU transfer. Shock indices for the cases and controls were compared with use of t test. A P value <0.05 was considered statistically significant. For the SI, we calculated the odds ratio and its 95% confidence interval (CI) and P value using different cut points. We did not perform a receiver operating characteristics analysis because matching of cases and controls greatly complicates estimation of the sensitivity and specificity of the SI;16 a cohort study is suggested to investigate this analysis further. All statistical analyses were performed by SAS version 9.1.3 software (SAS Institute Inc, Cary, NC).
Results
A total of 50 pairs of matching cases and controls was included in this study. Table 1 lists the source of admission, demographic characteristics, and numbers of deaths for cases and controls. There were no statistically significant differences in admission source, age, sex, ethnicity, admission care unit, or Charlson Comorbidity Index. Mean length of stay was 14.8 days (SD, 9.7 days) for the cases and 5.7 days (SD, 6.3 days; P < 0.001) for the controls. Admission diagnoses were classified on the basis of the organ system of involvement (Table 2). In 30 of 50 cases, the admission diagnosis and the reason for ICU transfer were related.
| Value | Cases (n = 50) | Controls (n = 50) | P Value* |
|---|---|---|---|
| |||
| Emergency department admission, No. (%) | 33 (66) | 28 (56) | 0.41 |
| Direct admission, No. (%) | 14 (28) | 15 (30) | 1.00 |
| Other admission, No. (%) | 3 (6) | 7 (14) | 0.32 |
| Age, mean (SD), years | 69.8 (15.7) | 70.3 (15.8) | 0.38 |
| Male sex, No. (%) | 26 (52) | 18 (36) | 0.12 |
| Ethnicity, No. (%) | 1.00 | ||
| White | 46 (92) | 46 (92) | |
| Other | 4 (8) | 4 (8) | |
| Charlson Comorbidity index, mean (SD) | 3.06 (2.31) | 2.66 (2.02) | 0.22 |
| Hospital stay, mean (SD), day | 14.8 (9.7) | 5.7 (6.3) | 0.0007 |
| Hospital deaths, No. | 9 | 1 | 0.008 |
| Deaths within 30 days, No. | 5 | 2 | 0.24 |
| Deaths within 6 months, No. | 9 | 6 | 0.40 |
| System | Primary Admission Diagnosis | No. of Cases |
|---|---|---|
| Constitutional | Fever, malaise, general symptoms | 7 |
| Cardiovascular | Hypertension, congestive heart failure, chest pain, peripheral vascular disease, edema | 5 |
| Dermatologic | Cellulitis, foot ulcer, skin rash | 3 |
| Gastrointestinal | Pancreatitis, gastrointestinal hemorrhage, nausea and vomiting, diarrhea, abdominal pain | 6 |
| Hematologic | Thrombocytopenia, abnormal coagulation | 2 |
| Musculoskeletal | Lymphedema, shoulder pain, lumbago, back ache, closed dorsal vertebral fracture | 7 |
| Neurologic | Delirium tremens, psychosis, convulsions | 3 |
| Pulmonary | Pneumonia, food or vomit aspiration pneumonitis, shortness of breath, respiratory abnormality | 13 |
| Renal | Hyperkalemia, acute renal failure, renal artery atherosclerosis | 4 |
We reviewed the vital signs and shock indices for the 24 hours before ICU transfer for each case and over the entire hospitalization for each control, to determine the worst set (the lowest systolic blood pressure and the highest heart rate, respiratory rate, and SI). The cases had 1 to 22 complete sets of vitals for the 24 hours before ICU transfer; the median number of sets was 3 and the mean was 4. The controls had 1 to 12 complete sets for the 24 hours before the worst SI: the median was 3 sets and the mean was 3. In 26 of 50 controls, the worst SI occurred within the first 24 hours after admission. There was a significant difference between the median values of the worst shock indices of the cases and the controls (0.87 vs. 0.72; P < 0.005).
Table 3 shows the different values of the SI and the corresponding odds ratio of unplanned ICU transfer for cases compared with controls. The difference was significant at an SI of 0.85 and greater, indicating a strong association with unplanned ICU transfer.
| Shock Index | P Value | Odds Ratio | 95% CI |
|---|---|---|---|
| |||
| 0.8 | 0.05 | 2.43 | 1.015.86 |
| 0.85 | 0.02 | 3.00 | 1.917.56 |
| 0.9 | 0.007 | 7.50 | 1.7232.78 |
| 0.95 | <0.03 | 5.50 | 1.2224.81 |
We also found that the patients who transferred to the ICU had a greater number of inpatient deaths (9 cases vs. 1 control; P = 0.008), which would be expected, but there was no difference in 30‐day or 6‐month mortality rate (Table 1). One patient died after 30 days and while still hospitalized.
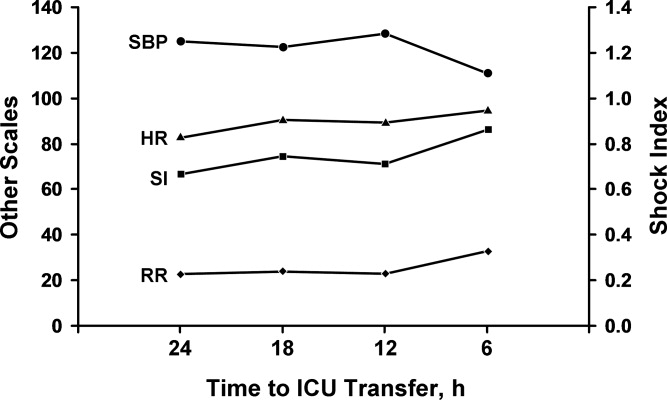
Comparison between the temporal trend of vital signs and the SI of the cases for the 24 hours before ICU transfer is shown in Figure 1. This graph shows the median of all the worst values (minimum systolic blood pressure and maximum SI, heart rate, and respiratory rate) over the four 6‐hour time periods (24 hours) preceding ICU transfer. Of note, the change in vital signs is subtle even while the SI increased to more than 0.8 as the patients clinically worsened before transfer.
Discussion
In our comparison of the SI of 50 patients who required unplanned (unexpected) transfer to the ICU with the SI of 50 matched controls who did not require this higher level of care, we found that a SI of 0.85 or greater was significantly associated with unplanned transfer to the ICU. The cases had a significantly higher worst SI than the controls, and they also had a significantly longer hospital stay and higher inpatient mortality rate, as would be expected for a sicker patient population. These findings are important given that the SI may be useful for assessing illness severity, for helping determine the need for transfer to the ICU, or for activating METs or RRTs.
A major problem with providing optimal care for hospitalized general medical patients is the inherent difficulty in determining illness severity and clinical decline, especially when the decline occurs gradually. Existing consensus recommendations for ICU admission include both specific diagnoses and arbitrary objective criteria based on abnormal vital signs and laboratory values.27 Also, individual institutions may have their own ICU admission requirements, which may differ from these or RRT criteria. Although vital signs are important as a snapshot of basic physiologic function, a number of noncritical conditions may lead to abnormal vital signs, and not all abnormal vital signs are associated with an adverse clinical event. By relying solely on vital signs, clinicians may not recognize critical illness and therefore not transfer a patient to the ICU or may inappropriately transfer a patient who does not need ICU‐level care.
Markers of illness severity other than vital signs, such as the Acute Physiology and Chronic Health Evaluation (APACHE) score, have been shown to predict the death of ICU patients17, 18 but have been rarely studied outside the ICU setting.19 Also, calculating the APACHE score is cumbersome, and there is no cutoff score that defines when a patient should be transferred to the ICU. Subbe et al.,20 in their study to identify critically ill patients, found that introduction of a physiological scoring system (including MET or RRT activation scores) would have identified only a small number of additional patients as critically ill. Another common marker of illness severity, the 4 criteria of the systemic inflammatory response syndrome (temperature <36C or >38C; heart rate >90 beats per minute; respiratory rate >20 breaths per minute or PCO2 <32 mm Hg; and white blood cell count >12,000/L or <4000/L or with more than 10% band cells)21 may be too sensitive to use as a decision aid, since even a healthy person running after a bus could have 2 of the 4 criteria.22 Likewise, surgical patients may have transient leukocytosis due to a stress response independent of an infection.23
The SI may be more accurate than vital signs alone to determine illness severity and who is at risk for an unplanned transfer to the ICU. Birkhahn et al.24 concluded that the SI may be more useful in early hemorrhage than either heart rate or systolic blood pressure alone. Rady et al.25 showed that the SI used in the emergency department can identify critical illness with apparently stable vital signs, where an elevation of the SI above 0.9 was associated with an illness that was treated immediately with admission to the hospital and intensive therapy on admission. However, it is unclear whether the SI can be used to monitor ongoing treatment, because a previous study showed that the SI may be of limited value in the assessment of systemic oxygen transport and response to therapy in clinical septic shock.26 Of note, the SI is mostly independent of the effects of pain or anxiety, which cause a concurrent rise in heart rate and systolic blood pressure. Because the heart's left ventricular work is unchanged or may increase from the underlying catecholamine surge, the SI will be unchanged or may actually decrease.
Our study adds to the medical literature the findings that: (1) the SI may be useful as an indicator of illness severity and a triage tool in patients with no trauma but with various medical conditions, and (2) the SI showed a strong association with unplanned ICU transfer.
The main strength of our study is its case‐control design with matched controls. Also, by comparing groups from the same patient care unit, we sought to minimize the selection bias that can be inherent in case‐control studies. Limitations include the retrospective, nonrandomized study design and the fact that there may have been variations in vital sign measurements by the multiple caregivers. However, the vital signs were taken according to standard hospital practice and reflect real‐world conditions. Although generalizability may be somewhat limited because of our homogeneous patient population, our patients had a wide range of various medical illnesses, so our study should be applicable to other hospital settings, both academic and community‐based.
One of the main weaknesses of our study is that the results were not adjusted for the burden of comorbid conditions, although there were no statistically significant differences in the number of comorbid conditions among the cases and the controls (P = 0.96). Also, we did not directly compare the SI with vital signs alone to determine superiority.
The SI may be an important objective measure to help clinicians decide when patients need treatment that is more aggressive, assistance from a MET or an RRT, or a preemptive, rather than unplanned, transfer to an ICU. Although it is unlikely that a single measure will allow accurate triage of all medical or surgical patients, the SI may be a useful adjunct to clinical judgment and other objective measures in determining illness severity and clinical decline. Further prospective studies are needed to compare the role of the SI specifically with MET or RRT activation criteria, to clarify the role of comorbid conditions in unplanned transfers to the ICU, to validate the cut point for the SI in various disease states, and to assess its utility in patients with septic shock. Depending on these results, it may be beneficial to incorporate the SI into the electronic medical record as an automatic alert to identify patients at risk for ICU transfer.
Conclusions
The SI is an easily calculated composite index of heart rate and systolic blood pressure. An elevated SI of 0.85 can identify patients who are at risk for unplanned transfer to the ICU from general patient care units. Future studies will determine whether the SI is more accurate than simple vital signs as an indicator of clinical decline. If so, it may be useful as a trigger to activate METs or RRTs for treatment.
- ,.Outcome of intensive care patients in a group of British intensive care units.Crit Care Med.1998;26(8):1337–1345.
- ,,,.The longer patients are in hospital before Intensive Care admission the higher their mortality.Intensive Care Med.2004;30(10):1908–1913.
- ,.Physiological abnormalities in early warning scores are related to mortality in adult inpatients.Br J Anaesth.2004;92(6):882–884.
- ,,,,.Association between clinically abnormal observations and subsequent in‐hospital mortality: a prospective study.Resuscitation.2004;62(2):137–141.
- ,,,,,.Recognising clinical instability in hospital patients before cardiac arrest or unplanned admission to intensive care: a pilot study in a tertiary‐care hospital.Med J Aust.1999;171(1):22–25.
- ,,.Physiological values and procedures in the 24 h before ICU admission from the ward.Anaesthesia.1999;54(6):529–534.
- ,,, et al.Antecedents to hospital deaths.Intern Med J.2001;31(6):343–348.
- ,,, et al.A comparison of antecedents to cardiac arrests, deaths and emergency intensive care admissions in Australia and New Zealand, and the United Kingdom: the ACADEMIA study.Resuscitation.2004;62(3):275–282.
- ,,,,.Anticipating events of in‐hospital cardiac arrest.Eur J Emerg Med.2004;11(1):24–28.
- ,,, et al.Duration of life‐threatening antecedents prior to intensive care admission.Intensive Care Med.2002;28(11):1629–1634.
- ,,,.The prevalence of recordings of the signs of critical conditions and emergency responses in hospital wards: the SOCCER study.Resuscitation.2005;65(2):149–157.
- ,,,,,.Hospital‐wide code rates and mortality before and after implementation of a rapid response team.JAMA.2008;300(21):2506–2513.
- ,,,,.Rapid response teams: a systematic review and meta‐analysis.Arch Intern Med.2010;170(1):18–26.
- ,. [Shock index.]Dtsch Med Wochenschr.1967;92(43):1947–50. [German]
- ,,,.A new method of classifying prognostic comorbidity in longitudinal studies: development and validation.J Chronic Dis.1987;40(5):373–83.
- ,.Matching in studies of classification accuracy: implications for analysis, efficiency, and assessment of incremental value.Biometrics.2008;64(1):1–9.
- ,,,.APACHE II: a severity of disease classification system.Crit Care Med.1985;13(10):818–829.
- ,.Outcome prediction in critical care: the Acute Physiology and Chronic Health Evaluation models.Curr Opin Crit Care.2008;14(5):491–497.
- ,,.APACHE II predicts long‐term survival in COPD patients admitted to a general medical ward.J Gen Intern Med.2003;18(10):824–830.
- ,,,.Validation of physiological scoring systems in the accident and emergency department.Emerg Med J.2006;23(11):841–845.
- ,,, et al;2001 SCCM/ESICM/ACCP/ATS/SIS International Sepsis Definitions Conference.Crit Care Med.2003;31(4):1250–1256.
- .Dear SIRS, I'm sorry to say that I don't like you...Crit Care Med.1997;25(2):372–374.
- ,.The inflammatory response to surgery and trauma.Curr Opin Crit Care.2006;12(4):325–332.
- ,,,,.Shock index in diagnosing early acute hypovolemia.Am J Emerg Med.2005;23(3):323–326.
- ,,,,.A comparison of the shock index and conventional vital signs to identify acute, critical illness in the emergency department.Ann Emerg Med.1994;24(4):685–690. Erratum in:Ann Emerg Med.year="1994"1994;24(6):1208.
- ,,,.Shock index: a re‐evaluation in acute circulatory failure.Resuscitation.1992;23(3):227–234.
- ,,,,, et al.Guidelines for intensive care unit admission, discharge, and triage. Task Force of the American College of Critical Care Medicine, Society of Critical Care Medicine.Crit Care Med.1999;27(3):633–638.
The decision to transfer a patient to the intensive care unit (ICU) from a general care setting is complex and based not only on clinical findings and patient wishes but also on the understanding that ICU resources are limited and costly.1 Adding to the decision‐making complexity is the knowledge that patients who transfer to an ICU from a general medical unit comprise the highest mortality group of ICU patients, with the mortality rate directly proportional to both the time spent on the general medical unit1, 2 and the number of physiologic abnormalities before ICU admission.3, 4
Prior studies have shown that cardiac arrest and unplanned (unexpected) transfers to the ICU are preceded by a period of physiologic instability reflected in the vital signs.510 However, vital signs alone may not accurately indicate clinical condition. For example, a person may be able to maintain normal blood pressure and heart rate despite severe illness or may have abnormal vital signs at baseline, which may be the case for an otherwise healthy young woman who has baseline low systolic blood pressure. Also, noncritical conditions commonly seen in hospitalized medical or surgical patients, such as anxiety or pain, may increase the respiratory rate or heart rate. Conversely, certain common medications, such as ‐blockers, may mask or blunt the normal physiologic response to illness. Overall, the prevalence of abnormal physiologic variables is high among hospitalized adult patients irrespective of the presence of serious adverse events.11 This prevalence may be a reason why 2 recent studies of inpatient medical emergency teams (METs) or rapid response teams (RRTs), which generally rely on vital signs for activation, failed to show a decrease in adult mortality rates.12, 13
Given the complexity of interpreting single vital sign readings, we evaluated a simple and clinically intuitive variable, the shock index (SI) (heart rate/systolic blood pressure, a noninvasive indication of left ventricular function),14 as a potential marker of the need for intensive care. Allgwer and Burri14 first developed the SI in studies of patients with acute blood loss, intraabdominal bleeding, fat emboli, and severe infections. They observed that a healthy adult had a mean SI of 0.54 (standard deviation [SD], 0.021), while an index of 1.0 indicated threatened shock and indices greater than 1.5 were seen in volume‐deficient shock.
We hypothesized that an elevated SI is a differentiating factor between a patient who had an unplanned ICU transfer and a general medical patient who did not require this higher level of care. To our knowledge, the SI has not been studied for this application previously.
Patients and Methods
Study Design
We conducted a retrospective case‐control study of 50 consecutive general medical patients who had unplanned transfers to the ICU and 50 matched control patients, with the approval of the Mayo Clinic Institutional Review Board. All patients were admitted to a general medical unit, and only patients who previously provided permission for their records to be used in research were included in the study.
Patients
This study enrolled patients who were at least 18 years old and who were admitted to a single general medical unit for 24 hours or longer. Patients were excluded if they required a surgical intervention, were transferred from another hospital, received care on a different general medical unit at any time during the hospitalization, or were pregnant. Our data collection began at the patients' (cases and controls) arrival on the general medical unit; we did not include data from any evaluation (outpatient or emergency department) before hospital admission.
Case Definition
An unplanned transfer was defined as an episode of unexpected clinical deterioration in a general medical patient that necessitated transfer to the ICU, as opposed to a preemptive or elective transfer following a procedure. Patients with unplanned transfers from December 9, 2003, to December 29, 2004, were eligible for the study. Only the first transfer to the ICU was considered for patients who had multiple ICU transfers during a single hospitalization. Because these data were collected before METs or RRTs were introduced at our institution, the recommendation for ICU transfer was a joint decision by the primary care team and the ICU team.
Control Definition
The matched controls were identified from among patients admitted to the general medical unit from January 16, 2002, to December 13, 2004. To reduce the effect of the heterogeneity inherent in general medical patients, we matched controls for age (within 5 years of age of the corresponding case), admission diagnosis code, and patient care unit of admission and required that they were admitted for at least 24 hours before dismissal. Patients who had an ICU stay during the same admission were excluded. The median difference in admission dates between the cases and the controls was 327 days, and 26 of the 50 matched pairs had admission dates within 1 year of each other. This lengthy interval between cases and controls was a consequence of the low incidence of patients who met the matching criteria.
Setting
This study involved the general medical units and ICUs of the 1157‐bed Saint Mary's Hospital, an academic tertiary care facility at Mayo Clinic in Rochester, Minnesota.
Vital Sign Determination
Vital signs abstracted for this study included blood pressure, heart rate, respiratory rate, oxygen saturation, and temperature. The SI was calculated for each set of abstracted vital signs. Staff nurses were responsible for the routine measurement and recording of vital signs at least once every 8 hours, although in several instances not all parameters were checked. In accordance with nursing policy, values outside the defined parameters were rechecked by the nursing supervisor of each care unit and, if found to be abnormal, were conveyed to the patient's physician. This system meant that abnormal results were checked by numerous observers, with differences in the frequency of recordings for individual patients.
Data Collection
Demographic data and information on the vital signs were abstracted through a comprehensive chart review. Demographic data included age, sex, ethnicity, comorbid conditions, hospital care unit, date and time of admission, admission diagnosis, date and time of transfer to the ICU, length of stay, dismissal date, and disposition at discharge. Comorbid conditions were scored using the Charlson Comorbidity Index.15
Statistical Analysis
A sample size of 50 matched pairs provided 81% power to detect an odds ratio of 3.0 or greater between cases and controls, with a 0.05, 2‐tailed level of significance with McNemar test. Patient demographic characteristics were summarized by the frequencies for categorical data and by mean and SD for continuous data. Consistent with the study design, the McNemar test and conditional logistic model analyses were used to determine the association between the SI and the risk of unplanned ICU transfer. Shock indices for the cases and controls were compared with use of t test. A P value <0.05 was considered statistically significant. For the SI, we calculated the odds ratio and its 95% confidence interval (CI) and P value using different cut points. We did not perform a receiver operating characteristics analysis because matching of cases and controls greatly complicates estimation of the sensitivity and specificity of the SI;16 a cohort study is suggested to investigate this analysis further. All statistical analyses were performed by SAS version 9.1.3 software (SAS Institute Inc, Cary, NC).
Results
A total of 50 pairs of matching cases and controls was included in this study. Table 1 lists the source of admission, demographic characteristics, and numbers of deaths for cases and controls. There were no statistically significant differences in admission source, age, sex, ethnicity, admission care unit, or Charlson Comorbidity Index. Mean length of stay was 14.8 days (SD, 9.7 days) for the cases and 5.7 days (SD, 6.3 days; P < 0.001) for the controls. Admission diagnoses were classified on the basis of the organ system of involvement (Table 2). In 30 of 50 cases, the admission diagnosis and the reason for ICU transfer were related.
| Value | Cases (n = 50) | Controls (n = 50) | P Value* |
|---|---|---|---|
| |||
| Emergency department admission, No. (%) | 33 (66) | 28 (56) | 0.41 |
| Direct admission, No. (%) | 14 (28) | 15 (30) | 1.00 |
| Other admission, No. (%) | 3 (6) | 7 (14) | 0.32 |
| Age, mean (SD), years | 69.8 (15.7) | 70.3 (15.8) | 0.38 |
| Male sex, No. (%) | 26 (52) | 18 (36) | 0.12 |
| Ethnicity, No. (%) | 1.00 | ||
| White | 46 (92) | 46 (92) | |
| Other | 4 (8) | 4 (8) | |
| Charlson Comorbidity index, mean (SD) | 3.06 (2.31) | 2.66 (2.02) | 0.22 |
| Hospital stay, mean (SD), day | 14.8 (9.7) | 5.7 (6.3) | 0.0007 |
| Hospital deaths, No. | 9 | 1 | 0.008 |
| Deaths within 30 days, No. | 5 | 2 | 0.24 |
| Deaths within 6 months, No. | 9 | 6 | 0.40 |
| System | Primary Admission Diagnosis | No. of Cases |
|---|---|---|
| Constitutional | Fever, malaise, general symptoms | 7 |
| Cardiovascular | Hypertension, congestive heart failure, chest pain, peripheral vascular disease, edema | 5 |
| Dermatologic | Cellulitis, foot ulcer, skin rash | 3 |
| Gastrointestinal | Pancreatitis, gastrointestinal hemorrhage, nausea and vomiting, diarrhea, abdominal pain | 6 |
| Hematologic | Thrombocytopenia, abnormal coagulation | 2 |
| Musculoskeletal | Lymphedema, shoulder pain, lumbago, back ache, closed dorsal vertebral fracture | 7 |
| Neurologic | Delirium tremens, psychosis, convulsions | 3 |
| Pulmonary | Pneumonia, food or vomit aspiration pneumonitis, shortness of breath, respiratory abnormality | 13 |
| Renal | Hyperkalemia, acute renal failure, renal artery atherosclerosis | 4 |
We reviewed the vital signs and shock indices for the 24 hours before ICU transfer for each case and over the entire hospitalization for each control, to determine the worst set (the lowest systolic blood pressure and the highest heart rate, respiratory rate, and SI). The cases had 1 to 22 complete sets of vitals for the 24 hours before ICU transfer; the median number of sets was 3 and the mean was 4. The controls had 1 to 12 complete sets for the 24 hours before the worst SI: the median was 3 sets and the mean was 3. In 26 of 50 controls, the worst SI occurred within the first 24 hours after admission. There was a significant difference between the median values of the worst shock indices of the cases and the controls (0.87 vs. 0.72; P < 0.005).
Table 3 shows the different values of the SI and the corresponding odds ratio of unplanned ICU transfer for cases compared with controls. The difference was significant at an SI of 0.85 and greater, indicating a strong association with unplanned ICU transfer.
| Shock Index | P Value | Odds Ratio | 95% CI |
|---|---|---|---|
| |||
| 0.8 | 0.05 | 2.43 | 1.015.86 |
| 0.85 | 0.02 | 3.00 | 1.917.56 |
| 0.9 | 0.007 | 7.50 | 1.7232.78 |
| 0.95 | <0.03 | 5.50 | 1.2224.81 |
We also found that the patients who transferred to the ICU had a greater number of inpatient deaths (9 cases vs. 1 control; P = 0.008), which would be expected, but there was no difference in 30‐day or 6‐month mortality rate (Table 1). One patient died after 30 days and while still hospitalized.
Comparison between the temporal trend of vital signs and the SI of the cases for the 24 hours before ICU transfer is shown in Figure 1. This graph shows the median of all the worst values (minimum systolic blood pressure and maximum SI, heart rate, and respiratory rate) over the four 6‐hour time periods (24 hours) preceding ICU transfer. Of note, the change in vital signs is subtle even while the SI increased to more than 0.8 as the patients clinically worsened before transfer.
Discussion
In our comparison of the SI of 50 patients who required unplanned (unexpected) transfer to the ICU with the SI of 50 matched controls who did not require this higher level of care, we found that a SI of 0.85 or greater was significantly associated with unplanned transfer to the ICU. The cases had a significantly higher worst SI than the controls, and they also had a significantly longer hospital stay and higher inpatient mortality rate, as would be expected for a sicker patient population. These findings are important given that the SI may be useful for assessing illness severity, for helping determine the need for transfer to the ICU, or for activating METs or RRTs.
A major problem with providing optimal care for hospitalized general medical patients is the inherent difficulty in determining illness severity and clinical decline, especially when the decline occurs gradually. Existing consensus recommendations for ICU admission include both specific diagnoses and arbitrary objective criteria based on abnormal vital signs and laboratory values.27 Also, individual institutions may have their own ICU admission requirements, which may differ from these or RRT criteria. Although vital signs are important as a snapshot of basic physiologic function, a number of noncritical conditions may lead to abnormal vital signs, and not all abnormal vital signs are associated with an adverse clinical event. By relying solely on vital signs, clinicians may not recognize critical illness and therefore not transfer a patient to the ICU or may inappropriately transfer a patient who does not need ICU‐level care.
Markers of illness severity other than vital signs, such as the Acute Physiology and Chronic Health Evaluation (APACHE) score, have been shown to predict the death of ICU patients17, 18 but have been rarely studied outside the ICU setting.19 Also, calculating the APACHE score is cumbersome, and there is no cutoff score that defines when a patient should be transferred to the ICU. Subbe et al.,20 in their study to identify critically ill patients, found that introduction of a physiological scoring system (including MET or RRT activation scores) would have identified only a small number of additional patients as critically ill. Another common marker of illness severity, the 4 criteria of the systemic inflammatory response syndrome (temperature <36C or >38C; heart rate >90 beats per minute; respiratory rate >20 breaths per minute or PCO2 <32 mm Hg; and white blood cell count >12,000/L or <4000/L or with more than 10% band cells)21 may be too sensitive to use as a decision aid, since even a healthy person running after a bus could have 2 of the 4 criteria.22 Likewise, surgical patients may have transient leukocytosis due to a stress response independent of an infection.23
The SI may be more accurate than vital signs alone to determine illness severity and who is at risk for an unplanned transfer to the ICU. Birkhahn et al.24 concluded that the SI may be more useful in early hemorrhage than either heart rate or systolic blood pressure alone. Rady et al.25 showed that the SI used in the emergency department can identify critical illness with apparently stable vital signs, where an elevation of the SI above 0.9 was associated with an illness that was treated immediately with admission to the hospital and intensive therapy on admission. However, it is unclear whether the SI can be used to monitor ongoing treatment, because a previous study showed that the SI may be of limited value in the assessment of systemic oxygen transport and response to therapy in clinical septic shock.26 Of note, the SI is mostly independent of the effects of pain or anxiety, which cause a concurrent rise in heart rate and systolic blood pressure. Because the heart's left ventricular work is unchanged or may increase from the underlying catecholamine surge, the SI will be unchanged or may actually decrease.
Our study adds to the medical literature the findings that: (1) the SI may be useful as an indicator of illness severity and a triage tool in patients with no trauma but with various medical conditions, and (2) the SI showed a strong association with unplanned ICU transfer.
The main strength of our study is its case‐control design with matched controls. Also, by comparing groups from the same patient care unit, we sought to minimize the selection bias that can be inherent in case‐control studies. Limitations include the retrospective, nonrandomized study design and the fact that there may have been variations in vital sign measurements by the multiple caregivers. However, the vital signs were taken according to standard hospital practice and reflect real‐world conditions. Although generalizability may be somewhat limited because of our homogeneous patient population, our patients had a wide range of various medical illnesses, so our study should be applicable to other hospital settings, both academic and community‐based.
One of the main weaknesses of our study is that the results were not adjusted for the burden of comorbid conditions, although there were no statistically significant differences in the number of comorbid conditions among the cases and the controls (P = 0.96). Also, we did not directly compare the SI with vital signs alone to determine superiority.
The SI may be an important objective measure to help clinicians decide when patients need treatment that is more aggressive, assistance from a MET or an RRT, or a preemptive, rather than unplanned, transfer to an ICU. Although it is unlikely that a single measure will allow accurate triage of all medical or surgical patients, the SI may be a useful adjunct to clinical judgment and other objective measures in determining illness severity and clinical decline. Further prospective studies are needed to compare the role of the SI specifically with MET or RRT activation criteria, to clarify the role of comorbid conditions in unplanned transfers to the ICU, to validate the cut point for the SI in various disease states, and to assess its utility in patients with septic shock. Depending on these results, it may be beneficial to incorporate the SI into the electronic medical record as an automatic alert to identify patients at risk for ICU transfer.
Conclusions
The SI is an easily calculated composite index of heart rate and systolic blood pressure. An elevated SI of 0.85 can identify patients who are at risk for unplanned transfer to the ICU from general patient care units. Future studies will determine whether the SI is more accurate than simple vital signs as an indicator of clinical decline. If so, it may be useful as a trigger to activate METs or RRTs for treatment.
- ,.Outcome of intensive care patients in a group of British intensive care units.Crit Care Med.1998;26(8):1337–1345.
- ,,,.The longer patients are in hospital before Intensive Care admission the higher their mortality.Intensive Care Med.2004;30(10):1908–1913.
- ,.Physiological abnormalities in early warning scores are related to mortality in adult inpatients.Br J Anaesth.2004;92(6):882–884.
- ,,,,.Association between clinically abnormal observations and subsequent in‐hospital mortality: a prospective study.Resuscitation.2004;62(2):137–141.
- ,,,,,.Recognising clinical instability in hospital patients before cardiac arrest or unplanned admission to intensive care: a pilot study in a tertiary‐care hospital.Med J Aust.1999;171(1):22–25.
- ,,.Physiological values and procedures in the 24 h before ICU admission from the ward.Anaesthesia.1999;54(6):529–534.
- ,,, et al.Antecedents to hospital deaths.Intern Med J.2001;31(6):343–348.
- ,,, et al.A comparison of antecedents to cardiac arrests, deaths and emergency intensive care admissions in Australia and New Zealand, and the United Kingdom: the ACADEMIA study.Resuscitation.2004;62(3):275–282.
- ,,,,.Anticipating events of in‐hospital cardiac arrest.Eur J Emerg Med.2004;11(1):24–28.
- ,,, et al.Duration of life‐threatening antecedents prior to intensive care admission.Intensive Care Med.2002;28(11):1629–1634.
- ,,,.The prevalence of recordings of the signs of critical conditions and emergency responses in hospital wards: the SOCCER study.Resuscitation.2005;65(2):149–157.
- ,,,,,.Hospital‐wide code rates and mortality before and after implementation of a rapid response team.JAMA.2008;300(21):2506–2513.
- ,,,,.Rapid response teams: a systematic review and meta‐analysis.Arch Intern Med.2010;170(1):18–26.
- ,. [Shock index.]Dtsch Med Wochenschr.1967;92(43):1947–50. [German]
- ,,,.A new method of classifying prognostic comorbidity in longitudinal studies: development and validation.J Chronic Dis.1987;40(5):373–83.
- ,.Matching in studies of classification accuracy: implications for analysis, efficiency, and assessment of incremental value.Biometrics.2008;64(1):1–9.
- ,,,.APACHE II: a severity of disease classification system.Crit Care Med.1985;13(10):818–829.
- ,.Outcome prediction in critical care: the Acute Physiology and Chronic Health Evaluation models.Curr Opin Crit Care.2008;14(5):491–497.
- ,,.APACHE II predicts long‐term survival in COPD patients admitted to a general medical ward.J Gen Intern Med.2003;18(10):824–830.
- ,,,.Validation of physiological scoring systems in the accident and emergency department.Emerg Med J.2006;23(11):841–845.
- ,,, et al;2001 SCCM/ESICM/ACCP/ATS/SIS International Sepsis Definitions Conference.Crit Care Med.2003;31(4):1250–1256.
- .Dear SIRS, I'm sorry to say that I don't like you...Crit Care Med.1997;25(2):372–374.
- ,.The inflammatory response to surgery and trauma.Curr Opin Crit Care.2006;12(4):325–332.
- ,,,,.Shock index in diagnosing early acute hypovolemia.Am J Emerg Med.2005;23(3):323–326.
- ,,,,.A comparison of the shock index and conventional vital signs to identify acute, critical illness in the emergency department.Ann Emerg Med.1994;24(4):685–690. Erratum in:Ann Emerg Med.year="1994"1994;24(6):1208.
- ,,,.Shock index: a re‐evaluation in acute circulatory failure.Resuscitation.1992;23(3):227–234.
- ,,,,, et al.Guidelines for intensive care unit admission, discharge, and triage. Task Force of the American College of Critical Care Medicine, Society of Critical Care Medicine.Crit Care Med.1999;27(3):633–638.
Copyright © 2010 Society of Hospital Medicine
