User login
Evaluating automated rules for rapid response system alarm triggers in medical and surgical patients
Patients typically show signs and symptoms of deterioration hours to days prior to cardiorespiratory arrest.1,2 The rate of inhospital cardiorespiratory arrest (CRA) requiring cardiopulmonary resuscitation is estimated to be 0.174 per bed per year in the United States.3 After CRA, survival to discharge is estimated to be as low as 18%.3,4 Efforts to predict and prevent arrest could prove beneficial.1,2
Rapid response systems (RRS) have been proposed as a means of identifying clinical deterioration and facilitating a timely response. These systems were designed to bring clinicians with critical care expertise to the bedside to prevent unnecessary deaths. They typically include an afferent limb (detects deteriorating patients), an efferent limb (responds to calls and acts to avoid further deterioration), and administrative and data analysis limbs.5,6 Automatic provision of recommendations and computer-based systems are desirable components of the afferent limb of the detection system.6 Both are independent predictors of improved clinical practices for clinical decision support systems.7 However, the existing early warning scores (EWS) may not be ready for automation due to low positive predictive values (PPV) and sensitivities.8
It is possible that the low discriminatory accuracy of the published EWS may be secondary to the use of aggregate patient populations for derivation of scores. We hypothesized that these EWS perform differently in medical and in surgical subpopulations. Also, the EWS need to be tested in a time-dependent manner to serve as a realistic clinical support tool for hospitalized patients.
STUDY AIM
The aim of this study was to evaluate the differential performance of widely used EWS in medical vs surgical patients.
METHODS
Site
The study was conducted in an academic center with 2 hospitals in Southeastern Minnesota totaling approximately 1500 general care nonintensive care unit (ICU) beds. The Mayo Clinic Institutional Review Board approved the research proposal.
Subjects
Our retrospective cohort was comprised of all adult inpatients discharged from 2 academic hospitals between January 1, 2011 and December 31, 2011 who spent any time in a general care (non-ICU) unit. We excluded patients younger than 18 years, psychiatric or rehabilitation inpatients, those without research authorization, and patients admitted for research purposes.
Study patients were divided into medical and surgical cohorts. Hospitalizations were considered surgical if patients had surgery at any time during their hospital stay according to billing data. A trigger was an instance in which a patient met the conditions of a specific rule (score/vital sign exceeded the published/defined threshold).
A resuscitation call was defined as a call for cardiopulmonary resuscitation when a patient has a CRA.
An event was an occurrence of 1 of the following in a general care setting: unplanned transfer to the ICU, resuscitation call, or RRS activation.
The RRS activation criteria consisted of an “acute and persistent change” in any 1 or more of the following: oxygen saturations less than 90%, heart rate less than 40 or greater than 130 beats/minute, systolic blood pressure less than 90 mm Hg, or respiratory rate less than 10 or greater than 28 breaths/minute. The RRS activation requires health provider action; they are not electronically generated. Nurses and physicians may also activate the RRS if they are concerned about a patient, even if calling criteria are not met. This is in contrast to the EWS analyzed, which are aggregate composites of multiple parameters. However, whether or not a derangement in vital signs is considered an “acute and persistent change” still involves clinical judgment. Any movement from a general care bed to an ICU bed, or from a general care bed to a procedure area, and from there to an ICU, was considered unplanned. Transfers to the ICU directly from the emergency department or operating room (OR) were not considered as an unplanned transfer and were not included in the analyses.
Coverage time was the period observed for events after a rule was triggered. In this analysis, a coverage time of 24 hours was considered, with a 1-hour look-back. A trigger was counted as a true positive if an event occurred during the following 24 hours. The 1-hour look-back was included to take into account the nursing clinical process of prioritizing a call to the RRS followed by documentation of the altered vital signs that prompted the call.
An episode was the continuous time on the general care floor within a hospitalization, excluding times when a patient was in the OR or ICU. For example, if a patient was admitted to a general bed on a surgery floor, subsequently went to the OR, and then returned to the surgery floor, the 2 episodes were considered separate: the time on the floor before surgery, and the time on the floor after surgery.
Assessment of implementation of RRS in our hospitals showed a significant drop in the failure-to-rescue rate (issues considered related to delay or failure to identify or intervene appropriately when a patient was deteriorating, as identified through mortality review) and a decrease in non-ICU mortality.9,10 This suggests that our current process captures many of the relevant episodes of acute deterioration when a rapid response team is needed and supports using RRS activation as outcomes.
Data Sources
We developed a time-stamped longitudinal database of patient data from the electronic health record, including vital signs, laboratory test results, demographics (age, sex), administrative data (including length of stay), comorbidities, resuscitation code status, location in hospital, and at the minute level throughout each patient’s hospital stay. Physiologically impossible values (eg, blood pressures of 1200 mm Hg) were considered entered in error and eliminated from the database. Time spent in the OR or ICU was excluded because RRS activation would not be applied in these already highly monitored areas. SAS Statistical software (SAS Institute Inc. Cary, North Carolina) was used for database creation.
We applied the current RRS calling criteria in our institution and calculated the Kirkland score,11 along with some of the most widely used early warning scores:12 Modified Early Warning System (MEWS),13 Standardized Early Warning Scoring System (SEWS),14 Global Modified Early Warning Score (GMEWS),15 Worthing physiologic scoring system,16 National Early Warning Score (NEWS),17 and VitaPAC Early Warning Score (ViEWS).18 Published thresholds for these scores were used to create rule triggers in the data. Once a trigger was created to calculate the number of false positives and true positives, all subsequent triggers were ignored until the end of the episode or until 24 hours elapsed. We calculated triggers in a rolling fashion throughout the episodes of care. The EWS score was updated every time a new parameter was entered into the analytical electronic health record, and the most recent value for each was used to calculate the score. SAS statistical software was used for calculation of scores and identification of outcomes.
For our analysis, events were treated as dependent variables, and triggers were independent variables. We calculated the score for each EWS to the minute level throughout our retrospective database. If the score for a specific EWS was higher than the published/recommended threshold for that EWS, an alert was considered to have been issued, and the patient was followed for 24 hours. If the patient had an event in the subsequent 24 hours, or 1 hour before (1-hour look-back), the alert was considered a true positive; if not, a false positive. Events that were not preceded by an alert were false negatives, and 24-hour intervals without either an alert or an event were considered true negatives. This simulation exercise was performed for each EWS in both subcohorts (medical and surgical). Clusters of RRS calls followed by transfers to the ICU within 3 hours were considered as a single adverse event (RRS calls, as it was the first event to occur) to avoid double counting. We have described how well this simulation methodology,8 correlates with results from prospective studies.19
Statistical Analysis
To calculate whether results were statistically significant for subgroups, a jackknife method of calculating variance20 was used. The jackknife method calculates variance by repeating the calculations of the statistic leaving out 1 sample at a time. In our case, we repeated the calculation of sensitivity and PPV leaving out 1 patient at a time. Once the simulation method had been run and the false/true positives/negatives had been assigned, calculation of each metric (PPV and sensitivity) was repeated for n subsamples, each leaving out 1 patient. The variance was calculated and 2 Student t tests were performed for each EWS: 1 for PPV and another for sensitivity. SAS statistical software v 9.3 was used for the simulation analysis; R statistical software v 3.0.2 (The R Foundation, Vienna, Austria) was used for the calculation of the statistical significance of results. A univariable analysis was also performed to assess the sensitivity and PPVs for the published thresholds of the most common variables in each EWS: respiratory rate, systolic blood pressure, heart rate, temperature, and mental status as measured by the modified Richmond Agitation Sedation Score.21
RESULTS
The initial cohort included 60,020 hospitalizations, of which the following were excluded: 2751 because of a lack of appropriate research authorization; 6433 because the patients were younger than 18 years; 2129 as psychiatric admissions; 284 as rehabilitation admissions; 872 as research purposes-only admissions; and 1185 because the patient was never in a general care bed (eg, they were either admitted directly to the ICU, or they were admitted for an outpatient surgical procedure and spent time in the postanesthesia care unit).
Table 1 summarizes patient and trigger characteristics, overall and by subgroup. The final cohort included 75,240 total episodes in 46,366 hospitalizations, from 34,898 unique patients, of which 48.7% were male. There were 23,831 medical and 22,535 surgical hospitalizations. Median length of episode was 2 days both for medical and surgical patients. Median length of stay was 3 days, both for medical and for surgical patients.

There were 3332 events in total, of which 1709 were RRS calls, 185 were resuscitation calls, and 1438 were unscheduled transfers to the ICU. The rate of events was 4.67 events per 100 episodes in the aggregate adult population. There were 3.93 events per 100 episodes for surgical hospitalizations, and 5.86 events per 100 episodes for medical hospitalizations (P < .001). The number of CRAs in our cohort was 0.27 per 100 episodes, 0.128 per hospital bed per year, or 4.37 per 1000 hospital admissions, similar to other reported numbers in the literature.3, 22,23
The total number of EWS triggers varied greatly between EWS rules, with the volume ranging during the study year from 1363 triggers with the GMEWS rule to 77,711 triggers with the ViEWS score.

All scores had PPVs less than 25%. As seen in Table 2 and shown graphically in the Figure, all scores performed better on medical patients (blue) than on surgical patients (yellow). The P value was < .0001 for both PPV and sensitivity. The Worthing score had the highest sensitivity (0.78 for medical and 0.68 for surgical) but a very low PPV (0.04 for medical and 0.03 for surgical), while GMEWS was the opposite: low sensitivity (0.10 and 0.07) but the highest PPV (0.22 and 0.18).

The results of the univariable analysis can be seen in Table 3. Most of the criteria performed better (higher sensitivity and PPV) as predictors in the medical hospitalizations than in the surgical hospitalizations.

DISCUSSION
We hypothesized that EWS may perform differently when applied to medical rather than surgical patients. Studies had not analyzed this in a time-dependent manner,24-26 which limited the applicability of the results.8
All analyzed scores performed better in medical patients than in surgical patients (Figure). This could reflect a behavioral difference by the teams on surgical and medical floors in the decision to activate the RRS, or a bias of the clinicians who designed the scores (mostly nonsurgeons). The difference could also mean that physiological deteriorations are intrinsically different in patients who have undergone anesthesia and surgery. For example, in surgical patients, a bleeding episode is more likely to be the cause of their physiological deterioration, or the lingering effects of anesthesia could mask underlying deterioration. Such patients would benefit from scores where variables such as heart rate, blood pressure, or hemoglobin had more influence.
When comparing the different scores, it was much easier for a patient to meet the alerting score with the Worthing score than with GMEWS. In the Worthing score, a respiratory rate greater than 22 breaths per minute, or a systolic blood pressure less than 100 mm Hg, already meet alerting criteria. Similar vital signs result in 0 and 1 points (respectively) in GMEWS, far from its alerting score of 5. This reflects the intrinsic tradeoff of EWS: as the threshold for considering a patient “at risk” drops, not only does the number of true positives (and the sensitivity) increase, but also the number of false positives, thus lowering the PPV.
However, none of the scores analyzed were considered to perform well based on their PPV and sensitivity, particularly in the surgical subpopulation. Focusing on another metric, the area under the receiver operator curve can give misleadingly optimistic results.24,27 However, the extremely low prevalence of acute physiological deterioration can produce low PPVs even when specificity seems acceptable, which is why it is important to evaluate PPV directly.28
To use EWS effectively to activate RRS, they need to be combined with clinical judgment to avoid high levels of false alerts, particularly in surgical patients. It has been reported that RRS is activated only 30% of the time a patient meets RRS calling criteria.29 While there may be cultural characteristics inhibiting the decision to call,30 our study hints at another explanation: if RRS was activated every time a patient met calling criteria based on the scores analyzed, the number of RRS calls would be very high and difficult to manage. So health providers may be doing the right thing when “filtering” RRS calls and not applying the criteria strictly, but in conjunction with clinical judgment.
A limitation of any study like this is how to define “acute physiological deterioration.” We defined an event as recognized episodes of acute physiological deterioration that are signaled by escalations of care (eg, RRS, resuscitation calls, or transfers to an ICU) or unexpected death. By definition, our calculated PPV is affected by clinicians’ recognition of clinical deteriorations. This definition, common in the literature, has the limitation of potentially underestimating EWS’ performance by missing some events that are resolved by the primary care team without an escalation of care. However, we believe our interpretation is not unreasonable since the purpose of EWS is to trigger escalations of care in a timely fashion. Prospective studies could define an event in a way that is less affected by the clinicians’ judgment.
Regarding patient demographics, age was similar between the 2 groups (average, 58.2 years for medical vs 58.9 years for surgical), and there was only a small difference in gender ratios (45.1% male in the medical vs 51.4% in the surgical group). These differences are unlikely to have affected the results significantly, but unknown differences in demographics or other patient characteristics between groups may account for differences in score performance between surgical and medical patients.
Several of the EWS analyzed had overlapping trigger criteria with our own RRS activation criteria (although as single-parameter triggers and not as aggregate). To test how these potential biases could affect our results, we performed a post hoc sensitivity analysis eliminating calls to the RRS as an outcome (so using the alternative outcome of unexpected transfers to the ICU and resuscitation calls). The results are similar to those of our main analysis, with all analyzed scores having lower sensitivity and PPV in surgical hospitalizations when compared to medical hospitalizations.
Our study suggests that, to optimize detection of physiological deterioration events, EWS should try to take into account different patient types, with the most basic distinction being surgical vs medical. This tailoring will make EWS more complex, and less suited for paper-based calculation, but new electronic health records are increasingly able to incorporate decision support, and some EWS have been developed for electronic calculation only. Of particular interest in this regard is the score developed by Escobar et al,31 which groups patients into categories according to the reason for admission, and calculates a different subscore based on that category. While the score by Escobar et al. does not split patients based on medical or surgical status, a more general interpretation of our results suggests that a score may be more accurate if it classifies patients into subgroups with different subscores. This seems to be confirmed by the fact that the score by Escobar et al performs better than MEWS.28 Unfortunately, the paper describing it does not provide enough detail to use it in our database.
A recent systematic review showed increasing evidence that RRS may be effective in reducing CRAs occurring in a non-ICU setting and, more important, overall inhospital mortality.32 While differing implementation strategies (eg, different length of the educational effort, changes in the frequency of vital signs monitoring) can impact the success of such an initiative, it has been speculated that the afferent limb (which often includes an EWS) might be the most critical part of the system.33 Our results show that the most widely used EWS perform significantly worse on surgical patients, and suggest that a way to improve the accuracy of EWS would be to tailor the risk calculation to different patient subgroups (eg, medical and surgical patients). Plausible next steps would be to demonstrate that tailoring risk calculation to medical and surgical patients separately can improve risk predictions and accuracy of EWS.
Disclosure
The authors report no financial conflicts of interest.
1. Buist MD, Jarmolowski E, Burton PR, Bernard SA, Waxman BP, Anderson J. Recognising clinical instability in hospital patients before cardiac arrest or unplanned admission to intensive care. A pilot study in a tertiary-care hospital. Med J Aust. 1999; 171(1):22-25. PubMed
2. Schein RM, Hazday N, Pena M, Ruben BH, Sprung CL. Clinical antecedents to in-hospital cardiopulmonary arrest. Chest. 1990;98(6):1388-1392. PubMed
3. Peberdy MA, Kaye W, Ornato JP, Larkin GL, Nadkarni V, Mancini ME, et al. Cardiopulmonary resuscitation of adults in the hospital: a report of 14720 cardiac arrests from the National Registry of Cardiopulmonary Resuscitation. Resuscitation. 2003; 58(3):297-308. PubMed
4. Nadkarni VM, Larkin GL, Peberdy MA, Carey SM, Kaye W, Mancini ME, et al. First documented rhythm and clinical outcome from in-hospital cardiac arrest among children and adults. JAMA. 2006;295(1):50-57. PubMed
5. Devita MA, Bellomo R, Hillman K, Kellum J, Rotondi A, Teres D, et al. Findings of the first consensus conference on medical emergency teams. Crit Care Med. 2006;34(9):2463-2478. PubMed
6. DeVita MA, Smith GB, Adam SK, Adams-Pizarro I, Buist M, Bellomo R, et al. “Identifying the hospitalised patient in crisis”--a consensus conference on the afferent limb of rapid response systems. Resuscitation. 2010;81(4):375-382. PubMed
7. Kawamoto K, Houlihan CA, Balas EA, Lobach DF. Improving clinical practice using clinical decision support systems: a systematic review of trials to identify features critical to success. BMJ. 2005;330(7494):765. PubMed
8. Romero-Brufau S, Huddleston JM, Naessens JM, Johnson MG, Hickman J, Morlan BW, et al. Widely used track and trigger scores: are they ready for automation in practice? Resuscitation. 2014;85(4):549-552. PubMed
9. Huddleston JM, Diedrich DA, Kinsey GC, Enzler MJ, Manning DM. Learning from every death. J Patient Saf. 2014;10(1):6-12. PubMed
10. Moriarty JP, Schiebel NE, Johnson MG, Jensen JB, Caples SM, Morlan BW, et al. Evaluating implementation of a rapid response team: considering alternative outcome measures. Int J Qual Health Care. 2014;26(1):49-57. PubMed
11. Kirkland LL, Malinchoc M, O’Byrne M, Benson JT, Kashiwagi DT, Burton MC, et al. A clinical deterioration prediction tool for internal medicine patients. Am J Med Qual. 2013;28(2):135-142. PubMed
12. Griffiths JR, Kidney EM. Current use of early warning scores in UK emergency departments. Emerg Med J. 2012;29(1):65-66. PubMed
13. Subbe CP, Kruger M, Rutherford P, Gemmel L. Validation of a modified Early Warning Score in medical admissions. QJM. 2001;94(10):521-526. PubMed
14. Paterson R, MacLeod DC, Thetford D, Beattie A, Graham C, Lam S, et al.. Prediction of in-hospital mortality and length of stay using an early warning scoring system: clinical audit. Clin Med (Lond). 2006;6(3):281-284. PubMed
15. Harrison GA, Jacques T, McLaws ML, Kilborn G. Combinations of early signs of critical illness predict in-hospital death–the SOCCER study (signs of critical conditions and emergency responses). Resuscitation. 2006;71(3):327-334. PubMed
16. Duckitt RW, Buxton-Thomas R, Walker J, Cheek E, Bewick V, Venn R, et al. Worthing physiological scoring system: derivation and validation of a physiological early-warning system for medical admissions. An observational, population-based single-centre study. Br J Anaesth. 2007; 98(6):769-774. PubMed
17. Smith GB, Prytherch DR, Meredith P, Schmidt PE, Featherstone PI. The ability of the National Early Warning Score (NEWS) to discriminate patients at risk of early cardiac arrest, unanticipated intensive care unit admission, and death. Resuscitation. 2013;84(4):465-470. PubMed
18. Prytherch DR, Smith GB, Schmidt PE, Featherstone PI. ViEWS--Towards a national early warning score for detecting adult inpatient deterioration. Resuscitation. 2010;81(8):932-937. PubMed
19. Romero-Brufau S, Huddleston JM. Reply to letter: widely used track and trigger scores: are they ready for automation in practice? Resuscitation. 2014;85(10):e159. PubMed
20. Efron B, Stein C. The jackknife estimate of variance. Annals of Statistics. 1981;586-596.
21. Sessler CN, Gosnell MS, Grap MJ, Brophy GM, O’Neal PV, Keane KA, et al. The Richmond Agitation-Sedation Scale: validity and reliability in adult intensive care unit patients. Am J Respir Crit Care Med. 2002;166(10):1338-1344. PubMed
22. DeVita MA, Braithwaite RS, Mahidhara R, Stuart S, Foraida M, Simmons RL. Medical Emergency Response Improvement Team (MERIT). Use of medical emergency team responses to reduce hospital cardiopulmonary arrests. Qual Saf Health Care. 2004;13(4):251-254. PubMed
23. Goncales PD, Polessi JA, Bass LM, Santos Gde P, Yokota PK, Laselva CR, et al. Reduced frequency of cardiopulmonary arrests by rapid response teams. Einstein (Sao Paulo). 2012;10(4):442-448. PubMed
24. Cuthbertson BH, Boroujerdi M, McKie L, Aucott L, Prescott G. Can physiological variables and early warning scoring systems allow early recognition of the deteriorating surgical patient? Crit Care Med. 2007;35(2):402-409. PubMed
25. Gardner-Thorpe J, Love N, Wrightson J, Walsh S, Keeling N. The value of Modified Early Warning Score (MEWS) in surgical in-patients: a prospective observational study. Ann R Coll Surg Engl. 2006;88(6):571-575. PubMed
26. Stenhouse C, Coates S, Tivey M, Allsop P, Parker T. Prospective evaluation of a modified Early Warning Score to aid earlier detection of patients developing critical illness on a general surgical ward. British Journal of Anaesthesia. 2000;84(5):663-663.
27. Smith GB, Prytherch DR, Schmidt PE, Featherstone PI. Review and performance evaluation of aggregate weighted ‘track and trigger’ systems. Resuscitation. 2008;77(2):170-179. PubMed
28. Romero-Brufau S, Huddleston JM, Escobar GJ, Liebow M. Why the C-statistic is not informative to evaluate early warning scores and what metrics to use. Crit Care. 2015; 19:285. PubMed
29. Hillman K, Chen J, Cretikos M, Bellomo R, Brown D, Doig G, et al. Introduction of the medical emergency team (MET) system: a cluster-randomised controlled trial. Lancet. 2005;365(9477):2091-2097. PubMed
30. Shearer B, Marshall S, Buist MD, Finnigan M, Kitto S, Hore T, et al. What stops hospital clinical staff from following protocols? An analysis of the incidence and factors behind the failure of bedside clinical staff to activate the rapid response system in a multi-campus Australian metropolitan healthcare service. BMJ Qual Saf. 2012;21(7):569-575. PubMed
31. Escobar GJ, LaGuardia JC, Turk BJ, Ragins A, Kipnis P, Draper D. Early detection of impending physiologic deterioration among patients who are not in intensive care: development of predictive models using data from an automated electronic medical record. J Hosp Med. 2012;7(5):388-395. PubMed
32. Winters BD, Weaver SJ, Pfoh ER, Yang T, Pham JC, Dy SM. Rapid-response systems as a patient safety strategy: a systematic review. Ann Intern Med. 2013;158(5 pt 2):417-425. PubMed
33. Jones DA, DeVita MA, Bellomo R. Rapid-response teams. N Engl J Med. 2011;365(2):139-146. PubMed
Patients typically show signs and symptoms of deterioration hours to days prior to cardiorespiratory arrest.1,2 The rate of inhospital cardiorespiratory arrest (CRA) requiring cardiopulmonary resuscitation is estimated to be 0.174 per bed per year in the United States.3 After CRA, survival to discharge is estimated to be as low as 18%.3,4 Efforts to predict and prevent arrest could prove beneficial.1,2
Rapid response systems (RRS) have been proposed as a means of identifying clinical deterioration and facilitating a timely response. These systems were designed to bring clinicians with critical care expertise to the bedside to prevent unnecessary deaths. They typically include an afferent limb (detects deteriorating patients), an efferent limb (responds to calls and acts to avoid further deterioration), and administrative and data analysis limbs.5,6 Automatic provision of recommendations and computer-based systems are desirable components of the afferent limb of the detection system.6 Both are independent predictors of improved clinical practices for clinical decision support systems.7 However, the existing early warning scores (EWS) may not be ready for automation due to low positive predictive values (PPV) and sensitivities.8
It is possible that the low discriminatory accuracy of the published EWS may be secondary to the use of aggregate patient populations for derivation of scores. We hypothesized that these EWS perform differently in medical and in surgical subpopulations. Also, the EWS need to be tested in a time-dependent manner to serve as a realistic clinical support tool for hospitalized patients.
STUDY AIM
The aim of this study was to evaluate the differential performance of widely used EWS in medical vs surgical patients.
METHODS
Site
The study was conducted in an academic center with 2 hospitals in Southeastern Minnesota totaling approximately 1500 general care nonintensive care unit (ICU) beds. The Mayo Clinic Institutional Review Board approved the research proposal.
Subjects
Our retrospective cohort was comprised of all adult inpatients discharged from 2 academic hospitals between January 1, 2011 and December 31, 2011 who spent any time in a general care (non-ICU) unit. We excluded patients younger than 18 years, psychiatric or rehabilitation inpatients, those without research authorization, and patients admitted for research purposes.
Study patients were divided into medical and surgical cohorts. Hospitalizations were considered surgical if patients had surgery at any time during their hospital stay according to billing data. A trigger was an instance in which a patient met the conditions of a specific rule (score/vital sign exceeded the published/defined threshold).
A resuscitation call was defined as a call for cardiopulmonary resuscitation when a patient has a CRA.
An event was an occurrence of 1 of the following in a general care setting: unplanned transfer to the ICU, resuscitation call, or RRS activation.
The RRS activation criteria consisted of an “acute and persistent change” in any 1 or more of the following: oxygen saturations less than 90%, heart rate less than 40 or greater than 130 beats/minute, systolic blood pressure less than 90 mm Hg, or respiratory rate less than 10 or greater than 28 breaths/minute. The RRS activation requires health provider action; they are not electronically generated. Nurses and physicians may also activate the RRS if they are concerned about a patient, even if calling criteria are not met. This is in contrast to the EWS analyzed, which are aggregate composites of multiple parameters. However, whether or not a derangement in vital signs is considered an “acute and persistent change” still involves clinical judgment. Any movement from a general care bed to an ICU bed, or from a general care bed to a procedure area, and from there to an ICU, was considered unplanned. Transfers to the ICU directly from the emergency department or operating room (OR) were not considered as an unplanned transfer and were not included in the analyses.
Coverage time was the period observed for events after a rule was triggered. In this analysis, a coverage time of 24 hours was considered, with a 1-hour look-back. A trigger was counted as a true positive if an event occurred during the following 24 hours. The 1-hour look-back was included to take into account the nursing clinical process of prioritizing a call to the RRS followed by documentation of the altered vital signs that prompted the call.
An episode was the continuous time on the general care floor within a hospitalization, excluding times when a patient was in the OR or ICU. For example, if a patient was admitted to a general bed on a surgery floor, subsequently went to the OR, and then returned to the surgery floor, the 2 episodes were considered separate: the time on the floor before surgery, and the time on the floor after surgery.
Assessment of implementation of RRS in our hospitals showed a significant drop in the failure-to-rescue rate (issues considered related to delay or failure to identify or intervene appropriately when a patient was deteriorating, as identified through mortality review) and a decrease in non-ICU mortality.9,10 This suggests that our current process captures many of the relevant episodes of acute deterioration when a rapid response team is needed and supports using RRS activation as outcomes.
Data Sources
We developed a time-stamped longitudinal database of patient data from the electronic health record, including vital signs, laboratory test results, demographics (age, sex), administrative data (including length of stay), comorbidities, resuscitation code status, location in hospital, and at the minute level throughout each patient’s hospital stay. Physiologically impossible values (eg, blood pressures of 1200 mm Hg) were considered entered in error and eliminated from the database. Time spent in the OR or ICU was excluded because RRS activation would not be applied in these already highly monitored areas. SAS Statistical software (SAS Institute Inc. Cary, North Carolina) was used for database creation.
We applied the current RRS calling criteria in our institution and calculated the Kirkland score,11 along with some of the most widely used early warning scores:12 Modified Early Warning System (MEWS),13 Standardized Early Warning Scoring System (SEWS),14 Global Modified Early Warning Score (GMEWS),15 Worthing physiologic scoring system,16 National Early Warning Score (NEWS),17 and VitaPAC Early Warning Score (ViEWS).18 Published thresholds for these scores were used to create rule triggers in the data. Once a trigger was created to calculate the number of false positives and true positives, all subsequent triggers were ignored until the end of the episode or until 24 hours elapsed. We calculated triggers in a rolling fashion throughout the episodes of care. The EWS score was updated every time a new parameter was entered into the analytical electronic health record, and the most recent value for each was used to calculate the score. SAS statistical software was used for calculation of scores and identification of outcomes.
For our analysis, events were treated as dependent variables, and triggers were independent variables. We calculated the score for each EWS to the minute level throughout our retrospective database. If the score for a specific EWS was higher than the published/recommended threshold for that EWS, an alert was considered to have been issued, and the patient was followed for 24 hours. If the patient had an event in the subsequent 24 hours, or 1 hour before (1-hour look-back), the alert was considered a true positive; if not, a false positive. Events that were not preceded by an alert were false negatives, and 24-hour intervals without either an alert or an event were considered true negatives. This simulation exercise was performed for each EWS in both subcohorts (medical and surgical). Clusters of RRS calls followed by transfers to the ICU within 3 hours were considered as a single adverse event (RRS calls, as it was the first event to occur) to avoid double counting. We have described how well this simulation methodology,8 correlates with results from prospective studies.19
Statistical Analysis
To calculate whether results were statistically significant for subgroups, a jackknife method of calculating variance20 was used. The jackknife method calculates variance by repeating the calculations of the statistic leaving out 1 sample at a time. In our case, we repeated the calculation of sensitivity and PPV leaving out 1 patient at a time. Once the simulation method had been run and the false/true positives/negatives had been assigned, calculation of each metric (PPV and sensitivity) was repeated for n subsamples, each leaving out 1 patient. The variance was calculated and 2 Student t tests were performed for each EWS: 1 for PPV and another for sensitivity. SAS statistical software v 9.3 was used for the simulation analysis; R statistical software v 3.0.2 (The R Foundation, Vienna, Austria) was used for the calculation of the statistical significance of results. A univariable analysis was also performed to assess the sensitivity and PPVs for the published thresholds of the most common variables in each EWS: respiratory rate, systolic blood pressure, heart rate, temperature, and mental status as measured by the modified Richmond Agitation Sedation Score.21
RESULTS
The initial cohort included 60,020 hospitalizations, of which the following were excluded: 2751 because of a lack of appropriate research authorization; 6433 because the patients were younger than 18 years; 2129 as psychiatric admissions; 284 as rehabilitation admissions; 872 as research purposes-only admissions; and 1185 because the patient was never in a general care bed (eg, they were either admitted directly to the ICU, or they were admitted for an outpatient surgical procedure and spent time in the postanesthesia care unit).
Table 1 summarizes patient and trigger characteristics, overall and by subgroup. The final cohort included 75,240 total episodes in 46,366 hospitalizations, from 34,898 unique patients, of which 48.7% were male. There were 23,831 medical and 22,535 surgical hospitalizations. Median length of episode was 2 days both for medical and surgical patients. Median length of stay was 3 days, both for medical and for surgical patients.
There were 3332 events in total, of which 1709 were RRS calls, 185 were resuscitation calls, and 1438 were unscheduled transfers to the ICU. The rate of events was 4.67 events per 100 episodes in the aggregate adult population. There were 3.93 events per 100 episodes for surgical hospitalizations, and 5.86 events per 100 episodes for medical hospitalizations (P < .001). The number of CRAs in our cohort was 0.27 per 100 episodes, 0.128 per hospital bed per year, or 4.37 per 1000 hospital admissions, similar to other reported numbers in the literature.3, 22,23
The total number of EWS triggers varied greatly between EWS rules, with the volume ranging during the study year from 1363 triggers with the GMEWS rule to 77,711 triggers with the ViEWS score.
All scores had PPVs less than 25%. As seen in Table 2 and shown graphically in the Figure, all scores performed better on medical patients (blue) than on surgical patients (yellow). The P value was < .0001 for both PPV and sensitivity. The Worthing score had the highest sensitivity (0.78 for medical and 0.68 for surgical) but a very low PPV (0.04 for medical and 0.03 for surgical), while GMEWS was the opposite: low sensitivity (0.10 and 0.07) but the highest PPV (0.22 and 0.18).
The results of the univariable analysis can be seen in Table 3. Most of the criteria performed better (higher sensitivity and PPV) as predictors in the medical hospitalizations than in the surgical hospitalizations.
DISCUSSION
We hypothesized that EWS may perform differently when applied to medical rather than surgical patients. Studies had not analyzed this in a time-dependent manner,24-26 which limited the applicability of the results.8
All analyzed scores performed better in medical patients than in surgical patients (Figure). This could reflect a behavioral difference by the teams on surgical and medical floors in the decision to activate the RRS, or a bias of the clinicians who designed the scores (mostly nonsurgeons). The difference could also mean that physiological deteriorations are intrinsically different in patients who have undergone anesthesia and surgery. For example, in surgical patients, a bleeding episode is more likely to be the cause of their physiological deterioration, or the lingering effects of anesthesia could mask underlying deterioration. Such patients would benefit from scores where variables such as heart rate, blood pressure, or hemoglobin had more influence.
When comparing the different scores, it was much easier for a patient to meet the alerting score with the Worthing score than with GMEWS. In the Worthing score, a respiratory rate greater than 22 breaths per minute, or a systolic blood pressure less than 100 mm Hg, already meet alerting criteria. Similar vital signs result in 0 and 1 points (respectively) in GMEWS, far from its alerting score of 5. This reflects the intrinsic tradeoff of EWS: as the threshold for considering a patient “at risk” drops, not only does the number of true positives (and the sensitivity) increase, but also the number of false positives, thus lowering the PPV.
However, none of the scores analyzed were considered to perform well based on their PPV and sensitivity, particularly in the surgical subpopulation. Focusing on another metric, the area under the receiver operator curve can give misleadingly optimistic results.24,27 However, the extremely low prevalence of acute physiological deterioration can produce low PPVs even when specificity seems acceptable, which is why it is important to evaluate PPV directly.28
To use EWS effectively to activate RRS, they need to be combined with clinical judgment to avoid high levels of false alerts, particularly in surgical patients. It has been reported that RRS is activated only 30% of the time a patient meets RRS calling criteria.29 While there may be cultural characteristics inhibiting the decision to call,30 our study hints at another explanation: if RRS was activated every time a patient met calling criteria based on the scores analyzed, the number of RRS calls would be very high and difficult to manage. So health providers may be doing the right thing when “filtering” RRS calls and not applying the criteria strictly, but in conjunction with clinical judgment.
A limitation of any study like this is how to define “acute physiological deterioration.” We defined an event as recognized episodes of acute physiological deterioration that are signaled by escalations of care (eg, RRS, resuscitation calls, or transfers to an ICU) or unexpected death. By definition, our calculated PPV is affected by clinicians’ recognition of clinical deteriorations. This definition, common in the literature, has the limitation of potentially underestimating EWS’ performance by missing some events that are resolved by the primary care team without an escalation of care. However, we believe our interpretation is not unreasonable since the purpose of EWS is to trigger escalations of care in a timely fashion. Prospective studies could define an event in a way that is less affected by the clinicians’ judgment.
Regarding patient demographics, age was similar between the 2 groups (average, 58.2 years for medical vs 58.9 years for surgical), and there was only a small difference in gender ratios (45.1% male in the medical vs 51.4% in the surgical group). These differences are unlikely to have affected the results significantly, but unknown differences in demographics or other patient characteristics between groups may account for differences in score performance between surgical and medical patients.
Several of the EWS analyzed had overlapping trigger criteria with our own RRS activation criteria (although as single-parameter triggers and not as aggregate). To test how these potential biases could affect our results, we performed a post hoc sensitivity analysis eliminating calls to the RRS as an outcome (so using the alternative outcome of unexpected transfers to the ICU and resuscitation calls). The results are similar to those of our main analysis, with all analyzed scores having lower sensitivity and PPV in surgical hospitalizations when compared to medical hospitalizations.
Our study suggests that, to optimize detection of physiological deterioration events, EWS should try to take into account different patient types, with the most basic distinction being surgical vs medical. This tailoring will make EWS more complex, and less suited for paper-based calculation, but new electronic health records are increasingly able to incorporate decision support, and some EWS have been developed for electronic calculation only. Of particular interest in this regard is the score developed by Escobar et al,31 which groups patients into categories according to the reason for admission, and calculates a different subscore based on that category. While the score by Escobar et al. does not split patients based on medical or surgical status, a more general interpretation of our results suggests that a score may be more accurate if it classifies patients into subgroups with different subscores. This seems to be confirmed by the fact that the score by Escobar et al performs better than MEWS.28 Unfortunately, the paper describing it does not provide enough detail to use it in our database.
A recent systematic review showed increasing evidence that RRS may be effective in reducing CRAs occurring in a non-ICU setting and, more important, overall inhospital mortality.32 While differing implementation strategies (eg, different length of the educational effort, changes in the frequency of vital signs monitoring) can impact the success of such an initiative, it has been speculated that the afferent limb (which often includes an EWS) might be the most critical part of the system.33 Our results show that the most widely used EWS perform significantly worse on surgical patients, and suggest that a way to improve the accuracy of EWS would be to tailor the risk calculation to different patient subgroups (eg, medical and surgical patients). Plausible next steps would be to demonstrate that tailoring risk calculation to medical and surgical patients separately can improve risk predictions and accuracy of EWS.
Disclosure
The authors report no financial conflicts of interest.
1. Buist MD, Jarmolowski E, Burton PR, Bernard SA, Waxman BP, Anderson J. Recognising clinical instability in hospital patients before cardiac arrest or unplanned admission to intensive care. A pilot study in a tertiary-care hospital. Med J Aust. 1999; 171(1):22-25. PubMed
2. Schein RM, Hazday N, Pena M, Ruben BH, Sprung CL. Clinical antecedents to in-hospital cardiopulmonary arrest. Chest. 1990;98(6):1388-1392. PubMed
3. Peberdy MA, Kaye W, Ornato JP, Larkin GL, Nadkarni V, Mancini ME, et al. Cardiopulmonary resuscitation of adults in the hospital: a report of 14720 cardiac arrests from the National Registry of Cardiopulmonary Resuscitation. Resuscitation. 2003; 58(3):297-308. PubMed
4. Nadkarni VM, Larkin GL, Peberdy MA, Carey SM, Kaye W, Mancini ME, et al. First documented rhythm and clinical outcome from in-hospital cardiac arrest among children and adults. JAMA. 2006;295(1):50-57. PubMed
5. Devita MA, Bellomo R, Hillman K, Kellum J, Rotondi A, Teres D, et al. Findings of the first consensus conference on medical emergency teams. Crit Care Med. 2006;34(9):2463-2478. PubMed
6. DeVita MA, Smith GB, Adam SK, Adams-Pizarro I, Buist M, Bellomo R, et al. “Identifying the hospitalised patient in crisis”--a consensus conference on the afferent limb of rapid response systems. Resuscitation. 2010;81(4):375-382. PubMed
7. Kawamoto K, Houlihan CA, Balas EA, Lobach DF. Improving clinical practice using clinical decision support systems: a systematic review of trials to identify features critical to success. BMJ. 2005;330(7494):765. PubMed
8. Romero-Brufau S, Huddleston JM, Naessens JM, Johnson MG, Hickman J, Morlan BW, et al. Widely used track and trigger scores: are they ready for automation in practice? Resuscitation. 2014;85(4):549-552. PubMed
9. Huddleston JM, Diedrich DA, Kinsey GC, Enzler MJ, Manning DM. Learning from every death. J Patient Saf. 2014;10(1):6-12. PubMed
10. Moriarty JP, Schiebel NE, Johnson MG, Jensen JB, Caples SM, Morlan BW, et al. Evaluating implementation of a rapid response team: considering alternative outcome measures. Int J Qual Health Care. 2014;26(1):49-57. PubMed
11. Kirkland LL, Malinchoc M, O’Byrne M, Benson JT, Kashiwagi DT, Burton MC, et al. A clinical deterioration prediction tool for internal medicine patients. Am J Med Qual. 2013;28(2):135-142. PubMed
12. Griffiths JR, Kidney EM. Current use of early warning scores in UK emergency departments. Emerg Med J. 2012;29(1):65-66. PubMed
13. Subbe CP, Kruger M, Rutherford P, Gemmel L. Validation of a modified Early Warning Score in medical admissions. QJM. 2001;94(10):521-526. PubMed
14. Paterson R, MacLeod DC, Thetford D, Beattie A, Graham C, Lam S, et al.. Prediction of in-hospital mortality and length of stay using an early warning scoring system: clinical audit. Clin Med (Lond). 2006;6(3):281-284. PubMed
15. Harrison GA, Jacques T, McLaws ML, Kilborn G. Combinations of early signs of critical illness predict in-hospital death–the SOCCER study (signs of critical conditions and emergency responses). Resuscitation. 2006;71(3):327-334. PubMed
16. Duckitt RW, Buxton-Thomas R, Walker J, Cheek E, Bewick V, Venn R, et al. Worthing physiological scoring system: derivation and validation of a physiological early-warning system for medical admissions. An observational, population-based single-centre study. Br J Anaesth. 2007; 98(6):769-774. PubMed
17. Smith GB, Prytherch DR, Meredith P, Schmidt PE, Featherstone PI. The ability of the National Early Warning Score (NEWS) to discriminate patients at risk of early cardiac arrest, unanticipated intensive care unit admission, and death. Resuscitation. 2013;84(4):465-470. PubMed
18. Prytherch DR, Smith GB, Schmidt PE, Featherstone PI. ViEWS--Towards a national early warning score for detecting adult inpatient deterioration. Resuscitation. 2010;81(8):932-937. PubMed
19. Romero-Brufau S, Huddleston JM. Reply to letter: widely used track and trigger scores: are they ready for automation in practice? Resuscitation. 2014;85(10):e159. PubMed
20. Efron B, Stein C. The jackknife estimate of variance. Annals of Statistics. 1981;586-596.
21. Sessler CN, Gosnell MS, Grap MJ, Brophy GM, O’Neal PV, Keane KA, et al. The Richmond Agitation-Sedation Scale: validity and reliability in adult intensive care unit patients. Am J Respir Crit Care Med. 2002;166(10):1338-1344. PubMed
22. DeVita MA, Braithwaite RS, Mahidhara R, Stuart S, Foraida M, Simmons RL. Medical Emergency Response Improvement Team (MERIT). Use of medical emergency team responses to reduce hospital cardiopulmonary arrests. Qual Saf Health Care. 2004;13(4):251-254. PubMed
23. Goncales PD, Polessi JA, Bass LM, Santos Gde P, Yokota PK, Laselva CR, et al. Reduced frequency of cardiopulmonary arrests by rapid response teams. Einstein (Sao Paulo). 2012;10(4):442-448. PubMed
24. Cuthbertson BH, Boroujerdi M, McKie L, Aucott L, Prescott G. Can physiological variables and early warning scoring systems allow early recognition of the deteriorating surgical patient? Crit Care Med. 2007;35(2):402-409. PubMed
25. Gardner-Thorpe J, Love N, Wrightson J, Walsh S, Keeling N. The value of Modified Early Warning Score (MEWS) in surgical in-patients: a prospective observational study. Ann R Coll Surg Engl. 2006;88(6):571-575. PubMed
26. Stenhouse C, Coates S, Tivey M, Allsop P, Parker T. Prospective evaluation of a modified Early Warning Score to aid earlier detection of patients developing critical illness on a general surgical ward. British Journal of Anaesthesia. 2000;84(5):663-663.
27. Smith GB, Prytherch DR, Schmidt PE, Featherstone PI. Review and performance evaluation of aggregate weighted ‘track and trigger’ systems. Resuscitation. 2008;77(2):170-179. PubMed
28. Romero-Brufau S, Huddleston JM, Escobar GJ, Liebow M. Why the C-statistic is not informative to evaluate early warning scores and what metrics to use. Crit Care. 2015; 19:285. PubMed
29. Hillman K, Chen J, Cretikos M, Bellomo R, Brown D, Doig G, et al. Introduction of the medical emergency team (MET) system: a cluster-randomised controlled trial. Lancet. 2005;365(9477):2091-2097. PubMed
30. Shearer B, Marshall S, Buist MD, Finnigan M, Kitto S, Hore T, et al. What stops hospital clinical staff from following protocols? An analysis of the incidence and factors behind the failure of bedside clinical staff to activate the rapid response system in a multi-campus Australian metropolitan healthcare service. BMJ Qual Saf. 2012;21(7):569-575. PubMed
31. Escobar GJ, LaGuardia JC, Turk BJ, Ragins A, Kipnis P, Draper D. Early detection of impending physiologic deterioration among patients who are not in intensive care: development of predictive models using data from an automated electronic medical record. J Hosp Med. 2012;7(5):388-395. PubMed
32. Winters BD, Weaver SJ, Pfoh ER, Yang T, Pham JC, Dy SM. Rapid-response systems as a patient safety strategy: a systematic review. Ann Intern Med. 2013;158(5 pt 2):417-425. PubMed
33. Jones DA, DeVita MA, Bellomo R. Rapid-response teams. N Engl J Med. 2011;365(2):139-146. PubMed
© 2017 Society of Hospital Medicine
PMI After Hip Fracture Surgery
Perioperative myocardial infarction (PMI) often remains unrecognized with higher mortality in the aged.13 Perioperative ischemic symptoms are often masked by analgesia, sedation, and transient and subtle electrocardiographic (ECG) changes. Postoperative troponin measurement is not routinely done for PMI diagnosis. Hip fracture surgery is the most common non‐cardiac surgical procedure in the elderly, with limited data on clinical presentation of PMI.46 Moreover, the elderly are significantly underrepresented in clinical studies.7 We therefore examined the clinical presentation of PMI and its outcomes among elderly patients admitted for hip fracture repair.
METHODS
Study Population
A population‐based, retrospective, case‐control study was conducted of all residents in Olmsted County, Minnesota undergoing surgery for hip fracture repair from January 1, 1988 through December 31, 2002. Primary indication for the surgery was proximal femur (femoral neck or subtrochanteric) fracture. Patients who were <65 years old, had a pathological hip fracture, multiple injuries or fractures, surgery >72 hours after injury (due to higher mortality with delayed surgery),8 nonsurgical management of hip fracture repair, or incomplete data were excluded. All patients provided prior authorization to use their medical records for research, per institutional protocols.9
Criteria for Perioperative Myocardial Infarction and Death
We utilized the universal definition of acute myocardial infarction10 to define PMI within the first 7 days following hip fracture surgery. We included creatine kinase‐MB fraction (CK‐MB) as the biomarker for 1988July 2000, and troponin as the biomarker for August 20002002. Mortality was defined as death from any cause within the first year following hip fracture repair. Deaths were identified through the National Death Index.
Statistical Analysis
For each case of PMI, we identified 2 control patients who were selected at random from the non‐PMI patient population. These controls were matched to cases based on age at the time of surgery (5 years) and gender in 1:2 ratios. Baseline characteristics across PMI and non‐PMI groups were compared using the Kruskal‐Wallis test (for continuous data) and the chi‐square or Fisher's exact tests (for categorical data). Mean values were utilized in place of the missing values for the following variables: preoperative troponin (missing values 88 [17.5%]), CK‐MB (8 [1.6%]), troponin (21 [5.4%]), and postoperative hemoglobin (17 [3.4%]). Univariate predictors of PMI with P 0.2 baseline characteristics were entered into a multivariate, conditional, logistic regression analysis. Rates of outcomes were calculated using the Kaplan‐Meier method, and by a landmark survival curve for those with and without PMI. Cox proportional hazards analysis was utilized for survival analysis at 30 days and 1 year. All statistical tests were 2‐sided, and P values <0.05 were considered significant. All analyses were performed using SAS for UNIX (version 9.1.3; SAS Institute, Inc, Cary, NC).
RESULTS
In the cohort of 1212 with hip fracture surgeries, 167 (13.8%) cases of PMI occurred in the first 7 days, of which 153 (92%) occurred within the first 48 hours. A total of 334 controls were matched with 167 cases of PMI. Table 1 summarizes the demographic characteristics of the study participants. Of the patients with PMI, 25.2% experienced symptoms of ischemia; 7% reported chest pain, and 12% reported dyspnea. Only 22.8% of patients with PMI had ECG changes consistent with ischemia. ST elevation MI was present in 7.2% patients. PMI patients had a lower mean hemoglobin compared to the patients without PMI (8.9 mg/dL vs 9.4 mg/dL, P < 0.001). Median length of stay (LOS) in the hospital was higher among patients who experienced PMI (11.6 vs 7.4 days, P < 0.001). Overall in‐hospital mortality was 5.6%. There were 24 deaths (14.4%) in the PMI group compared to 4 (1.2%) in‐hospital deaths in patients without PMI (P < 0.001). A total of 473 (94%) patients survived to discharge. At 30‐day follow‐up, there were 29 (17.4%) deaths in the PMI group and 14 (4.2%) deaths in non‐PMI group. During the follow‐up for 1 year, there were 143 (29%) deaths: PMI 66 (39.5%) and 77 (23%) non‐PMI group (P < 0.01).
| Characteristics, n (%) | Patients With PMI | Patients Without PMI | P Value* |
|---|---|---|---|
| (N = 167) | (N = 334) | ||
| |||
| Age mean SD | 85.3 7.4 | 85.2 7.1 | 0.5 |
| Weight (kg) mean SD | 59.98 16.7 | 59.80 13.9 | 0.5 |
| Women | 127 (76.4) | 254 (76) | 0.5 |
| Any symptom of ischemia, n (%) | |||
| Chest/arm pain | 11 (7) | 4 (1) | 0.002 |
| Dyspnea | 20 (12) | 14 (4) | 0.001 |
| Nausea/vomiting | 8 (5) | 6 (2) | 0.08 |
| Diaphoresis | 1 (1) | 1 (0.3) | 1.0 |
| PND | 3 (2) | 1 (0.3) | 0.3 |
| ECG changes, n (%) | |||
| ST‐segment elevation MI | 12 (7.2) | 0 | 0.01 |
| New ECG changes consistent with ischemia | 38 (22.8) | 1(0.3) | 0.01 |
| Biochemical evidence of ischemia, n (%) | |||
| CK‐MB | 147 (88) | 20 (6) | 0.01 |
| Troponin | 52 (33) | 9 (3) | 0.001 |
| Laboratory markers | |||
| Hemoglobin gm/dL mean (SD) | 8.9 1.0 | 9.4 1.2 | 0.001 |
| Postoperative anemia (<8.0 gm/dL), n (%) | 22 (13.2) | 37 (11.1) | 0.5 |
| Length of stay (days), mean SD | 11.6 7.7 | 7.4 6.4 | 0.001 |
| In‐hospital outcome | <0.001 | ||
| Dead | 24 (14.4) | 4 (1.2) | |
| Alive | 143 (85.6) | 330 (98.8) | |
| 30‐Day outcome | <0.001 | ||
| Dead | 29 (17.4) | 14 (4.2) | |
| Alive | 138 (82.6) | 320 (95.8) | |
| 1‐Year outcome | <0.001 | ||
| Dead | 66 (39.5) | 77 (23) | |
| Alive | 101 (60.4) | 257 (77) | |
Table 2 describes the risk factors associated with PMI in‐hospital, 30‐day, and 1‐year mortality. Risk factors for PMI were coronary artery disease (CAD) (odds ratio [OR], 3.5; confidence interval [CI], 2.25.6), and serum creatinine >2 mg/dL (OR, 2.4; CI, 1.34.4). Risk factors for in‐hospital mortality were age 8589 (OR, 5.3; CI, 1.617.7), age 90 (OR, 8.9; CI, 2.630.8), PMI (OR 15.1; CI, 4.648.8), male gender (OR 5.8; CI, 2.215.2), dyspnea (OR 5.4; CI, 1.816.9), and hemoglobin <8.0 gm/dL (OR, 3.5; CI, 1.29.9). PMI was a strong predictor for 30‐day mortality (hazard ratio [HR], 4.3; CI, 2.18.9). Risk factors for 1‐year mortality were: age 90 (HR, 2.0; CI, 1.43.1), male gender (HR, 2.1; CI, 1.53.0), and PMI (HR, 1.9; CI, 1.42.7). Figures 1 and 2 describe the Kaplan‐Meier survival curves for patients with and without PMI.
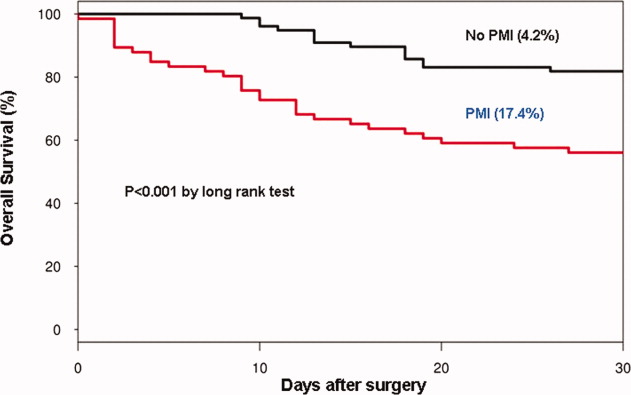
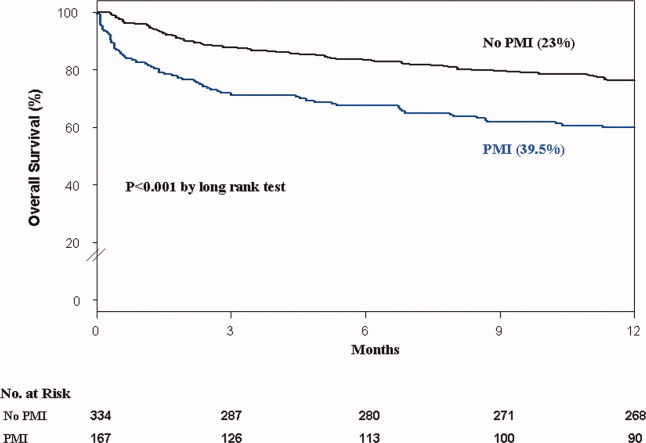
| Unadjusted OR (95% CI) | Adjusted OR (95% CI) | P Value | |
|---|---|---|---|
| |||
| Perioperative myocardial infarction | |||
| Coronary artery disease | 3.0 (2.14.5) | 3.5 (2.25.6) | <0.001 |
| Serum creatinine >2.0 mg/dL | 2.7 (1.64.8) | 2.4 (1.34.4) | 0.003 |
| In‐hospital mortality | |||
| Age 8589 | 1.7 (0.83.7) | 5.3 (1.617.7) | 0.01 |
| Age 90 | 2.2 (1.04.8) | 8.9 (2.630.8) | <0.001 |
| Male gender | 3.0 (1.46.4) | 5.8 (2.215.2) | <0.001 |
| Postoperative anemia (<8.0 gm/dL) | 4.2 (1.710.0) | 3.5 (1.29.9) | 0.02 |
| Perioperative myocardial infarction | 14.0 (5.248.0) | 15.1 (4.649.0) | <0.001 |
| 30‐Day mortality | |||
| Perioperative myocardial infarction | 4.1 (2.27.8) | 4.3 (2.18.9) | <0.001 |
| 1‐Year mortality | |||
| Age 8589 | 1.3 (0.81.9) | 1.6 (1.02.4) | <0.03 |
| Age 90 | 1.9 (1.32.9) | 2.0 (1.43.1) | 0.001 |
| Male gender | 1.9 (1.32.6) | 2.1 (1.53.0) | <0.001 |
| Dementia | 2.5 (1.83.6) | 2.7 (1.93.8) | <0.001 |
| Perioperative myocardial infarction | 2.0 (1.52.8) | 1.9 (1.42.7) | 0.001 |
DISCUSSION
We report the high incidence of PMI (13.8%) in the cohort of 1212 elderly patients (mean age 85 years) undergoing hip fracture surgery. Most PMI events (92%) occurred within the first 48 hours of surgery. Most of the events (75%) were asymptomatic. Elderly patients with PMI had an increased hospital LOS by 4.2 days, with high in‐hospital mortality (13.8%), 30‐day mortality (17.4%), and 1‐year mortality (39.5%).
Most of the PMI patients were identified with cardiac biomarkers on the basis of universal definition of MI within the first 48 hours. Although universal definition of MI does not define PMI as a separate type, PMI shares common pathophysiological pathways of Type 1 MI (primary coronary event) and Type 2 MI (myocardial oxygen supplydemand imbalance). Postoperative tachycardia, hemodynamic instability, anemia, and hypoxemia may initiate pathways causing more Type 2 MI. Our study highlights the continued need for active surveillance of clinical symptoms, postoperative ECG monitoring for STT changes, and utilizing cardiac troponin in older postoperative patients to improve diagnostic accuracy of PMI.
The current study has higher asymptomatic PMI events when compared to a study of Devereaux et al.11 The current study had an older population undergoing urgent hip fracture surgery, with a higher burden of CAD (60%) and renal failure (20%) with serum creatinine >2 gm/dL (see Supporting Information, Appendix 1, in the online version of this article). Older age and a higher burden of these risk factors may explain the higher incidence of PMI in the current study. Perioperative liberal use of analgesics in hip fracture surgery may explain more asymptomatic patients.
In light of the recently published FOCUS12 trial, an important finding from our study is that postoperative anemia among elderly (<8.0 gm/dL) is associated with a 3.5‐fold increased in‐hospital mortality. It is critical to maintain perioperative hemoglobin above 8.0 gm/dL in very elderly patients, due to asymptomatic presentation of PMI.
In the current study, PMI is associated with a 15‐fold increased risk of in‐hospital death and a 4.3‐fold increased risk of 30‐day mortality in the elderly. Advanced age (85 years) is a well known strong predictor of initial hospital admission and death in elderly patients after outpatient surgery.13 Furthermore, the odds for an in‐hospital death increase by 70% for each 10‐year increase in age.14 Therefore, early detection of silent PMI among at‐risk elderly patients by cardiac biomarkers may help in optimization of cardiac pharmacotherapy known to decrease short‐ and long‐term mortality.
There are limitations inherent to the retrospective design and methodology. Data collection was done through the year 2002. CK was used for the period that spans from 1988 to mid‐2000. Troponin was used from 2000 to 2002. Statin use was not analyzed for lack of significant data. Limited use of beta‐blockers (15%) and angiotensin‐converting‐enzyme (ACE) inhibitors (25%) may also contribute to higher events (see Supporting Information, Appendix 1, in the online version of this article).
CONCLUSIONS
Elderly patients have a higher incidence of PMI and mortality after hip fracture surgery than what guidelines indicate. The majority of the elderly patients with PMI did not experience ischemic symptoms and required cardiac biomarkers for diagnosis. The results of our study support the measurement of troponin in postoperative elderly patients for the diagnosis of PMI to implement in‐hospital preventive strategies to reduce PMI‐associated mortality.
Acknowledgements
The authors gratefully acknowledge the assistance of Ms Dawn Bergen in drafting and editing the manuscript.
Disclosures: This research was supported by funding from AHA grant 03‐30103N‐04, Rochester Epidemiology Project (grant RO1‐AR30582 from the National Institute of Arthritis and Musculoskeletal and Skin Diseases). The project was also supported by the National Center for Research Resources and the National Center for Advancing Translational Sciences, National Institutes of Health, through grant UL1 RR024150. The content is solely the responsibility of the authors and does not necessarily represent the official views of the NIH.
- , , , et al. Impact of age on perioperative complications and length of stay in patients undergoing noncardiac surgery. Ann Intern Med. 2001;134(8):637–643.
- , , , et al. Meta‐analysis: excess mortality after hip fracture among older women and men. Ann Intern Med. 2010;152(6):380–390.
- , , , et al. Body mass index (BMI) and risk of noncardiac postoperative medical complications in elderly hip fracture patients: a population‐based study. J Hosp Med. 2009;4(8):E1–E9.
- . History of the Rochester Epidemiology Project. Mayo Clin Proc. 1996;71(3):266–274.
- , , , . Incidence and mortality of hip fractures in the United States. JAMA. 2009;302(14):1573–1579.
- , , , et al. Body mass index and risk of adverse cardiac events in elderly patients with hip fracture: a population‐based study. J Am Geriatr Soc. 2009;57(3):419–426.
- , , , et al. Acute coronary care in the elderly, part I. Non‐ST‐segment‐elevation acute coronary syndromes: a scientific statement for healthcare professionals from the American Heart Association Council on Clinical Cardiology: in collaboration with the Society of Geriatric Cardiology. Circulation. 2007;115(19):2549–2569.
- , . Hip fracture mortality. A prospective, multifactorial study to predict and minimize death risk. Clin Orthop Relat Res. 1992;280:214–222.
- , , , et al. ACC/AHA/ACP‐ASIM guidelines for the management of patients with chronic stable angina. J Am Coll Cardiol. 1999;33(7):2092–2190.
- , , ; for the Joint ESC/ACCF/AHA/WHF Task Force for the Redefinition of Myocardial Infarction. Universal definition of myocardial infarction. J Am Coll Cardiol. 2007;50(22):2173–2195.
- , , , et al. Characteristics and short‐term prognosis of perioperative myocardial infarction in patients undergoing noncardiac surgery. Ann Intern Med. 2011;154(8):523–528.
- , , , et al. Liberal or restrictive transfusion in high‐risk patients after hip surgery. N Engl J Med. 2011;365(26):2453–2462.
- , , , . Inpatient hospital admission and death after outpatient surgery in elderly patients: importance of patient and system characteristics and location of care. Arch Surg. 2004;139(1):67–72.
- , , , et al. Predictors of hospital mortality in the global registry of acute coronary events. Arch Intern Med. 2003;163(19):2345–2353.
Perioperative myocardial infarction (PMI) often remains unrecognized with higher mortality in the aged.13 Perioperative ischemic symptoms are often masked by analgesia, sedation, and transient and subtle electrocardiographic (ECG) changes. Postoperative troponin measurement is not routinely done for PMI diagnosis. Hip fracture surgery is the most common non‐cardiac surgical procedure in the elderly, with limited data on clinical presentation of PMI.46 Moreover, the elderly are significantly underrepresented in clinical studies.7 We therefore examined the clinical presentation of PMI and its outcomes among elderly patients admitted for hip fracture repair.
METHODS
Study Population
A population‐based, retrospective, case‐control study was conducted of all residents in Olmsted County, Minnesota undergoing surgery for hip fracture repair from January 1, 1988 through December 31, 2002. Primary indication for the surgery was proximal femur (femoral neck or subtrochanteric) fracture. Patients who were <65 years old, had a pathological hip fracture, multiple injuries or fractures, surgery >72 hours after injury (due to higher mortality with delayed surgery),8 nonsurgical management of hip fracture repair, or incomplete data were excluded. All patients provided prior authorization to use their medical records for research, per institutional protocols.9
Criteria for Perioperative Myocardial Infarction and Death
We utilized the universal definition of acute myocardial infarction10 to define PMI within the first 7 days following hip fracture surgery. We included creatine kinase‐MB fraction (CK‐MB) as the biomarker for 1988July 2000, and troponin as the biomarker for August 20002002. Mortality was defined as death from any cause within the first year following hip fracture repair. Deaths were identified through the National Death Index.
Statistical Analysis
For each case of PMI, we identified 2 control patients who were selected at random from the non‐PMI patient population. These controls were matched to cases based on age at the time of surgery (5 years) and gender in 1:2 ratios. Baseline characteristics across PMI and non‐PMI groups were compared using the Kruskal‐Wallis test (for continuous data) and the chi‐square or Fisher's exact tests (for categorical data). Mean values were utilized in place of the missing values for the following variables: preoperative troponin (missing values 88 [17.5%]), CK‐MB (8 [1.6%]), troponin (21 [5.4%]), and postoperative hemoglobin (17 [3.4%]). Univariate predictors of PMI with P 0.2 baseline characteristics were entered into a multivariate, conditional, logistic regression analysis. Rates of outcomes were calculated using the Kaplan‐Meier method, and by a landmark survival curve for those with and without PMI. Cox proportional hazards analysis was utilized for survival analysis at 30 days and 1 year. All statistical tests were 2‐sided, and P values <0.05 were considered significant. All analyses were performed using SAS for UNIX (version 9.1.3; SAS Institute, Inc, Cary, NC).
RESULTS
In the cohort of 1212 with hip fracture surgeries, 167 (13.8%) cases of PMI occurred in the first 7 days, of which 153 (92%) occurred within the first 48 hours. A total of 334 controls were matched with 167 cases of PMI. Table 1 summarizes the demographic characteristics of the study participants. Of the patients with PMI, 25.2% experienced symptoms of ischemia; 7% reported chest pain, and 12% reported dyspnea. Only 22.8% of patients with PMI had ECG changes consistent with ischemia. ST elevation MI was present in 7.2% patients. PMI patients had a lower mean hemoglobin compared to the patients without PMI (8.9 mg/dL vs 9.4 mg/dL, P < 0.001). Median length of stay (LOS) in the hospital was higher among patients who experienced PMI (11.6 vs 7.4 days, P < 0.001). Overall in‐hospital mortality was 5.6%. There were 24 deaths (14.4%) in the PMI group compared to 4 (1.2%) in‐hospital deaths in patients without PMI (P < 0.001). A total of 473 (94%) patients survived to discharge. At 30‐day follow‐up, there were 29 (17.4%) deaths in the PMI group and 14 (4.2%) deaths in non‐PMI group. During the follow‐up for 1 year, there were 143 (29%) deaths: PMI 66 (39.5%) and 77 (23%) non‐PMI group (P < 0.01).
| Characteristics, n (%) | Patients With PMI | Patients Without PMI | P Value* |
|---|---|---|---|
| (N = 167) | (N = 334) | ||
| |||
| Age mean SD | 85.3 7.4 | 85.2 7.1 | 0.5 |
| Weight (kg) mean SD | 59.98 16.7 | 59.80 13.9 | 0.5 |
| Women | 127 (76.4) | 254 (76) | 0.5 |
| Any symptom of ischemia, n (%) | |||
| Chest/arm pain | 11 (7) | 4 (1) | 0.002 |
| Dyspnea | 20 (12) | 14 (4) | 0.001 |
| Nausea/vomiting | 8 (5) | 6 (2) | 0.08 |
| Diaphoresis | 1 (1) | 1 (0.3) | 1.0 |
| PND | 3 (2) | 1 (0.3) | 0.3 |
| ECG changes, n (%) | |||
| ST‐segment elevation MI | 12 (7.2) | 0 | 0.01 |
| New ECG changes consistent with ischemia | 38 (22.8) | 1(0.3) | 0.01 |
| Biochemical evidence of ischemia, n (%) | |||
| CK‐MB | 147 (88) | 20 (6) | 0.01 |
| Troponin | 52 (33) | 9 (3) | 0.001 |
| Laboratory markers | |||
| Hemoglobin gm/dL mean (SD) | 8.9 1.0 | 9.4 1.2 | 0.001 |
| Postoperative anemia (<8.0 gm/dL), n (%) | 22 (13.2) | 37 (11.1) | 0.5 |
| Length of stay (days), mean SD | 11.6 7.7 | 7.4 6.4 | 0.001 |
| In‐hospital outcome | <0.001 | ||
| Dead | 24 (14.4) | 4 (1.2) | |
| Alive | 143 (85.6) | 330 (98.8) | |
| 30‐Day outcome | <0.001 | ||
| Dead | 29 (17.4) | 14 (4.2) | |
| Alive | 138 (82.6) | 320 (95.8) | |
| 1‐Year outcome | <0.001 | ||
| Dead | 66 (39.5) | 77 (23) | |
| Alive | 101 (60.4) | 257 (77) | |
Table 2 describes the risk factors associated with PMI in‐hospital, 30‐day, and 1‐year mortality. Risk factors for PMI were coronary artery disease (CAD) (odds ratio [OR], 3.5; confidence interval [CI], 2.25.6), and serum creatinine >2 mg/dL (OR, 2.4; CI, 1.34.4). Risk factors for in‐hospital mortality were age 8589 (OR, 5.3; CI, 1.617.7), age 90 (OR, 8.9; CI, 2.630.8), PMI (OR 15.1; CI, 4.648.8), male gender (OR 5.8; CI, 2.215.2), dyspnea (OR 5.4; CI, 1.816.9), and hemoglobin <8.0 gm/dL (OR, 3.5; CI, 1.29.9). PMI was a strong predictor for 30‐day mortality (hazard ratio [HR], 4.3; CI, 2.18.9). Risk factors for 1‐year mortality were: age 90 (HR, 2.0; CI, 1.43.1), male gender (HR, 2.1; CI, 1.53.0), and PMI (HR, 1.9; CI, 1.42.7). Figures 1 and 2 describe the Kaplan‐Meier survival curves for patients with and without PMI.
| Unadjusted OR (95% CI) | Adjusted OR (95% CI) | P Value | |
|---|---|---|---|
| |||
| Perioperative myocardial infarction | |||
| Coronary artery disease | 3.0 (2.14.5) | 3.5 (2.25.6) | <0.001 |
| Serum creatinine >2.0 mg/dL | 2.7 (1.64.8) | 2.4 (1.34.4) | 0.003 |
| In‐hospital mortality | |||
| Age 8589 | 1.7 (0.83.7) | 5.3 (1.617.7) | 0.01 |
| Age 90 | 2.2 (1.04.8) | 8.9 (2.630.8) | <0.001 |
| Male gender | 3.0 (1.46.4) | 5.8 (2.215.2) | <0.001 |
| Postoperative anemia (<8.0 gm/dL) | 4.2 (1.710.0) | 3.5 (1.29.9) | 0.02 |
| Perioperative myocardial infarction | 14.0 (5.248.0) | 15.1 (4.649.0) | <0.001 |
| 30‐Day mortality | |||
| Perioperative myocardial infarction | 4.1 (2.27.8) | 4.3 (2.18.9) | <0.001 |
| 1‐Year mortality | |||
| Age 8589 | 1.3 (0.81.9) | 1.6 (1.02.4) | <0.03 |
| Age 90 | 1.9 (1.32.9) | 2.0 (1.43.1) | 0.001 |
| Male gender | 1.9 (1.32.6) | 2.1 (1.53.0) | <0.001 |
| Dementia | 2.5 (1.83.6) | 2.7 (1.93.8) | <0.001 |
| Perioperative myocardial infarction | 2.0 (1.52.8) | 1.9 (1.42.7) | 0.001 |
DISCUSSION
We report the high incidence of PMI (13.8%) in the cohort of 1212 elderly patients (mean age 85 years) undergoing hip fracture surgery. Most PMI events (92%) occurred within the first 48 hours of surgery. Most of the events (75%) were asymptomatic. Elderly patients with PMI had an increased hospital LOS by 4.2 days, with high in‐hospital mortality (13.8%), 30‐day mortality (17.4%), and 1‐year mortality (39.5%).
Most of the PMI patients were identified with cardiac biomarkers on the basis of universal definition of MI within the first 48 hours. Although universal definition of MI does not define PMI as a separate type, PMI shares common pathophysiological pathways of Type 1 MI (primary coronary event) and Type 2 MI (myocardial oxygen supplydemand imbalance). Postoperative tachycardia, hemodynamic instability, anemia, and hypoxemia may initiate pathways causing more Type 2 MI. Our study highlights the continued need for active surveillance of clinical symptoms, postoperative ECG monitoring for STT changes, and utilizing cardiac troponin in older postoperative patients to improve diagnostic accuracy of PMI.
The current study has higher asymptomatic PMI events when compared to a study of Devereaux et al.11 The current study had an older population undergoing urgent hip fracture surgery, with a higher burden of CAD (60%) and renal failure (20%) with serum creatinine >2 gm/dL (see Supporting Information, Appendix 1, in the online version of this article). Older age and a higher burden of these risk factors may explain the higher incidence of PMI in the current study. Perioperative liberal use of analgesics in hip fracture surgery may explain more asymptomatic patients.
In light of the recently published FOCUS12 trial, an important finding from our study is that postoperative anemia among elderly (<8.0 gm/dL) is associated with a 3.5‐fold increased in‐hospital mortality. It is critical to maintain perioperative hemoglobin above 8.0 gm/dL in very elderly patients, due to asymptomatic presentation of PMI.
In the current study, PMI is associated with a 15‐fold increased risk of in‐hospital death and a 4.3‐fold increased risk of 30‐day mortality in the elderly. Advanced age (85 years) is a well known strong predictor of initial hospital admission and death in elderly patients after outpatient surgery.13 Furthermore, the odds for an in‐hospital death increase by 70% for each 10‐year increase in age.14 Therefore, early detection of silent PMI among at‐risk elderly patients by cardiac biomarkers may help in optimization of cardiac pharmacotherapy known to decrease short‐ and long‐term mortality.
There are limitations inherent to the retrospective design and methodology. Data collection was done through the year 2002. CK was used for the period that spans from 1988 to mid‐2000. Troponin was used from 2000 to 2002. Statin use was not analyzed for lack of significant data. Limited use of beta‐blockers (15%) and angiotensin‐converting‐enzyme (ACE) inhibitors (25%) may also contribute to higher events (see Supporting Information, Appendix 1, in the online version of this article).
CONCLUSIONS
Elderly patients have a higher incidence of PMI and mortality after hip fracture surgery than what guidelines indicate. The majority of the elderly patients with PMI did not experience ischemic symptoms and required cardiac biomarkers for diagnosis. The results of our study support the measurement of troponin in postoperative elderly patients for the diagnosis of PMI to implement in‐hospital preventive strategies to reduce PMI‐associated mortality.
Acknowledgements
The authors gratefully acknowledge the assistance of Ms Dawn Bergen in drafting and editing the manuscript.
Disclosures: This research was supported by funding from AHA grant 03‐30103N‐04, Rochester Epidemiology Project (grant RO1‐AR30582 from the National Institute of Arthritis and Musculoskeletal and Skin Diseases). The project was also supported by the National Center for Research Resources and the National Center for Advancing Translational Sciences, National Institutes of Health, through grant UL1 RR024150. The content is solely the responsibility of the authors and does not necessarily represent the official views of the NIH.
- , , , et al. Impact of age on perioperative complications and length of stay in patients undergoing noncardiac surgery. Ann Intern Med. 2001;134(8):637–643.
- , , , et al. Meta‐analysis: excess mortality after hip fracture among older women and men. Ann Intern Med. 2010;152(6):380–390.
- , , , et al. Body mass index (BMI) and risk of noncardiac postoperative medical complications in elderly hip fracture patients: a population‐based study. J Hosp Med. 2009;4(8):E1–E9.
- . History of the Rochester Epidemiology Project. Mayo Clin Proc. 1996;71(3):266–274.
- , , , . Incidence and mortality of hip fractures in the United States. JAMA. 2009;302(14):1573–1579.
- , , , et al. Body mass index and risk of adverse cardiac events in elderly patients with hip fracture: a population‐based study. J Am Geriatr Soc. 2009;57(3):419–426.
- , , , et al. Acute coronary care in the elderly, part I. Non‐ST‐segment‐elevation acute coronary syndromes: a scientific statement for healthcare professionals from the American Heart Association Council on Clinical Cardiology: in collaboration with the Society of Geriatric Cardiology. Circulation. 2007;115(19):2549–2569.
- , . Hip fracture mortality. A prospective, multifactorial study to predict and minimize death risk. Clin Orthop Relat Res. 1992;280:214–222.
- , , , et al. ACC/AHA/ACP‐ASIM guidelines for the management of patients with chronic stable angina. J Am Coll Cardiol. 1999;33(7):2092–2190.
- , , ; for the Joint ESC/ACCF/AHA/WHF Task Force for the Redefinition of Myocardial Infarction. Universal definition of myocardial infarction. J Am Coll Cardiol. 2007;50(22):2173–2195.
- , , , et al. Characteristics and short‐term prognosis of perioperative myocardial infarction in patients undergoing noncardiac surgery. Ann Intern Med. 2011;154(8):523–528.
- , , , et al. Liberal or restrictive transfusion in high‐risk patients after hip surgery. N Engl J Med. 2011;365(26):2453–2462.
- , , , . Inpatient hospital admission and death after outpatient surgery in elderly patients: importance of patient and system characteristics and location of care. Arch Surg. 2004;139(1):67–72.
- , , , et al. Predictors of hospital mortality in the global registry of acute coronary events. Arch Intern Med. 2003;163(19):2345–2353.

Role of Shock Index in ICU Transfers
The decision to transfer a patient to the intensive care unit (ICU) from a general care setting is complex and based not only on clinical findings and patient wishes but also on the understanding that ICU resources are limited and costly.1 Adding to the decision‐making complexity is the knowledge that patients who transfer to an ICU from a general medical unit comprise the highest mortality group of ICU patients, with the mortality rate directly proportional to both the time spent on the general medical unit1, 2 and the number of physiologic abnormalities before ICU admission.3, 4
Prior studies have shown that cardiac arrest and unplanned (unexpected) transfers to the ICU are preceded by a period of physiologic instability reflected in the vital signs.510 However, vital signs alone may not accurately indicate clinical condition. For example, a person may be able to maintain normal blood pressure and heart rate despite severe illness or may have abnormal vital signs at baseline, which may be the case for an otherwise healthy young woman who has baseline low systolic blood pressure. Also, noncritical conditions commonly seen in hospitalized medical or surgical patients, such as anxiety or pain, may increase the respiratory rate or heart rate. Conversely, certain common medications, such as ‐blockers, may mask or blunt the normal physiologic response to illness. Overall, the prevalence of abnormal physiologic variables is high among hospitalized adult patients irrespective of the presence of serious adverse events.11 This prevalence may be a reason why 2 recent studies of inpatient medical emergency teams (METs) or rapid response teams (RRTs), which generally rely on vital signs for activation, failed to show a decrease in adult mortality rates.12, 13
Given the complexity of interpreting single vital sign readings, we evaluated a simple and clinically intuitive variable, the shock index (SI) (heart rate/systolic blood pressure, a noninvasive indication of left ventricular function),14 as a potential marker of the need for intensive care. Allgwer and Burri14 first developed the SI in studies of patients with acute blood loss, intraabdominal bleeding, fat emboli, and severe infections. They observed that a healthy adult had a mean SI of 0.54 (standard deviation [SD], 0.021), while an index of 1.0 indicated threatened shock and indices greater than 1.5 were seen in volume‐deficient shock.
We hypothesized that an elevated SI is a differentiating factor between a patient who had an unplanned ICU transfer and a general medical patient who did not require this higher level of care. To our knowledge, the SI has not been studied for this application previously.
Patients and Methods
Study Design
We conducted a retrospective case‐control study of 50 consecutive general medical patients who had unplanned transfers to the ICU and 50 matched control patients, with the approval of the Mayo Clinic Institutional Review Board. All patients were admitted to a general medical unit, and only patients who previously provided permission for their records to be used in research were included in the study.
Patients
This study enrolled patients who were at least 18 years old and who were admitted to a single general medical unit for 24 hours or longer. Patients were excluded if they required a surgical intervention, were transferred from another hospital, received care on a different general medical unit at any time during the hospitalization, or were pregnant. Our data collection began at the patients' (cases and controls) arrival on the general medical unit; we did not include data from any evaluation (outpatient or emergency department) before hospital admission.
Case Definition
An unplanned transfer was defined as an episode of unexpected clinical deterioration in a general medical patient that necessitated transfer to the ICU, as opposed to a preemptive or elective transfer following a procedure. Patients with unplanned transfers from December 9, 2003, to December 29, 2004, were eligible for the study. Only the first transfer to the ICU was considered for patients who had multiple ICU transfers during a single hospitalization. Because these data were collected before METs or RRTs were introduced at our institution, the recommendation for ICU transfer was a joint decision by the primary care team and the ICU team.
Control Definition
The matched controls were identified from among patients admitted to the general medical unit from January 16, 2002, to December 13, 2004. To reduce the effect of the heterogeneity inherent in general medical patients, we matched controls for age (within 5 years of age of the corresponding case), admission diagnosis code, and patient care unit of admission and required that they were admitted for at least 24 hours before dismissal. Patients who had an ICU stay during the same admission were excluded. The median difference in admission dates between the cases and the controls was 327 days, and 26 of the 50 matched pairs had admission dates within 1 year of each other. This lengthy interval between cases and controls was a consequence of the low incidence of patients who met the matching criteria.
Setting
This study involved the general medical units and ICUs of the 1157‐bed Saint Mary's Hospital, an academic tertiary care facility at Mayo Clinic in Rochester, Minnesota.
Vital Sign Determination
Vital signs abstracted for this study included blood pressure, heart rate, respiratory rate, oxygen saturation, and temperature. The SI was calculated for each set of abstracted vital signs. Staff nurses were responsible for the routine measurement and recording of vital signs at least once every 8 hours, although in several instances not all parameters were checked. In accordance with nursing policy, values outside the defined parameters were rechecked by the nursing supervisor of each care unit and, if found to be abnormal, were conveyed to the patient's physician. This system meant that abnormal results were checked by numerous observers, with differences in the frequency of recordings for individual patients.
Data Collection
Demographic data and information on the vital signs were abstracted through a comprehensive chart review. Demographic data included age, sex, ethnicity, comorbid conditions, hospital care unit, date and time of admission, admission diagnosis, date and time of transfer to the ICU, length of stay, dismissal date, and disposition at discharge. Comorbid conditions were scored using the Charlson Comorbidity Index.15
Statistical Analysis
A sample size of 50 matched pairs provided 81% power to detect an odds ratio of 3.0 or greater between cases and controls, with a 0.05, 2‐tailed level of significance with McNemar test. Patient demographic characteristics were summarized by the frequencies for categorical data and by mean and SD for continuous data. Consistent with the study design, the McNemar test and conditional logistic model analyses were used to determine the association between the SI and the risk of unplanned ICU transfer. Shock indices for the cases and controls were compared with use of t test. A P value <0.05 was considered statistically significant. For the SI, we calculated the odds ratio and its 95% confidence interval (CI) and P value using different cut points. We did not perform a receiver operating characteristics analysis because matching of cases and controls greatly complicates estimation of the sensitivity and specificity of the SI;16 a cohort study is suggested to investigate this analysis further. All statistical analyses were performed by SAS version 9.1.3 software (SAS Institute Inc, Cary, NC).
Results
A total of 50 pairs of matching cases and controls was included in this study. Table 1 lists the source of admission, demographic characteristics, and numbers of deaths for cases and controls. There were no statistically significant differences in admission source, age, sex, ethnicity, admission care unit, or Charlson Comorbidity Index. Mean length of stay was 14.8 days (SD, 9.7 days) for the cases and 5.7 days (SD, 6.3 days; P < 0.001) for the controls. Admission diagnoses were classified on the basis of the organ system of involvement (Table 2). In 30 of 50 cases, the admission diagnosis and the reason for ICU transfer were related.
| Value | Cases (n = 50) | Controls (n = 50) | P Value* |
|---|---|---|---|
| |||
| Emergency department admission, No. (%) | 33 (66) | 28 (56) | 0.41 |
| Direct admission, No. (%) | 14 (28) | 15 (30) | 1.00 |
| Other admission, No. (%) | 3 (6) | 7 (14) | 0.32 |
| Age, mean (SD), years | 69.8 (15.7) | 70.3 (15.8) | 0.38 |
| Male sex, No. (%) | 26 (52) | 18 (36) | 0.12 |
| Ethnicity, No. (%) | 1.00 | ||
| White | 46 (92) | 46 (92) | |
| Other | 4 (8) | 4 (8) | |
| Charlson Comorbidity index, mean (SD) | 3.06 (2.31) | 2.66 (2.02) | 0.22 |
| Hospital stay, mean (SD), day | 14.8 (9.7) | 5.7 (6.3) | 0.0007 |
| Hospital deaths, No. | 9 | 1 | 0.008 |
| Deaths within 30 days, No. | 5 | 2 | 0.24 |
| Deaths within 6 months, No. | 9 | 6 | 0.40 |
| System | Primary Admission Diagnosis | No. of Cases |
|---|---|---|
| Constitutional | Fever, malaise, general symptoms | 7 |
| Cardiovascular | Hypertension, congestive heart failure, chest pain, peripheral vascular disease, edema | 5 |
| Dermatologic | Cellulitis, foot ulcer, skin rash | 3 |
| Gastrointestinal | Pancreatitis, gastrointestinal hemorrhage, nausea and vomiting, diarrhea, abdominal pain | 6 |
| Hematologic | Thrombocytopenia, abnormal coagulation | 2 |
| Musculoskeletal | Lymphedema, shoulder pain, lumbago, back ache, closed dorsal vertebral fracture | 7 |
| Neurologic | Delirium tremens, psychosis, convulsions | 3 |
| Pulmonary | Pneumonia, food or vomit aspiration pneumonitis, shortness of breath, respiratory abnormality | 13 |
| Renal | Hyperkalemia, acute renal failure, renal artery atherosclerosis | 4 |
We reviewed the vital signs and shock indices for the 24 hours before ICU transfer for each case and over the entire hospitalization for each control, to determine the worst set (the lowest systolic blood pressure and the highest heart rate, respiratory rate, and SI). The cases had 1 to 22 complete sets of vitals for the 24 hours before ICU transfer; the median number of sets was 3 and the mean was 4. The controls had 1 to 12 complete sets for the 24 hours before the worst SI: the median was 3 sets and the mean was 3. In 26 of 50 controls, the worst SI occurred within the first 24 hours after admission. There was a significant difference between the median values of the worst shock indices of the cases and the controls (0.87 vs. 0.72; P < 0.005).
Table 3 shows the different values of the SI and the corresponding odds ratio of unplanned ICU transfer for cases compared with controls. The difference was significant at an SI of 0.85 and greater, indicating a strong association with unplanned ICU transfer.
| Shock Index | P Value | Odds Ratio | 95% CI |
|---|---|---|---|
| |||
| 0.8 | 0.05 | 2.43 | 1.015.86 |
| 0.85 | 0.02 | 3.00 | 1.917.56 |
| 0.9 | 0.007 | 7.50 | 1.7232.78 |
| 0.95 | <0.03 | 5.50 | 1.2224.81 |
We also found that the patients who transferred to the ICU had a greater number of inpatient deaths (9 cases vs. 1 control; P = 0.008), which would be expected, but there was no difference in 30‐day or 6‐month mortality rate (Table 1). One patient died after 30 days and while still hospitalized.
Comparison between the temporal trend of vital signs and the SI of the cases for the 24 hours before ICU transfer is shown in Figure 1. This graph shows the median of all the worst values (minimum systolic blood pressure and maximum SI, heart rate, and respiratory rate) over the four 6‐hour time periods (24 hours) preceding ICU transfer. Of note, the change in vital signs is subtle even while the SI increased to more than 0.8 as the patients clinically worsened before transfer.
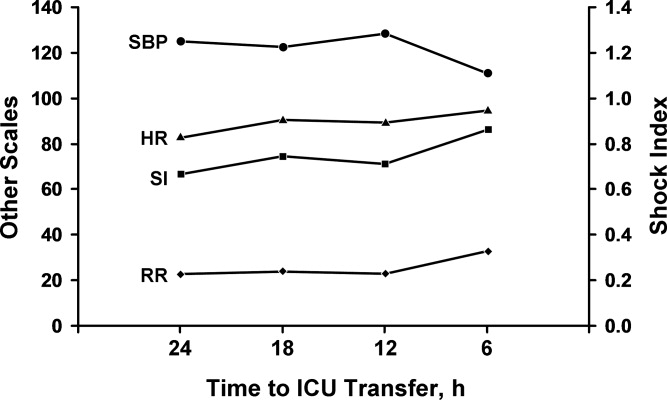
Discussion
In our comparison of the SI of 50 patients who required unplanned (unexpected) transfer to the ICU with the SI of 50 matched controls who did not require this higher level of care, we found that a SI of 0.85 or greater was significantly associated with unplanned transfer to the ICU. The cases had a significantly higher worst SI than the controls, and they also had a significantly longer hospital stay and higher inpatient mortality rate, as would be expected for a sicker patient population. These findings are important given that the SI may be useful for assessing illness severity, for helping determine the need for transfer to the ICU, or for activating METs or RRTs.
A major problem with providing optimal care for hospitalized general medical patients is the inherent difficulty in determining illness severity and clinical decline, especially when the decline occurs gradually. Existing consensus recommendations for ICU admission include both specific diagnoses and arbitrary objective criteria based on abnormal vital signs and laboratory values.27 Also, individual institutions may have their own ICU admission requirements, which may differ from these or RRT criteria. Although vital signs are important as a snapshot of basic physiologic function, a number of noncritical conditions may lead to abnormal vital signs, and not all abnormal vital signs are associated with an adverse clinical event. By relying solely on vital signs, clinicians may not recognize critical illness and therefore not transfer a patient to the ICU or may inappropriately transfer a patient who does not need ICU‐level care.
Markers of illness severity other than vital signs, such as the Acute Physiology and Chronic Health Evaluation (APACHE) score, have been shown to predict the death of ICU patients17, 18 but have been rarely studied outside the ICU setting.19 Also, calculating the APACHE score is cumbersome, and there is no cutoff score that defines when a patient should be transferred to the ICU. Subbe et al.,20 in their study to identify critically ill patients, found that introduction of a physiological scoring system (including MET or RRT activation scores) would have identified only a small number of additional patients as critically ill. Another common marker of illness severity, the 4 criteria of the systemic inflammatory response syndrome (temperature <36C or >38C; heart rate >90 beats per minute; respiratory rate >20 breaths per minute or PCO2 <32 mm Hg; and white blood cell count >12,000/L or <4000/L or with more than 10% band cells)21 may be too sensitive to use as a decision aid, since even a healthy person running after a bus could have 2 of the 4 criteria.22 Likewise, surgical patients may have transient leukocytosis due to a stress response independent of an infection.23
The SI may be more accurate than vital signs alone to determine illness severity and who is at risk for an unplanned transfer to the ICU. Birkhahn et al.24 concluded that the SI may be more useful in early hemorrhage than either heart rate or systolic blood pressure alone. Rady et al.25 showed that the SI used in the emergency department can identify critical illness with apparently stable vital signs, where an elevation of the SI above 0.9 was associated with an illness that was treated immediately with admission to the hospital and intensive therapy on admission. However, it is unclear whether the SI can be used to monitor ongoing treatment, because a previous study showed that the SI may be of limited value in the assessment of systemic oxygen transport and response to therapy in clinical septic shock.26 Of note, the SI is mostly independent of the effects of pain or anxiety, which cause a concurrent rise in heart rate and systolic blood pressure. Because the heart's left ventricular work is unchanged or may increase from the underlying catecholamine surge, the SI will be unchanged or may actually decrease.
Our study adds to the medical literature the findings that: (1) the SI may be useful as an indicator of illness severity and a triage tool in patients with no trauma but with various medical conditions, and (2) the SI showed a strong association with unplanned ICU transfer.
The main strength of our study is its case‐control design with matched controls. Also, by comparing groups from the same patient care unit, we sought to minimize the selection bias that can be inherent in case‐control studies. Limitations include the retrospective, nonrandomized study design and the fact that there may have been variations in vital sign measurements by the multiple caregivers. However, the vital signs were taken according to standard hospital practice and reflect real‐world conditions. Although generalizability may be somewhat limited because of our homogeneous patient population, our patients had a wide range of various medical illnesses, so our study should be applicable to other hospital settings, both academic and community‐based.
One of the main weaknesses of our study is that the results were not adjusted for the burden of comorbid conditions, although there were no statistically significant differences in the number of comorbid conditions among the cases and the controls (P = 0.96). Also, we did not directly compare the SI with vital signs alone to determine superiority.
The SI may be an important objective measure to help clinicians decide when patients need treatment that is more aggressive, assistance from a MET or an RRT, or a preemptive, rather than unplanned, transfer to an ICU. Although it is unlikely that a single measure will allow accurate triage of all medical or surgical patients, the SI may be a useful adjunct to clinical judgment and other objective measures in determining illness severity and clinical decline. Further prospective studies are needed to compare the role of the SI specifically with MET or RRT activation criteria, to clarify the role of comorbid conditions in unplanned transfers to the ICU, to validate the cut point for the SI in various disease states, and to assess its utility in patients with septic shock. Depending on these results, it may be beneficial to incorporate the SI into the electronic medical record as an automatic alert to identify patients at risk for ICU transfer.
Conclusions
The SI is an easily calculated composite index of heart rate and systolic blood pressure. An elevated SI of 0.85 can identify patients who are at risk for unplanned transfer to the ICU from general patient care units. Future studies will determine whether the SI is more accurate than simple vital signs as an indicator of clinical decline. If so, it may be useful as a trigger to activate METs or RRTs for treatment.
- ,.Outcome of intensive care patients in a group of British intensive care units.Crit Care Med.1998;26(8):1337–1345.
- ,,,.The longer patients are in hospital before Intensive Care admission the higher their mortality.Intensive Care Med.2004;30(10):1908–1913.
- ,.Physiological abnormalities in early warning scores are related to mortality in adult inpatients.Br J Anaesth.2004;92(6):882–884.
- ,,,,.Association between clinically abnormal observations and subsequent in‐hospital mortality: a prospective study.Resuscitation.2004;62(2):137–141.
- ,,,,,.Recognising clinical instability in hospital patients before cardiac arrest or unplanned admission to intensive care: a pilot study in a tertiary‐care hospital.Med J Aust.1999;171(1):22–25.
- ,,.Physiological values and procedures in the 24 h before ICU admission from the ward.Anaesthesia.1999;54(6):529–534.
- ,,, et al.Antecedents to hospital deaths.Intern Med J.2001;31(6):343–348.
- ,,, et al.A comparison of antecedents to cardiac arrests, deaths and emergency intensive care admissions in Australia and New Zealand, and the United Kingdom: the ACADEMIA study.Resuscitation.2004;62(3):275–282.
- ,,,,.Anticipating events of in‐hospital cardiac arrest.Eur J Emerg Med.2004;11(1):24–28.
- ,,, et al.Duration of life‐threatening antecedents prior to intensive care admission.Intensive Care Med.2002;28(11):1629–1634.
- ,,,.The prevalence of recordings of the signs of critical conditions and emergency responses in hospital wards: the SOCCER study.Resuscitation.2005;65(2):149–157.
- ,,,,,.Hospital‐wide code rates and mortality before and after implementation of a rapid response team.JAMA.2008;300(21):2506–2513.
- ,,,,.Rapid response teams: a systematic review and meta‐analysis.Arch Intern Med.2010;170(1):18–26.
- ,. [Shock index.]Dtsch Med Wochenschr.1967;92(43):1947–50. [German]
- ,,,.A new method of classifying prognostic comorbidity in longitudinal studies: development and validation.J Chronic Dis.1987;40(5):373–83.
- ,.Matching in studies of classification accuracy: implications for analysis, efficiency, and assessment of incremental value.Biometrics.2008;64(1):1–9.
- ,,,.APACHE II: a severity of disease classification system.Crit Care Med.1985;13(10):818–829.
- ,.Outcome prediction in critical care: the Acute Physiology and Chronic Health Evaluation models.Curr Opin Crit Care.2008;14(5):491–497.
- ,,.APACHE II predicts long‐term survival in COPD patients admitted to a general medical ward.J Gen Intern Med.2003;18(10):824–830.
- ,,,.Validation of physiological scoring systems in the accident and emergency department.Emerg Med J.2006;23(11):841–845.
- ,,, et al;2001 SCCM/ESICM/ACCP/ATS/SIS International Sepsis Definitions Conference.Crit Care Med.2003;31(4):1250–1256.
- .Dear SIRS, I'm sorry to say that I don't like you...Crit Care Med.1997;25(2):372–374.
- ,.The inflammatory response to surgery and trauma.Curr Opin Crit Care.2006;12(4):325–332.
- ,,,,.Shock index in diagnosing early acute hypovolemia.Am J Emerg Med.2005;23(3):323–326.
- ,,,,.A comparison of the shock index and conventional vital signs to identify acute, critical illness in the emergency department.Ann Emerg Med.1994;24(4):685–690. Erratum in:Ann Emerg Med.year="1994"1994;24(6):1208.
- ,,,.Shock index: a re‐evaluation in acute circulatory failure.Resuscitation.1992;23(3):227–234.
- ,,,,, et al.Guidelines for intensive care unit admission, discharge, and triage. Task Force of the American College of Critical Care Medicine, Society of Critical Care Medicine.Crit Care Med.1999;27(3):633–638.
The decision to transfer a patient to the intensive care unit (ICU) from a general care setting is complex and based not only on clinical findings and patient wishes but also on the understanding that ICU resources are limited and costly.1 Adding to the decision‐making complexity is the knowledge that patients who transfer to an ICU from a general medical unit comprise the highest mortality group of ICU patients, with the mortality rate directly proportional to both the time spent on the general medical unit1, 2 and the number of physiologic abnormalities before ICU admission.3, 4
Prior studies have shown that cardiac arrest and unplanned (unexpected) transfers to the ICU are preceded by a period of physiologic instability reflected in the vital signs.510 However, vital signs alone may not accurately indicate clinical condition. For example, a person may be able to maintain normal blood pressure and heart rate despite severe illness or may have abnormal vital signs at baseline, which may be the case for an otherwise healthy young woman who has baseline low systolic blood pressure. Also, noncritical conditions commonly seen in hospitalized medical or surgical patients, such as anxiety or pain, may increase the respiratory rate or heart rate. Conversely, certain common medications, such as ‐blockers, may mask or blunt the normal physiologic response to illness. Overall, the prevalence of abnormal physiologic variables is high among hospitalized adult patients irrespective of the presence of serious adverse events.11 This prevalence may be a reason why 2 recent studies of inpatient medical emergency teams (METs) or rapid response teams (RRTs), which generally rely on vital signs for activation, failed to show a decrease in adult mortality rates.12, 13
Given the complexity of interpreting single vital sign readings, we evaluated a simple and clinically intuitive variable, the shock index (SI) (heart rate/systolic blood pressure, a noninvasive indication of left ventricular function),14 as a potential marker of the need for intensive care. Allgwer and Burri14 first developed the SI in studies of patients with acute blood loss, intraabdominal bleeding, fat emboli, and severe infections. They observed that a healthy adult had a mean SI of 0.54 (standard deviation [SD], 0.021), while an index of 1.0 indicated threatened shock and indices greater than 1.5 were seen in volume‐deficient shock.
We hypothesized that an elevated SI is a differentiating factor between a patient who had an unplanned ICU transfer and a general medical patient who did not require this higher level of care. To our knowledge, the SI has not been studied for this application previously.
Patients and Methods
Study Design
We conducted a retrospective case‐control study of 50 consecutive general medical patients who had unplanned transfers to the ICU and 50 matched control patients, with the approval of the Mayo Clinic Institutional Review Board. All patients were admitted to a general medical unit, and only patients who previously provided permission for their records to be used in research were included in the study.
Patients
This study enrolled patients who were at least 18 years old and who were admitted to a single general medical unit for 24 hours or longer. Patients were excluded if they required a surgical intervention, were transferred from another hospital, received care on a different general medical unit at any time during the hospitalization, or were pregnant. Our data collection began at the patients' (cases and controls) arrival on the general medical unit; we did not include data from any evaluation (outpatient or emergency department) before hospital admission.
Case Definition
An unplanned transfer was defined as an episode of unexpected clinical deterioration in a general medical patient that necessitated transfer to the ICU, as opposed to a preemptive or elective transfer following a procedure. Patients with unplanned transfers from December 9, 2003, to December 29, 2004, were eligible for the study. Only the first transfer to the ICU was considered for patients who had multiple ICU transfers during a single hospitalization. Because these data were collected before METs or RRTs were introduced at our institution, the recommendation for ICU transfer was a joint decision by the primary care team and the ICU team.
Control Definition
The matched controls were identified from among patients admitted to the general medical unit from January 16, 2002, to December 13, 2004. To reduce the effect of the heterogeneity inherent in general medical patients, we matched controls for age (within 5 years of age of the corresponding case), admission diagnosis code, and patient care unit of admission and required that they were admitted for at least 24 hours before dismissal. Patients who had an ICU stay during the same admission were excluded. The median difference in admission dates between the cases and the controls was 327 days, and 26 of the 50 matched pairs had admission dates within 1 year of each other. This lengthy interval between cases and controls was a consequence of the low incidence of patients who met the matching criteria.
Setting
This study involved the general medical units and ICUs of the 1157‐bed Saint Mary's Hospital, an academic tertiary care facility at Mayo Clinic in Rochester, Minnesota.
Vital Sign Determination
Vital signs abstracted for this study included blood pressure, heart rate, respiratory rate, oxygen saturation, and temperature. The SI was calculated for each set of abstracted vital signs. Staff nurses were responsible for the routine measurement and recording of vital signs at least once every 8 hours, although in several instances not all parameters were checked. In accordance with nursing policy, values outside the defined parameters were rechecked by the nursing supervisor of each care unit and, if found to be abnormal, were conveyed to the patient's physician. This system meant that abnormal results were checked by numerous observers, with differences in the frequency of recordings for individual patients.
Data Collection
Demographic data and information on the vital signs were abstracted through a comprehensive chart review. Demographic data included age, sex, ethnicity, comorbid conditions, hospital care unit, date and time of admission, admission diagnosis, date and time of transfer to the ICU, length of stay, dismissal date, and disposition at discharge. Comorbid conditions were scored using the Charlson Comorbidity Index.15
Statistical Analysis
A sample size of 50 matched pairs provided 81% power to detect an odds ratio of 3.0 or greater between cases and controls, with a 0.05, 2‐tailed level of significance with McNemar test. Patient demographic characteristics were summarized by the frequencies for categorical data and by mean and SD for continuous data. Consistent with the study design, the McNemar test and conditional logistic model analyses were used to determine the association between the SI and the risk of unplanned ICU transfer. Shock indices for the cases and controls were compared with use of t test. A P value <0.05 was considered statistically significant. For the SI, we calculated the odds ratio and its 95% confidence interval (CI) and P value using different cut points. We did not perform a receiver operating characteristics analysis because matching of cases and controls greatly complicates estimation of the sensitivity and specificity of the SI;16 a cohort study is suggested to investigate this analysis further. All statistical analyses were performed by SAS version 9.1.3 software (SAS Institute Inc, Cary, NC).
Results
A total of 50 pairs of matching cases and controls was included in this study. Table 1 lists the source of admission, demographic characteristics, and numbers of deaths for cases and controls. There were no statistically significant differences in admission source, age, sex, ethnicity, admission care unit, or Charlson Comorbidity Index. Mean length of stay was 14.8 days (SD, 9.7 days) for the cases and 5.7 days (SD, 6.3 days; P < 0.001) for the controls. Admission diagnoses were classified on the basis of the organ system of involvement (Table 2). In 30 of 50 cases, the admission diagnosis and the reason for ICU transfer were related.
| Value | Cases (n = 50) | Controls (n = 50) | P Value* |
|---|---|---|---|
| |||
| Emergency department admission, No. (%) | 33 (66) | 28 (56) | 0.41 |
| Direct admission, No. (%) | 14 (28) | 15 (30) | 1.00 |
| Other admission, No. (%) | 3 (6) | 7 (14) | 0.32 |
| Age, mean (SD), years | 69.8 (15.7) | 70.3 (15.8) | 0.38 |
| Male sex, No. (%) | 26 (52) | 18 (36) | 0.12 |
| Ethnicity, No. (%) | 1.00 | ||
| White | 46 (92) | 46 (92) | |
| Other | 4 (8) | 4 (8) | |
| Charlson Comorbidity index, mean (SD) | 3.06 (2.31) | 2.66 (2.02) | 0.22 |
| Hospital stay, mean (SD), day | 14.8 (9.7) | 5.7 (6.3) | 0.0007 |
| Hospital deaths, No. | 9 | 1 | 0.008 |
| Deaths within 30 days, No. | 5 | 2 | 0.24 |
| Deaths within 6 months, No. | 9 | 6 | 0.40 |
| System | Primary Admission Diagnosis | No. of Cases |
|---|---|---|
| Constitutional | Fever, malaise, general symptoms | 7 |
| Cardiovascular | Hypertension, congestive heart failure, chest pain, peripheral vascular disease, edema | 5 |
| Dermatologic | Cellulitis, foot ulcer, skin rash | 3 |
| Gastrointestinal | Pancreatitis, gastrointestinal hemorrhage, nausea and vomiting, diarrhea, abdominal pain | 6 |
| Hematologic | Thrombocytopenia, abnormal coagulation | 2 |
| Musculoskeletal | Lymphedema, shoulder pain, lumbago, back ache, closed dorsal vertebral fracture | 7 |
| Neurologic | Delirium tremens, psychosis, convulsions | 3 |
| Pulmonary | Pneumonia, food or vomit aspiration pneumonitis, shortness of breath, respiratory abnormality | 13 |
| Renal | Hyperkalemia, acute renal failure, renal artery atherosclerosis | 4 |
We reviewed the vital signs and shock indices for the 24 hours before ICU transfer for each case and over the entire hospitalization for each control, to determine the worst set (the lowest systolic blood pressure and the highest heart rate, respiratory rate, and SI). The cases had 1 to 22 complete sets of vitals for the 24 hours before ICU transfer; the median number of sets was 3 and the mean was 4. The controls had 1 to 12 complete sets for the 24 hours before the worst SI: the median was 3 sets and the mean was 3. In 26 of 50 controls, the worst SI occurred within the first 24 hours after admission. There was a significant difference between the median values of the worst shock indices of the cases and the controls (0.87 vs. 0.72; P < 0.005).
Table 3 shows the different values of the SI and the corresponding odds ratio of unplanned ICU transfer for cases compared with controls. The difference was significant at an SI of 0.85 and greater, indicating a strong association with unplanned ICU transfer.
| Shock Index | P Value | Odds Ratio | 95% CI |
|---|---|---|---|
| |||
| 0.8 | 0.05 | 2.43 | 1.015.86 |
| 0.85 | 0.02 | 3.00 | 1.917.56 |
| 0.9 | 0.007 | 7.50 | 1.7232.78 |
| 0.95 | <0.03 | 5.50 | 1.2224.81 |
We also found that the patients who transferred to the ICU had a greater number of inpatient deaths (9 cases vs. 1 control; P = 0.008), which would be expected, but there was no difference in 30‐day or 6‐month mortality rate (Table 1). One patient died after 30 days and while still hospitalized.
Comparison between the temporal trend of vital signs and the SI of the cases for the 24 hours before ICU transfer is shown in Figure 1. This graph shows the median of all the worst values (minimum systolic blood pressure and maximum SI, heart rate, and respiratory rate) over the four 6‐hour time periods (24 hours) preceding ICU transfer. Of note, the change in vital signs is subtle even while the SI increased to more than 0.8 as the patients clinically worsened before transfer.
Discussion
In our comparison of the SI of 50 patients who required unplanned (unexpected) transfer to the ICU with the SI of 50 matched controls who did not require this higher level of care, we found that a SI of 0.85 or greater was significantly associated with unplanned transfer to the ICU. The cases had a significantly higher worst SI than the controls, and they also had a significantly longer hospital stay and higher inpatient mortality rate, as would be expected for a sicker patient population. These findings are important given that the SI may be useful for assessing illness severity, for helping determine the need for transfer to the ICU, or for activating METs or RRTs.
A major problem with providing optimal care for hospitalized general medical patients is the inherent difficulty in determining illness severity and clinical decline, especially when the decline occurs gradually. Existing consensus recommendations for ICU admission include both specific diagnoses and arbitrary objective criteria based on abnormal vital signs and laboratory values.27 Also, individual institutions may have their own ICU admission requirements, which may differ from these or RRT criteria. Although vital signs are important as a snapshot of basic physiologic function, a number of noncritical conditions may lead to abnormal vital signs, and not all abnormal vital signs are associated with an adverse clinical event. By relying solely on vital signs, clinicians may not recognize critical illness and therefore not transfer a patient to the ICU or may inappropriately transfer a patient who does not need ICU‐level care.
Markers of illness severity other than vital signs, such as the Acute Physiology and Chronic Health Evaluation (APACHE) score, have been shown to predict the death of ICU patients17, 18 but have been rarely studied outside the ICU setting.19 Also, calculating the APACHE score is cumbersome, and there is no cutoff score that defines when a patient should be transferred to the ICU. Subbe et al.,20 in their study to identify critically ill patients, found that introduction of a physiological scoring system (including MET or RRT activation scores) would have identified only a small number of additional patients as critically ill. Another common marker of illness severity, the 4 criteria of the systemic inflammatory response syndrome (temperature <36C or >38C; heart rate >90 beats per minute; respiratory rate >20 breaths per minute or PCO2 <32 mm Hg; and white blood cell count >12,000/L or <4000/L or with more than 10% band cells)21 may be too sensitive to use as a decision aid, since even a healthy person running after a bus could have 2 of the 4 criteria.22 Likewise, surgical patients may have transient leukocytosis due to a stress response independent of an infection.23
The SI may be more accurate than vital signs alone to determine illness severity and who is at risk for an unplanned transfer to the ICU. Birkhahn et al.24 concluded that the SI may be more useful in early hemorrhage than either heart rate or systolic blood pressure alone. Rady et al.25 showed that the SI used in the emergency department can identify critical illness with apparently stable vital signs, where an elevation of the SI above 0.9 was associated with an illness that was treated immediately with admission to the hospital and intensive therapy on admission. However, it is unclear whether the SI can be used to monitor ongoing treatment, because a previous study showed that the SI may be of limited value in the assessment of systemic oxygen transport and response to therapy in clinical septic shock.26 Of note, the SI is mostly independent of the effects of pain or anxiety, which cause a concurrent rise in heart rate and systolic blood pressure. Because the heart's left ventricular work is unchanged or may increase from the underlying catecholamine surge, the SI will be unchanged or may actually decrease.
Our study adds to the medical literature the findings that: (1) the SI may be useful as an indicator of illness severity and a triage tool in patients with no trauma but with various medical conditions, and (2) the SI showed a strong association with unplanned ICU transfer.
The main strength of our study is its case‐control design with matched controls. Also, by comparing groups from the same patient care unit, we sought to minimize the selection bias that can be inherent in case‐control studies. Limitations include the retrospective, nonrandomized study design and the fact that there may have been variations in vital sign measurements by the multiple caregivers. However, the vital signs were taken according to standard hospital practice and reflect real‐world conditions. Although generalizability may be somewhat limited because of our homogeneous patient population, our patients had a wide range of various medical illnesses, so our study should be applicable to other hospital settings, both academic and community‐based.
One of the main weaknesses of our study is that the results were not adjusted for the burden of comorbid conditions, although there were no statistically significant differences in the number of comorbid conditions among the cases and the controls (P = 0.96). Also, we did not directly compare the SI with vital signs alone to determine superiority.
The SI may be an important objective measure to help clinicians decide when patients need treatment that is more aggressive, assistance from a MET or an RRT, or a preemptive, rather than unplanned, transfer to an ICU. Although it is unlikely that a single measure will allow accurate triage of all medical or surgical patients, the SI may be a useful adjunct to clinical judgment and other objective measures in determining illness severity and clinical decline. Further prospective studies are needed to compare the role of the SI specifically with MET or RRT activation criteria, to clarify the role of comorbid conditions in unplanned transfers to the ICU, to validate the cut point for the SI in various disease states, and to assess its utility in patients with septic shock. Depending on these results, it may be beneficial to incorporate the SI into the electronic medical record as an automatic alert to identify patients at risk for ICU transfer.
Conclusions
The SI is an easily calculated composite index of heart rate and systolic blood pressure. An elevated SI of 0.85 can identify patients who are at risk for unplanned transfer to the ICU from general patient care units. Future studies will determine whether the SI is more accurate than simple vital signs as an indicator of clinical decline. If so, it may be useful as a trigger to activate METs or RRTs for treatment.
- ,.Outcome of intensive care patients in a group of British intensive care units.Crit Care Med.1998;26(8):1337–1345.
- ,,,.The longer patients are in hospital before Intensive Care admission the higher their mortality.Intensive Care Med.2004;30(10):1908–1913.
- ,.Physiological abnormalities in early warning scores are related to mortality in adult inpatients.Br J Anaesth.2004;92(6):882–884.
- ,,,,.Association between clinically abnormal observations and subsequent in‐hospital mortality: a prospective study.Resuscitation.2004;62(2):137–141.
- ,,,,,.Recognising clinical instability in hospital patients before cardiac arrest or unplanned admission to intensive care: a pilot study in a tertiary‐care hospital.Med J Aust.1999;171(1):22–25.
- ,,.Physiological values and procedures in the 24 h before ICU admission from the ward.Anaesthesia.1999;54(6):529–534.
- ,,, et al.Antecedents to hospital deaths.Intern Med J.2001;31(6):343–348.
- ,,, et al.A comparison of antecedents to cardiac arrests, deaths and emergency intensive care admissions in Australia and New Zealand, and the United Kingdom: the ACADEMIA study.Resuscitation.2004;62(3):275–282.
- ,,,,.Anticipating events of in‐hospital cardiac arrest.Eur J Emerg Med.2004;11(1):24–28.
- ,,, et al.Duration of life‐threatening antecedents prior to intensive care admission.Intensive Care Med.2002;28(11):1629–1634.
- ,,,.The prevalence of recordings of the signs of critical conditions and emergency responses in hospital wards: the SOCCER study.Resuscitation.2005;65(2):149–157.
- ,,,,,.Hospital‐wide code rates and mortality before and after implementation of a rapid response team.JAMA.2008;300(21):2506–2513.
- ,,,,.Rapid response teams: a systematic review and meta‐analysis.Arch Intern Med.2010;170(1):18–26.
- ,. [Shock index.]Dtsch Med Wochenschr.1967;92(43):1947–50. [German]
- ,,,.A new method of classifying prognostic comorbidity in longitudinal studies: development and validation.J Chronic Dis.1987;40(5):373–83.
- ,.Matching in studies of classification accuracy: implications for analysis, efficiency, and assessment of incremental value.Biometrics.2008;64(1):1–9.
- ,,,.APACHE II: a severity of disease classification system.Crit Care Med.1985;13(10):818–829.
- ,.Outcome prediction in critical care: the Acute Physiology and Chronic Health Evaluation models.Curr Opin Crit Care.2008;14(5):491–497.
- ,,.APACHE II predicts long‐term survival in COPD patients admitted to a general medical ward.J Gen Intern Med.2003;18(10):824–830.
- ,,,.Validation of physiological scoring systems in the accident and emergency department.Emerg Med J.2006;23(11):841–845.
- ,,, et al;2001 SCCM/ESICM/ACCP/ATS/SIS International Sepsis Definitions Conference.Crit Care Med.2003;31(4):1250–1256.
- .Dear SIRS, I'm sorry to say that I don't like you...Crit Care Med.1997;25(2):372–374.
- ,.The inflammatory response to surgery and trauma.Curr Opin Crit Care.2006;12(4):325–332.
- ,,,,.Shock index in diagnosing early acute hypovolemia.Am J Emerg Med.2005;23(3):323–326.
- ,,,,.A comparison of the shock index and conventional vital signs to identify acute, critical illness in the emergency department.Ann Emerg Med.1994;24(4):685–690. Erratum in:Ann Emerg Med.year="1994"1994;24(6):1208.
- ,,,.Shock index: a re‐evaluation in acute circulatory failure.Resuscitation.1992;23(3):227–234.
- ,,,,, et al.Guidelines for intensive care unit admission, discharge, and triage. Task Force of the American College of Critical Care Medicine, Society of Critical Care Medicine.Crit Care Med.1999;27(3):633–638.
Copyright © 2010 Society of Hospital Medicine

Handoff Efficiency
Transfer of responsibility for patients, or handoff,1 occurs frequently in hospitalist services, requiring excellent and timely communication to ensure patient safety. Communication failure is a major contributor to medical errors.2, 3 Recognizing such findings, a growing body of literature addresses handoff techniques for learners.47
Vidyarthi described the handoff process as traditionally informal, unstructured, and idiosyncratic,4 and many believe efforts to formalize and structure this process are important for patient safety.8 Standardized handoff forms have improved accuracy of information.9 Web‐based sign‐out systems reportedly reduced the number of patients missed on rounds.10
Hospitalists also face challenges with effective communication during service change.11 The Society of Hospital Medicine identified the handoff skill as a core competency for hospitalists, and recommendations based on a systematic review of the literature were published.12 Inpatient medicine programs are increasingly using midlevel providers such as nurse practitioners (NPs) and physician assistants (PAs) along with hospitalists to accommodate workload while maintaining the scholarly enterprise in academic centers.13 To our knowledge there is no literature examining the hospitalist service handoffs involving NP/PAs.
We wished to study the effectiveness and timeliness of the morning handoff from the night coverage providers to the daytime teams consisting of one hospitalist and one NP/PA. Our objectives were to identify deficiencies and to evaluate the effectiveness of a restructured handoff process.
Methods
The Mayo Clinic Institutional Review Board reviewed and approved this study.
Setting
At the time of this study, the Division of Hospital Internal Medicine (HIM) at our institution consisted of 22 hospitalists, 11 NPs and 9 PAs (hereinafter NP/PAs), and 2 clinical assistants (CAs). The CAs assist with clerical duties not covered by Unit Secretaries:
-
Obtaining outside records
-
Clarifying referring physician contact information
-
Scheduling follow‐up outpatient appointments for tests, procedures, and visits
-
Attendance at morning handoff
Each CA can assist 3 or 4 daytime service teams.
Daytime Service Organization
Six HIM services, each managing up to 12 patients, are staffed by a partnership of 1 hospitalist and 1 NP/PA: Four services are primary general medicine services, and 2 consulting (orthopedic comanagement) services.
Night Coverage
Three of 4 primary daytime services and one consult service team transfer care to the (in‐house) night NP/PA. The night NP/PA addresses any acute‐care issues and reports at morning handoff to the 3 primary services and 1 consult service. In a designated conference room the morning handoff occurs, with at least 1 (day team) service representative present. This is usually the NP/PA, as the day team hospitalist concurrently receives a report on new admissions from the (in‐house) night hospitalist (who also covers one service and backs up the night NP/PA).
Improvement Process
An improvement team was formed within the Division of HIM consisting of 3 hospitalists, 3 NP/PAs, and 2 CAs to assess the existing handoff process at 7:45am between the Night NP/PA and daytime services. The improvement team met, reviewed evidence‐based literature on handoffs and discussed our local process. Four problems were identified by consensus:
-
Unpredictable start and finish times
-
Inefficiency (time wasted)
-
Poor environment (room noisy and distracting conversations)
-
Poor communication (overwrought and meandering narratives).
Intervention
The improvement team structured a new handoff process to address these deficiencies.
-
Environment: Moved to a smaller room (lower ceiling, less ambient noise).
-
Identification: table cards designating seats for participants (reduced queries regarding what service are you, today?).
-
Start Times: Each service team assigned a consistent start time (labeled on the table card) within a 15‐minute period, and although earlier reportage could occur, any service team present at their designated time has priority for the attention of the night NP/PA, and the opportunity to ask questions.
-
Quiet and Focus: HIM members were reminded to remain quiet in the handoff room, so the service receiving report has the floor and personal conversations must not impede the principals.
-
Visual Cue: Green Good to go sign placed on team table cards when no verbal was required.
-
Written e‐Material: The improvement team required elements of a brief written report in a specified column of our existing electronic service list (ESL). The ESL is a custom designed template importing laboratory, medication, and demographic data automatically but also capable of free text additions (Figure 1). All providers were instructed to update the ESL every 12 hours.
-
Admission and Progress Notes: After manual electronic medical record search, the CAs printed any notes generated in the preceding 12 hours and placed them by the team table card.

The improvement team provided education for the new process at a division meeting and through e‐mail. The recommended report sequence was night NP/PA reporting and day service teams asking questions and seeking clarifications. We discouraged editorial comments and chit‐chat.
A member of the improvement team monitored the new handoff process for 15 days, and 3 months later for 10 days.
Survey
An anonymous survey (Figure 2) concerning staff satisfaction with handoff was conducted immediately before and 15 days after the intervention. In the e‐mail containing the postintervention survey, providers were asked to respond only if they had been on service the preceding 15 days (and thus eligible to participate in handoff). To help insure this, the first question read, Have you been on service during the past 15 days?
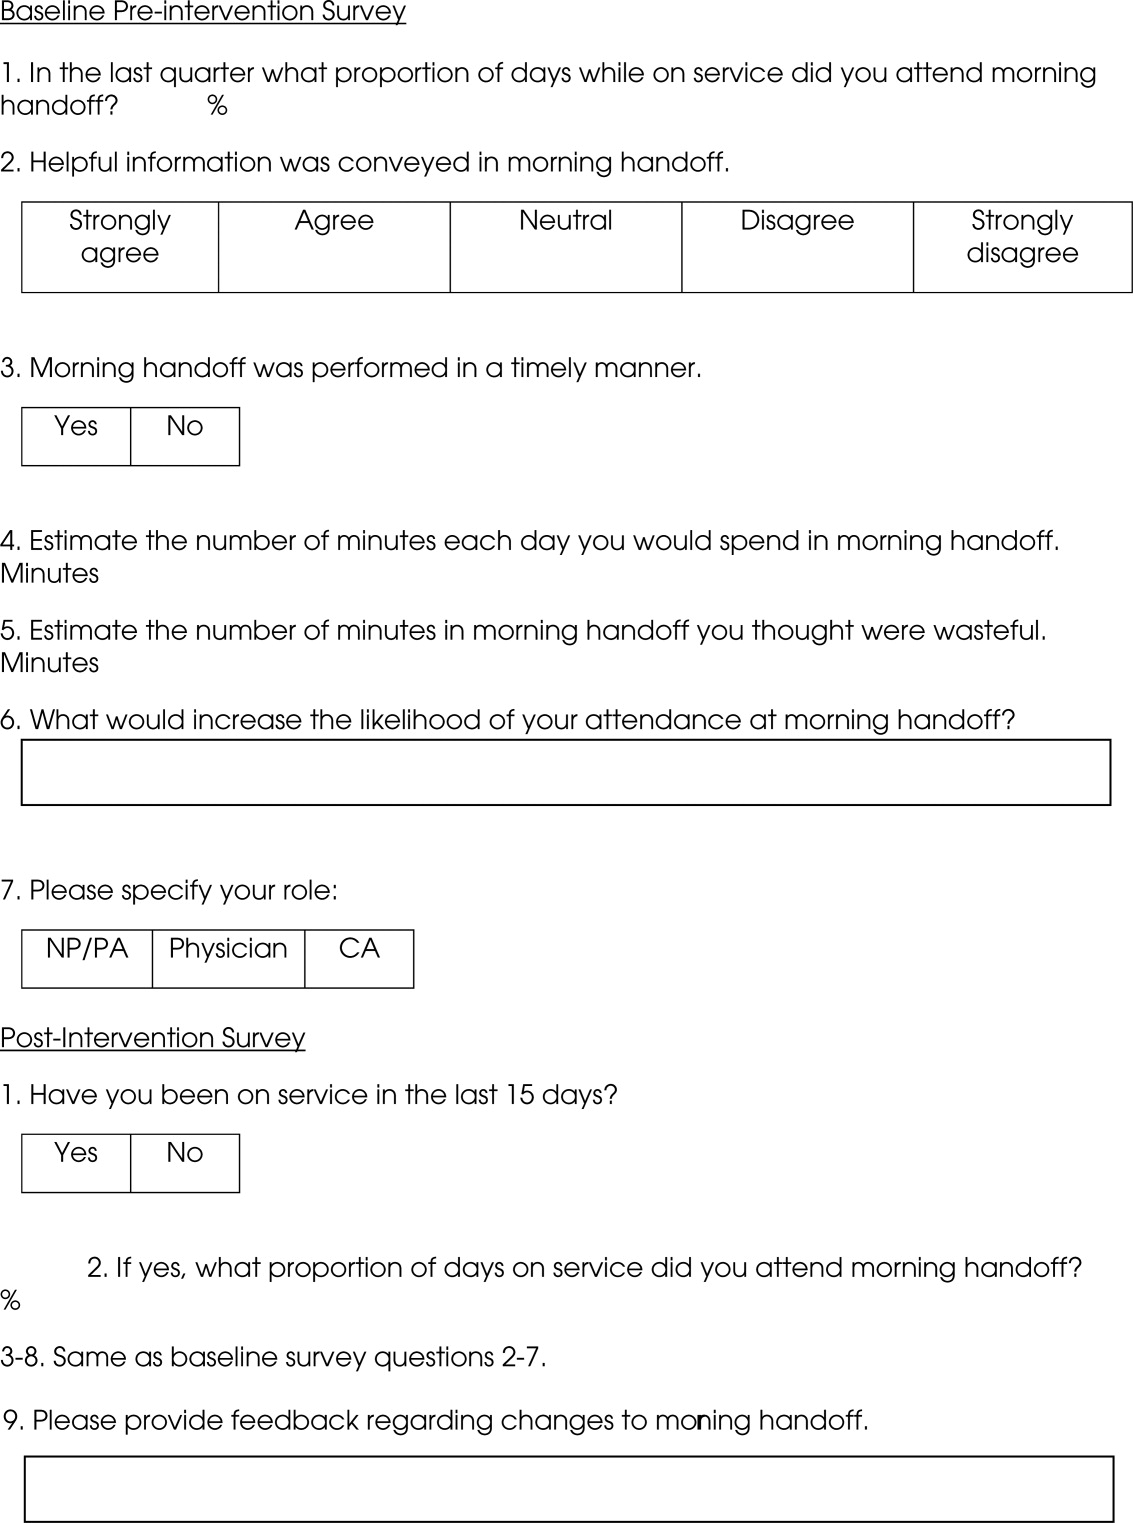
Statistics
To compare the relationship of preintervention and postintervention survey responses, Fisher's exact test was used to compare categorical variables and 2 sample t‐test and Wilcoxon rank sum test were used for continuous variables. Comparisons that adjusted for the possibility of someone responding to both the preintervention and postintervention surveys were not performed since the surveys were anonymous. A P value <0.05 was considered statistically significant. For the item concerning the percentage of days morning report was attended while on service, based on a common standard deviation estimate of 35.3, we had 80% power to detect a difference of 29.1 (pre vs. post). This computation assumes a 2‐sample t‐test of = 0.05 with sample sizes of 36 and 18. We have 59% power to detect a difference of 27% (67% pre vs. 94% post) for those who at least agree that helpful information was conveyed during handoff. This computation is based on a 2‐sided Pearson 2 test with = 0.05.
Qualitative data analysis of respondents' answers to the open‐ended survey questions What would increase the likelihood of your attending handoff? and What feedback do you have regarding the changes to handoff? was performed using the constant comparative method14 associated with grounded theory approaches to identify themes and categories.15 To establish interrater reliability, three investigators (MCB, DTK, LLK) independently identified coding categories for the data set, compared results, redefined coding categories as needed, and reanalyzed the data until 80% agreement was reached.
Results
Thirty‐six of the 44 providers (82%) answered the preintervention survey, including 18 of 22 hospitalists (82%), 17 of 20 NPs/PAs (85%), and 1 of 2 CAs (50%). During the intervention based on our staffing model, 21 providers had the opportunity to participate in handoff, and 18 (86%) answered the postintervention survey, including 5 of 6 hospitalists (83%), 9 of 14 NPs/PAs (64%), and 2 of 2 CAs (100%). All respondents to the postintervention survey reported being on service during the previous 15 days.
As summarized in Table 1, compared to 60.5% of survey participants (n = 38) who thought morning handoff was performed in a timely fashion preintervention, 100% (n = 15) felt it was performed in a timely fashion postintervention (P = 0.005). The average time spent in morning report before the intervention was 11 minutes, as compared to 5 minutes after the intervention (P < 0.0028). Prior to the intervention, 6.5 minutes of the handoff were viewed to be wasteful, as compared to 0.5 minutes of the handoff in the postintervention survey (P < 0.0001). Attendance and quality of information perceptions did not demonstrate statistically significant change.
| Survey Question | Preintervention | Postintervention | P |
|---|---|---|---|
| What proportion of days while on service did you attend morning report? (%) | 78 | 87 | 0.4119 |
| Helpful information was conveyed in morning report, n (%) | 0.112 | ||
| Strongly agree | 9 (25) | 9 (56) | |
| Agree | 15 (42) | 6 (38) | |
| Neutral | 8 (22) | 1 (6) | |
| Disagree | 4 (11) | 0 | |
| Strongly disagree | 0 | 0 | |
| Morning report was performed in a timely manner, #yes/#no | 23/15 | 15/0 | 0.005 |
| Estimate the number of minutes each day you would spend in morning report (minute) | 11 | 5 | <0.0028 |
| Estimate the number of minutes in morning report you thought were wasteful (minute) | 6.5 | 0.5 | <0.0001 |
During the 15‐day observation period, morning handoff started by 0745 on 14 of 15 (93%) of days and finished by 0800 on 15 of 15 (100%) of days. Table cards, ESL, and progress notes were on the table by 0745 on 15 of 15 (100%) of days following the intervention. Three months after the intervention, the following were observed: morning handoff started by 0745 on 10 of 10 (100%) of days; finished by 0800 on 10 of 10 (100%) of days; and table cards, ESL, and progress notes were on the table by 0745 on 10 of 10 (100%) of days.
Qualitative Data Analysis
Three themes were identified in both preintervention and postintervention surveys: timeliness, quality of report and environment (Table 2). In the preintervention survey, timeliness complaints involved inconsistent start time, prolonged duration of handoff, and inefficiency due to time wasted while teams waited for their handoff report. Comments about report quality mentioned the nonstandardized report process that included nonpertinent information and editorializing. Environmental concerns addressed noise from multiple service team members assembled in 1 large room and chatting while awaiting report. In the postintervention survey, respondents' comments noted improved efficiency, environment, and report quality.
| Deficiency | Pre‐Intervention | Post‐Intervention |
|---|---|---|
| Timeliness | Efficiency needed | I found the changes lead to more concise and valuable time spent in report |
| Timely, scheduled and efficient reports would help increase my attendance | I personally enjoyed having the times set so you are held accountable for a certain handoff | |
| Set report times so I don't have to listen to everyone else's report | More organized and efficient | |
| Too much time wasted | Love the good to go card! Can start on rounds | |
| Environment | Not having to listen to chit chat unrelated to patient carewould improve my attendance | There is less chit chat |
| Services should receive report in a quieter room | Seems less chaotic with less people overall in the room so less distraction | |
| Need a quieter and smaller room | Because the room is quieter, I did not have to repeat information | |
| Too noisy | Quiet and respectful | |
| Quality | I would like a more organized format More information isn't needed, just the correct information in a timely manner | I felt that the amount of information shared was only what was pertinent and important |
| If I first had the opportunity to review ESL and any notes generated in the last 12 hours, this would improve report | Written information on the ESL assured that I didn't forget something important | |
| Less editorializing about events and less adrenaline | I liked having the progress notes generated overnight available for review | |
| Need only meaningful information | Excellent report with prompt dissemination of information |
Discussion
We describe an intervention that set the expectation for formal, structured written and verbal communication in a focused environment involving outgoing and incoming clinicians, resulting in improved satisfaction. Before the intervention, the improvement team identified by consensus 4 problems: unpredictable start time, inefficiency, environment, and report quality. Formal structuring of our handoff process resulted in statistically significant improvement in handoff timeliness and efficiency in the view of the HIM division members. Process improvement included precise team specific start times within a 12‐minute window to improve reliability and predictability and eliminating nonproductive waiting. Additionally, receiving teams were clearly identified with table cards so that no time was wasted locating the appropriate service for report, and minimizing role‐identification challenges. The good to go sign signaled teams that no events had occurred overnight requiring verbal report. Handoff timeliness persisted 3 months after the intervention, suggesting that the process is easily sustainable.
Postintervention survey comments noted the improved environment: a smaller, quieter room with the door closed. Before the intervention, all day team providers, CAs and night provider met in a large, loud room where multiple conversations were commonplace. Previous study of the handoff process supports creating an environment free of distraction.4
Postintervention survey responses to the open‐ended questions suggested improved provider satisfaction with the quality of the report. We believe this occurred for several reasons. First, having a precise start time for each team within a 12‐minute window led to a more focused report. Second, the ESL provided a column for providers to suggest plans of care for anticipated overnight events to improve preparedness and avoid significant omissions. Third, hospital notes generated overnight were made available which allowed daytime providers to review events before handoff, for a more informed update, or just after verbal report to reinforce the information just received, a technique used in other high‐reliability organizations.16 This measure also provided an at‐a‐glance view of each patient, decreasing the complexity of handoff.17
This study has important limitations. We address the handoff process of 1 hospitalist group at a single academic center. NP/PAs are the clinicians with first‐call responsibility for the night coverage of our patients, and the handoff process between the night NP/PA and daytime provider was studied. The handoff between physicians for patients admitted overnight was not assessed. Another limitation is that the time spent in handoff is reported as a participant estimate. There was no objective measurement of time, and respondents may have been biased. An additional limitation of our study concerns the preintervention and postintervention surveys. Both surveys were anonymous, which makes discerning the absolute impact of the intervention difficult due to the lack of paired responses. Lastly, our institution has an ESL. This option may not be available in other hospital systems.
Several deficiencies in the handoff process were addressed by providing key clinical data verbally and in written format, enhancing the physical environment, and defining each team's handoff start time. Our process improvements are consistent with the handoff recommendations endorsed by the Society of Hospital Medicine.12 Subsequent direct observation, subjective reports, and survey results demonstrated improvement in the handoff process.
Future studies might measure the effectiveness of morning handoff by end‐shift interviews of the daytime clinicians. Similarly, a study of evening handoff could measure the efficiency and effectiveness of report given by day teams to night‐coverage colleagues. Furthermore, if the handoff report skill set can be more rigorously defined and measured, a hospitalist clinical competency for hospitalists and NP/PAs could be developed in this core process‐of‐care.12
Acknowledgements
The authors thank Lisa Boucher for preparation of this manuscript.
- , , , et al.Lost in translation: challenges and opportunities in physician‐to‐physician communication during patient handoffs.Acad Med.2005;80:1094–1099.
- , , .Communication failures: an insidious contributor to medical mishaps.Acad Med.2004;79:186–194.
- , , .The human factor: the critical importance of effective teamwork and communication in providing safe care.Quality 13 Suppl 1:i85–90.
- , , , et al.Managing discontinuity in academic medical centers: strategies for a safe and effective resident sign‐out.J Hosp Med.2006;1:257–266.
- , , .Development and implementation of an oral sign‐out skills curriculum.J Gen Intern Med.2007;22:1470–1474.
- , , , et al.The top 10 list for a safe and effective sign‐out.Arch Surg2008;143(10):1008–1010.
- , , , et al.Residents' and attending physicians' handoffs: a systematic review of the literature.Acad Med.2009;84(12):1775–1787.
- , , , et al.A structured handoff program for interns.Acad Med.2009;84:347–352.
- , , , et al.Simple standardized patient handoff system that increases accuracy and completeness.J Surg.2008;65:476–485.
- , , , et al.A randomized, controlled trial evaluation the impact of a computerized rounding and sign‐out system on continuity of care and resident work hours.J Am Coll Surg.2005;200:538–545.
- , , , .Understanding communication during hospitalist service changes: A mixed methods study.J Hosp Med.2009;4(9):535–540.
- , , , , , .Hospitalist handoffs: a systematic review and task force recommendations.J of Hosp Med.2009;4(7):433–440.
- , , , et al.Implementation of a physician assistant/hospitalist service in an academic medical center: impact on efficiency and patient outcomes.J Hosp Med.2008;3:361–368.
- , .Basics of Qualitiative Research: Grounded Theory Procedures and Techniques.Sage Publications, Inc.Newbury Park, CA.1990.
- , .Naturalistic Inquiry.Sage Publications, Inc.Newbury Park, CA.1985.
- .Communication strategies from high‐reliability organizations.Ann Surg.2007;245(2):170–172.
- , , , et al.Handoff strategies in settings with high consequences for failure: lessons for health care operations.Int J Qual Health Care.2004;16(2):125.
Transfer of responsibility for patients, or handoff,1 occurs frequently in hospitalist services, requiring excellent and timely communication to ensure patient safety. Communication failure is a major contributor to medical errors.2, 3 Recognizing such findings, a growing body of literature addresses handoff techniques for learners.47
Vidyarthi described the handoff process as traditionally informal, unstructured, and idiosyncratic,4 and many believe efforts to formalize and structure this process are important for patient safety.8 Standardized handoff forms have improved accuracy of information.9 Web‐based sign‐out systems reportedly reduced the number of patients missed on rounds.10
Hospitalists also face challenges with effective communication during service change.11 The Society of Hospital Medicine identified the handoff skill as a core competency for hospitalists, and recommendations based on a systematic review of the literature were published.12 Inpatient medicine programs are increasingly using midlevel providers such as nurse practitioners (NPs) and physician assistants (PAs) along with hospitalists to accommodate workload while maintaining the scholarly enterprise in academic centers.13 To our knowledge there is no literature examining the hospitalist service handoffs involving NP/PAs.
We wished to study the effectiveness and timeliness of the morning handoff from the night coverage providers to the daytime teams consisting of one hospitalist and one NP/PA. Our objectives were to identify deficiencies and to evaluate the effectiveness of a restructured handoff process.
Methods
The Mayo Clinic Institutional Review Board reviewed and approved this study.
Setting
At the time of this study, the Division of Hospital Internal Medicine (HIM) at our institution consisted of 22 hospitalists, 11 NPs and 9 PAs (hereinafter NP/PAs), and 2 clinical assistants (CAs). The CAs assist with clerical duties not covered by Unit Secretaries:
-
Obtaining outside records
-
Clarifying referring physician contact information
-
Scheduling follow‐up outpatient appointments for tests, procedures, and visits
-
Attendance at morning handoff
Each CA can assist 3 or 4 daytime service teams.
Daytime Service Organization
Six HIM services, each managing up to 12 patients, are staffed by a partnership of 1 hospitalist and 1 NP/PA: Four services are primary general medicine services, and 2 consulting (orthopedic comanagement) services.
Night Coverage
Three of 4 primary daytime services and one consult service team transfer care to the (in‐house) night NP/PA. The night NP/PA addresses any acute‐care issues and reports at morning handoff to the 3 primary services and 1 consult service. In a designated conference room the morning handoff occurs, with at least 1 (day team) service representative present. This is usually the NP/PA, as the day team hospitalist concurrently receives a report on new admissions from the (in‐house) night hospitalist (who also covers one service and backs up the night NP/PA).
Improvement Process
An improvement team was formed within the Division of HIM consisting of 3 hospitalists, 3 NP/PAs, and 2 CAs to assess the existing handoff process at 7:45am between the Night NP/PA and daytime services. The improvement team met, reviewed evidence‐based literature on handoffs and discussed our local process. Four problems were identified by consensus:
-
Unpredictable start and finish times
-
Inefficiency (time wasted)
-
Poor environment (room noisy and distracting conversations)
-
Poor communication (overwrought and meandering narratives).
Intervention
The improvement team structured a new handoff process to address these deficiencies.
-
Environment: Moved to a smaller room (lower ceiling, less ambient noise).
-
Identification: table cards designating seats for participants (reduced queries regarding what service are you, today?).
-
Start Times: Each service team assigned a consistent start time (labeled on the table card) within a 15‐minute period, and although earlier reportage could occur, any service team present at their designated time has priority for the attention of the night NP/PA, and the opportunity to ask questions.
-
Quiet and Focus: HIM members were reminded to remain quiet in the handoff room, so the service receiving report has the floor and personal conversations must not impede the principals.
-
Visual Cue: Green Good to go sign placed on team table cards when no verbal was required.
-
Written e‐Material: The improvement team required elements of a brief written report in a specified column of our existing electronic service list (ESL). The ESL is a custom designed template importing laboratory, medication, and demographic data automatically but also capable of free text additions (Figure 1). All providers were instructed to update the ESL every 12 hours.
-
Admission and Progress Notes: After manual electronic medical record search, the CAs printed any notes generated in the preceding 12 hours and placed them by the team table card.
The improvement team provided education for the new process at a division meeting and through e‐mail. The recommended report sequence was night NP/PA reporting and day service teams asking questions and seeking clarifications. We discouraged editorial comments and chit‐chat.
A member of the improvement team monitored the new handoff process for 15 days, and 3 months later for 10 days.
Survey
An anonymous survey (Figure 2) concerning staff satisfaction with handoff was conducted immediately before and 15 days after the intervention. In the e‐mail containing the postintervention survey, providers were asked to respond only if they had been on service the preceding 15 days (and thus eligible to participate in handoff). To help insure this, the first question read, Have you been on service during the past 15 days?
Statistics
To compare the relationship of preintervention and postintervention survey responses, Fisher's exact test was used to compare categorical variables and 2 sample t‐test and Wilcoxon rank sum test were used for continuous variables. Comparisons that adjusted for the possibility of someone responding to both the preintervention and postintervention surveys were not performed since the surveys were anonymous. A P value <0.05 was considered statistically significant. For the item concerning the percentage of days morning report was attended while on service, based on a common standard deviation estimate of 35.3, we had 80% power to detect a difference of 29.1 (pre vs. post). This computation assumes a 2‐sample t‐test of = 0.05 with sample sizes of 36 and 18. We have 59% power to detect a difference of 27% (67% pre vs. 94% post) for those who at least agree that helpful information was conveyed during handoff. This computation is based on a 2‐sided Pearson 2 test with = 0.05.
Qualitative data analysis of respondents' answers to the open‐ended survey questions What would increase the likelihood of your attending handoff? and What feedback do you have regarding the changes to handoff? was performed using the constant comparative method14 associated with grounded theory approaches to identify themes and categories.15 To establish interrater reliability, three investigators (MCB, DTK, LLK) independently identified coding categories for the data set, compared results, redefined coding categories as needed, and reanalyzed the data until 80% agreement was reached.
Results
Thirty‐six of the 44 providers (82%) answered the preintervention survey, including 18 of 22 hospitalists (82%), 17 of 20 NPs/PAs (85%), and 1 of 2 CAs (50%). During the intervention based on our staffing model, 21 providers had the opportunity to participate in handoff, and 18 (86%) answered the postintervention survey, including 5 of 6 hospitalists (83%), 9 of 14 NPs/PAs (64%), and 2 of 2 CAs (100%). All respondents to the postintervention survey reported being on service during the previous 15 days.
As summarized in Table 1, compared to 60.5% of survey participants (n = 38) who thought morning handoff was performed in a timely fashion preintervention, 100% (n = 15) felt it was performed in a timely fashion postintervention (P = 0.005). The average time spent in morning report before the intervention was 11 minutes, as compared to 5 minutes after the intervention (P < 0.0028). Prior to the intervention, 6.5 minutes of the handoff were viewed to be wasteful, as compared to 0.5 minutes of the handoff in the postintervention survey (P < 0.0001). Attendance and quality of information perceptions did not demonstrate statistically significant change.
| Survey Question | Preintervention | Postintervention | P |
|---|---|---|---|
| What proportion of days while on service did you attend morning report? (%) | 78 | 87 | 0.4119 |
| Helpful information was conveyed in morning report, n (%) | 0.112 | ||
| Strongly agree | 9 (25) | 9 (56) | |
| Agree | 15 (42) | 6 (38) | |
| Neutral | 8 (22) | 1 (6) | |
| Disagree | 4 (11) | 0 | |
| Strongly disagree | 0 | 0 | |
| Morning report was performed in a timely manner, #yes/#no | 23/15 | 15/0 | 0.005 |
| Estimate the number of minutes each day you would spend in morning report (minute) | 11 | 5 | <0.0028 |
| Estimate the number of minutes in morning report you thought were wasteful (minute) | 6.5 | 0.5 | <0.0001 |
During the 15‐day observation period, morning handoff started by 0745 on 14 of 15 (93%) of days and finished by 0800 on 15 of 15 (100%) of days. Table cards, ESL, and progress notes were on the table by 0745 on 15 of 15 (100%) of days following the intervention. Three months after the intervention, the following were observed: morning handoff started by 0745 on 10 of 10 (100%) of days; finished by 0800 on 10 of 10 (100%) of days; and table cards, ESL, and progress notes were on the table by 0745 on 10 of 10 (100%) of days.
Qualitative Data Analysis
Three themes were identified in both preintervention and postintervention surveys: timeliness, quality of report and environment (Table 2). In the preintervention survey, timeliness complaints involved inconsistent start time, prolonged duration of handoff, and inefficiency due to time wasted while teams waited for their handoff report. Comments about report quality mentioned the nonstandardized report process that included nonpertinent information and editorializing. Environmental concerns addressed noise from multiple service team members assembled in 1 large room and chatting while awaiting report. In the postintervention survey, respondents' comments noted improved efficiency, environment, and report quality.
| Deficiency | Pre‐Intervention | Post‐Intervention |
|---|---|---|
| Timeliness | Efficiency needed | I found the changes lead to more concise and valuable time spent in report |
| Timely, scheduled and efficient reports would help increase my attendance | I personally enjoyed having the times set so you are held accountable for a certain handoff | |
| Set report times so I don't have to listen to everyone else's report | More organized and efficient | |
| Too much time wasted | Love the good to go card! Can start on rounds | |
| Environment | Not having to listen to chit chat unrelated to patient carewould improve my attendance | There is less chit chat |
| Services should receive report in a quieter room | Seems less chaotic with less people overall in the room so less distraction | |
| Need a quieter and smaller room | Because the room is quieter, I did not have to repeat information | |
| Too noisy | Quiet and respectful | |
| Quality | I would like a more organized format More information isn't needed, just the correct information in a timely manner | I felt that the amount of information shared was only what was pertinent and important |
| If I first had the opportunity to review ESL and any notes generated in the last 12 hours, this would improve report | Written information on the ESL assured that I didn't forget something important | |
| Less editorializing about events and less adrenaline | I liked having the progress notes generated overnight available for review | |
| Need only meaningful information | Excellent report with prompt dissemination of information |
Discussion
We describe an intervention that set the expectation for formal, structured written and verbal communication in a focused environment involving outgoing and incoming clinicians, resulting in improved satisfaction. Before the intervention, the improvement team identified by consensus 4 problems: unpredictable start time, inefficiency, environment, and report quality. Formal structuring of our handoff process resulted in statistically significant improvement in handoff timeliness and efficiency in the view of the HIM division members. Process improvement included precise team specific start times within a 12‐minute window to improve reliability and predictability and eliminating nonproductive waiting. Additionally, receiving teams were clearly identified with table cards so that no time was wasted locating the appropriate service for report, and minimizing role‐identification challenges. The good to go sign signaled teams that no events had occurred overnight requiring verbal report. Handoff timeliness persisted 3 months after the intervention, suggesting that the process is easily sustainable.
Postintervention survey comments noted the improved environment: a smaller, quieter room with the door closed. Before the intervention, all day team providers, CAs and night provider met in a large, loud room where multiple conversations were commonplace. Previous study of the handoff process supports creating an environment free of distraction.4
Postintervention survey responses to the open‐ended questions suggested improved provider satisfaction with the quality of the report. We believe this occurred for several reasons. First, having a precise start time for each team within a 12‐minute window led to a more focused report. Second, the ESL provided a column for providers to suggest plans of care for anticipated overnight events to improve preparedness and avoid significant omissions. Third, hospital notes generated overnight were made available which allowed daytime providers to review events before handoff, for a more informed update, or just after verbal report to reinforce the information just received, a technique used in other high‐reliability organizations.16 This measure also provided an at‐a‐glance view of each patient, decreasing the complexity of handoff.17
This study has important limitations. We address the handoff process of 1 hospitalist group at a single academic center. NP/PAs are the clinicians with first‐call responsibility for the night coverage of our patients, and the handoff process between the night NP/PA and daytime provider was studied. The handoff between physicians for patients admitted overnight was not assessed. Another limitation is that the time spent in handoff is reported as a participant estimate. There was no objective measurement of time, and respondents may have been biased. An additional limitation of our study concerns the preintervention and postintervention surveys. Both surveys were anonymous, which makes discerning the absolute impact of the intervention difficult due to the lack of paired responses. Lastly, our institution has an ESL. This option may not be available in other hospital systems.
Several deficiencies in the handoff process were addressed by providing key clinical data verbally and in written format, enhancing the physical environment, and defining each team's handoff start time. Our process improvements are consistent with the handoff recommendations endorsed by the Society of Hospital Medicine.12 Subsequent direct observation, subjective reports, and survey results demonstrated improvement in the handoff process.
Future studies might measure the effectiveness of morning handoff by end‐shift interviews of the daytime clinicians. Similarly, a study of evening handoff could measure the efficiency and effectiveness of report given by day teams to night‐coverage colleagues. Furthermore, if the handoff report skill set can be more rigorously defined and measured, a hospitalist clinical competency for hospitalists and NP/PAs could be developed in this core process‐of‐care.12
Acknowledgements
The authors thank Lisa Boucher for preparation of this manuscript.
- , , , et al.Lost in translation: challenges and opportunities in physician‐to‐physician communication during patient handoffs.Acad Med.2005;80:1094–1099.
- , , .Communication failures: an insidious contributor to medical mishaps.Acad Med.2004;79:186–194.
- , , .The human factor: the critical importance of effective teamwork and communication in providing safe care.Quality 13 Suppl 1:i85–90.
- , , , et al.Managing discontinuity in academic medical centers: strategies for a safe and effective resident sign‐out.J Hosp Med.2006;1:257–266.
- , , .Development and implementation of an oral sign‐out skills curriculum.J Gen Intern Med.2007;22:1470–1474.
- , , , et al.The top 10 list for a safe and effective sign‐out.Arch Surg2008;143(10):1008–1010.
- , , , et al.Residents' and attending physicians' handoffs: a systematic review of the literature.Acad Med.2009;84(12):1775–1787.
- , , , et al.A structured handoff program for interns.Acad Med.2009;84:347–352.
- , , , et al.Simple standardized patient handoff system that increases accuracy and completeness.J Surg.2008;65:476–485.
- , , , et al.A randomized, controlled trial evaluation the impact of a computerized rounding and sign‐out system on continuity of care and resident work hours.J Am Coll Surg.2005;200:538–545.
- , , , .Understanding communication during hospitalist service changes: A mixed methods study.J Hosp Med.2009;4(9):535–540.
- , , , , , .Hospitalist handoffs: a systematic review and task force recommendations.J of Hosp Med.2009;4(7):433–440.
- , , , et al.Implementation of a physician assistant/hospitalist service in an academic medical center: impact on efficiency and patient outcomes.J Hosp Med.2008;3:361–368.
- , .Basics of Qualitiative Research: Grounded Theory Procedures and Techniques.Sage Publications, Inc.Newbury Park, CA.1990.
- , .Naturalistic Inquiry.Sage Publications, Inc.Newbury Park, CA.1985.
- .Communication strategies from high‐reliability organizations.Ann Surg.2007;245(2):170–172.
- , , , et al.Handoff strategies in settings with high consequences for failure: lessons for health care operations.Int J Qual Health Care.2004;16(2):125.