User login
I-MOVE: Inpatient Pre-Discharge Mobility Score As a Predictor of Post-Discharge Mortality
From the Mayo Clinic Center for Innovation (Dr. Romero-Brufau) Department of Medicine (Drs. Manning, Borrud, Keller, Kashiwagi, Huddleston, and Croghan) Department of Health Sciences Research (Mr. Cha), Mayo Clinic, Rochester, MN.
Abstract
- Objective: To determine whether a score of 8 or greater on the I-MOVE, a bedside instrument that evaluates the need for assistance in turning, sitting, standing, transferring from bed to a chair, and ambulating, predicts lower risk for 30-day readmission or mortality.
- Design: Retrospective cohort study of patients discharged from 2003 to 2011 from a referral hospital in Southeastern Minnesota. We used a convenience sample of 426 inpatients who had at least one documented calculation of the I-MOVE score performed as part of the clinical process during the study.
- Results: Overall 30-day mortality rate, readmission rate, and rate of the combined death/readmission outcome were 6.1% (26 patients), 15% (64 patients) and 19.7% (84 patients), respectively. After controlling for confounding variables, an I-MOVE score ≥ 8 was a significant predictive factor for 30-day mortality (OR = 0.136, P < 0.01) but not 30-day readmission (OR = 1.143, P = 0.62) or the combined outcome death/readmission (OR = 0.682, P = 0.13).
- Conclusion: The clinical information provided by a patient's I-MOVE score before discharge does not provide information about readmission risk but may offer incremental information about 30-day mortality risk.
Risk factors for hospital 30-day readmission have been studied by Hasan et al [1], van Walraven et al [2], Allaudeen et al [3], and more recently, Donze et al [4]. Risk factors found to be associated with readmission include race, length of stay, and number of hospitalizations in the last 12 months. Additionally, patients identified “feeling unprepared for discharge” and “difficulty performing activities of daily living” as top issues contributing to readmission. The Affordable Care Act established the Value-Based Purchasing (VBP) model for defined hospital illnesses such as acute myocardial infarction, heart failure, and community acquired pneumonia. This has focused more attention on post-discharge 30-day mortality and readmissions as publicly reported metrics that in part determine the Centers for Medicare and Medicaid Services care reimbursement rates [5].
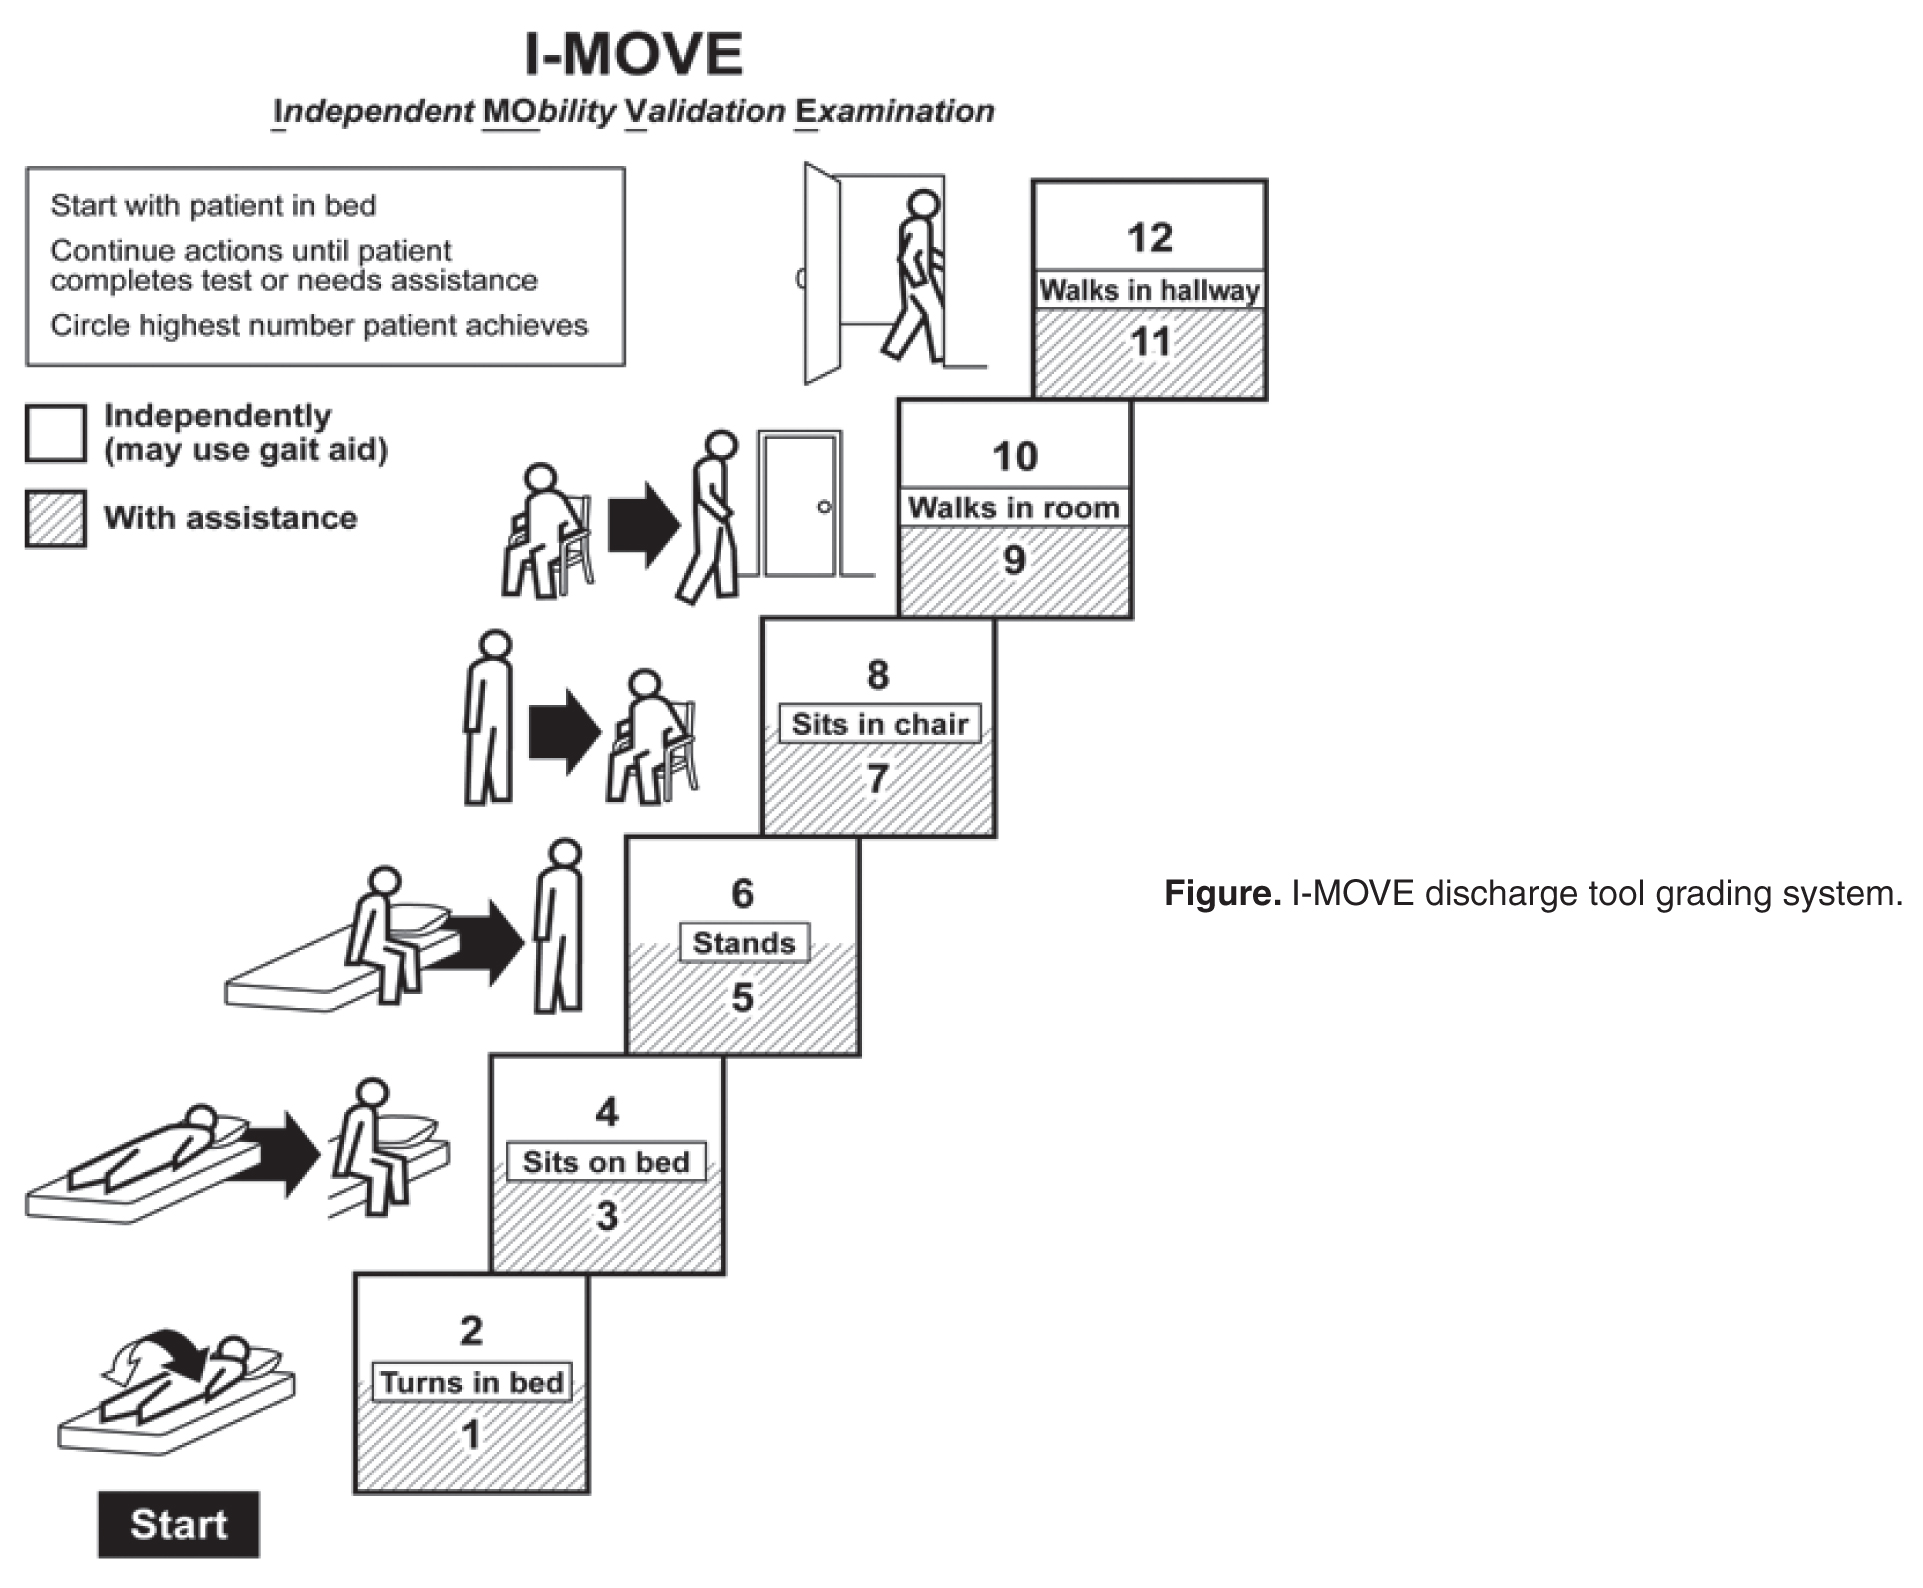
In our hospital, over 400 inpatients have been evaluated since 2004 using the I-MOVE scoring system in the course of their usual care. I-MOVE was most commonly employed by geriatricians in the division of hospital internal medicine, who collectively endorsed the tool in their practice meetings, especially for elderly patients returning to home alone whose mobility independence was uncertain.
Although it was initially designed to help clinicians understand the mobility independence of a patient before discharge, it may provide incremental value discerning risk of 30-day readmission and/or death. We therefore hypothesized that an I-MOVE score of less than 8 (not being able to transfer from a bed to a chair without assistance) would be a significant predictor of 30-day readmission and/or death.
Methods
Study Design
We performed a retrospective cohort study using a convenience sample including the patients in which the I-MOVE score had been calculated as part of the clinical process of care.
Setting and Participants
Participants were any inpatients discharged from the general medicine unit at Mayo Clinic Rochester from January 2003 to May 2011 who had at least one documented calculation of the I-MOVE score performed as part of the clinical process. Patients in the general medicine unit are adults not requiring subspecialty cardiovascular or neurology, coronary care unit, surgical, psychiatry, or rehabilitation. Patients were excluded if there was missing key outcome information or if they died during the hospitalization. For patients with more than one I-MOVE assessment, only the one closest to discharge was used. Data were abstracted from the electronic medical records between July and August 2011.
Variables
Outcome variables were 30-day readmission, 30-day mortality, and the combined outcome of mortality or readmission. We used the last I-MOVE score as a dichotomous variable with a cut-off of 8, which corresponds to the ability to transfer from bed to a chair unaided, for predicting the 2 outcomes. Only readmissions to the study hospital were captured. Deaths were identified from the electronic medical record. Mayo Clinic patient records are updated monthly with external reports of confirmed, actuarial records of deaths reported from public databases.
To control for possible confounding variables, we included the following covariates: age, gender, race/ethnicity, dates of admission and discharge, insurance (Medicare, Medicaid, self-pay, or private), marital status (currently married/not currently married), length of hospital stay, emergent admission, number of hospital admissions in the last 12 months, number of visits to the emergency department in the last 6 months and Charlson Index. All variables were abstracted from the electronic medical record.
Sample
A search was performed in the electronic medical record to find clinical documents (admission notes, progress notes, and hospital summaries) that mentioned the term “I-MOVE.” Manual review of the records was performed to confirm inclusion criteria.
Statistical Analysis
Separate analyses were performed for the 2 outcomes considered. First, a univariate analysis was performed with all covariates for variable selection. Variables that were significantly predictive with P < 0.1 were included in the multivariate model. Variables included in the first run of the multivariate model were excluded from the final multivariate model if they were not independently significant with P < 0.05. The I-MOVE variable was then added to that model to check its predictive power beyond that of the included covariates.
Results
Patient Characteristics
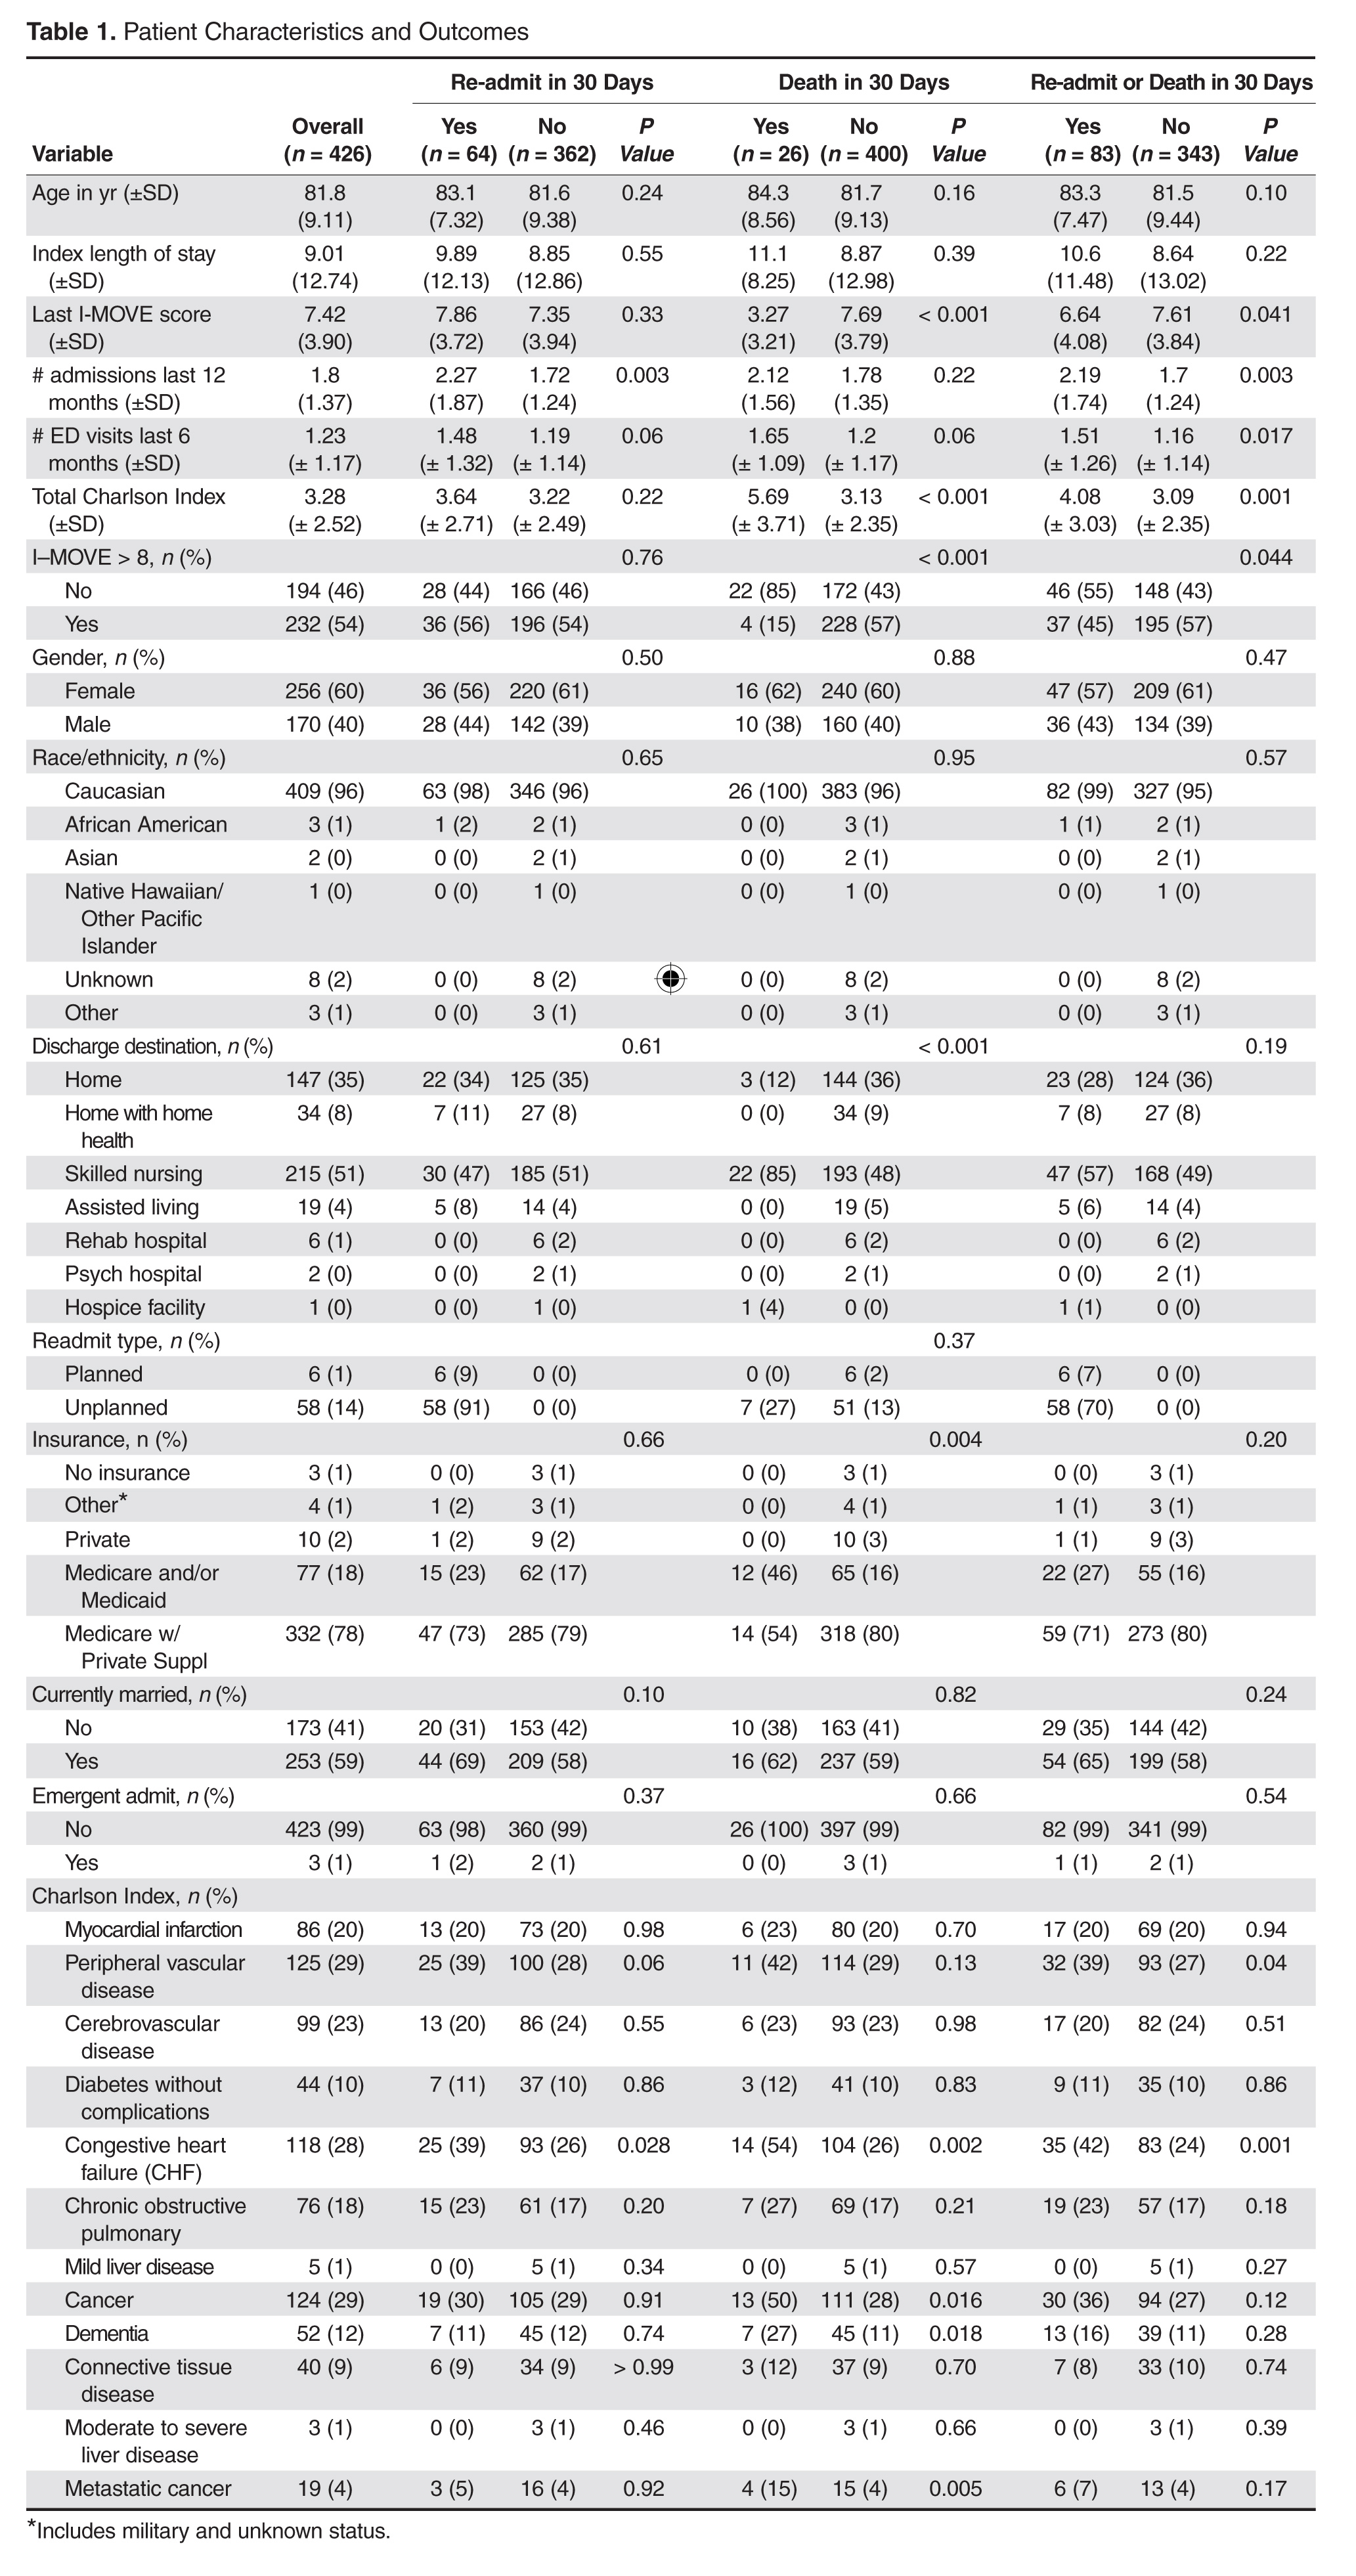
For the final dataset of 426 patients, 30-day mortality rate, readmission rate, and rate of the combined death/readmission outcome were 6.1% (26 patients), 15% (64 patients) and 19.7% (84 patients), respectively. A total of 6 patients were readmitted and died within 30 days after the initial discharge. The number of patients that had an I-MOVE score greater than or equal to 8 was 232 (54.4%). Table 2 presents the mean, standard deviation, and median I-MOVE score by patient discharge destination. Patients discharged home had an average I-MOVE score of 11.98, versus 7.24 for patients discharge to a skilled nursing facility (P = 0.2).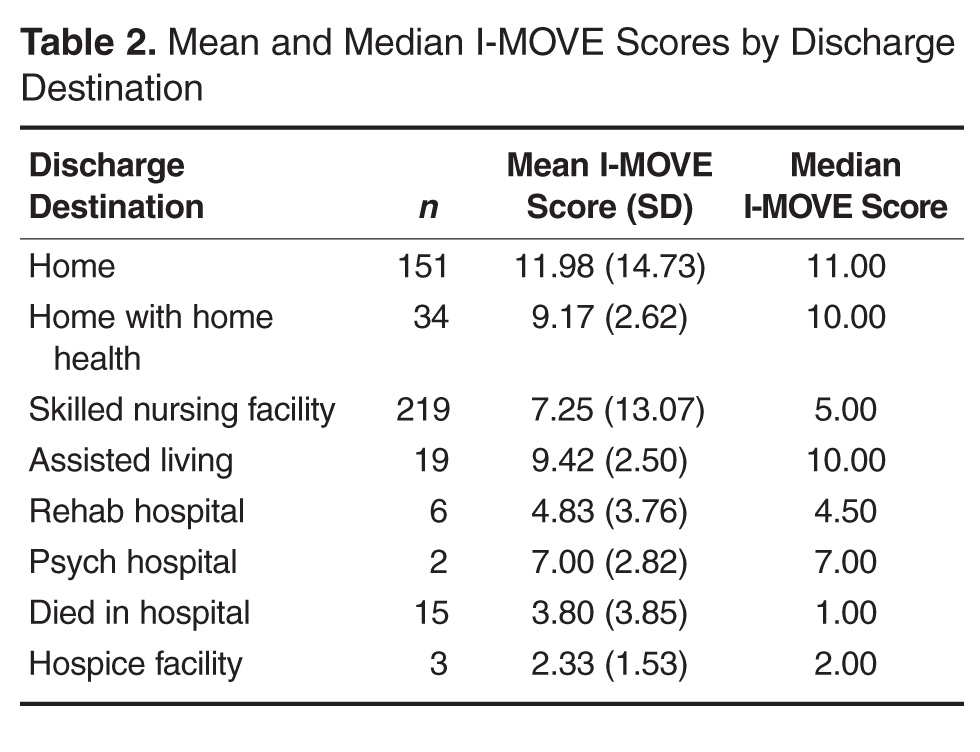
Analysis
Table 3 presents the odds ratios and coefficient estimate of the models. In the univariate analysis, an I-MOVE score greater than or equal to 8 was significantly correlated with 30-day mortality (P < 0.001), and the combined outcome (P = 0.044) but not with 30-day readmission (P = 0.76). After controlling for confounding variables, I-MOVE greater than or equal to 8 was a significant predictor of 30-day mortality (P < 0.01) but not 30-day readmission (P = 0.75) 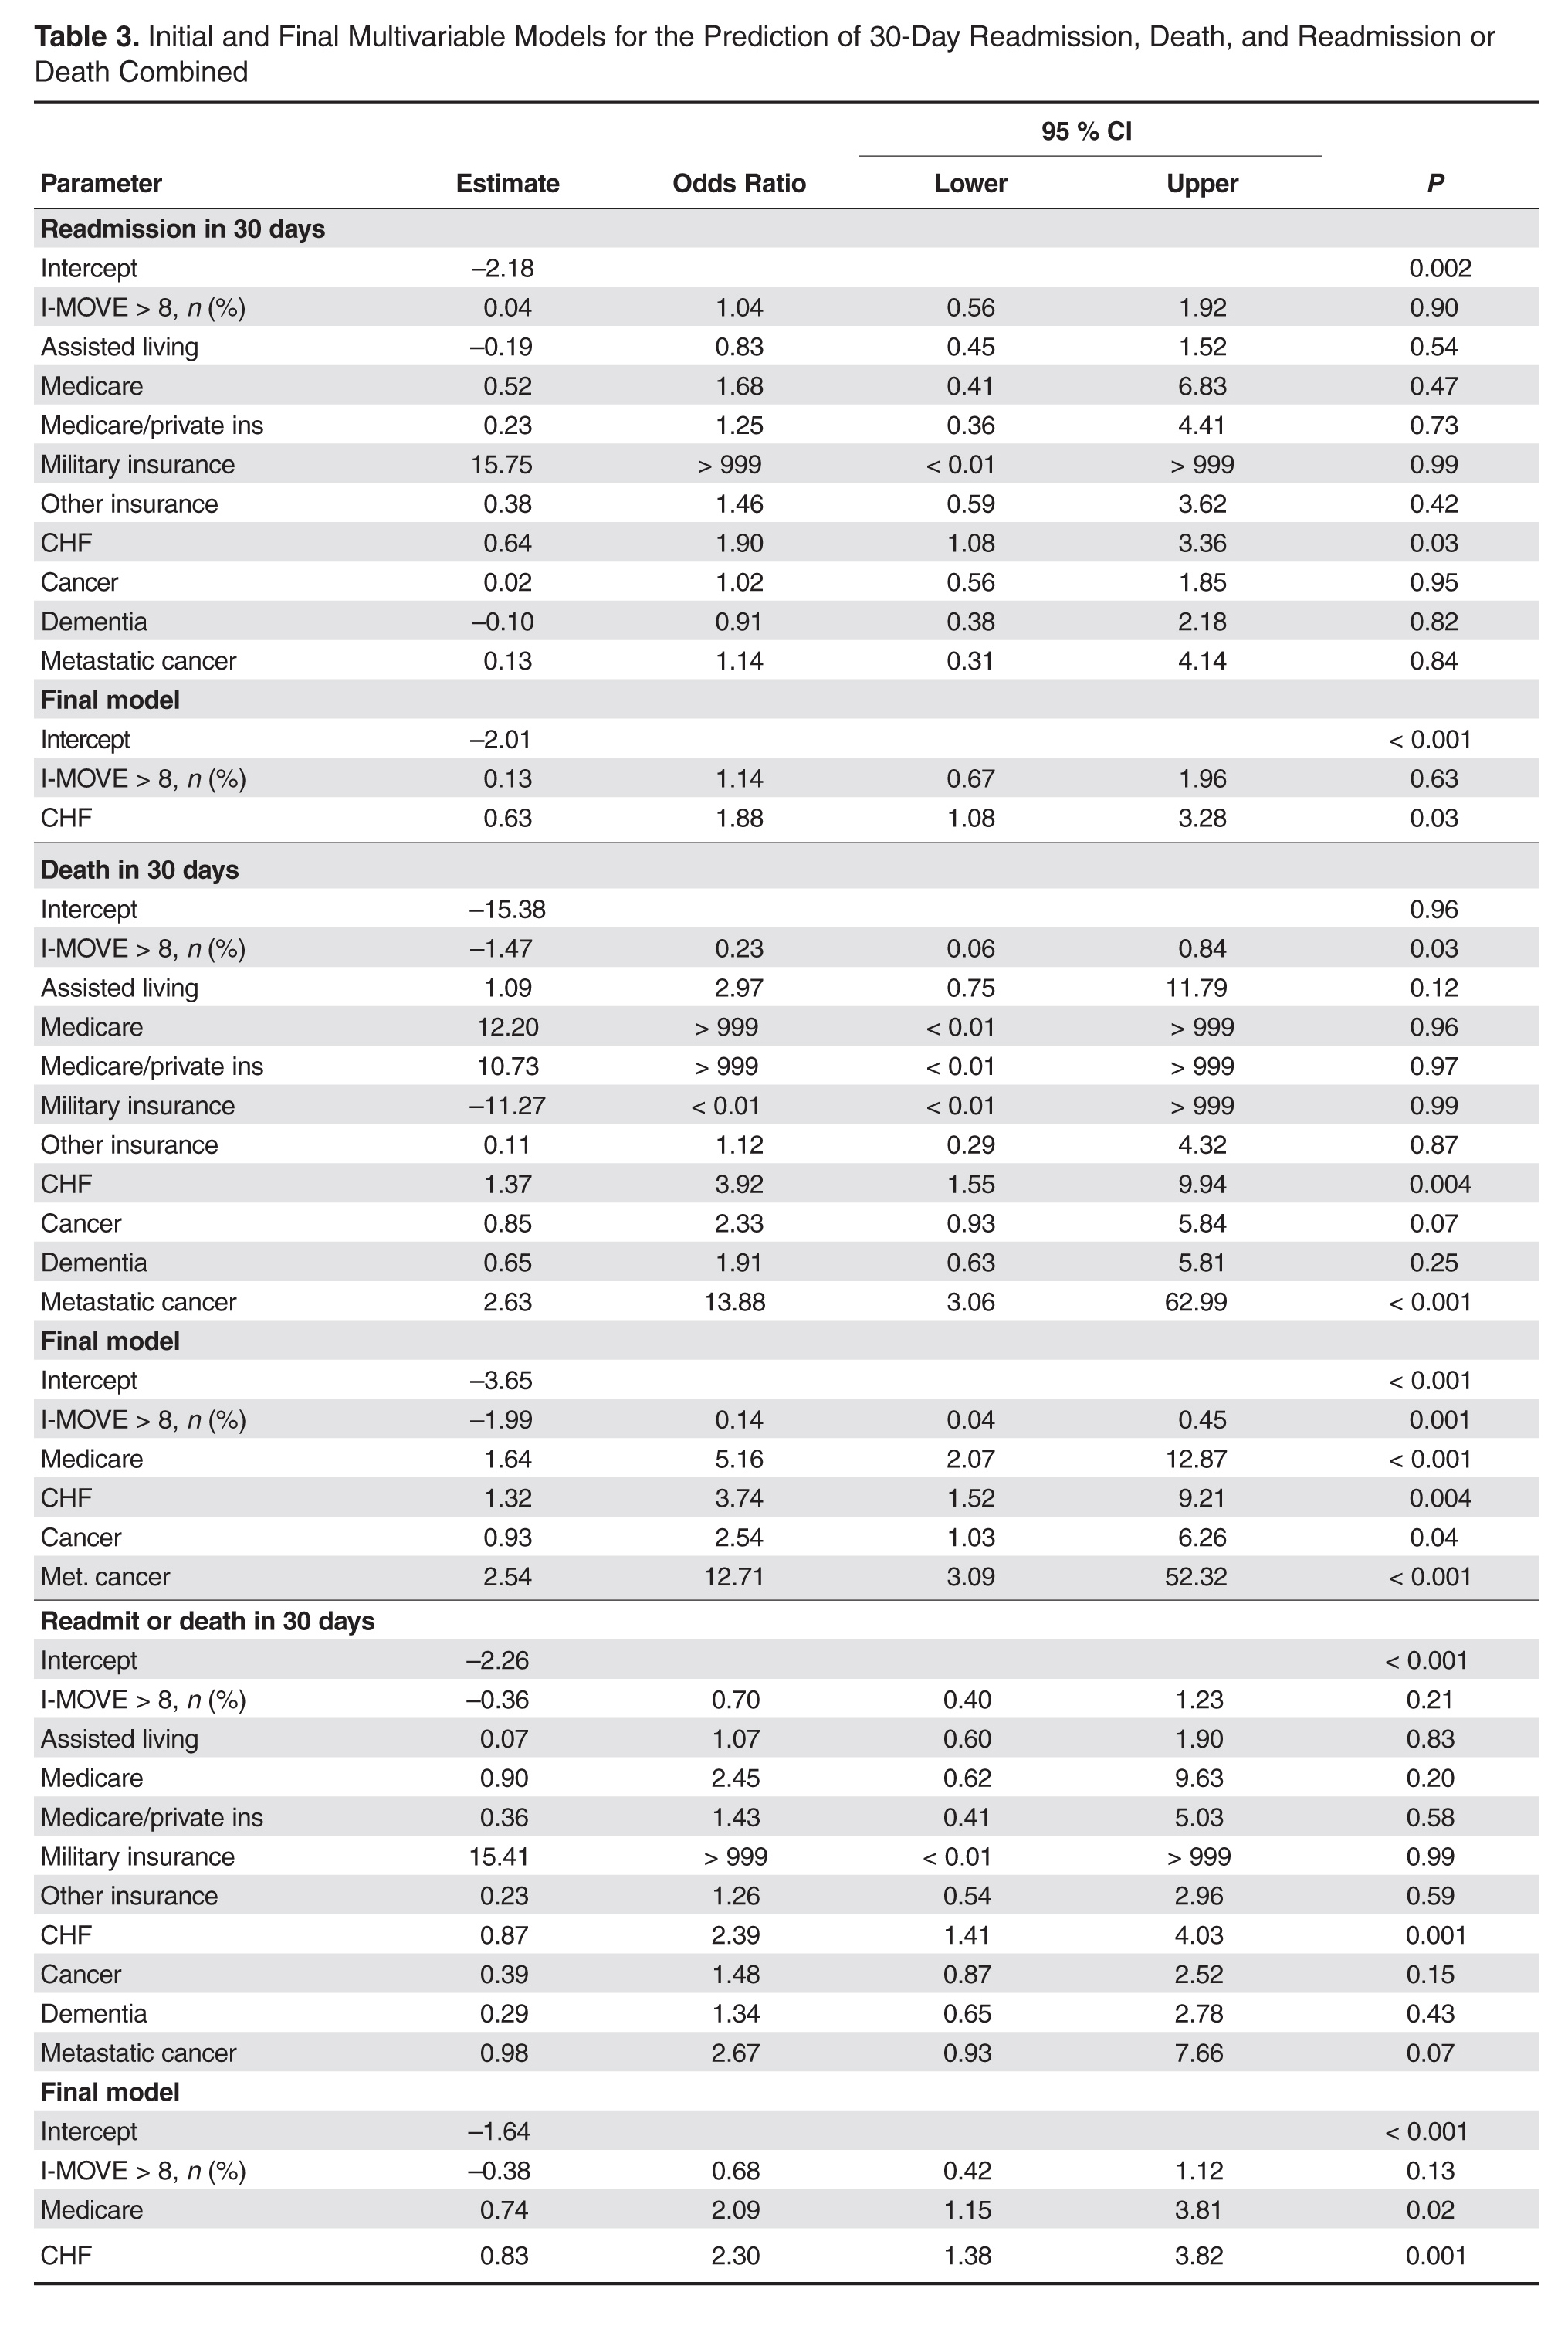
Discussion
An I-MOVE score of less than 8 (inability to transfer from bed to a chair unassisted) is a statistically significant predictor of 30-day post-discharge mortality but not readmission or the combined outcome of death/readmission.
A recent review that evaluated published models that attempted to predict readmissions concluded that most current readmission risk prediction models designed for either comparative or clinical purposes perform poorly and that efforts are needed to improve their performance as use becomes more widespread [8]. Health care providers’ ability to predict which patients would be readmitted within 30 days was also shown by a recent study to be very poor, with C-statistics around 0.60 [9]. This inability of both experts and statistical methods to accurately predict readmissions may reflect some inherent randomness or unpredictability of readmissions, or the fact that a paradigm shift is still needed in the identification of the most important risk factors for readmissions. Along the same line, a recent evaluation of interventions aimed at reducing readmissions found that none of those identified in the literature managed to consistently reduce readmission rates long-term [10]. In addition, hospitals with greater adherence to recommended care processes did not achieve meaningfully better 30-day hospital readmission rates compared to those with lower levels of performance.
Conceptually, readmissions are an example of what is called “complexity science,” where many agents or factors (including the patient’s underlying illness, quality of care delivered, continuity and coordination of care, and resources available in the patient’s environment) and their interactions all play a role in the outcome [11,12]. Since I-MOVE primarily evaluates the physical capacity of the patient, and not any of the other variables that strongly affect readmission, it is perhaps not surprising that it did not predict readmission. It can be argued, on the other hand, that short term (30-day) mortality is more dependent on the patient’s physical and functional status [13] and so more likely to correlate with a measure such as I-MOVE. Inouye et al [13] found that pre-hospital, self-reported need for assistance in 7 basic “activities of daily living” (among which are transfers and ambulation) correlated with 90-day, and 2-year, post-hospital mortality.
The study has the advantage of a relatively large sample size, and the fact that the I-MOVE score was assessed before discharge eliminates the possibility of assessor bias. However, it has some limitations. We used a convenience sample, which may have introduced selection bias. Although we have no data on how providers selected patients for I-MOVE assessment, it would be reasonable to assume that patients were selected from among those whose activity level was, in terms of independence, doubtful or uncertain. That is, those who were not clearly vigorous (up and walking easily), nor clearly debilitated (in need of great assistance) may have been more likely to be assessed using I-MOVE. A more systematic selection of subjects might increase or decrease the predictive performance of the I-MOVE assessment. In addition, although we attempted to control for potential confounders, it is possible that additional confounders were left out of our analysis.
In summary, although the predictive performance of I-MOVE still needs to be confirmed by prospective studies with a comprehensive selection of subjects, the I-MOVE score at discharge appears to be associated with 30-day post-discharge mortality.
Acknowledgments: We thank the Department of Medicine’s clinical research office for their help in study design, data acquisition, and statistical analysis.
Corresponding author: Santiago Romero-Brufau, MD, Mayo Clinic Center for Innovation, 200 First St. SW, Rochester, MN 55905, romerobrufau.santiago@mayo.edu.
Funding/support: This publication was supported by grant number UL1 TR000135 from the National Center for Advancing Translational Sciences (NCATS). Its contents are solely the responsibility of the authors and do not necessarily represent the official views of the NIH.
1. Hasan O, Meltzer DO, Shaykevich SA, et al. Hospital readmission in general medicine patients: a prediction model.
J Gen Intern Med 2010;25:211–9.
2. van Walraven C, Dhalla IA, Bell C, et al. Derivation and validation of an index to predict early death or unplanned readmission after discharge from hospital to the community. CMAJ 2010;182:551–7.
3. Allaudeen N, Vidyarthi A, Maselli J, Auerbach A. Redefining readmission risk factors for general medicine patients. J Hosp Med 2011;6:54–60.
4. Donze J, Aujesky D, Williams D, Schnipper JL. Potentially avoidable 30-day hospital readmissions in medical patients: derivation and validation of a prediction model. JAMA Intern Med 2013;173:632–8.
5. Kocher RP, Adashi EY. Hospital readmissions and the Affordable Care Act: paying for coordinated quality care. JAMA 2011;306:1794–5.
6. Manning DM, Keller AS, Frank DL. Home alone: assessing mobility independence before discharge. J Hosp Med 2009;4:252–4.
7. Cook DJ, Manning DM, Holland DE, et al. Patient engagement and reported outcomes in surgical recovery: effectiveness of an e-health platform. J Am Coll Surg 2013;217:648–55.
8. Kansagara D, Englander H, Salanitro A, et al. Risk prediction models for hospital readmission: a systematic review. JAMA 2011;306:1688–98.
9. Allaudeen N, Schnipper JL, Orav EJ, et al. Inability of providers to predict unplanned readmissions. J Gen Intern Med 2011;26:771–6.
10. Hansen LO, Young RS, Hinami K, et al. Interventions to reduce 30-day rehospitalization: a systematic review. Ann Intern Med 2011;155:520–8.
11. Marks E. Complexity science and the readmission dilemma. JAMA Intern Med 2013;173:629–31.
12. Lindquist LA, Baker DW. Understanding preventable hospital readmissions: masqueraders, markers, and true causal factors. J Hosp Med 2011;6:51–3.
13. Inouye SK, Peduzzi PN, Robison JT, et al. Importance of functional measures in predicting mortality among older hospitalized patients. JAMA 1998;279:1187–93.
From the Mayo Clinic Center for Innovation (Dr. Romero-Brufau) Department of Medicine (Drs. Manning, Borrud, Keller, Kashiwagi, Huddleston, and Croghan) Department of Health Sciences Research (Mr. Cha), Mayo Clinic, Rochester, MN.
Abstract
- Objective: To determine whether a score of 8 or greater on the I-MOVE, a bedside instrument that evaluates the need for assistance in turning, sitting, standing, transferring from bed to a chair, and ambulating, predicts lower risk for 30-day readmission or mortality.
- Design: Retrospective cohort study of patients discharged from 2003 to 2011 from a referral hospital in Southeastern Minnesota. We used a convenience sample of 426 inpatients who had at least one documented calculation of the I-MOVE score performed as part of the clinical process during the study.
- Results: Overall 30-day mortality rate, readmission rate, and rate of the combined death/readmission outcome were 6.1% (26 patients), 15% (64 patients) and 19.7% (84 patients), respectively. After controlling for confounding variables, an I-MOVE score ≥ 8 was a significant predictive factor for 30-day mortality (OR = 0.136, P < 0.01) but not 30-day readmission (OR = 1.143, P = 0.62) or the combined outcome death/readmission (OR = 0.682, P = 0.13).
- Conclusion: The clinical information provided by a patient's I-MOVE score before discharge does not provide information about readmission risk but may offer incremental information about 30-day mortality risk.
Risk factors for hospital 30-day readmission have been studied by Hasan et al [1], van Walraven et al [2], Allaudeen et al [3], and more recently, Donze et al [4]. Risk factors found to be associated with readmission include race, length of stay, and number of hospitalizations in the last 12 months. Additionally, patients identified “feeling unprepared for discharge” and “difficulty performing activities of daily living” as top issues contributing to readmission. The Affordable Care Act established the Value-Based Purchasing (VBP) model for defined hospital illnesses such as acute myocardial infarction, heart failure, and community acquired pneumonia. This has focused more attention on post-discharge 30-day mortality and readmissions as publicly reported metrics that in part determine the Centers for Medicare and Medicaid Services care reimbursement rates [5].
In our hospital, over 400 inpatients have been evaluated since 2004 using the I-MOVE scoring system in the course of their usual care. I-MOVE was most commonly employed by geriatricians in the division of hospital internal medicine, who collectively endorsed the tool in their practice meetings, especially for elderly patients returning to home alone whose mobility independence was uncertain.
Although it was initially designed to help clinicians understand the mobility independence of a patient before discharge, it may provide incremental value discerning risk of 30-day readmission and/or death. We therefore hypothesized that an I-MOVE score of less than 8 (not being able to transfer from a bed to a chair without assistance) would be a significant predictor of 30-day readmission and/or death.
Methods
Study Design
We performed a retrospective cohort study using a convenience sample including the patients in which the I-MOVE score had been calculated as part of the clinical process of care.
Setting and Participants
Participants were any inpatients discharged from the general medicine unit at Mayo Clinic Rochester from January 2003 to May 2011 who had at least one documented calculation of the I-MOVE score performed as part of the clinical process. Patients in the general medicine unit are adults not requiring subspecialty cardiovascular or neurology, coronary care unit, surgical, psychiatry, or rehabilitation. Patients were excluded if there was missing key outcome information or if they died during the hospitalization. For patients with more than one I-MOVE assessment, only the one closest to discharge was used. Data were abstracted from the electronic medical records between July and August 2011.
Variables
Outcome variables were 30-day readmission, 30-day mortality, and the combined outcome of mortality or readmission. We used the last I-MOVE score as a dichotomous variable with a cut-off of 8, which corresponds to the ability to transfer from bed to a chair unaided, for predicting the 2 outcomes. Only readmissions to the study hospital were captured. Deaths were identified from the electronic medical record. Mayo Clinic patient records are updated monthly with external reports of confirmed, actuarial records of deaths reported from public databases.
To control for possible confounding variables, we included the following covariates: age, gender, race/ethnicity, dates of admission and discharge, insurance (Medicare, Medicaid, self-pay, or private), marital status (currently married/not currently married), length of hospital stay, emergent admission, number of hospital admissions in the last 12 months, number of visits to the emergency department in the last 6 months and Charlson Index. All variables were abstracted from the electronic medical record.
Sample
A search was performed in the electronic medical record to find clinical documents (admission notes, progress notes, and hospital summaries) that mentioned the term “I-MOVE.” Manual review of the records was performed to confirm inclusion criteria.
Statistical Analysis
Separate analyses were performed for the 2 outcomes considered. First, a univariate analysis was performed with all covariates for variable selection. Variables that were significantly predictive with P < 0.1 were included in the multivariate model. Variables included in the first run of the multivariate model were excluded from the final multivariate model if they were not independently significant with P < 0.05. The I-MOVE variable was then added to that model to check its predictive power beyond that of the included covariates.
Results
Patient Characteristics
For the final dataset of 426 patients, 30-day mortality rate, readmission rate, and rate of the combined death/readmission outcome were 6.1% (26 patients), 15% (64 patients) and 19.7% (84 patients), respectively. A total of 6 patients were readmitted and died within 30 days after the initial discharge. The number of patients that had an I-MOVE score greater than or equal to 8 was 232 (54.4%). Table 2 presents the mean, standard deviation, and median I-MOVE score by patient discharge destination. Patients discharged home had an average I-MOVE score of 11.98, versus 7.24 for patients discharge to a skilled nursing facility (P = 0.2).
Analysis
Table 3 presents the odds ratios and coefficient estimate of the models. In the univariate analysis, an I-MOVE score greater than or equal to 8 was significantly correlated with 30-day mortality (P < 0.001), and the combined outcome (P = 0.044) but not with 30-day readmission (P = 0.76). After controlling for confounding variables, I-MOVE greater than or equal to 8 was a significant predictor of 30-day mortality (P < 0.01) but not 30-day readmission (P = 0.75)
Discussion
An I-MOVE score of less than 8 (inability to transfer from bed to a chair unassisted) is a statistically significant predictor of 30-day post-discharge mortality but not readmission or the combined outcome of death/readmission.
A recent review that evaluated published models that attempted to predict readmissions concluded that most current readmission risk prediction models designed for either comparative or clinical purposes perform poorly and that efforts are needed to improve their performance as use becomes more widespread [8]. Health care providers’ ability to predict which patients would be readmitted within 30 days was also shown by a recent study to be very poor, with C-statistics around 0.60 [9]. This inability of both experts and statistical methods to accurately predict readmissions may reflect some inherent randomness or unpredictability of readmissions, or the fact that a paradigm shift is still needed in the identification of the most important risk factors for readmissions. Along the same line, a recent evaluation of interventions aimed at reducing readmissions found that none of those identified in the literature managed to consistently reduce readmission rates long-term [10]. In addition, hospitals with greater adherence to recommended care processes did not achieve meaningfully better 30-day hospital readmission rates compared to those with lower levels of performance.
Conceptually, readmissions are an example of what is called “complexity science,” where many agents or factors (including the patient’s underlying illness, quality of care delivered, continuity and coordination of care, and resources available in the patient’s environment) and their interactions all play a role in the outcome [11,12]. Since I-MOVE primarily evaluates the physical capacity of the patient, and not any of the other variables that strongly affect readmission, it is perhaps not surprising that it did not predict readmission. It can be argued, on the other hand, that short term (30-day) mortality is more dependent on the patient’s physical and functional status [13] and so more likely to correlate with a measure such as I-MOVE. Inouye et al [13] found that pre-hospital, self-reported need for assistance in 7 basic “activities of daily living” (among which are transfers and ambulation) correlated with 90-day, and 2-year, post-hospital mortality.
The study has the advantage of a relatively large sample size, and the fact that the I-MOVE score was assessed before discharge eliminates the possibility of assessor bias. However, it has some limitations. We used a convenience sample, which may have introduced selection bias. Although we have no data on how providers selected patients for I-MOVE assessment, it would be reasonable to assume that patients were selected from among those whose activity level was, in terms of independence, doubtful or uncertain. That is, those who were not clearly vigorous (up and walking easily), nor clearly debilitated (in need of great assistance) may have been more likely to be assessed using I-MOVE. A more systematic selection of subjects might increase or decrease the predictive performance of the I-MOVE assessment. In addition, although we attempted to control for potential confounders, it is possible that additional confounders were left out of our analysis.
In summary, although the predictive performance of I-MOVE still needs to be confirmed by prospective studies with a comprehensive selection of subjects, the I-MOVE score at discharge appears to be associated with 30-day post-discharge mortality.
Acknowledgments: We thank the Department of Medicine’s clinical research office for their help in study design, data acquisition, and statistical analysis.
Corresponding author: Santiago Romero-Brufau, MD, Mayo Clinic Center for Innovation, 200 First St. SW, Rochester, MN 55905, romerobrufau.santiago@mayo.edu.
Funding/support: This publication was supported by grant number UL1 TR000135 from the National Center for Advancing Translational Sciences (NCATS). Its contents are solely the responsibility of the authors and do not necessarily represent the official views of the NIH.
1. Hasan O, Meltzer DO, Shaykevich SA, et al. Hospital readmission in general medicine patients: a prediction model.
J Gen Intern Med 2010;25:211–9.
2. van Walraven C, Dhalla IA, Bell C, et al. Derivation and validation of an index to predict early death or unplanned readmission after discharge from hospital to the community. CMAJ 2010;182:551–7.
3. Allaudeen N, Vidyarthi A, Maselli J, Auerbach A. Redefining readmission risk factors for general medicine patients. J Hosp Med 2011;6:54–60.
4. Donze J, Aujesky D, Williams D, Schnipper JL. Potentially avoidable 30-day hospital readmissions in medical patients: derivation and validation of a prediction model. JAMA Intern Med 2013;173:632–8.
5. Kocher RP, Adashi EY. Hospital readmissions and the Affordable Care Act: paying for coordinated quality care. JAMA 2011;306:1794–5.
6. Manning DM, Keller AS, Frank DL. Home alone: assessing mobility independence before discharge. J Hosp Med 2009;4:252–4.
7. Cook DJ, Manning DM, Holland DE, et al. Patient engagement and reported outcomes in surgical recovery: effectiveness of an e-health platform. J Am Coll Surg 2013;217:648–55.
8. Kansagara D, Englander H, Salanitro A, et al. Risk prediction models for hospital readmission: a systematic review. JAMA 2011;306:1688–98.
9. Allaudeen N, Schnipper JL, Orav EJ, et al. Inability of providers to predict unplanned readmissions. J Gen Intern Med 2011;26:771–6.
10. Hansen LO, Young RS, Hinami K, et al. Interventions to reduce 30-day rehospitalization: a systematic review. Ann Intern Med 2011;155:520–8.
11. Marks E. Complexity science and the readmission dilemma. JAMA Intern Med 2013;173:629–31.
12. Lindquist LA, Baker DW. Understanding preventable hospital readmissions: masqueraders, markers, and true causal factors. J Hosp Med 2011;6:51–3.
13. Inouye SK, Peduzzi PN, Robison JT, et al. Importance of functional measures in predicting mortality among older hospitalized patients. JAMA 1998;279:1187–93.
The $64,000 Question/
A 40‐year‐old Sudanese man was admitted due to worsening abdominal pain with recurrent ascites. He had a history of hepatitis B (HBV) infection and diabetes. He previously drank 3 beers per day on the weekends, but he had not consumed alcohol in over a year. He was born in Sudan but lived in Egypt most of his adult life; he immigrated to the United States 6 years previously. He was hospitalized out of state 9 months ago for a swollen abdomen and underwent an exploratory laparotomy that reportedly was unremarkable except for ascites.
Portal hypertension due to liver disease is the most common cause of ascites. This patient has a known risk factor for liver disease (history of HBV infection). Although his reported alcohol consumption is low, there is a synergistic effect on liver injury in the setting of chronic hepatitis. Abdominal pain in the setting of ascites needs to be urgently evaluated to exclude spontaneous bacterial peritonitis (SBP). Also, because chronic HBV infection is the major risk factor for hepatocellular carcinoma in the world, malignant ascites is in the differential. Hepatic vascular thrombosis and tuberculous peritonitis (given the patient's country of origin and travel history) also should be considered. The most appropriate initial test would be a diagnostic paracentesis to support or exclude the presence of SBP and direct the evaluation toward liver disease or other less‐common causes of ascites.
The patient was seen as an outpatient 5 months prior to admission with transient fever and joint pains. Laboratory studies at that visit were notable for a serum albumin of 3.2 g/dL (normal 3.55), 2.4 g of predicted 24‐hour protein on urinalysis (normal <30 mg per 24 hours), creatinine of 0.5 mg/dL (normal 0.81.3), and a positive hepatitis B surface antibody. The working diagnosis was a nonspecific viral syndrome and his symptoms resolved without treatment. One month later, he developed ascites and mild lower extremity edema. Additional laboratory studies at that time showed a normocytic anemia with hemoglobin 11.7 g/dL (normal 13.517.5) and leukopenia with white blood cell count of 2.4 109/L (normal 3.510.5), neutrophil count of 1.45 109/L (normal 1.77.0), and lymphocyte count of 0.58 109/L (normal 0.902.90). Transaminases, serum bilirubin, prothrombin time, alpha fetoprotein, and peripheral blood smear were normal. Human immunodeficiency virus antibody screen and QuantiFERON‐TB assay were negative. Hemoglobin A1c was 6.2% (normal 4.06.0). Repeat urinalysis demonstrated 883 mg of predicted 24‐hour protein. Computed tomography (CT) of the abdomen showed a large amount of intra‐abdominal ascites; the liver and spleen were normal, and there were no varices or other evidence of portal hypertension. Echocardiogram was normal except for a small inferior vena cava (IVC) and a mildly increased right ventricular systolic pressure of 32 mm Hg (systolic blood pressure 98 mm Hg). Due to the indeterminate cause for the patient's ascites, referral was made for gastroenterology evaluation with consideration for a paracentesis.
Cirrhotic ascites seems less likely. Postsinusoidal causes of portal hypertension (eg, cardiomyopathy) are also less likely given the absence of suggestive findings on echocardiography. Malignant ascites also appears less probable in the absence of suggestive findings such as mass lesions, lymphadenopathy, or peritoneal carcinomatosis on CT imaging. The suspicion for tuberculous peritonitis is lower with the negative QuantiFERON‐TB test. Hypoalbuminemia, normocytic anemia, leukopenia, and proteinuria all suggest a systemic inflammatory condition (eg, systemic lupus erythematosus [SLE]) with inflammatory serositis causing ascites). Nephrotic syndrome can cause hypoalbuminemia, edema, and ascites, but his total urine protein losses of <3.5 grams per 24 hours are not in keeping with this diagnosis. Other uncommon causes of ascites such as chylous ascites have not yet been excluded. The most appropriate next step remains ascitic fluid analysis.
A paracentesis yielded 7.8 L of clear‐yellow fluid and improvement in his abdominal discomfort. Analysis showed 224 total nucleated cells/L with 2% neutrophils, 57% lymphocytes, and 37% monocytes. Ascites total protein was 3.8 g/dL and glucose was 55 mg/dL. Gram stain and culture were negative, and cytology was negative for malignancy but showed lymphocytes, plasma cells, monocytes, and reactive mesothelial cells interpreted as consistent with chronic inflammation. The serum‐ascites albumin gradient (SAAG) was not obtained.
With a low leukocyte count and a paucity of neutrophils, this is not SBP. The ascites fluid did not have a chylous appearance. The SAAG, which can distinguish between portal hypertensive and nonportal hypertensive causes for ascites using a cutoff of 1.1 g/dL, was not done. The total protein was high, arguing against cirrhosis. High protein ascites with a high SAAG would suggest a posthepatic source of portal hypertension (eg, Budd‐Chiari syndrome, constrictive pericarditis). High protein ascites with a low SAAG would suggest an inflammatory or malignant source of ascites. The relative lymphocytosis in the ascites fluid suggests an inflammatory process, but is a nonspecific finding. The negative cytology does not completely exclude a malignancy, but given the absence of findings on the CT, malignant ascites is less likely.
Three months before admission, the patient underwent a repeat large‐volume paracentesis and a liver biopsy. The biopsy showed ectopic portal vein branches consistent with hepatoportal sclerosis, but no actual sclerosis was identified. The pathologist concluded that the findings suggested noncirrhotic portal hypertension due to a vascular in‐flow abnormality. Abdominal ultrasound with Doppler was unremarkable other than slightly increased echogenicity of the liver. Magnetic resonance (MR) angiogram showed narrowing of the intra‐abdominal IVC at the level of the diaphragm. Because of concern that hepatic congestion from high pressures in the narrowed IVC was leading to poor vascular inflow as suggested by the biopsy findings, an inferior vena cavagram was performed. This study was normal, although no transhepatic pressure measurements were obtained. Three stool specimens and 2 urine specimens were negative for parasites. The patient required repeat large‐volume paracenteses monthly. SBP was again ruled out, but no other diagnostic labs were obtained. He had anorexia with poor oral intake each time his abdomen became distended.
The patient was started on furosemide 1 month prior to admission to the hospital but had only a slight improvement in the ascites. His other medications included insulin, tamsulosin, and hydrocodone‐acetaminophen. Five days prior to admission, he underwent a diagnostic laparoscopy, which showed only ascites and small adhesions to the anterior abdominal wall. There was no visual evidence of malignancy, and the surgeon commented that the liver was normal. No additional biopsies were obtained.
The liver biopsy findings could be seen in noncirrhotic portal hypertension, although this diagnosis would be unlikely without splenomegaly, varices, or other signs of portal hypertension. However, 2 possible etiologies for noncirrhotic portal hypertension in this patient would be hepatic congestion from the narrowed IVC (although the normal IVC study argues against this) and hepatic schistosomiasis. Schistosomiasis is an important cause of noncirrhotic portal hypertension in endemic areas like this patient's country of origin, but the negative stool and urine studies, combined with the lack of granulomas or fibrosis seen on biopsy, make this condition unlikely.
Systemic amyloidosis (primary or secondary) could also be a cause of ascites and could present with multiorgan involvement (diarrhea and nephrotic syndrome). Amyloid deposits would have probably been seen in the liver biopsy, if present, but may not have been apparent unless specific stains (Congo red) were performed.
Evaluation for systemic, inflammatory autoimmune processes is indicated. Serum autoantibodies (anti‐nuclear antibody [ANA] and extractable nuclear antigens), and a serum and 24‐hour urine protein electrophoresis would be appropriate diagnostic tests. Peritoneal biopsies would have been helpful to assess for serosal diseases.
The patient subsequently developed acute right‐sided abdominal pain requiring urgent evaluation and admission to the hospital. He was initially assessed by a general surgeon, who found no evidence of postoperative complications. His temperature was 36.7C, blood pressure 105/64, heart rate 82, respiratory rate 16, and oxygen saturation 97% on room air. He appeared chronically ill, but he was in no distress and he had a normal mental status. Cardiac exam was normal except for mild jugular venous distension. He had mild bibasilar lung crackles. His abdomen was distended with superficial abdominal tenderness and a fluid wave, but he had normal bowel sounds and no peritoneal signs. He had mild scrotal edema but no peripheral edema. Joint exam did not suggest synovitis and there were no rashes or oral ulcers. Lactate was 0.9 mmol/L (normal 0.62.3), albumin was 2.6 g/dL, and prealbumin was 9 mg/dL (normal 1938). Erythrocyte sedimentation rate and C‐reactive protein were 46 mm/hour (normal <22) and 33.1 mg/L (normal 8), respectively. He had a normocytic anemia and leukopenia. Liver tests and routine chemistries were normal. Serum protein electrophoresis indicated no monoclonal protein. Complete 24‐hour urine collection showed 1.2 g of protein (normal <102 mg). Paracentesis of 3.4 L demonstrated 227 total nucleated cells/L with 2% neutrophils. Following the fluid removal, he had improvement in his pain, which he felt was related to the ascites rather than the recent surgery. Ascites total protein was 3.9 g/dL and ascites albumin was 1.7 g/dL. Ascites culture was negative for infection. Serum Schistosoma immunoglobulin G (IgG) antibody was positive at 3.53 (normal <1.00).
Further history revealed prior episodes of polyarticular joint pain and swelling in his hands and knees 5 years before admission. At that time, he reported a diffuse, pruritic, papular body rash. In addition, he noticed that his fingertips and toes turned white with cold exposure.
Importantly, surgical and infectious complications have been excluded. High protein ascites with a low SAAG of 0.9 suggests an inflammatory source of ascites. The follow‐up clinical data (arthritis, normocytic anemia, leukopenia, rash, Raynaud's phenomenon) suggest a systemic inflammatory syndrome such as SLE, with accompanying serositis. Serologic testing for autoantibodies would be recommended. Peritoneal biopsies, if obtained, may have demonstrated chronic, inflammatory infiltrate (nonspecific) or leukocytoclastic vasculitis (strongly supportive).
ANA enzyme immunoassay was >12 U (normal 1.0 U). Extractable nuclear antigens revealed positive autoantibodies for anti‐SSA, anti‐SSB, and anti‐ribosomal P. Moreover, double‐stranded DNA IgG antibody was 120 IU/mL (normal <30 IU/mL) and C3, C4, and total complement levels were low.
The clinical data support a diagnosis of SLE with serositis. Treatment of the underlying connective tissue disease will typically result in resolution of the ascites; diuretic therapy is generally ineffective.
In consultation with rheumatology and gastroenterology specialists, the diagnosis of SLE was made based on criteria of serositis, persistent leukopenia, arthritis, renal disease (proteinuria), positive ANA, elevated ds‐DNA antibodies, and hypocomplementemia. MR imaging of the abdominal vasculature demonstrated no evidence of vasculitis. The patient was given intravenous methylprednisolone 1 g daily for 3 days followed by high‐dose oral corticosteroids with a gradual taper. He was also started on mycophenolate mofetil as a steroid‐sparing medication (which was later changed to leflunomide due to persistent leukopenia) and hydroxychloroquine. His isolated positive Schistosoma IgG antibody in the absence of other findings was consistent with past exposure or infection. The infectious disease specialist felt there was no evidence of active schistosomiasis, but recommended treatment with a single dose of praziquantel due to the potential benefit with low risk of side effects. The patient had ongoing improvement following dismissal. He had 1 additional paracentesis of 4.1 L, 10 days after his hospitalization, and his ascites and proteinuria resolved. At the 5‐year follow‐up visit, there had been no recurrence of abdominal ascites or abdominal pain. He remains on low‐dose prednisone at 5 mg daily, leflunomide, and hydroxychloroquine.
COMMENTARY
This patient had recurrent ascites with 29.6 L removed over the 4 months prior to admission and an additional 3.4 L during his hospitalization. His outpatient providers initially considered a portal hypertensive etiology of his ascites due to his history of HBV and prior alcohol use. They also appropriately investigated for a possible infectious process. They next directed their evaluation toward the liver biopsy findings, which raised concern for a vascular inflow abnormality. However, the evaluation could have been performed more rapidly and far more cost‐efficiently had a diagnostic paracentesis with calculation of the SAAG been performed early in the evaluation.
The SAAG, which was first described in 1983 by Par and colleagues, is a parameter reflecting the oncotic pressure gradient between the vascular bed and the interstitial splanchnic or ascitic fluid. [1] In the classic study by Runyon and colleagues, a SAAG difference of 1.1 g/dL correctly differentiated causes of ascites due to portal hypertension from those that were not due to portal hypertension 96.7% of the time. [2] Conditions such as nephrotic syndrome, peritoneal carcinomatosis, and serositis (lupus peritonitis) can cause ascites in patients without portal hypertension.
Serositis in the form of pleuritis and/or pericarditis is a common feature of SLE, and ascites has been described in 8% to 11% of SLE patients.[3] However, massive ascites due to lupus peritonitis as a presenting symptom is rare.[4] More common causes of ascites in the setting of SLE include nephrotic syndrome, heart failure, protein‐losing enteropathy, constrictive pericarditis, Budd‐Chiari syndrome, indolent infections such as tuberculosis, and chylous ascites.[5, 6, 7] Of note, lupus peritonitis may be chronic or acute. Chronic ascites develops insidiously with few manifestations of active lupus and may be painless, whereas ascites from acute lupus peritonitis typically develops rapidly and presents with acute abdominal pain and other signs of increased lupus activity.[3, 5, 6, 8, 9]
Ascites from lupus peritonitis may be due to marked serosal exudative accumulation with reduced absorptive capacity in the peritoneum.[3, 4, 10] Other possible causes include peritoneal inflammation from deposition of immune complexes or vasculitis of peritoneal vessels and visceral serous membranes.[4, 9, 11] Although subserosal and submucosal vasculitis have been found in acute ascites, chronic ascites may be related to scarring from vasculitis and serosal inflammation leading to poor venous and lymph drainage.[9] Ascitic fluid characteristics from lupus peritonitis include a SAAG <1.1, presence of white blood cells anywhere in a broad range from 10 to 1630/L, and a range of fluid protein from 3.4 to 4.7 mg/dL.[3] Although not tested in this patient, findings of low complement levels, positive ANA, and elevated anti‐DNA antibody in the ascitic fluid would be supportive of lupus peritonitis, but not specific.[5, 9, 12] Lupus erythematosus cells are occasionally found in the ascitic fluid, but do not rule out other causes of ascites.[9] On retrospective analysis, lupus erythematosus cells were not seen in this patient's pathology specimens.
Treatment of lupus peritonitis and ascites is with high‐dose glucocorticoid therapy, but many patients may need a second immunosuppressant, possibly because of impaired peritoneal circulation from chronic inflammation leading to decreased drug delivery.[13, 14] Chronic ascites may be recalcitrant to systemic glucocorticoids,[3] so a possible alternative therapy is intraperitoneal injection of triamcinolone, which successfully treated massive ascites in a patient who did not respond to oral glucocorticoid treatment.[13] Although ascites may be refractory in some patients, those with chronic lupus peritonitis can generally achieve remission, yet the overall prognosis depends on the presence and severity of multiorgan involvement from SLE. As with any SLE patient, there are also risks of infection from immunosuppression and increased cardiovascular risks.
This patient's evaluation and treatment could have been expedited if he had undergone a paracenteses with determination of the SAAG early in his workup. It is not known why the SAAG was not obtained despite multiple outpatient visits and paracenteses, his history of HBV, and prior alcohol use. This may have been simply an unfortunate oversight. Alternatively, it may have been that his outpatient providers focused on tantalizing clues such as his country of origin, which led to concern for schistosomiasis, and the biopsy findings suggestive of a vascular inflow abnormality that led to further extensive testing. In so doing, the clinicians committed several diagnostic errors, including multiple alternatives bias, anchoring, and confirmation bias.[15] As a result, the patient accrued excess charges of $64,000 from multiple tests, laparoscopic surgery, and 2 hospitalizations. This case highlights how cognitive errors introduce costly variability into patient care, especially when a simple and accurate test is at the beginning of the decision tree.
CLINICAL TEACHING POINTS
- Diagnostic paracentesis, with calculation of the serum‐ascites albumin gradient, should be the first test in the workup for ascites and can distinguish portal hypertensive causes from nonportal hypertensive causes.
- Ascites related to SLE can be acute or chronic and caused by bowel infarction, perforation, pancreatitis, mesenteric vasculitis, nephrotic syndrome, heart failure, protein‐losing enteropathy, constrictive pericarditis, lupus peritonitis, Budd‐Chiari syndrome, or serositis (lupus peritonitis).
- Ascites caused by lupus peritonitis is rare. Once treated, management should be directed toward keeping the SLE in remission.
ACKNOWLEDGMENTS
Disclosure: Nothing to report.
- , , . Serum‐ascites albumin concentration gradient: a physiologic approach to the differential diagnosis of ascites. Gastroenterology. 1983;85(2):240–244.
- , , , et al. The serum‐ascites albumin gradient is superior to the exudate‐transudate concept in the differential diagnosis of ascites. Ann Intern Med. 1992;117:215–220.
- , , . Insidious onset of massive painless ascites as initial manifestation of systemic lupus erythematosus. Lupus. 2011;20:754–757.
- , . Rapid onset of massive ascites as the initial presentation of systemic lupus erythematosus. Am J Gastroenterol. 2000;95:302–303.
- , . Gastrointestinal and hepatic manifestations of systemic lupus erythematosus. J Clin Gastroenterol. 2011;45:436–441.
- , , , . Massive ascites as a presenting feature of lupus. Int J Rheum Dis. 2012;15:e15–e16.
- , , , et al. Concurrent occurrence of chylothorax, chylous ascites, and protein‐losing enteropathy in systemic lupus erythematosus. J Rheumatol. 2002;29:1330–1333.
- , , , et al. Abdominal manifestations in childhood‐onset systemic lupus erythematosus. Ann Rheum Dis. 2007;66:174–178.
- , , . Chronic lupus peritonitis with ascites: review of the literature with a case report. Semin Arthritis Rheum. 1988;18:121–126.
- , . Nonhepatic Gastrointestinal Manifestations of Systemic Lupus Erythematosus. London, United Kingdom: Churchill Livingstone; 1987:747–760.
- , , , . Ascites due to lupus peritonitis: a rare form of onset of systemic lupus erythematosus. Rev Bras Reumatol. 2012;52(1):113–119.
- , , , . New‐onset lupus presenting as serositis in an 80‐year‐old woman: does a high‐titer ANA in pleural, pericardial, or peritoneal fluid help confirm the diagnosis? J Clin Rheum.2005:11(5):292–293.
- , , , . Successful treatment of massive ascites with intraperitoneal administration of a steroid in a case of systemic lupus erythematosus. Lupus. 2009;18:740–742.
- , , , et al. Chronic lupus peritonitis with massive ascites at elderly onset: case report and review of the literature. Intern Med. 2002;41:1056–1061.
- . The Importance of cognitive errors in diagnosis and strategies to minimize them. Acad Med. 2003;78:775–780.
A 40‐year‐old Sudanese man was admitted due to worsening abdominal pain with recurrent ascites. He had a history of hepatitis B (HBV) infection and diabetes. He previously drank 3 beers per day on the weekends, but he had not consumed alcohol in over a year. He was born in Sudan but lived in Egypt most of his adult life; he immigrated to the United States 6 years previously. He was hospitalized out of state 9 months ago for a swollen abdomen and underwent an exploratory laparotomy that reportedly was unremarkable except for ascites.
Portal hypertension due to liver disease is the most common cause of ascites. This patient has a known risk factor for liver disease (history of HBV infection). Although his reported alcohol consumption is low, there is a synergistic effect on liver injury in the setting of chronic hepatitis. Abdominal pain in the setting of ascites needs to be urgently evaluated to exclude spontaneous bacterial peritonitis (SBP). Also, because chronic HBV infection is the major risk factor for hepatocellular carcinoma in the world, malignant ascites is in the differential. Hepatic vascular thrombosis and tuberculous peritonitis (given the patient's country of origin and travel history) also should be considered. The most appropriate initial test would be a diagnostic paracentesis to support or exclude the presence of SBP and direct the evaluation toward liver disease or other less‐common causes of ascites.
The patient was seen as an outpatient 5 months prior to admission with transient fever and joint pains. Laboratory studies at that visit were notable for a serum albumin of 3.2 g/dL (normal 3.55), 2.4 g of predicted 24‐hour protein on urinalysis (normal <30 mg per 24 hours), creatinine of 0.5 mg/dL (normal 0.81.3), and a positive hepatitis B surface antibody. The working diagnosis was a nonspecific viral syndrome and his symptoms resolved without treatment. One month later, he developed ascites and mild lower extremity edema. Additional laboratory studies at that time showed a normocytic anemia with hemoglobin 11.7 g/dL (normal 13.517.5) and leukopenia with white blood cell count of 2.4 109/L (normal 3.510.5), neutrophil count of 1.45 109/L (normal 1.77.0), and lymphocyte count of 0.58 109/L (normal 0.902.90). Transaminases, serum bilirubin, prothrombin time, alpha fetoprotein, and peripheral blood smear were normal. Human immunodeficiency virus antibody screen and QuantiFERON‐TB assay were negative. Hemoglobin A1c was 6.2% (normal 4.06.0). Repeat urinalysis demonstrated 883 mg of predicted 24‐hour protein. Computed tomography (CT) of the abdomen showed a large amount of intra‐abdominal ascites; the liver and spleen were normal, and there were no varices or other evidence of portal hypertension. Echocardiogram was normal except for a small inferior vena cava (IVC) and a mildly increased right ventricular systolic pressure of 32 mm Hg (systolic blood pressure 98 mm Hg). Due to the indeterminate cause for the patient's ascites, referral was made for gastroenterology evaluation with consideration for a paracentesis.
Cirrhotic ascites seems less likely. Postsinusoidal causes of portal hypertension (eg, cardiomyopathy) are also less likely given the absence of suggestive findings on echocardiography. Malignant ascites also appears less probable in the absence of suggestive findings such as mass lesions, lymphadenopathy, or peritoneal carcinomatosis on CT imaging. The suspicion for tuberculous peritonitis is lower with the negative QuantiFERON‐TB test. Hypoalbuminemia, normocytic anemia, leukopenia, and proteinuria all suggest a systemic inflammatory condition (eg, systemic lupus erythematosus [SLE]) with inflammatory serositis causing ascites). Nephrotic syndrome can cause hypoalbuminemia, edema, and ascites, but his total urine protein losses of <3.5 grams per 24 hours are not in keeping with this diagnosis. Other uncommon causes of ascites such as chylous ascites have not yet been excluded. The most appropriate next step remains ascitic fluid analysis.
A paracentesis yielded 7.8 L of clear‐yellow fluid and improvement in his abdominal discomfort. Analysis showed 224 total nucleated cells/L with 2% neutrophils, 57% lymphocytes, and 37% monocytes. Ascites total protein was 3.8 g/dL and glucose was 55 mg/dL. Gram stain and culture were negative, and cytology was negative for malignancy but showed lymphocytes, plasma cells, monocytes, and reactive mesothelial cells interpreted as consistent with chronic inflammation. The serum‐ascites albumin gradient (SAAG) was not obtained.
With a low leukocyte count and a paucity of neutrophils, this is not SBP. The ascites fluid did not have a chylous appearance. The SAAG, which can distinguish between portal hypertensive and nonportal hypertensive causes for ascites using a cutoff of 1.1 g/dL, was not done. The total protein was high, arguing against cirrhosis. High protein ascites with a high SAAG would suggest a posthepatic source of portal hypertension (eg, Budd‐Chiari syndrome, constrictive pericarditis). High protein ascites with a low SAAG would suggest an inflammatory or malignant source of ascites. The relative lymphocytosis in the ascites fluid suggests an inflammatory process, but is a nonspecific finding. The negative cytology does not completely exclude a malignancy, but given the absence of findings on the CT, malignant ascites is less likely.
Three months before admission, the patient underwent a repeat large‐volume paracentesis and a liver biopsy. The biopsy showed ectopic portal vein branches consistent with hepatoportal sclerosis, but no actual sclerosis was identified. The pathologist concluded that the findings suggested noncirrhotic portal hypertension due to a vascular in‐flow abnormality. Abdominal ultrasound with Doppler was unremarkable other than slightly increased echogenicity of the liver. Magnetic resonance (MR) angiogram showed narrowing of the intra‐abdominal IVC at the level of the diaphragm. Because of concern that hepatic congestion from high pressures in the narrowed IVC was leading to poor vascular inflow as suggested by the biopsy findings, an inferior vena cavagram was performed. This study was normal, although no transhepatic pressure measurements were obtained. Three stool specimens and 2 urine specimens were negative for parasites. The patient required repeat large‐volume paracenteses monthly. SBP was again ruled out, but no other diagnostic labs were obtained. He had anorexia with poor oral intake each time his abdomen became distended.
The patient was started on furosemide 1 month prior to admission to the hospital but had only a slight improvement in the ascites. His other medications included insulin, tamsulosin, and hydrocodone‐acetaminophen. Five days prior to admission, he underwent a diagnostic laparoscopy, which showed only ascites and small adhesions to the anterior abdominal wall. There was no visual evidence of malignancy, and the surgeon commented that the liver was normal. No additional biopsies were obtained.
The liver biopsy findings could be seen in noncirrhotic portal hypertension, although this diagnosis would be unlikely without splenomegaly, varices, or other signs of portal hypertension. However, 2 possible etiologies for noncirrhotic portal hypertension in this patient would be hepatic congestion from the narrowed IVC (although the normal IVC study argues against this) and hepatic schistosomiasis. Schistosomiasis is an important cause of noncirrhotic portal hypertension in endemic areas like this patient's country of origin, but the negative stool and urine studies, combined with the lack of granulomas or fibrosis seen on biopsy, make this condition unlikely.
Systemic amyloidosis (primary or secondary) could also be a cause of ascites and could present with multiorgan involvement (diarrhea and nephrotic syndrome). Amyloid deposits would have probably been seen in the liver biopsy, if present, but may not have been apparent unless specific stains (Congo red) were performed.
Evaluation for systemic, inflammatory autoimmune processes is indicated. Serum autoantibodies (anti‐nuclear antibody [ANA] and extractable nuclear antigens), and a serum and 24‐hour urine protein electrophoresis would be appropriate diagnostic tests. Peritoneal biopsies would have been helpful to assess for serosal diseases.
The patient subsequently developed acute right‐sided abdominal pain requiring urgent evaluation and admission to the hospital. He was initially assessed by a general surgeon, who found no evidence of postoperative complications. His temperature was 36.7C, blood pressure 105/64, heart rate 82, respiratory rate 16, and oxygen saturation 97% on room air. He appeared chronically ill, but he was in no distress and he had a normal mental status. Cardiac exam was normal except for mild jugular venous distension. He had mild bibasilar lung crackles. His abdomen was distended with superficial abdominal tenderness and a fluid wave, but he had normal bowel sounds and no peritoneal signs. He had mild scrotal edema but no peripheral edema. Joint exam did not suggest synovitis and there were no rashes or oral ulcers. Lactate was 0.9 mmol/L (normal 0.62.3), albumin was 2.6 g/dL, and prealbumin was 9 mg/dL (normal 1938). Erythrocyte sedimentation rate and C‐reactive protein were 46 mm/hour (normal <22) and 33.1 mg/L (normal 8), respectively. He had a normocytic anemia and leukopenia. Liver tests and routine chemistries were normal. Serum protein electrophoresis indicated no monoclonal protein. Complete 24‐hour urine collection showed 1.2 g of protein (normal <102 mg). Paracentesis of 3.4 L demonstrated 227 total nucleated cells/L with 2% neutrophils. Following the fluid removal, he had improvement in his pain, which he felt was related to the ascites rather than the recent surgery. Ascites total protein was 3.9 g/dL and ascites albumin was 1.7 g/dL. Ascites culture was negative for infection. Serum Schistosoma immunoglobulin G (IgG) antibody was positive at 3.53 (normal <1.00).
Further history revealed prior episodes of polyarticular joint pain and swelling in his hands and knees 5 years before admission. At that time, he reported a diffuse, pruritic, papular body rash. In addition, he noticed that his fingertips and toes turned white with cold exposure.
Importantly, surgical and infectious complications have been excluded. High protein ascites with a low SAAG of 0.9 suggests an inflammatory source of ascites. The follow‐up clinical data (arthritis, normocytic anemia, leukopenia, rash, Raynaud's phenomenon) suggest a systemic inflammatory syndrome such as SLE, with accompanying serositis. Serologic testing for autoantibodies would be recommended. Peritoneal biopsies, if obtained, may have demonstrated chronic, inflammatory infiltrate (nonspecific) or leukocytoclastic vasculitis (strongly supportive).
ANA enzyme immunoassay was >12 U (normal 1.0 U). Extractable nuclear antigens revealed positive autoantibodies for anti‐SSA, anti‐SSB, and anti‐ribosomal P. Moreover, double‐stranded DNA IgG antibody was 120 IU/mL (normal <30 IU/mL) and C3, C4, and total complement levels were low.
The clinical data support a diagnosis of SLE with serositis. Treatment of the underlying connective tissue disease will typically result in resolution of the ascites; diuretic therapy is generally ineffective.
In consultation with rheumatology and gastroenterology specialists, the diagnosis of SLE was made based on criteria of serositis, persistent leukopenia, arthritis, renal disease (proteinuria), positive ANA, elevated ds‐DNA antibodies, and hypocomplementemia. MR imaging of the abdominal vasculature demonstrated no evidence of vasculitis. The patient was given intravenous methylprednisolone 1 g daily for 3 days followed by high‐dose oral corticosteroids with a gradual taper. He was also started on mycophenolate mofetil as a steroid‐sparing medication (which was later changed to leflunomide due to persistent leukopenia) and hydroxychloroquine. His isolated positive Schistosoma IgG antibody in the absence of other findings was consistent with past exposure or infection. The infectious disease specialist felt there was no evidence of active schistosomiasis, but recommended treatment with a single dose of praziquantel due to the potential benefit with low risk of side effects. The patient had ongoing improvement following dismissal. He had 1 additional paracentesis of 4.1 L, 10 days after his hospitalization, and his ascites and proteinuria resolved. At the 5‐year follow‐up visit, there had been no recurrence of abdominal ascites or abdominal pain. He remains on low‐dose prednisone at 5 mg daily, leflunomide, and hydroxychloroquine.
COMMENTARY
This patient had recurrent ascites with 29.6 L removed over the 4 months prior to admission and an additional 3.4 L during his hospitalization. His outpatient providers initially considered a portal hypertensive etiology of his ascites due to his history of HBV and prior alcohol use. They also appropriately investigated for a possible infectious process. They next directed their evaluation toward the liver biopsy findings, which raised concern for a vascular inflow abnormality. However, the evaluation could have been performed more rapidly and far more cost‐efficiently had a diagnostic paracentesis with calculation of the SAAG been performed early in the evaluation.
The SAAG, which was first described in 1983 by Par and colleagues, is a parameter reflecting the oncotic pressure gradient between the vascular bed and the interstitial splanchnic or ascitic fluid. [1] In the classic study by Runyon and colleagues, a SAAG difference of 1.1 g/dL correctly differentiated causes of ascites due to portal hypertension from those that were not due to portal hypertension 96.7% of the time. [2] Conditions such as nephrotic syndrome, peritoneal carcinomatosis, and serositis (lupus peritonitis) can cause ascites in patients without portal hypertension.
Serositis in the form of pleuritis and/or pericarditis is a common feature of SLE, and ascites has been described in 8% to 11% of SLE patients.[3] However, massive ascites due to lupus peritonitis as a presenting symptom is rare.[4] More common causes of ascites in the setting of SLE include nephrotic syndrome, heart failure, protein‐losing enteropathy, constrictive pericarditis, Budd‐Chiari syndrome, indolent infections such as tuberculosis, and chylous ascites.[5, 6, 7] Of note, lupus peritonitis may be chronic or acute. Chronic ascites develops insidiously with few manifestations of active lupus and may be painless, whereas ascites from acute lupus peritonitis typically develops rapidly and presents with acute abdominal pain and other signs of increased lupus activity.[3, 5, 6, 8, 9]
Ascites from lupus peritonitis may be due to marked serosal exudative accumulation with reduced absorptive capacity in the peritoneum.[3, 4, 10] Other possible causes include peritoneal inflammation from deposition of immune complexes or vasculitis of peritoneal vessels and visceral serous membranes.[4, 9, 11] Although subserosal and submucosal vasculitis have been found in acute ascites, chronic ascites may be related to scarring from vasculitis and serosal inflammation leading to poor venous and lymph drainage.[9] Ascitic fluid characteristics from lupus peritonitis include a SAAG <1.1, presence of white blood cells anywhere in a broad range from 10 to 1630/L, and a range of fluid protein from 3.4 to 4.7 mg/dL.[3] Although not tested in this patient, findings of low complement levels, positive ANA, and elevated anti‐DNA antibody in the ascitic fluid would be supportive of lupus peritonitis, but not specific.[5, 9, 12] Lupus erythematosus cells are occasionally found in the ascitic fluid, but do not rule out other causes of ascites.[9] On retrospective analysis, lupus erythematosus cells were not seen in this patient's pathology specimens.
Treatment of lupus peritonitis and ascites is with high‐dose glucocorticoid therapy, but many patients may need a second immunosuppressant, possibly because of impaired peritoneal circulation from chronic inflammation leading to decreased drug delivery.[13, 14] Chronic ascites may be recalcitrant to systemic glucocorticoids,[3] so a possible alternative therapy is intraperitoneal injection of triamcinolone, which successfully treated massive ascites in a patient who did not respond to oral glucocorticoid treatment.[13] Although ascites may be refractory in some patients, those with chronic lupus peritonitis can generally achieve remission, yet the overall prognosis depends on the presence and severity of multiorgan involvement from SLE. As with any SLE patient, there are also risks of infection from immunosuppression and increased cardiovascular risks.
This patient's evaluation and treatment could have been expedited if he had undergone a paracenteses with determination of the SAAG early in his workup. It is not known why the SAAG was not obtained despite multiple outpatient visits and paracenteses, his history of HBV, and prior alcohol use. This may have been simply an unfortunate oversight. Alternatively, it may have been that his outpatient providers focused on tantalizing clues such as his country of origin, which led to concern for schistosomiasis, and the biopsy findings suggestive of a vascular inflow abnormality that led to further extensive testing. In so doing, the clinicians committed several diagnostic errors, including multiple alternatives bias, anchoring, and confirmation bias.[15] As a result, the patient accrued excess charges of $64,000 from multiple tests, laparoscopic surgery, and 2 hospitalizations. This case highlights how cognitive errors introduce costly variability into patient care, especially when a simple and accurate test is at the beginning of the decision tree.
CLINICAL TEACHING POINTS
- Diagnostic paracentesis, with calculation of the serum‐ascites albumin gradient, should be the first test in the workup for ascites and can distinguish portal hypertensive causes from nonportal hypertensive causes.
- Ascites related to SLE can be acute or chronic and caused by bowel infarction, perforation, pancreatitis, mesenteric vasculitis, nephrotic syndrome, heart failure, protein‐losing enteropathy, constrictive pericarditis, lupus peritonitis, Budd‐Chiari syndrome, or serositis (lupus peritonitis).
- Ascites caused by lupus peritonitis is rare. Once treated, management should be directed toward keeping the SLE in remission.
ACKNOWLEDGMENTS
Disclosure: Nothing to report.
- , , . Serum‐ascites albumin concentration gradient: a physiologic approach to the differential diagnosis of ascites. Gastroenterology. 1983;85(2):240–244.
- , , , et al. The serum‐ascites albumin gradient is superior to the exudate‐transudate concept in the differential diagnosis of ascites. Ann Intern Med. 1992;117:215–220.
- , , . Insidious onset of massive painless ascites as initial manifestation of systemic lupus erythematosus. Lupus. 2011;20:754–757.
- , . Rapid onset of massive ascites as the initial presentation of systemic lupus erythematosus. Am J Gastroenterol. 2000;95:302–303.
- , . Gastrointestinal and hepatic manifestations of systemic lupus erythematosus. J Clin Gastroenterol. 2011;45:436–441.
- , , , . Massive ascites as a presenting feature of lupus. Int J Rheum Dis. 2012;15:e15–e16.
- , , , et al. Concurrent occurrence of chylothorax, chylous ascites, and protein‐losing enteropathy in systemic lupus erythematosus. J Rheumatol. 2002;29:1330–1333.
- , , , et al. Abdominal manifestations in childhood‐onset systemic lupus erythematosus. Ann Rheum Dis. 2007;66:174–178.
- , , . Chronic lupus peritonitis with ascites: review of the literature with a case report. Semin Arthritis Rheum. 1988;18:121–126.
- , . Nonhepatic Gastrointestinal Manifestations of Systemic Lupus Erythematosus. London, United Kingdom: Churchill Livingstone; 1987:747–760.
- , , , . Ascites due to lupus peritonitis: a rare form of onset of systemic lupus erythematosus. Rev Bras Reumatol. 2012;52(1):113–119.
- , , , . New‐onset lupus presenting as serositis in an 80‐year‐old woman: does a high‐titer ANA in pleural, pericardial, or peritoneal fluid help confirm the diagnosis? J Clin Rheum.2005:11(5):292–293.
- , , , . Successful treatment of massive ascites with intraperitoneal administration of a steroid in a case of systemic lupus erythematosus. Lupus. 2009;18:740–742.
- , , , et al. Chronic lupus peritonitis with massive ascites at elderly onset: case report and review of the literature. Intern Med. 2002;41:1056–1061.
- . The Importance of cognitive errors in diagnosis and strategies to minimize them. Acad Med. 2003;78:775–780.
Role of Shock Index in ICU Transfers
The decision to transfer a patient to the intensive care unit (ICU) from a general care setting is complex and based not only on clinical findings and patient wishes but also on the understanding that ICU resources are limited and costly.1 Adding to the decision‐making complexity is the knowledge that patients who transfer to an ICU from a general medical unit comprise the highest mortality group of ICU patients, with the mortality rate directly proportional to both the time spent on the general medical unit1, 2 and the number of physiologic abnormalities before ICU admission.3, 4
Prior studies have shown that cardiac arrest and unplanned (unexpected) transfers to the ICU are preceded by a period of physiologic instability reflected in the vital signs.510 However, vital signs alone may not accurately indicate clinical condition. For example, a person may be able to maintain normal blood pressure and heart rate despite severe illness or may have abnormal vital signs at baseline, which may be the case for an otherwise healthy young woman who has baseline low systolic blood pressure. Also, noncritical conditions commonly seen in hospitalized medical or surgical patients, such as anxiety or pain, may increase the respiratory rate or heart rate. Conversely, certain common medications, such as ‐blockers, may mask or blunt the normal physiologic response to illness. Overall, the prevalence of abnormal physiologic variables is high among hospitalized adult patients irrespective of the presence of serious adverse events.11 This prevalence may be a reason why 2 recent studies of inpatient medical emergency teams (METs) or rapid response teams (RRTs), which generally rely on vital signs for activation, failed to show a decrease in adult mortality rates.12, 13
Given the complexity of interpreting single vital sign readings, we evaluated a simple and clinically intuitive variable, the shock index (SI) (heart rate/systolic blood pressure, a noninvasive indication of left ventricular function),14 as a potential marker of the need for intensive care. Allgwer and Burri14 first developed the SI in studies of patients with acute blood loss, intraabdominal bleeding, fat emboli, and severe infections. They observed that a healthy adult had a mean SI of 0.54 (standard deviation [SD], 0.021), while an index of 1.0 indicated threatened shock and indices greater than 1.5 were seen in volume‐deficient shock.
We hypothesized that an elevated SI is a differentiating factor between a patient who had an unplanned ICU transfer and a general medical patient who did not require this higher level of care. To our knowledge, the SI has not been studied for this application previously.
Patients and Methods
Study Design
We conducted a retrospective case‐control study of 50 consecutive general medical patients who had unplanned transfers to the ICU and 50 matched control patients, with the approval of the Mayo Clinic Institutional Review Board. All patients were admitted to a general medical unit, and only patients who previously provided permission for their records to be used in research were included in the study.
Patients
This study enrolled patients who were at least 18 years old and who were admitted to a single general medical unit for 24 hours or longer. Patients were excluded if they required a surgical intervention, were transferred from another hospital, received care on a different general medical unit at any time during the hospitalization, or were pregnant. Our data collection began at the patients' (cases and controls) arrival on the general medical unit; we did not include data from any evaluation (outpatient or emergency department) before hospital admission.
Case Definition
An unplanned transfer was defined as an episode of unexpected clinical deterioration in a general medical patient that necessitated transfer to the ICU, as opposed to a preemptive or elective transfer following a procedure. Patients with unplanned transfers from December 9, 2003, to December 29, 2004, were eligible for the study. Only the first transfer to the ICU was considered for patients who had multiple ICU transfers during a single hospitalization. Because these data were collected before METs or RRTs were introduced at our institution, the recommendation for ICU transfer was a joint decision by the primary care team and the ICU team.
Control Definition
The matched controls were identified from among patients admitted to the general medical unit from January 16, 2002, to December 13, 2004. To reduce the effect of the heterogeneity inherent in general medical patients, we matched controls for age (within 5 years of age of the corresponding case), admission diagnosis code, and patient care unit of admission and required that they were admitted for at least 24 hours before dismissal. Patients who had an ICU stay during the same admission were excluded. The median difference in admission dates between the cases and the controls was 327 days, and 26 of the 50 matched pairs had admission dates within 1 year of each other. This lengthy interval between cases and controls was a consequence of the low incidence of patients who met the matching criteria.
Setting
This study involved the general medical units and ICUs of the 1157‐bed Saint Mary's Hospital, an academic tertiary care facility at Mayo Clinic in Rochester, Minnesota.
Vital Sign Determination
Vital signs abstracted for this study included blood pressure, heart rate, respiratory rate, oxygen saturation, and temperature. The SI was calculated for each set of abstracted vital signs. Staff nurses were responsible for the routine measurement and recording of vital signs at least once every 8 hours, although in several instances not all parameters were checked. In accordance with nursing policy, values outside the defined parameters were rechecked by the nursing supervisor of each care unit and, if found to be abnormal, were conveyed to the patient's physician. This system meant that abnormal results were checked by numerous observers, with differences in the frequency of recordings for individual patients.
Data Collection
Demographic data and information on the vital signs were abstracted through a comprehensive chart review. Demographic data included age, sex, ethnicity, comorbid conditions, hospital care unit, date and time of admission, admission diagnosis, date and time of transfer to the ICU, length of stay, dismissal date, and disposition at discharge. Comorbid conditions were scored using the Charlson Comorbidity Index.15
Statistical Analysis
A sample size of 50 matched pairs provided 81% power to detect an odds ratio of 3.0 or greater between cases and controls, with a 0.05, 2‐tailed level of significance with McNemar test. Patient demographic characteristics were summarized by the frequencies for categorical data and by mean and SD for continuous data. Consistent with the study design, the McNemar test and conditional logistic model analyses were used to determine the association between the SI and the risk of unplanned ICU transfer. Shock indices for the cases and controls were compared with use of t test. A P value <0.05 was considered statistically significant. For the SI, we calculated the odds ratio and its 95% confidence interval (CI) and P value using different cut points. We did not perform a receiver operating characteristics analysis because matching of cases and controls greatly complicates estimation of the sensitivity and specificity of the SI;16 a cohort study is suggested to investigate this analysis further. All statistical analyses were performed by SAS version 9.1.3 software (SAS Institute Inc, Cary, NC).
Results
A total of 50 pairs of matching cases and controls was included in this study. Table 1 lists the source of admission, demographic characteristics, and numbers of deaths for cases and controls. There were no statistically significant differences in admission source, age, sex, ethnicity, admission care unit, or Charlson Comorbidity Index. Mean length of stay was 14.8 days (SD, 9.7 days) for the cases and 5.7 days (SD, 6.3 days; P < 0.001) for the controls. Admission diagnoses were classified on the basis of the organ system of involvement (Table 2). In 30 of 50 cases, the admission diagnosis and the reason for ICU transfer were related.
| Value | Cases (n = 50) | Controls (n = 50) | P Value* |
|---|---|---|---|
| |||
| Emergency department admission, No. (%) | 33 (66) | 28 (56) | 0.41 |
| Direct admission, No. (%) | 14 (28) | 15 (30) | 1.00 |
| Other admission, No. (%) | 3 (6) | 7 (14) | 0.32 |
| Age, mean (SD), years | 69.8 (15.7) | 70.3 (15.8) | 0.38 |
| Male sex, No. (%) | 26 (52) | 18 (36) | 0.12 |
| Ethnicity, No. (%) | 1.00 | ||
| White | 46 (92) | 46 (92) | |
| Other | 4 (8) | 4 (8) | |
| Charlson Comorbidity index, mean (SD) | 3.06 (2.31) | 2.66 (2.02) | 0.22 |
| Hospital stay, mean (SD), day | 14.8 (9.7) | 5.7 (6.3) | 0.0007 |
| Hospital deaths, No. | 9 | 1 | 0.008 |
| Deaths within 30 days, No. | 5 | 2 | 0.24 |
| Deaths within 6 months, No. | 9 | 6 | 0.40 |
| System | Primary Admission Diagnosis | No. of Cases |
|---|---|---|
| Constitutional | Fever, malaise, general symptoms | 7 |
| Cardiovascular | Hypertension, congestive heart failure, chest pain, peripheral vascular disease, edema | 5 |
| Dermatologic | Cellulitis, foot ulcer, skin rash | 3 |
| Gastrointestinal | Pancreatitis, gastrointestinal hemorrhage, nausea and vomiting, diarrhea, abdominal pain | 6 |
| Hematologic | Thrombocytopenia, abnormal coagulation | 2 |
| Musculoskeletal | Lymphedema, shoulder pain, lumbago, back ache, closed dorsal vertebral fracture | 7 |
| Neurologic | Delirium tremens, psychosis, convulsions | 3 |
| Pulmonary | Pneumonia, food or vomit aspiration pneumonitis, shortness of breath, respiratory abnormality | 13 |
| Renal | Hyperkalemia, acute renal failure, renal artery atherosclerosis | 4 |
We reviewed the vital signs and shock indices for the 24 hours before ICU transfer for each case and over the entire hospitalization for each control, to determine the worst set (the lowest systolic blood pressure and the highest heart rate, respiratory rate, and SI). The cases had 1 to 22 complete sets of vitals for the 24 hours before ICU transfer; the median number of sets was 3 and the mean was 4. The controls had 1 to 12 complete sets for the 24 hours before the worst SI: the median was 3 sets and the mean was 3. In 26 of 50 controls, the worst SI occurred within the first 24 hours after admission. There was a significant difference between the median values of the worst shock indices of the cases and the controls (0.87 vs. 0.72; P < 0.005).
Table 3 shows the different values of the SI and the corresponding odds ratio of unplanned ICU transfer for cases compared with controls. The difference was significant at an SI of 0.85 and greater, indicating a strong association with unplanned ICU transfer.
| Shock Index | P Value | Odds Ratio | 95% CI |
|---|---|---|---|
| |||
| 0.8 | 0.05 | 2.43 | 1.015.86 |
| 0.85 | 0.02 | 3.00 | 1.917.56 |
| 0.9 | 0.007 | 7.50 | 1.7232.78 |
| 0.95 | <0.03 | 5.50 | 1.2224.81 |
We also found that the patients who transferred to the ICU had a greater number of inpatient deaths (9 cases vs. 1 control; P = 0.008), which would be expected, but there was no difference in 30‐day or 6‐month mortality rate (Table 1). One patient died after 30 days and while still hospitalized.
Comparison between the temporal trend of vital signs and the SI of the cases for the 24 hours before ICU transfer is shown in Figure 1. This graph shows the median of all the worst values (minimum systolic blood pressure and maximum SI, heart rate, and respiratory rate) over the four 6‐hour time periods (24 hours) preceding ICU transfer. Of note, the change in vital signs is subtle even while the SI increased to more than 0.8 as the patients clinically worsened before transfer.
Discussion
In our comparison of the SI of 50 patients who required unplanned (unexpected) transfer to the ICU with the SI of 50 matched controls who did not require this higher level of care, we found that a SI of 0.85 or greater was significantly associated with unplanned transfer to the ICU. The cases had a significantly higher worst SI than the controls, and they also had a significantly longer hospital stay and higher inpatient mortality rate, as would be expected for a sicker patient population. These findings are important given that the SI may be useful for assessing illness severity, for helping determine the need for transfer to the ICU, or for activating METs or RRTs.
A major problem with providing optimal care for hospitalized general medical patients is the inherent difficulty in determining illness severity and clinical decline, especially when the decline occurs gradually. Existing consensus recommendations for ICU admission include both specific diagnoses and arbitrary objective criteria based on abnormal vital signs and laboratory values.27 Also, individual institutions may have their own ICU admission requirements, which may differ from these or RRT criteria. Although vital signs are important as a snapshot of basic physiologic function, a number of noncritical conditions may lead to abnormal vital signs, and not all abnormal vital signs are associated with an adverse clinical event. By relying solely on vital signs, clinicians may not recognize critical illness and therefore not transfer a patient to the ICU or may inappropriately transfer a patient who does not need ICU‐level care.
Markers of illness severity other than vital signs, such as the Acute Physiology and Chronic Health Evaluation (APACHE) score, have been shown to predict the death of ICU patients17, 18 but have been rarely studied outside the ICU setting.19 Also, calculating the APACHE score is cumbersome, and there is no cutoff score that defines when a patient should be transferred to the ICU. Subbe et al.,20 in their study to identify critically ill patients, found that introduction of a physiological scoring system (including MET or RRT activation scores) would have identified only a small number of additional patients as critically ill. Another common marker of illness severity, the 4 criteria of the systemic inflammatory response syndrome (temperature <36C or >38C; heart rate >90 beats per minute; respiratory rate >20 breaths per minute or PCO2 <32 mm Hg; and white blood cell count >12,000/L or <4000/L or with more than 10% band cells)21 may be too sensitive to use as a decision aid, since even a healthy person running after a bus could have 2 of the 4 criteria.22 Likewise, surgical patients may have transient leukocytosis due to a stress response independent of an infection.23
The SI may be more accurate than vital signs alone to determine illness severity and who is at risk for an unplanned transfer to the ICU. Birkhahn et al.24 concluded that the SI may be more useful in early hemorrhage than either heart rate or systolic blood pressure alone. Rady et al.25 showed that the SI used in the emergency department can identify critical illness with apparently stable vital signs, where an elevation of the SI above 0.9 was associated with an illness that was treated immediately with admission to the hospital and intensive therapy on admission. However, it is unclear whether the SI can be used to monitor ongoing treatment, because a previous study showed that the SI may be of limited value in the assessment of systemic oxygen transport and response to therapy in clinical septic shock.26 Of note, the SI is mostly independent of the effects of pain or anxiety, which cause a concurrent rise in heart rate and systolic blood pressure. Because the heart's left ventricular work is unchanged or may increase from the underlying catecholamine surge, the SI will be unchanged or may actually decrease.
Our study adds to the medical literature the findings that: (1) the SI may be useful as an indicator of illness severity and a triage tool in patients with no trauma but with various medical conditions, and (2) the SI showed a strong association with unplanned ICU transfer.
The main strength of our study is its case‐control design with matched controls. Also, by comparing groups from the same patient care unit, we sought to minimize the selection bias that can be inherent in case‐control studies. Limitations include the retrospective, nonrandomized study design and the fact that there may have been variations in vital sign measurements by the multiple caregivers. However, the vital signs were taken according to standard hospital practice and reflect real‐world conditions. Although generalizability may be somewhat limited because of our homogeneous patient population, our patients had a wide range of various medical illnesses, so our study should be applicable to other hospital settings, both academic and community‐based.
One of the main weaknesses of our study is that the results were not adjusted for the burden of comorbid conditions, although there were no statistically significant differences in the number of comorbid conditions among the cases and the controls (P = 0.96). Also, we did not directly compare the SI with vital signs alone to determine superiority.
The SI may be an important objective measure to help clinicians decide when patients need treatment that is more aggressive, assistance from a MET or an RRT, or a preemptive, rather than unplanned, transfer to an ICU. Although it is unlikely that a single measure will allow accurate triage of all medical or surgical patients, the SI may be a useful adjunct to clinical judgment and other objective measures in determining illness severity and clinical decline. Further prospective studies are needed to compare the role of the SI specifically with MET or RRT activation criteria, to clarify the role of comorbid conditions in unplanned transfers to the ICU, to validate the cut point for the SI in various disease states, and to assess its utility in patients with septic shock. Depending on these results, it may be beneficial to incorporate the SI into the electronic medical record as an automatic alert to identify patients at risk for ICU transfer.
Conclusions
The SI is an easily calculated composite index of heart rate and systolic blood pressure. An elevated SI of 0.85 can identify patients who are at risk for unplanned transfer to the ICU from general patient care units. Future studies will determine whether the SI is more accurate than simple vital signs as an indicator of clinical decline. If so, it may be useful as a trigger to activate METs or RRTs for treatment.
- ,.Outcome of intensive care patients in a group of British intensive care units.Crit Care Med.1998;26(8):1337–1345.
- ,,,.The longer patients are in hospital before Intensive Care admission the higher their mortality.Intensive Care Med.2004;30(10):1908–1913.
- ,.Physiological abnormalities in early warning scores are related to mortality in adult inpatients.Br J Anaesth.2004;92(6):882–884.
- ,,,,.Association between clinically abnormal observations and subsequent in‐hospital mortality: a prospective study.Resuscitation.2004;62(2):137–141.
- ,,,,,.Recognising clinical instability in hospital patients before cardiac arrest or unplanned admission to intensive care: a pilot study in a tertiary‐care hospital.Med J Aust.1999;171(1):22–25.
- ,,.Physiological values and procedures in the 24 h before ICU admission from the ward.Anaesthesia.1999;54(6):529–534.
- ,,, et al.Antecedents to hospital deaths.Intern Med J.2001;31(6):343–348.
- ,,, et al.A comparison of antecedents to cardiac arrests, deaths and emergency intensive care admissions in Australia and New Zealand, and the United Kingdom: the ACADEMIA study.Resuscitation.2004;62(3):275–282.
- ,,,,.Anticipating events of in‐hospital cardiac arrest.Eur J Emerg Med.2004;11(1):24–28.
- ,,, et al.Duration of life‐threatening antecedents prior to intensive care admission.Intensive Care Med.2002;28(11):1629–1634.
- ,,,.The prevalence of recordings of the signs of critical conditions and emergency responses in hospital wards: the SOCCER study.Resuscitation.2005;65(2):149–157.
- ,,,,,.Hospital‐wide code rates and mortality before and after implementation of a rapid response team.JAMA.2008;300(21):2506–2513.
- ,,,,.Rapid response teams: a systematic review and meta‐analysis.Arch Intern Med.2010;170(1):18–26.
- ,. [Shock index.]Dtsch Med Wochenschr.1967;92(43):1947–50. [German]
- ,,,.A new method of classifying prognostic comorbidity in longitudinal studies: development and validation.J Chronic Dis.1987;40(5):373–83.
- ,.Matching in studies of classification accuracy: implications for analysis, efficiency, and assessment of incremental value.Biometrics.2008;64(1):1–9.
- ,,,.APACHE II: a severity of disease classification system.Crit Care Med.1985;13(10):818–829.
- ,.Outcome prediction in critical care: the Acute Physiology and Chronic Health Evaluation models.Curr Opin Crit Care.2008;14(5):491–497.
- ,,.APACHE II predicts long‐term survival in COPD patients admitted to a general medical ward.J Gen Intern Med.2003;18(10):824–830.
- ,,,.Validation of physiological scoring systems in the accident and emergency department.Emerg Med J.2006;23(11):841–845.
- ,,, et al;2001 SCCM/ESICM/ACCP/ATS/SIS International Sepsis Definitions Conference.Crit Care Med.2003;31(4):1250–1256.
- .Dear SIRS, I'm sorry to say that I don't like you...Crit Care Med.1997;25(2):372–374.
- ,.The inflammatory response to surgery and trauma.Curr Opin Crit Care.2006;12(4):325–332.
- ,,,,.Shock index in diagnosing early acute hypovolemia.Am J Emerg Med.2005;23(3):323–326.
- ,,,,.A comparison of the shock index and conventional vital signs to identify acute, critical illness in the emergency department.Ann Emerg Med.1994;24(4):685–690. Erratum in:Ann Emerg Med.year="1994"1994;24(6):1208.
- ,,,.Shock index: a re‐evaluation in acute circulatory failure.Resuscitation.1992;23(3):227–234.
- ,,,,, et al.Guidelines for intensive care unit admission, discharge, and triage. Task Force of the American College of Critical Care Medicine, Society of Critical Care Medicine.Crit Care Med.1999;27(3):633–638.
The decision to transfer a patient to the intensive care unit (ICU) from a general care setting is complex and based not only on clinical findings and patient wishes but also on the understanding that ICU resources are limited and costly.1 Adding to the decision‐making complexity is the knowledge that patients who transfer to an ICU from a general medical unit comprise the highest mortality group of ICU patients, with the mortality rate directly proportional to both the time spent on the general medical unit1, 2 and the number of physiologic abnormalities before ICU admission.3, 4
Prior studies have shown that cardiac arrest and unplanned (unexpected) transfers to the ICU are preceded by a period of physiologic instability reflected in the vital signs.510 However, vital signs alone may not accurately indicate clinical condition. For example, a person may be able to maintain normal blood pressure and heart rate despite severe illness or may have abnormal vital signs at baseline, which may be the case for an otherwise healthy young woman who has baseline low systolic blood pressure. Also, noncritical conditions commonly seen in hospitalized medical or surgical patients, such as anxiety or pain, may increase the respiratory rate or heart rate. Conversely, certain common medications, such as ‐blockers, may mask or blunt the normal physiologic response to illness. Overall, the prevalence of abnormal physiologic variables is high among hospitalized adult patients irrespective of the presence of serious adverse events.11 This prevalence may be a reason why 2 recent studies of inpatient medical emergency teams (METs) or rapid response teams (RRTs), which generally rely on vital signs for activation, failed to show a decrease in adult mortality rates.12, 13
Given the complexity of interpreting single vital sign readings, we evaluated a simple and clinically intuitive variable, the shock index (SI) (heart rate/systolic blood pressure, a noninvasive indication of left ventricular function),14 as a potential marker of the need for intensive care. Allgwer and Burri14 first developed the SI in studies of patients with acute blood loss, intraabdominal bleeding, fat emboli, and severe infections. They observed that a healthy adult had a mean SI of 0.54 (standard deviation [SD], 0.021), while an index of 1.0 indicated threatened shock and indices greater than 1.5 were seen in volume‐deficient shock.
We hypothesized that an elevated SI is a differentiating factor between a patient who had an unplanned ICU transfer and a general medical patient who did not require this higher level of care. To our knowledge, the SI has not been studied for this application previously.
Patients and Methods
Study Design
We conducted a retrospective case‐control study of 50 consecutive general medical patients who had unplanned transfers to the ICU and 50 matched control patients, with the approval of the Mayo Clinic Institutional Review Board. All patients were admitted to a general medical unit, and only patients who previously provided permission for their records to be used in research were included in the study.
Patients
This study enrolled patients who were at least 18 years old and who were admitted to a single general medical unit for 24 hours or longer. Patients were excluded if they required a surgical intervention, were transferred from another hospital, received care on a different general medical unit at any time during the hospitalization, or were pregnant. Our data collection began at the patients' (cases and controls) arrival on the general medical unit; we did not include data from any evaluation (outpatient or emergency department) before hospital admission.
Case Definition
An unplanned transfer was defined as an episode of unexpected clinical deterioration in a general medical patient that necessitated transfer to the ICU, as opposed to a preemptive or elective transfer following a procedure. Patients with unplanned transfers from December 9, 2003, to December 29, 2004, were eligible for the study. Only the first transfer to the ICU was considered for patients who had multiple ICU transfers during a single hospitalization. Because these data were collected before METs or RRTs were introduced at our institution, the recommendation for ICU transfer was a joint decision by the primary care team and the ICU team.
Control Definition
The matched controls were identified from among patients admitted to the general medical unit from January 16, 2002, to December 13, 2004. To reduce the effect of the heterogeneity inherent in general medical patients, we matched controls for age (within 5 years of age of the corresponding case), admission diagnosis code, and patient care unit of admission and required that they were admitted for at least 24 hours before dismissal. Patients who had an ICU stay during the same admission were excluded. The median difference in admission dates between the cases and the controls was 327 days, and 26 of the 50 matched pairs had admission dates within 1 year of each other. This lengthy interval between cases and controls was a consequence of the low incidence of patients who met the matching criteria.
Setting
This study involved the general medical units and ICUs of the 1157‐bed Saint Mary's Hospital, an academic tertiary care facility at Mayo Clinic in Rochester, Minnesota.
Vital Sign Determination
Vital signs abstracted for this study included blood pressure, heart rate, respiratory rate, oxygen saturation, and temperature. The SI was calculated for each set of abstracted vital signs. Staff nurses were responsible for the routine measurement and recording of vital signs at least once every 8 hours, although in several instances not all parameters were checked. In accordance with nursing policy, values outside the defined parameters were rechecked by the nursing supervisor of each care unit and, if found to be abnormal, were conveyed to the patient's physician. This system meant that abnormal results were checked by numerous observers, with differences in the frequency of recordings for individual patients.
Data Collection
Demographic data and information on the vital signs were abstracted through a comprehensive chart review. Demographic data included age, sex, ethnicity, comorbid conditions, hospital care unit, date and time of admission, admission diagnosis, date and time of transfer to the ICU, length of stay, dismissal date, and disposition at discharge. Comorbid conditions were scored using the Charlson Comorbidity Index.15
Statistical Analysis
A sample size of 50 matched pairs provided 81% power to detect an odds ratio of 3.0 or greater between cases and controls, with a 0.05, 2‐tailed level of significance with McNemar test. Patient demographic characteristics were summarized by the frequencies for categorical data and by mean and SD for continuous data. Consistent with the study design, the McNemar test and conditional logistic model analyses were used to determine the association between the SI and the risk of unplanned ICU transfer. Shock indices for the cases and controls were compared with use of t test. A P value <0.05 was considered statistically significant. For the SI, we calculated the odds ratio and its 95% confidence interval (CI) and P value using different cut points. We did not perform a receiver operating characteristics analysis because matching of cases and controls greatly complicates estimation of the sensitivity and specificity of the SI;16 a cohort study is suggested to investigate this analysis further. All statistical analyses were performed by SAS version 9.1.3 software (SAS Institute Inc, Cary, NC).
Results
A total of 50 pairs of matching cases and controls was included in this study. Table 1 lists the source of admission, demographic characteristics, and numbers of deaths for cases and controls. There were no statistically significant differences in admission source, age, sex, ethnicity, admission care unit, or Charlson Comorbidity Index. Mean length of stay was 14.8 days (SD, 9.7 days) for the cases and 5.7 days (SD, 6.3 days; P < 0.001) for the controls. Admission diagnoses were classified on the basis of the organ system of involvement (Table 2). In 30 of 50 cases, the admission diagnosis and the reason for ICU transfer were related.
| Value | Cases (n = 50) | Controls (n = 50) | P Value* |
|---|---|---|---|
| |||
| Emergency department admission, No. (%) | 33 (66) | 28 (56) | 0.41 |
| Direct admission, No. (%) | 14 (28) | 15 (30) | 1.00 |
| Other admission, No. (%) | 3 (6) | 7 (14) | 0.32 |
| Age, mean (SD), years | 69.8 (15.7) | 70.3 (15.8) | 0.38 |
| Male sex, No. (%) | 26 (52) | 18 (36) | 0.12 |
| Ethnicity, No. (%) | 1.00 | ||
| White | 46 (92) | 46 (92) | |
| Other | 4 (8) | 4 (8) | |
| Charlson Comorbidity index, mean (SD) | 3.06 (2.31) | 2.66 (2.02) | 0.22 |
| Hospital stay, mean (SD), day | 14.8 (9.7) | 5.7 (6.3) | 0.0007 |
| Hospital deaths, No. | 9 | 1 | 0.008 |
| Deaths within 30 days, No. | 5 | 2 | 0.24 |
| Deaths within 6 months, No. | 9 | 6 | 0.40 |
| System | Primary Admission Diagnosis | No. of Cases |
|---|---|---|
| Constitutional | Fever, malaise, general symptoms | 7 |
| Cardiovascular | Hypertension, congestive heart failure, chest pain, peripheral vascular disease, edema | 5 |
| Dermatologic | Cellulitis, foot ulcer, skin rash | 3 |
| Gastrointestinal | Pancreatitis, gastrointestinal hemorrhage, nausea and vomiting, diarrhea, abdominal pain | 6 |
| Hematologic | Thrombocytopenia, abnormal coagulation | 2 |
| Musculoskeletal | Lymphedema, shoulder pain, lumbago, back ache, closed dorsal vertebral fracture | 7 |
| Neurologic | Delirium tremens, psychosis, convulsions | 3 |
| Pulmonary | Pneumonia, food or vomit aspiration pneumonitis, shortness of breath, respiratory abnormality | 13 |
| Renal | Hyperkalemia, acute renal failure, renal artery atherosclerosis | 4 |
We reviewed the vital signs and shock indices for the 24 hours before ICU transfer for each case and over the entire hospitalization for each control, to determine the worst set (the lowest systolic blood pressure and the highest heart rate, respiratory rate, and SI). The cases had 1 to 22 complete sets of vitals for the 24 hours before ICU transfer; the median number of sets was 3 and the mean was 4. The controls had 1 to 12 complete sets for the 24 hours before the worst SI: the median was 3 sets and the mean was 3. In 26 of 50 controls, the worst SI occurred within the first 24 hours after admission. There was a significant difference between the median values of the worst shock indices of the cases and the controls (0.87 vs. 0.72; P < 0.005).
Table 3 shows the different values of the SI and the corresponding odds ratio of unplanned ICU transfer for cases compared with controls. The difference was significant at an SI of 0.85 and greater, indicating a strong association with unplanned ICU transfer.
| Shock Index | P Value | Odds Ratio | 95% CI |
|---|---|---|---|
| |||
| 0.8 | 0.05 | 2.43 | 1.015.86 |
| 0.85 | 0.02 | 3.00 | 1.917.56 |
| 0.9 | 0.007 | 7.50 | 1.7232.78 |
| 0.95 | <0.03 | 5.50 | 1.2224.81 |
We also found that the patients who transferred to the ICU had a greater number of inpatient deaths (9 cases vs. 1 control; P = 0.008), which would be expected, but there was no difference in 30‐day or 6‐month mortality rate (Table 1). One patient died after 30 days and while still hospitalized.
Comparison between the temporal trend of vital signs and the SI of the cases for the 24 hours before ICU transfer is shown in Figure 1. This graph shows the median of all the worst values (minimum systolic blood pressure and maximum SI, heart rate, and respiratory rate) over the four 6‐hour time periods (24 hours) preceding ICU transfer. Of note, the change in vital signs is subtle even while the SI increased to more than 0.8 as the patients clinically worsened before transfer.
Discussion
In our comparison of the SI of 50 patients who required unplanned (unexpected) transfer to the ICU with the SI of 50 matched controls who did not require this higher level of care, we found that a SI of 0.85 or greater was significantly associated with unplanned transfer to the ICU. The cases had a significantly higher worst SI than the controls, and they also had a significantly longer hospital stay and higher inpatient mortality rate, as would be expected for a sicker patient population. These findings are important given that the SI may be useful for assessing illness severity, for helping determine the need for transfer to the ICU, or for activating METs or RRTs.
A major problem with providing optimal care for hospitalized general medical patients is the inherent difficulty in determining illness severity and clinical decline, especially when the decline occurs gradually. Existing consensus recommendations for ICU admission include both specific diagnoses and arbitrary objective criteria based on abnormal vital signs and laboratory values.27 Also, individual institutions may have their own ICU admission requirements, which may differ from these or RRT criteria. Although vital signs are important as a snapshot of basic physiologic function, a number of noncritical conditions may lead to abnormal vital signs, and not all abnormal vital signs are associated with an adverse clinical event. By relying solely on vital signs, clinicians may not recognize critical illness and therefore not transfer a patient to the ICU or may inappropriately transfer a patient who does not need ICU‐level care.
Markers of illness severity other than vital signs, such as the Acute Physiology and Chronic Health Evaluation (APACHE) score, have been shown to predict the death of ICU patients17, 18 but have been rarely studied outside the ICU setting.19 Also, calculating the APACHE score is cumbersome, and there is no cutoff score that defines when a patient should be transferred to the ICU. Subbe et al.,20 in their study to identify critically ill patients, found that introduction of a physiological scoring system (including MET or RRT activation scores) would have identified only a small number of additional patients as critically ill. Another common marker of illness severity, the 4 criteria of the systemic inflammatory response syndrome (temperature <36C or >38C; heart rate >90 beats per minute; respiratory rate >20 breaths per minute or PCO2 <32 mm Hg; and white blood cell count >12,000/L or <4000/L or with more than 10% band cells)21 may be too sensitive to use as a decision aid, since even a healthy person running after a bus could have 2 of the 4 criteria.22 Likewise, surgical patients may have transient leukocytosis due to a stress response independent of an infection.23
The SI may be more accurate than vital signs alone to determine illness severity and who is at risk for an unplanned transfer to the ICU. Birkhahn et al.24 concluded that the SI may be more useful in early hemorrhage than either heart rate or systolic blood pressure alone. Rady et al.25 showed that the SI used in the emergency department can identify critical illness with apparently stable vital signs, where an elevation of the SI above 0.9 was associated with an illness that was treated immediately with admission to the hospital and intensive therapy on admission. However, it is unclear whether the SI can be used to monitor ongoing treatment, because a previous study showed that the SI may be of limited value in the assessment of systemic oxygen transport and response to therapy in clinical septic shock.26 Of note, the SI is mostly independent of the effects of pain or anxiety, which cause a concurrent rise in heart rate and systolic blood pressure. Because the heart's left ventricular work is unchanged or may increase from the underlying catecholamine surge, the SI will be unchanged or may actually decrease.
Our study adds to the medical literature the findings that: (1) the SI may be useful as an indicator of illness severity and a triage tool in patients with no trauma but with various medical conditions, and (2) the SI showed a strong association with unplanned ICU transfer.
The main strength of our study is its case‐control design with matched controls. Also, by comparing groups from the same patient care unit, we sought to minimize the selection bias that can be inherent in case‐control studies. Limitations include the retrospective, nonrandomized study design and the fact that there may have been variations in vital sign measurements by the multiple caregivers. However, the vital signs were taken according to standard hospital practice and reflect real‐world conditions. Although generalizability may be somewhat limited because of our homogeneous patient population, our patients had a wide range of various medical illnesses, so our study should be applicable to other hospital settings, both academic and community‐based.
One of the main weaknesses of our study is that the results were not adjusted for the burden of comorbid conditions, although there were no statistically significant differences in the number of comorbid conditions among the cases and the controls (P = 0.96). Also, we did not directly compare the SI with vital signs alone to determine superiority.
The SI may be an important objective measure to help clinicians decide when patients need treatment that is more aggressive, assistance from a MET or an RRT, or a preemptive, rather than unplanned, transfer to an ICU. Although it is unlikely that a single measure will allow accurate triage of all medical or surgical patients, the SI may be a useful adjunct to clinical judgment and other objective measures in determining illness severity and clinical decline. Further prospective studies are needed to compare the role of the SI specifically with MET or RRT activation criteria, to clarify the role of comorbid conditions in unplanned transfers to the ICU, to validate the cut point for the SI in various disease states, and to assess its utility in patients with septic shock. Depending on these results, it may be beneficial to incorporate the SI into the electronic medical record as an automatic alert to identify patients at risk for ICU transfer.
Conclusions
The SI is an easily calculated composite index of heart rate and systolic blood pressure. An elevated SI of 0.85 can identify patients who are at risk for unplanned transfer to the ICU from general patient care units. Future studies will determine whether the SI is more accurate than simple vital signs as an indicator of clinical decline. If so, it may be useful as a trigger to activate METs or RRTs for treatment.
- ,.Outcome of intensive care patients in a group of British intensive care units.Crit Care Med.1998;26(8):1337–1345.
- ,,,.The longer patients are in hospital before Intensive Care admission the higher their mortality.Intensive Care Med.2004;30(10):1908–1913.
- ,.Physiological abnormalities in early warning scores are related to mortality in adult inpatients.Br J Anaesth.2004;92(6):882–884.
- ,,,,.Association between clinically abnormal observations and subsequent in‐hospital mortality: a prospective study.Resuscitation.2004;62(2):137–141.
- ,,,,,.Recognising clinical instability in hospital patients before cardiac arrest or unplanned admission to intensive care: a pilot study in a tertiary‐care hospital.Med J Aust.1999;171(1):22–25.
- ,,.Physiological values and procedures in the 24 h before ICU admission from the ward.Anaesthesia.1999;54(6):529–534.
- ,,, et al.Antecedents to hospital deaths.Intern Med J.2001;31(6):343–348.
- ,,, et al.A comparison of antecedents to cardiac arrests, deaths and emergency intensive care admissions in Australia and New Zealand, and the United Kingdom: the ACADEMIA study.Resuscitation.2004;62(3):275–282.
- ,,,,.Anticipating events of in‐hospital cardiac arrest.Eur J Emerg Med.2004;11(1):24–28.
- ,,, et al.Duration of life‐threatening antecedents prior to intensive care admission.Intensive Care Med.2002;28(11):1629–1634.
- ,,,.The prevalence of recordings of the signs of critical conditions and emergency responses in hospital wards: the SOCCER study.Resuscitation.2005;65(2):149–157.
- ,,,,,.Hospital‐wide code rates and mortality before and after implementation of a rapid response team.JAMA.2008;300(21):2506–2513.
- ,,,,.Rapid response teams: a systematic review and meta‐analysis.Arch Intern Med.2010;170(1):18–26.
- ,. [Shock index.]Dtsch Med Wochenschr.1967;92(43):1947–50. [German]
- ,,,.A new method of classifying prognostic comorbidity in longitudinal studies: development and validation.J Chronic Dis.1987;40(5):373–83.
- ,.Matching in studies of classification accuracy: implications for analysis, efficiency, and assessment of incremental value.Biometrics.2008;64(1):1–9.
- ,,,.APACHE II: a severity of disease classification system.Crit Care Med.1985;13(10):818–829.
- ,.Outcome prediction in critical care: the Acute Physiology and Chronic Health Evaluation models.Curr Opin Crit Care.2008;14(5):491–497.
- ,,.APACHE II predicts long‐term survival in COPD patients admitted to a general medical ward.J Gen Intern Med.2003;18(10):824–830.
- ,,,.Validation of physiological scoring systems in the accident and emergency department.Emerg Med J.2006;23(11):841–845.
- ,,, et al;2001 SCCM/ESICM/ACCP/ATS/SIS International Sepsis Definitions Conference.Crit Care Med.2003;31(4):1250–1256.
- .Dear SIRS, I'm sorry to say that I don't like you...Crit Care Med.1997;25(2):372–374.
- ,.The inflammatory response to surgery and trauma.Curr Opin Crit Care.2006;12(4):325–332.
- ,,,,.Shock index in diagnosing early acute hypovolemia.Am J Emerg Med.2005;23(3):323–326.
- ,,,,.A comparison of the shock index and conventional vital signs to identify acute, critical illness in the emergency department.Ann Emerg Med.1994;24(4):685–690. Erratum in:Ann Emerg Med.year="1994"1994;24(6):1208.
- ,,,.Shock index: a re‐evaluation in acute circulatory failure.Resuscitation.1992;23(3):227–234.
- ,,,,, et al.Guidelines for intensive care unit admission, discharge, and triage. Task Force of the American College of Critical Care Medicine, Society of Critical Care Medicine.Crit Care Med.1999;27(3):633–638.
Copyright © 2010 Society of Hospital Medicine

Ultrasound Measurement to Estimate CVP
Severe sepsis and septic shock account for more than 750,000 hospital admissions and 215,000 deaths per year.1 Early fluid resuscitation is the cornerstone of treatment, and early goal‐directed therapy (EGDT), which includes a target central venous pressure (CVP) of 8 to 12 mm Hg, has been shown to improve outcomes, including mortality and length of stay.2 This goal allows appropriate initial resuscitation and may decrease the risk of excess fluid administration, which is related to adverse outcomes in critically ill patients.3 However, nonintensivists may not start early aggressive fluid resuscitation because of inability to accurately assess intravascular volume, concerns for inadvertent volume overload, or the difficulty of recognizing insidious illness. Assessment of volume status, primarily from inspection of the internal jugular vein to estimate CVP, is difficult to perform by clinical examination alone, especially if CVP is very low.4 Inspection of the external jugular vein is perhaps easier than inspecting the internal jugular vein and appears to accurately estimate CVP,5 but it does not allow the degree of precision necessary for EGDT. Echocardiography can estimate CVP based on respirophasic variation or collapsibility index, but this technique requires expensive equipment and sonographic expertise. The current gold standard technique for measuring CVP requires an invasive central venous catheter, which can delay timely resuscitation and is associated with complications.6
An alternative technique to guide resuscitation efforts should be accurate, safe, rapid, and easy to perform at the bedside, while providing real‐time measurement results. We hypothesized that CVP can be accurately assessed using noninvasive ultrasound imaging of the internal jugular vein, since jugular venous pressure is essentially equal to CVP.7 Specifically, our study estimated the diagnostic accuracy of ultrasound measurement of the aspect ratio (height/width) of the internal jugular vein compared with the invasively measured CVP target for EGDT. We expected that a lower aspect ratio would correlate with a lower CVP and a higher aspect ratio would correlate with a higher CVP.
Methods
Volunteers were enrolled at Saint Mary's Hospital (Mayo Clinic) in Rochester, MN, from January to March 2006, and patients were enrolled at Saint Mary's Hospital and at Abbott Northwestern Hospital (Allina Hospitals and Clinics) in Minneapolis, MN, from May 2006 to October 2007. The study was approved by the Institutional Review Boards of Mayo Clinic and Allina and had 2 phases. The first phase comprised ultrasound measurements of internal jugular vein aspect ratio and determination of intraobserver and interobserver agreement in healthy volunteers. The second phase involved measurement of internal jugular vein aspect ratio and invasive CVP in a convenience sample of 44 spontaneously breathing patients admitted to medical intensive care units: 9 patients at Saint Marys Hospital and 35 patients at Abbott Northwestern Hospital. Patients were enrolled only when study members were on duty in the intensive care unit and able to perform study measurements. As a result, a high proportion of patients who may have been eligible were not asked to participate.
Each volunteer was deemed euvolemic on the basis of normal orthostatic measurements and normal oral intake with no vomiting or diarrhea in the previous 5 days. Measurements of 19 volunteers were made by 1 author (A.S.K.), with subsequent measurements of 15 of the volunteers made by another author (O.G.) to determine interobserver variability; 4 participants did not undergo a second measurement because of scheduling conflicts.
Inclusion and exclusion criteria for the critically ill patients are provided in Table 1. Recruitment was based on presenting symptoms and test results that led the intensive care unit physicians to decide to place a CVP monitor. All the enrolled patients had invasive CVP measurement performed approximately 30 to 40 minutes after ultrasound measurement of the internal jugular vein; this delay was the time required to place the central line and obtain the measurement. All patients who were invited to participate in the study were included. No patients were excluded on the basis of the exclusion criteria or because of inability to place a central line. No complications related to central line placement occurred.
| Inclusion criteria |
| 1. Aged 18 years or older |
| 2. Admission to the intensive care unit |
| 3. Spontaneously breathing (not intubated/ventilated) |
| 4. Planned insertion of a central venous pressure monitor for therapy |
| Exclusion criteria |
| 1. Known cervical spine injuries or fusion |
| 2. Nonremovable cervical collars |
| 3. Surgical dressings that would prevent visualization of the internal jugular vein |
| 4. Inability of the patient to be properly positioned |
| 5. A code situation |
We followed a prescribed measurement technique (Table 2) to determine the internal jugular vein aspect ratio in all volunteers and patients. Measurements of the volunteers were made with a Site‐Rite 3 Ultrasound System (Bard Access Systems, Inc., Salt Lake City, UT) using a 9.0‐MHz transducer. Measurements of the critically ill patients were made with a SonoSite MicroMaxx ultrasound system (SonoSite, Inc., Bothell, WA) using a 10.5‐MHz transducer. Study team physicians initially were blinded to actual measured CVP. Internal jugular vein aspect ratio and CVP were measured at tidal volume end‐expiration for all patients. One measurement was obtained for each patient, with measurements being made by 1 of 4 physicians (2 intensivists, 1 critical care fellow, and 1 chief medicine resident). With no specific ultrasound training and with only minimal practice, the physicians could obtain the optimal aspect ratio within a few seconds (Figure 1).

| 1. Position the patient supine (0) with head and legs flat, ensuring overall comfort. A small pillow can be used to help keep head, neck, and trunk aligned |
| 2. Have the patient rotate his or her head slightly to the side (<30) to expose the internal jugular vein |
| 3. Place the transducer transversely on the patient's neck over the expected location of the internal jugular vein. The transducer should be perpendicular to the patient's neck |
| 4. Apply slight pressure to the transducer to locate the internal jugular vein on the view screen. Use the minimum pressure necessary to obtain a good quality ultrasound image |
| 5. Once the internal jugular vein is found, adjust the position of the transducer over the vein to obtain the most circular cross‐sectional image |
| 6. Have the patient breathe normally, then ask him or her to briefly stop breathing at normal (tidal volume) end‐expiration |
| 7. Store the best end‐expiration image (in which the internal jugular vein appears most circular) and have the patient resume normal breathing |
| 8. Measure the height and width of the internal jugular vein using the built‐in cursor function or a ruler |
This was an exploratory prospective study, and all methods of data collection were designed before patient enrollment. However, the ultrasound‐derived aspect ratio of 0.83 (which defined a CVP of 8 mm Hg) was determined post hoc to maximize sensitivity and specificity and was based on the aspect ratio of the euvolemic volunteers and the inflection point of the CVP vs aspect ratio curve for the critically ill patients.
Statistical Analysis
Groups were compared using the 2 test for differences in proportions and the Wilcoxon rank sum test for continuous data. P < 0.05 was considered statistically significant. Bland‐Altman plots were used to describe the bias and variability of the aspect ratio within and between observers.8 This technique compares 2 methods of measurement to determine agreement and repeatability by plotting the mean of the differences (which should be zero) and the upper and lower limits of agreement (1.96 standard deviations [SDs] of those differences above and below the mean). Results were calculated using the available data; there was no adjustment for missing data. Analyses were performed using SPLUS and SAS/STAT software (SAS Institute, Inc., Cary, NC).
Results
We first evaluated 19 white volunteers: 12 women and 7 men. Mean (SD) age was 42 (11) years and mean body mass index was 26.6 (4.5) kg/m2. Mean arterial pressure was 89 (13) mm Hg and mean heart rate was 71 (15) beats/minute. Mean aspect ratio of the right and left internal jugular vein for all volunteers was 0.82 (0.07). There was no difference in aspect ratio between the right (0.83 [0.10]) and left (0.81 [0.13]) vein (P > 0.10). Also, no difference in the aspect ratio was seen between men (0.81 [0.08]) and women (0.83 [0.07]) (P = 0.77). Bland‐Altman analysis indicated moderate intraobserver and interobserver agreement for the aspect ratio measurements (Figure 2).
We then compared the aspect ratio measured using ultrasound and CVP measured with an invasive monitor for 44 spontaneously breathing critically ill patients (22 women and 22 men; 38 were white). Mean (SD) age was 66 (14) years and mean body mass index was 28.8 (9.1) kg/m2. Mean arterial pressure (n = 36) was 67 (12) mm Hg and mean heart rate (n = 34) was 92 (22) beats/minute. Systemic inflammatory response syndrome (SIRS) criteria were present in 23 of 40 patients; complete data were unavailable for the other 4 patients. Of these 40 patients, 20 had sepsis, 15 had severe sepsis, and 5 had septic shock. The most common diagnoses were gastrointestinal tract bleeding in 6 patients and congestive heart failure in 4 patients. Acute Physiology and Chronic Health Evaluation (APACHE III) score, available for 8 of the 9 patients at Saint Marys Hospital, was 63 (10).
Figure 3 shows measured aspect ratios vs. invasively measured CVP for the critically ill patients. The curvilinear result is consistent with venous and right ventricular compliance ( volume/ pressure) characteristics. Note that the inflection point (beginning of the increased slope) of the curve corresponds to a CVP of about 8 mm Hg. Furthermore, the aspect ratio (0.8) at this point is the same as that seen in the euvolemic volunteers. These findings suggest that, in spontaneously breathing patients, a CVP of about 8 mm Hg and an aspect ratio of about 0.8 each defines the beginning of the plateau on the cardiac Frank‐Starling curve.
Ultrasound imaging of the internal jugular vein aspect ratio accurately estimated the CVP target of 8 mm Hg based on the area under the receiver operating characteristics curve of 0.84 (95% confidence interval [CI], 0.72‐0.96) (Figure 4). For an invasively measured CVP of less than 8 mm Hg, the likelihood ratio for a positive ultrasound test result (aspect ratio < 0.83) was 3.5 (95% CI, 1.4‐8.4) and for a negative test result (aspect ratio 0.83) was 0.30 (95% CI, 0.14‐0.62). Clinically, this means that patients with a measured aspect ratio of less than 0.83 require further fluid resuscitation, whereas patients with a measured aspect ratio of 0.83 or greater are less likely to benefit from fluid resuscitation.
Discussion
This study demonstrated that the EGDT CVP target of 8 to 12 mm Hg can be accurately estimated (referenced to invasive CVP monitoring) using noninvasive ultrasound measurement of the internal jugular vein in spontaneously breathing critically ill patients. The measurement process is simple to perform at the bedside and moderately reliable when performed by different observers; also, the results appear to be equivalent for both sides and for males or females. Images can be stored electronically for serial comparisons and for viewing by other caregivers. Because the aspect ratio is essentially constant over the length of the internal jugular vein, unlike diameter, measurements can be performed anywhere along the vein. Also, ultrasound imaging allows visualization of the internal jugular vein despite anatomic variation.9
Previous attempts at noninvasive hemodynamic monitoring using plethysmography, thoracic electrical bioimpedance, and external Doppler probes have shown these methods to be cumbersome or inaccurate.1013 Other investigators have used echocardiography14, 15 and handheld ultrasound16 to image the diameter of the inferior vena cava in order to assess intravascular volume status, but these techniques require expertise in sonographic imaging. An alternative technique is to measure peripheral venous pressure, which correlates with CVP.17 This method, however, requires technical expertise to zero the monitor and is not yet widely used for critically ill patients. A literature search found 1 letter to the editor suggesting that real‐time ultrasound imaging of the internal jugular vein could be used to qualitatively determine jugular venous pressure18 and 3 studies using ultrasound in conjunction with a pressure transducer or manometer to determine the pressure needed to collapse the vein (either the internal jugular or a peripheral vein), with subsequent correlation to CVP.1921 These latter techniques appear to be cumbersome and require custom equipment that is not readily available in most hospitals.
Any measurement of CVP, including our technique, assumes correlation with volume responsiveness as a surrogate for intravascular volume. However, CVP is governed by multiple physiologic and pathologic factors, including intravascular volume, vascular and ventricular compliance, ventricular function, tricuspid stenosis and regurgitation, cardiac tamponade, and atrioventricular dissociation.22, 23 Therefore, CVP alone may not be an accurate measure of volume responsiveness (intravascular volume). CVP may also have spontaneous variation similar to pulmonary capillary wedge pressure, which can be as high as 7 mm Hg in any given patient.24 Furthermore, invasive CVP monitors also have limitations, and the overall accuracy of the Philips system used at Saint Marys Hospital is 4% of the reading or 4 mm Hg, whichever is greater.25 Nonetheless, the EGDT algorithm that incorporates CVP measurement with a target of 8 to 12 mm Hg in spontaneously breathing patients and 12 mm Hg in mechanically ventilated patients has resulted in decreased mortality among patients with severe sepsis and is recommended by the Surviving Sepsis Campaign guidelines26 and the Institute for Healthcare Improvement.27
These study results are important because nonintensivists such as hospitalists and emergency department physicians can use this technique to provide rapid fluid resuscitation early in the course of severe sepsis and septic shock, when aggressive fluid resuscitation is most effective. Ultrasound imaging of the internal jugular vein is easy to perform without formal training, and the equipment is readily available in most hospitals. Future studies will evaluate outcomes in spontaneously breathing and ventilated patients to determine the accuracy of this measurement technique in volume‐depleted and volume‐overloaded states. If validated in different patient populations, ultrasound measurement of the internal jugular vein could substitute for the EGDT CVP target in critically ill patients and allow early aggressive fluid resuscitation before a central venous catheter is placed.
Limitations
This exploratory study enrolled a small convenience sample of primarily white patients. The convenience sample is potentially prone to selection bias since a majority of patients who may have been eligible were never asked to participate. Also, not all patients had sepsis syndrome; our intention was to measure CVP and aspect ratio for available critically ill patients. Accordingly, results may be different depending on severity of illness. In addition, some of the patients were transferred from outside medical centers or from emergency departments and therefore may have already been partly resuscitated. Another limitation is that the intraobserver and interobserver variability for the healthy volunteers showed only moderate agreement, possibly indicating limited repeatability, although these results could be due to the small sample size. Also, we did not determine intraobserver and interobserver variability for the critically ill patients; results may be different from those of the healthy volunteers. Furthermore, underlying conditions such as tricuspid stenosis or regurgitation and cardiac tamponade may affect measurement results, but we included all patients without formal assessment, since treatment was performed on an urgent/emergent basis as would happen in real clinical settings.
Acknowledgements
The authors dedicate this work to their patients with severe sepsis. They thank Lisa Kirkland, MD, and Murat Yilmaz, MD, for their assistance with this study. They also thank the Mayo Clinic Divisions of General Internal Medicine and Pulmonary and Critical Care Medicine for funding.
- ,,,,,.Epidemiology of severe sepsis in the United States: analysis of incidence, outcome, and associated costs of care.Crit Care Med.2001;29(7):1303–1310.
- ,,, et al.Early Goal‐Directed Therapy Collaborative Group. Early goal‐directed therapy in the treatment of severe sepsis and septic shock.N Engl J Med.2001;345(19):1368–1377.
- ,.Fluid therapy in resuscitated sepsis: less is more.Chest.2008;133(1):252–263.
- ,.The rational clinical examination: does this patient have abnormal central venous pressure?JAMA.1996;275(8):630–634.
- ,,,,,.Usefulness of the external jugular vein examination in detecting abnormal central venous pressure in critically ill patients.Arch Intern Med.2006;166(19):2132–2137.
- ,.Central venous catheterization.Crit Care Med.2007;35(5):1390–1396.
- .How to use central venous pressure measurements.Curr Opin Crit Care.2005;11(3):264–270.
- ,.Statistical methods for assessing agreement between two methods of clinical measurement.Lancet.1986;1(8476):307–310.
- ,.Anatomical variations of internal jugular vein location: impact on central venous access.Crit Care Med.1991;19(12):1516–1519.
- ,,.Noninvasive measurement of central venous pressure by neck inductive plethysmography.Chest.1991;100(2):371–375.
- ,,, et al.A new noninvasive method to determine central venous pressure.Resuscitation.2006;70(2):238–246.
- .Advances in critical care monitoring.Arch Surg.1997;132(7):734–739.
- ,,, et al.Continuous recording of pulmonary artery diastolic pressure and cardiac output using a novel ultrasound transducer.J Am Soc Echocardiogr.2002;15(11):1381–1386.
- ,,,,.Measurement of anterior‐posterior diameter of inferior vena cava by ultrasonography: a new non‐invasive method to assess acute changes in vascular filling state.Cardiovasc Res.1994;28(8):1269–1272.
- ,,,.Utility of the inferior vena cava diameter as a marker of dry weight in nonoliguric hemodialyzed patients.ASAIO J.2001;47(5):528–532.
- ,,, et al.Handcarried ultrasound measurement of the inferior vena cava for assessment of intravascular volume status in the outpatient hemodialysis clinic.Clin J Am Soc Nephrol.2006;1(4):749–753.
- ,,, et al.Comparison of peripheral and central venous pressures in critically ill patients.Anaesth Intensive Care.2003;31(1):34–39.
- .Determination of elevated jugular venous pressure by real‐time ultrasound.Ann Emerg Med.1999;34(1):115.
- ,,,.Ultrasound‐guided noninvasive measurement of a patient's central venous pressure.Conf Proc IEEE Eng Med Biol Soc.2006;1:3843–3849.
- ,,, et al.Noninvasive central venous pressure measurement by controlled compression sonography at the forearm.J Am Coll Cardiol.2007;50(16):1584–1589.
- ,,,,,.Estimation of central venous pressure by ultrasound.Resuscitation.2005;64(2):193–199.
- ,,, et al.Determination of total effective vascular compliance in patients with sepsis syndrome.Am J Respir Crit Care Med.1998;157(1):50–56.
- ,,.Central venous pressure: uses and limitations. In: Pinsky MR, Payen D, eds.Functional Hemodynamic Monitoring.Berlin, Germany:Springer‐Verlag Berlin Heidelberg;2006:101.
- ,.Normal fluctuations in pulmonary artery and pulmonary capillary wedge pressures in acutely ill patients.Heart Lung.1982;11(5):393–398.
- Philips M3012A Data Sheet.Hemodynamic extension to the multi‐measurement server.Amsterdam:Koninklijke Philips Electronics N.V.;2003.
- ,,, et al.Surviving Sepsis Campaign Management Guidelines Committee. Surviving Sepsis Campaign guidelines for management of severe sepsis and septic shock.Crit Care Med.2004;32(3):858–873. [Erratua: Crit Care Med. 2004;32(6):1448. Correction of dosage error in text. Crit Care Med. 2004;32(10):2169–2170.]
- Institute for Healthcare Improvement.Sepsis.Cambridge, MA:Institute for Healthcare Improvement. Available at:http://www.ihi.org/IHI/Topics/CriticalCare/Sepsis. Accessed March 2009.
Severe sepsis and septic shock account for more than 750,000 hospital admissions and 215,000 deaths per year.1 Early fluid resuscitation is the cornerstone of treatment, and early goal‐directed therapy (EGDT), which includes a target central venous pressure (CVP) of 8 to 12 mm Hg, has been shown to improve outcomes, including mortality and length of stay.2 This goal allows appropriate initial resuscitation and may decrease the risk of excess fluid administration, which is related to adverse outcomes in critically ill patients.3 However, nonintensivists may not start early aggressive fluid resuscitation because of inability to accurately assess intravascular volume, concerns for inadvertent volume overload, or the difficulty of recognizing insidious illness. Assessment of volume status, primarily from inspection of the internal jugular vein to estimate CVP, is difficult to perform by clinical examination alone, especially if CVP is very low.4 Inspection of the external jugular vein is perhaps easier than inspecting the internal jugular vein and appears to accurately estimate CVP,5 but it does not allow the degree of precision necessary for EGDT. Echocardiography can estimate CVP based on respirophasic variation or collapsibility index, but this technique requires expensive equipment and sonographic expertise. The current gold standard technique for measuring CVP requires an invasive central venous catheter, which can delay timely resuscitation and is associated with complications.6
An alternative technique to guide resuscitation efforts should be accurate, safe, rapid, and easy to perform at the bedside, while providing real‐time measurement results. We hypothesized that CVP can be accurately assessed using noninvasive ultrasound imaging of the internal jugular vein, since jugular venous pressure is essentially equal to CVP.7 Specifically, our study estimated the diagnostic accuracy of ultrasound measurement of the aspect ratio (height/width) of the internal jugular vein compared with the invasively measured CVP target for EGDT. We expected that a lower aspect ratio would correlate with a lower CVP and a higher aspect ratio would correlate with a higher CVP.
Methods
Volunteers were enrolled at Saint Mary's Hospital (Mayo Clinic) in Rochester, MN, from January to March 2006, and patients were enrolled at Saint Mary's Hospital and at Abbott Northwestern Hospital (Allina Hospitals and Clinics) in Minneapolis, MN, from May 2006 to October 2007. The study was approved by the Institutional Review Boards of Mayo Clinic and Allina and had 2 phases. The first phase comprised ultrasound measurements of internal jugular vein aspect ratio and determination of intraobserver and interobserver agreement in healthy volunteers. The second phase involved measurement of internal jugular vein aspect ratio and invasive CVP in a convenience sample of 44 spontaneously breathing patients admitted to medical intensive care units: 9 patients at Saint Marys Hospital and 35 patients at Abbott Northwestern Hospital. Patients were enrolled only when study members were on duty in the intensive care unit and able to perform study measurements. As a result, a high proportion of patients who may have been eligible were not asked to participate.
Each volunteer was deemed euvolemic on the basis of normal orthostatic measurements and normal oral intake with no vomiting or diarrhea in the previous 5 days. Measurements of 19 volunteers were made by 1 author (A.S.K.), with subsequent measurements of 15 of the volunteers made by another author (O.G.) to determine interobserver variability; 4 participants did not undergo a second measurement because of scheduling conflicts.
Inclusion and exclusion criteria for the critically ill patients are provided in Table 1. Recruitment was based on presenting symptoms and test results that led the intensive care unit physicians to decide to place a CVP monitor. All the enrolled patients had invasive CVP measurement performed approximately 30 to 40 minutes after ultrasound measurement of the internal jugular vein; this delay was the time required to place the central line and obtain the measurement. All patients who were invited to participate in the study were included. No patients were excluded on the basis of the exclusion criteria or because of inability to place a central line. No complications related to central line placement occurred.
| Inclusion criteria |
| 1. Aged 18 years or older |
| 2. Admission to the intensive care unit |
| 3. Spontaneously breathing (not intubated/ventilated) |
| 4. Planned insertion of a central venous pressure monitor for therapy |
| Exclusion criteria |
| 1. Known cervical spine injuries or fusion |
| 2. Nonremovable cervical collars |
| 3. Surgical dressings that would prevent visualization of the internal jugular vein |
| 4. Inability of the patient to be properly positioned |
| 5. A code situation |
We followed a prescribed measurement technique (Table 2) to determine the internal jugular vein aspect ratio in all volunteers and patients. Measurements of the volunteers were made with a Site‐Rite 3 Ultrasound System (Bard Access Systems, Inc., Salt Lake City, UT) using a 9.0‐MHz transducer. Measurements of the critically ill patients were made with a SonoSite MicroMaxx ultrasound system (SonoSite, Inc., Bothell, WA) using a 10.5‐MHz transducer. Study team physicians initially were blinded to actual measured CVP. Internal jugular vein aspect ratio and CVP were measured at tidal volume end‐expiration for all patients. One measurement was obtained for each patient, with measurements being made by 1 of 4 physicians (2 intensivists, 1 critical care fellow, and 1 chief medicine resident). With no specific ultrasound training and with only minimal practice, the physicians could obtain the optimal aspect ratio within a few seconds (Figure 1).
| 1. Position the patient supine (0) with head and legs flat, ensuring overall comfort. A small pillow can be used to help keep head, neck, and trunk aligned |
| 2. Have the patient rotate his or her head slightly to the side (<30) to expose the internal jugular vein |
| 3. Place the transducer transversely on the patient's neck over the expected location of the internal jugular vein. The transducer should be perpendicular to the patient's neck |
| 4. Apply slight pressure to the transducer to locate the internal jugular vein on the view screen. Use the minimum pressure necessary to obtain a good quality ultrasound image |
| 5. Once the internal jugular vein is found, adjust the position of the transducer over the vein to obtain the most circular cross‐sectional image |
| 6. Have the patient breathe normally, then ask him or her to briefly stop breathing at normal (tidal volume) end‐expiration |
| 7. Store the best end‐expiration image (in which the internal jugular vein appears most circular) and have the patient resume normal breathing |
| 8. Measure the height and width of the internal jugular vein using the built‐in cursor function or a ruler |
This was an exploratory prospective study, and all methods of data collection were designed before patient enrollment. However, the ultrasound‐derived aspect ratio of 0.83 (which defined a CVP of 8 mm Hg) was determined post hoc to maximize sensitivity and specificity and was based on the aspect ratio of the euvolemic volunteers and the inflection point of the CVP vs aspect ratio curve for the critically ill patients.
Statistical Analysis
Groups were compared using the 2 test for differences in proportions and the Wilcoxon rank sum test for continuous data. P < 0.05 was considered statistically significant. Bland‐Altman plots were used to describe the bias and variability of the aspect ratio within and between observers.8 This technique compares 2 methods of measurement to determine agreement and repeatability by plotting the mean of the differences (which should be zero) and the upper and lower limits of agreement (1.96 standard deviations [SDs] of those differences above and below the mean). Results were calculated using the available data; there was no adjustment for missing data. Analyses were performed using SPLUS and SAS/STAT software (SAS Institute, Inc., Cary, NC).
Results
We first evaluated 19 white volunteers: 12 women and 7 men. Mean (SD) age was 42 (11) years and mean body mass index was 26.6 (4.5) kg/m2. Mean arterial pressure was 89 (13) mm Hg and mean heart rate was 71 (15) beats/minute. Mean aspect ratio of the right and left internal jugular vein for all volunteers was 0.82 (0.07). There was no difference in aspect ratio between the right (0.83 [0.10]) and left (0.81 [0.13]) vein (P > 0.10). Also, no difference in the aspect ratio was seen between men (0.81 [0.08]) and women (0.83 [0.07]) (P = 0.77). Bland‐Altman analysis indicated moderate intraobserver and interobserver agreement for the aspect ratio measurements (Figure 2).
We then compared the aspect ratio measured using ultrasound and CVP measured with an invasive monitor for 44 spontaneously breathing critically ill patients (22 women and 22 men; 38 were white). Mean (SD) age was 66 (14) years and mean body mass index was 28.8 (9.1) kg/m2. Mean arterial pressure (n = 36) was 67 (12) mm Hg and mean heart rate (n = 34) was 92 (22) beats/minute. Systemic inflammatory response syndrome (SIRS) criteria were present in 23 of 40 patients; complete data were unavailable for the other 4 patients. Of these 40 patients, 20 had sepsis, 15 had severe sepsis, and 5 had septic shock. The most common diagnoses were gastrointestinal tract bleeding in 6 patients and congestive heart failure in 4 patients. Acute Physiology and Chronic Health Evaluation (APACHE III) score, available for 8 of the 9 patients at Saint Marys Hospital, was 63 (10).
Figure 3 shows measured aspect ratios vs. invasively measured CVP for the critically ill patients. The curvilinear result is consistent with venous and right ventricular compliance ( volume/ pressure) characteristics. Note that the inflection point (beginning of the increased slope) of the curve corresponds to a CVP of about 8 mm Hg. Furthermore, the aspect ratio (0.8) at this point is the same as that seen in the euvolemic volunteers. These findings suggest that, in spontaneously breathing patients, a CVP of about 8 mm Hg and an aspect ratio of about 0.8 each defines the beginning of the plateau on the cardiac Frank‐Starling curve.
Ultrasound imaging of the internal jugular vein aspect ratio accurately estimated the CVP target of 8 mm Hg based on the area under the receiver operating characteristics curve of 0.84 (95% confidence interval [CI], 0.72‐0.96) (Figure 4). For an invasively measured CVP of less than 8 mm Hg, the likelihood ratio for a positive ultrasound test result (aspect ratio < 0.83) was 3.5 (95% CI, 1.4‐8.4) and for a negative test result (aspect ratio 0.83) was 0.30 (95% CI, 0.14‐0.62). Clinically, this means that patients with a measured aspect ratio of less than 0.83 require further fluid resuscitation, whereas patients with a measured aspect ratio of 0.83 or greater are less likely to benefit from fluid resuscitation.
Discussion
This study demonstrated that the EGDT CVP target of 8 to 12 mm Hg can be accurately estimated (referenced to invasive CVP monitoring) using noninvasive ultrasound measurement of the internal jugular vein in spontaneously breathing critically ill patients. The measurement process is simple to perform at the bedside and moderately reliable when performed by different observers; also, the results appear to be equivalent for both sides and for males or females. Images can be stored electronically for serial comparisons and for viewing by other caregivers. Because the aspect ratio is essentially constant over the length of the internal jugular vein, unlike diameter, measurements can be performed anywhere along the vein. Also, ultrasound imaging allows visualization of the internal jugular vein despite anatomic variation.9
Previous attempts at noninvasive hemodynamic monitoring using plethysmography, thoracic electrical bioimpedance, and external Doppler probes have shown these methods to be cumbersome or inaccurate.1013 Other investigators have used echocardiography14, 15 and handheld ultrasound16 to image the diameter of the inferior vena cava in order to assess intravascular volume status, but these techniques require expertise in sonographic imaging. An alternative technique is to measure peripheral venous pressure, which correlates with CVP.17 This method, however, requires technical expertise to zero the monitor and is not yet widely used for critically ill patients. A literature search found 1 letter to the editor suggesting that real‐time ultrasound imaging of the internal jugular vein could be used to qualitatively determine jugular venous pressure18 and 3 studies using ultrasound in conjunction with a pressure transducer or manometer to determine the pressure needed to collapse the vein (either the internal jugular or a peripheral vein), with subsequent correlation to CVP.1921 These latter techniques appear to be cumbersome and require custom equipment that is not readily available in most hospitals.
Any measurement of CVP, including our technique, assumes correlation with volume responsiveness as a surrogate for intravascular volume. However, CVP is governed by multiple physiologic and pathologic factors, including intravascular volume, vascular and ventricular compliance, ventricular function, tricuspid stenosis and regurgitation, cardiac tamponade, and atrioventricular dissociation.22, 23 Therefore, CVP alone may not be an accurate measure of volume responsiveness (intravascular volume). CVP may also have spontaneous variation similar to pulmonary capillary wedge pressure, which can be as high as 7 mm Hg in any given patient.24 Furthermore, invasive CVP monitors also have limitations, and the overall accuracy of the Philips system used at Saint Marys Hospital is 4% of the reading or 4 mm Hg, whichever is greater.25 Nonetheless, the EGDT algorithm that incorporates CVP measurement with a target of 8 to 12 mm Hg in spontaneously breathing patients and 12 mm Hg in mechanically ventilated patients has resulted in decreased mortality among patients with severe sepsis and is recommended by the Surviving Sepsis Campaign guidelines26 and the Institute for Healthcare Improvement.27
These study results are important because nonintensivists such as hospitalists and emergency department physicians can use this technique to provide rapid fluid resuscitation early in the course of severe sepsis and septic shock, when aggressive fluid resuscitation is most effective. Ultrasound imaging of the internal jugular vein is easy to perform without formal training, and the equipment is readily available in most hospitals. Future studies will evaluate outcomes in spontaneously breathing and ventilated patients to determine the accuracy of this measurement technique in volume‐depleted and volume‐overloaded states. If validated in different patient populations, ultrasound measurement of the internal jugular vein could substitute for the EGDT CVP target in critically ill patients and allow early aggressive fluid resuscitation before a central venous catheter is placed.
Limitations
This exploratory study enrolled a small convenience sample of primarily white patients. The convenience sample is potentially prone to selection bias since a majority of patients who may have been eligible were never asked to participate. Also, not all patients had sepsis syndrome; our intention was to measure CVP and aspect ratio for available critically ill patients. Accordingly, results may be different depending on severity of illness. In addition, some of the patients were transferred from outside medical centers or from emergency departments and therefore may have already been partly resuscitated. Another limitation is that the intraobserver and interobserver variability for the healthy volunteers showed only moderate agreement, possibly indicating limited repeatability, although these results could be due to the small sample size. Also, we did not determine intraobserver and interobserver variability for the critically ill patients; results may be different from those of the healthy volunteers. Furthermore, underlying conditions such as tricuspid stenosis or regurgitation and cardiac tamponade may affect measurement results, but we included all patients without formal assessment, since treatment was performed on an urgent/emergent basis as would happen in real clinical settings.
Acknowledgements
The authors dedicate this work to their patients with severe sepsis. They thank Lisa Kirkland, MD, and Murat Yilmaz, MD, for their assistance with this study. They also thank the Mayo Clinic Divisions of General Internal Medicine and Pulmonary and Critical Care Medicine for funding.
- ,,,,,.Epidemiology of severe sepsis in the United States: analysis of incidence, outcome, and associated costs of care.Crit Care Med.2001;29(7):1303–1310.
- ,,, et al.Early Goal‐Directed Therapy Collaborative Group. Early goal‐directed therapy in the treatment of severe sepsis and septic shock.N Engl J Med.2001;345(19):1368–1377.
- ,.Fluid therapy in resuscitated sepsis: less is more.Chest.2008;133(1):252–263.
- ,.The rational clinical examination: does this patient have abnormal central venous pressure?JAMA.1996;275(8):630–634.
- ,,,,,.Usefulness of the external jugular vein examination in detecting abnormal central venous pressure in critically ill patients.Arch Intern Med.2006;166(19):2132–2137.
- ,.Central venous catheterization.Crit Care Med.2007;35(5):1390–1396.
- .How to use central venous pressure measurements.Curr Opin Crit Care.2005;11(3):264–270.
- ,.Statistical methods for assessing agreement between two methods of clinical measurement.Lancet.1986;1(8476):307–310.
- ,.Anatomical variations of internal jugular vein location: impact on central venous access.Crit Care Med.1991;19(12):1516–1519.
- ,,.Noninvasive measurement of central venous pressure by neck inductive plethysmography.Chest.1991;100(2):371–375.
- ,,, et al.A new noninvasive method to determine central venous pressure.Resuscitation.2006;70(2):238–246.
- .Advances in critical care monitoring.Arch Surg.1997;132(7):734–739.
- ,,, et al.Continuous recording of pulmonary artery diastolic pressure and cardiac output using a novel ultrasound transducer.J Am Soc Echocardiogr.2002;15(11):1381–1386.
- ,,,,.Measurement of anterior‐posterior diameter of inferior vena cava by ultrasonography: a new non‐invasive method to assess acute changes in vascular filling state.Cardiovasc Res.1994;28(8):1269–1272.
- ,,,.Utility of the inferior vena cava diameter as a marker of dry weight in nonoliguric hemodialyzed patients.ASAIO J.2001;47(5):528–532.
- ,,, et al.Handcarried ultrasound measurement of the inferior vena cava for assessment of intravascular volume status in the outpatient hemodialysis clinic.Clin J Am Soc Nephrol.2006;1(4):749–753.
- ,,, et al.Comparison of peripheral and central venous pressures in critically ill patients.Anaesth Intensive Care.2003;31(1):34–39.
- .Determination of elevated jugular venous pressure by real‐time ultrasound.Ann Emerg Med.1999;34(1):115.
- ,,,.Ultrasound‐guided noninvasive measurement of a patient's central venous pressure.Conf Proc IEEE Eng Med Biol Soc.2006;1:3843–3849.
- ,,, et al.Noninvasive central venous pressure measurement by controlled compression sonography at the forearm.J Am Coll Cardiol.2007;50(16):1584–1589.
- ,,,,,.Estimation of central venous pressure by ultrasound.Resuscitation.2005;64(2):193–199.
- ,,, et al.Determination of total effective vascular compliance in patients with sepsis syndrome.Am J Respir Crit Care Med.1998;157(1):50–56.
- ,,.Central venous pressure: uses and limitations. In: Pinsky MR, Payen D, eds.Functional Hemodynamic Monitoring.Berlin, Germany:Springer‐Verlag Berlin Heidelberg;2006:101.
- ,.Normal fluctuations in pulmonary artery and pulmonary capillary wedge pressures in acutely ill patients.Heart Lung.1982;11(5):393–398.
- Philips M3012A Data Sheet.Hemodynamic extension to the multi‐measurement server.Amsterdam:Koninklijke Philips Electronics N.V.;2003.
- ,,, et al.Surviving Sepsis Campaign Management Guidelines Committee. Surviving Sepsis Campaign guidelines for management of severe sepsis and septic shock.Crit Care Med.2004;32(3):858–873. [Erratua: Crit Care Med. 2004;32(6):1448. Correction of dosage error in text. Crit Care Med. 2004;32(10):2169–2170.]
- Institute for Healthcare Improvement.Sepsis.Cambridge, MA:Institute for Healthcare Improvement. Available at:http://www.ihi.org/IHI/Topics/CriticalCare/Sepsis. Accessed March 2009.
Copyright © 2009 Society of Hospital Medicine
Discharge Planning
Hospitalized patients are often debilitated, either from their admitting illness or from the deconditioning that occurs with inactivity. Functional decline, which appears to progress in a hierarchical pattern,1 occurs in 24% to 50% of geriatric patients during hospitalization and is poorly documented.2 Such a decline is associated not only with longer hospital stays and increased health care costs but also with higher mortality.3 The American College of Physicians, through its Assessing Care of Vulnerable Elders project, expressly endorsed gait and mobility evaluation as a quality indicator, and examination insufficiency is well documented.4
Of the several existing mobility assessment tools, few are used routinely in hospital. Some require complex scoring; others require timing and/or a trained occupational therapist.5 We created a simplified tool named Independent Mobility Validation Examination (I‐MOVE) for use by bedside caregivers. We evaluated the tool's face validity and interobserver agreement.
I‐MOVE
I‐MOVE, represented schematically in Figure 1, is a performance test that assesses the patient's ability to perform a sequence of 6 basic tasks: rolling over in bed, sitting up, standing, transferring to a chair, walking in the room, and walking in the hallway. Most motor functions can be assumed to be hierarchical in nature; any patient who can perform at the highest level, such as walking safely, also would be expected to perform at the lowest level.
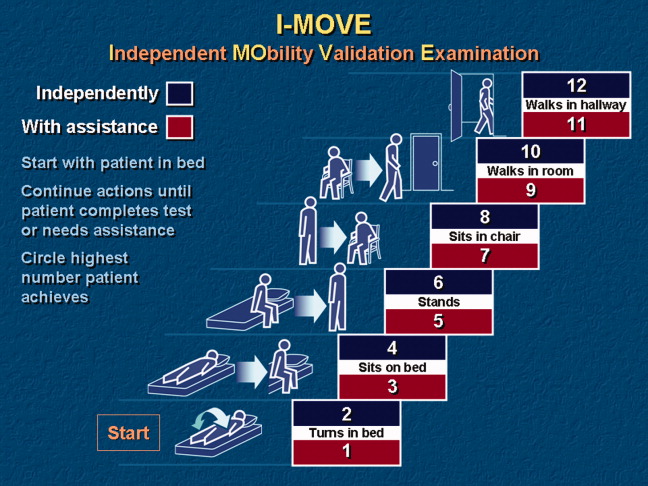
Instructions for administering I‐MOVE are as follows:
-
Review current orders. Exclude patients ordered on bed rest or non‐weight‐bearing or other orders precluding any of the 6 requested actions.
-
Prepare environment.
-
Chair at bedside.
-
Lower side bed rail closest to chair.
-
Clear path for patient to ambulate.
-
Ensure patient dons slippers.
-
Flatten bed.
-
Ensure any gait assistive device, if generally used by the patient, is within reach from the bedside.
-
Requests for patient action (for steps c through f, make available and within reach any appropriate gait‐assistance device such as walker or cane, if such is customarily used at home or newly prescribed):
-
With patient lying supine in bed, with close supervision, ask patient to turn from side to side in bed (request when both bed rails are up).
-
Lower side rail closer to chair and ask the patient to rise up to a sitting position and turn to sit up with legs dangling off the bed.
-
Ask the patient to stand.
-
Ask the patient to take a seat in the chair next to the bed.
-
Ask the patient to ambulate in the room.
-
Ask the patient to ambulate in the hallway.
-
At any point if the patient seems incapable, unsteady, or unsafe to accomplish the requested task, render hands‐on assistance and immediately end the test.
-
Document, by number (1‐12), the activity level successfully accomplished independently by the patient (even number levels) or accomplished with assistance (odd number levels).
-
Patient may be considered independent if able to perform the activity with a normal assistive device (cane, walker, brace, or crutches) but not using furniture.
-
Assistance is defined as any physical contact with the patient.
Findings
Face Validity
We sent surveys to 6 experienced practicing clinicians at our hospital: a geriatrician, a physiatrist, an exercise physiologist, an occupational therapist, a physical therapist, and a registered nurse. We asked each clinician to rate the 6 I‐MOVE elements (requested actions) for clinical relevance to mobility independence. Relevance of each element was measured on an ordinal scale with scores ranging from 1 to 4, with: 1 not relevant; 2 somewhat relevant; 3 quite relevant; and 4 very relevant. From the 5 responses we received, 4 evaluators ranked all 6 I‐MOVE requested actions as very relevant. The fifth evaluator ranked 5 of the 6 actions as very relevant and 1 action (walking in the room) as quite relevant. These results demonstrate general agreement that I‐MOVE is, at face value, a reasonable measure of independent mobility.
Interrater Reliability
The protocol was approved by the hospital's institutional review board. On a general medical unita non‐electrocardiographic telemetry, nonsurgical unit of an acute care hospital, where patients are assigned the primary service of an internal medicine physicianwe instructed 2 registered nurse (RN) volunteers (RN1 and RN2) in the I‐MOVE protocol. Each RN administered I‐MOVE independently to 41 consecutive, cognitively intact patients in a blinded fashion (ie, neither nurse was aware of the other's scoring of each patient) and within 1 hour of each other's assessment.
After administering I‐MOVE to each patient, the nurse judged and scored the patient's performance using the 12‐level I‐MOVE ordinal scale, ranging from a low value of 1, complete dependence, to the highest value of 12, complete independence. The patients' I‐MOVE score pairs recorded by RN1 and RN2 were statistically compared. Interrater reliability, a comparison of the 41 patients' score pairs, is graphically represented in Figure 2. The calculated intraclass correlation coefficient (r) was 0.90, indicating excellent agreement (r > 0.75).
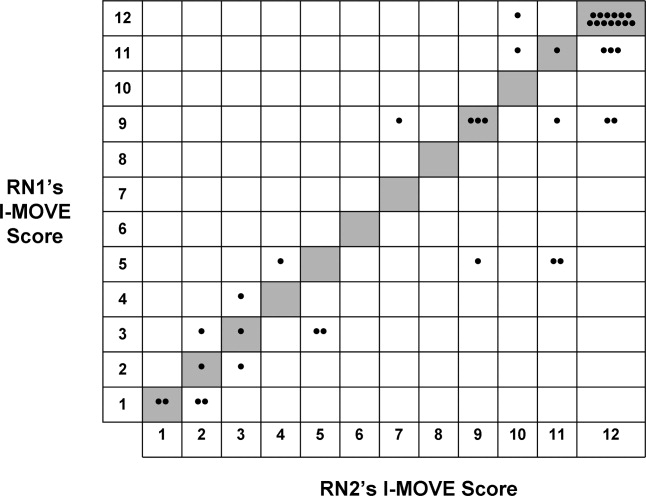
Discussion
Traditional physical examinations by physicians and assessments by nurses do not routinely extend to standardized mobility testing and may fail to recognize disability. Of the existing mobility assessment tools, we believe that most are not suited to patients hospitalized on general medical units. I‐MOVE has been designed to address this need, with an emphasis on practicality and brevity to allow repetition at appropriate intervals (tracking), as is done for vital signs. In this initial study, I‐MOVE was found to have face‐valid content and excellent interrater agreement.
Our study had several limitations. Only 1 pair of test administrators was involved; the sample population was chosen by convenience; clustering of outcomes occurred at level 12, which may have augmented the agreement; and the study was limited to cognitively intact patients. Note that we chose to use the intraclass correlation coefficient rather than the statistic because the weighting between the ordinal I‐MOVE scores has not yet been studied and defined. Also, the weighted is asymptotically equivalent to the intraclass correlation coefficient.
I‐MOVE is intended to aid caregivers in the recognition of debility so that appropriate interventions such as physical therapy may be prescribed. It was designed to complement, not replace, specialized evaluations such as those performed by physical therapists, occupational therapists, or comprehensive geriatric assessments. This practical assessment of basic functioning may enhance communication among caregivers, patients, and patients' family members, especially with regard to discharge planning. Further study is needed to validate I‐MOVE against existing tools, evaluate I‐MOVE's utility as a vital sign, and discern whether a sharp or unexpected decline portends a medical complication.
- .Health status and physical capacity. In:Osterweil D,Brummel‐Smith K,Beck JC, eds.Comprehensive Geriatric Assessment.New York:McGraw‐Hill;2000:41–66.
- ,,, et al.A predictive index for functional decline in hospitalized elderly medical patients.J Gen Intern Med.1993;8(12):645–652.
- ,,.Prevalence and outcomes of low mobility in hospitalized older patients.J Am Geriatr Soc.2004;52(8):1263–1270.
- ,,, et al.Detection and management of falls and instability in vulnerable elders by community physicians.J Am Geriatr Soc.2004;52(9):1527–1531.
- ,,.Exercising body and mind: an integrated approach to functional independence in hospitalized older people.J Am Geriatr Soc.2008;56(4):630–635.
Hospitalized patients are often debilitated, either from their admitting illness or from the deconditioning that occurs with inactivity. Functional decline, which appears to progress in a hierarchical pattern,1 occurs in 24% to 50% of geriatric patients during hospitalization and is poorly documented.2 Such a decline is associated not only with longer hospital stays and increased health care costs but also with higher mortality.3 The American College of Physicians, through its Assessing Care of Vulnerable Elders project, expressly endorsed gait and mobility evaluation as a quality indicator, and examination insufficiency is well documented.4
Of the several existing mobility assessment tools, few are used routinely in hospital. Some require complex scoring; others require timing and/or a trained occupational therapist.5 We created a simplified tool named Independent Mobility Validation Examination (I‐MOVE) for use by bedside caregivers. We evaluated the tool's face validity and interobserver agreement.
I‐MOVE
I‐MOVE, represented schematically in Figure 1, is a performance test that assesses the patient's ability to perform a sequence of 6 basic tasks: rolling over in bed, sitting up, standing, transferring to a chair, walking in the room, and walking in the hallway. Most motor functions can be assumed to be hierarchical in nature; any patient who can perform at the highest level, such as walking safely, also would be expected to perform at the lowest level.
Instructions for administering I‐MOVE are as follows:
-
Review current orders. Exclude patients ordered on bed rest or non‐weight‐bearing or other orders precluding any of the 6 requested actions.
-
Prepare environment.
-
Chair at bedside.
-
Lower side bed rail closest to chair.
-
Clear path for patient to ambulate.
-
Ensure patient dons slippers.
-
Flatten bed.
-
Ensure any gait assistive device, if generally used by the patient, is within reach from the bedside.
-
Requests for patient action (for steps c through f, make available and within reach any appropriate gait‐assistance device such as walker or cane, if such is customarily used at home or newly prescribed):
-
With patient lying supine in bed, with close supervision, ask patient to turn from side to side in bed (request when both bed rails are up).
-
Lower side rail closer to chair and ask the patient to rise up to a sitting position and turn to sit up with legs dangling off the bed.
-
Ask the patient to stand.
-
Ask the patient to take a seat in the chair next to the bed.
-
Ask the patient to ambulate in the room.
-
Ask the patient to ambulate in the hallway.
-
At any point if the patient seems incapable, unsteady, or unsafe to accomplish the requested task, render hands‐on assistance and immediately end the test.
-
Document, by number (1‐12), the activity level successfully accomplished independently by the patient (even number levels) or accomplished with assistance (odd number levels).
-
Patient may be considered independent if able to perform the activity with a normal assistive device (cane, walker, brace, or crutches) but not using furniture.
-
Assistance is defined as any physical contact with the patient.
Findings
Face Validity
We sent surveys to 6 experienced practicing clinicians at our hospital: a geriatrician, a physiatrist, an exercise physiologist, an occupational therapist, a physical therapist, and a registered nurse. We asked each clinician to rate the 6 I‐MOVE elements (requested actions) for clinical relevance to mobility independence. Relevance of each element was measured on an ordinal scale with scores ranging from 1 to 4, with: 1 not relevant; 2 somewhat relevant; 3 quite relevant; and 4 very relevant. From the 5 responses we received, 4 evaluators ranked all 6 I‐MOVE requested actions as very relevant. The fifth evaluator ranked 5 of the 6 actions as very relevant and 1 action (walking in the room) as quite relevant. These results demonstrate general agreement that I‐MOVE is, at face value, a reasonable measure of independent mobility.
Interrater Reliability
The protocol was approved by the hospital's institutional review board. On a general medical unita non‐electrocardiographic telemetry, nonsurgical unit of an acute care hospital, where patients are assigned the primary service of an internal medicine physicianwe instructed 2 registered nurse (RN) volunteers (RN1 and RN2) in the I‐MOVE protocol. Each RN administered I‐MOVE independently to 41 consecutive, cognitively intact patients in a blinded fashion (ie, neither nurse was aware of the other's scoring of each patient) and within 1 hour of each other's assessment.
After administering I‐MOVE to each patient, the nurse judged and scored the patient's performance using the 12‐level I‐MOVE ordinal scale, ranging from a low value of 1, complete dependence, to the highest value of 12, complete independence. The patients' I‐MOVE score pairs recorded by RN1 and RN2 were statistically compared. Interrater reliability, a comparison of the 41 patients' score pairs, is graphically represented in Figure 2. The calculated intraclass correlation coefficient (r) was 0.90, indicating excellent agreement (r > 0.75).
Discussion
Traditional physical examinations by physicians and assessments by nurses do not routinely extend to standardized mobility testing and may fail to recognize disability. Of the existing mobility assessment tools, we believe that most are not suited to patients hospitalized on general medical units. I‐MOVE has been designed to address this need, with an emphasis on practicality and brevity to allow repetition at appropriate intervals (tracking), as is done for vital signs. In this initial study, I‐MOVE was found to have face‐valid content and excellent interrater agreement.
Our study had several limitations. Only 1 pair of test administrators was involved; the sample population was chosen by convenience; clustering of outcomes occurred at level 12, which may have augmented the agreement; and the study was limited to cognitively intact patients. Note that we chose to use the intraclass correlation coefficient rather than the statistic because the weighting between the ordinal I‐MOVE scores has not yet been studied and defined. Also, the weighted is asymptotically equivalent to the intraclass correlation coefficient.
I‐MOVE is intended to aid caregivers in the recognition of debility so that appropriate interventions such as physical therapy may be prescribed. It was designed to complement, not replace, specialized evaluations such as those performed by physical therapists, occupational therapists, or comprehensive geriatric assessments. This practical assessment of basic functioning may enhance communication among caregivers, patients, and patients' family members, especially with regard to discharge planning. Further study is needed to validate I‐MOVE against existing tools, evaluate I‐MOVE's utility as a vital sign, and discern whether a sharp or unexpected decline portends a medical complication.
- .Health status and physical capacity. In:Osterweil D,Brummel‐Smith K,Beck JC, eds.Comprehensive Geriatric Assessment.New York:McGraw‐Hill;2000:41–66.
- ,,, et al.A predictive index for functional decline in hospitalized elderly medical patients.J Gen Intern Med.1993;8(12):645–652.
- ,,.Prevalence and outcomes of low mobility in hospitalized older patients.J Am Geriatr Soc.2004;52(8):1263–1270.
- ,,, et al.Detection and management of falls and instability in vulnerable elders by community physicians.J Am Geriatr Soc.2004;52(9):1527–1531.
- ,,.Exercising body and mind: an integrated approach to functional independence in hospitalized older people.J Am Geriatr Soc.2008;56(4):630–635.

Staph Endocarditis, METs, COPD CPGs & More
A review of staphylococcal Endocarditis
VG Fowler Jr, Miro JM, Hoen B, et al for the ICE Investigators. Staphylococcus aureus endocarditis: a consequence of medical progress. JAMA. 2005;June 22;293(24):3061-3062.
Agroup of infectious diseases experts from centers throughout the world formed the International Collaboration on Endocarditis (ICE) in 1999 to gain a global understanding of infective endocarditis. Using the Duke Criteria patients with definite infective endocarditis in a prospective manner, 275 variables were reported with these cases to a central database maintained at Duke University. The ICE-Prospective Cohort Study (ICE-PCS) enrolled 1,779 patients with infective endocarditis in 39 centers in 16 countries between June 15, 2000, and December 31, 2003, and has been described in a recent report. (Cabell CH, Abrutyn E. Infect Dis Clin North Am. 2002;16:255-72). Staphylococcus aureus was the most common cause of infective endocarditis in this group of patients (n=558; 31.6%); the authors characterized risk factors and clinical issues associated with these cases in this report.
By univariate analysis, compared with non-Staphylococcus aureus infective endocarditis, patients with infective endocarditis due to Staphylococcus aureus were more likely than patients with infective endocarditis due to other pathogens to be female (P<0.001), hemodialysis dependent (P<0.001), have diabetes mellitus (P=0.009), have other chronic illnesses (P<0.001), have a healthcare association (P<0.001), have higher rates of stroke (P<0.001), have systemic embolization (P<0.001), have persistent bacteremia (P<0.001), or die (P<0.001).
Although healthcare associated Staphylococcus aureus infective endocarditis was the most common form of Staphylococcus aureus infective endocarditis, more than 60% of healthcare-associated patients acquired the infection outside the hospital. This reflects the global trend in healthcare delivery patterns favoring ambulatory treatment (e.g., outpatient medication infusion via long-term IV access, hemodialysis)
Multivariate analysis, clinical features independently associated with Staphylococcus aureus infective endocarditis (versus non-Staphylococcus aureus infective endocarditis) were: IV drug use (OR, 9.3; 95% CI, 6.3-13.7); first clinical presentation less than one month after first symptoms (OR, 5.1; 95% CI, 3.2-8.2); healthcare-associated infection (OR, 2.9; 95% CI, 2.1-3.8), persistent bacteremia (OR, 2.3; 95% CI, 1.5-3.8), presence of a presumed intravascular device source (OR, 1.7; 95% CI, 1.2-2.6), stroke (OR, 1.6; 95% CI, 1.2-2.3), or diabetes mellitus (OR, 1.3; 95% CI, 1.1-1.8).
Patients from the United States with Staphylococcus aureus infective endocarditis were more likely to be hemodialysis-dependent, to be diabetic, to have a hemodialysis fistula or a chronic indwelling central catheter as a presumed source of infection, and to have a non-nosocomial healthcare association. Patients from the United States and Brazil were more likely to have Methicillin-resistant Staphyloccocus aureus (MRSA) than were patients from Europe, the Middle East, Australia, or New Zealand. In-hospital mortality rates were similar across regions, although American patients were significantly more likely to develop persistent bacteremia (25.6%, P<0.001).
Characteristics independently associated with mortality among patients with nonintravenous drug-use-associated Staphylococcus aureus infective endocarditis by multivariate analysis included stroke (OR, 3.67; 95% CI, 1.94-6.94), persistent bacteremia (OR, 3.06; 95% CI, 1.75-5.35), diagnosis in Southern Europe or the Middle East (OR, 3.21; 95% CI, 1.17-10.56).
This study establishes Staphylococcus aureus infective endocarditis as the leading cause of infective endocarditis in many regions of the world and spotlights the global emergence of healthcare contact as a risk factor for Staphylococcus aureus infective endocarditis. In a significant portion of these patients, an IV device was the presumed source of bacteremia; prosthetic cardiac devices (pacemakers, defibrillators, or prosthetic cardiac valves) were present in almost one-quarter of the patients.
MRSA was a significant cause of Staphylococcus aureus infective endocarditis and displayed regional variation, accounting for almost 40% of the infective endocarditis caused by Staphylococcus aureus in some regions. Patients with infective endocarditis caused by MRSA were significantly more likely to have pre-existing chronic conditions and healthcare associated infective endocarditis by both univariate and multivariate analysis. They also were often associated with persistent bacteremia. On the other hand, 20% of patients with MRSA infective endocarditis developed their infection in the absence of identifiable healthcare contact.
Limitations of this report include the fact that this is an observational study of patients from self-selected centers. Each center most likely represents a portion of the local population, making it difficult to generalize findings to the entire population centers from which this report originates. Represented hospitals were typically referral centers that have cardiac surgery programs and may have widely differing populations with varied risk factors. Advantages include the large size of this prospectively evaluated cohort and the ability to analyze regional variations between continents with a contemporary nature of the patient sample (2000-2003).
Infectious Endocarditis in Olmsted County, Minn.
Tleyjeh IM, Steckelberg JM, Murad HS, et al. Temporal trends in infective endocarditis: a population-based study in Olmsted County, Minnesota. JAMA. 2005;293:3022-3028.
Tleyjeh and colleagues at the Mayo Clinic in Rochester, Minn., retrospectively studied 102 cases of infective endocarditis that occurred in 107 Olmsted County residents from 1970-2000. Main outcome measures were incidence of infective endocarditis, proportion of patients with underlying heart disease and causative micro-organisms and clinical characteristics. The records of all Olmsted County residents with infective endocarditis were identified and reviewed in detail. The definite and possible infective endocarditis cases as defined by modified Duke Criteria were used in the analysis.
The age- and gender-adjusted incidence of infective endocarditis ranged from 5.0 to 7.0 cases per 100,000 person-years during the study period and did not change significantly over time. There were 84 (79%) cases of native valve infective endocarditis and 23 (21%) cases of prosthetic valve infective endocarditis. Valves involved: aortic—36 (24%); mitral—49 (46%), aortic and mitral—12 (11%), right-sided or bilateral—8 (7%), or unknown—8 (7%). 16 (15%) had valve surgery within 42 days and the six-month mortality was 26% (n=28).
Infective endocarditis is a disease of the older individual in this population, with a mean age ranging from 54.1 years in 1980-1984 to 67.4 years in 1995-2000 (P=0.24 for trend). There was a male predominance (67%-83%), which did not significantly change over time.
Mitral valve prolapse was the most frequent underlying valvular heart disease. Viridans streptococci were the most common causative organisms (n=47; 44%) followed by Staphylococcus aureus (n=28 cases; 26%).
The overall average crude infective endocarditis incidence of the period 1970-2000 was 4.95 per 100,000 person-years. The age- and gender-adjusted annual incidence was 6.06 per 100,000 (95% CI, 4.89-7.22). There was no time trend for either streptococcus or Staphylococcus aureus infective endocarditis: the annual adjusted incidence of viridans group streptococcal infective endocarditis was 1.7 to 3.5 cases per 100,000 person years while Staphylococcus aureus infective endocarditis had an annual adjusted incidence of 1.0-2.2 cases per 100,000. The incidence rates of viridans group streptococcal and Staphylococcus aureus infective endocarditis have not changed significantly over time in this population.
Potential limitations of this study include possible incomplete case finding or recognition of the retrospective nature of the case reviews. The homogeneity of the patient population studied (primarily elderly white males with a low prevalence of intravenous drug use) limits the ability to generalize the results. Advantages include the fact that this is a population-based study at a medical center with detailed medical records of virtually all residents of a single county. This allows us to view the clinical features and etiologic factors of primarily left-sided infective endocarditis without the referral bias that tends to taint other studies typically published out of large medical centers with larger geographic referral bases.
Computers and Adverse Drug Events
Nebeker JR, Hoffman JM, Weir CR, Bennett CL, Hurdle JF. High rates of adverse drug events in a highly computerized hospital. Arch Intern Med. 2005;165:1111-1116.
Adverse drug events account for a significant number of hospital admissions and the ensuing costs associated with these hospitalizations. Electronic endeavors, such as computerized physician order entry (CPOE), bar code systems, and electronic medical records attempt to reduce the preventable adverse drug events.
Nebeker, et al. attempted to assess the effects of the implementation of CPOE and other computerized medication systems on adverse drug events in a tertiary care Veterans Administration Medical Center. They used an observational study design whereby 937 out of 2,306 newly admitted patients from several hospital wards were randomly chosen and assigned to a pharmacist reviewer during a 20-week period.
They reviewed complete medical records of hospital stays every other day to document adverse drug events. Not only were traditional adverse drug events identified, but harm from overdoses and/or inappropriate dose reductions or discontinuations, as well as intolerable harm from dose titration, were documented as adverse drug events. The harms caused by the drugs were considered only if the drugs were started in the hospital.
Harms were classified based on prior literature and included standards for pharmacological typology, causality assessment, error type, event terminology, drug class, seriousness index, and medication error category indexing. Additional uncommon classifications were also used, including additional resource utilization. Consensus meetings were held weekly to confirm classification of adverse drug events. Of the admissions reviewed, 483 adverse drug events were identified of which 93% were drug reactions while 7% were due to over- or underdosing. Of the drug reactions, 90% were considered dose-dependent while 10% were considered to be idiosyncratic.
Two different indexing scales were used in classifying the harms. Using the LDS Hospital Scale, it was suggested that 91% of the adverse drug events caused moderate harm while 9% caused serious harm. Using the National Coordinating Council for Medication Error Reporting and Prevention indexing, it was suggested that 87% of the adverse drug events fell into category E (requiring treatment) and 4% into category F (requiring prolonged hospitalization). Twenty-seven percent of the total adverse drug events were thought to be due to errors, including execution and planning steps. Sixty-one percent of errors occurred with the ordering mechanism while 25% of the errors occurred in the monitoring process.
This study highlighted rates of adverse drug events five to 19 times higher than baseline. The authors explained this higher-than-expected rate in part by study elements, such as the use of clinical pharmacists as reviewers, iterative case reviews, and accessible electronic data that make adverse drug events more noticeable.
Weaknesses of this study included issues of comparability of CPOEs because there were significant feature differences among commercial software programs. In addition, this was an observational study lacking a control group. The authors felt that their study did not support the idea that the computerized patient record of the study institution had caused adverse drug events. Rather, the study supported the idea that the system increased the visibility of adverse drug events compared with a paper system. In addition, the authors recommended that the choice of CPOEs be carefully considered, with a focus on decision support features when integrated into a healthcare organization.
The Questionable Benefit of Medical Emergency Teams
Hillman K, Chen J, Cretikos M, et al. Introduction of the medical emergency team (MET) system: a cluster-randomised controlled trial. MERIT study investigators. Lancet. 2005;365:2091-2097.
Previous studies have reported that the MET system reduces the incidence of cardiac arrests, deaths, and unplanned ICU admissions. A MET is a preplanned group of healthcare practitioners who respond to acute patient deteriorations in hospitalized patients.
METs are usually identical to hospital code teams, with the exception that they respond prior to a patient’s developing cardiac arrest. This early response has been shown to significantly decrease unexpected hospital mortality in hospitals in the United States, Australia, and Great Britain. Even though the system has been reported since 1995, few hospitals have knowledge of or experience with METs.
Unexpected hospital deaths and cardiac arrests are often preceded by clinical warning signs. In addition, unplanned ICU admissions may be foreshadowed by abnormalities in the patient’s vital signs that may progress if appropriate interventions are not undertaken. METs assess patients with abnormal physical findings or when there is a concern about the patient’s condition. These patients have findings that may precede a serious event or cardiac arrest, but otherwise don’t meet existing criteria to call a code.
The theory is that if a MET responds to see a patient who is becoming unstable (see “Table 1: MET Calling Criteria,” at left), early interventions may reduce the likelihood of arrest. Published studies have shown a reduction in cardiac arrests and ICU length of stay in virtually all systems in which MET has been introduced (although most studies are hampered by the use of historical controls).
The MERIT study randomized 23 hospitals in Australia to continue functioning as usual (n=11) or to introduce a MET system (n=12). The study sites included a wide range of tertiary, metropolitan, and non-metropolitan hospitals in different states across Australia. The primary outcome was the composite of cardiac arrest, unexpected death, or unplanned ICU admission during the six-month study period after MET activation, using intention to treat analysis.
A four-month educational period was undertaken with the MET centers prior to initiation of the trial. Control hospitals did not receive any education about the MET concept. This was followed by a six-month trial period. Cardiac arrest teams were maintained at all hospitals. The MET consisted of at least one doctor and a nurse from the ED or ICU.
The eligible patients included those residing on a medical ward (including critical care units); the ICUs, OR, postoperative recovery areas, and ED areas were not regarded as general wards.
The primary outcome for the study was the composite outcome of the incidence (events divided by number of eligible patients admitted to the hospital and residing on a medical ward during the study period) of:
- Cardiac arrests without a pre-existing “not-for-resuscitation” (NFR) order;
- Unplanned ICU admissions; and
- Unexpected deaths (those without a pre-existing NFR order).
The results of the study:
- During the study period, the overall rate of calls for the cardiac arrest team or MET was significantly higher in intervention hospitals than in control hospitals. Calls not associated with events were more common in MET hospitals than in controls. Half of the total calls were not associated with a cardiac arrest or unexpected death, whereas in MET hospitals more than 80% of calls were not associated with a cardiac arrest or death (P<0.0001).
- In patients with documented MET calling criteria in association with cardiac arrest or unexpected death, the call rate was similar in MET and control hospitals.
- There were no significant differences between the MET and control hospitals for any outcome.
- The response to changes in vital signs was not adequate—even in MET centers.
These findings are surprising in view of previously reported findings using the MET system. Potential reasons for lack of difference between MET centers and controls include:
- Number of study sites or the duration of the study may not have been adequate for implementation or education;
- Hospitals may already be efficient in detecting and managing unstable patients;
- Patient selection criteria may have been overly restricted. For example, other studies have used 30 respirations per minute for tachypnea as a calling criterion compared with 36 breaths per minute used in this trial;
- Knowledge of the study may have leaked to control hospitals;
- Cardiac arrest teams function as METs at times: Nearly half of the calls to cardiac arrest teams in control hospitals were made without a cardiac arrest or unexpected death; and
- The selected outcomes may not be sensitive enough.
Even though this large, multicenter controlled trial was unable to show a significant benefit of METs, we should not be discouraged from performing further controlled trials in different settings. The use of METs is clearly an exciting and evolving area of medicine.
Barriers to Patient Safety
Amalberti R, Auroy Y, Berwick D, Barach P. Five system barriers to achieving ultrasafe health care. Ann Intern Med. 2005;142:756-764
Patient safety in our healthcare system is a growing concern. One area of dialogue concerning preventable healthcare-associated harms involves the comparability of the healthcare industry with non-medical industries, such as aviation and nuclear power, that have adapted successful strategies shown to provide ultrasafe environments. Amalberti, et al. discuss risk assessment in a variety of industries and explain the need for a benchmarking approach in order to optimize or achieve safety in the healthcare field.
The authors identify five systemic barriers from literature that are fundamentally connected to the ability of the healthcare field to achieve an extremely safe environment.
Barrier 1—acceptance of limitations on maximum performance: The first barrier is the type of expected performance in the field. This is illustrated by the tradeoffs associated with ultrasafety versus productivity. The amount of risk involved was directly related to the limits placed on maximum performance. The first barrier is the acceptance that every system has limits. When a producer exceeds their limit, then safety suffers. An example used is that of blood donation: The limits of collection speed are weighed against the needed screening process.
Barrier 2—abandonment of professional autonomy: The second barrier concerns the concept of professional autonomy. While more teamwork and regulations reduce individual autonomy, this appears to improve safety in the healthcare environment. The bottom line is the importance of teamwork. The example used is that of traffic on a highway: Autonomous units work together to function safely.
Barrier 3—transition from the mindset of craftsman to that of an equivalent actor: The third barrier to achieving high levels of safety includes an equivalent actor mindset. This entails establishing a reliable standard of excellent care in lieu of focusing on individuality, similar to the notion that passengers on an airline usually do not know their pilots, but have established confidence in the airline itself.
Barrier 4—the need for system-level arbitration to optimize safety strategies: The fourth barrier identified is a need for system-level arbitration to optimize safety strategies. This need results from the pressure for justice (usually through litigation) once an accident occurs. Top-down arbitration of safety will be less successful than system level design.
Barrier 5—the need to simplify professional rules and regulations: The final barrier results from the many of layers of guidelines as they serve to create an environment of excellence. This barrier necessitates the removal of these layers to simplify the environment. Existing guidelines should be distilled down to those shown to promote quality and safety. Byzantine rules can obscure the goal of safety and glorify rules, for rules sake.
Certain structural limitations within the field, such as worker shortages in the face of increasing public demands and the reliance of the field on trainees such as students, interns, and residents, create other hurdles. The authors conclude by suggesting a two-tiered system of healthcare whereby ultrasafety could be more easily accomplished in areas of medicine considered more stable (first tier), and a second tier of care that would include the more unstable conditions, and thus inherently, represent the higher risk situations where errors are more likely to occur.
Another provocative point of this article is the need to move toward educating and training teams—not individuals.
The Importance of Implementing COPD Guidelines
Harvey PA, Murphy MC, Dornom E, et al. Implementing evidence-based guidelines: inpatient management of chronic obstructive pulmonary disease. Intern Med J. 2005;35:151-155.
COPD is a common diagnosis that sometimes requires hospitalization. Evidence-based guidelines for disease management, including that of hospitalized patients, exist, but there is a paucity of knowledge about the actual quality of care delivered in the hospital as it aligns with published guidelines. This study by Harvey, et al. explores the quality of care delivered in the hospital for patients with COPD, while at the same time investigating an intervention for the medical staff in an effort to improve adherence to evidenced-based guidelines of the disease.
Using ICD-10 codes for a COPD diagnosis, the study incorporated a retrospective chart review of 49 hospital admissions prior to the intervention and 35 admissions after the intervention in a hospital in Melbourne, Australia. Data were collected pertaining to the hospital management of COPD as it compared with what the authors considered to be Level A—or the highest level of evidence summarized from several professional organizations. The intervention delivered to the medical staff included a summarized presentation of the results from the initial audit of the 49 charts, as well as an educational package that was given to them following the presentation.
Except for inappropriate use of intravenous aminophylline, of which there was a 100% concordance to Level A guidelines, the initiation of systemic steroids (intravenous and/or oral) had the highest concordance rate of 80% and 83%, pre- and postintervention respectively. Appropriate steroid duration (seven to 14 days) had the lowest concordance rates at 10% and 29%, pre- and postintervention respectively.
In addition, preintervention concordance (10%) involving steroid duration was the only rate considered significantly different in the postintervention group (29%). While concordance rates were high for the use of any type of nebulized bronchodilator (96% preintervention and 80% postintervention), the Level A guidelines the authors used suggested that beta-agonist bronchodilators should be used alone prior to the initiation of ipratropium bromide. The concordance rates for this guideline were 27% preintervention and 34% postintervention.
Largely, the authors felt their intervention failed to improve concordance rates to the Level A guidelines investigated and also that their findings of variable and lower concordance rates across the board corroborated other similar studies. The major weaknesses of this study included the small sample size and the nonrandomness of the sampling.
In addition, the authors report that the particular hospital studied included junior doctors who rotated on and off service, which likely prevented the effects of the intervention from being measured on a provider level. In spite of the weaknesses in the study, the article brings to light the need for a more effective translation of evidence-based guidelines to actual practice, especially in the practice of COPD management in the hospital. Further methods of guideline implementation in the clinic setting must be elucidated to improve the care patients with COPD receive in the hospital.
Not all Troponin Elevations Are Myocardial Infarctions
Jeremais A, Gibson CM. Narrative review: alternative causes for elevated cardiac troponin levels when acute coronary syndromes are excluded. Ann Intern Med. 2005;142:786-791.
Troponins are regulatory proteins that control the calcium-mediated interaction of actin and myosin during muscle contraction. All muscle tissue contains troponins, but cardiac troponin T and I have amino acid sequences that are different from skeletal and smooth muscle troponins, allowing them to be detectable by monoclonal antibody-based assays.
In the event of reversible or irreversible cell damage—or possibly even from transiently increased cell membrane permeability—cardiac troponins are released from myocytes into circulation. This characteristic provides a sensitive test for detecting myocardial injury and damage; however, this test is not specific for acute coronary syndromes. And any disorder that causes myocyte damage may cause an elevated troponin.
The 2002 American College of Cardiology/American Heart Association practice guidelines for unstable angina and non-ST-segment elevation myocardial infarction acknowledge that the myocardial necrosis signified by troponin elevation may not necessarily be caused by atherosclerotic coronary artery disease. Such nonthrombotic troponin elevation can be caused by four basic mechanisms, as discussed by Dr. Jeremias and Dr. Gibson.
- Demand ischemia refers to a mismatch between myocardial oxygen demand and supply in the absence of flow-limiting epicardial stenosis. Conditions such as sepsis or septic shock and the systemic inflammatory response syndrome, hypotension or hypovolemia, tachyarrhythmias, and left ventricular hypertrophy can all cause release of cardiac troponin.
- Myocardial ischemia in the absence of fixed obstructive coronary disease can be caused by coronary vasospasm, acute stroke or intracranial hemorrhage, and ingestion of sympathomimetics.
- Direct myocardial damage can be seen in cardiac contusion, direct current cardioversion, cardiac infiltrative disorders such as amyloidosis, certain chemotherapy agents, myocarditis, pericarditis, and cardiac transplantation.
- Myocardial strain occurs when volume and pressure overload of the left and/or right ventricle cause excessive wall tension. Congestive heat failure, acute pulmonary embolism, and chronic pulmonary hypertension can lead to myocardial strain and troponin elevation.
Another condition that can lead to persistently elevated cardiac troponins is end-stage renal disease. This elevation may be due to small areas of clinically silent myocardial necrosis, an increased left ventricular mass, or possibly from impaired renal troponin excretion. Although troponins are believed to be cleared by the reticuloendothelial system, recent evidence shows that troponin T is fragmented into molecules that are small enough to be renally excreted.
In summary, elevated troponin can be found in many clinical settings and is associated with impaired short- and long-term survival. TH
Classic Literature
The HATEFUL Patient

Every physician has groaned internally when seeing a certain patient’s name on his list, going out of her way to avoid a particular family, or getting hopelessly engaged and increasingly enraged in a battle over a “lost” narcotic prescription. There are certain patients with whom a doctor-patient relationship feels more like a contest than a partnership. These interactions make a physician’s daily practice difficult, and they may wreak havoc among the staff on an inpatient ward. These patients grow ever more intolerable to their caregivers, who often harbor a wish to simply make them disappear.
In his landmark 1978 article “Taking Care of the Hateful Patient,” (NEJM, 298:883-887) James Groves, MD, discussed the characteristics of these difficult patients and the sometimes difficult emotions they generate in their caregivers. He described four different groups of patients, using an illustrative case for each, and discussed the ways in which these patients’ often maddening behavior serves to mitigate their profound dependency.
Dependent clingers are those patients whose neediness is overt, who seem to regard the physician as a sow with teats to spare. Dr. Groves suggested early, firm limit-setting with these patients to prevent the formation and later shattering of the patient’s illusion of the physician as inexhaustible.
Dependency lies at the heart of an entitled demander’s behavior as well, but their fear of abandonment is expressed as hostility and arrogance rather than overt neediness. Affirming to the patient that you share in their quest for the good (but not perfect) medical care to which they are entitled allows patient and physician to rally around a common goal.
This strategy backfires with manipulative help-rejecters, who seem almost pleased to report to their physician each time they fail a new treatment attempt. Overtly expressing some doubt that the treatment will completely cure all the patient’s difficulties and providing regular follow up are recommended for this group. These strategies relieve the patient of the unconscious anxiety that he may be abandoned by his physician should his symptoms abate.
Self-destructive deniers make the physician feel powerless as they persist in behavior that undermines all efforts to improve their health. With these patients, viewing their behavior as a terminal illness and managing symptoms and exacerbations accordingly allows the physician to focus on caring for the patient without unrealistic expectations of cure on the one hand and judgmental indifference on the other.
After discussing each of these groups, Dr. Groves concluded the article by suggesting that perhaps the greatest challenge physicians face in caring for these difficult patients is the temptation to disown the negative feelings they engender. He wrote that this effort not only strains the doctor’s limits, but also wastes valuable clinical data unmasked by these feelings—data that could inform clinical care. For decades prior to Dr. Groves’ article, psychoanalysts had reflected on what Freud termed “countertransference,” or the physician’s internal emotional reaction to a patient.
In his article “Hate in the Counter-Transference,” D.W. Winnicott, MD, suggested that rather than accepting the guilt that these feelings typically engender in a caregiver, negative countertransference reactions should be regarded by the physician as valuable information in understanding the patient’s psychic world. By training and by disposition, however, most physicians considered (and continue to consider) these emotions inappropriate. They seemingly negate the sympathy, kindness, and commitment to the patient’s well-being that should be central to a physician’s vocation. Conventional wisdom held that denying the feelings was the only proper response, and if that proved impossible, transferring the patient to a willing colleague was usually recommended. In contrast, Dr. Groves freed the physician to use these feelings to improve patient care.
Now a classic and oft-cited work, “Taking Care of the Hateful Patient” distills a wealth of analytic insight into a structure and language comprehensible to the busy generalist. By explaining the reactions each group of patients induces in their physicians, Dr. Groves provides useful tools to understand a particular patient’s psychology. Suggestions for strategic approaches to each category of patient are easy to understand and to adapt to one’s own practice. He explains how judicious limit-setting can be as valuable for the patient as it is for the doctor. Perhaps most helpful is his description of the needs of these patients that lie beneath their “hateful” exterior. Armed with this understanding, a physician can reclaim the empathy that is often so elusive with these patients.—Sandra Rackley MD, Kemuel Philbrick, MD
A review of staphylococcal Endocarditis
VG Fowler Jr, Miro JM, Hoen B, et al for the ICE Investigators. Staphylococcus aureus endocarditis: a consequence of medical progress. JAMA. 2005;June 22;293(24):3061-3062.
Agroup of infectious diseases experts from centers throughout the world formed the International Collaboration on Endocarditis (ICE) in 1999 to gain a global understanding of infective endocarditis. Using the Duke Criteria patients with definite infective endocarditis in a prospective manner, 275 variables were reported with these cases to a central database maintained at Duke University. The ICE-Prospective Cohort Study (ICE-PCS) enrolled 1,779 patients with infective endocarditis in 39 centers in 16 countries between June 15, 2000, and December 31, 2003, and has been described in a recent report. (Cabell CH, Abrutyn E. Infect Dis Clin North Am. 2002;16:255-72). Staphylococcus aureus was the most common cause of infective endocarditis in this group of patients (n=558; 31.6%); the authors characterized risk factors and clinical issues associated with these cases in this report.
By univariate analysis, compared with non-Staphylococcus aureus infective endocarditis, patients with infective endocarditis due to Staphylococcus aureus were more likely than patients with infective endocarditis due to other pathogens to be female (P<0.001), hemodialysis dependent (P<0.001), have diabetes mellitus (P=0.009), have other chronic illnesses (P<0.001), have a healthcare association (P<0.001), have higher rates of stroke (P<0.001), have systemic embolization (P<0.001), have persistent bacteremia (P<0.001), or die (P<0.001).
Although healthcare associated Staphylococcus aureus infective endocarditis was the most common form of Staphylococcus aureus infective endocarditis, more than 60% of healthcare-associated patients acquired the infection outside the hospital. This reflects the global trend in healthcare delivery patterns favoring ambulatory treatment (e.g., outpatient medication infusion via long-term IV access, hemodialysis)
Multivariate analysis, clinical features independently associated with Staphylococcus aureus infective endocarditis (versus non-Staphylococcus aureus infective endocarditis) were: IV drug use (OR, 9.3; 95% CI, 6.3-13.7); first clinical presentation less than one month after first symptoms (OR, 5.1; 95% CI, 3.2-8.2); healthcare-associated infection (OR, 2.9; 95% CI, 2.1-3.8), persistent bacteremia (OR, 2.3; 95% CI, 1.5-3.8), presence of a presumed intravascular device source (OR, 1.7; 95% CI, 1.2-2.6), stroke (OR, 1.6; 95% CI, 1.2-2.3), or diabetes mellitus (OR, 1.3; 95% CI, 1.1-1.8).
Patients from the United States with Staphylococcus aureus infective endocarditis were more likely to be hemodialysis-dependent, to be diabetic, to have a hemodialysis fistula or a chronic indwelling central catheter as a presumed source of infection, and to have a non-nosocomial healthcare association. Patients from the United States and Brazil were more likely to have Methicillin-resistant Staphyloccocus aureus (MRSA) than were patients from Europe, the Middle East, Australia, or New Zealand. In-hospital mortality rates were similar across regions, although American patients were significantly more likely to develop persistent bacteremia (25.6%, P<0.001).
Characteristics independently associated with mortality among patients with nonintravenous drug-use-associated Staphylococcus aureus infective endocarditis by multivariate analysis included stroke (OR, 3.67; 95% CI, 1.94-6.94), persistent bacteremia (OR, 3.06; 95% CI, 1.75-5.35), diagnosis in Southern Europe or the Middle East (OR, 3.21; 95% CI, 1.17-10.56).
This study establishes Staphylococcus aureus infective endocarditis as the leading cause of infective endocarditis in many regions of the world and spotlights the global emergence of healthcare contact as a risk factor for Staphylococcus aureus infective endocarditis. In a significant portion of these patients, an IV device was the presumed source of bacteremia; prosthetic cardiac devices (pacemakers, defibrillators, or prosthetic cardiac valves) were present in almost one-quarter of the patients.
MRSA was a significant cause of Staphylococcus aureus infective endocarditis and displayed regional variation, accounting for almost 40% of the infective endocarditis caused by Staphylococcus aureus in some regions. Patients with infective endocarditis caused by MRSA were significantly more likely to have pre-existing chronic conditions and healthcare associated infective endocarditis by both univariate and multivariate analysis. They also were often associated with persistent bacteremia. On the other hand, 20% of patients with MRSA infective endocarditis developed their infection in the absence of identifiable healthcare contact.
Limitations of this report include the fact that this is an observational study of patients from self-selected centers. Each center most likely represents a portion of the local population, making it difficult to generalize findings to the entire population centers from which this report originates. Represented hospitals were typically referral centers that have cardiac surgery programs and may have widely differing populations with varied risk factors. Advantages include the large size of this prospectively evaluated cohort and the ability to analyze regional variations between continents with a contemporary nature of the patient sample (2000-2003).
Infectious Endocarditis in Olmsted County, Minn.
Tleyjeh IM, Steckelberg JM, Murad HS, et al. Temporal trends in infective endocarditis: a population-based study in Olmsted County, Minnesota. JAMA. 2005;293:3022-3028.
Tleyjeh and colleagues at the Mayo Clinic in Rochester, Minn., retrospectively studied 102 cases of infective endocarditis that occurred in 107 Olmsted County residents from 1970-2000. Main outcome measures were incidence of infective endocarditis, proportion of patients with underlying heart disease and causative micro-organisms and clinical characteristics. The records of all Olmsted County residents with infective endocarditis were identified and reviewed in detail. The definite and possible infective endocarditis cases as defined by modified Duke Criteria were used in the analysis.
The age- and gender-adjusted incidence of infective endocarditis ranged from 5.0 to 7.0 cases per 100,000 person-years during the study period and did not change significantly over time. There were 84 (79%) cases of native valve infective endocarditis and 23 (21%) cases of prosthetic valve infective endocarditis. Valves involved: aortic—36 (24%); mitral—49 (46%), aortic and mitral—12 (11%), right-sided or bilateral—8 (7%), or unknown—8 (7%). 16 (15%) had valve surgery within 42 days and the six-month mortality was 26% (n=28).
Infective endocarditis is a disease of the older individual in this population, with a mean age ranging from 54.1 years in 1980-1984 to 67.4 years in 1995-2000 (P=0.24 for trend). There was a male predominance (67%-83%), which did not significantly change over time.
Mitral valve prolapse was the most frequent underlying valvular heart disease. Viridans streptococci were the most common causative organisms (n=47; 44%) followed by Staphylococcus aureus (n=28 cases; 26%).
The overall average crude infective endocarditis incidence of the period 1970-2000 was 4.95 per 100,000 person-years. The age- and gender-adjusted annual incidence was 6.06 per 100,000 (95% CI, 4.89-7.22). There was no time trend for either streptococcus or Staphylococcus aureus infective endocarditis: the annual adjusted incidence of viridans group streptococcal infective endocarditis was 1.7 to 3.5 cases per 100,000 person years while Staphylococcus aureus infective endocarditis had an annual adjusted incidence of 1.0-2.2 cases per 100,000. The incidence rates of viridans group streptococcal and Staphylococcus aureus infective endocarditis have not changed significantly over time in this population.
Potential limitations of this study include possible incomplete case finding or recognition of the retrospective nature of the case reviews. The homogeneity of the patient population studied (primarily elderly white males with a low prevalence of intravenous drug use) limits the ability to generalize the results. Advantages include the fact that this is a population-based study at a medical center with detailed medical records of virtually all residents of a single county. This allows us to view the clinical features and etiologic factors of primarily left-sided infective endocarditis without the referral bias that tends to taint other studies typically published out of large medical centers with larger geographic referral bases.
Computers and Adverse Drug Events
Nebeker JR, Hoffman JM, Weir CR, Bennett CL, Hurdle JF. High rates of adverse drug events in a highly computerized hospital. Arch Intern Med. 2005;165:1111-1116.
Adverse drug events account for a significant number of hospital admissions and the ensuing costs associated with these hospitalizations. Electronic endeavors, such as computerized physician order entry (CPOE), bar code systems, and electronic medical records attempt to reduce the preventable adverse drug events.
Nebeker, et al. attempted to assess the effects of the implementation of CPOE and other computerized medication systems on adverse drug events in a tertiary care Veterans Administration Medical Center. They used an observational study design whereby 937 out of 2,306 newly admitted patients from several hospital wards were randomly chosen and assigned to a pharmacist reviewer during a 20-week period.
They reviewed complete medical records of hospital stays every other day to document adverse drug events. Not only were traditional adverse drug events identified, but harm from overdoses and/or inappropriate dose reductions or discontinuations, as well as intolerable harm from dose titration, were documented as adverse drug events. The harms caused by the drugs were considered only if the drugs were started in the hospital.
Harms were classified based on prior literature and included standards for pharmacological typology, causality assessment, error type, event terminology, drug class, seriousness index, and medication error category indexing. Additional uncommon classifications were also used, including additional resource utilization. Consensus meetings were held weekly to confirm classification of adverse drug events. Of the admissions reviewed, 483 adverse drug events were identified of which 93% were drug reactions while 7% were due to over- or underdosing. Of the drug reactions, 90% were considered dose-dependent while 10% were considered to be idiosyncratic.
Two different indexing scales were used in classifying the harms. Using the LDS Hospital Scale, it was suggested that 91% of the adverse drug events caused moderate harm while 9% caused serious harm. Using the National Coordinating Council for Medication Error Reporting and Prevention indexing, it was suggested that 87% of the adverse drug events fell into category E (requiring treatment) and 4% into category F (requiring prolonged hospitalization). Twenty-seven percent of the total adverse drug events were thought to be due to errors, including execution and planning steps. Sixty-one percent of errors occurred with the ordering mechanism while 25% of the errors occurred in the monitoring process.
This study highlighted rates of adverse drug events five to 19 times higher than baseline. The authors explained this higher-than-expected rate in part by study elements, such as the use of clinical pharmacists as reviewers, iterative case reviews, and accessible electronic data that make adverse drug events more noticeable.
Weaknesses of this study included issues of comparability of CPOEs because there were significant feature differences among commercial software programs. In addition, this was an observational study lacking a control group. The authors felt that their study did not support the idea that the computerized patient record of the study institution had caused adverse drug events. Rather, the study supported the idea that the system increased the visibility of adverse drug events compared with a paper system. In addition, the authors recommended that the choice of CPOEs be carefully considered, with a focus on decision support features when integrated into a healthcare organization.
The Questionable Benefit of Medical Emergency Teams
Hillman K, Chen J, Cretikos M, et al. Introduction of the medical emergency team (MET) system: a cluster-randomised controlled trial. MERIT study investigators. Lancet. 2005;365:2091-2097.
Previous studies have reported that the MET system reduces the incidence of cardiac arrests, deaths, and unplanned ICU admissions. A MET is a preplanned group of healthcare practitioners who respond to acute patient deteriorations in hospitalized patients.
METs are usually identical to hospital code teams, with the exception that they respond prior to a patient’s developing cardiac arrest. This early response has been shown to significantly decrease unexpected hospital mortality in hospitals in the United States, Australia, and Great Britain. Even though the system has been reported since 1995, few hospitals have knowledge of or experience with METs.
Unexpected hospital deaths and cardiac arrests are often preceded by clinical warning signs. In addition, unplanned ICU admissions may be foreshadowed by abnormalities in the patient’s vital signs that may progress if appropriate interventions are not undertaken. METs assess patients with abnormal physical findings or when there is a concern about the patient’s condition. These patients have findings that may precede a serious event or cardiac arrest, but otherwise don’t meet existing criteria to call a code.
The theory is that if a MET responds to see a patient who is becoming unstable (see “Table 1: MET Calling Criteria,” at left), early interventions may reduce the likelihood of arrest. Published studies have shown a reduction in cardiac arrests and ICU length of stay in virtually all systems in which MET has been introduced (although most studies are hampered by the use of historical controls).
The MERIT study randomized 23 hospitals in Australia to continue functioning as usual (n=11) or to introduce a MET system (n=12). The study sites included a wide range of tertiary, metropolitan, and non-metropolitan hospitals in different states across Australia. The primary outcome was the composite of cardiac arrest, unexpected death, or unplanned ICU admission during the six-month study period after MET activation, using intention to treat analysis.
A four-month educational period was undertaken with the MET centers prior to initiation of the trial. Control hospitals did not receive any education about the MET concept. This was followed by a six-month trial period. Cardiac arrest teams were maintained at all hospitals. The MET consisted of at least one doctor and a nurse from the ED or ICU.
The eligible patients included those residing on a medical ward (including critical care units); the ICUs, OR, postoperative recovery areas, and ED areas were not regarded as general wards.
The primary outcome for the study was the composite outcome of the incidence (events divided by number of eligible patients admitted to the hospital and residing on a medical ward during the study period) of:
- Cardiac arrests without a pre-existing “not-for-resuscitation” (NFR) order;
- Unplanned ICU admissions; and
- Unexpected deaths (those without a pre-existing NFR order).
The results of the study:
- During the study period, the overall rate of calls for the cardiac arrest team or MET was significantly higher in intervention hospitals than in control hospitals. Calls not associated with events were more common in MET hospitals than in controls. Half of the total calls were not associated with a cardiac arrest or unexpected death, whereas in MET hospitals more than 80% of calls were not associated with a cardiac arrest or death (P<0.0001).
- In patients with documented MET calling criteria in association with cardiac arrest or unexpected death, the call rate was similar in MET and control hospitals.
- There were no significant differences between the MET and control hospitals for any outcome.
- The response to changes in vital signs was not adequate—even in MET centers.
These findings are surprising in view of previously reported findings using the MET system. Potential reasons for lack of difference between MET centers and controls include:
- Number of study sites or the duration of the study may not have been adequate for implementation or education;
- Hospitals may already be efficient in detecting and managing unstable patients;
- Patient selection criteria may have been overly restricted. For example, other studies have used 30 respirations per minute for tachypnea as a calling criterion compared with 36 breaths per minute used in this trial;
- Knowledge of the study may have leaked to control hospitals;
- Cardiac arrest teams function as METs at times: Nearly half of the calls to cardiac arrest teams in control hospitals were made without a cardiac arrest or unexpected death; and
- The selected outcomes may not be sensitive enough.
Even though this large, multicenter controlled trial was unable to show a significant benefit of METs, we should not be discouraged from performing further controlled trials in different settings. The use of METs is clearly an exciting and evolving area of medicine.
Barriers to Patient Safety
Amalberti R, Auroy Y, Berwick D, Barach P. Five system barriers to achieving ultrasafe health care. Ann Intern Med. 2005;142:756-764
Patient safety in our healthcare system is a growing concern. One area of dialogue concerning preventable healthcare-associated harms involves the comparability of the healthcare industry with non-medical industries, such as aviation and nuclear power, that have adapted successful strategies shown to provide ultrasafe environments. Amalberti, et al. discuss risk assessment in a variety of industries and explain the need for a benchmarking approach in order to optimize or achieve safety in the healthcare field.
The authors identify five systemic barriers from literature that are fundamentally connected to the ability of the healthcare field to achieve an extremely safe environment.
Barrier 1—acceptance of limitations on maximum performance: The first barrier is the type of expected performance in the field. This is illustrated by the tradeoffs associated with ultrasafety versus productivity. The amount of risk involved was directly related to the limits placed on maximum performance. The first barrier is the acceptance that every system has limits. When a producer exceeds their limit, then safety suffers. An example used is that of blood donation: The limits of collection speed are weighed against the needed screening process.
Barrier 2—abandonment of professional autonomy: The second barrier concerns the concept of professional autonomy. While more teamwork and regulations reduce individual autonomy, this appears to improve safety in the healthcare environment. The bottom line is the importance of teamwork. The example used is that of traffic on a highway: Autonomous units work together to function safely.
Barrier 3—transition from the mindset of craftsman to that of an equivalent actor: The third barrier to achieving high levels of safety includes an equivalent actor mindset. This entails establishing a reliable standard of excellent care in lieu of focusing on individuality, similar to the notion that passengers on an airline usually do not know their pilots, but have established confidence in the airline itself.
Barrier 4—the need for system-level arbitration to optimize safety strategies: The fourth barrier identified is a need for system-level arbitration to optimize safety strategies. This need results from the pressure for justice (usually through litigation) once an accident occurs. Top-down arbitration of safety will be less successful than system level design.
Barrier 5—the need to simplify professional rules and regulations: The final barrier results from the many of layers of guidelines as they serve to create an environment of excellence. This barrier necessitates the removal of these layers to simplify the environment. Existing guidelines should be distilled down to those shown to promote quality and safety. Byzantine rules can obscure the goal of safety and glorify rules, for rules sake.
Certain structural limitations within the field, such as worker shortages in the face of increasing public demands and the reliance of the field on trainees such as students, interns, and residents, create other hurdles. The authors conclude by suggesting a two-tiered system of healthcare whereby ultrasafety could be more easily accomplished in areas of medicine considered more stable (first tier), and a second tier of care that would include the more unstable conditions, and thus inherently, represent the higher risk situations where errors are more likely to occur.
Another provocative point of this article is the need to move toward educating and training teams—not individuals.
The Importance of Implementing COPD Guidelines
Harvey PA, Murphy MC, Dornom E, et al. Implementing evidence-based guidelines: inpatient management of chronic obstructive pulmonary disease. Intern Med J. 2005;35:151-155.
COPD is a common diagnosis that sometimes requires hospitalization. Evidence-based guidelines for disease management, including that of hospitalized patients, exist, but there is a paucity of knowledge about the actual quality of care delivered in the hospital as it aligns with published guidelines. This study by Harvey, et al. explores the quality of care delivered in the hospital for patients with COPD, while at the same time investigating an intervention for the medical staff in an effort to improve adherence to evidenced-based guidelines of the disease.
Using ICD-10 codes for a COPD diagnosis, the study incorporated a retrospective chart review of 49 hospital admissions prior to the intervention and 35 admissions after the intervention in a hospital in Melbourne, Australia. Data were collected pertaining to the hospital management of COPD as it compared with what the authors considered to be Level A—or the highest level of evidence summarized from several professional organizations. The intervention delivered to the medical staff included a summarized presentation of the results from the initial audit of the 49 charts, as well as an educational package that was given to them following the presentation.
Except for inappropriate use of intravenous aminophylline, of which there was a 100% concordance to Level A guidelines, the initiation of systemic steroids (intravenous and/or oral) had the highest concordance rate of 80% and 83%, pre- and postintervention respectively. Appropriate steroid duration (seven to 14 days) had the lowest concordance rates at 10% and 29%, pre- and postintervention respectively.
In addition, preintervention concordance (10%) involving steroid duration was the only rate considered significantly different in the postintervention group (29%). While concordance rates were high for the use of any type of nebulized bronchodilator (96% preintervention and 80% postintervention), the Level A guidelines the authors used suggested that beta-agonist bronchodilators should be used alone prior to the initiation of ipratropium bromide. The concordance rates for this guideline were 27% preintervention and 34% postintervention.
Largely, the authors felt their intervention failed to improve concordance rates to the Level A guidelines investigated and also that their findings of variable and lower concordance rates across the board corroborated other similar studies. The major weaknesses of this study included the small sample size and the nonrandomness of the sampling.
In addition, the authors report that the particular hospital studied included junior doctors who rotated on and off service, which likely prevented the effects of the intervention from being measured on a provider level. In spite of the weaknesses in the study, the article brings to light the need for a more effective translation of evidence-based guidelines to actual practice, especially in the practice of COPD management in the hospital. Further methods of guideline implementation in the clinic setting must be elucidated to improve the care patients with COPD receive in the hospital.
Not all Troponin Elevations Are Myocardial Infarctions
Jeremais A, Gibson CM. Narrative review: alternative causes for elevated cardiac troponin levels when acute coronary syndromes are excluded. Ann Intern Med. 2005;142:786-791.
Troponins are regulatory proteins that control the calcium-mediated interaction of actin and myosin during muscle contraction. All muscle tissue contains troponins, but cardiac troponin T and I have amino acid sequences that are different from skeletal and smooth muscle troponins, allowing them to be detectable by monoclonal antibody-based assays.
In the event of reversible or irreversible cell damage—or possibly even from transiently increased cell membrane permeability—cardiac troponins are released from myocytes into circulation. This characteristic provides a sensitive test for detecting myocardial injury and damage; however, this test is not specific for acute coronary syndromes. And any disorder that causes myocyte damage may cause an elevated troponin.
The 2002 American College of Cardiology/American Heart Association practice guidelines for unstable angina and non-ST-segment elevation myocardial infarction acknowledge that the myocardial necrosis signified by troponin elevation may not necessarily be caused by atherosclerotic coronary artery disease. Such nonthrombotic troponin elevation can be caused by four basic mechanisms, as discussed by Dr. Jeremias and Dr. Gibson.
- Demand ischemia refers to a mismatch between myocardial oxygen demand and supply in the absence of flow-limiting epicardial stenosis. Conditions such as sepsis or septic shock and the systemic inflammatory response syndrome, hypotension or hypovolemia, tachyarrhythmias, and left ventricular hypertrophy can all cause release of cardiac troponin.
- Myocardial ischemia in the absence of fixed obstructive coronary disease can be caused by coronary vasospasm, acute stroke or intracranial hemorrhage, and ingestion of sympathomimetics.
- Direct myocardial damage can be seen in cardiac contusion, direct current cardioversion, cardiac infiltrative disorders such as amyloidosis, certain chemotherapy agents, myocarditis, pericarditis, and cardiac transplantation.
- Myocardial strain occurs when volume and pressure overload of the left and/or right ventricle cause excessive wall tension. Congestive heat failure, acute pulmonary embolism, and chronic pulmonary hypertension can lead to myocardial strain and troponin elevation.
Another condition that can lead to persistently elevated cardiac troponins is end-stage renal disease. This elevation may be due to small areas of clinically silent myocardial necrosis, an increased left ventricular mass, or possibly from impaired renal troponin excretion. Although troponins are believed to be cleared by the reticuloendothelial system, recent evidence shows that troponin T is fragmented into molecules that are small enough to be renally excreted.
In summary, elevated troponin can be found in many clinical settings and is associated with impaired short- and long-term survival. TH
Classic Literature
The HATEFUL Patient
Every physician has groaned internally when seeing a certain patient’s name on his list, going out of her way to avoid a particular family, or getting hopelessly engaged and increasingly enraged in a battle over a “lost” narcotic prescription. There are certain patients with whom a doctor-patient relationship feels more like a contest than a partnership. These interactions make a physician’s daily practice difficult, and they may wreak havoc among the staff on an inpatient ward. These patients grow ever more intolerable to their caregivers, who often harbor a wish to simply make them disappear.
In his landmark 1978 article “Taking Care of the Hateful Patient,” (NEJM, 298:883-887) James Groves, MD, discussed the characteristics of these difficult patients and the sometimes difficult emotions they generate in their caregivers. He described four different groups of patients, using an illustrative case for each, and discussed the ways in which these patients’ often maddening behavior serves to mitigate their profound dependency.
Dependent clingers are those patients whose neediness is overt, who seem to regard the physician as a sow with teats to spare. Dr. Groves suggested early, firm limit-setting with these patients to prevent the formation and later shattering of the patient’s illusion of the physician as inexhaustible.
Dependency lies at the heart of an entitled demander’s behavior as well, but their fear of abandonment is expressed as hostility and arrogance rather than overt neediness. Affirming to the patient that you share in their quest for the good (but not perfect) medical care to which they are entitled allows patient and physician to rally around a common goal.
This strategy backfires with manipulative help-rejecters, who seem almost pleased to report to their physician each time they fail a new treatment attempt. Overtly expressing some doubt that the treatment will completely cure all the patient’s difficulties and providing regular follow up are recommended for this group. These strategies relieve the patient of the unconscious anxiety that he may be abandoned by his physician should his symptoms abate.
Self-destructive deniers make the physician feel powerless as they persist in behavior that undermines all efforts to improve their health. With these patients, viewing their behavior as a terminal illness and managing symptoms and exacerbations accordingly allows the physician to focus on caring for the patient without unrealistic expectations of cure on the one hand and judgmental indifference on the other.
After discussing each of these groups, Dr. Groves concluded the article by suggesting that perhaps the greatest challenge physicians face in caring for these difficult patients is the temptation to disown the negative feelings they engender. He wrote that this effort not only strains the doctor’s limits, but also wastes valuable clinical data unmasked by these feelings—data that could inform clinical care. For decades prior to Dr. Groves’ article, psychoanalysts had reflected on what Freud termed “countertransference,” or the physician’s internal emotional reaction to a patient.
In his article “Hate in the Counter-Transference,” D.W. Winnicott, MD, suggested that rather than accepting the guilt that these feelings typically engender in a caregiver, negative countertransference reactions should be regarded by the physician as valuable information in understanding the patient’s psychic world. By training and by disposition, however, most physicians considered (and continue to consider) these emotions inappropriate. They seemingly negate the sympathy, kindness, and commitment to the patient’s well-being that should be central to a physician’s vocation. Conventional wisdom held that denying the feelings was the only proper response, and if that proved impossible, transferring the patient to a willing colleague was usually recommended. In contrast, Dr. Groves freed the physician to use these feelings to improve patient care.
Now a classic and oft-cited work, “Taking Care of the Hateful Patient” distills a wealth of analytic insight into a structure and language comprehensible to the busy generalist. By explaining the reactions each group of patients induces in their physicians, Dr. Groves provides useful tools to understand a particular patient’s psychology. Suggestions for strategic approaches to each category of patient are easy to understand and to adapt to one’s own practice. He explains how judicious limit-setting can be as valuable for the patient as it is for the doctor. Perhaps most helpful is his description of the needs of these patients that lie beneath their “hateful” exterior. Armed with this understanding, a physician can reclaim the empathy that is often so elusive with these patients.—Sandra Rackley MD, Kemuel Philbrick, MD