User login
PMI After Hip Fracture Surgery
Perioperative myocardial infarction (PMI) often remains unrecognized with higher mortality in the aged.13 Perioperative ischemic symptoms are often masked by analgesia, sedation, and transient and subtle electrocardiographic (ECG) changes. Postoperative troponin measurement is not routinely done for PMI diagnosis. Hip fracture surgery is the most common non‐cardiac surgical procedure in the elderly, with limited data on clinical presentation of PMI.46 Moreover, the elderly are significantly underrepresented in clinical studies.7 We therefore examined the clinical presentation of PMI and its outcomes among elderly patients admitted for hip fracture repair.
METHODS
Study Population
A population‐based, retrospective, case‐control study was conducted of all residents in Olmsted County, Minnesota undergoing surgery for hip fracture repair from January 1, 1988 through December 31, 2002. Primary indication for the surgery was proximal femur (femoral neck or subtrochanteric) fracture. Patients who were <65 years old, had a pathological hip fracture, multiple injuries or fractures, surgery >72 hours after injury (due to higher mortality with delayed surgery),8 nonsurgical management of hip fracture repair, or incomplete data were excluded. All patients provided prior authorization to use their medical records for research, per institutional protocols.9
Criteria for Perioperative Myocardial Infarction and Death
We utilized the universal definition of acute myocardial infarction10 to define PMI within the first 7 days following hip fracture surgery. We included creatine kinase‐MB fraction (CK‐MB) as the biomarker for 1988July 2000, and troponin as the biomarker for August 20002002. Mortality was defined as death from any cause within the first year following hip fracture repair. Deaths were identified through the National Death Index.
Statistical Analysis
For each case of PMI, we identified 2 control patients who were selected at random from the non‐PMI patient population. These controls were matched to cases based on age at the time of surgery (5 years) and gender in 1:2 ratios. Baseline characteristics across PMI and non‐PMI groups were compared using the Kruskal‐Wallis test (for continuous data) and the chi‐square or Fisher's exact tests (for categorical data). Mean values were utilized in place of the missing values for the following variables: preoperative troponin (missing values 88 [17.5%]), CK‐MB (8 [1.6%]), troponin (21 [5.4%]), and postoperative hemoglobin (17 [3.4%]). Univariate predictors of PMI with P 0.2 baseline characteristics were entered into a multivariate, conditional, logistic regression analysis. Rates of outcomes were calculated using the Kaplan‐Meier method, and by a landmark survival curve for those with and without PMI. Cox proportional hazards analysis was utilized for survival analysis at 30 days and 1 year. All statistical tests were 2‐sided, and P values <0.05 were considered significant. All analyses were performed using SAS for UNIX (version 9.1.3; SAS Institute, Inc, Cary, NC).
RESULTS
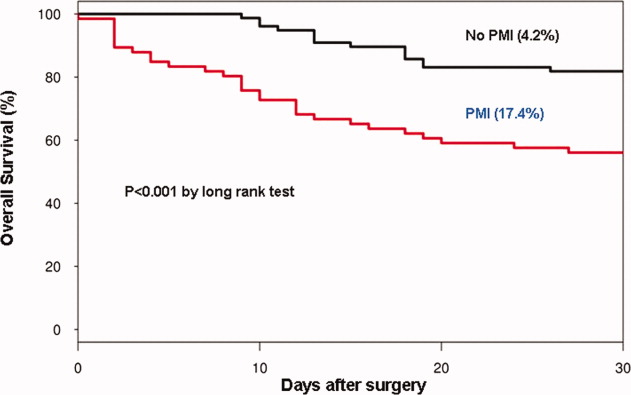
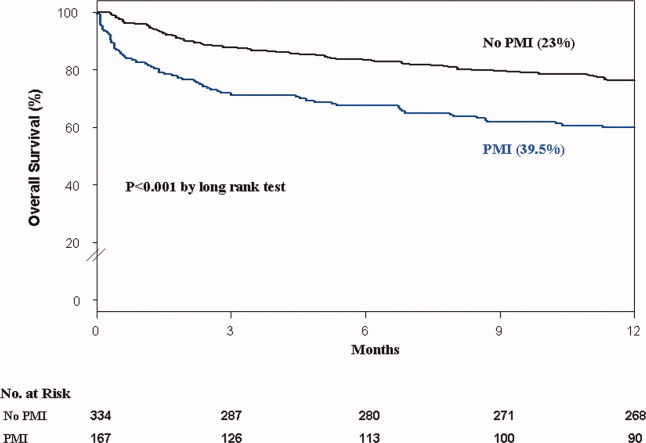
In the cohort of 1212 with hip fracture surgeries, 167 (13.8%) cases of PMI occurred in the first 7 days, of which 153 (92%) occurred within the first 48 hours. A total of 334 controls were matched with 167 cases of PMI. Table 1 summarizes the demographic characteristics of the study participants. Of the patients with PMI, 25.2% experienced symptoms of ischemia; 7% reported chest pain, and 12% reported dyspnea. Only 22.8% of patients with PMI had ECG changes consistent with ischemia. ST elevation MI was present in 7.2% patients. PMI patients had a lower mean hemoglobin compared to the patients without PMI (8.9 mg/dL vs 9.4 mg/dL, P < 0.001). Median length of stay (LOS) in the hospital was higher among patients who experienced PMI (11.6 vs 7.4 days, P < 0.001). Overall in‐hospital mortality was 5.6%. There were 24 deaths (14.4%) in the PMI group compared to 4 (1.2%) in‐hospital deaths in patients without PMI (P < 0.001). A total of 473 (94%) patients survived to discharge. At 30‐day follow‐up, there were 29 (17.4%) deaths in the PMI group and 14 (4.2%) deaths in non‐PMI group. During the follow‐up for 1 year, there were 143 (29%) deaths: PMI 66 (39.5%) and 77 (23%) non‐PMI group (P < 0.01).
| Characteristics, n (%) | Patients With PMI | Patients Without PMI | P Value* |
|---|---|---|---|
| (N = 167) | (N = 334) | ||
| |||
| Age mean SD | 85.3 7.4 | 85.2 7.1 | 0.5 |
| Weight (kg) mean SD | 59.98 16.7 | 59.80 13.9 | 0.5 |
| Women | 127 (76.4) | 254 (76) | 0.5 |
| Any symptom of ischemia, n (%) | |||
| Chest/arm pain | 11 (7) | 4 (1) | 0.002 |
| Dyspnea | 20 (12) | 14 (4) | 0.001 |
| Nausea/vomiting | 8 (5) | 6 (2) | 0.08 |
| Diaphoresis | 1 (1) | 1 (0.3) | 1.0 |
| PND | 3 (2) | 1 (0.3) | 0.3 |
| ECG changes, n (%) | |||
| ST‐segment elevation MI | 12 (7.2) | 0 | 0.01 |
| New ECG changes consistent with ischemia | 38 (22.8) | 1(0.3) | 0.01 |
| Biochemical evidence of ischemia, n (%) | |||
| CK‐MB | 147 (88) | 20 (6) | 0.01 |
| Troponin | 52 (33) | 9 (3) | 0.001 |
| Laboratory markers | |||
| Hemoglobin gm/dL mean (SD) | 8.9 1.0 | 9.4 1.2 | 0.001 |
| Postoperative anemia (<8.0 gm/dL), n (%) | 22 (13.2) | 37 (11.1) | 0.5 |
| Length of stay (days), mean SD | 11.6 7.7 | 7.4 6.4 | 0.001 |
| In‐hospital outcome | <0.001 | ||
| Dead | 24 (14.4) | 4 (1.2) | |
| Alive | 143 (85.6) | 330 (98.8) | |
| 30‐Day outcome | <0.001 | ||
| Dead | 29 (17.4) | 14 (4.2) | |
| Alive | 138 (82.6) | 320 (95.8) | |
| 1‐Year outcome | <0.001 | ||
| Dead | 66 (39.5) | 77 (23) | |
| Alive | 101 (60.4) | 257 (77) | |
Table 2 describes the risk factors associated with PMI in‐hospital, 30‐day, and 1‐year mortality. Risk factors for PMI were coronary artery disease (CAD) (odds ratio [OR], 3.5; confidence interval [CI], 2.25.6), and serum creatinine >2 mg/dL (OR, 2.4; CI, 1.34.4). Risk factors for in‐hospital mortality were age 8589 (OR, 5.3; CI, 1.617.7), age 90 (OR, 8.9; CI, 2.630.8), PMI (OR 15.1; CI, 4.648.8), male gender (OR 5.8; CI, 2.215.2), dyspnea (OR 5.4; CI, 1.816.9), and hemoglobin <8.0 gm/dL (OR, 3.5; CI, 1.29.9). PMI was a strong predictor for 30‐day mortality (hazard ratio [HR], 4.3; CI, 2.18.9). Risk factors for 1‐year mortality were: age 90 (HR, 2.0; CI, 1.43.1), male gender (HR, 2.1; CI, 1.53.0), and PMI (HR, 1.9; CI, 1.42.7). Figures 1 and 2 describe the Kaplan‐Meier survival curves for patients with and without PMI.
| Unadjusted OR (95% CI) | Adjusted OR (95% CI) | P Value | |
|---|---|---|---|
| |||
| Perioperative myocardial infarction | |||
| Coronary artery disease | 3.0 (2.14.5) | 3.5 (2.25.6) | <0.001 |
| Serum creatinine >2.0 mg/dL | 2.7 (1.64.8) | 2.4 (1.34.4) | 0.003 |
| In‐hospital mortality | |||
| Age 8589 | 1.7 (0.83.7) | 5.3 (1.617.7) | 0.01 |
| Age 90 | 2.2 (1.04.8) | 8.9 (2.630.8) | <0.001 |
| Male gender | 3.0 (1.46.4) | 5.8 (2.215.2) | <0.001 |
| Postoperative anemia (<8.0 gm/dL) | 4.2 (1.710.0) | 3.5 (1.29.9) | 0.02 |
| Perioperative myocardial infarction | 14.0 (5.248.0) | 15.1 (4.649.0) | <0.001 |
| 30‐Day mortality | |||
| Perioperative myocardial infarction | 4.1 (2.27.8) | 4.3 (2.18.9) | <0.001 |
| 1‐Year mortality | |||
| Age 8589 | 1.3 (0.81.9) | 1.6 (1.02.4) | <0.03 |
| Age 90 | 1.9 (1.32.9) | 2.0 (1.43.1) | 0.001 |
| Male gender | 1.9 (1.32.6) | 2.1 (1.53.0) | <0.001 |
| Dementia | 2.5 (1.83.6) | 2.7 (1.93.8) | <0.001 |
| Perioperative myocardial infarction | 2.0 (1.52.8) | 1.9 (1.42.7) | 0.001 |
DISCUSSION
We report the high incidence of PMI (13.8%) in the cohort of 1212 elderly patients (mean age 85 years) undergoing hip fracture surgery. Most PMI events (92%) occurred within the first 48 hours of surgery. Most of the events (75%) were asymptomatic. Elderly patients with PMI had an increased hospital LOS by 4.2 days, with high in‐hospital mortality (13.8%), 30‐day mortality (17.4%), and 1‐year mortality (39.5%).
Most of the PMI patients were identified with cardiac biomarkers on the basis of universal definition of MI within the first 48 hours. Although universal definition of MI does not define PMI as a separate type, PMI shares common pathophysiological pathways of Type 1 MI (primary coronary event) and Type 2 MI (myocardial oxygen supplydemand imbalance). Postoperative tachycardia, hemodynamic instability, anemia, and hypoxemia may initiate pathways causing more Type 2 MI. Our study highlights the continued need for active surveillance of clinical symptoms, postoperative ECG monitoring for STT changes, and utilizing cardiac troponin in older postoperative patients to improve diagnostic accuracy of PMI.
The current study has higher asymptomatic PMI events when compared to a study of Devereaux et al.11 The current study had an older population undergoing urgent hip fracture surgery, with a higher burden of CAD (60%) and renal failure (20%) with serum creatinine >2 gm/dL (see Supporting Information, Appendix 1, in the online version of this article). Older age and a higher burden of these risk factors may explain the higher incidence of PMI in the current study. Perioperative liberal use of analgesics in hip fracture surgery may explain more asymptomatic patients.
In light of the recently published FOCUS12 trial, an important finding from our study is that postoperative anemia among elderly (<8.0 gm/dL) is associated with a 3.5‐fold increased in‐hospital mortality. It is critical to maintain perioperative hemoglobin above 8.0 gm/dL in very elderly patients, due to asymptomatic presentation of PMI.
In the current study, PMI is associated with a 15‐fold increased risk of in‐hospital death and a 4.3‐fold increased risk of 30‐day mortality in the elderly. Advanced age (85 years) is a well known strong predictor of initial hospital admission and death in elderly patients after outpatient surgery.13 Furthermore, the odds for an in‐hospital death increase by 70% for each 10‐year increase in age.14 Therefore, early detection of silent PMI among at‐risk elderly patients by cardiac biomarkers may help in optimization of cardiac pharmacotherapy known to decrease short‐ and long‐term mortality.
There are limitations inherent to the retrospective design and methodology. Data collection was done through the year 2002. CK was used for the period that spans from 1988 to mid‐2000. Troponin was used from 2000 to 2002. Statin use was not analyzed for lack of significant data. Limited use of beta‐blockers (15%) and angiotensin‐converting‐enzyme (ACE) inhibitors (25%) may also contribute to higher events (see Supporting Information, Appendix 1, in the online version of this article).
CONCLUSIONS
Elderly patients have a higher incidence of PMI and mortality after hip fracture surgery than what guidelines indicate. The majority of the elderly patients with PMI did not experience ischemic symptoms and required cardiac biomarkers for diagnosis. The results of our study support the measurement of troponin in postoperative elderly patients for the diagnosis of PMI to implement in‐hospital preventive strategies to reduce PMI‐associated mortality.
Acknowledgements
The authors gratefully acknowledge the assistance of Ms Dawn Bergen in drafting and editing the manuscript.
Disclosures: This research was supported by funding from AHA grant 03‐30103N‐04, Rochester Epidemiology Project (grant RO1‐AR30582 from the National Institute of Arthritis and Musculoskeletal and Skin Diseases). The project was also supported by the National Center for Research Resources and the National Center for Advancing Translational Sciences, National Institutes of Health, through grant UL1 RR024150. The content is solely the responsibility of the authors and does not necessarily represent the official views of the NIH.
- , , , et al. Impact of age on perioperative complications and length of stay in patients undergoing noncardiac surgery. Ann Intern Med. 2001;134(8):637–643.
- , , , et al. Meta‐analysis: excess mortality after hip fracture among older women and men. Ann Intern Med. 2010;152(6):380–390.
- , , , et al. Body mass index (BMI) and risk of noncardiac postoperative medical complications in elderly hip fracture patients: a population‐based study. J Hosp Med. 2009;4(8):E1–E9.
- . History of the Rochester Epidemiology Project. Mayo Clin Proc. 1996;71(3):266–274.
- , , , . Incidence and mortality of hip fractures in the United States. JAMA. 2009;302(14):1573–1579.
- , , , et al. Body mass index and risk of adverse cardiac events in elderly patients with hip fracture: a population‐based study. J Am Geriatr Soc. 2009;57(3):419–426.
- , , , et al. Acute coronary care in the elderly, part I. Non‐ST‐segment‐elevation acute coronary syndromes: a scientific statement for healthcare professionals from the American Heart Association Council on Clinical Cardiology: in collaboration with the Society of Geriatric Cardiology. Circulation. 2007;115(19):2549–2569.
- , . Hip fracture mortality. A prospective, multifactorial study to predict and minimize death risk. Clin Orthop Relat Res. 1992;280:214–222.
- , , , et al. ACC/AHA/ACP‐ASIM guidelines for the management of patients with chronic stable angina. J Am Coll Cardiol. 1999;33(7):2092–2190.
- , , ; for the Joint ESC/ACCF/AHA/WHF Task Force for the Redefinition of Myocardial Infarction. Universal definition of myocardial infarction. J Am Coll Cardiol. 2007;50(22):2173–2195.
- , , , et al. Characteristics and short‐term prognosis of perioperative myocardial infarction in patients undergoing noncardiac surgery. Ann Intern Med. 2011;154(8):523–528.
- , , , et al. Liberal or restrictive transfusion in high‐risk patients after hip surgery. N Engl J Med. 2011;365(26):2453–2462.
- , , , . Inpatient hospital admission and death after outpatient surgery in elderly patients: importance of patient and system characteristics and location of care. Arch Surg. 2004;139(1):67–72.
- , , , et al. Predictors of hospital mortality in the global registry of acute coronary events. Arch Intern Med. 2003;163(19):2345–2353.
Perioperative myocardial infarction (PMI) often remains unrecognized with higher mortality in the aged.13 Perioperative ischemic symptoms are often masked by analgesia, sedation, and transient and subtle electrocardiographic (ECG) changes. Postoperative troponin measurement is not routinely done for PMI diagnosis. Hip fracture surgery is the most common non‐cardiac surgical procedure in the elderly, with limited data on clinical presentation of PMI.46 Moreover, the elderly are significantly underrepresented in clinical studies.7 We therefore examined the clinical presentation of PMI and its outcomes among elderly patients admitted for hip fracture repair.
METHODS
Study Population
A population‐based, retrospective, case‐control study was conducted of all residents in Olmsted County, Minnesota undergoing surgery for hip fracture repair from January 1, 1988 through December 31, 2002. Primary indication for the surgery was proximal femur (femoral neck or subtrochanteric) fracture. Patients who were <65 years old, had a pathological hip fracture, multiple injuries or fractures, surgery >72 hours after injury (due to higher mortality with delayed surgery),8 nonsurgical management of hip fracture repair, or incomplete data were excluded. All patients provided prior authorization to use their medical records for research, per institutional protocols.9
Criteria for Perioperative Myocardial Infarction and Death
We utilized the universal definition of acute myocardial infarction10 to define PMI within the first 7 days following hip fracture surgery. We included creatine kinase‐MB fraction (CK‐MB) as the biomarker for 1988July 2000, and troponin as the biomarker for August 20002002. Mortality was defined as death from any cause within the first year following hip fracture repair. Deaths were identified through the National Death Index.
Statistical Analysis
For each case of PMI, we identified 2 control patients who were selected at random from the non‐PMI patient population. These controls were matched to cases based on age at the time of surgery (5 years) and gender in 1:2 ratios. Baseline characteristics across PMI and non‐PMI groups were compared using the Kruskal‐Wallis test (for continuous data) and the chi‐square or Fisher's exact tests (for categorical data). Mean values were utilized in place of the missing values for the following variables: preoperative troponin (missing values 88 [17.5%]), CK‐MB (8 [1.6%]), troponin (21 [5.4%]), and postoperative hemoglobin (17 [3.4%]). Univariate predictors of PMI with P 0.2 baseline characteristics were entered into a multivariate, conditional, logistic regression analysis. Rates of outcomes were calculated using the Kaplan‐Meier method, and by a landmark survival curve for those with and without PMI. Cox proportional hazards analysis was utilized for survival analysis at 30 days and 1 year. All statistical tests were 2‐sided, and P values <0.05 were considered significant. All analyses were performed using SAS for UNIX (version 9.1.3; SAS Institute, Inc, Cary, NC).
RESULTS
In the cohort of 1212 with hip fracture surgeries, 167 (13.8%) cases of PMI occurred in the first 7 days, of which 153 (92%) occurred within the first 48 hours. A total of 334 controls were matched with 167 cases of PMI. Table 1 summarizes the demographic characteristics of the study participants. Of the patients with PMI, 25.2% experienced symptoms of ischemia; 7% reported chest pain, and 12% reported dyspnea. Only 22.8% of patients with PMI had ECG changes consistent with ischemia. ST elevation MI was present in 7.2% patients. PMI patients had a lower mean hemoglobin compared to the patients without PMI (8.9 mg/dL vs 9.4 mg/dL, P < 0.001). Median length of stay (LOS) in the hospital was higher among patients who experienced PMI (11.6 vs 7.4 days, P < 0.001). Overall in‐hospital mortality was 5.6%. There were 24 deaths (14.4%) in the PMI group compared to 4 (1.2%) in‐hospital deaths in patients without PMI (P < 0.001). A total of 473 (94%) patients survived to discharge. At 30‐day follow‐up, there were 29 (17.4%) deaths in the PMI group and 14 (4.2%) deaths in non‐PMI group. During the follow‐up for 1 year, there were 143 (29%) deaths: PMI 66 (39.5%) and 77 (23%) non‐PMI group (P < 0.01).
| Characteristics, n (%) | Patients With PMI | Patients Without PMI | P Value* |
|---|---|---|---|
| (N = 167) | (N = 334) | ||
| |||
| Age mean SD | 85.3 7.4 | 85.2 7.1 | 0.5 |
| Weight (kg) mean SD | 59.98 16.7 | 59.80 13.9 | 0.5 |
| Women | 127 (76.4) | 254 (76) | 0.5 |
| Any symptom of ischemia, n (%) | |||
| Chest/arm pain | 11 (7) | 4 (1) | 0.002 |
| Dyspnea | 20 (12) | 14 (4) | 0.001 |
| Nausea/vomiting | 8 (5) | 6 (2) | 0.08 |
| Diaphoresis | 1 (1) | 1 (0.3) | 1.0 |
| PND | 3 (2) | 1 (0.3) | 0.3 |
| ECG changes, n (%) | |||
| ST‐segment elevation MI | 12 (7.2) | 0 | 0.01 |
| New ECG changes consistent with ischemia | 38 (22.8) | 1(0.3) | 0.01 |
| Biochemical evidence of ischemia, n (%) | |||
| CK‐MB | 147 (88) | 20 (6) | 0.01 |
| Troponin | 52 (33) | 9 (3) | 0.001 |
| Laboratory markers | |||
| Hemoglobin gm/dL mean (SD) | 8.9 1.0 | 9.4 1.2 | 0.001 |
| Postoperative anemia (<8.0 gm/dL), n (%) | 22 (13.2) | 37 (11.1) | 0.5 |
| Length of stay (days), mean SD | 11.6 7.7 | 7.4 6.4 | 0.001 |
| In‐hospital outcome | <0.001 | ||
| Dead | 24 (14.4) | 4 (1.2) | |
| Alive | 143 (85.6) | 330 (98.8) | |
| 30‐Day outcome | <0.001 | ||
| Dead | 29 (17.4) | 14 (4.2) | |
| Alive | 138 (82.6) | 320 (95.8) | |
| 1‐Year outcome | <0.001 | ||
| Dead | 66 (39.5) | 77 (23) | |
| Alive | 101 (60.4) | 257 (77) | |
Table 2 describes the risk factors associated with PMI in‐hospital, 30‐day, and 1‐year mortality. Risk factors for PMI were coronary artery disease (CAD) (odds ratio [OR], 3.5; confidence interval [CI], 2.25.6), and serum creatinine >2 mg/dL (OR, 2.4; CI, 1.34.4). Risk factors for in‐hospital mortality were age 8589 (OR, 5.3; CI, 1.617.7), age 90 (OR, 8.9; CI, 2.630.8), PMI (OR 15.1; CI, 4.648.8), male gender (OR 5.8; CI, 2.215.2), dyspnea (OR 5.4; CI, 1.816.9), and hemoglobin <8.0 gm/dL (OR, 3.5; CI, 1.29.9). PMI was a strong predictor for 30‐day mortality (hazard ratio [HR], 4.3; CI, 2.18.9). Risk factors for 1‐year mortality were: age 90 (HR, 2.0; CI, 1.43.1), male gender (HR, 2.1; CI, 1.53.0), and PMI (HR, 1.9; CI, 1.42.7). Figures 1 and 2 describe the Kaplan‐Meier survival curves for patients with and without PMI.
| Unadjusted OR (95% CI) | Adjusted OR (95% CI) | P Value | |
|---|---|---|---|
| |||
| Perioperative myocardial infarction | |||
| Coronary artery disease | 3.0 (2.14.5) | 3.5 (2.25.6) | <0.001 |
| Serum creatinine >2.0 mg/dL | 2.7 (1.64.8) | 2.4 (1.34.4) | 0.003 |
| In‐hospital mortality | |||
| Age 8589 | 1.7 (0.83.7) | 5.3 (1.617.7) | 0.01 |
| Age 90 | 2.2 (1.04.8) | 8.9 (2.630.8) | <0.001 |
| Male gender | 3.0 (1.46.4) | 5.8 (2.215.2) | <0.001 |
| Postoperative anemia (<8.0 gm/dL) | 4.2 (1.710.0) | 3.5 (1.29.9) | 0.02 |
| Perioperative myocardial infarction | 14.0 (5.248.0) | 15.1 (4.649.0) | <0.001 |
| 30‐Day mortality | |||
| Perioperative myocardial infarction | 4.1 (2.27.8) | 4.3 (2.18.9) | <0.001 |
| 1‐Year mortality | |||
| Age 8589 | 1.3 (0.81.9) | 1.6 (1.02.4) | <0.03 |
| Age 90 | 1.9 (1.32.9) | 2.0 (1.43.1) | 0.001 |
| Male gender | 1.9 (1.32.6) | 2.1 (1.53.0) | <0.001 |
| Dementia | 2.5 (1.83.6) | 2.7 (1.93.8) | <0.001 |
| Perioperative myocardial infarction | 2.0 (1.52.8) | 1.9 (1.42.7) | 0.001 |
DISCUSSION
We report the high incidence of PMI (13.8%) in the cohort of 1212 elderly patients (mean age 85 years) undergoing hip fracture surgery. Most PMI events (92%) occurred within the first 48 hours of surgery. Most of the events (75%) were asymptomatic. Elderly patients with PMI had an increased hospital LOS by 4.2 days, with high in‐hospital mortality (13.8%), 30‐day mortality (17.4%), and 1‐year mortality (39.5%).
Most of the PMI patients were identified with cardiac biomarkers on the basis of universal definition of MI within the first 48 hours. Although universal definition of MI does not define PMI as a separate type, PMI shares common pathophysiological pathways of Type 1 MI (primary coronary event) and Type 2 MI (myocardial oxygen supplydemand imbalance). Postoperative tachycardia, hemodynamic instability, anemia, and hypoxemia may initiate pathways causing more Type 2 MI. Our study highlights the continued need for active surveillance of clinical symptoms, postoperative ECG monitoring for STT changes, and utilizing cardiac troponin in older postoperative patients to improve diagnostic accuracy of PMI.
The current study has higher asymptomatic PMI events when compared to a study of Devereaux et al.11 The current study had an older population undergoing urgent hip fracture surgery, with a higher burden of CAD (60%) and renal failure (20%) with serum creatinine >2 gm/dL (see Supporting Information, Appendix 1, in the online version of this article). Older age and a higher burden of these risk factors may explain the higher incidence of PMI in the current study. Perioperative liberal use of analgesics in hip fracture surgery may explain more asymptomatic patients.
In light of the recently published FOCUS12 trial, an important finding from our study is that postoperative anemia among elderly (<8.0 gm/dL) is associated with a 3.5‐fold increased in‐hospital mortality. It is critical to maintain perioperative hemoglobin above 8.0 gm/dL in very elderly patients, due to asymptomatic presentation of PMI.
In the current study, PMI is associated with a 15‐fold increased risk of in‐hospital death and a 4.3‐fold increased risk of 30‐day mortality in the elderly. Advanced age (85 years) is a well known strong predictor of initial hospital admission and death in elderly patients after outpatient surgery.13 Furthermore, the odds for an in‐hospital death increase by 70% for each 10‐year increase in age.14 Therefore, early detection of silent PMI among at‐risk elderly patients by cardiac biomarkers may help in optimization of cardiac pharmacotherapy known to decrease short‐ and long‐term mortality.
There are limitations inherent to the retrospective design and methodology. Data collection was done through the year 2002. CK was used for the period that spans from 1988 to mid‐2000. Troponin was used from 2000 to 2002. Statin use was not analyzed for lack of significant data. Limited use of beta‐blockers (15%) and angiotensin‐converting‐enzyme (ACE) inhibitors (25%) may also contribute to higher events (see Supporting Information, Appendix 1, in the online version of this article).
CONCLUSIONS
Elderly patients have a higher incidence of PMI and mortality after hip fracture surgery than what guidelines indicate. The majority of the elderly patients with PMI did not experience ischemic symptoms and required cardiac biomarkers for diagnosis. The results of our study support the measurement of troponin in postoperative elderly patients for the diagnosis of PMI to implement in‐hospital preventive strategies to reduce PMI‐associated mortality.
Acknowledgements
The authors gratefully acknowledge the assistance of Ms Dawn Bergen in drafting and editing the manuscript.
Disclosures: This research was supported by funding from AHA grant 03‐30103N‐04, Rochester Epidemiology Project (grant RO1‐AR30582 from the National Institute of Arthritis and Musculoskeletal and Skin Diseases). The project was also supported by the National Center for Research Resources and the National Center for Advancing Translational Sciences, National Institutes of Health, through grant UL1 RR024150. The content is solely the responsibility of the authors and does not necessarily represent the official views of the NIH.
- , , , et al. Impact of age on perioperative complications and length of stay in patients undergoing noncardiac surgery. Ann Intern Med. 2001;134(8):637–643.
- , , , et al. Meta‐analysis: excess mortality after hip fracture among older women and men. Ann Intern Med. 2010;152(6):380–390.
- , , , et al. Body mass index (BMI) and risk of noncardiac postoperative medical complications in elderly hip fracture patients: a population‐based study. J Hosp Med. 2009;4(8):E1–E9.
- . History of the Rochester Epidemiology Project. Mayo Clin Proc. 1996;71(3):266–274.
- , , , . Incidence and mortality of hip fractures in the United States. JAMA. 2009;302(14):1573–1579.
- , , , et al. Body mass index and risk of adverse cardiac events in elderly patients with hip fracture: a population‐based study. J Am Geriatr Soc. 2009;57(3):419–426.
- , , , et al. Acute coronary care in the elderly, part I. Non‐ST‐segment‐elevation acute coronary syndromes: a scientific statement for healthcare professionals from the American Heart Association Council on Clinical Cardiology: in collaboration with the Society of Geriatric Cardiology. Circulation. 2007;115(19):2549–2569.
- , . Hip fracture mortality. A prospective, multifactorial study to predict and minimize death risk. Clin Orthop Relat Res. 1992;280:214–222.
- , , , et al. ACC/AHA/ACP‐ASIM guidelines for the management of patients with chronic stable angina. J Am Coll Cardiol. 1999;33(7):2092–2190.
- , , ; for the Joint ESC/ACCF/AHA/WHF Task Force for the Redefinition of Myocardial Infarction. Universal definition of myocardial infarction. J Am Coll Cardiol. 2007;50(22):2173–2195.
- , , , et al. Characteristics and short‐term prognosis of perioperative myocardial infarction in patients undergoing noncardiac surgery. Ann Intern Med. 2011;154(8):523–528.
- , , , et al. Liberal or restrictive transfusion in high‐risk patients after hip surgery. N Engl J Med. 2011;365(26):2453–2462.
- , , , . Inpatient hospital admission and death after outpatient surgery in elderly patients: importance of patient and system characteristics and location of care. Arch Surg. 2004;139(1):67–72.
- , , , et al. Predictors of hospital mortality in the global registry of acute coronary events. Arch Intern Med. 2003;163(19):2345–2353.

Heart Failure and Hip Fracture Repair
As the population ages, hip fractures and heart failure increase in prevalence.1, 2 Heart failure prevalence is also increasing in hospitalized patients.3 Indeed, hospitalizations involving heart failure as an active issue tripled in the last 30 years.4 Heart failure has been associated with an increased risk for hip fracture,5, 6 and previous studies report a 6%20% prevalence of preoperative heart failure in hip fracture patients.710 While exacerbation of heart failure increases the mortality risk in patients admitted for hip fractures,8 the incidence of new heart failure, as well as the preoperative factors that predict postoperative heart failure in this patient population remain unclear.
American College of Cardiology/American Heart Association (ACC/AHA) perioperative guidelines identify orthopedic surgeries, including hip fracture repair, as intermediate risk procedures.11 Compared to other intermediate risk operations, however, postoperative outcomes following hip fracture repair differ significantly.1216 Overall mortality in hip fracture patients has been reported at 29% at one year,8 with the excess mortality from hip fracture alone at nearly 20%.10, 13 However, the exact factors that contribute to this excess mortality, particularly with regard to heart failure, remain unclear.
To examine the preoperative prevalence, subsequent incidence, and predictors of heart failure in patients undergoing hip fracture repair operations, this study used an established, population‐based database to compare the postoperative consequences in hip fracture repair patients with and without preexisting heart failure. We hypothesized that preoperative heart failure worsens postoperative outcomes in hip fracture patients.
METHODS
Case Ascertainment
Following approval by the Institutional Review Boards of Mayo Clinic and the Olmsted Medical Center, we used the Rochester Epidemiology Project (REP) to identify the patients for this study. The REP is a population‐based medical records linkage system that records all diagnoses, surgical procedures, laboratory data, and death information from hospital, emergency room, outpatient, and nursing home care in the community.17
All Olmsted County, Minnesota, residents who sustained a hip fracture and underwent surgical repair from 1988 through 2002 were evaluated. Patients with more than one hip fracture during the study period (96 occurrences) were censored from the data analysis at the time of the subsequent hip fracture and then included as new cases. The complete enumeration of hip fracture episodes managed in the three Olmsted County hospital facilities (Mayo Clinic's Saint Mary's and Rochester Methodist Hospitals, and the Olmsted Medical Center Hospital) occurred in three phases: First, all hospitalizations with the surgical procedure (International Statistical Classification of Diseases, 9th Revision [ICD‐9]) codes 79.15 (reduction, fracture, femur, closed with internal fixation), 79.25 (reduction, fracture, femur, open, without internal fixation), 79.35 (reduction, fracture, femur, open with internal fixation), 79.95 (operation, unspecified bone injury, femur), 80.05 (arthrotomy for removal of hip prosthesis), 80.15 (arthrotomy, other, hip), 80.95 (excision, hip joint), 81.21 (arthrodesis, hip), 81.40 (repair hip, not elsewhere classified), 81.51 (total hip replacement), 81.52 (partial hip replacement), and 81.53 (revision hip replacement) were identified. Second, through review of the original inpatient and outpatient medical records, we confirmed that a fracture was associated with the index hospitalization. Finally, radiology reports of each index hospitalization verified the presence and exact anatomical location of each fracture. Of those with fractures on admission x‐rays, only patients with a proximal femur (femoral neck or intertrochanteric) fracture as the primary indication for the surgery were included in the study. Surgical report or radiographic evidence of hip fracture was available for all patients. Secondary fractures due to a specific pathological lesion (eg, malignancy) or high‐energy trauma (by convention, motor vehicle accidents or falls from significant heights) were excluded. Only patients who had provided an authorization to review their medical records for research were ultimately included in the study cohort.18 Medical records were search manually, if indicated.
Criteria for Heart Failure and Death
Preoperative heart failure was based on clinical documentation of heart failure in a patient's medical record prior to the time of the hip fracture repair. Postoperative heart failure, including acute exacerbations, was defined according to Framingham criteria.19 Framingham criteria included clinical evidence of increased central venous pressure, pulmonary edema, an S3 gallop, radiographic pulmonary edema, and response to diuresis. Heart failure was not graded on clinical severity (ie, New York Heart Association classification). We did not distinguish between systolic and diastolic heart failure. Mortality was defined as death from any cause within the first year following hip fracture repair. Deaths were identified either through REP resources or the National Death Index.
Statistical Methods
Continuous variables are presented as mean standard deviation and categorical variables as number (percent). Two‐sample t tests or Wilcoxon rank sum tests were used to test for significant differences in continuous variables. Chi‐square or Fisher's exact tests were used for categorical variables. Rates of postoperative outcomes were calculated using the KaplanMeier method for the overall group and for those with and without preoperative heart failure. A landmark survival curve was used to evaluate postoperative mortality among patients who experienced heart failure in the first seven postoperative days versus those who did not. Patients who died or underwent another hip operation within the first seven postoperative days were excluded from this analysis. Univariate Cox proportional hazards models were used to evaluate the predictors of postoperative heart failure and mortality. Patients who died or experienced a second hip surgery within one year of their first were censored at that time. Any subsequent hip fracture repair was treated as a new case. To account for the inclusion of multiple hip fracture repairs for a given patient, the Cox proportional hazards model included a robust variance estimator. This provided an accurate calculation of the standard error in the presence of within‐subject correlation.20 Statistical tests were two‐sided, and P values were considered significant if less than 0.05. Statistical analyses were performed using SAS (version 9.1.3, SAS Institute, Cary, NC).
RESULTS
From among 1327 potential hip fracture repairs, we excluded 115 cases involving multiple injuries or operations (19), pathological fractures (20), in‐hospital fractures (3), or an operation >72 hours after the initial fracture (5). Three patients under 65 years of age were also excluded, as were cases with missing information (9) or cases managed nonoperatively (56). The final analysis included 1212 surgical cases in 1116 subjects. No subjects were lost to surveillance for 1 year following their hip fracture repair.
Table 1 summarizes the baseline characteristics of the study population. The overall prevalence of preoperative heart failure was 27.0% (327 of 1212). Those with preoperative heart failure were older, heavier, more likely male and white, and less likely to live independently preoperatively. They were also more likely to suffer from preexisting cardiovascular comorbidities.
| All (N = 1,212) | HF (N = 327) | No HF (N = 885) | P Value* | |
|---|---|---|---|---|
| ||||
| Demographics | ||||
| Mean age (years) (SD) | 84.2 (7.44) | 85.5 (6.54) | 83.7 (7.70) | 0.00101 |
| Male gender | 237 (19.6) | 76 (23.2) | 161 (18.2) | 0.04912 |
| Mean BMI (kg/m2) (SD) | 23.3 (4.97) | 24.1 (5.68) | 23.0 (4.65) | 0.01231 |
| White | 1,204 (99.3) | 322 (98.5) | 882 (99.7) | 0.03713 |
| Preoperative living situation | ||||
| Nursing facility | 468 (38.6) | 144 (44) | 324 (36.6) | 0.01842 |
| Home | 744 (61.4) | 183 (56) | 561 (63.4) | 0.05192 |
| Preoperative ambulatory status | ||||
| Dependent | 149 (12.3) | 50 (15.3) | 99 (11.2) | |
| Independent | 1,061 (87.7) | 276 (84.7) | 785 (88.8) | |
| Medical history | ||||
| Hypertension | 705 (58.2) | 226 (69.1) | 479 (54.1) | <0.00012 |
| Diabetes mellitus | 143 (11.8) | 63 (19.3) | 80 (9) | <0.00012 |
| Cerebrovascular disease | 331 (27.3) | 129 (39.4) | 202 (22.8) | <0.00012 |
| Peripheral vascular disease | 195 (16.1) | 80 (24.5) | 115 (13) | <0.00012 |
| Coronary artery disease | 464 (38.3) | 237 (72.5) | 227 (25.6) | <0.00012 |
| Atrial fibrillation/flutter | 254 (21) | 133 (40.7) | 121 (13.7) | <0.00012 |
| Complete heart block | 18 (1.5) | 9 (2.8) | 9 (1) | 0.03373 |
| Pacer at time of admission | 32 (2.6) | 16 (4.9) | 16 (1.8) | 0.00292 |
| Chronic obstructive pulmonary disease | 196 (16.2) | 78 (23.9) | 118 (13.3) | <0.00012 |
| Liver disease | 15 (1.2) | 7 (2.1) | 8 (0.9) | 0.13753 |
| Chronic renal insufficiency | 131 (10.8) | 61 (18.7) | 70 (7.9) | <0.00012 |
| Mean length of hospitalization (days) (SD) | 10.0 (7.57) | 11.1 (8.82) | 9.6 (7.01) | 0.00101 |
| Discharge disposition | 0.00192 | |||
| Home | 150 (12.4) | 26 (8.0) | 124 (14.0) | |
| Skilled nursing facility | 1,004 (82.9) | 278 (85.0) | 726 (82.1) | |
| Dead | 57 (4.7) | 23 (7.0) | 34 (3.9) | |
Table 1 also summarizes the main outcome characteristics of the study population. Those with preoperative heart failure had longer mean lengths of stay (LOS), were more often discharged to a skilled facility, and demonstrated higher inpatient mortality rates.
Table 2 summarizes the outcomes associated with preoperative heart failure. The overall rate of postoperative heart failure was 6.7% within 7 postoperative days and 21.3% within 1 postoperative year. Postoperative heart failure was significantly more common among those with preoperative heart failure (hazard ratio [HR], 3.0; 95% confidence interval [CI], 2.3 to 3.9; P < 0.001). Among those without preoperative heart failure, rates of postoperative incident heart failure were 4.8% at 7 days and 15.0% at 1 year. Compared to patients without preoperative heart failure, those with preoperative heart failure demonstrated higher one year mortality rates and higher rates of postoperative heart failure at 7 days and 1 year.
| Preoperative Heart Failure (Subjects) | |||||
|---|---|---|---|---|---|
| Outcome | All (N = 1212) | No (N = 885) | Yes (N = 327) | Risk ratio* (95% CI) | P Value |
| |||||
| Heart failure exacerbation within seven postoperative days | 6.7% (5.4, 8.3) | 4.8% (3.5, 6.5) | 12.1% (8.7, 16.2) | 2.72 (1.72, 4.31) | <0.0001 |
| One‐year postoperative heart failure exacerbation | 21.3% (18.8, 23.7) | 15.0% (12.5, 17.4) | 39.3% (33.3, 44.9) | 3.00 (2.32, 3.87) | <0.0001 |
| One‐year postoperative mortality | 24.5% (22.0, 26.9) | 19.8% (17.1, 22.4) | 37.2% (31.6, 42.3) | 2.11 (1.67, 2.67) | <0.0001 |
| One‐year postoperative mortality or heart failure exacerbation | 36.5% (33.7, 39.2) | 29.7% (26.6, 32.6) | 55.0% (49.3, 60.2) | 2.28 (1.88, 2.76) | <0.0001 |
Figure 1 displays the outcomes to 1 year of surveillance. Rates of postoperative heart failure and postoperative mortality were consistently higher among those with, versus without, preoperative heart failure. Figure 2 displays similar data stratified by gender. Postoperative heart failure rates did not differ significantly between genders (HR, 1.0; 95% CI, 0.8 to 1.4), but postoperative mortality rates were significantly higher among males than females (HR, 1.9; 95% CI, 1.5 to 2.5; P < 0.001).
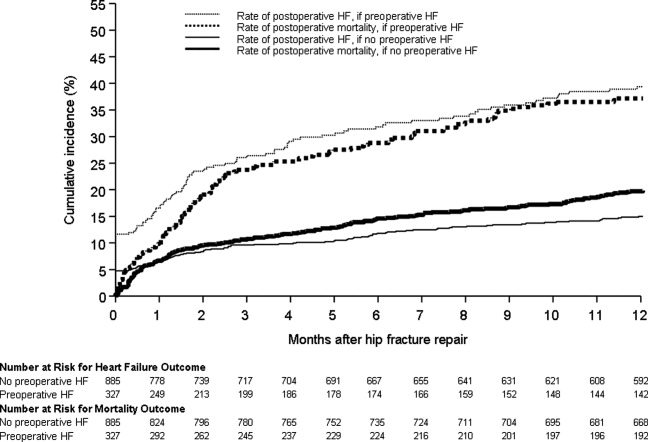
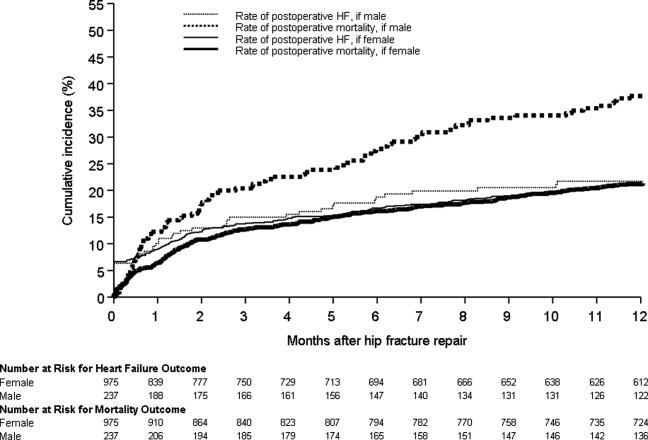
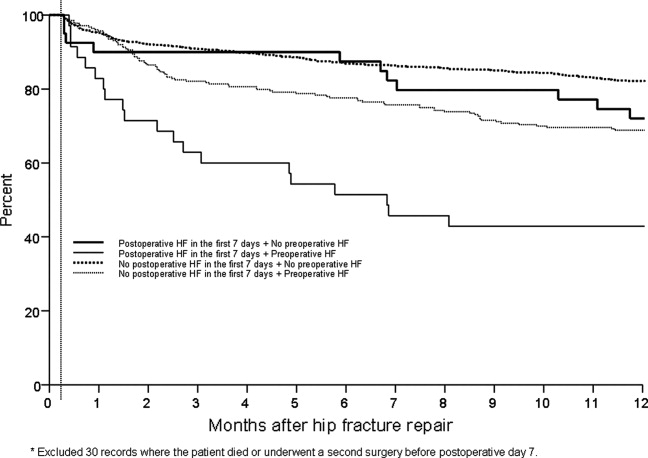
Figure 3 displays survival rates to 1 year based on the occurrence of incident or recurrent heart failure within the first 7 postoperative days. Survival rates were lowest among patients with recurrent heart failure in the first 7 postoperative days and highest among those with no preoperative or postoperative heart failure. Subjects with incident heart failure in the first postoperative week, and those with preoperative heart failure who did not suffer a recurrence, demonstrated intermediate survival rates (P < 0.001 for trend across all four groups).
DISCUSSION
This population‐based study found that heart failure represents a highly prevalent condition in elderly patients undergoing hip fracture repairs. It demonstrates that those with preoperative heart failure typically suffer from more cardiovascular comorbidities and carry a higher risk of postoperative heart failure and postoperative mortality.
While many studies have focused on the epidemiology of hip fractures,21 population‐based data on cardiac complications following hip fracture repair are significantly less common. The ACC/AHA preoperative cardiac evaluation guidelines classify orthopedic procedures, including hip fracture repair, as intermediate risk.11 Consequently, some may assume that all orthopedic patients will have a mortality rate less than 5%. Indeed, the 30‐day postoperative mortality rate published from our institution's Total Joint Registry was 0.6% following elective total hip arthroplasty.22 However, the present study demonstrates that current ACC/AHA preoperative cardiac evaluation guidelines may not apply to the population of frail patients undergoing hip fracture repair. Particularly among those who experience new heart failure within the first seven days following surgery, outcomes are substantially worse than the ACC/AHA perioperative guidelines may suggest.11
Preoperative heart failure has been associated with adverse risk for postoperative mortality after hip fracture.9, 10, 12 However, these studies did not report heart failure as a complication of hip fracture repair. A prospective cohort study of 2448 hip fracture patients at an academic hospital in Great Britain found a 5% rate of inpatient heart failure as a postoperative complication.23 The hazard ratio for one‐year mortality was 11.3 with postoperative heart failure.23 However, the British study did not distinguish heart failure from other cardiovascular diseases as a preoperative comorbidity or stratify the risk for postoperative mortality by preoperative heart failure status.23 Our findings add to previous literature by measuring heart failure as a specific complication of hip fracture repair and examining the association of preoperative heart failure with postoperative heart failure and mortality.
Length of stay after hip fracture repair varies in the literature, but previous work has not clearly associated heart failure with length of hospitalization in the setting of hip fracture repair.24, 25 Our study found a significantly higher mean length of stay among those with preoperative heart failure. This adds to previous work by delineating an association between heart failure and increased length of stay after hip fracture repair.
We found a higher rate of postoperative mortality among men compared to women. Rates of postoperative heart failure, however, were more similar (Figure 2). Previous studies have found a consistently higher mortality rate among men versus women after hip fracture.9, 23, 2529 Possible explanations for these findings include the overall increased burden of cardiovascular disease among men, lower treatment rates of osteoporosis in men,30 and increased susceptibility to other postoperative complications, such as infection.25
The findings of this study carry important clinical implications for the perioperative care of hip fracture patients with, or at risk for, heart failure. They suggest that current risk stratification guidelines classifying orthopedic operations as intermediate risk procedures do not reflect the high risk for morbidity that hip fracture patients face.11 The association of heart failure with adverse outcomes implies the need for heightened surveillance in the perioperative period, particularly with regard to volume status and medication reconciliation. Hip fracture patients and their families must be counseled about the ramifications of perioperative heart failure, including higher rates of postoperative heart failure, longer hospitalizations, and ultimate mortality.
This research carries several limitations and remains subject to biases inherent in retrospective cohort studies. The reported effects of heart failure on outcomes after hip fracture repair may be due to confounding from age, functional status, and other comorbidities. We attempted to minimize sampling bias through complete enumeration of hip fracture surgeries among Olmsted County residents. Completeness of follow‐up (100% at one year) was possible given the availability of documentation of all inpatient and outpatient medical care in the community.17 We used objectively defined outcomes to minimize measurement bias. Applicability to a more diverse population may be limited because >95% of the research population was from a single, predominantly white community. However, prior studies have documented that hip fracture incidence rates31 and socioeconomic factors17 in Olmsted County are similar to those for other white residents of the United States. Heart failure rates were determined clinically according to the Framingham criteria. However, the Framingham criteria may inappropriately diagnose individuals with heart failure32 and falsely elevate the prevalence of heart failure as a preoperative comorbidity or postoperative complication.
The statistical analysis included patients counted multiple times if they underwent subsequent hip fracture repair during the study period. Including these patients may inaccurately inflate event rates or contribute to incorrect estimates of standard error. However, we felt it was appropriate to include recurrent hip fracture repair cases in the analysis because they represent a clinically distinct patient from both a medical and functional perspective. We used a robust variance estimator in the Cox proportional hazards models to provide an accurate calculation of the standard error given the possibility for correlation within subjects.20 Finally, the proportion of these patients was low (94 of 1116 unique patients; 8.4%).
Future work must involve further risk stratification and therapeutic interventions in perioperative hip fracture patients. A more robust analysis of heart failure, with differentiation between systolic and diastolic dysfunction, may facilitate risk stratification. Assessment of compliance with standard preoperative heart failure medications and the impact of heightened clinical vigilance may enlighten means to improve postoperative outcomes. Studies on risk stratification and therapeutic interventions may then inform policy regarding length of stay and reimbursement in hip fracture patients.
CONCLUSION
In summary, our population‐based findings reveal that heart failure represents a prevalent and serious comorbidity in patients undergoing hip fracture repair. Clinicians caring for perioperative hip fracture patients must pay particular attention to risk for, and implications of, new or recurrent heart failure.
Acknowledgements
The authors thank Donna K. Lawson, LPN, Kathy Wolfert, and Cherie Dolliver for their assistance in data collection and management.
- .Epidemiology of hip fractures: Implications of the exponential increase with age.Bone.1996;18(3 suppl):121S–125S.
- ,,, et al.Trends in length of stay and short‐term outcomes among Medicare patients hospitalized for heart failure, 1993–2006.JAMA.2010;303(21):2141–2147.
- ,,,,.The expanding national burden of heart failure in the United States: The influence of heart failure in women.Am Heart J.2004;147(1):74–78.
- ,,,.Heart failure‐related hospitalization in the U.S., 1979 to 2004.J Am Coll Cardiol.2008;52(6):428–434.
- ,,,,.Heart failure is a risk factor for orthopedic fracture: A population‐based analysis of 16,294 patients.Circulation.2008;118(19):1946–1952.
- ,,, et al.Cardiovascular diseases and risk of hip fracture.JAMA.2009;302(15):1666–1673.
- ,,,.Effectiveness of hospitalist involvement in hip fracture management questioned.South Med J.2007;100(9):912–913.
- ,,, et al.Effects of a hospitalist care model on mortality of elderly patients with hip fractures.J Hosp Med.2007;2(4):219–225.
- ,,,.Excess mortality in men compared with women following a hip fracture. National analysis of comedications, comorbidity and survival.Age Ageing.2010;39(2):203–209.
- ,,.Increased mortality in patients with a hip fracture—Effect of pre‐morbid conditions and post‐fracture complications.Osteoporos Int.2007;18(12):1583–1593.
- ,,, et al.ACC/AHA 2007 guidelines on perioperative cardiovascular evaluation and care for noncardiac surgery: Executive summary: A report of the American College of Cardiology/American Heart Association Task Force on Practice Guidelines (Writing Committee to Revise the 2002 Guidelines on Perioperative Cardiovascular Evaluation for Noncardiac Surgery): Developed in collaboration with the American Society of Echocardiography, American Society of Nuclear Cardiology, Heart Rhythm Society, Society of Cardiovascular Anesthesiologists, Society for Cardiovascular Angiography and Interventions, Society for Vascular Medicine and Biology, and Society for Vascular Surgery.J Am Coll Cardiol.2007;50(17):1707–1732.
- ,,,,.Excess mortality following hip fracture: The role of underlying health status.Osteoporos Int.2007;18(11):1463–1472.
- .Time trends of mortality after first hip fractures.Osteoporos Int.2007;18(6):721–732.
- ,,, et al.Mortality and locomotion 6 months after hospitalization for hip fracture: Risk factors and risk‐adjusted hospital outcomes.JAMA.2001;285(21):2736–2742.
- ,,,.Factors associated with mortality after hip fracture.Osteoporos Int.2000;11(3):228–232.
- ,,,,,.Hip fractures among the elderly: Factors associated with in‐hospital mortality.Am J Epidemiol.1991;134(10):1128–1137.
- .History of the Rochester Epidemiology Project.Mayo Clin Proc.1996;71(3):266–274.
- .The threat to medical‐records research.N Engl J Med.1997;337(20):1466–1470.
- ,,,.The natural history of congestive heart failure: The Framingham Study.N Engl J Med.1971;285(26):1441–1446.
- ,.The robust inference for the Cox proportional hazards model.J Am Stat Assoc.1989;84(408):1074–1078.
- .Hip fracture epidemiological trends, outcomes, and risk factors, 1970–2009.Int J Gen Med.2010;3:1–17.
- ,,,,,.Frequency of myocardial infarction, pulmonary embolism, deep venous thrombosis, and death following primary hip or knee arthroplasty.Anesthesiology.2002;96(5):1140–1146.
- ,,,.Effect of comorbidities and postoperative complications on mortality after hip fracture in elderly people: Prospective observational cohort study.BMJ.2005;331(7529):1374–1376.
- ,,, et al.The aftermath of hip fracture: Discharge placement, functional status change, and mortality.Am J Epidemiol.2009;170(10):1290–1299.
- ,,,,,.Gender differences in mortality after hip fracture: The role of infection.J Bone Miner Res.2003;18(12):2231–2237.
- ,,,,.Mortality after all major types of osteoporotic fracture in men and women: An observational study.Lancet.1999;353(9156):878–882.
- ,,.Adjusted mortality after hip fracture: From the Cardiovascular Health Study.J Am Geriatr Soc.2006;54(12):1885–1891.
- ,,, et al.Meta‐analysis: Excess mortality after hip fracture among older women and men.Ann Intern Med.2010;152(6):380–390.
- ,,,.Predictors of hip fractures in elderly men.J Bone Miner Res.1995;10(12):1900–1907.
- ,,, et al.Population‐based fracture risk assessment and osteoporosis treatment disparities by race and gender.J Gen Intern Med.2009;24(8):956–962.
- ,,.Long‐term trends in hip fracture prevalence: The influence of hip fracture incidence and survival.Osteoporos Int.1998;8(1):68–74.
- ,,,,,.diagnostic accuracy of clinical criteria for identifying systolic and diastolic heart failure: Cross‐sectional study.J Eval Clin Pract.2009;15(1):55–61.
As the population ages, hip fractures and heart failure increase in prevalence.1, 2 Heart failure prevalence is also increasing in hospitalized patients.3 Indeed, hospitalizations involving heart failure as an active issue tripled in the last 30 years.4 Heart failure has been associated with an increased risk for hip fracture,5, 6 and previous studies report a 6%20% prevalence of preoperative heart failure in hip fracture patients.710 While exacerbation of heart failure increases the mortality risk in patients admitted for hip fractures,8 the incidence of new heart failure, as well as the preoperative factors that predict postoperative heart failure in this patient population remain unclear.
American College of Cardiology/American Heart Association (ACC/AHA) perioperative guidelines identify orthopedic surgeries, including hip fracture repair, as intermediate risk procedures.11 Compared to other intermediate risk operations, however, postoperative outcomes following hip fracture repair differ significantly.1216 Overall mortality in hip fracture patients has been reported at 29% at one year,8 with the excess mortality from hip fracture alone at nearly 20%.10, 13 However, the exact factors that contribute to this excess mortality, particularly with regard to heart failure, remain unclear.
To examine the preoperative prevalence, subsequent incidence, and predictors of heart failure in patients undergoing hip fracture repair operations, this study used an established, population‐based database to compare the postoperative consequences in hip fracture repair patients with and without preexisting heart failure. We hypothesized that preoperative heart failure worsens postoperative outcomes in hip fracture patients.
METHODS
Case Ascertainment
Following approval by the Institutional Review Boards of Mayo Clinic and the Olmsted Medical Center, we used the Rochester Epidemiology Project (REP) to identify the patients for this study. The REP is a population‐based medical records linkage system that records all diagnoses, surgical procedures, laboratory data, and death information from hospital, emergency room, outpatient, and nursing home care in the community.17
All Olmsted County, Minnesota, residents who sustained a hip fracture and underwent surgical repair from 1988 through 2002 were evaluated. Patients with more than one hip fracture during the study period (96 occurrences) were censored from the data analysis at the time of the subsequent hip fracture and then included as new cases. The complete enumeration of hip fracture episodes managed in the three Olmsted County hospital facilities (Mayo Clinic's Saint Mary's and Rochester Methodist Hospitals, and the Olmsted Medical Center Hospital) occurred in three phases: First, all hospitalizations with the surgical procedure (International Statistical Classification of Diseases, 9th Revision [ICD‐9]) codes 79.15 (reduction, fracture, femur, closed with internal fixation), 79.25 (reduction, fracture, femur, open, without internal fixation), 79.35 (reduction, fracture, femur, open with internal fixation), 79.95 (operation, unspecified bone injury, femur), 80.05 (arthrotomy for removal of hip prosthesis), 80.15 (arthrotomy, other, hip), 80.95 (excision, hip joint), 81.21 (arthrodesis, hip), 81.40 (repair hip, not elsewhere classified), 81.51 (total hip replacement), 81.52 (partial hip replacement), and 81.53 (revision hip replacement) were identified. Second, through review of the original inpatient and outpatient medical records, we confirmed that a fracture was associated with the index hospitalization. Finally, radiology reports of each index hospitalization verified the presence and exact anatomical location of each fracture. Of those with fractures on admission x‐rays, only patients with a proximal femur (femoral neck or intertrochanteric) fracture as the primary indication for the surgery were included in the study. Surgical report or radiographic evidence of hip fracture was available for all patients. Secondary fractures due to a specific pathological lesion (eg, malignancy) or high‐energy trauma (by convention, motor vehicle accidents or falls from significant heights) were excluded. Only patients who had provided an authorization to review their medical records for research were ultimately included in the study cohort.18 Medical records were search manually, if indicated.
Criteria for Heart Failure and Death
Preoperative heart failure was based on clinical documentation of heart failure in a patient's medical record prior to the time of the hip fracture repair. Postoperative heart failure, including acute exacerbations, was defined according to Framingham criteria.19 Framingham criteria included clinical evidence of increased central venous pressure, pulmonary edema, an S3 gallop, radiographic pulmonary edema, and response to diuresis. Heart failure was not graded on clinical severity (ie, New York Heart Association classification). We did not distinguish between systolic and diastolic heart failure. Mortality was defined as death from any cause within the first year following hip fracture repair. Deaths were identified either through REP resources or the National Death Index.
Statistical Methods
Continuous variables are presented as mean standard deviation and categorical variables as number (percent). Two‐sample t tests or Wilcoxon rank sum tests were used to test for significant differences in continuous variables. Chi‐square or Fisher's exact tests were used for categorical variables. Rates of postoperative outcomes were calculated using the KaplanMeier method for the overall group and for those with and without preoperative heart failure. A landmark survival curve was used to evaluate postoperative mortality among patients who experienced heart failure in the first seven postoperative days versus those who did not. Patients who died or underwent another hip operation within the first seven postoperative days were excluded from this analysis. Univariate Cox proportional hazards models were used to evaluate the predictors of postoperative heart failure and mortality. Patients who died or experienced a second hip surgery within one year of their first were censored at that time. Any subsequent hip fracture repair was treated as a new case. To account for the inclusion of multiple hip fracture repairs for a given patient, the Cox proportional hazards model included a robust variance estimator. This provided an accurate calculation of the standard error in the presence of within‐subject correlation.20 Statistical tests were two‐sided, and P values were considered significant if less than 0.05. Statistical analyses were performed using SAS (version 9.1.3, SAS Institute, Cary, NC).
RESULTS
From among 1327 potential hip fracture repairs, we excluded 115 cases involving multiple injuries or operations (19), pathological fractures (20), in‐hospital fractures (3), or an operation >72 hours after the initial fracture (5). Three patients under 65 years of age were also excluded, as were cases with missing information (9) or cases managed nonoperatively (56). The final analysis included 1212 surgical cases in 1116 subjects. No subjects were lost to surveillance for 1 year following their hip fracture repair.
Table 1 summarizes the baseline characteristics of the study population. The overall prevalence of preoperative heart failure was 27.0% (327 of 1212). Those with preoperative heart failure were older, heavier, more likely male and white, and less likely to live independently preoperatively. They were also more likely to suffer from preexisting cardiovascular comorbidities.
| All (N = 1,212) | HF (N = 327) | No HF (N = 885) | P Value* | |
|---|---|---|---|---|
| ||||
| Demographics | ||||
| Mean age (years) (SD) | 84.2 (7.44) | 85.5 (6.54) | 83.7 (7.70) | 0.00101 |
| Male gender | 237 (19.6) | 76 (23.2) | 161 (18.2) | 0.04912 |
| Mean BMI (kg/m2) (SD) | 23.3 (4.97) | 24.1 (5.68) | 23.0 (4.65) | 0.01231 |
| White | 1,204 (99.3) | 322 (98.5) | 882 (99.7) | 0.03713 |
| Preoperative living situation | ||||
| Nursing facility | 468 (38.6) | 144 (44) | 324 (36.6) | 0.01842 |
| Home | 744 (61.4) | 183 (56) | 561 (63.4) | 0.05192 |
| Preoperative ambulatory status | ||||
| Dependent | 149 (12.3) | 50 (15.3) | 99 (11.2) | |
| Independent | 1,061 (87.7) | 276 (84.7) | 785 (88.8) | |
| Medical history | ||||
| Hypertension | 705 (58.2) | 226 (69.1) | 479 (54.1) | <0.00012 |
| Diabetes mellitus | 143 (11.8) | 63 (19.3) | 80 (9) | <0.00012 |
| Cerebrovascular disease | 331 (27.3) | 129 (39.4) | 202 (22.8) | <0.00012 |
| Peripheral vascular disease | 195 (16.1) | 80 (24.5) | 115 (13) | <0.00012 |
| Coronary artery disease | 464 (38.3) | 237 (72.5) | 227 (25.6) | <0.00012 |
| Atrial fibrillation/flutter | 254 (21) | 133 (40.7) | 121 (13.7) | <0.00012 |
| Complete heart block | 18 (1.5) | 9 (2.8) | 9 (1) | 0.03373 |
| Pacer at time of admission | 32 (2.6) | 16 (4.9) | 16 (1.8) | 0.00292 |
| Chronic obstructive pulmonary disease | 196 (16.2) | 78 (23.9) | 118 (13.3) | <0.00012 |
| Liver disease | 15 (1.2) | 7 (2.1) | 8 (0.9) | 0.13753 |
| Chronic renal insufficiency | 131 (10.8) | 61 (18.7) | 70 (7.9) | <0.00012 |
| Mean length of hospitalization (days) (SD) | 10.0 (7.57) | 11.1 (8.82) | 9.6 (7.01) | 0.00101 |
| Discharge disposition | 0.00192 | |||
| Home | 150 (12.4) | 26 (8.0) | 124 (14.0) | |
| Skilled nursing facility | 1,004 (82.9) | 278 (85.0) | 726 (82.1) | |
| Dead | 57 (4.7) | 23 (7.0) | 34 (3.9) | |
Table 1 also summarizes the main outcome characteristics of the study population. Those with preoperative heart failure had longer mean lengths of stay (LOS), were more often discharged to a skilled facility, and demonstrated higher inpatient mortality rates.
Table 2 summarizes the outcomes associated with preoperative heart failure. The overall rate of postoperative heart failure was 6.7% within 7 postoperative days and 21.3% within 1 postoperative year. Postoperative heart failure was significantly more common among those with preoperative heart failure (hazard ratio [HR], 3.0; 95% confidence interval [CI], 2.3 to 3.9; P < 0.001). Among those without preoperative heart failure, rates of postoperative incident heart failure were 4.8% at 7 days and 15.0% at 1 year. Compared to patients without preoperative heart failure, those with preoperative heart failure demonstrated higher one year mortality rates and higher rates of postoperative heart failure at 7 days and 1 year.
| Preoperative Heart Failure (Subjects) | |||||
|---|---|---|---|---|---|
| Outcome | All (N = 1212) | No (N = 885) | Yes (N = 327) | Risk ratio* (95% CI) | P Value |
| |||||
| Heart failure exacerbation within seven postoperative days | 6.7% (5.4, 8.3) | 4.8% (3.5, 6.5) | 12.1% (8.7, 16.2) | 2.72 (1.72, 4.31) | <0.0001 |
| One‐year postoperative heart failure exacerbation | 21.3% (18.8, 23.7) | 15.0% (12.5, 17.4) | 39.3% (33.3, 44.9) | 3.00 (2.32, 3.87) | <0.0001 |
| One‐year postoperative mortality | 24.5% (22.0, 26.9) | 19.8% (17.1, 22.4) | 37.2% (31.6, 42.3) | 2.11 (1.67, 2.67) | <0.0001 |
| One‐year postoperative mortality or heart failure exacerbation | 36.5% (33.7, 39.2) | 29.7% (26.6, 32.6) | 55.0% (49.3, 60.2) | 2.28 (1.88, 2.76) | <0.0001 |
Figure 1 displays the outcomes to 1 year of surveillance. Rates of postoperative heart failure and postoperative mortality were consistently higher among those with, versus without, preoperative heart failure. Figure 2 displays similar data stratified by gender. Postoperative heart failure rates did not differ significantly between genders (HR, 1.0; 95% CI, 0.8 to 1.4), but postoperative mortality rates were significantly higher among males than females (HR, 1.9; 95% CI, 1.5 to 2.5; P < 0.001).
Figure 3 displays survival rates to 1 year based on the occurrence of incident or recurrent heart failure within the first 7 postoperative days. Survival rates were lowest among patients with recurrent heart failure in the first 7 postoperative days and highest among those with no preoperative or postoperative heart failure. Subjects with incident heart failure in the first postoperative week, and those with preoperative heart failure who did not suffer a recurrence, demonstrated intermediate survival rates (P < 0.001 for trend across all four groups).
DISCUSSION
This population‐based study found that heart failure represents a highly prevalent condition in elderly patients undergoing hip fracture repairs. It demonstrates that those with preoperative heart failure typically suffer from more cardiovascular comorbidities and carry a higher risk of postoperative heart failure and postoperative mortality.
While many studies have focused on the epidemiology of hip fractures,21 population‐based data on cardiac complications following hip fracture repair are significantly less common. The ACC/AHA preoperative cardiac evaluation guidelines classify orthopedic procedures, including hip fracture repair, as intermediate risk.11 Consequently, some may assume that all orthopedic patients will have a mortality rate less than 5%. Indeed, the 30‐day postoperative mortality rate published from our institution's Total Joint Registry was 0.6% following elective total hip arthroplasty.22 However, the present study demonstrates that current ACC/AHA preoperative cardiac evaluation guidelines may not apply to the population of frail patients undergoing hip fracture repair. Particularly among those who experience new heart failure within the first seven days following surgery, outcomes are substantially worse than the ACC/AHA perioperative guidelines may suggest.11
Preoperative heart failure has been associated with adverse risk for postoperative mortality after hip fracture.9, 10, 12 However, these studies did not report heart failure as a complication of hip fracture repair. A prospective cohort study of 2448 hip fracture patients at an academic hospital in Great Britain found a 5% rate of inpatient heart failure as a postoperative complication.23 The hazard ratio for one‐year mortality was 11.3 with postoperative heart failure.23 However, the British study did not distinguish heart failure from other cardiovascular diseases as a preoperative comorbidity or stratify the risk for postoperative mortality by preoperative heart failure status.23 Our findings add to previous literature by measuring heart failure as a specific complication of hip fracture repair and examining the association of preoperative heart failure with postoperative heart failure and mortality.
Length of stay after hip fracture repair varies in the literature, but previous work has not clearly associated heart failure with length of hospitalization in the setting of hip fracture repair.24, 25 Our study found a significantly higher mean length of stay among those with preoperative heart failure. This adds to previous work by delineating an association between heart failure and increased length of stay after hip fracture repair.
We found a higher rate of postoperative mortality among men compared to women. Rates of postoperative heart failure, however, were more similar (Figure 2). Previous studies have found a consistently higher mortality rate among men versus women after hip fracture.9, 23, 2529 Possible explanations for these findings include the overall increased burden of cardiovascular disease among men, lower treatment rates of osteoporosis in men,30 and increased susceptibility to other postoperative complications, such as infection.25
The findings of this study carry important clinical implications for the perioperative care of hip fracture patients with, or at risk for, heart failure. They suggest that current risk stratification guidelines classifying orthopedic operations as intermediate risk procedures do not reflect the high risk for morbidity that hip fracture patients face.11 The association of heart failure with adverse outcomes implies the need for heightened surveillance in the perioperative period, particularly with regard to volume status and medication reconciliation. Hip fracture patients and their families must be counseled about the ramifications of perioperative heart failure, including higher rates of postoperative heart failure, longer hospitalizations, and ultimate mortality.
This research carries several limitations and remains subject to biases inherent in retrospective cohort studies. The reported effects of heart failure on outcomes after hip fracture repair may be due to confounding from age, functional status, and other comorbidities. We attempted to minimize sampling bias through complete enumeration of hip fracture surgeries among Olmsted County residents. Completeness of follow‐up (100% at one year) was possible given the availability of documentation of all inpatient and outpatient medical care in the community.17 We used objectively defined outcomes to minimize measurement bias. Applicability to a more diverse population may be limited because >95% of the research population was from a single, predominantly white community. However, prior studies have documented that hip fracture incidence rates31 and socioeconomic factors17 in Olmsted County are similar to those for other white residents of the United States. Heart failure rates were determined clinically according to the Framingham criteria. However, the Framingham criteria may inappropriately diagnose individuals with heart failure32 and falsely elevate the prevalence of heart failure as a preoperative comorbidity or postoperative complication.
The statistical analysis included patients counted multiple times if they underwent subsequent hip fracture repair during the study period. Including these patients may inaccurately inflate event rates or contribute to incorrect estimates of standard error. However, we felt it was appropriate to include recurrent hip fracture repair cases in the analysis because they represent a clinically distinct patient from both a medical and functional perspective. We used a robust variance estimator in the Cox proportional hazards models to provide an accurate calculation of the standard error given the possibility for correlation within subjects.20 Finally, the proportion of these patients was low (94 of 1116 unique patients; 8.4%).
Future work must involve further risk stratification and therapeutic interventions in perioperative hip fracture patients. A more robust analysis of heart failure, with differentiation between systolic and diastolic dysfunction, may facilitate risk stratification. Assessment of compliance with standard preoperative heart failure medications and the impact of heightened clinical vigilance may enlighten means to improve postoperative outcomes. Studies on risk stratification and therapeutic interventions may then inform policy regarding length of stay and reimbursement in hip fracture patients.
CONCLUSION
In summary, our population‐based findings reveal that heart failure represents a prevalent and serious comorbidity in patients undergoing hip fracture repair. Clinicians caring for perioperative hip fracture patients must pay particular attention to risk for, and implications of, new or recurrent heart failure.
Acknowledgements
The authors thank Donna K. Lawson, LPN, Kathy Wolfert, and Cherie Dolliver for their assistance in data collection and management.
- .Epidemiology of hip fractures: Implications of the exponential increase with age.Bone.1996;18(3 suppl):121S–125S.
- ,,, et al.Trends in length of stay and short‐term outcomes among Medicare patients hospitalized for heart failure, 1993–2006.JAMA.2010;303(21):2141–2147.
- ,,,,.The expanding national burden of heart failure in the United States: The influence of heart failure in women.Am Heart J.2004;147(1):74–78.
- ,,,.Heart failure‐related hospitalization in the U.S., 1979 to 2004.J Am Coll Cardiol.2008;52(6):428–434.
- ,,,,.Heart failure is a risk factor for orthopedic fracture: A population‐based analysis of 16,294 patients.Circulation.2008;118(19):1946–1952.
- ,,, et al.Cardiovascular diseases and risk of hip fracture.JAMA.2009;302(15):1666–1673.
- ,,,.Effectiveness of hospitalist involvement in hip fracture management questioned.South Med J.2007;100(9):912–913.
- ,,, et al.Effects of a hospitalist care model on mortality of elderly patients with hip fractures.J Hosp Med.2007;2(4):219–225.
- ,,,.Excess mortality in men compared with women following a hip fracture. National analysis of comedications, comorbidity and survival.Age Ageing.2010;39(2):203–209.
- ,,.Increased mortality in patients with a hip fracture—Effect of pre‐morbid conditions and post‐fracture complications.Osteoporos Int.2007;18(12):1583–1593.
- ,,, et al.ACC/AHA 2007 guidelines on perioperative cardiovascular evaluation and care for noncardiac surgery: Executive summary: A report of the American College of Cardiology/American Heart Association Task Force on Practice Guidelines (Writing Committee to Revise the 2002 Guidelines on Perioperative Cardiovascular Evaluation for Noncardiac Surgery): Developed in collaboration with the American Society of Echocardiography, American Society of Nuclear Cardiology, Heart Rhythm Society, Society of Cardiovascular Anesthesiologists, Society for Cardiovascular Angiography and Interventions, Society for Vascular Medicine and Biology, and Society for Vascular Surgery.J Am Coll Cardiol.2007;50(17):1707–1732.
- ,,,,.Excess mortality following hip fracture: The role of underlying health status.Osteoporos Int.2007;18(11):1463–1472.
- .Time trends of mortality after first hip fractures.Osteoporos Int.2007;18(6):721–732.
- ,,, et al.Mortality and locomotion 6 months after hospitalization for hip fracture: Risk factors and risk‐adjusted hospital outcomes.JAMA.2001;285(21):2736–2742.
- ,,,.Factors associated with mortality after hip fracture.Osteoporos Int.2000;11(3):228–232.
- ,,,,,.Hip fractures among the elderly: Factors associated with in‐hospital mortality.Am J Epidemiol.1991;134(10):1128–1137.
- .History of the Rochester Epidemiology Project.Mayo Clin Proc.1996;71(3):266–274.
- .The threat to medical‐records research.N Engl J Med.1997;337(20):1466–1470.
- ,,,.The natural history of congestive heart failure: The Framingham Study.N Engl J Med.1971;285(26):1441–1446.
- ,.The robust inference for the Cox proportional hazards model.J Am Stat Assoc.1989;84(408):1074–1078.
- .Hip fracture epidemiological trends, outcomes, and risk factors, 1970–2009.Int J Gen Med.2010;3:1–17.
- ,,,,,.Frequency of myocardial infarction, pulmonary embolism, deep venous thrombosis, and death following primary hip or knee arthroplasty.Anesthesiology.2002;96(5):1140–1146.
- ,,,.Effect of comorbidities and postoperative complications on mortality after hip fracture in elderly people: Prospective observational cohort study.BMJ.2005;331(7529):1374–1376.
- ,,, et al.The aftermath of hip fracture: Discharge placement, functional status change, and mortality.Am J Epidemiol.2009;170(10):1290–1299.
- ,,,,,.Gender differences in mortality after hip fracture: The role of infection.J Bone Miner Res.2003;18(12):2231–2237.
- ,,,,.Mortality after all major types of osteoporotic fracture in men and women: An observational study.Lancet.1999;353(9156):878–882.
- ,,.Adjusted mortality after hip fracture: From the Cardiovascular Health Study.J Am Geriatr Soc.2006;54(12):1885–1891.
- ,,, et al.Meta‐analysis: Excess mortality after hip fracture among older women and men.Ann Intern Med.2010;152(6):380–390.
- ,,,.Predictors of hip fractures in elderly men.J Bone Miner Res.1995;10(12):1900–1907.
- ,,, et al.Population‐based fracture risk assessment and osteoporosis treatment disparities by race and gender.J Gen Intern Med.2009;24(8):956–962.
- ,,.Long‐term trends in hip fracture prevalence: The influence of hip fracture incidence and survival.Osteoporos Int.1998;8(1):68–74.
- ,,,,,.diagnostic accuracy of clinical criteria for identifying systolic and diastolic heart failure: Cross‐sectional study.J Eval Clin Pract.2009;15(1):55–61.
Copyright © 2011 Society of Hospital Medicine

Role of Shock Index in ICU Transfers
The decision to transfer a patient to the intensive care unit (ICU) from a general care setting is complex and based not only on clinical findings and patient wishes but also on the understanding that ICU resources are limited and costly.1 Adding to the decision‐making complexity is the knowledge that patients who transfer to an ICU from a general medical unit comprise the highest mortality group of ICU patients, with the mortality rate directly proportional to both the time spent on the general medical unit1, 2 and the number of physiologic abnormalities before ICU admission.3, 4
Prior studies have shown that cardiac arrest and unplanned (unexpected) transfers to the ICU are preceded by a period of physiologic instability reflected in the vital signs.510 However, vital signs alone may not accurately indicate clinical condition. For example, a person may be able to maintain normal blood pressure and heart rate despite severe illness or may have abnormal vital signs at baseline, which may be the case for an otherwise healthy young woman who has baseline low systolic blood pressure. Also, noncritical conditions commonly seen in hospitalized medical or surgical patients, such as anxiety or pain, may increase the respiratory rate or heart rate. Conversely, certain common medications, such as ‐blockers, may mask or blunt the normal physiologic response to illness. Overall, the prevalence of abnormal physiologic variables is high among hospitalized adult patients irrespective of the presence of serious adverse events.11 This prevalence may be a reason why 2 recent studies of inpatient medical emergency teams (METs) or rapid response teams (RRTs), which generally rely on vital signs for activation, failed to show a decrease in adult mortality rates.12, 13
Given the complexity of interpreting single vital sign readings, we evaluated a simple and clinically intuitive variable, the shock index (SI) (heart rate/systolic blood pressure, a noninvasive indication of left ventricular function),14 as a potential marker of the need for intensive care. Allgwer and Burri14 first developed the SI in studies of patients with acute blood loss, intraabdominal bleeding, fat emboli, and severe infections. They observed that a healthy adult had a mean SI of 0.54 (standard deviation [SD], 0.021), while an index of 1.0 indicated threatened shock and indices greater than 1.5 were seen in volume‐deficient shock.
We hypothesized that an elevated SI is a differentiating factor between a patient who had an unplanned ICU transfer and a general medical patient who did not require this higher level of care. To our knowledge, the SI has not been studied for this application previously.
Patients and Methods
Study Design
We conducted a retrospective case‐control study of 50 consecutive general medical patients who had unplanned transfers to the ICU and 50 matched control patients, with the approval of the Mayo Clinic Institutional Review Board. All patients were admitted to a general medical unit, and only patients who previously provided permission for their records to be used in research were included in the study.
Patients
This study enrolled patients who were at least 18 years old and who were admitted to a single general medical unit for 24 hours or longer. Patients were excluded if they required a surgical intervention, were transferred from another hospital, received care on a different general medical unit at any time during the hospitalization, or were pregnant. Our data collection began at the patients' (cases and controls) arrival on the general medical unit; we did not include data from any evaluation (outpatient or emergency department) before hospital admission.
Case Definition
An unplanned transfer was defined as an episode of unexpected clinical deterioration in a general medical patient that necessitated transfer to the ICU, as opposed to a preemptive or elective transfer following a procedure. Patients with unplanned transfers from December 9, 2003, to December 29, 2004, were eligible for the study. Only the first transfer to the ICU was considered for patients who had multiple ICU transfers during a single hospitalization. Because these data were collected before METs or RRTs were introduced at our institution, the recommendation for ICU transfer was a joint decision by the primary care team and the ICU team.
Control Definition
The matched controls were identified from among patients admitted to the general medical unit from January 16, 2002, to December 13, 2004. To reduce the effect of the heterogeneity inherent in general medical patients, we matched controls for age (within 5 years of age of the corresponding case), admission diagnosis code, and patient care unit of admission and required that they were admitted for at least 24 hours before dismissal. Patients who had an ICU stay during the same admission were excluded. The median difference in admission dates between the cases and the controls was 327 days, and 26 of the 50 matched pairs had admission dates within 1 year of each other. This lengthy interval between cases and controls was a consequence of the low incidence of patients who met the matching criteria.
Setting
This study involved the general medical units and ICUs of the 1157‐bed Saint Mary's Hospital, an academic tertiary care facility at Mayo Clinic in Rochester, Minnesota.
Vital Sign Determination
Vital signs abstracted for this study included blood pressure, heart rate, respiratory rate, oxygen saturation, and temperature. The SI was calculated for each set of abstracted vital signs. Staff nurses were responsible for the routine measurement and recording of vital signs at least once every 8 hours, although in several instances not all parameters were checked. In accordance with nursing policy, values outside the defined parameters were rechecked by the nursing supervisor of each care unit and, if found to be abnormal, were conveyed to the patient's physician. This system meant that abnormal results were checked by numerous observers, with differences in the frequency of recordings for individual patients.
Data Collection
Demographic data and information on the vital signs were abstracted through a comprehensive chart review. Demographic data included age, sex, ethnicity, comorbid conditions, hospital care unit, date and time of admission, admission diagnosis, date and time of transfer to the ICU, length of stay, dismissal date, and disposition at discharge. Comorbid conditions were scored using the Charlson Comorbidity Index.15
Statistical Analysis
A sample size of 50 matched pairs provided 81% power to detect an odds ratio of 3.0 or greater between cases and controls, with a 0.05, 2‐tailed level of significance with McNemar test. Patient demographic characteristics were summarized by the frequencies for categorical data and by mean and SD for continuous data. Consistent with the study design, the McNemar test and conditional logistic model analyses were used to determine the association between the SI and the risk of unplanned ICU transfer. Shock indices for the cases and controls were compared with use of t test. A P value <0.05 was considered statistically significant. For the SI, we calculated the odds ratio and its 95% confidence interval (CI) and P value using different cut points. We did not perform a receiver operating characteristics analysis because matching of cases and controls greatly complicates estimation of the sensitivity and specificity of the SI;16 a cohort study is suggested to investigate this analysis further. All statistical analyses were performed by SAS version 9.1.3 software (SAS Institute Inc, Cary, NC).
Results
A total of 50 pairs of matching cases and controls was included in this study. Table 1 lists the source of admission, demographic characteristics, and numbers of deaths for cases and controls. There were no statistically significant differences in admission source, age, sex, ethnicity, admission care unit, or Charlson Comorbidity Index. Mean length of stay was 14.8 days (SD, 9.7 days) for the cases and 5.7 days (SD, 6.3 days; P < 0.001) for the controls. Admission diagnoses were classified on the basis of the organ system of involvement (Table 2). In 30 of 50 cases, the admission diagnosis and the reason for ICU transfer were related.
| Value | Cases (n = 50) | Controls (n = 50) | P Value* |
|---|---|---|---|
| |||
| Emergency department admission, No. (%) | 33 (66) | 28 (56) | 0.41 |
| Direct admission, No. (%) | 14 (28) | 15 (30) | 1.00 |
| Other admission, No. (%) | 3 (6) | 7 (14) | 0.32 |
| Age, mean (SD), years | 69.8 (15.7) | 70.3 (15.8) | 0.38 |
| Male sex, No. (%) | 26 (52) | 18 (36) | 0.12 |
| Ethnicity, No. (%) | 1.00 | ||
| White | 46 (92) | 46 (92) | |
| Other | 4 (8) | 4 (8) | |
| Charlson Comorbidity index, mean (SD) | 3.06 (2.31) | 2.66 (2.02) | 0.22 |
| Hospital stay, mean (SD), day | 14.8 (9.7) | 5.7 (6.3) | 0.0007 |
| Hospital deaths, No. | 9 | 1 | 0.008 |
| Deaths within 30 days, No. | 5 | 2 | 0.24 |
| Deaths within 6 months, No. | 9 | 6 | 0.40 |
| System | Primary Admission Diagnosis | No. of Cases |
|---|---|---|
| Constitutional | Fever, malaise, general symptoms | 7 |
| Cardiovascular | Hypertension, congestive heart failure, chest pain, peripheral vascular disease, edema | 5 |
| Dermatologic | Cellulitis, foot ulcer, skin rash | 3 |
| Gastrointestinal | Pancreatitis, gastrointestinal hemorrhage, nausea and vomiting, diarrhea, abdominal pain | 6 |
| Hematologic | Thrombocytopenia, abnormal coagulation | 2 |
| Musculoskeletal | Lymphedema, shoulder pain, lumbago, back ache, closed dorsal vertebral fracture | 7 |
| Neurologic | Delirium tremens, psychosis, convulsions | 3 |
| Pulmonary | Pneumonia, food or vomit aspiration pneumonitis, shortness of breath, respiratory abnormality | 13 |
| Renal | Hyperkalemia, acute renal failure, renal artery atherosclerosis | 4 |
We reviewed the vital signs and shock indices for the 24 hours before ICU transfer for each case and over the entire hospitalization for each control, to determine the worst set (the lowest systolic blood pressure and the highest heart rate, respiratory rate, and SI). The cases had 1 to 22 complete sets of vitals for the 24 hours before ICU transfer; the median number of sets was 3 and the mean was 4. The controls had 1 to 12 complete sets for the 24 hours before the worst SI: the median was 3 sets and the mean was 3. In 26 of 50 controls, the worst SI occurred within the first 24 hours after admission. There was a significant difference between the median values of the worst shock indices of the cases and the controls (0.87 vs. 0.72; P < 0.005).
Table 3 shows the different values of the SI and the corresponding odds ratio of unplanned ICU transfer for cases compared with controls. The difference was significant at an SI of 0.85 and greater, indicating a strong association with unplanned ICU transfer.
| Shock Index | P Value | Odds Ratio | 95% CI |
|---|---|---|---|
| |||
| 0.8 | 0.05 | 2.43 | 1.015.86 |
| 0.85 | 0.02 | 3.00 | 1.917.56 |
| 0.9 | 0.007 | 7.50 | 1.7232.78 |
| 0.95 | <0.03 | 5.50 | 1.2224.81 |
We also found that the patients who transferred to the ICU had a greater number of inpatient deaths (9 cases vs. 1 control; P = 0.008), which would be expected, but there was no difference in 30‐day or 6‐month mortality rate (Table 1). One patient died after 30 days and while still hospitalized.
Comparison between the temporal trend of vital signs and the SI of the cases for the 24 hours before ICU transfer is shown in Figure 1. This graph shows the median of all the worst values (minimum systolic blood pressure and maximum SI, heart rate, and respiratory rate) over the four 6‐hour time periods (24 hours) preceding ICU transfer. Of note, the change in vital signs is subtle even while the SI increased to more than 0.8 as the patients clinically worsened before transfer.
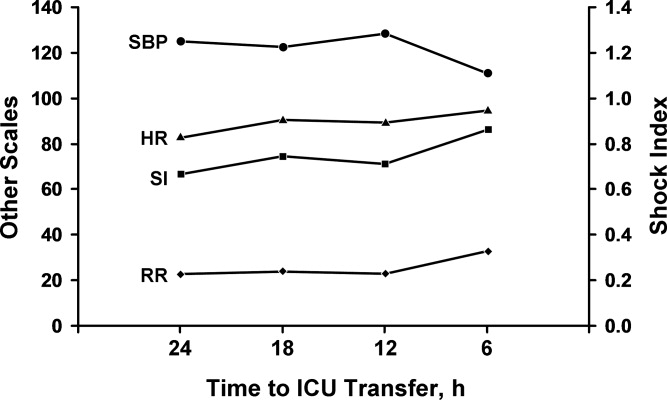
Discussion
In our comparison of the SI of 50 patients who required unplanned (unexpected) transfer to the ICU with the SI of 50 matched controls who did not require this higher level of care, we found that a SI of 0.85 or greater was significantly associated with unplanned transfer to the ICU. The cases had a significantly higher worst SI than the controls, and they also had a significantly longer hospital stay and higher inpatient mortality rate, as would be expected for a sicker patient population. These findings are important given that the SI may be useful for assessing illness severity, for helping determine the need for transfer to the ICU, or for activating METs or RRTs.
A major problem with providing optimal care for hospitalized general medical patients is the inherent difficulty in determining illness severity and clinical decline, especially when the decline occurs gradually. Existing consensus recommendations for ICU admission include both specific diagnoses and arbitrary objective criteria based on abnormal vital signs and laboratory values.27 Also, individual institutions may have their own ICU admission requirements, which may differ from these or RRT criteria. Although vital signs are important as a snapshot of basic physiologic function, a number of noncritical conditions may lead to abnormal vital signs, and not all abnormal vital signs are associated with an adverse clinical event. By relying solely on vital signs, clinicians may not recognize critical illness and therefore not transfer a patient to the ICU or may inappropriately transfer a patient who does not need ICU‐level care.
Markers of illness severity other than vital signs, such as the Acute Physiology and Chronic Health Evaluation (APACHE) score, have been shown to predict the death of ICU patients17, 18 but have been rarely studied outside the ICU setting.19 Also, calculating the APACHE score is cumbersome, and there is no cutoff score that defines when a patient should be transferred to the ICU. Subbe et al.,20 in their study to identify critically ill patients, found that introduction of a physiological scoring system (including MET or RRT activation scores) would have identified only a small number of additional patients as critically ill. Another common marker of illness severity, the 4 criteria of the systemic inflammatory response syndrome (temperature <36C or >38C; heart rate >90 beats per minute; respiratory rate >20 breaths per minute or PCO2 <32 mm Hg; and white blood cell count >12,000/L or <4000/L or with more than 10% band cells)21 may be too sensitive to use as a decision aid, since even a healthy person running after a bus could have 2 of the 4 criteria.22 Likewise, surgical patients may have transient leukocytosis due to a stress response independent of an infection.23
The SI may be more accurate than vital signs alone to determine illness severity and who is at risk for an unplanned transfer to the ICU. Birkhahn et al.24 concluded that the SI may be more useful in early hemorrhage than either heart rate or systolic blood pressure alone. Rady et al.25 showed that the SI used in the emergency department can identify critical illness with apparently stable vital signs, where an elevation of the SI above 0.9 was associated with an illness that was treated immediately with admission to the hospital and intensive therapy on admission. However, it is unclear whether the SI can be used to monitor ongoing treatment, because a previous study showed that the SI may be of limited value in the assessment of systemic oxygen transport and response to therapy in clinical septic shock.26 Of note, the SI is mostly independent of the effects of pain or anxiety, which cause a concurrent rise in heart rate and systolic blood pressure. Because the heart's left ventricular work is unchanged or may increase from the underlying catecholamine surge, the SI will be unchanged or may actually decrease.
Our study adds to the medical literature the findings that: (1) the SI may be useful as an indicator of illness severity and a triage tool in patients with no trauma but with various medical conditions, and (2) the SI showed a strong association with unplanned ICU transfer.
The main strength of our study is its case‐control design with matched controls. Also, by comparing groups from the same patient care unit, we sought to minimize the selection bias that can be inherent in case‐control studies. Limitations include the retrospective, nonrandomized study design and the fact that there may have been variations in vital sign measurements by the multiple caregivers. However, the vital signs were taken according to standard hospital practice and reflect real‐world conditions. Although generalizability may be somewhat limited because of our homogeneous patient population, our patients had a wide range of various medical illnesses, so our study should be applicable to other hospital settings, both academic and community‐based.
One of the main weaknesses of our study is that the results were not adjusted for the burden of comorbid conditions, although there were no statistically significant differences in the number of comorbid conditions among the cases and the controls (P = 0.96). Also, we did not directly compare the SI with vital signs alone to determine superiority.
The SI may be an important objective measure to help clinicians decide when patients need treatment that is more aggressive, assistance from a MET or an RRT, or a preemptive, rather than unplanned, transfer to an ICU. Although it is unlikely that a single measure will allow accurate triage of all medical or surgical patients, the SI may be a useful adjunct to clinical judgment and other objective measures in determining illness severity and clinical decline. Further prospective studies are needed to compare the role of the SI specifically with MET or RRT activation criteria, to clarify the role of comorbid conditions in unplanned transfers to the ICU, to validate the cut point for the SI in various disease states, and to assess its utility in patients with septic shock. Depending on these results, it may be beneficial to incorporate the SI into the electronic medical record as an automatic alert to identify patients at risk for ICU transfer.
Conclusions
The SI is an easily calculated composite index of heart rate and systolic blood pressure. An elevated SI of 0.85 can identify patients who are at risk for unplanned transfer to the ICU from general patient care units. Future studies will determine whether the SI is more accurate than simple vital signs as an indicator of clinical decline. If so, it may be useful as a trigger to activate METs or RRTs for treatment.
- ,.Outcome of intensive care patients in a group of British intensive care units.Crit Care Med.1998;26(8):1337–1345.
- ,,,.The longer patients are in hospital before Intensive Care admission the higher their mortality.Intensive Care Med.2004;30(10):1908–1913.
- ,.Physiological abnormalities in early warning scores are related to mortality in adult inpatients.Br J Anaesth.2004;92(6):882–884.
- ,,,,.Association between clinically abnormal observations and subsequent in‐hospital mortality: a prospective study.Resuscitation.2004;62(2):137–141.
- ,,,,,.Recognising clinical instability in hospital patients before cardiac arrest or unplanned admission to intensive care: a pilot study in a tertiary‐care hospital.Med J Aust.1999;171(1):22–25.
- ,,.Physiological values and procedures in the 24 h before ICU admission from the ward.Anaesthesia.1999;54(6):529–534.
- ,,, et al.Antecedents to hospital deaths.Intern Med J.2001;31(6):343–348.
- ,,, et al.A comparison of antecedents to cardiac arrests, deaths and emergency intensive care admissions in Australia and New Zealand, and the United Kingdom: the ACADEMIA study.Resuscitation.2004;62(3):275–282.
- ,,,,.Anticipating events of in‐hospital cardiac arrest.Eur J Emerg Med.2004;11(1):24–28.
- ,,, et al.Duration of life‐threatening antecedents prior to intensive care admission.Intensive Care Med.2002;28(11):1629–1634.
- ,,,.The prevalence of recordings of the signs of critical conditions and emergency responses in hospital wards: the SOCCER study.Resuscitation.2005;65(2):149–157.
- ,,,,,.Hospital‐wide code rates and mortality before and after implementation of a rapid response team.JAMA.2008;300(21):2506–2513.
- ,,,,.Rapid response teams: a systematic review and meta‐analysis.Arch Intern Med.2010;170(1):18–26.
- ,. [Shock index.]Dtsch Med Wochenschr.1967;92(43):1947–50. [German]
- ,,,.A new method of classifying prognostic comorbidity in longitudinal studies: development and validation.J Chronic Dis.1987;40(5):373–83.
- ,.Matching in studies of classification accuracy: implications for analysis, efficiency, and assessment of incremental value.Biometrics.2008;64(1):1–9.
- ,,,.APACHE II: a severity of disease classification system.Crit Care Med.1985;13(10):818–829.
- ,.Outcome prediction in critical care: the Acute Physiology and Chronic Health Evaluation models.Curr Opin Crit Care.2008;14(5):491–497.
- ,,.APACHE II predicts long‐term survival in COPD patients admitted to a general medical ward.J Gen Intern Med.2003;18(10):824–830.
- ,,,.Validation of physiological scoring systems in the accident and emergency department.Emerg Med J.2006;23(11):841–845.
- ,,, et al;2001 SCCM/ESICM/ACCP/ATS/SIS International Sepsis Definitions Conference.Crit Care Med.2003;31(4):1250–1256.
- .Dear SIRS, I'm sorry to say that I don't like you...Crit Care Med.1997;25(2):372–374.
- ,.The inflammatory response to surgery and trauma.Curr Opin Crit Care.2006;12(4):325–332.
- ,,,,.Shock index in diagnosing early acute hypovolemia.Am J Emerg Med.2005;23(3):323–326.
- ,,,,.A comparison of the shock index and conventional vital signs to identify acute, critical illness in the emergency department.Ann Emerg Med.1994;24(4):685–690. Erratum in:Ann Emerg Med.year="1994"1994;24(6):1208.
- ,,,.Shock index: a re‐evaluation in acute circulatory failure.Resuscitation.1992;23(3):227–234.
- ,,,,, et al.Guidelines for intensive care unit admission, discharge, and triage. Task Force of the American College of Critical Care Medicine, Society of Critical Care Medicine.Crit Care Med.1999;27(3):633–638.
The decision to transfer a patient to the intensive care unit (ICU) from a general care setting is complex and based not only on clinical findings and patient wishes but also on the understanding that ICU resources are limited and costly.1 Adding to the decision‐making complexity is the knowledge that patients who transfer to an ICU from a general medical unit comprise the highest mortality group of ICU patients, with the mortality rate directly proportional to both the time spent on the general medical unit1, 2 and the number of physiologic abnormalities before ICU admission.3, 4
Prior studies have shown that cardiac arrest and unplanned (unexpected) transfers to the ICU are preceded by a period of physiologic instability reflected in the vital signs.510 However, vital signs alone may not accurately indicate clinical condition. For example, a person may be able to maintain normal blood pressure and heart rate despite severe illness or may have abnormal vital signs at baseline, which may be the case for an otherwise healthy young woman who has baseline low systolic blood pressure. Also, noncritical conditions commonly seen in hospitalized medical or surgical patients, such as anxiety or pain, may increase the respiratory rate or heart rate. Conversely, certain common medications, such as ‐blockers, may mask or blunt the normal physiologic response to illness. Overall, the prevalence of abnormal physiologic variables is high among hospitalized adult patients irrespective of the presence of serious adverse events.11 This prevalence may be a reason why 2 recent studies of inpatient medical emergency teams (METs) or rapid response teams (RRTs), which generally rely on vital signs for activation, failed to show a decrease in adult mortality rates.12, 13
Given the complexity of interpreting single vital sign readings, we evaluated a simple and clinically intuitive variable, the shock index (SI) (heart rate/systolic blood pressure, a noninvasive indication of left ventricular function),14 as a potential marker of the need for intensive care. Allgwer and Burri14 first developed the SI in studies of patients with acute blood loss, intraabdominal bleeding, fat emboli, and severe infections. They observed that a healthy adult had a mean SI of 0.54 (standard deviation [SD], 0.021), while an index of 1.0 indicated threatened shock and indices greater than 1.5 were seen in volume‐deficient shock.
We hypothesized that an elevated SI is a differentiating factor between a patient who had an unplanned ICU transfer and a general medical patient who did not require this higher level of care. To our knowledge, the SI has not been studied for this application previously.
Patients and Methods
Study Design
We conducted a retrospective case‐control study of 50 consecutive general medical patients who had unplanned transfers to the ICU and 50 matched control patients, with the approval of the Mayo Clinic Institutional Review Board. All patients were admitted to a general medical unit, and only patients who previously provided permission for their records to be used in research were included in the study.
Patients
This study enrolled patients who were at least 18 years old and who were admitted to a single general medical unit for 24 hours or longer. Patients were excluded if they required a surgical intervention, were transferred from another hospital, received care on a different general medical unit at any time during the hospitalization, or were pregnant. Our data collection began at the patients' (cases and controls) arrival on the general medical unit; we did not include data from any evaluation (outpatient or emergency department) before hospital admission.
Case Definition
An unplanned transfer was defined as an episode of unexpected clinical deterioration in a general medical patient that necessitated transfer to the ICU, as opposed to a preemptive or elective transfer following a procedure. Patients with unplanned transfers from December 9, 2003, to December 29, 2004, were eligible for the study. Only the first transfer to the ICU was considered for patients who had multiple ICU transfers during a single hospitalization. Because these data were collected before METs or RRTs were introduced at our institution, the recommendation for ICU transfer was a joint decision by the primary care team and the ICU team.
Control Definition
The matched controls were identified from among patients admitted to the general medical unit from January 16, 2002, to December 13, 2004. To reduce the effect of the heterogeneity inherent in general medical patients, we matched controls for age (within 5 years of age of the corresponding case), admission diagnosis code, and patient care unit of admission and required that they were admitted for at least 24 hours before dismissal. Patients who had an ICU stay during the same admission were excluded. The median difference in admission dates between the cases and the controls was 327 days, and 26 of the 50 matched pairs had admission dates within 1 year of each other. This lengthy interval between cases and controls was a consequence of the low incidence of patients who met the matching criteria.
Setting
This study involved the general medical units and ICUs of the 1157‐bed Saint Mary's Hospital, an academic tertiary care facility at Mayo Clinic in Rochester, Minnesota.
Vital Sign Determination
Vital signs abstracted for this study included blood pressure, heart rate, respiratory rate, oxygen saturation, and temperature. The SI was calculated for each set of abstracted vital signs. Staff nurses were responsible for the routine measurement and recording of vital signs at least once every 8 hours, although in several instances not all parameters were checked. In accordance with nursing policy, values outside the defined parameters were rechecked by the nursing supervisor of each care unit and, if found to be abnormal, were conveyed to the patient's physician. This system meant that abnormal results were checked by numerous observers, with differences in the frequency of recordings for individual patients.
Data Collection
Demographic data and information on the vital signs were abstracted through a comprehensive chart review. Demographic data included age, sex, ethnicity, comorbid conditions, hospital care unit, date and time of admission, admission diagnosis, date and time of transfer to the ICU, length of stay, dismissal date, and disposition at discharge. Comorbid conditions were scored using the Charlson Comorbidity Index.15
Statistical Analysis
A sample size of 50 matched pairs provided 81% power to detect an odds ratio of 3.0 or greater between cases and controls, with a 0.05, 2‐tailed level of significance with McNemar test. Patient demographic characteristics were summarized by the frequencies for categorical data and by mean and SD for continuous data. Consistent with the study design, the McNemar test and conditional logistic model analyses were used to determine the association between the SI and the risk of unplanned ICU transfer. Shock indices for the cases and controls were compared with use of t test. A P value <0.05 was considered statistically significant. For the SI, we calculated the odds ratio and its 95% confidence interval (CI) and P value using different cut points. We did not perform a receiver operating characteristics analysis because matching of cases and controls greatly complicates estimation of the sensitivity and specificity of the SI;16 a cohort study is suggested to investigate this analysis further. All statistical analyses were performed by SAS version 9.1.3 software (SAS Institute Inc, Cary, NC).
Results
A total of 50 pairs of matching cases and controls was included in this study. Table 1 lists the source of admission, demographic characteristics, and numbers of deaths for cases and controls. There were no statistically significant differences in admission source, age, sex, ethnicity, admission care unit, or Charlson Comorbidity Index. Mean length of stay was 14.8 days (SD, 9.7 days) for the cases and 5.7 days (SD, 6.3 days; P < 0.001) for the controls. Admission diagnoses were classified on the basis of the organ system of involvement (Table 2). In 30 of 50 cases, the admission diagnosis and the reason for ICU transfer were related.
| Value | Cases (n = 50) | Controls (n = 50) | P Value* |
|---|---|---|---|
| |||
| Emergency department admission, No. (%) | 33 (66) | 28 (56) | 0.41 |
| Direct admission, No. (%) | 14 (28) | 15 (30) | 1.00 |
| Other admission, No. (%) | 3 (6) | 7 (14) | 0.32 |
| Age, mean (SD), years | 69.8 (15.7) | 70.3 (15.8) | 0.38 |
| Male sex, No. (%) | 26 (52) | 18 (36) | 0.12 |
| Ethnicity, No. (%) | 1.00 | ||
| White | 46 (92) | 46 (92) | |
| Other | 4 (8) | 4 (8) | |
| Charlson Comorbidity index, mean (SD) | 3.06 (2.31) | 2.66 (2.02) | 0.22 |
| Hospital stay, mean (SD), day | 14.8 (9.7) | 5.7 (6.3) | 0.0007 |
| Hospital deaths, No. | 9 | 1 | 0.008 |
| Deaths within 30 days, No. | 5 | 2 | 0.24 |
| Deaths within 6 months, No. | 9 | 6 | 0.40 |
| System | Primary Admission Diagnosis | No. of Cases |
|---|---|---|
| Constitutional | Fever, malaise, general symptoms | 7 |
| Cardiovascular | Hypertension, congestive heart failure, chest pain, peripheral vascular disease, edema | 5 |
| Dermatologic | Cellulitis, foot ulcer, skin rash | 3 |
| Gastrointestinal | Pancreatitis, gastrointestinal hemorrhage, nausea and vomiting, diarrhea, abdominal pain | 6 |
| Hematologic | Thrombocytopenia, abnormal coagulation | 2 |
| Musculoskeletal | Lymphedema, shoulder pain, lumbago, back ache, closed dorsal vertebral fracture | 7 |
| Neurologic | Delirium tremens, psychosis, convulsions | 3 |
| Pulmonary | Pneumonia, food or vomit aspiration pneumonitis, shortness of breath, respiratory abnormality | 13 |
| Renal | Hyperkalemia, acute renal failure, renal artery atherosclerosis | 4 |
We reviewed the vital signs and shock indices for the 24 hours before ICU transfer for each case and over the entire hospitalization for each control, to determine the worst set (the lowest systolic blood pressure and the highest heart rate, respiratory rate, and SI). The cases had 1 to 22 complete sets of vitals for the 24 hours before ICU transfer; the median number of sets was 3 and the mean was 4. The controls had 1 to 12 complete sets for the 24 hours before the worst SI: the median was 3 sets and the mean was 3. In 26 of 50 controls, the worst SI occurred within the first 24 hours after admission. There was a significant difference between the median values of the worst shock indices of the cases and the controls (0.87 vs. 0.72; P < 0.005).
Table 3 shows the different values of the SI and the corresponding odds ratio of unplanned ICU transfer for cases compared with controls. The difference was significant at an SI of 0.85 and greater, indicating a strong association with unplanned ICU transfer.
| Shock Index | P Value | Odds Ratio | 95% CI |
|---|---|---|---|
| |||
| 0.8 | 0.05 | 2.43 | 1.015.86 |
| 0.85 | 0.02 | 3.00 | 1.917.56 |
| 0.9 | 0.007 | 7.50 | 1.7232.78 |
| 0.95 | <0.03 | 5.50 | 1.2224.81 |
We also found that the patients who transferred to the ICU had a greater number of inpatient deaths (9 cases vs. 1 control; P = 0.008), which would be expected, but there was no difference in 30‐day or 6‐month mortality rate (Table 1). One patient died after 30 days and while still hospitalized.
Comparison between the temporal trend of vital signs and the SI of the cases for the 24 hours before ICU transfer is shown in Figure 1. This graph shows the median of all the worst values (minimum systolic blood pressure and maximum SI, heart rate, and respiratory rate) over the four 6‐hour time periods (24 hours) preceding ICU transfer. Of note, the change in vital signs is subtle even while the SI increased to more than 0.8 as the patients clinically worsened before transfer.
Discussion
In our comparison of the SI of 50 patients who required unplanned (unexpected) transfer to the ICU with the SI of 50 matched controls who did not require this higher level of care, we found that a SI of 0.85 or greater was significantly associated with unplanned transfer to the ICU. The cases had a significantly higher worst SI than the controls, and they also had a significantly longer hospital stay and higher inpatient mortality rate, as would be expected for a sicker patient population. These findings are important given that the SI may be useful for assessing illness severity, for helping determine the need for transfer to the ICU, or for activating METs or RRTs.
A major problem with providing optimal care for hospitalized general medical patients is the inherent difficulty in determining illness severity and clinical decline, especially when the decline occurs gradually. Existing consensus recommendations for ICU admission include both specific diagnoses and arbitrary objective criteria based on abnormal vital signs and laboratory values.27 Also, individual institutions may have their own ICU admission requirements, which may differ from these or RRT criteria. Although vital signs are important as a snapshot of basic physiologic function, a number of noncritical conditions may lead to abnormal vital signs, and not all abnormal vital signs are associated with an adverse clinical event. By relying solely on vital signs, clinicians may not recognize critical illness and therefore not transfer a patient to the ICU or may inappropriately transfer a patient who does not need ICU‐level care.
Markers of illness severity other than vital signs, such as the Acute Physiology and Chronic Health Evaluation (APACHE) score, have been shown to predict the death of ICU patients17, 18 but have been rarely studied outside the ICU setting.19 Also, calculating the APACHE score is cumbersome, and there is no cutoff score that defines when a patient should be transferred to the ICU. Subbe et al.,20 in their study to identify critically ill patients, found that introduction of a physiological scoring system (including MET or RRT activation scores) would have identified only a small number of additional patients as critically ill. Another common marker of illness severity, the 4 criteria of the systemic inflammatory response syndrome (temperature <36C or >38C; heart rate >90 beats per minute; respiratory rate >20 breaths per minute or PCO2 <32 mm Hg; and white blood cell count >12,000/L or <4000/L or with more than 10% band cells)21 may be too sensitive to use as a decision aid, since even a healthy person running after a bus could have 2 of the 4 criteria.22 Likewise, surgical patients may have transient leukocytosis due to a stress response independent of an infection.23
The SI may be more accurate than vital signs alone to determine illness severity and who is at risk for an unplanned transfer to the ICU. Birkhahn et al.24 concluded that the SI may be more useful in early hemorrhage than either heart rate or systolic blood pressure alone. Rady et al.25 showed that the SI used in the emergency department can identify critical illness with apparently stable vital signs, where an elevation of the SI above 0.9 was associated with an illness that was treated immediately with admission to the hospital and intensive therapy on admission. However, it is unclear whether the SI can be used to monitor ongoing treatment, because a previous study showed that the SI may be of limited value in the assessment of systemic oxygen transport and response to therapy in clinical septic shock.26 Of note, the SI is mostly independent of the effects of pain or anxiety, which cause a concurrent rise in heart rate and systolic blood pressure. Because the heart's left ventricular work is unchanged or may increase from the underlying catecholamine surge, the SI will be unchanged or may actually decrease.
Our study adds to the medical literature the findings that: (1) the SI may be useful as an indicator of illness severity and a triage tool in patients with no trauma but with various medical conditions, and (2) the SI showed a strong association with unplanned ICU transfer.
The main strength of our study is its case‐control design with matched controls. Also, by comparing groups from the same patient care unit, we sought to minimize the selection bias that can be inherent in case‐control studies. Limitations include the retrospective, nonrandomized study design and the fact that there may have been variations in vital sign measurements by the multiple caregivers. However, the vital signs were taken according to standard hospital practice and reflect real‐world conditions. Although generalizability may be somewhat limited because of our homogeneous patient population, our patients had a wide range of various medical illnesses, so our study should be applicable to other hospital settings, both academic and community‐based.
One of the main weaknesses of our study is that the results were not adjusted for the burden of comorbid conditions, although there were no statistically significant differences in the number of comorbid conditions among the cases and the controls (P = 0.96). Also, we did not directly compare the SI with vital signs alone to determine superiority.
The SI may be an important objective measure to help clinicians decide when patients need treatment that is more aggressive, assistance from a MET or an RRT, or a preemptive, rather than unplanned, transfer to an ICU. Although it is unlikely that a single measure will allow accurate triage of all medical or surgical patients, the SI may be a useful adjunct to clinical judgment and other objective measures in determining illness severity and clinical decline. Further prospective studies are needed to compare the role of the SI specifically with MET or RRT activation criteria, to clarify the role of comorbid conditions in unplanned transfers to the ICU, to validate the cut point for the SI in various disease states, and to assess its utility in patients with septic shock. Depending on these results, it may be beneficial to incorporate the SI into the electronic medical record as an automatic alert to identify patients at risk for ICU transfer.
Conclusions
The SI is an easily calculated composite index of heart rate and systolic blood pressure. An elevated SI of 0.85 can identify patients who are at risk for unplanned transfer to the ICU from general patient care units. Future studies will determine whether the SI is more accurate than simple vital signs as an indicator of clinical decline. If so, it may be useful as a trigger to activate METs or RRTs for treatment.
- ,.Outcome of intensive care patients in a group of British intensive care units.Crit Care Med.1998;26(8):1337–1345.
- ,,,.The longer patients are in hospital before Intensive Care admission the higher their mortality.Intensive Care Med.2004;30(10):1908–1913.
- ,.Physiological abnormalities in early warning scores are related to mortality in adult inpatients.Br J Anaesth.2004;92(6):882–884.
- ,,,,.Association between clinically abnormal observations and subsequent in‐hospital mortality: a prospective study.Resuscitation.2004;62(2):137–141.
- ,,,,,.Recognising clinical instability in hospital patients before cardiac arrest or unplanned admission to intensive care: a pilot study in a tertiary‐care hospital.Med J Aust.1999;171(1):22–25.
- ,,.Physiological values and procedures in the 24 h before ICU admission from the ward.Anaesthesia.1999;54(6):529–534.
- ,,, et al.Antecedents to hospital deaths.Intern Med J.2001;31(6):343–348.
- ,,, et al.A comparison of antecedents to cardiac arrests, deaths and emergency intensive care admissions in Australia and New Zealand, and the United Kingdom: the ACADEMIA study.Resuscitation.2004;62(3):275–282.
- ,,,,.Anticipating events of in‐hospital cardiac arrest.Eur J Emerg Med.2004;11(1):24–28.
- ,,, et al.Duration of life‐threatening antecedents prior to intensive care admission.Intensive Care Med.2002;28(11):1629–1634.
- ,,,.The prevalence of recordings of the signs of critical conditions and emergency responses in hospital wards: the SOCCER study.Resuscitation.2005;65(2):149–157.
- ,,,,,.Hospital‐wide code rates and mortality before and after implementation of a rapid response team.JAMA.2008;300(21):2506–2513.
- ,,,,.Rapid response teams: a systematic review and meta‐analysis.Arch Intern Med.2010;170(1):18–26.
- ,. [Shock index.]Dtsch Med Wochenschr.1967;92(43):1947–50. [German]
- ,,,.A new method of classifying prognostic comorbidity in longitudinal studies: development and validation.J Chronic Dis.1987;40(5):373–83.
- ,.Matching in studies of classification accuracy: implications for analysis, efficiency, and assessment of incremental value.Biometrics.2008;64(1):1–9.
- ,,,.APACHE II: a severity of disease classification system.Crit Care Med.1985;13(10):818–829.
- ,.Outcome prediction in critical care: the Acute Physiology and Chronic Health Evaluation models.Curr Opin Crit Care.2008;14(5):491–497.
- ,,.APACHE II predicts long‐term survival in COPD patients admitted to a general medical ward.J Gen Intern Med.2003;18(10):824–830.
- ,,,.Validation of physiological scoring systems in the accident and emergency department.Emerg Med J.2006;23(11):841–845.
- ,,, et al;2001 SCCM/ESICM/ACCP/ATS/SIS International Sepsis Definitions Conference.Crit Care Med.2003;31(4):1250–1256.
- .Dear SIRS, I'm sorry to say that I don't like you...Crit Care Med.1997;25(2):372–374.
- ,.The inflammatory response to surgery and trauma.Curr Opin Crit Care.2006;12(4):325–332.
- ,,,,.Shock index in diagnosing early acute hypovolemia.Am J Emerg Med.2005;23(3):323–326.
- ,,,,.A comparison of the shock index and conventional vital signs to identify acute, critical illness in the emergency department.Ann Emerg Med.1994;24(4):685–690. Erratum in:Ann Emerg Med.year="1994"1994;24(6):1208.
- ,,,.Shock index: a re‐evaluation in acute circulatory failure.Resuscitation.1992;23(3):227–234.
- ,,,,, et al.Guidelines for intensive care unit admission, discharge, and triage. Task Force of the American College of Critical Care Medicine, Society of Critical Care Medicine.Crit Care Med.1999;27(3):633–638.
Copyright © 2010 Society of Hospital Medicine

BMI and Postoperative Complications
Public health concerns such as the aging population1 and the increasing prevalence of obesity2 are also important issues to hospitals. However, little attention has been given to the interface of obesity and the elderly, largely due to the dearth of studies that include elderly patients. An aging population leads to an increase in geriatric syndromes, such as osteoporosis3 and its most devastating complication, hip fracture.4 These frail, hip‐fracture patients pose management challenges to practicing geriatricians and hospitalists.5,6 Furthermore, although fracture risk is inversely correlated to body mass index (BMI),7 this relationship has yet to be fully examined in the postoperative hip‐fracture population. In other surgical settings, there is disagreement as to whether underweight or obese patients are at higher risk of developing medical complications,8‐11 but for orthopedic patients, data have been limited to elective orthopedic populations.12‐14 We previously demonstrated that underweight hip‐fracture patients are at higher risk of postoperative cardiac complications at 1 year,15 consistent with studies of cardiac risk indices determining long‐term events. Because of different pathophysiologic mechanisms, the purpose of this study was to ascertain the influence of BMI on inpatient postoperative noncardiac medical complications and to assess predictors of such complications following urgent hip fracture repair.
Patients and Methods
All Olmsted County, Minnesota, residents undergoing urgent hip repair due to fracture were identified using the Rochester Epidemiology Project, a medical‐record linkage system funded by the Federal government since 1966 to support disease‐related epidemiology studies.16 All patient medical care is indexed, and both inpatient and outpatient visits are captured and available for review, allowing for complete case ascertainment. Medical care in Olmsted County is primarily provided by Mayo Clinic with its affiliated hospitals (St. Mary's and Rochester Methodist) and the Olmsted Medical Center, in addition to a few individual providers. Over 95% of all Olmsted County hip fracture surgeries are ultimately managed at St. Mary's Hospital.
Following approval by the Institutional Review Board we used this unique data resource to identify all residents with an International Classification of Diseases, 9th edition (ICD‐9) diagnosis code of 820 to 829 for hip fracture (n = 1310). Both sexes were included, and all patients included in the study provided research authorization for use of their medical records for research purposes.17 We excluded patients who were managed conservatively (n = 56), had a pathological fracture (n = 20), had multiple injuries (n = 19), were operated on >72 hours after fracture (n = 5), were aged <65 years (n = 2), or were admitted for reasons other than a fracture and experienced an in‐hospital fracture (n = 3). We subsequently excluded patients with missing information (n = 10). World Health Organization (WHO) criteria were used for classifying BMI: underweight (BMI < 18.5); normal (BMI = 18.5‐24.9); overweight (BMI = 25.0‐29.9); and obese (BMI 30.0).18
All data were abstracted using standardized collection forms by trained nurse abstractors blinded to the study hypothesis. Patients' admission height and weight were documented; if unavailable, the nearest data within 2 months prior to surgery were recorded. Patients' preadmission residence, functional status, baseline comorbidities, admission medications, discharge destination, as well as whether patients had an intensive care unit stay or any major surgeries in the past 90 days were abstracted. In addition, American Society of Anesthesia (ASA) class, type of anesthesia, and length of stay were also obtained. Inpatient complications that had been identified by the treating physicians and documented in the medical record or identified on imaging studies were assessed from the time of hip fracture repair to the time of discharge using standardized clinical criteria (Table 1). For criteria that were based on either objective findings or clinical documentation/suspicion, the patient was considered to meet the criteria of having a complication if they fulfilled either one. We did not include any cardiac outcomes, including congestive heart failure, angina, myocardial infarction, or arrhythmias that had been previously reported.15 Noncardiac complications were classified broadly: respiratory (respiratory failure, respiratory depression, or pulmonary hypoxemia); neurologic (any cerebral event including hemorrhagic or ischemic stroke, transient ischemic attack, or delirium); gastrointestinal (ileus or gastrointestinal bleeding); vascular (pulmonary embolus, or deep vein thrombosis); infectious (pneumonia, sepsis, urinary tract, wound, or cellulitis); renal/metabolic (acute renal failure, dehydration, or electrolyte abnormalities); or other (fractures or falls).
| Definition | Symptom |
|---|---|
| |
| Gastrointestinal | |
| Ileus | Dilated loops of bowel on X‐ray; documented ileus with nausea, vomiting, no stool or inability to take oral intake |
| Gastrointestinal bleeding | Sudden appearance of frank blood on nasogastric lavage or by rectum AND a decrease in hemoglobin of 2 g/dL or greater with no other suspected source of ongoing blood loss |
| Infectious | |
| Pneumonia | New infiltrate on chest x‐ray plus 2 of the following 3 findings: temperature >38C, elevated white cell count, sputum pathogen that requires antibiotic treatment |
| Bacteremia/sepsis | Localized infection with positive blood culture for the same pathogen AND chills, rigors, fever, elevated white cell count AND intravenous antibiotic treatment |
| Urinary tract infection | Pyuria symptoms |
| Positive gram stain symptoms | |
| Wound | |
| Cellulitis | As documented in physician's note of a superficial skin infection |
| Neurologic | |
| Cerebral eventhypoxia, thrombosis or hemorrhage | New neurologic dysfunction (hemiplegia, hemianesthesia, hemianopia, aphasia, or unconsciousness) postoperatively |
| Transient ischemic attack | Any neurologic dysfunction resolving within a 24‐hour period |
| Delirium | Positive Confusion Assessment Method38 |
| Renal/metabolic | |
| Renal failure | A doubling of baseline value of creatinine; serum creatinine >3.0 mg/dL; acute need for dialysis |
| Dehydration | As documented in the physician's note |
| Electrolyte abnormalities | Any laboratory evidence of abnormal electrolytes compared to normal |
| Respiratory | |
| Respiratory failure | Need for intubation and ventilation >24 hours postoperatively; need for reintubation and ventilation after 1 hour postoperatively |
| Respiratory depression | Respiratory arrest; PaCO2 >60 mmHg that provider believed was associated with narcotics |
| Pulmonary hypoxemia | SaO2 <90% with or without supplemental oxygen; supplemental oxygen >24 hours |
| Vascular | |
| Deep vein thrombosis | Positive lower extremity venous Doppler |
| Pulmonary embolism | Acute onset dyspnea and tachycardia, increased central venous pressure AND (positive ventilation/perfusion scan OR positive computed tomography OR positive pulmonary angiogram) |
| Other | |
| Fractures | Any in‐hospital documented fracture of any bone |
| Falls | Patients descending to the ground from any position unintentionally |
Continuous data are presented as means standard deviation and categorical data as counts and percentages. In testing for differences in patient demographics, past medical history, and baseline clinical data among BMI groups, Kruskal‐Wallis tests were performed for continuous variables and Fisher's Exact or Cochran‐Mantel‐Haenszel tests were used for discrete variables. Bonferroni adjustments were performed where appropriate. The primary outcome was the risk of any noncardiac medical complication during the postoperative hospitalization, based on patients with complications. Incidence rates were calculated for the overall group as well as for each BMI category. BMI was evaluated categorically according to the WHO criteria, as a continuous variable dichotomized as a BMI 18.5 kg/m2 to 24.9 kg/m2 (normal) vs. all others, and above/below 25.0 kg/m2. The effect of BMI and other potential risk factors on the complication rate was evaluated using logistic regression. The effect of BMI category on the overall complication rate was adjusted for the a priori risk factors of age, sex, surgical year, and ASA class both univariately (Model 1) and multivariately (Model 2). In addition to these variables, we also evaluated other potential risk factors, including baseline demographic and baseline clinical variables that were significant (P < 0.05) univariately using a stepwise selection; first forcing in BMI as a categorical variable (Model 3), then repeating the stepwise selection process without forcing in BMI (Model 4). Using data from Lawrence et al.,19 we estimated that we would have 80% power to detect differences in rates of inpatient noncardiac complications equal to an odds ratio (OR) = 2.2 (normal vs. underweight), OR = 2.0 (normal vs. overweight), and OR = 2.4 (normal vs. obese). Finally, because of power considerations, as an exploratory analysis, we additionally identified predictors of inpatient complications within each BMI category using stepwise selection. All statistical tests were 2‐sided, and P values <0.05 were considered significant. All analyses were performed using SAS for UNIX (version 9.1.3; SAS Institute, Inc., Cary, NC).
Results
Between 1988 and 2002, 1195 urgent repairs for hip fracture met our inclusion/exclusion criteria. We subsequently excluded 15 repairs with missing BMI data, and, of the 7 patients with >1 repair, we included only their first fracture episode in our analysis. Two were subsequently excluded due to an administrative error. Ultimately, 1180 hip fracture repairs were included in the analysis cohort. There were 184 (15.6%) patients in the underweight group, 640 (54.2%) with normal BMI, 251 (21.3%) with a BMI 25.0 to 29.9 kg/m2, and 105 (8.9%) with a BMI 30 kg/m2. Baseline characteristics are otherwise shown in Table 2. Normal BMI patients were significantly older than the other groups, and underweight patients were less likely to be admitted from home. Past history of having a cardiovascular risk factor or a cardiovascular diagnosis appeared to increase with increasing BMI. Underweight patients were more likely to have chronic obstructive pulmonary disease (COPD) than patients with normal BMI (P = 0.03) or overweight patients (P = 0.009), but not more than obese patients (P = 0.21). There were no differences across BMI groups in ASA class, type of anesthesia, intensive care unit stay, or length of stay.
| Variable | Underweight (<18.5 kg/m2) n = 184 n (%) | Normal (18.5‐24.9 kg/m2) n = 640 n (%) | Overweight (25‐29.9 kg/m2) n = 251 n (%) | Obese (30 kg/m2) n = 105 n (%) | P Value* |
|---|---|---|---|---|---|
| |||||
| Age (years) | 84.8 8.0 | 85.0 7.2 | 83.1 7.3 | 80.7 7.4 | <0.001 |
| Female sex | 171 (92.9) | 525 (82) | 177 (70.5) | 76 (72.4) | <0.001 |
| Preadmission residence | |||||
| ALC/SNF | 79 (42.9) | 250 (39.1) | 83 (33.1) | 36 (34.3) | 0.024 |
| Home | 105 (57.1) | 390 (60.9) | 168 (66.9) | 69 (65.7) | |
| Functional status | |||||
| Dependent | 25 (13.6) | 80 (12.5) | 24 (9.6) | 7 (6.7) | 0.044 |
| Walking independently | 159 (86.4) | 560 (87.5) | 226 (90.4) | 97 (93.3) | |
| History of | |||||
| Hypertension | 84 (45.7) | 374 (58.4) | 159 (63.3) | 70 (66.7) | <0.001 |
| Diabetes | 9 (4.9) | 71 (11.1) | 30 (12) | 30 (28.6) | <0.001 |
| Cerebrovascular disease | 40 (21.7) | 175 (27.3) | 77 (30.7) | 33 (31.4) | 0.028 |
| Myocardial infarction | 44 (23.9) | 140 (21.9) | 61 (24.3) | 36 (34.3) | 0.106 |
| Congestive heart failure | 48 (26.1) | 150 (23.4) | 76 (30.3) | 44 (41.9) | 0.003 |
| Atrial fibrillation/flutter | 49 (26.6) | 118 (18.4) | 57 (22.7) | 26 (24.8) | 0.985 |
| Chronic renal insufficiency | 11 (6) | 64 (10) | 34 (13.5) | 20 (19) | <0.001 |
| Dementia | 63 (34.2) | 233 (36.4) | 74 (29.5) | 26 (24.8) | 0.031 |
| Obstructive sleep apnea | 2 (1.1) | 5 (0.8) | 5 (2.0) | 6 (5.7) | 0.005 |
| COPD | 41 (22.3) | 100 (15.6) | 32 (12.7) | 17 (16.2) | 0.032 |
| Asthma | 13 (7.1) | 47 (7.3) | 18 (7.2) | 12 (11.4) | 0.395 |
| COPD or asthma | 49 (26.6) | 133 (20.8) | 45 (17.9) | 23 (21.9) | 0.093 |
| Pulmonary embolism or deep vein thrombosis | 9 (4.9) | 21 (3.3) | 21 (8.4) | 17 (16.2) | <0.001 |
| Osteoporosis | 77 (41.8) | 253 (39.5) | 73 (29.1) | 31 (29.5) | <0.001 |
| Collagen vascular diseases | 10 (5.4) | 29 (4.5) | 9 (3.6) | 12 (11.4) | 0.34 |
| Cancer | 61 (33.2) | 169 (26.4) | 75 (29.9) | 32 (30.5) | 0.88 |
| Lymphoma | 2 (1.1) | 3 (0.5) | 2 (0.8) | 2 (1.9) | 0.25 |
| Leukemia | 2 (1.1) | 3 (0.5) | 1 (0.4) | 1 (1) | |
| Major surgery within 90 days | 3 (1.6) | 10 (1.6) | 8 (3.2) | 3 (2.9) | 0.366 |
| ASA class | |||||
| I or II | 19 (10.4) | 93 (14.5) | 46 (18.3) | 12 (11.4) | 0.144 |
| III, IV, or V | 164 (89.6) | 547 (85.5) | 205 (81.7) | 93 (88.6) | |
| Type of anesthesia | |||||
| General | 134 (72.8) | 477 (74.5) | 192 (76.5) | 84 (80) | |
| Other (spinal, epidural, local, combination) | 50 (27.2) | 163 (25.5) | 59 (23.5) | 21 (20) | 0.16 |
| Admission medications | |||||
| Insulin | 2 (1.1) | 18 (2.8) | 11 (4.4) | 17 (16.2) | <0.001 |
| Aspirin | 50 (27.2) | 197 (30.8) | 82 (32.7) | 37 (35.2) | 0.126 |
| Beta‐blockers | 18 (9.8) | 90 (14.1) | 50 (19.9) | 25 (23.8) | <0.001 |
| ACE/ARB | 32 (17.4) | 95 (14.8) | 55 (21.9) | 28 (26.7) | 0.009 |
| Calcium‐channel blocker | 26 (14.1) | 104 (16.3) | 39 (15.5) | 21 (20) | 0.38 |
| Intensive care unit stay | 63 (34.2) | 154 (24.1) | 61 (24.3) | 30 (28.6) | 0.16 |
| Length of stay, days | 10.3 (9.7) | 9.7 (6.8) | 10.2 (7.6) | 11.1 (8.6) | 0.10 |
| Discharge destination | |||||
| Home | 20 (10.9) | 65 (10.2) | 43 (17.1) | 19 (18.1) | |
| ALC/nursing home | 146 (79.8) | 547 (85.5) | 199 (79.3) | 83 (79) | <0.001 |
| In‐hospital death | 17 (9.3) | 28 (4.4) | 9 (3.6) | 3 (2.9) | |
There were 77 (41.8%) postoperative inpatient noncardiac complications in the underweight group, 234 (36.6%) in the normal BMI group, 90 (35.9%) in the overweight group, and 42 (40.0%) in the obese group (P = 0.49). Figure 1 demonstrates the main subcategory complication rates by BMI group, and Table 3 outlines the univariate unadjusted complication rates. Other than gastrointestinal complications being more prevalent as BMI increases (P = 0.005), there were no significant differences in crude complication rates across BMI categories (all P > 0.05) for the other complication subcategories. A multiple comparisons analysis did not demonstrate any differences between normal and any of the other BMI categories for ileus. Normal BMI patients were more likely to be discharged to a nursing facility than overweight or obese patients (85.5% vs. 79.3%, P = 0.03; and 85.5% vs. 79.0%, P = 0.03, respectively). The proportion of in‐hospital deaths among underweight patients was significantly higher than in any of the other groups (9.3% vs. 4.4%; P = 0.01), but mean length of stay was not significantly different.

| Overall Cohort n (%) | Underweight (<18.5 kg/m2) n = 184 n (%) | Normal (18.5‐24.9 kg/m2) n = 640 n (%) | Overweight (25‐29.9 kg/m2) n = 251 n (%) | Obese (30 kg/m2) n = 105 n (%) | P Value | |
|---|---|---|---|---|---|---|
| ||||||
| Gastrointestinal | ||||||
| Ileus | 38 (3.2) | 1 (0.5) | 21 (3.3) | 12 (4.8) | 4 (3.8) | 0.03 |
| Gastrointestinal bleeding | 21 (1.8) | 1 (0.5) | 11 (1.7) | 6 (2.4) | 3 (2.9) | 0.35 |
| Infectious | ||||||
| Pneumonia | 69 (5.8) | 12 (6.5) | 39 (6.1) | 14 (5.6) | 4 (3.8) | 0.51 |
| Bacteremia/sepsis | 8 (0.7) | 1 (0.5) | 2 (0.3) | 5 (2.0) | 0 (0) | 0.06 |
| Urinary tract infection | 84 (7.1) | 12 (6.5) | 47 (7.3) | 15 (6) | 10 (9.5) | 0.78 |
| Wound | ||||||
| Cellulitis | ||||||
| Neurological | ||||||
| Cerebral event‐hypoxia, thrombosis or hemorrhage | 15 (1.3) | 1 (0.5) | 6 (0.9) | 6 (2.4) | 2 (1.9) | 0.21 |
| Transient ischemic attack | ||||||
| Delirium | 199 (16.9) | 40 (21.7) | 106 (16.6) | 36 (14.3) | 17 (16.2) | 0.08 |
| Renal/metabolic | ||||||
| Renal failure | 19 (1.6) | 3 (1.6) | 9 (1.4) | 5 (2.0) | 2 (1.9) | 0.82 |
| Dehydration | ||||||
| Electrolyte abnormalities | ||||||
| Respiratory | ||||||
| Respiratory failure | 53 (4.5) | 10 (5.4) | 23 (3.6) | 15 (6.0) | 5 (4.8) | 0.61 |
| Respiratory depression | 23 (1.9) | 3 (1.6) | 11 (1.7) | 8 (3.2) | 1 (1.0) | 0.50 |
| Pulmonary hypoxemia | 157 (13.3) | 33 (17.9) | 78 (12.2) | 34 (13.5) | 12 (11.4) | 0.22 |
| Vascular | ||||||
| Deep vein thrombosis | 5 (0.4) | 0 (0) | 2 (0.3) | 3 (1.2) | 0 (0) | 0.24 |
| Pulmonary embolism | 16 (1.4) | 3 (1.6) | 7 (1.1) | 5 (2.0) | 1 (1.0) | 0.65 |
| Other | ||||||
| Fractures | 6 (0.5) | 1 (0.5) | 5 (0.8) | 0 (0) | 0 (0) | 0.57 |
| Falls | ||||||
Significant univariate predictors of the composite outcome of any noncardiac complication included: age (OR, 1.04 95% confidence interval [CI>], 1.02‐1.06; P < 0.001), age 75 years (OR, 2.25; 95% CI, 1.52‐3.33; P < 0.001), age 85 years (OR, 1.49; 95% CI, 1.17‐1.89; P < 0.001), male sex (OR, 1.41; 95% CI, 1.05‐1.90; P = 0.02), admission from home (OR, 0.77; 95% CI, 0.61‐0.98; P = 0.03), a history of cerebrovascular disease (OR, 1.41; 95% CI, 1.08‐1.83; P = 0.01), myocardial infarction (OR, 1.41; 95% CI, 1.07‐1.86; P = 0.02), angina (OR, 1.32; 95% CI, 1.03‐1.69; P = 0.03), congestive heart failure (OR, 1.45; 95% CI, 1.11‐1.89; P = 0.006), dementia (OR, 1.39; 95% CI, 1.08‐1.78; P = 0.01), peripheral vascular disease (OR, 1.47; 95% CI, 1.06‐2.03; P = 0.02), COPD/asthma (OR, 1.56; 95% CI, 1.18‐2.08; P = 0.002), osteoarthritis (OR, 1.29; 95% CI, 1.01‐1.65; P = 0.04), code status as Do Not Resuscitate (OR, 0.74; 95% CI, 0.58‐0.94; P = 0.015), or ASA class III‐V (OR, 2.24; 95% CI, 1.53‐3.29; P < 0.001). Results were no different after using the Charlson comorbidity index in place of ASA class (data not shown). No significant differences in overall noncardiac complications were observed when examining BMI as a continuous variable, as a categorical variable, as 25 kg/m2 vs. <25 kg/m2, or as 18.5 kg/m2 to 24.9 kg/m2 vs. all others. Examining renal, respiratory, peripheral vascular, or neurologic complications univariately within these aforementioned strata also did not demonstrate any significant differences among BMI categories (data not shown).
Multivariable analyses (Models 1‐4) are shown for any overall noncardiac inpatient medical complication in Table 4. BMI was not a significant predictor in any of our models, specifically in our main model that examined the effect of BMI adjusting for a priori variables (Model 2). However, older age, male sex, and ASA class were highly significant predictors of complications in all four models; however, surgical year was nonsignificant. Notably, after stepwise selection for other demographic and premorbid variables, a history of COPD or asthma was found to be an additional significant factor both in Model 3 (forcing BMI in the model) and Model 4 (without BMI in the model). Exploratory analysis of individual predictors of inpatient noncardiac complications within each BMI category demonstrated that, in underweight patients, admission use of ‐blockers was a significant predictor of having any medical complication (OR, 3.1; 95% CI, 1.1‐8.60; P = 0.03). In normal BMI patients, age 75 years (OR, 2.6; 95% CI, 1.4‐4.9; P = 0.003), ASA class III‐V (OR, 2.3; 95% CI, 1.3‐3.9; P = 0.003), and a history of cerebrovascular disease (OR, 1.5; 95%CI, 1.04‐2.1; P = 0.03) were predictors; and, in obese patients, only age (OR, 1.1; 95% CI, 1.00‐1.12; P = 0.05) was significant. There were no significant predictors of having a medical complication in the overweight group.
| Underweight <18.5 kg/m2 n = 184* n (%) | Normal 18.5‐24.9 kg/m2 n = 640* n (%) | Overweight 25‐29.9 kg/m2 n = 251* n (%) | Obese 30 kg/m2 n = 105* n (%) | Age | Male Sex | Surgical Year | ASA Score, III‐V vs. I/II | COPD/ Asthma | |
|---|---|---|---|---|---|---|---|---|---|
| |||||||||
| Model 1a | 1.25 (0.89‐1.74) | Referent | 0.97 (0.72‐1.31) | 1.16 (0.76‐1.76) | |||||
| Model 1b | 1.26 (0.90‐1.77) | Referent | 1.05 (0.77‐1.43) | 1.38 (0.90‐2.13) | 1.04 (1.02‐1.06) | ||||
| Model 1c | 1.30 (0.93‐1.83) | Referent | 0.93 (0.68‐1.26) | 1.12 (0.73‐1.71) | 1.47 (1.09‐1.98) | ||||
| Model 1d | 1.28 (0.91‐1.79) | Referent | 0.97 (0.71‐1.31) | 1.13 (0.74‐1.73) | 1.03 (1.00‐1.06) | ||||
| Model 1e | 1.23 (0.88‐1.72) | Referent | 1.00 (0.73‐1.36) | 1.13 (0.74‐1.73) | 2.22 (1.52‐3.24) | ||||
| Model 2 | 1.33 (0.95‐1.88) | Referent | 1.01 (0.74‐1.38) | 1.28 (0.82‐1.98) | 1.04 (1.02‐1.06) | 1.59 (1.17‐2.17) | 1.02 (0.99‐1.05) | 1.89 (1.28‐2.79) | |
| Model 3∥ | 1.30 (0.92‐1.84) | Referent | 1.04 (0.76‐1.42) | 1.30 (0.84‐2.02) | 1.05 (1.03‐1.06) | 1.52 (1.11‐2.07) | 1.02 (0.99‐1.05) | 1.77 (1.20‐2.62) | 1.58 (1.17‐2.12) |
| Model 4 | 1.05 (1.03‐1.06) | 1.49 (1.10‐2.02) | 1.84 (1.25‐2.71) | 1.58 (1.18‐2.12) | |||||
Discussion
Most research describing the association of BMI with postoperative outcomes has concentrated on cardiac surgery, general surgical procedures, and intensive care unit utilization.8‐11,20 In the orthopedic literature, an elevated BMI has been associated with a higher number of short‐term complications, but this was limited to elective knee arthroplasty and spine surgery populations.12,13,21 Conversely, no differences were observed in obese patients undergoing hip arthroplasties.14,22 To the best of our knowledge, this study may be the first to examine the impact of BMI on inpatient hospital outcomes following urgent hip fracture repair. Our results suggest the risk of developing a noncardiac medical complication is the same regardless of BMI.
Our overall complication rate was higher (38%) than previous reports by others.19,23‐26 Thus, Lawrence et al.,19 in their retrospective study of 20 facilities, demonstrated an overall complication rate of 17%, even though they also included postoperative cardiac complications. Although their study period overlapped our own (1982‐1993), they additionally included patients aged 60 to 65 years, a population known to have fewer comorbidities and fewer postoperative complications than the elderly hip‐fracture patients studied here. In addition, their population may have been healthier at baseline, in that a higher proportion lived at home (73%) and a lower percentage were ASA class III‐V (71%) than our cohort. These differences in baseline characteristics may explain the higher complication rates observed in our study.
Our findings did not suggest any relationship of BMI with noncardiac postoperative medical complications in any of the 4 methods we used to stratify BMI (continuous, categorical, normal vs. abnormal, and 25 kg/m2). Evidence is contradictory as to what the effect of BMI has on postoperative complications. An elevated BMI (30 kg/m2) has been shown to lead to increased sternal wound infection and saphenous vein harvest infection in a cardiac surgery population,27 but other studies10,28,29 have demonstrated the opposite effect. Among 6336 patients undergoing elective general surgery procedures, the incidence of complications were similar by body mass.30 A matched study design that included urgent and emergent surgeries also did not find any appreciable increased perioperative risk in noncardiac surgery.28 Whether this may be due to the elective nature of the surgeries in these studies, hence leading to selection bias, is unknown.
In geriatric patients, multiple baseline comorbid conditions often are reflected in a higher ASA class, which increases the risk of significant perioperative complications. Our multivariate modeling showed that a high ASA class strongly predicts morbidity and mortality following hip fracture repair, in line with other studies.19,31,32 Although the Charlson comorbidity index could alternatively been used, we elected to adjust for ASA class as it is more commonly used and is simple to use. Interestingly, surgical year did not significantly predict any complication, which can suggest that practice changes play a minimal impact on patient outcomes. However, we caution that because the individual event rates, particularly vascular, were low, we were unable to fully determine whether changes in practice management, such as improved thromboprophylaxis, would impact event rates over time. Finally, other predictors such as older age33 and a concomitant history of either COPD or asthma,34 are well‐accepted predictors of inpatient complications. Our attempt to examine specific predictors of complications in each BMI category revealed differing results, making interpretations difficult. Because of power considerations, this was meant solely as an exploratory analysis, and larger cohorts are needed to further ascertain whether predictors are different in these groups. Such a study may in fact identify perioperative issues that allow practitioners caring for this population to modify these factors.
One of the major limitations in our study was our inability to adjust for individual complications using multivariable models, such as deep vein thrombosis or delirium, within each BMI stratum, because of statistical power issues. Such a study would require large numbers of individual complications or events to allow for appropriate adjustments. The authors acknowledge that such individual complication rates may vary dramatically. We were aware of this potential problem, and therefore a priori ascertained a composite outcome of any noncardiac medical complication. However, our results do provide preliminary information regarding the impact of BMI on noncardiac medical complications. Further studies would be needed, though, to fully determine the effect of BMI on the number of cases with each complication.
Obesity (or BMI) is a known cardiovascular risk factor, and our previous study's aim was to determine cardiovascular events in a comparable manner to the way risk indices, such as the Goldman, Lee, or the AHA preoperative algorithm function. The surgical literature often presents noncardiac complications separately, allowing us to directly compare our own data to other published studies. We used 2 separate approaches, focusing on the inpatient stay (ascertaining noncardiac complications) and 1‐year cardiac outcomes (cardiac complications), as these are mediated by different mechanisms and factors. Furthermore, the intent of both studies was to dispel any concerns that an elevated BMI would in fact lead to an increased number of complications. Whether cardiac complications, though, would impact noncardiac complications, or vice‐versa, is unknown, and would require further investigation.
Although we relied on well‐established definitions for body mass, they have often been challenged, as they may underestimate adiposity in the elderly population due to age‐related reductions in lean mass.35,36 Studies have demonstrated a poor correlation between percent body fat and BMI in the >65 year age group,37 which could impact our results and outcomes by misclassifying patients. Yet, as an anthropometric measurement, BMI is easily obtainable and its variables are routinely documented in patients' medical records, as compared to other anthropometric measurements. Other means of estimating adiposity, such as densitometry or computed tomography (CT) scanning, are impractical, expensive, and not used clinically but routinely in research settings. The lack of standardization in obtaining height and weight, despite nurse‐initiated protocols for bed calibration, may have introduced a degree of measurement bias. Furthermore, the extent of lean mass lost and volume status changes lead to further challenges of using BMI in hospital settings. Whether other anthropometric measurements, including hip circumference, waist circumference, or waist‐hip ratio, should be used in this group of patients requires further examination. However, despite its shortcomings in elderly patients, BMI is still deemed an appropriate surrogate for obesity.
Our main strength was the use of the Rochester Epidemiology Project medical record linkage system to ascertain all patient data. This focuses on patients from a single geographically‐defined community minimizing referral biases often observed in studies originating from a tertiary care referral center. Previous disease‐related epidemiology studies using the Olmsted County population have demonstrated excellent external validity to the U.S. white population.16 We relied on the medical documentation of the treating clinician for many diagnoses in our data abstraction. Although we attempted to use standardized definitions, clinicians may have inadvertently forgotten to document subjective signs or symptoms that would assist in the categorization of these complications. Hence, added inpatient complications may have been overlooked, suggesting that our results may slightly underestimate the true incidence in this population. Additionally, certain complications may overlap categories, such as pneumonia and infections. We agree with Lawrence et al.19 that long periods of time are necessary to accumulate data of this kind in an effort to describe complication rates epidemiologically.
Despite no difference in outcomes among BMI categories, our results have striking implications for the hospitalized patient. Thus, underweight elderly patients, often considered frail with minimal functional reserve, are at no higher risk for developing inpatient medical complications than patients with higher BMIs. This is contrary to our study focusing on cardiac complications, where underweight patients were at higher risk.15 Conversely, obese patients, who have been demonstrated to be at higher risk of medical complications (particularly pulmonary), had no greater risk than patients with normal BMI. To the practicing geriatrician and hospitalist, this information provides important prognostication regarding additional perioperative measures that need to be implemented in these different groups. Based on our results, BMI does not play a particular role in noncardiac medical complications, dispelling any myths of the added burden of excess weight on surgical outcomes in this population. From a hospital perspective, this may be important since additional testing or preventative management in these patients may lead to additional resource use. However, in‐hospital deaths were higher in underweight patients than in patients with a normal BMI. Although we were underpowered to detect any differences in mortality between groups and could therefore not adjust for additional variables, it is unknown whether cardiac or noncardiac complications may be a stronger predictor of death in the underweight patient population. Further studies would be needed to better ascertain this relationship.
Conclusions
In elderly patients undergoing urgent hip fracture repair, BMI does not appear to lead to an excess rate of inpatient noncardiac complications. Our results are the first to demonstrate that BMI has no impact on morbidity in this patient population. Further research on the influence of body composition on inpatient complications in this population is needed to accurately allow for appropriate perioperative prophylaxis. Whether BMI impacts specific complications or in‐patient mortality in this population still requires investigation.
Acknowledgements
The authors thank Donna K. Lawson, LPN, Kathy Wolfert, and Cherie Dolliver, for their assistance in data collection and management.
- , .The effect of longevity on spending for acute and long‐term care.N Engl J Med.2000;342(19):1409–1415.
- , , , .Excess deaths associated with underweight, overweight, and obesity.JAMA.2005;293(15):1861–1867.
- .Adverse outcomes of osteoporotic fractures in the general population.J Bone Miner Res.2003;18(6):1139–1141.
- , , , , , .Incidence and economic burden of osteoporosis‐related fractures in the United States, 2005–2025.J Bone Miner Res.2007;22(3):465–475.
- , .Medical care of elderly patients with hip fractures.Mayo Clin Proc.2001;76(3):295–298.
- , , , et al.Effects of a hospitalist model on elderly patients with hip fracture.Arch Intern Med.2005;165(7):796–801.
- , , , et al.Body mass index as a predictor of fracture risk: a meta‐analysis.Osteoporos Int.2005;16(11):1330–1338.
- , , , , .Increased body mass index predicts increased blood loss during radical cystectomy.J Urol.2004;171(3):1077–1079.
- , , , .Laparoscopic colorectal surgery in obese and nonobese patients: do differences in body mass indices lead to different outcomes?Surg Endosc.2004;18(10):1452–1456.
- , , , , , .The relationship of body mass index to outcomes after percutaneous coronary intervention.J Interv Cardiol.2006;19(5):388–395.
- , , , , , .Is extreme obesity a risk factor for cardiac surgery? An analysis of patients with a BMI ≥40.Eur J Cardiothorac Surg.2006;29(4):434–440.
- , , , , , .Perioperative morbidity following total knee arthroplasty among obese patients.J Knee Surg.2002;15(2):77–83.
- , , , et al.Obesity and spine surgery: relation to perioperative complications.J Neurosurg Spine.2007;6(4):291–297.
- , , , .The influence of obesity on perioperative morbidity and mortality in revision total hip arthroplasty.Arch Orthop Trauma Surg.2000;120(5–6):267–271.
- , , , et al.Body mass index and risk of adverse cardiac events in elderly hip fracture patients: a population‐based study.J Am Geriatr Soc.2009;57(3):419–426.
- .History of the Rochester Epidemiology Project.Mayo Clin Proc.1996;71(3):266–274.
- .The threat to medical‐records research.N Engl J Med.1997;337(20):1466–170.
- .A Treatise on Man and the Development of His Faculties.Brussels:Musquardt;1871.
- , , , , .Medical complications and outcomes after hip fracture repair.Arch Intern Med.2002;162(18):2053–2057.
- , , .Effect of obesity on intensive care morbidity and mortality: a meta‐analysis.Crit Care Med.2008;36(1):151–158.
- , .Relationship of body mass index to early complications in knee replacement surgery.Arch Orthop Trauma Surg.2008;128(1):5–9.
- , , , , , .Obesity in total hip replacement.J Bone Joint Surg Br.2008;90(4):424–429.
- , , , et al.Use of an intramedullary hip‐screw compared with a compression hip‐screw with a plate for intertrochanteric femoral fractures. A prospective, randomized study of one hundred patients.J Bone Joint Surg Am.1998;80(5):618–630.
- .Blood transfusion requirements in intracapsular femoral neck fractures.Injury.1996;27(10):709–711.
- , , , .Risk prediction in operatively treated fractures of the hip.Clin Orthop Relat Res.1993(293):148–152.
- .Internal fixation or arthroplasty for displaced subcapital fractures in the elderly?Injury.1992;23(8):521–524.
- , , , et al.Impact of body mass index and albumin on morbidity and mortality after cardiac surgery.J Thorac Cardiovasc Surg.1999;118(5):866–873.
- , , , et al.Increased body mass index and peri‐operative risk in patients undergoing non‐cardiac surgery.Obes Surg.2004;14(2):275–281.
- , , , et al.Effects of body size on operative, intermediate, and long‐term outcomes after coronary artery bypass operation.Ann Thorac Surg.2001;71(2):521–530; discussion 530–531.
- , , , .Obesity in general elective surgery.Lancet.2003;361(9374):2032–2035.
- , , , et al.Effects of a hospitalist care model on mortality of elderly patients with hip fractures.J Hosp Med.2007;2(4):219–225.
- , , , .Morbidity and mortality after hip fracture: the impact of operative delay.Arch Orthop Trauma Surg.2004;124(5):334–340.
- , , , , .Outcome after hip fracture in individuals ninety years of age and older.J Orthop Trauma.2001;15(1):34–39.
- , , , et al.Development and initial validation of a risk score for predicting in‐hospital and 1‐year mortality in patients with hip fractures.J Bone Miner Res.2005;20(3):494–500.
- , , , , , .How useful is body mass index for comparison of body fatness across age, sex, and ethnic groups?Am J Epidemiol.1996;143(3):228–239.
- , , , , .Reassessment of body mass indices.Am J Clin Nutr.1990;52(3):405–408.
- , , , et al.Accuracy of body mass index in diagnosing obesity in the adult general population.Int J Obes (Lond).2008;32(6):959–966.
- , , , , , .Clarifying confusion: the confusion assessment method. A new method for detection of delirium.Ann Intern Med.1990;113(12):941–948.
Public health concerns such as the aging population1 and the increasing prevalence of obesity2 are also important issues to hospitals. However, little attention has been given to the interface of obesity and the elderly, largely due to the dearth of studies that include elderly patients. An aging population leads to an increase in geriatric syndromes, such as osteoporosis3 and its most devastating complication, hip fracture.4 These frail, hip‐fracture patients pose management challenges to practicing geriatricians and hospitalists.5,6 Furthermore, although fracture risk is inversely correlated to body mass index (BMI),7 this relationship has yet to be fully examined in the postoperative hip‐fracture population. In other surgical settings, there is disagreement as to whether underweight or obese patients are at higher risk of developing medical complications,8‐11 but for orthopedic patients, data have been limited to elective orthopedic populations.12‐14 We previously demonstrated that underweight hip‐fracture patients are at higher risk of postoperative cardiac complications at 1 year,15 consistent with studies of cardiac risk indices determining long‐term events. Because of different pathophysiologic mechanisms, the purpose of this study was to ascertain the influence of BMI on inpatient postoperative noncardiac medical complications and to assess predictors of such complications following urgent hip fracture repair.
Patients and Methods
All Olmsted County, Minnesota, residents undergoing urgent hip repair due to fracture were identified using the Rochester Epidemiology Project, a medical‐record linkage system funded by the Federal government since 1966 to support disease‐related epidemiology studies.16 All patient medical care is indexed, and both inpatient and outpatient visits are captured and available for review, allowing for complete case ascertainment. Medical care in Olmsted County is primarily provided by Mayo Clinic with its affiliated hospitals (St. Mary's and Rochester Methodist) and the Olmsted Medical Center, in addition to a few individual providers. Over 95% of all Olmsted County hip fracture surgeries are ultimately managed at St. Mary's Hospital.
Following approval by the Institutional Review Board we used this unique data resource to identify all residents with an International Classification of Diseases, 9th edition (ICD‐9) diagnosis code of 820 to 829 for hip fracture (n = 1310). Both sexes were included, and all patients included in the study provided research authorization for use of their medical records for research purposes.17 We excluded patients who were managed conservatively (n = 56), had a pathological fracture (n = 20), had multiple injuries (n = 19), were operated on >72 hours after fracture (n = 5), were aged <65 years (n = 2), or were admitted for reasons other than a fracture and experienced an in‐hospital fracture (n = 3). We subsequently excluded patients with missing information (n = 10). World Health Organization (WHO) criteria were used for classifying BMI: underweight (BMI < 18.5); normal (BMI = 18.5‐24.9); overweight (BMI = 25.0‐29.9); and obese (BMI 30.0).18
All data were abstracted using standardized collection forms by trained nurse abstractors blinded to the study hypothesis. Patients' admission height and weight were documented; if unavailable, the nearest data within 2 months prior to surgery were recorded. Patients' preadmission residence, functional status, baseline comorbidities, admission medications, discharge destination, as well as whether patients had an intensive care unit stay or any major surgeries in the past 90 days were abstracted. In addition, American Society of Anesthesia (ASA) class, type of anesthesia, and length of stay were also obtained. Inpatient complications that had been identified by the treating physicians and documented in the medical record or identified on imaging studies were assessed from the time of hip fracture repair to the time of discharge using standardized clinical criteria (Table 1). For criteria that were based on either objective findings or clinical documentation/suspicion, the patient was considered to meet the criteria of having a complication if they fulfilled either one. We did not include any cardiac outcomes, including congestive heart failure, angina, myocardial infarction, or arrhythmias that had been previously reported.15 Noncardiac complications were classified broadly: respiratory (respiratory failure, respiratory depression, or pulmonary hypoxemia); neurologic (any cerebral event including hemorrhagic or ischemic stroke, transient ischemic attack, or delirium); gastrointestinal (ileus or gastrointestinal bleeding); vascular (pulmonary embolus, or deep vein thrombosis); infectious (pneumonia, sepsis, urinary tract, wound, or cellulitis); renal/metabolic (acute renal failure, dehydration, or electrolyte abnormalities); or other (fractures or falls).
| Definition | Symptom |
|---|---|
| |
| Gastrointestinal | |
| Ileus | Dilated loops of bowel on X‐ray; documented ileus with nausea, vomiting, no stool or inability to take oral intake |
| Gastrointestinal bleeding | Sudden appearance of frank blood on nasogastric lavage or by rectum AND a decrease in hemoglobin of 2 g/dL or greater with no other suspected source of ongoing blood loss |
| Infectious | |
| Pneumonia | New infiltrate on chest x‐ray plus 2 of the following 3 findings: temperature >38C, elevated white cell count, sputum pathogen that requires antibiotic treatment |
| Bacteremia/sepsis | Localized infection with positive blood culture for the same pathogen AND chills, rigors, fever, elevated white cell count AND intravenous antibiotic treatment |
| Urinary tract infection | Pyuria symptoms |
| Positive gram stain symptoms | |
| Wound | |
| Cellulitis | As documented in physician's note of a superficial skin infection |
| Neurologic | |
| Cerebral eventhypoxia, thrombosis or hemorrhage | New neurologic dysfunction (hemiplegia, hemianesthesia, hemianopia, aphasia, or unconsciousness) postoperatively |
| Transient ischemic attack | Any neurologic dysfunction resolving within a 24‐hour period |
| Delirium | Positive Confusion Assessment Method38 |
| Renal/metabolic | |
| Renal failure | A doubling of baseline value of creatinine; serum creatinine >3.0 mg/dL; acute need for dialysis |
| Dehydration | As documented in the physician's note |
| Electrolyte abnormalities | Any laboratory evidence of abnormal electrolytes compared to normal |
| Respiratory | |
| Respiratory failure | Need for intubation and ventilation >24 hours postoperatively; need for reintubation and ventilation after 1 hour postoperatively |
| Respiratory depression | Respiratory arrest; PaCO2 >60 mmHg that provider believed was associated with narcotics |
| Pulmonary hypoxemia | SaO2 <90% with or without supplemental oxygen; supplemental oxygen >24 hours |
| Vascular | |
| Deep vein thrombosis | Positive lower extremity venous Doppler |
| Pulmonary embolism | Acute onset dyspnea and tachycardia, increased central venous pressure AND (positive ventilation/perfusion scan OR positive computed tomography OR positive pulmonary angiogram) |
| Other | |
| Fractures | Any in‐hospital documented fracture of any bone |
| Falls | Patients descending to the ground from any position unintentionally |
Continuous data are presented as means standard deviation and categorical data as counts and percentages. In testing for differences in patient demographics, past medical history, and baseline clinical data among BMI groups, Kruskal‐Wallis tests were performed for continuous variables and Fisher's Exact or Cochran‐Mantel‐Haenszel tests were used for discrete variables. Bonferroni adjustments were performed where appropriate. The primary outcome was the risk of any noncardiac medical complication during the postoperative hospitalization, based on patients with complications. Incidence rates were calculated for the overall group as well as for each BMI category. BMI was evaluated categorically according to the WHO criteria, as a continuous variable dichotomized as a BMI 18.5 kg/m2 to 24.9 kg/m2 (normal) vs. all others, and above/below 25.0 kg/m2. The effect of BMI and other potential risk factors on the complication rate was evaluated using logistic regression. The effect of BMI category on the overall complication rate was adjusted for the a priori risk factors of age, sex, surgical year, and ASA class both univariately (Model 1) and multivariately (Model 2). In addition to these variables, we also evaluated other potential risk factors, including baseline demographic and baseline clinical variables that were significant (P < 0.05) univariately using a stepwise selection; first forcing in BMI as a categorical variable (Model 3), then repeating the stepwise selection process without forcing in BMI (Model 4). Using data from Lawrence et al.,19 we estimated that we would have 80% power to detect differences in rates of inpatient noncardiac complications equal to an odds ratio (OR) = 2.2 (normal vs. underweight), OR = 2.0 (normal vs. overweight), and OR = 2.4 (normal vs. obese). Finally, because of power considerations, as an exploratory analysis, we additionally identified predictors of inpatient complications within each BMI category using stepwise selection. All statistical tests were 2‐sided, and P values <0.05 were considered significant. All analyses were performed using SAS for UNIX (version 9.1.3; SAS Institute, Inc., Cary, NC).
Results
Between 1988 and 2002, 1195 urgent repairs for hip fracture met our inclusion/exclusion criteria. We subsequently excluded 15 repairs with missing BMI data, and, of the 7 patients with >1 repair, we included only their first fracture episode in our analysis. Two were subsequently excluded due to an administrative error. Ultimately, 1180 hip fracture repairs were included in the analysis cohort. There were 184 (15.6%) patients in the underweight group, 640 (54.2%) with normal BMI, 251 (21.3%) with a BMI 25.0 to 29.9 kg/m2, and 105 (8.9%) with a BMI 30 kg/m2. Baseline characteristics are otherwise shown in Table 2. Normal BMI patients were significantly older than the other groups, and underweight patients were less likely to be admitted from home. Past history of having a cardiovascular risk factor or a cardiovascular diagnosis appeared to increase with increasing BMI. Underweight patients were more likely to have chronic obstructive pulmonary disease (COPD) than patients with normal BMI (P = 0.03) or overweight patients (P = 0.009), but not more than obese patients (P = 0.21). There were no differences across BMI groups in ASA class, type of anesthesia, intensive care unit stay, or length of stay.
| Variable | Underweight (<18.5 kg/m2) n = 184 n (%) | Normal (18.5‐24.9 kg/m2) n = 640 n (%) | Overweight (25‐29.9 kg/m2) n = 251 n (%) | Obese (30 kg/m2) n = 105 n (%) | P Value* |
|---|---|---|---|---|---|
| |||||
| Age (years) | 84.8 8.0 | 85.0 7.2 | 83.1 7.3 | 80.7 7.4 | <0.001 |
| Female sex | 171 (92.9) | 525 (82) | 177 (70.5) | 76 (72.4) | <0.001 |
| Preadmission residence | |||||
| ALC/SNF | 79 (42.9) | 250 (39.1) | 83 (33.1) | 36 (34.3) | 0.024 |
| Home | 105 (57.1) | 390 (60.9) | 168 (66.9) | 69 (65.7) | |
| Functional status | |||||
| Dependent | 25 (13.6) | 80 (12.5) | 24 (9.6) | 7 (6.7) | 0.044 |
| Walking independently | 159 (86.4) | 560 (87.5) | 226 (90.4) | 97 (93.3) | |
| History of | |||||
| Hypertension | 84 (45.7) | 374 (58.4) | 159 (63.3) | 70 (66.7) | <0.001 |
| Diabetes | 9 (4.9) | 71 (11.1) | 30 (12) | 30 (28.6) | <0.001 |
| Cerebrovascular disease | 40 (21.7) | 175 (27.3) | 77 (30.7) | 33 (31.4) | 0.028 |
| Myocardial infarction | 44 (23.9) | 140 (21.9) | 61 (24.3) | 36 (34.3) | 0.106 |
| Congestive heart failure | 48 (26.1) | 150 (23.4) | 76 (30.3) | 44 (41.9) | 0.003 |
| Atrial fibrillation/flutter | 49 (26.6) | 118 (18.4) | 57 (22.7) | 26 (24.8) | 0.985 |
| Chronic renal insufficiency | 11 (6) | 64 (10) | 34 (13.5) | 20 (19) | <0.001 |
| Dementia | 63 (34.2) | 233 (36.4) | 74 (29.5) | 26 (24.8) | 0.031 |
| Obstructive sleep apnea | 2 (1.1) | 5 (0.8) | 5 (2.0) | 6 (5.7) | 0.005 |
| COPD | 41 (22.3) | 100 (15.6) | 32 (12.7) | 17 (16.2) | 0.032 |
| Asthma | 13 (7.1) | 47 (7.3) | 18 (7.2) | 12 (11.4) | 0.395 |
| COPD or asthma | 49 (26.6) | 133 (20.8) | 45 (17.9) | 23 (21.9) | 0.093 |
| Pulmonary embolism or deep vein thrombosis | 9 (4.9) | 21 (3.3) | 21 (8.4) | 17 (16.2) | <0.001 |
| Osteoporosis | 77 (41.8) | 253 (39.5) | 73 (29.1) | 31 (29.5) | <0.001 |
| Collagen vascular diseases | 10 (5.4) | 29 (4.5) | 9 (3.6) | 12 (11.4) | 0.34 |
| Cancer | 61 (33.2) | 169 (26.4) | 75 (29.9) | 32 (30.5) | 0.88 |
| Lymphoma | 2 (1.1) | 3 (0.5) | 2 (0.8) | 2 (1.9) | 0.25 |
| Leukemia | 2 (1.1) | 3 (0.5) | 1 (0.4) | 1 (1) | |
| Major surgery within 90 days | 3 (1.6) | 10 (1.6) | 8 (3.2) | 3 (2.9) | 0.366 |
| ASA class | |||||
| I or II | 19 (10.4) | 93 (14.5) | 46 (18.3) | 12 (11.4) | 0.144 |
| III, IV, or V | 164 (89.6) | 547 (85.5) | 205 (81.7) | 93 (88.6) | |
| Type of anesthesia | |||||
| General | 134 (72.8) | 477 (74.5) | 192 (76.5) | 84 (80) | |
| Other (spinal, epidural, local, combination) | 50 (27.2) | 163 (25.5) | 59 (23.5) | 21 (20) | 0.16 |
| Admission medications | |||||
| Insulin | 2 (1.1) | 18 (2.8) | 11 (4.4) | 17 (16.2) | <0.001 |
| Aspirin | 50 (27.2) | 197 (30.8) | 82 (32.7) | 37 (35.2) | 0.126 |
| Beta‐blockers | 18 (9.8) | 90 (14.1) | 50 (19.9) | 25 (23.8) | <0.001 |
| ACE/ARB | 32 (17.4) | 95 (14.8) | 55 (21.9) | 28 (26.7) | 0.009 |
| Calcium‐channel blocker | 26 (14.1) | 104 (16.3) | 39 (15.5) | 21 (20) | 0.38 |
| Intensive care unit stay | 63 (34.2) | 154 (24.1) | 61 (24.3) | 30 (28.6) | 0.16 |
| Length of stay, days | 10.3 (9.7) | 9.7 (6.8) | 10.2 (7.6) | 11.1 (8.6) | 0.10 |
| Discharge destination | |||||
| Home | 20 (10.9) | 65 (10.2) | 43 (17.1) | 19 (18.1) | |
| ALC/nursing home | 146 (79.8) | 547 (85.5) | 199 (79.3) | 83 (79) | <0.001 |
| In‐hospital death | 17 (9.3) | 28 (4.4) | 9 (3.6) | 3 (2.9) | |
There were 77 (41.8%) postoperative inpatient noncardiac complications in the underweight group, 234 (36.6%) in the normal BMI group, 90 (35.9%) in the overweight group, and 42 (40.0%) in the obese group (P = 0.49). Figure 1 demonstrates the main subcategory complication rates by BMI group, and Table 3 outlines the univariate unadjusted complication rates. Other than gastrointestinal complications being more prevalent as BMI increases (P = 0.005), there were no significant differences in crude complication rates across BMI categories (all P > 0.05) for the other complication subcategories. A multiple comparisons analysis did not demonstrate any differences between normal and any of the other BMI categories for ileus. Normal BMI patients were more likely to be discharged to a nursing facility than overweight or obese patients (85.5% vs. 79.3%, P = 0.03; and 85.5% vs. 79.0%, P = 0.03, respectively). The proportion of in‐hospital deaths among underweight patients was significantly higher than in any of the other groups (9.3% vs. 4.4%; P = 0.01), but mean length of stay was not significantly different.
| Overall Cohort n (%) | Underweight (<18.5 kg/m2) n = 184 n (%) | Normal (18.5‐24.9 kg/m2) n = 640 n (%) | Overweight (25‐29.9 kg/m2) n = 251 n (%) | Obese (30 kg/m2) n = 105 n (%) | P Value | |
|---|---|---|---|---|---|---|
| ||||||
| Gastrointestinal | ||||||
| Ileus | 38 (3.2) | 1 (0.5) | 21 (3.3) | 12 (4.8) | 4 (3.8) | 0.03 |
| Gastrointestinal bleeding | 21 (1.8) | 1 (0.5) | 11 (1.7) | 6 (2.4) | 3 (2.9) | 0.35 |
| Infectious | ||||||
| Pneumonia | 69 (5.8) | 12 (6.5) | 39 (6.1) | 14 (5.6) | 4 (3.8) | 0.51 |
| Bacteremia/sepsis | 8 (0.7) | 1 (0.5) | 2 (0.3) | 5 (2.0) | 0 (0) | 0.06 |
| Urinary tract infection | 84 (7.1) | 12 (6.5) | 47 (7.3) | 15 (6) | 10 (9.5) | 0.78 |
| Wound | ||||||
| Cellulitis | ||||||
| Neurological | ||||||
| Cerebral event‐hypoxia, thrombosis or hemorrhage | 15 (1.3) | 1 (0.5) | 6 (0.9) | 6 (2.4) | 2 (1.9) | 0.21 |
| Transient ischemic attack | ||||||
| Delirium | 199 (16.9) | 40 (21.7) | 106 (16.6) | 36 (14.3) | 17 (16.2) | 0.08 |
| Renal/metabolic | ||||||
| Renal failure | 19 (1.6) | 3 (1.6) | 9 (1.4) | 5 (2.0) | 2 (1.9) | 0.82 |
| Dehydration | ||||||
| Electrolyte abnormalities | ||||||
| Respiratory | ||||||
| Respiratory failure | 53 (4.5) | 10 (5.4) | 23 (3.6) | 15 (6.0) | 5 (4.8) | 0.61 |
| Respiratory depression | 23 (1.9) | 3 (1.6) | 11 (1.7) | 8 (3.2) | 1 (1.0) | 0.50 |
| Pulmonary hypoxemia | 157 (13.3) | 33 (17.9) | 78 (12.2) | 34 (13.5) | 12 (11.4) | 0.22 |
| Vascular | ||||||
| Deep vein thrombosis | 5 (0.4) | 0 (0) | 2 (0.3) | 3 (1.2) | 0 (0) | 0.24 |
| Pulmonary embolism | 16 (1.4) | 3 (1.6) | 7 (1.1) | 5 (2.0) | 1 (1.0) | 0.65 |
| Other | ||||||
| Fractures | 6 (0.5) | 1 (0.5) | 5 (0.8) | 0 (0) | 0 (0) | 0.57 |
| Falls | ||||||
Significant univariate predictors of the composite outcome of any noncardiac complication included: age (OR, 1.04 95% confidence interval [CI>], 1.02‐1.06; P < 0.001), age 75 years (OR, 2.25; 95% CI, 1.52‐3.33; P < 0.001), age 85 years (OR, 1.49; 95% CI, 1.17‐1.89; P < 0.001), male sex (OR, 1.41; 95% CI, 1.05‐1.90; P = 0.02), admission from home (OR, 0.77; 95% CI, 0.61‐0.98; P = 0.03), a history of cerebrovascular disease (OR, 1.41; 95% CI, 1.08‐1.83; P = 0.01), myocardial infarction (OR, 1.41; 95% CI, 1.07‐1.86; P = 0.02), angina (OR, 1.32; 95% CI, 1.03‐1.69; P = 0.03), congestive heart failure (OR, 1.45; 95% CI, 1.11‐1.89; P = 0.006), dementia (OR, 1.39; 95% CI, 1.08‐1.78; P = 0.01), peripheral vascular disease (OR, 1.47; 95% CI, 1.06‐2.03; P = 0.02), COPD/asthma (OR, 1.56; 95% CI, 1.18‐2.08; P = 0.002), osteoarthritis (OR, 1.29; 95% CI, 1.01‐1.65; P = 0.04), code status as Do Not Resuscitate (OR, 0.74; 95% CI, 0.58‐0.94; P = 0.015), or ASA class III‐V (OR, 2.24; 95% CI, 1.53‐3.29; P < 0.001). Results were no different after using the Charlson comorbidity index in place of ASA class (data not shown). No significant differences in overall noncardiac complications were observed when examining BMI as a continuous variable, as a categorical variable, as 25 kg/m2 vs. <25 kg/m2, or as 18.5 kg/m2 to 24.9 kg/m2 vs. all others. Examining renal, respiratory, peripheral vascular, or neurologic complications univariately within these aforementioned strata also did not demonstrate any significant differences among BMI categories (data not shown).
Multivariable analyses (Models 1‐4) are shown for any overall noncardiac inpatient medical complication in Table 4. BMI was not a significant predictor in any of our models, specifically in our main model that examined the effect of BMI adjusting for a priori variables (Model 2). However, older age, male sex, and ASA class were highly significant predictors of complications in all four models; however, surgical year was nonsignificant. Notably, after stepwise selection for other demographic and premorbid variables, a history of COPD or asthma was found to be an additional significant factor both in Model 3 (forcing BMI in the model) and Model 4 (without BMI in the model). Exploratory analysis of individual predictors of inpatient noncardiac complications within each BMI category demonstrated that, in underweight patients, admission use of ‐blockers was a significant predictor of having any medical complication (OR, 3.1; 95% CI, 1.1‐8.60; P = 0.03). In normal BMI patients, age 75 years (OR, 2.6; 95% CI, 1.4‐4.9; P = 0.003), ASA class III‐V (OR, 2.3; 95% CI, 1.3‐3.9; P = 0.003), and a history of cerebrovascular disease (OR, 1.5; 95%CI, 1.04‐2.1; P = 0.03) were predictors; and, in obese patients, only age (OR, 1.1; 95% CI, 1.00‐1.12; P = 0.05) was significant. There were no significant predictors of having a medical complication in the overweight group.
| Underweight <18.5 kg/m2 n = 184* n (%) | Normal 18.5‐24.9 kg/m2 n = 640* n (%) | Overweight 25‐29.9 kg/m2 n = 251* n (%) | Obese 30 kg/m2 n = 105* n (%) | Age | Male Sex | Surgical Year | ASA Score, III‐V vs. I/II | COPD/ Asthma | |
|---|---|---|---|---|---|---|---|---|---|
| |||||||||
| Model 1a | 1.25 (0.89‐1.74) | Referent | 0.97 (0.72‐1.31) | 1.16 (0.76‐1.76) | |||||
| Model 1b | 1.26 (0.90‐1.77) | Referent | 1.05 (0.77‐1.43) | 1.38 (0.90‐2.13) | 1.04 (1.02‐1.06) | ||||
| Model 1c | 1.30 (0.93‐1.83) | Referent | 0.93 (0.68‐1.26) | 1.12 (0.73‐1.71) | 1.47 (1.09‐1.98) | ||||
| Model 1d | 1.28 (0.91‐1.79) | Referent | 0.97 (0.71‐1.31) | 1.13 (0.74‐1.73) | 1.03 (1.00‐1.06) | ||||
| Model 1e | 1.23 (0.88‐1.72) | Referent | 1.00 (0.73‐1.36) | 1.13 (0.74‐1.73) | 2.22 (1.52‐3.24) | ||||
| Model 2 | 1.33 (0.95‐1.88) | Referent | 1.01 (0.74‐1.38) | 1.28 (0.82‐1.98) | 1.04 (1.02‐1.06) | 1.59 (1.17‐2.17) | 1.02 (0.99‐1.05) | 1.89 (1.28‐2.79) | |
| Model 3∥ | 1.30 (0.92‐1.84) | Referent | 1.04 (0.76‐1.42) | 1.30 (0.84‐2.02) | 1.05 (1.03‐1.06) | 1.52 (1.11‐2.07) | 1.02 (0.99‐1.05) | 1.77 (1.20‐2.62) | 1.58 (1.17‐2.12) |
| Model 4 | 1.05 (1.03‐1.06) | 1.49 (1.10‐2.02) | 1.84 (1.25‐2.71) | 1.58 (1.18‐2.12) | |||||
Discussion
Most research describing the association of BMI with postoperative outcomes has concentrated on cardiac surgery, general surgical procedures, and intensive care unit utilization.8‐11,20 In the orthopedic literature, an elevated BMI has been associated with a higher number of short‐term complications, but this was limited to elective knee arthroplasty and spine surgery populations.12,13,21 Conversely, no differences were observed in obese patients undergoing hip arthroplasties.14,22 To the best of our knowledge, this study may be the first to examine the impact of BMI on inpatient hospital outcomes following urgent hip fracture repair. Our results suggest the risk of developing a noncardiac medical complication is the same regardless of BMI.
Our overall complication rate was higher (38%) than previous reports by others.19,23‐26 Thus, Lawrence et al.,19 in their retrospective study of 20 facilities, demonstrated an overall complication rate of 17%, even though they also included postoperative cardiac complications. Although their study period overlapped our own (1982‐1993), they additionally included patients aged 60 to 65 years, a population known to have fewer comorbidities and fewer postoperative complications than the elderly hip‐fracture patients studied here. In addition, their population may have been healthier at baseline, in that a higher proportion lived at home (73%) and a lower percentage were ASA class III‐V (71%) than our cohort. These differences in baseline characteristics may explain the higher complication rates observed in our study.
Our findings did not suggest any relationship of BMI with noncardiac postoperative medical complications in any of the 4 methods we used to stratify BMI (continuous, categorical, normal vs. abnormal, and 25 kg/m2). Evidence is contradictory as to what the effect of BMI has on postoperative complications. An elevated BMI (30 kg/m2) has been shown to lead to increased sternal wound infection and saphenous vein harvest infection in a cardiac surgery population,27 but other studies10,28,29 have demonstrated the opposite effect. Among 6336 patients undergoing elective general surgery procedures, the incidence of complications were similar by body mass.30 A matched study design that included urgent and emergent surgeries also did not find any appreciable increased perioperative risk in noncardiac surgery.28 Whether this may be due to the elective nature of the surgeries in these studies, hence leading to selection bias, is unknown.
In geriatric patients, multiple baseline comorbid conditions often are reflected in a higher ASA class, which increases the risk of significant perioperative complications. Our multivariate modeling showed that a high ASA class strongly predicts morbidity and mortality following hip fracture repair, in line with other studies.19,31,32 Although the Charlson comorbidity index could alternatively been used, we elected to adjust for ASA class as it is more commonly used and is simple to use. Interestingly, surgical year did not significantly predict any complication, which can suggest that practice changes play a minimal impact on patient outcomes. However, we caution that because the individual event rates, particularly vascular, were low, we were unable to fully determine whether changes in practice management, such as improved thromboprophylaxis, would impact event rates over time. Finally, other predictors such as older age33 and a concomitant history of either COPD or asthma,34 are well‐accepted predictors of inpatient complications. Our attempt to examine specific predictors of complications in each BMI category revealed differing results, making interpretations difficult. Because of power considerations, this was meant solely as an exploratory analysis, and larger cohorts are needed to further ascertain whether predictors are different in these groups. Such a study may in fact identify perioperative issues that allow practitioners caring for this population to modify these factors.
One of the major limitations in our study was our inability to adjust for individual complications using multivariable models, such as deep vein thrombosis or delirium, within each BMI stratum, because of statistical power issues. Such a study would require large numbers of individual complications or events to allow for appropriate adjustments. The authors acknowledge that such individual complication rates may vary dramatically. We were aware of this potential problem, and therefore a priori ascertained a composite outcome of any noncardiac medical complication. However, our results do provide preliminary information regarding the impact of BMI on noncardiac medical complications. Further studies would be needed, though, to fully determine the effect of BMI on the number of cases with each complication.
Obesity (or BMI) is a known cardiovascular risk factor, and our previous study's aim was to determine cardiovascular events in a comparable manner to the way risk indices, such as the Goldman, Lee, or the AHA preoperative algorithm function. The surgical literature often presents noncardiac complications separately, allowing us to directly compare our own data to other published studies. We used 2 separate approaches, focusing on the inpatient stay (ascertaining noncardiac complications) and 1‐year cardiac outcomes (cardiac complications), as these are mediated by different mechanisms and factors. Furthermore, the intent of both studies was to dispel any concerns that an elevated BMI would in fact lead to an increased number of complications. Whether cardiac complications, though, would impact noncardiac complications, or vice‐versa, is unknown, and would require further investigation.
Although we relied on well‐established definitions for body mass, they have often been challenged, as they may underestimate adiposity in the elderly population due to age‐related reductions in lean mass.35,36 Studies have demonstrated a poor correlation between percent body fat and BMI in the >65 year age group,37 which could impact our results and outcomes by misclassifying patients. Yet, as an anthropometric measurement, BMI is easily obtainable and its variables are routinely documented in patients' medical records, as compared to other anthropometric measurements. Other means of estimating adiposity, such as densitometry or computed tomography (CT) scanning, are impractical, expensive, and not used clinically but routinely in research settings. The lack of standardization in obtaining height and weight, despite nurse‐initiated protocols for bed calibration, may have introduced a degree of measurement bias. Furthermore, the extent of lean mass lost and volume status changes lead to further challenges of using BMI in hospital settings. Whether other anthropometric measurements, including hip circumference, waist circumference, or waist‐hip ratio, should be used in this group of patients requires further examination. However, despite its shortcomings in elderly patients, BMI is still deemed an appropriate surrogate for obesity.
Our main strength was the use of the Rochester Epidemiology Project medical record linkage system to ascertain all patient data. This focuses on patients from a single geographically‐defined community minimizing referral biases often observed in studies originating from a tertiary care referral center. Previous disease‐related epidemiology studies using the Olmsted County population have demonstrated excellent external validity to the U.S. white population.16 We relied on the medical documentation of the treating clinician for many diagnoses in our data abstraction. Although we attempted to use standardized definitions, clinicians may have inadvertently forgotten to document subjective signs or symptoms that would assist in the categorization of these complications. Hence, added inpatient complications may have been overlooked, suggesting that our results may slightly underestimate the true incidence in this population. Additionally, certain complications may overlap categories, such as pneumonia and infections. We agree with Lawrence et al.19 that long periods of time are necessary to accumulate data of this kind in an effort to describe complication rates epidemiologically.
Despite no difference in outcomes among BMI categories, our results have striking implications for the hospitalized patient. Thus, underweight elderly patients, often considered frail with minimal functional reserve, are at no higher risk for developing inpatient medical complications than patients with higher BMIs. This is contrary to our study focusing on cardiac complications, where underweight patients were at higher risk.15 Conversely, obese patients, who have been demonstrated to be at higher risk of medical complications (particularly pulmonary), had no greater risk than patients with normal BMI. To the practicing geriatrician and hospitalist, this information provides important prognostication regarding additional perioperative measures that need to be implemented in these different groups. Based on our results, BMI does not play a particular role in noncardiac medical complications, dispelling any myths of the added burden of excess weight on surgical outcomes in this population. From a hospital perspective, this may be important since additional testing or preventative management in these patients may lead to additional resource use. However, in‐hospital deaths were higher in underweight patients than in patients with a normal BMI. Although we were underpowered to detect any differences in mortality between groups and could therefore not adjust for additional variables, it is unknown whether cardiac or noncardiac complications may be a stronger predictor of death in the underweight patient population. Further studies would be needed to better ascertain this relationship.
Conclusions
In elderly patients undergoing urgent hip fracture repair, BMI does not appear to lead to an excess rate of inpatient noncardiac complications. Our results are the first to demonstrate that BMI has no impact on morbidity in this patient population. Further research on the influence of body composition on inpatient complications in this population is needed to accurately allow for appropriate perioperative prophylaxis. Whether BMI impacts specific complications or in‐patient mortality in this population still requires investigation.
Acknowledgements
The authors thank Donna K. Lawson, LPN, Kathy Wolfert, and Cherie Dolliver, for their assistance in data collection and management.
- , .The effect of longevity on spending for acute and long‐term care.N Engl J Med.2000;342(19):1409–1415.
- , , , .Excess deaths associated with underweight, overweight, and obesity.JAMA.2005;293(15):1861–1867.
- .Adverse outcomes of osteoporotic fractures in the general population.J Bone Miner Res.2003;18(6):1139–1141.
- , , , , , .Incidence and economic burden of osteoporosis‐related fractures in the United States, 2005–2025.J Bone Miner Res.2007;22(3):465–475.
- , .Medical care of elderly patients with hip fractures.Mayo Clin Proc.2001;76(3):295–298.
- , , , et al.Effects of a hospitalist model on elderly patients with hip fracture.Arch Intern Med.2005;165(7):796–801.
- , , , et al.Body mass index as a predictor of fracture risk: a meta‐analysis.Osteoporos Int.2005;16(11):1330–1338.
- , , , , .Increased body mass index predicts increased blood loss during radical cystectomy.J Urol.2004;171(3):1077–1079.
- , , , .Laparoscopic colorectal surgery in obese and nonobese patients: do differences in body mass indices lead to different outcomes?Surg Endosc.2004;18(10):1452–1456.
- , , , , , .The relationship of body mass index to outcomes after percutaneous coronary intervention.J Interv Cardiol.2006;19(5):388–395.
- , , , , , .Is extreme obesity a risk factor for cardiac surgery? An analysis of patients with a BMI ≥40.Eur J Cardiothorac Surg.2006;29(4):434–440.
- , , , , , .Perioperative morbidity following total knee arthroplasty among obese patients.J Knee Surg.2002;15(2):77–83.
- , , , et al.Obesity and spine surgery: relation to perioperative complications.J Neurosurg Spine.2007;6(4):291–297.
- , , , .The influence of obesity on perioperative morbidity and mortality in revision total hip arthroplasty.Arch Orthop Trauma Surg.2000;120(5–6):267–271.
- , , , et al.Body mass index and risk of adverse cardiac events in elderly hip fracture patients: a population‐based study.J Am Geriatr Soc.2009;57(3):419–426.
- .History of the Rochester Epidemiology Project.Mayo Clin Proc.1996;71(3):266–274.
- .The threat to medical‐records research.N Engl J Med.1997;337(20):1466–170.
- .A Treatise on Man and the Development of His Faculties.Brussels:Musquardt;1871.
- , , , , .Medical complications and outcomes after hip fracture repair.Arch Intern Med.2002;162(18):2053–2057.
- , , .Effect of obesity on intensive care morbidity and mortality: a meta‐analysis.Crit Care Med.2008;36(1):151–158.
- , .Relationship of body mass index to early complications in knee replacement surgery.Arch Orthop Trauma Surg.2008;128(1):5–9.
- , , , , , .Obesity in total hip replacement.J Bone Joint Surg Br.2008;90(4):424–429.
- , , , et al.Use of an intramedullary hip‐screw compared with a compression hip‐screw with a plate for intertrochanteric femoral fractures. A prospective, randomized study of one hundred patients.J Bone Joint Surg Am.1998;80(5):618–630.
- .Blood transfusion requirements in intracapsular femoral neck fractures.Injury.1996;27(10):709–711.
- , , , .Risk prediction in operatively treated fractures of the hip.Clin Orthop Relat Res.1993(293):148–152.
- .Internal fixation or arthroplasty for displaced subcapital fractures in the elderly?Injury.1992;23(8):521–524.
- , , , et al.Impact of body mass index and albumin on morbidity and mortality after cardiac surgery.J Thorac Cardiovasc Surg.1999;118(5):866–873.
- , , , et al.Increased body mass index and peri‐operative risk in patients undergoing non‐cardiac surgery.Obes Surg.2004;14(2):275–281.
- , , , et al.Effects of body size on operative, intermediate, and long‐term outcomes after coronary artery bypass operation.Ann Thorac Surg.2001;71(2):521–530; discussion 530–531.
- , , , .Obesity in general elective surgery.Lancet.2003;361(9374):2032–2035.
- , , , et al.Effects of a hospitalist care model on mortality of elderly patients with hip fractures.J Hosp Med.2007;2(4):219–225.
- , , , .Morbidity and mortality after hip fracture: the impact of operative delay.Arch Orthop Trauma Surg.2004;124(5):334–340.
- , , , , .Outcome after hip fracture in individuals ninety years of age and older.J Orthop Trauma.2001;15(1):34–39.
- , , , et al.Development and initial validation of a risk score for predicting in‐hospital and 1‐year mortality in patients with hip fractures.J Bone Miner Res.2005;20(3):494–500.
- , , , , , .How useful is body mass index for comparison of body fatness across age, sex, and ethnic groups?Am J Epidemiol.1996;143(3):228–239.
- , , , , .Reassessment of body mass indices.Am J Clin Nutr.1990;52(3):405–408.
- , , , et al.Accuracy of body mass index in diagnosing obesity in the adult general population.Int J Obes (Lond).2008;32(6):959–966.
- , , , , , .Clarifying confusion: the confusion assessment method. A new method for detection of delirium.Ann Intern Med.1990;113(12):941–948.
Copyright © 2009 Society of Hospital Medicine
Jeanne M. Huddleston, Division of Hospital Internal Medicine, Mayo Clinic, 200 First Street SW, Rochester, MN 55905
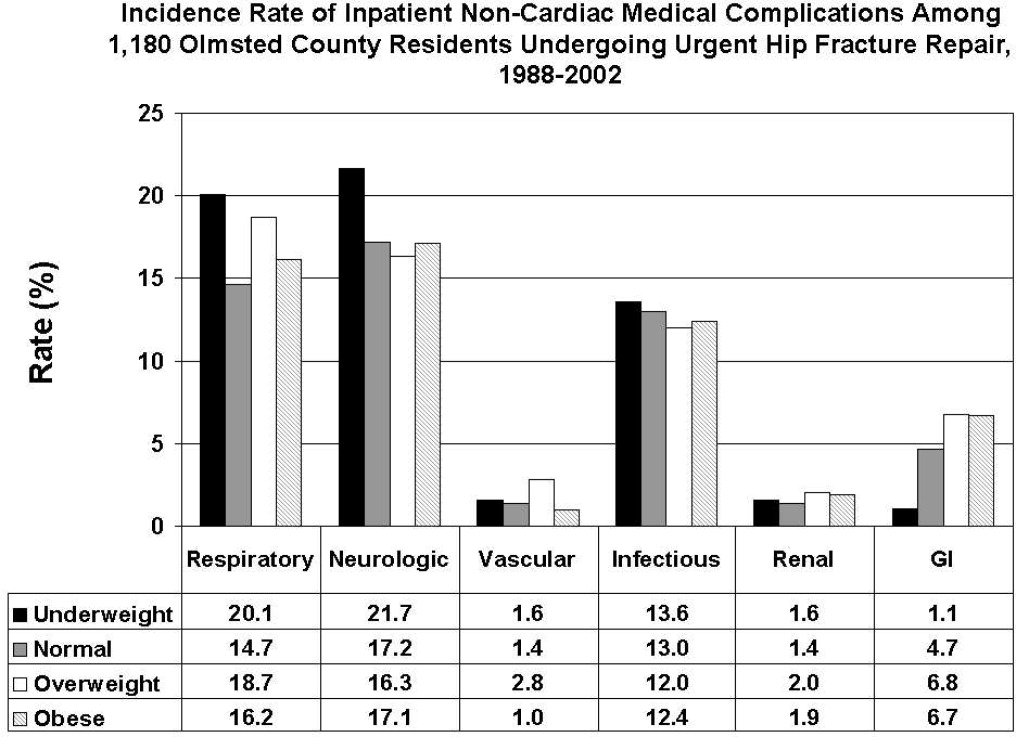
Ischemic Stroke After Hip Operation
In the United States, hip operations (internal fixation of fracture or total hip arthroplasty [THA]) are the most common noncardiac major surgical procedures performed in patients age 65 years and older (45.2 procedures per 100,000 persons per year).1 This number of procedures is projected to increase substantially in the coming decades.
Little is known about the clinical predictors of postoperative stroke in patients undergoing hip surgical procedures. Further, recent results of the Perioperative Ischemic Evaluation (POISE) trial have shown that measures taken to reduce cardiac complications postoperatively may adversely affect the risk of stroke.2 The POISE study showed decreases in myocardial infarction and coronary revascularization but accompanying increases in stroke and death with use of ‐blockers in patients undergoing noncardiac surgery.
Prevention of adverse events is one of the top priorities of the U.S. health care system today.35 Risk stratification and therapeutic optimization of underlying chronic diseases may be important in decreasing perioperative risk and improving postoperative outcomes.
Our objective was to determine the rate of postoperative ischemic stroke in all residents of Olmsted County, MN, who underwent hip operation between 1988 and 2002 and to identify clinical predictors of postoperative stroke.
Subjects and Methods
Olmsted County is one of the few places in the world where comprehensive population‐based studies of disease etiology and outcomes are feasible. This feasibility is due to the Rochester Epidemiology Project, a medical records linkage system that provides access to the records of all medical care in the community.1 All medical diagnoses made for a resident of Olmsted County are entered on a master sheet in the patient's medical record, which is then entered into a central computer index.
Hip operations were identified using the Surgical Information Recording System data warehouse, where detailed data are stored as International Classification of Diseases, 9th edition (ICD‐9) codes for all surgical procedures performed from January 1, 1988, forward. A total of 2028 THAs and hip fracture repairs (ICD‐9 codes 81.51, 81.52, 81.53, 79.15, and 79.25) performed between 1988 and 2002 in Olmsted County were identified. Of the hip procedures, 142 were excluded (Figure 1). The final analysis cohort contained 1886 hip operations1195 hip fracture repairs and 691 THAs.
The population‐based cohort was assembled and the data were abstracted from complete inpatient and outpatient records from admission for surgical treatment up to 1 year after surgery. Only those patients who had given prior authorization for research were included in the study cohort. The Mayo Clinic Institutional Review Board approved the study.
Case Ascertainment
We used several screening procedures to completely enumerate all postoperative strokes in our study population (Figure 1). The Mayo Clinic administrative database was used to identify all cases with relevant cerebrovascular disease (ICD‐9 codes 430.0‐437.9, 368.12, 781.4, and 784.3) within 1 year after hip operation. The Rochester Stroke Registry identified incident cases of ischemic stroke in Olmsted County from 1988 through 1994. The clinic's administrative database was also used to identify brain imaging studies (brain computed tomography, magnetic resonance imaging, or carotid ultrasonography) between the day of the procedure and 1 year postoperatively. A neurologist reviewed each image and the associated medical record identified during the screening process in detail for the constellation of signs and symptoms consistent with the diagnosis of stroke. Death certificates and autopsy reports were also reviewed to identify persons with the diagnosis of stroke. The outcome (stroke) was masked to the nurse abstractor who reviewed charts for predictors of postoperative stroke (eg, atrial fibrillation, coronary artery disease [CAD], history of stroke, medication use). The exposed or unexposed status of the patients to the predictors of stroke was masked to the physician (A.S.P.) who screened electronic medical records for the outcome measure (stroke).
Cerebral infarction or ischemic stroke was defined as the acute onset of a neurologic deficit that persisted for longer than 24 hours and corresponded to an arterial vascular territory of the cerebral hemispheres, brainstem, or cerebellum, with or without computed tomographic or magnetic resonance imaging documentation. Transient ischemic attack was defined as an episode of focal neurologic symptoms with abrupt onset and rapid resolution, lasting less than 24 hours, and due to altered circulation to a limited region of the brain.
Only patients with ischemic strokes clinically documented by a neurologist were included in the analysis.
Primary Outcomes
Outcomes were the cumulative probability of ischemic stroke and predictors of stroke in the first 12 months after surgical treatment of the hip.
Statistical Analysis
Continuous variables are presented as mean (standard deviation [SD]); categorical variables are presented as number and percentage. Two‐sample t tests or Wilcoxon rank sum tests were used to test for differences between THAs and hip fracture repairs in demographic characteristics, past medical history, and baseline clinical data composed of continuous variables; 2 or Fisher exact tests were used for categorical variables. No patient was lost to follow‐up during the 1 year after the initial surgery. However, the data of patients who died or had a second hip procedure within that period were censored.
The rate of ischemic stroke within 1 year after the incident hip procedure was calculated using the Kaplan‐Meier method. Second hip procedures within that period were counted as additional cases. Rates were calculated for the overall group, as well as for the univariate risk factors of operative procedure type, age, sex, past medical history of stroke, hypertension, atrial fibrillation, CAD, chronic obstructive pulmonary disease (COPD), diabetes mellitus, and chronic renal insufficiency. Use of ‐blockers, hydroxymethylglutaryl‐coenzyme A (HMG‐CoA) reductase inhibitors, or aspirin at hospital admission was also considered. Cox proportional hazards regression models were used to evaluate the risk of ischemic stroke for each of these univariate risk factors. Multivariable Cox proportional hazards models were constructed with adjustments for operative procedure type, age, sex, and comorbid conditions such as atrial fibrillation and hypertension. These covariates were added in a stepwise selection to identify factors significantly associated with the outcome. To account for patients who had a second hip procedure within 1 year of their first operation, we calculated all Cox proportional hazards regression results using the robust sandwich estimate of the covariance matrix. The proportional hazards assumption for all Cox models was evaluated with the methods proposed by Therneau and Grambsch;6 no violations of this assumption were identified. The rate of postoperative stroke after adjusting for the competing risk of death was calculated using the approach of Gooley et al.7 All statistical tests were 2‐sided, and a P value was considered significant if it was less than 0.05. Statistical analyses were performed using statistical software (SAS version 9.1.3; SAS Institute, Inc., Cary, NC).
Results
Among the patients with the 1886 hip procedures, 67 ischemic strokes were identified within 1 year after the index surgical procedure10 (1.4%) among the 691 THAs and 57 (4.8%) among the 1195 hip fracture repairs. Baseline characteristics are summarized in Table 1. Compared with the THA group, patients in the hip fracture repair group were more likely to be older and female. Additionally, such comorbid conditions as a history of stroke, diabetes mellitus, congestive heart failure, atrial fibrillation, or dementia were more prevalent in the hip fracture repair group.
| Characteristics | Surgical Procedure | Total (n = 1,886) | P Value* | |
|---|---|---|---|---|
| THA (n = 691) | Fracture Repair (n = 1,195) | |||
| ||||
| Age, years | 74.9 (6.59) | 84.2 (7.49) | 80.8 (8.46) | <0.001 |
| Sex, male | 258 (37.3) | 234 (19.6) | 492 (26.1) | <0.001 |
| Race, White | 690 (100) | 1,187 (99.3) | 1,877 (99.5) | 0.17 |
| BMI | 27.7 (5.36) | 23.3 (4.93) | 24.9 (5.52) | <0.001 |
| History | ||||
| Hypertension | 424 (61.4) | 695 (58.2) | 1,119 (59.3) | 0.17 |
| Diabetes | 57 (8.2) | 141 (11.8) | 198 (10.5) | 0.02 |
| Stroke | 50 (7.2) | 334 (27.9) | 384 (20.4) | <0.001 |
| CHF | 100 (14.5) | 321 (26.9) | 421 (22.3) | <0.001 |
| Atrial fibrillation | 72 (10.4) | 241 (20.2) | 313 (16.6) | <0.001 |
| Dementia | 16 (2.3) | 407 (34.1) | 423 (22.4) | <0.001 |
| ASA risk classification | <0.001 | |||
| 1 or 2 | 343 (49.6) | 172 (14.4) | 515 (27.3) | |
| 3, 4, or 5 | 348 (50.4) | 1,022 (85.6) | 1,370 (72.7) | |
| Medication on admission | ||||
| Aspirin | 168 (24.3) | 369 (30.9) | 537 (28.5) | 0.002 |
| ‐Blocker | 134 (19.4) | 184 (15.4) | 318 (16.9) | 0.03 |
| Insulin | 12 (1.7) | 48 (4) | 60 (3.2) | 0.007 |
| Length of stay, days | 7.3 (3.9) | 10.0 (7.61) | 9.0 (6.63) | <0.001 |
Univariate analyses assessing the rate and risk of postoperative ischemic stroke are shown in Table 2. The rate of stroke was significantly greater among hip fracture repairs than THAs 30 days postoperatively and 1 year postoperatively (1.5% vs. 0.6% and 5.5% vs. 1.5%, respectively; P < 0.001) (Figure 2). In our study we found an annual incidence rate of ischemic stroke of 4093 per 100,000 person‐years (95% confidence interval [CI], 3172‐5198 per 100,000 person‐years). Accounting for death as a competing risk for stroke had little impact on the rate of stroke overall or within the 2 surgical groups (results not shown). Univariate Cox proportional hazards models showed that neither sex nor history of hypertension, diabetes mellitus, COPD, chronic renal insufficiency, or CAD or use of HMG‐CoA reductase inhibitors or ‐blockers were significant predictors of ischemic stroke. However, other clinical risk factors, such as a history of atrial fibrillation (hazard ratio [HR], 2.16; P = 0.005), hip fracture repair vs. THA (HR, 3.80; P < 0.001), increased age (HR, 2.20; P = 0.017), aspirin use (HR, 1.8; P = 0.014), and history of previous stroke (HR, 4.18; P < 0.001), were significantly associated with an increased risk of stroke (Table 2).
| Variable | Number of Patients | Number of Events | Rate (%) | Hazard Ratio | P Value | |
|---|---|---|---|---|---|---|
| 30‐Day (95% CI) | 1‐Year (95% CI) | |||||
| ||||||
| Overall | 1886 | 67 | 1.2 (0.7‐1.7) | 3.9 (3‐4.8) | ||
| Type of operative procedure | ||||||
| THA | 691 | 10 | 0.6 (0.0‐1.1) | 1.5 (0.6‐2.4) | ||
| Hip fracture repair | 1195 | 57 | 1.5 (0.8‐2.2) | 5.5 (4.1‐6.9) | 3.80 (1.94‐7.44) | <0.001 |
| Age at operation, years | ||||||
| <75 | 528 | 11 | 1.0 (0.1‐1.8) | 2.1 (0.9‐3.3) | ||
| 75 | 1358 | 56 | 1.3 (0.7‐1.9) | 4.7 (3.5‐5.8) | 2.20 (1.15‐4.21) | 0.02 |
| Sex | ||||||
| Female | 1394 | 54 | 1.3 (0.7‐1.9) | 4.2 (3.1‐5.3) | ||
| Male | 492 | 13 | 0.8 (0.0‐1.7) | 2.9 (1.3‐4.4) | 0.69 (0.38‐1.27) | 0.24 |
| History of stroke | ||||||
| No | 1502 | 34 | 0.7 (0.3‐1.2) | 2.4 (1.6‐3.3) | ||
| Yes | 384 | 33 | 3.0 (1.2‐4.7) | 9.9 (6.6‐13) | 4.18 (2.59‐6.74) | <0.001 |
| History of hypertension | ||||||
| No | 767 | 23 | 0.8 (0.2‐1.4) | 3.4 (2.0‐4.7) | ||
| Yes | 1119 | 44 | 1.5 (0.7‐2.2) | 4.2 (3.0‐5.5) | 1.29 (0.78‐2.14) | 0.32 |
| History of atrial fibrillation | ||||||
| No | 1573 | 48 | 1.0 (0.5‐1.5) | 3.3 (2.4‐4.2) | ||
| Yes | 313 | 19 | 1.9 (0.4‐3.5) | 7.0 (3.9‐9.9) | 2.16 (1.27‐3.67) | 0.005 |
| History of CAD | ||||||
| No | 1224 | 40 | 1.1 (0.5‐1.6) | 3.5 (2.4‐4.5) | ||
| Yes | 662 | 27 | 1.4 (0.5‐2.3) | 4.7 (2.9‐6.4) | 1.34 (0.82‐2.19) | 0.24 |
| History of COPD | ||||||
| No | 1606 | 62 | 1.4 (0.8‐2.0) | 4.2 (3.1‐5.2) | ||
| Yes | 280 | 5 | 0 (0.0‐0.0) | 2.2 (0.3‐4.1) | 0.49 (0.20‐1.22) | 0.13 |
| History of diabetes mellitus | ||||||
| No | 1688 | 56 | 1.1 (0.6‐1.7) | 3.6 (2.7‐4.5) | ||
| Yes | 198 | 11 | 1.5 (0‐3.3) | 6.3 (2.6‐9.9) | 1.75 (0.92‐3.34) | 0.09 |
| History of renal insufficiency | ||||||
| No | 1718 | 58 | 1.0 (0.5‐1.5) | 3.7 (2.7‐4.6) | ||
| Yes | 168 | 9 | 3.0 (0.4‐5.5) | 5.8 (2‐9.5) | 1.77 (0.88‐3.57) | 0.11 |
| Aspirin use | ||||||
| No | 1349 | 39 | 0.7 (0.2‐1.1) | 3.2 (2.2‐4.2) | ||
| Yes | 537 | 28 | 2.5 (0.1‐3.8) | 5.7 (3.6‐7.7) | 1.86 (1.13‐3.06) | 0.01 |
| ‐Blocker use | ||||||
| No | 1568 | 52 | 1.1 (0.6‐1.6) | 3.6 (2.7‐4.6) | ||
| Yes | 318 | 15 | 1.6 (0.2‐3.0) | 5.1 (2.6‐7.6) | 1.42 (0.81‐2.52) | 0.22 |
| HMG‐CoA reductase inhibitor use | ||||||
| No | 1736 | 63 | 1.2 (0.7‐1.7) | 4.0 (3.0‐4.9) | ||
| Yes (statin/other lipid lowering drugs) | 148 | 4 | 1.4 (0‐3.2) | 2.8 (0.1‐5.4) | 0.70 (0.26‐1.94) | 0.50 |
Because age was associated with the type of surgical procedure (87% of hip fracture repair patients were 75 years or older compared with 45% of THA patients), the effect of hip fracture repair on ischemic stroke was adjusted for age. For similar reasons, sex was also examined as an adjusting factor. Adjustment for age and sex resulted in only a slight attenuation of the HR for hip fracture repair vs. THA, from 3.8 to 3.4. A further analysis also adjusted for history of hypertension and history of atrial fibrillation, both comorbidities commonly associated with ischemic stroke. After adjustment for age, sex, history of hypertension, and history of atrial fibrillation, the risk of ischemic stroke was still significantly greater in the hip fracture repair group than in the THA group (HR, 2.8; 95% CI, 1.4‐5.7; P = 0.005).
To determine the most important predictors of postoperative ischemic stroke, multivariable analysis was conducted with stepwise selection. Potential risk factors included the following: operative procedure type (hip fracture repair vs. THA), age, sex, and history of stroke, hypertension, atrial fibrillation, CAD, COPD, diabetes mellitus, and chronic renal insufficiency, as well as use of ‐blockers, HMG‐CoA reductase inhibitors, and aspirin on hospital admission. Among all these factors, history of stroke (HR, 3.27; P < 0.001) and hip fracture repair vs. THA (HR, 2.74; P = 0.004) were confirmed to be significant predictors of postoperative ischemic stroke; the other factors did not significantly affect the model (Figure 2).
Comment
Our findings contrast those of previous studies that focused on perioperative ischemic stroke rates for specific surgical procedures,2, 8, 9 but do seem concordant with published results for early event rates of cerebrovascular accident or transient ischemic attack (1%) following hip fracture.10 The data from our study suggest that perioperative stroke cumulative probability is relatively high for hip procedures at both 30 days (1.2%) and 1 year (3.9%) after the index surgical procedure compared with general procedures. Subjects with a history of stroke who were undergoing hip operation had a postoperative stroke risk of 3.0% at 30 days and 9.9% at 1 year.
The incidence of stroke was greater in the hip fracture repair group (1.5% at 30 days and 5.5% at 1 year) than in the elective THA group (0.6% at 30 days and 1.5% at 1 year). The increased 1‐year mortality for patients undergoing hip surgery compared with the general population is in part due to cerebrovascular disease,10 and, therefore, the 1‐year stroke incidence is important.
After adjustment for age, sex, and comorbidities (hypertension and atrial fibrillation), the risk of postoperative ischemic stroke was 2.71 times greater in the hip fracture repair group than in the THA group (P = 0.006). These data are important in counseling and caring for patients undergoing different types of hip procedures.
From 1985 through 1989, for the age group (75‐84 years old) that best fits the demographics of our cohort, both men and women had limited variation over time in annual incidence rates of stroke (2149‐1074 strokes per 100,000 population per year) for Olmsted County, MN.11 In our study we found an annual incidence rate of ischemic stroke of 4,093 per 100,000 person‐years (95% CI, 3172‐5198 per 100,000 person‐years). The lower limit of the 95% CI is higher than the rates reported for Olmsted County, suggesting that having hip surgery increases the 1‐year risk of ischemic stroke.
Previous studies have shown that the risk factor most consistently correlated to perioperative ischemic stroke is a history of stroke.9 In our study, history of stroke and type of hip fracture surgery were confirmed to be the strongest predictors of postoperative stroke. History of hypertension, atrial fibrillation, CAD, COPD, diabetes, or chronic renal insufficiency was not correlated to perioperative ischemic stroke.
Nonmodifiable risk factors, such as advanced age, serve as markers of stroke risk and help identify high‐risk populations that may require aggressive intervention. After age adjustment of hip fracture repair, age was no longer significantly associated with postoperative stroke.
Cerebrovascular disease appears to be a marker for CAD, and, therefore, patients with a history of stroke usually have a Revised Cardiac Risk Index that may suggest the use of ‐blockers. According to the recent results of the POISE trial, use of ‐blockers could lead to increased stroke incidence.2 Our results showed no significant correlation between stroke risk and ‐blocker use, but our study period was from 1988 to 2002, when titration of ‐blocker dose to heart rates of 55 to 60 beats per minute was not common practice.
Several studies have confirmed the value of aspirin in decreasing the rate of vascular outcomes after diagnosis of transient ischemic attack or stroke.12 In our study, aspirin use on hospital admission was found in the univariate analysis to be associated with an increased risk of stroke, but this finding was not confirmed after adjustments for age, sex, and comorbid conditions. Aspirin use on admission was not a significant predictor of postoperative stroke, most likely because aspirin use can be considered a marker of increased cardiovascular risk and we adjusted for these comorbid conditions.
The limitations of this study are inherent in its retrospective design. First, we identified all incident cases of stroke after hip operation by reviewing medical records and then abstracting data from those records. We may have missed some mild strokes if they were misclassified as peripheral vestibular neuropathy, migraine, or even seizure. Less likely is that we missed strokes within the first 30 days after the procedure because that is the period in which patients with hip operation are either hospitalized or sent for rehabilitation in skilled nursing facilities. It is known that institutionalization leads to better surveillance and more complete ascertainment of any medical event.
The event rate of postoperative stroke at 30 days after hip operation was low. Therefore, we did not have the statistical power to comment meaningfully on predictors of stroke at 30 days after the hip procedure. Any nonrespondent or volunteer bias was addressed by using data from the Rochester Epidemiology Project, which allowed us to identify all Olmsted County residents who underwent hip operation between 1988 and 2002. The diagnostic suspicion bias was also accounted for in our study design because different physicians provided care and outcome measurement.
Our results apply for the patients who underwent hip operation between 1988 and 2002. The noncardiac surgery guidelines have been revised between 1988 and 2002, and we did not perform a stratified analysis by index year. The next step in our study will be to extend our data collection to 2008 and look at time trends.
Conclusion
In this population‐based historical cohort study, patients undergoing hip operation had a 3.9% cumulative probability of ischemic stroke during the first postoperative year. History of stroke and type of hip procedure (ie, hip fracture repair) were the strongest predictors of this complication. Because history of stroke is such a strong predictor of postoperative stroke, the perioperative management of these patients should probably be tailored, with closely observed blood pressure management and antihypertensive medication adjustment, to avoid compromising cerebral perfusion. Also, to avoid postoperative hypercoagulability that increases the risk of stroke, these patients may need to begin receiving antiplatelets as soon as is surgically acceptable.1315
- .History of the Rochester Epidemiology Project.Mayo Clin Proc.1996;71(3):266–274.
- POISE Study Group;,,,,,, et al.Effects of extended‐release metoprolol succinate in patients undergoing non‐cardiac surgery (POISE trial): a randomised controlled trial.Lancet.2008;371(9627):1839–1847.
- ,,,,,, et al;American Heart Association Statistics Committee and Stroke Statistics Subcommittee. Heart disease and stroke statistics—2006 update: a report from the American Heart Association Statistics Committee and Stroke Statistics Subcommittee.Circulation.2006;113(6):e85–e151.
- Shojania KG, Duncan BW, McDonald KM, Wachter RM, Markowitz AJ, eds.Making health care safer: a critical analysis of patient safety practices. Evidence Report/Technology Assessment No.43.AHRQ publication no. 01‐E058.Rockville, MD:Agency for Healthcare Research and Quality (AHRQ),U.S. Department of Health and Human Services;2001.668 p.
- ,,.Deaths due to medical errors are exaggerated in Institute of Medicine report.JAMA.2000;284(1):93–95.
- ,.Modeling survival data: extending the Cox model.New York:Springer;2000.
- ,,,.Estimation of failure probabilities in the presence of competing risks: new representations of old estimators.Stat Med.1999;18(6):695–706.
- ,,.Postoperative cerebrovascular accidents in general surgery.Acta Anaesthesiol Scand.1988;32(8):698–701.
- ,,,,,, et al.Perioperative stroke risk in 173 consecutive patients with a past history of stroke.Arch Surg.1990;125(8):986–989.
- ,,,,.Medical complications and outcomes after hip fracture repair.Arch Intern Med.2002;162(18):2053–2057.
- ,,,,.Stroke incidence, prevalence, and survival: secular trends in Rochester, Minnesota, through 1989.Stroke.1996;27(3):373–380.
- CAST (Chinese Acute Stroke Trial) Collaborative Group.Randomised placebo‐controlled trial of early aspirin use in 20,000 patients with acute ischaemic stroke.Lancet.1997;349(9066):1641–1649.
- ,,.Coagulation activation and organ dysfunction following cardiac surgery.Chest.2005;128(1):229–236.
- ,,,,,.Intra‐ and postoperative fibrinolysis in patients undergoing cardiopulmonary bypass surgery.Haemostasis.1991;21(1):58–64.
- .Perioperative stroke.N Engl J Med.2007;356(7):706–713.
In the United States, hip operations (internal fixation of fracture or total hip arthroplasty [THA]) are the most common noncardiac major surgical procedures performed in patients age 65 years and older (45.2 procedures per 100,000 persons per year).1 This number of procedures is projected to increase substantially in the coming decades.
Little is known about the clinical predictors of postoperative stroke in patients undergoing hip surgical procedures. Further, recent results of the Perioperative Ischemic Evaluation (POISE) trial have shown that measures taken to reduce cardiac complications postoperatively may adversely affect the risk of stroke.2 The POISE study showed decreases in myocardial infarction and coronary revascularization but accompanying increases in stroke and death with use of ‐blockers in patients undergoing noncardiac surgery.
Prevention of adverse events is one of the top priorities of the U.S. health care system today.35 Risk stratification and therapeutic optimization of underlying chronic diseases may be important in decreasing perioperative risk and improving postoperative outcomes.
Our objective was to determine the rate of postoperative ischemic stroke in all residents of Olmsted County, MN, who underwent hip operation between 1988 and 2002 and to identify clinical predictors of postoperative stroke.
Subjects and Methods
Olmsted County is one of the few places in the world where comprehensive population‐based studies of disease etiology and outcomes are feasible. This feasibility is due to the Rochester Epidemiology Project, a medical records linkage system that provides access to the records of all medical care in the community.1 All medical diagnoses made for a resident of Olmsted County are entered on a master sheet in the patient's medical record, which is then entered into a central computer index.
Hip operations were identified using the Surgical Information Recording System data warehouse, where detailed data are stored as International Classification of Diseases, 9th edition (ICD‐9) codes for all surgical procedures performed from January 1, 1988, forward. A total of 2028 THAs and hip fracture repairs (ICD‐9 codes 81.51, 81.52, 81.53, 79.15, and 79.25) performed between 1988 and 2002 in Olmsted County were identified. Of the hip procedures, 142 were excluded (Figure 1). The final analysis cohort contained 1886 hip operations1195 hip fracture repairs and 691 THAs.
The population‐based cohort was assembled and the data were abstracted from complete inpatient and outpatient records from admission for surgical treatment up to 1 year after surgery. Only those patients who had given prior authorization for research were included in the study cohort. The Mayo Clinic Institutional Review Board approved the study.
Case Ascertainment
We used several screening procedures to completely enumerate all postoperative strokes in our study population (Figure 1). The Mayo Clinic administrative database was used to identify all cases with relevant cerebrovascular disease (ICD‐9 codes 430.0‐437.9, 368.12, 781.4, and 784.3) within 1 year after hip operation. The Rochester Stroke Registry identified incident cases of ischemic stroke in Olmsted County from 1988 through 1994. The clinic's administrative database was also used to identify brain imaging studies (brain computed tomography, magnetic resonance imaging, or carotid ultrasonography) between the day of the procedure and 1 year postoperatively. A neurologist reviewed each image and the associated medical record identified during the screening process in detail for the constellation of signs and symptoms consistent with the diagnosis of stroke. Death certificates and autopsy reports were also reviewed to identify persons with the diagnosis of stroke. The outcome (stroke) was masked to the nurse abstractor who reviewed charts for predictors of postoperative stroke (eg, atrial fibrillation, coronary artery disease [CAD], history of stroke, medication use). The exposed or unexposed status of the patients to the predictors of stroke was masked to the physician (A.S.P.) who screened electronic medical records for the outcome measure (stroke).
Cerebral infarction or ischemic stroke was defined as the acute onset of a neurologic deficit that persisted for longer than 24 hours and corresponded to an arterial vascular territory of the cerebral hemispheres, brainstem, or cerebellum, with or without computed tomographic or magnetic resonance imaging documentation. Transient ischemic attack was defined as an episode of focal neurologic symptoms with abrupt onset and rapid resolution, lasting less than 24 hours, and due to altered circulation to a limited region of the brain.
Only patients with ischemic strokes clinically documented by a neurologist were included in the analysis.
Primary Outcomes
Outcomes were the cumulative probability of ischemic stroke and predictors of stroke in the first 12 months after surgical treatment of the hip.
Statistical Analysis
Continuous variables are presented as mean (standard deviation [SD]); categorical variables are presented as number and percentage. Two‐sample t tests or Wilcoxon rank sum tests were used to test for differences between THAs and hip fracture repairs in demographic characteristics, past medical history, and baseline clinical data composed of continuous variables; 2 or Fisher exact tests were used for categorical variables. No patient was lost to follow‐up during the 1 year after the initial surgery. However, the data of patients who died or had a second hip procedure within that period were censored.
The rate of ischemic stroke within 1 year after the incident hip procedure was calculated using the Kaplan‐Meier method. Second hip procedures within that period were counted as additional cases. Rates were calculated for the overall group, as well as for the univariate risk factors of operative procedure type, age, sex, past medical history of stroke, hypertension, atrial fibrillation, CAD, chronic obstructive pulmonary disease (COPD), diabetes mellitus, and chronic renal insufficiency. Use of ‐blockers, hydroxymethylglutaryl‐coenzyme A (HMG‐CoA) reductase inhibitors, or aspirin at hospital admission was also considered. Cox proportional hazards regression models were used to evaluate the risk of ischemic stroke for each of these univariate risk factors. Multivariable Cox proportional hazards models were constructed with adjustments for operative procedure type, age, sex, and comorbid conditions such as atrial fibrillation and hypertension. These covariates were added in a stepwise selection to identify factors significantly associated with the outcome. To account for patients who had a second hip procedure within 1 year of their first operation, we calculated all Cox proportional hazards regression results using the robust sandwich estimate of the covariance matrix. The proportional hazards assumption for all Cox models was evaluated with the methods proposed by Therneau and Grambsch;6 no violations of this assumption were identified. The rate of postoperative stroke after adjusting for the competing risk of death was calculated using the approach of Gooley et al.7 All statistical tests were 2‐sided, and a P value was considered significant if it was less than 0.05. Statistical analyses were performed using statistical software (SAS version 9.1.3; SAS Institute, Inc., Cary, NC).
Results
Among the patients with the 1886 hip procedures, 67 ischemic strokes were identified within 1 year after the index surgical procedure10 (1.4%) among the 691 THAs and 57 (4.8%) among the 1195 hip fracture repairs. Baseline characteristics are summarized in Table 1. Compared with the THA group, patients in the hip fracture repair group were more likely to be older and female. Additionally, such comorbid conditions as a history of stroke, diabetes mellitus, congestive heart failure, atrial fibrillation, or dementia were more prevalent in the hip fracture repair group.
| Characteristics | Surgical Procedure | Total (n = 1,886) | P Value* | |
|---|---|---|---|---|
| THA (n = 691) | Fracture Repair (n = 1,195) | |||
| ||||
| Age, years | 74.9 (6.59) | 84.2 (7.49) | 80.8 (8.46) | <0.001 |
| Sex, male | 258 (37.3) | 234 (19.6) | 492 (26.1) | <0.001 |
| Race, White | 690 (100) | 1,187 (99.3) | 1,877 (99.5) | 0.17 |
| BMI | 27.7 (5.36) | 23.3 (4.93) | 24.9 (5.52) | <0.001 |
| History | ||||
| Hypertension | 424 (61.4) | 695 (58.2) | 1,119 (59.3) | 0.17 |
| Diabetes | 57 (8.2) | 141 (11.8) | 198 (10.5) | 0.02 |
| Stroke | 50 (7.2) | 334 (27.9) | 384 (20.4) | <0.001 |
| CHF | 100 (14.5) | 321 (26.9) | 421 (22.3) | <0.001 |
| Atrial fibrillation | 72 (10.4) | 241 (20.2) | 313 (16.6) | <0.001 |
| Dementia | 16 (2.3) | 407 (34.1) | 423 (22.4) | <0.001 |
| ASA risk classification | <0.001 | |||
| 1 or 2 | 343 (49.6) | 172 (14.4) | 515 (27.3) | |
| 3, 4, or 5 | 348 (50.4) | 1,022 (85.6) | 1,370 (72.7) | |
| Medication on admission | ||||
| Aspirin | 168 (24.3) | 369 (30.9) | 537 (28.5) | 0.002 |
| ‐Blocker | 134 (19.4) | 184 (15.4) | 318 (16.9) | 0.03 |
| Insulin | 12 (1.7) | 48 (4) | 60 (3.2) | 0.007 |
| Length of stay, days | 7.3 (3.9) | 10.0 (7.61) | 9.0 (6.63) | <0.001 |
Univariate analyses assessing the rate and risk of postoperative ischemic stroke are shown in Table 2. The rate of stroke was significantly greater among hip fracture repairs than THAs 30 days postoperatively and 1 year postoperatively (1.5% vs. 0.6% and 5.5% vs. 1.5%, respectively; P < 0.001) (Figure 2). In our study we found an annual incidence rate of ischemic stroke of 4093 per 100,000 person‐years (95% confidence interval [CI], 3172‐5198 per 100,000 person‐years). Accounting for death as a competing risk for stroke had little impact on the rate of stroke overall or within the 2 surgical groups (results not shown). Univariate Cox proportional hazards models showed that neither sex nor history of hypertension, diabetes mellitus, COPD, chronic renal insufficiency, or CAD or use of HMG‐CoA reductase inhibitors or ‐blockers were significant predictors of ischemic stroke. However, other clinical risk factors, such as a history of atrial fibrillation (hazard ratio [HR], 2.16; P = 0.005), hip fracture repair vs. THA (HR, 3.80; P < 0.001), increased age (HR, 2.20; P = 0.017), aspirin use (HR, 1.8; P = 0.014), and history of previous stroke (HR, 4.18; P < 0.001), were significantly associated with an increased risk of stroke (Table 2).
| Variable | Number of Patients | Number of Events | Rate (%) | Hazard Ratio | P Value | |
|---|---|---|---|---|---|---|
| 30‐Day (95% CI) | 1‐Year (95% CI) | |||||
| ||||||
| Overall | 1886 | 67 | 1.2 (0.7‐1.7) | 3.9 (3‐4.8) | ||
| Type of operative procedure | ||||||
| THA | 691 | 10 | 0.6 (0.0‐1.1) | 1.5 (0.6‐2.4) | ||
| Hip fracture repair | 1195 | 57 | 1.5 (0.8‐2.2) | 5.5 (4.1‐6.9) | 3.80 (1.94‐7.44) | <0.001 |
| Age at operation, years | ||||||
| <75 | 528 | 11 | 1.0 (0.1‐1.8) | 2.1 (0.9‐3.3) | ||
| 75 | 1358 | 56 | 1.3 (0.7‐1.9) | 4.7 (3.5‐5.8) | 2.20 (1.15‐4.21) | 0.02 |
| Sex | ||||||
| Female | 1394 | 54 | 1.3 (0.7‐1.9) | 4.2 (3.1‐5.3) | ||
| Male | 492 | 13 | 0.8 (0.0‐1.7) | 2.9 (1.3‐4.4) | 0.69 (0.38‐1.27) | 0.24 |
| History of stroke | ||||||
| No | 1502 | 34 | 0.7 (0.3‐1.2) | 2.4 (1.6‐3.3) | ||
| Yes | 384 | 33 | 3.0 (1.2‐4.7) | 9.9 (6.6‐13) | 4.18 (2.59‐6.74) | <0.001 |
| History of hypertension | ||||||
| No | 767 | 23 | 0.8 (0.2‐1.4) | 3.4 (2.0‐4.7) | ||
| Yes | 1119 | 44 | 1.5 (0.7‐2.2) | 4.2 (3.0‐5.5) | 1.29 (0.78‐2.14) | 0.32 |
| History of atrial fibrillation | ||||||
| No | 1573 | 48 | 1.0 (0.5‐1.5) | 3.3 (2.4‐4.2) | ||
| Yes | 313 | 19 | 1.9 (0.4‐3.5) | 7.0 (3.9‐9.9) | 2.16 (1.27‐3.67) | 0.005 |
| History of CAD | ||||||
| No | 1224 | 40 | 1.1 (0.5‐1.6) | 3.5 (2.4‐4.5) | ||
| Yes | 662 | 27 | 1.4 (0.5‐2.3) | 4.7 (2.9‐6.4) | 1.34 (0.82‐2.19) | 0.24 |
| History of COPD | ||||||
| No | 1606 | 62 | 1.4 (0.8‐2.0) | 4.2 (3.1‐5.2) | ||
| Yes | 280 | 5 | 0 (0.0‐0.0) | 2.2 (0.3‐4.1) | 0.49 (0.20‐1.22) | 0.13 |
| History of diabetes mellitus | ||||||
| No | 1688 | 56 | 1.1 (0.6‐1.7) | 3.6 (2.7‐4.5) | ||
| Yes | 198 | 11 | 1.5 (0‐3.3) | 6.3 (2.6‐9.9) | 1.75 (0.92‐3.34) | 0.09 |
| History of renal insufficiency | ||||||
| No | 1718 | 58 | 1.0 (0.5‐1.5) | 3.7 (2.7‐4.6) | ||
| Yes | 168 | 9 | 3.0 (0.4‐5.5) | 5.8 (2‐9.5) | 1.77 (0.88‐3.57) | 0.11 |
| Aspirin use | ||||||
| No | 1349 | 39 | 0.7 (0.2‐1.1) | 3.2 (2.2‐4.2) | ||
| Yes | 537 | 28 | 2.5 (0.1‐3.8) | 5.7 (3.6‐7.7) | 1.86 (1.13‐3.06) | 0.01 |
| ‐Blocker use | ||||||
| No | 1568 | 52 | 1.1 (0.6‐1.6) | 3.6 (2.7‐4.6) | ||
| Yes | 318 | 15 | 1.6 (0.2‐3.0) | 5.1 (2.6‐7.6) | 1.42 (0.81‐2.52) | 0.22 |
| HMG‐CoA reductase inhibitor use | ||||||
| No | 1736 | 63 | 1.2 (0.7‐1.7) | 4.0 (3.0‐4.9) | ||
| Yes (statin/other lipid lowering drugs) | 148 | 4 | 1.4 (0‐3.2) | 2.8 (0.1‐5.4) | 0.70 (0.26‐1.94) | 0.50 |
Because age was associated with the type of surgical procedure (87% of hip fracture repair patients were 75 years or older compared with 45% of THA patients), the effect of hip fracture repair on ischemic stroke was adjusted for age. For similar reasons, sex was also examined as an adjusting factor. Adjustment for age and sex resulted in only a slight attenuation of the HR for hip fracture repair vs. THA, from 3.8 to 3.4. A further analysis also adjusted for history of hypertension and history of atrial fibrillation, both comorbidities commonly associated with ischemic stroke. After adjustment for age, sex, history of hypertension, and history of atrial fibrillation, the risk of ischemic stroke was still significantly greater in the hip fracture repair group than in the THA group (HR, 2.8; 95% CI, 1.4‐5.7; P = 0.005).
To determine the most important predictors of postoperative ischemic stroke, multivariable analysis was conducted with stepwise selection. Potential risk factors included the following: operative procedure type (hip fracture repair vs. THA), age, sex, and history of stroke, hypertension, atrial fibrillation, CAD, COPD, diabetes mellitus, and chronic renal insufficiency, as well as use of ‐blockers, HMG‐CoA reductase inhibitors, and aspirin on hospital admission. Among all these factors, history of stroke (HR, 3.27; P < 0.001) and hip fracture repair vs. THA (HR, 2.74; P = 0.004) were confirmed to be significant predictors of postoperative ischemic stroke; the other factors did not significantly affect the model (Figure 2).
Comment
Our findings contrast those of previous studies that focused on perioperative ischemic stroke rates for specific surgical procedures,2, 8, 9 but do seem concordant with published results for early event rates of cerebrovascular accident or transient ischemic attack (1%) following hip fracture.10 The data from our study suggest that perioperative stroke cumulative probability is relatively high for hip procedures at both 30 days (1.2%) and 1 year (3.9%) after the index surgical procedure compared with general procedures. Subjects with a history of stroke who were undergoing hip operation had a postoperative stroke risk of 3.0% at 30 days and 9.9% at 1 year.
The incidence of stroke was greater in the hip fracture repair group (1.5% at 30 days and 5.5% at 1 year) than in the elective THA group (0.6% at 30 days and 1.5% at 1 year). The increased 1‐year mortality for patients undergoing hip surgery compared with the general population is in part due to cerebrovascular disease,10 and, therefore, the 1‐year stroke incidence is important.
After adjustment for age, sex, and comorbidities (hypertension and atrial fibrillation), the risk of postoperative ischemic stroke was 2.71 times greater in the hip fracture repair group than in the THA group (P = 0.006). These data are important in counseling and caring for patients undergoing different types of hip procedures.
From 1985 through 1989, for the age group (75‐84 years old) that best fits the demographics of our cohort, both men and women had limited variation over time in annual incidence rates of stroke (2149‐1074 strokes per 100,000 population per year) for Olmsted County, MN.11 In our study we found an annual incidence rate of ischemic stroke of 4,093 per 100,000 person‐years (95% CI, 3172‐5198 per 100,000 person‐years). The lower limit of the 95% CI is higher than the rates reported for Olmsted County, suggesting that having hip surgery increases the 1‐year risk of ischemic stroke.
Previous studies have shown that the risk factor most consistently correlated to perioperative ischemic stroke is a history of stroke.9 In our study, history of stroke and type of hip fracture surgery were confirmed to be the strongest predictors of postoperative stroke. History of hypertension, atrial fibrillation, CAD, COPD, diabetes, or chronic renal insufficiency was not correlated to perioperative ischemic stroke.
Nonmodifiable risk factors, such as advanced age, serve as markers of stroke risk and help identify high‐risk populations that may require aggressive intervention. After age adjustment of hip fracture repair, age was no longer significantly associated with postoperative stroke.
Cerebrovascular disease appears to be a marker for CAD, and, therefore, patients with a history of stroke usually have a Revised Cardiac Risk Index that may suggest the use of ‐blockers. According to the recent results of the POISE trial, use of ‐blockers could lead to increased stroke incidence.2 Our results showed no significant correlation between stroke risk and ‐blocker use, but our study period was from 1988 to 2002, when titration of ‐blocker dose to heart rates of 55 to 60 beats per minute was not common practice.
Several studies have confirmed the value of aspirin in decreasing the rate of vascular outcomes after diagnosis of transient ischemic attack or stroke.12 In our study, aspirin use on hospital admission was found in the univariate analysis to be associated with an increased risk of stroke, but this finding was not confirmed after adjustments for age, sex, and comorbid conditions. Aspirin use on admission was not a significant predictor of postoperative stroke, most likely because aspirin use can be considered a marker of increased cardiovascular risk and we adjusted for these comorbid conditions.
The limitations of this study are inherent in its retrospective design. First, we identified all incident cases of stroke after hip operation by reviewing medical records and then abstracting data from those records. We may have missed some mild strokes if they were misclassified as peripheral vestibular neuropathy, migraine, or even seizure. Less likely is that we missed strokes within the first 30 days after the procedure because that is the period in which patients with hip operation are either hospitalized or sent for rehabilitation in skilled nursing facilities. It is known that institutionalization leads to better surveillance and more complete ascertainment of any medical event.
The event rate of postoperative stroke at 30 days after hip operation was low. Therefore, we did not have the statistical power to comment meaningfully on predictors of stroke at 30 days after the hip procedure. Any nonrespondent or volunteer bias was addressed by using data from the Rochester Epidemiology Project, which allowed us to identify all Olmsted County residents who underwent hip operation between 1988 and 2002. The diagnostic suspicion bias was also accounted for in our study design because different physicians provided care and outcome measurement.
Our results apply for the patients who underwent hip operation between 1988 and 2002. The noncardiac surgery guidelines have been revised between 1988 and 2002, and we did not perform a stratified analysis by index year. The next step in our study will be to extend our data collection to 2008 and look at time trends.
Conclusion
In this population‐based historical cohort study, patients undergoing hip operation had a 3.9% cumulative probability of ischemic stroke during the first postoperative year. History of stroke and type of hip procedure (ie, hip fracture repair) were the strongest predictors of this complication. Because history of stroke is such a strong predictor of postoperative stroke, the perioperative management of these patients should probably be tailored, with closely observed blood pressure management and antihypertensive medication adjustment, to avoid compromising cerebral perfusion. Also, to avoid postoperative hypercoagulability that increases the risk of stroke, these patients may need to begin receiving antiplatelets as soon as is surgically acceptable.1315
- .History of the Rochester Epidemiology Project.Mayo Clin Proc.1996;71(3):266–274.
- POISE Study Group;,,,,,, et al.Effects of extended‐release metoprolol succinate in patients undergoing non‐cardiac surgery (POISE trial): a randomised controlled trial.Lancet.2008;371(9627):1839–1847.
- ,,,,,, et al;American Heart Association Statistics Committee and Stroke Statistics Subcommittee. Heart disease and stroke statistics—2006 update: a report from the American Heart Association Statistics Committee and Stroke Statistics Subcommittee.Circulation.2006;113(6):e85–e151.
- Shojania KG, Duncan BW, McDonald KM, Wachter RM, Markowitz AJ, eds.Making health care safer: a critical analysis of patient safety practices. Evidence Report/Technology Assessment No.43.AHRQ publication no. 01‐E058.Rockville, MD:Agency for Healthcare Research and Quality (AHRQ),U.S. Department of Health and Human Services;2001.668 p.
- ,,.Deaths due to medical errors are exaggerated in Institute of Medicine report.JAMA.2000;284(1):93–95.
- ,.Modeling survival data: extending the Cox model.New York:Springer;2000.
- ,,,.Estimation of failure probabilities in the presence of competing risks: new representations of old estimators.Stat Med.1999;18(6):695–706.
- ,,.Postoperative cerebrovascular accidents in general surgery.Acta Anaesthesiol Scand.1988;32(8):698–701.
- ,,,,,, et al.Perioperative stroke risk in 173 consecutive patients with a past history of stroke.Arch Surg.1990;125(8):986–989.
- ,,,,.Medical complications and outcomes after hip fracture repair.Arch Intern Med.2002;162(18):2053–2057.
- ,,,,.Stroke incidence, prevalence, and survival: secular trends in Rochester, Minnesota, through 1989.Stroke.1996;27(3):373–380.
- CAST (Chinese Acute Stroke Trial) Collaborative Group.Randomised placebo‐controlled trial of early aspirin use in 20,000 patients with acute ischaemic stroke.Lancet.1997;349(9066):1641–1649.
- ,,.Coagulation activation and organ dysfunction following cardiac surgery.Chest.2005;128(1):229–236.
- ,,,,,.Intra‐ and postoperative fibrinolysis in patients undergoing cardiopulmonary bypass surgery.Haemostasis.1991;21(1):58–64.
- .Perioperative stroke.N Engl J Med.2007;356(7):706–713.
Copyright © 2009 Society of Hospital Medicine

Costs and Arthroplasty
Hospital practices are increasingly responsible for ensuring enhanced patient safety, satisfaction, and cost containment. Recently developed models of care have achieved the necessary efficiency to attain these measures, not only in the use of hospitalists managing general medical1, 2 and postoperative orthopedic patients,3, 4 but also in the use of midlevel providers in busy primary care settings.5 In addition, stroke units6 and geriatric evaluation and management units7, 8 worldwide have demonstrated reduced disability and improved survival and importantly have been proven to provide cost‐effective care. Specialized orthopedic surgery (SOS) units may be a means to reproduce the results observed in these other models.
The economic potential of SOS units will become more significant with changing demographics. The percentage of patients greater than 65 years old will increase, from 12.3% in 2002 to 20% by 2030, with a parallel increase in the prevalence of osteoarthritis (OA).9 The World Health Organization has declared 2000‐2010 the Bone and Joint Decade,10, 11 reflecting that OA affects some 43 million people, with more than 60 million projected to be affected by 2020.12, 13 The National Center for Health Statistics reported that more than 280,000 total knee arthroplasties (TKAs) are performed annually in the United States, which marks an increase in frequency in the last decade that is likely to continue.1419
Approximately 75% of all TKAs are reimbursed under Medicare,17 whereas elective TKA continues to be one of the most common surgeries in the Medicare‐age patient population,20 foreshadowing the prominent cost burden of osteoarthritis in the aging population. The concomitant decreasing reimbursement for arthroplasty in general supports an examination of what constitutes efficient, high‐quality, and cost‐effective care21 for TKA. At our institution, patients undergoing TKA are preferentially triaged to an SOS nursing unit for postoperative care. As hospital bed capacity continues to decline, patients may be triaged to open beds at locations that may not be the optimal choice for nursing care. The primary purpose of this study was to determine the impact of SOS units versus nonorthopedic nursing (NON) units on resource utilization for and outcomes of patients undergoing elective knee arthroplasty. We hypothesized that length of stay would be shorter and cost of inpatient care would be lower for patients cared for on SOS units.
MATERIALS AND METHODS
Study Design and Setting
We conducted a retrospective observational cohort study of all patients undergoing elective primary TKA from January 1, 1996, to December 31, 2004, comparing outcomes of patients assigned to SOS units with those of patients assigned to NON units. Patients were admitted to Rochester Methodist Hospital, Mayo Clinic, a tertiary‐care primary surgical teaching hospital that has 794 beds and more than 15,000 admissions annually. There were 13 faculty orthopedic surgeons performing elective nontraumatic lower‐extremity joint procedures during the study period, each with orthopedic residents rotating as part of the patient care team.
Study Population
All patients at Mayo Clinic who had undergone a joint replacement were followed prospectively, and data were collected using standardized forms and protocols, the methodologies of which have been described previously.22 Follow‐up was greater than 95% complete. Using the joint registry, patients who had undergone a TKA were identified (n = 9798). Postoperative patients initially transferred from the postanesthesia care unit to a general care floor were included. We excluded patients who required urgent, revision, or bilateral arthroplasties; who had been treated at or transferred from another institution; and whose primary surgical indication was trauma or septic arthritis. Subjects admitted to the hospital on the day prior to the procedure and subjects initially transferred directly from the postanesthesia care unit to the intensive care unit (ICU) were excluded, including patients requiring immediate postoperative cardiac monitoring. All primary surgical interventions were performed between Monday and Friday. The study authors identified 5883 eligible patients.
Patient clinical and demographic data including surgical indication; age; sex; height and weight at surgery; and dates of admission, surgery, death, discharge, and last follow‐up were abstracted from the registry. Type of anesthesia (general, regional, combined), American Society of Anesthesiologists (ASA) physical status class, and date and time of ICU admission and discharge were abstracted from individual departmental databases. The Decision Support System (DSS) administrative database (Eclipsys, Boca Raton, FL) was utilized to abstract relevant clinical variables, including major comorbid conditions such as cancer, cerebrovascular disease, chronic pulmonary disease, congestive heart failure, dementia, diabetes, hemiplegia, HIV/AIDS, metastatic solid tumors, myocardial infarction, peripheral vascular disease, renal disease, rheumatologic disease, and ulcers. A composite Charlson comorbidity score was computed as previously described.23, 24 Administrative variables regarding patient encounters including inpatient stay variableslength of stay, costs, patient location, nursing care units, admission times, discharge disposition and datewere also obtained from the DSS database.
Variables and Definitions
Length of stay was defined as the number of days from time of admission for the surgical episode to time of discharge. All costs were based on a provider perspective using standardized 2005 costs based on inflation‐adjusted estimates as previously described.3, 25, 26 We assessed resource utilization among patients who received care on an SOS unit by determining length of stay and total, hospital, and physician costs for the specified surgical episode. We also assessed blood bank, ICU, laboratory, pharmacy, physical therapy, occupational therapy, respiratory therapy, radiology, and room‐and‐board costs. Blood bank costs consisted of the costs of storing, processing, and administering the transfusion. Surgical procedure, anesthesia, and preoperative service costs were excluded from our cost analyses, as our aim was to examine hospital flow and resource utilization from time of transfer from the postanesthesia care unit to hospital discharge in order to specifically examine the impact of an SOS unit. We compared unexpected ICU admissions and stays and the resources utilized of patients in these 2 groups.
State and federal death registries confirmed patient expiration and primary cause of death. In‐hospital mortality was defined as death during the same hospital admission as the indexed surgical episode. Thirty‐day mortality was defined as death occurring within 30 days of the surgical procedure. Readmission at 30 days was defined as any admission to our institutions within a 30‐day period whose purpose was possibly related to the initial surgical episode and not a result of an elective admission. A priori we were aware of the small number of these events in the elective joint population. Therefore, we combined inpatient 30‐day mortality, 30‐day reoperation, and 30‐day readmission rates as a composite endpoint.
Specialized Orthopedic Surgery Units
An SOS unit was defined as a general care nursing unit where patients receive all their postoperative care after elective TKA. Such a unit has a multidisciplinary staff that has orthopedic expertise. The differences between an SOS unit and a NON unit are described in Table 1. Bed availability at the time of discharge from the postanesthesia care unit was the exclusive factor for admission to this unit. Bed availability was dependent on staff availability or whether there was an excess number of operative cases. The number and severity of patient medical comorbidities or complications, the time of discharge from the postanesthesia care unit, and patient room preference had no impact on which unit patients were admitted to. Patients were allocated to the SOS group or the NON unit group according to their physical location the evening of admission. Monitored beds at this facility are solely located in the ICU, and neither SOS nor NON units have this capability. Any patient requiring a monitored bed at any time, regardless of the reason, would be transferred directly to the ICU. Daily rounds were performed on either unit by the primary orthopedic team. The need for either medical or pain service consultation was at the discretion of the primary orthopedic team and not dependent on the patient's physical location.
| Specialized orthopedic surgical unit (SOS) | Nonorthopedic nursing unit (NON) | |
|---|---|---|
| ||
| Type of unit | Orthopedic general care unit. | General surgical care unit. |
| Patient type | Postoperative elective orthopedic only. | Any patientmedical or surgical. |
| Determinants of physical location for orthopedic patient | Primary bed assignment. | Admitted only if SOS units have reached full bed capacity. |
| Orthopedic‐trained nursing staff | Yesrequired to have additional post‐RN* training in orthopedics. These RNs rarely float to nonorthopedic units. | Nomay have additional training or experience in an unrelated medical or surgical discipline. Floating to other units may occur. |
| Orthopedic‐specific physical + occupational therapy | Provided by certified physical therapists trained in lower‐extremity joint procedures. Site‐based therapy available to all patients on SOS units. | Provided by certified physical therapists who do not necessarily have postoperative orthopedic lower‐extremity specialization. Site‐based therapy on NON unit available to all patients. |
| Licensed social workers | Dedicated to postoperative needs of orthopedic patients physically located on SOS units. | Not specifically dedicated to the postoperative elective orthopedic joint patient and not physically located on these units. |
| Interdisciplinary team meetings | Patient care addressed in a interdisciplinary team meeting 3 times weeklyconsists of an RN, physical and occupational therapists, social worker, and physician. | No care team meetings, as patients are off‐service. |
| Physician postoperative order set | Orthopedic‐specific order set that is available hospitalwide. Nursing staff on these units is familiar with these order sets. | Orthopedic‐specific order set available hospitalwide. Nursing staff on these units may not be entirely familiar with these order sets. |
| Rehabilitation protocols | Orthopedic specific. | Not orthopedic specific. |
| Patient‐care instructions | Orthopedic diagnosis‐specific instructions readily available | Orthopedic diagnosis‐specific instructions available but requires staff to obtain information and forms from the SOS inits. |
| Discharge protocol | Specifically targeted to the postarthroplasty patient | Generic hospitalwide protocol. |
| Hospital discharge summary | Yescowritten by primary orthopedic team and primary orthopedic RN. | Yescowritten by primary orthopedic team and nonorthopedic RN. |
| Orthopedic‐specific discharge instructions | Yescowritten by primary orthopedic team and primary orthopedic RN. | No. |
All data were subsequently combined into a single database to facilitate data analysis. We further excluded 44 patients because no cost information was available, 9 patients who had multiple joint replacements performed during the specified surgical hospitalization, 69 patients because they had not authorized their medical records to be used for the purposes of research; 163 patients admitted directly to the ICU, 63 patients admitted the day prior to surgery, and 1 patient whose billing data suggested an outpatient encounter. A final patient cohort of 5534 patients was in the analysis. With the observed sample size and the overall variability, our study had 80% power to detect a difference between the 2 groups as small as 0.22 days in length of stay and $761 in hospital costs. The study was approved by our institutional review board. All study patients had authorized the use of their medical records for the purposes of research. Funding was obtained through an intramurally sponsored Small Grants Program by the Division of General Internal Medicine, which had no impact on the design of the study, reporting, or decision to submit an article on the study for publication.
Statistical Analysis
The statistical analysis compared baseline health and demographic characteristics of the patients cared for on SOS units with those cared for on NON units using chi‐square tests for nominal factors and the 2‐sample Wilcoxon rank sum tests for continuous variables. We used the chi‐square test to test for unadjusted differences in sex, patient residence (local or referred), race, individual Charlson comorbid conditions, anesthesia type, admitting diagnosis, 30‐day readmission rate, and discharge location. The 2‐sample Wilcoxon rank sum test assessed unadjusted differences in length of stay, costs, age, ICU days of stay, number of reoperations, total Charlson score and ASA class. Thirty‐day mortality rates were tested using the Fisher exact test.
Differences between patients in SOS and NON units in length of stay (LOS) and costs were the study's primary outcomes. We adjusted for baseline and surgical covariates using generalized linear regression models for these outcomes. The effect of the nursing unit was based on regression coefficients for age, sex, ASA class, anesthesia type, Charlson comorbidities, and surgical year. Age was analyzed using 5 categories: <55; 55‐64; 70‐74; 54‐69, and >75 years, with 65‐69 years used as the reference group. Each Charlson comorbid condition was treated as an indicator variable. Indicator variables were also assigned to surgical year, with 2004 used as the reference. These variables were subsequently entered into the model to calculate the differences between patients on an SOS unit and those on a NON unit.
Our secondary outcomes included ICU utilization and 30‐day outcomes of mortality, reoperations, and readmissions. We then assessed the effect of treatment on the SOS unit using the entire cohort (n = 5534) for unplanned postoperative ICU stay (yes or no) and on our combined endpoint after adjusting for the variables listed previously, using logistic regression models. A P value < 0.05 was considered statistically significant. All analyses were performed using statistical software (SAS, version 9.1; SAS Institute Inc, Cary, NC).
RESULTS
Baseline patient characteristics are represented in Table 2. Five thousand and eighty‐two patients were admitted to an SOS unit, and 452 patients were admitted to a NON unit. The annual number of patients undergoing TKA increased during our study period, as did the number of patients cared for on NON units. There were no differences between groups in the number of local county patients or in the number of patients primarily referred by other providers for elective arthroplasty. Mean length of stay was 4.9 days in both groups. After adjusting for the specified covariates, including age, sex, year of surgery, Charlson comorbidities, ASA class, and type of anesthesia, LOS was 0.234 days shorter in the SOS group (95% confidence interval [CI]: 0.08, 0.39; P = .002). Overall and hospital costs were significantly lower in the SOS group, as outlined with the other costs in Table 3. Room‐and‐board costs were 5.3% lower for SOS patients than for patients on NON units, representing a per‐patient difference of $244 $87 (95% CI: $72, $415; P = .005).
| Specialized orthopedic surgery unit (n = 5082) | Nonorthopedic nursing unit (n = 452) | P value | |||
|---|---|---|---|---|---|
| n | % | n | % | ||
| |||||
| Age (years) | |||||
| <55 | 534 | 10.5% | 57 | 12.6% | |
| 55‐64 | 1148 | 22.6% | 101 | 22.4% | |
| 65‐69 | 802 | 15.8% | 66 | 14.6% | |
| 70‐74 | 1106 | 21.8% | 91 | 20.1% | |
| >75 | 1492 | 29.4% | 137 | 30.3% | |
| Mean age ( SD*) | 68.3 10.75 | 67.9 11.5 | .50 | ||
| Sex | .70 | ||||
| Male | 2173 | 42.8% | 189 | 41.8% | |
| Female | 2909 | 57.2% | 263 | 58.2% | |
| Race | .28 | ||||
| White | 4731 | 93.1% | 420 | 92.9% | |
| Other* | 51 | 1.0% | 8 | 1.8% | |
| Unknown | 300 | 5.9% | 24 | 5.3% | |
| Local Olmsted County patients | 772 | 15.2% | 58 | 12.8% | .18 |
| Indication for surgery | .03 | ||||
| Osteoarthritis | 4778 | 94% | 430 | 95.1% | |
| Rheumatologic disease | 184 | 3.6% | 6 | 1.3% | |
| Avascular necrosis | 62 | 1.2% | 5 | 1.1% | |
| Congenital | 6 | 0.1% | 1 | 0.2% | |
| Cancer | 22 | 0.4% | 5 | 1.1% | |
| Other | 30 | 0.6% | 5 | 1.1% | |
| Year of surgery | < .001 | ||||
| 1996 | 497 | 98.8% | 6 | 1.19% | |
| 1997 | 571 | 99.7% | 2 | 0.35% | |
| 1998 | 479 | 98.8% | 6 | 1.24% | |
| 1999 | 487 | 94.8% | 27 | 5.25% | |
| 2000 | 458 | 92.7% | 36 | 7.29% | |
| 2001 | 502 | 86.7% | 77 | 13.3% | |
| 2002 | 593 | 89.2% | 72 | 10.8% | |
| 2003 | 639 | 87.1% | 95 | 12.9% | |
| 2004 | 856 | 86.7% | 131 | 13.3% | |
| Charlson score (mean SD) | 0.256 0.536 | 0.288 0.593 | .23 | ||
| AIDS | 0 | 0% | 1 | 0.22% | 1.00 |
| Cancer | 85 | 1.68% | 7 | 1.55% | .84 |
| Cerebrovascular disease | 32 | 0.63% | 0 | 0% | .09 |
| Chronic pulmonary disease | 28 | 5.63% | 23 | 5.09% | .63 |
| Congestive heart failure | 89 | 1.75% | 22 | 4.87% | < .001 |
| Dementia | 10 | 0.2% | 2 | 0.44% | .28 |
| Diabetes | 603 | 11.9% | 58 | 12.8% | .54 |
| Hemiplegia | 9 | 0.18% | 0 | 0% | .37 |
| Metastatic solid tumor | 11 | 0.22% | 2 | 0.44% | .34 |
| Myocardial infarction | 29 | 0.57% | 4 | 0.88% | .4 |
| Peripheral vascular disease | 67 | 1.32% | 4 | 0.88% | .43 |
| Renal disease | 52 | 1.02% | 5 | 1.11% | .87 |
| Rheumatologic disease | 12 | 0.24% | 2 | 0.44% | .40 |
| Ulcers | 15 | 0.3% | 0 | 0% | .25 |
| ASA class‖ | |||||
| I | 99 | 2.0% | 12 | 2.7% | |
| II | 2891 | 56.9% | 255 | 56.4% | |
| III | 2084 | 41.0% | 183 | 40.5% | |
| IV | 8 | 0.2% | 2 | 0.4% | |
| Average ASA class ( SD) | 2.39 0.53 | 2.39 0.55 | .80 | ||
| Anesthesia type | .02 | ||||
| General | 1644 | 32.4% | 143 | 31.6% | |
| Regional | 2742 | 54% | 226 | 50% | |
| Combined | 696 | 13.7% | 83 | 18.4% | |
| Unadjusted values | Adjusted values | ||||||||
|---|---|---|---|---|---|---|---|---|---|
| SOS* | SD | NON | SD | P value | Difference | SD | P value | 95% CI | |
| |||||||||
| Total cost | $9989 | $5392 | $10,067 | $5075 | .77 | $600 | $244 | .01 | $122, $1079 |
| Hospital costs | $9789 | $5123 | $ 9805 | $4647 | .23 | $594 | $231 | .01 | $141, $1047 |
| Room & board | $4399 | $1825 | $ 4577 | $1579 | .04 | $244 | $ 87 | .005 | $ 72, $ 415 |
| ICU costs | $ 58 | $1094 | $ 107 | $ 682 | .35 | $ 11 | $ 51 | .82 | $111, $ 88 |
| Pharmacy | $ 851 | $1701 | $ 931 | $1823 | .34 | $ 87 | $ 85 | .30 | $ 79, $253 |
| Laboratory costs | $ 386 | $ 438 | $ 395 | $ 405 | .65 | $ 27 | $ 20 | .18 | $ 12, $ 65 |
| Radiology costs | $ 98 | $ 205 | $ 103 | $ 183 | .61 | $ 1 | $ 10 | .93 | $ 20, $ 19 |
| PT/OT**/RT | $ 739 | $ 505 | $ 682 | $ 394 | .004 | $ 15 | $ 19 | .45 | $ 23, $ 52 |
| Blood bank | $ 159 | $ 306 | $ 178 | $3023 | .22 | $ 6 | $ 15 | .69 | $ 35, $ 23 |
| Physician costs | $ 207 | $ 464 | $ 258 | $ 628 | .09 | $ 20 | $ 22 | .386 | $ 24, $ 63 |
| E&M costs‖ | $ 89 | $ 211 | $ 109 | $ 238 | .09 | $ 4 | $ 9 | .658 | $ 23, $ 14 |
| Physician radiology | $ 63 | $ 158 | $ 38 | $ 192 | .49 | $ 2 | $ 8 | .78 | $ 13, $ 18 |
| Other costs | $ 34 | $ 138 | $ 37 | $ 160 | .61 | $0.64 | $ 6 | .92 | $ 13, $ 12 |
There were 83 patients (1.63%) transferred from SOS units to the ICU, compared with 14 patients (3.1%) transferred from NON units (P = .02), but no differences in the mean number of ICU days or associated costs between groups. A priori, the authors were aware of the small number of postoperative medical events in this population. In examining the combined endpoint of reoperations, readmissions, and mortality, there were no differences observed in our regression analysis between SOS patients and NON unit patients (0.03 events, standard error: 0.1859; odds ratio: 0.976). Table 4 demonstrates a higher percentage of patients discharged with home health on the NON units than on the SOS units (8.41% vs. 4.62%; P < .001).
| Specialized orthopedic surgery unit | Nonorthopedic nursing unit | P value | |||
|---|---|---|---|---|---|
| n* | % | n | % | ||
| |||||
| Home | 3812 | 75% | 328 | 72.6% | .252 |
| Home health | 235 | 4.62% | 38 | 8.41% | < .001 |
| Transferred to skilled nursing facility | 1030 | 20.3% | 86 | 19% | .529 |
DISCUSSION
To the best of our knowledge, this is the first study to examine the impact of specialized orthopedic surgery units on resource utilization in elective knee arthroplasty patients. Our findings demonstrate that patients admitted following elective TKA to SOS units will have a reduced length of stay, lower overall and hospital costs, and fewer unexpected transfers to higher levels of care (ICUs). We believe that these findings are a result in part of the specialized expertise allied health care providers develop by taking care of and focusing on a large volume of patients over time with the same group and type of surgeons. This multidisciplinary setting in which care providers are familiar not only with each other but with this specific population of patients creates the environment necessary for adherence to specialized clinical pathways.27
Patient LOS is an important determinant of resource utilization. In a study by Husted et al., the mean length of stay in Danish hospitals following TKA was 8.6 days in 2003.28 An epidemiological study using the Nationwide Inpatient Sample database of patients in the United States showed that from 1998 to 2000, the mean LOS was 4.3 days.18 In our study, the mean LOS was slightly higher (4.9 days), potentially reflecting referral bias. Achieving additional savings and improved outcomes by further reducing LOS in an environment in which care pathways are already in place is often difficult; hence, alternative approaches and strategies are often necessary.29, 30 Our results suggest that in TKA patients, after adjusting for other factors, there is a decrease in the length of stay of 0.234 days among those cared for on SOS units. However, we cannot state that the existence of the clinical pathway alone is responsible for our data differences because certain components of the care pathway for elective TKA patients are used throughout the hospital regardless of type of postoperative nursing unit. We believe that the interdisciplinary specialty care provided to orthopedic patients on SOS units is a critical component of a successfully implemented care pathway and not just a convenience or practice preference. The same surgeons admitting patients to the same nursing unit, with the same nurses, physical therapists and pharmacists providing care to the same type of patient population over time, leverages the collective experience of all care providers. This integrated, multidisciplinary teamwork may optimize timeliness, achieve incremental cost savings, and improve safety (including a decreased number of unanticipated transfers to an ICU setting).
Clinical pathways are known to reduce overall costs, normally by reducing LOS,29, 3133 and our results suggest approximately an incremental 6% cost reduction with the use of improving patient logistics by using SOS units. An economic evaluation study by Healy et al. suggests that focusing on nursing units may be a means of reducing total costs.29 Our cost savings were slightly lower than the reported savings by other practice assessments; however, we excluded operative and anesthesia costs, both significant contributors to overall and hospital costs. By eliminating these variables, our costs were specifically limited to the postoperative course, which is highly dependent on specialized interdisciplinary care.29
Providing specialized care has a significant impact on society. Although there is a per‐patient savings of only $600 when elective TKA patients are cared for on SOS units, this could be the difference between a positive and negative margin in the setting of fixed reimbursement. With a current average of 90 patients annually triaged postoperatively to NON units, there is a potential loss of $54,000 annually at our institution in just this single patient population with the current mechanisms of perioperative hospital flow. Multiply this potential savings to a national level, and the total is significant. With an aging population, the number of arthroplasties and concomitantly the number of hospitalizations in general are likely to increase, suggesting that changes in hospital flow are required to ensure optimal, cost‐effective care in the best setting available for patients. Such care is often related to surgical volume, and our institution observes such volume. Our results indicate that SOS units are one possible means of achieving this objective of fiscal sustainability, but further studies are needed to determine the indirect and hidden costs of sustaining such units in order to observe the actual cost savings.34 It could be argued that for elective TKA patients to have the most optimal outcomes and most efficient care, the surgical procedure should be performed only if beds are available on the nursing units whose staff has the most specific training.
Thirty‐Day Outcomes
We elected to combine 30‐day mortality, reoperations, and readmissions pertaining to the joint procedure as a composite endpoint and found no differences in outcomes between groups. These results suggest that these longer‐term patient‐specific outcomes are likely not related to the specialty nursing care. We used a 30‐day endpoint assuming that a longer period may have led to the inclusion of deaths that were not directly attributable to the surgical intervention. In addition, a previous study advocated using 30 days as an endpoint for follow‐up, as it adequately accounts for adverse events.35 Our institution is also a referral center; hence, we would likely be unable to capture all events if we were to use the standard 90‐day period used for payment for this procedure, as these data are not canvassed by the joint registry.
Discharge Disposition
NON unit patients tended to have a higher degree of home health arranged at discharge. The NON unit nursing staff cares for other nonorthopedic surgical patients daily and may transfer their patterns of care utilization to the orthopedic patients despite different postoperative needs. In addition, if NON unit nursing staff members care for TKA patients only intermittently, they may not have as clear a working understanding of the particular postoperative requirements of TKA patients and consequently request unnecessary home health services and general community resources. Alternatively, patients cared for on NON units may actually have needed more assistance and more services on discharge. Although purely speculative, patients cared for by dedicated orthopedic surgery staff may develop added confidence from the experience of the allied care staff and feel less of a need for postdismissal services.
Role of Hospitalists in Specialized Care Pathways
Hospitalists are known to improve efficiency without reducing patient satisfaction. Their role has been demonstrated in different patient populations.1, 2, 3638 In a study of hip fracture patients, a hospitalist care model demonstrated a reduction in length of stay and time to surgery, without compromising long‐term outcomes.4, 39 Utilizing a hospitalist/midlevel care provider team approach to reduce LOS in units with a static number of beds can possibly increase bed turnover and prevent triaging of patients onto NON units. This is but one example of how a medical‐surgical partnership can improve outcomes. However, in an era where cost‐effective and regulatory practices require optimal resource allocation, hospitalists are in a key position to foster quality improvement projects, promote patient safety measures, and enhance systems care delivery. Becoming involved in designing specialized clinical units, with an emphasis on a multidisciplinary care approach, and developing their relationships with hospital administrators and nursing staff should be among their priorities. The Society of Hospital Medicine has also been committed to the care of the elderly through its core competencies40 and the orthopedic population that will benefit from such process changes and care pathways. Hospital innovations such as the implementation of SOS‐type units not only for other medical‐surgical partnerships but also for site‐based units caring for geriatric patients can be top priorities for hospitalists.
Strengths and Applicability
Our results are important in that they can likely be applied to both large tertiary‐care centers and smaller community‐based centers that perform specialized orthopedic surgeries. Nurses on specialized orthopedic units are very familiar with this postoperative population and have developed expertise in the care of these patients. These experienced nurses can likely be found on orthopedic units in tertiary‐care centers or surgical units in smaller facilities. Furthermore, our results support the benefits of interdisciplinary advanced teamwork. When an interdisciplinary group of health care providers works together on a daily basis, certain habits and patterns inevitably develop that often are unplanned and may be difficult to measure. This enhanced patient flow may not occur if these patients are cared for by providers unfamiliar with each other's work patterns. The importance of optimized teamwork is not hospital‐size dependent. Only primary elective knee arthroplasties were included to minimize confounding bias by bilateral or revision surgeries or indications such as septic arthritis, which are known to lead to increased length of stay, costs and complications.41
Limitations
Our study has the limitations of its retrospective nonrandomized study design, and only a prospective, randomized investigation could definitively address our aims. By excluding sicker patients, such as those referred with complicated health issues or high‐risk patients who required admission in advance of the proposed surgery for monitoring of perioperative anticoagulation issues, our estimates of possible differences between our comparison groups may have been conservative. We are unaware of how these sicker patients would fare on either nursing unit. Furthermore, what occurs in the hospital setting may not only have an impact on the hospital stay but may also influence long‐term outcomes. This is impossible to assess with analysis of administrative databases.
We relied on the complete and accurate recording of data from various databases, depending on the validity of data entry and collection. With a large cohort of patients, any errors in documentation or abstraction would be expected to be similar in both groups. Furthermore, confounding variables such as patient comorbidities are extracted from administrative data sets whose personnel might not be as familiar with the medical aspects of patient care. We used linear and logistic regression analyses to account for known differences in baseline characteristics despite the sample sizes being proportionally larger in the SOS group. Although we attribute the shortened length of stay in the SOS group to the interdisciplinary team approach, we were unable to determine to what extent this was a result of nursing staff or discharge planning. By using administrative databases, we were unable to abstract the consensus time and date of discharge, when all hospital staff deemed the patient ready for discharge, and hence relied on the actual time of discharge, which can be heavily reliant on availability at skilled nursing facilities. In addition, it was unknown whether patients discharged from SOS units were, by matter of protocol, discharged earlier in the day. Nevertheless, this small difference in length of stay can improve patient flow by opening up postoperative patient beds. Furthermore, such data sets are unable to provide information on patient satisfaction or quality‐of‐life measures, both of which are important determinants in specialized care pathways.42 The patient population served by our institution is generally ethnically homogeneous, thereby limiting potential generalizations to tertiary‐care centers or geographical areas with a population similar to ours. Our study also was not intended as a formal cost‐effectiveness analysis; hence, the impact of possible startup costs to begin a similar nursing unit was not explored. Although differences in practice management can be considered a limitation of not only operative but also perioperative care, we neither expected nor encountered any significant or drastic alterations during the study period, and year of surgery was adjusted for in our analysis. However, prospective randomized controlled studies testing specific clinical pathways and practice‐related innovations are needed to better examine these outcomes.
CONCLUSIONS
In conclusion, postoperative patients after elective knee arthroplasty cared for on specialized orthopedic surgery units have shorter length of stays and cost hospitals less than patients admitted to nonspecialized orthopedic nursing units. In an era in which quality indicators and external reviews are forcing practitioners and health care organizations to become increasingly responsible for their own practices, more research is required to better address specific questions pertaining to different processes of care. Our study is meant to increase the attention paid to patient flow and postoperative logistics in the elective TKA population. SOS units, as a unique model of care, may become an additional step toward ensuring quality care and improved resource utilization.
Acknowledgements
The authors thank Donna K. Lawson, LPN, for her assistance in data collection and management.
- ,,,,,.Implementation of a voluntary hospitalist service at a community teaching hospital: improved clinical efficiency and patient outcomes.Ann Intern Med.2002;137:859–865.
- ,,, et al.Effects of physician experience on costs and outcomes on an academic general medicine service: results of a trial of hospitalists.Ann Intern Med.2002;137:866–874.
- ,,, et al.Medical and surgical comanagement after elective hip and knee arthroplasty: a randomized, controlled trial.Ann Intern Med.2004;141:28–38.
- ,,, et al.Effects of a hospitalist model on elderly patients with hip fracture.Arch Intern Med.2005;165:796–801.
- ,,,,.The economic benefit for family/general medicine practices employing physician assistants.Am J Manag Care.2002;8:613–620.
- ,,, et al.Economic evaluation of Australian stroke services: a prospective, multicenter study comparing dedicated stroke units with other care modalities.Stroke.2006;37:2790–2795.
- ,,,.Geriatric evaluation and management units in the care of the frail elderly cancer patient.J Gerontol A Biol Sci Med Sci.2005;60:798–803.
- ,,,,,.A randomized, controlled trial of a geriatric assessment unit in a community rehabilitation hospital.N Engl J Med.1990;322:1572–1578.
- ,.The effect of longevity on spending for acute and long‐term care.N Engl J Med.2000;342:1409–1415.
- ,,, et al.The Bone and Joint Decade 2000‐2010.Acta Orthop Scand.1998;69:219–220.
- .The Bone and Joint Decade 2000‐2010— for prevention and treatment of musculoskeletal disease.Osteoarthr Cartil.1998;7:1–4.
- Prevalence of self‐reported arthritis or chronic joint symptoms among adults—United States, 2001.MMWR Morb Mortal Wkly Rep.2002;51:948–950.
- ,,, et al.Estimates of the prevalence of arthritis and selected musculoskeletal disorders in the United States.Arthritis Rheum.1998;41:778–799.
- HCUPnet, Healthcare Cost and Utilization Project. Agency for Healthcare Research and Quality, 2002. Available at: http://www.ahrq.gov. Accessed January 25,2005.
- ,,,,,.Costs and cost‐effectiveness in hip and knee replacements. A prospective study.Int J Technol Assess Health Care.1997;13:575–588.
- ,,,,.Trends in total knee replacement surgeries and implications for public health, 1990‐2000.Public Health Rep.2005;120:278–282.
- ,,, et al.Demographic variation in the rate of knee replacement: a multi‐year analysis.Health Serv Res.1996;31:125–140.
- ,,,,.Trends in the epidemiology of total shoulder arthroplasty in the United States from 1990‐2000.Arthritis Rheum.2006;55:591–597.
- ,.2001 National Hospital Discharge Survey.Adv Data.2003;332.
- ,.2002 National Hospital Discharge Survey.Adv Data.2004:1–29.
- ,,.Costs of health care administration in the United States and Canada.N Engl J Med2003;349:768–775.
- ,,.Maintaining a hip registry for 25 years. Mayo Clinic experience.Clin Orthop Relat Res.1997:61–68.
- ,,,.Validation of a combined comorbidity index.J Clin Epidemiol.1994;47:1245–1251.
- ,,,.A new method of classifying prognostic comorbidity in longitudinal studies: development and validation.J Chronic Dis.1987;40:373–383.
- ,,, et al.A prospective randomized comparison of laparoscopic appendectomy with open appendectomy: Clinical and economic analyses.Surgery.2001;129:390–400.
- ,,, et al.Incremental costs of enrolling cancer patients in clinical trials: a population‐based study.J Natl Cancer Inst.1999;91:847–853.
- ,.Understanding the complexity of redesigning care around the clinical microsystem.Qual Saf Health Care.2006;15(Suppl 1):i10–i16.
- ,,, et al.Length of stay after primary total hip and knee arthroplasty in Denmark, 2001‐2003.Ugeskr Laeger.2006;168:276–279.
- ,,,.Opportunities for control of hospital costs for total joint arthroplasty after initial cost containment.J Arthroplasty.1998;13:504–507.
- ,,,,.Effectiveness of clinical pathways for total knee and total hip arthroplasty: literature review.J Arthroplasty.2003;18:69–74.
- ,,, et al.The effect of a perioperative clinical pathway for knee replacement surgery on hospital costs.Anesth Analg.1998;86:978–984.
- The cost effectiveness of streamlined care pathways and product standardization in total knee arthroplasty.J Arthroplasty.1999;14:182–186.
- ,,,,.Impact of cost reduction programs on short‐term patient outcome and hospital cost of total knee arthroplasty.J Bone Joint Surg Am.2002;84‐A:348–353.
- ,,,.Success of clinical pathways for total joint arthroplasty in a community hospital.Clin Orthop Relat Res.2007;457:133–137.
- ,,,.Optimal timeframe for reporting short‐term complication rates after total knee arthroplasty.J Arthroplasty.2006;21:705–711.
- ,,.Associations with reduced length of stay and costs on an academic hospitalist service.Am J Manag Care.2004;10:561–568.
- ,,.Is there a geriatrician in the house? Geriatric care approaches in hospitalist programs.J Hosp Med.2006;1:29–35.
- .Care of hospitalized older patients: opportunities for hospital‐based physicians.J Hosp Med.2006;1:42–47.
- ,,, et al.Effects of a hospitalist care model on mortality of elderly patients with hip fractures.J Hosp Med.2007;2:219–225.
- ,,,,.Core competencies in hospital medicine: development and methodology.J Hosp Med.2006;1:48–56.
- ,,,,,.Effect of feedback on resource use and morbidity in hip and knee arthroplasty in an integrated group practice setting.Mayo Clin Proc.1996;71:127–133.
- ,,,.Integrated care pathways.BMJ.1998;316:133–137.
Hospital practices are increasingly responsible for ensuring enhanced patient safety, satisfaction, and cost containment. Recently developed models of care have achieved the necessary efficiency to attain these measures, not only in the use of hospitalists managing general medical1, 2 and postoperative orthopedic patients,3, 4 but also in the use of midlevel providers in busy primary care settings.5 In addition, stroke units6 and geriatric evaluation and management units7, 8 worldwide have demonstrated reduced disability and improved survival and importantly have been proven to provide cost‐effective care. Specialized orthopedic surgery (SOS) units may be a means to reproduce the results observed in these other models.
The economic potential of SOS units will become more significant with changing demographics. The percentage of patients greater than 65 years old will increase, from 12.3% in 2002 to 20% by 2030, with a parallel increase in the prevalence of osteoarthritis (OA).9 The World Health Organization has declared 2000‐2010 the Bone and Joint Decade,10, 11 reflecting that OA affects some 43 million people, with more than 60 million projected to be affected by 2020.12, 13 The National Center for Health Statistics reported that more than 280,000 total knee arthroplasties (TKAs) are performed annually in the United States, which marks an increase in frequency in the last decade that is likely to continue.1419
Approximately 75% of all TKAs are reimbursed under Medicare,17 whereas elective TKA continues to be one of the most common surgeries in the Medicare‐age patient population,20 foreshadowing the prominent cost burden of osteoarthritis in the aging population. The concomitant decreasing reimbursement for arthroplasty in general supports an examination of what constitutes efficient, high‐quality, and cost‐effective care21 for TKA. At our institution, patients undergoing TKA are preferentially triaged to an SOS nursing unit for postoperative care. As hospital bed capacity continues to decline, patients may be triaged to open beds at locations that may not be the optimal choice for nursing care. The primary purpose of this study was to determine the impact of SOS units versus nonorthopedic nursing (NON) units on resource utilization for and outcomes of patients undergoing elective knee arthroplasty. We hypothesized that length of stay would be shorter and cost of inpatient care would be lower for patients cared for on SOS units.
MATERIALS AND METHODS
Study Design and Setting
We conducted a retrospective observational cohort study of all patients undergoing elective primary TKA from January 1, 1996, to December 31, 2004, comparing outcomes of patients assigned to SOS units with those of patients assigned to NON units. Patients were admitted to Rochester Methodist Hospital, Mayo Clinic, a tertiary‐care primary surgical teaching hospital that has 794 beds and more than 15,000 admissions annually. There were 13 faculty orthopedic surgeons performing elective nontraumatic lower‐extremity joint procedures during the study period, each with orthopedic residents rotating as part of the patient care team.
Study Population
All patients at Mayo Clinic who had undergone a joint replacement were followed prospectively, and data were collected using standardized forms and protocols, the methodologies of which have been described previously.22 Follow‐up was greater than 95% complete. Using the joint registry, patients who had undergone a TKA were identified (n = 9798). Postoperative patients initially transferred from the postanesthesia care unit to a general care floor were included. We excluded patients who required urgent, revision, or bilateral arthroplasties; who had been treated at or transferred from another institution; and whose primary surgical indication was trauma or septic arthritis. Subjects admitted to the hospital on the day prior to the procedure and subjects initially transferred directly from the postanesthesia care unit to the intensive care unit (ICU) were excluded, including patients requiring immediate postoperative cardiac monitoring. All primary surgical interventions were performed between Monday and Friday. The study authors identified 5883 eligible patients.
Patient clinical and demographic data including surgical indication; age; sex; height and weight at surgery; and dates of admission, surgery, death, discharge, and last follow‐up were abstracted from the registry. Type of anesthesia (general, regional, combined), American Society of Anesthesiologists (ASA) physical status class, and date and time of ICU admission and discharge were abstracted from individual departmental databases. The Decision Support System (DSS) administrative database (Eclipsys, Boca Raton, FL) was utilized to abstract relevant clinical variables, including major comorbid conditions such as cancer, cerebrovascular disease, chronic pulmonary disease, congestive heart failure, dementia, diabetes, hemiplegia, HIV/AIDS, metastatic solid tumors, myocardial infarction, peripheral vascular disease, renal disease, rheumatologic disease, and ulcers. A composite Charlson comorbidity score was computed as previously described.23, 24 Administrative variables regarding patient encounters including inpatient stay variableslength of stay, costs, patient location, nursing care units, admission times, discharge disposition and datewere also obtained from the DSS database.
Variables and Definitions
Length of stay was defined as the number of days from time of admission for the surgical episode to time of discharge. All costs were based on a provider perspective using standardized 2005 costs based on inflation‐adjusted estimates as previously described.3, 25, 26 We assessed resource utilization among patients who received care on an SOS unit by determining length of stay and total, hospital, and physician costs for the specified surgical episode. We also assessed blood bank, ICU, laboratory, pharmacy, physical therapy, occupational therapy, respiratory therapy, radiology, and room‐and‐board costs. Blood bank costs consisted of the costs of storing, processing, and administering the transfusion. Surgical procedure, anesthesia, and preoperative service costs were excluded from our cost analyses, as our aim was to examine hospital flow and resource utilization from time of transfer from the postanesthesia care unit to hospital discharge in order to specifically examine the impact of an SOS unit. We compared unexpected ICU admissions and stays and the resources utilized of patients in these 2 groups.
State and federal death registries confirmed patient expiration and primary cause of death. In‐hospital mortality was defined as death during the same hospital admission as the indexed surgical episode. Thirty‐day mortality was defined as death occurring within 30 days of the surgical procedure. Readmission at 30 days was defined as any admission to our institutions within a 30‐day period whose purpose was possibly related to the initial surgical episode and not a result of an elective admission. A priori we were aware of the small number of these events in the elective joint population. Therefore, we combined inpatient 30‐day mortality, 30‐day reoperation, and 30‐day readmission rates as a composite endpoint.
Specialized Orthopedic Surgery Units
An SOS unit was defined as a general care nursing unit where patients receive all their postoperative care after elective TKA. Such a unit has a multidisciplinary staff that has orthopedic expertise. The differences between an SOS unit and a NON unit are described in Table 1. Bed availability at the time of discharge from the postanesthesia care unit was the exclusive factor for admission to this unit. Bed availability was dependent on staff availability or whether there was an excess number of operative cases. The number and severity of patient medical comorbidities or complications, the time of discharge from the postanesthesia care unit, and patient room preference had no impact on which unit patients were admitted to. Patients were allocated to the SOS group or the NON unit group according to their physical location the evening of admission. Monitored beds at this facility are solely located in the ICU, and neither SOS nor NON units have this capability. Any patient requiring a monitored bed at any time, regardless of the reason, would be transferred directly to the ICU. Daily rounds were performed on either unit by the primary orthopedic team. The need for either medical or pain service consultation was at the discretion of the primary orthopedic team and not dependent on the patient's physical location.
| Specialized orthopedic surgical unit (SOS) | Nonorthopedic nursing unit (NON) | |
|---|---|---|
| ||
| Type of unit | Orthopedic general care unit. | General surgical care unit. |
| Patient type | Postoperative elective orthopedic only. | Any patientmedical or surgical. |
| Determinants of physical location for orthopedic patient | Primary bed assignment. | Admitted only if SOS units have reached full bed capacity. |
| Orthopedic‐trained nursing staff | Yesrequired to have additional post‐RN* training in orthopedics. These RNs rarely float to nonorthopedic units. | Nomay have additional training or experience in an unrelated medical or surgical discipline. Floating to other units may occur. |
| Orthopedic‐specific physical + occupational therapy | Provided by certified physical therapists trained in lower‐extremity joint procedures. Site‐based therapy available to all patients on SOS units. | Provided by certified physical therapists who do not necessarily have postoperative orthopedic lower‐extremity specialization. Site‐based therapy on NON unit available to all patients. |
| Licensed social workers | Dedicated to postoperative needs of orthopedic patients physically located on SOS units. | Not specifically dedicated to the postoperative elective orthopedic joint patient and not physically located on these units. |
| Interdisciplinary team meetings | Patient care addressed in a interdisciplinary team meeting 3 times weeklyconsists of an RN, physical and occupational therapists, social worker, and physician. | No care team meetings, as patients are off‐service. |
| Physician postoperative order set | Orthopedic‐specific order set that is available hospitalwide. Nursing staff on these units is familiar with these order sets. | Orthopedic‐specific order set available hospitalwide. Nursing staff on these units may not be entirely familiar with these order sets. |
| Rehabilitation protocols | Orthopedic specific. | Not orthopedic specific. |
| Patient‐care instructions | Orthopedic diagnosis‐specific instructions readily available | Orthopedic diagnosis‐specific instructions available but requires staff to obtain information and forms from the SOS inits. |
| Discharge protocol | Specifically targeted to the postarthroplasty patient | Generic hospitalwide protocol. |
| Hospital discharge summary | Yescowritten by primary orthopedic team and primary orthopedic RN. | Yescowritten by primary orthopedic team and nonorthopedic RN. |
| Orthopedic‐specific discharge instructions | Yescowritten by primary orthopedic team and primary orthopedic RN. | No. |
All data were subsequently combined into a single database to facilitate data analysis. We further excluded 44 patients because no cost information was available, 9 patients who had multiple joint replacements performed during the specified surgical hospitalization, 69 patients because they had not authorized their medical records to be used for the purposes of research; 163 patients admitted directly to the ICU, 63 patients admitted the day prior to surgery, and 1 patient whose billing data suggested an outpatient encounter. A final patient cohort of 5534 patients was in the analysis. With the observed sample size and the overall variability, our study had 80% power to detect a difference between the 2 groups as small as 0.22 days in length of stay and $761 in hospital costs. The study was approved by our institutional review board. All study patients had authorized the use of their medical records for the purposes of research. Funding was obtained through an intramurally sponsored Small Grants Program by the Division of General Internal Medicine, which had no impact on the design of the study, reporting, or decision to submit an article on the study for publication.
Statistical Analysis
The statistical analysis compared baseline health and demographic characteristics of the patients cared for on SOS units with those cared for on NON units using chi‐square tests for nominal factors and the 2‐sample Wilcoxon rank sum tests for continuous variables. We used the chi‐square test to test for unadjusted differences in sex, patient residence (local or referred), race, individual Charlson comorbid conditions, anesthesia type, admitting diagnosis, 30‐day readmission rate, and discharge location. The 2‐sample Wilcoxon rank sum test assessed unadjusted differences in length of stay, costs, age, ICU days of stay, number of reoperations, total Charlson score and ASA class. Thirty‐day mortality rates were tested using the Fisher exact test.
Differences between patients in SOS and NON units in length of stay (LOS) and costs were the study's primary outcomes. We adjusted for baseline and surgical covariates using generalized linear regression models for these outcomes. The effect of the nursing unit was based on regression coefficients for age, sex, ASA class, anesthesia type, Charlson comorbidities, and surgical year. Age was analyzed using 5 categories: <55; 55‐64; 70‐74; 54‐69, and >75 years, with 65‐69 years used as the reference group. Each Charlson comorbid condition was treated as an indicator variable. Indicator variables were also assigned to surgical year, with 2004 used as the reference. These variables were subsequently entered into the model to calculate the differences between patients on an SOS unit and those on a NON unit.
Our secondary outcomes included ICU utilization and 30‐day outcomes of mortality, reoperations, and readmissions. We then assessed the effect of treatment on the SOS unit using the entire cohort (n = 5534) for unplanned postoperative ICU stay (yes or no) and on our combined endpoint after adjusting for the variables listed previously, using logistic regression models. A P value < 0.05 was considered statistically significant. All analyses were performed using statistical software (SAS, version 9.1; SAS Institute Inc, Cary, NC).
RESULTS
Baseline patient characteristics are represented in Table 2. Five thousand and eighty‐two patients were admitted to an SOS unit, and 452 patients were admitted to a NON unit. The annual number of patients undergoing TKA increased during our study period, as did the number of patients cared for on NON units. There were no differences between groups in the number of local county patients or in the number of patients primarily referred by other providers for elective arthroplasty. Mean length of stay was 4.9 days in both groups. After adjusting for the specified covariates, including age, sex, year of surgery, Charlson comorbidities, ASA class, and type of anesthesia, LOS was 0.234 days shorter in the SOS group (95% confidence interval [CI]: 0.08, 0.39; P = .002). Overall and hospital costs were significantly lower in the SOS group, as outlined with the other costs in Table 3. Room‐and‐board costs were 5.3% lower for SOS patients than for patients on NON units, representing a per‐patient difference of $244 $87 (95% CI: $72, $415; P = .005).
| Specialized orthopedic surgery unit (n = 5082) | Nonorthopedic nursing unit (n = 452) | P value | |||
|---|---|---|---|---|---|
| n | % | n | % | ||
| |||||
| Age (years) | |||||
| <55 | 534 | 10.5% | 57 | 12.6% | |
| 55‐64 | 1148 | 22.6% | 101 | 22.4% | |
| 65‐69 | 802 | 15.8% | 66 | 14.6% | |
| 70‐74 | 1106 | 21.8% | 91 | 20.1% | |
| >75 | 1492 | 29.4% | 137 | 30.3% | |
| Mean age ( SD*) | 68.3 10.75 | 67.9 11.5 | .50 | ||
| Sex | .70 | ||||
| Male | 2173 | 42.8% | 189 | 41.8% | |
| Female | 2909 | 57.2% | 263 | 58.2% | |
| Race | .28 | ||||
| White | 4731 | 93.1% | 420 | 92.9% | |
| Other* | 51 | 1.0% | 8 | 1.8% | |
| Unknown | 300 | 5.9% | 24 | 5.3% | |
| Local Olmsted County patients | 772 | 15.2% | 58 | 12.8% | .18 |
| Indication for surgery | .03 | ||||
| Osteoarthritis | 4778 | 94% | 430 | 95.1% | |
| Rheumatologic disease | 184 | 3.6% | 6 | 1.3% | |
| Avascular necrosis | 62 | 1.2% | 5 | 1.1% | |
| Congenital | 6 | 0.1% | 1 | 0.2% | |
| Cancer | 22 | 0.4% | 5 | 1.1% | |
| Other | 30 | 0.6% | 5 | 1.1% | |
| Year of surgery | < .001 | ||||
| 1996 | 497 | 98.8% | 6 | 1.19% | |
| 1997 | 571 | 99.7% | 2 | 0.35% | |
| 1998 | 479 | 98.8% | 6 | 1.24% | |
| 1999 | 487 | 94.8% | 27 | 5.25% | |
| 2000 | 458 | 92.7% | 36 | 7.29% | |
| 2001 | 502 | 86.7% | 77 | 13.3% | |
| 2002 | 593 | 89.2% | 72 | 10.8% | |
| 2003 | 639 | 87.1% | 95 | 12.9% | |
| 2004 | 856 | 86.7% | 131 | 13.3% | |
| Charlson score (mean SD) | 0.256 0.536 | 0.288 0.593 | .23 | ||
| AIDS | 0 | 0% | 1 | 0.22% | 1.00 |
| Cancer | 85 | 1.68% | 7 | 1.55% | .84 |
| Cerebrovascular disease | 32 | 0.63% | 0 | 0% | .09 |
| Chronic pulmonary disease | 28 | 5.63% | 23 | 5.09% | .63 |
| Congestive heart failure | 89 | 1.75% | 22 | 4.87% | < .001 |
| Dementia | 10 | 0.2% | 2 | 0.44% | .28 |
| Diabetes | 603 | 11.9% | 58 | 12.8% | .54 |
| Hemiplegia | 9 | 0.18% | 0 | 0% | .37 |
| Metastatic solid tumor | 11 | 0.22% | 2 | 0.44% | .34 |
| Myocardial infarction | 29 | 0.57% | 4 | 0.88% | .4 |
| Peripheral vascular disease | 67 | 1.32% | 4 | 0.88% | .43 |
| Renal disease | 52 | 1.02% | 5 | 1.11% | .87 |
| Rheumatologic disease | 12 | 0.24% | 2 | 0.44% | .40 |
| Ulcers | 15 | 0.3% | 0 | 0% | .25 |
| ASA class‖ | |||||
| I | 99 | 2.0% | 12 | 2.7% | |
| II | 2891 | 56.9% | 255 | 56.4% | |
| III | 2084 | 41.0% | 183 | 40.5% | |
| IV | 8 | 0.2% | 2 | 0.4% | |
| Average ASA class ( SD) | 2.39 0.53 | 2.39 0.55 | .80 | ||
| Anesthesia type | .02 | ||||
| General | 1644 | 32.4% | 143 | 31.6% | |
| Regional | 2742 | 54% | 226 | 50% | |
| Combined | 696 | 13.7% | 83 | 18.4% | |
| Unadjusted values | Adjusted values | ||||||||
|---|---|---|---|---|---|---|---|---|---|
| SOS* | SD | NON | SD | P value | Difference | SD | P value | 95% CI | |
| |||||||||
| Total cost | $9989 | $5392 | $10,067 | $5075 | .77 | $600 | $244 | .01 | $122, $1079 |
| Hospital costs | $9789 | $5123 | $ 9805 | $4647 | .23 | $594 | $231 | .01 | $141, $1047 |
| Room & board | $4399 | $1825 | $ 4577 | $1579 | .04 | $244 | $ 87 | .005 | $ 72, $ 415 |
| ICU costs | $ 58 | $1094 | $ 107 | $ 682 | .35 | $ 11 | $ 51 | .82 | $111, $ 88 |
| Pharmacy | $ 851 | $1701 | $ 931 | $1823 | .34 | $ 87 | $ 85 | .30 | $ 79, $253 |
| Laboratory costs | $ 386 | $ 438 | $ 395 | $ 405 | .65 | $ 27 | $ 20 | .18 | $ 12, $ 65 |
| Radiology costs | $ 98 | $ 205 | $ 103 | $ 183 | .61 | $ 1 | $ 10 | .93 | $ 20, $ 19 |
| PT/OT**/RT | $ 739 | $ 505 | $ 682 | $ 394 | .004 | $ 15 | $ 19 | .45 | $ 23, $ 52 |
| Blood bank | $ 159 | $ 306 | $ 178 | $3023 | .22 | $ 6 | $ 15 | .69 | $ 35, $ 23 |
| Physician costs | $ 207 | $ 464 | $ 258 | $ 628 | .09 | $ 20 | $ 22 | .386 | $ 24, $ 63 |
| E&M costs‖ | $ 89 | $ 211 | $ 109 | $ 238 | .09 | $ 4 | $ 9 | .658 | $ 23, $ 14 |
| Physician radiology | $ 63 | $ 158 | $ 38 | $ 192 | .49 | $ 2 | $ 8 | .78 | $ 13, $ 18 |
| Other costs | $ 34 | $ 138 | $ 37 | $ 160 | .61 | $0.64 | $ 6 | .92 | $ 13, $ 12 |
There were 83 patients (1.63%) transferred from SOS units to the ICU, compared with 14 patients (3.1%) transferred from NON units (P = .02), but no differences in the mean number of ICU days or associated costs between groups. A priori, the authors were aware of the small number of postoperative medical events in this population. In examining the combined endpoint of reoperations, readmissions, and mortality, there were no differences observed in our regression analysis between SOS patients and NON unit patients (0.03 events, standard error: 0.1859; odds ratio: 0.976). Table 4 demonstrates a higher percentage of patients discharged with home health on the NON units than on the SOS units (8.41% vs. 4.62%; P < .001).
| Specialized orthopedic surgery unit | Nonorthopedic nursing unit | P value | |||
|---|---|---|---|---|---|
| n* | % | n | % | ||
| |||||
| Home | 3812 | 75% | 328 | 72.6% | .252 |
| Home health | 235 | 4.62% | 38 | 8.41% | < .001 |
| Transferred to skilled nursing facility | 1030 | 20.3% | 86 | 19% | .529 |
DISCUSSION
To the best of our knowledge, this is the first study to examine the impact of specialized orthopedic surgery units on resource utilization in elective knee arthroplasty patients. Our findings demonstrate that patients admitted following elective TKA to SOS units will have a reduced length of stay, lower overall and hospital costs, and fewer unexpected transfers to higher levels of care (ICUs). We believe that these findings are a result in part of the specialized expertise allied health care providers develop by taking care of and focusing on a large volume of patients over time with the same group and type of surgeons. This multidisciplinary setting in which care providers are familiar not only with each other but with this specific population of patients creates the environment necessary for adherence to specialized clinical pathways.27
Patient LOS is an important determinant of resource utilization. In a study by Husted et al., the mean length of stay in Danish hospitals following TKA was 8.6 days in 2003.28 An epidemiological study using the Nationwide Inpatient Sample database of patients in the United States showed that from 1998 to 2000, the mean LOS was 4.3 days.18 In our study, the mean LOS was slightly higher (4.9 days), potentially reflecting referral bias. Achieving additional savings and improved outcomes by further reducing LOS in an environment in which care pathways are already in place is often difficult; hence, alternative approaches and strategies are often necessary.29, 30 Our results suggest that in TKA patients, after adjusting for other factors, there is a decrease in the length of stay of 0.234 days among those cared for on SOS units. However, we cannot state that the existence of the clinical pathway alone is responsible for our data differences because certain components of the care pathway for elective TKA patients are used throughout the hospital regardless of type of postoperative nursing unit. We believe that the interdisciplinary specialty care provided to orthopedic patients on SOS units is a critical component of a successfully implemented care pathway and not just a convenience or practice preference. The same surgeons admitting patients to the same nursing unit, with the same nurses, physical therapists and pharmacists providing care to the same type of patient population over time, leverages the collective experience of all care providers. This integrated, multidisciplinary teamwork may optimize timeliness, achieve incremental cost savings, and improve safety (including a decreased number of unanticipated transfers to an ICU setting).
Clinical pathways are known to reduce overall costs, normally by reducing LOS,29, 3133 and our results suggest approximately an incremental 6% cost reduction with the use of improving patient logistics by using SOS units. An economic evaluation study by Healy et al. suggests that focusing on nursing units may be a means of reducing total costs.29 Our cost savings were slightly lower than the reported savings by other practice assessments; however, we excluded operative and anesthesia costs, both significant contributors to overall and hospital costs. By eliminating these variables, our costs were specifically limited to the postoperative course, which is highly dependent on specialized interdisciplinary care.29
Providing specialized care has a significant impact on society. Although there is a per‐patient savings of only $600 when elective TKA patients are cared for on SOS units, this could be the difference between a positive and negative margin in the setting of fixed reimbursement. With a current average of 90 patients annually triaged postoperatively to NON units, there is a potential loss of $54,000 annually at our institution in just this single patient population with the current mechanisms of perioperative hospital flow. Multiply this potential savings to a national level, and the total is significant. With an aging population, the number of arthroplasties and concomitantly the number of hospitalizations in general are likely to increase, suggesting that changes in hospital flow are required to ensure optimal, cost‐effective care in the best setting available for patients. Such care is often related to surgical volume, and our institution observes such volume. Our results indicate that SOS units are one possible means of achieving this objective of fiscal sustainability, but further studies are needed to determine the indirect and hidden costs of sustaining such units in order to observe the actual cost savings.34 It could be argued that for elective TKA patients to have the most optimal outcomes and most efficient care, the surgical procedure should be performed only if beds are available on the nursing units whose staff has the most specific training.
Thirty‐Day Outcomes
We elected to combine 30‐day mortality, reoperations, and readmissions pertaining to the joint procedure as a composite endpoint and found no differences in outcomes between groups. These results suggest that these longer‐term patient‐specific outcomes are likely not related to the specialty nursing care. We used a 30‐day endpoint assuming that a longer period may have led to the inclusion of deaths that were not directly attributable to the surgical intervention. In addition, a previous study advocated using 30 days as an endpoint for follow‐up, as it adequately accounts for adverse events.35 Our institution is also a referral center; hence, we would likely be unable to capture all events if we were to use the standard 90‐day period used for payment for this procedure, as these data are not canvassed by the joint registry.
Discharge Disposition
NON unit patients tended to have a higher degree of home health arranged at discharge. The NON unit nursing staff cares for other nonorthopedic surgical patients daily and may transfer their patterns of care utilization to the orthopedic patients despite different postoperative needs. In addition, if NON unit nursing staff members care for TKA patients only intermittently, they may not have as clear a working understanding of the particular postoperative requirements of TKA patients and consequently request unnecessary home health services and general community resources. Alternatively, patients cared for on NON units may actually have needed more assistance and more services on discharge. Although purely speculative, patients cared for by dedicated orthopedic surgery staff may develop added confidence from the experience of the allied care staff and feel less of a need for postdismissal services.
Role of Hospitalists in Specialized Care Pathways
Hospitalists are known to improve efficiency without reducing patient satisfaction. Their role has been demonstrated in different patient populations.1, 2, 3638 In a study of hip fracture patients, a hospitalist care model demonstrated a reduction in length of stay and time to surgery, without compromising long‐term outcomes.4, 39 Utilizing a hospitalist/midlevel care provider team approach to reduce LOS in units with a static number of beds can possibly increase bed turnover and prevent triaging of patients onto NON units. This is but one example of how a medical‐surgical partnership can improve outcomes. However, in an era where cost‐effective and regulatory practices require optimal resource allocation, hospitalists are in a key position to foster quality improvement projects, promote patient safety measures, and enhance systems care delivery. Becoming involved in designing specialized clinical units, with an emphasis on a multidisciplinary care approach, and developing their relationships with hospital administrators and nursing staff should be among their priorities. The Society of Hospital Medicine has also been committed to the care of the elderly through its core competencies40 and the orthopedic population that will benefit from such process changes and care pathways. Hospital innovations such as the implementation of SOS‐type units not only for other medical‐surgical partnerships but also for site‐based units caring for geriatric patients can be top priorities for hospitalists.
Strengths and Applicability
Our results are important in that they can likely be applied to both large tertiary‐care centers and smaller community‐based centers that perform specialized orthopedic surgeries. Nurses on specialized orthopedic units are very familiar with this postoperative population and have developed expertise in the care of these patients. These experienced nurses can likely be found on orthopedic units in tertiary‐care centers or surgical units in smaller facilities. Furthermore, our results support the benefits of interdisciplinary advanced teamwork. When an interdisciplinary group of health care providers works together on a daily basis, certain habits and patterns inevitably develop that often are unplanned and may be difficult to measure. This enhanced patient flow may not occur if these patients are cared for by providers unfamiliar with each other's work patterns. The importance of optimized teamwork is not hospital‐size dependent. Only primary elective knee arthroplasties were included to minimize confounding bias by bilateral or revision surgeries or indications such as septic arthritis, which are known to lead to increased length of stay, costs and complications.41
Limitations
Our study has the limitations of its retrospective nonrandomized study design, and only a prospective, randomized investigation could definitively address our aims. By excluding sicker patients, such as those referred with complicated health issues or high‐risk patients who required admission in advance of the proposed surgery for monitoring of perioperative anticoagulation issues, our estimates of possible differences between our comparison groups may have been conservative. We are unaware of how these sicker patients would fare on either nursing unit. Furthermore, what occurs in the hospital setting may not only have an impact on the hospital stay but may also influence long‐term outcomes. This is impossible to assess with analysis of administrative databases.
We relied on the complete and accurate recording of data from various databases, depending on the validity of data entry and collection. With a large cohort of patients, any errors in documentation or abstraction would be expected to be similar in both groups. Furthermore, confounding variables such as patient comorbidities are extracted from administrative data sets whose personnel might not be as familiar with the medical aspects of patient care. We used linear and logistic regression analyses to account for known differences in baseline characteristics despite the sample sizes being proportionally larger in the SOS group. Although we attribute the shortened length of stay in the SOS group to the interdisciplinary team approach, we were unable to determine to what extent this was a result of nursing staff or discharge planning. By using administrative databases, we were unable to abstract the consensus time and date of discharge, when all hospital staff deemed the patient ready for discharge, and hence relied on the actual time of discharge, which can be heavily reliant on availability at skilled nursing facilities. In addition, it was unknown whether patients discharged from SOS units were, by matter of protocol, discharged earlier in the day. Nevertheless, this small difference in length of stay can improve patient flow by opening up postoperative patient beds. Furthermore, such data sets are unable to provide information on patient satisfaction or quality‐of‐life measures, both of which are important determinants in specialized care pathways.42 The patient population served by our institution is generally ethnically homogeneous, thereby limiting potential generalizations to tertiary‐care centers or geographical areas with a population similar to ours. Our study also was not intended as a formal cost‐effectiveness analysis; hence, the impact of possible startup costs to begin a similar nursing unit was not explored. Although differences in practice management can be considered a limitation of not only operative but also perioperative care, we neither expected nor encountered any significant or drastic alterations during the study period, and year of surgery was adjusted for in our analysis. However, prospective randomized controlled studies testing specific clinical pathways and practice‐related innovations are needed to better examine these outcomes.
CONCLUSIONS
In conclusion, postoperative patients after elective knee arthroplasty cared for on specialized orthopedic surgery units have shorter length of stays and cost hospitals less than patients admitted to nonspecialized orthopedic nursing units. In an era in which quality indicators and external reviews are forcing practitioners and health care organizations to become increasingly responsible for their own practices, more research is required to better address specific questions pertaining to different processes of care. Our study is meant to increase the attention paid to patient flow and postoperative logistics in the elective TKA population. SOS units, as a unique model of care, may become an additional step toward ensuring quality care and improved resource utilization.
Acknowledgements
The authors thank Donna K. Lawson, LPN, for her assistance in data collection and management.
- ,,,,,.Implementation of a voluntary hospitalist service at a community teaching hospital: improved clinical efficiency and patient outcomes.Ann Intern Med.2002;137:859–865.
- ,,, et al.Effects of physician experience on costs and outcomes on an academic general medicine service: results of a trial of hospitalists.Ann Intern Med.2002;137:866–874.
- ,,, et al.Medical and surgical comanagement after elective hip and knee arthroplasty: a randomized, controlled trial.Ann Intern Med.2004;141:28–38.
- ,,, et al.Effects of a hospitalist model on elderly patients with hip fracture.Arch Intern Med.2005;165:796–801.
- ,,,,.The economic benefit for family/general medicine practices employing physician assistants.Am J Manag Care.2002;8:613–620.
- ,,, et al.Economic evaluation of Australian stroke services: a prospective, multicenter study comparing dedicated stroke units with other care modalities.Stroke.2006;37:2790–2795.
- ,,,.Geriatric evaluation and management units in the care of the frail elderly cancer patient.J Gerontol A Biol Sci Med Sci.2005;60:798–803.
- ,,,,,.A randomized, controlled trial of a geriatric assessment unit in a community rehabilitation hospital.N Engl J Med.1990;322:1572–1578.
- ,.The effect of longevity on spending for acute and long‐term care.N Engl J Med.2000;342:1409–1415.
- ,,, et al.The Bone and Joint Decade 2000‐2010.Acta Orthop Scand.1998;69:219–220.
- .The Bone and Joint Decade 2000‐2010— for prevention and treatment of musculoskeletal disease.Osteoarthr Cartil.1998;7:1–4.
- Prevalence of self‐reported arthritis or chronic joint symptoms among adults—United States, 2001.MMWR Morb Mortal Wkly Rep.2002;51:948–950.
- ,,, et al.Estimates of the prevalence of arthritis and selected musculoskeletal disorders in the United States.Arthritis Rheum.1998;41:778–799.
- HCUPnet, Healthcare Cost and Utilization Project. Agency for Healthcare Research and Quality, 2002. Available at: http://www.ahrq.gov. Accessed January 25,2005.
- ,,,,,.Costs and cost‐effectiveness in hip and knee replacements. A prospective study.Int J Technol Assess Health Care.1997;13:575–588.
- ,,,,.Trends in total knee replacement surgeries and implications for public health, 1990‐2000.Public Health Rep.2005;120:278–282.
- ,,, et al.Demographic variation in the rate of knee replacement: a multi‐year analysis.Health Serv Res.1996;31:125–140.
- ,,,,.Trends in the epidemiology of total shoulder arthroplasty in the United States from 1990‐2000.Arthritis Rheum.2006;55:591–597.
- ,.2001 National Hospital Discharge Survey.Adv Data.2003;332.
- ,.2002 National Hospital Discharge Survey.Adv Data.2004:1–29.
- ,,.Costs of health care administration in the United States and Canada.N Engl J Med2003;349:768–775.
- ,,.Maintaining a hip registry for 25 years. Mayo Clinic experience.Clin Orthop Relat Res.1997:61–68.
- ,,,.Validation of a combined comorbidity index.J Clin Epidemiol.1994;47:1245–1251.
- ,,,.A new method of classifying prognostic comorbidity in longitudinal studies: development and validation.J Chronic Dis.1987;40:373–383.
- ,,, et al.A prospective randomized comparison of laparoscopic appendectomy with open appendectomy: Clinical and economic analyses.Surgery.2001;129:390–400.
- ,,, et al.Incremental costs of enrolling cancer patients in clinical trials: a population‐based study.J Natl Cancer Inst.1999;91:847–853.
- ,.Understanding the complexity of redesigning care around the clinical microsystem.Qual Saf Health Care.2006;15(Suppl 1):i10–i16.
- ,,, et al.Length of stay after primary total hip and knee arthroplasty in Denmark, 2001‐2003.Ugeskr Laeger.2006;168:276–279.
- ,,,.Opportunities for control of hospital costs for total joint arthroplasty after initial cost containment.J Arthroplasty.1998;13:504–507.
- ,,,,.Effectiveness of clinical pathways for total knee and total hip arthroplasty: literature review.J Arthroplasty.2003;18:69–74.
- ,,, et al.The effect of a perioperative clinical pathway for knee replacement surgery on hospital costs.Anesth Analg.1998;86:978–984.
- The cost effectiveness of streamlined care pathways and product standardization in total knee arthroplasty.J Arthroplasty.1999;14:182–186.
- ,,,,.Impact of cost reduction programs on short‐term patient outcome and hospital cost of total knee arthroplasty.J Bone Joint Surg Am.2002;84‐A:348–353.
- ,,,.Success of clinical pathways for total joint arthroplasty in a community hospital.Clin Orthop Relat Res.2007;457:133–137.
- ,,,.Optimal timeframe for reporting short‐term complication rates after total knee arthroplasty.J Arthroplasty.2006;21:705–711.
- ,,.Associations with reduced length of stay and costs on an academic hospitalist service.Am J Manag Care.2004;10:561–568.
- ,,.Is there a geriatrician in the house? Geriatric care approaches in hospitalist programs.J Hosp Med.2006;1:29–35.
- .Care of hospitalized older patients: opportunities for hospital‐based physicians.J Hosp Med.2006;1:42–47.
- ,,, et al.Effects of a hospitalist care model on mortality of elderly patients with hip fractures.J Hosp Med.2007;2:219–225.
- ,,,,.Core competencies in hospital medicine: development and methodology.J Hosp Med.2006;1:48–56.
- ,,,,,.Effect of feedback on resource use and morbidity in hip and knee arthroplasty in an integrated group practice setting.Mayo Clin Proc.1996;71:127–133.
- ,,,.Integrated care pathways.BMJ.1998;316:133–137.
Copyright © 2008 Society of Hospital Medicine
Hospitalists and Hip Fractures
Because the incidence of hip fracture increases dramatically with age and the elderly are the fastest‐growing portion of the United States population, the number of hip fractures is expected to triple by 2040.1 With the associated increase in postoperative morbidity and mortality, the costs will likely exceed $16‐$20 billion annually.15 Already by 2002, the number of patients with hip fractures exceeded 340,000 in this country, resulting in $8.6 billion in health care expenditures from in‐hospital and posthospital costs.68 This makes hip fracture a serious public health concern and triggers a need to devise an efficient means of caring for these patients. We previously reported that a hospitalist service can decrease time to surgery and shorten length of stay without affecting the number of inpatient deaths or 30‐day readmissions of patients undergoing hip fracture surgery.9 However, one concern with reducing length of stay and time to surgery in the high‐risk hip fracture patient population is the effect on long‐term mortality because the death rate following hip fracture repair may be as high as 43% after 1 year.10 To evaluate this important issue, we assessed mortality over a 1‐year period in the same cohort of patients previously described.9 We also identified predictors associated with mortality. We hypothesized that the expedited surgical treatment and decreased length of stay of a hospitalist‐managed group would not have an adverse effect on 1‐year mortality.
METHODS
Patient Selection
Following approval by the Mayo Clinic Institutional Review Board, we used the Mayo Clinic Surgical Index to identify patients admitted between July 1, 2000, and June 30, 2002, who matched International Classification of Diseases (9th Edition) hip fracture codes.11 These patients were cross‐referenced with those having a primary surgical indication of hip fracture. Patients transferred to our facility more than 72 hours after fracture were excluded from our study. Study patients provided authorization to use their medical records for the purposes of research.
A cohort of 466 patients was identified. For purposes of comparison, patients admitted between July 1, 2000, and June 30, 2001, were deemed to belong to the standard care service, and patients admitted between July 1, 2001, and June 30, 2002, were deemed part of the hospitalist service.
Intervention
Prior to July 2001, Mayo Clinic patients aged 65 and older having surgical repair of a hip fracture were triaged directly to a surgical orthopedic or general medical teaching service. Patients with multiple medical diagnoses were managed initially on a medical teaching service prior to transfer to the operating room. The primary team (medical or surgical) was responsible for the postoperative care of the patient and any orders or consultations required.
After July 1, 2001, these patients were admitted by the orthopedic surgery service and medically comanaged by a hospitalist service, which consisted of a hospitalist physician and 2 allied‐health practitioners. Twelve hospitalists and 12 allied health care professionals cared for patients during the study period. All preoperative and postoperative evaluations, inpatient management decisions, and coordination of outpatient care were performed by the hospitalists. This model of care is similar to one previously studied and published elsewhere.12 A census cap of 20 patients limited the number of patients managed by the hospitalist service. Any overflow of hip fracture patients was triaged directly to a non‐hospitalist‐based primary medical or surgical service as before. Thus, 23 hip fracture patients (10%) admitted after July 1, 2001, were not managed by the hospitalists but are included in this group for an intent‐to‐treat analysis.
Data Collection
Study nurses abstracted all data including admitting diagnoses, demographic features, type and mechanism of hip fracture, admission date and time, American Society of Anesthesia (ASA) class, comorbid medical conditions, medications, all clinical data, and readmission rates. Date of last follow‐up was confirmed using the Mayo Clinic medical record, whereas date and cause of death were obtained from death certificates obtained from state and national sources. Length of stay was defined as the number of days between admission and discharge. Time to surgery was defined in hours as the time from hospital admission to the start of the surgery. Finally, time from surgery to dismissal was defined as the number of days from the initiation of the surgical procedure to the time of dismissal. Thirty‐day readmission was defined as readmission to our hospital within 30 days of discharge date.
Statistical Considerations
Power
The power analysis was based on the end point of survival following surgical repair of hip fracture and primary comparison of patients in the standard care group with those in the hospitalist group. With 236 patients in the standard care group, 230 in the hospitalist group, and 274 observed deaths during the follow‐up period, there was 80% power to detect a hazard ratio of 1.4 or greater as being statistically significant (alpha = 0.05, beta = 0.2).
Analysis
The analysis focused on the end point of survival following surgical repair of hip fracture. In addition to the hospitalist versus standard care service, demographic, baseline clinical, and in‐hospital data were evaluated as potential predictors of survival. Survival rates were estimated using the method of Kaplan and Meier, and relative differences in survival were evaluated using the Cox proportional hazards regression models.13, 14 Potential predictors were analyzed both univariately and in a multivariable model. For the multivariable model, initial variable selection was accomplished using stepwise selection, backward elimination, and recursive partitioning.15 Each method yielded similar results. Bootstrap resampling was then used to confirm the variables selected for each model.16, 17 The threshold of statistical significance was set at P = .05 for all tests. All analyses were conducted in SAS version 8.2 (SAS Institute Inc., Cary, NC) and Splus version 6.2.1 (Insightful Corporation, Seattle, WA).
RESULTS
There were 236 patients with hip fractures (50.6%) admitted to the standard care service, and 230 patients (49.4%) admitted to the hospitalist service. As shown in Table 1, the baseline characteristics of the patients admitted to the 2 services did not differ significantly except that a greater proportion of patients with hypoxia were admitted to the hospitalist service (11.3% vs. 5.5%; P = .02). However, time to surgery, postsurgery stay, and overall length of hospitalization of the hospitalist‐treated patients were all significantly shorter.
| Patient characteristic | Standard care n = 236 | Hospitalist care n = 230 | P value | ||
|---|---|---|---|---|---|
| |||||
| Age (years) | 82 | 83 | .34 | ||
| Female sex | 171 | 72.5% | 163 | 70.9% | .70 |
| Comorbidity | |||||
| Coronary artery disease | 69 | 29.2% | 77 | 33.5% | .32 |
| Congestive heart failure | 41 | 17.4% | 49 | 21.3% | .28 |
| Chronic obstructive pulmonary disease | 36 | 15.3% | 38 | 16.5% | .71 |
| Cerebral vascular accident or transient ischemic attack | 36 | 15.3% | 50 | 21.7% | .07 |
| Dementia | 54 | 22.9% | 62 | 27.0% | .31 |
| Diabetes | 45 | 19.1% | 46 | 20.0% | .80 |
| Renal insufficiency | 17 | 7.2% | 17 | 7.4% | .94 |
| Residence at time of admission | .07 | ||||
| Home | 149 | 63.1% | 138 | 60.0% | |
| Assisted living | 32 | 13.6% | 42 | 18.3% | |
| Nursing home | 55 | 23.3% | 50 | 21.7% | |
| Ambulatory status at time of admission | .14 | ||||
| Independent | 114 | 48.3% | 89 | 38.7% | |
| Assistive device | 99 | 41.9% | 115 | 50.0% | |
| Personal help | 9 | 3.8% | 16 | 7.0% | |
| Transfer to bed or chair | 9 | 3.8% | 7 | 3.0% | |
| Nonambulatory | 5 | 2.1% | 3 | 1.3% | |
| Signs at time of admission | |||||
| Hypotension | 4 | 1.7% | 3 | 1.3% | > .99 |
| Hypoxia | 13 | 5.5% | 26 | 11.3% | .02 |
| Pulmonary edema | 37 | 15.7% | 29 | 12.6% | .34 |
| Tachycardia | 19 | 8.1% | 25 | 10.9% | .3 |
| Fracture type | .78 | ||||
| Femoral neck | 118 | 50.0% | 118 | 51.3% | |
| Intertrochanteric | 118 | 50.0% | 112 | 48.7% | |
| Mechanism of fracture | .82 | ||||
| Fall | 219 | 92.8% | 212 | 92.2% | |
| Trauma | 1 | 0.4% | 3 | 1.3% | |
| Pathologic | 7 | 3.0% | 6 | 2.6% | |
| Unknown | 9 | 3.8% | 7 | 3.0% | |
| ASA* class | .38 | ||||
| I or II | 33 | 14.0% | 23 | 10.0% | |
| III | 166 | 70.3% | 166 | 72.2% | |
| IV | 37 | 15.7% | 41 | 17.8% | |
| Location discharged to | .07 | ||||
| Home or assisted living | 24 | 10.5% | 13 | 5.9% | |
| Nursing home | 196 | 86.0% | 192 | 87.3% | |
| Another hospital or hospice | 8 | 3.5% | 15 | 6.8% | |
| Time to surgery (hours) | 38 | 25 | .001 | ||
| Time from surgery to discharge (days) | 9 | 7 | .04 | ||
| Length of stay | 10.6 | 8.4 | < .00 | ||
| Readmission rate | 25 | 10.6% | 20 | 8.7% | .49 |
Patients were followed for a median of 4.0 years (range 5 days to 5.6 years), and 192 patients were still alive at the end of follow‐up (April 2006). As illustrated in Figure 1, survival did not differ between the 2 treatment groups (P = .36). Overall survival at 1 year was 70.6% (95% confidence interval [CI]: 66.5%, 74.9%). Survival at 1 year in the standard care group was 70.6% (95% CI: 64.9%, 76.8%), whereas in the hospitalist group, it was 70.5% (95% CI: 64.8%, 76.7%). As delineated in Table 2, cardiovascular causes accounted for 34 deaths (25.6%), with 14 of these in the standard care group and 20 in the hospitalist group; 29 deaths (21.8%) had respiratory causes, 20 in the standard care group and 9 in the hospitalist group; and 17 (12.8%) were due to cancer, with 7 and 10 in the standard care and hospitalist groups, respectively. Unknown causes accounted for 21 cases, or 15.8% of total deaths.
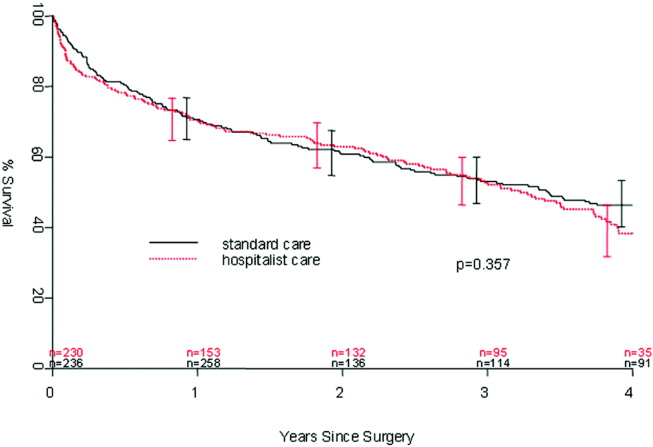
| Standard care | Hospitalist care | Total No. of deaths | % | |
|---|---|---|---|---|
| Cancer | 7 | 10 | 17 | 12.8% |
| Cardiovascular | 14 | 20 | 34 | 25.6% |
| Infectious | 5 | 4 | 9 | 6.8% |
| Neurological | 5 | 10 | 15 | 11.3% |
| Other | 0 | 2 | 2 | 1.5% |
| Renal | 4 | 2 | 6 | 4.5% |
| Respiratory | 20 | 9 | 29 | 21.8% |
| Unknown | 11 | 10 | 21 | 15.8% |
| Total | 66 | 67 | 133 | 100.0% |
In the univariate analysis, we found 29 variables that were significant predictors of survival (Table 3). A hospitalist model of care was not significantly associated with patient survival, despite the shorter length of stay (8.4 days vs. 10.6 days; P < .001) or expedited time to surgery (25 vs. 38 hours; P < .001), when compared with the standard care group, as previously reported by Phy et al.9 In the multivariable analysis (Table 4), however, the independent predictors of mortality were ASA class III or IV versus class II (hazard ratio [HR] 4.20; 95% CI: 2.21, 7.99), admission from a nursing home versus from home or assisted living (HR 2.24; 95% CI: 1.73, 2.90), and inpatient complications, which included patients requiring admission to the intensive care unit (ICU) and those who had a myocardial infarction or acute renal failure as an inpatient (HR 1.85; 95% CI: 1.45, 2.35). Even after adjusting for these factors, survival following hip fracture did not differ significantly between the hospitalist care patients and the standard care patients (HR 1.16; 95% CI: 0.91, 1.48).
| Variable | Hazard ratio (95% CI) | P value |
|---|---|---|
| ||
| Age on admission per 10 years | 1.41 (1.20, 1.65) | < .001 |
| ASA* II | 1.0 (referent) | |
| ASA* III | 5.27 (2.79, 9.96) | < .001 |
| ASA* IV | 11.7 (5.97, 22.9) | < .001 |
| History of chronic obstructive pulmonary disease | 1.82 (1.35, 2.43) | < .001 |
| History of renal insufficiency | 2.40 (1.62,3.55) | < .001 |
| History of stroke/transient ischemic attack | 1.46 (1.10, 1.95) | .01 |
| History of diabetes | 1.70 (1.29,2.25) | < .001 |
| History of congestive heart failure | 2.26 (1.73, 2.96) | < .001 |
| History of coronary artery disease | 1.53 (1.20, 1.97) | < .001 |
| History of dementia | 2.02 (1.57, 2.59) | < .001 |
| Admission from home | 1.0 (referent) | |
| Admission from assisted living | 1.47 (1.06, 2.04) | .02 |
| Admission from nursing home | 3.04 (2.33, 3.98) | < .001 |
| Independent | 1.0 (referent) | |
| Use of assistive device | 1.81 (1.39, 2.36) | < .001 |
| Personal help | 3.49 (2.16, 5.64) | < .001 |
| Nonambulatory | 3.96 (2.47, 6.35) | < .001 |
| Crackles on admission | 2.03 (1.50, 2.74) | < .001 |
| Hypoxia on admission | 1.56 (1.04, 2.32) | .03 |
| Hypotension on admission | 6.21 (2.72, 14.2) | < .001 |
| Tachycardia on admission | 1.66 (1.15, 2.41) | .007 |
| Coumadin on admission | 1.57 (1.13, 2.18) | .007 |
| Confusion/unconsciousness on admission | 2.23 (1.74, 2.87) | < .001 |
| Fever on admission | 1.98 (1.16, 3.40) | .01 |
| Tachypnea on admission | 1.95 (1.39, 2.72) | < .001 |
| Inpatient myocardial Infarction | 3.59 (2.35, 5.48) | < .001 |
| Inpatient atrial fibrillation | 2.00 (1.37, 2.92) | < .001 |
| Inpatient congestive heart failure | 2.62 (1.79, 3.84) | < .0001 |
| Inpatient delirium | 1.46 (1.13, 1.90) | < .005 |
| Inpatient lung infection | 2.52 (1.85, 3.42) | < .001 |
| Inpatient respiratory failure | 2.76 (1.64, 4.66) | < .001 |
| Inpatient mechanical ventilation | 2.56 (1.43, 4.57) | .002 |
| Inpatient renal failure | 3.60 (1.97, 6.61) | < .001 |
| Days from admission to surgery | 1.06 (1.005, 1.12) | .03 |
| Intensive care unit stay | 1.93 (1.51, 2.47) | < .001 |
| Variable | Hazard ratio (95% CI) | P value |
|---|---|---|
| ||
| Age on admission per 10 years | 1.17 (0.99, 1.38) | .07 |
| ASA* class III or IV | 4.20 (2.21, 7.99) | < .001 |
| ASA* class II | 1.0 (referent) | |
| Admission from nursing home | 2.24 (1.73, 2.90) | < .001 |
| Admission from home or assisted living | 1.0 (referent) | |
| Inpatient myocardial infarction, inpatient acute renal failure, or intensive care unit stay | 1.85 (1.45, 2.35) | < .001 |
| No inpatient myocardial infarction, no inpatient acute renal failure, and no intensive care unit stay | 1.0 (referent) | |
DISCUSSION
In our previous study, length of stay and time to surgery were significantly lower in a hospitalist care model.9 The present study shows that neither the reduced length of stay nor the shortened time to surgery of patients managed by the hospitalist group was associated with a difference in mortality compared with a standard care group, despite significantly improved efficiency and processes of care. Thus, our results refute initial concerns of increased mortality in a hospitalist model of care.
Delivery of perioperative medical care to hip fracture patients by hospitalists is associated with significant decreases in time to surgery and length of stay compared with standard care, with no differences in short‐term mortality.9, 18 Although there have been conflicting reports on the impact of length of stay and time to surgery on long‐term outcomes, our findings support previous results that decreased time to surgery was not associated with an observable effect on mortality.1923 A recent study by Orosz et al. that evaluated 1178 patients showed that earlier hip fracture surgery (performed less than 24 hours after admission) was not associated with reduced mortality, although it was associated with shorter length of stay.19 Our study also corroborates the results of an examination of 8383 hip fracture patients by Grimes et al., who found that time to surgery between 24 and 48 hours after admission had no effect on either 30‐day or long‐term mortality compared with that of those who underwent surgery between 48 and 72 hours, between 72 and 96 hours, or more than 96 hours after admission.20 However, both these results and our own are contrary to those of Gdalevich, whose study of 651 patients found that 1‐year mortality was 1.6‐fold higher for those whose hip fracture repair was postponed more than 48 hours.21 However, time to surgery in both the standard care and hospitalist model in our study was well below the 48‐hour cutoff, suggesting that operating anywhere within the normally accepted 48‐hour time frame may not influence long‐term mortality.
Because of the small number of events in both groups, we were unable to specifically compare whether a hospitalist model of care has any specific impact on long‐term cause of death. Although causes of death of patients with hip fracture were consistent with those of previous studies,10, 24 our death rate at 1 year, 29.4%, was higher than that seen among similar population groups at tertiary referral centers.19, 20, 2429 This is most likely a result of the cohort having a high proportion of nursing home patients (22%)19, 24, 26 transferred for evaluation to St. Mary's Hospital, which serves most of Olmsted County, Minnesota. This hospital also has some characteristics of a community‐based hospital, as it is where greater than 95% of all county patients receive care for surgical repair of hip fracture. Mortality rates are often higher at these types of hospitals.30 Previous studies using patients from Olmsted County indicate results can also be extrapolated to a large part of the U.S. population.31 In Pitto et al.'s study, the risk of death was 31% lower in those admitted from home than for those admitted from a nursing home.32 The latter patients normally have a higher number of comorbid conditions and tend to be less ambulatory than those in a community home‐dwelling setting. Our study also demonstrated that admission from a nursing home was a strong predictor of mortality for up to 1 year in the geriatric population. This may reflect the inherent decreased survival in this patient group, which is in agreement with the findings of other studies that showed inactivity and decreased ambulation prior to fracture were associated with increased mortality.3335
Multiple comorbidities, commonly seen in a geriatric population, translate into a higher ASA class and an increased risk of significant in‐hospital complications. Our study confirmed the findings of previous studies that a higher ASA class is a strong predictor of mortality,21, 26, 30, 3537 independent of decreased time to surgery.38 We also noted that significant in‐hospital complications, including renal failure, respiratory failure, and myocardial infarction, are documented predictors of mortality after hip fracture.27 Although mortality may vary depending on fracture type (femoral neck vs. intertrochanteric),3941 these differences were not observed in our study, in line with the results of previous published studies.37, 42 Controlling for age and comorbidities may be why an association was not found between fracture type and mortality. Finally, in a model containing comorbidity, ASA class, and nursing home residence prior to fracture, age was not a significant predictor of mortality.
Our study had a number of limitations. First, this was a retrospective cohort study based on chart review, so some data may have been subject to recording bias, and this might have differed between the serial models. Because of the retrospective nature of the study and referral of some of the patients from outside the community, our 1‐year follow‐up was not complete, but approached a respectable 93%. Other studies have described the benefits derived by a hospitalist practice only following the first year of its implementation, likely because of the hospitalist learning curve.43, 44 This may be why there was no difference in mortality between the standard care and hospitalist groups, as the latter was only in its first year of existence. Additional longitudinal study is required to find out if mortality differences emerge between the treatment groups. Furthermore, although in‐hospital care may influence short‐term outcomes, its effect on long‐term mortality has been unclear. Our data demonstrate that even though a hospitalist service can shorten length of stay and time to surgery, there were no appreciable intermediate differences in mortality at 1 year. Further prospective studies are needed to determine whether this medical‐surgical partnership in caring for these patients provides more favorable outcomes of reducing mortality and intercurrent complications.
Acknowledgements
We thank Donna K. Lawson for her assistance in data collection and management.
- ,,.The future of hip fractures in the United States. Numbers, costs, and potential effects of postmenopausal estrogen.Clin Orthop Relat Res1990 (252):163–166.
- ,,.Hip fractures in the elderly: a world‐wide projection.Osteoporos Int.1992;2:285–289.
- ,,,.The economic cost of hip fractures among elderly women. A one‐year, prospective, observational cohort study with matched‐pair analysis.Belgian Hip Fracture Study Group.J Bone Joint Surg Am.2001;83‐A:493–500.
- ,,.Estimating hip fracture morbidity, mortality and costs.J Am Geriatr Soc.2003;51:364–370.
- ,.The aging of America. Impact on health care costs.JAMA.1990;263:2335–2340.
- ,,,.Medical expenditures for the treatment of osteoporotic fractures in the United States in 1995: report from the National Osteoporosis Foundation.J Bone Miner Res.1997;12(1):24–35.
- US Department of Health and Human Services.Surveillance for selected public health indicators affecting older adults —United States.MMWR Morb Mortal Wkly Rep1999;48:33–34.
- ,.Epidemiology and outcomes of osteoporotic fractures.Lancet.2002;359:1761–1767.
- ,,, et al.Effects of a hospitalist model on elderly patients with hip fracture.Arch Intern Med.2005;165:796–801.
- ,,.Hip fractures in Finland and Great Britain—a comparison of patient characteristics and outcomes.Int Orthop.2001;25:349–354.
- WHO.International Classification of Disease, Ninth Revision (ICD‐9).Geneva, Switzerland:World Health Organization;1977.
- ,,, et al.Medical and surgical comanagement after elective hip and knee arthroplasty: a randomized, controlled trial.Ann Intern Med.2004;141(1):28–38.
- .Regression models and life‐tables (with discussion).J R Stat Soc Ser B.1972;34:187–220.
- ,.Nonparametric estimation from incomplete observations.J Am Statistical Assoc.1958;53:457–481.
- ,.An Introduction to Recursive Partitioning using the RPART Routines: Section of Biostatistics, Mayo Clinic;1997.
- .Computer Intensive Statistical Methods, Validation, Model Selection, and Bootstrap.London:Chapman and Hall;1994.
- ,.A bootstrap resampling procedure for model building: application to the Cox regression model.Stat Med.1992;11:2093–2109.
- ,,.Associations between the hospitalist model of care and quality‐of‐care‐related outcomes in patients undergoing hip fracture surgery.Mayo Clin Proc.2006;81(1):28–31.
- ,,, et al.Association of timing of surgery for hip fracture and patient outcomes.JAMA.2004;291:1738–1743.
- ,,,,.The effects of time‐to‐surgery on mortality and morbidity in patients following hip fracture.Am J Med.2002;112:702–709.
- ,,,.Morbidity and mortality after hip fracture: the impact of operative delay.Arch Orthop Trauma Surg.2004;124:334–340.
- ,,.Delay to surgery prolongs hospital stay in patients with fractures of the proximal femur.J Bone Joint Surg Br.2005;87:1123–1126.
- ,.The timing of surgery for proximal femoral fractures.J Bone Joint Surg Br.1992;74(2):203–205.
- ,,, et al.Hospital readmissions after hospital discharge for hip fracture: surgical and nonsurgical causes and effect on outcomes.J Am Geriatr Soc.2003;51:399–403.
- ,.Mortality after hip fractures.Acta Orthop Scand1979;50(2):161–167.
- ,,,,.Medical complications and outcomes after hip fracture repair.Arch Intern Med.2002;162:2053–2057.
- ,,, et al.Development and initial validation of a risk score for predicting in‐hospital and 1‐year mortality in patients with hip fractures.J Bone Miner Res.2005;20:494–500.
- ,,,,.Outcome after hip fracture in individuals ninety years of age and older.J Orthop Trauma.2001;15(1):34–39.
- ,,,.Hip fractures in the elderly: predictors of one year mortality.J Orthop Trauma.1997;11(3):162–165.
- ,,,.The effect of hospital type and surgical delay on mortality after surgery for hip fracture.J Bone Joint Surg Br.2005;87:361–366.
- .History of the Rochester Epidemiology Project.Mayo Clin Proc.1996;71:266–274.
- .The mortality and social prognosis of hip fractures. A prospective multifactorial study.Int Orthop.1994;18(2):109–113.
- ,.Functional outcome after hip fracture. A 1‐year prospective outcome study of 275 patients.Injury.2003;34:529–532.
- ,,.Rate of mortality for elderly patients after fracture of the hip in the 1980's.J Bone Joint Surg Am.1987;69:1335–1340.
- ,,,.Hip fractures in the elderly. Mortality, functional results and social readaptation.Int Surg.1989;74(3):191–194.
- ,,.Blood transfusion requirements in femoral neck fracture.Injury.2000;31(1):7–10.
- ,,.Mortality and causes of death after hip fractures in The Netherlands.Neth J Med.1992;41(1–2):4–10.
- ,,.Influence of preoperative medical status and delay to surgery on death following a hip fracture.ANZ J Surg.2002;72:405–407.
- ,,,Predictors of mortality and institutionalization after hip fracture: the New Haven EPESE cohort. Established Populations for Epidemiologic Studies of the Elderly.Am J Public Health.1994;84:1807–1812.
- ,,,.Mortality risk after hip fracture.J Orthop Trauma.2003;17(1):53–56.
- ,,.Thirty‐day mortality following hip arthroplasty for acute fracture.J Bone Joint Surg Am.2004;86‐A:1983–1988.
- ,,,,.Functional outcomes and mortality vary among different types of hip fractures: a function of patient characteristics.Clin Orthop Relat Res.2004:64–71.
- ,,,,,.Implementation of a voluntary hospitalist service at a community teaching hospital: improved clinical efficiency and patient outcomes.Ann Intern Med.2002;137:859–865.
- ,,, et al.Effects of physician experience on costs and outcomes on an academic general medicine service: results of a trial of hospitalists.Ann Intern Med.2002;137:866–874.
Because the incidence of hip fracture increases dramatically with age and the elderly are the fastest‐growing portion of the United States population, the number of hip fractures is expected to triple by 2040.1 With the associated increase in postoperative morbidity and mortality, the costs will likely exceed $16‐$20 billion annually.15 Already by 2002, the number of patients with hip fractures exceeded 340,000 in this country, resulting in $8.6 billion in health care expenditures from in‐hospital and posthospital costs.68 This makes hip fracture a serious public health concern and triggers a need to devise an efficient means of caring for these patients. We previously reported that a hospitalist service can decrease time to surgery and shorten length of stay without affecting the number of inpatient deaths or 30‐day readmissions of patients undergoing hip fracture surgery.9 However, one concern with reducing length of stay and time to surgery in the high‐risk hip fracture patient population is the effect on long‐term mortality because the death rate following hip fracture repair may be as high as 43% after 1 year.10 To evaluate this important issue, we assessed mortality over a 1‐year period in the same cohort of patients previously described.9 We also identified predictors associated with mortality. We hypothesized that the expedited surgical treatment and decreased length of stay of a hospitalist‐managed group would not have an adverse effect on 1‐year mortality.
METHODS
Patient Selection
Following approval by the Mayo Clinic Institutional Review Board, we used the Mayo Clinic Surgical Index to identify patients admitted between July 1, 2000, and June 30, 2002, who matched International Classification of Diseases (9th Edition) hip fracture codes.11 These patients were cross‐referenced with those having a primary surgical indication of hip fracture. Patients transferred to our facility more than 72 hours after fracture were excluded from our study. Study patients provided authorization to use their medical records for the purposes of research.
A cohort of 466 patients was identified. For purposes of comparison, patients admitted between July 1, 2000, and June 30, 2001, were deemed to belong to the standard care service, and patients admitted between July 1, 2001, and June 30, 2002, were deemed part of the hospitalist service.
Intervention
Prior to July 2001, Mayo Clinic patients aged 65 and older having surgical repair of a hip fracture were triaged directly to a surgical orthopedic or general medical teaching service. Patients with multiple medical diagnoses were managed initially on a medical teaching service prior to transfer to the operating room. The primary team (medical or surgical) was responsible for the postoperative care of the patient and any orders or consultations required.
After July 1, 2001, these patients were admitted by the orthopedic surgery service and medically comanaged by a hospitalist service, which consisted of a hospitalist physician and 2 allied‐health practitioners. Twelve hospitalists and 12 allied health care professionals cared for patients during the study period. All preoperative and postoperative evaluations, inpatient management decisions, and coordination of outpatient care were performed by the hospitalists. This model of care is similar to one previously studied and published elsewhere.12 A census cap of 20 patients limited the number of patients managed by the hospitalist service. Any overflow of hip fracture patients was triaged directly to a non‐hospitalist‐based primary medical or surgical service as before. Thus, 23 hip fracture patients (10%) admitted after July 1, 2001, were not managed by the hospitalists but are included in this group for an intent‐to‐treat analysis.
Data Collection
Study nurses abstracted all data including admitting diagnoses, demographic features, type and mechanism of hip fracture, admission date and time, American Society of Anesthesia (ASA) class, comorbid medical conditions, medications, all clinical data, and readmission rates. Date of last follow‐up was confirmed using the Mayo Clinic medical record, whereas date and cause of death were obtained from death certificates obtained from state and national sources. Length of stay was defined as the number of days between admission and discharge. Time to surgery was defined in hours as the time from hospital admission to the start of the surgery. Finally, time from surgery to dismissal was defined as the number of days from the initiation of the surgical procedure to the time of dismissal. Thirty‐day readmission was defined as readmission to our hospital within 30 days of discharge date.
Statistical Considerations
Power
The power analysis was based on the end point of survival following surgical repair of hip fracture and primary comparison of patients in the standard care group with those in the hospitalist group. With 236 patients in the standard care group, 230 in the hospitalist group, and 274 observed deaths during the follow‐up period, there was 80% power to detect a hazard ratio of 1.4 or greater as being statistically significant (alpha = 0.05, beta = 0.2).
Analysis
The analysis focused on the end point of survival following surgical repair of hip fracture. In addition to the hospitalist versus standard care service, demographic, baseline clinical, and in‐hospital data were evaluated as potential predictors of survival. Survival rates were estimated using the method of Kaplan and Meier, and relative differences in survival were evaluated using the Cox proportional hazards regression models.13, 14 Potential predictors were analyzed both univariately and in a multivariable model. For the multivariable model, initial variable selection was accomplished using stepwise selection, backward elimination, and recursive partitioning.15 Each method yielded similar results. Bootstrap resampling was then used to confirm the variables selected for each model.16, 17 The threshold of statistical significance was set at P = .05 for all tests. All analyses were conducted in SAS version 8.2 (SAS Institute Inc., Cary, NC) and Splus version 6.2.1 (Insightful Corporation, Seattle, WA).
RESULTS
There were 236 patients with hip fractures (50.6%) admitted to the standard care service, and 230 patients (49.4%) admitted to the hospitalist service. As shown in Table 1, the baseline characteristics of the patients admitted to the 2 services did not differ significantly except that a greater proportion of patients with hypoxia were admitted to the hospitalist service (11.3% vs. 5.5%; P = .02). However, time to surgery, postsurgery stay, and overall length of hospitalization of the hospitalist‐treated patients were all significantly shorter.
| Patient characteristic | Standard care n = 236 | Hospitalist care n = 230 | P value | ||
|---|---|---|---|---|---|
| |||||
| Age (years) | 82 | 83 | .34 | ||
| Female sex | 171 | 72.5% | 163 | 70.9% | .70 |
| Comorbidity | |||||
| Coronary artery disease | 69 | 29.2% | 77 | 33.5% | .32 |
| Congestive heart failure | 41 | 17.4% | 49 | 21.3% | .28 |
| Chronic obstructive pulmonary disease | 36 | 15.3% | 38 | 16.5% | .71 |
| Cerebral vascular accident or transient ischemic attack | 36 | 15.3% | 50 | 21.7% | .07 |
| Dementia | 54 | 22.9% | 62 | 27.0% | .31 |
| Diabetes | 45 | 19.1% | 46 | 20.0% | .80 |
| Renal insufficiency | 17 | 7.2% | 17 | 7.4% | .94 |
| Residence at time of admission | .07 | ||||
| Home | 149 | 63.1% | 138 | 60.0% | |
| Assisted living | 32 | 13.6% | 42 | 18.3% | |
| Nursing home | 55 | 23.3% | 50 | 21.7% | |
| Ambulatory status at time of admission | .14 | ||||
| Independent | 114 | 48.3% | 89 | 38.7% | |
| Assistive device | 99 | 41.9% | 115 | 50.0% | |
| Personal help | 9 | 3.8% | 16 | 7.0% | |
| Transfer to bed or chair | 9 | 3.8% | 7 | 3.0% | |
| Nonambulatory | 5 | 2.1% | 3 | 1.3% | |
| Signs at time of admission | |||||
| Hypotension | 4 | 1.7% | 3 | 1.3% | > .99 |
| Hypoxia | 13 | 5.5% | 26 | 11.3% | .02 |
| Pulmonary edema | 37 | 15.7% | 29 | 12.6% | .34 |
| Tachycardia | 19 | 8.1% | 25 | 10.9% | .3 |
| Fracture type | .78 | ||||
| Femoral neck | 118 | 50.0% | 118 | 51.3% | |
| Intertrochanteric | 118 | 50.0% | 112 | 48.7% | |
| Mechanism of fracture | .82 | ||||
| Fall | 219 | 92.8% | 212 | 92.2% | |
| Trauma | 1 | 0.4% | 3 | 1.3% | |
| Pathologic | 7 | 3.0% | 6 | 2.6% | |
| Unknown | 9 | 3.8% | 7 | 3.0% | |
| ASA* class | .38 | ||||
| I or II | 33 | 14.0% | 23 | 10.0% | |
| III | 166 | 70.3% | 166 | 72.2% | |
| IV | 37 | 15.7% | 41 | 17.8% | |
| Location discharged to | .07 | ||||
| Home or assisted living | 24 | 10.5% | 13 | 5.9% | |
| Nursing home | 196 | 86.0% | 192 | 87.3% | |
| Another hospital or hospice | 8 | 3.5% | 15 | 6.8% | |
| Time to surgery (hours) | 38 | 25 | .001 | ||
| Time from surgery to discharge (days) | 9 | 7 | .04 | ||
| Length of stay | 10.6 | 8.4 | < .00 | ||
| Readmission rate | 25 | 10.6% | 20 | 8.7% | .49 |
Patients were followed for a median of 4.0 years (range 5 days to 5.6 years), and 192 patients were still alive at the end of follow‐up (April 2006). As illustrated in Figure 1, survival did not differ between the 2 treatment groups (P = .36). Overall survival at 1 year was 70.6% (95% confidence interval [CI]: 66.5%, 74.9%). Survival at 1 year in the standard care group was 70.6% (95% CI: 64.9%, 76.8%), whereas in the hospitalist group, it was 70.5% (95% CI: 64.8%, 76.7%). As delineated in Table 2, cardiovascular causes accounted for 34 deaths (25.6%), with 14 of these in the standard care group and 20 in the hospitalist group; 29 deaths (21.8%) had respiratory causes, 20 in the standard care group and 9 in the hospitalist group; and 17 (12.8%) were due to cancer, with 7 and 10 in the standard care and hospitalist groups, respectively. Unknown causes accounted for 21 cases, or 15.8% of total deaths.
| Standard care | Hospitalist care | Total No. of deaths | % | |
|---|---|---|---|---|
| Cancer | 7 | 10 | 17 | 12.8% |
| Cardiovascular | 14 | 20 | 34 | 25.6% |
| Infectious | 5 | 4 | 9 | 6.8% |
| Neurological | 5 | 10 | 15 | 11.3% |
| Other | 0 | 2 | 2 | 1.5% |
| Renal | 4 | 2 | 6 | 4.5% |
| Respiratory | 20 | 9 | 29 | 21.8% |
| Unknown | 11 | 10 | 21 | 15.8% |
| Total | 66 | 67 | 133 | 100.0% |
In the univariate analysis, we found 29 variables that were significant predictors of survival (Table 3). A hospitalist model of care was not significantly associated with patient survival, despite the shorter length of stay (8.4 days vs. 10.6 days; P < .001) or expedited time to surgery (25 vs. 38 hours; P < .001), when compared with the standard care group, as previously reported by Phy et al.9 In the multivariable analysis (Table 4), however, the independent predictors of mortality were ASA class III or IV versus class II (hazard ratio [HR] 4.20; 95% CI: 2.21, 7.99), admission from a nursing home versus from home or assisted living (HR 2.24; 95% CI: 1.73, 2.90), and inpatient complications, which included patients requiring admission to the intensive care unit (ICU) and those who had a myocardial infarction or acute renal failure as an inpatient (HR 1.85; 95% CI: 1.45, 2.35). Even after adjusting for these factors, survival following hip fracture did not differ significantly between the hospitalist care patients and the standard care patients (HR 1.16; 95% CI: 0.91, 1.48).
| Variable | Hazard ratio (95% CI) | P value |
|---|---|---|
| ||
| Age on admission per 10 years | 1.41 (1.20, 1.65) | < .001 |
| ASA* II | 1.0 (referent) | |
| ASA* III | 5.27 (2.79, 9.96) | < .001 |
| ASA* IV | 11.7 (5.97, 22.9) | < .001 |
| History of chronic obstructive pulmonary disease | 1.82 (1.35, 2.43) | < .001 |
| History of renal insufficiency | 2.40 (1.62,3.55) | < .001 |
| History of stroke/transient ischemic attack | 1.46 (1.10, 1.95) | .01 |
| History of diabetes | 1.70 (1.29,2.25) | < .001 |
| History of congestive heart failure | 2.26 (1.73, 2.96) | < .001 |
| History of coronary artery disease | 1.53 (1.20, 1.97) | < .001 |
| History of dementia | 2.02 (1.57, 2.59) | < .001 |
| Admission from home | 1.0 (referent) | |
| Admission from assisted living | 1.47 (1.06, 2.04) | .02 |
| Admission from nursing home | 3.04 (2.33, 3.98) | < .001 |
| Independent | 1.0 (referent) | |
| Use of assistive device | 1.81 (1.39, 2.36) | < .001 |
| Personal help | 3.49 (2.16, 5.64) | < .001 |
| Nonambulatory | 3.96 (2.47, 6.35) | < .001 |
| Crackles on admission | 2.03 (1.50, 2.74) | < .001 |
| Hypoxia on admission | 1.56 (1.04, 2.32) | .03 |
| Hypotension on admission | 6.21 (2.72, 14.2) | < .001 |
| Tachycardia on admission | 1.66 (1.15, 2.41) | .007 |
| Coumadin on admission | 1.57 (1.13, 2.18) | .007 |
| Confusion/unconsciousness on admission | 2.23 (1.74, 2.87) | < .001 |
| Fever on admission | 1.98 (1.16, 3.40) | .01 |
| Tachypnea on admission | 1.95 (1.39, 2.72) | < .001 |
| Inpatient myocardial Infarction | 3.59 (2.35, 5.48) | < .001 |
| Inpatient atrial fibrillation | 2.00 (1.37, 2.92) | < .001 |
| Inpatient congestive heart failure | 2.62 (1.79, 3.84) | < .0001 |
| Inpatient delirium | 1.46 (1.13, 1.90) | < .005 |
| Inpatient lung infection | 2.52 (1.85, 3.42) | < .001 |
| Inpatient respiratory failure | 2.76 (1.64, 4.66) | < .001 |
| Inpatient mechanical ventilation | 2.56 (1.43, 4.57) | .002 |
| Inpatient renal failure | 3.60 (1.97, 6.61) | < .001 |
| Days from admission to surgery | 1.06 (1.005, 1.12) | .03 |
| Intensive care unit stay | 1.93 (1.51, 2.47) | < .001 |
| Variable | Hazard ratio (95% CI) | P value |
|---|---|---|
| ||
| Age on admission per 10 years | 1.17 (0.99, 1.38) | .07 |
| ASA* class III or IV | 4.20 (2.21, 7.99) | < .001 |
| ASA* class II | 1.0 (referent) | |
| Admission from nursing home | 2.24 (1.73, 2.90) | < .001 |
| Admission from home or assisted living | 1.0 (referent) | |
| Inpatient myocardial infarction, inpatient acute renal failure, or intensive care unit stay | 1.85 (1.45, 2.35) | < .001 |
| No inpatient myocardial infarction, no inpatient acute renal failure, and no intensive care unit stay | 1.0 (referent) | |
DISCUSSION
In our previous study, length of stay and time to surgery were significantly lower in a hospitalist care model.9 The present study shows that neither the reduced length of stay nor the shortened time to surgery of patients managed by the hospitalist group was associated with a difference in mortality compared with a standard care group, despite significantly improved efficiency and processes of care. Thus, our results refute initial concerns of increased mortality in a hospitalist model of care.
Delivery of perioperative medical care to hip fracture patients by hospitalists is associated with significant decreases in time to surgery and length of stay compared with standard care, with no differences in short‐term mortality.9, 18 Although there have been conflicting reports on the impact of length of stay and time to surgery on long‐term outcomes, our findings support previous results that decreased time to surgery was not associated with an observable effect on mortality.1923 A recent study by Orosz et al. that evaluated 1178 patients showed that earlier hip fracture surgery (performed less than 24 hours after admission) was not associated with reduced mortality, although it was associated with shorter length of stay.19 Our study also corroborates the results of an examination of 8383 hip fracture patients by Grimes et al., who found that time to surgery between 24 and 48 hours after admission had no effect on either 30‐day or long‐term mortality compared with that of those who underwent surgery between 48 and 72 hours, between 72 and 96 hours, or more than 96 hours after admission.20 However, both these results and our own are contrary to those of Gdalevich, whose study of 651 patients found that 1‐year mortality was 1.6‐fold higher for those whose hip fracture repair was postponed more than 48 hours.21 However, time to surgery in both the standard care and hospitalist model in our study was well below the 48‐hour cutoff, suggesting that operating anywhere within the normally accepted 48‐hour time frame may not influence long‐term mortality.
Because of the small number of events in both groups, we were unable to specifically compare whether a hospitalist model of care has any specific impact on long‐term cause of death. Although causes of death of patients with hip fracture were consistent with those of previous studies,10, 24 our death rate at 1 year, 29.4%, was higher than that seen among similar population groups at tertiary referral centers.19, 20, 2429 This is most likely a result of the cohort having a high proportion of nursing home patients (22%)19, 24, 26 transferred for evaluation to St. Mary's Hospital, which serves most of Olmsted County, Minnesota. This hospital also has some characteristics of a community‐based hospital, as it is where greater than 95% of all county patients receive care for surgical repair of hip fracture. Mortality rates are often higher at these types of hospitals.30 Previous studies using patients from Olmsted County indicate results can also be extrapolated to a large part of the U.S. population.31 In Pitto et al.'s study, the risk of death was 31% lower in those admitted from home than for those admitted from a nursing home.32 The latter patients normally have a higher number of comorbid conditions and tend to be less ambulatory than those in a community home‐dwelling setting. Our study also demonstrated that admission from a nursing home was a strong predictor of mortality for up to 1 year in the geriatric population. This may reflect the inherent decreased survival in this patient group, which is in agreement with the findings of other studies that showed inactivity and decreased ambulation prior to fracture were associated with increased mortality.3335
Multiple comorbidities, commonly seen in a geriatric population, translate into a higher ASA class and an increased risk of significant in‐hospital complications. Our study confirmed the findings of previous studies that a higher ASA class is a strong predictor of mortality,21, 26, 30, 3537 independent of decreased time to surgery.38 We also noted that significant in‐hospital complications, including renal failure, respiratory failure, and myocardial infarction, are documented predictors of mortality after hip fracture.27 Although mortality may vary depending on fracture type (femoral neck vs. intertrochanteric),3941 these differences were not observed in our study, in line with the results of previous published studies.37, 42 Controlling for age and comorbidities may be why an association was not found between fracture type and mortality. Finally, in a model containing comorbidity, ASA class, and nursing home residence prior to fracture, age was not a significant predictor of mortality.
Our study had a number of limitations. First, this was a retrospective cohort study based on chart review, so some data may have been subject to recording bias, and this might have differed between the serial models. Because of the retrospective nature of the study and referral of some of the patients from outside the community, our 1‐year follow‐up was not complete, but approached a respectable 93%. Other studies have described the benefits derived by a hospitalist practice only following the first year of its implementation, likely because of the hospitalist learning curve.43, 44 This may be why there was no difference in mortality between the standard care and hospitalist groups, as the latter was only in its first year of existence. Additional longitudinal study is required to find out if mortality differences emerge between the treatment groups. Furthermore, although in‐hospital care may influence short‐term outcomes, its effect on long‐term mortality has been unclear. Our data demonstrate that even though a hospitalist service can shorten length of stay and time to surgery, there were no appreciable intermediate differences in mortality at 1 year. Further prospective studies are needed to determine whether this medical‐surgical partnership in caring for these patients provides more favorable outcomes of reducing mortality and intercurrent complications.
Acknowledgements
We thank Donna K. Lawson for her assistance in data collection and management.
- ,,.The future of hip fractures in the United States. Numbers, costs, and potential effects of postmenopausal estrogen.Clin Orthop Relat Res1990 (252):163–166.
- ,,.Hip fractures in the elderly: a world‐wide projection.Osteoporos Int.1992;2:285–289.
- ,,,.The economic cost of hip fractures among elderly women. A one‐year, prospective, observational cohort study with matched‐pair analysis.Belgian Hip Fracture Study Group.J Bone Joint Surg Am.2001;83‐A:493–500.
- ,,.Estimating hip fracture morbidity, mortality and costs.J Am Geriatr Soc.2003;51:364–370.
- ,.The aging of America. Impact on health care costs.JAMA.1990;263:2335–2340.
- ,,,.Medical expenditures for the treatment of osteoporotic fractures in the United States in 1995: report from the National Osteoporosis Foundation.J Bone Miner Res.1997;12(1):24–35.
- US Department of Health and Human Services.Surveillance for selected public health indicators affecting older adults —United States.MMWR Morb Mortal Wkly Rep1999;48:33–34.
- ,.Epidemiology and outcomes of osteoporotic fractures.Lancet.2002;359:1761–1767.
- ,,, et al.Effects of a hospitalist model on elderly patients with hip fracture.Arch Intern Med.2005;165:796–801.
- ,,.Hip fractures in Finland and Great Britain—a comparison of patient characteristics and outcomes.Int Orthop.2001;25:349–354.
- WHO.International Classification of Disease, Ninth Revision (ICD‐9).Geneva, Switzerland:World Health Organization;1977.
- ,,, et al.Medical and surgical comanagement after elective hip and knee arthroplasty: a randomized, controlled trial.Ann Intern Med.2004;141(1):28–38.
- .Regression models and life‐tables (with discussion).J R Stat Soc Ser B.1972;34:187–220.
- ,.Nonparametric estimation from incomplete observations.J Am Statistical Assoc.1958;53:457–481.
- ,.An Introduction to Recursive Partitioning using the RPART Routines: Section of Biostatistics, Mayo Clinic;1997.
- .Computer Intensive Statistical Methods, Validation, Model Selection, and Bootstrap.London:Chapman and Hall;1994.
- ,.A bootstrap resampling procedure for model building: application to the Cox regression model.Stat Med.1992;11:2093–2109.
- ,,.Associations between the hospitalist model of care and quality‐of‐care‐related outcomes in patients undergoing hip fracture surgery.Mayo Clin Proc.2006;81(1):28–31.
- ,,, et al.Association of timing of surgery for hip fracture and patient outcomes.JAMA.2004;291:1738–1743.
- ,,,,.The effects of time‐to‐surgery on mortality and morbidity in patients following hip fracture.Am J Med.2002;112:702–709.
- ,,,.Morbidity and mortality after hip fracture: the impact of operative delay.Arch Orthop Trauma Surg.2004;124:334–340.
- ,,.Delay to surgery prolongs hospital stay in patients with fractures of the proximal femur.J Bone Joint Surg Br.2005;87:1123–1126.
- ,.The timing of surgery for proximal femoral fractures.J Bone Joint Surg Br.1992;74(2):203–205.
- ,,, et al.Hospital readmissions after hospital discharge for hip fracture: surgical and nonsurgical causes and effect on outcomes.J Am Geriatr Soc.2003;51:399–403.
- ,.Mortality after hip fractures.Acta Orthop Scand1979;50(2):161–167.
- ,,,,.Medical complications and outcomes after hip fracture repair.Arch Intern Med.2002;162:2053–2057.
- ,,, et al.Development and initial validation of a risk score for predicting in‐hospital and 1‐year mortality in patients with hip fractures.J Bone Miner Res.2005;20:494–500.
- ,,,,.Outcome after hip fracture in individuals ninety years of age and older.J Orthop Trauma.2001;15(1):34–39.
- ,,,.Hip fractures in the elderly: predictors of one year mortality.J Orthop Trauma.1997;11(3):162–165.
- ,,,.The effect of hospital type and surgical delay on mortality after surgery for hip fracture.J Bone Joint Surg Br.2005;87:361–366.
- .History of the Rochester Epidemiology Project.Mayo Clin Proc.1996;71:266–274.
- .The mortality and social prognosis of hip fractures. A prospective multifactorial study.Int Orthop.1994;18(2):109–113.
- ,.Functional outcome after hip fracture. A 1‐year prospective outcome study of 275 patients.Injury.2003;34:529–532.
- ,,.Rate of mortality for elderly patients after fracture of the hip in the 1980's.J Bone Joint Surg Am.1987;69:1335–1340.
- ,,,.Hip fractures in the elderly. Mortality, functional results and social readaptation.Int Surg.1989;74(3):191–194.
- ,,.Blood transfusion requirements in femoral neck fracture.Injury.2000;31(1):7–10.
- ,,.Mortality and causes of death after hip fractures in The Netherlands.Neth J Med.1992;41(1–2):4–10.
- ,,.Influence of preoperative medical status and delay to surgery on death following a hip fracture.ANZ J Surg.2002;72:405–407.
- ,,,Predictors of mortality and institutionalization after hip fracture: the New Haven EPESE cohort. Established Populations for Epidemiologic Studies of the Elderly.Am J Public Health.1994;84:1807–1812.
- ,,,.Mortality risk after hip fracture.J Orthop Trauma.2003;17(1):53–56.
- ,,.Thirty‐day mortality following hip arthroplasty for acute fracture.J Bone Joint Surg Am.2004;86‐A:1983–1988.
- ,,,,.Functional outcomes and mortality vary among different types of hip fractures: a function of patient characteristics.Clin Orthop Relat Res.2004:64–71.
- ,,,,,.Implementation of a voluntary hospitalist service at a community teaching hospital: improved clinical efficiency and patient outcomes.Ann Intern Med.2002;137:859–865.
- ,,, et al.Effects of physician experience on costs and outcomes on an academic general medicine service: results of a trial of hospitalists.Ann Intern Med.2002;137:866–874.
Copyright © 2007 Society of Hospital Medicine

Discharge Appointments
Dicharge of a patient from the hospital is a complicated, interprofessional endeavor.1, 2 Several institutions report that discharge is one of the least satisfying elements of the patient's hospital experience.35 Recent evidence suggests that a poorly planned or disorganized discharge may compromise patient safety in the period soon after dismissal.6 Several initiatives have been aimed at improving patient satisfaction and safety related to discharge.710
In 2000 the Mayo Clinic (Rochester, Minnesota) Department of Internal Medicine leadership established a goal to improve patient satisfaction with the hospital dismissal process. Patient focus group data suggested that uncertainty about the anticipated date and time of discharge causes frustration to some patients and families.
We hypothesized that an appointment to leave the hospital might be practicable. We joined an Institute for Healthcare Improvement collaborative (Improving Flow Through Acute Care Settings, 1 of 6 Improvement Action Network [IMPACT] Learning and Innovation Communities) aimed at scheduling discharge appointments (DAs). The collaborating members deemed that, although the ideal DA is set at least a day in advance, a same‐day DA is also desirable for both patient satisfaction and staff task organization in pursuit of a high‐quality discharge.
METHODS
This project was approved by the Mayo Foundation Institutional Review Board. We tested the following hypotheses:
It is possible to make and display DAs in various care units.
Most DAs can be scheduled a day before dismissal.
Most DA patients depart on time.
Setting
Mayo Clinic in Rochester, Minnesota, is a tertiary academic medical center with 2 hospitals (Saint Marys and Rochester Methodist) that house a total of 1951 licensed beds in 76 care units.
The preliminary study displaying DAs was carried out in the Innovation and Quality (IQ) Unit of Saint Marys Hospital, a 23‐bed general medical care unit that supports both resident and nonresident services. Traditionally, primary services usually consist of an attending physician and house officer physicians (junior and senior residents). Less commonly, primary services consist of an attending physician and either a nurse‐practitioner or a physician assistant.
The design pilot took place between August 2 and December 24, 2003. The subsequent, larger study of applicability took place across 8 care units (including the IQ Unit) between December 28, 2003, and April 25, 2004.
Preliminary Work: Design Pilot
We designed bedside dry‐erase wall displays and mounted them in the rooms in plain view of patients and their families and caregivers. Pilot testing of DA scheduling was done on a general medical care unit from August 2 to December 24, 2003. To optimize the process for scheduling a DA, our team developed 21 small tests to change the dismissal process through plan, do, study, and act cycles.11
The recommended process was that as soon as an organized discharge could be reasonably envisioned, the primary service provider would discuss with the patient, family, and primary nurse (and a social service worker, if involved) the anticipated discharge day. A member of the primary service was to handwrite (with a marker) the anticipated day on the specially designed bedside dry‐erase board (Fig. 1) in view of the patient. The same primary service prescribers could amend this anticipated day (or time) by repeating the process of consultation and discussion as needed. The time of the DA could be written on the DA board (or amended) by either a member of the primary service or the primary care nurse.

Each morning, the primary care nurse transmitted the DA board data to the admission, discharge, and transfer log kept at the unit secretary desk (in which the actual discharge time has always been routinely recorded by the unit secretary).
Adoption of DA Scheduling in Other Care Units
Several meetings were held with 7 other patient care unit leaders about adopting the protocol. These units, both medical and surgical, were selected according to 3 criteria: (1) prior participation in unit‐level continuous improvement work, (2) current or recent work in any aspect of the discharge process, and (3) a reputation for having innovative nursing leadership and staff.
Data Acquisition and Analysis
Data were collected daily from each participating unit's admission, discharge, and transfer log: both the actual time of departure and the DA, if one had been scheduled. For each DA patient, the DA time was compared with the actual departure time.
RESULTS
During the 4‐month study of discharges across 8 care units, 1256 of 2046 patients (61%) received a DA; 576 of the DAs (46%) were scheduled at least 1 day in advance (Table 1). Among patients with a DA, 752 were discharged on time (60%), and only 240 (19%) were tardy.
| Unit | DAs | Departure time of patients compared with DA | |||||
|---|---|---|---|---|---|---|---|
| No. | Type of unit | No. of patients | Patients with DAs, n (%) | DAs scheduled ϵ 1 day ahead, n (%) | On time, n (%)a | Early, n (%) | Late, n (%) |
| |||||||
| 1 | Neurology/neurosurgery | 525 | 270 (51) | 0 (0) | 175 (65) | 44 (16) | 51 (19) |
| 2 | Surgery (mixed) | 481 | 325 (68) | 289 (89) | 166 (51) | 101 (31) | 58 (18) |
| 3 | General internal medicine (IQ Unit) | 466 | 243 (52) | 35 (14) | 132 (54) | 50 (21) | 61 (25) |
| 4 | Neurology/neurosurgery | 267 | 189 (71) | 40 (21) | 119 (63) | 41 (22) | 29 (15) |
| 5 | Vascular surgery | 201 | 127 (63) | 127 (100) | 90 (71) | 12 (9) | 25 (20) |
| 6 | Psychiatry | 46 | 42 (91) | 42 (100) | 28 (67) | 9 (21) | 5 (12) |
| 7 | Orthopedic surgeryelective | 38 | 38 (100) | 22 (58) | 24 (63) | 3 (8) | 11 (29) |
| 8 | Orthopedic surgerytrauma | 22 | 22 (100) | 21 (95) | 18 (82) | 4 (18) | 0 (0) |
| Total | 2046 | 1256 (61) | 576 (46) | 752 (60) | 264 (21) | 240 (19) | |
DISCUSSION
In response to patient focus group feedback, we designed a tool and a process by which a DA could be made and posted at bedside. Among 2046 patients discharged from 8 care units over 4 months, 61% (1256) had a posted, in‐room DA. Almost half the patients with DAs (46%) had a DA scheduled at least 1 calendar day ahead. Remarkably, among patients with a DA, fewer than 20% were discharged tardily. In‐room posting of DAs across a spectrum of care units appears to be practicable, even in the face of extant diagnostic or therapeutic uncertainty.
This was an initial test‐of‐concept project and an exploratory trial. The limitations are: (1) satisfaction (patient, family, nurse, and physician) was not tested with any validated survey instrument, (2) length of stay was not studied, (3) reasons for variable DA success among care units were not ascertained, and (4) resource use was not measured.
Anecdotal information from a postdischarge phone survey indicated that patients seemed appreciative of a DA. The survey data were not included in this article because the survey tool was not a validated instrument and the interviewer (a coauthor) was not blinded to the hypothesis and was therefore subject to bias. No negative comments were received through informal real‐time feedback from patients and family during the making and posting of DAs, and encouraging comments were common.
Physician participation in posting the DA appeared to be key, and the unavoidable dialogue about the clinical rationale for a chosen date seemed welcome. A telling anecdote came from a patient who did not have a DA board: I didn't get the same treatment as my roommate with the [DA] board. The other doctors talked with [him] more about discharge. I wish my team would have done this more with me.
We cannot be certain of the reasons for the care unit disparity in setting and meeting DAs. We speculate that the level of staff enthusiasm for DAs explains the variation rather than patient population characteristics. Further, we cannot explain why 39% of the patients did not receive a DA. Physician feedback was generally, but not uniformly, positive. Negative comments that might explain DA omissions include: (1) patients already are informed and awarethe tool is superfluous; (2) the day of discharge is unknowable in advance; and (3) patients or family members will hold us to it or be upset if the DA is changed.
We expected that diagnostic uncertainty might pose challenges to providing DAs. When primary service providers were reassured that DAs could be amended, this concern was reduced (but not eliminated). It seemed useful for providers to envision the earliest day of discharge by assuming that the results of a pending key test or consultation would be favorable. Frequency of DA modification was not studied. DAs were amended, however, and patients (to our knowledge) seemed unperturbedperhaps because of an almost unavoidable discussion of the clinical rationale because the act of posting the DA occurred in full view of (and in partnership with) the patient.
A trend toward discharge earlier in the day was observed (data not shown). Theoretically, such a trend offers the potential to improve inpatient flow, in part by discharging patients before morning surgical cases are completed.
Although we had many favorable comments about DAs from patients, family members, and nurses, satisfaction of patients, families, and staff members deserves formal study. Further, it is not known whether unused DA boards might contribute to patient dissatisfaction. Any effect that the display of DAs may have on the length of stay also may be a topic worthy of future study.
CONCLUSIONS
Patients and their families sometimes desire more communication about the anticipated day and time of hospital discharge. We designed a process for making a tentative DA and a tool by which the DA could be posted at the bedside. The results of this study suggest that (1) despite some uncertainty it is possible to schedule and post DAs in‐room in various care units and in various settings, (2) DAs were made at least a day ahead of time in almost half the DA discharges, and (3) most DA discharges were characterized by on‐time departure. In addition, patient, family, and nursing satisfaction (in relation to the DA) warrants further investigation.
Acknowledgements
We acknowledge the valuable insights and collaboration of our colleagues Deborah R. Fischer, Steven L. Bahnemann, Matthew Skelton, MD, Lauri J. Dahl, Pamela O. Johnson, MSN, Debra A. Hernke, MSN, Susan L. Stirn, MSN, Barbara R. Spurrier, Ryan R. Armbruster, Todd J. Bille, and Donna K. Lawson of the Mayo Clinic and Mayo Foundation.
- ,,, et al.Learning from patients: a discharge planning improvement project.Jt Comm J Qual Improv.1996;22:311–22.
- ,,,,,, et al.Payer‐hospital collaboration to improve patient satisfaction with hospital discharge.Jt Comm J Qual Improv.1996;22:336–344.
- ,,,,,.How was your hospital stay? Patients' reports about their care in Canadian hospitals.CMAJ.1994;150:1813–1822.
- .A hospitalization from hell: a patient's perspective on quality.Ann Intern Med.2003;138:33–39.
- ,,.Predictors of elder and family caregiver satisfaction with discharge planning.J Cardiovasc Nurs.2000;14:76–87.
- ,,,,.The incidence and severity of adverse events affecting patients after discharge from the hospital.Ann Intern Med.2003;138:161–167.
- ,,, et al.Patient callback program: a quality improvement, customer service, and marketing tool.J Health Care Mark.1993;13:60–65.
- ,,,.Effects of a medical team coordinator on length of hospital stay.CMAJ.1992;146:511–515.
- ,.Discharge planning from hospital to home.Cochrane Database Syst Rev.2000;4:CD000313.
- ,,,.Continuity of care and patient outcomes after hospital discharge.J Gen Intern Med.2004;19:624–631.
- Institute for Healthcare Improvement. Cambridge, UK: Institute for Healthcare Improvement. Available from: http://www.ihi.org/IHI/Topics/Improvement/ImprovementMethods/HowToImprove/testingchanges.htm. Accessed July 28,2006.
Dicharge of a patient from the hospital is a complicated, interprofessional endeavor.1, 2 Several institutions report that discharge is one of the least satisfying elements of the patient's hospital experience.35 Recent evidence suggests that a poorly planned or disorganized discharge may compromise patient safety in the period soon after dismissal.6 Several initiatives have been aimed at improving patient satisfaction and safety related to discharge.710
In 2000 the Mayo Clinic (Rochester, Minnesota) Department of Internal Medicine leadership established a goal to improve patient satisfaction with the hospital dismissal process. Patient focus group data suggested that uncertainty about the anticipated date and time of discharge causes frustration to some patients and families.
We hypothesized that an appointment to leave the hospital might be practicable. We joined an Institute for Healthcare Improvement collaborative (Improving Flow Through Acute Care Settings, 1 of 6 Improvement Action Network [IMPACT] Learning and Innovation Communities) aimed at scheduling discharge appointments (DAs). The collaborating members deemed that, although the ideal DA is set at least a day in advance, a same‐day DA is also desirable for both patient satisfaction and staff task organization in pursuit of a high‐quality discharge.
METHODS
This project was approved by the Mayo Foundation Institutional Review Board. We tested the following hypotheses:
It is possible to make and display DAs in various care units.
Most DAs can be scheduled a day before dismissal.
Most DA patients depart on time.
Setting
Mayo Clinic in Rochester, Minnesota, is a tertiary academic medical center with 2 hospitals (Saint Marys and Rochester Methodist) that house a total of 1951 licensed beds in 76 care units.
The preliminary study displaying DAs was carried out in the Innovation and Quality (IQ) Unit of Saint Marys Hospital, a 23‐bed general medical care unit that supports both resident and nonresident services. Traditionally, primary services usually consist of an attending physician and house officer physicians (junior and senior residents). Less commonly, primary services consist of an attending physician and either a nurse‐practitioner or a physician assistant.
The design pilot took place between August 2 and December 24, 2003. The subsequent, larger study of applicability took place across 8 care units (including the IQ Unit) between December 28, 2003, and April 25, 2004.
Preliminary Work: Design Pilot
We designed bedside dry‐erase wall displays and mounted them in the rooms in plain view of patients and their families and caregivers. Pilot testing of DA scheduling was done on a general medical care unit from August 2 to December 24, 2003. To optimize the process for scheduling a DA, our team developed 21 small tests to change the dismissal process through plan, do, study, and act cycles.11
The recommended process was that as soon as an organized discharge could be reasonably envisioned, the primary service provider would discuss with the patient, family, and primary nurse (and a social service worker, if involved) the anticipated discharge day. A member of the primary service was to handwrite (with a marker) the anticipated day on the specially designed bedside dry‐erase board (Fig. 1) in view of the patient. The same primary service prescribers could amend this anticipated day (or time) by repeating the process of consultation and discussion as needed. The time of the DA could be written on the DA board (or amended) by either a member of the primary service or the primary care nurse.
Each morning, the primary care nurse transmitted the DA board data to the admission, discharge, and transfer log kept at the unit secretary desk (in which the actual discharge time has always been routinely recorded by the unit secretary).
Adoption of DA Scheduling in Other Care Units
Several meetings were held with 7 other patient care unit leaders about adopting the protocol. These units, both medical and surgical, were selected according to 3 criteria: (1) prior participation in unit‐level continuous improvement work, (2) current or recent work in any aspect of the discharge process, and (3) a reputation for having innovative nursing leadership and staff.
Data Acquisition and Analysis
Data were collected daily from each participating unit's admission, discharge, and transfer log: both the actual time of departure and the DA, if one had been scheduled. For each DA patient, the DA time was compared with the actual departure time.
RESULTS
During the 4‐month study of discharges across 8 care units, 1256 of 2046 patients (61%) received a DA; 576 of the DAs (46%) were scheduled at least 1 day in advance (Table 1). Among patients with a DA, 752 were discharged on time (60%), and only 240 (19%) were tardy.
| Unit | DAs | Departure time of patients compared with DA | |||||
|---|---|---|---|---|---|---|---|
| No. | Type of unit | No. of patients | Patients with DAs, n (%) | DAs scheduled ϵ 1 day ahead, n (%) | On time, n (%)a | Early, n (%) | Late, n (%) |
| |||||||
| 1 | Neurology/neurosurgery | 525 | 270 (51) | 0 (0) | 175 (65) | 44 (16) | 51 (19) |
| 2 | Surgery (mixed) | 481 | 325 (68) | 289 (89) | 166 (51) | 101 (31) | 58 (18) |
| 3 | General internal medicine (IQ Unit) | 466 | 243 (52) | 35 (14) | 132 (54) | 50 (21) | 61 (25) |
| 4 | Neurology/neurosurgery | 267 | 189 (71) | 40 (21) | 119 (63) | 41 (22) | 29 (15) |
| 5 | Vascular surgery | 201 | 127 (63) | 127 (100) | 90 (71) | 12 (9) | 25 (20) |
| 6 | Psychiatry | 46 | 42 (91) | 42 (100) | 28 (67) | 9 (21) | 5 (12) |
| 7 | Orthopedic surgeryelective | 38 | 38 (100) | 22 (58) | 24 (63) | 3 (8) | 11 (29) |
| 8 | Orthopedic surgerytrauma | 22 | 22 (100) | 21 (95) | 18 (82) | 4 (18) | 0 (0) |
| Total | 2046 | 1256 (61) | 576 (46) | 752 (60) | 264 (21) | 240 (19) | |
DISCUSSION
In response to patient focus group feedback, we designed a tool and a process by which a DA could be made and posted at bedside. Among 2046 patients discharged from 8 care units over 4 months, 61% (1256) had a posted, in‐room DA. Almost half the patients with DAs (46%) had a DA scheduled at least 1 calendar day ahead. Remarkably, among patients with a DA, fewer than 20% were discharged tardily. In‐room posting of DAs across a spectrum of care units appears to be practicable, even in the face of extant diagnostic or therapeutic uncertainty.
This was an initial test‐of‐concept project and an exploratory trial. The limitations are: (1) satisfaction (patient, family, nurse, and physician) was not tested with any validated survey instrument, (2) length of stay was not studied, (3) reasons for variable DA success among care units were not ascertained, and (4) resource use was not measured.
Anecdotal information from a postdischarge phone survey indicated that patients seemed appreciative of a DA. The survey data were not included in this article because the survey tool was not a validated instrument and the interviewer (a coauthor) was not blinded to the hypothesis and was therefore subject to bias. No negative comments were received through informal real‐time feedback from patients and family during the making and posting of DAs, and encouraging comments were common.
Physician participation in posting the DA appeared to be key, and the unavoidable dialogue about the clinical rationale for a chosen date seemed welcome. A telling anecdote came from a patient who did not have a DA board: I didn't get the same treatment as my roommate with the [DA] board. The other doctors talked with [him] more about discharge. I wish my team would have done this more with me.
We cannot be certain of the reasons for the care unit disparity in setting and meeting DAs. We speculate that the level of staff enthusiasm for DAs explains the variation rather than patient population characteristics. Further, we cannot explain why 39% of the patients did not receive a DA. Physician feedback was generally, but not uniformly, positive. Negative comments that might explain DA omissions include: (1) patients already are informed and awarethe tool is superfluous; (2) the day of discharge is unknowable in advance; and (3) patients or family members will hold us to it or be upset if the DA is changed.
We expected that diagnostic uncertainty might pose challenges to providing DAs. When primary service providers were reassured that DAs could be amended, this concern was reduced (but not eliminated). It seemed useful for providers to envision the earliest day of discharge by assuming that the results of a pending key test or consultation would be favorable. Frequency of DA modification was not studied. DAs were amended, however, and patients (to our knowledge) seemed unperturbedperhaps because of an almost unavoidable discussion of the clinical rationale because the act of posting the DA occurred in full view of (and in partnership with) the patient.
A trend toward discharge earlier in the day was observed (data not shown). Theoretically, such a trend offers the potential to improve inpatient flow, in part by discharging patients before morning surgical cases are completed.
Although we had many favorable comments about DAs from patients, family members, and nurses, satisfaction of patients, families, and staff members deserves formal study. Further, it is not known whether unused DA boards might contribute to patient dissatisfaction. Any effect that the display of DAs may have on the length of stay also may be a topic worthy of future study.
CONCLUSIONS
Patients and their families sometimes desire more communication about the anticipated day and time of hospital discharge. We designed a process for making a tentative DA and a tool by which the DA could be posted at the bedside. The results of this study suggest that (1) despite some uncertainty it is possible to schedule and post DAs in‐room in various care units and in various settings, (2) DAs were made at least a day ahead of time in almost half the DA discharges, and (3) most DA discharges were characterized by on‐time departure. In addition, patient, family, and nursing satisfaction (in relation to the DA) warrants further investigation.
Acknowledgements
We acknowledge the valuable insights and collaboration of our colleagues Deborah R. Fischer, Steven L. Bahnemann, Matthew Skelton, MD, Lauri J. Dahl, Pamela O. Johnson, MSN, Debra A. Hernke, MSN, Susan L. Stirn, MSN, Barbara R. Spurrier, Ryan R. Armbruster, Todd J. Bille, and Donna K. Lawson of the Mayo Clinic and Mayo Foundation.
- ,,, et al.Learning from patients: a discharge planning improvement project.Jt Comm J Qual Improv.1996;22:311–22.
- ,,,,,, et al.Payer‐hospital collaboration to improve patient satisfaction with hospital discharge.Jt Comm J Qual Improv.1996;22:336–344.
- ,,,,,.How was your hospital stay? Patients' reports about their care in Canadian hospitals.CMAJ.1994;150:1813–1822.
- .A hospitalization from hell: a patient's perspective on quality.Ann Intern Med.2003;138:33–39.
- ,,.Predictors of elder and family caregiver satisfaction with discharge planning.J Cardiovasc Nurs.2000;14:76–87.
- ,,,,.The incidence and severity of adverse events affecting patients after discharge from the hospital.Ann Intern Med.2003;138:161–167.
- ,,, et al.Patient callback program: a quality improvement, customer service, and marketing tool.J Health Care Mark.1993;13:60–65.
- ,,,.Effects of a medical team coordinator on length of hospital stay.CMAJ.1992;146:511–515.
- ,.Discharge planning from hospital to home.Cochrane Database Syst Rev.2000;4:CD000313.
- ,,,.Continuity of care and patient outcomes after hospital discharge.J Gen Intern Med.2004;19:624–631.
- Institute for Healthcare Improvement. Cambridge, UK: Institute for Healthcare Improvement. Available from: http://www.ihi.org/IHI/Topics/Improvement/ImprovementMethods/HowToImprove/testingchanges.htm. Accessed July 28,2006.
Copyright © 2007 Society of Hospital Medicine