Frequent and prolonged fasting can lead to patient dissatisfaction and distress.1 It may also cause malnutrition and negatively affect outcomes in high-risk populations such as the elderly.2 Evidence suggests that patients are commonly kept fasting longer than necessary.3,4 However, the extent to which nil per os (NPO) orders are necessary or adhere to evidence-based duration is unknown.
Our study showed half of patients admitted to the general medicine services experienced a period of fasting, and 1 in 4 NPO orders may be avoidable.5 In this study, we aimed to provide action-oriented recommendations by 1) assessing why some interventions did not occur after NPO orders were placed and 2) analyzing NPO orders by indication and comparing them with the best available evidence.
METHOD
This retrospective study was conducted at an academic medical center in the United States. The study protocol was approved by the Mayo Clinic Institutional Review Board.
Detailed data handling and NPO order review processes have been described elsewhere.5 Briefly, we identified 1200 NPO orders of 120 or more minutes’ duration that were written for patients on the general medicine services at our institution in 2013. After blinded duplicate review, we excluded 70 orders written in the intensive care unit or on other services, 24 with unknown indications, 101 primarily indicated for clinical reasons, and 81 that had multiple indications. Consequently, 924 orders indicated for a single intervention (eg, imaging study, procedure, or operation) were included in the main analysis.
We assessed if the indicated intervention was performed. If performed, we recorded the time when the intervention was started. If not performed, we assessed reasons why it was not performed. We also performed exploratory analyses to investigate factors associated with performing the indicated intervention. The variables were 1) NPO starting at midnight, 2) NPO starting within 12 hours of admission, and 3) indication (eg, imaging study, procedure, or operation). We also conducted sensitivity analyses limited to 1 NPO order per patient (N = 673) to assess independence of the orders.
We then further categorized indications for the orders in detail and identified those with a sample size >10. This resulted in 779 orders that were included in the analysis by indication. We reviewed the literature by indication to determine suggested minimally required fasting durations to compare fasting duration in our patients to current evidence-based recommendations.
For descriptive statistics, we used median with interquartile range (IQR) for continuous variables and percentage for discrete variables; chi-square tests were used for comparison of discrete variables. All P values were two-tailed and P < 0.05 was considered significant.
RESULTS
Median length of 924 orders was 12.7 hours (IQR, 10.1-15.7 hours); 190 (20.1%), 577 (62.4%), and 157 (21.0%) orders were indicated for imaging studies, procedures, and operations, respectively. NPO started at midnight in 662 (71.6%) and within 12 hours of admission in 210 (22.7%) orders.
The indicated interventions were not performed in 183 (19.8%) orders, mostly as a result of a change in plan (75/183, 41.0%) or scheduling barriers (43/183, 23.5%). Plan changes occurred when, for example, input from a consulting service was obtained or the supervising physician decided not to pursue the intervention. Scheduling barriers included slots being unavailable and conflicts with other tasks/tests. Notably, only in 1 of 183 (0.5%) orders, the intervention was cancelled because the patient ate (Table 1).
Table 1
NPO orders starting at midnight were associated with higher likelihood of indicated interventions being performed (546/662, 82.5% vs. 195/262, 74.4%; P = 0.006), as were NPO orders starting more than 12 hours after admission (601/714, 84.2% vs. 140/210, 66.7%; P < 0.001). Imaging studies were more likely to be performed than procedures or operations (170/190, 89.5% vs. 452/577, 78.3% vs. 119/157, 75.8%; P = 0.001). These results were unchanged when the analyses were limited to 1 order per patient.
When analyzed by indication, the median durations of NPO orders ranged from 8.3 hours in kidney ultrasound to 13.9 hours in upper endoscopy. These were slightly shortened, most by 1 to 2 hours, when the duration was calculated from start of the order to initiation of the intervention. The literature review identified, for most indications, that the minimally required length of NPO were 2 to 4 hours, generally 6 to 8 hours shorter than the median NPO length in this study sample. Furthermore, for indications such as computed tomography with intravenous contrast and abdominal ultrasound, the literature suggested NPO may be unnecessary (Table 2).6-9,16-30
Table 2
DISCUSSION
We analyzed a comprehensive set of NPO orders written for interventions in medical inpatients at an academic medical center. NPO started at midnight in 71.6% of the analyzed orders. In 1 in 5 NPO orders, the indicated intervention was not performed largely due to a change in plan or scheduling barriers. In most NPO orders in which the indicated interventions were performed, patients were kept fasting either unnecessarily or much longer than needed. This study is the first of its kind in evaluating NPO-ordering practices across multiple indications and comparing them with the best available evidence.
These results suggest current NPO practice in the hospital is suboptimal, and limited literature measures the magnitude of this issue.6,7 An important aspect of our study findings is that, in a substantial number of NPO orders, the indicated interventions were not performed for seemingly avoidable reasons. These issues may be attributable to clinicians’ preemptive decisions or lack of knowledge, or inefficiency in the healthcare system. Minimizing anticipatory NPO may carry drawbacks such as delays in interventions, and limited evidence links excessive NPO with clinical outcomes (eg, length of stay, readmission, or death). However, from the patients’ perspective, it is important to be kept fasting only for clinical benefit. Hence, this calls for substantial improvement of NPO practices.
Furthermore, results indicated that the duration of most NPO orders was longer than the minimal duration currently suggested in the literature. Whereas strong evidence suggests that no longer than 2 hours of fasting is generally required for preoperative purposes,8 limited studies have evaluated the required length of NPO orders in imaging studies and procedures,9-11 which comprised most of the orders in the study cohort. For example, in upper endoscopy, 2 small studies suggested fasting for 1 or 2 hours may provide as good visualization as with the conventional 6 to 8 hours of fasting.9,10 In coronary angiography, a retrospective study demonstrated fasting may be unnecessary.11 Due to lack of robust evidence, guidelines for these interventions either do not specify the required length of fasting or have not changed the conventional recommendations for fasting, leading to large variations in fasting policies by institution.6,12 Therefore, more studies are needed to define required length of fasting for those indications and to measure the exact magnitude of excessive fasting in the hospital.
One of the limitations of this study is generalizability because NPO practice may considerably vary by institution as suggested in the literature.4,6,12 Conversely, studies have suggested that excessive fasting exists in other institutions.3,4,13 Thus, this study adds further evidence of the prevalence of suboptimal NPO practice to the literature and provides a benchmark that other institutions can refer to when evaluating their own NPO practice. Another limitation is the assumption that the evidence for minimally required NPO duration can be applied to our patient samples. Specifically, the American Society of Anesthesiologists guideline states that preoperative or preprocedural fasting may need to be longer than 2 hours for 1) patients with comorbidities that can affect gastric emptying or fluid volume such as obesity, diabetes, emergency care, and enteral tube feeding, and 2) patients in whom airway management might be difficult.8 We did not consider these possibilities, and as these conditions are prevalent in medical inpatients, we may be overstating the excessiveness of fasting orders. On the other hand, especially in patients with diabetes, prolonged fasting may cause harm by inducing hypoglycemia.14 Further, no study rigorously evaluated safety of shortening the fasting period for these subsets of patients. Therefore, it is necessary to establish optimal duration of NPO and to improve NPO ordering practice even in these patient subsets.
While more research is needed to define optimal duration of NPO for various interventions and specific subsets of patients and to establish linkage of excessive NPO with clinical outcomes, our data provide insights into immediate actions that can be taken by clinicians to improve NPO practices using our data as a benchmark. First, institutions can establish more robust practice guidelines or institutional protocols for NPO orders. Successful interventions have been reported,15 and breaking the habit of ordering NPO after midnight is certainly possible. We recommend each institution does so by indication, potentially through interdepartmental work groups involving appropriate departments such as radiology, surgery, and medicine. Second, institutional guidelines or protocols can be incorporated in the ordering system to enable appropriate NPO ordering. For example, at our institution, we are modifying the order screens for ultrasound-guided paracentesis and thoracentesis to indicate that NPO is not necessary for these procedures unless sedation is anticipated. We conclude that, at any institution, efforts in improving the NPO practice are urgently warranted to minimize unnecessary fasting.
Disclosures
This publication was supported by Grant Number UL1 TR000135 from the National Center for Advancing Translational Sciences (NCATS). Its contents are solely the responsibility of the authors and do not necessarily represent the official views of the National Institutes of Health. The authors report no financial conflicts of interest.
References
1. Carey SK, Conchin S, Bloomfield-Stone S. A qualitative study into the impact of fasting within a large tertiary hospital in Australia - the patients’ perspective. J Clin Nurs. 2015;24:1946-1954. PubMed
2. Kyriakos G, Calleja-Fernández A, Ávila-Turcios D, Cano-Rodríguez I, Ballesteros Pomar MD, Vidal-Casariego A. Prolonged fasting with fluid therapy is related to poorer outcomes in medical patients. Nutr Hosp. 2013;28:1710-1716. PubMed
3. Rycroft-Malone J, Seers K, Crichton N, et al. A pragmatic cluster randomised trial evaluating three implementation interventions. Implement Sci. 2012;7:80. PubMed
4. Breuer JP, Bosse G, Seifert S, et al. Pre-operative fasting: a nationwide survey of German anaesthesia departments. Acta Anaesthesiol Scand. 2010;54:313-320. PubMed
5. Sorita A, Thongprayoon C, Ahmed A, et al. Frequency and appropriateness of fasting orders in the hospital. Mayo Clin Proc. 2015;90:1225-1232. PubMed
6. Lee BY, Ok JJ, Abdelaziz Elsayed AA, Kim Y, Han DH. Preparative fasting for contrast-enhanced CT: reconsideration. Radiology. 2012;263:444-450. PubMed
7. Manchikanti L, Malla Y, Wargo BW, Fellows B. Preoperative fasting before interventional techniques: is it necessary or evidence-based? Pain Physician. 2011;14:459-467. PubMed
8. American Society of Anesthesiologists Committee. Practice guidelines for preoperative fasting and the use of pharmacologic agents to reduce the risk of pulmonary aspiration: application to healthy patients undergoing elective procedures: an updated report by the American Society of Anesthesiologists Committee on Standards and Practice Parameters. Anesthesiology. 2011;114:495-511. PubMed
9. Koeppe AT, Lubini M, Bonadeo NM, Moraes I Jr, Fornari F. Comfort, safety and quality of upper gastrointestinal endoscopy after 2 hours fasting: a randomized controlled trial. BMC Gastroenterol. 2013;13:158. PubMed
10. De Silva AP, Amarasiri L, Liyanage MN, Kottachchi D, Dassanayake AS, de Silva HJ. One-hour fast for water and six-hour fast for solids prior to endoscopy provides good endoscopic vision and results in minimum patient discomfort. J Gastroenterol Hepatol. 2009;24:1095-1097. PubMed
11. Hamid T, Aleem Q, Lau Y, et al. Pre-procedural fasting for coronary interventions: is it time to change practice? Heart. 2014;100:658-661. PubMed
12. Ahmed SU, Tonidandel W, Trella J, Martin NM, Chang Y. Peri-procedural protocols for interventional pain management techniques: a survey of US pain centers. Pain Physician. 2005;8:181-185. PubMed
13. Franklin GA, McClave SA, Hurt RT, et al. Physician-delivered malnutrition: why do patients receive nothing by mouth or a clear liquid diet in a university hospital setting? JPEN J Parenter Enteral Nutr. 2011;35:337-342. PubMed
14. Aldasouqi S, Sheikh A, Klosterman P, et al. Hypoglycemia in patients with diabetes who are fasting for laboratory blood tests: the Cape Girardeau Hypoglycemia En Route Prevention Program. Postgrad Med. 2013;125:136-143. PubMed
15. Aguilar-Nascimento JE, Salomão AB, Caporossi C, Diniz BN. Clinical benefits after the implementation of a multimodal perioperative protocol in elderly patients. Arq Gastroenterol. 2010;47:178-183. PubMed
16. Hilberath JN, Oakes DA, Shernan SK, Bulwer BE, D’Ambra MN, Eltzschig HK. Safety of transesophageal echocardiography. J Am Soc Echocardiogr. 2010;23: 1115-1127. PubMed
17. Hahn RT, Abraham T, Adams MS, et al. Guidelines for performing a comprehensive transesophageal echocardiographic examination: recommendations from the American Society of Echocardiography and the Society of Cardiovascular Anesthesiologists. J Am Soc Echocardiogr. 2013;26:921-964. PubMed
18. Sinan T, Leven H, Sheikh M. Is fasting a necessary preparation for abdominal ultrasound? BMC Med Imaging. 2003;3:1. PubMed
19. Garcia DA, Froes TR. Importance of fasting in preparing dogs for abdominal ultrasound examination of specific organs. J Small Anim Pract. 2014;55:630-634. PubMed
20. Kidney ultrasound. The Johns Hopkins University, The Johns Hopkins Hospital, and Johns Hopkins Health System. Health Library, Johns Hopkins Medicine. Available at: http://www.hopkinsmedicine.org/healthlibrary/test_procedures/urology/kidney_ultrasound_92,P07709/. Accessed August 17, 2015.
21. Surasi DS, Bhambhvani P, Baldwin JA, Almodovar SE, O’Malley JP. 18F-FDG PET and PET/CT patient preparation: a review of the literature. J Nucl Med Technol. 2014;42:5-13. PubMed
22. Kang SH, Hyun JJ. Preparation and patient evaluation for safe gastrointestinal endoscopy. Clin Endosc. 2013;46:212-218. PubMed
23. Smith I, Kranke P, Murat I, et al. Perioperative fasting in adults and children: guidelines from the European Society of Anaesthesiology. Eur J Anaesthesiol. 2011;28:556-569. PubMed
24. ASGE Standards of Practice Committee, Saltzman JR, Cash BD, Pasha SF, et al. Bowel preparation before colonoscopy. Gastrointest Endosc. 2015;81:781-794. PubMed
25. Hassan C, Bretthauer M, Kaminski MF, et al; European Society of Gastrointestinal Endoscopy. Bowel preparation for colonoscopy: European Society of Gastrointestinal Endoscopy (ESGE) guideline. Endoscopy. 2013;45:142-150. PubMed
26. Du Rand IA, Blaikley J, Booton R, et al; British Thoracic Society Bronchoscopy Guideline Group. British Thoracic Society guideline for diagnostic flexible bronchoscopy in adults: accredited by NICE. Thorax. 2013;68(suppl 1):i1-i44. PubMed
27. Thoracentesis. The Johns Hopkins University, The Johns Hopkins Hospital, and Johns Hopkins Health System. Health Library, Johns Hopkins Medicine. Available at: http://www.hopkinsmedicine.org/healthlibrary/test_procedures/pulmonary/thoracentesis_92,P07761/. Accessed August 18, 2015.
28. Runyon BA. Diagnostic and therapeutic abdominal paracentesis. UpToDate. Available at: http://www.uptodate.com/contents/diagnostic-and-therapeutic-abdominal-paracentesis. Published February 18, 2014. Accessed August 18, 2015.
29. Granata A, Fiorini F, Andrulli S, et al. Doppler ultrasound and renal artery stenosis: An overview. J Ultrasound. 2009;12:133-143. PubMed
30. Gerhard-Herman M, Gardin JM, Jaff M, et al. Guidelines for noninvasive vascular laboratory testing: a report from the American Society of Echocardiography and the Society for Vascular Medicine and Biology. Vasc Med. 2006;11:183-200. PubMed
Frequent and prolonged fasting can lead to patient dissatisfaction and distress.1 It may also cause malnutrition and negatively affect outcomes in high-risk populations such as the elderly.2 Evidence suggests that patients are commonly kept fasting longer than necessary.3,4 However, the extent to which nil per os (NPO) orders are necessary or adhere to evidence-based duration is unknown.
Our study showed half of patients admitted to the general medicine services experienced a period of fasting, and 1 in 4 NPO orders may be avoidable.5 In this study, we aimed to provide action-oriented recommendations by 1) assessing why some interventions did not occur after NPO orders were placed and 2) analyzing NPO orders by indication and comparing them with the best available evidence.
METHOD
This retrospective study was conducted at an academic medical center in the United States. The study protocol was approved by the Mayo Clinic Institutional Review Board.
Detailed data handling and NPO order review processes have been described elsewhere.5 Briefly, we identified 1200 NPO orders of 120 or more minutes’ duration that were written for patients on the general medicine services at our institution in 2013. After blinded duplicate review, we excluded 70 orders written in the intensive care unit or on other services, 24 with unknown indications, 101 primarily indicated for clinical reasons, and 81 that had multiple indications. Consequently, 924 orders indicated for a single intervention (eg, imaging study, procedure, or operation) were included in the main analysis.
We assessed if the indicated intervention was performed. If performed, we recorded the time when the intervention was started. If not performed, we assessed reasons why it was not performed. We also performed exploratory analyses to investigate factors associated with performing the indicated intervention. The variables were 1) NPO starting at midnight, 2) NPO starting within 12 hours of admission, and 3) indication (eg, imaging study, procedure, or operation). We also conducted sensitivity analyses limited to 1 NPO order per patient (N = 673) to assess independence of the orders.
We then further categorized indications for the orders in detail and identified those with a sample size >10. This resulted in 779 orders that were included in the analysis by indication. We reviewed the literature by indication to determine suggested minimally required fasting durations to compare fasting duration in our patients to current evidence-based recommendations.
For descriptive statistics, we used median with interquartile range (IQR) for continuous variables and percentage for discrete variables; chi-square tests were used for comparison of discrete variables. All P values were two-tailed and P < 0.05 was considered significant.
RESULTS
Median length of 924 orders was 12.7 hours (IQR, 10.1-15.7 hours); 190 (20.1%), 577 (62.4%), and 157 (21.0%) orders were indicated for imaging studies, procedures, and operations, respectively. NPO started at midnight in 662 (71.6%) and within 12 hours of admission in 210 (22.7%) orders.
The indicated interventions were not performed in 183 (19.8%) orders, mostly as a result of a change in plan (75/183, 41.0%) or scheduling barriers (43/183, 23.5%). Plan changes occurred when, for example, input from a consulting service was obtained or the supervising physician decided not to pursue the intervention. Scheduling barriers included slots being unavailable and conflicts with other tasks/tests. Notably, only in 1 of 183 (0.5%) orders, the intervention was cancelled because the patient ate (Table 1).
Table 1
NPO orders starting at midnight were associated with higher likelihood of indicated interventions being performed (546/662, 82.5% vs. 195/262, 74.4%; P = 0.006), as were NPO orders starting more than 12 hours after admission (601/714, 84.2% vs. 140/210, 66.7%; P < 0.001). Imaging studies were more likely to be performed than procedures or operations (170/190, 89.5% vs. 452/577, 78.3% vs. 119/157, 75.8%; P = 0.001). These results were unchanged when the analyses were limited to 1 order per patient.
When analyzed by indication, the median durations of NPO orders ranged from 8.3 hours in kidney ultrasound to 13.9 hours in upper endoscopy. These were slightly shortened, most by 1 to 2 hours, when the duration was calculated from start of the order to initiation of the intervention. The literature review identified, for most indications, that the minimally required length of NPO were 2 to 4 hours, generally 6 to 8 hours shorter than the median NPO length in this study sample. Furthermore, for indications such as computed tomography with intravenous contrast and abdominal ultrasound, the literature suggested NPO may be unnecessary (Table 2).6-9,16-30
Table 2
DISCUSSION
We analyzed a comprehensive set of NPO orders written for interventions in medical inpatients at an academic medical center. NPO started at midnight in 71.6% of the analyzed orders. In 1 in 5 NPO orders, the indicated intervention was not performed largely due to a change in plan or scheduling barriers. In most NPO orders in which the indicated interventions were performed, patients were kept fasting either unnecessarily or much longer than needed. This study is the first of its kind in evaluating NPO-ordering practices across multiple indications and comparing them with the best available evidence.
These results suggest current NPO practice in the hospital is suboptimal, and limited literature measures the magnitude of this issue.6,7 An important aspect of our study findings is that, in a substantial number of NPO orders, the indicated interventions were not performed for seemingly avoidable reasons. These issues may be attributable to clinicians’ preemptive decisions or lack of knowledge, or inefficiency in the healthcare system. Minimizing anticipatory NPO may carry drawbacks such as delays in interventions, and limited evidence links excessive NPO with clinical outcomes (eg, length of stay, readmission, or death). However, from the patients’ perspective, it is important to be kept fasting only for clinical benefit. Hence, this calls for substantial improvement of NPO practices.
Furthermore, results indicated that the duration of most NPO orders was longer than the minimal duration currently suggested in the literature. Whereas strong evidence suggests that no longer than 2 hours of fasting is generally required for preoperative purposes,8 limited studies have evaluated the required length of NPO orders in imaging studies and procedures,9-11 which comprised most of the orders in the study cohort. For example, in upper endoscopy, 2 small studies suggested fasting for 1 or 2 hours may provide as good visualization as with the conventional 6 to 8 hours of fasting.9,10 In coronary angiography, a retrospective study demonstrated fasting may be unnecessary.11 Due to lack of robust evidence, guidelines for these interventions either do not specify the required length of fasting or have not changed the conventional recommendations for fasting, leading to large variations in fasting policies by institution.6,12 Therefore, more studies are needed to define required length of fasting for those indications and to measure the exact magnitude of excessive fasting in the hospital.
One of the limitations of this study is generalizability because NPO practice may considerably vary by institution as suggested in the literature.4,6,12 Conversely, studies have suggested that excessive fasting exists in other institutions.3,4,13 Thus, this study adds further evidence of the prevalence of suboptimal NPO practice to the literature and provides a benchmark that other institutions can refer to when evaluating their own NPO practice. Another limitation is the assumption that the evidence for minimally required NPO duration can be applied to our patient samples. Specifically, the American Society of Anesthesiologists guideline states that preoperative or preprocedural fasting may need to be longer than 2 hours for 1) patients with comorbidities that can affect gastric emptying or fluid volume such as obesity, diabetes, emergency care, and enteral tube feeding, and 2) patients in whom airway management might be difficult.8 We did not consider these possibilities, and as these conditions are prevalent in medical inpatients, we may be overstating the excessiveness of fasting orders. On the other hand, especially in patients with diabetes, prolonged fasting may cause harm by inducing hypoglycemia.14 Further, no study rigorously evaluated safety of shortening the fasting period for these subsets of patients. Therefore, it is necessary to establish optimal duration of NPO and to improve NPO ordering practice even in these patient subsets.
While more research is needed to define optimal duration of NPO for various interventions and specific subsets of patients and to establish linkage of excessive NPO with clinical outcomes, our data provide insights into immediate actions that can be taken by clinicians to improve NPO practices using our data as a benchmark. First, institutions can establish more robust practice guidelines or institutional protocols for NPO orders. Successful interventions have been reported,15 and breaking the habit of ordering NPO after midnight is certainly possible. We recommend each institution does so by indication, potentially through interdepartmental work groups involving appropriate departments such as radiology, surgery, and medicine. Second, institutional guidelines or protocols can be incorporated in the ordering system to enable appropriate NPO ordering. For example, at our institution, we are modifying the order screens for ultrasound-guided paracentesis and thoracentesis to indicate that NPO is not necessary for these procedures unless sedation is anticipated. We conclude that, at any institution, efforts in improving the NPO practice are urgently warranted to minimize unnecessary fasting.
Disclosures
This publication was supported by Grant Number UL1 TR000135 from the National Center for Advancing Translational Sciences (NCATS). Its contents are solely the responsibility of the authors and do not necessarily represent the official views of the National Institutes of Health. The authors report no financial conflicts of interest.
References
1. Carey SK, Conchin S, Bloomfield-Stone S. A qualitative study into the impact of fasting within a large tertiary hospital in Australia - the patients’ perspective. J Clin Nurs. 2015;24:1946-1954. PubMed
2. Kyriakos G, Calleja-Fernández A, Ávila-Turcios D, Cano-Rodríguez I, Ballesteros Pomar MD, Vidal-Casariego A. Prolonged fasting with fluid therapy is related to poorer outcomes in medical patients. Nutr Hosp. 2013;28:1710-1716. PubMed
3. Rycroft-Malone J, Seers K, Crichton N, et al. A pragmatic cluster randomised trial evaluating three implementation interventions. Implement Sci. 2012;7:80. PubMed
4. Breuer JP, Bosse G, Seifert S, et al. Pre-operative fasting: a nationwide survey of German anaesthesia departments. Acta Anaesthesiol Scand. 2010;54:313-320. PubMed
5. Sorita A, Thongprayoon C, Ahmed A, et al. Frequency and appropriateness of fasting orders in the hospital. Mayo Clin Proc. 2015;90:1225-1232. PubMed
6. Lee BY, Ok JJ, Abdelaziz Elsayed AA, Kim Y, Han DH. Preparative fasting for contrast-enhanced CT: reconsideration. Radiology. 2012;263:444-450. PubMed
7. Manchikanti L, Malla Y, Wargo BW, Fellows B. Preoperative fasting before interventional techniques: is it necessary or evidence-based? Pain Physician. 2011;14:459-467. PubMed
8. American Society of Anesthesiologists Committee. Practice guidelines for preoperative fasting and the use of pharmacologic agents to reduce the risk of pulmonary aspiration: application to healthy patients undergoing elective procedures: an updated report by the American Society of Anesthesiologists Committee on Standards and Practice Parameters. Anesthesiology. 2011;114:495-511. PubMed
9. Koeppe AT, Lubini M, Bonadeo NM, Moraes I Jr, Fornari F. Comfort, safety and quality of upper gastrointestinal endoscopy after 2 hours fasting: a randomized controlled trial. BMC Gastroenterol. 2013;13:158. PubMed
10. De Silva AP, Amarasiri L, Liyanage MN, Kottachchi D, Dassanayake AS, de Silva HJ. One-hour fast for water and six-hour fast for solids prior to endoscopy provides good endoscopic vision and results in minimum patient discomfort. J Gastroenterol Hepatol. 2009;24:1095-1097. PubMed
11. Hamid T, Aleem Q, Lau Y, et al. Pre-procedural fasting for coronary interventions: is it time to change practice? Heart. 2014;100:658-661. PubMed
12. Ahmed SU, Tonidandel W, Trella J, Martin NM, Chang Y. Peri-procedural protocols for interventional pain management techniques: a survey of US pain centers. Pain Physician. 2005;8:181-185. PubMed
13. Franklin GA, McClave SA, Hurt RT, et al. Physician-delivered malnutrition: why do patients receive nothing by mouth or a clear liquid diet in a university hospital setting? JPEN J Parenter Enteral Nutr. 2011;35:337-342. PubMed
14. Aldasouqi S, Sheikh A, Klosterman P, et al. Hypoglycemia in patients with diabetes who are fasting for laboratory blood tests: the Cape Girardeau Hypoglycemia En Route Prevention Program. Postgrad Med. 2013;125:136-143. PubMed
15. Aguilar-Nascimento JE, Salomão AB, Caporossi C, Diniz BN. Clinical benefits after the implementation of a multimodal perioperative protocol in elderly patients. Arq Gastroenterol. 2010;47:178-183. PubMed
16. Hilberath JN, Oakes DA, Shernan SK, Bulwer BE, D’Ambra MN, Eltzschig HK. Safety of transesophageal echocardiography. J Am Soc Echocardiogr. 2010;23: 1115-1127. PubMed
17. Hahn RT, Abraham T, Adams MS, et al. Guidelines for performing a comprehensive transesophageal echocardiographic examination: recommendations from the American Society of Echocardiography and the Society of Cardiovascular Anesthesiologists. J Am Soc Echocardiogr. 2013;26:921-964. PubMed
18. Sinan T, Leven H, Sheikh M. Is fasting a necessary preparation for abdominal ultrasound? BMC Med Imaging. 2003;3:1. PubMed
19. Garcia DA, Froes TR. Importance of fasting in preparing dogs for abdominal ultrasound examination of specific organs. J Small Anim Pract. 2014;55:630-634. PubMed
20. Kidney ultrasound. The Johns Hopkins University, The Johns Hopkins Hospital, and Johns Hopkins Health System. Health Library, Johns Hopkins Medicine. Available at: http://www.hopkinsmedicine.org/healthlibrary/test_procedures/urology/kidney_ultrasound_92,P07709/. Accessed August 17, 2015.
21. Surasi DS, Bhambhvani P, Baldwin JA, Almodovar SE, O’Malley JP. 18F-FDG PET and PET/CT patient preparation: a review of the literature. J Nucl Med Technol. 2014;42:5-13. PubMed
22. Kang SH, Hyun JJ. Preparation and patient evaluation for safe gastrointestinal endoscopy. Clin Endosc. 2013;46:212-218. PubMed
23. Smith I, Kranke P, Murat I, et al. Perioperative fasting in adults and children: guidelines from the European Society of Anaesthesiology. Eur J Anaesthesiol. 2011;28:556-569. PubMed
24. ASGE Standards of Practice Committee, Saltzman JR, Cash BD, Pasha SF, et al. Bowel preparation before colonoscopy. Gastrointest Endosc. 2015;81:781-794. PubMed
25. Hassan C, Bretthauer M, Kaminski MF, et al; European Society of Gastrointestinal Endoscopy. Bowel preparation for colonoscopy: European Society of Gastrointestinal Endoscopy (ESGE) guideline. Endoscopy. 2013;45:142-150. PubMed
26. Du Rand IA, Blaikley J, Booton R, et al; British Thoracic Society Bronchoscopy Guideline Group. British Thoracic Society guideline for diagnostic flexible bronchoscopy in adults: accredited by NICE. Thorax. 2013;68(suppl 1):i1-i44. PubMed
27. Thoracentesis. The Johns Hopkins University, The Johns Hopkins Hospital, and Johns Hopkins Health System. Health Library, Johns Hopkins Medicine. Available at: http://www.hopkinsmedicine.org/healthlibrary/test_procedures/pulmonary/thoracentesis_92,P07761/. Accessed August 18, 2015.
28. Runyon BA. Diagnostic and therapeutic abdominal paracentesis. UpToDate. Available at: http://www.uptodate.com/contents/diagnostic-and-therapeutic-abdominal-paracentesis. Published February 18, 2014. Accessed August 18, 2015.
29. Granata A, Fiorini F, Andrulli S, et al. Doppler ultrasound and renal artery stenosis: An overview. J Ultrasound. 2009;12:133-143. PubMed
30. Gerhard-Herman M, Gardin JM, Jaff M, et al. Guidelines for noninvasive vascular laboratory testing: a report from the American Society of Echocardiography and the Society for Vascular Medicine and Biology. Vasc Med. 2006;11:183-200. PubMed
Address for Correspondence and Reprint Requests: Deanne T. Kashiwagi, MD, Mayo Clinic, Division of Hospital Internal Medicine, 200 First Street SW, Rochester, MN 55905; Telephone: 507-255-8715; Fax: 507-255-9189; Email: kashiwagi.deanne@mayo.edu
Content Gating
Open Access (article Unlocked/Open Access)
Alternative CME
Consolidated Pubs: Do Not Show Source Publication Logo
Handoffs are key events in the care of hospitalized patients whereby vital information is relayed between healthcare providers. Resident duty hour restrictions and the popularity of shift‐based work schedules have increased the frequency of inpatient handoffs.[1, 2] Failures in communication at the time of patient handoff have been implicated as contributing factors to preventable adverse events.[3, 4, 5, 6] With patient safety in mind, accreditation organizations and professional societies have made the standardization of hospital handoff procedures a priority.[7, 8] A variety of strategies have been utilized to standardize handoffs. Examples include the use of mnemonics,[9] electronic resources,[10, 11, 12] preformatted handoff sheets,[13, 14, 15, 16] and optimization of the handoff environment.[17] The primary outcomes for many of these studies center on the provider by measuring their retention of patient facts[18, 19] and completion of tasks[14, 16] after handoff, for example. Few studies examined patient‐centered outcomes such as transfer to a higher level of care,[20] length of stay,[11] mortality,[21] or readmission rate.[22] A study in the pediatric population found that implementation of a handoff bundle was associated with a decrease in medical errors and preventable adverse events.[23]
The Society of Hospital Medicine recommends that patient handoffs consist of both a written and verbal component.[8] Providers in our division work on 3 shifts: day, evening, and night. In 2009, we developed a face‐to‐face morning handoff, during which night‐shift providers hand off patient care to day‐shift providers incorporating an electronically generated service information list.[17] Given that the evening shift ends well before the day shift begins, the evening‐shift providers do not participate in this face‐to‐face handoff of care for patients they admit to day providers.
We wished to compare the clinical outcomes and adverse events of patients admitted by the night‐shift providers to those admitted by the evening‐shift providers. We hypothesized that transfer of care using a face‐to‐face handoff would be associated with fewer adverse events and improved clinical outcomes.
METHODS
The study was deemed exempt by the Mayo Clinic Institutional Review Board.
Study Population
Hospitalists at the study institution, a 1157‐bed academic tertiary referral hospital, admit general medical patients from the emergency department, as transfers from other institutions, and as direct admissions from outpatient offices. Patients included in the study were all adults admitted by evening‐ and night‐shift hospitalists from August 1, 2011 through August 1, 2012 between 6:45 pm and midnight. Our institution primarily uses 2 levels of care for adult inpatients on internal medicine services, including a general care floor for low‐acuity patients and an intensive care unit for high‐acuity patients. All of the patients in this study were triaged as low acuity at the time of admission and were initially admitted to general care units.
Setting
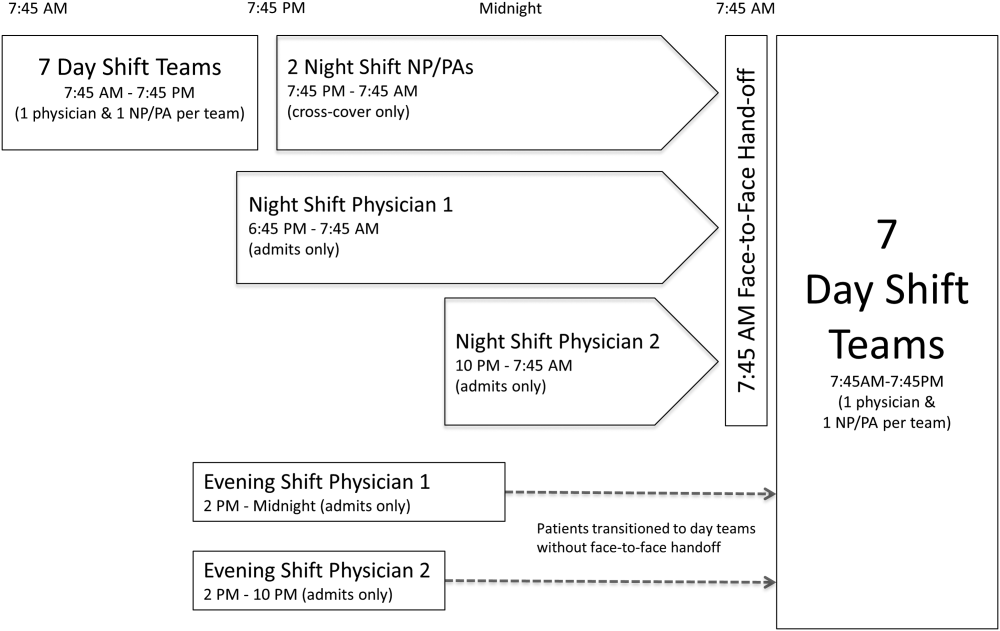
The division's shift schedule during the study period is depicted in Figure 1. Day‐shift providers included a physician and nurse practitioner (NP) or physician assistant (PA) on each of 7 teams. Each service had an average daily patient census between 10 and 15 patients with 3 to 4 new admissions every 24 hours, with 1 to 2 of these admissions occurring during the evening and night shifts, on average. The day shift started at 7:45 am and ended at 7:45 pm, at which time the day teams transitioned care of their patients to 1 of 2 overnight NP/PAs who provided cross‐cover for all teams through the night. The overnight NP/PAs then transitioned care back to the day teams at 7:45 am the following morning.
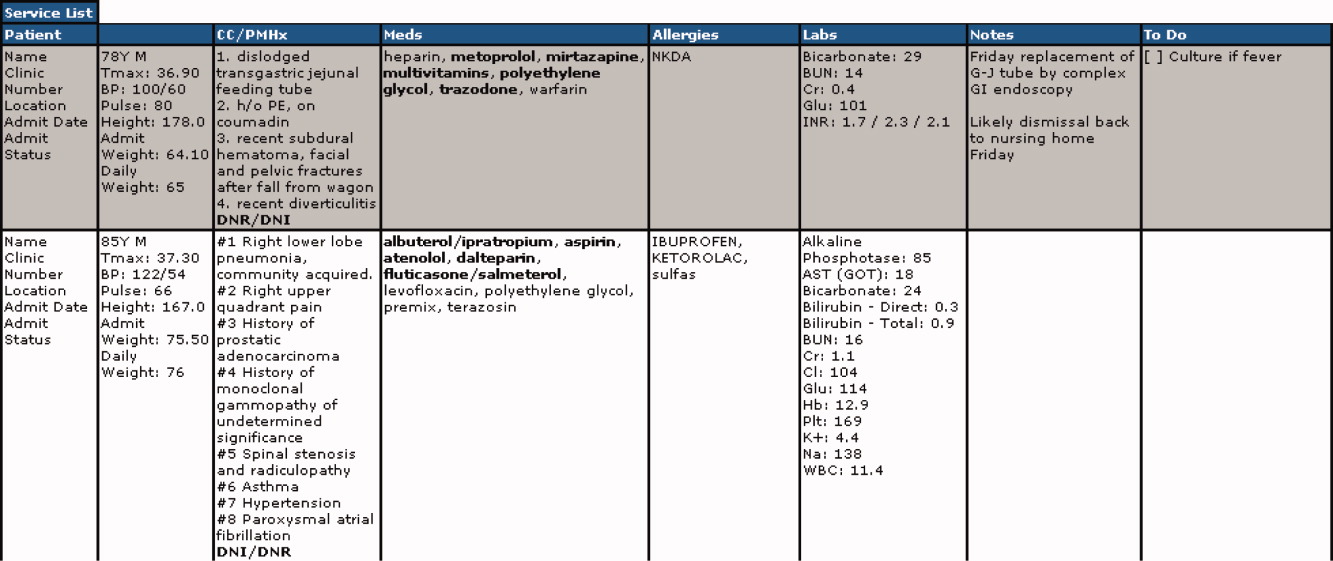
Two evening‐shift providers, both physicians, including a staff hospitalist and a hospital medicine fellowship trainee, admitted patients without any cross‐cover responsibility. Their shifts had the same start time, but staggered end times (2 pm10 pm and 2 pmmidnight). At the end of their shifts, the evening‐shift providers relayed concerns or items for follow‐up to the night cross‐cover NP/PAs; however, this handoff was nonstandardized and provider dependent. The cross‐cover providers could also choose to pass on any relevant information to day‐shift providers if thought to be necessary, but this, again, was not required or standardized. A printed electronic handoff tool (including the patient's problem list, medications, vital signs, laboratory results, and to do list as determined by the admitting provider) as well as all clinical notes generated since admission were made available to day‐shift providers who assumed care at 7:45 am; however, there was no face‐to‐face handoff between the evening‐ and day‐shift providers.
Two night‐shift physicians, including a moonlighting board‐eligible internal medicine physician and staff hospitalist, also started at staggered times, 6:45 pm and 10 pm, but their shifts both ended at 7:45 am. These physicians also admitted patients without cross‐cover responsibilities. At 7:45 am, in a face‐to‐face meeting, they transitioned care of patients admitted overnight to day‐shift providers. This handoff occurred at a predesignated place with assigned start times for each team. During the meeting, printed electronic documents, including the aforementioned electronic handoff tool as well as all clinical notes generated since admission, were made available to the oncoming day‐shift providers. The face‐to‐face interaction between night‐ and day‐shift providers lasted approximately 5 minutes and allowed for a brief presentation of the patient, review of the diagnostic testing and treatments performed so far, as well as anticipatory guidance regarding potential issues throughout the remainder of the hospitalization. Although inclusion of the above components was encouraged during the face‐to‐face handoff, the interaction was not scripted and topics discussed were at the providers' discretion.
Patients admitted during the evening and night shifts were assigned to day‐shift services primarily based on the current census of each team, so as to distribute the workload evenly.
Chart Review
Patients included in the study were admitted by evening‐ or night‐shift providers between 6:45 pm and midnight. This time period accounts for when the evening shift and night shift overlap, allowing for direct comparison of patients admitted during the same time of day, so as to avoid confounding factors. Patients were grouped by whether they were admitted by an evening‐shift provider or a night‐shift provider. Each study patient's chart was retrospectively reviewed and relevant demographic and clinical data were collected. Demographic information included age, gender, and race. Clinical information included medical comorbidities, Charlson Comorbidity Index score, rapid response team calls, code team calls, transfers to a higher level of care, death in hospital, 30‐day readmission rate, length of stay (LOS), and adverse events. The Charlson Comorbidity Index score[24] was determined from diagnoses in the institution's medical index database. The 30‐day readmission rate included observation stays and full hospital admissions that occurred at our institution in the 30 days following the patient's hospital discharge from the index admission. LOS was determined based on the time of admission and discharge, as reported in the hospital billing system, and is reported as the median and mean LOS in hours for all patients in each group.
The Global Trigger Tool (GTT) was used to identify adverse events, as defined within the GTT whitepaper to be unintended physical injury resulting from or contributed to by medical care that requires additional monitoring, treatment or hospitalization, or that results in death.[25] Developed by the Institute for Healthcare Improvement, the GTT uses triggers, clues in the medical record that suggest an adverse event may have occurred, to cue a more detailed chart review. Registered nurses trained in use of the GTT reviewed all of the included patients' electronic medical records. If a trigger was identified (such as a patient fall suffered in the hospital), further chart review was prompted to determine if patient harm occurred. If there was evidence of harm, an adverse event was determined to have occurred and was then categorized using the National Coordinating Council for Medication Error Reporting and Prevention Index for Categorizing Errors.[26] For example, in the case of a patient fall whereby the patient was determined to have fallen in the hospital and suffered a laceration requiring wound care, but the hospital stay was not prolonged, this adverse event was categorized as category E (an adverse event that caused the patient temporary harm necessitating intervention, without prolongation of the hospital stay).
Outcomes including rapid response team calls, code team calls, transfers to a higher level of care, death in the hospital, and adverse events, as identified using the GTT, were counted if they occurred between 7:45 am on the first morning of admission until 12 hours later at 7:45 pm, at the time of the first evening handoff of the admitted patients' care.
Statistical Methods
Study data were collected and managed using REDCap (Research Electronic Data Capture) electronic data capture tools hosted at Mayo Clinic.[27] When comparing outcomes between the 2 groups, Fisher exact test was used for categorical variables and Student t test was used for continuous variables. Global Trigger Tool data were analyzed using the SAS GENMOD procedure, assuming a negative binomial distribution. All the above analyses were performed using SAS version 9.3 software (SAS Institute Inc., Cary, NC). Rates of adverse events were compared using MedCalc version 13 software (MedCalc Software, Ostend, Belgium).[28] A P value <0.05 was considered significant.
RESULTS
Of 805 patients admitted between 6:45 pm and midnight during the study period, 305 (37.9%) patients were handed off to day‐shift providers without face‐to‐face handoff, and 500 (62.1%) patients were transferred to the care of day‐shift providers with the use of a face‐to‐face handoff.
Baseline characteristics of both groups are depicted in Table 1. Demographic characteristics, including age, gender, and race, were not significantly different between groups. The mean Charlson Comorbidity Index score was not significantly different between the groups without and with a face‐to‐face handoff. In addition, the presence of medical comorbidities including type 2 diabetes mellitus, hypertension, coronary artery disease, hyperlipidemia, heart failure, body mass index (BMI) <18, active cancer, and current cigarette smoking were not significantly different between the 2 groups. There was a trend to a significantly increased proportion of patients with a BMI >30 in the group without face‐to‐face handoff (P=0.05).
Baseline Patient Characteristics
Without Face‐to‐Face Handoff, N=305
With Face‐to‐Face Handoff, N=500
P Value
NOTE: Abbreviations: BMI, body mass index; SD, standard deviation.
Age, y, mean (SD)
65.8 (19.0)
64.2 (20.0)
0.25
Sex, n (%)
0.69
Female
166 (54%)
265 (53%)
Male
139 (46%)
235 (47%)
Race, n (%)
0.94
White
287 (95%)
466 (93%)
African American
5 (2%)
9 (2%)
Arab/Middle Eastern
3 (1%)
8 (2%)
Asian
1 (0%)
3 (1%)
Indian subcontinental
1 (0%)
1 (0%)
American Indian/Alaskan
1 (0%)
1 (0%)
Other
3 (1%)
8 (2%)
Unknown
1 (0%)
4 (1%)
Charlson Comorbidity Index, mean ( SD)
2.98 ( 3.73)
2.93 ( 3.72)
0.85
Comorbidities, n (%)
Type 2 diabetes
82 (27%)
143 (29%)
0.60
Hypertension
195 (64%)
303 (61%)
0.34
Coronary artery disease
76 (25%)
137 (27%)
0.44
Hyperlipidemia
122 (40%)
206 (41%)
0.74
Heart failure
30 (10%)
66 (13%)
0.15
BMI >30
109 (36%)
146 (29%)
0.05
BMI <18
7 (2%)
12 (2%)
0.92
Active cancer
29 (10%)
46 (9%)
0.88
Current smoker
49 (16%)
90 (18%)
0.48
Results for the outcomes of this study are depicted in Table 2. The frequency of rapid response team calls, code team calls, transfers to a higher level of care, and death in the hospital in the 12 hours following the first morning handoff of the admission were not significantly different between the 2 groups. Both 30‐day readmission rate and LOS (median and mean) were not significantly different between groups.
Patient Outcomes
Without Face‐to‐Face Handoff, N=305
With Face‐to‐Face Handoff, N=500
P Value
NOTE: Abbreviations: IQR, interquartile range; SD, standard deviation.
Global Trigger Tool adverse events were categorized by the National Coordinating Council for Medication Error Reporting and Prevention Index for Categorizing Medication Errors, using categories E through I.
Rapid response team call, n (%)
4 (1%)
5 (1%)
0.68
Code team call, n (%)
0 (0%)
1 (0%)
0.43
Transfer to higher level of care, n (%)
7 (2%)
11 (2%)
0.93
Patient death, n (%)
0 (0%)
0 (0%)
1.00
30‐day readmission, n (%)
50 (16%)
67 (13%)
0.23
Hospital length of stay
Median, h (IQR)
66.5 (41.3115.6)
70.3 (41.9131.2)
0.30
Mean, h ( SD)
102.0 ( 110.0)
102.9 ( 94.0)
0.90
Adverse events (Global Trigger Tool)
Temporary harm and required intervention (E)
4
7
0.92
Temporary harm and required initial or prolonged hospitalization (F)
7
8
0.53
Permanent harm (G)
0
1
0.44
Intervention required to sustain life (H)
0
6
0.14
Death (I)
0
0
1.00
Total adverse events per 100 admissions
3.61
4.40
0.59
% of admissions with an adverse event
2.6%
3.2%
0.64
There was no significant difference between the 2 groups in the frequency of adverse events resulting in harm for any of the categories (categories EI). Total adverse events between groups were also compared. Adverse events per 100 admissions were not significantly different between the group without face‐to‐face handoff compared to the group with face‐to‐face handoff. The percentage of admissions with an adverse event was also similar between groups.
DISCUSSION
We found no significant difference in the rate of rapid response team calls, code team calls, transfers to a higher level of care, death in hospital, or adverse events when comparing patients transitioned to the care of day‐shift providers with or without a face‐to‐face handoff. We hypothesize that a reason adverse events were no different between the 2 groups may be that providers were more vigilant when they did not receive a face‐to‐face handoff from the previous provider. As a result, providers may have dedicated additional time reviewing the medical record, speaking with the patients, and communicating with other healthcare providers to ensure a safe care transition. Similarly, other studies found no significant reduction in adverse events when using a standardized handoff.[10, 13, 29] This may be because patient handoff is 1 of a multitude of factors that impact the rate of adverse events, and a handoff may play a less vital role in a system where documentation of care for a given patient is readily accessible, uniform, and detailed. A face‐to‐face interaction itself in a patient handoff may be less pertinent if key information can be communicated through other channels, such as an electronic handoff tool, email, or phone.
Another potential explanation for the lack of a significant difference in patient outcomes with and without a face‐to‐face handoff is related to the study design and inherent rate of the events measured. With the exception of 30‐day readmission rate and LOS, the outcomes of the study were recorded only if they occurred in the 12 hours following the first morning handoff of the admission. This was done in an attempt to isolate the effect of the nonface‐to‐face versus face‐to‐face handoff on the first morning of the admission, and to avoid confounding effects by subsequent transitions of care later in the hospitalization. The frequency of hospital admissions in which an adverse event occurred during this relatively short 12‐hour window was approximately 3% for all patients in the study. With 805 total patients in the study, there may have been insufficient statistical power to detect a difference in the rate of outcomes, if a difference did exist, considering the event rate for both groups and the sample size.
There are several additional limitations to our study. First, the GTT was designed to be applied across the entirety of a hospitalization. By screening for adverse events over the span of only 12 hours for each hospitalization, the sensitivity of the tool may have been diminished, with a proportion of adverse events not captured, even when the sequence of events leading to patient harm began during the 12 hours in question. Second, this is a retrospective study, and all adverse events may not be documented in the medical record. Third, although not formally structured and infrequent, some evening‐shift providers did send an email or call the oncoming day‐shift provider to discuss patients admitted. This process, however, was provider dependent, unstructured, uncommon, and erratic, and thus we were not able to capture it from medical record review. Finally, the patients in this study were deemed low acuity upon triage prior to admission. A face‐to‐face handoff may be less important in ensuring patient safety when caring for low‐acuity compared to high‐acuity patients, considering the rapidity at which the critically ill can deteriorate.
Handoffs of patient care in the hospital have certainly increased in recent years. Consequently, communication among providers is undoubtedly important, with patient safety being the primary goal. Our work suggests that a face‐to‐face component of a handoff is not vital to ensure a safe care transition. Because of the increasing frequency of handoffs, providers' ability to do so face‐to‐face will likely be challenged by time and logistical constraints. Future work is needed to delineate the most effective components of the handoff so that we can design information transfer that promotes safe and efficient care, even without a face‐to‐face interaction.
Acknowledgements
The authors are grateful for support from the Mayo Clinic Department of Medicine Clinical Research Office, Ms. Donna Lawson, and Mr. Stephen Cha.
Disclosures: This publication was made possible by the Mayo Clinic Center for Clinical and Translational Science through grant number UL1 TR000135 from the National Center for Advancing Translational Science, a component of the National Institutes of Health. The authors report no conflicts of interest.
Desai SV, Feldman L, Brown L, et al. Effect of the 2011 vs 2003 duty hour regulation‐compliant models on sleep duration, trainee education, and continuity of patient care among internal medicine house staff: a randomized trial. JAMA Intern Med.2013;173(8):649–655.
Robeznieks A. 'Shift work': 24‐hour workdays are out as residents, hospitals deal with changes, mixed feelings on restrictions. Mod Healthc. 2011;41(30):6–7, 16, 1.
Horwitz LI, Moin T, Krumholz HM, Wang L, Bradley EH. Consequences of inadequate sign‐out for patient care. Arch Intern Med. 2008;168(16):1755–1760.
Arora V, Johnson J, Lovinger D, Humphrey HJ, Meltzer DO. Communication failures in patient sign‐out and suggestions for improvement: a critical incident analysis. Qual Saf Health Care. 2005;14(6):401–407.
Singh H, Thomas EJ, Petersen LA, Studdert DM. Medical errors involving trainees: a study of closed malpractice claims from 5 insurers. Archives of internal medicine. 2007;167(19):2030–2036.
Greenberg CC, Regenbogen SE, Studdert DM, et al. Patterns of communication breakdowns resulting in injury to surgical patients. J Am Coll Surg. 2007;204(4):533–540.
Joint Commission International. Standard PC.02.02.01. 2013Hospital Accreditation Standards. Oak Brook, IL: Joint Commission Resources; 2013.
Arora VM, Manjarrez E, Dressler DD, Basaviah P, Halasyamani L, Kripalani S. Hospitalist handoffs: a systematic review and task force recommendations. J Hosp Med. 2009;4(7):433–440.
Riesenberg LA, Leitzsch J, Little BW. Systematic review of handoff mnemonics literature. Am J Med Qual. 2009;24(3):196–204.
Petersen LA, Orav EJ, Teich JM, O'Neil AC, Brennan TA. Using a computerized sign‐out program to improve continuity of inpatient care and prevent adverse events. Jt Comm J Qual Improv. 1998;24(2):77–87.
Ryan S, O'Riordan JM, Tierney S, Conlon KC, Ridgway PF. Impact of a new electronic handover system in surgery. Int J Surg. 2011;9(3):217–220.
Eaton EG, Horvath KD, Lober WB, Pellegrini CA. Organizing the transfer of patient care information: the development of a computerized resident sign‐out system. Surgery. 2004;136(1):5–13.
Zavalkoff SR, Razack SI, Lavoie J, Dancea AB. Handover after pediatric heart surgery: a simple tool improves information exchange. Pediatr Crit Care Med. 2011;12(3):309–313.
Wayne JD, Tyagi R, Reinhardt G, et al. Simple standardized patient handoff system that increases accuracy and completeness. J Surg Educ. 2008;65(6):476–485.
Stahl K, Palileo A, Schulman CI, et al. Enhancing patient safety in the trauma/surgical intensive care unit. J Trauma. 2009;67(3):430–433; discussion 433–435.
Salerno SM, Arnett MV, Domanski JP. Standardized sign‐out reduces intern perception of medical errors on the general internal medicine ward. Teach Learn Med. 2009;21(2):121–126.
Burton MC, Kashiwagi DT, Kirkland LL, Manning D, Varkey P. Gaining efficiency and satisfaction in the handoff process. J Hosp Med. 2010;5(9):547–552.
Pickering BW, Hurley K, Marsh B. Identification of patient information corruption in the intensive care unit: using a scoring tool to direct quality improvements in handover. Crit Care Med. 2009;37(11):2905–2912.
Dowding D. Examining the effects that manipulating information given in the change of shift report has on nurses' care planning ability. J Adv Nurs. 2001;33(6):836–846.
Horwitz LI, Parwani V, Shah NR, et al. Evaluation of an asynchronous physician voicemail sign‐out for emergency department admissions. Ann Emerg Med. 2009;54(3):368–378.
Mazzocco K, Petitti DB, Fong KT, et al. Surgical team behaviors and patient outcomes. Am J Surg. 2009;197(5):678–685.
Hess DR, Tokarczyk A, O'Malley M, Gavaghan S, Sullivan J, Schmidt U. The value of adding a verbal report to written handoffs on early readmission following prolonged respiratory failure. Chest. 2010;138(6):1475–1479.
Starmer AJ, Sectish TC, Simon DW, et al. Rates of medical errors and preventable adverse events among hospitalized children following implementation of a resident handoff bundle. JAMA. 2013;310(21):2262–2270.
Charlson ME, Pompei P, Ales KL, MacKenzie CR. A new method of classifying prognostic comorbidity in longitudinal studies: development and validation. J Chronic Dis. 1987;40(5):373–383.
Griffin FA, Resar RK. IHI Global Trigger Tool for measuring adverse events (second edition). IHI Innovation Series white paper. Cambridge, MA: Institute for Healthcare Improvement; 2009. Available at: http://www.ihi.org/resources/Pages/IHIWhitePapers/IHIGlobalTriggerToolWhitePaper.aspx. www.IHI.org). Accessed June 1, 2014.
National Coordinating Council for Medication Error Reporting and Prevention (NCC MERP) index for categorizing errors. Available at: http://www.nccmerp.org/medErrorCatIndex.html. Accessed June 1, 2014.
Harris PA, Taylor R, Thielke R, Payne J, Gonzalez N, Conde JG. Research electronic data capture (REDCap)—a metadata‐driven methodology and workflow process for providing translational research informatics support. J Biomed Inform. 2009;42(2):377–381.
Sahai H, Khurshid A. Statistics in Epidemiology: Methods, Techniques, and Applications. Boca Raton, FL: CRC Press; 1996.
Eaton EG, McDonough K, Lober WB, Johnson EA, Pellegrini CA, Horvath KD. Safety of using a computerized rounding and sign‐out system to reduce resident duty hours. Acad Med. 2010;85(7):1189–1195.
Handoffs are key events in the care of hospitalized patients whereby vital information is relayed between healthcare providers. Resident duty hour restrictions and the popularity of shift‐based work schedules have increased the frequency of inpatient handoffs.[1, 2] Failures in communication at the time of patient handoff have been implicated as contributing factors to preventable adverse events.[3, 4, 5, 6] With patient safety in mind, accreditation organizations and professional societies have made the standardization of hospital handoff procedures a priority.[7, 8] A variety of strategies have been utilized to standardize handoffs. Examples include the use of mnemonics,[9] electronic resources,[10, 11, 12] preformatted handoff sheets,[13, 14, 15, 16] and optimization of the handoff environment.[17] The primary outcomes for many of these studies center on the provider by measuring their retention of patient facts[18, 19] and completion of tasks[14, 16] after handoff, for example. Few studies examined patient‐centered outcomes such as transfer to a higher level of care,[20] length of stay,[11] mortality,[21] or readmission rate.[22] A study in the pediatric population found that implementation of a handoff bundle was associated with a decrease in medical errors and preventable adverse events.[23]
The Society of Hospital Medicine recommends that patient handoffs consist of both a written and verbal component.[8] Providers in our division work on 3 shifts: day, evening, and night. In 2009, we developed a face‐to‐face morning handoff, during which night‐shift providers hand off patient care to day‐shift providers incorporating an electronically generated service information list.[17] Given that the evening shift ends well before the day shift begins, the evening‐shift providers do not participate in this face‐to‐face handoff of care for patients they admit to day providers.
We wished to compare the clinical outcomes and adverse events of patients admitted by the night‐shift providers to those admitted by the evening‐shift providers. We hypothesized that transfer of care using a face‐to‐face handoff would be associated with fewer adverse events and improved clinical outcomes.
METHODS
The study was deemed exempt by the Mayo Clinic Institutional Review Board.
Study Population
Hospitalists at the study institution, a 1157‐bed academic tertiary referral hospital, admit general medical patients from the emergency department, as transfers from other institutions, and as direct admissions from outpatient offices. Patients included in the study were all adults admitted by evening‐ and night‐shift hospitalists from August 1, 2011 through August 1, 2012 between 6:45 pm and midnight. Our institution primarily uses 2 levels of care for adult inpatients on internal medicine services, including a general care floor for low‐acuity patients and an intensive care unit for high‐acuity patients. All of the patients in this study were triaged as low acuity at the time of admission and were initially admitted to general care units.
Setting
The division's shift schedule during the study period is depicted in Figure 1. Day‐shift providers included a physician and nurse practitioner (NP) or physician assistant (PA) on each of 7 teams. Each service had an average daily patient census between 10 and 15 patients with 3 to 4 new admissions every 24 hours, with 1 to 2 of these admissions occurring during the evening and night shifts, on average. The day shift started at 7:45 am and ended at 7:45 pm, at which time the day teams transitioned care of their patients to 1 of 2 overnight NP/PAs who provided cross‐cover for all teams through the night. The overnight NP/PAs then transitioned care back to the day teams at 7:45 am the following morning.
Two evening‐shift providers, both physicians, including a staff hospitalist and a hospital medicine fellowship trainee, admitted patients without any cross‐cover responsibility. Their shifts had the same start time, but staggered end times (2 pm10 pm and 2 pmmidnight). At the end of their shifts, the evening‐shift providers relayed concerns or items for follow‐up to the night cross‐cover NP/PAs; however, this handoff was nonstandardized and provider dependent. The cross‐cover providers could also choose to pass on any relevant information to day‐shift providers if thought to be necessary, but this, again, was not required or standardized. A printed electronic handoff tool (including the patient's problem list, medications, vital signs, laboratory results, and to do list as determined by the admitting provider) as well as all clinical notes generated since admission were made available to day‐shift providers who assumed care at 7:45 am; however, there was no face‐to‐face handoff between the evening‐ and day‐shift providers.
Two night‐shift physicians, including a moonlighting board‐eligible internal medicine physician and staff hospitalist, also started at staggered times, 6:45 pm and 10 pm, but their shifts both ended at 7:45 am. These physicians also admitted patients without cross‐cover responsibilities. At 7:45 am, in a face‐to‐face meeting, they transitioned care of patients admitted overnight to day‐shift providers. This handoff occurred at a predesignated place with assigned start times for each team. During the meeting, printed electronic documents, including the aforementioned electronic handoff tool as well as all clinical notes generated since admission, were made available to the oncoming day‐shift providers. The face‐to‐face interaction between night‐ and day‐shift providers lasted approximately 5 minutes and allowed for a brief presentation of the patient, review of the diagnostic testing and treatments performed so far, as well as anticipatory guidance regarding potential issues throughout the remainder of the hospitalization. Although inclusion of the above components was encouraged during the face‐to‐face handoff, the interaction was not scripted and topics discussed were at the providers' discretion.
Patients admitted during the evening and night shifts were assigned to day‐shift services primarily based on the current census of each team, so as to distribute the workload evenly.
Chart Review
Patients included in the study were admitted by evening‐ or night‐shift providers between 6:45 pm and midnight. This time period accounts for when the evening shift and night shift overlap, allowing for direct comparison of patients admitted during the same time of day, so as to avoid confounding factors. Patients were grouped by whether they were admitted by an evening‐shift provider or a night‐shift provider. Each study patient's chart was retrospectively reviewed and relevant demographic and clinical data were collected. Demographic information included age, gender, and race. Clinical information included medical comorbidities, Charlson Comorbidity Index score, rapid response team calls, code team calls, transfers to a higher level of care, death in hospital, 30‐day readmission rate, length of stay (LOS), and adverse events. The Charlson Comorbidity Index score[24] was determined from diagnoses in the institution's medical index database. The 30‐day readmission rate included observation stays and full hospital admissions that occurred at our institution in the 30 days following the patient's hospital discharge from the index admission. LOS was determined based on the time of admission and discharge, as reported in the hospital billing system, and is reported as the median and mean LOS in hours for all patients in each group.
The Global Trigger Tool (GTT) was used to identify adverse events, as defined within the GTT whitepaper to be unintended physical injury resulting from or contributed to by medical care that requires additional monitoring, treatment or hospitalization, or that results in death.[25] Developed by the Institute for Healthcare Improvement, the GTT uses triggers, clues in the medical record that suggest an adverse event may have occurred, to cue a more detailed chart review. Registered nurses trained in use of the GTT reviewed all of the included patients' electronic medical records. If a trigger was identified (such as a patient fall suffered in the hospital), further chart review was prompted to determine if patient harm occurred. If there was evidence of harm, an adverse event was determined to have occurred and was then categorized using the National Coordinating Council for Medication Error Reporting and Prevention Index for Categorizing Errors.[26] For example, in the case of a patient fall whereby the patient was determined to have fallen in the hospital and suffered a laceration requiring wound care, but the hospital stay was not prolonged, this adverse event was categorized as category E (an adverse event that caused the patient temporary harm necessitating intervention, without prolongation of the hospital stay).
Outcomes including rapid response team calls, code team calls, transfers to a higher level of care, death in the hospital, and adverse events, as identified using the GTT, were counted if they occurred between 7:45 am on the first morning of admission until 12 hours later at 7:45 pm, at the time of the first evening handoff of the admitted patients' care.
Statistical Methods
Study data were collected and managed using REDCap (Research Electronic Data Capture) electronic data capture tools hosted at Mayo Clinic.[27] When comparing outcomes between the 2 groups, Fisher exact test was used for categorical variables and Student t test was used for continuous variables. Global Trigger Tool data were analyzed using the SAS GENMOD procedure, assuming a negative binomial distribution. All the above analyses were performed using SAS version 9.3 software (SAS Institute Inc., Cary, NC). Rates of adverse events were compared using MedCalc version 13 software (MedCalc Software, Ostend, Belgium).[28] A P value <0.05 was considered significant.
RESULTS
Of 805 patients admitted between 6:45 pm and midnight during the study period, 305 (37.9%) patients were handed off to day‐shift providers without face‐to‐face handoff, and 500 (62.1%) patients were transferred to the care of day‐shift providers with the use of a face‐to‐face handoff.
Baseline characteristics of both groups are depicted in Table 1. Demographic characteristics, including age, gender, and race, were not significantly different between groups. The mean Charlson Comorbidity Index score was not significantly different between the groups without and with a face‐to‐face handoff. In addition, the presence of medical comorbidities including type 2 diabetes mellitus, hypertension, coronary artery disease, hyperlipidemia, heart failure, body mass index (BMI) <18, active cancer, and current cigarette smoking were not significantly different between the 2 groups. There was a trend to a significantly increased proportion of patients with a BMI >30 in the group without face‐to‐face handoff (P=0.05).
Baseline Patient Characteristics
Without Face‐to‐Face Handoff, N=305
With Face‐to‐Face Handoff, N=500
P Value
NOTE: Abbreviations: BMI, body mass index; SD, standard deviation.
Age, y, mean (SD)
65.8 (19.0)
64.2 (20.0)
0.25
Sex, n (%)
0.69
Female
166 (54%)
265 (53%)
Male
139 (46%)
235 (47%)
Race, n (%)
0.94
White
287 (95%)
466 (93%)
African American
5 (2%)
9 (2%)
Arab/Middle Eastern
3 (1%)
8 (2%)
Asian
1 (0%)
3 (1%)
Indian subcontinental
1 (0%)
1 (0%)
American Indian/Alaskan
1 (0%)
1 (0%)
Other
3 (1%)
8 (2%)
Unknown
1 (0%)
4 (1%)
Charlson Comorbidity Index, mean ( SD)
2.98 ( 3.73)
2.93 ( 3.72)
0.85
Comorbidities, n (%)
Type 2 diabetes
82 (27%)
143 (29%)
0.60
Hypertension
195 (64%)
303 (61%)
0.34
Coronary artery disease
76 (25%)
137 (27%)
0.44
Hyperlipidemia
122 (40%)
206 (41%)
0.74
Heart failure
30 (10%)
66 (13%)
0.15
BMI >30
109 (36%)
146 (29%)
0.05
BMI <18
7 (2%)
12 (2%)
0.92
Active cancer
29 (10%)
46 (9%)
0.88
Current smoker
49 (16%)
90 (18%)
0.48
Results for the outcomes of this study are depicted in Table 2. The frequency of rapid response team calls, code team calls, transfers to a higher level of care, and death in the hospital in the 12 hours following the first morning handoff of the admission were not significantly different between the 2 groups. Both 30‐day readmission rate and LOS (median and mean) were not significantly different between groups.
Patient Outcomes
Without Face‐to‐Face Handoff, N=305
With Face‐to‐Face Handoff, N=500
P Value
NOTE: Abbreviations: IQR, interquartile range; SD, standard deviation.
Global Trigger Tool adverse events were categorized by the National Coordinating Council for Medication Error Reporting and Prevention Index for Categorizing Medication Errors, using categories E through I.
Rapid response team call, n (%)
4 (1%)
5 (1%)
0.68
Code team call, n (%)
0 (0%)
1 (0%)
0.43
Transfer to higher level of care, n (%)
7 (2%)
11 (2%)
0.93
Patient death, n (%)
0 (0%)
0 (0%)
1.00
30‐day readmission, n (%)
50 (16%)
67 (13%)
0.23
Hospital length of stay
Median, h (IQR)
66.5 (41.3115.6)
70.3 (41.9131.2)
0.30
Mean, h ( SD)
102.0 ( 110.0)
102.9 ( 94.0)
0.90
Adverse events (Global Trigger Tool)
Temporary harm and required intervention (E)
4
7
0.92
Temporary harm and required initial or prolonged hospitalization (F)
7
8
0.53
Permanent harm (G)
0
1
0.44
Intervention required to sustain life (H)
0
6
0.14
Death (I)
0
0
1.00
Total adverse events per 100 admissions
3.61
4.40
0.59
% of admissions with an adverse event
2.6%
3.2%
0.64
There was no significant difference between the 2 groups in the frequency of adverse events resulting in harm for any of the categories (categories EI). Total adverse events between groups were also compared. Adverse events per 100 admissions were not significantly different between the group without face‐to‐face handoff compared to the group with face‐to‐face handoff. The percentage of admissions with an adverse event was also similar between groups.
DISCUSSION
We found no significant difference in the rate of rapid response team calls, code team calls, transfers to a higher level of care, death in hospital, or adverse events when comparing patients transitioned to the care of day‐shift providers with or without a face‐to‐face handoff. We hypothesize that a reason adverse events were no different between the 2 groups may be that providers were more vigilant when they did not receive a face‐to‐face handoff from the previous provider. As a result, providers may have dedicated additional time reviewing the medical record, speaking with the patients, and communicating with other healthcare providers to ensure a safe care transition. Similarly, other studies found no significant reduction in adverse events when using a standardized handoff.[10, 13, 29] This may be because patient handoff is 1 of a multitude of factors that impact the rate of adverse events, and a handoff may play a less vital role in a system where documentation of care for a given patient is readily accessible, uniform, and detailed. A face‐to‐face interaction itself in a patient handoff may be less pertinent if key information can be communicated through other channels, such as an electronic handoff tool, email, or phone.
Another potential explanation for the lack of a significant difference in patient outcomes with and without a face‐to‐face handoff is related to the study design and inherent rate of the events measured. With the exception of 30‐day readmission rate and LOS, the outcomes of the study were recorded only if they occurred in the 12 hours following the first morning handoff of the admission. This was done in an attempt to isolate the effect of the nonface‐to‐face versus face‐to‐face handoff on the first morning of the admission, and to avoid confounding effects by subsequent transitions of care later in the hospitalization. The frequency of hospital admissions in which an adverse event occurred during this relatively short 12‐hour window was approximately 3% for all patients in the study. With 805 total patients in the study, there may have been insufficient statistical power to detect a difference in the rate of outcomes, if a difference did exist, considering the event rate for both groups and the sample size.
There are several additional limitations to our study. First, the GTT was designed to be applied across the entirety of a hospitalization. By screening for adverse events over the span of only 12 hours for each hospitalization, the sensitivity of the tool may have been diminished, with a proportion of adverse events not captured, even when the sequence of events leading to patient harm began during the 12 hours in question. Second, this is a retrospective study, and all adverse events may not be documented in the medical record. Third, although not formally structured and infrequent, some evening‐shift providers did send an email or call the oncoming day‐shift provider to discuss patients admitted. This process, however, was provider dependent, unstructured, uncommon, and erratic, and thus we were not able to capture it from medical record review. Finally, the patients in this study were deemed low acuity upon triage prior to admission. A face‐to‐face handoff may be less important in ensuring patient safety when caring for low‐acuity compared to high‐acuity patients, considering the rapidity at which the critically ill can deteriorate.
Handoffs of patient care in the hospital have certainly increased in recent years. Consequently, communication among providers is undoubtedly important, with patient safety being the primary goal. Our work suggests that a face‐to‐face component of a handoff is not vital to ensure a safe care transition. Because of the increasing frequency of handoffs, providers' ability to do so face‐to‐face will likely be challenged by time and logistical constraints. Future work is needed to delineate the most effective components of the handoff so that we can design information transfer that promotes safe and efficient care, even without a face‐to‐face interaction.
Acknowledgements
The authors are grateful for support from the Mayo Clinic Department of Medicine Clinical Research Office, Ms. Donna Lawson, and Mr. Stephen Cha.
Disclosures: This publication was made possible by the Mayo Clinic Center for Clinical and Translational Science through grant number UL1 TR000135 from the National Center for Advancing Translational Science, a component of the National Institutes of Health. The authors report no conflicts of interest.
References
Desai SV, Feldman L, Brown L, et al. Effect of the 2011 vs 2003 duty hour regulation‐compliant models on sleep duration, trainee education, and continuity of patient care among internal medicine house staff: a randomized trial. JAMA Intern Med.2013;173(8):649–655.
Robeznieks A. 'Shift work': 24‐hour workdays are out as residents, hospitals deal with changes, mixed feelings on restrictions. Mod Healthc. 2011;41(30):6–7, 16, 1.
Horwitz LI, Moin T, Krumholz HM, Wang L, Bradley EH. Consequences of inadequate sign‐out for patient care. Arch Intern Med. 2008;168(16):1755–1760.
Arora V, Johnson J, Lovinger D, Humphrey HJ, Meltzer DO. Communication failures in patient sign‐out and suggestions for improvement: a critical incident analysis. Qual Saf Health Care. 2005;14(6):401–407.
Singh H, Thomas EJ, Petersen LA, Studdert DM. Medical errors involving trainees: a study of closed malpractice claims from 5 insurers. Archives of internal medicine. 2007;167(19):2030–2036.
Greenberg CC, Regenbogen SE, Studdert DM, et al. Patterns of communication breakdowns resulting in injury to surgical patients. J Am Coll Surg. 2007;204(4):533–540.
Joint Commission International. Standard PC.02.02.01. 2013Hospital Accreditation Standards. Oak Brook, IL: Joint Commission Resources; 2013.
Arora VM, Manjarrez E, Dressler DD, Basaviah P, Halasyamani L, Kripalani S. Hospitalist handoffs: a systematic review and task force recommendations. J Hosp Med. 2009;4(7):433–440.
Riesenberg LA, Leitzsch J, Little BW. Systematic review of handoff mnemonics literature. Am J Med Qual. 2009;24(3):196–204.
Petersen LA, Orav EJ, Teich JM, O'Neil AC, Brennan TA. Using a computerized sign‐out program to improve continuity of inpatient care and prevent adverse events. Jt Comm J Qual Improv. 1998;24(2):77–87.
Ryan S, O'Riordan JM, Tierney S, Conlon KC, Ridgway PF. Impact of a new electronic handover system in surgery. Int J Surg. 2011;9(3):217–220.
Eaton EG, Horvath KD, Lober WB, Pellegrini CA. Organizing the transfer of patient care information: the development of a computerized resident sign‐out system. Surgery. 2004;136(1):5–13.
Zavalkoff SR, Razack SI, Lavoie J, Dancea AB. Handover after pediatric heart surgery: a simple tool improves information exchange. Pediatr Crit Care Med. 2011;12(3):309–313.
Wayne JD, Tyagi R, Reinhardt G, et al. Simple standardized patient handoff system that increases accuracy and completeness. J Surg Educ. 2008;65(6):476–485.
Stahl K, Palileo A, Schulman CI, et al. Enhancing patient safety in the trauma/surgical intensive care unit. J Trauma. 2009;67(3):430–433; discussion 433–435.
Salerno SM, Arnett MV, Domanski JP. Standardized sign‐out reduces intern perception of medical errors on the general internal medicine ward. Teach Learn Med. 2009;21(2):121–126.
Burton MC, Kashiwagi DT, Kirkland LL, Manning D, Varkey P. Gaining efficiency and satisfaction in the handoff process. J Hosp Med. 2010;5(9):547–552.
Pickering BW, Hurley K, Marsh B. Identification of patient information corruption in the intensive care unit: using a scoring tool to direct quality improvements in handover. Crit Care Med. 2009;37(11):2905–2912.
Dowding D. Examining the effects that manipulating information given in the change of shift report has on nurses' care planning ability. J Adv Nurs. 2001;33(6):836–846.
Horwitz LI, Parwani V, Shah NR, et al. Evaluation of an asynchronous physician voicemail sign‐out for emergency department admissions. Ann Emerg Med. 2009;54(3):368–378.
Mazzocco K, Petitti DB, Fong KT, et al. Surgical team behaviors and patient outcomes. Am J Surg. 2009;197(5):678–685.
Hess DR, Tokarczyk A, O'Malley M, Gavaghan S, Sullivan J, Schmidt U. The value of adding a verbal report to written handoffs on early readmission following prolonged respiratory failure. Chest. 2010;138(6):1475–1479.
Starmer AJ, Sectish TC, Simon DW, et al. Rates of medical errors and preventable adverse events among hospitalized children following implementation of a resident handoff bundle. JAMA. 2013;310(21):2262–2270.
Charlson ME, Pompei P, Ales KL, MacKenzie CR. A new method of classifying prognostic comorbidity in longitudinal studies: development and validation. J Chronic Dis. 1987;40(5):373–383.
Griffin FA, Resar RK. IHI Global Trigger Tool for measuring adverse events (second edition). IHI Innovation Series white paper. Cambridge, MA: Institute for Healthcare Improvement; 2009. Available at: http://www.ihi.org/resources/Pages/IHIWhitePapers/IHIGlobalTriggerToolWhitePaper.aspx. www.IHI.org). Accessed June 1, 2014.
National Coordinating Council for Medication Error Reporting and Prevention (NCC MERP) index for categorizing errors. Available at: http://www.nccmerp.org/medErrorCatIndex.html. Accessed June 1, 2014.
Harris PA, Taylor R, Thielke R, Payne J, Gonzalez N, Conde JG. Research electronic data capture (REDCap)—a metadata‐driven methodology and workflow process for providing translational research informatics support. J Biomed Inform. 2009;42(2):377–381.
Sahai H, Khurshid A. Statistics in Epidemiology: Methods, Techniques, and Applications. Boca Raton, FL: CRC Press; 1996.
Eaton EG, McDonough K, Lober WB, Johnson EA, Pellegrini CA, Horvath KD. Safety of using a computerized rounding and sign‐out system to reduce resident duty hours. Acad Med. 2010;85(7):1189–1195.
Address for correspondence and reprint requests: Deanne T. Kashiwagi, MD, Division of Hospital Internal Medicine, Mayo Clinic, 200 First Street SW, Rochester, MN 55905; Telephone: 507‐255‐9225; Fax: 507‐255‐9189; E‐mail: kashiwagi.deanne@mayo.edu
Many patients are admitted and readmitted to acute care hospitals with alcohol‐related diagnoses, including alcohol withdrawal syndrome (AWS), and experience significant morbidity and mortality. In patients with septic shock or at risk for acute respiratory distress syndrome (ARDS), chronic alcohol abuse is associated with increased ARDS and severity of multiple organ dysfunction.1 Among intensive care unit (ICU) patients, those with alcohol dependence have higher morbidity, including septic shock, and higher hospital mortality.2 Patients who experience AWS as a result of alcohol dependence may experience life‐threatening complications, such as seizures and delirium tremens.3,4 In‐hospital mortality from AWS is historically high,5 but with benzodiazepines used in a symptom‐driven manner to treat the complications of alcohol use, hospital mortality rates are more recently reported at 2.4%.6
As inpatient outcomes1,2,7 and hospital mortality810 are negatively affected by alcohol abuse, the post‐hospital course of these patients is also of interest. Specifically, patients are often admitted and readmitted with alcohol‐related diagnoses or AWS to acute care hospitals, but relatively little quantitative data exist on readmission factors in this population.11 Patients readmitted to detoxification units or alcohol and substance abuse units have been studied, and factors associated with readmission include psychiatric disorder,1217 female gender,14,15 and delay in rehabilitation aftercare.18
These results cannot be generalized to patients with AWS who are admitted and readmitted to acute‐care hospitals. First, patients hospitalized for alcohol withdrawal symptoms are often medically ill with more severe symptoms, and more frequent coexisting medical and psychiatric illnesses, that complicate the withdrawal syndrome. Detoxification units and substance abuse units require patients to be medically stable before admission, because they do not have the ability to provide a high level of supervision and treatment. Second, much of what we know regarding risk factors for readmission to detoxification centers and substance abuse units comes from studies of administrative data of the Veterans Health Administration,12,13 Medicare Provider Analysis and Review file,16 privately owned outpatient substance abuse centers,14 and publicly funded detoxification centers.18 These results may be difficult to generalize to other patient populations. Accordingly, the objective of this study was to identify demographic and clinical factors associated with multiple admissions to a general medicine service for treatment of AWS over a 3‐year period. Characterization of these high‐risk patients and their hospital course may help focus intervention and reduce these revolving door admissions.
METHODS
The Mayo Clinic Institutional Review Board deemed the study exempt.
Patient Selection
The study was conducted at an 1157‐bed academic tertiary referral hospital, located in the Midwest, that has approximately 15,000 inpatient admissions to general medicine services annually and serves as the main referral center for the region. Patients included in this study were adults admitted to general medicine services and treated with symptom‐triggered Clinical Institute Withdrawal AssessmentAlcohol Revised (CIWA‐Ar) protocol19 between January 1, 2006 and December 31, 2008. Patients were identified using the Mayo Clinic Quality Improvement Resource Center database, as done in a previous CIWA‐Ar study.20 Patients were excluded if the primary diagnosis was a nonalcohol‐related diagnosis (Figure 1).
Figure 1
Study design. Abbreviations: AWS, alcohol withdrawal syndrome; CIWA‐Ar, Clinical Institute Withdrawal Assessment—Alcohol Revised.
Patients were placed in 1 of 2 groups based on number of admissions during the study period, either a single‐admission group or a multiple‐admissions group. While most readmission studies use a 30‐day mark from discharge, we used 3 years to better capture relapse and recidivism in this patient population. The 2 groups were then compared retrospectively. To insure that a single admission was not arbitrarily created by the December 2008 cutoff, we reviewed the single‐admission group for additional admissions through June of 2009. If a patient did have a subsequent admission, then the patient was moved to the multiple‐admissions group.
Clinical Variables
Demographic and clinical data was obtained using the Mayo Data Retrieval System (DRS), the Mayo Clinic Life Sciences System (MCLSS) database, and electronic medical records. Clinical data for the multiple‐admissions group was derived from the first admission of the study period, and subsequently referred to as index admission. Specific demographic information collected included age, race, gender, marital status, employment status, and education. Clinical data collected included admitting diagnosis, comorbid medical disorders, psychiatric disorders, and CIWA‐Ar evaluations including highest total score (CIWA‐Ar score [max] and component scores). The CIWA‐Ar protocol is a scale to assess the severity of alcohol withdrawal, based on 10 symptoms of alcohol withdrawal ranging from 0 (not present) to 7 (extremely severe). The protocol requires the scale to be administered hourly, and total scores guide the medication dosing and administration of benzodiazepines to control withdrawal symptoms. Laboratory data collected included serum ammonia, alanine aminotransferase(ALT), and admission urine drug screen. For the purposes of this study, a urine drug screen was considered positive if a substance other than alcohol was present. Length of stay (LOS) and adverse events during hospitalization (delirium tremens, intubations, rapid response team [RRT] calls, ICU transfers, and in‐hospital mortality) were also collected.
Medical comorbidity was measured using the Charlson Comorbidity Index (CCI).21 The CCI was scored electronically using diagnoses in the institution's medical index database dating back 5 years from patient's first, or index, admission. Originally validated as a prognostic tool for mortality 1 year after admission in medical patients, the CCI was chosen as it accounts for most medical comorbidities.21 Data was validated, by another investigator not involved in the initial abstracting process, by randomly verifying 5% of the abstracted data.
Statistical Analysis
Standard descriptive statistics were used for patient characteristics and demographics. Comparing the multiple‐admissions group and single‐admission group, categorical variables were evaluated using the Fisher exact test or Pearson chi‐square test. Continuous variables were evaluated using 2‐sample t test. Multivariate logistic model analyses with stepwise elimination method were used to identify risk factors that were associated with multiple admissions. Age, gender, and variables that were statistically significant in the univariate analysis were used in stepwise regression to get to the final model. A P value of 0.05 was considered statistically significant. All statistical analyses were performed using SAS version 9.3 software (SAS Institute, Cary, NC).
RESULTS
The CIWA‐Ar protocol was ordered on 1199 admissions during the study period. Of these, 411 (34.3%) admissions were excluded because AWS was not the primary diagnosis, leaving 788 (65.7%) admissions for 322 patients, which formed the study population. Of the 322 patients, 180 (56%) had a single admission and 142 (44%) had multiple admissions.
Univariate analyses of demographic and clinical variables are shown in Tables 1 and 2, respectively. Patients with multiple admissions were more likely divorced (P = 0.028), have a high school education or less (P = 0.002), have a higher CCI score (P < 0.0001), a higher CIWA‐Ar score (max) (P < 0.0001), a higher ALT level (P = 0.050), more psychiatric comorbidity (P < 0.026), and a positive urine drug screen (P < 0.001). Adverse events were not significantly different between the 2 groups (Table 2).
Univariate Analysis of Demographic Variables and Multiple Admissions
Variable
Single Admission N = 180
Multiple Admissions N = 142
P Value
Abbreviations: GED, General Educational Development; SD, standard deviation. *P 0.05 and significant.
Age, years (SD)
47.85 (12.84)
45.94 (12)
0.170
Male, No. (%)
122 (68)
109 (77)
0.080
Race/Ethnicity, No. (%)
0.270
White
168 (93)
132 (93)
African American
6 (3)
3 (2)
Asian
0 (0)
1 (1)
Middle Eastern
3 (2)
0 (0)
Other
3 (2)
6 (4)
Relationship status, No. (%)
0.160
Divorced
49 (27)
55 (39)
0.028*
Married
54 (30)
34 (24)
0.230
Separated
9 (5)
4 (3)
0.323
Single
59 (33)
38 (27)
0.243
Widowed
5 (3)
3 (2)
0.703
Committed
4 (2)
7 (5)
0.188
Unknown
0 (0)
1 (1)
0.259
Education, No. (%)
0.002*
High school graduate, GED, or less
49 (28)
67 (47)
Some college or above
89 (49)
60 (42)
Unknown
41 (23)
15 (11)
Employment, No. (%)
0.290
Retired
26 (14)
12 (8)
Employed
72 (40)
51 (36)
Unemployed
51 (28)
51 (36)
Homemaker
9 (5)
4 (3)
Work disabled
20 (11)
23 (16)
Student
1 (1)
0 (0)
Unknown
1 (1)
1 (1)
Univariate Analysis of Clinical Variables and Multiple Admissions
Variable
Single Admission N = 180
Multiple Admissions N = 142
P Value
Abbreviations: ALT, alanine aminotransferase; CIWA‐Ar, Clinical Institute Withdrawal AssessmentAlcohol Revised; ICU, intensive care unit; LOS, length of stay (days); RRT, rapid response team; SD, standard deviation. *P 0.05 and significant. Score >5. Score >3.
LOS, mean (SD)
3.71 (7.10)
2.72 (3.40)
0.130
Charlson Comorbidity Index, mean (SD)
1.7 (2.23)
2.51 (2.90)
0.005*
Medical comorbidity, No. (%)
Diabetes mellitus
6 (3)
16 (11)
0.005*
Cardiovascular disease
6 (3)
15 (11)
0.050*
Cerebrovascular disease
0 (0)
3 (2)
0.009*
Hypertension
53 (30)
36 (25)
0.400
Cancer
17 (7)
10 (9)
0.440
Psychiatric comorbidity, No. (%)
97 (54)
94 (66)
0.026*
Adjustment disorder
0 (0)
6 (4)
0.005*
Depressive disorder
85 (47)
76 (54)
0.260
Bipolar disorder
6 (3)
10 (7)
0.130
Psychotic disorder
4 (2)
6 (4)
0.030*
Anxiety disorder
30 (17)
25 (18)
0.820
Drug abuse
4 (2)
4 (3)
0.730
Eating disorder
0 (0)
3 (2)
0.050*
CIWA‐Ar scores
CIWA‐Ar score (max), mean (SD)
15 (8)
20 (9)
<0.000*
Component, mean (SD)
Agitation
20 (11)
36 (25)
0.001*
Anxiety
23 (13)
38 (27)
0.001*
Auditory disturbance
4 (2)
9 (6)
0.110
Headache
11 (6)
26 (18)
0.001*
Nausea/vomiting
5 (3)
17 (12)
0.003*
Orientation
52 (29)
72 (51)
0.001*
Paroxysm/sweats
9 (5)
17 (12)
0.023*
Tactile disturbance
25 (14)
54 (38)
0.001*
Tremor
35 (19)
47 (33)
0.004*
Visual disturbance
54 (30)
77 (54)
0.001*
ALT (U/L), mean (SD)
76 (85)
101 (71)
0.050*
Ammonia (mcg N/dl), mean (SD)
25 (14)
29 (29)
0.530
Positive urine drug screen, No. (%)
25 (14)
49 (35)
<0.001*
Tetrahydrocannabinol
14 (56)
19 (39)
Cocaine
8 (32)
8 (16)
Benzodiazepine
6 (24)
11 (22)
Opiate
4 (16)
13 (26)
Amphetamine
2 (8)
2 (4)
Barbiturate
1 (4)
0 (0)
Adverse event, No. (%)
RRT
1 (1)
1 (1)
0.866
ICU transfer
32 (18)
20 (14)
0.550
Intubation
12 (7)
4 (3)
0.890
Delirium tremens
7 (4)
4 (3)
0.600
In‐hospital mortality
0 (0)
0 (0)
Multivariate logistic model analysis was performed using the variables age, male gender, divorced marital status, high school education or less, CIWA‐Ar score (max), CCI score, psychiatric comorbidity, and positive urine drug screen. With a stepwise elimination process, the final model showed that multiple admissions were associated with high school education or less (P = 0.0071), higher CCI score (P = 0.0010), higher CIWA‐Ar score (max) (P < 0.0001), a positive urine drug screen (P = 0.0002), and psychiatric comorbidity (P = 0.0303) (Table 3).
Multivariate Analysis of Variables Associated With Multiple Admissions
Variable
Adjusted Odds Ratio (95% CI)
P Value
Abbreviations: CI, confidence interval; CIWA‐Ar, Clinical Institute Withdrawal AssessmentAlcohol Revised. *P 0.05 and significant.
High school education or less
2.074 (1.219, 3.529)
0.0071*
CIWA‐Ar score (max)
1.074 (1.042, 1.107)
<0.0001*
Charlson Comorbidity Index
1.232 (1.088, 1.396)
0.0010*
Psychiatric comorbidity
1.757 (1.055, 2.928)
0.0303*
Positive urine drug screen
3.180 (1.740, 5.812)
0.0002*
DISCUSSION
We provide important information regarding identification of individuals at high risk for multiple admissions to general medicine services for treatment of AWS. This study found that patients with multiple admissions for AWS had more medical comorbidity. They had more cases of diabetes mellitus, cardiovascular disease, and cerebrovascular disease, and their CCI scores were higher. They also had higher CIWA‐Ar (max) scores, as well as higher CIWA‐Ar component scores, indicating a more severe withdrawal.
Further, psychiatric comorbidity was also associated with multiple admissions. Consistent with the high prevalence in alcoholic patients, psychiatric comorbidity was common in both patients with a single admission and multiple admissions. We also found that a positive urine drug screen was associated with multiple admissions. Interestingly, few patients in each group had a diagnosis recorded in the medical record of an additional substance abuse disorder, yet 14% of patients with a single admission and 29% of patients with multiple admissions had a positive urine drug screen for a non‐alcohol substance. Psychiatric comorbidity, including additional substance abuse, is a well‐established risk factor for readmission to detoxification centers.1215, 17,22,23 Also, people with either an alcohol or non‐alcohol drug addiction, are known to be 7 times more likely to have another addiction than the rest of the population.24 This study suggests clinicians may underrecognize additional substance abuse disorders which are common in this patient population.
In contrast to studies of patients readmitted to detoxification units and substance abuse units,14,15,18,22 we found level of education, specifically a high school education or less, to be associated with multiple admissions. In a study of alcoholics, Greenfield and colleagues found that lower education in alcoholics predicts shorter time to relapse.25 A lack of education may result in inadequate healthcare literacy. Poor health behavior choices that follow may lead to relapse and subsequent admissions for AWS. With respect to other demographic variables, patients in our study population were predominantly men, which is not surprising. Gender differences in alcoholism are well established, with alcohol abuse and dependence more prevalent in men.26 We did not find gender associated with multiple admissions.
Our findings have management and treatment implications. First, providers who care for patients with AWS should not simply focus on treating withdrawal signs and symptoms, but also screen for and address other medical issues, which may not be apparent or seem stable at first glance. While a comorbid medical condition may not be the primary reason for hospital admission, comorbid medical conditions are known to be a source of psychological distress27 and have a negative effect on abstinence. Second, all patients should be screened for additional substance abuse. Initial laboratory testing should include a urine drug screen. Third, before discharging the patient, providers should establish primary care follow‐up for continued surveillance of medical issues. There is evidence that primary care services are predictive of better substance abuse treatment outcomes for those with medical problems.28,29
Finally, inpatient psychiatric consultation, upon admission, is essential for several reasons. First, the psychiatric team can help with initial management and treatment of the alcohol withdrawal regardless of stage and severity, obtain a more comprehensive psychiatric history, and assess for the presence of psychiatric comorbidities that may contribute to, aggravate, or complicate the clinical picture. The team can also address other substance abuse issues when detected by drug screen or clinical history. The psychiatric team, along with chemical‐dependency counselors and social workers, can provide valuable input regarding chemical‐dependency resources available on discharge and help instruct the patient in healthy behaviors. Because healthcare illiteracy may be an issue in this patient population, these instructions should be tailored to the patient's educational level. Prior to discharge, the psychiatry team, social workers, or chemical‐dependency counselors can also assist with, or arrange, rehabilitation aftercare for patients. Recent work shows that patients were less likely to be readmitted to crisis detoxification if they entered rehabilitation care within 3 days of discharge.18
Our study has significant limitations. This study was performed with data at a single academic medical center with an ethnically homogeneous patient population, limiting the external validity of its results. Because this is a retrospective study, data analyses are limited by the quality and accuracy of data in the electronic medical record. Also, our follow‐up period may not have been long enough to detect additional admissions, and we did not screen for patient admissions prior to the study period. By limiting data collection to admissions for AWS to general medical services, we may have missed cases of AWS when admitted for other reasons or to subspecialty services, and we may have missed severe cases requiring admission to an intensive care unit. While we believe we were able to capture most admissions, we may underreport this number since we cannot account for those events that may have occurred at other facilities and locations. Lastly, without a control group, this study is limited in its ability to show an association between any variable and readmission.
In our study, 142 patients accounted for 608 admissions during the 3‐year study period, which speaks to the high recidivism rates for patients with AWS. This disease is associated with high morbidity, high medical costs, and high utilization of healthcare. Our study provides insight regarding identification of patients at high risk of multiple admissions with respect to demographic (lower level of education) and clinical characteristics (worse withdrawal severity, more medical and psychiatric comorbidity, and polysubstance abuse). We believe collaboration between social services, chemical‐dependency counselors, psychiatry, and medicine is necessary to effectively treat this population of patients and assist with the crucial transition to the outpatient setting. Future studies should include key social factors, such as health literacy in the readmission risk assessment, as well as primary care follow‐up and rehabilitation aftercare.
Moss M, Burnham EL. Chronic alcohol abuse, acute respiratory distress syndrome, and multiple organ dysfunction. Crit Care Med.2003;31(4 suppl):S207–S212.
O'Brien JMLu B, Ali NA, et al. Alcohol dependence is independently associated with sepsis, septic shock, and hospital mortality among adult intensive care unit patients. Crit Care Med.2007;35(2):345–350.
Foy A, March S, Drinkwater V. Use of an objective clinical scale in the assessment and management of alcohol withdrawal in a large general hospital. Alcohol Clin Exp Res.1988;12(3):360–364.
Sarff M, Gold JA. Alcohol withdrawal syndromes in the intensive care unit. Crit Care Med.2010;38(9 suppl):S494–S501.
Moore M, Gray M.Alcoholism at the Boston City Hospital—V. The causes of death among alcoholic patients at the Haymarket Square Relief Station, 1923–year="1938"1938. N Engl J Med.year="1939"1939;221(July 13):58–59.
Louro Puerta R, Anton Otero E, Zuniga V Lorenzo. Epidemiology of alcohol withdrawal syndrome: mortality and factors of poor prognosis [in Spanish]. An Med Interna (Madrid).2006;23(7):307–309.
Saitz R, Ghali WA, Moskowitz MA. The impact of alcohol‐related diagnoses on pneumonia outcomes. Arch Intern Med.1997;157(13):1446–1452.
Monte R, Rabunal R, Casariego E, Lopez‐Agreda H, Mateos A, Pertega S. Analysis of the factors determining survival of alcoholic withdrawal syndrome patients in a general hospital. Alcohol Alcohol.2010;45(2):151–158.
Khan A, Levy P, DeHorn S, Miller W, Compton S. Predictors of mortality in patients with delirium tremens. Acad Emerg Med.2008;15(8):788–790.
Campos J, Roca L, Gude F, Gonzalez‐Quintela A. Long‐term mortality of patients admitted to the hospital with alcohol withdrawal syndrome. Alcohol Clin Exp Res.2011;35(6):1180–1186.
Raven MC, Carrier ER, Lee J, Billings JC, Marr M, Gourevitch MN. Substance use treatment barriers for patients with frequent hospital admissions. J Subst Abuse Treat.2010;38(1):22–30.
Moos RH, Brennan PL, Mertens JR. Diagnostic subgroups and predictors of one‐year re‐admission among late‐middle‐aged and older substance abuse patients. J Stud Alcohol.1994;55(2):173–183.
Moos RH, Mertens JR, Brennan PL. Rates and predictors of four‐year readmission among late‐middle‐aged and older substance abuse patients. J Stud Alcohol.1994;55(5):561–570.
Mertens JR, Weisner CM, Ray GT. Readmission among chemical dependency patients in private, outpatient treatment: patterns, correlates and role in long‐term outcome. J Stud Alcohol.2005;66(6):842–847.
Luchansky B, He L, Krupski A, Stark KD. Predicting readmission to substance abuse treatment using state information systems. The impact of client and treatment characteristics.J Subst Abuse.2000;12(3):255–270.
Brennan PL, Kagay CR, Geppert JJ, Moos RH. Elderly Medicare inpatients with substance use disorders: characteristics and predictors of hospital readmissions over a four‐year interval. J Stud Alcohol.2000;61(6):891–895.
Tomasson K, Vaglum P. The role of psychiatric comorbidity in the prediction of readmission for detoxification. Compr Psychiatry.1998;39(3):129–136.
Carrier E, McNeely J, Lobach I, Tay S, Gourevitch MN, Raven MC. Factors associated with frequent utilization of crisis substance use detoxification services. J Addict Dis.2011;30(2):116–122.
Sullivan JT, Sykora K, Schneiderman J, Naranjo CA, Sellers EM. Assessment of alcohol withdrawal: the revised Clinical Institute Withdrawal Assessment for Alcohol scale (CIWA‐Ar). Br J Addict.1989;84(11):1353–1357.
Hecksel KA, Bostwick JM, Jaeger TM, Cha SS.Inappropriate use of symptom‐triggered therapy for alcohol withdrawal in the general hospital. Mayo Clin Proc.2008;83(3):274–279.
Charlson ME, Pompei P, Ales KL, MacKenzie CR. A new method of classifying prognostic comorbidity in longitudinal studies: development and validation. J Chronic Dis.1987;40(5):373–383.
Ponzer S, Johansson S‐E, Bergman B. A four‐year follow‐up study of male alcoholics: factors affecting the risk of readmission. Alcohol.2002;27(2):83–88.
Walker RD, Howard MO, Anderson B, et al. Diagnosis and hospital readmission rates of female veterans with substance‐related disorders. Psychiatr Serv.1995;46(9):932–937.
Regier DA, Farmer ME, Rae DS, et al. Comorbidity of mental disorders with alcohol and other drug abuse. Results from the Epidemiologic Catchment Area (ECA) Study. JAMA.1990;264(19):2511–2518.
Greenfield SF, Sugarman DE, Muenz LR, Patterson MD, He DY, Weiss RD. The relationship between educational attainment and relapse among alcohol‐dependent men and women: a prospective study. Alcohol Clin Exp Res.2003;27(8):1278–1285.
Hasin DS, Stinson FS, Ogburn E, Grant BF. Prevalence, correlates, disability, and comorbidity of DSM‐IV alcohol abuse and dependence in the United States: results from the National Epidemiologic Survey on Alcohol and Related Conditions. Arch Gen Psychiatry.2007;64(7):830–842.
Shih M, Simon PA. Health‐related quality of life among adults with serious psychological distress and chronic medical conditions. Qual Life Res.2008;17(4):521–528.
Saitz R, Horton NJ, Larson MJ, Winter M, Samet JH. Primary medical care and reductions in addiction severity: a prospective cohort study. Addiction.2005;100(1):70–78.
Mertens JR, Flisher AJ, Satre DD, Weisner CM. The role of medical conditions and primary care services in 5‐year substance use outcomes among chemical dependency treatment patients. Drug Alcohol Depend.2008;98(1–2):45–53.
Many patients are admitted and readmitted to acute care hospitals with alcohol‐related diagnoses, including alcohol withdrawal syndrome (AWS), and experience significant morbidity and mortality. In patients with septic shock or at risk for acute respiratory distress syndrome (ARDS), chronic alcohol abuse is associated with increased ARDS and severity of multiple organ dysfunction.1 Among intensive care unit (ICU) patients, those with alcohol dependence have higher morbidity, including septic shock, and higher hospital mortality.2 Patients who experience AWS as a result of alcohol dependence may experience life‐threatening complications, such as seizures and delirium tremens.3,4 In‐hospital mortality from AWS is historically high,5 but with benzodiazepines used in a symptom‐driven manner to treat the complications of alcohol use, hospital mortality rates are more recently reported at 2.4%.6
As inpatient outcomes1,2,7 and hospital mortality810 are negatively affected by alcohol abuse, the post‐hospital course of these patients is also of interest. Specifically, patients are often admitted and readmitted with alcohol‐related diagnoses or AWS to acute care hospitals, but relatively little quantitative data exist on readmission factors in this population.11 Patients readmitted to detoxification units or alcohol and substance abuse units have been studied, and factors associated with readmission include psychiatric disorder,1217 female gender,14,15 and delay in rehabilitation aftercare.18
These results cannot be generalized to patients with AWS who are admitted and readmitted to acute‐care hospitals. First, patients hospitalized for alcohol withdrawal symptoms are often medically ill with more severe symptoms, and more frequent coexisting medical and psychiatric illnesses, that complicate the withdrawal syndrome. Detoxification units and substance abuse units require patients to be medically stable before admission, because they do not have the ability to provide a high level of supervision and treatment. Second, much of what we know regarding risk factors for readmission to detoxification centers and substance abuse units comes from studies of administrative data of the Veterans Health Administration,12,13 Medicare Provider Analysis and Review file,16 privately owned outpatient substance abuse centers,14 and publicly funded detoxification centers.18 These results may be difficult to generalize to other patient populations. Accordingly, the objective of this study was to identify demographic and clinical factors associated with multiple admissions to a general medicine service for treatment of AWS over a 3‐year period. Characterization of these high‐risk patients and their hospital course may help focus intervention and reduce these revolving door admissions.
METHODS
The Mayo Clinic Institutional Review Board deemed the study exempt.
Patient Selection
The study was conducted at an 1157‐bed academic tertiary referral hospital, located in the Midwest, that has approximately 15,000 inpatient admissions to general medicine services annually and serves as the main referral center for the region. Patients included in this study were adults admitted to general medicine services and treated with symptom‐triggered Clinical Institute Withdrawal AssessmentAlcohol Revised (CIWA‐Ar) protocol19 between January 1, 2006 and December 31, 2008. Patients were identified using the Mayo Clinic Quality Improvement Resource Center database, as done in a previous CIWA‐Ar study.20 Patients were excluded if the primary diagnosis was a nonalcohol‐related diagnosis (Figure 1).
Figure 1
Study design. Abbreviations: AWS, alcohol withdrawal syndrome; CIWA‐Ar, Clinical Institute Withdrawal Assessment—Alcohol Revised.
Patients were placed in 1 of 2 groups based on number of admissions during the study period, either a single‐admission group or a multiple‐admissions group. While most readmission studies use a 30‐day mark from discharge, we used 3 years to better capture relapse and recidivism in this patient population. The 2 groups were then compared retrospectively. To insure that a single admission was not arbitrarily created by the December 2008 cutoff, we reviewed the single‐admission group for additional admissions through June of 2009. If a patient did have a subsequent admission, then the patient was moved to the multiple‐admissions group.
Clinical Variables
Demographic and clinical data was obtained using the Mayo Data Retrieval System (DRS), the Mayo Clinic Life Sciences System (MCLSS) database, and electronic medical records. Clinical data for the multiple‐admissions group was derived from the first admission of the study period, and subsequently referred to as index admission. Specific demographic information collected included age, race, gender, marital status, employment status, and education. Clinical data collected included admitting diagnosis, comorbid medical disorders, psychiatric disorders, and CIWA‐Ar evaluations including highest total score (CIWA‐Ar score [max] and component scores). The CIWA‐Ar protocol is a scale to assess the severity of alcohol withdrawal, based on 10 symptoms of alcohol withdrawal ranging from 0 (not present) to 7 (extremely severe). The protocol requires the scale to be administered hourly, and total scores guide the medication dosing and administration of benzodiazepines to control withdrawal symptoms. Laboratory data collected included serum ammonia, alanine aminotransferase(ALT), and admission urine drug screen. For the purposes of this study, a urine drug screen was considered positive if a substance other than alcohol was present. Length of stay (LOS) and adverse events during hospitalization (delirium tremens, intubations, rapid response team [RRT] calls, ICU transfers, and in‐hospital mortality) were also collected.
Medical comorbidity was measured using the Charlson Comorbidity Index (CCI).21 The CCI was scored electronically using diagnoses in the institution's medical index database dating back 5 years from patient's first, or index, admission. Originally validated as a prognostic tool for mortality 1 year after admission in medical patients, the CCI was chosen as it accounts for most medical comorbidities.21 Data was validated, by another investigator not involved in the initial abstracting process, by randomly verifying 5% of the abstracted data.
Statistical Analysis
Standard descriptive statistics were used for patient characteristics and demographics. Comparing the multiple‐admissions group and single‐admission group, categorical variables were evaluated using the Fisher exact test or Pearson chi‐square test. Continuous variables were evaluated using 2‐sample t test. Multivariate logistic model analyses with stepwise elimination method were used to identify risk factors that were associated with multiple admissions. Age, gender, and variables that were statistically significant in the univariate analysis were used in stepwise regression to get to the final model. A P value of 0.05 was considered statistically significant. All statistical analyses were performed using SAS version 9.3 software (SAS Institute, Cary, NC).
RESULTS
The CIWA‐Ar protocol was ordered on 1199 admissions during the study period. Of these, 411 (34.3%) admissions were excluded because AWS was not the primary diagnosis, leaving 788 (65.7%) admissions for 322 patients, which formed the study population. Of the 322 patients, 180 (56%) had a single admission and 142 (44%) had multiple admissions.
Univariate analyses of demographic and clinical variables are shown in Tables 1 and 2, respectively. Patients with multiple admissions were more likely divorced (P = 0.028), have a high school education or less (P = 0.002), have a higher CCI score (P < 0.0001), a higher CIWA‐Ar score (max) (P < 0.0001), a higher ALT level (P = 0.050), more psychiatric comorbidity (P < 0.026), and a positive urine drug screen (P < 0.001). Adverse events were not significantly different between the 2 groups (Table 2).
Univariate Analysis of Demographic Variables and Multiple Admissions
Variable
Single Admission N = 180
Multiple Admissions N = 142
P Value
Abbreviations: GED, General Educational Development; SD, standard deviation. *P 0.05 and significant.
Age, years (SD)
47.85 (12.84)
45.94 (12)
0.170
Male, No. (%)
122 (68)
109 (77)
0.080
Race/Ethnicity, No. (%)
0.270
White
168 (93)
132 (93)
African American
6 (3)
3 (2)
Asian
0 (0)
1 (1)
Middle Eastern
3 (2)
0 (0)
Other
3 (2)
6 (4)
Relationship status, No. (%)
0.160
Divorced
49 (27)
55 (39)
0.028*
Married
54 (30)
34 (24)
0.230
Separated
9 (5)
4 (3)
0.323
Single
59 (33)
38 (27)
0.243
Widowed
5 (3)
3 (2)
0.703
Committed
4 (2)
7 (5)
0.188
Unknown
0 (0)
1 (1)
0.259
Education, No. (%)
0.002*
High school graduate, GED, or less
49 (28)
67 (47)
Some college or above
89 (49)
60 (42)
Unknown
41 (23)
15 (11)
Employment, No. (%)
0.290
Retired
26 (14)
12 (8)
Employed
72 (40)
51 (36)
Unemployed
51 (28)
51 (36)
Homemaker
9 (5)
4 (3)
Work disabled
20 (11)
23 (16)
Student
1 (1)
0 (0)
Unknown
1 (1)
1 (1)
Univariate Analysis of Clinical Variables and Multiple Admissions
Variable
Single Admission N = 180
Multiple Admissions N = 142
P Value
Abbreviations: ALT, alanine aminotransferase; CIWA‐Ar, Clinical Institute Withdrawal AssessmentAlcohol Revised; ICU, intensive care unit; LOS, length of stay (days); RRT, rapid response team; SD, standard deviation. *P 0.05 and significant. Score >5. Score >3.
LOS, mean (SD)
3.71 (7.10)
2.72 (3.40)
0.130
Charlson Comorbidity Index, mean (SD)
1.7 (2.23)
2.51 (2.90)
0.005*
Medical comorbidity, No. (%)
Diabetes mellitus
6 (3)
16 (11)
0.005*
Cardiovascular disease
6 (3)
15 (11)
0.050*
Cerebrovascular disease
0 (0)
3 (2)
0.009*
Hypertension
53 (30)
36 (25)
0.400
Cancer
17 (7)
10 (9)
0.440
Psychiatric comorbidity, No. (%)
97 (54)
94 (66)
0.026*
Adjustment disorder
0 (0)
6 (4)
0.005*
Depressive disorder
85 (47)
76 (54)
0.260
Bipolar disorder
6 (3)
10 (7)
0.130
Psychotic disorder
4 (2)
6 (4)
0.030*
Anxiety disorder
30 (17)
25 (18)
0.820
Drug abuse
4 (2)
4 (3)
0.730
Eating disorder
0 (0)
3 (2)
0.050*
CIWA‐Ar scores
CIWA‐Ar score (max), mean (SD)
15 (8)
20 (9)
<0.000*
Component, mean (SD)
Agitation
20 (11)
36 (25)
0.001*
Anxiety
23 (13)
38 (27)
0.001*
Auditory disturbance
4 (2)
9 (6)
0.110
Headache
11 (6)
26 (18)
0.001*
Nausea/vomiting
5 (3)
17 (12)
0.003*
Orientation
52 (29)
72 (51)
0.001*
Paroxysm/sweats
9 (5)
17 (12)
0.023*
Tactile disturbance
25 (14)
54 (38)
0.001*
Tremor
35 (19)
47 (33)
0.004*
Visual disturbance
54 (30)
77 (54)
0.001*
ALT (U/L), mean (SD)
76 (85)
101 (71)
0.050*
Ammonia (mcg N/dl), mean (SD)
25 (14)
29 (29)
0.530
Positive urine drug screen, No. (%)
25 (14)
49 (35)
<0.001*
Tetrahydrocannabinol
14 (56)
19 (39)
Cocaine
8 (32)
8 (16)
Benzodiazepine
6 (24)
11 (22)
Opiate
4 (16)
13 (26)
Amphetamine
2 (8)
2 (4)
Barbiturate
1 (4)
0 (0)
Adverse event, No. (%)
RRT
1 (1)
1 (1)
0.866
ICU transfer
32 (18)
20 (14)
0.550
Intubation
12 (7)
4 (3)
0.890
Delirium tremens
7 (4)
4 (3)
0.600
In‐hospital mortality
0 (0)
0 (0)
Multivariate logistic model analysis was performed using the variables age, male gender, divorced marital status, high school education or less, CIWA‐Ar score (max), CCI score, psychiatric comorbidity, and positive urine drug screen. With a stepwise elimination process, the final model showed that multiple admissions were associated with high school education or less (P = 0.0071), higher CCI score (P = 0.0010), higher CIWA‐Ar score (max) (P < 0.0001), a positive urine drug screen (P = 0.0002), and psychiatric comorbidity (P = 0.0303) (Table 3).
Multivariate Analysis of Variables Associated With Multiple Admissions
Variable
Adjusted Odds Ratio (95% CI)
P Value
Abbreviations: CI, confidence interval; CIWA‐Ar, Clinical Institute Withdrawal AssessmentAlcohol Revised. *P 0.05 and significant.
High school education or less
2.074 (1.219, 3.529)
0.0071*
CIWA‐Ar score (max)
1.074 (1.042, 1.107)
<0.0001*
Charlson Comorbidity Index
1.232 (1.088, 1.396)
0.0010*
Psychiatric comorbidity
1.757 (1.055, 2.928)
0.0303*
Positive urine drug screen
3.180 (1.740, 5.812)
0.0002*
DISCUSSION
We provide important information regarding identification of individuals at high risk for multiple admissions to general medicine services for treatment of AWS. This study found that patients with multiple admissions for AWS had more medical comorbidity. They had more cases of diabetes mellitus, cardiovascular disease, and cerebrovascular disease, and their CCI scores were higher. They also had higher CIWA‐Ar (max) scores, as well as higher CIWA‐Ar component scores, indicating a more severe withdrawal.
Further, psychiatric comorbidity was also associated with multiple admissions. Consistent with the high prevalence in alcoholic patients, psychiatric comorbidity was common in both patients with a single admission and multiple admissions. We also found that a positive urine drug screen was associated with multiple admissions. Interestingly, few patients in each group had a diagnosis recorded in the medical record of an additional substance abuse disorder, yet 14% of patients with a single admission and 29% of patients with multiple admissions had a positive urine drug screen for a non‐alcohol substance. Psychiatric comorbidity, including additional substance abuse, is a well‐established risk factor for readmission to detoxification centers.1215, 17,22,23 Also, people with either an alcohol or non‐alcohol drug addiction, are known to be 7 times more likely to have another addiction than the rest of the population.24 This study suggests clinicians may underrecognize additional substance abuse disorders which are common in this patient population.
In contrast to studies of patients readmitted to detoxification units and substance abuse units,14,15,18,22 we found level of education, specifically a high school education or less, to be associated with multiple admissions. In a study of alcoholics, Greenfield and colleagues found that lower education in alcoholics predicts shorter time to relapse.25 A lack of education may result in inadequate healthcare literacy. Poor health behavior choices that follow may lead to relapse and subsequent admissions for AWS. With respect to other demographic variables, patients in our study population were predominantly men, which is not surprising. Gender differences in alcoholism are well established, with alcohol abuse and dependence more prevalent in men.26 We did not find gender associated with multiple admissions.
Our findings have management and treatment implications. First, providers who care for patients with AWS should not simply focus on treating withdrawal signs and symptoms, but also screen for and address other medical issues, which may not be apparent or seem stable at first glance. While a comorbid medical condition may not be the primary reason for hospital admission, comorbid medical conditions are known to be a source of psychological distress27 and have a negative effect on abstinence. Second, all patients should be screened for additional substance abuse. Initial laboratory testing should include a urine drug screen. Third, before discharging the patient, providers should establish primary care follow‐up for continued surveillance of medical issues. There is evidence that primary care services are predictive of better substance abuse treatment outcomes for those with medical problems.28,29
Finally, inpatient psychiatric consultation, upon admission, is essential for several reasons. First, the psychiatric team can help with initial management and treatment of the alcohol withdrawal regardless of stage and severity, obtain a more comprehensive psychiatric history, and assess for the presence of psychiatric comorbidities that may contribute to, aggravate, or complicate the clinical picture. The team can also address other substance abuse issues when detected by drug screen or clinical history. The psychiatric team, along with chemical‐dependency counselors and social workers, can provide valuable input regarding chemical‐dependency resources available on discharge and help instruct the patient in healthy behaviors. Because healthcare illiteracy may be an issue in this patient population, these instructions should be tailored to the patient's educational level. Prior to discharge, the psychiatry team, social workers, or chemical‐dependency counselors can also assist with, or arrange, rehabilitation aftercare for patients. Recent work shows that patients were less likely to be readmitted to crisis detoxification if they entered rehabilitation care within 3 days of discharge.18
Our study has significant limitations. This study was performed with data at a single academic medical center with an ethnically homogeneous patient population, limiting the external validity of its results. Because this is a retrospective study, data analyses are limited by the quality and accuracy of data in the electronic medical record. Also, our follow‐up period may not have been long enough to detect additional admissions, and we did not screen for patient admissions prior to the study period. By limiting data collection to admissions for AWS to general medical services, we may have missed cases of AWS when admitted for other reasons or to subspecialty services, and we may have missed severe cases requiring admission to an intensive care unit. While we believe we were able to capture most admissions, we may underreport this number since we cannot account for those events that may have occurred at other facilities and locations. Lastly, without a control group, this study is limited in its ability to show an association between any variable and readmission.
In our study, 142 patients accounted for 608 admissions during the 3‐year study period, which speaks to the high recidivism rates for patients with AWS. This disease is associated with high morbidity, high medical costs, and high utilization of healthcare. Our study provides insight regarding identification of patients at high risk of multiple admissions with respect to demographic (lower level of education) and clinical characteristics (worse withdrawal severity, more medical and psychiatric comorbidity, and polysubstance abuse). We believe collaboration between social services, chemical‐dependency counselors, psychiatry, and medicine is necessary to effectively treat this population of patients and assist with the crucial transition to the outpatient setting. Future studies should include key social factors, such as health literacy in the readmission risk assessment, as well as primary care follow‐up and rehabilitation aftercare.
References
Moss M, Burnham EL. Chronic alcohol abuse, acute respiratory distress syndrome, and multiple organ dysfunction. Crit Care Med.2003;31(4 suppl):S207–S212.
O'Brien JMLu B, Ali NA, et al. Alcohol dependence is independently associated with sepsis, septic shock, and hospital mortality among adult intensive care unit patients. Crit Care Med.2007;35(2):345–350.
Foy A, March S, Drinkwater V. Use of an objective clinical scale in the assessment and management of alcohol withdrawal in a large general hospital. Alcohol Clin Exp Res.1988;12(3):360–364.
Sarff M, Gold JA. Alcohol withdrawal syndromes in the intensive care unit. Crit Care Med.2010;38(9 suppl):S494–S501.
Moore M, Gray M.Alcoholism at the Boston City Hospital—V. The causes of death among alcoholic patients at the Haymarket Square Relief Station, 1923–year="1938"1938. N Engl J Med.year="1939"1939;221(July 13):58–59.
Louro Puerta R, Anton Otero E, Zuniga V Lorenzo. Epidemiology of alcohol withdrawal syndrome: mortality and factors of poor prognosis [in Spanish]. An Med Interna (Madrid).2006;23(7):307–309.
Saitz R, Ghali WA, Moskowitz MA. The impact of alcohol‐related diagnoses on pneumonia outcomes. Arch Intern Med.1997;157(13):1446–1452.
Monte R, Rabunal R, Casariego E, Lopez‐Agreda H, Mateos A, Pertega S. Analysis of the factors determining survival of alcoholic withdrawal syndrome patients in a general hospital. Alcohol Alcohol.2010;45(2):151–158.
Khan A, Levy P, DeHorn S, Miller W, Compton S. Predictors of mortality in patients with delirium tremens. Acad Emerg Med.2008;15(8):788–790.
Campos J, Roca L, Gude F, Gonzalez‐Quintela A. Long‐term mortality of patients admitted to the hospital with alcohol withdrawal syndrome. Alcohol Clin Exp Res.2011;35(6):1180–1186.
Raven MC, Carrier ER, Lee J, Billings JC, Marr M, Gourevitch MN. Substance use treatment barriers for patients with frequent hospital admissions. J Subst Abuse Treat.2010;38(1):22–30.
Moos RH, Brennan PL, Mertens JR. Diagnostic subgroups and predictors of one‐year re‐admission among late‐middle‐aged and older substance abuse patients. J Stud Alcohol.1994;55(2):173–183.
Moos RH, Mertens JR, Brennan PL. Rates and predictors of four‐year readmission among late‐middle‐aged and older substance abuse patients. J Stud Alcohol.1994;55(5):561–570.
Mertens JR, Weisner CM, Ray GT. Readmission among chemical dependency patients in private, outpatient treatment: patterns, correlates and role in long‐term outcome. J Stud Alcohol.2005;66(6):842–847.
Luchansky B, He L, Krupski A, Stark KD. Predicting readmission to substance abuse treatment using state information systems. The impact of client and treatment characteristics.J Subst Abuse.2000;12(3):255–270.
Brennan PL, Kagay CR, Geppert JJ, Moos RH. Elderly Medicare inpatients with substance use disorders: characteristics and predictors of hospital readmissions over a four‐year interval. J Stud Alcohol.2000;61(6):891–895.
Tomasson K, Vaglum P. The role of psychiatric comorbidity in the prediction of readmission for detoxification. Compr Psychiatry.1998;39(3):129–136.
Carrier E, McNeely J, Lobach I, Tay S, Gourevitch MN, Raven MC. Factors associated with frequent utilization of crisis substance use detoxification services. J Addict Dis.2011;30(2):116–122.
Sullivan JT, Sykora K, Schneiderman J, Naranjo CA, Sellers EM. Assessment of alcohol withdrawal: the revised Clinical Institute Withdrawal Assessment for Alcohol scale (CIWA‐Ar). Br J Addict.1989;84(11):1353–1357.
Hecksel KA, Bostwick JM, Jaeger TM, Cha SS.Inappropriate use of symptom‐triggered therapy for alcohol withdrawal in the general hospital. Mayo Clin Proc.2008;83(3):274–279.
Charlson ME, Pompei P, Ales KL, MacKenzie CR. A new method of classifying prognostic comorbidity in longitudinal studies: development and validation. J Chronic Dis.1987;40(5):373–383.
Ponzer S, Johansson S‐E, Bergman B. A four‐year follow‐up study of male alcoholics: factors affecting the risk of readmission. Alcohol.2002;27(2):83–88.
Walker RD, Howard MO, Anderson B, et al. Diagnosis and hospital readmission rates of female veterans with substance‐related disorders. Psychiatr Serv.1995;46(9):932–937.
Regier DA, Farmer ME, Rae DS, et al. Comorbidity of mental disorders with alcohol and other drug abuse. Results from the Epidemiologic Catchment Area (ECA) Study. JAMA.1990;264(19):2511–2518.
Greenfield SF, Sugarman DE, Muenz LR, Patterson MD, He DY, Weiss RD. The relationship between educational attainment and relapse among alcohol‐dependent men and women: a prospective study. Alcohol Clin Exp Res.2003;27(8):1278–1285.
Hasin DS, Stinson FS, Ogburn E, Grant BF. Prevalence, correlates, disability, and comorbidity of DSM‐IV alcohol abuse and dependence in the United States: results from the National Epidemiologic Survey on Alcohol and Related Conditions. Arch Gen Psychiatry.2007;64(7):830–842.
Shih M, Simon PA. Health‐related quality of life among adults with serious psychological distress and chronic medical conditions. Qual Life Res.2008;17(4):521–528.
Saitz R, Horton NJ, Larson MJ, Winter M, Samet JH. Primary medical care and reductions in addiction severity: a prospective cohort study. Addiction.2005;100(1):70–78.
Mertens JR, Flisher AJ, Satre DD, Weisner CM. The role of medical conditions and primary care services in 5‐year substance use outcomes among chemical dependency treatment patients. Drug Alcohol Depend.2008;98(1–2):45–53.
Transfer of responsibility for patients, or handoff,1 occurs frequently in hospitalist services, requiring excellent and timely communication to ensure patient safety. Communication failure is a major contributor to medical errors.2, 3 Recognizing such findings, a growing body of literature addresses handoff techniques for learners.47
Vidyarthi described the handoff process as traditionally informal, unstructured, and idiosyncratic,4 and many believe efforts to formalize and structure this process are important for patient safety.8 Standardized handoff forms have improved accuracy of information.9 Web‐based sign‐out systems reportedly reduced the number of patients missed on rounds.10
Hospitalists also face challenges with effective communication during service change.11 The Society of Hospital Medicine identified the handoff skill as a core competency for hospitalists, and recommendations based on a systematic review of the literature were published.12 Inpatient medicine programs are increasingly using midlevel providers such as nurse practitioners (NPs) and physician assistants (PAs) along with hospitalists to accommodate workload while maintaining the scholarly enterprise in academic centers.13 To our knowledge there is no literature examining the hospitalist service handoffs involving NP/PAs.
We wished to study the effectiveness and timeliness of the morning handoff from the night coverage providers to the daytime teams consisting of one hospitalist and one NP/PA. Our objectives were to identify deficiencies and to evaluate the effectiveness of a restructured handoff process.
Methods
The Mayo Clinic Institutional Review Board reviewed and approved this study.
Setting
At the time of this study, the Division of Hospital Internal Medicine (HIM) at our institution consisted of 22 hospitalists, 11 NPs and 9 PAs (hereinafter NP/PAs), and 2 clinical assistants (CAs). The CAs assist with clerical duties not covered by Unit Secretaries:
Obtaining outside records
Clarifying referring physician contact information
Scheduling follow‐up outpatient appointments for tests, procedures, and visits
Attendance at morning handoff
Each CA can assist 3 or 4 daytime service teams.
Daytime Service Organization
Six HIM services, each managing up to 12 patients, are staffed by a partnership of 1 hospitalist and 1 NP/PA: Four services are primary general medicine services, and 2 consulting (orthopedic comanagement) services.
Night Coverage
Three of 4 primary daytime services and one consult service team transfer care to the (in‐house) night NP/PA. The night NP/PA addresses any acute‐care issues and reports at morning handoff to the 3 primary services and 1 consult service. In a designated conference room the morning handoff occurs, with at least 1 (day team) service representative present. This is usually the NP/PA, as the day team hospitalist concurrently receives a report on new admissions from the (in‐house) night hospitalist (who also covers one service and backs up the night NP/PA).
Improvement Process
An improvement team was formed within the Division of HIM consisting of 3 hospitalists, 3 NP/PAs, and 2 CAs to assess the existing handoff process at 7:45am between the Night NP/PA and daytime services. The improvement team met, reviewed evidence‐based literature on handoffs and discussed our local process. Four problems were identified by consensus:
Unpredictable start and finish times
Inefficiency (time wasted)
Poor environment (room noisy and distracting conversations)
Poor communication (overwrought and meandering narratives).
Intervention
The improvement team structured a new handoff process to address these deficiencies.
Environment: Moved to a smaller room (lower ceiling, less ambient noise).
Identification: table cards designating seats for participants (reduced queries regarding what service are you, today?).
Start Times: Each service team assigned a consistent start time (labeled on the table card) within a 15‐minute period, and although earlier reportage could occur, any service team present at their designated time has priority for the attention of the night NP/PA, and the opportunity to ask questions.
Quiet and Focus: HIM members were reminded to remain quiet in the handoff room, so the service receiving report has the floor and personal conversations must not impede the principals.
Visual Cue: Green Good to go sign placed on team table cards when no verbal was required.
Written e‐Material: The improvement team required elements of a brief written report in a specified column of our existing electronic service list (ESL). The ESL is a custom designed template importing laboratory, medication, and demographic data automatically but also capable of free text additions (Figure 1). All providers were instructed to update the ESL every 12 hours.
Admission and Progress Notes: After manual electronic medical record search, the CAs printed any notes generated in the preceding 12 hours and placed them by the team table card.
Figure 1
Electronic template. [Color figure can be viewed in the online issue, which is available at wileyonlinelibrary.com.]
The improvement team provided education for the new process at a division meeting and through e‐mail. The recommended report sequence was night NP/PA reporting and day service teams asking questions and seeking clarifications. We discouraged editorial comments and chit‐chat.
A member of the improvement team monitored the new handoff process for 15 days, and 3 months later for 10 days.
Survey
An anonymous survey (Figure 2) concerning staff satisfaction with handoff was conducted immediately before and 15 days after the intervention. In the e‐mail containing the postintervention survey, providers were asked to respond only if they had been on service the preceding 15 days (and thus eligible to participate in handoff). To help insure this, the first question read, Have you been on service during the past 15 days?
Figure 2
Survey Questions.
Statistics
To compare the relationship of preintervention and postintervention survey responses, Fisher's exact test was used to compare categorical variables and 2 sample t‐test and Wilcoxon rank sum test were used for continuous variables. Comparisons that adjusted for the possibility of someone responding to both the preintervention and postintervention surveys were not performed since the surveys were anonymous. A P value <0.05 was considered statistically significant. For the item concerning the percentage of days morning report was attended while on service, based on a common standard deviation estimate of 35.3, we had 80% power to detect a difference of 29.1 (pre vs. post). This computation assumes a 2‐sample t‐test of = 0.05 with sample sizes of 36 and 18. We have 59% power to detect a difference of 27% (67% pre vs. 94% post) for those who at least agree that helpful information was conveyed during handoff. This computation is based on a 2‐sided Pearson 2 test with = 0.05.
Qualitative data analysis of respondents' answers to the open‐ended survey questions What would increase the likelihood of your attending handoff? and What feedback do you have regarding the changes to handoff? was performed using the constant comparative method14 associated with grounded theory approaches to identify themes and categories.15 To establish interrater reliability, three investigators (MCB, DTK, LLK) independently identified coding categories for the data set, compared results, redefined coding categories as needed, and reanalyzed the data until 80% agreement was reached.
Results
Thirty‐six of the 44 providers (82%) answered the preintervention survey, including 18 of 22 hospitalists (82%), 17 of 20 NPs/PAs (85%), and 1 of 2 CAs (50%). During the intervention based on our staffing model, 21 providers had the opportunity to participate in handoff, and 18 (86%) answered the postintervention survey, including 5 of 6 hospitalists (83%), 9 of 14 NPs/PAs (64%), and 2 of 2 CAs (100%). All respondents to the postintervention survey reported being on service during the previous 15 days.
As summarized in Table 1, compared to 60.5% of survey participants (n = 38) who thought morning handoff was performed in a timely fashion preintervention, 100% (n = 15) felt it was performed in a timely fashion postintervention (P = 0.005). The average time spent in morning report before the intervention was 11 minutes, as compared to 5 minutes after the intervention (P < 0.0028). Prior to the intervention, 6.5 minutes of the handoff were viewed to be wasteful, as compared to 0.5 minutes of the handoff in the postintervention survey (P < 0.0001). Attendance and quality of information perceptions did not demonstrate statistically significant change.
Provider Survey Results Pre‐ and Postintervention
Survey Question
Preintervention
Postintervention
P
What proportion of days while on service did you attend morning report? (%)
78
87
0.4119
Helpful information was conveyed in morning report, n (%)
0.112
Strongly agree
9 (25)
9 (56)
Agree
15 (42)
6 (38)
Neutral
8 (22)
1 (6)
Disagree
4 (11)
0
Strongly disagree
0
0
Morning report was performed in a timely manner, #yes/#no
23/15
15/0
0.005
Estimate the number of minutes each day you would spend in morning report (minute)
11
5
<0.0028
Estimate the number of minutes in morning report you thought were wasteful (minute)
6.5
0.5
<0.0001
During the 15‐day observation period, morning handoff started by 0745 on 14 of 15 (93%) of days and finished by 0800 on 15 of 15 (100%) of days. Table cards, ESL, and progress notes were on the table by 0745 on 15 of 15 (100%) of days following the intervention. Three months after the intervention, the following were observed: morning handoff started by 0745 on 10 of 10 (100%) of days; finished by 0800 on 10 of 10 (100%) of days; and table cards, ESL, and progress notes were on the table by 0745 on 10 of 10 (100%) of days.
Qualitative Data Analysis
Three themes were identified in both preintervention and postintervention surveys: timeliness, quality of report and environment (Table 2). In the preintervention survey, timeliness complaints involved inconsistent start time, prolonged duration of handoff, and inefficiency due to time wasted while teams waited for their handoff report. Comments about report quality mentioned the nonstandardized report process that included nonpertinent information and editorializing. Environmental concerns addressed noise from multiple service team members assembled in 1 large room and chatting while awaiting report. In the postintervention survey, respondents' comments noted improved efficiency, environment, and report quality.
Provider Survey Feedback: Representative Comments
Deficiency
Pre‐Intervention
Post‐Intervention
Timeliness
Efficiency needed
I found the changes lead to more concise and valuable time spent in report
Timely, scheduled and efficient reports would help increase my attendance
I personally enjoyed having the times set so you are held accountable for a certain handoff
Set report times so I don't have to listen to everyone else's report
More organized and efficient
Too much time wasted
Love the good to go card! Can start on rounds
Environment
Not having to listen to chit chat unrelated to patient carewould improve my attendance
There is less chit chat
Services should receive report in a quieter room
Seems less chaotic with less people overall in the room so less distraction
Need a quieter and smaller room
Because the room is quieter, I did not have to repeat information
Too noisy
Quiet and respectful
Quality
I would like a more organized format More information isn't needed, just the correct information in a timely manner
I felt that the amount of information shared was only what was pertinent and important
If I first had the opportunity to review ESL and any notes generated in the last 12 hours, this would improve report
Written information on the ESL assured that I didn't forget something important
Less editorializing about events and less adrenaline
I liked having the progress notes generated overnight available for review
Need only meaningful information
Excellent report with prompt dissemination of information
Discussion
We describe an intervention that set the expectation for formal, structured written and verbal communication in a focused environment involving outgoing and incoming clinicians, resulting in improved satisfaction. Before the intervention, the improvement team identified by consensus 4 problems: unpredictable start time, inefficiency, environment, and report quality. Formal structuring of our handoff process resulted in statistically significant improvement in handoff timeliness and efficiency in the view of the HIM division members. Process improvement included precise team specific start times within a 12‐minute window to improve reliability and predictability and eliminating nonproductive waiting. Additionally, receiving teams were clearly identified with table cards so that no time was wasted locating the appropriate service for report, and minimizing role‐identification challenges. The good to go sign signaled teams that no events had occurred overnight requiring verbal report. Handoff timeliness persisted 3 months after the intervention, suggesting that the process is easily sustainable.
Postintervention survey comments noted the improved environment: a smaller, quieter room with the door closed. Before the intervention, all day team providers, CAs and night provider met in a large, loud room where multiple conversations were commonplace. Previous study of the handoff process supports creating an environment free of distraction.4
Postintervention survey responses to the open‐ended questions suggested improved provider satisfaction with the quality of the report. We believe this occurred for several reasons. First, having a precise start time for each team within a 12‐minute window led to a more focused report. Second, the ESL provided a column for providers to suggest plans of care for anticipated overnight events to improve preparedness and avoid significant omissions. Third, hospital notes generated overnight were made available which allowed daytime providers to review events before handoff, for a more informed update, or just after verbal report to reinforce the information just received, a technique used in other high‐reliability organizations.16 This measure also provided an at‐a‐glance view of each patient, decreasing the complexity of handoff.17
This study has important limitations. We address the handoff process of 1 hospitalist group at a single academic center. NP/PAs are the clinicians with first‐call responsibility for the night coverage of our patients, and the handoff process between the night NP/PA and daytime provider was studied. The handoff between physicians for patients admitted overnight was not assessed. Another limitation is that the time spent in handoff is reported as a participant estimate. There was no objective measurement of time, and respondents may have been biased. An additional limitation of our study concerns the preintervention and postintervention surveys. Both surveys were anonymous, which makes discerning the absolute impact of the intervention difficult due to the lack of paired responses. Lastly, our institution has an ESL. This option may not be available in other hospital systems.
Several deficiencies in the handoff process were addressed by providing key clinical data verbally and in written format, enhancing the physical environment, and defining each team's handoff start time. Our process improvements are consistent with the handoff recommendations endorsed by the Society of Hospital Medicine.12 Subsequent direct observation, subjective reports, and survey results demonstrated improvement in the handoff process.
Future studies might measure the effectiveness of morning handoff by end‐shift interviews of the daytime clinicians. Similarly, a study of evening handoff could measure the efficiency and effectiveness of report given by day teams to night‐coverage colleagues. Furthermore, if the handoff report skill set can be more rigorously defined and measured, a hospitalist clinical competency for hospitalists and NP/PAs could be developed in this core process‐of‐care.12
Acknowledgements
The authors thank Lisa Boucher for preparation of this manuscript.
References
Solet DA, Norvell MN, Rutan GH, et al.Lost in translation: challenges and opportunities in physician‐to‐physician communication during patient handoffs.Acad Med.2005;80:1094–1099.
Sutcliffe KM, Lewton E, Rosenthal MM.Communication failures: an insidious contributor to medical mishaps.Acad Med.2004;79:186–194.
Leonard M, Graham S, Bonacum D.The human factor: the critical importance of effective teamwork and communication in providing safe care.Quality 13Suppl 1:i85–90.
Vidyarthi AR, Arora V, Schnipper JL, et al.Managing discontinuity in academic medical centers: strategies for a safe and effective resident sign‐out.J Hosp Med.2006;1:257–266.
Horwitz LI, Moin T, Green ML.Development and implementation of an oral sign‐out skills curriculum.J Gen Intern Med.2007;22:1470–1474.
Kemp CD, Bath JM, Berger J, et al.The top 10 list for a safe and effective sign‐out.Arch Surg2008;143(10):1008–1010.
Riesenberg LA, Leitzsch J, Massucci JL, et al.Residents' and attending physicians' handoffs: a systematic review of the literature.Acad Med.2009;84(12):1775–1787.
Chu ES, Reid M, Schulz T, et al.A structured handoff program for interns.Acad Med.2009;84:347–352.
Wayne JD, Tyagi R, Reinhardt G, et al.Simple standardized patient handoff system that increases accuracy and completeness.J Surg.2008;65:476–485.
Van Eaton EG, Horvath KD, Lober WB, et al.A randomized, controlled trial evaluation the impact of a computerized rounding and sign‐out system on continuity of care and resident work hours.J Am Coll Surg.2005;200:538–545.
Hinami K, Farnan JM, Meltzer DO, Arora VM.Understanding communication during hospitalist service changes: A mixed methods study.J Hosp Med.2009;4(9):535–540.
Arora VM, Manjarrez E, Dressler DD, Bassaviah P, Halasyamani L, Kripalani S.Hospitalist handoffs: a systematic review and task force recommendations.J of Hosp Med.2009;4(7):433–440.
Roy CL, Liang CL, Lund M, et al.Implementation of a physician assistant/hospitalist service in an academic medical center: impact on efficiency and patient outcomes.J Hosp Med.2008;3:361–368.
Strauss A, Corbin JM.Basics of Qualitiative Research: Grounded Theory Procedures and Techniques.Sage Publications, Inc.Newbury Park, CA.1990.
Lincold YS, Guba EG.Naturalistic Inquiry.Sage Publications, Inc.Newbury Park, CA.1985.
Patterson ES.Communication strategies from high‐reliability organizations.Ann Surg.2007;245(2):170–172.
Patterson ES, Roth EM, Woods DD, et al.Handoff strategies in settings with high consequences for failure: lessons for health care operations.Int J Qual Health Care.2004;16(2):125.
Transfer of responsibility for patients, or handoff,1 occurs frequently in hospitalist services, requiring excellent and timely communication to ensure patient safety. Communication failure is a major contributor to medical errors.2, 3 Recognizing such findings, a growing body of literature addresses handoff techniques for learners.47
Vidyarthi described the handoff process as traditionally informal, unstructured, and idiosyncratic,4 and many believe efforts to formalize and structure this process are important for patient safety.8 Standardized handoff forms have improved accuracy of information.9 Web‐based sign‐out systems reportedly reduced the number of patients missed on rounds.10
Hospitalists also face challenges with effective communication during service change.11 The Society of Hospital Medicine identified the handoff skill as a core competency for hospitalists, and recommendations based on a systematic review of the literature were published.12 Inpatient medicine programs are increasingly using midlevel providers such as nurse practitioners (NPs) and physician assistants (PAs) along with hospitalists to accommodate workload while maintaining the scholarly enterprise in academic centers.13 To our knowledge there is no literature examining the hospitalist service handoffs involving NP/PAs.
We wished to study the effectiveness and timeliness of the morning handoff from the night coverage providers to the daytime teams consisting of one hospitalist and one NP/PA. Our objectives were to identify deficiencies and to evaluate the effectiveness of a restructured handoff process.
Methods
The Mayo Clinic Institutional Review Board reviewed and approved this study.
Setting
At the time of this study, the Division of Hospital Internal Medicine (HIM) at our institution consisted of 22 hospitalists, 11 NPs and 9 PAs (hereinafter NP/PAs), and 2 clinical assistants (CAs). The CAs assist with clerical duties not covered by Unit Secretaries:
Obtaining outside records
Clarifying referring physician contact information
Scheduling follow‐up outpatient appointments for tests, procedures, and visits
Attendance at morning handoff
Each CA can assist 3 or 4 daytime service teams.
Daytime Service Organization
Six HIM services, each managing up to 12 patients, are staffed by a partnership of 1 hospitalist and 1 NP/PA: Four services are primary general medicine services, and 2 consulting (orthopedic comanagement) services.
Night Coverage
Three of 4 primary daytime services and one consult service team transfer care to the (in‐house) night NP/PA. The night NP/PA addresses any acute‐care issues and reports at morning handoff to the 3 primary services and 1 consult service. In a designated conference room the morning handoff occurs, with at least 1 (day team) service representative present. This is usually the NP/PA, as the day team hospitalist concurrently receives a report on new admissions from the (in‐house) night hospitalist (who also covers one service and backs up the night NP/PA).
Improvement Process
An improvement team was formed within the Division of HIM consisting of 3 hospitalists, 3 NP/PAs, and 2 CAs to assess the existing handoff process at 7:45am between the Night NP/PA and daytime services. The improvement team met, reviewed evidence‐based literature on handoffs and discussed our local process. Four problems were identified by consensus:
Unpredictable start and finish times
Inefficiency (time wasted)
Poor environment (room noisy and distracting conversations)
Poor communication (overwrought and meandering narratives).
Intervention
The improvement team structured a new handoff process to address these deficiencies.
Environment: Moved to a smaller room (lower ceiling, less ambient noise).
Identification: table cards designating seats for participants (reduced queries regarding what service are you, today?).
Start Times: Each service team assigned a consistent start time (labeled on the table card) within a 15‐minute period, and although earlier reportage could occur, any service team present at their designated time has priority for the attention of the night NP/PA, and the opportunity to ask questions.
Quiet and Focus: HIM members were reminded to remain quiet in the handoff room, so the service receiving report has the floor and personal conversations must not impede the principals.
Visual Cue: Green Good to go sign placed on team table cards when no verbal was required.
Written e‐Material: The improvement team required elements of a brief written report in a specified column of our existing electronic service list (ESL). The ESL is a custom designed template importing laboratory, medication, and demographic data automatically but also capable of free text additions (Figure 1). All providers were instructed to update the ESL every 12 hours.
Admission and Progress Notes: After manual electronic medical record search, the CAs printed any notes generated in the preceding 12 hours and placed them by the team table card.
Figure 1
Electronic template. [Color figure can be viewed in the online issue, which is available at wileyonlinelibrary.com.]
The improvement team provided education for the new process at a division meeting and through e‐mail. The recommended report sequence was night NP/PA reporting and day service teams asking questions and seeking clarifications. We discouraged editorial comments and chit‐chat.
A member of the improvement team monitored the new handoff process for 15 days, and 3 months later for 10 days.
Survey
An anonymous survey (Figure 2) concerning staff satisfaction with handoff was conducted immediately before and 15 days after the intervention. In the e‐mail containing the postintervention survey, providers were asked to respond only if they had been on service the preceding 15 days (and thus eligible to participate in handoff). To help insure this, the first question read, Have you been on service during the past 15 days?
Figure 2
Survey Questions.
Statistics
To compare the relationship of preintervention and postintervention survey responses, Fisher's exact test was used to compare categorical variables and 2 sample t‐test and Wilcoxon rank sum test were used for continuous variables. Comparisons that adjusted for the possibility of someone responding to both the preintervention and postintervention surveys were not performed since the surveys were anonymous. A P value <0.05 was considered statistically significant. For the item concerning the percentage of days morning report was attended while on service, based on a common standard deviation estimate of 35.3, we had 80% power to detect a difference of 29.1 (pre vs. post). This computation assumes a 2‐sample t‐test of = 0.05 with sample sizes of 36 and 18. We have 59% power to detect a difference of 27% (67% pre vs. 94% post) for those who at least agree that helpful information was conveyed during handoff. This computation is based on a 2‐sided Pearson 2 test with = 0.05.
Qualitative data analysis of respondents' answers to the open‐ended survey questions What would increase the likelihood of your attending handoff? and What feedback do you have regarding the changes to handoff? was performed using the constant comparative method14 associated with grounded theory approaches to identify themes and categories.15 To establish interrater reliability, three investigators (MCB, DTK, LLK) independently identified coding categories for the data set, compared results, redefined coding categories as needed, and reanalyzed the data until 80% agreement was reached.
Results
Thirty‐six of the 44 providers (82%) answered the preintervention survey, including 18 of 22 hospitalists (82%), 17 of 20 NPs/PAs (85%), and 1 of 2 CAs (50%). During the intervention based on our staffing model, 21 providers had the opportunity to participate in handoff, and 18 (86%) answered the postintervention survey, including 5 of 6 hospitalists (83%), 9 of 14 NPs/PAs (64%), and 2 of 2 CAs (100%). All respondents to the postintervention survey reported being on service during the previous 15 days.
As summarized in Table 1, compared to 60.5% of survey participants (n = 38) who thought morning handoff was performed in a timely fashion preintervention, 100% (n = 15) felt it was performed in a timely fashion postintervention (P = 0.005). The average time spent in morning report before the intervention was 11 minutes, as compared to 5 minutes after the intervention (P < 0.0028). Prior to the intervention, 6.5 minutes of the handoff were viewed to be wasteful, as compared to 0.5 minutes of the handoff in the postintervention survey (P < 0.0001). Attendance and quality of information perceptions did not demonstrate statistically significant change.
Provider Survey Results Pre‐ and Postintervention
Survey Question
Preintervention
Postintervention
P
What proportion of days while on service did you attend morning report? (%)
78
87
0.4119
Helpful information was conveyed in morning report, n (%)
0.112
Strongly agree
9 (25)
9 (56)
Agree
15 (42)
6 (38)
Neutral
8 (22)
1 (6)
Disagree
4 (11)
0
Strongly disagree
0
0
Morning report was performed in a timely manner, #yes/#no
23/15
15/0
0.005
Estimate the number of minutes each day you would spend in morning report (minute)
11
5
<0.0028
Estimate the number of minutes in morning report you thought were wasteful (minute)
6.5
0.5
<0.0001
During the 15‐day observation period, morning handoff started by 0745 on 14 of 15 (93%) of days and finished by 0800 on 15 of 15 (100%) of days. Table cards, ESL, and progress notes were on the table by 0745 on 15 of 15 (100%) of days following the intervention. Three months after the intervention, the following were observed: morning handoff started by 0745 on 10 of 10 (100%) of days; finished by 0800 on 10 of 10 (100%) of days; and table cards, ESL, and progress notes were on the table by 0745 on 10 of 10 (100%) of days.
Qualitative Data Analysis
Three themes were identified in both preintervention and postintervention surveys: timeliness, quality of report and environment (Table 2). In the preintervention survey, timeliness complaints involved inconsistent start time, prolonged duration of handoff, and inefficiency due to time wasted while teams waited for their handoff report. Comments about report quality mentioned the nonstandardized report process that included nonpertinent information and editorializing. Environmental concerns addressed noise from multiple service team members assembled in 1 large room and chatting while awaiting report. In the postintervention survey, respondents' comments noted improved efficiency, environment, and report quality.
Provider Survey Feedback: Representative Comments
Deficiency
Pre‐Intervention
Post‐Intervention
Timeliness
Efficiency needed
I found the changes lead to more concise and valuable time spent in report
Timely, scheduled and efficient reports would help increase my attendance
I personally enjoyed having the times set so you are held accountable for a certain handoff
Set report times so I don't have to listen to everyone else's report
More organized and efficient
Too much time wasted
Love the good to go card! Can start on rounds
Environment
Not having to listen to chit chat unrelated to patient carewould improve my attendance
There is less chit chat
Services should receive report in a quieter room
Seems less chaotic with less people overall in the room so less distraction
Need a quieter and smaller room
Because the room is quieter, I did not have to repeat information
Too noisy
Quiet and respectful
Quality
I would like a more organized format More information isn't needed, just the correct information in a timely manner
I felt that the amount of information shared was only what was pertinent and important
If I first had the opportunity to review ESL and any notes generated in the last 12 hours, this would improve report
Written information on the ESL assured that I didn't forget something important
Less editorializing about events and less adrenaline
I liked having the progress notes generated overnight available for review
Need only meaningful information
Excellent report with prompt dissemination of information
Discussion
We describe an intervention that set the expectation for formal, structured written and verbal communication in a focused environment involving outgoing and incoming clinicians, resulting in improved satisfaction. Before the intervention, the improvement team identified by consensus 4 problems: unpredictable start time, inefficiency, environment, and report quality. Formal structuring of our handoff process resulted in statistically significant improvement in handoff timeliness and efficiency in the view of the HIM division members. Process improvement included precise team specific start times within a 12‐minute window to improve reliability and predictability and eliminating nonproductive waiting. Additionally, receiving teams were clearly identified with table cards so that no time was wasted locating the appropriate service for report, and minimizing role‐identification challenges. The good to go sign signaled teams that no events had occurred overnight requiring verbal report. Handoff timeliness persisted 3 months after the intervention, suggesting that the process is easily sustainable.
Postintervention survey comments noted the improved environment: a smaller, quieter room with the door closed. Before the intervention, all day team providers, CAs and night provider met in a large, loud room where multiple conversations were commonplace. Previous study of the handoff process supports creating an environment free of distraction.4
Postintervention survey responses to the open‐ended questions suggested improved provider satisfaction with the quality of the report. We believe this occurred for several reasons. First, having a precise start time for each team within a 12‐minute window led to a more focused report. Second, the ESL provided a column for providers to suggest plans of care for anticipated overnight events to improve preparedness and avoid significant omissions. Third, hospital notes generated overnight were made available which allowed daytime providers to review events before handoff, for a more informed update, or just after verbal report to reinforce the information just received, a technique used in other high‐reliability organizations.16 This measure also provided an at‐a‐glance view of each patient, decreasing the complexity of handoff.17
This study has important limitations. We address the handoff process of 1 hospitalist group at a single academic center. NP/PAs are the clinicians with first‐call responsibility for the night coverage of our patients, and the handoff process between the night NP/PA and daytime provider was studied. The handoff between physicians for patients admitted overnight was not assessed. Another limitation is that the time spent in handoff is reported as a participant estimate. There was no objective measurement of time, and respondents may have been biased. An additional limitation of our study concerns the preintervention and postintervention surveys. Both surveys were anonymous, which makes discerning the absolute impact of the intervention difficult due to the lack of paired responses. Lastly, our institution has an ESL. This option may not be available in other hospital systems.
Several deficiencies in the handoff process were addressed by providing key clinical data verbally and in written format, enhancing the physical environment, and defining each team's handoff start time. Our process improvements are consistent with the handoff recommendations endorsed by the Society of Hospital Medicine.12 Subsequent direct observation, subjective reports, and survey results demonstrated improvement in the handoff process.
Future studies might measure the effectiveness of morning handoff by end‐shift interviews of the daytime clinicians. Similarly, a study of evening handoff could measure the efficiency and effectiveness of report given by day teams to night‐coverage colleagues. Furthermore, if the handoff report skill set can be more rigorously defined and measured, a hospitalist clinical competency for hospitalists and NP/PAs could be developed in this core process‐of‐care.12
Acknowledgements
The authors thank Lisa Boucher for preparation of this manuscript.
References
Solet DA, Norvell MN, Rutan GH, et al.Lost in translation: challenges and opportunities in physician‐to‐physician communication during patient handoffs.Acad Med.2005;80:1094–1099.
Sutcliffe KM, Lewton E, Rosenthal MM.Communication failures: an insidious contributor to medical mishaps.Acad Med.2004;79:186–194.
Leonard M, Graham S, Bonacum D.The human factor: the critical importance of effective teamwork and communication in providing safe care.Quality 13Suppl 1:i85–90.
Vidyarthi AR, Arora V, Schnipper JL, et al.Managing discontinuity in academic medical centers: strategies for a safe and effective resident sign‐out.J Hosp Med.2006;1:257–266.
Horwitz LI, Moin T, Green ML.Development and implementation of an oral sign‐out skills curriculum.J Gen Intern Med.2007;22:1470–1474.
Kemp CD, Bath JM, Berger J, et al.The top 10 list for a safe and effective sign‐out.Arch Surg2008;143(10):1008–1010.
Riesenberg LA, Leitzsch J, Massucci JL, et al.Residents' and attending physicians' handoffs: a systematic review of the literature.Acad Med.2009;84(12):1775–1787.
Chu ES, Reid M, Schulz T, et al.A structured handoff program for interns.Acad Med.2009;84:347–352.
Wayne JD, Tyagi R, Reinhardt G, et al.Simple standardized patient handoff system that increases accuracy and completeness.J Surg.2008;65:476–485.
Van Eaton EG, Horvath KD, Lober WB, et al.A randomized, controlled trial evaluation the impact of a computerized rounding and sign‐out system on continuity of care and resident work hours.J Am Coll Surg.2005;200:538–545.
Hinami K, Farnan JM, Meltzer DO, Arora VM.Understanding communication during hospitalist service changes: A mixed methods study.J Hosp Med.2009;4(9):535–540.
Arora VM, Manjarrez E, Dressler DD, Bassaviah P, Halasyamani L, Kripalani S.Hospitalist handoffs: a systematic review and task force recommendations.J of Hosp Med.2009;4(7):433–440.
Roy CL, Liang CL, Lund M, et al.Implementation of a physician assistant/hospitalist service in an academic medical center: impact on efficiency and patient outcomes.J Hosp Med.2008;3:361–368.
Strauss A, Corbin JM.Basics of Qualitiative Research: Grounded Theory Procedures and Techniques.Sage Publications, Inc.Newbury Park, CA.1990.
Lincold YS, Guba EG.Naturalistic Inquiry.Sage Publications, Inc.Newbury Park, CA.1985.
Patterson ES.Communication strategies from high‐reliability organizations.Ann Surg.2007;245(2):170–172.
Patterson ES, Roth EM, Woods DD, et al.Handoff strategies in settings with high consequences for failure: lessons for health care operations.Int J Qual Health Care.2004;16(2):125.