User login
Principles and Characteristics of an HMG
With the continuing growth of the specialty of hospital medicine, the capabilities and performance of hospital medicine groups (HMGs) varies significantly. There are few guidelines that HMGs can reference as tools to guide self‐improvement. To address this deficiency, the Society of Hospital Medicine (SHM) Board of Directors authorized a process to identify the key principles and characteristics of an effective HMG.
METHODS
Topic Development and Validation Prework
In providing direction to this effort, the SHM board felt that the principles and characteristics should be directed at both hospitals and hospitalists, addressing the full range of managerial, organizational, clinical, and quality activities necessary to achieve effectiveness. Furthermore, the board defined effectiveness as consisting of 2 components. First, the HMG must assure that the patients managed by hospitalists receive high‐quality care that is sensitive to their needs and preferences. Second, the HMG must understand that the central role of the hospitalist is to coordinate patient care and foster interdisciplinary communication across the care continuum to provide optimal patient outcomes.
The SHM board appointed an HMG Characteristics Workgroup consisting of individuals who have experience with a wide array of HMG models and who could offer expert opinions on the subject. The HMG Characteristics Workgroup felt it important to review the work of other organizations that develop and administer criteria, standards, and/or requirements for healthcare organizations. Examples cited were the American College of Surgeons[1]; The Joint Commission[2]; American Nurse Credentialing Center[3]; the National Committee for Quality Assurance[4]; the American Medical Group Association[5]; and the American Association of Critical‐Care Nurses.[6]
In March 2012 and April 2012, SHM staff reviewed the websites and published materials of these organizations. For each program, information was captured on the qualifications of applicants, history of the program, timing of administering the program, the nature of recognition granted, and the program's keys to success. The summary of these findings was shared with the workgroup.
Background research and the broad scope of characteristics to be addressed led to the workgroup's decision to develop the principles and characteristics using a consensus process, emphasizing expert opinion supplemented by feedback from a broad group of stakeholders.
Initial Draft
During April 2012 and May 2012, the HMG Characteristics Workgroup identified 3 domains for the key characteristics: (1) program structure and operations, (2) clinical care delivery, and (3) organizational performance improvement. Over the course of several meetings, the HMG Characteristics Workgroup developed an initial draft of 83 characteristics, grouped into 29 subgroups within the 3 domains.
From June 2012 to November 2012, this initial draft was reviewed by a broad cross section of the hospital medicine community including members of SHM's committees, a group of academic hospitalists, focus groups in 2 communities (Philadelphia and Boston), and the leaders of several regional and national hospitalist management companies. Quantitative and qualitative feedback was obtained.
In November 2012, the SHM Board of Directors held its annual leadership meeting, attended by approximately 25 national hospitalist thought leaders and chairpersons of SHM committees. At this meeting, a series of exercises were conducted in which these leaders of the hospital medicine movement, including the SHM board members, were each assigned individual characteristics and asked to review and edit them for clarity and appropriateness.
As a result of feedback at that meeting and subsequent discussion by the SHM board, the workgroup was asked to modify the characteristics in 3 ways. First, the list should be streamlined, reducing the number of characteristics. Second, the 3 domains should be eliminated, and a better organizing framework should be created. Third, additional context should be added to the list of characteristics.
Second Draft
During the period from November 2012 to December 2012, the HMG Characteristics Workgroup went through a 2‐step Delphi process to consolidate characteristics and/or eliminate characteristics that were redundant or unnecessary. In the first step, members of the workgroup rated each characteristic from 1 to 3. A rating of 1 meant not important; good quality, but not required for an effective HMG. A rating of 2 meant important; most effective HMGs will meet requirement. A rating of 3 meant highly important; mandatory for an effective HMG. In the second step, members of the workgroup received feedback on the scores for each characteristic and came to a consensus on which characteristics should be eliminated or merged with other characteristics.
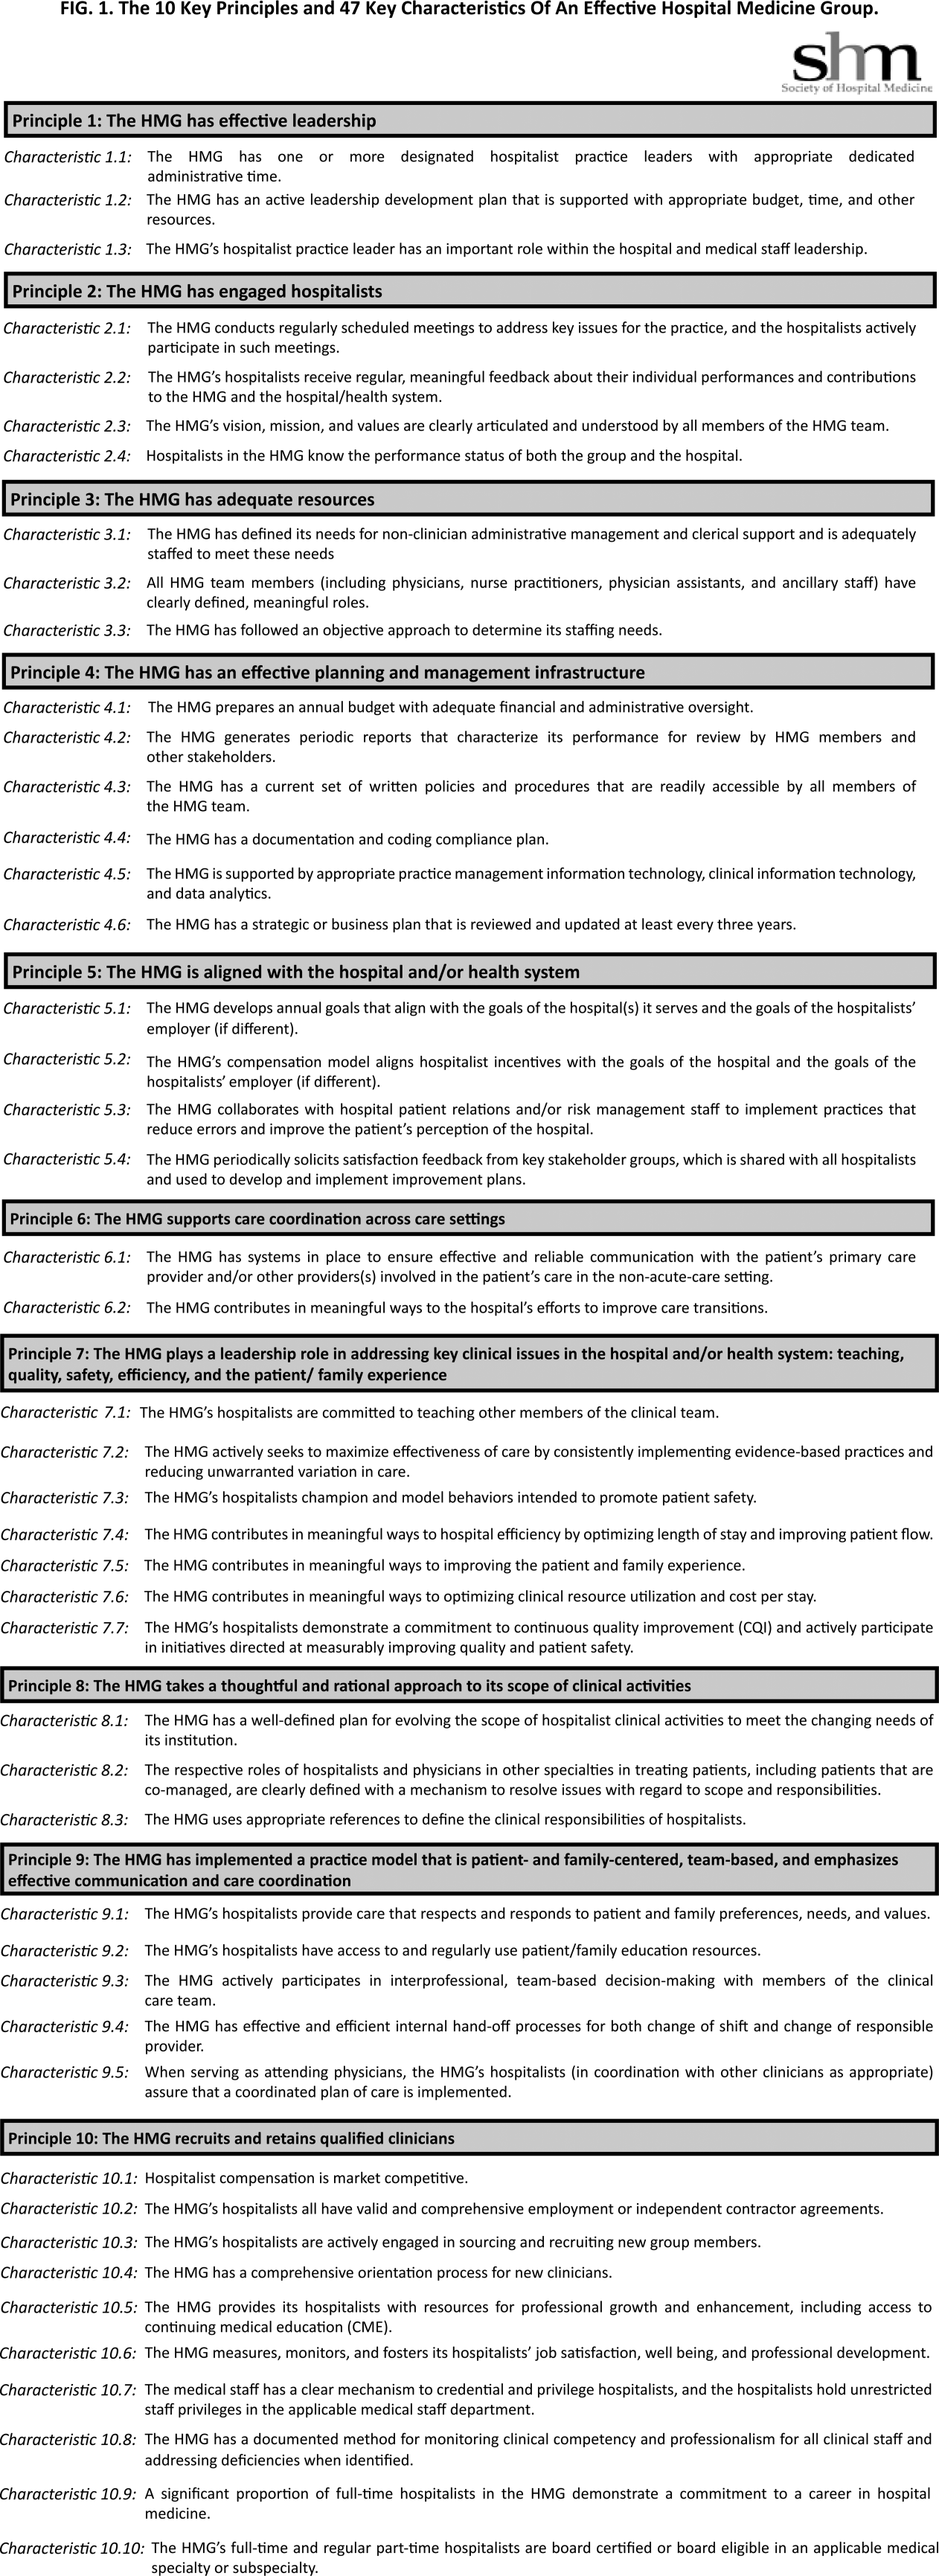
As a result, the number of characteristics was reduced and consolidated from 83 to 47, and a new framing structure was defined, replacing the 3 domains with 10 organizing principles. Finally, a rationale for each characteristic was added, defending its inclusion in the list. In addition, consideration was given to including a section describing how an HMG could demonstrate that their organization met each characteristic. However, the workgroup and the board decided that these demonstration requirements should be vetted before they were published.
From January 2013 to June 2013, the revised key principles and characteristics were reviewed by selected chairpersons of SHM committees and by 2 focus groups of HMG leaders. These reviews were conducted at the SHM Annual Meeting. Finally, in June 2013, the Committee on Clinical Leadership of the American Hospital Association reviewed and commented on the draft of the principles and characteristics.
In addition, based on feedback received from the reviewers, the wording of many of the characteristics went through revisions to assure precision and clarity. Before submission to the Journal of Hospital Medicine, a professional editor was engaged to assure that the format and language of the characteristics were clear and consistent.
Final Approval
The final draft of the 10 principles and 47 characteristics was approved for publication at a meeting of the SHM Board of Directors in September 2013 (Figure 1).

RESULTS
A recurring issue that the workgroup addressed was the applicability of the characteristics from 1 practice setting to another. Confounding factors include the HMG's employment/organizational model (eg, hospital employed, academic, multispecialty group, private practice, and management company), its population served (eg, adult vs pediatric, more than 1 hospital), and the type of hospital served (eg, academic vs community, the hospital has more than 1 HMG). The workgroup has made an effort to assure that all 47 characteristics can be applied to every type of HMG.
In developing the 10 principles, the workgroup attempted to construct a list of the basic ingredients needed to build and sustain an effective HMG. These 10 principles stand on their own, independent of the 47 key characteristics, and include issues such as effective leadership, clinician engagement, adequate resources, management infrastructure, key hospitalist roles and responsibilities, alignment with the hospital, and the recruitment and retention of qualified hospitalists.
A more detailed version of the Key Principles and Characteristics of an Effective HMG is available in the online version of this article (see Supporting Information, Appendix, in the online version of this article). The online Appendix includes the rationales for each of the characteristics, guidance on how to provide feedback to the SHM on the framework, and the SHM's plan for further development of the key principles and characteristics.
DISCUSSION
To address the variability in capabilities and performance of HMGs, these principles and characteristics are designed to provide a framework for HMGs seeking to conduct self‐assessments and develop pathways for improvement.
Although there may be HMG arrangements that do not directly involve the hospital and its executive team, and therefore alternative approaches may make sense, for most HMGs hospitals are directly involved with the HMG as either an employer or a contractor. For that reason, the Key Principles and Characteristics of an Effective HMG is written for 2 audiences: the executive leadership of the hospital (most specifically the chief medical officer or a similar role) and the hospitalists in the HMG (most specifically the practice medical director). To address the key characteristics requires the active participation of both parties. For the hospital executives, the framework establishes expectations for the HMG. For the hospitalists, the framework provides guidance in the development of an improvement plan.
Hospital executives and hospitalists can use the key characteristics in a broad spectrum of ways. The easiest and least formalized approach would be to use the framework as the basis of an ongoing dialogue between the hospital leadership and the HMG. A more formal approach would be to use the framework to guide the planning and budgeting activities of the HMG. Finally, a hospital or health system can use the key principles and characteristics as a way to evaluate their affiliated HMG(s)for example, the HMG must address 80% of the 47 characteristics.
The Key Principles and Characteristics of an Effective HMG should be considered akin to the Core Competencies in Hospital Medicine previously published in the Journal of Hospital Medicine.[7] However, instead of focusing on the competencies of individual physicians, this framework focuses on the characteristics of hospitalist groups. Just as a physician or other healthcare provider is not expected to demonstrate competency for every element in the core competencies document, an HMG does not need to have all 47 characteristics to be effective. Effective hospitalists may have skills other than those listed in the Core Competencies in Hospital Medicine. Similarly, the 47 characteristics do not represent an exhaustive list of every desirable HMG attribute. In general, effective HMGs should possess most of the characteristics.
In applying the framework, the HMG should not simply attempt to evaluate each characteristic with a yes or no assessment. For HMGs responding yes, there may be a wide range of performancefrom meeting the bare minimum requirements to employing sophisticated, expansive measures to excel in the characteristic.
SHM encourages hospital leaders and HMG leaders to use these characteristics to perform an HMG self‐assessment and to develop a plan. The plan could address implementation of selected characteristics that are not currently being addressed by the HMG or the development of additional behaviors, tools, resources, and capabilities that more fully incorporate those characteristics for which the HMG meets only minimum requirements. In addition, the plan could address the impact that a larger organization (eg, health system, hospital, or employer) may have on a given characteristic.
As outlined above, the process used to develop the Key Principles and Characteristics of an Effective HMG was grounded in expert opinion and extensive review and feedback. HMGs that use the framework should recognize that others might have a different opinion. For example, characteristic 5.2 states, The HMG's compensation model aligns hospitalist incentives with the goals of the hospital and the goals of the hospitalist's employer (if different). There are likely to be experienced hospitalist leaders who believe that an effective HMG does not need to have an incentive compensation system. However, the consensus process employed to develop the key characteristics led to the conclusion that an effective HMG should have an incentive compensation system.
The publication of the Key Principles and Characteristics of an Effective HMG may lead to negative and/or unintended consequences. A self‐assessment by an HMG using this framework could require a significant level of effort on behalf of the HMG, whereas implementing remedial efforts to address the characteristics could require an investment of time and money that could take away from other important issues facing the HMG. Many HMGs may be held accountable for addressing these characteristics without the necessary financial support from their hospital or medical group. Finally, the publication of the document could create a backlash from members of the hospitalist community who do not think that the SHM should be in the business of defining what characterizes an effective HMG, rather that this definition should be left to the marketplace.
Despite these concerns, the leadership of the SHM expects that the publication of the Key Principles and Characteristics of an Effective HMG will lead to overall improvement in the capabilities and performance of HMGs.
CONCLUSIONS
The Key Principles and Characteristics of an Effective HMG have been designed to be aspirational, helping to raise the bar for the specialty of hospital medicine. These principles and characteristics could provide a framework for HMGs seeking to conduct self‐assessments, outlining a pathway for improvement, and better defining the central role of hospitalists in coordinating team‐based, patient‐centered care in the acute care setting.
Acknowledgments
Disclosures: Patrick Cawley, MD: none; Steven Deitelzweig, MD: none; Leslie Flores, MHA: provides consulting to hospital medicine groups; Joseph A. Miller, MS: none; John Nelson, MD: provides consulting to hospital medicine groups; Scott Rissmiller, MD: none; Laurence Wellikson, MD: none; Winthrop F. Whitcomb, MD: provides consulting to hospital medicine groups.
- American College of Surgeons. New verification site visit outcomes. Available at: http://www.facs.org/trauma/verifivisitoutcomes.html. Accessed September 3, 2013.
- Hospital accreditation standards 2012. Oakbrook Terrace, IL: The Joint Commission; 2012. Available at: Amazon.com: http://www.amazon.com/Hospital‐Accreditation‐Standards‐Joint‐Commission/dp/1599404257
- The magnet model: components and sources of evidence. Silver Spring, MD: American Nurse Credentialing Center; 2011. Available at: Amazon.com: http://www.amazon.com/Magnet‐Model‐Components‐Sources‐Evidence/dp/1935213229.
- Patient Centered Medical Home Standards and Guidelines. National Committee for Quality Assurance. Available at: https://inetshop01.pub.ncqa.org/Publications/deptCate.asp?dept_id=21(suppl 1):2–95.
With the continuing growth of the specialty of hospital medicine, the capabilities and performance of hospital medicine groups (HMGs) varies significantly. There are few guidelines that HMGs can reference as tools to guide self‐improvement. To address this deficiency, the Society of Hospital Medicine (SHM) Board of Directors authorized a process to identify the key principles and characteristics of an effective HMG.
METHODS
Topic Development and Validation Prework
In providing direction to this effort, the SHM board felt that the principles and characteristics should be directed at both hospitals and hospitalists, addressing the full range of managerial, organizational, clinical, and quality activities necessary to achieve effectiveness. Furthermore, the board defined effectiveness as consisting of 2 components. First, the HMG must assure that the patients managed by hospitalists receive high‐quality care that is sensitive to their needs and preferences. Second, the HMG must understand that the central role of the hospitalist is to coordinate patient care and foster interdisciplinary communication across the care continuum to provide optimal patient outcomes.
The SHM board appointed an HMG Characteristics Workgroup consisting of individuals who have experience with a wide array of HMG models and who could offer expert opinions on the subject. The HMG Characteristics Workgroup felt it important to review the work of other organizations that develop and administer criteria, standards, and/or requirements for healthcare organizations. Examples cited were the American College of Surgeons[1]; The Joint Commission[2]; American Nurse Credentialing Center[3]; the National Committee for Quality Assurance[4]; the American Medical Group Association[5]; and the American Association of Critical‐Care Nurses.[6]
In March 2012 and April 2012, SHM staff reviewed the websites and published materials of these organizations. For each program, information was captured on the qualifications of applicants, history of the program, timing of administering the program, the nature of recognition granted, and the program's keys to success. The summary of these findings was shared with the workgroup.
Background research and the broad scope of characteristics to be addressed led to the workgroup's decision to develop the principles and characteristics using a consensus process, emphasizing expert opinion supplemented by feedback from a broad group of stakeholders.
Initial Draft
During April 2012 and May 2012, the HMG Characteristics Workgroup identified 3 domains for the key characteristics: (1) program structure and operations, (2) clinical care delivery, and (3) organizational performance improvement. Over the course of several meetings, the HMG Characteristics Workgroup developed an initial draft of 83 characteristics, grouped into 29 subgroups within the 3 domains.
From June 2012 to November 2012, this initial draft was reviewed by a broad cross section of the hospital medicine community including members of SHM's committees, a group of academic hospitalists, focus groups in 2 communities (Philadelphia and Boston), and the leaders of several regional and national hospitalist management companies. Quantitative and qualitative feedback was obtained.
In November 2012, the SHM Board of Directors held its annual leadership meeting, attended by approximately 25 national hospitalist thought leaders and chairpersons of SHM committees. At this meeting, a series of exercises were conducted in which these leaders of the hospital medicine movement, including the SHM board members, were each assigned individual characteristics and asked to review and edit them for clarity and appropriateness.
As a result of feedback at that meeting and subsequent discussion by the SHM board, the workgroup was asked to modify the characteristics in 3 ways. First, the list should be streamlined, reducing the number of characteristics. Second, the 3 domains should be eliminated, and a better organizing framework should be created. Third, additional context should be added to the list of characteristics.
Second Draft
During the period from November 2012 to December 2012, the HMG Characteristics Workgroup went through a 2‐step Delphi process to consolidate characteristics and/or eliminate characteristics that were redundant or unnecessary. In the first step, members of the workgroup rated each characteristic from 1 to 3. A rating of 1 meant not important; good quality, but not required for an effective HMG. A rating of 2 meant important; most effective HMGs will meet requirement. A rating of 3 meant highly important; mandatory for an effective HMG. In the second step, members of the workgroup received feedback on the scores for each characteristic and came to a consensus on which characteristics should be eliminated or merged with other characteristics.
As a result, the number of characteristics was reduced and consolidated from 83 to 47, and a new framing structure was defined, replacing the 3 domains with 10 organizing principles. Finally, a rationale for each characteristic was added, defending its inclusion in the list. In addition, consideration was given to including a section describing how an HMG could demonstrate that their organization met each characteristic. However, the workgroup and the board decided that these demonstration requirements should be vetted before they were published.
From January 2013 to June 2013, the revised key principles and characteristics were reviewed by selected chairpersons of SHM committees and by 2 focus groups of HMG leaders. These reviews were conducted at the SHM Annual Meeting. Finally, in June 2013, the Committee on Clinical Leadership of the American Hospital Association reviewed and commented on the draft of the principles and characteristics.
In addition, based on feedback received from the reviewers, the wording of many of the characteristics went through revisions to assure precision and clarity. Before submission to the Journal of Hospital Medicine, a professional editor was engaged to assure that the format and language of the characteristics were clear and consistent.
Final Approval
The final draft of the 10 principles and 47 characteristics was approved for publication at a meeting of the SHM Board of Directors in September 2013 (Figure 1).
RESULTS
A recurring issue that the workgroup addressed was the applicability of the characteristics from 1 practice setting to another. Confounding factors include the HMG's employment/organizational model (eg, hospital employed, academic, multispecialty group, private practice, and management company), its population served (eg, adult vs pediatric, more than 1 hospital), and the type of hospital served (eg, academic vs community, the hospital has more than 1 HMG). The workgroup has made an effort to assure that all 47 characteristics can be applied to every type of HMG.
In developing the 10 principles, the workgroup attempted to construct a list of the basic ingredients needed to build and sustain an effective HMG. These 10 principles stand on their own, independent of the 47 key characteristics, and include issues such as effective leadership, clinician engagement, adequate resources, management infrastructure, key hospitalist roles and responsibilities, alignment with the hospital, and the recruitment and retention of qualified hospitalists.
A more detailed version of the Key Principles and Characteristics of an Effective HMG is available in the online version of this article (see Supporting Information, Appendix, in the online version of this article). The online Appendix includes the rationales for each of the characteristics, guidance on how to provide feedback to the SHM on the framework, and the SHM's plan for further development of the key principles and characteristics.
DISCUSSION
To address the variability in capabilities and performance of HMGs, these principles and characteristics are designed to provide a framework for HMGs seeking to conduct self‐assessments and develop pathways for improvement.
Although there may be HMG arrangements that do not directly involve the hospital and its executive team, and therefore alternative approaches may make sense, for most HMGs hospitals are directly involved with the HMG as either an employer or a contractor. For that reason, the Key Principles and Characteristics of an Effective HMG is written for 2 audiences: the executive leadership of the hospital (most specifically the chief medical officer or a similar role) and the hospitalists in the HMG (most specifically the practice medical director). To address the key characteristics requires the active participation of both parties. For the hospital executives, the framework establishes expectations for the HMG. For the hospitalists, the framework provides guidance in the development of an improvement plan.
Hospital executives and hospitalists can use the key characteristics in a broad spectrum of ways. The easiest and least formalized approach would be to use the framework as the basis of an ongoing dialogue between the hospital leadership and the HMG. A more formal approach would be to use the framework to guide the planning and budgeting activities of the HMG. Finally, a hospital or health system can use the key principles and characteristics as a way to evaluate their affiliated HMG(s)for example, the HMG must address 80% of the 47 characteristics.
The Key Principles and Characteristics of an Effective HMG should be considered akin to the Core Competencies in Hospital Medicine previously published in the Journal of Hospital Medicine.[7] However, instead of focusing on the competencies of individual physicians, this framework focuses on the characteristics of hospitalist groups. Just as a physician or other healthcare provider is not expected to demonstrate competency for every element in the core competencies document, an HMG does not need to have all 47 characteristics to be effective. Effective hospitalists may have skills other than those listed in the Core Competencies in Hospital Medicine. Similarly, the 47 characteristics do not represent an exhaustive list of every desirable HMG attribute. In general, effective HMGs should possess most of the characteristics.
In applying the framework, the HMG should not simply attempt to evaluate each characteristic with a yes or no assessment. For HMGs responding yes, there may be a wide range of performancefrom meeting the bare minimum requirements to employing sophisticated, expansive measures to excel in the characteristic.
SHM encourages hospital leaders and HMG leaders to use these characteristics to perform an HMG self‐assessment and to develop a plan. The plan could address implementation of selected characteristics that are not currently being addressed by the HMG or the development of additional behaviors, tools, resources, and capabilities that more fully incorporate those characteristics for which the HMG meets only minimum requirements. In addition, the plan could address the impact that a larger organization (eg, health system, hospital, or employer) may have on a given characteristic.
As outlined above, the process used to develop the Key Principles and Characteristics of an Effective HMG was grounded in expert opinion and extensive review and feedback. HMGs that use the framework should recognize that others might have a different opinion. For example, characteristic 5.2 states, The HMG's compensation model aligns hospitalist incentives with the goals of the hospital and the goals of the hospitalist's employer (if different). There are likely to be experienced hospitalist leaders who believe that an effective HMG does not need to have an incentive compensation system. However, the consensus process employed to develop the key characteristics led to the conclusion that an effective HMG should have an incentive compensation system.
The publication of the Key Principles and Characteristics of an Effective HMG may lead to negative and/or unintended consequences. A self‐assessment by an HMG using this framework could require a significant level of effort on behalf of the HMG, whereas implementing remedial efforts to address the characteristics could require an investment of time and money that could take away from other important issues facing the HMG. Many HMGs may be held accountable for addressing these characteristics without the necessary financial support from their hospital or medical group. Finally, the publication of the document could create a backlash from members of the hospitalist community who do not think that the SHM should be in the business of defining what characterizes an effective HMG, rather that this definition should be left to the marketplace.
Despite these concerns, the leadership of the SHM expects that the publication of the Key Principles and Characteristics of an Effective HMG will lead to overall improvement in the capabilities and performance of HMGs.
CONCLUSIONS
The Key Principles and Characteristics of an Effective HMG have been designed to be aspirational, helping to raise the bar for the specialty of hospital medicine. These principles and characteristics could provide a framework for HMGs seeking to conduct self‐assessments, outlining a pathway for improvement, and better defining the central role of hospitalists in coordinating team‐based, patient‐centered care in the acute care setting.
Acknowledgments
Disclosures: Patrick Cawley, MD: none; Steven Deitelzweig, MD: none; Leslie Flores, MHA: provides consulting to hospital medicine groups; Joseph A. Miller, MS: none; John Nelson, MD: provides consulting to hospital medicine groups; Scott Rissmiller, MD: none; Laurence Wellikson, MD: none; Winthrop F. Whitcomb, MD: provides consulting to hospital medicine groups.
- American College of Surgeons. New verification site visit outcomes. Available at: http://www.facs.org/trauma/verifivisitoutcomes.html. Accessed September 3, 2013.
- Hospital accreditation standards 2012. Oakbrook Terrace, IL: The Joint Commission; 2012. Available at: Amazon.com: http://www.amazon.com/Hospital‐Accreditation‐Standards‐Joint‐Commission/dp/1599404257
- The magnet model: components and sources of evidence. Silver Spring, MD: American Nurse Credentialing Center; 2011. Available at: Amazon.com: http://www.amazon.com/Magnet‐Model‐Components‐Sources‐Evidence/dp/1935213229.
- Patient Centered Medical Home Standards and Guidelines. National Committee for Quality Assurance. Available at: https://inetshop01.pub.ncqa.org/Publications/deptCate.asp?dept_id=21(suppl 1):2–95.
HN‐Associated Healthcare Burden
Hyponatremia is an electrolyte disorder most commonly defined as a serum sodium concentration <135 mEq/L.1 Its exact definition can vary across studies, but typically ranges between <130 and <138 mEq/L.2, 3 Signs and symptoms of hyponatremia can include malaise, headache, disorientation, confusion, muscle weakness, and cramps. If severe, seizures, respiratory arrest, brainstem herniation, coma, and death may result.
The incidence of hyponatremia in the general hospitalized population has been reported to range between 1% and 6% when defined as <130135 mEq/L,4, 5 and its occurrence increases with a more prolonged hospital stay to 13%.6 A recent study reported that when hyponatremia was defined with a less stringent threshold of <138 mEq/L, the incidence at admission rose to 38%.3 Hyponatremia is a comorbid condition of multiple diseases, occurring in approximately 20% of patients with heart failure,7, 8 and 40% to 57% of patients with advanced cirrhosis.9, 10 The syndrome of the inappropriate release of antidiuretic hormone (SIADH) is additionally a predominant cause of hyponatremia, with a prevalence reported as high as 35% in hospitalized patients.11
Hyponatremia is not only widespread, but also an independent predictor of mortality. In a retrospective cohort analysis, Waikar et al reported that in comparison to patients who were normonatremic, patients with serum sodium concentrations <135 mEq/L had a risk of in‐hospital mortality as high as 47%, and that this risk doubled for patients with serum sodium concentrations between 125 and 129 mEq/L.6 In the study by Wald et al, which defined hyponatremia as <138 mEq/L, the risk of in‐hospital mortality was similar.3 In both of these studies, even mild hyponatremia (130137 mEq/L) was associated with increased risk of in‐hospital mortality.3, 6
The overall cost of hyponatremia is estimated to range between $1.6 and $3.6 billion for 2011.12, 13 Hospital readmissions are a significant contributor to total healthcare costs, with some being entirely avoidable with increased standards of care. The Centers for Medicare and Medicaid Services has begun to not only publicly report hospital readmission rates, but also penalize hospitals for early readmissions.14 Strategies to reduce hospital readmissions are currently being integrated into healthcare reform policy.14 In the present study, the incremental burden of hospitalized hyponatremic (HN) versus non‐HN patients in terms of hospital resource utilization, costs, and early hospital readmission in the real‐world was evaluated.
METHODS
Study Design
This study was a retrospective analysis that examined healthcare utilization and costs among HN patients using the Premier Hospital Database. The database contains over 310 million hospital encounters from more than 700 US hospitals, or 1 out of every 4 discharges in the US. The administrative data available included patient and provider demographics, diagnoses and procedures, as well as date‐stamped billing records for all pharmacy, laboratory, imaging, procedures, and supplies.
Patient Selection and Matching
HN patients were eligible for study inclusion if they were a hospital inpatient discharged between January 1, 2007 and March 31, 2010, were >18 years of age at admission, and had either a primary or secondary diagnosis of hyponatremia or hyposmolality (defined as International Classification of Diseases, Ninth Revision (ICD‐9‐CM) code: 276.1x). Patients were excluded if they had been transferred from another acute care facility, transferred to another acute care or critical access facility, or left against medical advice. Labor and delivery patients (ICD‐9‐CM codes: 72.xx‐74.xx, V22.x, V23.x, V27.x, and V28.x), and patients classified as observational were also excluded. A second cohort of non‐hyponatremic patients was created using the same inclusion and exclusion criteria, with the exception that patients not have a primary or secondary diagnosis of hyponatremia or hyposmolality (defined as ICD‐9‐CM code: 276.1x).
The matching of hyponatremia (HN) and control (non‐HN) cohorts was accomplished using a combination of exact and propensity score matching techniques. Patients were first exact matched on age, gender, Medicare Severity‐Diagnosis Related Group (MS‐DRG) assignment, and hospital geographic region. Propensity score matching was further utilized to create the final study cohorts for outcomes comparisons. Propensity score matching is commonly used in retrospective cohort studies to correct for sample selection bias due to observable differences between groups.15, 16 The propensity score was generated using logistic regression with the dependent variable as hyponatremia (yes vs no) and the following covariates: age, race, admission source, attending physician specialty, 3M All Patient Refined‐Diagnosis Related Group (APR‐DRG) Severity of Illness and Risk of Mortality index scores, Deyo‐Charlson Comorbidity Index score, selected hyponatremia‐related comorbidity conditions, and hospital size, region, and urban/rural designation. These covariates were initially selected by an expert panel of physicians, and backward selection was utilized in the logistic regression using the most parsimonious model.17
Following generation of the propensity scores, HN patients were matched to non‐HN patients 1:1 using a nearest neighbor matching algorithm, including hospital identification and propensity score.18 Inclusion of hospital identification in the matching sequence, as well as provider characteristics, especially hospital size, attending physician specialty, and geographic region in the propensity score, was used to control for potential clustering effects at the physician and hospital level.19 During the propensity score matching process, likelihood‐ratio test, Hosmer‐Lemshow goodness of fit, and concordance c statistics were utilized to assess the fitness of the models.20 The final propensity score model produced a concordance c statistic of 0.8.
Outcome Measures and Statistical Analyses
The following outcome measures were compared between the matched HN and non‐HN patient cohorts: total and intensive care unit (ICU) hospitalization costs, total and ICU length of stay (LOS), ICU admission, and 30‐day hospital readmission. Bivariate descriptive statistics were employed to test for significant differences in demographics, patient clinical characteristics, and unadjusted costs and healthcare resource utilization and readmission rates between patient cohorts. To detect statistically significant differences in continuous and categorical variables, respectively, t tests and chi‐square tests were performed.
Multivariate analysis of outcome measures utilized generalized linear models. Due to the skewed nature of LOS and cost data, LOS was analyzed using multivariate negative binomial regression and cost was analyzed using multivariate gamma regression.21 Binary outcomes (ICU admission and 30‐day readmission) were analyzed using multivariate logistic regression. The analysis accounted for potential confounding factors by inclusion of the following covariates: age group, gender, race, admission source, and Deyo‐Charlson Comorbidity Index score. These covariates were previously identified in the Wald et al hyponatremia study,3 and were verified using likelihood‐ratio, Hosmer‐Lemshow goodness of fit, and concordance c statistics.
Subgroup Sensitivity Analysis
For the subgroup sensitivity analyses, patients were identified as having community‐acquired pneumonia (CAP), congestive heart failure (CHF), urinary tract infection (UTI), or chronic obstructive pulmonary disease (COPD) based upon principal diagnosis codes. Patients were categorized according to these subgroup definitions, and then previously matched patients with the same subgroup classification constituted the final analysis set for each subgroup. The methods that were used for the overall matched analysis were then applied to each subgroup to evaluate the incremental burden of overall cost and LOS associated with hyponatremia.
RESULTS
Patient Population
Of the 606,057 HN patients eligible for matching, a total of 558,815 HN patients were matched to 558,815 non‐HN patients, a 92% match ratio. Table 1 describes the overall characteristics of the patient populations. For both cohorts, median age was 70 years, 57% of patients were female, and approximately 67% were white. The majority of patients in either cohort had Medicare coverage (55%), and approximately 75% of patients entered the hospital via the emergency room with nearly 70% having a 3M APR‐DRG disease severity level of major or extreme. Patients of both cohorts were most often attended by an internist or a hospitalist, with a combined percentage of approximately 60%. A small, but greater proportion of HN patients had comorbidities of cancer, pulmonary disease, and SIADH. Comorbid conditions of liver cirrhosis/hepatic disease and human immunodeficiency virus (HIV) were similarly distributed among both patient cohorts.
| Hyponatremic | Non‐Hyponatremic | |
|---|---|---|
| Discharges N (%) | Discharges N (%) | |
| ||
| Sample Discharges | 558,815 (100.0%) | 558,815 (100.0%) |
| Age median (IQR) | 70.00 (57.081.0) | 70.00 (57.081.0) |
| Gender | ||
| Female | 319,069 (57.1%) | 319,069 (57.1%) |
| Male | 239,746 (42.9%) | 239,746 (42.9%) |
| Race | ||
| American Indian | 3,465 (0.6%) | 3,448 (0.6%) |
| Asian/Pacific | 10,065 (1.8%) | 9,690 (1.7%) |
| Black | 63,776 (11.4%) | 66,233 (11.9%) |
| Hispanic | 24,341 (4.4%) | 24,426 (4.4%) |
| White | 377,434 (67.5%) | 376,639 (67.4%) |
| Other/unknown | 79,734 (14.3%) | 78,379 (14.0%) |
| Primary payer | ||
| Medicaretraditional | 310,312 (55.5%) | 310,643 (55.6%) |
| Managed care | 75,476 (13.5%) | 78,184 (14.0%) |
| Medicaremanaged care | 45,439 (8.1%) | 47,947 (8.6%) |
| Non‐cap | ||
| Medicaid | 44,690 (8.0%) | 43,767 (7.8%) |
| Other | 82,898 (14.8%) | 78,274 (14.0%) |
| Admission source | ||
| Physician referral | 5,022 (0.9%) | 4,636 (0.8%) |
| Transfer from another nonacute health facility | 18,031 (3.2%) | 18,163 (3.3%) |
| Emergency room | 417,556 (74.7%) | 420,401 (75.2%) |
| Other/unknown | 118,206 (21.2%) | 115,615 (20.7%) |
| APR‐DRG severity of illness | ||
| 1Minor | 14,257 (2.6%) | 12,993 (2.3%) |
| 2Moderate | 174,859 (31.3%) | 179,356 (32.1%) |
| 3Major | 263,814 (47.2%) | 265,422 (47.5%) |
| 4Extreme | 105,885 (19.0%) | 101,044 (18.1%) |
| Attending physician specialty | ||
| Internal Medicine | 235,628 (42.1%) | 240,875 (43.1%) |
| Hospitalist | 88,250 (15.8%) | 87,720 (15.7%) |
| Family Practice (FP) | 73,346 (13.1%) | 72,828 (13.0%) |
| Orthopedic Surgery (ORS) | 23,595 (4.2%) | 22,949 (4.1%) |
| Cardiovascular Diseases (CD) | 19,521 (3.5%) | 18,057 (3.2%) |
| Comorbidities | ||
| Human immunodeficiency virus | 3,971 (0.7%) | 4,018 (0.7%) |
| Cancer/neoplasm/malignancy | 107,851 (19.3%) | 105,199 (18.8%) |
| Pulmonary disease | 77,849 (13.9%) | 77,184 (13.8%) |
| Cirrhosis/hepatic disease | 23,038 (4.1%) | 23,418 (4.2%) |
| SIADH | 1,972 (0.4%) | 1,278 (0.2%) |
| Subgroup populations | ||
| Community‐acquired pneumonia | 26,291 (4.7%) | 26,291 (4.7%) |
| Congestive heart failure | 23,020 (4.1%) | 23,020 (4.1%) |
| Urinary tract infection | 14,238 (2.6%) | 14,238 (2.6%) |
| COPD | 8,696 (1.6%) | 8,696 (1.6%) |
| CCI median (IQR) | 3.0 (1.05.0) | 3.0 (1.05.0) |
| No. of premier hospitals | 459 | |
| Provider region | ||
| East North Central | 78,332 (14.0%) | 78,332 (14.0%) |
| East South Central | 32,122 (5.8%) | 32,122 (5.8%) |
| Middle Atlantic | 73,846 (13.2%) | 73,846 (13.2%) |
| Mountain | 23,761 (4.3%) | 23,761 (4.3%) |
| New England | 9,493 (1.7%) | 9,493 (1.7%) |
| Pacific | 73,059 (13.1%) | 73,059 (13.1%) |
| South Atlantic | 175,194 (31.4%) | 175,194 (31.4%) |
| West North Central | 37,913 (6.8%) | 37,913 (6.8%) |
| West South Central | 55,095 (9.9%) | 55,095 (9.9%) |
| Population served | ||
| Rural | 69,749 (12.5%) | 68,414 (12.2%) |
| Urban | 489,066 (87.5%) | 490,401 (87.8%) |
| Teaching status | ||
| Non‐teaching | 337,620 (60.4%) | 337,513 (60.4%) |
| Teaching | 221,195 (39.6%) | 221,302 (39.6%) |
| No. of hospital beds | ||
| 699 | 22,067 (4.0%) | 21,777 (3.9%) |
| 100199 | 57,367 (10.3%) | 56,097 (10.0%) |
| 200299 | 87,563 (15.7%) | 86,639 (15.5%) |
| 300499 | 218,834 (39.2%) | 220,248 (39.4%) |
| 500+ | 172,984 (31.0%) | 174,054 (31.2%) |
Hospital Characteristics
Patient cohorts had similar distributions with respect to hospital characteristics (Table 1). Approximately 30% of patients were provided care from hospitals located in the South Atlantic region, and between 10% and 15% were serviced from hospitals in the East North Central, Middle Atlantic, Pacific, and West South Central regions. Most hospitals providing care for patient cohorts served urban populations (88%) and were large, with hospital bed numbers 300. Approximately 60% of hospitals were non‐teaching hospitals.
Healthcare Utilization, Readmission, and Cost Differences Among Patient Cohorts
The mean LOS (8.8 10.3 vs 7.7 8.5, P < 0.001), a difference of 1.1 days and mean ICU LOS (5.5 7.9 vs 4.9 7.1 days, P < 0.001), a difference of 0.6 days were significantly greater for the HN cohort in comparison to the non‐HN cohort (Table 2). The increase in healthcare resource utilization of patients with HN was reflected in their significantly higher mean total hospital costs per admission ($15,281 $24,054 vs $13,439 $22,198, P < 0.001), a difference of $1842; and mean costs incurred in the ICU ($8525 $13,342 vs $7597 $12,695, P < 0.001), a difference of $928 (Table 2). Furthermore, patients in the HN cohort were significantly more likely to be readmitted to the hospital for any cause (17.5% vs 16.4%, P < 0.001) (Table 2).
| Hyponatremic | Non‐Hyponatremic | P Value | |
|---|---|---|---|
| |||
| Total LOS (mean SD) | 8.8 10.3 | 7.7 8.5 | <0.001 |
| Total hospitalization cost (mean SD) | $15,281 $24,054 | $13,439 $22,198 | <0.001 |
| ICU admission (N, %) | 129,235 (23.1%) | 123,502 (22.1%) | <0.001 |
| ICU LOS (mean SD) | 5.5 7.9 | 4.9 7.1 | <0.001 |
| ICU cost (mean SD) | $8,525 $13,342 | $7,597 $12,695 | <0.001 |
| 30‐Day all cause readmission (N, %) | 96,063 (17.5%) | 87,058 (16.4%) | <0.001 |
Multivariate Analysis
Multivariate analysis demonstrated hyponatremia was associated with an increase in mean hospital LOS of 10.9%, [95% confidence interval: 10.4%11.5%], (P < 0.0001) and an increase in mean total hospital costs of 8.2%, [7.4%9.0%], (P < 0.0001) (Table 3). Additionally, hyponatremia was associated with an increase in ICU LOS of 10.2%, [8.7%11.8%], (P < 0.0001), and a higher ICU cost of 8.9%, [7.2%10.7%], (P < 0.0001) (Table 3). Hyponatremia was not associated with a greater likelihood of ICU admission (odds ratio = 1.0; [1.01.0], P =.5760). However, the condition was associated with a significantly greater chance of hospital readmission (odds ratio = 1.2, [1.11.2], P < 0.0001) within 30 days postdischarge (Table 3).
| Overall Cohort N = 1,117,630 | CAP N = 52,582 | CHF N = 46,040 | UTI N = 28,746 | COPD N = 17,392 | |
|---|---|---|---|---|---|
| |||||
| Total LOS difference | 10.9% [10.4%, 11.5%] P < 0.0001 | 5.4% [4.4%, 6.5%] P < 0.0001 | 20.6% [19.0%, 22.2%] P < 0.0001 | 2.7% [1.2%, 4.2%] P = 0.0003 | 6.7% [4.8%, 8.5%] P < 0.0001 |
| Total cost difference | 8.2% [7.4%, 9.0%] P < 0.0001 | 5.6% [4.0%, 7.0%] P < 0.0001 | 19.2% [17.1%, 21.4%] P < 0.0001 | 2.2% [1.4%, 4.4%] P = 0.0582 | 5.6% [3.0%, 8.2%] P < 0.0001 |
| ICU admission* odds ratio | 1.0 [1.0, 1.0] P = 0.5760 | 1.0 [1.0, 1.1] P = 0.8363 | 1.2 [1.1, 1.3] P < 0.0001 | 1.2 [1.1, 1.3] P = 0.0038 | 1.0 [0.9, 1.1] P = 0.5995 |
| ICU LOS difference | 10.2% [8.7%, 11.8%] P < 0.0001 | 8.4% [3.4%, 13.7%] P = 0.0008 | 24.8% [19.9%, 29.9%] P < 0.0001 | 4.9% [4.0%, 14.7%] P = 0.2893 | 10.1% [1.5%, 19.3%] P = 0.0204 |
| ICU cost difference | 8.9% [7.2%, 10.7%] P < 0.0001 | 8.2% [2.7%, 14.0%] P = 0.0029 | 24.1% [18.9%, 29.7%] P < 0.0001 | 2.8% [6.7%, 13.4%] P = 0.5739 | 8.4% [0.6%, 18.1%] P = 0.6680 |
| 30‐Day readmission odds ratio | 1.2 [1.1, 1.2] P < 0.0001 | 1.0 [0.9, 1.0] P = 0.5141 | 1.1 [1.1, 1.2] P < 0.0001 | 1.0 [1.0, 1.1] P = 0.5211 | 1.0 [1.0, 1.1] P = 0.6119 |
Subgroup Sensitivity Analyses
For patients with CAP (n = 52,582), CHF (n = 46,040), a UTI (n = 28,476), or COPD (n = 17,392), the percent increases in LOS and all cause hospitalization cost of the HN cohort in comparison to the non‐HN cohort were 5.4% (P < 0.0001) and 5.6% (P < 0.0001), 20.6% (P < 0.0001) and 19.2% (P < 0.0001), 2.7% (P = 0.0003) and 2.2% (P = 0.0582), and 6.7% (P < 0.0001) and 5.6% (P < 0.0001), respectively (Table 3).
DISCUSSION
This large‐scale, real‐world hospital database study provides healthcare utilization and cost data on the largest population of HN patients that has currently been studied. The results of this study are consistent with others in showing that HN patients use healthcare services more extensively, and represent a patient population which is more expensive to treat in the inpatient setting.5, 22 Additionally, this study yields new findings in that patients in the real‐world with hyponatremia resulting from various etiologies are more likely to be readmitted to the hospital than patients with similar demographics and characteristics who do not have hyponatremia. The results of the subgroup analysis were generally consistent with the results for the overall matched population, as the incremental burden estimates were directionally consistent. However, among the specific subgroups of patients, although it appears that hyponatremia is predictive of hospital readmission in patients with CHF, it did not necessarily correspond with hospital readmission rates among patients with CAP, UTI, or COPD. Therefore, hyponatremia, at least for patients with these latter conditions, may not be predictive of readmission, but remains associated with increased healthcare utilization during the initial hospitalization. Further evaluation of the incremental burden of hyponatremia among patients with specific disease conditions is needed to validate the findings.
The difference in hospital LOS at first admission between HN and non‐HN patients in this study was 1.1 days, and comparable to that reported by Shorr et al.23 In the study by Shorr et al, patients hospitalized for congestive heart failure (CHF), who were HN, had a 0.5 day increased LOS, and those who were severely HN had a 1.3 day increased LOS.23 Two other retrospective cohort analyses reported a 1.4 day5 and 2.0 day22 increased LOS for HN patients in comparison to non‐HN patients. Zilberberg et al and Callahan et al additionally reported that HN patients had a significantly greater need for ICU (4%10%).5, 22 In the present study, LOS in the ICU and associated costs were also compared among HN and non‐HN cohorts and, after adjustment for key patient characteristics, hyponatremia was associated with an incremental increase of 10.2% for ICU LOS and an 8.9% increase in ICU cost.
In this study, patients with hyponatremia of any severity were found to have a mean increase in hospital cost per admission of $1842, with multivariate analysis demonstrating an associated incremental increase of 8.2%. These results are also comparable to that reported in other retrospective cohort analyses. Shorr et al reported that in‐hospital costs attributed to hyponatremia were $509, and for severe hyponatremia were $1132.23 Callahan et al reported a $1200 increase in costs per admission for patients with mild‐to‐moderate hyponatremia, and a $3540 increase for patients with moderate‐to‐severe hyponatremia, in comparison to non‐HN patients.22
The Institute for Healthcare Improvement reports that hospitalizations account for nearly one‐third of the $882 billion spent on healthcare in the US in 2011, and that a substantial fraction of all hospitalizations are readmissions.13, 24 A recent meta‐analysis of 30‐day hospital readmission rates found 23.1% were classified as avoidable.25 Readmission rates of HN patients in comparison to non‐HN patients have been reported in 3 other studies, all of which were conducted on clinical trial patients with heart failure.7, 8, 26 Two of these studies, which evaluated only patients with acute class IV heart failure,8, 26 reported that hyponatremia was associated with a significant increase in readmission rates (up to 20% higher), and the other, which evaluated any patients hospitalized for heart failure, did not.7 The differences there may be partially attributed to the differences in heart failure severity among patient populations, as hyponatremia is an independent predictor of worsening heart failure. The only published study to date on the influence of hyponatremia on readmission rates in the real‐world was conducted by Scherz et al, who reported that the co‐occurrence of hyponatremia in patients with acute pulmonary embolism, discharged from 185 hospitals in Pennsylvania, was independently associated with an increased readmission rate of 19.3%.27 In the present study, hyponatremia was associated with an incremental increase ranging between 14% and 17% for hospital readmission for any cause. It was conducted on a patient population in which hyponatremia was resultant from many causes, and not all patients had a serious comorbid condition. Also, the HN and non‐HN cohorts were matched for comorbidity prevalence and disease severity, and in other studies they were not. Therefore, the results of this study importantly imply that hyponatremia, whether it is resultant from a serious disease or any other cause substantially increases the healthcare burden. The implementation of strategies to prevent hospital readmissions may play an important role in reducing the healthcare burden of hyponatremia, and future studies are warranted to evaluate this hypothesis alongside evaluation of the outpatient hyponatremia burden.
The limitations of this study include, firstly, that it is only representative of inpatient hospital costs, and excludes outpatient healthcare utilization and costs. Secondly, this study utilized the Premier Hospital Database for patient selection, and laboratory testing data for serum sodium level are not available in this database; therefore, the severity of hyponatremia could not be accurately established in the HN patient population. Thirdly, the occurrence of hyponatremia in patients with some diseases is a marker of disease severity, as is the case with congestive heart failure and cirrhosis.23, 28 Our study did not adjust for the specific disease (eg, CHF) severity, which may influence the results. Future research is needed to evaluate the impact of hyponatremia on underlying disease severity of other diseases, and how its co‐occurrence may influence healthcare resource utilization and cost in each case. Although the Premier Hospital Database contains information from a large number of hospitals across the US, it is possible that it may not be representative of the entire US population of HN patients. Additionally, billing and coding errors and missing data could potentially have occurred, although the large patient population size likely precludes a large impact on the results of this study. Finally, the frequency of use of fluid restriction in these hospital settings could not be chronicled, thus limiting the ability to assess therapies and treatment modalities in use.
Acknowledgements
The authors acknowledge Melissa Lingohr‐Smith from Novosys Health in the editorial support and review of this manuscript.
Disclosures: This research was supported by Otsuka America Pharmaceutical, Inc, Princeton, NJ, which manufactures tolvaptan for the treatment of hyponatremia. Drs Amin and Deitelzweig are consultants for, and have received honoraria from, Otsuka America Pharmaceutical in connection with conducting this study. Drs Christian and Friend are employees of Otsuka America Pharmaceutical. Dr Lin is an employee of Novosys Health, which has received research funds from Otsuka America Pharmaceutical in connection with conducting this study and development of this manuscript. D. Baumer and Dr. Lowe are employees of Premier Inc, which has received research funds from Otsuka America Pharmaceutical. K. Belk was previously employed with Premier Inc.
- ,,.Management of hyponatremia: providing treatment and avoiding harm.Cleve Clin J Med.2010;77(10):715–726.
- ,,.Causes and management of hyponatremia.Ann Pharmacother.2003;37(11):1694–1702.
- ,,,,.Impact of hospital‐associated hyponatremia on selected outcomes.Arch Intern Med.2010;170(3):294–302.
- ,,,.Hyponatremia: a prospective analysis of its epidemiology and the pathogenetic role of vasopressin.Ann Intern Med.1985;102(2):164–168.
- ,,, et al.Epidemiology, clinical and economic outcomes of admission hyponatremia among hospitalized patients.Curr Med Res Opin.2008;24(6):1601–1608.
- ,,.Mortality after hospitalization with mild, moderate, and severe hyponatremia.Am J Med.2009;122(9):857–865.
- ,,, et al.Relationship between admission serum sodium concentration and clinical outcomes in patients hospitalized for heart failure: an analysis from the OPTIMIZE‐HF registry.Eur Heart J.2007;28(8):980–988.
- ,,, et al.Characterization and prognostic value of persistent hyponatremia in patients with severe heart failure in the ESCAPE Trial.Arch Intern Med.2007;167(18):1998–2005.
- ,,,.Hyponatremia in cirrhosis: results of a patient population survey.Hepatology.2006;44(6):1535–1542.
- ,,, et al.Hyponatremia in cirrhosis: from pathogenesis to treatment.Hepatology.1998;28(3):851–864.
- ,,,,.The syndrome of inappropriate antidiuresis: pathophysiology, clinical management and new therapeutic options.Nephron Clin Pract.2011;119(1):c62–c73.
- ,,.Cost of illness of hyponatremia in the United States.Cost Eff Resour Alloc.2006;4:10.
- US Health Care Budget: US Budget Breakdown for FY12—Charts. Available at: http://www.usgovernmentspending.com/health_care_budget_2012_1.html. Accessed December 19, 2011.
- 111th Congress. Patient Protection and Affordable Care Act. Public Law 111–148.1–906.
- .An evaluation of statistical matching.JBES.1984;2(1):91–102.
- ,.Propensity score‐matching methods for nonexperimental causal studies.Rev Econ Stat.2002;84(1):151–161.
- . Applied Logistic Regression Analysis. Quantitative Applications in the Social Sciences, Vol106.2nd ed.Thousand Oaks, CA:Sage;2002.
- .Reducing bias in a propensity score matched‐pair sample using greedy matching techniques. Paper presented at: Proceedings of the Twenty‐Sixth Annual SAS Users Group International Conference; April 22–25,2001; Long Beach, CA.
- ,,,,.The effect of clustering of outcomes on the association of procedure volume and surgical outcomes.Ann Intern Med.2003;139(8):658–665.
- .Regression Modeling Strategies: With Applications to Linear Models, Logistic Regression, and Survival Analysis.New York, NY:Springer‐Verlag,2001.
- ,,.Generalized Modeling Approaches to Risk Adjustment of Skewed Outcomes Data.Cambridge, MA:National Bureau of Economic Research, Inc;2003.
- ,,,.Economic impact of hyponatremia in hospitalized patients: a retrospective cohort study.Postgrad Med.2009;121(2):186–191.
- ,,, et al.Burden of sodium abnormalities in patients hospitalized for heart failure.Congest Heart Fail.2011;17(1):1–7.
- Institute for Healthcare Improvement. Reduce Avoidable Hospital Readmissions. Available at: http://www.ihi.org/explore/readmissions/Pages/default.aspx. Accessed December 18, 2011.
- ,,.A meta‐analysis of hospital 30‐day avoidable readmission rates.J Eval Clin Pract.2011 Nov 9. doi: 10.1111/j.1365–2753.2011.01773.x. Published online August 17, 2012.
- ,,, et al.Critical elements of clinical follow‐up after hospital discharge for heart failure: insights from the EVEREST trial.Eur J Heart Fail.2010;12(4):367–374.
- ,,, et al.Prognostic importance of hyponatremia in patients with acute pulmonary embolism.Am J Respir Crit Care Med.2010;182(9):1178–1183.
- ,,, et al.Serum sodium predicts prognosis in critically ill cirrhotic patients.J Clin Gastroenterol.2010;44(3):220–226.
Hyponatremia is an electrolyte disorder most commonly defined as a serum sodium concentration <135 mEq/L.1 Its exact definition can vary across studies, but typically ranges between <130 and <138 mEq/L.2, 3 Signs and symptoms of hyponatremia can include malaise, headache, disorientation, confusion, muscle weakness, and cramps. If severe, seizures, respiratory arrest, brainstem herniation, coma, and death may result.
The incidence of hyponatremia in the general hospitalized population has been reported to range between 1% and 6% when defined as <130135 mEq/L,4, 5 and its occurrence increases with a more prolonged hospital stay to 13%.6 A recent study reported that when hyponatremia was defined with a less stringent threshold of <138 mEq/L, the incidence at admission rose to 38%.3 Hyponatremia is a comorbid condition of multiple diseases, occurring in approximately 20% of patients with heart failure,7, 8 and 40% to 57% of patients with advanced cirrhosis.9, 10 The syndrome of the inappropriate release of antidiuretic hormone (SIADH) is additionally a predominant cause of hyponatremia, with a prevalence reported as high as 35% in hospitalized patients.11
Hyponatremia is not only widespread, but also an independent predictor of mortality. In a retrospective cohort analysis, Waikar et al reported that in comparison to patients who were normonatremic, patients with serum sodium concentrations <135 mEq/L had a risk of in‐hospital mortality as high as 47%, and that this risk doubled for patients with serum sodium concentrations between 125 and 129 mEq/L.6 In the study by Wald et al, which defined hyponatremia as <138 mEq/L, the risk of in‐hospital mortality was similar.3 In both of these studies, even mild hyponatremia (130137 mEq/L) was associated with increased risk of in‐hospital mortality.3, 6
The overall cost of hyponatremia is estimated to range between $1.6 and $3.6 billion for 2011.12, 13 Hospital readmissions are a significant contributor to total healthcare costs, with some being entirely avoidable with increased standards of care. The Centers for Medicare and Medicaid Services has begun to not only publicly report hospital readmission rates, but also penalize hospitals for early readmissions.14 Strategies to reduce hospital readmissions are currently being integrated into healthcare reform policy.14 In the present study, the incremental burden of hospitalized hyponatremic (HN) versus non‐HN patients in terms of hospital resource utilization, costs, and early hospital readmission in the real‐world was evaluated.
METHODS
Study Design
This study was a retrospective analysis that examined healthcare utilization and costs among HN patients using the Premier Hospital Database. The database contains over 310 million hospital encounters from more than 700 US hospitals, or 1 out of every 4 discharges in the US. The administrative data available included patient and provider demographics, diagnoses and procedures, as well as date‐stamped billing records for all pharmacy, laboratory, imaging, procedures, and supplies.
Patient Selection and Matching
HN patients were eligible for study inclusion if they were a hospital inpatient discharged between January 1, 2007 and March 31, 2010, were >18 years of age at admission, and had either a primary or secondary diagnosis of hyponatremia or hyposmolality (defined as International Classification of Diseases, Ninth Revision (ICD‐9‐CM) code: 276.1x). Patients were excluded if they had been transferred from another acute care facility, transferred to another acute care or critical access facility, or left against medical advice. Labor and delivery patients (ICD‐9‐CM codes: 72.xx‐74.xx, V22.x, V23.x, V27.x, and V28.x), and patients classified as observational were also excluded. A second cohort of non‐hyponatremic patients was created using the same inclusion and exclusion criteria, with the exception that patients not have a primary or secondary diagnosis of hyponatremia or hyposmolality (defined as ICD‐9‐CM code: 276.1x).
The matching of hyponatremia (HN) and control (non‐HN) cohorts was accomplished using a combination of exact and propensity score matching techniques. Patients were first exact matched on age, gender, Medicare Severity‐Diagnosis Related Group (MS‐DRG) assignment, and hospital geographic region. Propensity score matching was further utilized to create the final study cohorts for outcomes comparisons. Propensity score matching is commonly used in retrospective cohort studies to correct for sample selection bias due to observable differences between groups.15, 16 The propensity score was generated using logistic regression with the dependent variable as hyponatremia (yes vs no) and the following covariates: age, race, admission source, attending physician specialty, 3M All Patient Refined‐Diagnosis Related Group (APR‐DRG) Severity of Illness and Risk of Mortality index scores, Deyo‐Charlson Comorbidity Index score, selected hyponatremia‐related comorbidity conditions, and hospital size, region, and urban/rural designation. These covariates were initially selected by an expert panel of physicians, and backward selection was utilized in the logistic regression using the most parsimonious model.17
Following generation of the propensity scores, HN patients were matched to non‐HN patients 1:1 using a nearest neighbor matching algorithm, including hospital identification and propensity score.18 Inclusion of hospital identification in the matching sequence, as well as provider characteristics, especially hospital size, attending physician specialty, and geographic region in the propensity score, was used to control for potential clustering effects at the physician and hospital level.19 During the propensity score matching process, likelihood‐ratio test, Hosmer‐Lemshow goodness of fit, and concordance c statistics were utilized to assess the fitness of the models.20 The final propensity score model produced a concordance c statistic of 0.8.
Outcome Measures and Statistical Analyses
The following outcome measures were compared between the matched HN and non‐HN patient cohorts: total and intensive care unit (ICU) hospitalization costs, total and ICU length of stay (LOS), ICU admission, and 30‐day hospital readmission. Bivariate descriptive statistics were employed to test for significant differences in demographics, patient clinical characteristics, and unadjusted costs and healthcare resource utilization and readmission rates between patient cohorts. To detect statistically significant differences in continuous and categorical variables, respectively, t tests and chi‐square tests were performed.
Multivariate analysis of outcome measures utilized generalized linear models. Due to the skewed nature of LOS and cost data, LOS was analyzed using multivariate negative binomial regression and cost was analyzed using multivariate gamma regression.21 Binary outcomes (ICU admission and 30‐day readmission) were analyzed using multivariate logistic regression. The analysis accounted for potential confounding factors by inclusion of the following covariates: age group, gender, race, admission source, and Deyo‐Charlson Comorbidity Index score. These covariates were previously identified in the Wald et al hyponatremia study,3 and were verified using likelihood‐ratio, Hosmer‐Lemshow goodness of fit, and concordance c statistics.
Subgroup Sensitivity Analysis
For the subgroup sensitivity analyses, patients were identified as having community‐acquired pneumonia (CAP), congestive heart failure (CHF), urinary tract infection (UTI), or chronic obstructive pulmonary disease (COPD) based upon principal diagnosis codes. Patients were categorized according to these subgroup definitions, and then previously matched patients with the same subgroup classification constituted the final analysis set for each subgroup. The methods that were used for the overall matched analysis were then applied to each subgroup to evaluate the incremental burden of overall cost and LOS associated with hyponatremia.
RESULTS
Patient Population
Of the 606,057 HN patients eligible for matching, a total of 558,815 HN patients were matched to 558,815 non‐HN patients, a 92% match ratio. Table 1 describes the overall characteristics of the patient populations. For both cohorts, median age was 70 years, 57% of patients were female, and approximately 67% were white. The majority of patients in either cohort had Medicare coverage (55%), and approximately 75% of patients entered the hospital via the emergency room with nearly 70% having a 3M APR‐DRG disease severity level of major or extreme. Patients of both cohorts were most often attended by an internist or a hospitalist, with a combined percentage of approximately 60%. A small, but greater proportion of HN patients had comorbidities of cancer, pulmonary disease, and SIADH. Comorbid conditions of liver cirrhosis/hepatic disease and human immunodeficiency virus (HIV) were similarly distributed among both patient cohorts.
| Hyponatremic | Non‐Hyponatremic | |
|---|---|---|
| Discharges N (%) | Discharges N (%) | |
| ||
| Sample Discharges | 558,815 (100.0%) | 558,815 (100.0%) |
| Age median (IQR) | 70.00 (57.081.0) | 70.00 (57.081.0) |
| Gender | ||
| Female | 319,069 (57.1%) | 319,069 (57.1%) |
| Male | 239,746 (42.9%) | 239,746 (42.9%) |
| Race | ||
| American Indian | 3,465 (0.6%) | 3,448 (0.6%) |
| Asian/Pacific | 10,065 (1.8%) | 9,690 (1.7%) |
| Black | 63,776 (11.4%) | 66,233 (11.9%) |
| Hispanic | 24,341 (4.4%) | 24,426 (4.4%) |
| White | 377,434 (67.5%) | 376,639 (67.4%) |
| Other/unknown | 79,734 (14.3%) | 78,379 (14.0%) |
| Primary payer | ||
| Medicaretraditional | 310,312 (55.5%) | 310,643 (55.6%) |
| Managed care | 75,476 (13.5%) | 78,184 (14.0%) |
| Medicaremanaged care | 45,439 (8.1%) | 47,947 (8.6%) |
| Non‐cap | ||
| Medicaid | 44,690 (8.0%) | 43,767 (7.8%) |
| Other | 82,898 (14.8%) | 78,274 (14.0%) |
| Admission source | ||
| Physician referral | 5,022 (0.9%) | 4,636 (0.8%) |
| Transfer from another nonacute health facility | 18,031 (3.2%) | 18,163 (3.3%) |
| Emergency room | 417,556 (74.7%) | 420,401 (75.2%) |
| Other/unknown | 118,206 (21.2%) | 115,615 (20.7%) |
| APR‐DRG severity of illness | ||
| 1Minor | 14,257 (2.6%) | 12,993 (2.3%) |
| 2Moderate | 174,859 (31.3%) | 179,356 (32.1%) |
| 3Major | 263,814 (47.2%) | 265,422 (47.5%) |
| 4Extreme | 105,885 (19.0%) | 101,044 (18.1%) |
| Attending physician specialty | ||
| Internal Medicine | 235,628 (42.1%) | 240,875 (43.1%) |
| Hospitalist | 88,250 (15.8%) | 87,720 (15.7%) |
| Family Practice (FP) | 73,346 (13.1%) | 72,828 (13.0%) |
| Orthopedic Surgery (ORS) | 23,595 (4.2%) | 22,949 (4.1%) |
| Cardiovascular Diseases (CD) | 19,521 (3.5%) | 18,057 (3.2%) |
| Comorbidities | ||
| Human immunodeficiency virus | 3,971 (0.7%) | 4,018 (0.7%) |
| Cancer/neoplasm/malignancy | 107,851 (19.3%) | 105,199 (18.8%) |
| Pulmonary disease | 77,849 (13.9%) | 77,184 (13.8%) |
| Cirrhosis/hepatic disease | 23,038 (4.1%) | 23,418 (4.2%) |
| SIADH | 1,972 (0.4%) | 1,278 (0.2%) |
| Subgroup populations | ||
| Community‐acquired pneumonia | 26,291 (4.7%) | 26,291 (4.7%) |
| Congestive heart failure | 23,020 (4.1%) | 23,020 (4.1%) |
| Urinary tract infection | 14,238 (2.6%) | 14,238 (2.6%) |
| COPD | 8,696 (1.6%) | 8,696 (1.6%) |
| CCI median (IQR) | 3.0 (1.05.0) | 3.0 (1.05.0) |
| No. of premier hospitals | 459 | |
| Provider region | ||
| East North Central | 78,332 (14.0%) | 78,332 (14.0%) |
| East South Central | 32,122 (5.8%) | 32,122 (5.8%) |
| Middle Atlantic | 73,846 (13.2%) | 73,846 (13.2%) |
| Mountain | 23,761 (4.3%) | 23,761 (4.3%) |
| New England | 9,493 (1.7%) | 9,493 (1.7%) |
| Pacific | 73,059 (13.1%) | 73,059 (13.1%) |
| South Atlantic | 175,194 (31.4%) | 175,194 (31.4%) |
| West North Central | 37,913 (6.8%) | 37,913 (6.8%) |
| West South Central | 55,095 (9.9%) | 55,095 (9.9%) |
| Population served | ||
| Rural | 69,749 (12.5%) | 68,414 (12.2%) |
| Urban | 489,066 (87.5%) | 490,401 (87.8%) |
| Teaching status | ||
| Non‐teaching | 337,620 (60.4%) | 337,513 (60.4%) |
| Teaching | 221,195 (39.6%) | 221,302 (39.6%) |
| No. of hospital beds | ||
| 699 | 22,067 (4.0%) | 21,777 (3.9%) |
| 100199 | 57,367 (10.3%) | 56,097 (10.0%) |
| 200299 | 87,563 (15.7%) | 86,639 (15.5%) |
| 300499 | 218,834 (39.2%) | 220,248 (39.4%) |
| 500+ | 172,984 (31.0%) | 174,054 (31.2%) |
Hospital Characteristics
Patient cohorts had similar distributions with respect to hospital characteristics (Table 1). Approximately 30% of patients were provided care from hospitals located in the South Atlantic region, and between 10% and 15% were serviced from hospitals in the East North Central, Middle Atlantic, Pacific, and West South Central regions. Most hospitals providing care for patient cohorts served urban populations (88%) and were large, with hospital bed numbers 300. Approximately 60% of hospitals were non‐teaching hospitals.
Healthcare Utilization, Readmission, and Cost Differences Among Patient Cohorts
The mean LOS (8.8 10.3 vs 7.7 8.5, P < 0.001), a difference of 1.1 days and mean ICU LOS (5.5 7.9 vs 4.9 7.1 days, P < 0.001), a difference of 0.6 days were significantly greater for the HN cohort in comparison to the non‐HN cohort (Table 2). The increase in healthcare resource utilization of patients with HN was reflected in their significantly higher mean total hospital costs per admission ($15,281 $24,054 vs $13,439 $22,198, P < 0.001), a difference of $1842; and mean costs incurred in the ICU ($8525 $13,342 vs $7597 $12,695, P < 0.001), a difference of $928 (Table 2). Furthermore, patients in the HN cohort were significantly more likely to be readmitted to the hospital for any cause (17.5% vs 16.4%, P < 0.001) (Table 2).
| Hyponatremic | Non‐Hyponatremic | P Value | |
|---|---|---|---|
| |||
| Total LOS (mean SD) | 8.8 10.3 | 7.7 8.5 | <0.001 |
| Total hospitalization cost (mean SD) | $15,281 $24,054 | $13,439 $22,198 | <0.001 |
| ICU admission (N, %) | 129,235 (23.1%) | 123,502 (22.1%) | <0.001 |
| ICU LOS (mean SD) | 5.5 7.9 | 4.9 7.1 | <0.001 |
| ICU cost (mean SD) | $8,525 $13,342 | $7,597 $12,695 | <0.001 |
| 30‐Day all cause readmission (N, %) | 96,063 (17.5%) | 87,058 (16.4%) | <0.001 |
Multivariate Analysis
Multivariate analysis demonstrated hyponatremia was associated with an increase in mean hospital LOS of 10.9%, [95% confidence interval: 10.4%11.5%], (P < 0.0001) and an increase in mean total hospital costs of 8.2%, [7.4%9.0%], (P < 0.0001) (Table 3). Additionally, hyponatremia was associated with an increase in ICU LOS of 10.2%, [8.7%11.8%], (P < 0.0001), and a higher ICU cost of 8.9%, [7.2%10.7%], (P < 0.0001) (Table 3). Hyponatremia was not associated with a greater likelihood of ICU admission (odds ratio = 1.0; [1.01.0], P =.5760). However, the condition was associated with a significantly greater chance of hospital readmission (odds ratio = 1.2, [1.11.2], P < 0.0001) within 30 days postdischarge (Table 3).
| Overall Cohort N = 1,117,630 | CAP N = 52,582 | CHF N = 46,040 | UTI N = 28,746 | COPD N = 17,392 | |
|---|---|---|---|---|---|
| |||||
| Total LOS difference | 10.9% [10.4%, 11.5%] P < 0.0001 | 5.4% [4.4%, 6.5%] P < 0.0001 | 20.6% [19.0%, 22.2%] P < 0.0001 | 2.7% [1.2%, 4.2%] P = 0.0003 | 6.7% [4.8%, 8.5%] P < 0.0001 |
| Total cost difference | 8.2% [7.4%, 9.0%] P < 0.0001 | 5.6% [4.0%, 7.0%] P < 0.0001 | 19.2% [17.1%, 21.4%] P < 0.0001 | 2.2% [1.4%, 4.4%] P = 0.0582 | 5.6% [3.0%, 8.2%] P < 0.0001 |
| ICU admission* odds ratio | 1.0 [1.0, 1.0] P = 0.5760 | 1.0 [1.0, 1.1] P = 0.8363 | 1.2 [1.1, 1.3] P < 0.0001 | 1.2 [1.1, 1.3] P = 0.0038 | 1.0 [0.9, 1.1] P = 0.5995 |
| ICU LOS difference | 10.2% [8.7%, 11.8%] P < 0.0001 | 8.4% [3.4%, 13.7%] P = 0.0008 | 24.8% [19.9%, 29.9%] P < 0.0001 | 4.9% [4.0%, 14.7%] P = 0.2893 | 10.1% [1.5%, 19.3%] P = 0.0204 |
| ICU cost difference | 8.9% [7.2%, 10.7%] P < 0.0001 | 8.2% [2.7%, 14.0%] P = 0.0029 | 24.1% [18.9%, 29.7%] P < 0.0001 | 2.8% [6.7%, 13.4%] P = 0.5739 | 8.4% [0.6%, 18.1%] P = 0.6680 |
| 30‐Day readmission odds ratio | 1.2 [1.1, 1.2] P < 0.0001 | 1.0 [0.9, 1.0] P = 0.5141 | 1.1 [1.1, 1.2] P < 0.0001 | 1.0 [1.0, 1.1] P = 0.5211 | 1.0 [1.0, 1.1] P = 0.6119 |
Subgroup Sensitivity Analyses
For patients with CAP (n = 52,582), CHF (n = 46,040), a UTI (n = 28,476), or COPD (n = 17,392), the percent increases in LOS and all cause hospitalization cost of the HN cohort in comparison to the non‐HN cohort were 5.4% (P < 0.0001) and 5.6% (P < 0.0001), 20.6% (P < 0.0001) and 19.2% (P < 0.0001), 2.7% (P = 0.0003) and 2.2% (P = 0.0582), and 6.7% (P < 0.0001) and 5.6% (P < 0.0001), respectively (Table 3).
DISCUSSION
This large‐scale, real‐world hospital database study provides healthcare utilization and cost data on the largest population of HN patients that has currently been studied. The results of this study are consistent with others in showing that HN patients use healthcare services more extensively, and represent a patient population which is more expensive to treat in the inpatient setting.5, 22 Additionally, this study yields new findings in that patients in the real‐world with hyponatremia resulting from various etiologies are more likely to be readmitted to the hospital than patients with similar demographics and characteristics who do not have hyponatremia. The results of the subgroup analysis were generally consistent with the results for the overall matched population, as the incremental burden estimates were directionally consistent. However, among the specific subgroups of patients, although it appears that hyponatremia is predictive of hospital readmission in patients with CHF, it did not necessarily correspond with hospital readmission rates among patients with CAP, UTI, or COPD. Therefore, hyponatremia, at least for patients with these latter conditions, may not be predictive of readmission, but remains associated with increased healthcare utilization during the initial hospitalization. Further evaluation of the incremental burden of hyponatremia among patients with specific disease conditions is needed to validate the findings.
The difference in hospital LOS at first admission between HN and non‐HN patients in this study was 1.1 days, and comparable to that reported by Shorr et al.23 In the study by Shorr et al, patients hospitalized for congestive heart failure (CHF), who were HN, had a 0.5 day increased LOS, and those who were severely HN had a 1.3 day increased LOS.23 Two other retrospective cohort analyses reported a 1.4 day5 and 2.0 day22 increased LOS for HN patients in comparison to non‐HN patients. Zilberberg et al and Callahan et al additionally reported that HN patients had a significantly greater need for ICU (4%10%).5, 22 In the present study, LOS in the ICU and associated costs were also compared among HN and non‐HN cohorts and, after adjustment for key patient characteristics, hyponatremia was associated with an incremental increase of 10.2% for ICU LOS and an 8.9% increase in ICU cost.
In this study, patients with hyponatremia of any severity were found to have a mean increase in hospital cost per admission of $1842, with multivariate analysis demonstrating an associated incremental increase of 8.2%. These results are also comparable to that reported in other retrospective cohort analyses. Shorr et al reported that in‐hospital costs attributed to hyponatremia were $509, and for severe hyponatremia were $1132.23 Callahan et al reported a $1200 increase in costs per admission for patients with mild‐to‐moderate hyponatremia, and a $3540 increase for patients with moderate‐to‐severe hyponatremia, in comparison to non‐HN patients.22
The Institute for Healthcare Improvement reports that hospitalizations account for nearly one‐third of the $882 billion spent on healthcare in the US in 2011, and that a substantial fraction of all hospitalizations are readmissions.13, 24 A recent meta‐analysis of 30‐day hospital readmission rates found 23.1% were classified as avoidable.25 Readmission rates of HN patients in comparison to non‐HN patients have been reported in 3 other studies, all of which were conducted on clinical trial patients with heart failure.7, 8, 26 Two of these studies, which evaluated only patients with acute class IV heart failure,8, 26 reported that hyponatremia was associated with a significant increase in readmission rates (up to 20% higher), and the other, which evaluated any patients hospitalized for heart failure, did not.7 The differences there may be partially attributed to the differences in heart failure severity among patient populations, as hyponatremia is an independent predictor of worsening heart failure. The only published study to date on the influence of hyponatremia on readmission rates in the real‐world was conducted by Scherz et al, who reported that the co‐occurrence of hyponatremia in patients with acute pulmonary embolism, discharged from 185 hospitals in Pennsylvania, was independently associated with an increased readmission rate of 19.3%.27 In the present study, hyponatremia was associated with an incremental increase ranging between 14% and 17% for hospital readmission for any cause. It was conducted on a patient population in which hyponatremia was resultant from many causes, and not all patients had a serious comorbid condition. Also, the HN and non‐HN cohorts were matched for comorbidity prevalence and disease severity, and in other studies they were not. Therefore, the results of this study importantly imply that hyponatremia, whether it is resultant from a serious disease or any other cause substantially increases the healthcare burden. The implementation of strategies to prevent hospital readmissions may play an important role in reducing the healthcare burden of hyponatremia, and future studies are warranted to evaluate this hypothesis alongside evaluation of the outpatient hyponatremia burden.
The limitations of this study include, firstly, that it is only representative of inpatient hospital costs, and excludes outpatient healthcare utilization and costs. Secondly, this study utilized the Premier Hospital Database for patient selection, and laboratory testing data for serum sodium level are not available in this database; therefore, the severity of hyponatremia could not be accurately established in the HN patient population. Thirdly, the occurrence of hyponatremia in patients with some diseases is a marker of disease severity, as is the case with congestive heart failure and cirrhosis.23, 28 Our study did not adjust for the specific disease (eg, CHF) severity, which may influence the results. Future research is needed to evaluate the impact of hyponatremia on underlying disease severity of other diseases, and how its co‐occurrence may influence healthcare resource utilization and cost in each case. Although the Premier Hospital Database contains information from a large number of hospitals across the US, it is possible that it may not be representative of the entire US population of HN patients. Additionally, billing and coding errors and missing data could potentially have occurred, although the large patient population size likely precludes a large impact on the results of this study. Finally, the frequency of use of fluid restriction in these hospital settings could not be chronicled, thus limiting the ability to assess therapies and treatment modalities in use.
Acknowledgements
The authors acknowledge Melissa Lingohr‐Smith from Novosys Health in the editorial support and review of this manuscript.
Disclosures: This research was supported by Otsuka America Pharmaceutical, Inc, Princeton, NJ, which manufactures tolvaptan for the treatment of hyponatremia. Drs Amin and Deitelzweig are consultants for, and have received honoraria from, Otsuka America Pharmaceutical in connection with conducting this study. Drs Christian and Friend are employees of Otsuka America Pharmaceutical. Dr Lin is an employee of Novosys Health, which has received research funds from Otsuka America Pharmaceutical in connection with conducting this study and development of this manuscript. D. Baumer and Dr. Lowe are employees of Premier Inc, which has received research funds from Otsuka America Pharmaceutical. K. Belk was previously employed with Premier Inc.
- ,,.Management of hyponatremia: providing treatment and avoiding harm.Cleve Clin J Med.2010;77(10):715–726.
- ,,.Causes and management of hyponatremia.Ann Pharmacother.2003;37(11):1694–1702.
- ,,,,.Impact of hospital‐associated hyponatremia on selected outcomes.Arch Intern Med.2010;170(3):294–302.
- ,,,.Hyponatremia: a prospective analysis of its epidemiology and the pathogenetic role of vasopressin.Ann Intern Med.1985;102(2):164–168.
- ,,, et al.Epidemiology, clinical and economic outcomes of admission hyponatremia among hospitalized patients.Curr Med Res Opin.2008;24(6):1601–1608.
- ,,.Mortality after hospitalization with mild, moderate, and severe hyponatremia.Am J Med.2009;122(9):857–865.
- ,,, et al.Relationship between admission serum sodium concentration and clinical outcomes in patients hospitalized for heart failure: an analysis from the OPTIMIZE‐HF registry.Eur Heart J.2007;28(8):980–988.
- ,,, et al.Characterization and prognostic value of persistent hyponatremia in patients with severe heart failure in the ESCAPE Trial.Arch Intern Med.2007;167(18):1998–2005.
- ,,,.Hyponatremia in cirrhosis: results of a patient population survey.Hepatology.2006;44(6):1535–1542.
- ,,, et al.Hyponatremia in cirrhosis: from pathogenesis to treatment.Hepatology.1998;28(3):851–864.
- ,,,,.The syndrome of inappropriate antidiuresis: pathophysiology, clinical management and new therapeutic options.Nephron Clin Pract.2011;119(1):c62–c73.
- ,,.Cost of illness of hyponatremia in the United States.Cost Eff Resour Alloc.2006;4:10.
- US Health Care Budget: US Budget Breakdown for FY12—Charts. Available at: http://www.usgovernmentspending.com/health_care_budget_2012_1.html. Accessed December 19, 2011.
- 111th Congress. Patient Protection and Affordable Care Act. Public Law 111–148.1–906.
- .An evaluation of statistical matching.JBES.1984;2(1):91–102.
- ,.Propensity score‐matching methods for nonexperimental causal studies.Rev Econ Stat.2002;84(1):151–161.
- . Applied Logistic Regression Analysis. Quantitative Applications in the Social Sciences, Vol106.2nd ed.Thousand Oaks, CA:Sage;2002.
- .Reducing bias in a propensity score matched‐pair sample using greedy matching techniques. Paper presented at: Proceedings of the Twenty‐Sixth Annual SAS Users Group International Conference; April 22–25,2001; Long Beach, CA.
- ,,,,.The effect of clustering of outcomes on the association of procedure volume and surgical outcomes.Ann Intern Med.2003;139(8):658–665.
- .Regression Modeling Strategies: With Applications to Linear Models, Logistic Regression, and Survival Analysis.New York, NY:Springer‐Verlag,2001.
- ,,.Generalized Modeling Approaches to Risk Adjustment of Skewed Outcomes Data.Cambridge, MA:National Bureau of Economic Research, Inc;2003.
- ,,,.Economic impact of hyponatremia in hospitalized patients: a retrospective cohort study.Postgrad Med.2009;121(2):186–191.
- ,,, et al.Burden of sodium abnormalities in patients hospitalized for heart failure.Congest Heart Fail.2011;17(1):1–7.
- Institute for Healthcare Improvement. Reduce Avoidable Hospital Readmissions. Available at: http://www.ihi.org/explore/readmissions/Pages/default.aspx. Accessed December 18, 2011.
- ,,.A meta‐analysis of hospital 30‐day avoidable readmission rates.J Eval Clin Pract.2011 Nov 9. doi: 10.1111/j.1365–2753.2011.01773.x. Published online August 17, 2012.
- ,,, et al.Critical elements of clinical follow‐up after hospital discharge for heart failure: insights from the EVEREST trial.Eur J Heart Fail.2010;12(4):367–374.
- ,,, et al.Prognostic importance of hyponatremia in patients with acute pulmonary embolism.Am J Respir Crit Care Med.2010;182(9):1178–1183.
- ,,, et al.Serum sodium predicts prognosis in critically ill cirrhotic patients.J Clin Gastroenterol.2010;44(3):220–226.
Copyright © 2012 Society of Hospital Medicine