User login
Emergency Ultrasound: Focused Ultrasound for Respiratory Distress: The BLUE Protocol
Acute dyspnea, with or without hypoxia, is a common patient presentation in the ED, and can be the result of a myriad of mainly cardiac, pulmonary, and metabolic conditions—many of which are life-threatening. Therefore, it is crucial to determine or narrow the diagnosis promptly and initiate appropriate treatment. Focused ultrasound of the lungs can provide important information that can change a patient’s clinical course within minutes of initial evaluation.
Background
Prior to the 1990s, the lung was considered unsuitable for evaluation by ultrasound given the scatter of the ultrasound beam that is produced by the presence of aerated tissue. Lung pathology, however, produces distinct artifacts and signs on ultrasound that correspond with specific disease patterns.
The Bedside Lung Ultrasound in Emergencies (BLUE) protocol1 was developed by Daniel Lichtenstein, a French intensivist, and published in 2008. The goal of the examination is to improve the speed and precision of identifying common causes of acute dyspnea. The sensitivity of ultrasound for cardiogenic pulmonary edema, asthma/chronic obstructive pulmonary disease (COPD), and pneumothorax were reported as exceeding 88%.2 Strictly speaking, the BLUE protocol includes an evaluation of the deep veins as well to exclude thrombus; however, this article will focus on ultrasound imaging of the lung.
Relevant Findings
A-line Artifact
The A-line seen on lung ultrasound (Figure 1) originates from the pleura and can be seen in a normal lung. 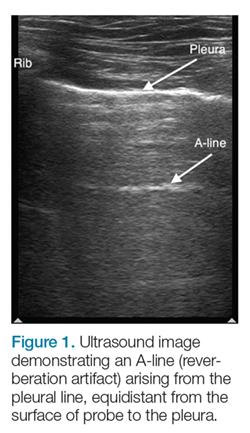
B-line Artifact
B-lines, also referred to as “lung rockets,” are a comet-tail artifact arising from the pleura (Figure 2). 
Lung Profiles
A patient can have one of three predominant lung profiles: A-profile, B-profile, or AB-profile.
A-profile. A-lines appear bilaterally with lung sliding in the anterior surface of lungs, suggestive of COPD, or pulmonary embolism. Exacerbation of congestive heart failure can be ruled out.
B-profile. The appearance of prominent B-lines bilaterally, suggestive of heart failure, essentially rules out COPD, pulmonary embolism, and pneumothorax.
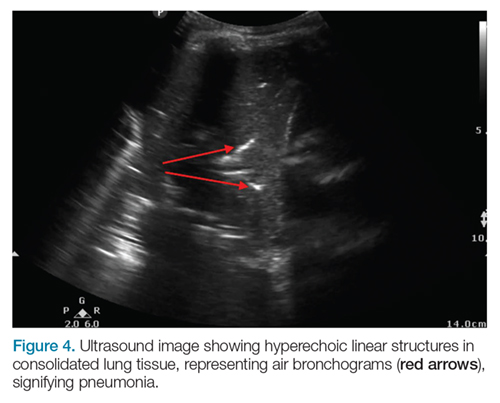
AB-profile. The appearance of predominant B-lines on one lung and predominant A-lines on the other lung, is consistent with an AB profile. This is usually associated with unilateral pneumonia, especially if seen with other findings such as subpleural consolidation (Figure 3) and air bronchograms (Figure 4).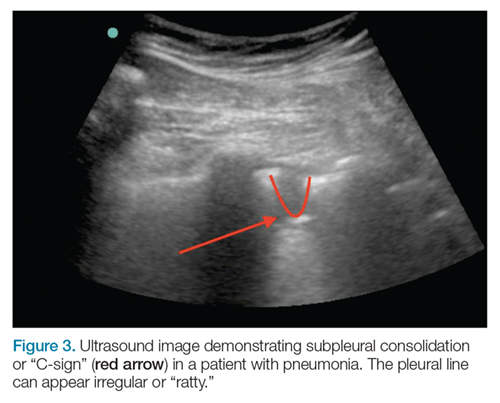
Lung Point
The lung point sign is the only specific finding in the BLUE protocol, and signifies the limits of a pneumothorax by showing the interface between normal lung sliding and the edge of the pneumothorax. Without a specific search for the lung point, it may not be seen in the anterior assessment of lung sliding, although lung sliding will still be abolished. 
Imaging Technique
The mid-to-high frequency phased array transducer is used to examine the anterior and posterolateral chest. The original BLUE protocol assesses three zones, but the most relevant information can be obtained from performing the ultrasound in the anterior and posterolateral locations (Figures 6 and 7).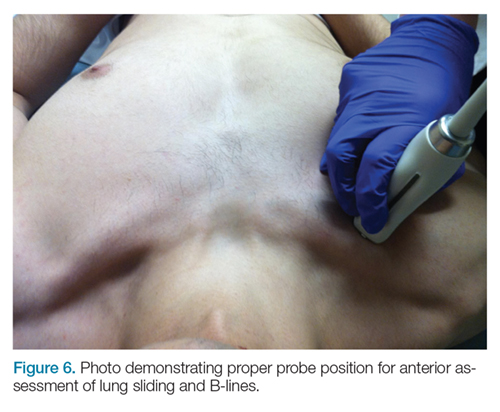
Anterior Pleural Assessment
The first step is to evaluate the pleural line anteriorly (Figure 1) for lung sliding. This is best accomplished by setting the depth to no more than 5 cm so that the focal zone of the ultrasound beam is directed at the pleural line, and it is centered on the screen. If no sliding is present, it is because the visceral and parietal pleura are not apposed to one another. There are many pathological entities that can cause this finding, but one of the more common is pneumothorax.
After evaluating the pleural line, the depth will then need to be switched to 15 cm to evaluate for B-lines. If B-lines are present without lung sliding, pneumonia should be strongly considered. The appearance of B-lines with lung sliding signifies alveolar interstitial fluid, commonly from pulmonary edema.
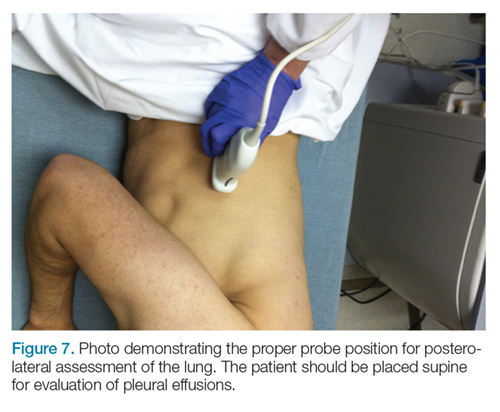
Posterolateral Assessment
The posterolateral assessment (Figure 7) evaluates for pleural effusion and consolidation. The dome of the diaphragm is the landmark above which abnormal lung and artifacts will be seen. 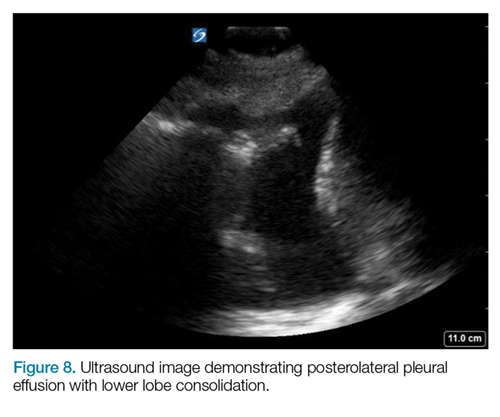
Summary
Lung ultrasound can help narrow the differential diagnosis for acute dyspnea within the first few minutes of the patient encounter. The BLUE protocol provides an organized approach to this evaluation. Often, the protocol is combined with focused examinations of the heart, inferior vena cava, and/or deep veins to complete the clinical picture. It is important to keep in mind that patients may have two or more pathological conditions (eg, asthma and pneumonia) that can affect the ultrasound findings. For this reason, ultrasound interpretation should always occur in the context of the clinical condition. If it does not exclude important diagnoses, additional investigations such as plain radiography, cross-sectional imaging, or ventilation/perfusion studies should be pursued.
1. Lichtenstein DA. BLUE-protocol and FALLS-protocol: two applications of lung ultrasound in the critically ill. Chest. 2015;147(6):1659-1670. doi:10.1378/chest.14-1313.
2. Lichtenstein DA, Mezière GA. Relevance of lung ultrasound in the diagnosis of acute respiratory failure: the BLUE protocol. Chest. 2008;134(1):117-125. doi:10.1378/chest.07-2800.
Acute dyspnea, with or without hypoxia, is a common patient presentation in the ED, and can be the result of a myriad of mainly cardiac, pulmonary, and metabolic conditions—many of which are life-threatening. Therefore, it is crucial to determine or narrow the diagnosis promptly and initiate appropriate treatment. Focused ultrasound of the lungs can provide important information that can change a patient’s clinical course within minutes of initial evaluation.
Background
Prior to the 1990s, the lung was considered unsuitable for evaluation by ultrasound given the scatter of the ultrasound beam that is produced by the presence of aerated tissue. Lung pathology, however, produces distinct artifacts and signs on ultrasound that correspond with specific disease patterns.
The Bedside Lung Ultrasound in Emergencies (BLUE) protocol1 was developed by Daniel Lichtenstein, a French intensivist, and published in 2008. The goal of the examination is to improve the speed and precision of identifying common causes of acute dyspnea. The sensitivity of ultrasound for cardiogenic pulmonary edema, asthma/chronic obstructive pulmonary disease (COPD), and pneumothorax were reported as exceeding 88%.2 Strictly speaking, the BLUE protocol includes an evaluation of the deep veins as well to exclude thrombus; however, this article will focus on ultrasound imaging of the lung.
Relevant Findings
A-line Artifact
The A-line seen on lung ultrasound (Figure 1) originates from the pleura and can be seen in a normal lung.
B-line Artifact
B-lines, also referred to as “lung rockets,” are a comet-tail artifact arising from the pleura (Figure 2).
Lung Profiles
A patient can have one of three predominant lung profiles: A-profile, B-profile, or AB-profile.
A-profile. A-lines appear bilaterally with lung sliding in the anterior surface of lungs, suggestive of COPD, or pulmonary embolism. Exacerbation of congestive heart failure can be ruled out.
B-profile. The appearance of prominent B-lines bilaterally, suggestive of heart failure, essentially rules out COPD, pulmonary embolism, and pneumothorax.
AB-profile. The appearance of predominant B-lines on one lung and predominant A-lines on the other lung, is consistent with an AB profile. This is usually associated with unilateral pneumonia, especially if seen with other findings such as subpleural consolidation (Figure 3) and air bronchograms (Figure 4).
Lung Point
The lung point sign is the only specific finding in the BLUE protocol, and signifies the limits of a pneumothorax by showing the interface between normal lung sliding and the edge of the pneumothorax. Without a specific search for the lung point, it may not be seen in the anterior assessment of lung sliding, although lung sliding will still be abolished.
Imaging Technique
The mid-to-high frequency phased array transducer is used to examine the anterior and posterolateral chest. The original BLUE protocol assesses three zones, but the most relevant information can be obtained from performing the ultrasound in the anterior and posterolateral locations (Figures 6 and 7).
Anterior Pleural Assessment
The first step is to evaluate the pleural line anteriorly (Figure 1) for lung sliding. This is best accomplished by setting the depth to no more than 5 cm so that the focal zone of the ultrasound beam is directed at the pleural line, and it is centered on the screen. If no sliding is present, it is because the visceral and parietal pleura are not apposed to one another. There are many pathological entities that can cause this finding, but one of the more common is pneumothorax.
After evaluating the pleural line, the depth will then need to be switched to 15 cm to evaluate for B-lines. If B-lines are present without lung sliding, pneumonia should be strongly considered. The appearance of B-lines with lung sliding signifies alveolar interstitial fluid, commonly from pulmonary edema.
Posterolateral Assessment
The posterolateral assessment (Figure 7) evaluates for pleural effusion and consolidation. The dome of the diaphragm is the landmark above which abnormal lung and artifacts will be seen.
Summary
Lung ultrasound can help narrow the differential diagnosis for acute dyspnea within the first few minutes of the patient encounter. The BLUE protocol provides an organized approach to this evaluation. Often, the protocol is combined with focused examinations of the heart, inferior vena cava, and/or deep veins to complete the clinical picture. It is important to keep in mind that patients may have two or more pathological conditions (eg, asthma and pneumonia) that can affect the ultrasound findings. For this reason, ultrasound interpretation should always occur in the context of the clinical condition. If it does not exclude important diagnoses, additional investigations such as plain radiography, cross-sectional imaging, or ventilation/perfusion studies should be pursued.
1. Lichtenstein DA. BLUE-protocol and FALLS-protocol: two applications of lung ultrasound in the critically ill. Chest. 2015;147(6):1659-1670. doi:10.1378/chest.14-1313.
2. Lichtenstein DA, Mezière GA. Relevance of lung ultrasound in the diagnosis of acute respiratory failure: the BLUE protocol. Chest. 2008;134(1):117-125. doi:10.1378/chest.07-2800.
Emergency Ultrasound: Pericardial Effusion and Tamponade: Making the Diagnosis at Bedside With Point-of-Care Echocardiography
Background
Pericardial effusions are usually an incidental finding on bedside echocardiogram—unless a patient shows clinical signs of tamponade physiology and obstructive shock. Echocardiogram is both sensitive and specific to detecting pericardial effusions.1 Although there are many causes of pericardial effusions, the most common causes of symptomatic effusions in the Western World are due to neoplasm, pericarditis, traumatic pathology, or idiopathic etiology. In developing countries, however, pericardial effusions are predominantly due to tuberculosis in an area where it is endemic.2,3 The size of the effusion is classified based on measurements of a fluid pocket during diastole. Mild effusion is defined as less than 10 mm; moderate effusion, 10 to 20 mm; and large effusion, greater than 20 mm.3
It is important to note that the pericardial space contains up to 50 mL of physiological fluid which may be seen on echocardiography during systole. Small effusions usually contain less than 100 mL of fluid; moderate effusions contain 100 to 500 mL of fluid; and large effusions, over 500 mL of fluid. Fluid of smaller effusions typically layer posteriorly, while the fluid of some moderate and most large effusions may be seen circumferentially.
Clinical Signs and Symptoms
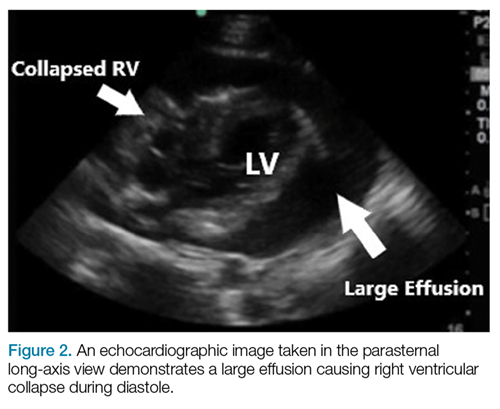
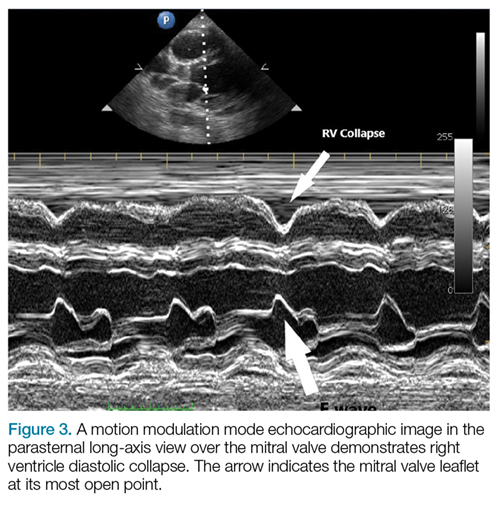
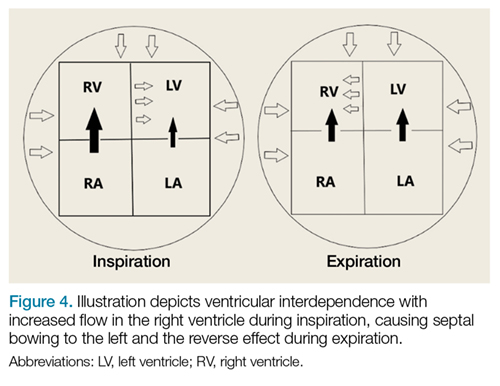
Patients with large chronic effusions are often asymptomatic, and clinical symptoms usually correlate to the acuity of pericardial accumulation. Patients with symptomatic effusions present with dyspnea on exertion that is followed by orthopnea, chest pain, and sometimes dysphagia, hoarseness, or hiccups due to irritation of surrounding structures until they exhibit tamponade physiology leading to hypotension secondary to obstructive shock. The most recognized signs of tamponade physiology on bedside echocardiography are early diastolic collapse of the right atrium and right ventricle, as well as ventricular interdependence.4
Imaging Technique
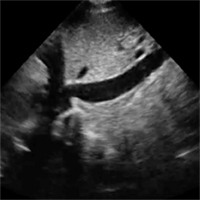
Pericardial effusion and cardiac tamponade can be detected in any of the standard echocardiographic views, with fluid usually appearing as an anechoic stripe. The fluid will first appear in the dependent portion of the pericardial space, but may become circumferential as it grows (Figure 1). 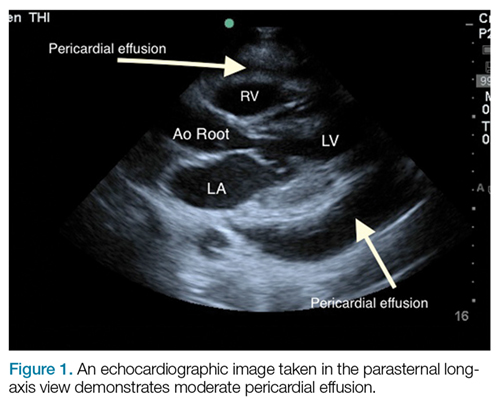
After evaluating for signs of tamponade on examination, the next step is to evaluate the inferior vena cava (IVC). A simple way to identify the IVC on echocardiography is to visualize the heart in the subxiphoid view, then rotate the probe so that the marker is pointing toward the patient’s head. As demonstrated in Figure 5, the IVC should be seen entering the right atrium; if the patient is truly in obstructive shock, the IVC should be plethoric with minimal respiratory variation.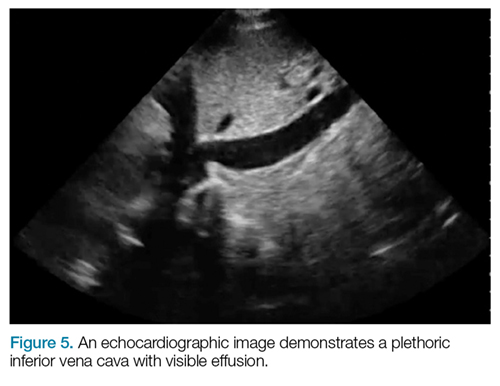
Pericardiocentesis
In the event of obstructive shock or pulseless electric activity with visualized or suspected tamponade, pericardiocentesis is considered standard of care. There are many approaches to performing a pericardiocentesis, including the classically taught blind subxiphoid approach, which is associated with high rates of morbidity and mortality.5 More recent image-guided approaches employ echocardiography-guided techniques that identify the location and distribution of fluid, and perform pericardiocentesis closest to the area largest fluid accumulation.
Most of these guided techniques involve in-plane visualization of the needle in either a subxiphoid, apical, or parasternal approach. Studies have shown that the subxiphoid approach has a higher risk of injury to the liver, heart, and IVC, with complication rates up to 20% depending on the study.6
The apical approach involves locating the cardiac apex and inserting the needle 1 cm lateral to the apex, with the point directed toward the effusion and in-line with the ultrasound probe, taking care to avoid the lingula. Studies have shown that complication rates with this approach are around 3%.7
Recent studies also suggest that in-line medial-to-lateral parasternal approaches may have minimal complications. However, when employing this approach, care must be taken to avoid the internal mammary artery, which can be identified using color-flow Doppler echocardiology.6
Conclusion
In general, bedside ultrasound is a quick and useful tool to evaluate for pericardial effusion and signs of tamponade physiology. When present, tamponade, a clinical diagnosis, is the likely cause of shock in the hemodynamically unstable patient with circumferential pericardial effusion.
While most cases of pericardial effusion are found incidentally, a stepwise approach to evaluate for tamponade is to quickly look for signs of early right-sided diastolic collapse or ventricular interdependence, as well as a plethoric IVC. For patients who have tamponade requiring pericardiocentesis, the ultrasound-guided apical or parasternal approaches have been shown to have fewer complications compared to the subxiphoid approach.
1. Imazio M, Adler Y. Management of pericardial effusion. Eur Heart J. 2013;34(16):1186-1197. doi:10.1093/eurheartj/ehs372.
2. Ben-Horin S, Bank I, Guetta V, Livneh A. Large symptomatic pericardial effusion as the presentation of unrecognized cancer: a study in 173 consecutive patients undergoing pericardiocentesis. Medicine. 2006;85(1):49-53. doi:10.1097/01.md.0000199556.69588.8e
3. Adler Y, Charron P, Imazio M, et al; European Society of Cardiology (ESC). 2015 ESC Guidelines for the diagnosis and management of pericardial diseases: The Task Force for the Diagnosis and Management of Pericardial Diseases of the European Society of Cardiology (ESC) Endorsed by: The European Association for Cardio-Thoracic Surgery (EACTS). Eur Heart J. 2015;36(42):2921-2964. doi:10.1093/eurheartj/ehv318.
4. Nagdev A, Stone MB. Point-of-care ultrasound evaluation of pericardial effusions: does this patient have cardiac tamponade? Resuscitation. 2011;82(6):671-673. doi:10.1016/j.resuscitation.2011.02.004.
5. Kumar R, Sinha A, Lin MJ. Complications of pericardiocentesis: a clinical synopsis. Int J Crit Illn Inj Sci. 2015;5(3):206-212. doi:10.4103/2229-5151.165007.
6. Osman A, Wan Chuan T, Ab Rahman J, Via G, Tavazzi G. Ultrasound-guided pericardiocentesis: a novel parasternal approach. Eur J Emerg Med. 2017;5. doi:10.1097/MEJ.0000000000000471.
7. Ozer HO, Davutoğlu V, Cakici M. Echocardiography-guided pericardiocentesis with the apical approach. Turk Kardiyol Dern Ars. 2009;37(3):177-181.
Background
Pericardial effusions are usually an incidental finding on bedside echocardiogram—unless a patient shows clinical signs of tamponade physiology and obstructive shock. Echocardiogram is both sensitive and specific to detecting pericardial effusions.1 Although there are many causes of pericardial effusions, the most common causes of symptomatic effusions in the Western World are due to neoplasm, pericarditis, traumatic pathology, or idiopathic etiology. In developing countries, however, pericardial effusions are predominantly due to tuberculosis in an area where it is endemic.2,3 The size of the effusion is classified based on measurements of a fluid pocket during diastole. Mild effusion is defined as less than 10 mm; moderate effusion, 10 to 20 mm; and large effusion, greater than 20 mm.3
It is important to note that the pericardial space contains up to 50 mL of physiological fluid which may be seen on echocardiography during systole. Small effusions usually contain less than 100 mL of fluid; moderate effusions contain 100 to 500 mL of fluid; and large effusions, over 500 mL of fluid. Fluid of smaller effusions typically layer posteriorly, while the fluid of some moderate and most large effusions may be seen circumferentially.
Clinical Signs and Symptoms
Patients with large chronic effusions are often asymptomatic, and clinical symptoms usually correlate to the acuity of pericardial accumulation. Patients with symptomatic effusions present with dyspnea on exertion that is followed by orthopnea, chest pain, and sometimes dysphagia, hoarseness, or hiccups due to irritation of surrounding structures until they exhibit tamponade physiology leading to hypotension secondary to obstructive shock. The most recognized signs of tamponade physiology on bedside echocardiography are early diastolic collapse of the right atrium and right ventricle, as well as ventricular interdependence.4
Imaging Technique
Pericardial effusion and cardiac tamponade can be detected in any of the standard echocardiographic views, with fluid usually appearing as an anechoic stripe. The fluid will first appear in the dependent portion of the pericardial space, but may become circumferential as it grows (Figure 1).
After evaluating for signs of tamponade on examination, the next step is to evaluate the inferior vena cava (IVC). A simple way to identify the IVC on echocardiography is to visualize the heart in the subxiphoid view, then rotate the probe so that the marker is pointing toward the patient’s head. As demonstrated in Figure 5, the IVC should be seen entering the right atrium; if the patient is truly in obstructive shock, the IVC should be plethoric with minimal respiratory variation.
Pericardiocentesis
In the event of obstructive shock or pulseless electric activity with visualized or suspected tamponade, pericardiocentesis is considered standard of care. There are many approaches to performing a pericardiocentesis, including the classically taught blind subxiphoid approach, which is associated with high rates of morbidity and mortality.5 More recent image-guided approaches employ echocardiography-guided techniques that identify the location and distribution of fluid, and perform pericardiocentesis closest to the area largest fluid accumulation.
Most of these guided techniques involve in-plane visualization of the needle in either a subxiphoid, apical, or parasternal approach. Studies have shown that the subxiphoid approach has a higher risk of injury to the liver, heart, and IVC, with complication rates up to 20% depending on the study.6
The apical approach involves locating the cardiac apex and inserting the needle 1 cm lateral to the apex, with the point directed toward the effusion and in-line with the ultrasound probe, taking care to avoid the lingula. Studies have shown that complication rates with this approach are around 3%.7
Recent studies also suggest that in-line medial-to-lateral parasternal approaches may have minimal complications. However, when employing this approach, care must be taken to avoid the internal mammary artery, which can be identified using color-flow Doppler echocardiology.6
Conclusion
In general, bedside ultrasound is a quick and useful tool to evaluate for pericardial effusion and signs of tamponade physiology. When present, tamponade, a clinical diagnosis, is the likely cause of shock in the hemodynamically unstable patient with circumferential pericardial effusion.
While most cases of pericardial effusion are found incidentally, a stepwise approach to evaluate for tamponade is to quickly look for signs of early right-sided diastolic collapse or ventricular interdependence, as well as a plethoric IVC. For patients who have tamponade requiring pericardiocentesis, the ultrasound-guided apical or parasternal approaches have been shown to have fewer complications compared to the subxiphoid approach.
1. Imazio M, Adler Y. Management of pericardial effusion. Eur Heart J. 2013;34(16):1186-1197. doi:10.1093/eurheartj/ehs372.
2. Ben-Horin S, Bank I, Guetta V, Livneh A. Large symptomatic pericardial effusion as the presentation of unrecognized cancer: a study in 173 consecutive patients undergoing pericardiocentesis. Medicine. 2006;85(1):49-53. doi:10.1097/01.md.0000199556.69588.8e
3. Adler Y, Charron P, Imazio M, et al; European Society of Cardiology (ESC). 2015 ESC Guidelines for the diagnosis and management of pericardial diseases: The Task Force for the Diagnosis and Management of Pericardial Diseases of the European Society of Cardiology (ESC) Endorsed by: The European Association for Cardio-Thoracic Surgery (EACTS). Eur Heart J. 2015;36(42):2921-2964. doi:10.1093/eurheartj/ehv318.
4. Nagdev A, Stone MB. Point-of-care ultrasound evaluation of pericardial effusions: does this patient have cardiac tamponade? Resuscitation. 2011;82(6):671-673. doi:10.1016/j.resuscitation.2011.02.004.
5. Kumar R, Sinha A, Lin MJ. Complications of pericardiocentesis: a clinical synopsis. Int J Crit Illn Inj Sci. 2015;5(3):206-212. doi:10.4103/2229-5151.165007.
6. Osman A, Wan Chuan T, Ab Rahman J, Via G, Tavazzi G. Ultrasound-guided pericardiocentesis: a novel parasternal approach. Eur J Emerg Med. 2017;5. doi:10.1097/MEJ.0000000000000471.
7. Ozer HO, Davutoğlu V, Cakici M. Echocardiography-guided pericardiocentesis with the apical approach. Turk Kardiyol Dern Ars. 2009;37(3):177-181.
Emergency Ultrasound: Ultrasound-Guided Arthrocentesis of the Ankle
Ankle effusions can be quite debilitating, causing band-like swelling and stiffness to the anterior aspect of ankle at the tibiotalar joint. Significant swelling can impair ankle dorsiflexion and plantar flexion. The differential diagnosis for joint effusions is wide, and includes traumatic effusion; gout; osteoarthritis; rheumatoid arthritis; and septic arthritis, which is one of the most important diagnoses for the emergency physician (EP) to identify and initiate prompt treatment to reduce the risk of serious morbidity and mortality. Differentiating these conditions requires joint aspiration and synovial fluid analysis. While a large effusion will be palpable and likely ballotable, smaller effusions are more challenging clinically. In such cases, point-of-care (POC) ultrasound can be a valuable tool in confirming a joint effusion.
Identifying Landmarks and Tibiotalar Joint
To access the tibiotalar joint space, it is important to identify useful landmarks.1 This is best accomplished by having the patient in the supine position, with the affected knee flexed approximately 90° and plantar surface of the foot lying flat on the bed (Figure 1). 

Performing the Arthrocentesis
The arthrocentesis is performed under sterile conditions using the high-frequency linear probe. A sterile probe cover is highly recommended if the operator will be using ultrasound to guide the procedure in real time.2 Using the palpable landmarks as a guide, the clinician should align the probe just medial to the tibialis anterior tendon with the probe marker oriented cephalad; scanning should begin superior to the ankle joint. The tibia will appear as a hyperechoic stripe just under a thin soft tissue layer. When the tibia is visible, the clinician should then slide the probe distally. The joint space will demonstrated by visualization of the distal tibia and talus bone (Figure 3). 


Pearls and Pitfalls
Point-of-care ultrasound is not only useful to guide arthrocentesis of joint effusions, but also to confirm the presence of an effusion prior to aspiration. At our institution, we have had many cases in which POC ultrasound demonstrated an absence of effusion, and we were able to avoid an unnecessary joint aspiration. Moreover, when an effusion is present, POC ultrasound-guided aspiration avoids complications. The use of POC ultrasound can also increase the confidence of the provider performing arthrocentesis of joints less commonly aspirated.
Summary
Joint aspiration is an important procedural tool for EPs, especially when used to rule out life-threatening conditions such as septic arthritis. Deeper joints and small fluid collections, however, can be difficult to access without image guidance. In the ED setting, POC ultrasound provides a widely available, easy-to-use, low-cost tool to increase the likelihood of success while minimizing damage to adjacent structures.
1. Nagdev A. Ultrasound-guided ankle arthrocentesis. Highland General Hospital Emergency Medicine Ultrasound Web site. http://highlandultrasound.com/ankle-arthrocentesis. Accessed June 8, 2017.
2. Reichman EF, Simon RR. Arthrocentesis. In: Reichman EF, Simon RR, eds. Emergency Medicine Procedures. 2nd ed. McGraw Hill Education: New York, NY; 2013.
Ankle effusions can be quite debilitating, causing band-like swelling and stiffness to the anterior aspect of ankle at the tibiotalar joint. Significant swelling can impair ankle dorsiflexion and plantar flexion. The differential diagnosis for joint effusions is wide, and includes traumatic effusion; gout; osteoarthritis; rheumatoid arthritis; and septic arthritis, which is one of the most important diagnoses for the emergency physician (EP) to identify and initiate prompt treatment to reduce the risk of serious morbidity and mortality. Differentiating these conditions requires joint aspiration and synovial fluid analysis. While a large effusion will be palpable and likely ballotable, smaller effusions are more challenging clinically. In such cases, point-of-care (POC) ultrasound can be a valuable tool in confirming a joint effusion.
Identifying Landmarks and Tibiotalar Joint
To access the tibiotalar joint space, it is important to identify useful landmarks.1 This is best accomplished by having the patient in the supine position, with the affected knee flexed approximately 90° and plantar surface of the foot lying flat on the bed (Figure 1).
Performing the Arthrocentesis
The arthrocentesis is performed under sterile conditions using the high-frequency linear probe. A sterile probe cover is highly recommended if the operator will be using ultrasound to guide the procedure in real time.2 Using the palpable landmarks as a guide, the clinician should align the probe just medial to the tibialis anterior tendon with the probe marker oriented cephalad; scanning should begin superior to the ankle joint. The tibia will appear as a hyperechoic stripe just under a thin soft tissue layer. When the tibia is visible, the clinician should then slide the probe distally. The joint space will demonstrated by visualization of the distal tibia and talus bone (Figure 3).
Pearls and Pitfalls
Point-of-care ultrasound is not only useful to guide arthrocentesis of joint effusions, but also to confirm the presence of an effusion prior to aspiration. At our institution, we have had many cases in which POC ultrasound demonstrated an absence of effusion, and we were able to avoid an unnecessary joint aspiration. Moreover, when an effusion is present, POC ultrasound-guided aspiration avoids complications. The use of POC ultrasound can also increase the confidence of the provider performing arthrocentesis of joints less commonly aspirated.
Summary
Joint aspiration is an important procedural tool for EPs, especially when used to rule out life-threatening conditions such as septic arthritis. Deeper joints and small fluid collections, however, can be difficult to access without image guidance. In the ED setting, POC ultrasound provides a widely available, easy-to-use, low-cost tool to increase the likelihood of success while minimizing damage to adjacent structures.
1. Nagdev A. Ultrasound-guided ankle arthrocentesis. Highland General Hospital Emergency Medicine Ultrasound Web site. http://highlandultrasound.com/ankle-arthrocentesis. Accessed June 8, 2017.
2. Reichman EF, Simon RR. Arthrocentesis. In: Reichman EF, Simon RR, eds. Emergency Medicine Procedures. 2nd ed. McGraw Hill Education: New York, NY; 2013.
Emergency Ultrasound: Tendon Evaluation With Ultrasonography
The vast majority of musculotendinous injuries occur secondary to violent contraction or excessive stretching.1 Ligamentous injuries, on the other hand, are due to an abnormal motion of joints. The magnitude of inciting forces results in a spectrum of pathology, ranging from a minor tear to a complete disruption of structures.
Ultrasonography provides a detailed assessment of soft tissue anatomy and dynamic functionality, and in some instances can be comparable or even superior to magnetic resonance imaging2 because the structural characteristics of certain tendons make them ideal for imaging via ultrasonography. We describe some of these characteristics and highlight their utility in diagnostic imaging.
Anatomical Structure
Tendons consist of tightly packed type I collagen fibers forming subfascicles that are arranged in a parallel distribution as fascicles. These bundles are held together by loose soft tissue, and the entire structure is covered by a thick fibroelastic epitendineum sheath. This linear distribution of structures yields a uniquely linear “fibrillary” pattern when viewed along the longitudinal axis of the structure (Figure 1a). In the short-axis view, the tendon appears as a well-circumscribed structure with speckled pattern of hyperechoic foci (Figure 1b). 3

Imaging Technique
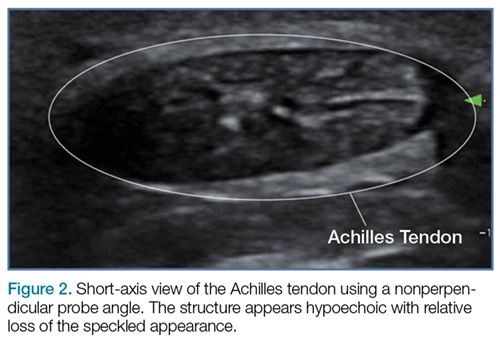
The optimal scanning technique involves the use of a high-frequency linear transducer. Higher frequencies yield more detailed images, but may be limited in patients with deeper structures due to body habitus. A key concept in tendon evaluation is an artifact known as “anisotropy.” This refers to change in appearance of the tendon based on the incident angle of the ultrasound beam. For example, when the probe is held perpendicular to the structure of interest, parallel fibers will reflect the emitted beam toward the probe and thus appear as hyperechoic and speckled, a characteristic of these fibers (Figures 1a and 1b). Contrarily, if the probe is held at a nonperpendicular angle, the reflected beam will not return to the probe, resulting in a hypoechoic appearance (Figure 2).
Pathology
Tendon strains result in varying degrees of fibrous tearing. These tears can range from first-degree tears (a few fibers) to third-degree tears (complete disruption). Partial tears result in focal hematoma formation (Figure 3a) at the region of disruption, appearing on ultrasound as a hypoechoic fluid collection within a hyperechoic fibrillary or speckled tendon structure. If the disruption occurs along the surface of the tendon, a focus of anechoic fluid may be seen surrounding the tendon. Complete tendon ruptures, on the other hand, appear as a hypoechoic void with retracted tendon fragments visualized on either side4 (Figures 3b and 3c). Although complete tears can be more apparent clinically in areas in which a group of tendons performs a cohesive movement (ie, rotator cuff), ultrasound can significantly reduce the rate of delayed diagnosis when physical examination is equivocal.

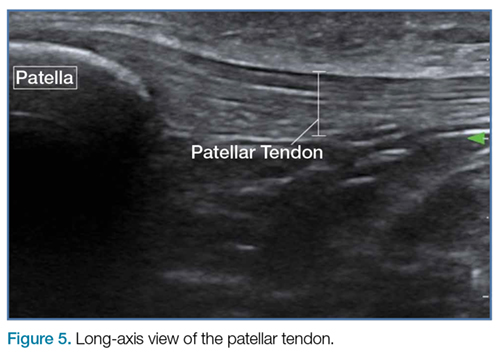
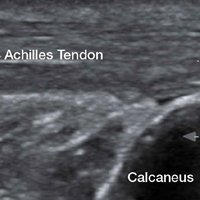
In the appropriate clinical setting, ultrasonography can provide rapid and dynamic assessment of musculotendinous injuries. Lower extremity injuries, including those affecting the Achilles (Figure 1), quadriceps, (Figures 4a and 4b) and patellar tendons (Figure 5), are easier clinical applications.

Assessment of rotator cuff tendons, although more difficult, can provide a specific assessment of shoulder pain.5 In such scenarios, ultrasound can serve a very useful role as an adjunct to the physical examination.
An important point to recognize is that tendons will appear hypoechoic at the insertion point on bone (anthesis) due to increased curvature resulting in lack of anisotropy. This can appear as a pathological finding, but can be accounted for by simply performing a heel-toe or tilt maneuver to arrange the beam perpendicular to the tendon fibers (Figures 6a and 6b).

Summary
Musculotendinous injuries many times present as nonspecific symptoms of pain and/or swelling. In the case of an equivocal physical examination, musculotendinous injuries can be diagnosed with increased accuracy through the use of ultrasound. Understanding the artifactual component of tendon ultrasound can aid the clinician in diagnosing these injuries, enhancing patient care and satisfaction.
1. Geiderman J, Katz D. Geneneral principles in orthopedic injuries. In: Marx JA, Hockberger RS, Walls RM, Biros MH, eds. Rosen’s Emergency Medicine: Concepts and Clinical Practice. Philadelphia, PA: Elsevier Saunders; 2014:49:511-533.
2. Jacobson, Jon A. Musculoskeletal sonography and MR imaging. A role for both imaging methods. Radiol Clin North Am. 1999;37(4):713-735.
3. O’Neill J, ed. Musculoskeletal Ultrasound: Anatomy and Technique. New York, NY: Springer Science+Business Media. 2008:3-17.
4. Dawson M, Mallin M. Introduction to bedside ultrasound. Vol 1. Emergency ultrasound solutions. Lexington, KY: Emergency Ultrasound Solutions; 2012;25:245-248. https://www.aci.health.nsw.gov.au/__data/assets/pdf_file/0009/327852/Introduction_to_Bedside_Ultrasound_Volume_1_-_Matt_and_Mike.pdf. Accessed April 12, 2017.
5. Tran G, Hensor EM, Ray A, Kingsbury SR, O’Connor P, Conaghan PG. Ultrasound-detected pathologies cluster into groups with different clinical outcomes: data from 3000 community referrals for shoulder pain. Arthritis Res Ther. 2017;19(1):30. doi:10.1186/s13075-017-1235-y.
The vast majority of musculotendinous injuries occur secondary to violent contraction or excessive stretching.1 Ligamentous injuries, on the other hand, are due to an abnormal motion of joints. The magnitude of inciting forces results in a spectrum of pathology, ranging from a minor tear to a complete disruption of structures.
Ultrasonography provides a detailed assessment of soft tissue anatomy and dynamic functionality, and in some instances can be comparable or even superior to magnetic resonance imaging2 because the structural characteristics of certain tendons make them ideal for imaging via ultrasonography. We describe some of these characteristics and highlight their utility in diagnostic imaging.
Anatomical Structure
Tendons consist of tightly packed type I collagen fibers forming subfascicles that are arranged in a parallel distribution as fascicles. These bundles are held together by loose soft tissue, and the entire structure is covered by a thick fibroelastic epitendineum sheath. This linear distribution of structures yields a uniquely linear “fibrillary” pattern when viewed along the longitudinal axis of the structure (Figure 1a). In the short-axis view, the tendon appears as a well-circumscribed structure with speckled pattern of hyperechoic foci (Figure 1b). 3
Imaging Technique
The optimal scanning technique involves the use of a high-frequency linear transducer. Higher frequencies yield more detailed images, but may be limited in patients with deeper structures due to body habitus. A key concept in tendon evaluation is an artifact known as “anisotropy.” This refers to change in appearance of the tendon based on the incident angle of the ultrasound beam. For example, when the probe is held perpendicular to the structure of interest, parallel fibers will reflect the emitted beam toward the probe and thus appear as hyperechoic and speckled, a characteristic of these fibers (Figures 1a and 1b). Contrarily, if the probe is held at a nonperpendicular angle, the reflected beam will not return to the probe, resulting in a hypoechoic appearance (Figure 2).
Pathology
Tendon strains result in varying degrees of fibrous tearing. These tears can range from first-degree tears (a few fibers) to third-degree tears (complete disruption). Partial tears result in focal hematoma formation (Figure 3a) at the region of disruption, appearing on ultrasound as a hypoechoic fluid collection within a hyperechoic fibrillary or speckled tendon structure. If the disruption occurs along the surface of the tendon, a focus of anechoic fluid may be seen surrounding the tendon. Complete tendon ruptures, on the other hand, appear as a hypoechoic void with retracted tendon fragments visualized on either side4 (Figures 3b and 3c). Although complete tears can be more apparent clinically in areas in which a group of tendons performs a cohesive movement (ie, rotator cuff), ultrasound can significantly reduce the rate of delayed diagnosis when physical examination is equivocal.
In the appropriate clinical setting, ultrasonography can provide rapid and dynamic assessment of musculotendinous injuries. Lower extremity injuries, including those affecting the Achilles (Figure 1), quadriceps, (Figures 4a and 4b) and patellar tendons (Figure 5), are easier clinical applications.
Assessment of rotator cuff tendons, although more difficult, can provide a specific assessment of shoulder pain.5 In such scenarios, ultrasound can serve a very useful role as an adjunct to the physical examination.
An important point to recognize is that tendons will appear hypoechoic at the insertion point on bone (anthesis) due to increased curvature resulting in lack of anisotropy. This can appear as a pathological finding, but can be accounted for by simply performing a heel-toe or tilt maneuver to arrange the beam perpendicular to the tendon fibers (Figures 6a and 6b).
Summary
Musculotendinous injuries many times present as nonspecific symptoms of pain and/or swelling. In the case of an equivocal physical examination, musculotendinous injuries can be diagnosed with increased accuracy through the use of ultrasound. Understanding the artifactual component of tendon ultrasound can aid the clinician in diagnosing these injuries, enhancing patient care and satisfaction.
1. Geiderman J, Katz D. Geneneral principles in orthopedic injuries. In: Marx JA, Hockberger RS, Walls RM, Biros MH, eds. Rosen’s Emergency Medicine: Concepts and Clinical Practice. Philadelphia, PA: Elsevier Saunders; 2014:49:511-533.
2. Jacobson, Jon A. Musculoskeletal sonography and MR imaging. A role for both imaging methods. Radiol Clin North Am. 1999;37(4):713-735.
3. O’Neill J, ed. Musculoskeletal Ultrasound: Anatomy and Technique. New York, NY: Springer Science+Business Media. 2008:3-17.
4. Dawson M, Mallin M. Introduction to bedside ultrasound. Vol 1. Emergency ultrasound solutions. Lexington, KY: Emergency Ultrasound Solutions; 2012;25:245-248. https://www.aci.health.nsw.gov.au/__data/assets/pdf_file/0009/327852/Introduction_to_Bedside_Ultrasound_Volume_1_-_Matt_and_Mike.pdf. Accessed April 12, 2017.
5. Tran G, Hensor EM, Ray A, Kingsbury SR, O’Connor P, Conaghan PG. Ultrasound-detected pathologies cluster into groups with different clinical outcomes: data from 3000 community referrals for shoulder pain. Arthritis Res Ther. 2017;19(1):30. doi:10.1186/s13075-017-1235-y.
Emergency Ultrasound: Tips and Tricks for Imaging Digits
Clinicians familiar with point-of-care (POC) ultrasound know that structures such as the hands and feet require the use of the linear high-frequency transducer to obtain quality images. In reality, however, employing the standard technique (ie, applying gel to the probe surface and scanning the structure) can be challenging due to the uneven surfaces of the fingers and toes; therefore, obtaining good contact with the transducer is harder than it may seem at first glance. Additionally, since these structures are superficial, they are usually seen on the top half of the ultrasound display, while the focal zone of most ultrasound machines is located in the middle of the display and is nonadjustable.
We describe two simple adjuncts to POC ultrasound that can assist in visualizing digital structures with greater ease and improved image resolution: the water bath1,2 and standoff pad techniques.
Water Bath Technique
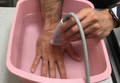
In the water bath technique, one fills a small basin with lukewarm water to a depth point where the extremity being studied (ie, hand or foot) is mostly—but not completely—submerged in the water bath. After the extremity is submerged, the high-frequency probe is then placed into the water bath (Figure 1). When employing this technique, the transducer does not need to make contact with the patient’s skin. Since the water acts as an excellent conduction medium for sound waves, no ultrasound gel is required. For a video demonstrating the use of the water bath technique to evaluate the distal tip of the finger, see below.

Standoff Pad
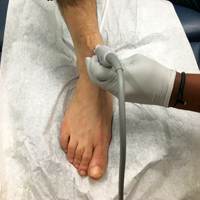
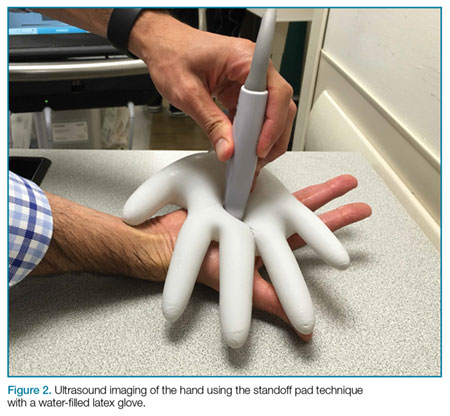
Another technique that enhances POC imaging of the digits involves a standoff pad. A variety of commercially available standoff pads can be used for this technique. Alternatively, the clinician can easily create a standoff pad using supplies that are readily available in the ED. One such method is to fill a latex glove with water, tie off the filled glove, and place it on top of the extremity to be imaged (Figure 2). The water in the glove will facilitate sound-wave transmission.
Pathology
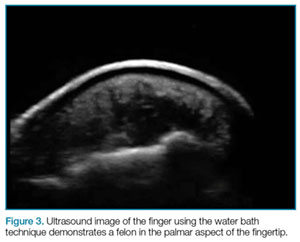
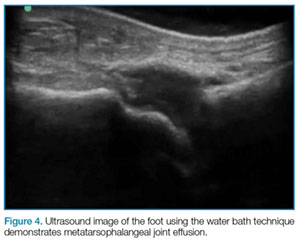
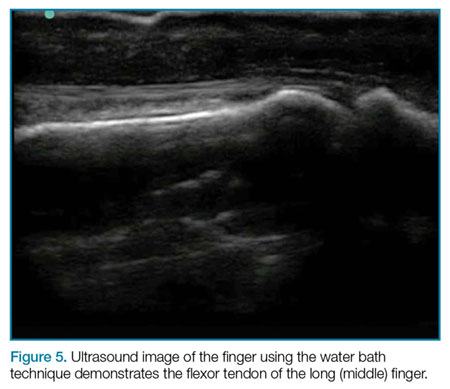
The water bath and standoff pad techniques can facilitate visualization of several pathologies, including felons (Figure 3), flexor tenosynovitis, phalangeal and metacarpal/metatarsal fractures, and interphalangeal, metacarpophalangeal, and metatarsophalangeal joint effusions (Figure 4). In addition, these techniques also assist in visualizing digit tendons to evaluate for tears in these structures (Figure 5).
Summary
Point-of-care ultrasound imaging to evaluate superficial body parts such as hands or feet can be challenging due to the irregular shape and uneven surface of these structures. The employment of adjuncts such as the water bath or standoff pad techniques can mitigate these challenges, facilitating the acquisition of high-resolution images and providing easier identification of pathology.
1. Krishnamurthy R, Yoo JH, Thapa M, Callahan MJ. Water-bath method for sonographic evaluation of superficial structures of the extremities in children. Pediatr Radiol. 2013;4(Suppl 1):S41-S47. DOI:10.1007/s00247-012-2592-y.
2. Jeong HY, Krishnamurthy R. 1012: Water-bath method for sonographic evaluation of superficial structures of the extremities. Ultrasound Med Biol. 2009;35(8):S101-S102. doi:10.1016/j.ultrasmedbio.2009.06.394.
Clinicians familiar with point-of-care (POC) ultrasound know that structures such as the hands and feet require the use of the linear high-frequency transducer to obtain quality images. In reality, however, employing the standard technique (ie, applying gel to the probe surface and scanning the structure) can be challenging due to the uneven surfaces of the fingers and toes; therefore, obtaining good contact with the transducer is harder than it may seem at first glance. Additionally, since these structures are superficial, they are usually seen on the top half of the ultrasound display, while the focal zone of most ultrasound machines is located in the middle of the display and is nonadjustable.
We describe two simple adjuncts to POC ultrasound that can assist in visualizing digital structures with greater ease and improved image resolution: the water bath1,2 and standoff pad techniques.
Water Bath Technique
In the water bath technique, one fills a small basin with lukewarm water to a depth point where the extremity being studied (ie, hand or foot) is mostly—but not completely—submerged in the water bath. After the extremity is submerged, the high-frequency probe is then placed into the water bath (Figure 1). When employing this technique, the transducer does not need to make contact with the patient’s skin. Since the water acts as an excellent conduction medium for sound waves, no ultrasound gel is required. For a video demonstrating the use of the water bath technique to evaluate the distal tip of the finger, see below.
Standoff Pad
Another technique that enhances POC imaging of the digits involves a standoff pad. A variety of commercially available standoff pads can be used for this technique. Alternatively, the clinician can easily create a standoff pad using supplies that are readily available in the ED. One such method is to fill a latex glove with water, tie off the filled glove, and place it on top of the extremity to be imaged (Figure 2). The water in the glove will facilitate sound-wave transmission.
Pathology
The water bath and standoff pad techniques can facilitate visualization of several pathologies, including felons (Figure 3), flexor tenosynovitis, phalangeal and metacarpal/metatarsal fractures, and interphalangeal, metacarpophalangeal, and metatarsophalangeal joint effusions (Figure 4). In addition, these techniques also assist in visualizing digit tendons to evaluate for tears in these structures (Figure 5).
Summary
Point-of-care ultrasound imaging to evaluate superficial body parts such as hands or feet can be challenging due to the irregular shape and uneven surface of these structures. The employment of adjuncts such as the water bath or standoff pad techniques can mitigate these challenges, facilitating the acquisition of high-resolution images and providing easier identification of pathology.
1. Krishnamurthy R, Yoo JH, Thapa M, Callahan MJ. Water-bath method for sonographic evaluation of superficial structures of the extremities in children. Pediatr Radiol. 2013;4(Suppl 1):S41-S47. DOI:10.1007/s00247-012-2592-y.
2. Jeong HY, Krishnamurthy R. 1012: Water-bath method for sonographic evaluation of superficial structures of the extremities. Ultrasound Med Biol. 2009;35(8):S101-S102. doi:10.1016/j.ultrasmedbio.2009.06.394.
Emergency Ultrasound: Ultrasound-Guided Ulnar, Median, and Radial Nerve Blocks
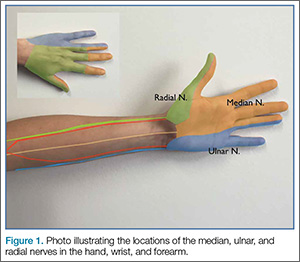
Emergency physicians (EPs) have traditionally used the landmark technique to block the radial, ulnar, and median nerves at the wrist (Figure 1). Many times, however, there is a need to perform the block more proximally. Performing these blocks with real-time ultrasound guidance allows the clinician to visually target the nerve, requires less anesthetic agent, and helps to avoid vascular structures. As with any procedure, employing the appropriate technique, along with practice, increases the success of the block.
Patient Selection
Before performing a nerve block, the EP must first determine if the patient is an appropriate candidate. The EP should be cautious in performing a nerve block on any patient who has paresthesias, tingling, or weakness, as the block will complicate further examinations. Likewise, a nerve block may be contraindicated in a patient in whom compartment syndrome is a concern, since the analgesic effect will inhibit the patient’s ability to sense increasing pain or worsening paresthesias.
Equipment and Preprocedure Care
An ultrasound-guided nerve block is performed using the linear high-frequency probe. Prior to the procedure, standard infection-control measures should be taken—ie, thoroughly cleaning the preinjection site and using a transducer-probe cover. Regarding the choice of anesthetic, either bupivacaine or lidocaine is appropriate; however, bupivacaine will provide a longer duration of analgesia. To administer the anesthetic, we typically use a regular cutting needle or a spinal needle. A review of the literature typically suggests either noncutting needle tips or tips with short bevels. There is a paucity of data on needle tip selection. The use of noncutting needle tips or tips with short bevels may be a better choice than a regular cutting needle or a spinal needle because they may decrease the chance of intraneural injection and consequent nerve injury.
Single- Versus Two-Person Technique
Peripheral nerve blocks can be performed using either a single- or two-person technique. In the one-person technique, the operator manipulates both the probe and the syringe. The two-person technique, however, requires the addition of tubing between the needle and the syringe. This can be done with the addition of a small section of intravenous (IV) tubing or by connecting two pieces of tubing together (the type traditionally placed on IV catheters). The operator holds the needle and the probe while the syringe and injection are controlled by the second person. Then, with the ultrasound machine set at the nerve or soft-tissue presetting, the scan begins by placing the probe in a transverse orientation.
Nerve Location and Identification
As previously noted, the ulnar, median, and radial nerves have traditionally been identified through use of the landmark technique just proximal to the wrist. The nerves can be located initially at these sites and then traced proximally.
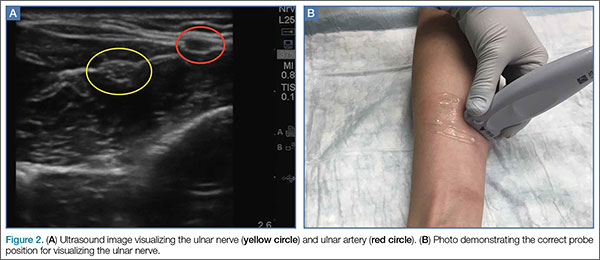
Ulnar Nerve
The ulnar nerve is located on the ulnar side of the forearm, just proximal to the wrist. (Figure 2a and 2b). The clinician should begin by fanning the probe at the wrist to find the ulnar artery and locate the nerve bundle. The ulnar nerve is also located on the ulnar side of the ulnar artery. The nerve will diverge from the path of the artery as it is traced proximally. To decrease the chance of an arterial injection/injury, the clinician should administer a nerve block after separating these two structures.
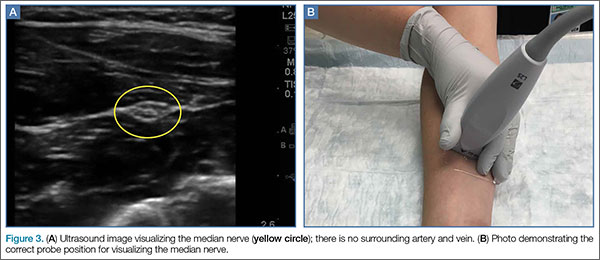
Median Nerve
The clinician can employ the landmark approach to help find the nerve; then the scan should begin at the carpal tunnel. On ultrasound, the tendons in the carpal tunnel will appear similar to nerves (ie, round and hyperechoic) compared to surrounding muscle. As one continues to slide the probe up the forearm, the tendons will become muscles and a single hyperechoic structure will remain—the median nerve running in between the flexor digitorum superificialis and the flexor digitorum profundus (Figure 3a and 3b). Since there is no artery alongside the median nerve, it can be traced proximally; therefore, the procedure can be performed in any convenient location.
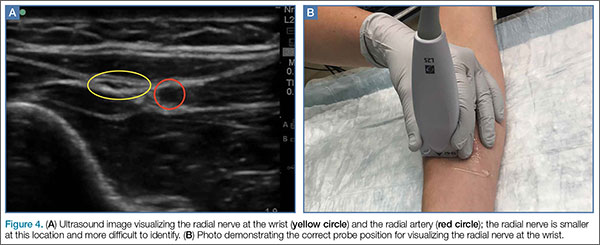
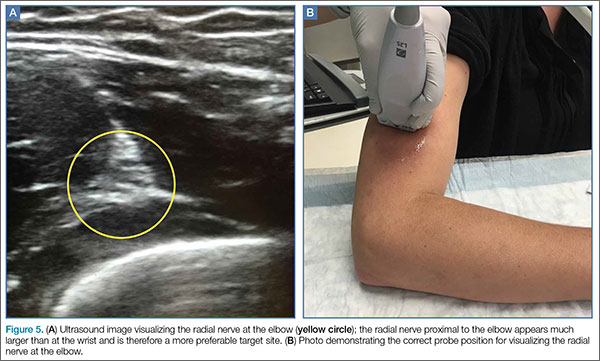
Radial Nerve
Of the three nerves, the radial nerve is the most challenging to visualize on ultrasound. There are two approaches to performing a radial nerve block. In the first approach, the radial nerve can be found just proximal to the wrist crease on the radial side of the radial artery (Figure 4a and 4b). This nerve is typically much smaller and harder to visualize at this level; it can be traced proximally and the block performed at this location. In the second approach, the radial nerve can be located 3 to 4 cm proximal to the elbow with the probe located anterolaterally (Figure 5a and 5b). In this location, the radial nerve lies between the brachialis and the brachioradialis muscles. In this approach, the nerve is much larger and easier to visualize.
Performing the Block
Prior to performing an anesthetic block at the ulnar, median, or radial nerve at the wrist, the clinician should first place the patient in a sitting or supine position with the appropriate elbow extended. When performing the block at the radial nerve above the elbow, the hand is typically placed in a resting position on the patient’s abdomen. When localizing the nerve, the angle of the transducer can vary the appearance of the nerve dramatically. To ensure the best possible view, the clinician should slowly “rock” the probe back and forth 10° to 20° in plane with the long axis of the arm, making sure the probe is placed as perpendicular as possible to the nerve. Once the nerve is identified, the clinician can follow it up and down the forearm with the probe to identify the best site to perform the block. In the optimal location, there should be a clear path that is as superficial as possible and avoids any vascular structures. We prefer using an in-plane technique to perform the nerve block to visualize the entire needle as it approaches the nerve. Once the site has been determined, the clinician should slowly inject 4 to 5 cc of anesthetic around the nerve, with the objective to partially surround the nerve. There is no need to completely surround the nerve, as doing so is not necessary to achieve a successful block. The clinician should stop immediately if the patient reports pain or if there is increased resistance, because this could indicate an intraneural injection.
Summary
Ultrasound-guided peripheral nerve blocks are an excellent option for providing regional anesthesia to lacerations and wounds that are too large for a local anesthetic. This technique can provide better analgesic relief, enhancing patient care.
Emergency physicians (EPs) have traditionally used the landmark technique to block the radial, ulnar, and median nerves at the wrist (Figure 1). Many times, however, there is a need to perform the block more proximally. Performing these blocks with real-time ultrasound guidance allows the clinician to visually target the nerve, requires less anesthetic agent, and helps to avoid vascular structures. As with any procedure, employing the appropriate technique, along with practice, increases the success of the block.
Patient Selection
Before performing a nerve block, the EP must first determine if the patient is an appropriate candidate. The EP should be cautious in performing a nerve block on any patient who has paresthesias, tingling, or weakness, as the block will complicate further examinations. Likewise, a nerve block may be contraindicated in a patient in whom compartment syndrome is a concern, since the analgesic effect will inhibit the patient’s ability to sense increasing pain or worsening paresthesias.
Equipment and Preprocedure Care
An ultrasound-guided nerve block is performed using the linear high-frequency probe. Prior to the procedure, standard infection-control measures should be taken—ie, thoroughly cleaning the preinjection site and using a transducer-probe cover. Regarding the choice of anesthetic, either bupivacaine or lidocaine is appropriate; however, bupivacaine will provide a longer duration of analgesia. To administer the anesthetic, we typically use a regular cutting needle or a spinal needle. A review of the literature typically suggests either noncutting needle tips or tips with short bevels. There is a paucity of data on needle tip selection. The use of noncutting needle tips or tips with short bevels may be a better choice than a regular cutting needle or a spinal needle because they may decrease the chance of intraneural injection and consequent nerve injury.
Single- Versus Two-Person Technique
Peripheral nerve blocks can be performed using either a single- or two-person technique. In the one-person technique, the operator manipulates both the probe and the syringe. The two-person technique, however, requires the addition of tubing between the needle and the syringe. This can be done with the addition of a small section of intravenous (IV) tubing or by connecting two pieces of tubing together (the type traditionally placed on IV catheters). The operator holds the needle and the probe while the syringe and injection are controlled by the second person. Then, with the ultrasound machine set at the nerve or soft-tissue presetting, the scan begins by placing the probe in a transverse orientation.
Nerve Location and Identification
As previously noted, the ulnar, median, and radial nerves have traditionally been identified through use of the landmark technique just proximal to the wrist. The nerves can be located initially at these sites and then traced proximally.
Ulnar Nerve
The ulnar nerve is located on the ulnar side of the forearm, just proximal to the wrist. (Figure 2a and 2b). The clinician should begin by fanning the probe at the wrist to find the ulnar artery and locate the nerve bundle. The ulnar nerve is also located on the ulnar side of the ulnar artery. The nerve will diverge from the path of the artery as it is traced proximally. To decrease the chance of an arterial injection/injury, the clinician should administer a nerve block after separating these two structures.
Median Nerve
The clinician can employ the landmark approach to help find the nerve; then the scan should begin at the carpal tunnel. On ultrasound, the tendons in the carpal tunnel will appear similar to nerves (ie, round and hyperechoic) compared to surrounding muscle. As one continues to slide the probe up the forearm, the tendons will become muscles and a single hyperechoic structure will remain—the median nerve running in between the flexor digitorum superificialis and the flexor digitorum profundus (Figure 3a and 3b). Since there is no artery alongside the median nerve, it can be traced proximally; therefore, the procedure can be performed in any convenient location.
Radial Nerve
Of the three nerves, the radial nerve is the most challenging to visualize on ultrasound. There are two approaches to performing a radial nerve block. In the first approach, the radial nerve can be found just proximal to the wrist crease on the radial side of the radial artery (Figure 4a and 4b). This nerve is typically much smaller and harder to visualize at this level; it can be traced proximally and the block performed at this location. In the second approach, the radial nerve can be located 3 to 4 cm proximal to the elbow with the probe located anterolaterally (Figure 5a and 5b). In this location, the radial nerve lies between the brachialis and the brachioradialis muscles. In this approach, the nerve is much larger and easier to visualize.
Performing the Block
Prior to performing an anesthetic block at the ulnar, median, or radial nerve at the wrist, the clinician should first place the patient in a sitting or supine position with the appropriate elbow extended. When performing the block at the radial nerve above the elbow, the hand is typically placed in a resting position on the patient’s abdomen. When localizing the nerve, the angle of the transducer can vary the appearance of the nerve dramatically. To ensure the best possible view, the clinician should slowly “rock” the probe back and forth 10° to 20° in plane with the long axis of the arm, making sure the probe is placed as perpendicular as possible to the nerve. Once the nerve is identified, the clinician can follow it up and down the forearm with the probe to identify the best site to perform the block. In the optimal location, there should be a clear path that is as superficial as possible and avoids any vascular structures. We prefer using an in-plane technique to perform the nerve block to visualize the entire needle as it approaches the nerve. Once the site has been determined, the clinician should slowly inject 4 to 5 cc of anesthetic around the nerve, with the objective to partially surround the nerve. There is no need to completely surround the nerve, as doing so is not necessary to achieve a successful block. The clinician should stop immediately if the patient reports pain or if there is increased resistance, because this could indicate an intraneural injection.
Summary
Ultrasound-guided peripheral nerve blocks are an excellent option for providing regional anesthesia to lacerations and wounds that are too large for a local anesthetic. This technique can provide better analgesic relief, enhancing patient care.
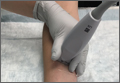
Clinical Pearls for the Extended Focused Assessment With Sonography for Trauma Examination
The extended focused assessment with sonography for trauma (EFAST) examination provides rapid point-of-care (POC) evaluation of patients with thoracoabdominal trauma. This article offers essential clinical pearls to ensure an accurate and thorough examination, including tips on proper gain adjustment, correct probe fanning, shadow removal, visualization of the paracolic gutters, seeking the “spine sign” to determine effusion, and assessing effusion or consolidation of the lung.
Turning Down the Gain
Too much gain (signal amplification) will wash out the ultrasound image, making it challenging to detect small quantities of free fluid. This is especially true in the pelvic windows. Sound waves travel easily through the fluid-filled bladder and a posterior acoustic enhancement artifact will make the far field of the image appear too bright, obscuring small quantities of fluid (Figure 1). To correct this issue without changing the gain of the entire image, the far-field gain can be adjusted on most ultrasound devices by using the time-gain compensation bar or a far field gain knob.
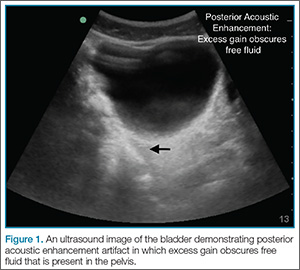
Fanning Is Key
With the probe placed at a single location on the skin, one can dramatically change the structures visualized by fanning (tilting the probe). The image visualized on the ultrasound screen represents only a single slice of the anatomy—one that is about the thickness of a credit card. A single image therefore can only show structures that are within that thin beam of the probe. Just as one would not make a clinical decision based on a single-slice computed tomography (CT) scan image, the same is true of ultrasound. By fanning the probe toward the anterior and posterior abdomen, the clinician will catch smaller quantities of free fluid within each quadrant. A good rule of thumb is to scan through the entire organ of interest from edge-to-edge (eg, the entire bladder when imaging the pelvic window; the entire kidney in the right upper quadrant (RUQ) window; the entire spleen in the left upper quadrant [LUQ]).
Get Rid of the Rib Shadows
The RUQ and LUQ windows can be difficult to visualize when the view is obscured by rib shadows. To minimize/remove rib shadows, some clinicians prefer to use the phased array probe, which has a small footprint that fits easily in the intercostal space. Clinicians who prefer using the curvilinear probe should place the probe at an oblique angle (Figure 2); this probe will fit between the ribs and remove shadowing artifacts.
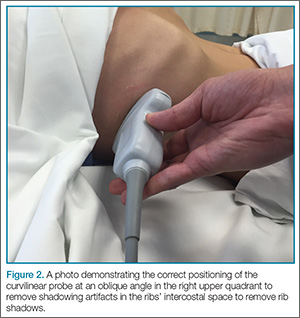
Remember the Paracolic
In some patients, the paracolic gutters are the most dependent portion of the abdomen and the first place where free fluid collects. When evaluating the RUQ, the clinician should first identify Morrison’s pouch, which is the interface between the liver and the kidney. After this pouch has been identified, the clinician should slide the probe toward the patient’s feet, paying close attention to the area around the inferior tip of the liver, and continue sliding the probe down to the inferior tip of the kidney, looking for fluid layering above the kidney or the psoas muscle (Figure 3). The same holds true for the LUQ technique. Once one has looked between the spleen and the diaphragm for free fluid, the probe should be moved down to the flank to evaluate the inferior tip of the spleen and the region anterior to the kidney.
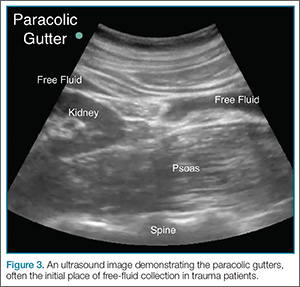
The Left Upper Quadrant—Do Not Let the Stomach Fake You Out
A fluid-filled stomach can be a fake-out for free fluid appearing black on ultrasound (Figure 4). Remember, free fluid in the LUQ window will typically appear between the spleen and the diaphragm or at either pole of the spleen, so the clinician should pay particular attention to these areas. When evaluating the LUQ, a good rule of thumb is to place one’s hand on the patient’s bed while holding the probe; this will ensure that the scan is sufficiently posterior. The probe may also need to be fanned toward the bed to identify the kidneys in the retroperitoneum.
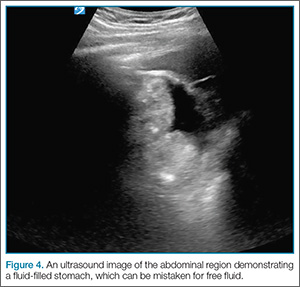
Look in the Chest and Remember the Spine Sign
Rapidly identifying a hemothorax can be a critical finding on the EFAST examination. Therefore, it is important to remember that air in the lungs scatters sound waves, so one does not normally visualize distinct structures that are deep to the pleural line. This is why the spine is not typically visible in the chest above the level of the diaphragm. When pathology is present, however, the sound waves are not blocked by air-filled lungs and one can see the “spine sign,” which suggests the presence of either effusion or consolidation of the lung (Figure 5).
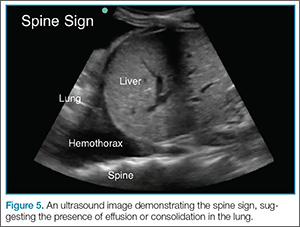
Tough Cardiac Window? Try These Tips
A subxiphoid window is typically used to assess for pericardial effusion. To obtain this view, the clinician usually needs to increase the depth setting by a few centimeters (typically to around 18 cm). When the patient is able to do so, he or she may assist in the examination by bending his or her knees or taking a deep breath to help bring the heart into view. Despite these efforts, however, in some patients, it is technically impossible to obtain a subxiphoid view. In such cases, switching to an alternate view, such as the parasternal window, may be successful in visualizing the subxiphoid region.
Summary
Proper gain adjustment, thorough scanning of the thoracoabdominal region, and knowledge of common artifacts and signs are essential to ensuring an accurate and thorough POC EFAST examination.
The extended focused assessment with sonography for trauma (EFAST) examination provides rapid point-of-care (POC) evaluation of patients with thoracoabdominal trauma. This article offers essential clinical pearls to ensure an accurate and thorough examination, including tips on proper gain adjustment, correct probe fanning, shadow removal, visualization of the paracolic gutters, seeking the “spine sign” to determine effusion, and assessing effusion or consolidation of the lung.
Turning Down the Gain
Too much gain (signal amplification) will wash out the ultrasound image, making it challenging to detect small quantities of free fluid. This is especially true in the pelvic windows. Sound waves travel easily through the fluid-filled bladder and a posterior acoustic enhancement artifact will make the far field of the image appear too bright, obscuring small quantities of fluid (Figure 1). To correct this issue without changing the gain of the entire image, the far-field gain can be adjusted on most ultrasound devices by using the time-gain compensation bar or a far field gain knob.
Fanning Is Key
With the probe placed at a single location on the skin, one can dramatically change the structures visualized by fanning (tilting the probe). The image visualized on the ultrasound screen represents only a single slice of the anatomy—one that is about the thickness of a credit card. A single image therefore can only show structures that are within that thin beam of the probe. Just as one would not make a clinical decision based on a single-slice computed tomography (CT) scan image, the same is true of ultrasound. By fanning the probe toward the anterior and posterior abdomen, the clinician will catch smaller quantities of free fluid within each quadrant. A good rule of thumb is to scan through the entire organ of interest from edge-to-edge (eg, the entire bladder when imaging the pelvic window; the entire kidney in the right upper quadrant (RUQ) window; the entire spleen in the left upper quadrant [LUQ]).
Get Rid of the Rib Shadows
The RUQ and LUQ windows can be difficult to visualize when the view is obscured by rib shadows. To minimize/remove rib shadows, some clinicians prefer to use the phased array probe, which has a small footprint that fits easily in the intercostal space. Clinicians who prefer using the curvilinear probe should place the probe at an oblique angle (Figure 2); this probe will fit between the ribs and remove shadowing artifacts.
Remember the Paracolic
In some patients, the paracolic gutters are the most dependent portion of the abdomen and the first place where free fluid collects. When evaluating the RUQ, the clinician should first identify Morrison’s pouch, which is the interface between the liver and the kidney. After this pouch has been identified, the clinician should slide the probe toward the patient’s feet, paying close attention to the area around the inferior tip of the liver, and continue sliding the probe down to the inferior tip of the kidney, looking for fluid layering above the kidney or the psoas muscle (Figure 3). The same holds true for the LUQ technique. Once one has looked between the spleen and the diaphragm for free fluid, the probe should be moved down to the flank to evaluate the inferior tip of the spleen and the region anterior to the kidney.
The Left Upper Quadrant—Do Not Let the Stomach Fake You Out
A fluid-filled stomach can be a fake-out for free fluid appearing black on ultrasound (Figure 4). Remember, free fluid in the LUQ window will typically appear between the spleen and the diaphragm or at either pole of the spleen, so the clinician should pay particular attention to these areas. When evaluating the LUQ, a good rule of thumb is to place one’s hand on the patient’s bed while holding the probe; this will ensure that the scan is sufficiently posterior. The probe may also need to be fanned toward the bed to identify the kidneys in the retroperitoneum.
Look in the Chest and Remember the Spine Sign
Rapidly identifying a hemothorax can be a critical finding on the EFAST examination. Therefore, it is important to remember that air in the lungs scatters sound waves, so one does not normally visualize distinct structures that are deep to the pleural line. This is why the spine is not typically visible in the chest above the level of the diaphragm. When pathology is present, however, the sound waves are not blocked by air-filled lungs and one can see the “spine sign,” which suggests the presence of either effusion or consolidation of the lung (Figure 5).
Tough Cardiac Window? Try These Tips
A subxiphoid window is typically used to assess for pericardial effusion. To obtain this view, the clinician usually needs to increase the depth setting by a few centimeters (typically to around 18 cm). When the patient is able to do so, he or she may assist in the examination by bending his or her knees or taking a deep breath to help bring the heart into view. Despite these efforts, however, in some patients, it is technically impossible to obtain a subxiphoid view. In such cases, switching to an alternate view, such as the parasternal window, may be successful in visualizing the subxiphoid region.
Summary
Proper gain adjustment, thorough scanning of the thoracoabdominal region, and knowledge of common artifacts and signs are essential to ensuring an accurate and thorough POC EFAST examination.
Emergency Ultrasound: Musculoskeletal Shoulder Dislocation
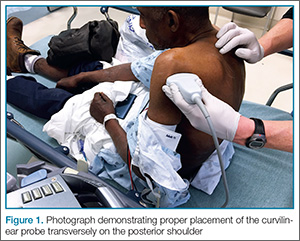
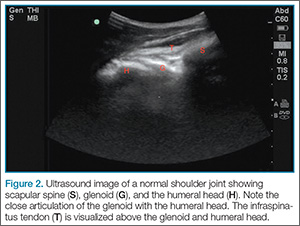
Point-of-care (POC) ultrasound is a great adjunct to the evaluation and treatment of shoulder dislocations. This modality can assist with identification of the dislocation—especially posterior dislocations, which can be notoriously difficult to diagnose on plain radiography.1,2 Moreover, it can aid with reduction by guiding intra-articular anesthetic injection, regional anesthesia with an interscalene brachial plexus nerve block, or suprascapular nerve block. Following treatment, POC ultrasound also can immediately confirm successful reduction.
Imaging Technique

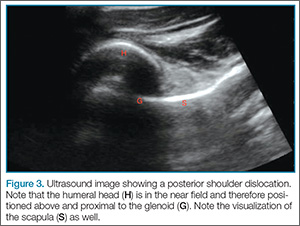
Facilitation of Reduction
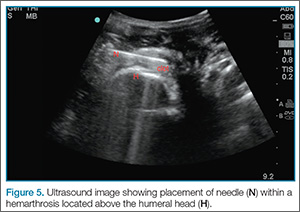
Summary
Bedside ultrasound is an excellent adjunct to traditional radiographs in the evaluation of patients presenting with shoulder injuries. In addition to its high sensitivity in detecting dislocation, this modality can be used to guide intra-articular treatment and to confirm successful reduction.
Dr Meer is an assistant professor and director of emergency ultrasound, department of emergency medicine, Emory University School of Medicine, Atlanta. Dr Beck is an assistant professor, department of emergency medicine, Emory University School of Medicine, Atlanta. Dr Taylor is an assistant professor and director of postgraduate medical education, department of emergency medicine, Emory University School of Medicine, Atlanta.
- Abbasi S, Molaie H, Hafezimoghadam P, et al. Diagnostic accuracy of ultrasonographic examination in the management of shoulder dislocation in the emergency department. Ann Emerg Med. 2013;62(2):170-175. doi:10.1016/j.annemergmed.2013.01.022.
- Beck S, Chilstrom M. Point-of-care ultrasound diagnosis and treatment of posterior shoulder dislocation. Am J Emerg Med. 2013;31(2):449.e3-449.e5. doi:10.1016/j.ajem.2012.06.017.
- Breslin K, Boniface K, Cohen J. Ultrasound-guided intra-articular lidocaine block for reduction of anterior shoulder dislocation in the pediatric emergency department. Pediatr Emerg Care. 2014;30(3):217-220. doi:10.1097/PEC.0000000000000095.
Point-of-care (POC) ultrasound is a great adjunct to the evaluation and treatment of shoulder dislocations. This modality can assist with identification of the dislocation—especially posterior dislocations, which can be notoriously difficult to diagnose on plain radiography.1,2 Moreover, it can aid with reduction by guiding intra-articular anesthetic injection, regional anesthesia with an interscalene brachial plexus nerve block, or suprascapular nerve block. Following treatment, POC ultrasound also can immediately confirm successful reduction.
Imaging Technique
Facilitation of Reduction
Summary
Bedside ultrasound is an excellent adjunct to traditional radiographs in the evaluation of patients presenting with shoulder injuries. In addition to its high sensitivity in detecting dislocation, this modality can be used to guide intra-articular treatment and to confirm successful reduction.
Dr Meer is an assistant professor and director of emergency ultrasound, department of emergency medicine, Emory University School of Medicine, Atlanta. Dr Beck is an assistant professor, department of emergency medicine, Emory University School of Medicine, Atlanta. Dr Taylor is an assistant professor and director of postgraduate medical education, department of emergency medicine, Emory University School of Medicine, Atlanta.
- Abbasi S, Molaie H, Hafezimoghadam P, et al. Diagnostic accuracy of ultrasonographic examination in the management of shoulder dislocation in the emergency department. Ann Emerg Med. 2013;62(2):170-175. doi:10.1016/j.annemergmed.2013.01.022.
- Beck S, Chilstrom M. Point-of-care ultrasound diagnosis and treatment of posterior shoulder dislocation. Am J Emerg Med. 2013;31(2):449.e3-449.e5. doi:10.1016/j.ajem.2012.06.017.
- Breslin K, Boniface K, Cohen J. Ultrasound-guided intra-articular lidocaine block for reduction of anterior shoulder dislocation in the pediatric emergency department. Pediatr Emerg Care. 2014;30(3):217-220. doi:10.1097/PEC.0000000000000095.
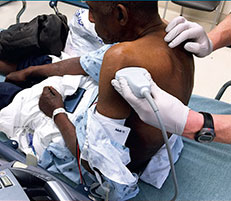
Emergency Ultrasound: Deep Vein Thrombosis
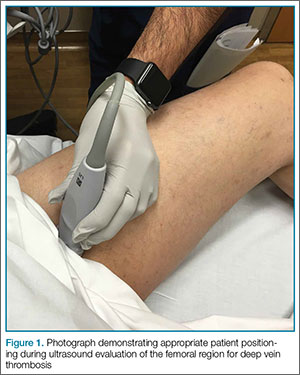
Femoral and Saphenous Vein
After the appropriate positioning has been achieved, the clinician should identify the common femoral vein and artery, and then slide the probe toward the head or feet until the saphenous vein, which empties into the common femoral vein, is identified 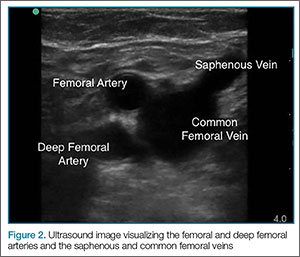
The clinician should take care not to apply too much pressure with the probe as this will compress the saphenous vein; therefore, it is important to use a light touch to ensure proper visualization. Once this key region is identified, the clinician should then use the probe to apply pressure to the vessels. The saphenous vein should compress completely upon application of sufficient pressure to the artery. In a normal vein, the anterior and posterior walls should touch and completely obliterate the lumen of the vein. When a clot is present, the walls of the vein will remain separated (Figure 3). A thrombus can be bright on ultrasound, but some DVTs may appear completely black. In some cases, a lack of compressibility may be the only tip-off to the presence of clot. 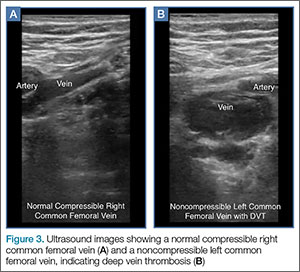
After fully evaluating the saphenous vein, the clinician should move the probe toward the feet, keeping the vessels centered in the image, while at the same time applying serial compression approximately every centimeter. As the probe is moved distally, the artery will typically bifurcate first and then the vein will bifurcate into the femoral and deep femoral branches. The femoral vein should be followed until it “dives” into the adductor canal.
Popliteal Region
The second zone of the examination is in the popliteal region. It can be helpful to prop the foot up, or hang the foot off the bed to improve access to this region (Figure 4). Similar to the femoral region, maximizing your depth and then decreasing it once the vessels are identified can help to ensure that you are not mistaking superficial vessels 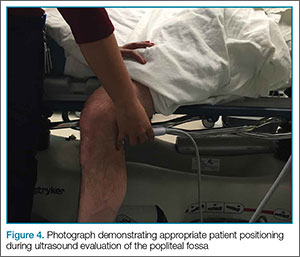
Common Pitfalls
The main pitfall to performing a DVT study is failing to identify the correct vessels. It is important to identify both the artery and vein running together to ensure that the correct location. In larger patients, the relatively shallow depth of the high-frequency 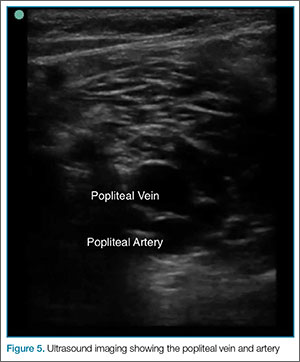
Another common pitfall to keep in mind is that lymph nodes can often be mistaken for clot (Figure 6). A lymph node may be distinguished from a clot by sliding the probe up and down the patient’s leg—lymph nodes will appear as discrete structures, continuous like vasculature. It is essential to evaluate the length of the common femoral, the femoral, and popliteal veins visualized as a recent study by Adhikari et al1 showed that two-point compression studies can miss up to 6% of isolated clots.
Summary
With practice, POC compression ultrasonography of the lower extremities can be used to quickly rule in the diagnosis DVT. Proper patient and probe positioning, as well as the application of appropriate probe pressure at different stages of the examination are essential to accurately visualize and assess the femoral, saphenous, and popliteal veins for the presence of a thrombus.
For a video and more information on performing this scan: 
Dr Meer is an assistant professor and director of emergency ultrasound, department of emergency medicine, Emory University School of Medicine, Atlanta, Georgia. Dr Beck is an assistant professor, department of emergency medicine, Emory University School of Medicine, Atlanta, Georgia. Dr Taylor is an assistant professor and director of postgraduate medical education, department of emergency medicine, Emory University School of Medicine, Atlanta, Georgia.
- Emergency Ultrasound: Deep Vein Thrombosis
- Adhikari S, Zeger W, Thom C, Fields JM. Isolated deep venous thrombosis: implications for 2-point compression ultrasonography of the lower extremity. Ann Emerg Med. 2015;66(3):262-266.
Femoral and Saphenous Vein
After the appropriate positioning has been achieved, the clinician should identify the common femoral vein and artery, and then slide the probe toward the head or feet until the saphenous vein, which empties into the common femoral vein, is identified
The clinician should take care not to apply too much pressure with the probe as this will compress the saphenous vein; therefore, it is important to use a light touch to ensure proper visualization. Once this key region is identified, the clinician should then use the probe to apply pressure to the vessels. The saphenous vein should compress completely upon application of sufficient pressure to the artery. In a normal vein, the anterior and posterior walls should touch and completely obliterate the lumen of the vein. When a clot is present, the walls of the vein will remain separated (Figure 3). A thrombus can be bright on ultrasound, but some DVTs may appear completely black. In some cases, a lack of compressibility may be the only tip-off to the presence of clot.
After fully evaluating the saphenous vein, the clinician should move the probe toward the feet, keeping the vessels centered in the image, while at the same time applying serial compression approximately every centimeter. As the probe is moved distally, the artery will typically bifurcate first and then the vein will bifurcate into the femoral and deep femoral branches. The femoral vein should be followed until it “dives” into the adductor canal.
Popliteal Region
The second zone of the examination is in the popliteal region. It can be helpful to prop the foot up, or hang the foot off the bed to improve access to this region (Figure 4). Similar to the femoral region, maximizing your depth and then decreasing it once the vessels are identified can help to ensure that you are not mistaking superficial vessels
Common Pitfalls
The main pitfall to performing a DVT study is failing to identify the correct vessels. It is important to identify both the artery and vein running together to ensure that the correct location. In larger patients, the relatively shallow depth of the high-frequency
Another common pitfall to keep in mind is that lymph nodes can often be mistaken for clot (Figure 6). A lymph node may be distinguished from a clot by sliding the probe up and down the patient’s leg—lymph nodes will appear as discrete structures, continuous like vasculature. It is essential to evaluate the length of the common femoral, the femoral, and popliteal veins visualized as a recent study by Adhikari et al1 showed that two-point compression studies can miss up to 6% of isolated clots.
Summary
With practice, POC compression ultrasonography of the lower extremities can be used to quickly rule in the diagnosis DVT. Proper patient and probe positioning, as well as the application of appropriate probe pressure at different stages of the examination are essential to accurately visualize and assess the femoral, saphenous, and popliteal veins for the presence of a thrombus.
For a video and more information on performing this scan:
Dr Meer is an assistant professor and director of emergency ultrasound, department of emergency medicine, Emory University School of Medicine, Atlanta, Georgia. Dr Beck is an assistant professor, department of emergency medicine, Emory University School of Medicine, Atlanta, Georgia. Dr Taylor is an assistant professor and director of postgraduate medical education, department of emergency medicine, Emory University School of Medicine, Atlanta, Georgia.
- Emergency Ultrasound: Deep Vein Thrombosis
- Adhikari S, Zeger W, Thom C, Fields JM. Isolated deep venous thrombosis: implications for 2-point compression ultrasonography of the lower extremity. Ann Emerg Med. 2015;66(3):262-266.
- Emergency Ultrasound: Deep Vein Thrombosis
- Adhikari S, Zeger W, Thom C, Fields JM. Isolated deep venous thrombosis: implications for 2-point compression ultrasonography of the lower extremity. Ann Emerg Med. 2015;66(3):262-266.
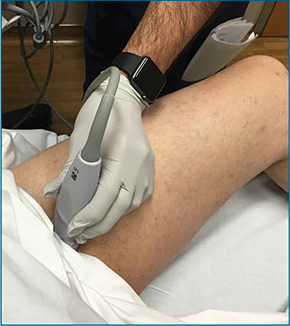
Emergency Ultrasound: Renal Evaluation
Background
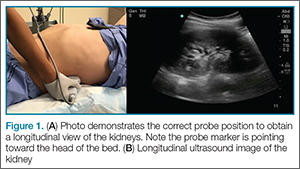
Technique
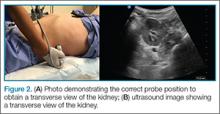
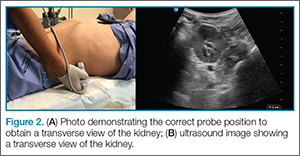
The study is performed with a curvilinear probe placed in the left and right midaxillary region along the lower costal margin. To obtain a longitudinal view of the kidneys, the probe marker should point toward the head of the bed (Figure 1). The clinician should then slide the probe until the kidney comes into view just caudal to either the liver on the right or the spleen on the left. It is important to remember that the kidneys are retroperitoneal; as such, the probe should be pointed toward the bed to ensure visualization.
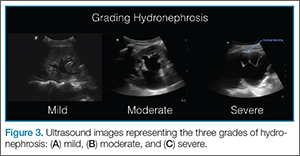
Hydronephrosis
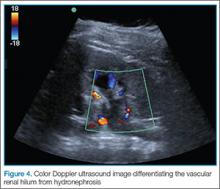

Ureteral or bladder outlet obstruction can lead to unilateral or bilateral renal hydronephrosis, which can present on a spectrum ranging from mild to severe. As fluid appears black on ultrasound, hydronephrosis will appear black in what is normally an echogenic center of the kidney. The higher the degree of hydronephrosis, the larger the area of black; in cases of severe hydronephrosis, there is thinning of the renal parenchyma and most of the kidney is taken up by dilated calyces (Figure 3). If there is uncertainty during evaluation, color Doppler may be employed to differentiate the vascular renal hilum from hydronephrosis (Figure 4).
Ureteral Stones
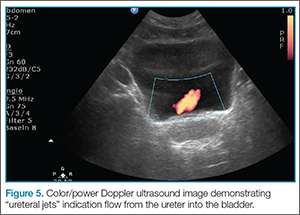
Ureteral stones are not typically visualized by ultrasound. However, intrarenal stones can be found. These will appear as hyperechoic structures within the central area of the kidney with acoustic shadowing artifact noted underneath them. Additionally, while scanning the bladder, one can sometimes find a stone lodged in the ureteropelvic junction (UPJ). One can also look for “ureteral jets,” seen as periodic flow of urine within the bladder using color/power Doppler (Figure 5).
Pearls/Pitfalls

Dr Meer is an assistant professor and director of emergency ultrasound, department of emergency medicine, Emory University School of Medicine, Atlanta, Georgia. Dr Beck is an assistant professor, department of emergency medicine, Emory University School of Medicine, Atlanta, Georgia. Dr Taylor is an assistant professor and director of postgraduate medical education, department of emergency medicine, Emory University School of Medicine, Atlanta, Georgia.
- Smith-Bindman R, Aubin C, Bailitz J, et al. Ultrasonography versus computed tomography for suspected nephrolithiasis. N Engl J Med. 2014;371(12):1100-1110.
Background
Technique
The study is performed with a curvilinear probe placed in the left and right midaxillary region along the lower costal margin. To obtain a longitudinal view of the kidneys, the probe marker should point toward the head of the bed (Figure 1). The clinician should then slide the probe until the kidney comes into view just caudal to either the liver on the right or the spleen on the left. It is important to remember that the kidneys are retroperitoneal; as such, the probe should be pointed toward the bed to ensure visualization.
Hydronephrosis
Ureteral or bladder outlet obstruction can lead to unilateral or bilateral renal hydronephrosis, which can present on a spectrum ranging from mild to severe. As fluid appears black on ultrasound, hydronephrosis will appear black in what is normally an echogenic center of the kidney. The higher the degree of hydronephrosis, the larger the area of black; in cases of severe hydronephrosis, there is thinning of the renal parenchyma and most of the kidney is taken up by dilated calyces (Figure 3). If there is uncertainty during evaluation, color Doppler may be employed to differentiate the vascular renal hilum from hydronephrosis (Figure 4).
Ureteral Stones
Ureteral stones are not typically visualized by ultrasound. However, intrarenal stones can be found. These will appear as hyperechoic structures within the central area of the kidney with acoustic shadowing artifact noted underneath them. Additionally, while scanning the bladder, one can sometimes find a stone lodged in the ureteropelvic junction (UPJ). One can also look for “ureteral jets,” seen as periodic flow of urine within the bladder using color/power Doppler (Figure 5).
Pearls/Pitfalls
Dr Meer is an assistant professor and director of emergency ultrasound, department of emergency medicine, Emory University School of Medicine, Atlanta, Georgia. Dr Beck is an assistant professor, department of emergency medicine, Emory University School of Medicine, Atlanta, Georgia. Dr Taylor is an assistant professor and director of postgraduate medical education, department of emergency medicine, Emory University School of Medicine, Atlanta, Georgia.
- Smith-Bindman R, Aubin C, Bailitz J, et al. Ultrasonography versus computed tomography for suspected nephrolithiasis. N Engl J Med. 2014;371(12):1100-1110.
- Smith-Bindman R, Aubin C, Bailitz J, et al. Ultrasonography versus computed tomography for suspected nephrolithiasis. N Engl J Med. 2014;371(12):1100-1110.