Financial relationships between physicians and industry are prevalent and complex and may have implications for patient care. A 2007 study reported that 94% of 3167 physicians surveyed had established some form of paid relationship with companies in the pharmaceutical industry.1 To facilitate increased transparency around these relationships, lawmakers passed the Physician Payments Sunshine Act in 2010, which requires pharmaceutical companies and device manufacturers to report all payments made to physicians.2 Mandatory disclosures include meals, honoraria, travel expenses, grants, and ownership or investment interests greater than $10. The information is displayed publicly in the Open Payments database (OPD)(https://openpayments-data.cms.gov/), a platform run by the Centers for Medicare and Medicaid Services.
The OPD allows for in-depth analyses of industry payments made to physicians. Many medical specialties—including orthopedics,3-5 plastic surgery,6,7 ophthalmology,8 and gastroenterology9—have published extensive literature characterizing the nature of these payments and disparities in the distribution of payments based on sex, geographic distribution, and other factors. After the first full year of OPD data collection for dermatology in 2014, Feng et al10 examined the number, amount, and nature of industry payments to dermatologists, as well as their geographic distribution for that year. As a follow-up to this initial research, Schlager et al11 characterized payments made to dermatologists for the year 2016 and found an increase in the total payments, mean payments, and number of dermatologists receiving payments compared with the 2014 data.
Our study aimed to characterize the last 5 years of available OPD data—from January 1, 2017, to December 31, 2021—to further explore trends in industry payments made to dermatologists. In particular, we examined the effects of the COVID-19 pandemic on payments as well as sex disparities and the distribution of industry payments.
Methods
We performed a retrospective analysis of the OPD for the general payment datasets from January 1, 2017, to December 31, 2021. The results were filtered to include only payments made to dermatologists, excluding physicians from other specialties, physician assistants, and other types of practitioners. Data for each physician were grouped by National Provider Identifier (NPI) for providers included in the set, allowing for analysis at the individual level. Data on sex were extracted from the National Plan & Provider Enumeration System’s monthly data dissemination for NPIs for July 2023 (when the study was conducted) and were joined to the OPD data using the NPI number reported for each physician. All data were extracted, transformed, and analyzed using R software (version 4.2.1). Figures and visualizations were produced using Microsoft Excel 2016.
Results
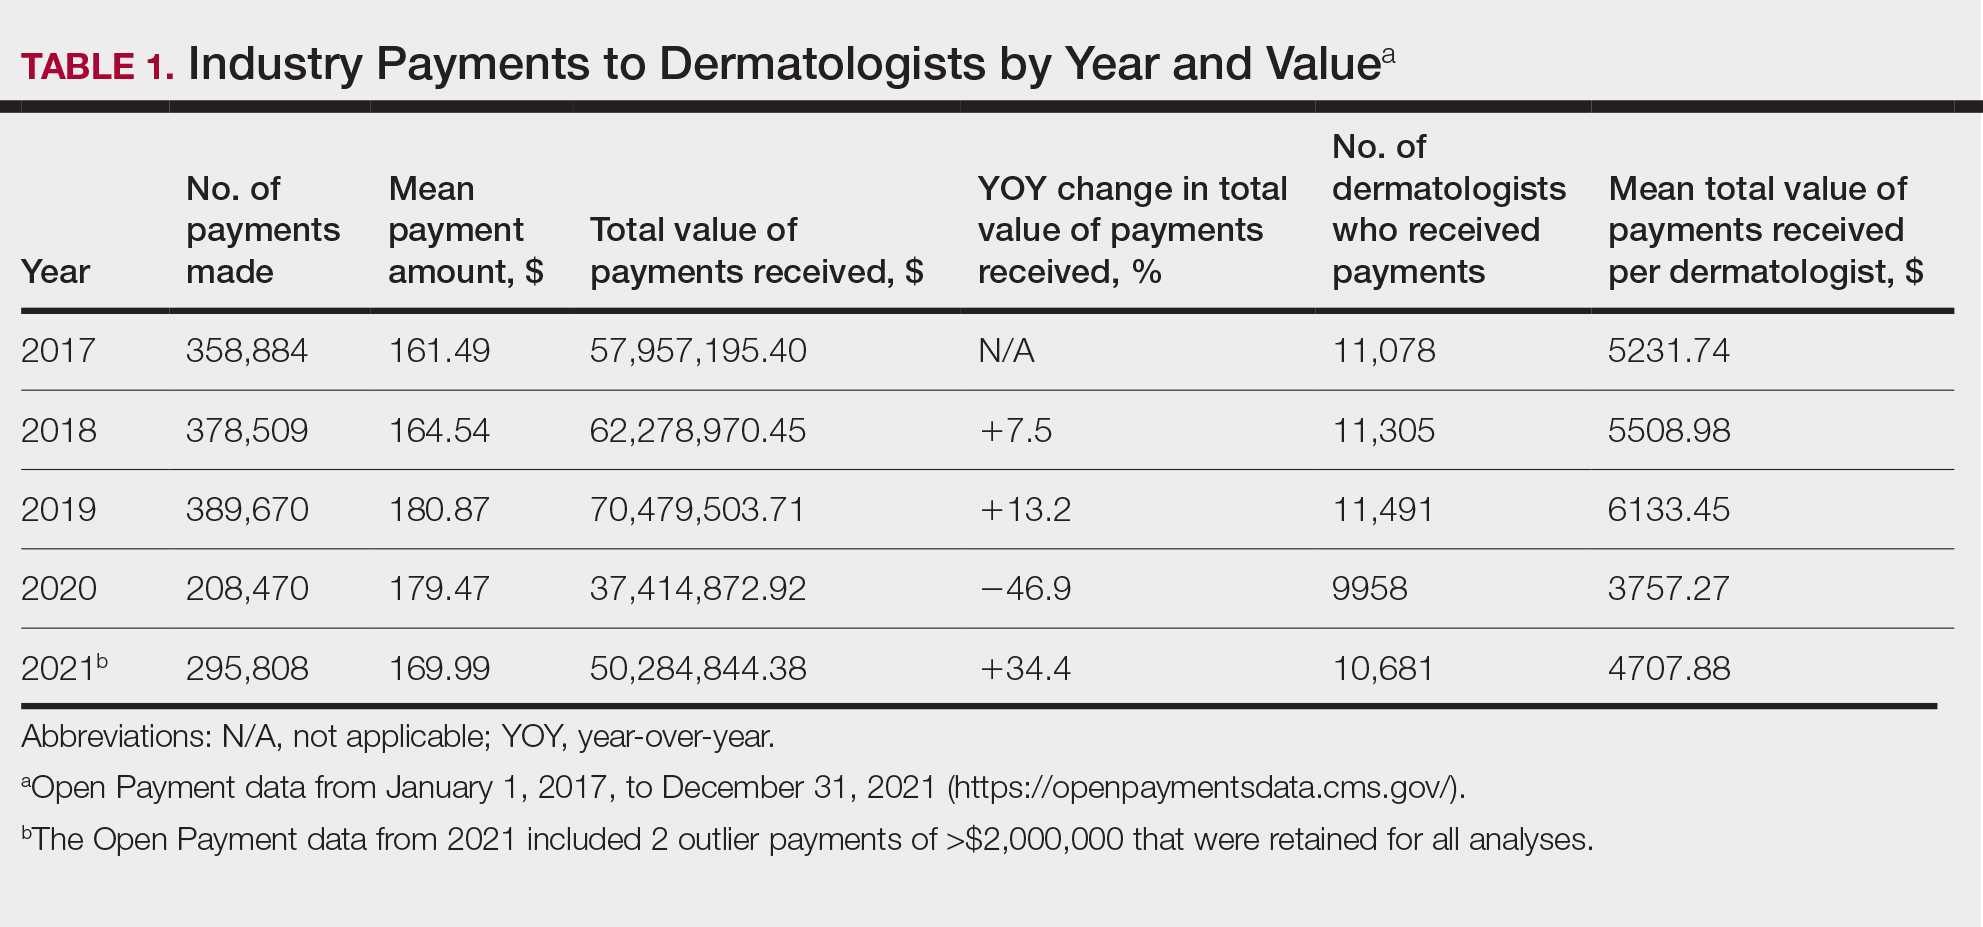
In 2017, a total of 358,884 payments were made by industry to dermatologists, accounting for nearly $58.0 million. The mean total value of payments received per dermatologist was $5231.74, and the mean payment amount was $161.49. In 2018, the total number of payments increased year-over-year by 5.5% (378,509 payments), the total value of payments received increased by 7.5% (approximately $62.3 million), and the mean total value of payments received per dermatologist increased by 5.3% ($5508.98). In 2019, the total number of payments increased by 3.0% (389,670 total payments), the total value of payments recieved increased by 13.2% (approximately $70.5 million), and the mean total value of payments received per dermatologist increased by 11.3% ($6133.45). All of these values decreased in 2020, likely due to COVID-19–related restrictions on travel and meetings (total number of payments, 208,470 [−46.5%]; total value of payments received, approximately $37.5 million [−46.9%], mean total value of payments received per dermatologist, $3757.27 [−38.7%]), but the mean payment amount remained stable at $179.47. In 2021, the total number of payments (295,808 [+41.9%]), total value of payments received (approximately $50.3 million [+34.4%]), and mean total value of payments received per dermatologist ($4707.88 [+25.3%]) all rebounded, but not to pre-2020 levels (Table 1). When looking at the geographic distribution of payments, the top 5 states receiving the highest total value of payments during the study period included California ($41.51 million), New York ($32.26 million), Florida ($21.38 million), Texas ($19.93 million), and Pennsylvania ($11.69 million).
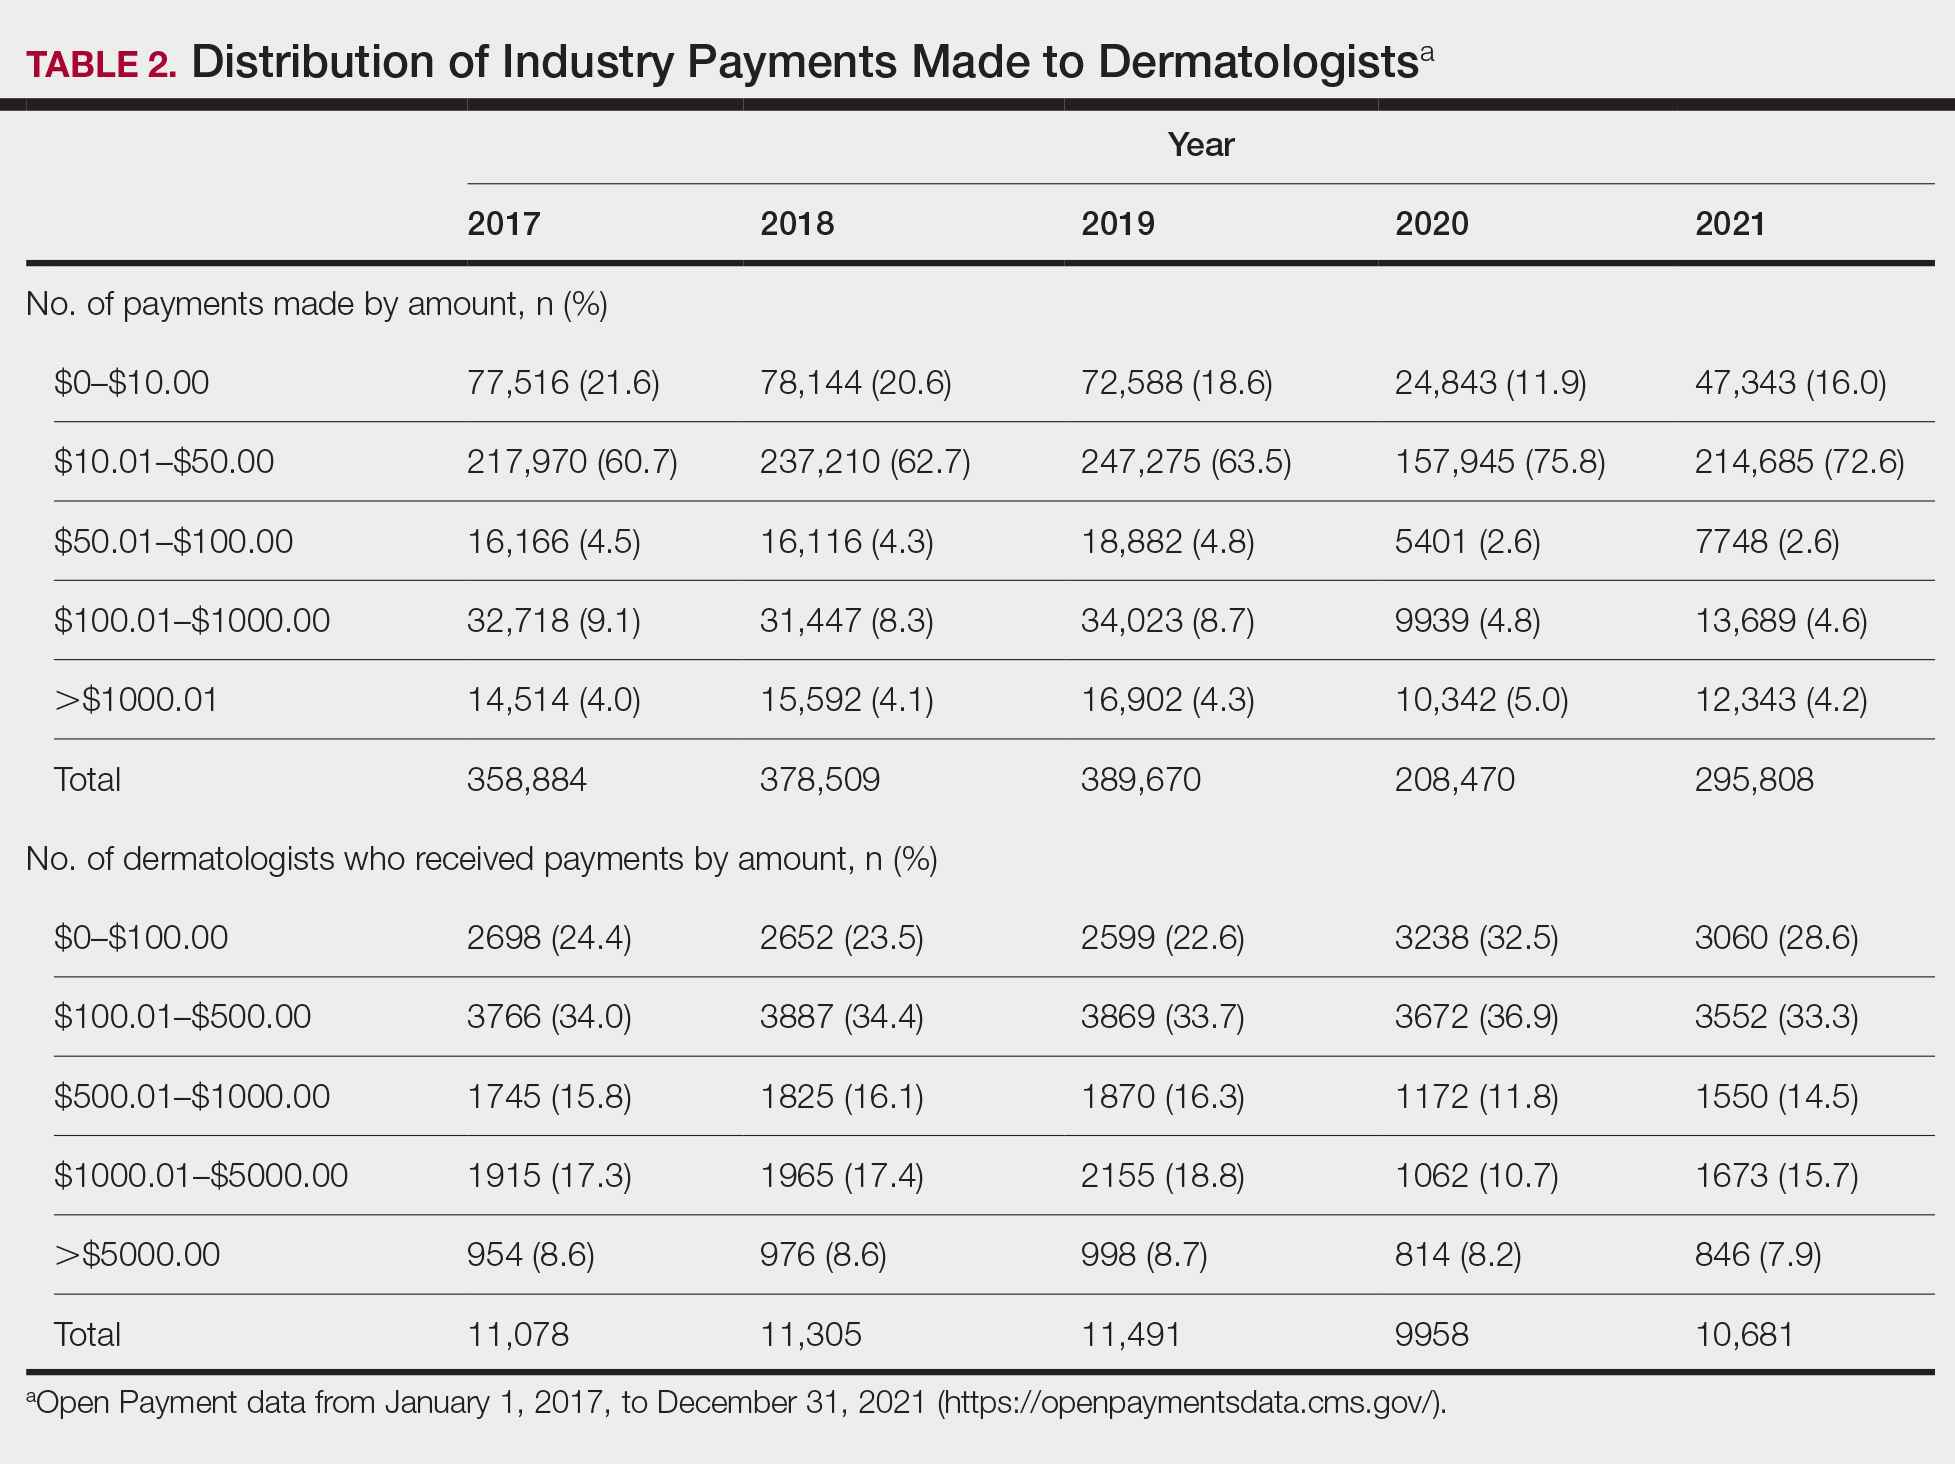
For each year from 2017 to 2021, more than 80% of payments made to dermatologists were less than $50. The majority (60.7%–75.8%) were in the $10 to $50 range. Between 4% and 5% of payments were more than $1000 for each year. Fewer than 10% of dermatologists received more than $5000 in total payments per year. Most dermatologists (33.3%–36.9%) received $100 to $500 per year. The distribution of payments stratified by number of payments made by amount and payment amount per dermatologist is further delineated in Table 2.
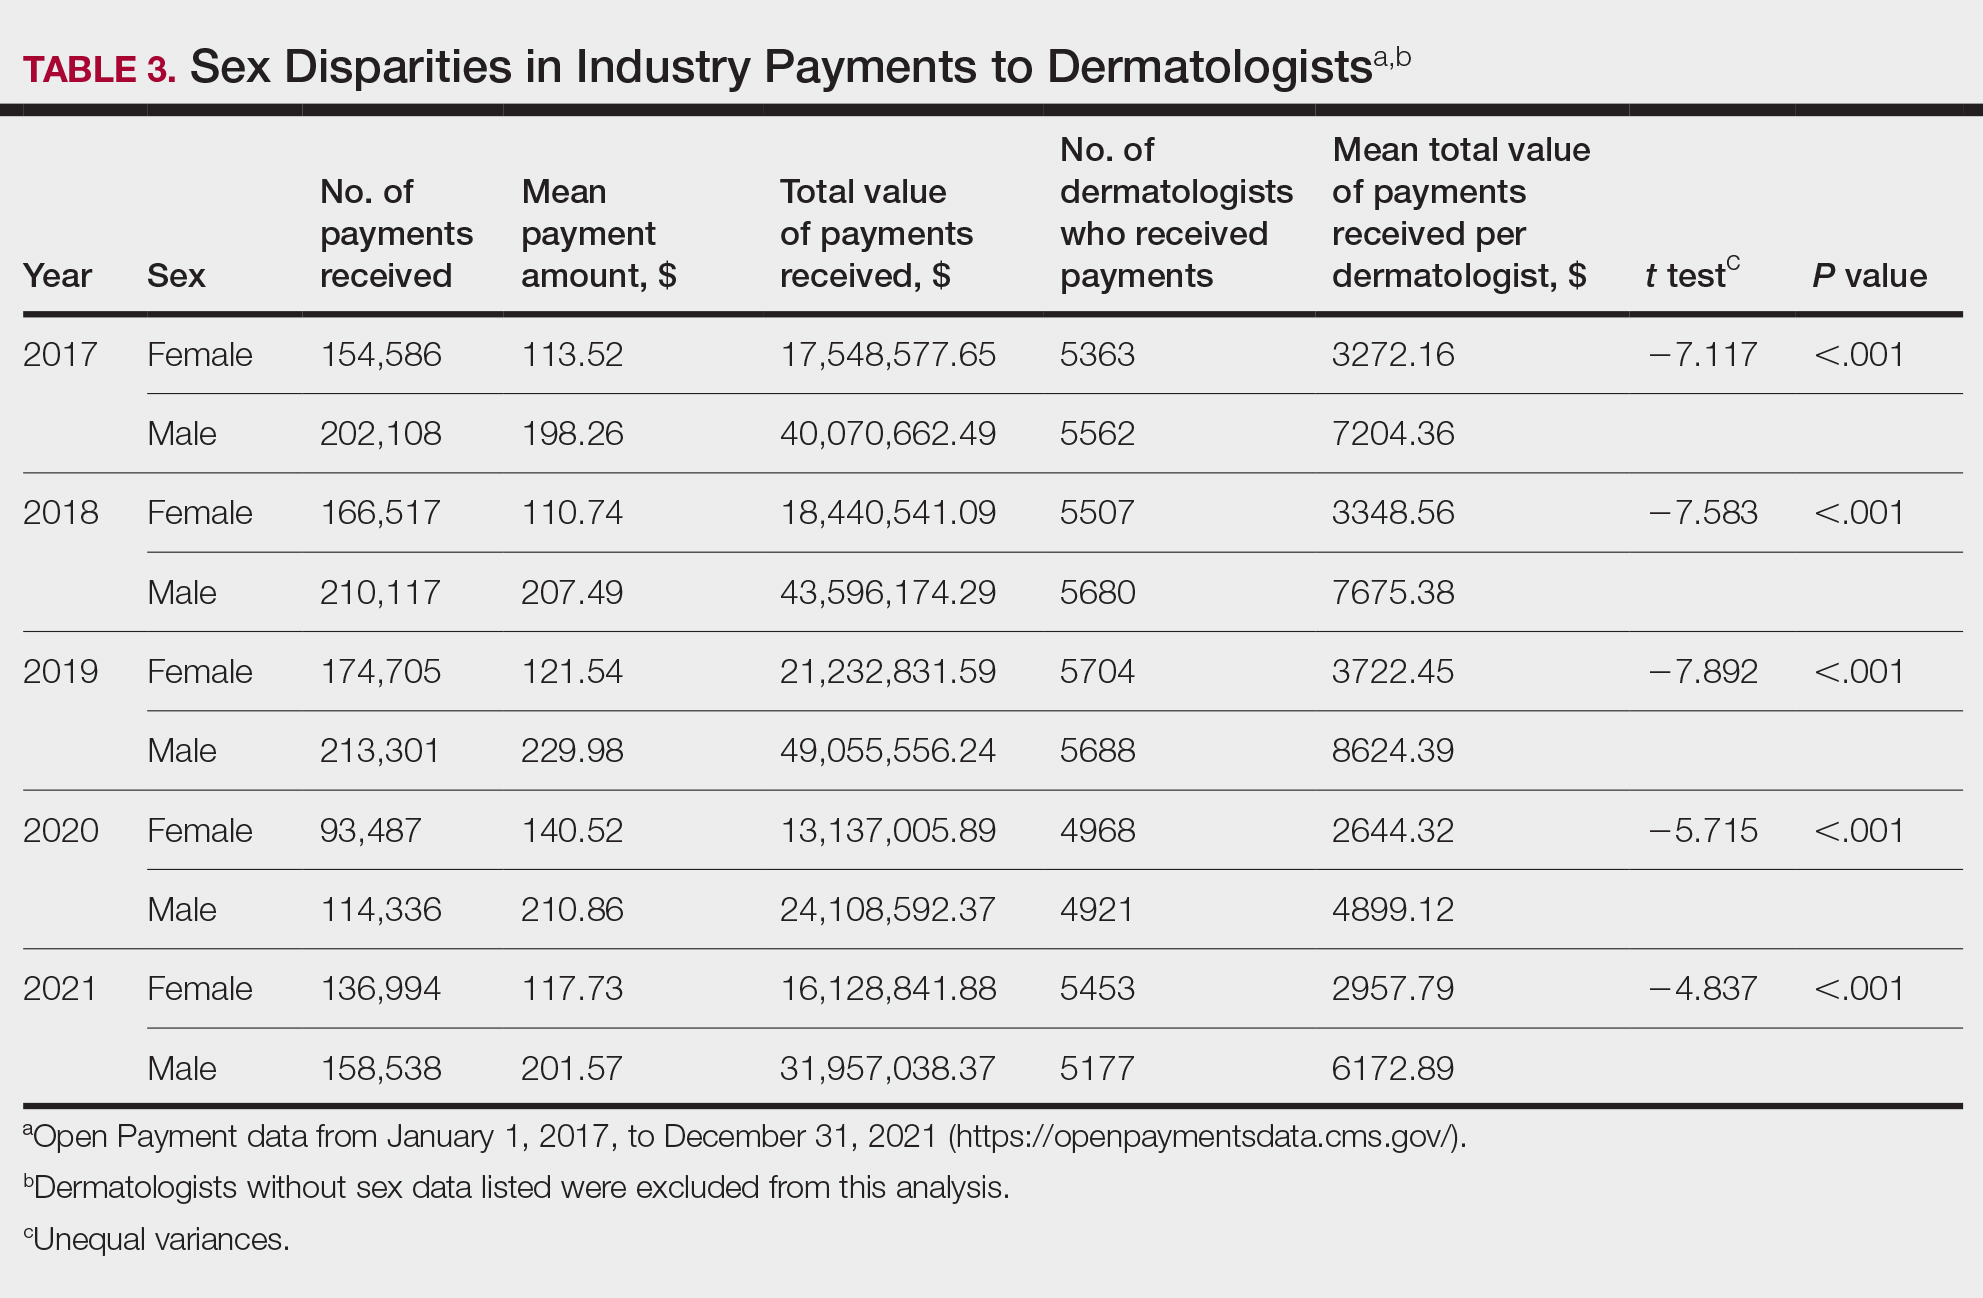
Among dermatologists who received industry payments in 2017, slightly more than half (50.9%) were male; however, male dermatologists accounted for more than $40.1 million of the more than $57.6 million total payments made to dermatologists (69.6%) that year. Male dermatologists received a mean payment amount of $198.26, while female dermatologists received a significantly smaller amount of $113.52 (P<.001). The mean total value of payments received per male dermatologist was $7204.36, while the mean total value for female dermatologists was $3272.16 (P<.001). The same statistically significant disparities in mean payment amount and mean total value of payments received by male vs female dermatologists were observed for every year from 2017 through 2021 (Table 3).


