User login
Heart on the right may sometimes be ‘right’
A 76-year-old man presented to the emergency department with right-sided exertional chest pain radiating to the right shoulder and arm associated with shortness of breath. His vital signs were normal. On clinical examination, the cardiac apex was palpated on the right side, 9 cm from the midsternal line in the fifth intercostal space.
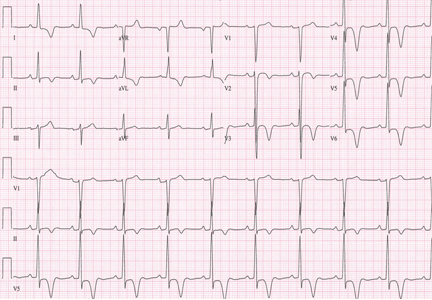
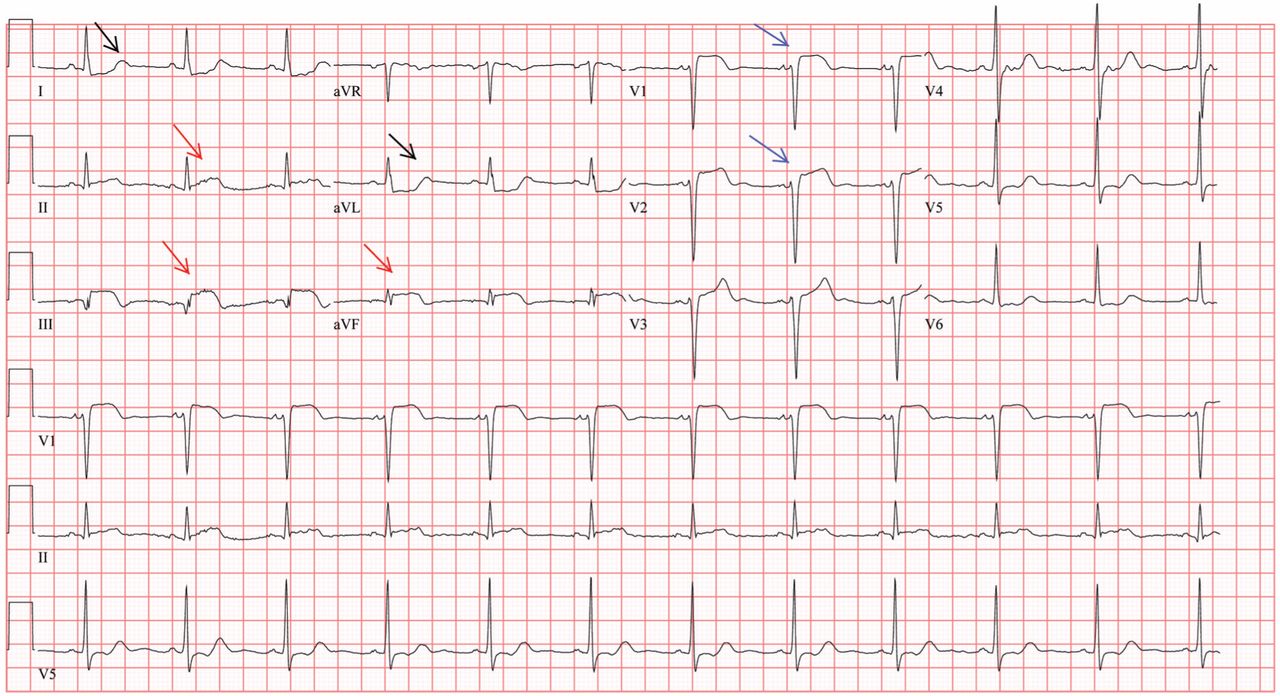
A standard left-sided 12-lead electrocardiogram (ECG) showed right-axis deviation and inverted P, QRS, and T waves in leads I and aVL (Figure 1). Although these changes are also seen when the right and left arm electrode wires are transposed, the precordial lead morphology in such a situation would usually be normal. In our patient, the precordial leads showed the absence or even slight reversal of R-wave progression, a feature indicative of dextrocardia.1,2
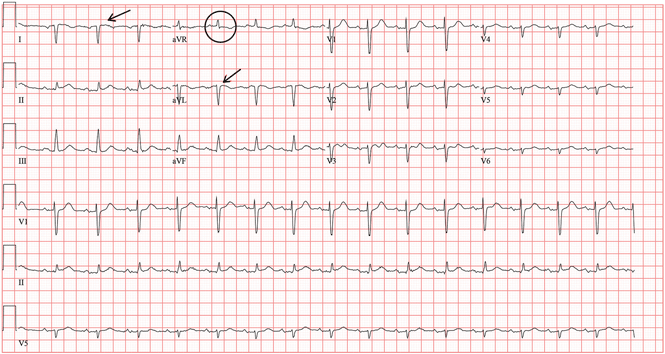
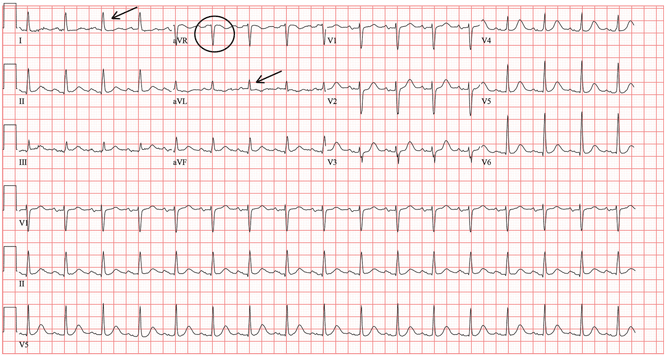
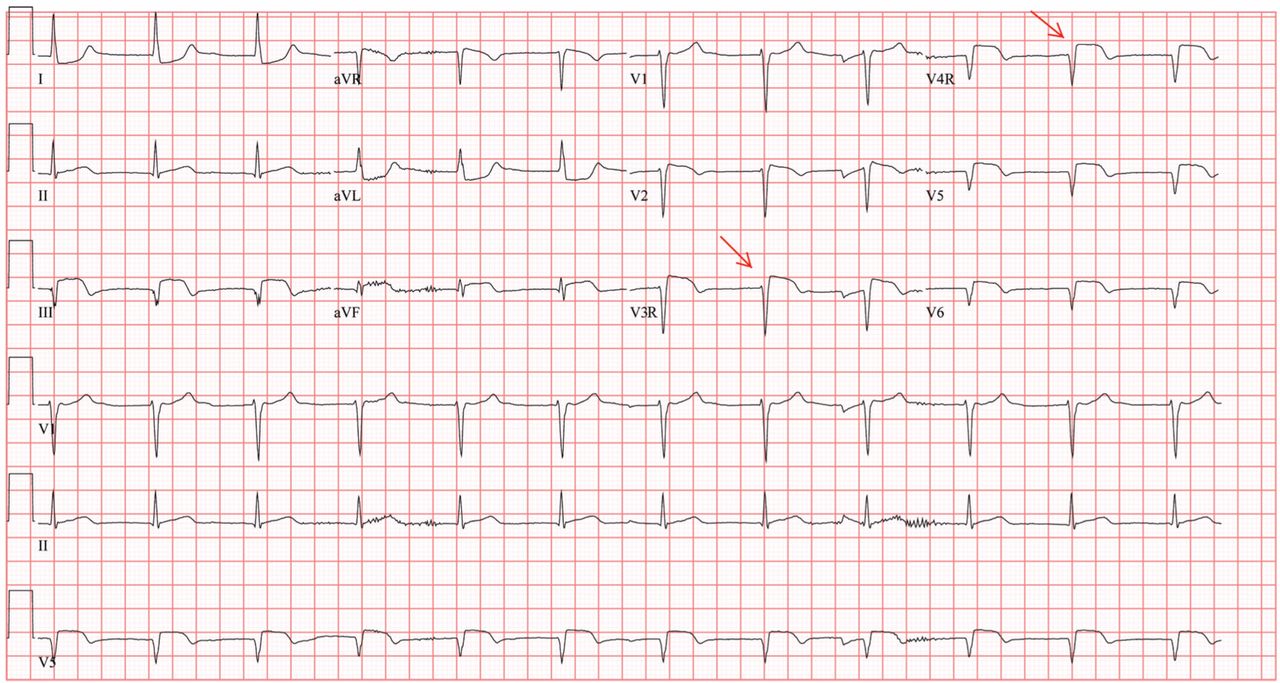
In patients with dextrocardia, right-sided hookup of the electrodes is usually necessary for proper interpretation of the ECG. When this was done in our patient, the ECG showed a normal cardiac axis, a negative QRS complex in lead aVR, a positive P wave and other complexes in lead I, and normal R-wave progression in the precordial leads—findings suggestive of dextrocardia (Figure 2).
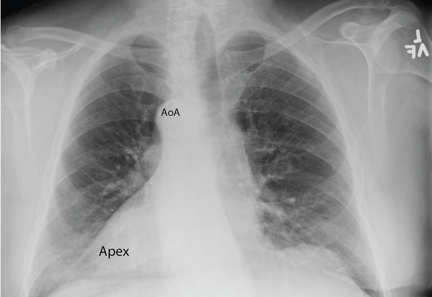
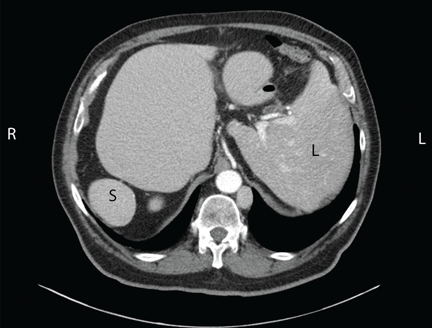
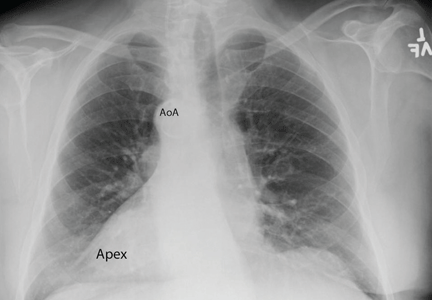
Chest radiography showed a right-sided cardiac silhouette (Figure 3), and computed tomography of the abdomen (Figure 4) revealed the liver positioned on the left side and the spleen on the right, confirming the diagnosis of situs inversus totalis. The ECG showed dextrocardia, but no other abnormalities. The patient eventually underwent coronary angiography, which showed nonobstructive coronary artery disease.
DEXTROCARDIA, OTHER CONGENITAL CARDIOVASCULAR MALFORMATIONS
Dextrocardia was first described in early 17th century.1 Situs solitus is the normal position of the heart and viscera, whereas situs inversus is a mirror-image anatomic arrangement of the organs. Situs inversus with dextrocardia, also called situs inversus totalis, is a rare condition (with a prevalence of 1 in 8,000) in which the heart and descending aorta are on the right and the thoracic and abdominal viscera are usually mirror images of the normal morphology.1,3,4 A mirror-image sinus node lies at the junction of the left superior vena cava and the left-sided (morphologic right) atrium.1 People with situs inversus with dextrocardia are usually asymptomatic and have a normal life expectancy.1,2 Situs inversus with levocardia is a rare condition in which the heart is in the normal position but the viscera are in the dextro-position. This anomaly has a prevalence of 1 in 22,000.5
Atrial situs almost always corresponds to visceral situs. However, when the alignment of the atria and viscera is inconsistent and situs cannot be determined clearly because of the malpositioning of organs, the condition is called “situs ambiguous.” This is very rare, with a prevalence of 1 in 40,000.6
Risk factors
The cause of congenital cardiovascular malformations such as these is not known, but risk factors include positive family history, maternal diabetes, and cocaine use in the first trimester.7
The prevalence of congenital heart disease in patients with situs inversus with dextrocardia is low and ranges from 2% to 5%. This is in contrast to situs solitus with dextrocardia (isolated dextrocardia), which is almost always associated with cardiovascular anomalies.2,4 Kartagener syndrome—the triad of situs inversus, sinusitis, and bronchiectasis—occurs in 25% of people with situs inversus with dextrocardia.4 Situs inversus with levocardia is also frequently associated with cardiac anomalies.5
The major features of dextrocardia on ECG are:
- Negative P wave, QRS complex, and T wave in lead I
- Positive QRS complex in aVR
- Right-axis deviation
- Reversal of R-wave progression in the precordial leads.
Ventricular activation and repolarization are reversed, resulting in a negative QRS complex and an inverted T wave in lead I. The absence of R-wave progression in the precordial leads helps differentiate mirror-image dextrocardia from erroneously reversed limb-electrode placement, which shows normal R-wave progression from V1 to V6 while showing similar features to those seen in dextrocardia in the limb leads.2 In right-sided hookup, the limb electrodes are reversed, and the chest electrodes are recorded from the right precordium.
CORONARY INTERVENTIONS REQUIRE SPECIAL CONSIDERATION
In patients with dextrocardia, coronary interventions can be challenging because of the mirror-image position of the coronary ostia and the aortic arch.8 These patients also need careful imaging, consideration of other associated congenital cardiac abnormalities, and detailed planning before cardiac surgery, including coronary artery bypass grafting.9
Patients with dextrocardia may present with cardiac symptoms localized to the right side of the body and have confusing clinical and diagnostic findings. Keeping dextrocardia and other such anomalies in mind can prevent delay in appropriately directed interventions. In a patient such as ours, the heart on the right side of the chest may indeed be “right.” Still, diagnostic tests to look for disorders encountered with dextrocardia may be necessary.
- Perloff JK. The cardiac malpositions. Am J Cardiol 2011; 108:1352–1361.
- Tanawuttiwat T, Vasaiwala S, Dia M. ECG image of the month. Mirror mirror. Am J Med 2010; 123:34–36.
- Douard R, Feldman A, Bargy F, Loric S, Delmas V. Anomalies of lateralization in man: a case of total situs in-versus. Surg Radiol Anat 2000; 22:293–297.
- Maldjian PD, Saric M. Approach to dextrocardia in adults: review. AJR Am J Roentgenol 2007; 188(suppl 6):S39–S49.
- Gindes L, Hegesh J, Barkai G, Jacobson JM, Achiron R. Isolated levocardia: prenatal diagnosis, clinical im-portance, and literature review. J Ultrasound Med 2007; 26:361–365.
- Abut E, Arman A, Güveli H, et al. Malposition of internal organs: a case of situs ambiguous anomaly in an adult. Turk J Gastroenterol 2003; 14:151–155.
- Kuehl KS, Loffredo C. Risk factors for heart disease associated with abnormal sidedness. Teratology 2002; 66:242–248.
- Aksoy S, Cam N, Gurkan U, Altay S, Bozbay M, Agirbasli M. Primary percutaneous intervention: for acute myo-cardial infarction in a patient with dextrocardia and situs inversus. Tex Heart Inst J 2012; 39:140–141.
- Murtuza B, Gupta P, Goli G, Lall KS. Coronary revascularization in adults with dextrocardia: surgical implications of the anatomic variants. Tex Heart Inst J 2010; 37:633–640.
A 76-year-old man presented to the emergency department with right-sided exertional chest pain radiating to the right shoulder and arm associated with shortness of breath. His vital signs were normal. On clinical examination, the cardiac apex was palpated on the right side, 9 cm from the midsternal line in the fifth intercostal space.
A standard left-sided 12-lead electrocardiogram (ECG) showed right-axis deviation and inverted P, QRS, and T waves in leads I and aVL (Figure 1). Although these changes are also seen when the right and left arm electrode wires are transposed, the precordial lead morphology in such a situation would usually be normal. In our patient, the precordial leads showed the absence or even slight reversal of R-wave progression, a feature indicative of dextrocardia.1,2
In patients with dextrocardia, right-sided hookup of the electrodes is usually necessary for proper interpretation of the ECG. When this was done in our patient, the ECG showed a normal cardiac axis, a negative QRS complex in lead aVR, a positive P wave and other complexes in lead I, and normal R-wave progression in the precordial leads—findings suggestive of dextrocardia (Figure 2).
Chest radiography showed a right-sided cardiac silhouette (Figure 3), and computed tomography of the abdomen (Figure 4) revealed the liver positioned on the left side and the spleen on the right, confirming the diagnosis of situs inversus totalis. The ECG showed dextrocardia, but no other abnormalities. The patient eventually underwent coronary angiography, which showed nonobstructive coronary artery disease.
DEXTROCARDIA, OTHER CONGENITAL CARDIOVASCULAR MALFORMATIONS
Dextrocardia was first described in early 17th century.1 Situs solitus is the normal position of the heart and viscera, whereas situs inversus is a mirror-image anatomic arrangement of the organs. Situs inversus with dextrocardia, also called situs inversus totalis, is a rare condition (with a prevalence of 1 in 8,000) in which the heart and descending aorta are on the right and the thoracic and abdominal viscera are usually mirror images of the normal morphology.1,3,4 A mirror-image sinus node lies at the junction of the left superior vena cava and the left-sided (morphologic right) atrium.1 People with situs inversus with dextrocardia are usually asymptomatic and have a normal life expectancy.1,2 Situs inversus with levocardia is a rare condition in which the heart is in the normal position but the viscera are in the dextro-position. This anomaly has a prevalence of 1 in 22,000.5
Atrial situs almost always corresponds to visceral situs. However, when the alignment of the atria and viscera is inconsistent and situs cannot be determined clearly because of the malpositioning of organs, the condition is called “situs ambiguous.” This is very rare, with a prevalence of 1 in 40,000.6
Risk factors
The cause of congenital cardiovascular malformations such as these is not known, but risk factors include positive family history, maternal diabetes, and cocaine use in the first trimester.7
The prevalence of congenital heart disease in patients with situs inversus with dextrocardia is low and ranges from 2% to 5%. This is in contrast to situs solitus with dextrocardia (isolated dextrocardia), which is almost always associated with cardiovascular anomalies.2,4 Kartagener syndrome—the triad of situs inversus, sinusitis, and bronchiectasis—occurs in 25% of people with situs inversus with dextrocardia.4 Situs inversus with levocardia is also frequently associated with cardiac anomalies.5
The major features of dextrocardia on ECG are:
- Negative P wave, QRS complex, and T wave in lead I
- Positive QRS complex in aVR
- Right-axis deviation
- Reversal of R-wave progression in the precordial leads.
Ventricular activation and repolarization are reversed, resulting in a negative QRS complex and an inverted T wave in lead I. The absence of R-wave progression in the precordial leads helps differentiate mirror-image dextrocardia from erroneously reversed limb-electrode placement, which shows normal R-wave progression from V1 to V6 while showing similar features to those seen in dextrocardia in the limb leads.2 In right-sided hookup, the limb electrodes are reversed, and the chest electrodes are recorded from the right precordium.
CORONARY INTERVENTIONS REQUIRE SPECIAL CONSIDERATION
In patients with dextrocardia, coronary interventions can be challenging because of the mirror-image position of the coronary ostia and the aortic arch.8 These patients also need careful imaging, consideration of other associated congenital cardiac abnormalities, and detailed planning before cardiac surgery, including coronary artery bypass grafting.9
Patients with dextrocardia may present with cardiac symptoms localized to the right side of the body and have confusing clinical and diagnostic findings. Keeping dextrocardia and other such anomalies in mind can prevent delay in appropriately directed interventions. In a patient such as ours, the heart on the right side of the chest may indeed be “right.” Still, diagnostic tests to look for disorders encountered with dextrocardia may be necessary.
- Perloff JK. The cardiac malpositions. Am J Cardiol 2011; 108:1352–1361.
- Tanawuttiwat T, Vasaiwala S, Dia M. ECG image of the month. Mirror mirror. Am J Med 2010; 123:34–36.
- Douard R, Feldman A, Bargy F, Loric S, Delmas V. Anomalies of lateralization in man: a case of total situs in-versus. Surg Radiol Anat 2000; 22:293–297.
- Maldjian PD, Saric M. Approach to dextrocardia in adults: review. AJR Am J Roentgenol 2007; 188(suppl 6):S39–S49.
- Gindes L, Hegesh J, Barkai G, Jacobson JM, Achiron R. Isolated levocardia: prenatal diagnosis, clinical im-portance, and literature review. J Ultrasound Med 2007; 26:361–365.
- Abut E, Arman A, Güveli H, et al. Malposition of internal organs: a case of situs ambiguous anomaly in an adult. Turk J Gastroenterol 2003; 14:151–155.
- Kuehl KS, Loffredo C. Risk factors for heart disease associated with abnormal sidedness. Teratology 2002; 66:242–248.
- Aksoy S, Cam N, Gurkan U, Altay S, Bozbay M, Agirbasli M. Primary percutaneous intervention: for acute myo-cardial infarction in a patient with dextrocardia and situs inversus. Tex Heart Inst J 2012; 39:140–141.
- Murtuza B, Gupta P, Goli G, Lall KS. Coronary revascularization in adults with dextrocardia: surgical implications of the anatomic variants. Tex Heart Inst J 2010; 37:633–640.
Implications of a prominent R wave in V1
A 19-year-old woman with no significant cardiac or pulmonary history presented with exertional dyspnea, which had begun a few months earlier. Auscultation revealed a loud pulmonary component of the second heart sound and a diastolic murmur heard along the upper left sternal border. Her 12-lead electrocardiogram is shown in Figure 1.
Q: Which of the following can cause prominent R waves in lead V1?
- Normal variant in young adults
- Wolff-Parkinson-White syndrome
- Posterior wall myocardial infarction
- Right ventricular hypertrophy
- All of the above
A: The correct answer is all of the above.
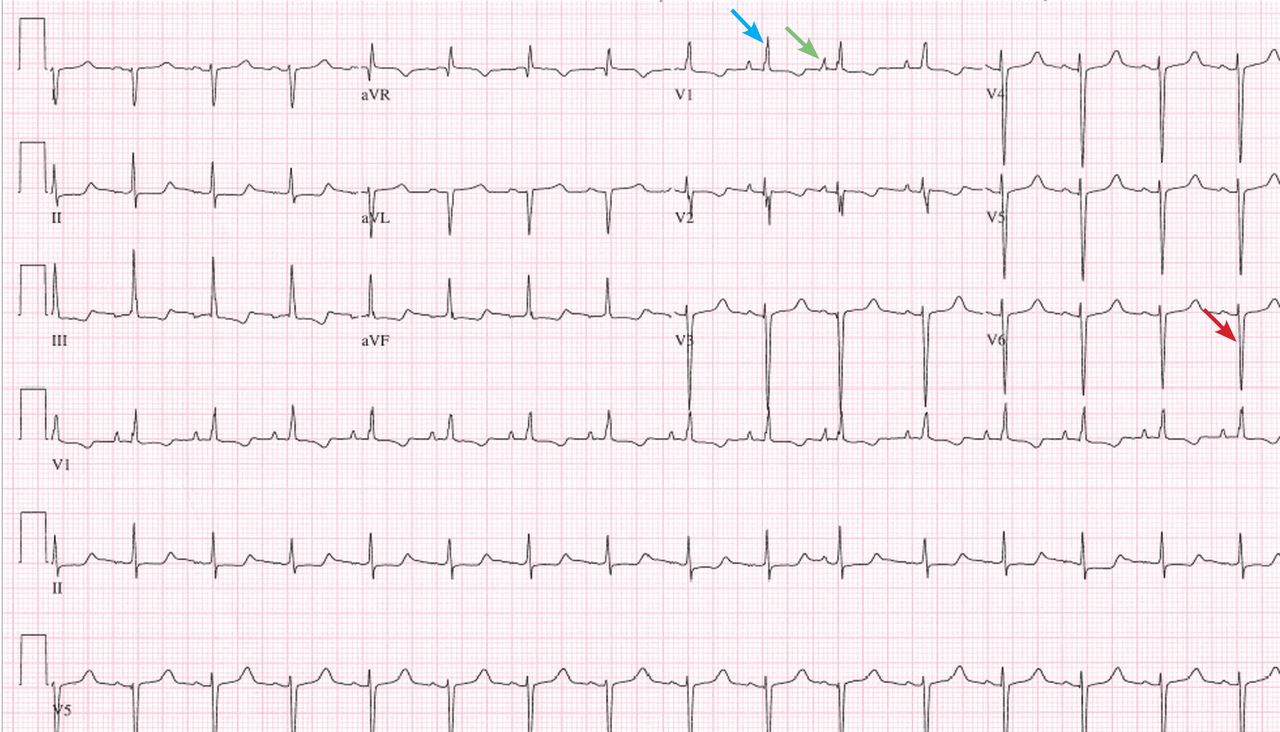
The patient’s electrocardiogram shows a right atrial abnormality and right ventricular hypertrophy. Right atrial enlargement is evidenced by a prominent initial P wave in V1 with an amplitude of at least 1.5 mm (0.15 mV). A P wave taller than 2.5 mm (0.25 mV) in lead II may also suggest a right atrial abnormality.1
Multiple criteria exist for the diagnosis of right ventricular hypertrophy. Tall R waves in V1 with an R/S ratio greater than 1 (ie, the R wave amplitude is more than the S wave depth) is commonly used.2 Deep S waves with an R/S ratio less than 1 in V6 is another criterion. Tall R waves of amplitude greater than 7 mm in V1 by themselves may represent right ventricular hypertrophy. Most of the electrocardiographic criteria are specific but not sensitive for this diagnosis.3
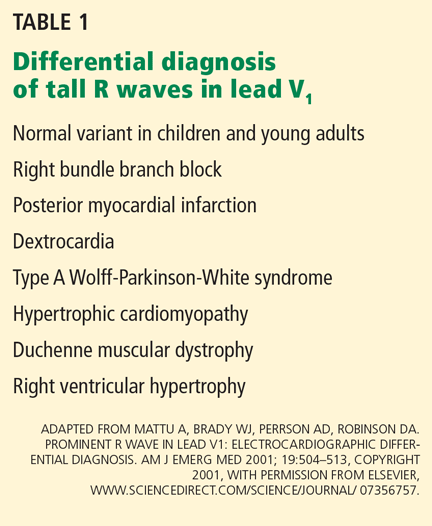
Other causes of tall R waves in V1 are given in Table 1.
Q: Which of the following diseases can present with an electrocardiographic pattern of right ventricular hypertrophy in young patients?
- Pulmonary hypertension
- Atrial septal defect
- Tetralogy of Fallot
- Pulmonary stenosis
- All of the above
A: The correct answer is all of the above.4
Our patient underwent multiple investigations. On echocardiography, her estimated right ventricular pressure was 80 mm Hg, and on cardiac catheterization her mean pulmonary arterial pressure was 55 mm Hg and her pulmonary capillary wedge pressure was 6 mm Hg. She was diagnosed with pulmonary arterial hypertension, which was the cause of her right ventricular hypertrophy. She eventually underwent bilateral lung transplantation.
- Hancock EW, Deal BJ, Mirvis DM, et al; American Heart Association Electrocardiography and Arrhythmias Committee, Council on Clinical Cardiology; American College of Cardiology Foundation; Heart Rhythm Society. AHA/ ACCF/HRS recommendations for the standardization and interpretation of the electrocardiogram: part V: electrocardiogram changes associated with cardiac chamber hypertrophy: a scientific statement from the American Heart Association Electrocardiography and Arrhythmias Committee, Council on Clinical Cardiology; the American College of Cardiology Foundation; and the Heart Rhythm Society: endorsed by the International Society for Computerized Electrocardiology. Circulation 2009; 119:e251–e261.
- Milnor WR. Electrocardiogram and vectorcardiogram in right ventricular hypertrophy and right bundle-branch block. Circulation 1957; 16:348–367.
- Lehtonen J, Sutinen S, Ikäheimo M, Pääkkö P. Electrocardiographic criteria for the diagnosis of right ventricular hypertrophy verified at autopsy. Chest 1988; 93:839–842.
- Webb G, Gatzoulis MA. Atrial septal defects in the adult: recent progress and overview. Circulation 2006; 114:1645–1653.
A 19-year-old woman with no significant cardiac or pulmonary history presented with exertional dyspnea, which had begun a few months earlier. Auscultation revealed a loud pulmonary component of the second heart sound and a diastolic murmur heard along the upper left sternal border. Her 12-lead electrocardiogram is shown in Figure 1.
Q: Which of the following can cause prominent R waves in lead V1?
- Normal variant in young adults
- Wolff-Parkinson-White syndrome
- Posterior wall myocardial infarction
- Right ventricular hypertrophy
- All of the above
A: The correct answer is all of the above.
The patient’s electrocardiogram shows a right atrial abnormality and right ventricular hypertrophy. Right atrial enlargement is evidenced by a prominent initial P wave in V1 with an amplitude of at least 1.5 mm (0.15 mV). A P wave taller than 2.5 mm (0.25 mV) in lead II may also suggest a right atrial abnormality.1
Multiple criteria exist for the diagnosis of right ventricular hypertrophy. Tall R waves in V1 with an R/S ratio greater than 1 (ie, the R wave amplitude is more than the S wave depth) is commonly used.2 Deep S waves with an R/S ratio less than 1 in V6 is another criterion. Tall R waves of amplitude greater than 7 mm in V1 by themselves may represent right ventricular hypertrophy. Most of the electrocardiographic criteria are specific but not sensitive for this diagnosis.3
Other causes of tall R waves in V1 are given in Table 1.
Q: Which of the following diseases can present with an electrocardiographic pattern of right ventricular hypertrophy in young patients?
- Pulmonary hypertension
- Atrial septal defect
- Tetralogy of Fallot
- Pulmonary stenosis
- All of the above
A: The correct answer is all of the above.4
Our patient underwent multiple investigations. On echocardiography, her estimated right ventricular pressure was 80 mm Hg, and on cardiac catheterization her mean pulmonary arterial pressure was 55 mm Hg and her pulmonary capillary wedge pressure was 6 mm Hg. She was diagnosed with pulmonary arterial hypertension, which was the cause of her right ventricular hypertrophy. She eventually underwent bilateral lung transplantation.
- Hancock EW, Deal BJ, Mirvis DM, et al; American Heart Association Electrocardiography and Arrhythmias Committee, Council on Clinical Cardiology; American College of Cardiology Foundation; Heart Rhythm Society. AHA/ ACCF/HRS recommendations for the standardization and interpretation of the electrocardiogram: part V: electrocardiogram changes associated with cardiac chamber hypertrophy: a scientific statement from the American Heart Association Electrocardiography and Arrhythmias Committee, Council on Clinical Cardiology; the American College of Cardiology Foundation; and the Heart Rhythm Society: endorsed by the International Society for Computerized Electrocardiology. Circulation 2009; 119:e251–e261.
- Milnor WR. Electrocardiogram and vectorcardiogram in right ventricular hypertrophy and right bundle-branch block. Circulation 1957; 16:348–367.
- Lehtonen J, Sutinen S, Ikäheimo M, Pääkkö P. Electrocardiographic criteria for the diagnosis of right ventricular hypertrophy verified at autopsy. Chest 1988; 93:839–842.
- Webb G, Gatzoulis MA. Atrial septal defects in the adult: recent progress and overview. Circulation 2006; 114:1645–1653.
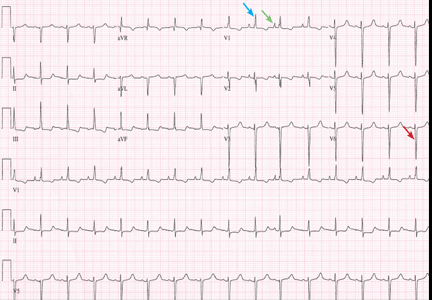
Giant inverted T waves
A 48-year-old man with hypertension was being evaluated for a noncardiac issue (progressive multifocal leukoencephalopathy). He had been an active runner and did not have any cardiovascular symptoms at the time. The electrocardiogram (ECG) shown in Figure 1 was a routine study done as a part of that evaluation. His cardiovascular examination was unremarkable, without murmur, S3, or S4. His pulse was regular at 72 beats per minute, and his blood pressure was 112/76 mm Hg.
Q: Which of the following electrocardiographic findings suggest left ventricular hypertrophy?
- Sum of the S wave in V1 and the R wave in V6 ≥ 35 mm
- Sum of the S wave in V3 and the R wave in aVL > 28 mm (men)
- Sum of the S wave in V3 and the R wave in aVL > 20 mm (women)
- All of the above
A: The correct answer is all of the above.1,2
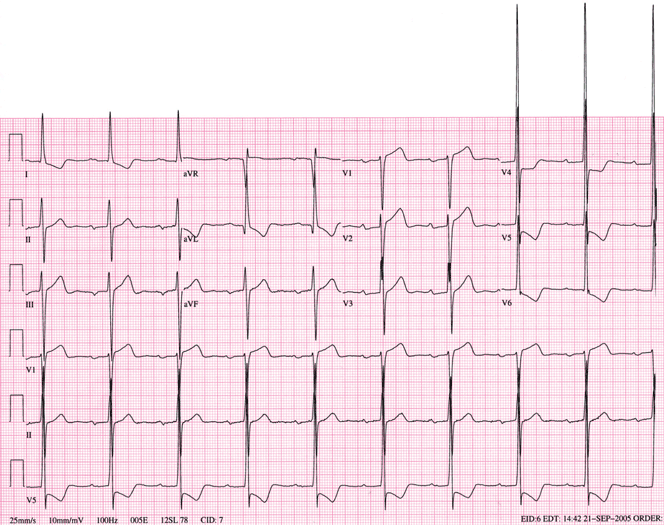
Our patient’s ECG shows sinus bradycardia and left ventricular hypertrophy, suggested by prominent voltage (sum of S in V1 and R in V6 ≥ 35 mm) and supported by ST-segment and T-wave changes in the lateral and midprecordial leads. Classic changes of left ventricular hypertrophy often include increased voltage and downsloping ST-segment depression with negative T waves in V5 and V6 (secondary repolarization changes or “strain” pattern).
Notable on this tracing are the large, asymmetric negative T waves in leads V3 through V6. Giant T waves are defined as negative T waves with voltage greater than 10 mm.3 Although there is no specific pattern of ventricular hypertrophy on an ECG that establishes the diagnosis of hypertrophic cardiomyopathy, left ventricular hypertrophy with T waves of this quality suggest the possibility of hypertrophic cardiomyopathy with apical hypertrophy.
Q: What are the other causes of giant negative T waves?
- Subarachnoid hemorrhage
- Complete heart block
- Non-Q-wave myocardial infarction
- All of the above
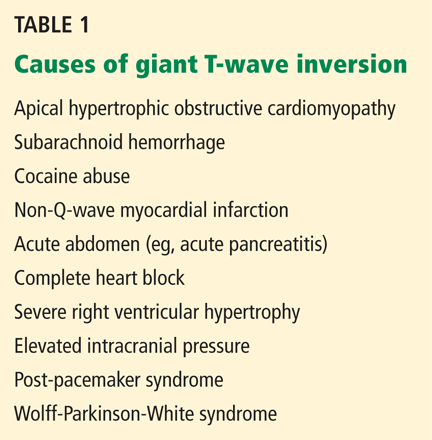
A: The correct answer is all of the above. Additional causes of dramatic T-wave inversion are listed in Table 1. Clinically, non-Q-wave myocardial infarction with T-wave changes and acute central nervous system injury are probably the most commonly seen.4
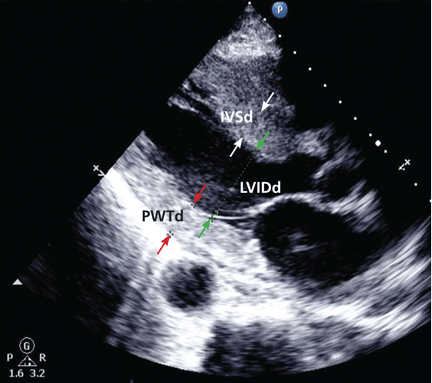
Echocardiography in this patient revealed severe apical hypertrophy of the ventricle with distal cavity obliteration. The left ventricular outflow-tract gradient was normal. The mitral valve appeared normal, and there was no resting systolic anterior motion.
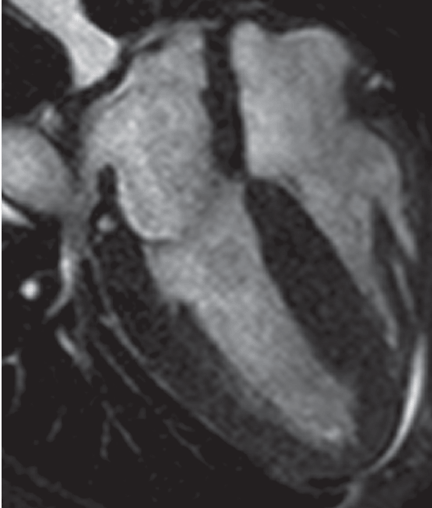
Cardiac magnetic resonance imaging showed the apical variant of hypertrophic cardiomyopathy but no evidence of left ventricular noncompaction, which is a differential diagnosis of apical hypertrophic obstructive cardiomyopathy. This disease was first described in Japan by Yamaguchi et al5 and Sakamoto et al6 and is regarded as a subgroup of nonobstructive hypertrophic cardiomyopathy. The prognosis of apical hypertrophic cardiomyopathy with regard to sudden cardiac death is believed to be better than that of other forms of hypertrophic cardiomyopathy.3
- Sokolow M, Lyon TP. The ventricular complex in left ventricular hypertrophy as obtained by unipolar precordial and limb leads. 1949. Ann Noninvasive Electrocardiol 2001; 6:343–368.
- Casale PN, Devereux RB, Alonso DR, Campo E, Kligfield P. Improved sex-specific criteria of left ventricular hypertrophy for clinical and computer interpretation of electrocardiograms: validation with autopsy findings. Circulation 1987; 75:565–572.
- Eriksson MJ, Sonnenberg B, Woo A, et al. Long-term outcome in patients with apical hypertrophic cardiomyopathy. J Am Coll Cardiol 2002; 39:638–645.
- Jacobson D, Schrire V. Giant T wave inversion. Br Heart J 1966; 28:768–775.
- Yamaguchi H, Ishimura T, Nishiyama S, et al. Hypertrophic nonobstructive cardiomyopathy with giant negative T waves (apical hypertrophy): ventriculographic and echocardiographic features in 30 patients. Am J Cardiol 1979; 44:401–412.
- Sakamoto T, Tei C, Murayama M, Ichiyasu H, Hada Y. Giant T wave inversion as a manifestation of asymmetrical apical hypertrophy (AAH) of the left ventricle. Echocardiographic and ultrasonocardiotomographic study. Jpn Heart J 1976; 17:611–629.
A 48-year-old man with hypertension was being evaluated for a noncardiac issue (progressive multifocal leukoencephalopathy). He had been an active runner and did not have any cardiovascular symptoms at the time. The electrocardiogram (ECG) shown in Figure 1 was a routine study done as a part of that evaluation. His cardiovascular examination was unremarkable, without murmur, S3, or S4. His pulse was regular at 72 beats per minute, and his blood pressure was 112/76 mm Hg.
Q: Which of the following electrocardiographic findings suggest left ventricular hypertrophy?
- Sum of the S wave in V1 and the R wave in V6 ≥ 35 mm
- Sum of the S wave in V3 and the R wave in aVL > 28 mm (men)
- Sum of the S wave in V3 and the R wave in aVL > 20 mm (women)
- All of the above
A: The correct answer is all of the above.1,2
Our patient’s ECG shows sinus bradycardia and left ventricular hypertrophy, suggested by prominent voltage (sum of S in V1 and R in V6 ≥ 35 mm) and supported by ST-segment and T-wave changes in the lateral and midprecordial leads. Classic changes of left ventricular hypertrophy often include increased voltage and downsloping ST-segment depression with negative T waves in V5 and V6 (secondary repolarization changes or “strain” pattern).
Notable on this tracing are the large, asymmetric negative T waves in leads V3 through V6. Giant T waves are defined as negative T waves with voltage greater than 10 mm.3 Although there is no specific pattern of ventricular hypertrophy on an ECG that establishes the diagnosis of hypertrophic cardiomyopathy, left ventricular hypertrophy with T waves of this quality suggest the possibility of hypertrophic cardiomyopathy with apical hypertrophy.
Q: What are the other causes of giant negative T waves?
- Subarachnoid hemorrhage
- Complete heart block
- Non-Q-wave myocardial infarction
- All of the above
A: The correct answer is all of the above. Additional causes of dramatic T-wave inversion are listed in Table 1. Clinically, non-Q-wave myocardial infarction with T-wave changes and acute central nervous system injury are probably the most commonly seen.4
Echocardiography in this patient revealed severe apical hypertrophy of the ventricle with distal cavity obliteration. The left ventricular outflow-tract gradient was normal. The mitral valve appeared normal, and there was no resting systolic anterior motion.
Cardiac magnetic resonance imaging showed the apical variant of hypertrophic cardiomyopathy but no evidence of left ventricular noncompaction, which is a differential diagnosis of apical hypertrophic obstructive cardiomyopathy. This disease was first described in Japan by Yamaguchi et al5 and Sakamoto et al6 and is regarded as a subgroup of nonobstructive hypertrophic cardiomyopathy. The prognosis of apical hypertrophic cardiomyopathy with regard to sudden cardiac death is believed to be better than that of other forms of hypertrophic cardiomyopathy.3
- Sokolow M, Lyon TP. The ventricular complex in left ventricular hypertrophy as obtained by unipolar precordial and limb leads. 1949. Ann Noninvasive Electrocardiol 2001; 6:343–368.
- Casale PN, Devereux RB, Alonso DR, Campo E, Kligfield P. Improved sex-specific criteria of left ventricular hypertrophy for clinical and computer interpretation of electrocardiograms: validation with autopsy findings. Circulation 1987; 75:565–572.
- Eriksson MJ, Sonnenberg B, Woo A, et al. Long-term outcome in patients with apical hypertrophic cardiomyopathy. J Am Coll Cardiol 2002; 39:638–645.
- Jacobson D, Schrire V. Giant T wave inversion. Br Heart J 1966; 28:768–775.
- Yamaguchi H, Ishimura T, Nishiyama S, et al. Hypertrophic nonobstructive cardiomyopathy with giant negative T waves (apical hypertrophy): ventriculographic and echocardiographic features in 30 patients. Am J Cardiol 1979; 44:401–412.
- Sakamoto T, Tei C, Murayama M, Ichiyasu H, Hada Y. Giant T wave inversion as a manifestation of asymmetrical apical hypertrophy (AAH) of the left ventricle. Echocardiographic and ultrasonocardiotomographic study. Jpn Heart J 1976; 17:611–629.
V1: The most important lead in inferior STEMI
Q: Which would be the most appropriate diagnosis?
- Pericarditis
- Acute inferior and right ventricular myocardial infarction
- Anterior and inferior myocardial infarction
- None of the above
A: The correct answer is acute inferior and right ventricular myocardial infarction.
Her electrocardiogram showed sinus rhythm and inferior ST-segment elevation myocardial infarction (STEMI) evidenced by ST-segment elevation in leads II, III, and aVF. Hemodynamic instability or ST-segment elevation of more than 1 mm in lead V1 raises the suspicion of right ventricular myocardial infarction. In such patients, the American Heart Association guidelines recommend electrocardiography with right-sided precordial leads.1
A 1-mm ST-segment elevation in the right precordial lead V4R is one of the most predictive electrocardiographic findings in right ventricular infarction.2 The electrocardiographic changes in this type of myocardial infarction may be transient and resolve within 10 hours in up to 48% of cases.3
Echocardiography can also be used to confirm the possibility of right ventricular infarction.
Q: Which clinical condition can occur as a complication of right ventricular myocardial infarction?
- Profound hypotension after nitrate administration
- High-degree heart block
- Atrial fibrillation
- All of the above
A: All of the conditions can occur.
Right ventricular involvement is very common, noted in up to 50% of patients with acute inferior STEMI in postmortem studies.4 However, hemodynamically significant right ventricular dysfunction is much less common.
Intravenous volume loading with normal saline is one of the first steps in the management of hypotension associated with right ventricular infarction. Patients with significant bradycardia or a high degree of atrioventricular block may require pacing. Early reperfusion should be achieved, if possible. Heightened suspicion is critical to the early diagnosis of this condition, since the prognosis is much worse than for isolated inferior STEMI.4
Our patient was found to have right coronary artery disease requiring percutaneous coronary intervention.
- Antman EM, Anbe DT, Armstrong PW, et al; American College of Cardiology. ACC/AHA guidelines for the management of patients with ST-elevation myocardial infarction: a report of the American College of Cardiology/American Heart Association Task Force on Practice Guidelines (Committee to Revise the 1999 Guidelines for the Management of Patients with Acute Myocardial Infarction). Circulation 2004; 110:e82–e292.
- Robalino BD, Whitlow PL, Underwood DA, Salcedo EE. Electrocardiographic manifestations of right ventricular infarction. Am Heart J 1989; 118:138–144.
- Braat SH, Brugada P, de Zwaan C, Coenegracht JM, Wellens HJ. Value of electrocardiogram in diagnosing right ventricular involvement in patients with an acute inferior wall myocardial infarction. Br Heart J 1983; 49:368–372.
- Zehender M, Kasper W, Kauder E, et al. Right ventricular infarction as an independent predictor of prognosis after acute inferior myocardial infarction. N Engl J Med 1993; 328:981–988.
Q: Which would be the most appropriate diagnosis?
- Pericarditis
- Acute inferior and right ventricular myocardial infarction
- Anterior and inferior myocardial infarction
- None of the above
A: The correct answer is acute inferior and right ventricular myocardial infarction.
Her electrocardiogram showed sinus rhythm and inferior ST-segment elevation myocardial infarction (STEMI) evidenced by ST-segment elevation in leads II, III, and aVF. Hemodynamic instability or ST-segment elevation of more than 1 mm in lead V1 raises the suspicion of right ventricular myocardial infarction. In such patients, the American Heart Association guidelines recommend electrocardiography with right-sided precordial leads.1
A 1-mm ST-segment elevation in the right precordial lead V4R is one of the most predictive electrocardiographic findings in right ventricular infarction.2 The electrocardiographic changes in this type of myocardial infarction may be transient and resolve within 10 hours in up to 48% of cases.3
Echocardiography can also be used to confirm the possibility of right ventricular infarction.
Q: Which clinical condition can occur as a complication of right ventricular myocardial infarction?
- Profound hypotension after nitrate administration
- High-degree heart block
- Atrial fibrillation
- All of the above
A: All of the conditions can occur.
Right ventricular involvement is very common, noted in up to 50% of patients with acute inferior STEMI in postmortem studies.4 However, hemodynamically significant right ventricular dysfunction is much less common.
Intravenous volume loading with normal saline is one of the first steps in the management of hypotension associated with right ventricular infarction. Patients with significant bradycardia or a high degree of atrioventricular block may require pacing. Early reperfusion should be achieved, if possible. Heightened suspicion is critical to the early diagnosis of this condition, since the prognosis is much worse than for isolated inferior STEMI.4
Our patient was found to have right coronary artery disease requiring percutaneous coronary intervention.
- Antman EM, Anbe DT, Armstrong PW, et al; American College of Cardiology. ACC/AHA guidelines for the management of patients with ST-elevation myocardial infarction: a report of the American College of Cardiology/American Heart Association Task Force on Practice Guidelines (Committee to Revise the 1999 Guidelines for the Management of Patients with Acute Myocardial Infarction). Circulation 2004; 110:e82–e292.
- Robalino BD, Whitlow PL, Underwood DA, Salcedo EE. Electrocardiographic manifestations of right ventricular infarction. Am Heart J 1989; 118:138–144.
- Braat SH, Brugada P, de Zwaan C, Coenegracht JM, Wellens HJ. Value of electrocardiogram in diagnosing right ventricular involvement in patients with an acute inferior wall myocardial infarction. Br Heart J 1983; 49:368–372.
- Zehender M, Kasper W, Kauder E, et al. Right ventricular infarction as an independent predictor of prognosis after acute inferior myocardial infarction. N Engl J Med 1993; 328:981–988.
Left ventricular hypertrophy: An overlooked cardiovascular risk factor
Left ventricular hypertrophy (LVH) strongly predicts cardiovascular morbidity and overall mortality in hypertensive patients. 1–7 Antihypertensive treatment that causes LVH to regress decreases the rates of adverse cardiovascular events and improves survival, independent of how much the blood pressure is lowered.8–11 It is clinically important to recognize that LVH is a modifiable risk factor and that management is more complex than just blood pressure control.
This paper reviews the definition of LVH, compares the diagnostic tests for it, and discusses the current evidence-based approach to managing this dangerous risk factor.
A CHRONICALLY ELEVATED CARDIAC WORKLOAD CAUSES LVH
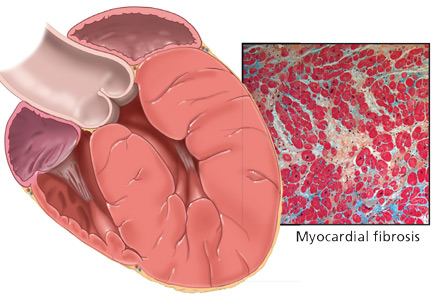
LVH is an abnormal increase in the mass of the left ventricular myocardium caused by a chronically increased workload on the heart.12 This most commonly results from the heart pumping against an elevated afterload, as in hypertension and aortic stenosis. Another notable cause is increased filling of the left ventricle (ie, diastolic overload), which is the underlying mechanism for LVH in patients with aortic or mitral regurgitation and dilated cardiomyopathy. Coronary artery disease can also play a role in the pathogenesis of LVH, as the normal myocardium attempts to compensate for the ischemic or infarcted tissue.13
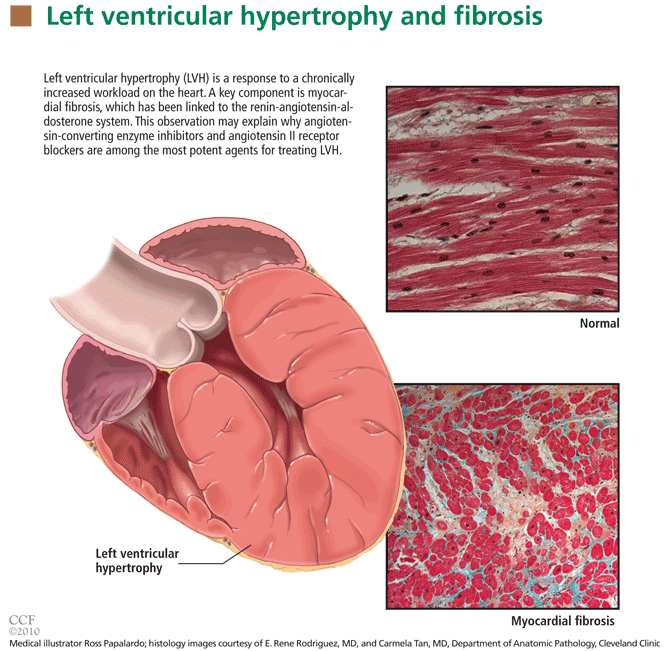
The development of myocardial fibrosis appears to be pathophysiologically linked to the renin-angiotensin-aldosterone system. Specifically, there is evidence that angiotensin II has a profibrotic effect on the myocardium of hypertensive patients.15 This may explain why angiotensin-converting enzyme (ACE) inhibitors and angiotensin II receptor blockers (ARBs) are among the most potent agents for treating LVH, as we will discuss later in this review.
DIAGNOSIS BY ELECTROCARDIOGRAPHY, ECHOCARDIOGRAPHY, OR MRI
Many different criteria for electrocardiographic LVH have been proposed over the years. Most use the voltage in one or more leads, with or without additional factors such as QRS duration, secondary ST-T wave abnormalities, or left atrial abnormalities. The most well known electrocardiographic criteria are the Cornell voltage,21 the Cornell product,22 the Sokolow-Lyon index,23 and the Romhilt-Estes point score system (Table 1).24
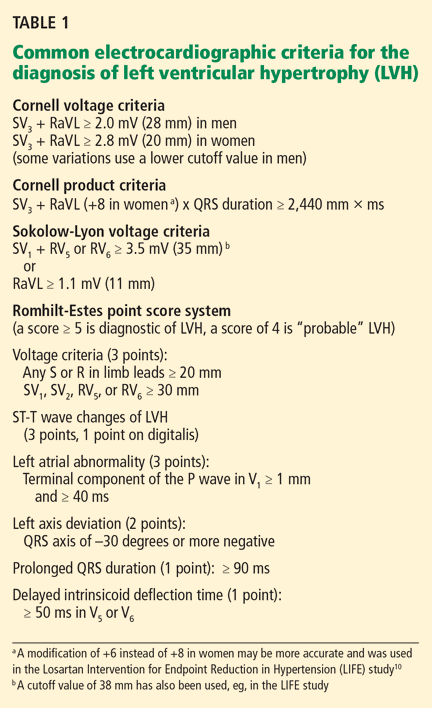
- Cornell voltage—median sensitivity 15%, median specificity 96%
- Cornell product—median sensitivity 19.5%, median specificity 91%
- Sokolow-Lyon voltage—median sensitivity 21%, median specificity 89%
- Romhilt-Estes point score—median sensitivity 17%, median specificity 95%.
Of note, the ranges of the published values were extremely broad. For example, the ranges in sensitivity were:
- Cornell voltage—2% to 41%
- Cornell product—8% to 32%
- Sokolow-Lyon voltage—4% to 51%
- Romhilt-Estes point score—0% to 41%.
While the studies with the extreme values may have had issues of small sample size or poor study quality, the wide range in values may primarily be the result of diverse study populations as well as different validation methods and cutoff values to define LVH. Regardless, the overall message of high specificity and low sensitivity is indisputable.
Electrocardiography is insensitive for diagnosing LVH because it relies on measuring the electrical activity of the heart by electrodes on the surface of the skin to predict the left ventricular mass. The intracardiac electrical activity is problematic to measure externally because the measurements are affected by everything between the myocardium and the electrodes, most notably fat, fluid, and air. Because of this effect, electrocardiography underdiagnoses LVH in patients with obesity, pleural effusions, pericardial effusions, anasarca, or chronic obstructive pulmonary disease. In addition, the diagnosis of LVH by electrocardiography is strongly influenced by age and ethnicity.25–26
While electrocardiography is not sensitive and cannot be used to rule out LVH, it still has a role in its diagnosis and management. In the landmark Losartan Intervention for Endpoint Reduction in Hypertension (LIFE) study, regression of LVH (diagnosed electrocardiographically by the Sokolow-Lyon index or the Cornell product criteria) in response to losartan (Cozaar) improved cardiovascular outcomes independent of blood pressure.10 Based on this, it is reasonable that all hypertensive patients and other patients at risk of LVH who undergo electrocardiography be screened with these two criteria.
Echocardiography is the test of choice
Echocardiography, if available, should be the test of choice to assess for LVH. It is much more sensitive than electrocardiography and can also detect other abnormalities such as left ventricular dysfunction and valvular disease.
This test uses transthoracic or transesophageal ultrasonography to measure the left ventricular end-diastolic diameter, posterior wall thickness, and interventricular septum thickness. From these measurements and the patient’s height and weight, the left ventricular mass index can be calculated.27
Several different cutoff values for the left ventricular mass index have been proposed; the LIFE study used values of > 104 g/m2 in women and > 116 g/m2 in men to define LVH.
When using echocardiography to assess for LVH, it is imperative that the left ventricular mass index be used and not just the left ventricular wall thickness, as often happens in clinical practice. This is necessary because diagnosis by wall thickness alone is not a good indicator of LVH, with a concordance between wall thickness and a left ventricular mass index of only 60%.28 In addition, wall thickness tends to underestimate LVH in women and overestimate it in men.
Is echocardiography cost-effective?
Despite its clear advantages, an important consideration about echocardiography as a screening test for all hypertensive patients is its cost.
A suggested way to reduce cost is to measure the left ventricular mass index only.29 A limited echocardiographic examination is much less expensive than a complete two-dimensional echocardiogram ($255 vs $431 per the 2009 Medicare Ambulatory Payment Classification30) and should be the examination performed if the patient has no other clinical indication for echocardiography.
Another way to control cost is to stratify patients by risk and to do echocardiography only in those who would benefit most from it. Based on the prevalence of LVH, one study concluded that echocardiography is most cost-effective in men 50 years or older.31
Further study is necessary to more precisely define the cost-effectiveness of echocardiographic screening for LVH in terms of potentially preventable cardiovascular morbidity and death.
Cardiac MRI: The costly gold standard
Cardiac MRI is the gold standard test for LVH, as it is even more accurate and reproducible than echocardiography.32 It can precisely estimate a patient's left ventricular mass and assess for other structural cardiac abnormalities.
MRI’s use, however, is severely restricted in clinical practice due to its high cost and limited availability. While it may never be used for general screening for LVH, it certainly has a role in clinical research and for assessing cardiac anatomy in special clinical situations.
TREATMENT SHOULD INCLUDE AN ACE INHIBITOR OR ARB
Once LVH has been diagnosed, the next step is to decide on an appropriate treatment plan.
While the choice of therapy will always depend on other comorbidities, a 2003 metaanalysis of antihypertensive medications in the treatment of LVH (controlling for the degree of blood pressure lowering) showed that ARBs were the most efficacious class of agents for reducing the left ventricular mass.33 Specifically, ARBs decreased the mass by 13%, followed by calcium-channel blockers at 11%, ACE inhibitors at 10%, diuretics at 8%, and beta-blockers at 6%. In pairwise comparison, ARBs, calcium-channel blockers, and ACE inhibitors were all significantly more effective in reducing the left ventricular mass than beta-blockers.
As previously discussed, LVH appears to be pathophysiologically linked to myocardial fibrosis and the renin-angiotensin-aldosterone system. For this reason and based on the data presented above regarding the degree of LVH regression, ACE inhibitors or ARBs should be used as the first-line agents for LVH unless they are contraindicated in the individual patient.
The LIFE study
The LIFE study offers the strongest evidence that treating LVH is beneficial. It showed that in hypertensive patients with electrocardiographic LVH by the Cornell product or Sokolow-Lyon criteria, treatment with antihypertensive drugs that resulted in less-severe LVH on electrocardiography was associated with lower rates of cardiovascular morbidity and death, independent of the blood pressure achieved or the drug used.10
The end point in this study was a composite of stroke, myocardial infarction, and cardiovascular death. Regression of electrocardiographic LVH in hypertensive patients has also been shown to decrease the incidence of diabetes mellitus,34 atrial fibrillation,35 and hospitalizations for heart failure.36
The LIFE study also examined the prognostic implications of treating LVH detected by echocardiography. In this prospective cohort substudy, patients who had a lower left ventricular mass index during treatment with antihypertensive drugs had lower rates of cardiovascular morbidity and all-cause mortality, independent of the effects of blood pressure and treatment used.11
These results suggest that there may be a role not only for treating LVH, but also for monitoring for a reduction in the left ventricular mass index as a goal of therapy (similar to the way hemoglobin A1c is used in diabetic patients). If the index is used in this way, one could potentially adjust the dose of current drugs, switch classes, or add an additional drug based on a persistently elevated left ventricular mass index in order to optimize the patient's overall cardiovascular risk. A randomized controlled trial of therapy directed by the mass index vs conventional therapy of LVH would be necessary to assess the clinical utility of this approach.
RECOMMENDATIONS
LVH is a common and potentially modifiable cardiovascular risk factor often overlooked in clinical practice. Ideally, all hypertensive patients should be screened with echocardiography to look for LVH, using the calculated left ventricular mass index rather than wall thickness alone to make the diagnosis. While electrocardiography is specific and also has prognostic implications, it is not sensitive enough to be used alone to screen for LVH.
Once the diagnosis of LVH is made, the initial therapy should be an ARB or an ACE inhibitor. Response to therapy can be assessed by monitoring for a reduction in left ventricular mass index or regression of electrocardiographic LVH.
Treatment-induced regression of LVH decreases adverse cardiovascular events and improves overall survival. When modifying medications in hypertensive patients, it is important to remember that the treatment of LVH is not synonymous with blood pressure control.
- Casale PN, Devereux RB, Milner M, et al. Value of echocardiographic measurement of left ventricular mass in predicting cardiovascular morbid events in hypertensive men. Ann Intern Med 1986; 105:173–178.
- Levy D, Garrison RJ, Savage DD, Kannel WB, Castelli WP. Prognostic implications of echocardiographically determined left ventricular mass in the Framingham Heart Study. N Engl J Med 1990; 322:1561–1566.
- Koren MJ, Devereux RB, Casale PN, Savage DD, Laragh JH. Relation of left ventricular mass and geometry to morbidity and mortality in uncomplicated essential hypertension. Ann Intern Med 1991; 114:345–352.
- Verdecchia P, Carini G, Circo A, et al; MAVI (MAssa Ventricolare sinistra nell’Ipertensione) Study Group. Left ventricular mass and cardiovascular morbidity in essential hypertension: the MAVI study. J Am Coll Cardiol 2001; 38:1829–1835.
- Haider AW, Larson MG, Benjamin EJ, Levy D. Increased left ventricular mass and hypertrophy are associated with increased risk for sudden death. J Am Coll Cardiol 1998; 32:1454–1459.
- Verdecchia P, Porcellati C, Reboldi G, et al. Left ventricular hypertrophy as an independent predictor of acute cerebrovascular events in essential hypertension. Circulation 2001; 104:2039–2044.
- Schillaci G, Verdecchia P, Porcellati C, Cuccurullo O, Cosco C, Perticone F. Continuous relation between left ventricular mass and cardiovascular risk in essential hypertension. Hypertension 2000; 35:580–586.
- Verdecchia P, Schillaci G, Borgioni C, et al. Prognostic significance of serial changes in left ventricular mass in essential hypertension. Circulation 1998; 97:48–54.
- Mathew J, Sleight P, Lonn E, et al; Heart Outcomes Prevention Evaluation (HOPE) Investigators. Reduction of cardiovascular risk by regression of electrocardiographic markers of left ventricular hypertrophy by the angiotensin-converting enzyme inhibitor ramipril. Circulation 2001; 104:1615–1621.
- Okin PM, Devereux RB, Jern S, et al; LIFE Study Investigators. Regression of electrocardiographic left ventricular hypertrophy during antihypertensive treatment and the prediction of major cardiovascular events. JAMA 2004; 292:2343–2349.
- Devereux RB, Wachtell K, Gerdts E, et al. Prognostic significance of left ventricular mass change during treatment of hypertension. JAMA 2004; 292:2350–2356.
- Lorell BH, Carabello BA. Left ventricular hypertrophy: pathogenesis, detection, and prognosis. Circulation 2000; 102:470–479.
- Zabalgoitia M, Berning J, Koren MJ, et al; LIFE Study Investigators. Impact of coronary artery disease on left ventricular systolic function and geometry in hypertensive patients with left ventricular hypertrophy (the LIFE study). Am J Cardiol 2001; 88:646–650.
- Weber KT, Janicki JS, Pick R, Capasso J, Anversa P. Myocardial fibrosis and pathologic hypertrophy in the rat with renovascular hypertension. Am J Cardiol 1990; 65:1G–7G.
- González A, López B, Querejeta R, Díez J. Regulation of myocardial fibrillar collagen by angiotensin II. A role in hypertensive heart disease? J Mol Cell Cardiol 2002; 34:1585–1593.
- Maron BJ. Hypertrophic cardiomyopathy: a systematic review. JAMA 2002; 287:1308–1320.
- Liebson PR, Grandits G, Prineas R, et al. Echocardiographic correlates of left ventricular structure among 844 mildly hypertensive men and women in the Treatment of Mild Hypertension Study (TOMHS). Circulation 1993; 87:476–486.
- Martinez MA, Sancho T, Armada E, et al; Vascular Risk Working Group Grupo Monitorizacíon Ambulatoria de la Presión Arterial (MAPA)-Madrid. Prevalence of left ventricular hypertrophy in patients with mild hypertension in primary care: impact of echocardiography on cardiovascular risk stratification. Am J Hypertens 2003; 16:556–563.
- Pewsner D, Jüni P, Egger M, Battaglia M, Sundström J, Bachmann LM. Accuracy of electrocardiography in diagnosis of left ventricular hypertrophy in arterial hypertension: systematic review. BMJ 2007; 335:711.
- Devereux RB. Is the electrocardiogram still useful for detection of left ventricular hypertrophy? Circulation 1990; 81:1144–1146.
- Casale PN, Devereux RB, Kligfield P, et al. Electrocardiographic detection of left ventricular hypertrophy: development and prospective validation of improved criteria. J Am Coll Cardiol 1985; 6:572–580.
- Molloy TJ, Okin PM, Devereux RB, Kligfield P. Electrocardiographic detection of left ventricular hypertrophy by the simple QRS voltage-duration product. J Am Coll Cardiol 1992; 20:1180–1186.
- Sokolow M, Lyon TP. The ventricular complex in left ventricular hypertrophy as obtained by unipolar precordial and limb leads. Am Heart J 1949; 37:161–186.
- Romhilt DW, Estes EH. A point-score system for the ECG diagnosis of left ventricular hypertrophy. Am Heart J 1968; 75:752–758.
- Levy D, Labib SB, Anderson KM, Christiansen JC, Kannel WB, Castelli WP. Determinants of sensitivity and specificity of electrocardiographic criteria for left ventricular hypertrophy. Circulation 1990; 81:815–820.
- Okin PM, Wright JT, Nieminen MS, et al. Ethnic differences in electrocardiographic criteria for left ventricular hypertrophy: the LIFE study. Losartan Intervention For Endpoint. Am J Hypertens 2002; 15:663–671.
- Devereux RB, Alonso DR, Lutas EM, et al. Echocardiographic assessment of left ventricular hypertrophy: comparison to necropsy findings. Am J Cardiol 1986; 57:450–458.
- Leibowitz D, Planer D, Ben-Ibgi F, Rott D, Weiss AT, Bursztyn M. Measurement of wall thickness alone does not accurately assess the presence of left ventricular hypertrophy. Clin Exp Hypertens 2007; 29:119–125.
- Black HR, Weltin G, Jaffe CC. The limited echocardiogram: a modification of standard echocardiography for use in the routine evaluation of patients with systemic hypertension. Am J Cardiol 1991; 67:1027–1030.
- American Society of Echocardiography Coding and Reimbursement Newsletter, January 2009. http://www.asecho.org/files/public/CodingnewsJan09.pdf. Accessed May 13, 2010.
- Cuspidi C, Meani S, Valerio C, Fusi V, Sala C, Zanchetti A. Left ventricular hypertrophy and cardiovascular risk stratification: impact and cost-effectiveness of echocardiography in recently diagnosed essential hypertensives. J Hypertens 2006; 24:1671–1677.
- Bottini PB, Carr AA, Prisant LM, Flickinger FW, Allison JD, Gottdiener JS. Magnetic resonance imaging compared to echocardiography to assess left ventricular mass in the hypertensive patient. Am J Hypertens 1995; 8:221–228.
- Klingbeil AU, Schneider M, Martus P, Messerli FH, Schmieder RE. A meta-analysis of the effects of treatment on left ventricular mass in essential hypertension. Am J Med 2003; 115:41–46.
- Okin PM, Devereux RB, Harris KE, et al; LIFE Study Investigators. In-treatment resolution or absence of electrocardiographic left ventricular hypertrophy is associated with decreased incidence of new-onset diabetes mellitus in hypertensive patients: the Losartan Intervention for Endpoint Reduction in Hypertension (LIFE) Study. Hypertension 2007; 50:984–990.
- Okin PM, Wachtell K, Devereux RB, et al. Regression of electrocardiographic left ventricular hypertrophy and decreased incidence of new-onset atrial fibrillation in patients with hypertension. JAMA 2006; 296:1242–1248.
- Okin PM, Devereux RB, Harris KE, et al; LIFE Study Investigators. Regression of electrocardiographic left ventricular hypertrophy is associated with less hospitalization for heart failure in hypertensive patients. Ann Intern Med 2007; 147:311–319.
Left ventricular hypertrophy (LVH) strongly predicts cardiovascular morbidity and overall mortality in hypertensive patients. 1–7 Antihypertensive treatment that causes LVH to regress decreases the rates of adverse cardiovascular events and improves survival, independent of how much the blood pressure is lowered.8–11 It is clinically important to recognize that LVH is a modifiable risk factor and that management is more complex than just blood pressure control.
This paper reviews the definition of LVH, compares the diagnostic tests for it, and discusses the current evidence-based approach to managing this dangerous risk factor.
A CHRONICALLY ELEVATED CARDIAC WORKLOAD CAUSES LVH
LVH is an abnormal increase in the mass of the left ventricular myocardium caused by a chronically increased workload on the heart.12 This most commonly results from the heart pumping against an elevated afterload, as in hypertension and aortic stenosis. Another notable cause is increased filling of the left ventricle (ie, diastolic overload), which is the underlying mechanism for LVH in patients with aortic or mitral regurgitation and dilated cardiomyopathy. Coronary artery disease can also play a role in the pathogenesis of LVH, as the normal myocardium attempts to compensate for the ischemic or infarcted tissue.13
The development of myocardial fibrosis appears to be pathophysiologically linked to the renin-angiotensin-aldosterone system. Specifically, there is evidence that angiotensin II has a profibrotic effect on the myocardium of hypertensive patients.15 This may explain why angiotensin-converting enzyme (ACE) inhibitors and angiotensin II receptor blockers (ARBs) are among the most potent agents for treating LVH, as we will discuss later in this review.
DIAGNOSIS BY ELECTROCARDIOGRAPHY, ECHOCARDIOGRAPHY, OR MRI
Many different criteria for electrocardiographic LVH have been proposed over the years. Most use the voltage in one or more leads, with or without additional factors such as QRS duration, secondary ST-T wave abnormalities, or left atrial abnormalities. The most well known electrocardiographic criteria are the Cornell voltage,21 the Cornell product,22 the Sokolow-Lyon index,23 and the Romhilt-Estes point score system (Table 1).24
- Cornell voltage—median sensitivity 15%, median specificity 96%
- Cornell product—median sensitivity 19.5%, median specificity 91%
- Sokolow-Lyon voltage—median sensitivity 21%, median specificity 89%
- Romhilt-Estes point score—median sensitivity 17%, median specificity 95%.
Of note, the ranges of the published values were extremely broad. For example, the ranges in sensitivity were:
- Cornell voltage—2% to 41%
- Cornell product—8% to 32%
- Sokolow-Lyon voltage—4% to 51%
- Romhilt-Estes point score—0% to 41%.
While the studies with the extreme values may have had issues of small sample size or poor study quality, the wide range in values may primarily be the result of diverse study populations as well as different validation methods and cutoff values to define LVH. Regardless, the overall message of high specificity and low sensitivity is indisputable.
Electrocardiography is insensitive for diagnosing LVH because it relies on measuring the electrical activity of the heart by electrodes on the surface of the skin to predict the left ventricular mass. The intracardiac electrical activity is problematic to measure externally because the measurements are affected by everything between the myocardium and the electrodes, most notably fat, fluid, and air. Because of this effect, electrocardiography underdiagnoses LVH in patients with obesity, pleural effusions, pericardial effusions, anasarca, or chronic obstructive pulmonary disease. In addition, the diagnosis of LVH by electrocardiography is strongly influenced by age and ethnicity.25–26
While electrocardiography is not sensitive and cannot be used to rule out LVH, it still has a role in its diagnosis and management. In the landmark Losartan Intervention for Endpoint Reduction in Hypertension (LIFE) study, regression of LVH (diagnosed electrocardiographically by the Sokolow-Lyon index or the Cornell product criteria) in response to losartan (Cozaar) improved cardiovascular outcomes independent of blood pressure.10 Based on this, it is reasonable that all hypertensive patients and other patients at risk of LVH who undergo electrocardiography be screened with these two criteria.
Echocardiography is the test of choice
Echocardiography, if available, should be the test of choice to assess for LVH. It is much more sensitive than electrocardiography and can also detect other abnormalities such as left ventricular dysfunction and valvular disease.
This test uses transthoracic or transesophageal ultrasonography to measure the left ventricular end-diastolic diameter, posterior wall thickness, and interventricular septum thickness. From these measurements and the patient’s height and weight, the left ventricular mass index can be calculated.27
Several different cutoff values for the left ventricular mass index have been proposed; the LIFE study used values of > 104 g/m2 in women and > 116 g/m2 in men to define LVH.
When using echocardiography to assess for LVH, it is imperative that the left ventricular mass index be used and not just the left ventricular wall thickness, as often happens in clinical practice. This is necessary because diagnosis by wall thickness alone is not a good indicator of LVH, with a concordance between wall thickness and a left ventricular mass index of only 60%.28 In addition, wall thickness tends to underestimate LVH in women and overestimate it in men.
Is echocardiography cost-effective?
Despite its clear advantages, an important consideration about echocardiography as a screening test for all hypertensive patients is its cost.
A suggested way to reduce cost is to measure the left ventricular mass index only.29 A limited echocardiographic examination is much less expensive than a complete two-dimensional echocardiogram ($255 vs $431 per the 2009 Medicare Ambulatory Payment Classification30) and should be the examination performed if the patient has no other clinical indication for echocardiography.
Another way to control cost is to stratify patients by risk and to do echocardiography only in those who would benefit most from it. Based on the prevalence of LVH, one study concluded that echocardiography is most cost-effective in men 50 years or older.31
Further study is necessary to more precisely define the cost-effectiveness of echocardiographic screening for LVH in terms of potentially preventable cardiovascular morbidity and death.
Cardiac MRI: The costly gold standard
Cardiac MRI is the gold standard test for LVH, as it is even more accurate and reproducible than echocardiography.32 It can precisely estimate a patient's left ventricular mass and assess for other structural cardiac abnormalities.
MRI’s use, however, is severely restricted in clinical practice due to its high cost and limited availability. While it may never be used for general screening for LVH, it certainly has a role in clinical research and for assessing cardiac anatomy in special clinical situations.
TREATMENT SHOULD INCLUDE AN ACE INHIBITOR OR ARB
Once LVH has been diagnosed, the next step is to decide on an appropriate treatment plan.
While the choice of therapy will always depend on other comorbidities, a 2003 metaanalysis of antihypertensive medications in the treatment of LVH (controlling for the degree of blood pressure lowering) showed that ARBs were the most efficacious class of agents for reducing the left ventricular mass.33 Specifically, ARBs decreased the mass by 13%, followed by calcium-channel blockers at 11%, ACE inhibitors at 10%, diuretics at 8%, and beta-blockers at 6%. In pairwise comparison, ARBs, calcium-channel blockers, and ACE inhibitors were all significantly more effective in reducing the left ventricular mass than beta-blockers.
As previously discussed, LVH appears to be pathophysiologically linked to myocardial fibrosis and the renin-angiotensin-aldosterone system. For this reason and based on the data presented above regarding the degree of LVH regression, ACE inhibitors or ARBs should be used as the first-line agents for LVH unless they are contraindicated in the individual patient.
The LIFE study
The LIFE study offers the strongest evidence that treating LVH is beneficial. It showed that in hypertensive patients with electrocardiographic LVH by the Cornell product or Sokolow-Lyon criteria, treatment with antihypertensive drugs that resulted in less-severe LVH on electrocardiography was associated with lower rates of cardiovascular morbidity and death, independent of the blood pressure achieved or the drug used.10
The end point in this study was a composite of stroke, myocardial infarction, and cardiovascular death. Regression of electrocardiographic LVH in hypertensive patients has also been shown to decrease the incidence of diabetes mellitus,34 atrial fibrillation,35 and hospitalizations for heart failure.36
The LIFE study also examined the prognostic implications of treating LVH detected by echocardiography. In this prospective cohort substudy, patients who had a lower left ventricular mass index during treatment with antihypertensive drugs had lower rates of cardiovascular morbidity and all-cause mortality, independent of the effects of blood pressure and treatment used.11
These results suggest that there may be a role not only for treating LVH, but also for monitoring for a reduction in the left ventricular mass index as a goal of therapy (similar to the way hemoglobin A1c is used in diabetic patients). If the index is used in this way, one could potentially adjust the dose of current drugs, switch classes, or add an additional drug based on a persistently elevated left ventricular mass index in order to optimize the patient's overall cardiovascular risk. A randomized controlled trial of therapy directed by the mass index vs conventional therapy of LVH would be necessary to assess the clinical utility of this approach.
RECOMMENDATIONS
LVH is a common and potentially modifiable cardiovascular risk factor often overlooked in clinical practice. Ideally, all hypertensive patients should be screened with echocardiography to look for LVH, using the calculated left ventricular mass index rather than wall thickness alone to make the diagnosis. While electrocardiography is specific and also has prognostic implications, it is not sensitive enough to be used alone to screen for LVH.
Once the diagnosis of LVH is made, the initial therapy should be an ARB or an ACE inhibitor. Response to therapy can be assessed by monitoring for a reduction in left ventricular mass index or regression of electrocardiographic LVH.
Treatment-induced regression of LVH decreases adverse cardiovascular events and improves overall survival. When modifying medications in hypertensive patients, it is important to remember that the treatment of LVH is not synonymous with blood pressure control.
- Casale PN, Devereux RB, Milner M, et al. Value of echocardiographic measurement of left ventricular mass in predicting cardiovascular morbid events in hypertensive men. Ann Intern Med 1986; 105:173–178.
- Levy D, Garrison RJ, Savage DD, Kannel WB, Castelli WP. Prognostic implications of echocardiographically determined left ventricular mass in the Framingham Heart Study. N Engl J Med 1990; 322:1561–1566.
- Koren MJ, Devereux RB, Casale PN, Savage DD, Laragh JH. Relation of left ventricular mass and geometry to morbidity and mortality in uncomplicated essential hypertension. Ann Intern Med 1991; 114:345–352.
- Verdecchia P, Carini G, Circo A, et al; MAVI (MAssa Ventricolare sinistra nell’Ipertensione) Study Group. Left ventricular mass and cardiovascular morbidity in essential hypertension: the MAVI study. J Am Coll Cardiol 2001; 38:1829–1835.
- Haider AW, Larson MG, Benjamin EJ, Levy D. Increased left ventricular mass and hypertrophy are associated with increased risk for sudden death. J Am Coll Cardiol 1998; 32:1454–1459.
- Verdecchia P, Porcellati C, Reboldi G, et al. Left ventricular hypertrophy as an independent predictor of acute cerebrovascular events in essential hypertension. Circulation 2001; 104:2039–2044.
- Schillaci G, Verdecchia P, Porcellati C, Cuccurullo O, Cosco C, Perticone F. Continuous relation between left ventricular mass and cardiovascular risk in essential hypertension. Hypertension 2000; 35:580–586.
- Verdecchia P, Schillaci G, Borgioni C, et al. Prognostic significance of serial changes in left ventricular mass in essential hypertension. Circulation 1998; 97:48–54.
- Mathew J, Sleight P, Lonn E, et al; Heart Outcomes Prevention Evaluation (HOPE) Investigators. Reduction of cardiovascular risk by regression of electrocardiographic markers of left ventricular hypertrophy by the angiotensin-converting enzyme inhibitor ramipril. Circulation 2001; 104:1615–1621.
- Okin PM, Devereux RB, Jern S, et al; LIFE Study Investigators. Regression of electrocardiographic left ventricular hypertrophy during antihypertensive treatment and the prediction of major cardiovascular events. JAMA 2004; 292:2343–2349.
- Devereux RB, Wachtell K, Gerdts E, et al. Prognostic significance of left ventricular mass change during treatment of hypertension. JAMA 2004; 292:2350–2356.
- Lorell BH, Carabello BA. Left ventricular hypertrophy: pathogenesis, detection, and prognosis. Circulation 2000; 102:470–479.
- Zabalgoitia M, Berning J, Koren MJ, et al; LIFE Study Investigators. Impact of coronary artery disease on left ventricular systolic function and geometry in hypertensive patients with left ventricular hypertrophy (the LIFE study). Am J Cardiol 2001; 88:646–650.
- Weber KT, Janicki JS, Pick R, Capasso J, Anversa P. Myocardial fibrosis and pathologic hypertrophy in the rat with renovascular hypertension. Am J Cardiol 1990; 65:1G–7G.
- González A, López B, Querejeta R, Díez J. Regulation of myocardial fibrillar collagen by angiotensin II. A role in hypertensive heart disease? J Mol Cell Cardiol 2002; 34:1585–1593.
- Maron BJ. Hypertrophic cardiomyopathy: a systematic review. JAMA 2002; 287:1308–1320.
- Liebson PR, Grandits G, Prineas R, et al. Echocardiographic correlates of left ventricular structure among 844 mildly hypertensive men and women in the Treatment of Mild Hypertension Study (TOMHS). Circulation 1993; 87:476–486.
- Martinez MA, Sancho T, Armada E, et al; Vascular Risk Working Group Grupo Monitorizacíon Ambulatoria de la Presión Arterial (MAPA)-Madrid. Prevalence of left ventricular hypertrophy in patients with mild hypertension in primary care: impact of echocardiography on cardiovascular risk stratification. Am J Hypertens 2003; 16:556–563.
- Pewsner D, Jüni P, Egger M, Battaglia M, Sundström J, Bachmann LM. Accuracy of electrocardiography in diagnosis of left ventricular hypertrophy in arterial hypertension: systematic review. BMJ 2007; 335:711.
- Devereux RB. Is the electrocardiogram still useful for detection of left ventricular hypertrophy? Circulation 1990; 81:1144–1146.
- Casale PN, Devereux RB, Kligfield P, et al. Electrocardiographic detection of left ventricular hypertrophy: development and prospective validation of improved criteria. J Am Coll Cardiol 1985; 6:572–580.
- Molloy TJ, Okin PM, Devereux RB, Kligfield P. Electrocardiographic detection of left ventricular hypertrophy by the simple QRS voltage-duration product. J Am Coll Cardiol 1992; 20:1180–1186.
- Sokolow M, Lyon TP. The ventricular complex in left ventricular hypertrophy as obtained by unipolar precordial and limb leads. Am Heart J 1949; 37:161–186.
- Romhilt DW, Estes EH. A point-score system for the ECG diagnosis of left ventricular hypertrophy. Am Heart J 1968; 75:752–758.
- Levy D, Labib SB, Anderson KM, Christiansen JC, Kannel WB, Castelli WP. Determinants of sensitivity and specificity of electrocardiographic criteria for left ventricular hypertrophy. Circulation 1990; 81:815–820.
- Okin PM, Wright JT, Nieminen MS, et al. Ethnic differences in electrocardiographic criteria for left ventricular hypertrophy: the LIFE study. Losartan Intervention For Endpoint. Am J Hypertens 2002; 15:663–671.
- Devereux RB, Alonso DR, Lutas EM, et al. Echocardiographic assessment of left ventricular hypertrophy: comparison to necropsy findings. Am J Cardiol 1986; 57:450–458.
- Leibowitz D, Planer D, Ben-Ibgi F, Rott D, Weiss AT, Bursztyn M. Measurement of wall thickness alone does not accurately assess the presence of left ventricular hypertrophy. Clin Exp Hypertens 2007; 29:119–125.
- Black HR, Weltin G, Jaffe CC. The limited echocardiogram: a modification of standard echocardiography for use in the routine evaluation of patients with systemic hypertension. Am J Cardiol 1991; 67:1027–1030.
- American Society of Echocardiography Coding and Reimbursement Newsletter, January 2009. http://www.asecho.org/files/public/CodingnewsJan09.pdf. Accessed May 13, 2010.
- Cuspidi C, Meani S, Valerio C, Fusi V, Sala C, Zanchetti A. Left ventricular hypertrophy and cardiovascular risk stratification: impact and cost-effectiveness of echocardiography in recently diagnosed essential hypertensives. J Hypertens 2006; 24:1671–1677.
- Bottini PB, Carr AA, Prisant LM, Flickinger FW, Allison JD, Gottdiener JS. Magnetic resonance imaging compared to echocardiography to assess left ventricular mass in the hypertensive patient. Am J Hypertens 1995; 8:221–228.
- Klingbeil AU, Schneider M, Martus P, Messerli FH, Schmieder RE. A meta-analysis of the effects of treatment on left ventricular mass in essential hypertension. Am J Med 2003; 115:41–46.
- Okin PM, Devereux RB, Harris KE, et al; LIFE Study Investigators. In-treatment resolution or absence of electrocardiographic left ventricular hypertrophy is associated with decreased incidence of new-onset diabetes mellitus in hypertensive patients: the Losartan Intervention for Endpoint Reduction in Hypertension (LIFE) Study. Hypertension 2007; 50:984–990.
- Okin PM, Wachtell K, Devereux RB, et al. Regression of electrocardiographic left ventricular hypertrophy and decreased incidence of new-onset atrial fibrillation in patients with hypertension. JAMA 2006; 296:1242–1248.
- Okin PM, Devereux RB, Harris KE, et al; LIFE Study Investigators. Regression of electrocardiographic left ventricular hypertrophy is associated with less hospitalization for heart failure in hypertensive patients. Ann Intern Med 2007; 147:311–319.
KEY POINTS
- LVH is caused by a chronically increased cardiac workload, most commonly from hypertension.
- Ideally, all hypertensive patients should undergo echocardiography to screen for LVH, using the calculated left ventricular mass index.
- Electrocardiography is too insensitive to be used alone to screen for LVH.
- In hypertensive patients, initial therapy of LVH should consist of an angiotensin II receptor blocker or an angiotensin-converting enzyme inhibitor.
- Treatment-induced regression of LVH improves cardiovascular outcomes independent of blood pressure.
- Further study is necessary to examine the utility of following the left ventricular mass index as a treatment goal.