User login
How Old Are You? Stand on One Leg and I’ll Tell You
This transcript has been edited for clarity.
So I was lying in bed the other night, trying to read my phone, and started complaining to my wife about how my vision keeps getting worse, and then how stiff I feel when I wake up in the morning, and how a recent injury is taking too long to heal, and she said, “Well, yeah. You’re 44. That’s when things start to head downhill.”
And I was like, “Forty-four? That seems very specific. I thought 50 was what people complain about.” And she said, “No, it’s a thing — 44 years old and 60 years old. There’s a drop-off there.”
And you know what? She was right.
A study, “Nonlinear dynamics of multi-omics profiles during human aging,” published in Nature Aging in August 2024, analyzed a ton of proteins and metabolites in people of various ages and found, when you put it all together, that I should know better than to doubt my brilliant spouse.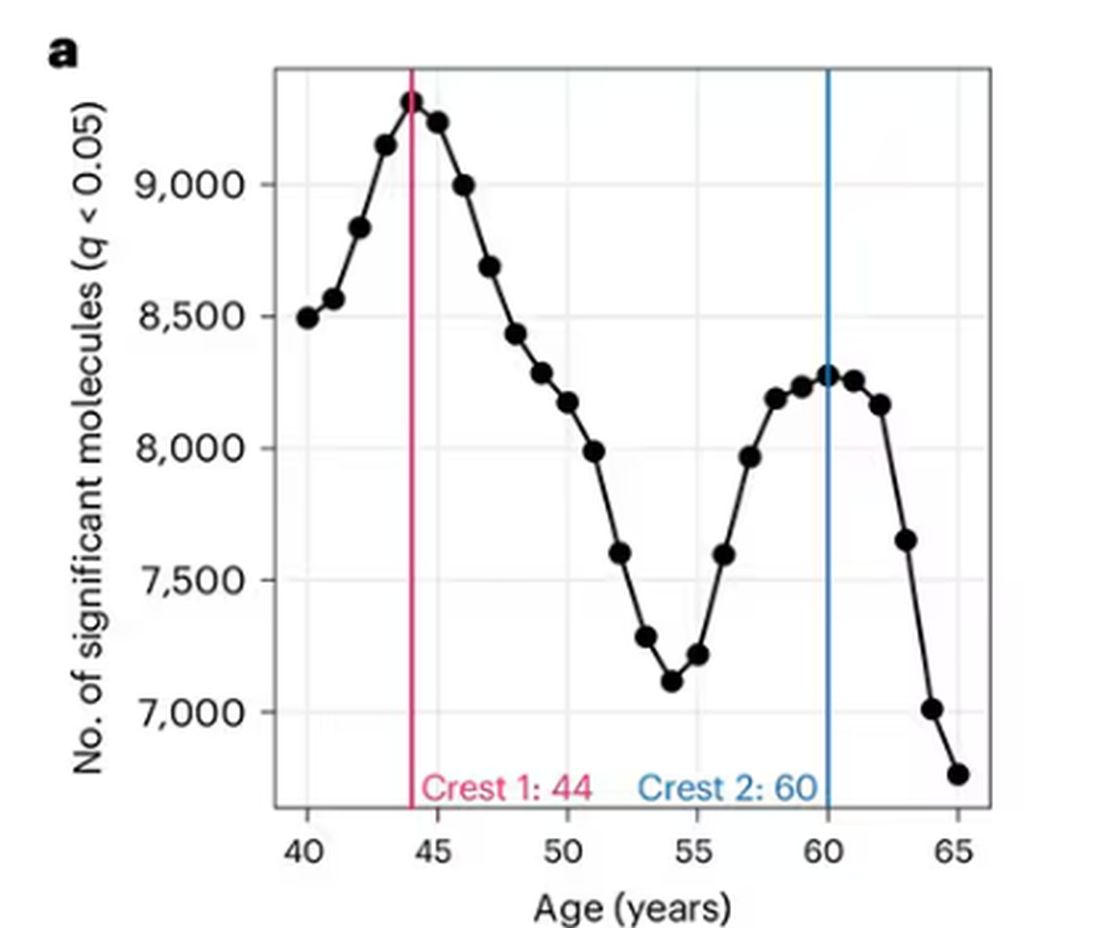
But deep down, I believe the cliché that age is just a number. I don’t particularly care about being 44, or turning 50 or 60. I care about how my body and brain are aging. If I can be a happy, healthy, 80-year-old in full command of my faculties, I would consider that a major win no matter what the calendar says.
So I’m always interested in ways to quantify how my body is aging, independent of how many birthdays I have passed. And, according to a new study, there’s actually a really easy way to do this: Just stand on one leg.
The surprising results come from “Age-related changes in gait, balance, and strength parameters: A cross-sectional study,” appearing in PLOS One, which analyzed 40 individuals — half under age 65 and half over age 65 — across a variety of domains of strength, balance, and gait. The conceit of the study? We all know that things like strength and balance worsen over time, but what worsens fastest? What might be the best metric to tell us how our bodies are aging?
To that end, you have a variety of correlations between various metrics and calendar age.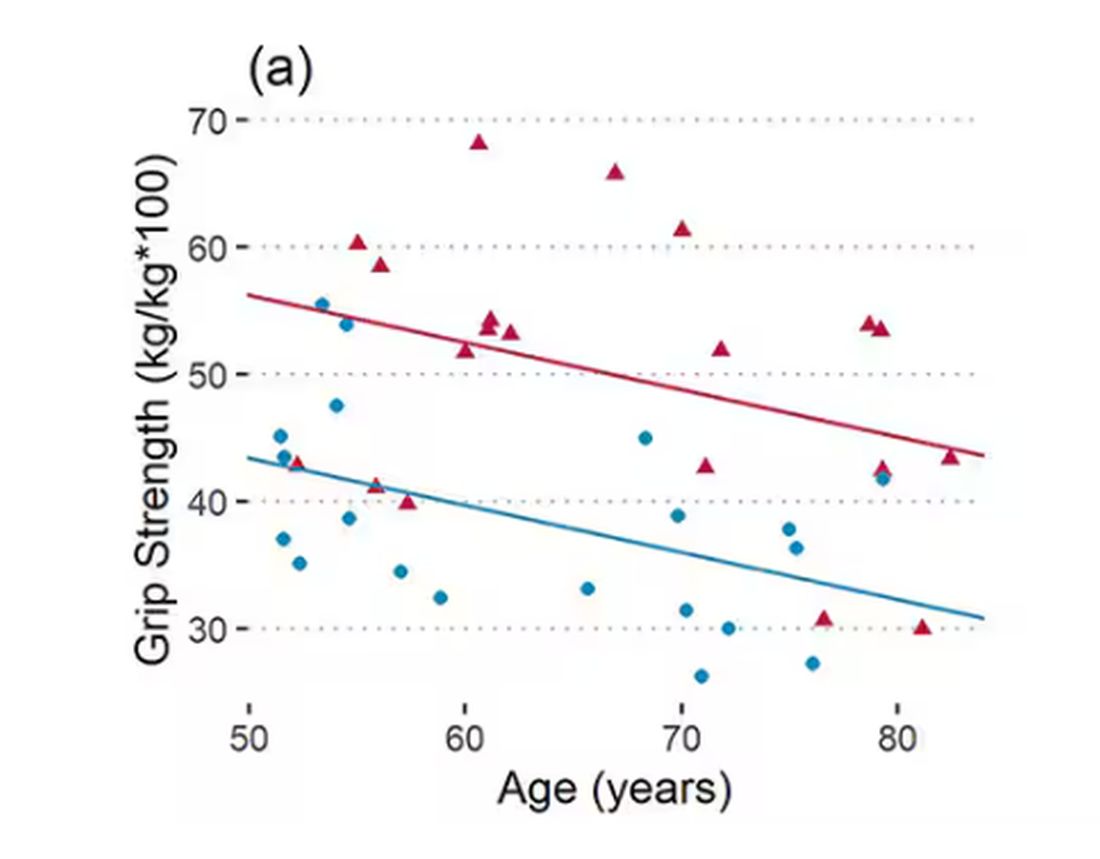
As age increases, grip strength goes down. Men (inexplicably in pink) have higher grip strength overall, and women (confusingly in blue) lower. Somewhat less strong correlations were seen for knee strength.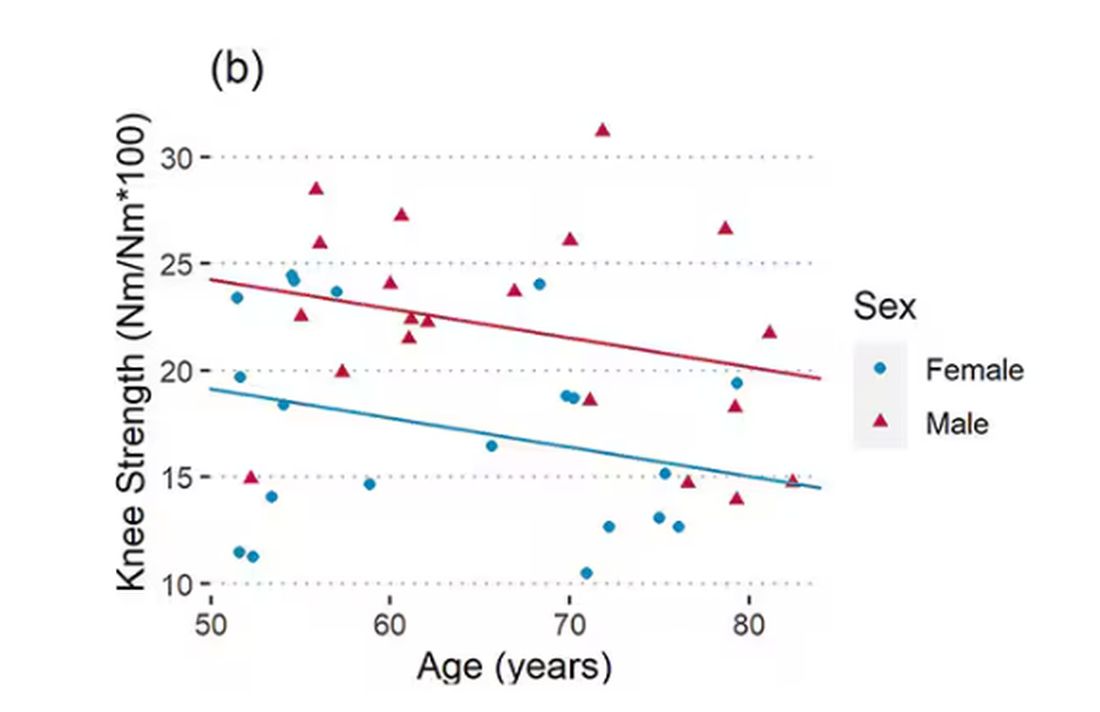
What about balance?
To assess this, the researchers had the participants stand on a pressure plate. In one scenario, they did this with eyes open, and the next with eyes closed. They then measured how much the pressure varied around the center of the individual on the plate — basically, how much the person swayed while they were standing there.
Sway increased as age increased. Sway increased a bit more with eyes closed than with eyes open.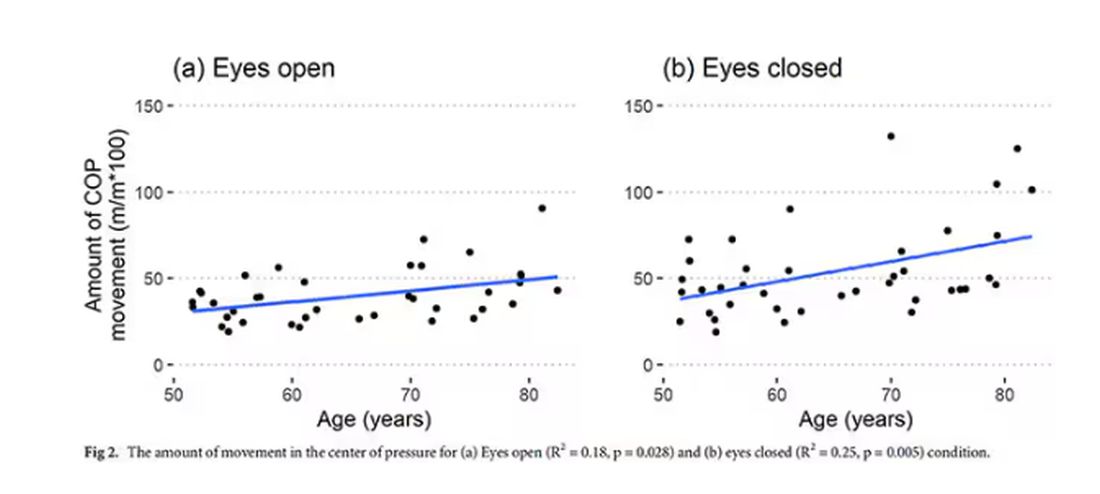
But the strongest correlation between any of these metrics and age was a simple one: How long can you stand on one leg?
Particularly for the nondominant leg, what you see here is a pretty dramatic drop-off in balance time around age 65, with younger people able to do 10 seconds with ease and some older people barely being able to make it to 2. 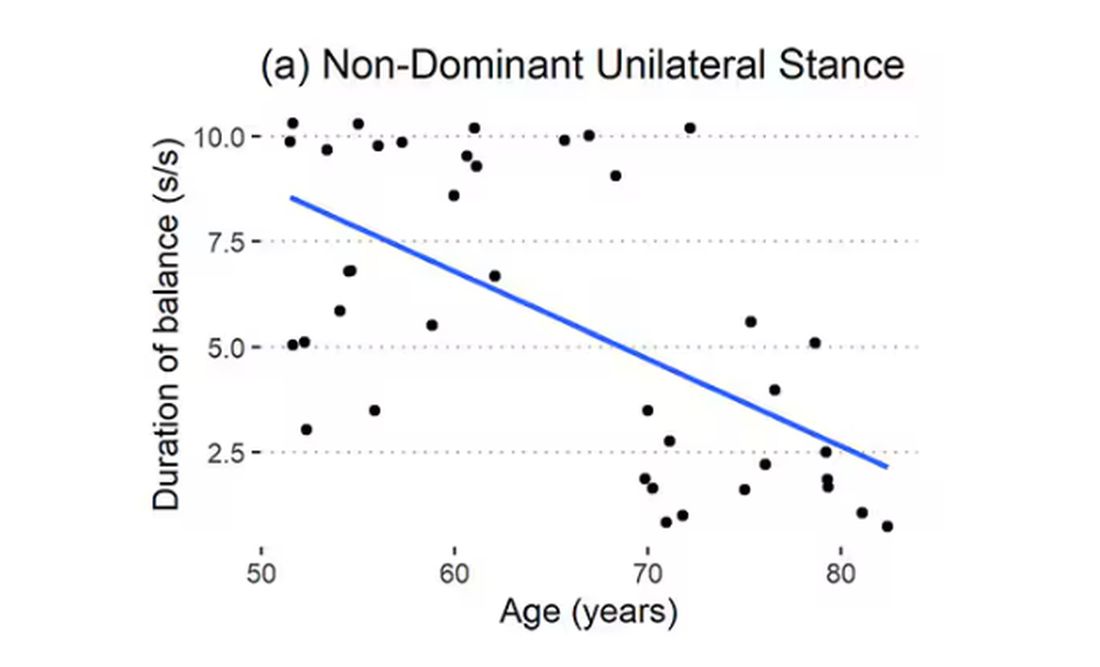
Of course, I had to try this for myself. And as I was standing around on one leg, it became clear to me exactly why this might be a good metric. It really integrates balance and strength in a way that the other tests don’t: balance, clearly, since you have to stay vertical over a relatively small base; but strength as well, because, well, one leg is holding up all the rest of you. You do feel it after a while.
So this metric passes the smell test to me, at least as a potential proxy for age-related physical decline.
But I should be careful to note that this was a cross-sectional study; the researchers looked at various people who were all different ages, not the same people over time to watch how these things change as they aged.
Also, the use of the correlation coefficient in graphs like this implies a certain linear relationship between age and standing-on-one-foot time. The raw data — the points on this graph — don’t appear that linear to me. As I mentioned above, it seems like there might be a bit of a sharp drop-off somewhere in the mid-60s. That means that we may not be able to use this as a sensitive test for aging that slowly changes as your body gets older. It might be that you’re able to essentially stand on one leg as long as you want until, one day, you can’t. That gives us less warning and less to act on.
And finally, we don’t know that changing this metric will change your health for the better. I’m sure a good physiatrist or physical therapist could design some exercises to increase any of our standing-on-one leg times. And no doubt, with practice, you could get your numbers way up. But that doesn’t necessarily mean you’re healthier. It’s like “teaching to the test”; you might score better on the standardized exam but you didn’t really learn the material.
So I am not adding one-leg standing to my daily exercise routine. But I won’t lie and tell you that, from time to time, and certainly on my 60th birthday, you may find me standing like a flamingo with a stopwatch in my hand.
Dr. Wilson is associate professor of medicine and public health and director of the Clinical and Translational Research Accelerator at Yale University, New Haven, Connecticut. He has disclosed no relevant financial relationships.
A version of this article appeared on Medscape.com.
This transcript has been edited for clarity.
So I was lying in bed the other night, trying to read my phone, and started complaining to my wife about how my vision keeps getting worse, and then how stiff I feel when I wake up in the morning, and how a recent injury is taking too long to heal, and she said, “Well, yeah. You’re 44. That’s when things start to head downhill.”
And I was like, “Forty-four? That seems very specific. I thought 50 was what people complain about.” And she said, “No, it’s a thing — 44 years old and 60 years old. There’s a drop-off there.”
And you know what? She was right.
A study, “Nonlinear dynamics of multi-omics profiles during human aging,” published in Nature Aging in August 2024, analyzed a ton of proteins and metabolites in people of various ages and found, when you put it all together, that I should know better than to doubt my brilliant spouse.
But deep down, I believe the cliché that age is just a number. I don’t particularly care about being 44, or turning 50 or 60. I care about how my body and brain are aging. If I can be a happy, healthy, 80-year-old in full command of my faculties, I would consider that a major win no matter what the calendar says.
So I’m always interested in ways to quantify how my body is aging, independent of how many birthdays I have passed. And, according to a new study, there’s actually a really easy way to do this: Just stand on one leg.
The surprising results come from “Age-related changes in gait, balance, and strength parameters: A cross-sectional study,” appearing in PLOS One, which analyzed 40 individuals — half under age 65 and half over age 65 — across a variety of domains of strength, balance, and gait. The conceit of the study? We all know that things like strength and balance worsen over time, but what worsens fastest? What might be the best metric to tell us how our bodies are aging?
To that end, you have a variety of correlations between various metrics and calendar age.
As age increases, grip strength goes down. Men (inexplicably in pink) have higher grip strength overall, and women (confusingly in blue) lower. Somewhat less strong correlations were seen for knee strength.
What about balance?
To assess this, the researchers had the participants stand on a pressure plate. In one scenario, they did this with eyes open, and the next with eyes closed. They then measured how much the pressure varied around the center of the individual on the plate — basically, how much the person swayed while they were standing there.
Sway increased as age increased. Sway increased a bit more with eyes closed than with eyes open.
But the strongest correlation between any of these metrics and age was a simple one: How long can you stand on one leg?
Particularly for the nondominant leg, what you see here is a pretty dramatic drop-off in balance time around age 65, with younger people able to do 10 seconds with ease and some older people barely being able to make it to 2.
Of course, I had to try this for myself. And as I was standing around on one leg, it became clear to me exactly why this might be a good metric. It really integrates balance and strength in a way that the other tests don’t: balance, clearly, since you have to stay vertical over a relatively small base; but strength as well, because, well, one leg is holding up all the rest of you. You do feel it after a while.
So this metric passes the smell test to me, at least as a potential proxy for age-related physical decline.
But I should be careful to note that this was a cross-sectional study; the researchers looked at various people who were all different ages, not the same people over time to watch how these things change as they aged.
Also, the use of the correlation coefficient in graphs like this implies a certain linear relationship between age and standing-on-one-foot time. The raw data — the points on this graph — don’t appear that linear to me. As I mentioned above, it seems like there might be a bit of a sharp drop-off somewhere in the mid-60s. That means that we may not be able to use this as a sensitive test for aging that slowly changes as your body gets older. It might be that you’re able to essentially stand on one leg as long as you want until, one day, you can’t. That gives us less warning and less to act on.
And finally, we don’t know that changing this metric will change your health for the better. I’m sure a good physiatrist or physical therapist could design some exercises to increase any of our standing-on-one leg times. And no doubt, with practice, you could get your numbers way up. But that doesn’t necessarily mean you’re healthier. It’s like “teaching to the test”; you might score better on the standardized exam but you didn’t really learn the material.
So I am not adding one-leg standing to my daily exercise routine. But I won’t lie and tell you that, from time to time, and certainly on my 60th birthday, you may find me standing like a flamingo with a stopwatch in my hand.
Dr. Wilson is associate professor of medicine and public health and director of the Clinical and Translational Research Accelerator at Yale University, New Haven, Connecticut. He has disclosed no relevant financial relationships.
A version of this article appeared on Medscape.com.
Time-Restricted Eating Is Not a Metabolic Magic Bullet
This transcript has been edited for clarity.
One out of three American adults — about 100 million people in this country — have the metabolic syndrome. I’m showing you the official criteria here, but essentially this is a syndrome of insulin resistance and visceral adiposity that predisposes us to a host of chronic diseases such as diabetes, heart disease, and even dementia. 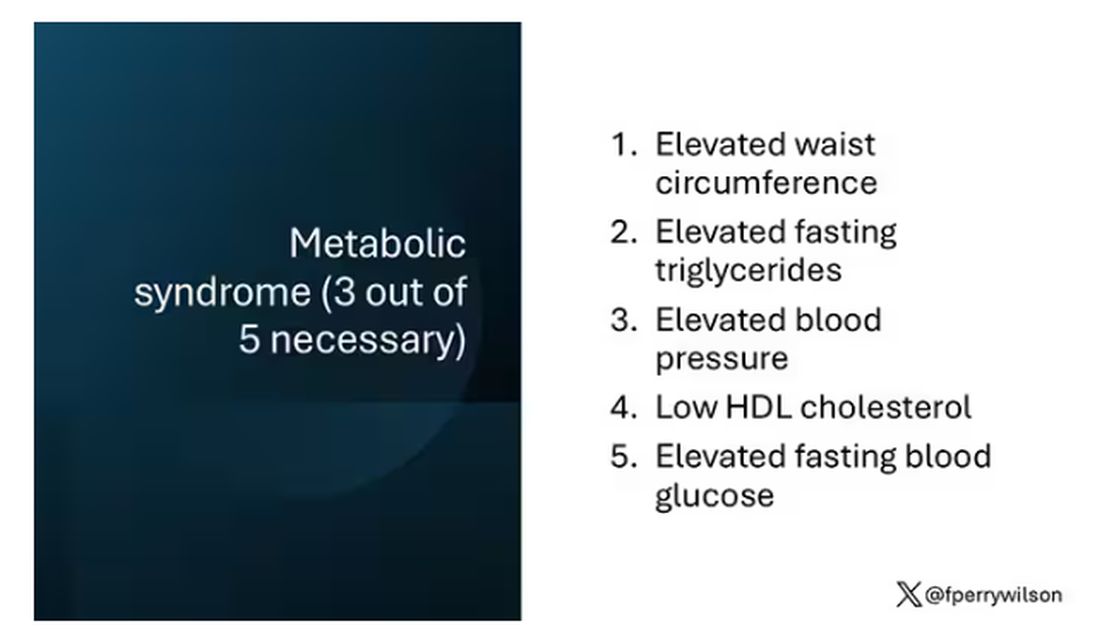
The metabolic syndrome is, fundamentally, a lifestyle disease. There is a direct line between our dietary habits and the wide availability of carbohydrate-rich, highly processed foods, and the rise in the syndrome in the population.
A saying I learned from one of my epidemiology teachers comes to mind: “Lifestyle diseases require lifestyle reinterventions.” But you know what? I’m not so sure anymore.
I’ve been around long enough to see multiple dietary fads come and go with varying efficacy. I grew up in the low-fat era, probably the most detrimental time to our national health as food manufacturers started replacing fats with carbohydrates, driving much of the problem we’re faced with today.
But I was also around for the Atkins diet and the low-carb craze — a healthier approach, all things being equal. And I’ve seen variants of these: the paleo diet (essentially a low-carb, high-protein diet based on minimally processed foods) and the Mediterranean diet, which sought to replace some percentage of fats with healthier fats.
And, of course, there is time-restricted eating.
Time-restricted eating, a variant of intermittent fasting, has the advantage of being very simple. No cookbooks, no recipes. Eat what you want — but limit it to certain hours in the day, ideally a window of less than 10 hours, such as 8 a.m. to 6 p.m.
When it comes to weight loss, the diets that work tend to work because they reduce calorie intake. I know, people will get angry about this, but thermodynamics is not just a good idea, it’s the law.
But weight loss is not the only reason we need to eat healthier. What we eat can impact our health in multiple ways; certain foods lead to more atherosclerosis, more inflammation, increased strain on the kidney and liver, and can affect our glucose homeostasis.
So I was really interested when I saw this article, “Time-Restricted Eating in Adults With Metabolic Syndrome,” appearing in Annals of Internal Medicine October 1, which examined the effect of time-restricted eating on the metabolic syndrome itself. Could this lifestyle intervention cure this lifestyle disease?
In the study, 108 individuals, all of whom had the metabolic syndrome but not full-blown diabetes, were randomized to usual care — basically, nutrition education — vs time-restricted eating. In that group, participants were instructed to reduce their window of eating by at least 4 hours to achieve an 8- to 10-hour eating window. The groups were followed for 3 months.
Now, before we get to the results, it’s important to remember that the success of a lifestyle intervention trial is quite dependent on how well people adhere to the lifestyle intervention. Time-restricted eating is not as easy as taking a pill once a day.
The researchers had participants log their consumption using a smartphone app to confirm whether they were adhering to that restricted eating window.
Broadly speaking, they did. At baseline, both groups had an eating window of about 14 hours a day — think 7 a.m. to 9 p.m. The intervention group reduced that to just under 10 hours, with 10% of days falling outside of the target window.
Lifestyle change achieved, the primary outcome was the change in hemoglobin A1c at 3 months. A1c integrates the serum glucose over time and is thus a good indicator of the success of the intervention in terms of insulin resistance. But the effect was, honestly, disappointing.
Technically, the time-restricted-eating group had a greater A1c change than the control group — by 0.1 percentage points. On average, they went from a baseline A1c of 5.87 to a 3-month A1c of 5.75.
Other metabolic syndrome markers were equally lackluster: no difference in fasting glucose, mean glucose, or fasting insulin.
There was some weight change. The control group, which got that dietary education, lost 1.5% of body weight over the 3 months. The time-restricted-eating group lost 3.3% — about 7 pounds, which is reasonable.
With that weight loss came statistically significant, albeit modest improvements in BMI, body fat percentage, and LDL cholesterol.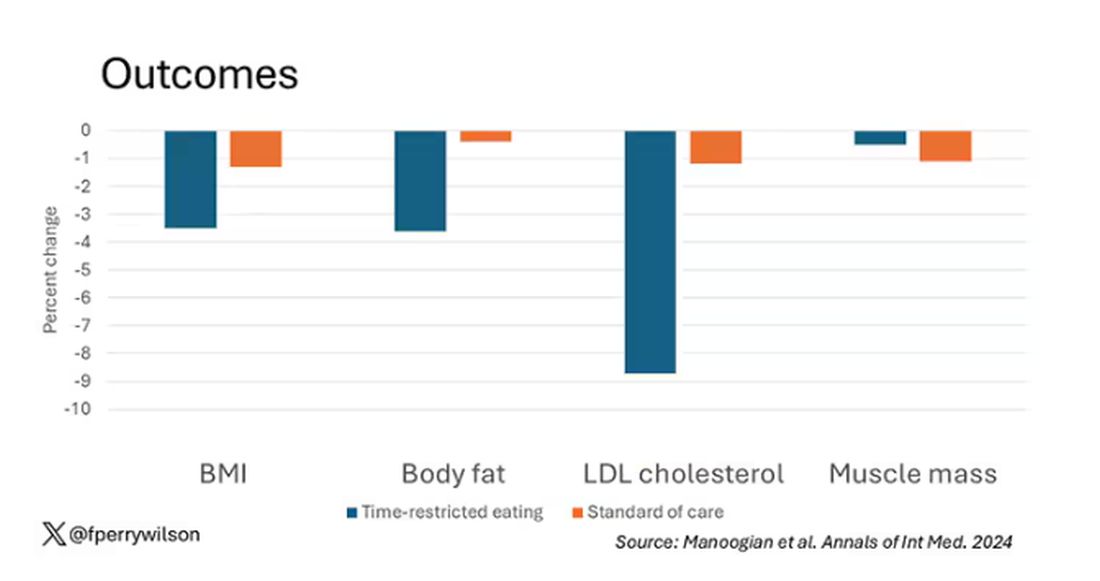
Of interest, despite the larger weight loss in the intermittent-fasting group, there was no difference in muscle mass loss, which is encouraging.
Taken together, we can say that, yes, it seems like time-restricted eating can help people lose some weight. This is essentially due to the fact that people eat fewer calories when they do time-restricted eating, as you can see here.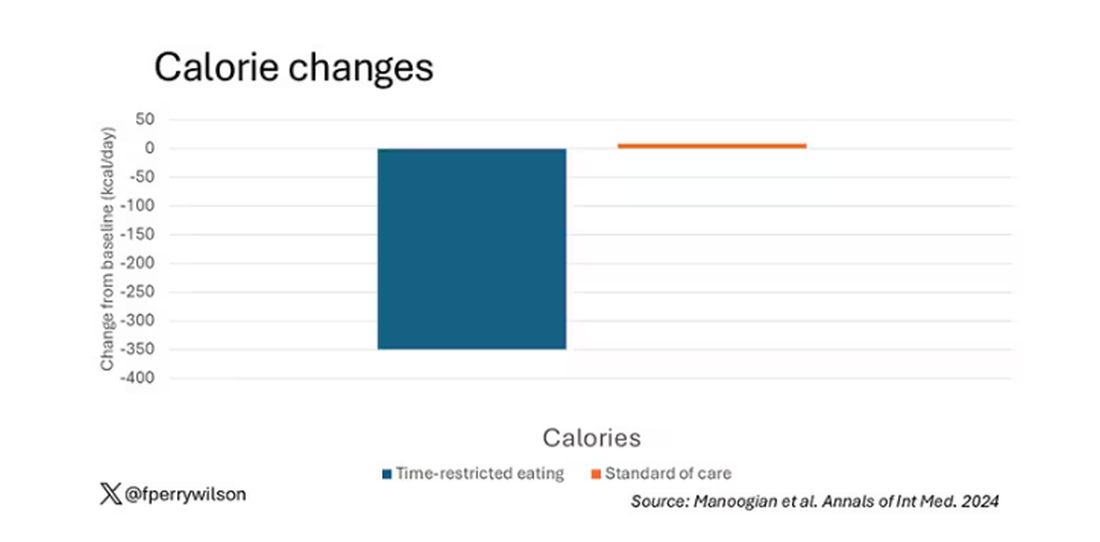
But, in the end, this trial examined whether this relatively straightforward lifestyle intervention would move the needle in terms of metabolic syndrome, and the data are not very compelling for that.
This graph shows how many of those five factors for metabolic syndrome the individuals in this trial had from the start to the end. You see that, over the 3 months, seven people in the time-restricted-eating group moved from having three criteria to two or one — being “cured” of metabolic syndrome, if you will. Nine people in the standard group were cured by that definition. Remember, they had to have at least three to have the syndrome and thus be eligible for the trial. 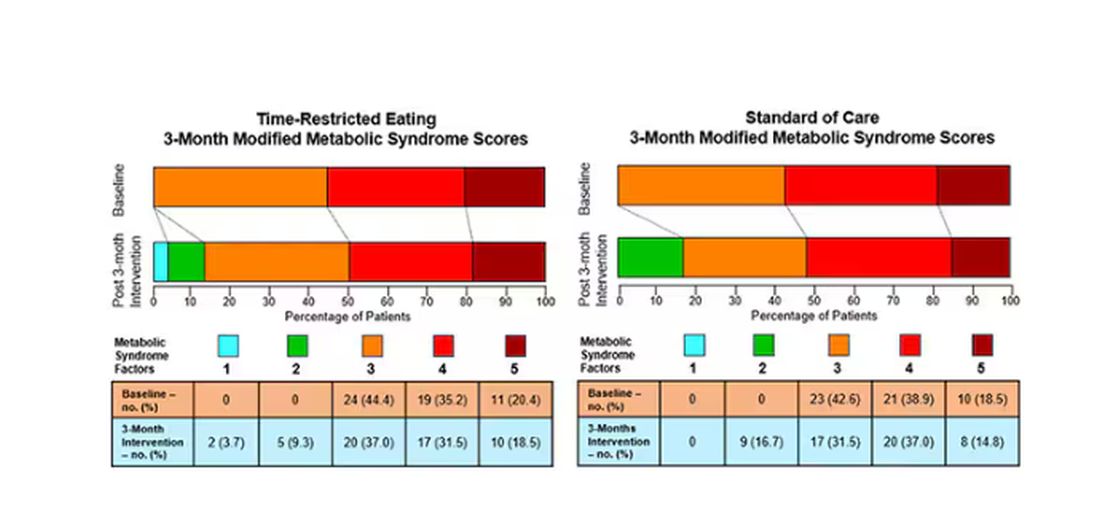
So If it just leads to weight loss by forcing people to consume less calories, then we need to acknowledge that we probably have better methods to achieve this same end. Ten years ago, I would have said that lifestyle change is the only way to end the epidemic of the metabolic syndrome in this country. Today, well, we live in a world of GLP-1 weight loss drugs. It is simply a different world now. Yes, they are expensive. Yes, they have side effects. But we need to evaluate them against the comparison. And so far, lifestyle changes alone are really no comparison.
Dr. Wilson is associate professor of medicine and public health and director of the Clinical and Translational Research Accelerator at Yale University, New Haven, Conn. He has disclosed no relevant financial relationships.
A version of this article appeared on Medscape.com.
This transcript has been edited for clarity.
One out of three American adults — about 100 million people in this country — have the metabolic syndrome. I’m showing you the official criteria here, but essentially this is a syndrome of insulin resistance and visceral adiposity that predisposes us to a host of chronic diseases such as diabetes, heart disease, and even dementia.
The metabolic syndrome is, fundamentally, a lifestyle disease. There is a direct line between our dietary habits and the wide availability of carbohydrate-rich, highly processed foods, and the rise in the syndrome in the population.
A saying I learned from one of my epidemiology teachers comes to mind: “Lifestyle diseases require lifestyle reinterventions.” But you know what? I’m not so sure anymore.
I’ve been around long enough to see multiple dietary fads come and go with varying efficacy. I grew up in the low-fat era, probably the most detrimental time to our national health as food manufacturers started replacing fats with carbohydrates, driving much of the problem we’re faced with today.
But I was also around for the Atkins diet and the low-carb craze — a healthier approach, all things being equal. And I’ve seen variants of these: the paleo diet (essentially a low-carb, high-protein diet based on minimally processed foods) and the Mediterranean diet, which sought to replace some percentage of fats with healthier fats.
And, of course, there is time-restricted eating.
Time-restricted eating, a variant of intermittent fasting, has the advantage of being very simple. No cookbooks, no recipes. Eat what you want — but limit it to certain hours in the day, ideally a window of less than 10 hours, such as 8 a.m. to 6 p.m.
When it comes to weight loss, the diets that work tend to work because they reduce calorie intake. I know, people will get angry about this, but thermodynamics is not just a good idea, it’s the law.
But weight loss is not the only reason we need to eat healthier. What we eat can impact our health in multiple ways; certain foods lead to more atherosclerosis, more inflammation, increased strain on the kidney and liver, and can affect our glucose homeostasis.
So I was really interested when I saw this article, “Time-Restricted Eating in Adults With Metabolic Syndrome,” appearing in Annals of Internal Medicine October 1, which examined the effect of time-restricted eating on the metabolic syndrome itself. Could this lifestyle intervention cure this lifestyle disease?
In the study, 108 individuals, all of whom had the metabolic syndrome but not full-blown diabetes, were randomized to usual care — basically, nutrition education — vs time-restricted eating. In that group, participants were instructed to reduce their window of eating by at least 4 hours to achieve an 8- to 10-hour eating window. The groups were followed for 3 months.
Now, before we get to the results, it’s important to remember that the success of a lifestyle intervention trial is quite dependent on how well people adhere to the lifestyle intervention. Time-restricted eating is not as easy as taking a pill once a day.
The researchers had participants log their consumption using a smartphone app to confirm whether they were adhering to that restricted eating window.
Broadly speaking, they did. At baseline, both groups had an eating window of about 14 hours a day — think 7 a.m. to 9 p.m. The intervention group reduced that to just under 10 hours, with 10% of days falling outside of the target window.
Lifestyle change achieved, the primary outcome was the change in hemoglobin A1c at 3 months. A1c integrates the serum glucose over time and is thus a good indicator of the success of the intervention in terms of insulin resistance. But the effect was, honestly, disappointing.
Technically, the time-restricted-eating group had a greater A1c change than the control group — by 0.1 percentage points. On average, they went from a baseline A1c of 5.87 to a 3-month A1c of 5.75.
Other metabolic syndrome markers were equally lackluster: no difference in fasting glucose, mean glucose, or fasting insulin.
There was some weight change. The control group, which got that dietary education, lost 1.5% of body weight over the 3 months. The time-restricted-eating group lost 3.3% — about 7 pounds, which is reasonable.
With that weight loss came statistically significant, albeit modest improvements in BMI, body fat percentage, and LDL cholesterol.
Of interest, despite the larger weight loss in the intermittent-fasting group, there was no difference in muscle mass loss, which is encouraging.
Taken together, we can say that, yes, it seems like time-restricted eating can help people lose some weight. This is essentially due to the fact that people eat fewer calories when they do time-restricted eating, as you can see here.
But, in the end, this trial examined whether this relatively straightforward lifestyle intervention would move the needle in terms of metabolic syndrome, and the data are not very compelling for that.
This graph shows how many of those five factors for metabolic syndrome the individuals in this trial had from the start to the end. You see that, over the 3 months, seven people in the time-restricted-eating group moved from having three criteria to two or one — being “cured” of metabolic syndrome, if you will. Nine people in the standard group were cured by that definition. Remember, they had to have at least three to have the syndrome and thus be eligible for the trial.
So If it just leads to weight loss by forcing people to consume less calories, then we need to acknowledge that we probably have better methods to achieve this same end. Ten years ago, I would have said that lifestyle change is the only way to end the epidemic of the metabolic syndrome in this country. Today, well, we live in a world of GLP-1 weight loss drugs. It is simply a different world now. Yes, they are expensive. Yes, they have side effects. But we need to evaluate them against the comparison. And so far, lifestyle changes alone are really no comparison.
Dr. Wilson is associate professor of medicine and public health and director of the Clinical and Translational Research Accelerator at Yale University, New Haven, Conn. He has disclosed no relevant financial relationships.
A version of this article appeared on Medscape.com.
Coffee’s ‘Sweet Spot’: Daily Consumption and Cardiometabolic Risk
Each and every day, 1 billion people on this planet ingest a particular psychoactive substance. This chemical has fairly profound physiologic effects. It increases levels of nitric oxide in the blood, leads to vasodilation, and, of course, makes you feel more awake. The substance comes in many forms but almost always in a liquid medium. Do you have it yet? That’s right. The substance is caffeine, quite possibly the healthiest recreational drug that has ever been discovered.
This might be my New England upbringing speaking, but when it comes to lifestyle and health, one of the rules I’ve internalized is that things that are pleasurable are generally bad for you. I know, I know — some of you love to exercise. Some of you love doing crosswords. But you know what I mean. I’m talking French fries, smoked meats, drugs, smoking, alcohol, binge-watching Firefly. You’d be suspicious if a study came out suggesting that eating ice cream in bed reduces your risk for heart attack, and so would I. So I’m always on the lookout for those unicorns of lifestyle factors, those rare things that you want to do and are also good for you.
So far, the data are strong for three things: sleeping, (safe) sexual activity, and coffee. You’ll have to stay tuned for articles about the first two. Today, we’re brewing up some deeper insights about the power of java.
I was inspired to write this article because of a paper, “Habitual Coffee, Tea, and Caffeine Consumption, Circulating Metabolites, and the Risk of Cardiometabolic Multimorbidity,” appearing September 17 in The Journal of Clinical Endocrinology and Metabolism (JCEM).
This is not the first study to suggest that coffee intake may be beneficial. A 2013 meta-analysis summarized the results of 36 studies with more than a million participants and found a U-shaped relationship between coffee intake and cardiovascular risk. The sweet spot was at three to five cups a day; people drinking that much coffee had about a 15% reduced risk for cardiovascular disease compared with nondrinkers.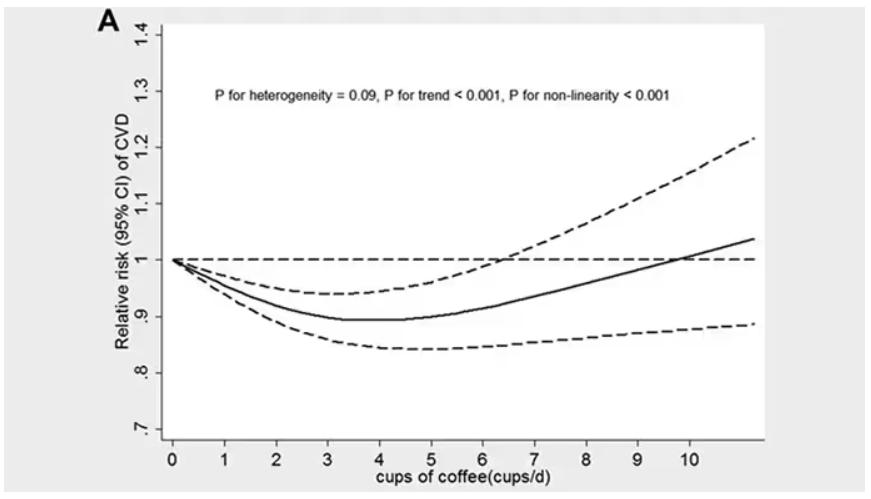
But here’s the thing. Coffee contains caffeine, but it is much more than that. It is a heady brew of various chemicals and compounds, phenols, and chlorogenic acids. And, of course, you can get caffeine from stuff that isn’t coffee — natural things like tea — and decidedly unnatural things like energy drinks. How do you figure out where the benefit really lies?
The JCEM study leveraged the impressive UK Biobank dataset to figure this out. The Biobank recruited more than half a million people from the UK between 2006 and 2010 and collected a wealth of data from each of them: surveys, blood samples, biometrics, medical imaging — the works. And then they followed what would happen to those people medically over time. It’s a pretty amazing resource.
But for the purposes of this study, what you need to know is that just under 200,000 of those participants met the key criteria for this study: being free from cardiovascular disease at baseline; having completed a detailed survey about their coffee, tea, and other caffeinated beverage intake; and having adequate follow-up. A subset of that number, just under 100,000, had metabolomic data — which is where this study really gets interesting.
We’ll dive into the metabolome in a moment, but first let’s just talk about the main finding, the relationship between coffee, tea, or caffeine and cardiovascular disease. But to do that, we need to acknowledge that people who drink a lot of coffee are different from people who don’t, and it might be those differences, not the coffee itself, that are beneficial.
What were those differences? People who drank more coffee tended to be a bit older, were less likely to be female, and were slightly more likely to engage in physical activity. They ate less processed meat but also fewer vegetables. Some of those factors, like being female, are generally protective against cardiovascular disease; but some, like age, are definitely not. The authors adjusted for these and multiple other factors, including alcohol intake, BMI, kidney function, and many others to try to disentangle the effect of being the type of person who drinks a lot of coffee from the drinking a lot of coffee itself.
These are the results of the fully adjusted model. Compared with nonconsumers, you can see that people in the higher range of coffee, tea, or just caffeine intake have almost a 40% reduction in cardiovascular disease in follow-up.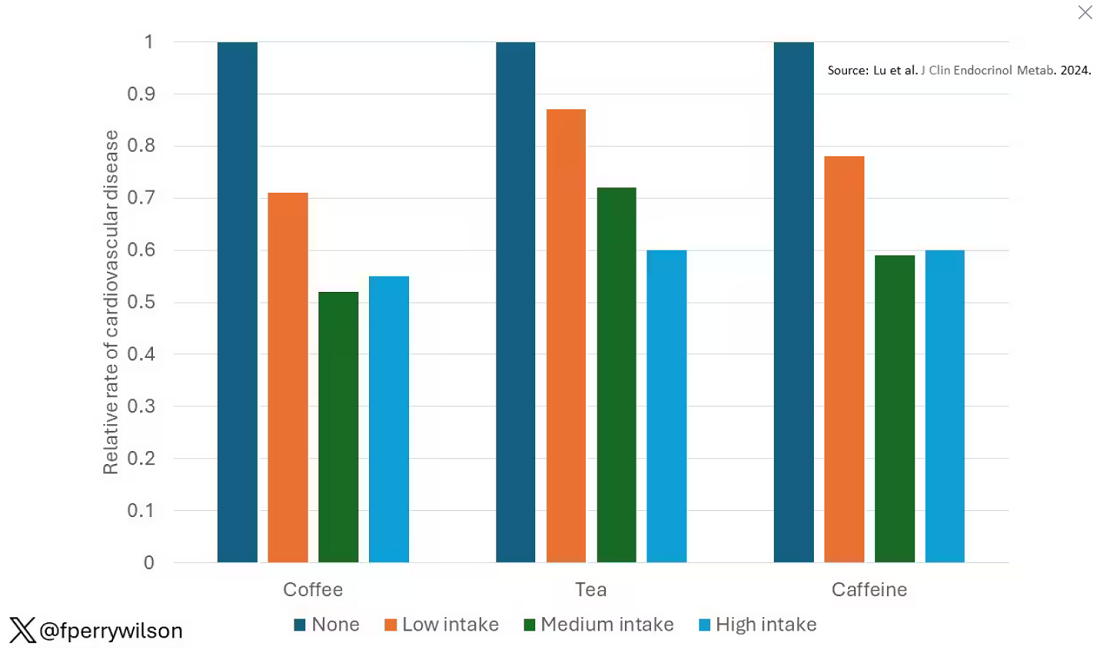
Looking at the benefit across the spectrum of intake, you again see that U-shaped curve, suggesting that a sweet spot for daily consumption can be found around 3 cups of coffee or tea (or 250 mg of caffeine). A standard energy drink contains about 120 mg of caffeine. 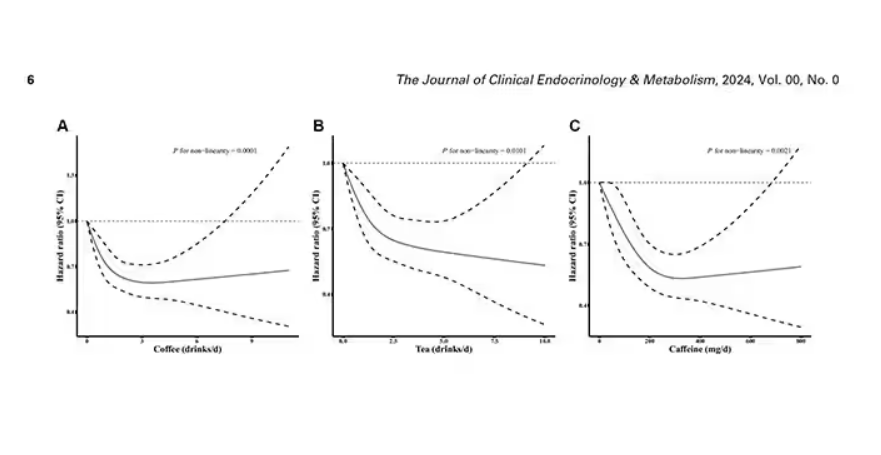
But if this is true, it would be good to know why. To figure that out, the authors turned to the metabolome. The idea here is that your body is constantly breaking stuff down, taking all these proteins and chemicals and compounds that we ingest and turning them into metabolites. Using advanced measurement techniques, researchers can measure hundreds or even thousands of metabolites from a single blood sample. They provide information, obviously, about the food you eat and the drinks you drink, but what is really intriguing is that some metabolites are associated with better health and some with worse
In this study, researchers measured 168 individual metabolites. Eighty of them, nearly half, were significantly altered in people who drank more coffee.
This figure summarizes the findings, and yes, this is way too complicated. 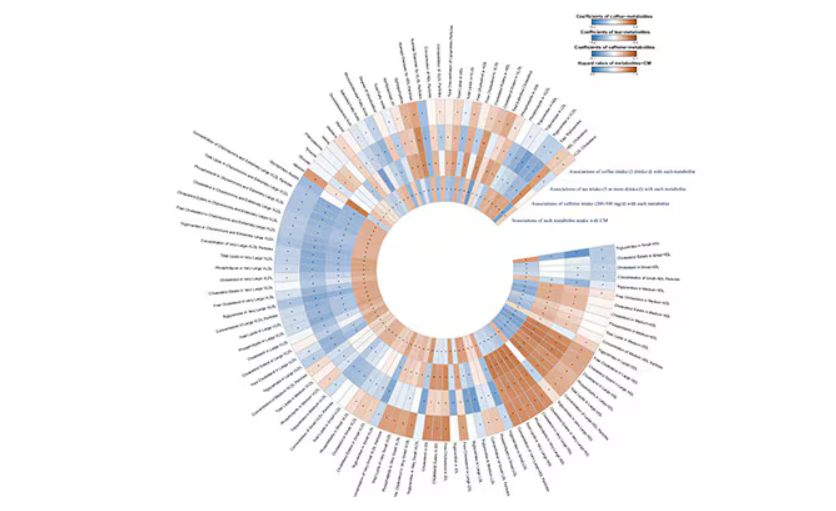
But here’s how to interpret it. The inner ring shows you how certain metabolites are associated with cardiovascular disease. The outer rings show you how those metabolites are associated with coffee, tea, or caffeine. The interesting part is that the sections of the ring (outer rings and inner rings) are very different colors.
Like here.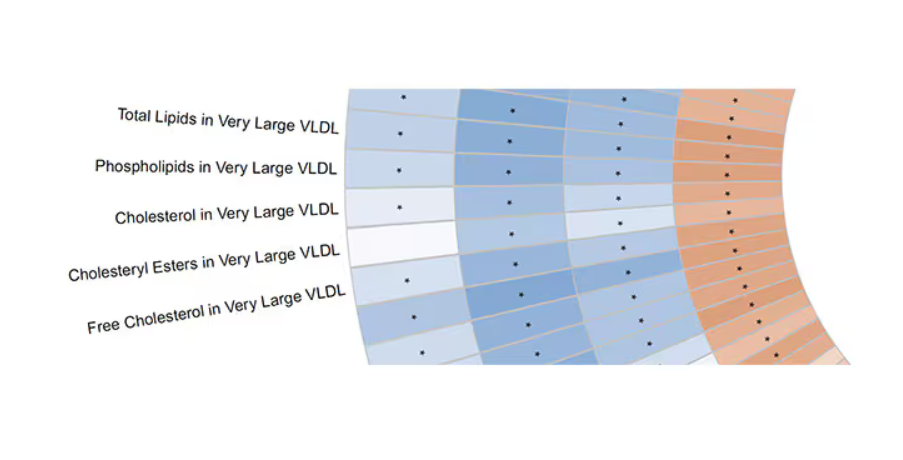
What you see here is a fairly profound effect that coffee, tea, or caffeine intake has on metabolites of VLDL — bad cholesterol. The beverages lower it, and, of course, higher levels lead to cardiovascular disease. This means that this is a potential causal pathway from coffee intake to heart protection.
And that’s not the only one.
You see a similar relationship for saturated fatty acids. Higher levels lead to cardiovascular disease, and coffee intake lowers levels. The reverse works too: Lower levels of histidine (an amino acid) increase cardiovascular risk, and coffee seems to raise those levels.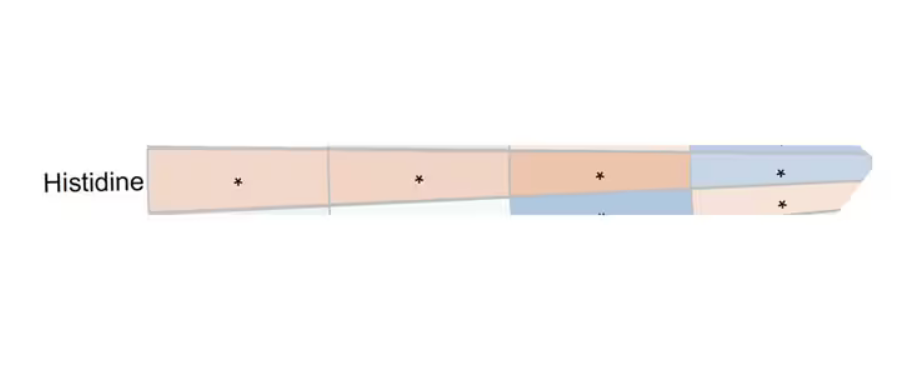
Is this all too good to be true? It’s hard to say. The data on coffee’s benefits have been remarkably consistent. Still, I wouldn’t be a good doctor if I didn’t mention that clearly there is a difference between a cup of black coffee and a venti caramel Frappuccino.
Nevertheless, coffee remains firmly in my holy trinity of enjoyable things that are, for whatever reason, still good for you. So, when you’re having that second, or third, or maybe fourth cup of the day, you can take that to heart.
Dr. Wilson, associate professor of medicine and public health and director of Yale’s Clinical and Translational Research Accelerator, reported no conflicts of interest.
A version of this article first appeared on Medscape.com.
Each and every day, 1 billion people on this planet ingest a particular psychoactive substance. This chemical has fairly profound physiologic effects. It increases levels of nitric oxide in the blood, leads to vasodilation, and, of course, makes you feel more awake. The substance comes in many forms but almost always in a liquid medium. Do you have it yet? That’s right. The substance is caffeine, quite possibly the healthiest recreational drug that has ever been discovered.
This might be my New England upbringing speaking, but when it comes to lifestyle and health, one of the rules I’ve internalized is that things that are pleasurable are generally bad for you. I know, I know — some of you love to exercise. Some of you love doing crosswords. But you know what I mean. I’m talking French fries, smoked meats, drugs, smoking, alcohol, binge-watching Firefly. You’d be suspicious if a study came out suggesting that eating ice cream in bed reduces your risk for heart attack, and so would I. So I’m always on the lookout for those unicorns of lifestyle factors, those rare things that you want to do and are also good for you.
So far, the data are strong for three things: sleeping, (safe) sexual activity, and coffee. You’ll have to stay tuned for articles about the first two. Today, we’re brewing up some deeper insights about the power of java.
I was inspired to write this article because of a paper, “Habitual Coffee, Tea, and Caffeine Consumption, Circulating Metabolites, and the Risk of Cardiometabolic Multimorbidity,” appearing September 17 in The Journal of Clinical Endocrinology and Metabolism (JCEM).
This is not the first study to suggest that coffee intake may be beneficial. A 2013 meta-analysis summarized the results of 36 studies with more than a million participants and found a U-shaped relationship between coffee intake and cardiovascular risk. The sweet spot was at three to five cups a day; people drinking that much coffee had about a 15% reduced risk for cardiovascular disease compared with nondrinkers.
But here’s the thing. Coffee contains caffeine, but it is much more than that. It is a heady brew of various chemicals and compounds, phenols, and chlorogenic acids. And, of course, you can get caffeine from stuff that isn’t coffee — natural things like tea — and decidedly unnatural things like energy drinks. How do you figure out where the benefit really lies?
The JCEM study leveraged the impressive UK Biobank dataset to figure this out. The Biobank recruited more than half a million people from the UK between 2006 and 2010 and collected a wealth of data from each of them: surveys, blood samples, biometrics, medical imaging — the works. And then they followed what would happen to those people medically over time. It’s a pretty amazing resource.
But for the purposes of this study, what you need to know is that just under 200,000 of those participants met the key criteria for this study: being free from cardiovascular disease at baseline; having completed a detailed survey about their coffee, tea, and other caffeinated beverage intake; and having adequate follow-up. A subset of that number, just under 100,000, had metabolomic data — which is where this study really gets interesting.
We’ll dive into the metabolome in a moment, but first let’s just talk about the main finding, the relationship between coffee, tea, or caffeine and cardiovascular disease. But to do that, we need to acknowledge that people who drink a lot of coffee are different from people who don’t, and it might be those differences, not the coffee itself, that are beneficial.
What were those differences? People who drank more coffee tended to be a bit older, were less likely to be female, and were slightly more likely to engage in physical activity. They ate less processed meat but also fewer vegetables. Some of those factors, like being female, are generally protective against cardiovascular disease; but some, like age, are definitely not. The authors adjusted for these and multiple other factors, including alcohol intake, BMI, kidney function, and many others to try to disentangle the effect of being the type of person who drinks a lot of coffee from the drinking a lot of coffee itself.
These are the results of the fully adjusted model. Compared with nonconsumers, you can see that people in the higher range of coffee, tea, or just caffeine intake have almost a 40% reduction in cardiovascular disease in follow-up.
Looking at the benefit across the spectrum of intake, you again see that U-shaped curve, suggesting that a sweet spot for daily consumption can be found around 3 cups of coffee or tea (or 250 mg of caffeine). A standard energy drink contains about 120 mg of caffeine.
But if this is true, it would be good to know why. To figure that out, the authors turned to the metabolome. The idea here is that your body is constantly breaking stuff down, taking all these proteins and chemicals and compounds that we ingest and turning them into metabolites. Using advanced measurement techniques, researchers can measure hundreds or even thousands of metabolites from a single blood sample. They provide information, obviously, about the food you eat and the drinks you drink, but what is really intriguing is that some metabolites are associated with better health and some with worse
In this study, researchers measured 168 individual metabolites. Eighty of them, nearly half, were significantly altered in people who drank more coffee.
This figure summarizes the findings, and yes, this is way too complicated.
But here’s how to interpret it. The inner ring shows you how certain metabolites are associated with cardiovascular disease. The outer rings show you how those metabolites are associated with coffee, tea, or caffeine. The interesting part is that the sections of the ring (outer rings and inner rings) are very different colors.
Like here.
What you see here is a fairly profound effect that coffee, tea, or caffeine intake has on metabolites of VLDL — bad cholesterol. The beverages lower it, and, of course, higher levels lead to cardiovascular disease. This means that this is a potential causal pathway from coffee intake to heart protection.
And that’s not the only one.
You see a similar relationship for saturated fatty acids. Higher levels lead to cardiovascular disease, and coffee intake lowers levels. The reverse works too: Lower levels of histidine (an amino acid) increase cardiovascular risk, and coffee seems to raise those levels.
Is this all too good to be true? It’s hard to say. The data on coffee’s benefits have been remarkably consistent. Still, I wouldn’t be a good doctor if I didn’t mention that clearly there is a difference between a cup of black coffee and a venti caramel Frappuccino.
Nevertheless, coffee remains firmly in my holy trinity of enjoyable things that are, for whatever reason, still good for you. So, when you’re having that second, or third, or maybe fourth cup of the day, you can take that to heart.
Dr. Wilson, associate professor of medicine and public health and director of Yale’s Clinical and Translational Research Accelerator, reported no conflicts of interest.
A version of this article first appeared on Medscape.com.
These Four Factors Account for 18 Years of Life Expectancy
This transcript has been edited for clarity.
Two individuals in the United States are celebrating their 30th birthdays. It’s a good day. They are entering the prime of their lives. One is a married White woman with a university degree. The other is a never-married White man with a high school diploma.
How many more years of life can these two individuals look forward to?
There’s a fairly dramatic difference. The man can expect 37.1 more years of life on average, living to be about 67. The woman can expect to live to age 85. That’s a life-expectancy discrepancy of 18 years based solely on gender, education, and marital status.
I’m using these cases to illustrate the extremes of life expectancy across four key social determinants of health: sex, race, marital status, and education. We all have some sense of how these factors play out in terms of health, but a new study suggests that it’s actually quite a bit more complicated than we thought.
Let me start by acknowledging my own bias here. As a clinical researcher, I sometimes find it hard to appreciate the value of actuarial-type studies that look at life expectancy (or any metric, really) between groups defined by marital status, for example. I’m never quite sure what to do with the conclusion. Married people live longer, the headline says. Okay, but as a doctor, what am I supposed to do about that? Encourage my patients to settle down and commit? Studies showing that women live longer than men or that White people live longer than Black people are also hard for me to incorporate into my practice. These are not easily changeable states.
But studies examining these groups are a reasonable starting point to ask more relevant questions. Why do women live longer than men? Is it behavioral (men take more risks and are less likely to see doctors)? Or is it hormonal (estrogen has a lot of protective effects that testosterone does not)? Or is it something else?
Integrating these social determinants of health into a cohesive story is a bit harder than it might seem, as this study, appearing in BMJ Open, illustrates.
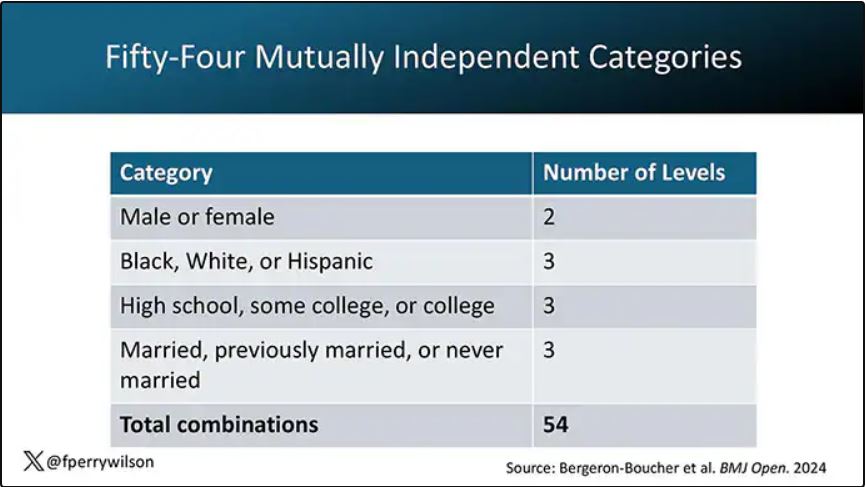
In the context of this study, every person in America can be placed into one of 54 mutually exclusive groups. You can be male or female. You can be Black, White, or Hispanic. You can have a high school diploma or less, an associate degree, or a college degree; and you can be married, previously married, or never married.
Of course, this does not capture the beautiful tapestry that is American life, but let’s give them a pass. They are working with data from the American Community Survey, which contains 8634 people — the statistics would run into trouble with more granular divisions. This survey can be population weighted, so you can scale up the results to reasonably represent the population of the United States.
The survey collected data on the four broad categories of sex, race, education, and marital status and linked those survey results to the Multiple Cause of Death dataset from the CDC. From there, it’s a pretty simple task to rank the 54 categories in order from longest to shortest life expectancy, as you can see here.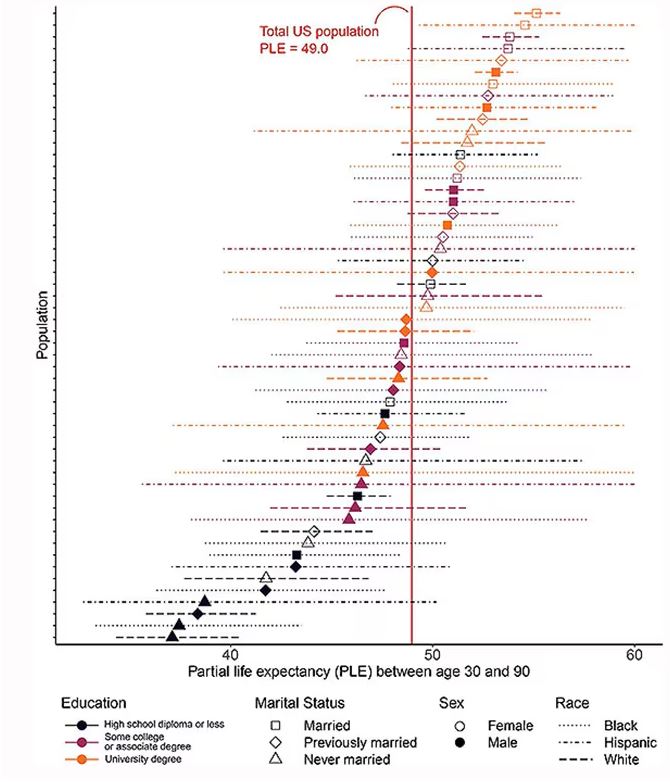
But that’s not really the interesting part of this study. Sure, there is a lot of variation; it’s interesting that these four factors explain about 18 years’ difference in life expectancy in this country. What strikes me here, actually, is the lack of an entirely consistent message across this spectrum.
Let me walk you through the second figure in this paper, because this nicely illustrates the surprising heterogeneity that exists here.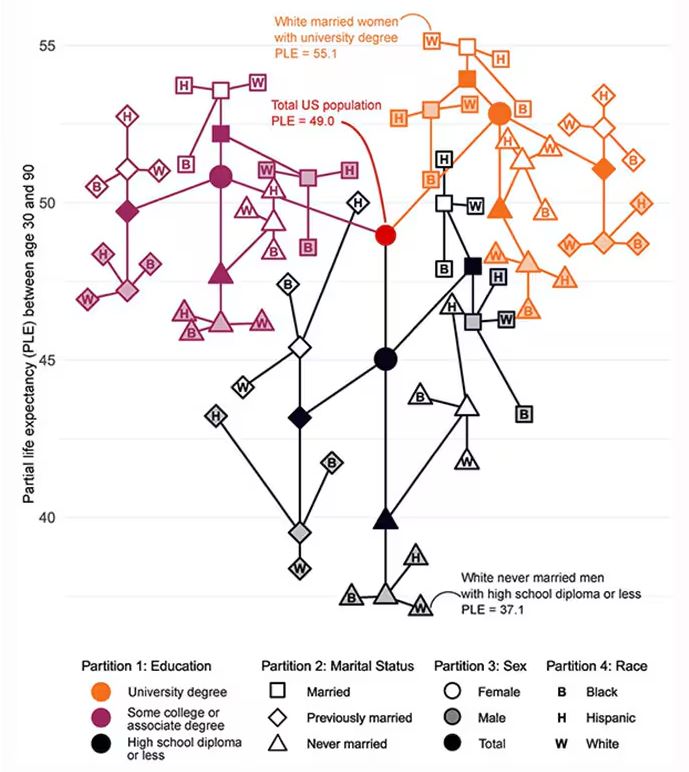
This may seem overwhelming, but basically, shapes that are higher up on the Y-axis represent the groups with longer life expectancy.
You can tell, for example, that shapes that are black in color (groups with high school educations or less) are generally lower. But not universally so. This box represents married, Hispanic females who do quite well in terms of life expectancy, even at that lower educational level.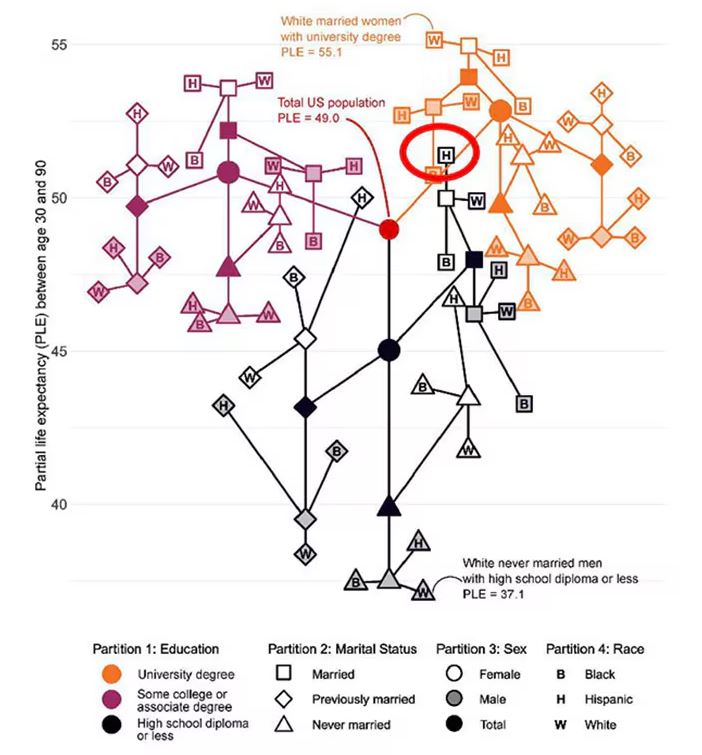
The authors quantify this phenomenon by creating a mortality risk score that integrates these findings. It looks something like this, with 0 being average morality for the United States.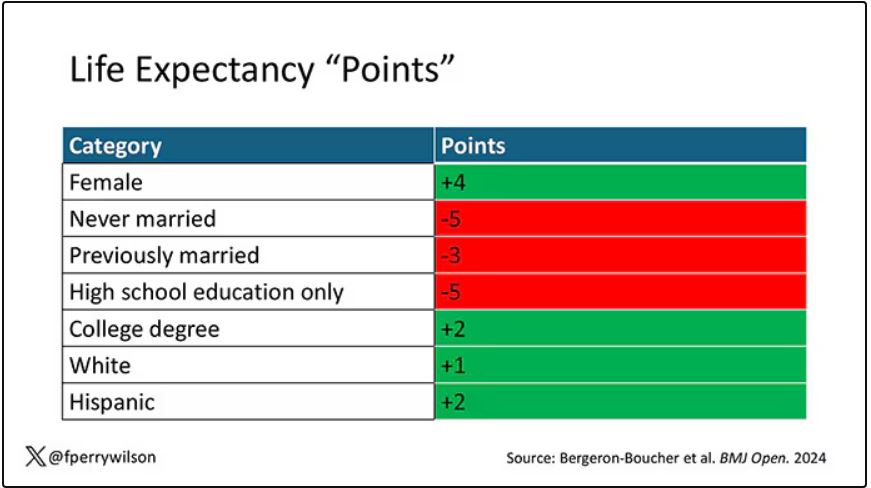
As you can see, you get a bunch of points for being female, but you lose a bunch for not being married. Education plays a large role, with a big hit for those who have a high school diploma or less, and a bonus for those with a college degree. Race plays a relatively more minor role.
This is all very interesting, but as I said at the beginning, this isn’t terribly useful to me as a physician. More important is figuring out why these differences exist. And there are some clues in the study data, particularly when we examine causes of death. This figure ranks those 54 groups again, from the married, White, college-educated females down to the never-married, White, high school–educated males. The boxes show how much more or less likely this group is to die of a given condition than the general population.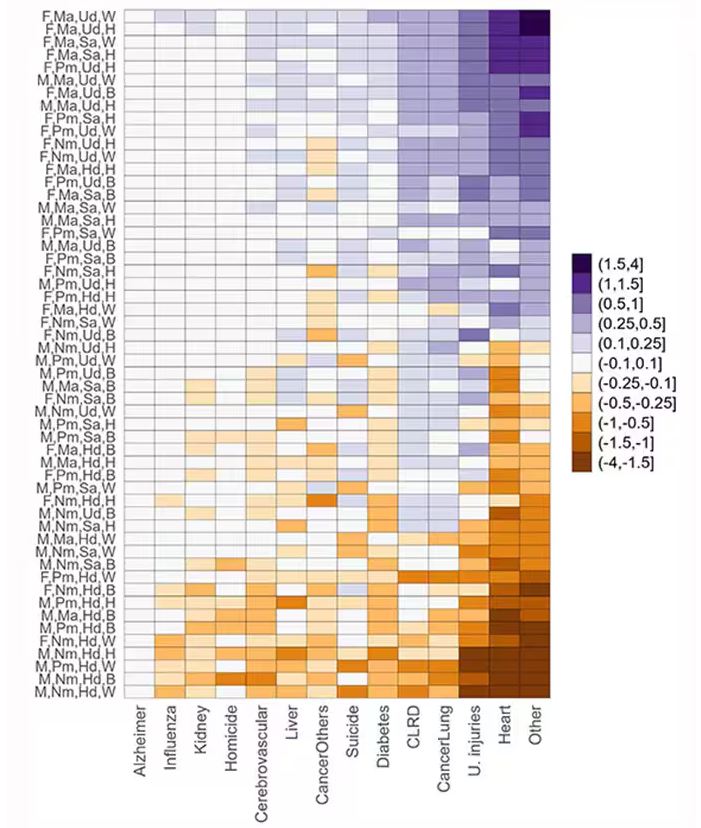
Looking at the bottom groups, you can see a dramatically increased risk for death from unintentional injuries, heart disease, and lung cancer. You see an increased risk for suicide as well. In the upper tiers, the only place where risk seems higher than expected is for the category of “other cancers,” reminding us that many types of cancer do not respect definitions of socioeconomic status.
You can even update the risk-scoring system to reflect the risk for different causes of death. You can see here how White people, for example, are at higher risk for death from unintentional injuries relative to other populations, despite having a lower mortality overall. 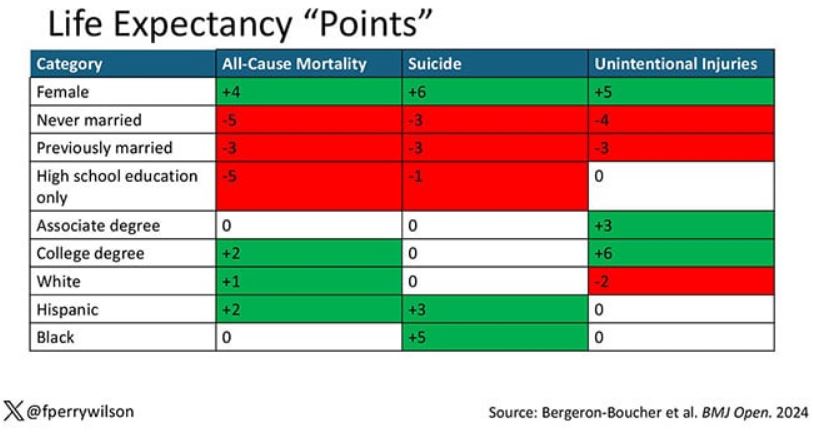
So maybe, through cause of death, we get a little closer to the answer of why. But this paper is really just a start. Its primary effect should be to surprise us — that in a country as wealthy as the United States, such dramatic variation exists based on factors that, with the exception of sex, I suppose, are not really biological. Which means that to find the why, we may need to turn from physiology to sociology.
Dr. Wilson is associate professor of medicine and public health and director of Yale’s Clinical and Translational Research Accelerator, New Haven, Connecticut. He has disclosed no relevant financial relationships.
A version of this article first appeared on Medscape.com.
This transcript has been edited for clarity.
Two individuals in the United States are celebrating their 30th birthdays. It’s a good day. They are entering the prime of their lives. One is a married White woman with a university degree. The other is a never-married White man with a high school diploma.
How many more years of life can these two individuals look forward to?
There’s a fairly dramatic difference. The man can expect 37.1 more years of life on average, living to be about 67. The woman can expect to live to age 85. That’s a life-expectancy discrepancy of 18 years based solely on gender, education, and marital status.
I’m using these cases to illustrate the extremes of life expectancy across four key social determinants of health: sex, race, marital status, and education. We all have some sense of how these factors play out in terms of health, but a new study suggests that it’s actually quite a bit more complicated than we thought.
Let me start by acknowledging my own bias here. As a clinical researcher, I sometimes find it hard to appreciate the value of actuarial-type studies that look at life expectancy (or any metric, really) between groups defined by marital status, for example. I’m never quite sure what to do with the conclusion. Married people live longer, the headline says. Okay, but as a doctor, what am I supposed to do about that? Encourage my patients to settle down and commit? Studies showing that women live longer than men or that White people live longer than Black people are also hard for me to incorporate into my practice. These are not easily changeable states.
But studies examining these groups are a reasonable starting point to ask more relevant questions. Why do women live longer than men? Is it behavioral (men take more risks and are less likely to see doctors)? Or is it hormonal (estrogen has a lot of protective effects that testosterone does not)? Or is it something else?
Integrating these social determinants of health into a cohesive story is a bit harder than it might seem, as this study, appearing in BMJ Open, illustrates.
In the context of this study, every person in America can be placed into one of 54 mutually exclusive groups. You can be male or female. You can be Black, White, or Hispanic. You can have a high school diploma or less, an associate degree, or a college degree; and you can be married, previously married, or never married.
Of course, this does not capture the beautiful tapestry that is American life, but let’s give them a pass. They are working with data from the American Community Survey, which contains 8634 people — the statistics would run into trouble with more granular divisions. This survey can be population weighted, so you can scale up the results to reasonably represent the population of the United States.
The survey collected data on the four broad categories of sex, race, education, and marital status and linked those survey results to the Multiple Cause of Death dataset from the CDC. From there, it’s a pretty simple task to rank the 54 categories in order from longest to shortest life expectancy, as you can see here.
But that’s not really the interesting part of this study. Sure, there is a lot of variation; it’s interesting that these four factors explain about 18 years’ difference in life expectancy in this country. What strikes me here, actually, is the lack of an entirely consistent message across this spectrum.
Let me walk you through the second figure in this paper, because this nicely illustrates the surprising heterogeneity that exists here.
This may seem overwhelming, but basically, shapes that are higher up on the Y-axis represent the groups with longer life expectancy.
You can tell, for example, that shapes that are black in color (groups with high school educations or less) are generally lower. But not universally so. This box represents married, Hispanic females who do quite well in terms of life expectancy, even at that lower educational level.
The authors quantify this phenomenon by creating a mortality risk score that integrates these findings. It looks something like this, with 0 being average morality for the United States.
As you can see, you get a bunch of points for being female, but you lose a bunch for not being married. Education plays a large role, with a big hit for those who have a high school diploma or less, and a bonus for those with a college degree. Race plays a relatively more minor role.
This is all very interesting, but as I said at the beginning, this isn’t terribly useful to me as a physician. More important is figuring out why these differences exist. And there are some clues in the study data, particularly when we examine causes of death. This figure ranks those 54 groups again, from the married, White, college-educated females down to the never-married, White, high school–educated males. The boxes show how much more or less likely this group is to die of a given condition than the general population.
Looking at the bottom groups, you can see a dramatically increased risk for death from unintentional injuries, heart disease, and lung cancer. You see an increased risk for suicide as well. In the upper tiers, the only place where risk seems higher than expected is for the category of “other cancers,” reminding us that many types of cancer do not respect definitions of socioeconomic status.
You can even update the risk-scoring system to reflect the risk for different causes of death. You can see here how White people, for example, are at higher risk for death from unintentional injuries relative to other populations, despite having a lower mortality overall.
So maybe, through cause of death, we get a little closer to the answer of why. But this paper is really just a start. Its primary effect should be to surprise us — that in a country as wealthy as the United States, such dramatic variation exists based on factors that, with the exception of sex, I suppose, are not really biological. Which means that to find the why, we may need to turn from physiology to sociology.
Dr. Wilson is associate professor of medicine and public health and director of Yale’s Clinical and Translational Research Accelerator, New Haven, Connecticut. He has disclosed no relevant financial relationships.
A version of this article first appeared on Medscape.com.
Ozempic Curbs Hunger – And Not Just for Food
This transcript has been edited for clarity.
If you’ve been paying attention only to the headlines, when you think of “Ozempic” you’ll think of a few things: a blockbuster weight loss drug or the tip of the spear of a completely new industry — why not? A drug so popular that the people it was invented for (those with diabetes) can’t even get it.
Ozempic and other GLP-1 receptor agonists are undeniable game changers. Insofar as obesity is the number-one public health risk in the United States, antiobesity drugs hold immense promise even if all they do is reduce obesity.
In 2023, an article in Scientific Reports presented data suggesting that people on Ozempic might be reducing their alcohol intake, not just their total calories.
A 2024 article in Molecular Psychiatry found that the drug might positively impact cannabis use disorder. An article from Brain Sciences suggests that the drug reduces compulsive shopping.
A picture is starting to form, a picture that suggests these drugs curb hunger both literally and figuratively. That GLP-1 receptor agonists like Ozempic and Mounjaro are fundamentally anticonsumption drugs. In a society that — some would argue — is plagued by overconsumption, these drugs might be just what the doctor ordered.
If only they could stop people from smoking.
Oh, wait — they can.
At least it seems they can, based on a new study appearing in Annals of Internal Medicine.
Before we get too excited, this is not a randomized trial. There actually was a small randomized trial of exenatide (Byetta), which is in the same class as Ozempic but probably a bit less potent, with promising results for smoking cessation. 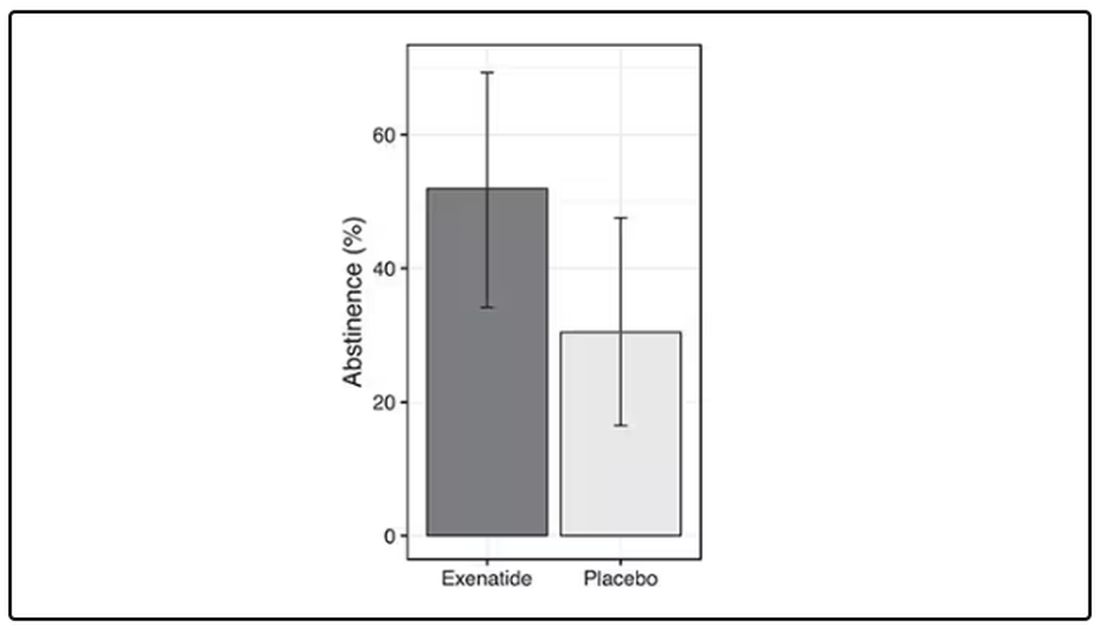
But Byetta is the weaker drug in this class; the market leader is Ozempic. So how can you figure out whether Ozempic can reduce smoking without doing a huge and expensive randomized trial? You can do what Nora Volkow and colleagues from the National Institute on Drug Abuse did: a target trial emulation study.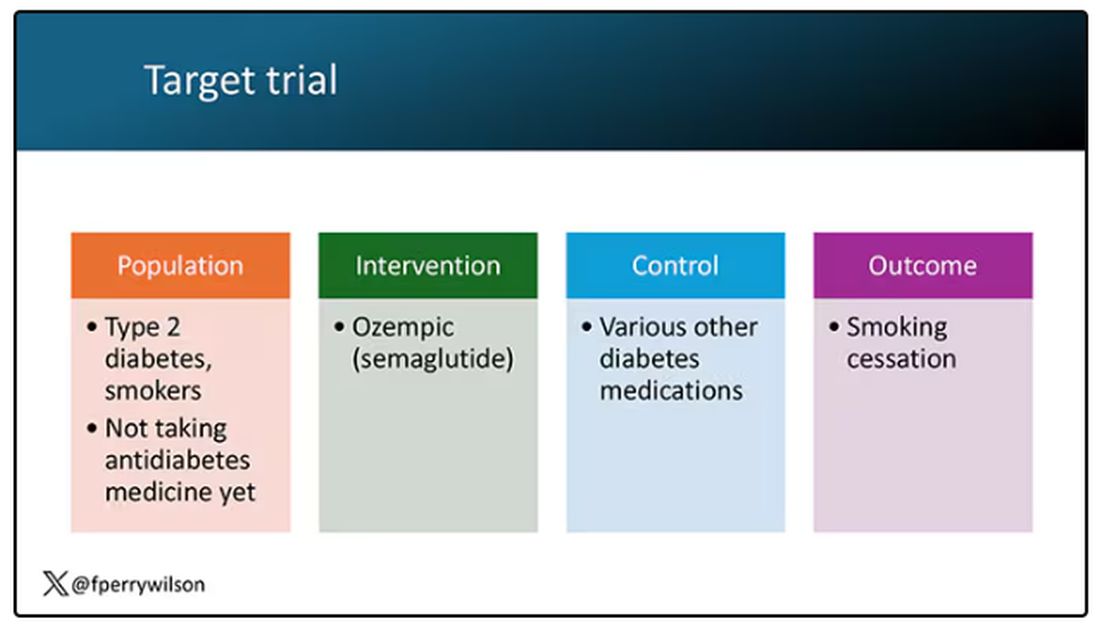
A target trial emulation study is more or less what it sounds like. First, you decide what your dream randomized controlled trial would be and you plan it all out in great detail. You define the population you would recruit, with all the relevant inclusion and exclusion criteria. You define the intervention and the control, and you define the outcome.
But you don’t actually do the trial. You could if someone would lend you $10-$50 million, but assuming you don’t have that lying around, you do the next best thing, which is to dig into a medical record database to find all the people who would be eligible for your imaginary trial. And you analyze them.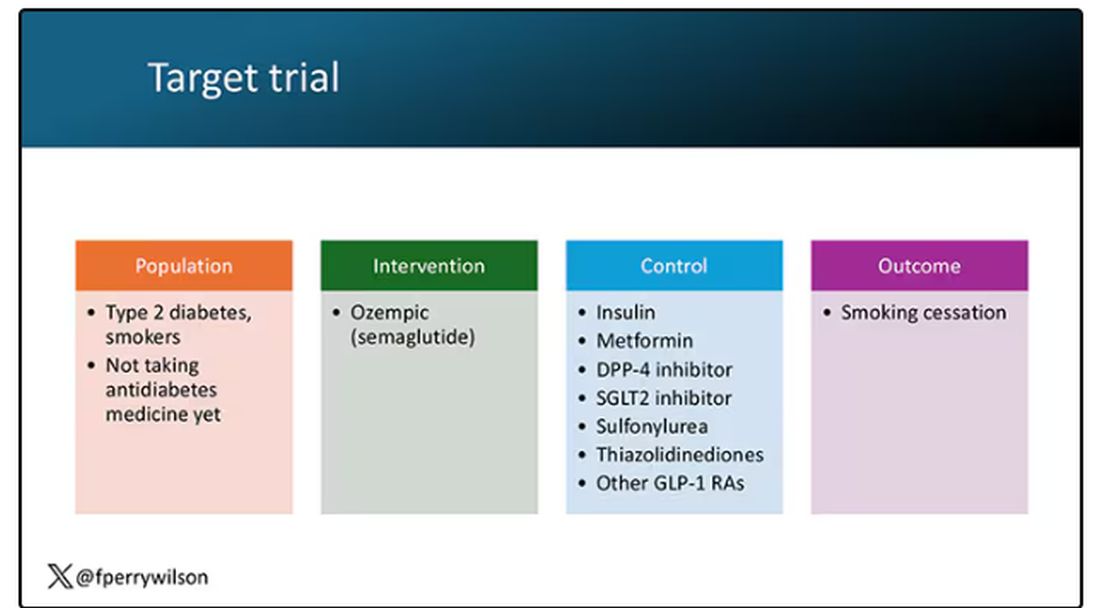
The authors wanted to study the effect of Ozempic on smoking among people with diabetes; that’s why all the comparator agents are antidiabetes drugs. They figured out whether these folks were smoking on the basis of a medical record diagnosis of tobacco use disorder before they started one of the drugs of interest. This code is fairly specific: If a patient has it, you can be pretty sure they are smoking. But it’s not very sensitive; not every smoker has this diagnostic code. This is an age-old limitation of using EHR data instead of asking patients, but it’s part of the tradeoff for not having to spend $50 million.
After applying all those inclusion and exclusion criteria, they have a defined population who could be in their dream trial. And, as luck would have it, some of those people really were treated with Ozempic and some really were treated with those other agents. Although decisions about what to prescribe were not randomized, the authors account for this confounding-by-indication using propensity-score matching. You can find a little explainer on propensity-score matching in an earlier column here. 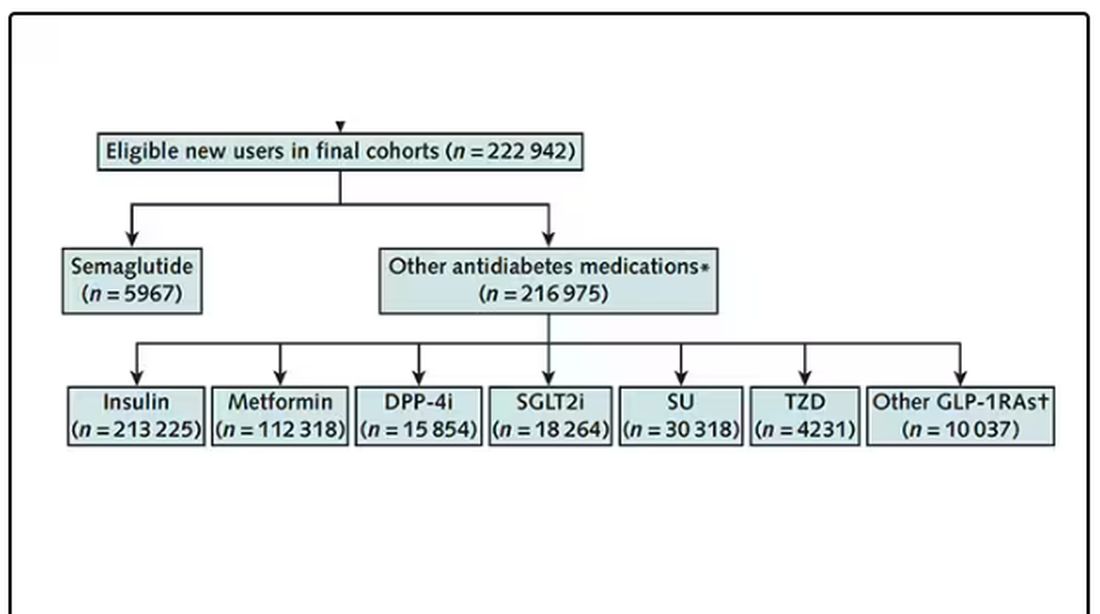
It’s easy enough, using the EHR, to figure out who has diabetes and who got which drug. But how do you know who quit smoking? Remember, everyone had a diagnosis code for tobacco use disorder prior to starting Ozempic or a comparator drug. The authors decided that if the patient had a medical visit where someone again coded tobacco-use disorder, they were still smoking. If someone prescribed smoking cessation meds like a nicotine patch or varenicline, they were obviously still smoking. If someone billed for tobacco-cessation counseling, the patient is still smoking. We’ll get back to the implications of this outcome definition in a minute.
Let’s talk about the results, which are pretty intriguing. 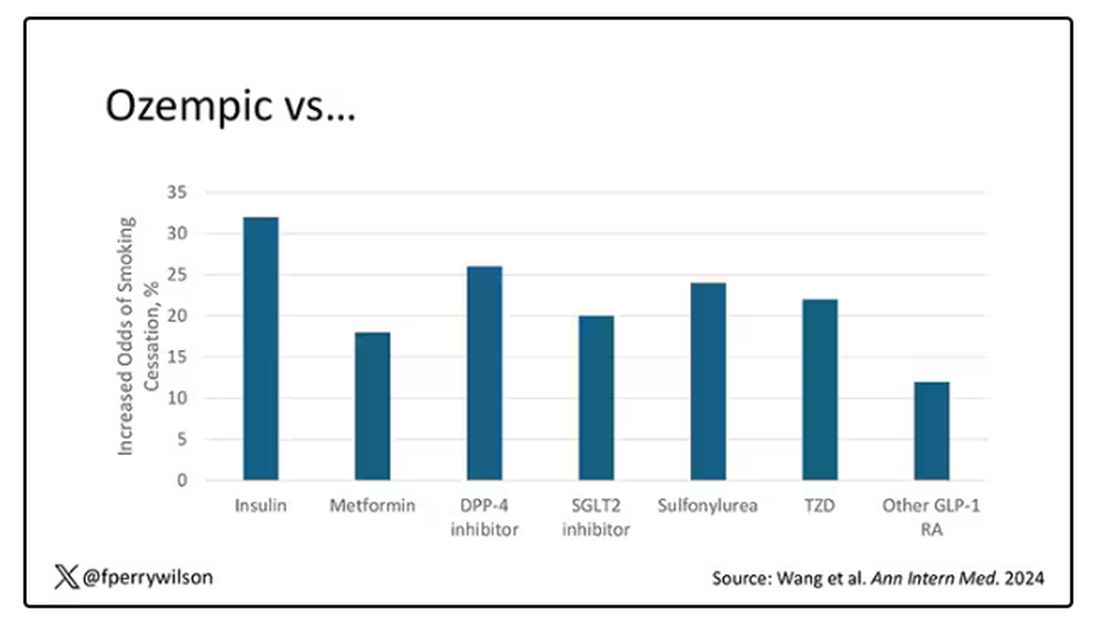
When Ozempic is compared with insulin among smokers with diabetes, those on Ozempic were about 30% more likely to quit smoking. They were about 18% more likely to quit smoking than those who took metformin. They were even slightly more likely to quit smoking than those on other GLP-1 receptor antagonists, though I should note that Mounjaro, which is probably the more potent GLP-1 drug in terms of weight loss, was not among the comparators.
This is pretty impressive for a drug that was not designed to be a smoking cessation drug. It speaks to this emerging idea that these drugs do more than curb appetite by slowing down gastric emptying or something. They work in the brain, modulating some of the reward circuitry that keeps us locked into our bad habits.
There are, of course, some caveats. As I pointed out, this study captured the idea of “still smoking” through the use of administrative codes in the EHR and prescription of smoking cessation aids. You could see similar results if taking Ozempic makes people less likely to address their smoking at all; maybe they shut down the doctor before they even talk about it, or there is too much to discuss during these visits to even get to the subject of smoking. You could also see results like this if people taking Ozempic had fewer visits overall, but the authors showed that that, at least, was not the case.
I’m inclined to believe that this effect is real, simply because we keep seeing signals from multiple sources. If that turns out to be the case, these new “weight loss” drugs may prove to be much more than that; they may turn out to be the drugs that can finally save us from ourselves.
Dr. Wilson is associate professor of medicine and public health and director of the Clinical and Translational Research Accelerator at Yale University, New Haven, Connecticut. He has disclosed no relevant financial relationships.
A version of this article first appeared on Medscape.com.
This transcript has been edited for clarity.
If you’ve been paying attention only to the headlines, when you think of “Ozempic” you’ll think of a few things: a blockbuster weight loss drug or the tip of the spear of a completely new industry — why not? A drug so popular that the people it was invented for (those with diabetes) can’t even get it.
Ozempic and other GLP-1 receptor agonists are undeniable game changers. Insofar as obesity is the number-one public health risk in the United States, antiobesity drugs hold immense promise even if all they do is reduce obesity.
In 2023, an article in Scientific Reports presented data suggesting that people on Ozempic might be reducing their alcohol intake, not just their total calories.
A 2024 article in Molecular Psychiatry found that the drug might positively impact cannabis use disorder. An article from Brain Sciences suggests that the drug reduces compulsive shopping.
A picture is starting to form, a picture that suggests these drugs curb hunger both literally and figuratively. That GLP-1 receptor agonists like Ozempic and Mounjaro are fundamentally anticonsumption drugs. In a society that — some would argue — is plagued by overconsumption, these drugs might be just what the doctor ordered.
If only they could stop people from smoking.
Oh, wait — they can.
At least it seems they can, based on a new study appearing in Annals of Internal Medicine.
Before we get too excited, this is not a randomized trial. There actually was a small randomized trial of exenatide (Byetta), which is in the same class as Ozempic but probably a bit less potent, with promising results for smoking cessation.
But Byetta is the weaker drug in this class; the market leader is Ozempic. So how can you figure out whether Ozempic can reduce smoking without doing a huge and expensive randomized trial? You can do what Nora Volkow and colleagues from the National Institute on Drug Abuse did: a target trial emulation study.
A target trial emulation study is more or less what it sounds like. First, you decide what your dream randomized controlled trial would be and you plan it all out in great detail. You define the population you would recruit, with all the relevant inclusion and exclusion criteria. You define the intervention and the control, and you define the outcome.
But you don’t actually do the trial. You could if someone would lend you $10-$50 million, but assuming you don’t have that lying around, you do the next best thing, which is to dig into a medical record database to find all the people who would be eligible for your imaginary trial. And you analyze them.
The authors wanted to study the effect of Ozempic on smoking among people with diabetes; that’s why all the comparator agents are antidiabetes drugs. They figured out whether these folks were smoking on the basis of a medical record diagnosis of tobacco use disorder before they started one of the drugs of interest. This code is fairly specific: If a patient has it, you can be pretty sure they are smoking. But it’s not very sensitive; not every smoker has this diagnostic code. This is an age-old limitation of using EHR data instead of asking patients, but it’s part of the tradeoff for not having to spend $50 million.
After applying all those inclusion and exclusion criteria, they have a defined population who could be in their dream trial. And, as luck would have it, some of those people really were treated with Ozempic and some really were treated with those other agents. Although decisions about what to prescribe were not randomized, the authors account for this confounding-by-indication using propensity-score matching. You can find a little explainer on propensity-score matching in an earlier column here.
It’s easy enough, using the EHR, to figure out who has diabetes and who got which drug. But how do you know who quit smoking? Remember, everyone had a diagnosis code for tobacco use disorder prior to starting Ozempic or a comparator drug. The authors decided that if the patient had a medical visit where someone again coded tobacco-use disorder, they were still smoking. If someone prescribed smoking cessation meds like a nicotine patch or varenicline, they were obviously still smoking. If someone billed for tobacco-cessation counseling, the patient is still smoking. We’ll get back to the implications of this outcome definition in a minute.
Let’s talk about the results, which are pretty intriguing.
When Ozempic is compared with insulin among smokers with diabetes, those on Ozempic were about 30% more likely to quit smoking. They were about 18% more likely to quit smoking than those who took metformin. They were even slightly more likely to quit smoking than those on other GLP-1 receptor antagonists, though I should note that Mounjaro, which is probably the more potent GLP-1 drug in terms of weight loss, was not among the comparators.
This is pretty impressive for a drug that was not designed to be a smoking cessation drug. It speaks to this emerging idea that these drugs do more than curb appetite by slowing down gastric emptying or something. They work in the brain, modulating some of the reward circuitry that keeps us locked into our bad habits.
There are, of course, some caveats. As I pointed out, this study captured the idea of “still smoking” through the use of administrative codes in the EHR and prescription of smoking cessation aids. You could see similar results if taking Ozempic makes people less likely to address their smoking at all; maybe they shut down the doctor before they even talk about it, or there is too much to discuss during these visits to even get to the subject of smoking. You could also see results like this if people taking Ozempic had fewer visits overall, but the authors showed that that, at least, was not the case.
I’m inclined to believe that this effect is real, simply because we keep seeing signals from multiple sources. If that turns out to be the case, these new “weight loss” drugs may prove to be much more than that; they may turn out to be the drugs that can finally save us from ourselves.
Dr. Wilson is associate professor of medicine and public health and director of the Clinical and Translational Research Accelerator at Yale University, New Haven, Connecticut. He has disclosed no relevant financial relationships.
A version of this article first appeared on Medscape.com.
Giving Cash to Improve Health
This transcript has been edited for clarity.
It doesn’t really matter what disease you are looking at — cancer, heart disease, dementia, drug abuse, psychiatric disorders. In every case, poverty is associated with worse disease.
But the word “associated” is doing a lot of work there. Many of us feel that poverty itself is causally linked to worse disease outcomes through things like poor access to care and poor access to medicines.
And there is an argument that the arrow goes the other way; perhaps people with worse illness are more likely to be poor because, in this country at least, being sick is incredibly expensive.
Causality is what all medical research is fundamentally about. We want to know if A causes B, because if A causes B, then changing A changes B. If poverty causes bad health outcomes, then alleviating poverty should alleviate bad health outcomes.
But that’s a hard proposition to test. You can’t exactly randomize some people to get extra money and some not to, right? Actually, you can. And in Massachusetts, they did.
What happened in Chelsea, Massachusetts, wasn’t exactly a randomized trial of cash supplementation to avoid bad health outcomes. It was actually a government program instituted during the pandemic. Chelsea has a large immigrant population, many of whom are living in poverty. From April to August 2020, the city ran a food distribution program to aid those in need. But the decision was then made to convert the money spent on that program to cash distributions — free of obligations. Chelsea residents making less than 30% of the median income for the Boston metro area — around $30,000 per family — were invited to enter a lottery. Only one member of any given family could enter. If selected, an individual would receive $200 a month, or $300 for a family of two, or $400 for a family of three or more. These payments went on for about 9 months.
The key thing here is that not everyone won the lottery. The lottery picked winners randomly; 1746 individuals were selected to receive the benefits in the form of a reloadable gift card, and 1134 applied but did not receive any assistance.
This is a perfect natural experiment. As you can see here — and as expected, given that the lottery winners were chosen randomly — winners and losers were similar in terms of age, sex, race, language, income, and more.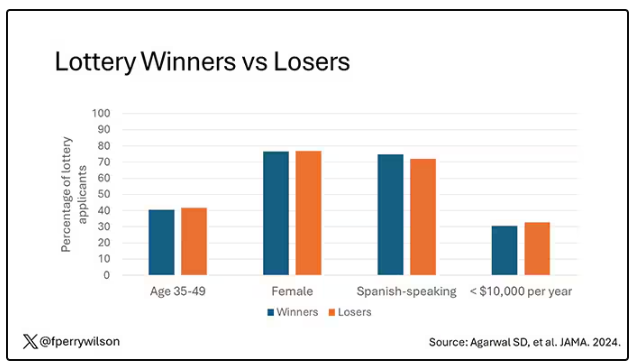
Researchers, led by Sumit Agarwal at the Brigham, leveraged that randomization to ask how these cash benefits would affect healthcare utilization. Their results appeared this week in JAMA.
I know what you’re thinking: Is $400 a month really enough to make a difference? Does $400 a month, less than $5000 a year, really fix poverty? We’ll get to that. But I will point out that the average family income of individuals in this study was about $1400 a month. An extra $400 might not change someone’s life, but it may really make a difference.
The primary outcome of this study was ED visits. There are a few ways this could go. Perhaps the money would lead to improved health and thus fewer ED visits. Or perhaps it would help people get transportation to primary care or other services that would offload the ED. Or maybe it would make things worse. Some folks have suggested that cash payments could increase the use of drugs and alcohol, and lead to more ED visits associated with the complications of using those substances.
Here are the actual data. Per 1000 individuals, there were 217 ED visits in the cash-benefit group, 318 in the no-benefit group. That was a statistically significant finding.
Breaking those ED visits down, you can see that fewer visits resulted in hospital admission, with fewer behavioral health–related visits and — a key finding — fewer visits for substance use disorder. This puts the lie to the idea that cash benefits increase drug use.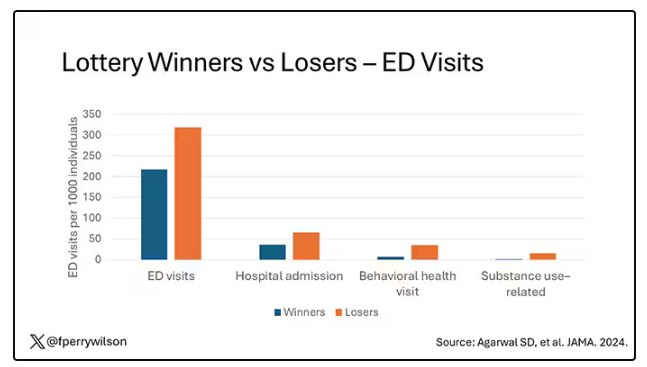
But the authors also looked at other causes of healthcare utilization. Outpatient visits were slightly higher in the cash-benefit group, driven largely by an increase in specialty care visits. The authors note that this is likely due to the fact that reaching a specialist often requires more travel, which can be costly. Indeed, this effect was most pronounced among the people living furthest from a specialty center.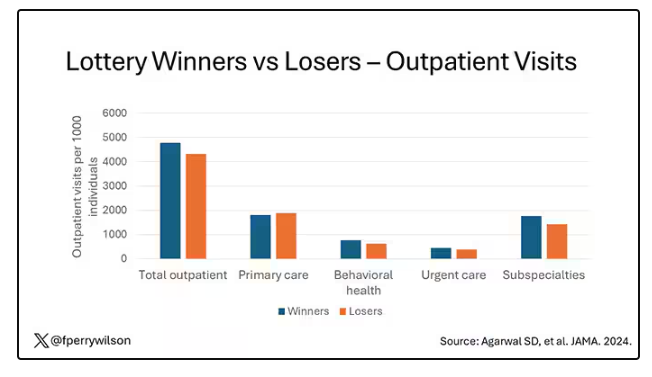
Outside of utilization, the researchers examined a variety of individual health markers — things like blood pressure — to see if the cash benefit had any effect. A bit of caution here because these data were available only among those who interacted with the healthcare system, which may bias the results a bit. Regardless, no major differences were seen in blood pressure, weight, hemoglobin A1c, cholesterol, or COVID vaccination.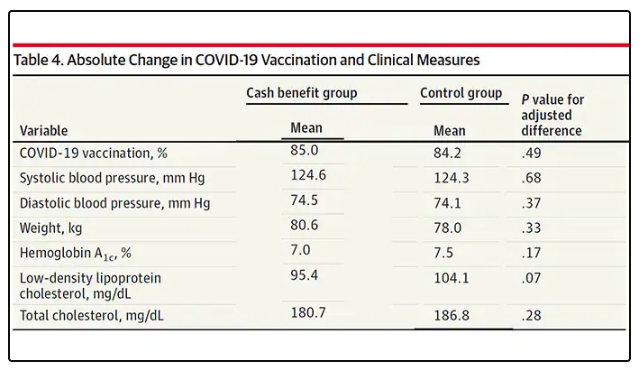
So, it seems that $400 a month doesn’t move the needle too much on risk factors for cardiovascular disease, but the effect on ED visits on their own is fairly impressive.
Is it worth it? The authors did their best to calculate the net effect of this program, accounting for the reduced ED visits and hospitalizations (that’s a big one), but also for the increased number of specialty visits. All told, the program saves about $450 per person in healthcare costs over 9 months. That’s about one seventh of the cost of the overall program.
But remember that they only looked at outcomes for the individual who got the gift cards; it’s likely that there were benefits to their family members as well. And, of course, programs like this can recoup costs indirectly though increases in economic activity, a phenomenon known as the multiplier effect.
I’m not here to tell you whether this program was a good idea; people tend to have quite strong feelings about this sort of thing. But I can tell you what it tells me about healthcare in America. It may not be surprising, but it confirms that access is far from fairly distributed.
I started this story asking about the arrow of causality between poverty and poor health. The truth is, you probably have causality in both directions. 
Dr. Wilson is associate professor of medicine and public health and director of the Clinical and Translational Research Accelerator at Yale University, New Haven, Conn. He has disclosed no relevant financial relationships.
A version of this article appeared on Medscape.com.
This transcript has been edited for clarity.
It doesn’t really matter what disease you are looking at — cancer, heart disease, dementia, drug abuse, psychiatric disorders. In every case, poverty is associated with worse disease.
But the word “associated” is doing a lot of work there. Many of us feel that poverty itself is causally linked to worse disease outcomes through things like poor access to care and poor access to medicines.
And there is an argument that the arrow goes the other way; perhaps people with worse illness are more likely to be poor because, in this country at least, being sick is incredibly expensive.
Causality is what all medical research is fundamentally about. We want to know if A causes B, because if A causes B, then changing A changes B. If poverty causes bad health outcomes, then alleviating poverty should alleviate bad health outcomes.
But that’s a hard proposition to test. You can’t exactly randomize some people to get extra money and some not to, right? Actually, you can. And in Massachusetts, they did.
What happened in Chelsea, Massachusetts, wasn’t exactly a randomized trial of cash supplementation to avoid bad health outcomes. It was actually a government program instituted during the pandemic. Chelsea has a large immigrant population, many of whom are living in poverty. From April to August 2020, the city ran a food distribution program to aid those in need. But the decision was then made to convert the money spent on that program to cash distributions — free of obligations. Chelsea residents making less than 30% of the median income for the Boston metro area — around $30,000 per family — were invited to enter a lottery. Only one member of any given family could enter. If selected, an individual would receive $200 a month, or $300 for a family of two, or $400 for a family of three or more. These payments went on for about 9 months.
The key thing here is that not everyone won the lottery. The lottery picked winners randomly; 1746 individuals were selected to receive the benefits in the form of a reloadable gift card, and 1134 applied but did not receive any assistance.
This is a perfect natural experiment. As you can see here — and as expected, given that the lottery winners were chosen randomly — winners and losers were similar in terms of age, sex, race, language, income, and more.
Researchers, led by Sumit Agarwal at the Brigham, leveraged that randomization to ask how these cash benefits would affect healthcare utilization. Their results appeared this week in JAMA.
I know what you’re thinking: Is $400 a month really enough to make a difference? Does $400 a month, less than $5000 a year, really fix poverty? We’ll get to that. But I will point out that the average family income of individuals in this study was about $1400 a month. An extra $400 might not change someone’s life, but it may really make a difference.
The primary outcome of this study was ED visits. There are a few ways this could go. Perhaps the money would lead to improved health and thus fewer ED visits. Or perhaps it would help people get transportation to primary care or other services that would offload the ED. Or maybe it would make things worse. Some folks have suggested that cash payments could increase the use of drugs and alcohol, and lead to more ED visits associated with the complications of using those substances.
Here are the actual data. Per 1000 individuals, there were 217 ED visits in the cash-benefit group, 318 in the no-benefit group. That was a statistically significant finding.
Breaking those ED visits down, you can see that fewer visits resulted in hospital admission, with fewer behavioral health–related visits and — a key finding — fewer visits for substance use disorder. This puts the lie to the idea that cash benefits increase drug use.
But the authors also looked at other causes of healthcare utilization. Outpatient visits were slightly higher in the cash-benefit group, driven largely by an increase in specialty care visits. The authors note that this is likely due to the fact that reaching a specialist often requires more travel, which can be costly. Indeed, this effect was most pronounced among the people living furthest from a specialty center.
Outside of utilization, the researchers examined a variety of individual health markers — things like blood pressure — to see if the cash benefit had any effect. A bit of caution here because these data were available only among those who interacted with the healthcare system, which may bias the results a bit. Regardless, no major differences were seen in blood pressure, weight, hemoglobin A1c, cholesterol, or COVID vaccination.
So, it seems that $400 a month doesn’t move the needle too much on risk factors for cardiovascular disease, but the effect on ED visits on their own is fairly impressive.
Is it worth it? The authors did their best to calculate the net effect of this program, accounting for the reduced ED visits and hospitalizations (that’s a big one), but also for the increased number of specialty visits. All told, the program saves about $450 per person in healthcare costs over 9 months. That’s about one seventh of the cost of the overall program.
But remember that they only looked at outcomes for the individual who got the gift cards; it’s likely that there were benefits to their family members as well. And, of course, programs like this can recoup costs indirectly though increases in economic activity, a phenomenon known as the multiplier effect.
I’m not here to tell you whether this program was a good idea; people tend to have quite strong feelings about this sort of thing. But I can tell you what it tells me about healthcare in America. It may not be surprising, but it confirms that access is far from fairly distributed.
I started this story asking about the arrow of causality between poverty and poor health. The truth is, you probably have causality in both directions.
Dr. Wilson is associate professor of medicine and public health and director of the Clinical and Translational Research Accelerator at Yale University, New Haven, Conn. He has disclosed no relevant financial relationships.
A version of this article appeared on Medscape.com.
Mounjaro Beats Ozempic, So Why Isn’t It More Popular?
This transcript has been edited for clarity.
It’s July, which means our hospital is filled with new interns, residents, and fellows all eager to embark on a new stage of their career. It’s an exciting time — a bit of a scary time — but it’s also the time when the medical strategies I’ve been taking for granted get called into question. At this point in the year, I tend to get a lot of “why” questions. Why did you order that test? Why did you suspect that diagnosis? Why did you choose that medication?
Meds are the hardest, I find. Sure, I can explain that I prescribed a glucagon-like peptide 1 (GLP-1) receptor agonist because the patient had diabetes and was overweight, and multiple studies show that this class of drug leads to weight loss and reduced mortality risk. But then I get the follow-up: Sure, but why THAT GLP-1 drug? Why did you pick semaglutide (Ozempic) over tirzepatide (Mounjaro)?
Here’s where I run out of good answers. Sometimes I choose a drug because that’s what the patient’s insurance has on their formulary. Sometimes it’s because it’s cheaper in general. Sometimes, it’s just force of habit. I know the correct dose, I have experience with the side effects — it’s comfortable.
What I can’t say is that I have solid evidence that one drug is superior to another, say from a randomized trial of semaglutide vs tirzepatide. I don’t have that evidence because that trial has never happened and, as I’ll explain in a minute, may never happen at all.
But we might have the next best thing. And the results may surprise you.
Why don’t we see more head-to-head trials of competitor drugs? The answer is pretty simple, honestly: risk management. For drugs that are on patent, like the GLP-1s, conducting a trial without the buy-in of the pharmaceutical company is simply too expensive — we can’t run a trial unless someone provides the drug for free. That gives the companies a lot of say in what trials get done, and it seems that most pharma companies have reached the same conclusion: A head-to-head trial is too risky. Be happy with the market share you have, and try to nibble away at the edges through good old-fashioned marketing.
But if you look at the data that are out there, you might wonder why Ozempic is the market leader. I mean, sure, it’s a heck of a weight loss drug. But the weight loss in the trials of Mounjaro was actually a bit higher. It’s worth noting here that tirzepatide (Mounjaro) is not just a GLP-1 receptor agonist; it is also a gastric inhibitory polypeptide agonist. 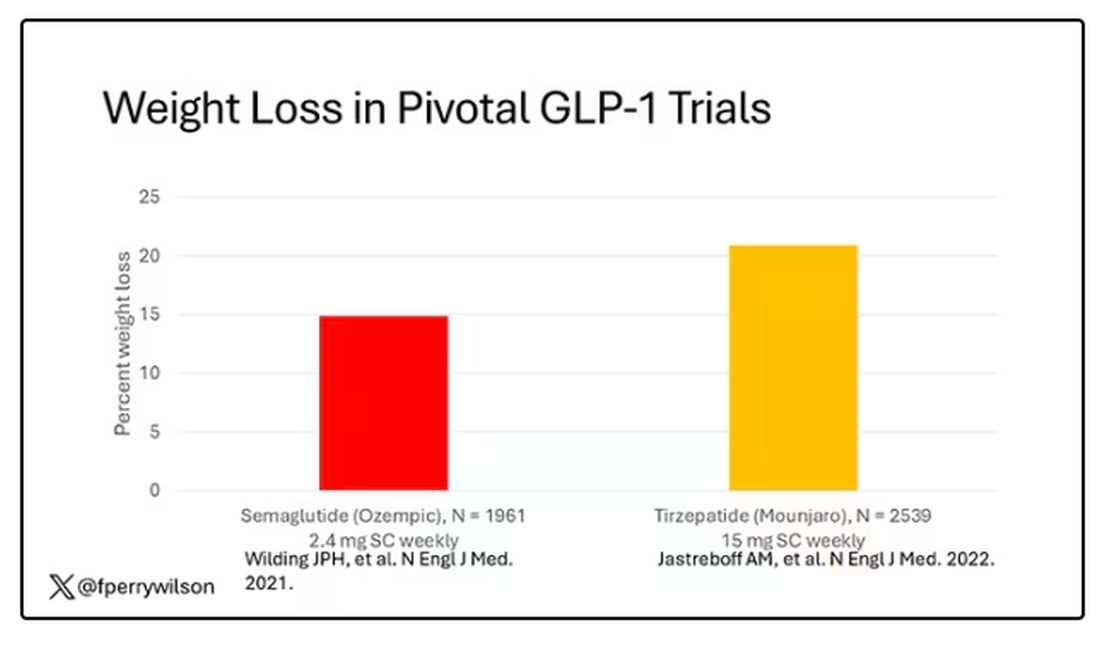
But it’s very hard to compare the results of a trial pitting Ozempic against placebo with a totally different trial pitting Mounjaro against placebo. You can always argue that the patients studied were just too different at baseline — an apples and oranges situation.
Newly published, a study appearing in JAMA Internal Medicine uses real-world data and propensity-score matching to turn oranges back into apples. I’ll walk you through it.
The data and analysis here come from Truveta, a collective of various US healthcare systems that share a broad swath of electronic health record data. Researchers identified 41,222 adults with overweight or obesity who were prescribed semaglutide or tirzepatide between May 2022 and September 2023.
You’d be tempted to just see which group lost more weight over time, but that is the apples and oranges problem. People prescribed Mounjaro were different from people who were prescribed Ozempic. There are a variety of factors to look at here, but the vibe is that the Mounjaro group seems healthier at baseline. They were younger and had less kidney disease, less hypertension, and less hyperlipidemia. They had higher incomes and were more likely to be White. They were also dramatically less likely to have diabetes. 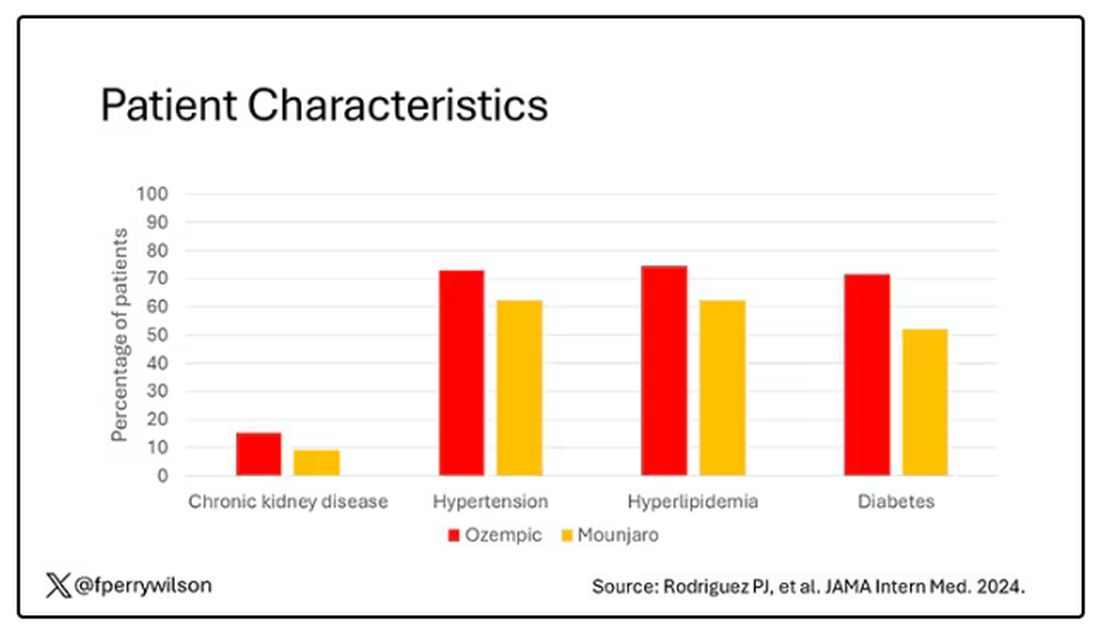
To account for this, the researchers used a statistical technique called propensity-score matching. Briefly, you create a model based on a variety of patient factors to predict who would be prescribed Ozempic and who would be prescribed Mounjaro. You then identify pairs of patients with similar probability (or propensity) of receiving, say, Ozempic, where one member of the pair got Ozempic and one got Mounjaro. Any unmatched individuals simply get dropped from the analysis.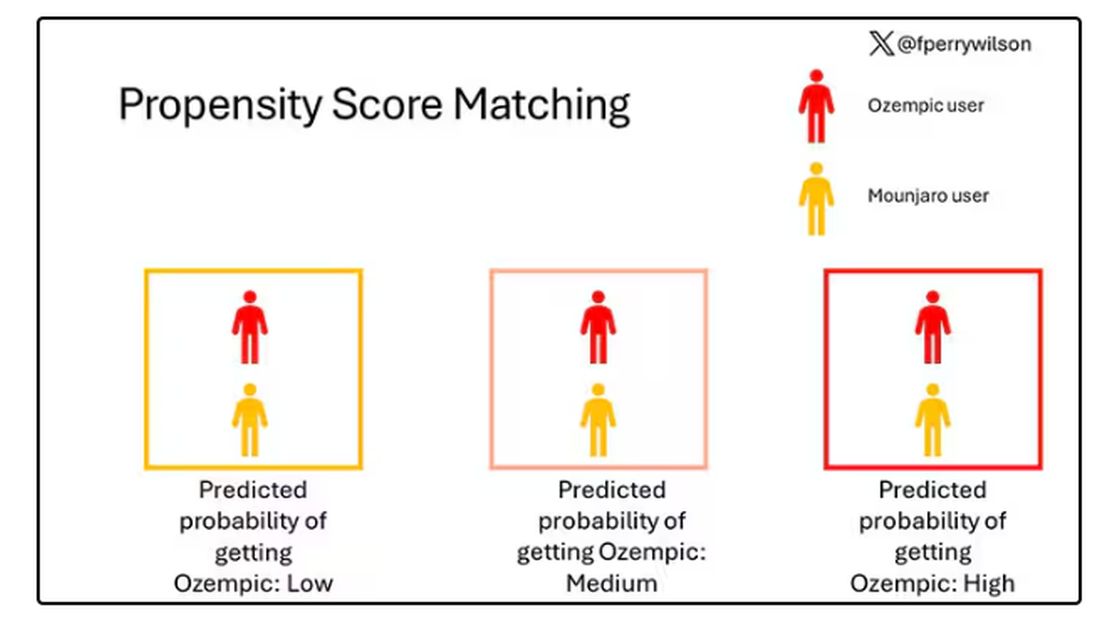
Thus, the researchers took the 41,222 individuals who started the analysis, of whom 9193 received Mounjaro, and identified the 9193 patients who got Ozempic that most closely matched the Mounjaro crowd. I know, it sounds confusing. But as an example, in the original dataset, 51.9% of those who got Mounjaro had diabetes compared with 71.5% of those who got Ozempic. Among the 9193 individuals who remained in the Ozempic group after matching, 52.1% had diabetes. By matching in this way, you balance your baseline characteristics. Turning apples into oranges. Or, maybe the better metaphor would be plucking the oranges out of a big pile of mostly apples.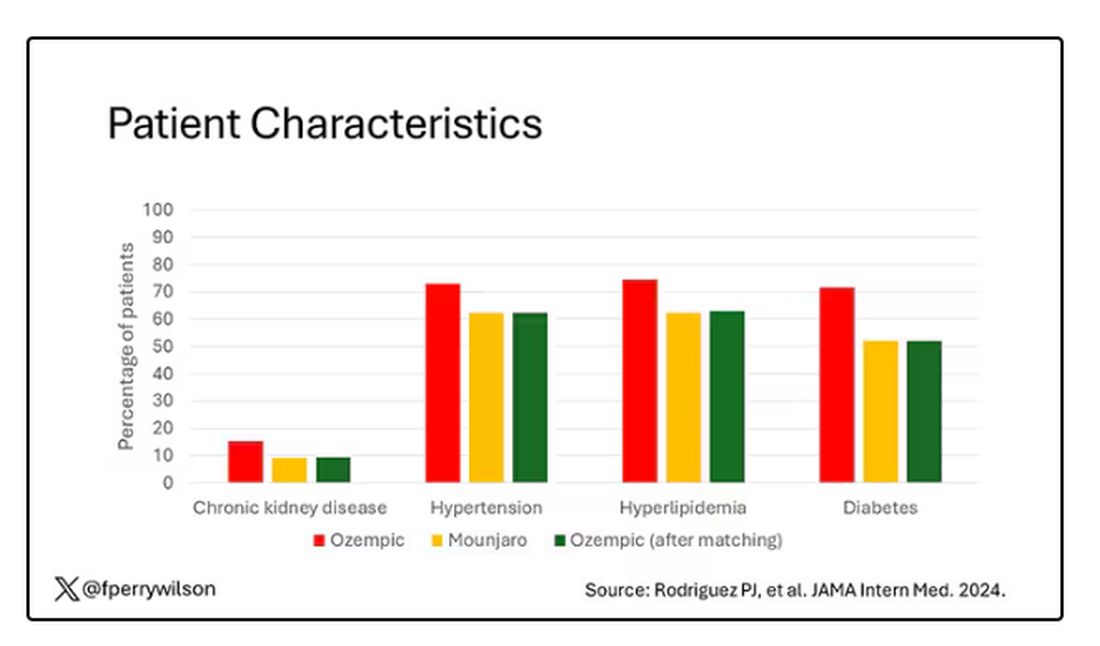
Once that’s done, we can go back to do what we wanted to do in the beginning, which is to look at the weight loss between the groups.
What I’m showing you here is the average percent change in body weight at 3, 6, and 12 months across the two drugs in the matched cohort. By a year out, you have basically 15% weight loss in the Mounjaro group compared with 8% or so in the Ozempic group. 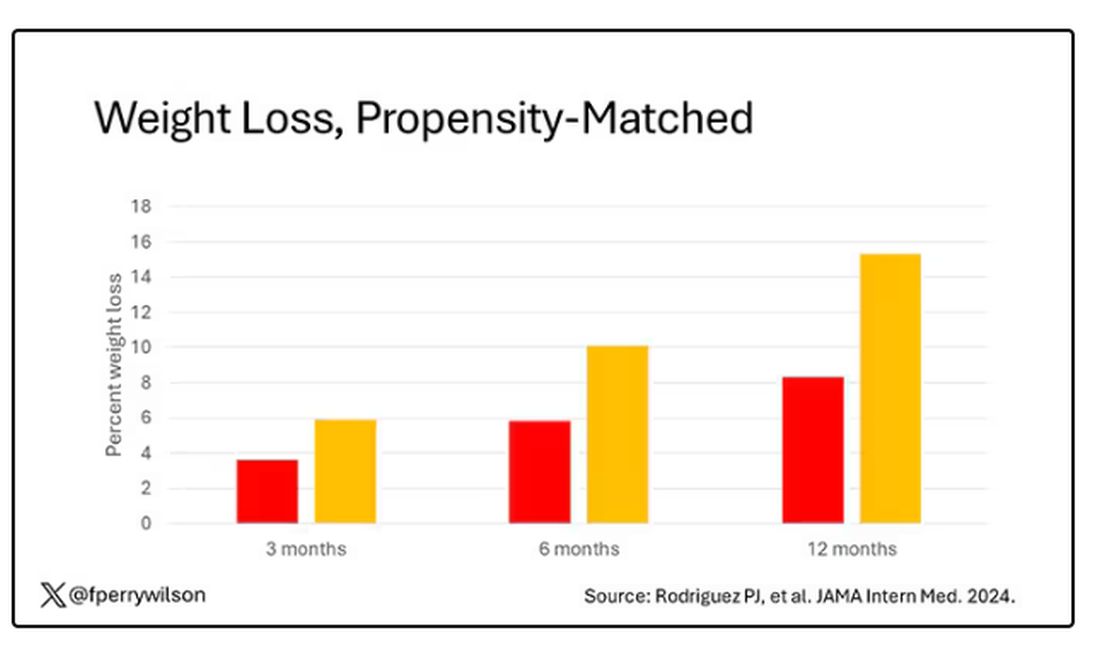
We can slice this a different way as well — asking what percent of people in each group achieve, say, 10% weight loss? This graph examines the percentage of each treatment group who hit that weight loss target over time. Mounjaro gets there faster.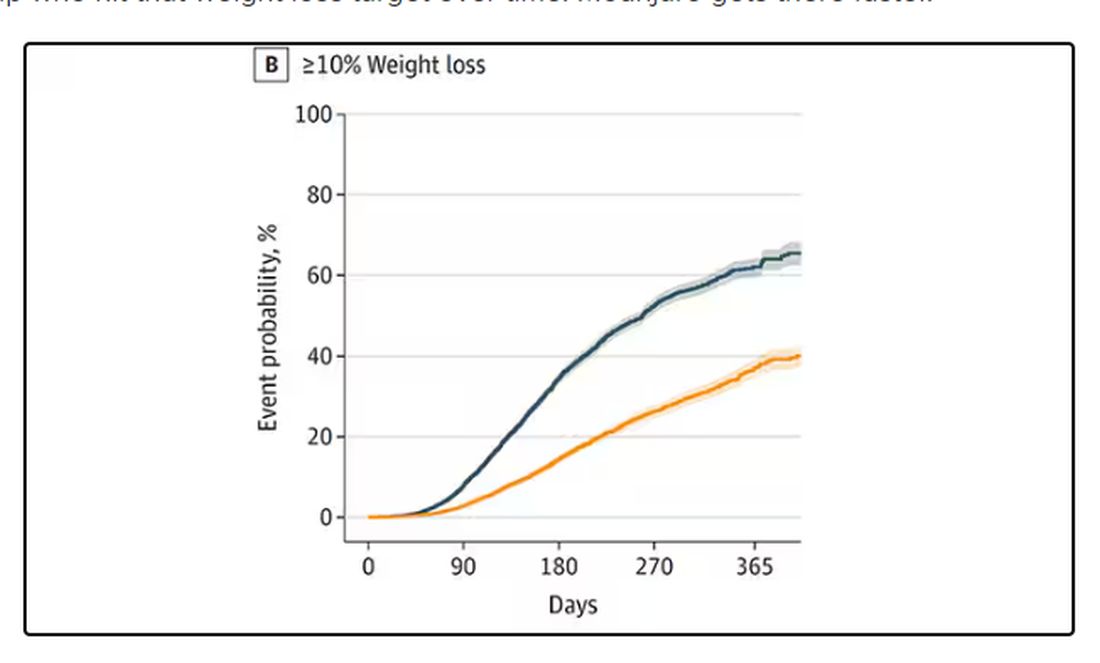
I should point out that this was a so-called “on treatment” analysis: If people stopped taking either of the drugs, they were no longer included in the study. That tends to make drugs like this appear better than they are because as time goes on, you may weed out the people who stop the drug owing to lack of efficacy or to side effects. But in a sensitivity analysis, the authors see what happens if they just treat people as if they were taking the drug for the entire year once they had it prescribed, and the results, while not as dramatic, were broadly similar. Mounjaro still came out on top.
Adverse events— stuff like gastroparesis and pancreatitis — were rare, but rates were similar between the two groups.
It’s great to see studies like this that leverage real world data and a solid statistical underpinning to give us providers actionable information. Is it 100% definitive? No. But, especially considering the clinical trial data, I don’t think I’m going out on a limb to say that Mounjaro seems to be the more effective weight loss agent. That said, we don’t actually live in a world where we can prescribe medications based on a silly little thing like which is the most effective. Especially given the cost of these agents — the patient’s insurance status is going to guide our prescription pen more than this study ever could. And of course, given the demand for this class of agents and the fact that both are actually quite effective, you may be best off prescribing whatever you can get your hands on.
But I’d like to see more of this. When I do have a choice of a medication, when costs and availability are similar, I’d like to be able to answer that question of “why did you choose that one?” with an evidence-based answer: “It’s better.”
Dr. Wilson is associate professor of medicine and public health and director of the Clinical and Translational Research Accelerator at Yale University, New Haven, Connecticut. He has disclosed no relevant financial relationships.
A version of this article appeared on Medscape.com.
This transcript has been edited for clarity.
It’s July, which means our hospital is filled with new interns, residents, and fellows all eager to embark on a new stage of their career. It’s an exciting time — a bit of a scary time — but it’s also the time when the medical strategies I’ve been taking for granted get called into question. At this point in the year, I tend to get a lot of “why” questions. Why did you order that test? Why did you suspect that diagnosis? Why did you choose that medication?
Meds are the hardest, I find. Sure, I can explain that I prescribed a glucagon-like peptide 1 (GLP-1) receptor agonist because the patient had diabetes and was overweight, and multiple studies show that this class of drug leads to weight loss and reduced mortality risk. But then I get the follow-up: Sure, but why THAT GLP-1 drug? Why did you pick semaglutide (Ozempic) over tirzepatide (Mounjaro)?
Here’s where I run out of good answers. Sometimes I choose a drug because that’s what the patient’s insurance has on their formulary. Sometimes it’s because it’s cheaper in general. Sometimes, it’s just force of habit. I know the correct dose, I have experience with the side effects — it’s comfortable.
What I can’t say is that I have solid evidence that one drug is superior to another, say from a randomized trial of semaglutide vs tirzepatide. I don’t have that evidence because that trial has never happened and, as I’ll explain in a minute, may never happen at all.
But we might have the next best thing. And the results may surprise you.
Why don’t we see more head-to-head trials of competitor drugs? The answer is pretty simple, honestly: risk management. For drugs that are on patent, like the GLP-1s, conducting a trial without the buy-in of the pharmaceutical company is simply too expensive — we can’t run a trial unless someone provides the drug for free. That gives the companies a lot of say in what trials get done, and it seems that most pharma companies have reached the same conclusion: A head-to-head trial is too risky. Be happy with the market share you have, and try to nibble away at the edges through good old-fashioned marketing.
But if you look at the data that are out there, you might wonder why Ozempic is the market leader. I mean, sure, it’s a heck of a weight loss drug. But the weight loss in the trials of Mounjaro was actually a bit higher. It’s worth noting here that tirzepatide (Mounjaro) is not just a GLP-1 receptor agonist; it is also a gastric inhibitory polypeptide agonist.
But it’s very hard to compare the results of a trial pitting Ozempic against placebo with a totally different trial pitting Mounjaro against placebo. You can always argue that the patients studied were just too different at baseline — an apples and oranges situation.
Newly published, a study appearing in JAMA Internal Medicine uses real-world data and propensity-score matching to turn oranges back into apples. I’ll walk you through it.
The data and analysis here come from Truveta, a collective of various US healthcare systems that share a broad swath of electronic health record data. Researchers identified 41,222 adults with overweight or obesity who were prescribed semaglutide or tirzepatide between May 2022 and September 2023.
You’d be tempted to just see which group lost more weight over time, but that is the apples and oranges problem. People prescribed Mounjaro were different from people who were prescribed Ozempic. There are a variety of factors to look at here, but the vibe is that the Mounjaro group seems healthier at baseline. They were younger and had less kidney disease, less hypertension, and less hyperlipidemia. They had higher incomes and were more likely to be White. They were also dramatically less likely to have diabetes.
To account for this, the researchers used a statistical technique called propensity-score matching. Briefly, you create a model based on a variety of patient factors to predict who would be prescribed Ozempic and who would be prescribed Mounjaro. You then identify pairs of patients with similar probability (or propensity) of receiving, say, Ozempic, where one member of the pair got Ozempic and one got Mounjaro. Any unmatched individuals simply get dropped from the analysis.
Thus, the researchers took the 41,222 individuals who started the analysis, of whom 9193 received Mounjaro, and identified the 9193 patients who got Ozempic that most closely matched the Mounjaro crowd. I know, it sounds confusing. But as an example, in the original dataset, 51.9% of those who got Mounjaro had diabetes compared with 71.5% of those who got Ozempic. Among the 9193 individuals who remained in the Ozempic group after matching, 52.1% had diabetes. By matching in this way, you balance your baseline characteristics. Turning apples into oranges. Or, maybe the better metaphor would be plucking the oranges out of a big pile of mostly apples.
Once that’s done, we can go back to do what we wanted to do in the beginning, which is to look at the weight loss between the groups.
What I’m showing you here is the average percent change in body weight at 3, 6, and 12 months across the two drugs in the matched cohort. By a year out, you have basically 15% weight loss in the Mounjaro group compared with 8% or so in the Ozempic group.
We can slice this a different way as well — asking what percent of people in each group achieve, say, 10% weight loss? This graph examines the percentage of each treatment group who hit that weight loss target over time. Mounjaro gets there faster.
I should point out that this was a so-called “on treatment” analysis: If people stopped taking either of the drugs, they were no longer included in the study. That tends to make drugs like this appear better than they are because as time goes on, you may weed out the people who stop the drug owing to lack of efficacy or to side effects. But in a sensitivity analysis, the authors see what happens if they just treat people as if they were taking the drug for the entire year once they had it prescribed, and the results, while not as dramatic, were broadly similar. Mounjaro still came out on top.
Adverse events— stuff like gastroparesis and pancreatitis — were rare, but rates were similar between the two groups.
It’s great to see studies like this that leverage real world data and a solid statistical underpinning to give us providers actionable information. Is it 100% definitive? No. But, especially considering the clinical trial data, I don’t think I’m going out on a limb to say that Mounjaro seems to be the more effective weight loss agent. That said, we don’t actually live in a world where we can prescribe medications based on a silly little thing like which is the most effective. Especially given the cost of these agents — the patient’s insurance status is going to guide our prescription pen more than this study ever could. And of course, given the demand for this class of agents and the fact that both are actually quite effective, you may be best off prescribing whatever you can get your hands on.
But I’d like to see more of this. When I do have a choice of a medication, when costs and availability are similar, I’d like to be able to answer that question of “why did you choose that one?” with an evidence-based answer: “It’s better.”
Dr. Wilson is associate professor of medicine and public health and director of the Clinical and Translational Research Accelerator at Yale University, New Haven, Connecticut. He has disclosed no relevant financial relationships.
A version of this article appeared on Medscape.com.
Facial Temperature Can Reveal Age and Disease
This transcript has been edited for clarity.
My oldest daughter is at sleepaway camp for a couple of weeks, and the camp has a photographer who goes around all day taking pictures of the kids, which get uploaded to a private Facebook group. In the past, I would go online every day (or, okay, several times a day) and scroll through all those pictures looking for one that features my kid.
I don’t have to do that anymore. This year, I simply uploaded a picture of my daughter to an app and artificial intelligence (AI) takes care of the rest, recognizing her face amidst the sea of smiling children, and flagging just those photos for me to peruse. It’s amazing, really. And a bit scary.
The fact that facial recognition has penetrated the summer camp market should tell you that the tech is truly ubiquitous. But today we’re going to think a bit more about what AI can do with a picture of your face, because the power of facial recognition is not just skin deep.
What’s got me hot and bothered about facial images is this paper, appearing in Cell Metabolism, which adds a new layer to the standard facial-analysis playbook: facial temperature.
To understand this paper, you need to understand a whole field of research that is developing various different “clocks” for age.
It turns out that age really is just a number. Our cells, our proteins, our biochemistry can be analyzed to give different numbers. These “clocks,” as distinct from the calendar we usually use to measure our age, might have more predictive power than the number itself.
There are numerous molecular clocks, such as telomere length, that not only correlate with calendar age but are superior to calendar age in predicting age-related complications. Testing telomere length typically requires a blood sample — and remains costly. But we can use other sources to estimate age; how about a photo?
I mean, we do this all the time when we meet someone new or, as a physician, when we meet a new patient. I have often written that a patient “appears younger than their stated age,” and we’ve all had the experience of hearing how old someone is and being shocked. I mean, have you seen Sharon Stone recently? She’s 66 years old. Okay — to be fair, there might be some outside help there. But you get the point.
Back to the Cell Metabolism paper. Researchers report on multiple algorithms to obtain an “age” from a picture of an individual’s face.
The first algorithm is pretty straightforward. Researchers collected 2811 images, all of Han Chinese individuals ranging in age from 20 to 90 years, and reconstructed a 3D facial map from those. 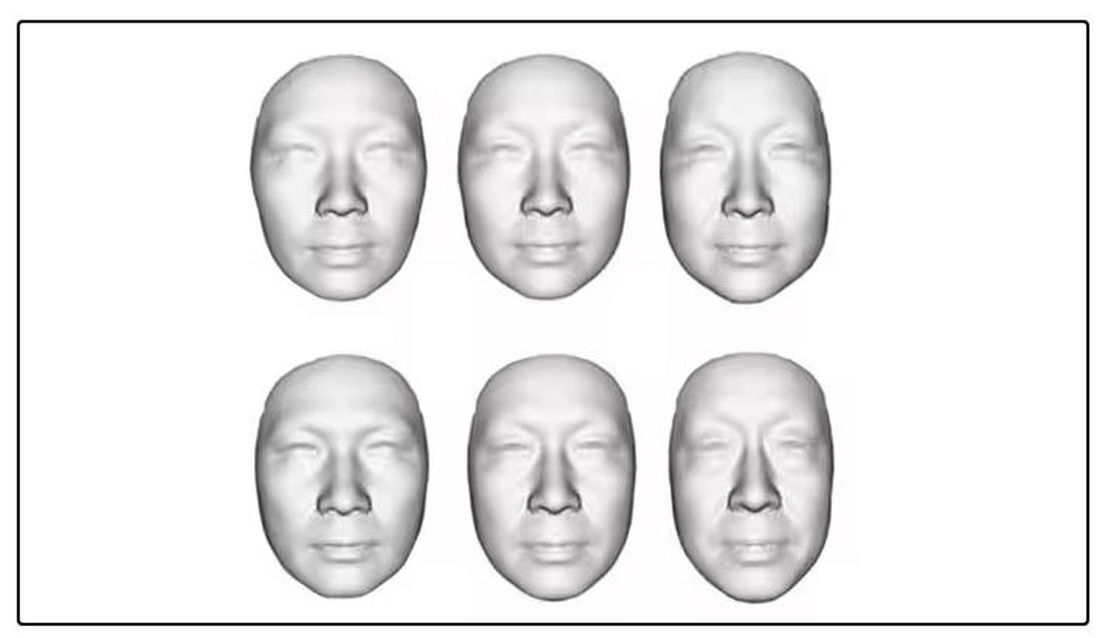
They then trained a convolutional neural network to predict the individuals’ ages from the pictures. It was quite accurate, as you can see here.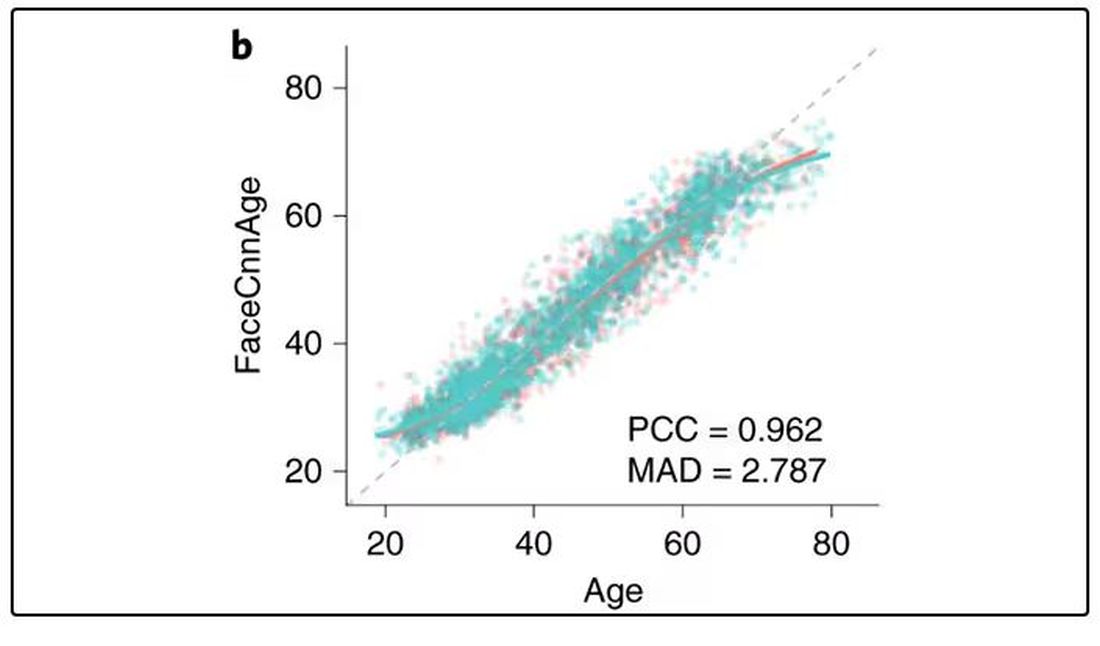
In the AI age, this may not seem that impressive. A brief search online turned up dozens of apps that promised to guess my age from a photo.
I sent this rather unflattering picture of myself to ChatGPT which, after initially demurring and saying it was not designed to guess ages, pegged me at somewhere between 35 and 45, which I am taking as a major victory.
But the Cell Metabolism paper goes deeper. Literally. 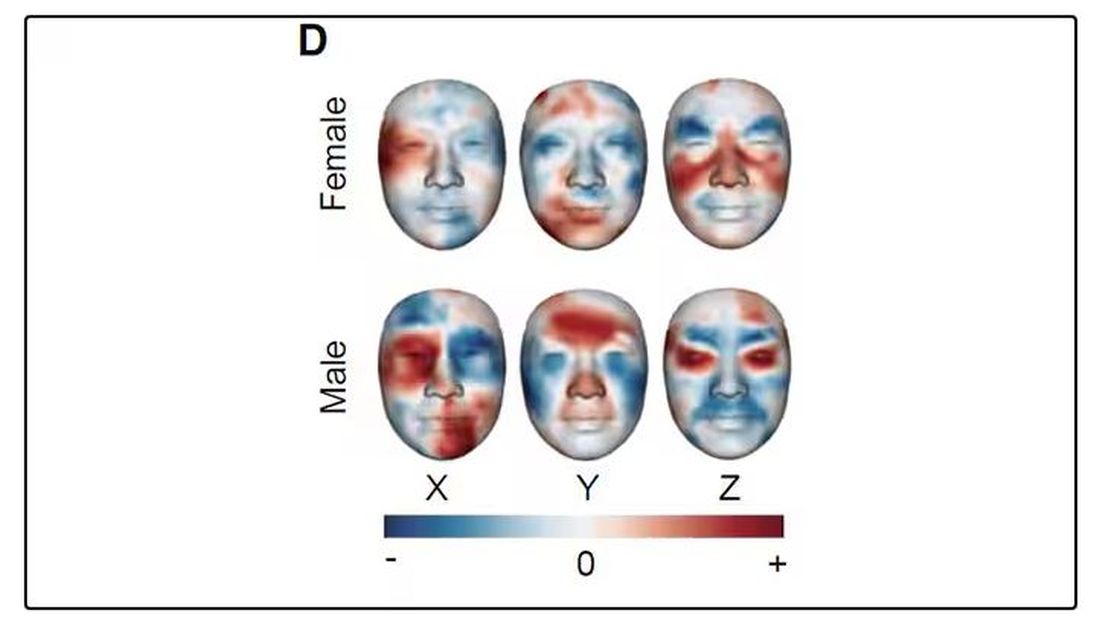
And this is where things start to get interesting. Because sure, the visible part of your face can change depending on makeup, expression, plastic surgery, and the like. But the temperature? That’s harder to fake.
It turns out that the temperature distribution in your face changes as you get older. There is a cooling of the nose and the cheeks, for example.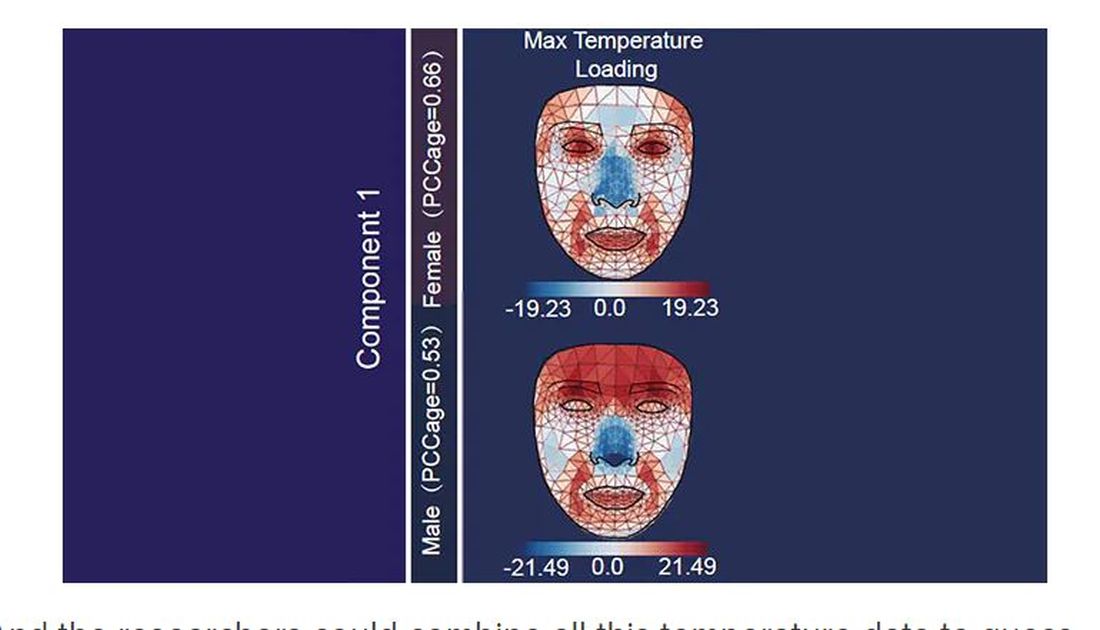
And the researchers could combine all this temperature data to guess someone’s calendar age fairly accurately, though notably not as accurately as the model that just looks at the pictures.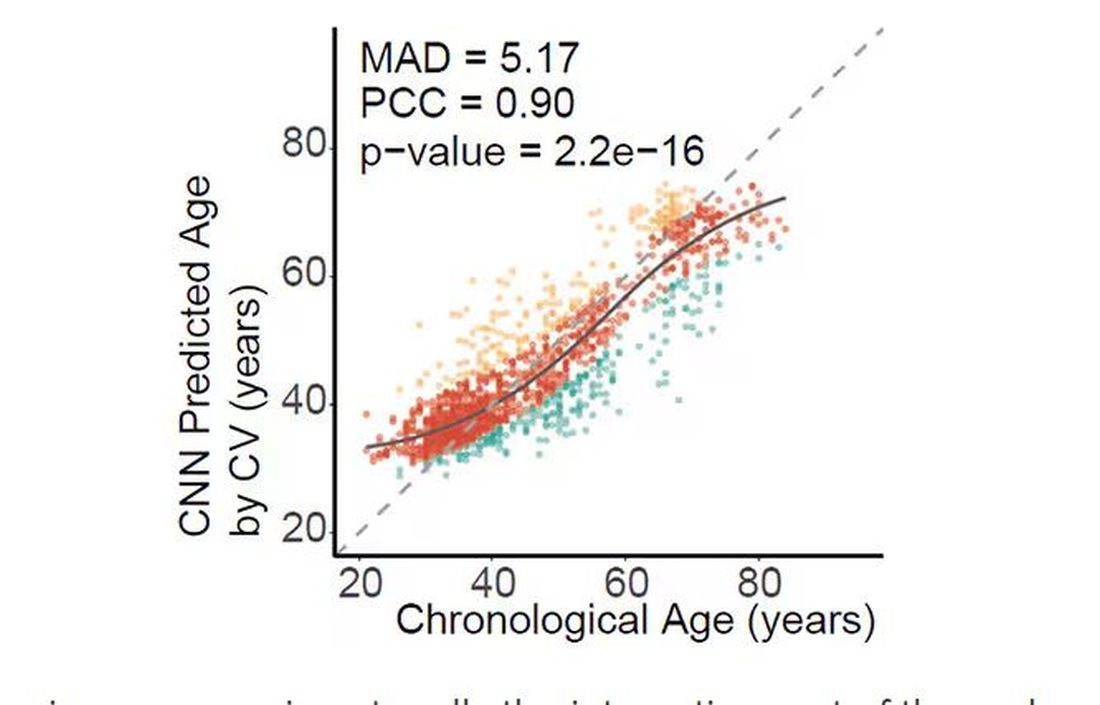
But guessing your age is not really the interesting part of thermal imaging of the face. It’s guessing — or, rather, predicting — the state of your metabolism. All these study participants had extensive metabolic testing performed, as well as detailed analysis of their lifestyle behaviors. And facial images could be used to predict those factors.
For example, the 3D reconstruction of the faces could predict who ate seafood (they tend to look younger than their actual age) compared with who ate poultry and meat (they tend to look older). The thermal imaging could predict who got more sleep (they look younger from a temperature perspective) and who ate more yogurt (also younger-appearing, temperature-wise). Facial temperature patterns could identify those with higher BMI, higher blood pressure, higher fasting glucose.
The researchers used the difference between actual and predicted age as a metric to measure illness as well. You can see here how, on average, individuals with hypertension, diabetes, and even liver cysts are “older,” at least by face temperature.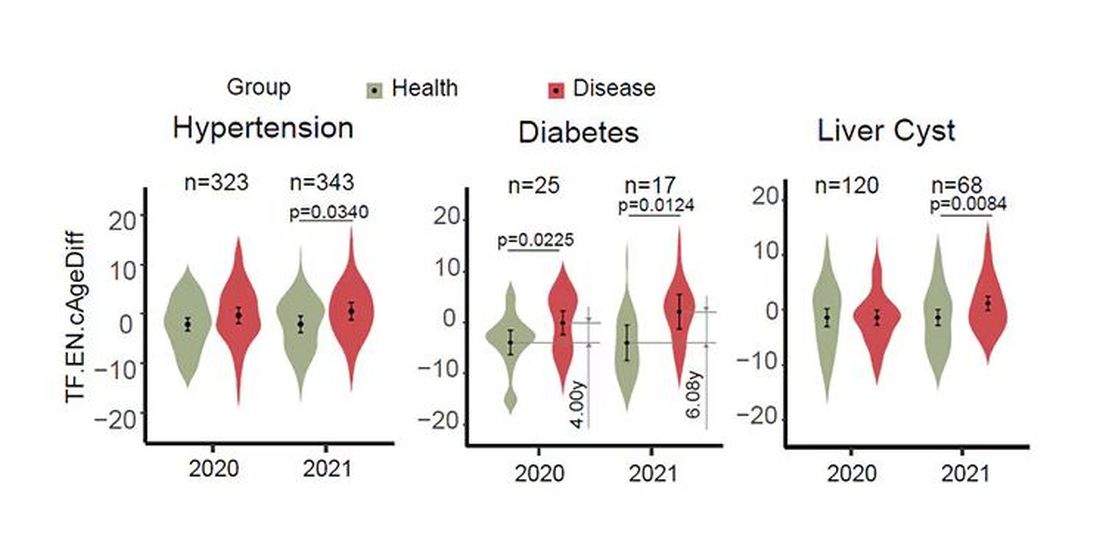
It may even be possible to use facial temperature as biofeedback. In a small study, the researchers measured the difference between facial temperature age and real age before and after 2 weeks of jump-roping. It turns out that 2 weeks of jump-roping can make you look about 5 years younger, at least as judged by a thermal camera. Or like the Predator.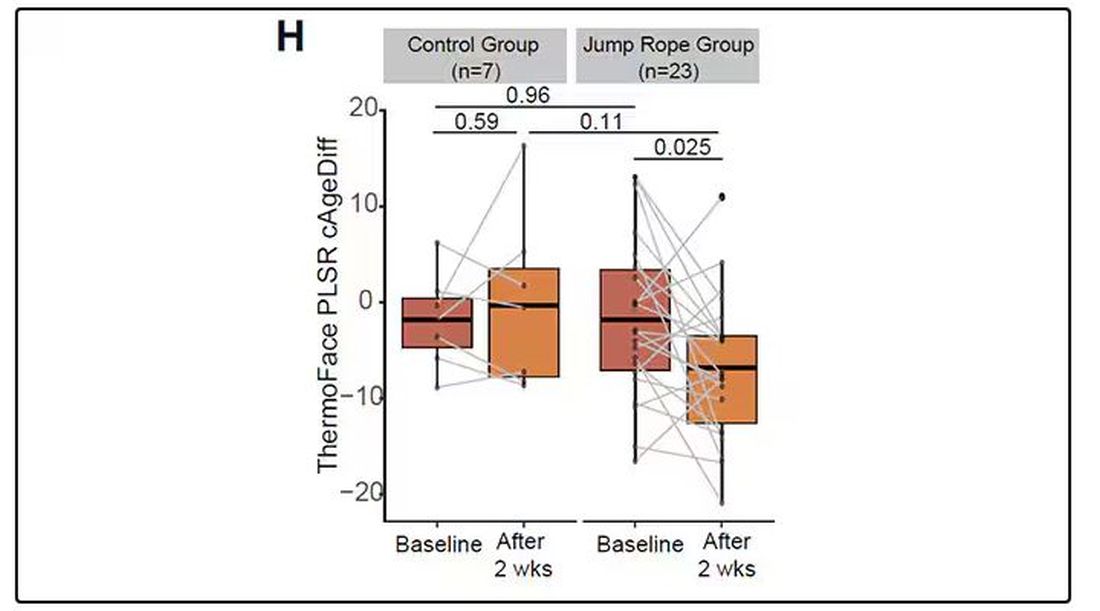
Okay, this is all very cool, but I’m not saying we’ll all be doing facial temperature tests in the near future. No; what this study highlights for me is how much information about ourselves is available to those who know how to decode it. Maybe those data come from the wrinkles in our faces, or the angles of our smiles, or the speed with which we type, or the temperature of our elbows. The data have always been there, actually, but we’ve never had the tools powerful enough to analyze them until now.
When I was a kid, I was obsessed with Star Trek — I know, you’re shocked — and, of course, the famous tricorder, a scanner that could tell everything about someone’s state of health in 5 seconds from 3 feet away. That’s how I thought medicine really would be in the future. Once I got to medical school, I was disabused of that notion. But the age of data, the age of AI, may mean the tricorder age is not actually that far away.
Dr. Wilson is associate professor of medicine and public health and director of the Clinical and Translational Research Accelerator at Yale University, New Haven, Conn. He has disclosed no relevant financial relationships.
A version of this article first appeared on Medscape.com.
This transcript has been edited for clarity.
My oldest daughter is at sleepaway camp for a couple of weeks, and the camp has a photographer who goes around all day taking pictures of the kids, which get uploaded to a private Facebook group. In the past, I would go online every day (or, okay, several times a day) and scroll through all those pictures looking for one that features my kid.
I don’t have to do that anymore. This year, I simply uploaded a picture of my daughter to an app and artificial intelligence (AI) takes care of the rest, recognizing her face amidst the sea of smiling children, and flagging just those photos for me to peruse. It’s amazing, really. And a bit scary.
The fact that facial recognition has penetrated the summer camp market should tell you that the tech is truly ubiquitous. But today we’re going to think a bit more about what AI can do with a picture of your face, because the power of facial recognition is not just skin deep.
What’s got me hot and bothered about facial images is this paper, appearing in Cell Metabolism, which adds a new layer to the standard facial-analysis playbook: facial temperature.
To understand this paper, you need to understand a whole field of research that is developing various different “clocks” for age.
It turns out that age really is just a number. Our cells, our proteins, our biochemistry can be analyzed to give different numbers. These “clocks,” as distinct from the calendar we usually use to measure our age, might have more predictive power than the number itself.
There are numerous molecular clocks, such as telomere length, that not only correlate with calendar age but are superior to calendar age in predicting age-related complications. Testing telomere length typically requires a blood sample — and remains costly. But we can use other sources to estimate age; how about a photo?
I mean, we do this all the time when we meet someone new or, as a physician, when we meet a new patient. I have often written that a patient “appears younger than their stated age,” and we’ve all had the experience of hearing how old someone is and being shocked. I mean, have you seen Sharon Stone recently? She’s 66 years old. Okay — to be fair, there might be some outside help there. But you get the point.
Back to the Cell Metabolism paper. Researchers report on multiple algorithms to obtain an “age” from a picture of an individual’s face.
The first algorithm is pretty straightforward. Researchers collected 2811 images, all of Han Chinese individuals ranging in age from 20 to 90 years, and reconstructed a 3D facial map from those.
They then trained a convolutional neural network to predict the individuals’ ages from the pictures. It was quite accurate, as you can see here.
In the AI age, this may not seem that impressive. A brief search online turned up dozens of apps that promised to guess my age from a photo.
I sent this rather unflattering picture of myself to ChatGPT which, after initially demurring and saying it was not designed to guess ages, pegged me at somewhere between 35 and 45, which I am taking as a major victory.
But the Cell Metabolism paper goes deeper. Literally.
And this is where things start to get interesting. Because sure, the visible part of your face can change depending on makeup, expression, plastic surgery, and the like. But the temperature? That’s harder to fake.
It turns out that the temperature distribution in your face changes as you get older. There is a cooling of the nose and the cheeks, for example.
And the researchers could combine all this temperature data to guess someone’s calendar age fairly accurately, though notably not as accurately as the model that just looks at the pictures.
But guessing your age is not really the interesting part of thermal imaging of the face. It’s guessing — or, rather, predicting — the state of your metabolism. All these study participants had extensive metabolic testing performed, as well as detailed analysis of their lifestyle behaviors. And facial images could be used to predict those factors.
For example, the 3D reconstruction of the faces could predict who ate seafood (they tend to look younger than their actual age) compared with who ate poultry and meat (they tend to look older). The thermal imaging could predict who got more sleep (they look younger from a temperature perspective) and who ate more yogurt (also younger-appearing, temperature-wise). Facial temperature patterns could identify those with higher BMI, higher blood pressure, higher fasting glucose.
The researchers used the difference between actual and predicted age as a metric to measure illness as well. You can see here how, on average, individuals with hypertension, diabetes, and even liver cysts are “older,” at least by face temperature.
It may even be possible to use facial temperature as biofeedback. In a small study, the researchers measured the difference between facial temperature age and real age before and after 2 weeks of jump-roping. It turns out that 2 weeks of jump-roping can make you look about 5 years younger, at least as judged by a thermal camera. Or like the Predator.
Okay, this is all very cool, but I’m not saying we’ll all be doing facial temperature tests in the near future. No; what this study highlights for me is how much information about ourselves is available to those who know how to decode it. Maybe those data come from the wrinkles in our faces, or the angles of our smiles, or the speed with which we type, or the temperature of our elbows. The data have always been there, actually, but we’ve never had the tools powerful enough to analyze them until now.
When I was a kid, I was obsessed with Star Trek — I know, you’re shocked — and, of course, the famous tricorder, a scanner that could tell everything about someone’s state of health in 5 seconds from 3 feet away. That’s how I thought medicine really would be in the future. Once I got to medical school, I was disabused of that notion. But the age of data, the age of AI, may mean the tricorder age is not actually that far away.
Dr. Wilson is associate professor of medicine and public health and director of the Clinical and Translational Research Accelerator at Yale University, New Haven, Conn. He has disclosed no relevant financial relationships.
A version of this article first appeared on Medscape.com.
Long COVID Can’t Be Solved Until We Decide What It Is
This transcript has been edited for clarity.
I want to help people suffering from long COVID as much as anyone. But we have a real problem. In brief, we are being too inclusive. The first thing you learn, when you start studying the epidemiology of diseases, is that you need a good case definition. And our case definition for long COVID sucks. Just last week, the National Academies of Sciences, Engineering, and Medicine (NASEM) issued a definition of long COVID with the aim of “improving consistency, documentation, and treatment.” Good news, right? Here’s the definition: “Long COVID is an infection-associated chronic condition that occurs after SARS-CoV-2 infection and is present for at least 3 months as a continuous, relapsing and remitting, or progressive disease state that affects one or more organ systems.”
This is not helpful. The symptoms can be in any organ system, can be continuous or relapsing and remitting. Basically, if you’ve had COVID — and essentially all of us have by now — and you have any symptom, even one that comes and goes, 3 months after that, it’s long COVID. They don’t even specify that it has to be a new symptom.
And I have sort of a case study in this problem today, based on a paper getting a lot of press suggesting that one out of every five people has long COVID.
We are talking about this study, “Epidemiologic Features of Recovery From SARS-CoV-2 Infection,” appearing in JAMA Network Open this week. While I think the idea is important, the study really highlights why it can be so hard to study long COVID.
As part of efforts to understand long COVID, the National Institutes of Health (NIH) leveraged 14 of its ongoing cohort studies. The NIH has multiple longitudinal cohort studies that follow various groups of people over time. You may have heard of the REGARDS study, for example, which focuses on cardiovascular risks to people living in the southern United States. Or the ARIC study, which followed adults in four communities across the United States for the development of heart disease. All 14 of the cohorts in this study are long-running projects with ongoing data collection. So, it was not a huge lift to add some questions to the yearly surveys and studies the participants were already getting.
To wit: “Do you think that you have had COVID-19?” and “Would you say that you are completely recovered now?” Those who said they weren’t fully recovered were asked how long it had been since their infection, and anyone who answered with a duration > 90 days was considered to have long COVID.
So, we have self-report of infection, self-report of duration of symptoms, and self-report of recovery. This is fine, of course; individuals’ perceptions of their own health are meaningful. But the vagaries inherent in those perceptions are going to muddy the waters as we attempt to discover the true nature of the long COVID syndrome.
But let’s look at some results. Out of 4708 individuals studied, 842 (17.9%) had not recovered by 90 days.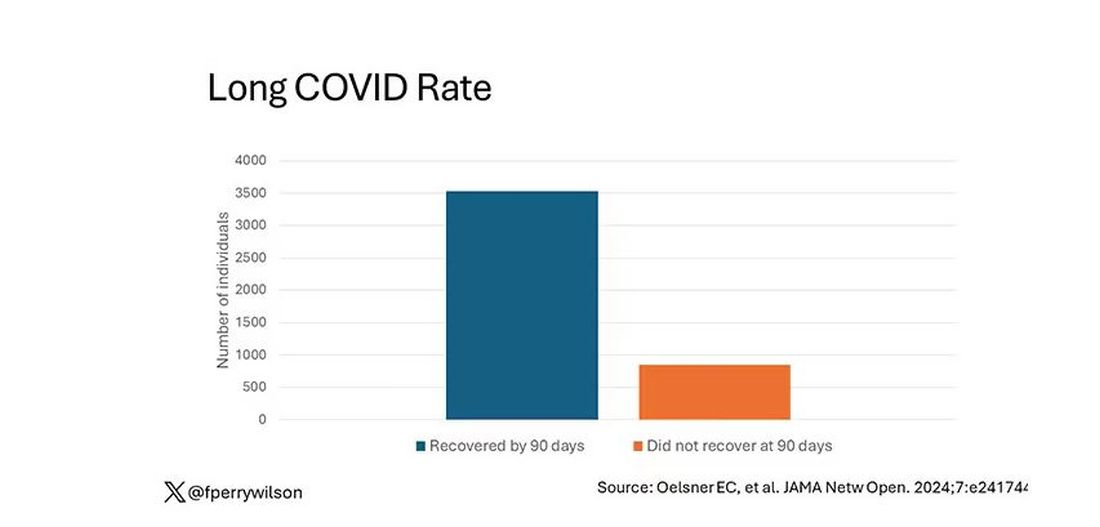
This study included not only people hospitalized with COVID, as some prior long COVID studies did, but people self-diagnosed, tested at home, etc. This estimate is as reflective of the broader US population as we can get.
And there are some interesting trends here.
Recovery time was longer in the first waves of COVID than in the Omicron wave.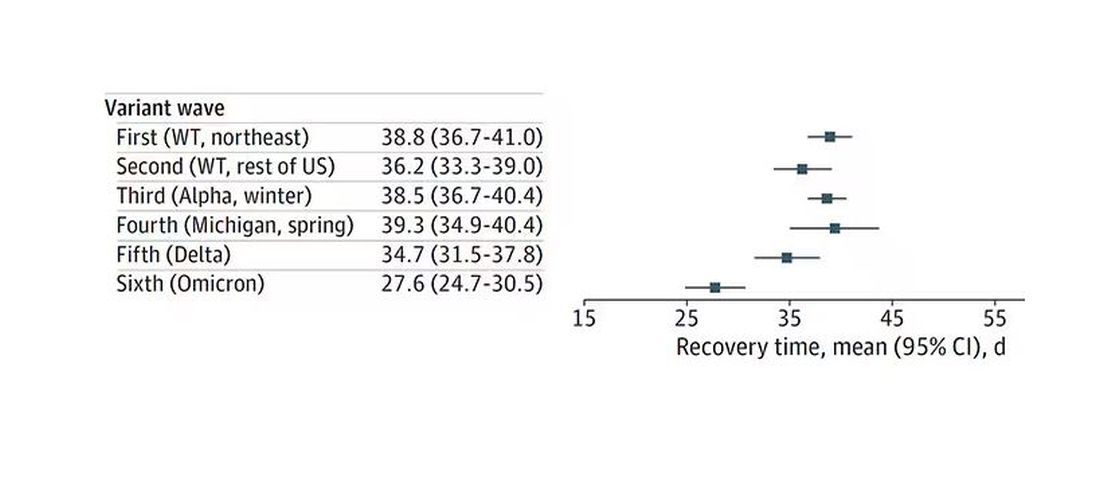
Recovery times were longer for smokers, those with diabetes, and those who were obese.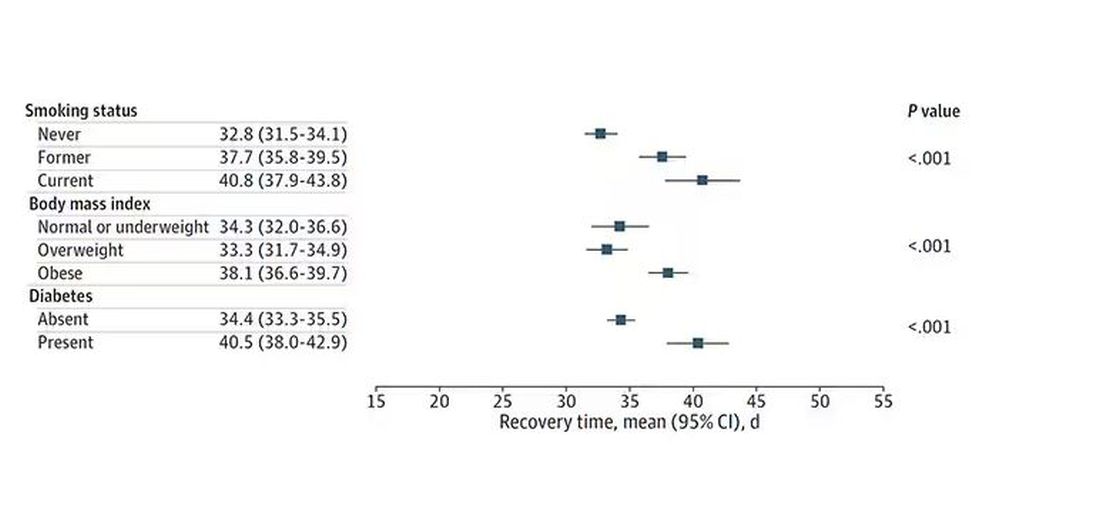
Recovery times were longer if the disease was more severe, in general. Though there is an unusual finding that women had longer recovery times despite their lower average severity of illness.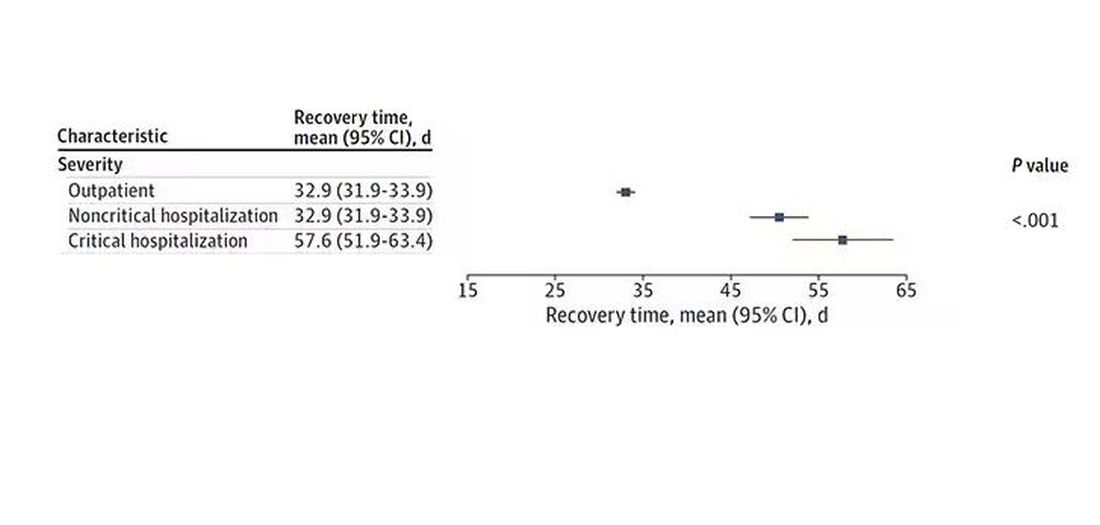
Vaccination was associated with shorter recovery times, as you can see here. 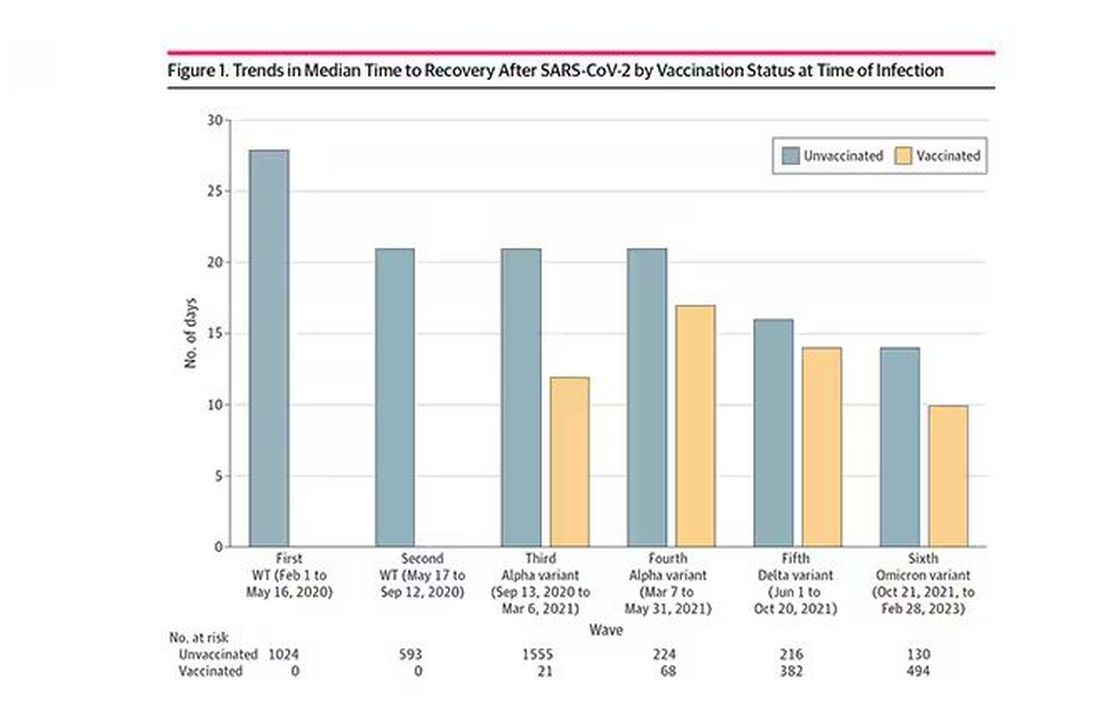
This is all quite interesting. It’s clear that people feel they are sick for a while after COVID. But we need to understand whether these symptoms are due to the lingering effects of a bad infection that knocks you down a peg, or to an ongoing syndrome — this thing we call long COVID — that has a physiologic basis and thus can be treated. And this study doesn’t help us much with that.
Not that this was the authors’ intention. This is a straight-up epidemiology study. But the problem is deeper than that. Let’s imagine that you want to really dig into this long COVID thing and get blood samples from people with it, ideally from controls with some other respiratory virus infection, and do all kinds of genetic and proteomic studies and stuff to really figure out what’s going on. Who do you enroll to be in the long COVID group? Do you enroll anyone who says they had COVID and still has some symptom more than 90 days after? You are going to find an awful lot of eligible people, and I guarantee that if there is a pathognomonic signature of long COVID, not all of them will have it.
And what about other respiratory viruses? This study in The Lancet Infectious Diseases compared long-term outcomes among hospitalized patients with COVID vs influenza. In general, the COVID outcomes are worse, but let’s not knock the concept of “long flu.” Across the board, roughly 50% of people report symptoms across any given organ system.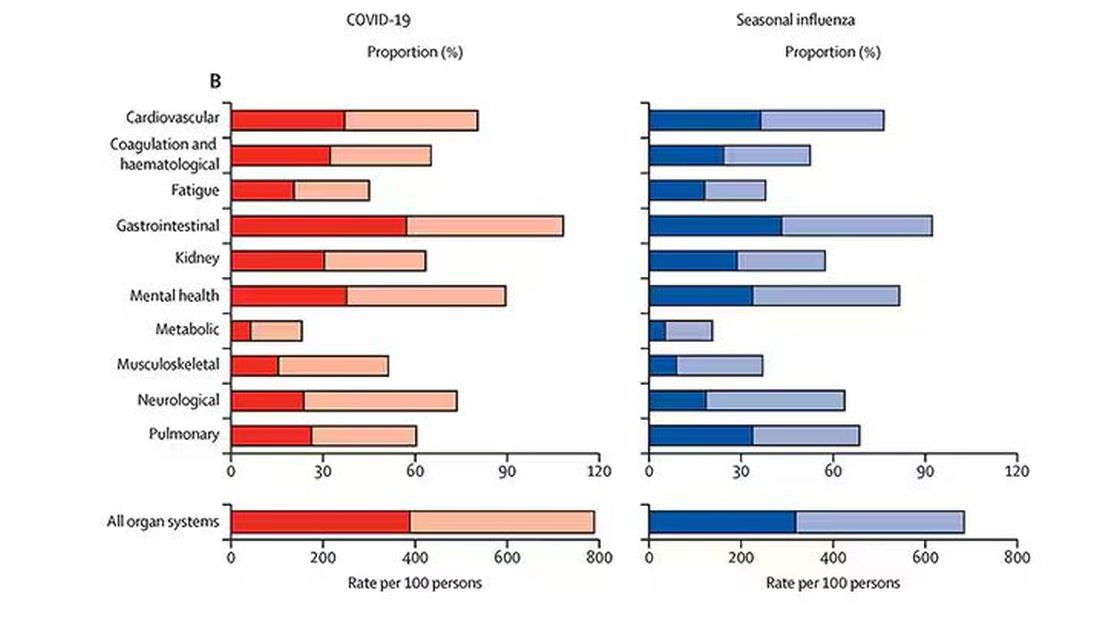
What this is all about is something called misclassification bias, a form of information bias that arises in a study where you label someone as diseased when they are not, or vice versa. If this happens at random, it’s bad; you’ve lost your ability to distinguish characteristics from the diseased and nondiseased population.
When it’s not random, it’s really bad. If we are more likely to misclassify women as having long COVID, for example, then it will appear that long COVID is more likely among women, or more likely among those with higher estrogen levels, or something. And that might simply be wrong.
I’m not saying that’s what happened here; this study does a really great job of what it set out to do, which was to describe the patterns of lingering symptoms after COVID. But we are not going to make progress toward understanding long COVID until we are less inclusive with our case definition. To paraphrase Syndrome from The Incredibles: If everyone has long COVID, then no one does.
Dr. Wilson is associate professor of medicine and public health and director of the Clinical and Translational Research Accelerator at Yale University, New Haven, Connecticut. He has disclosed no relevant financial relationships.
A version of this article appeared on Medscape.com.
This transcript has been edited for clarity.
I want to help people suffering from long COVID as much as anyone. But we have a real problem. In brief, we are being too inclusive. The first thing you learn, when you start studying the epidemiology of diseases, is that you need a good case definition. And our case definition for long COVID sucks. Just last week, the National Academies of Sciences, Engineering, and Medicine (NASEM) issued a definition of long COVID with the aim of “improving consistency, documentation, and treatment.” Good news, right? Here’s the definition: “Long COVID is an infection-associated chronic condition that occurs after SARS-CoV-2 infection and is present for at least 3 months as a continuous, relapsing and remitting, or progressive disease state that affects one or more organ systems.”
This is not helpful. The symptoms can be in any organ system, can be continuous or relapsing and remitting. Basically, if you’ve had COVID — and essentially all of us have by now — and you have any symptom, even one that comes and goes, 3 months after that, it’s long COVID. They don’t even specify that it has to be a new symptom.
And I have sort of a case study in this problem today, based on a paper getting a lot of press suggesting that one out of every five people has long COVID.
We are talking about this study, “Epidemiologic Features of Recovery From SARS-CoV-2 Infection,” appearing in JAMA Network Open this week. While I think the idea is important, the study really highlights why it can be so hard to study long COVID.
As part of efforts to understand long COVID, the National Institutes of Health (NIH) leveraged 14 of its ongoing cohort studies. The NIH has multiple longitudinal cohort studies that follow various groups of people over time. You may have heard of the REGARDS study, for example, which focuses on cardiovascular risks to people living in the southern United States. Or the ARIC study, which followed adults in four communities across the United States for the development of heart disease. All 14 of the cohorts in this study are long-running projects with ongoing data collection. So, it was not a huge lift to add some questions to the yearly surveys and studies the participants were already getting.
To wit: “Do you think that you have had COVID-19?” and “Would you say that you are completely recovered now?” Those who said they weren’t fully recovered were asked how long it had been since their infection, and anyone who answered with a duration > 90 days was considered to have long COVID.
So, we have self-report of infection, self-report of duration of symptoms, and self-report of recovery. This is fine, of course; individuals’ perceptions of their own health are meaningful. But the vagaries inherent in those perceptions are going to muddy the waters as we attempt to discover the true nature of the long COVID syndrome.
But let’s look at some results. Out of 4708 individuals studied, 842 (17.9%) had not recovered by 90 days.
This study included not only people hospitalized with COVID, as some prior long COVID studies did, but people self-diagnosed, tested at home, etc. This estimate is as reflective of the broader US population as we can get.
And there are some interesting trends here.
Recovery time was longer in the first waves of COVID than in the Omicron wave.
Recovery times were longer for smokers, those with diabetes, and those who were obese.
Recovery times were longer if the disease was more severe, in general. Though there is an unusual finding that women had longer recovery times despite their lower average severity of illness.
Vaccination was associated with shorter recovery times, as you can see here.
This is all quite interesting. It’s clear that people feel they are sick for a while after COVID. But we need to understand whether these symptoms are due to the lingering effects of a bad infection that knocks you down a peg, or to an ongoing syndrome — this thing we call long COVID — that has a physiologic basis and thus can be treated. And this study doesn’t help us much with that.
Not that this was the authors’ intention. This is a straight-up epidemiology study. But the problem is deeper than that. Let’s imagine that you want to really dig into this long COVID thing and get blood samples from people with it, ideally from controls with some other respiratory virus infection, and do all kinds of genetic and proteomic studies and stuff to really figure out what’s going on. Who do you enroll to be in the long COVID group? Do you enroll anyone who says they had COVID and still has some symptom more than 90 days after? You are going to find an awful lot of eligible people, and I guarantee that if there is a pathognomonic signature of long COVID, not all of them will have it.
And what about other respiratory viruses? This study in The Lancet Infectious Diseases compared long-term outcomes among hospitalized patients with COVID vs influenza. In general, the COVID outcomes are worse, but let’s not knock the concept of “long flu.” Across the board, roughly 50% of people report symptoms across any given organ system.
What this is all about is something called misclassification bias, a form of information bias that arises in a study where you label someone as diseased when they are not, or vice versa. If this happens at random, it’s bad; you’ve lost your ability to distinguish characteristics from the diseased and nondiseased population.
When it’s not random, it’s really bad. If we are more likely to misclassify women as having long COVID, for example, then it will appear that long COVID is more likely among women, or more likely among those with higher estrogen levels, or something. And that might simply be wrong.
I’m not saying that’s what happened here; this study does a really great job of what it set out to do, which was to describe the patterns of lingering symptoms after COVID. But we are not going to make progress toward understanding long COVID until we are less inclusive with our case definition. To paraphrase Syndrome from The Incredibles: If everyone has long COVID, then no one does.
Dr. Wilson is associate professor of medicine and public health and director of the Clinical and Translational Research Accelerator at Yale University, New Haven, Connecticut. He has disclosed no relevant financial relationships.
A version of this article appeared on Medscape.com.
In the Future, a Robot Intensivist May Save Your Life
This transcript has been edited for clarity.
They call it the “golden hour”: 60 minutes, give or take, when the chance to save the life of a trauma victim is at its greatest. If the patient can be resuscitated and stabilized in that time window, they stand a good chance of surviving. If not, well, they don’t.
But resuscitation is complicated. It requires blood products, fluids, vasopressors — all given in precise doses in response to rapidly changing hemodynamics. To do it right takes specialized training, advanced life support (ALS). If the patient is in a remote area or an area without ALS-certified emergency medical services, or is far from the nearest trauma center, that golden hour is lost. And the patient may be as well.
But we live in the future. We have robots in factories, self-driving cars, autonomous drones. Why not an autonomous trauma doctor? If you are in a life-threatening accident, would you want to be treated ... by a robot?
Enter “resuscitation based on functional hemodynamic monitoring,” or “ReFit,” introduced in this article appearing in the journal Intensive Care Medicine Experimental.
The idea behind ReFit is straightforward. Resuscitation after trauma should be based on hitting key hemodynamic targets using the tools we have available in the field: blood, fluids, pressors. The researchers wanted to develop a closed-loop system, something that could be used by minimally trained personnel. The input to the system? Hemodynamic data, provided through a single measurement device, an arterial catheter. The output: blood, fluids, and pressors, delivered intravenously.
The body (a prototype) of the system looks like this. You can see various pumps labeled with various fluids, electronic controllers, and so forth.
If that’s the body, then this is the brain – a ruggedized laptop interpreting a readout of that arterial catheter.
If that’s the brain, then the ReFit algorithm is the mind. The algorithm does its best to leverage all the data it can, so I want to walk through it in a bit of detail.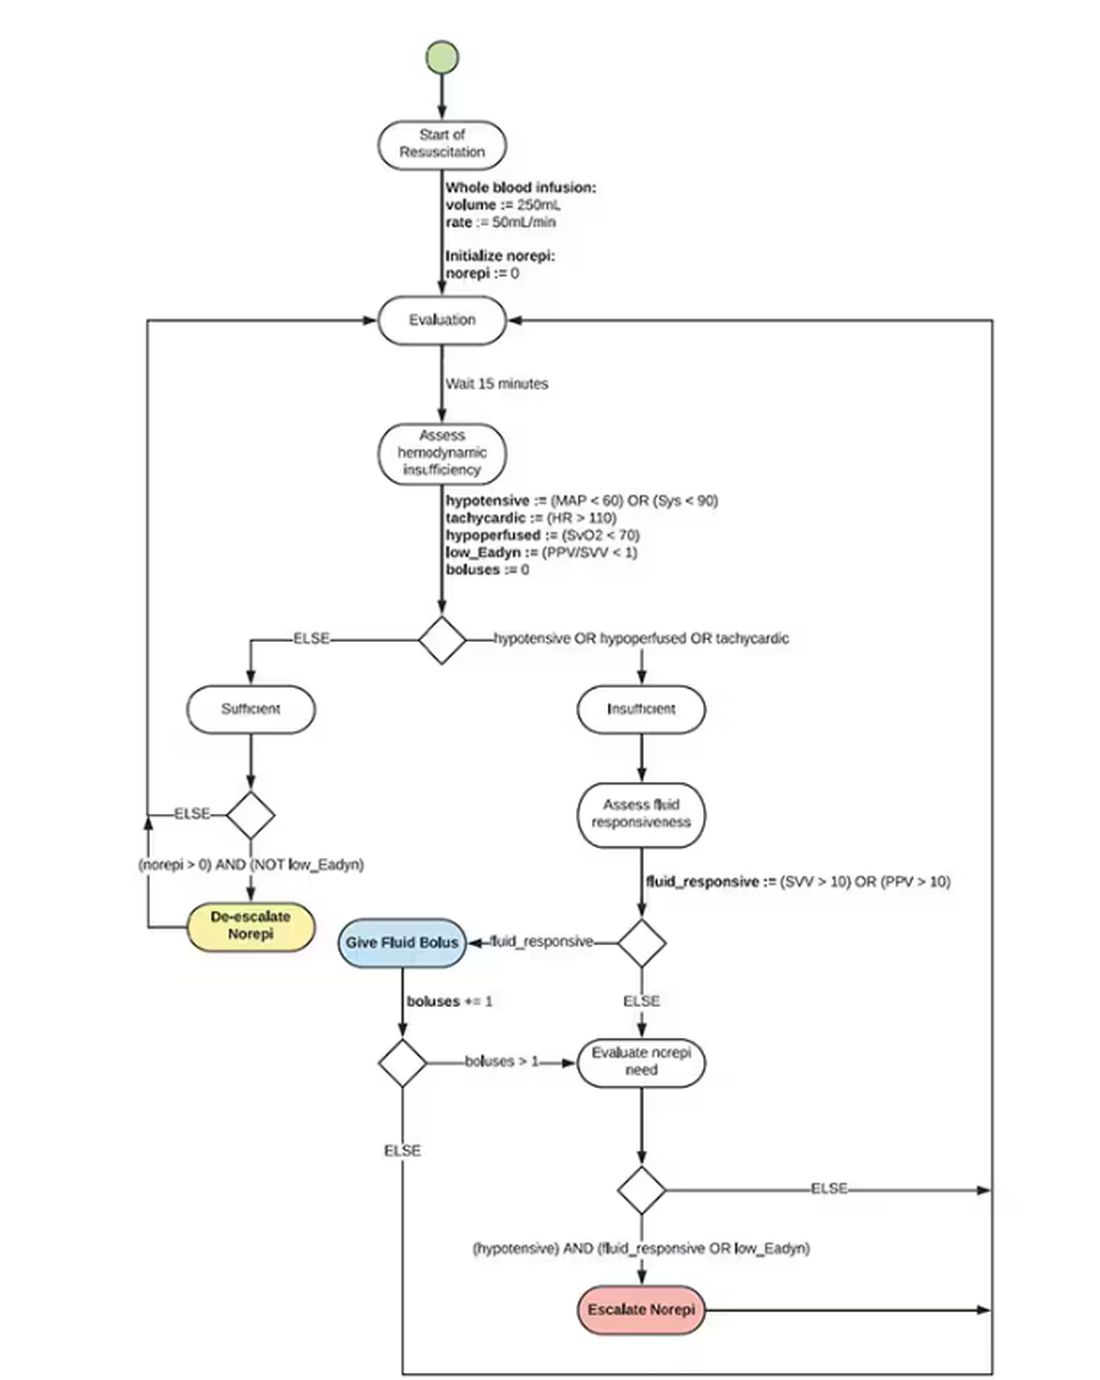
First, check to see whether the patient is stable, defined as a heart rate < 110 beats/min and a mean arterial pressure > 60 mm Hg. If not, you’re off to the races, starting with a bolus of whole blood.
Next, the algorithm gets really interesting. If the patient is still unstable, the computer assesses fluid responsiveness by giving a test dose of fluid and measuring the pulse pressure variation. Greater pulse pressure variation means more fluid responsiveness and the algorithm gives more fluid. Less pulse pressure variation leads the algorithm to uptitrate pressors — in this case, norepinephrine.
This cycle of evaluation and response keeps repeating. The computer titrates fluids and pressors up and down entirely on its own, in theory freeing the human team members to do other things, like getting the patient to a trauma center for definitive care.
So, how do you test whether something like this works? Clearly, you don’t want the trial run of a system like this to be used on a real human suffering from a real traumatic injury.
Once again, we have animals to thank for research advances — in this case, pigs. Fifteen pigs are described in the study. To simulate a severe, hemorrhagic trauma, they were anesthetized and the liver was lacerated. They were then observed passively until the mean arterial pressure had dropped to below 40 mm Hg.
This is a pretty severe injury. Three unfortunate animals served as controls, two of which died within the 3-hour time window of the study. Eight animals were plugged into the ReFit system.
For a window into what happens during this process, let’s take a look at the mean arterial pressure and heart rate readouts for one of the animals. You see that the blood pressure starts to fall precipitously after the liver laceration. The heart rate quickly picks up to compensate, raising the mean arterial pressure a bit, but this would be unsustainable with ongoing bleeding.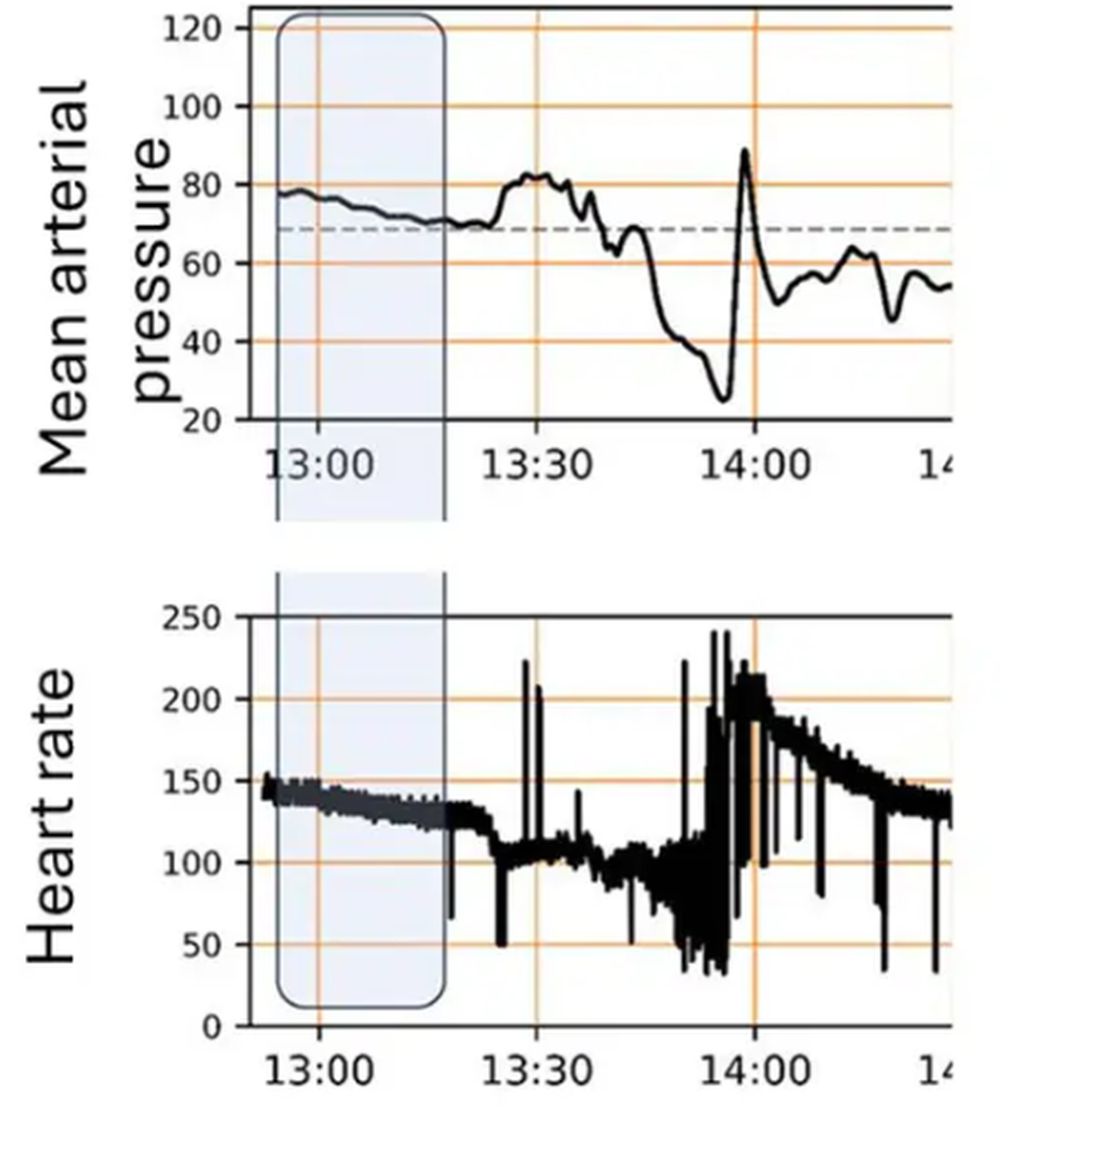
Here, the ReFit system takes over. Autonomously, the system administers two units of blood, followed by fluids, and then norepinephrine or further fluids per the protocol I described earlier. 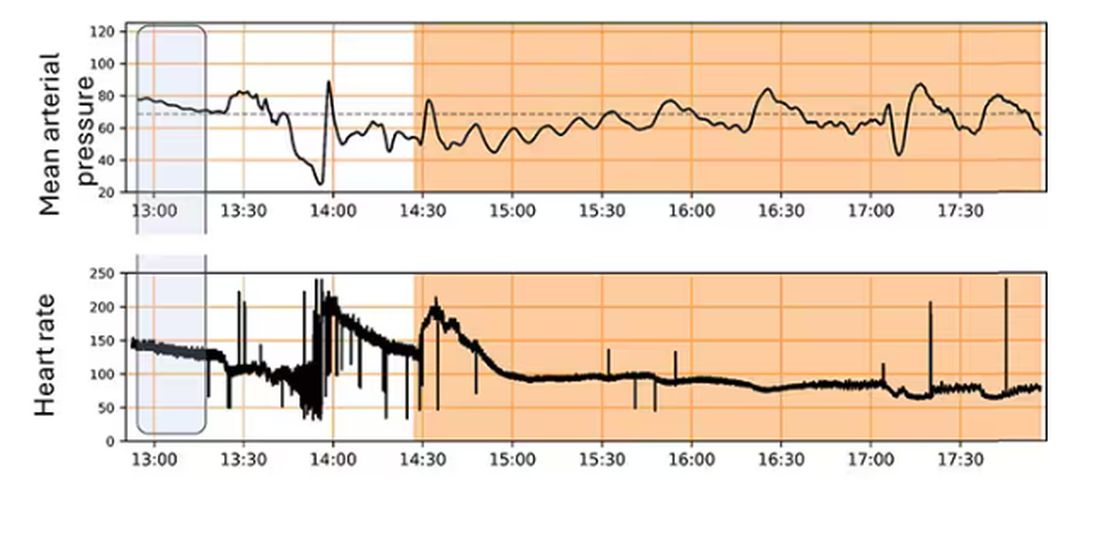
The practical upshot of all of this is stabilization, despite an as-yet untreated liver laceration.
Could an experienced ALS provider do this? Of course. But, as I mentioned before, you aren’t always near an experienced ALS provider.
This is all well and good in the lab, but in the real world, you actually need to transport a trauma patient. The researchers tried this also. To prove feasibility, four pigs were taken from the lab to the top of the University of Pittsburgh Medical Center, flown to Allegheny County Airport and back. Total time before liver laceration repair? Three hours. And all four survived.
It won’t surprise you to hear that this work was funded by the Department of Defense. You can see how a system like this, made a bit more rugged, a bit smaller, and a bit more self-contained could have real uses in the battlefield. But trauma is not unique to war, and something that can extend the time you have to safely transport a patient to definitive care — well, that’s worth its weight in golden hours.
Dr. Wilson is associate professor of medicine and public health and director of the Clinical and Translational Research Accelerator at Yale University, New Haven, Connecticut. He has disclosed no relevant financial relationships.
A version of this article appeared on Medscape.com.
This transcript has been edited for clarity.
They call it the “golden hour”: 60 minutes, give or take, when the chance to save the life of a trauma victim is at its greatest. If the patient can be resuscitated and stabilized in that time window, they stand a good chance of surviving. If not, well, they don’t.
But resuscitation is complicated. It requires blood products, fluids, vasopressors — all given in precise doses in response to rapidly changing hemodynamics. To do it right takes specialized training, advanced life support (ALS). If the patient is in a remote area or an area without ALS-certified emergency medical services, or is far from the nearest trauma center, that golden hour is lost. And the patient may be as well.
But we live in the future. We have robots in factories, self-driving cars, autonomous drones. Why not an autonomous trauma doctor? If you are in a life-threatening accident, would you want to be treated ... by a robot?
Enter “resuscitation based on functional hemodynamic monitoring,” or “ReFit,” introduced in this article appearing in the journal Intensive Care Medicine Experimental.
The idea behind ReFit is straightforward. Resuscitation after trauma should be based on hitting key hemodynamic targets using the tools we have available in the field: blood, fluids, pressors. The researchers wanted to develop a closed-loop system, something that could be used by minimally trained personnel. The input to the system? Hemodynamic data, provided through a single measurement device, an arterial catheter. The output: blood, fluids, and pressors, delivered intravenously.
The body (a prototype) of the system looks like this. You can see various pumps labeled with various fluids, electronic controllers, and so forth.
If that’s the body, then this is the brain – a ruggedized laptop interpreting a readout of that arterial catheter.
If that’s the brain, then the ReFit algorithm is the mind. The algorithm does its best to leverage all the data it can, so I want to walk through it in a bit of detail.
First, check to see whether the patient is stable, defined as a heart rate < 110 beats/min and a mean arterial pressure > 60 mm Hg. If not, you’re off to the races, starting with a bolus of whole blood.
Next, the algorithm gets really interesting. If the patient is still unstable, the computer assesses fluid responsiveness by giving a test dose of fluid and measuring the pulse pressure variation. Greater pulse pressure variation means more fluid responsiveness and the algorithm gives more fluid. Less pulse pressure variation leads the algorithm to uptitrate pressors — in this case, norepinephrine.
This cycle of evaluation and response keeps repeating. The computer titrates fluids and pressors up and down entirely on its own, in theory freeing the human team members to do other things, like getting the patient to a trauma center for definitive care.
So, how do you test whether something like this works? Clearly, you don’t want the trial run of a system like this to be used on a real human suffering from a real traumatic injury.
Once again, we have animals to thank for research advances — in this case, pigs. Fifteen pigs are described in the study. To simulate a severe, hemorrhagic trauma, they were anesthetized and the liver was lacerated. They were then observed passively until the mean arterial pressure had dropped to below 40 mm Hg.
This is a pretty severe injury. Three unfortunate animals served as controls, two of which died within the 3-hour time window of the study. Eight animals were plugged into the ReFit system.
For a window into what happens during this process, let’s take a look at the mean arterial pressure and heart rate readouts for one of the animals. You see that the blood pressure starts to fall precipitously after the liver laceration. The heart rate quickly picks up to compensate, raising the mean arterial pressure a bit, but this would be unsustainable with ongoing bleeding.
Here, the ReFit system takes over. Autonomously, the system administers two units of blood, followed by fluids, and then norepinephrine or further fluids per the protocol I described earlier.
The practical upshot of all of this is stabilization, despite an as-yet untreated liver laceration.
Could an experienced ALS provider do this? Of course. But, as I mentioned before, you aren’t always near an experienced ALS provider.
This is all well and good in the lab, but in the real world, you actually need to transport a trauma patient. The researchers tried this also. To prove feasibility, four pigs were taken from the lab to the top of the University of Pittsburgh Medical Center, flown to Allegheny County Airport and back. Total time before liver laceration repair? Three hours. And all four survived.
It won’t surprise you to hear that this work was funded by the Department of Defense. You can see how a system like this, made a bit more rugged, a bit smaller, and a bit more self-contained could have real uses in the battlefield. But trauma is not unique to war, and something that can extend the time you have to safely transport a patient to definitive care — well, that’s worth its weight in golden hours.
Dr. Wilson is associate professor of medicine and public health and director of the Clinical and Translational Research Accelerator at Yale University, New Haven, Connecticut. He has disclosed no relevant financial relationships.
A version of this article appeared on Medscape.com.