User login
Clinical Progress Note: Myocardial Injury After Noncardiac Surgery
More than 200 million patients worldwide undergo major noncardiac surgery each year. Of these, more than 10 million patients suffer a major adverse cardiovascular event (MACE) within 30 days of surgery.1 Elevated troponins after noncardiac surgery have been associated with increased mortality, but the management of these patients and the indications for screening remain unclear. The nomenclature around myocardial injury also remains confusing. In this Progress Note, we aim to define myocardial injury after noncardiac surgery (MINS) and discuss the key questions on MINS and postoperative troponin elevation.
A PubMed search for medical subject headings and the terms “myocardial injury after noncardiac surgery,” “perioperative troponin,” and “postoperative troponin” restricted to humans, English language, and published in the past 5 years resulted in 144 articles. Articles most relevant to this progress note were included. Guidelines from major societies on perioperative cardiovascular assessment and management were also reviewed.
DEFINITION OF MYOCARDIAL INJURY AND MINS
The Fourth Universal Definition of Myocardial Infarction ( UDMI 4) defines myocardial injury as detection of an elevated cardiac troponin above the 99th percentile upper reference limit (URL).2 Different troponin assays are not comparable and institutions set their own thresholds for abnormal troponin. Per UDMI 4, myocardial injury is classified as (Figure)2-4:
- Acute Myocardial Infarction (MI): This is defined as “detection of a rise and/or fall of cardiac troponin with ≥1 value above the 99th percentile URL and ≥1 of the following: symptoms of acute myocardial ischemia, new ischemic electrocardiographic changes, development of pathological Q waves, or imaging evidence of new loss of viable myocardium or new regional wall motion abnormality in a pattern consistent with an ischemic etiology.” If these patients have an acute atherosclerotic plaque rupture, they are classified as Type 1 MI (T1MI), and if they have a mismatch between oxygen supply/demand, they are classified as Type 2 MI (T2MI).
- Acute Nonischemic Myocardial Injury (NIMI): This is defined as detection of both a rise and/or fall of cardiac troponin and one or more cardiac troponin values above the 99th percentile URL, but no overt clinical evidence of myocardial ischemia.
- Chronic Myocardial Injury: This is defined as one or more cardiac troponin values above the 99th percentile URL but without a rise and/or fall pattern.
MINS is defined as a rise and/or fall of cardiac biomarkers of presumed ischemic etiology within 30 days of noncardiac surgery that may occur with or without the clinical criteria necessary to fulfill the universal definition of MI (Figure).5-8

EPIDEMIOLOGY AND OUTCOMES
A meta-analysis of 169 studies reported the overall incidence of MINS to be 17.9%; the incidence was 19.6% when systematic troponin screening was done versus 9.9% when troponins were ordered selectively based on the clinical context.5
That meta-analysis found that patients with MINS were more likely to be older, male, undergoing nonelective surgeries, and have hypertension, coronary artery disease (CAD), prior MI, heart failure, or kidney disease.5 Intraoperative hypotension (defined as systolic blood pressure <100 mm Hg or mean arterial pressure <55 mm Hg for up to 5 minutes or <60 mm Hg for 30 minutes or more) and intraoperative tachycardia (defined as heart rate >100 beats per minute) have been associated with MINS.5,9 The relationship between anesthesia type and MINS is uncertain.
MINS is associated with an increased risk of 30-day mortality, nonfatal cardiac arrest, heart failure, and stroke.In the Vascular Events In Noncardiac Surgery Patients Cohort Evaluation (VISION) studies, the majority of patients did not have ischemic symptoms.6,7 In this study, 30-day mortality rates were 8.5% to 13.5% in patients with ischemic symptoms or electrocardiographic changes and 2.9% to 7.7% in patients with asymptomatic troponin elevations. Among the patients without MINS, 30-day mortality was 0.6% to 1.1%. Higher levels of cardiac troponin were associated with higher mortality rates and shorter time to death.
SCREENING GUIDELINES
The recommendations for perioperative screening for MINS vary from society to society. Although MINS is associated with worse outcomes, and most patients with MINS are asymptomatic, perioperative screening for MINS in the absence of clinical signs or symptoms is currently not recommended by the American College of Cardiology/American Heart Association (ACC/AHA).10
ACC/AHA
“The usefulness of postoperative screening with troponin levels in patients at high risk for perioperative MI, but without signs or symptoms suggestive of myocardial ischemia or MI, is uncertain in the absence of established risks and benefits of a defined management strategy (Class IIb; level of evidence [LOE]–B).”10
European Society of Cardiology
“Measurement of B-type natriuretic peptides (BNP) and high-sensitivity troponins (hsTn) after surgery may be considered in high-risk patients to improve risk stratification (Class IIb; LOE-B). Preoperatively and postoperatively, patients who could most benefit from BNP or hsTn measurements are those with metabolic equivalents (METs) ≤4 or those with a revised cardiac risk index (RCRI) score >1 for vascular surgery and >2 for nonvascular surgery. Postoperatively, patients with a surgical Apgar score <7 should also be monitored with BNP or hsTn to detect complications early, independent of their RCRI values.”11
Canadian Cardiovascular Society
“We recommend obtaining daily troponins for 48-72 hours after noncardiac surgery in patients with a baseline risk of >5% for cardiovascular death or nonfatal MI at 30 days after surgery (ie, patients with an elevated N-terminal-proBNP (NT-proBNP)/BNP before surgery or, if there is no NT-proBNP/BNP before surgery, in those who have an RCRI score ≥1, age 45-64 years with significant cardiovascular disease, or age ≥65 years) (Strong recommendation; Moderate quality evidence).”1
MANAGEMENT OF MINS
Currently, evidence-based therapies are well established only for T1MI. However, it is often challenging to differentiate T1MI from other causes of troponin elevation in the perioperative setting in which anesthesia, sedation, or analgesia may mask ischemic symptoms that typically prompt further investigation. While peak troponin levels may be higher in T1MI than they are in T2MI, the initial or delta change in the troponin may provide poor discrimination between T1MI and T2MI.2 Management is complicated not only by the uncertainty about the underlying diagnosis (T1MI, T2MI, or NIMI) but also by the heterogeneity in the underlying pathophysiology of troponin elevation in patients with T2MI and NIMI. Patients with T2MI are generally sicker and have higher mortality than patients with T1MI, and management typically involves treating the underlying reason for oxygen supply/demand mismatch. Mortality in T2MI is more commonly caused by noncardiovascular causes, but underlying CAD is an independent predictor of cardiovascular death or recurrent MI in these patients.
The MANAGE trial (Management of Myocardial Injury After Noncardiac Surgery) had several methodological limitations to inform clinical practice but showed potential benefit of dabigatran in patients with MINS.12 In this trial, patients on dabigatran had significantly lower rates of the primary efficacy outcome (composite of vascular mortality and nonfatal MI, nonhemorrhagic stroke, peripheral arterial thrombosis, amputation, and symptomatic venous thromboembolism) without a significant increase in life-threatening, major, or critical organ bleeding. Of the secondary efficacy outcomes, only nonhemorrhagic stroke was significantly reduced with dabigatran, but the event rate was low. In the subgroup analysis, patients randomized to dabigatran within 5 days of MINS and those meeting the criteria for MI had significantly lower rates of the primary efficacy outcome.
Patients with T2MI with known CAD may benefit from long-term risk reduction strategies for secondary prevention. There are no definitive management strategies in the literature for T2MI with unknown or no CAD. The SWEDEHEART registry (Swedish Web-System for Enhancement and Development of Evidence-Based Care in Heart Disease Evaluated According to Recommended Therapy) enrolled 9,136 patients with MI with nonobstructive coronary arteries (MINOCA).13 Though MINOCA may include T1MI patients, the majority of these patients are classified as T2MI under UDMI 4. Therefore, it has been proposed that data from this registry may inform management on T2MI.14 Data from this registry showed that statins and angiotensin-converting enzyme inhibitors or angiotensin II receptor blockers were associated with lower incidence of MACE over a mean follow-up of 4.1 years. Dual-antiplatelet therapy or beta blockers did not significantly lower the incidence of MACE.13 In another study assessing 2-year mortality in patients with T2MI, beta blockers were beneficial.15
KEY QUESTIONS AND RECOMMENDATIONS
Who should be screened?
Screening can be performed if further risk stratification of high-risk patients or patients with poor functional status is desired. European Society of Cardiology and Canadian Cardiovascular Society guidelines provide guidance on the screening criteria. Troponin elevation in a low-risk group is associated with a low mortality rate, and many of these troponin elevations may be secondary to causes other than myocardial ischemia.
How should screening be conducted?
If planning to obtain postoperative troponins, then preoperative troponin should be obtained because 35% of the patients may have a chronic troponin elevation.
What is the risk if postoperative troponin screening is not performed?
Most patients with MINS are asymptomatic. Systematic screening with troponins (compared with selective screening based on clinical signs or symptoms) can detect T1MI that would otherwise remain occult and undiagnosed.
What is the risk if postoperative troponin screening is performed?
Detecting asymptomatic troponin elevations could lead to potentially harmful treatments (eg, increased risk of bleeding with antithrombotics in the postoperative setting, increased use of cardiac angiography, or addition of new medications such as statins and beta-blockers in the postoperative setting with the potential for adverse effects).
How should MINS be documented?
ST-elevation and non–ST elevation MI (STEMI and NSTEMI) should be reserved for T1MI only. T1MI should be documented when acute plaque rupture is strongly suspected. T2MI should be documented when oxygen supply/demand mismatch is strongly suspected as the etiology of acute MI (eg, T2MI secondary to tachyarrhythmia, hypertensive emergency, or septic shock). Documenting as “demand ischemia” or “unlikely acute coronary syndrome” for T2MI or NIMI should be avoided. Troponin elevations not meeting the criteria for acute MI should be documented as “non-MI troponin elevation” (eg, non-MI troponin elevation secondary to chronic kidney disease or left ventricular hypertrophy). Terms like “troponinitis” or “troponinemia” should be avoided.3
Can MINS be prevented?
There are no well-defined strategies for prevention of MINS, but cardiovascular risk factors should be optimized preoperatively for all patients. In a meta-analysis, preoperative aspirin was not associated with reduced incidence of MINS, and the role of preoperative statins remains speculative; however, nonacute initiation of beta-blockers preoperatively was associated with a lower incidence of MINS.5 Withholding angiotensin-converting enzyme inhibitors or angiotensin II receptor blockers in the 24 hours prior to surgery has been associated with a lower incidence of MINS. Intraoperative hypotension or tachycardia should be avoided.
CONCLUSION
While MINS has been associated with increased 30-day mortality, there are currently no definitive evidence-based management strategies for these patients. Institutions should consider creating decision-support tools if considering screening for MINS based on patient- and surgery-specific risk factors.
Disclosures
The authors have nothing to disclose.
1. Duceppe E, Parlow J, MacDonald P, et al. Canadian Cardiovascular Society guidelines on perioperative cardiac risk assessment and management for patients who undergo noncardiac surgery. Can J Cardiol. 2017;33(1):17-32. https://doi.org/10.1016/j.cjca.2016.09.008.
2. Thygesen K, Alpert JS, Jaffe AS, et al. Fourth universal definition of myocardial infarction. J Am Coll Cardiol. 2018;72(18):2231-2264. https://doi.org/10.1016/j.jacc.2018.08.1038.
3. Goyal A, Gluckman TJ, Levy A, et al. Translating the fourth universal definition of myocardial infarction into clinical documentation: ten pearls for frontline clinicians. Cardiology Magazine. 2018. https://www.acc.org/latest-in-cardiology/articles/2018/11/06/12/42/translating-the-fourth-universal-definition-of-myocardial-infarction-into-clinical-documentation-ten-pearls-for-frontline-clinicians. Accessed February 20, 2020.
4. King CJ, Levy AE, Trost JC. Clinical progress notes: updates from the 4th universal definition of myocardial infarction. J Hosp Med. 2019;14(9):555-557. https://doi.org/10.12788/jhm.3283.
5. Smilowitz NR, Redel-Traub G, Hausvater A, et al. Myocardial injury after noncardiac surgery: a systematic review and meta-analysis. Cardiol Rev. 2019;27(6):267-273. https://doi.org/10.1097/crd.0000000000000254.
6. Botto F, Alonso-Coello P, Chan MT, et al. Myocardial injury after noncardiac surgery: a large, international, prospective cohort study establishing diagnostic criteria, characteristics, predictors, and 30-day outcomes. Anesthesiology. 2014;120(3):564-578. https://doi.org/10.1097/aln.0000000000000113.
7. Writing Committee for the VISION Study Investigators, Devereaux PJ, Biccard BM, et al. Association of postoperative high-sensitivity troponin levels with myocardial injury and 30-day mortality among patients undergoing noncardiac surgery. JAMA. 2017;317(16):1642-1651. https://doi.org/10.1001/jama.2017.4360.
8. Puelacher C, Lurati Buse G, Seeberger D, et al. Perioperative myocardial injury after noncardiac surgery: incidence, mortality, and characterization. Circulation. 2018;137(12):1221-1232. https://doi.org/10.1161/circulationaha.117.030114.
9. Abbott TEF, Pearse RM, Archbold RA, et al. A prospective international multicentre cohort study of intraoperative heart rate and systolic blood pressure and myocardial injury after noncardiac surgery: results of the VISION study. Anesth Analg. 2018;126(6):1936-1945. https://doi.org/10.1213/ane.0000000000002560.
10. Fleisher LA, Fleischmann KE, Auerbach AD, et al. 2014 ACC/AHA guideline on perioperative cardiovascular evaluation and management of patients undergoing noncardiac surgery: a report of the American College of Cardiology/American Heart Association Task Force on practice guidelines. J Am Coll Cardiol. 2014;64(22):e77-e137. https://doi.org/10.1016/j.jacc.2014.07.944.
11. Kristensen SD, Knuuti J, Saraste A, et al. 2014 ESC/ESA Guidelines on non-cardiac surgery: cardiovascular assessment and management: the joint task force on non-cardiac surgery: cardiovascular assessment and management of the European Society of Cardiology (ESC) and the European Society of Anaesthesiology (ESA). Eur Heart J. 2014;35(35):2383-2431. https://doi.org/10.1093/eurheartj/ehu282.
12. Devereaux PJ, Duceppe E, Guyatt G, et al. Dabigatran in patients with myocardial injury after non-cardiac surgery (MANAGE): an international, randomised, placebo-controlled trial. Lancet. 2018;391(10137):2325-2334. https://doi.org/10.1016/s0140-6736(18)30832-8.
13. Lindahl B, Baron T, Erlinge D, et al. Medical therapy for secondary prevention and long-term outcome in patients with myocardial infarction with nonobstructive coronary artery disease. Circulation. 2017;135(16):1481-1489. https://doi.org/10.1161/circulationaha.116.026336.
14. DeFilippis AP, Chapman AR, Mills NL, et al. Assessment and treatment of patients with type 2 myocardial infarction and acute nonischemic myocardial injury. Circulation. 2019;140(20):1661-1678. https://doi.org/10.1161/circulationaha.119.040631.
15. Sandoval Y, Smith SW, Sexter A, et al. Type 1 and 2 myocardial infarction and myocardial injury: clinical transition to high-sensitivity cardiac troponin I. Am J Med. 2017;130(12):1431-1439.e4. https://doi.org/10.1016/j.amjmed.2017.05.049.
More than 200 million patients worldwide undergo major noncardiac surgery each year. Of these, more than 10 million patients suffer a major adverse cardiovascular event (MACE) within 30 days of surgery.1 Elevated troponins after noncardiac surgery have been associated with increased mortality, but the management of these patients and the indications for screening remain unclear. The nomenclature around myocardial injury also remains confusing. In this Progress Note, we aim to define myocardial injury after noncardiac surgery (MINS) and discuss the key questions on MINS and postoperative troponin elevation.
A PubMed search for medical subject headings and the terms “myocardial injury after noncardiac surgery,” “perioperative troponin,” and “postoperative troponin” restricted to humans, English language, and published in the past 5 years resulted in 144 articles. Articles most relevant to this progress note were included. Guidelines from major societies on perioperative cardiovascular assessment and management were also reviewed.
DEFINITION OF MYOCARDIAL INJURY AND MINS
The Fourth Universal Definition of Myocardial Infarction ( UDMI 4) defines myocardial injury as detection of an elevated cardiac troponin above the 99th percentile upper reference limit (URL).2 Different troponin assays are not comparable and institutions set their own thresholds for abnormal troponin. Per UDMI 4, myocardial injury is classified as (Figure)2-4:
- Acute Myocardial Infarction (MI): This is defined as “detection of a rise and/or fall of cardiac troponin with ≥1 value above the 99th percentile URL and ≥1 of the following: symptoms of acute myocardial ischemia, new ischemic electrocardiographic changes, development of pathological Q waves, or imaging evidence of new loss of viable myocardium or new regional wall motion abnormality in a pattern consistent with an ischemic etiology.” If these patients have an acute atherosclerotic plaque rupture, they are classified as Type 1 MI (T1MI), and if they have a mismatch between oxygen supply/demand, they are classified as Type 2 MI (T2MI).
- Acute Nonischemic Myocardial Injury (NIMI): This is defined as detection of both a rise and/or fall of cardiac troponin and one or more cardiac troponin values above the 99th percentile URL, but no overt clinical evidence of myocardial ischemia.
- Chronic Myocardial Injury: This is defined as one or more cardiac troponin values above the 99th percentile URL but without a rise and/or fall pattern.
MINS is defined as a rise and/or fall of cardiac biomarkers of presumed ischemic etiology within 30 days of noncardiac surgery that may occur with or without the clinical criteria necessary to fulfill the universal definition of MI (Figure).5-8
EPIDEMIOLOGY AND OUTCOMES
A meta-analysis of 169 studies reported the overall incidence of MINS to be 17.9%; the incidence was 19.6% when systematic troponin screening was done versus 9.9% when troponins were ordered selectively based on the clinical context.5
That meta-analysis found that patients with MINS were more likely to be older, male, undergoing nonelective surgeries, and have hypertension, coronary artery disease (CAD), prior MI, heart failure, or kidney disease.5 Intraoperative hypotension (defined as systolic blood pressure <100 mm Hg or mean arterial pressure <55 mm Hg for up to 5 minutes or <60 mm Hg for 30 minutes or more) and intraoperative tachycardia (defined as heart rate >100 beats per minute) have been associated with MINS.5,9 The relationship between anesthesia type and MINS is uncertain.
MINS is associated with an increased risk of 30-day mortality, nonfatal cardiac arrest, heart failure, and stroke.In the Vascular Events In Noncardiac Surgery Patients Cohort Evaluation (VISION) studies, the majority of patients did not have ischemic symptoms.6,7 In this study, 30-day mortality rates were 8.5% to 13.5% in patients with ischemic symptoms or electrocardiographic changes and 2.9% to 7.7% in patients with asymptomatic troponin elevations. Among the patients without MINS, 30-day mortality was 0.6% to 1.1%. Higher levels of cardiac troponin were associated with higher mortality rates and shorter time to death.
SCREENING GUIDELINES
The recommendations for perioperative screening for MINS vary from society to society. Although MINS is associated with worse outcomes, and most patients with MINS are asymptomatic, perioperative screening for MINS in the absence of clinical signs or symptoms is currently not recommended by the American College of Cardiology/American Heart Association (ACC/AHA).10
ACC/AHA
“The usefulness of postoperative screening with troponin levels in patients at high risk for perioperative MI, but without signs or symptoms suggestive of myocardial ischemia or MI, is uncertain in the absence of established risks and benefits of a defined management strategy (Class IIb; level of evidence [LOE]–B).”10
European Society of Cardiology
“Measurement of B-type natriuretic peptides (BNP) and high-sensitivity troponins (hsTn) after surgery may be considered in high-risk patients to improve risk stratification (Class IIb; LOE-B). Preoperatively and postoperatively, patients who could most benefit from BNP or hsTn measurements are those with metabolic equivalents (METs) ≤4 or those with a revised cardiac risk index (RCRI) score >1 for vascular surgery and >2 for nonvascular surgery. Postoperatively, patients with a surgical Apgar score <7 should also be monitored with BNP or hsTn to detect complications early, independent of their RCRI values.”11
Canadian Cardiovascular Society
“We recommend obtaining daily troponins for 48-72 hours after noncardiac surgery in patients with a baseline risk of >5% for cardiovascular death or nonfatal MI at 30 days after surgery (ie, patients with an elevated N-terminal-proBNP (NT-proBNP)/BNP before surgery or, if there is no NT-proBNP/BNP before surgery, in those who have an RCRI score ≥1, age 45-64 years with significant cardiovascular disease, or age ≥65 years) (Strong recommendation; Moderate quality evidence).”1
MANAGEMENT OF MINS
Currently, evidence-based therapies are well established only for T1MI. However, it is often challenging to differentiate T1MI from other causes of troponin elevation in the perioperative setting in which anesthesia, sedation, or analgesia may mask ischemic symptoms that typically prompt further investigation. While peak troponin levels may be higher in T1MI than they are in T2MI, the initial or delta change in the troponin may provide poor discrimination between T1MI and T2MI.2 Management is complicated not only by the uncertainty about the underlying diagnosis (T1MI, T2MI, or NIMI) but also by the heterogeneity in the underlying pathophysiology of troponin elevation in patients with T2MI and NIMI. Patients with T2MI are generally sicker and have higher mortality than patients with T1MI, and management typically involves treating the underlying reason for oxygen supply/demand mismatch. Mortality in T2MI is more commonly caused by noncardiovascular causes, but underlying CAD is an independent predictor of cardiovascular death or recurrent MI in these patients.
The MANAGE trial (Management of Myocardial Injury After Noncardiac Surgery) had several methodological limitations to inform clinical practice but showed potential benefit of dabigatran in patients with MINS.12 In this trial, patients on dabigatran had significantly lower rates of the primary efficacy outcome (composite of vascular mortality and nonfatal MI, nonhemorrhagic stroke, peripheral arterial thrombosis, amputation, and symptomatic venous thromboembolism) without a significant increase in life-threatening, major, or critical organ bleeding. Of the secondary efficacy outcomes, only nonhemorrhagic stroke was significantly reduced with dabigatran, but the event rate was low. In the subgroup analysis, patients randomized to dabigatran within 5 days of MINS and those meeting the criteria for MI had significantly lower rates of the primary efficacy outcome.
Patients with T2MI with known CAD may benefit from long-term risk reduction strategies for secondary prevention. There are no definitive management strategies in the literature for T2MI with unknown or no CAD. The SWEDEHEART registry (Swedish Web-System for Enhancement and Development of Evidence-Based Care in Heart Disease Evaluated According to Recommended Therapy) enrolled 9,136 patients with MI with nonobstructive coronary arteries (MINOCA).13 Though MINOCA may include T1MI patients, the majority of these patients are classified as T2MI under UDMI 4. Therefore, it has been proposed that data from this registry may inform management on T2MI.14 Data from this registry showed that statins and angiotensin-converting enzyme inhibitors or angiotensin II receptor blockers were associated with lower incidence of MACE over a mean follow-up of 4.1 years. Dual-antiplatelet therapy or beta blockers did not significantly lower the incidence of MACE.13 In another study assessing 2-year mortality in patients with T2MI, beta blockers were beneficial.15
KEY QUESTIONS AND RECOMMENDATIONS
Who should be screened?
Screening can be performed if further risk stratification of high-risk patients or patients with poor functional status is desired. European Society of Cardiology and Canadian Cardiovascular Society guidelines provide guidance on the screening criteria. Troponin elevation in a low-risk group is associated with a low mortality rate, and many of these troponin elevations may be secondary to causes other than myocardial ischemia.
How should screening be conducted?
If planning to obtain postoperative troponins, then preoperative troponin should be obtained because 35% of the patients may have a chronic troponin elevation.
What is the risk if postoperative troponin screening is not performed?
Most patients with MINS are asymptomatic. Systematic screening with troponins (compared with selective screening based on clinical signs or symptoms) can detect T1MI that would otherwise remain occult and undiagnosed.
What is the risk if postoperative troponin screening is performed?
Detecting asymptomatic troponin elevations could lead to potentially harmful treatments (eg, increased risk of bleeding with antithrombotics in the postoperative setting, increased use of cardiac angiography, or addition of new medications such as statins and beta-blockers in the postoperative setting with the potential for adverse effects).
How should MINS be documented?
ST-elevation and non–ST elevation MI (STEMI and NSTEMI) should be reserved for T1MI only. T1MI should be documented when acute plaque rupture is strongly suspected. T2MI should be documented when oxygen supply/demand mismatch is strongly suspected as the etiology of acute MI (eg, T2MI secondary to tachyarrhythmia, hypertensive emergency, or septic shock). Documenting as “demand ischemia” or “unlikely acute coronary syndrome” for T2MI or NIMI should be avoided. Troponin elevations not meeting the criteria for acute MI should be documented as “non-MI troponin elevation” (eg, non-MI troponin elevation secondary to chronic kidney disease or left ventricular hypertrophy). Terms like “troponinitis” or “troponinemia” should be avoided.3
Can MINS be prevented?
There are no well-defined strategies for prevention of MINS, but cardiovascular risk factors should be optimized preoperatively for all patients. In a meta-analysis, preoperative aspirin was not associated with reduced incidence of MINS, and the role of preoperative statins remains speculative; however, nonacute initiation of beta-blockers preoperatively was associated with a lower incidence of MINS.5 Withholding angiotensin-converting enzyme inhibitors or angiotensin II receptor blockers in the 24 hours prior to surgery has been associated with a lower incidence of MINS. Intraoperative hypotension or tachycardia should be avoided.
CONCLUSION
While MINS has been associated with increased 30-day mortality, there are currently no definitive evidence-based management strategies for these patients. Institutions should consider creating decision-support tools if considering screening for MINS based on patient- and surgery-specific risk factors.
Disclosures
The authors have nothing to disclose.
1. Duceppe E, Parlow J, MacDonald P, et al. Canadian Cardiovascular Society guidelines on perioperative cardiac risk assessment and management for patients who undergo noncardiac surgery. Can J Cardiol. 2017;33(1):17-32. https://doi.org/10.1016/j.cjca.2016.09.008.
2. Thygesen K, Alpert JS, Jaffe AS, et al. Fourth universal definition of myocardial infarction. J Am Coll Cardiol. 2018;72(18):2231-2264. https://doi.org/10.1016/j.jacc.2018.08.1038.
3. Goyal A, Gluckman TJ, Levy A, et al. Translating the fourth universal definition of myocardial infarction into clinical documentation: ten pearls for frontline clinicians. Cardiology Magazine. 2018. https://www.acc.org/latest-in-cardiology/articles/2018/11/06/12/42/translating-the-fourth-universal-definition-of-myocardial-infarction-into-clinical-documentation-ten-pearls-for-frontline-clinicians. Accessed February 20, 2020.
4. King CJ, Levy AE, Trost JC. Clinical progress notes: updates from the 4th universal definition of myocardial infarction. J Hosp Med. 2019;14(9):555-557. https://doi.org/10.12788/jhm.3283.
5. Smilowitz NR, Redel-Traub G, Hausvater A, et al. Myocardial injury after noncardiac surgery: a systematic review and meta-analysis. Cardiol Rev. 2019;27(6):267-273. https://doi.org/10.1097/crd.0000000000000254.
6. Botto F, Alonso-Coello P, Chan MT, et al. Myocardial injury after noncardiac surgery: a large, international, prospective cohort study establishing diagnostic criteria, characteristics, predictors, and 30-day outcomes. Anesthesiology. 2014;120(3):564-578. https://doi.org/10.1097/aln.0000000000000113.
7. Writing Committee for the VISION Study Investigators, Devereaux PJ, Biccard BM, et al. Association of postoperative high-sensitivity troponin levels with myocardial injury and 30-day mortality among patients undergoing noncardiac surgery. JAMA. 2017;317(16):1642-1651. https://doi.org/10.1001/jama.2017.4360.
8. Puelacher C, Lurati Buse G, Seeberger D, et al. Perioperative myocardial injury after noncardiac surgery: incidence, mortality, and characterization. Circulation. 2018;137(12):1221-1232. https://doi.org/10.1161/circulationaha.117.030114.
9. Abbott TEF, Pearse RM, Archbold RA, et al. A prospective international multicentre cohort study of intraoperative heart rate and systolic blood pressure and myocardial injury after noncardiac surgery: results of the VISION study. Anesth Analg. 2018;126(6):1936-1945. https://doi.org/10.1213/ane.0000000000002560.
10. Fleisher LA, Fleischmann KE, Auerbach AD, et al. 2014 ACC/AHA guideline on perioperative cardiovascular evaluation and management of patients undergoing noncardiac surgery: a report of the American College of Cardiology/American Heart Association Task Force on practice guidelines. J Am Coll Cardiol. 2014;64(22):e77-e137. https://doi.org/10.1016/j.jacc.2014.07.944.
11. Kristensen SD, Knuuti J, Saraste A, et al. 2014 ESC/ESA Guidelines on non-cardiac surgery: cardiovascular assessment and management: the joint task force on non-cardiac surgery: cardiovascular assessment and management of the European Society of Cardiology (ESC) and the European Society of Anaesthesiology (ESA). Eur Heart J. 2014;35(35):2383-2431. https://doi.org/10.1093/eurheartj/ehu282.
12. Devereaux PJ, Duceppe E, Guyatt G, et al. Dabigatran in patients with myocardial injury after non-cardiac surgery (MANAGE): an international, randomised, placebo-controlled trial. Lancet. 2018;391(10137):2325-2334. https://doi.org/10.1016/s0140-6736(18)30832-8.
13. Lindahl B, Baron T, Erlinge D, et al. Medical therapy for secondary prevention and long-term outcome in patients with myocardial infarction with nonobstructive coronary artery disease. Circulation. 2017;135(16):1481-1489. https://doi.org/10.1161/circulationaha.116.026336.
14. DeFilippis AP, Chapman AR, Mills NL, et al. Assessment and treatment of patients with type 2 myocardial infarction and acute nonischemic myocardial injury. Circulation. 2019;140(20):1661-1678. https://doi.org/10.1161/circulationaha.119.040631.
15. Sandoval Y, Smith SW, Sexter A, et al. Type 1 and 2 myocardial infarction and myocardial injury: clinical transition to high-sensitivity cardiac troponin I. Am J Med. 2017;130(12):1431-1439.e4. https://doi.org/10.1016/j.amjmed.2017.05.049.
© 2020 Society of Hospital Medicine
Surgical Comanagement by Hospitalists: Continued Improvement Over 5 Years
In surgical comanagement (SCM), surgeons and hospitalists share responsibility of care for surgical patients. While SCM has been increasingly utilized, many of the reported models are a modification of the consultation model, in which a group of rotating hospitalists, internists, or geriatricians care for the surgical patients, often after medical complications may have occured.1-4
In August 2012, we implemented SCM in Orthopedic and Neurosurgery services at our institution.5 This model is unique because the same Internal Medicine hospitalists are dedicated year round to the same surgical service. SCM hospitalists see patients on their assigned surgical service only; they do not see patients on the Internal Medicine service. After the first year of implementing SCM, we conducted a propensity score–weighted study with 17,057 discharges in the pre-SCM group (January 2009 to July 2012) and 5,533 discharges in the post-SCM group (September 2012 to September 2013).5 In this study, SCM was associated with a decrease in medical complications, length of stay (LOS), medical consultations, 30-day readmissions, and cost.5
Since SCM requires ongoing investment by institutions, we now report a follow-up study to explore if there were continued improvements in patient outcomes with SCM. In this study, we evaluate if there was a decrease in medical complications, LOS, number of medical consultations, rapid response team calls, and code blues and an increase in patient satisfaction with SCM in Orthopedic and Neurosurgery services between 2012 and 2018.
METHODS
We included 26,380 discharges from Orthopedic and Neurosurgery services between September 1, 2012, and June 30, 2018, at our academic medical center. We excluded patients discharged in August 2012 as we transitioned to the SCM model. Our Institutional Review Board exempted this study from further review.
SCM Structure
SCM structure was detailed in a prior article.5 We have 3.0 clinical full-time equivalents on the Orthopedic surgery SCM service and 1.2 on the Neurosurgery SCM service. On weekdays, during the day (8
During the day, SCM hospitalists receive the first call for medical issues. After 5
SCM hospitalists screen the entire patient list on their assigned surgery service each day. After screening the patient list, SCM hospitalists formally see select patients with preventable or active medical conditions and write notes on the patient’s chart. There are no set criteria to determine which patients would be seen by SCM. This is because surgeries can decompensate stable medical conditions or new unexpected medical complications may occur. Additionally, in our prior study, we reported that SCM reduced medical complications and LOS regardless of age or patient acuity.5
Outcomes
Our primary outcome was proportion of patients with ≥1 medical complication (sepsis, pneumonia, urinary tract infection, delirium, acute kidney injury, atrial fibrillation, or ileus). Our secondary outcomes included mean LOS, proportion of patients with ≥2 medical consultations, rapid response team calls, code blues, and top-box patient satisfaction score. Though cost is an important consideration in implementing SCM, limited financial data were available. However, since LOS is a key component in calculating direct costs,6 we estimated the cost savings per discharge using mean direct cost per day and the difference in mean LOS between pre- and post-SCM groups.5
We defined medical complications using International Classification of Disease (ICD) Codes 9 or 10 that were coded as “not present on admission” (Appendix 1). We used Hospital Consumer Assessment of Healthcare Providers and Systems (HCAHPS) survey for three questions for patient satisfaction: Did doctors treat with courtesy and respect, listen carefully, and explain things in a way you could understand?
Statistical Analysis
We used regression analysis to assess trends in patient characteristics by year (Appendix 2). Logistic regression with logit link was used to assess the yearly change in our binary outcomes (proportion of patients with ≥1 medical complication, those with ≥2 medical consultations, rapid response team calls, code blue, and top-box patient satisfaction score) and reported odds ratios. Gamma regression with identity link was performed for our continuous outcome (LOS). Beta coefficient was reported to estimate the yearly change in LOS under their original scales. Age, primary insurance, race, Charlson comorbidity score, general or regional anesthesia, surgical service, and duration of surgery were adjusted in the regression analyses for outcomes. SAS 9.4 was used for analysis.
RESULTS
Patient characteristics are shown in Table 1. Overall, 62.8% patients were discharged from Orthopedic surgery service, 72.5% patients underwent elective surgery, and 88.8% received general anesthesia. Between 2012 and 2018, there was a significant increase in the median age of patients (from 60 years to 63 years), mean Charlson comorbidity score increased from 1.07 to 1.46, and median case mix index, a measure of patient acuity, increased from 2.10 to 2.36 (Appendix 2).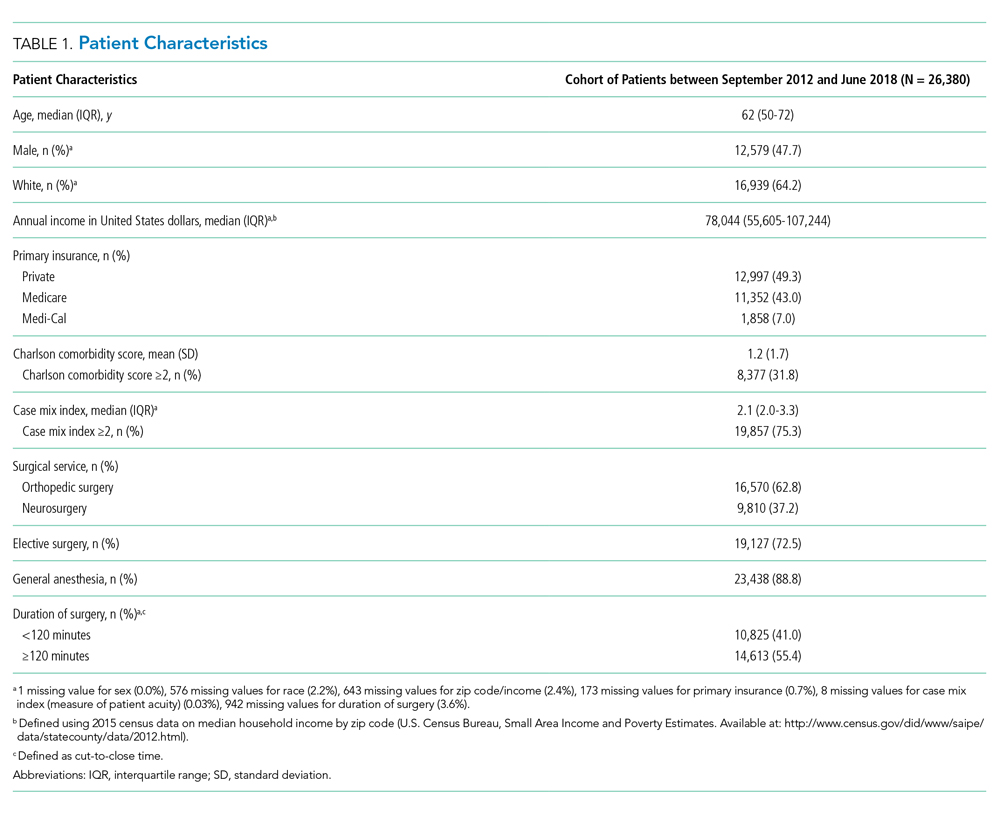
Comparing pre-SCM unadjusted rates reported in our prior study (January 2009 to July 2012) to post-SCM (September 2012 to June 2018; Appendix 3), patients with ≥1 medical complication decreased from 10.1% to 6.1%, LOS (mean ± standard deviation) changed from 5.4 ± 2.2 days to 4.6 ± 5.8 days, patients with ≥2 medical consultations decreased from 19.4% to 9.2%, rapid response team calls changed from 1% to 0.9%, code blues changed from 0.3% to 0.2%, and patients with top-box patient satisfaction score increased from 86.4% to 94.2%.5
In the adjusted analysis from 2012 to 2018, the odds of patients with ≥1 medical complication decreased by 3.8% per year (P = .01), estimated LOS decreased by 0.3 days per year (P < .0001), and the odds of rapid response team calls decreased by 12.2% per year (P = .001; Table 2). Changes over time in the odds of patients with ≥2 medical consultations, code blues, or top-box patient satisfaction score were not statistically significant (Table 2). Based on the LOS reduction pre- to post-SCM, there were estimated average direct cost savings of $3,424 per discharge between 2012 and 2018.
DISCUSSION
Since the implementation of SCM on Orthopedic and Neurosurgery services at our institution, there was a decrease in medical complications, LOS, and rapid response team calls. To our knowledge, this is one of the largest studies evaluating the benefits of SCM over 5.8 years. Similar to our prior studies on this SCM model of care,5,7 other studies have reported a decrease in medical complications,8-10 LOS,11-13 and cost of care14 with SCM.
While the changes in the unadjusted rates of outcomes over the years appeared to be small, while our patient population became older and sicker, there were significant changes in several of our outcomes in the adjusted analysis. We believe that SCM hospitalists have developed a skill set and understanding of these surgical patients over time and can manage more medically complex patients without an increase in medical complications or LOS. We attribute this to our unique SCM model in which the same hospitalists stay year round on the same surgical service. SCM hospitalists have built trusting relationships with the surgical team with greater involvement in decision making, care planning, and patient selection. With minimal turnover in the SCM group and with ongoing learning, SCM hospitalists can anticipate fluid or pain medication requirements after specific surgeries and the surgery-specific medical complications. SCM hospitalists are available on the patient units to provide timely intervention in case of medical deterioration; answer any questions from patients, families, or nursing while the surgical teams may be in the operating room; and coordinate with other medical consultants or outpatient providers as needed.
This study has several limitations. This is a single-center study at an academic institution, limited to two surgical services. We did not have a control group and multiple hospital-wide interventions may have affected these outcomes. This is an observational study in which unobserved variables may bias the results. We used ICD codes to identify medical complications, which relies on the quality of physician documentation. While our response rate of 21.1% for HCAHPS was comparable to the national average of 26.7%, it may not reliably represent our patient population.15 Lastly, we had limited financial data.
CONCLUSION
With the move toward value-based payment and increasing medical complexity of surgical patients, SCM by hospitalists may deliver high-quality care.
1. Auerbach AD, Wachter RM, Cheng HQ, et al. Comanagement of surgical patients between neurosurgeons and hospitalists. Arch Intern Med. 2010;170(22):2004-2010. https://doi.org/10.1001/archinternmed.2010.432
2. Ruiz ME, Merino RÁ, Rodríguez R, Sánchez GM, Alonso A, Barbero M. Effect of comanagement with internal medicine on hospital stay of patients admitted to the service of otolaryngology. Acta Otorrinolaringol Esp. 2015;66(5):264-268. https://doi.org/10.1016/j.otorri.2014.09.010.
3. Tadros RO, Faries PL, Malik R, et al. The effect of a hospitalist comanagement service on vascular surgery inpatients. J Vasc Surg. 2015;61(6):1550-1555. https://doi.org/10.1016/j.jvs.2015.01.006
4. Gregersen M, Mørch MM, Hougaard K, Damsgaard EM. Geriatric intervention in elderly patients with hip fracture in an orthopedic ward. J Inj Violence Res. 2012;4(2):45-51. https://doi.org/10.5249/jivr.v4i2.96
5. Rohatgi N, Loftus P, Grujic O, Cullen M, Hopkins J, Ahuja N. Surgical comanagement by hospitalists improves patient outcomes: A propensity score analysis. Ann Surg. 2016;264(2):275-282. https://doi.org/10.1097/SLA.0000000000001629
6. Polverejan E, Gardiner JC, Bradley CJ, Holmes-Rovner M, Rovner D. Estimating mean hospital cost as a function of length of stay and patient characteristics. Health Econ. 2003;12(11):935-947. https://doi.org/10.1002/hec.774
7. Rohatgi N, Wei PH, Grujic O, Ahuja N. Surgical Comanagement by hospitalists in colorectal surgery. J Am Coll Surg. 2018;227(4):404-410. https://doi.org/10.1016/j.jamcollsurg.2018.06.011
8. Huddleston JM, Long KH, Naessens JM, et al. Medical and surgical comanagement after elective hip and knee arthroplasty: A randomized, controlled trial. Ann Intern Med. 2004;141(1):28-38. https://doi.org/10.7326/0003-4819-141-1-200407060-00012.
9. Swart E, Vasudeva E, Makhni EC, Macaulay W, Bozic KJ. Dedicated perioperative hip fracture comanagement programs are cost-effective in high-volume centers: An economic analysis. Clin Orthop Relat Res. 2016;474(1):222-233. https://doi.org/10.1007/s11999-015-4494-4.
10. Iberti CT, Briones A, Gabriel E, Dunn AS. Hospitalist-vascular surgery comanagement: Effects on complications and mortality. Hosp Pract. 2016;44(5):233-236. https://doi.org/10.1080/21548331.2016.1259543.
11. Kammerlander C, Roth T, Friedman SM, et al. Ortho-geriatric service--A literature review comparing different models. Osteoporos Int. 2010;21(Suppl 4):S637-S646. https://doi.org/10.1007/s00198-010-1396-x.
12. Bracey DN, Kiymaz TC, Holst DC, et al. An orthopedic-hospitalist comanaged hip fracture service reduces inpatient length of stay. Geriatr Orthop Surg Rehabil. 2016;7(4):171-177. https://doi.org/10.1177/2151458516661383.
13. Duplantier NL, Briski DC, Luce LT, Meyer MS, Ochsner JL, Chimento GF. The effects of a hospitalist comanagement model for joint arthroplasty patients in a teaching facility. J Arthroplasty. 2016;31(3):567-572. https://doi.org/10.1016/j.arth.2015.10.010.
14. Roy A, Heckman MG, Roy V. Associations between the hospitalist model of care and quality-of-care-related outcomes in patients undergoing hip fracture surgery. Mayo Clin Proc. 2006;81(1):28-31. https://doi.org/10.4065/81.1.28.
15. Godden E, Paseka A, Gnida J, Inguanzo J. The impact of response rate on Hospital Consumer Assessment of Healthcare Providers and System (HCAHPS) dimension scores. Patient Exp J. 2019;6(1):105-114. https://doi.org/10.35680/2372-0247.1357.
In surgical comanagement (SCM), surgeons and hospitalists share responsibility of care for surgical patients. While SCM has been increasingly utilized, many of the reported models are a modification of the consultation model, in which a group of rotating hospitalists, internists, or geriatricians care for the surgical patients, often after medical complications may have occured.1-4
In August 2012, we implemented SCM in Orthopedic and Neurosurgery services at our institution.5 This model is unique because the same Internal Medicine hospitalists are dedicated year round to the same surgical service. SCM hospitalists see patients on their assigned surgical service only; they do not see patients on the Internal Medicine service. After the first year of implementing SCM, we conducted a propensity score–weighted study with 17,057 discharges in the pre-SCM group (January 2009 to July 2012) and 5,533 discharges in the post-SCM group (September 2012 to September 2013).5 In this study, SCM was associated with a decrease in medical complications, length of stay (LOS), medical consultations, 30-day readmissions, and cost.5
Since SCM requires ongoing investment by institutions, we now report a follow-up study to explore if there were continued improvements in patient outcomes with SCM. In this study, we evaluate if there was a decrease in medical complications, LOS, number of medical consultations, rapid response team calls, and code blues and an increase in patient satisfaction with SCM in Orthopedic and Neurosurgery services between 2012 and 2018.
METHODS
We included 26,380 discharges from Orthopedic and Neurosurgery services between September 1, 2012, and June 30, 2018, at our academic medical center. We excluded patients discharged in August 2012 as we transitioned to the SCM model. Our Institutional Review Board exempted this study from further review.
SCM Structure
SCM structure was detailed in a prior article.5 We have 3.0 clinical full-time equivalents on the Orthopedic surgery SCM service and 1.2 on the Neurosurgery SCM service. On weekdays, during the day (8
During the day, SCM hospitalists receive the first call for medical issues. After 5
SCM hospitalists screen the entire patient list on their assigned surgery service each day. After screening the patient list, SCM hospitalists formally see select patients with preventable or active medical conditions and write notes on the patient’s chart. There are no set criteria to determine which patients would be seen by SCM. This is because surgeries can decompensate stable medical conditions or new unexpected medical complications may occur. Additionally, in our prior study, we reported that SCM reduced medical complications and LOS regardless of age or patient acuity.5
Outcomes
Our primary outcome was proportion of patients with ≥1 medical complication (sepsis, pneumonia, urinary tract infection, delirium, acute kidney injury, atrial fibrillation, or ileus). Our secondary outcomes included mean LOS, proportion of patients with ≥2 medical consultations, rapid response team calls, code blues, and top-box patient satisfaction score. Though cost is an important consideration in implementing SCM, limited financial data were available. However, since LOS is a key component in calculating direct costs,6 we estimated the cost savings per discharge using mean direct cost per day and the difference in mean LOS between pre- and post-SCM groups.5
We defined medical complications using International Classification of Disease (ICD) Codes 9 or 10 that were coded as “not present on admission” (Appendix 1). We used Hospital Consumer Assessment of Healthcare Providers and Systems (HCAHPS) survey for three questions for patient satisfaction: Did doctors treat with courtesy and respect, listen carefully, and explain things in a way you could understand?
Statistical Analysis
We used regression analysis to assess trends in patient characteristics by year (Appendix 2). Logistic regression with logit link was used to assess the yearly change in our binary outcomes (proportion of patients with ≥1 medical complication, those with ≥2 medical consultations, rapid response team calls, code blue, and top-box patient satisfaction score) and reported odds ratios. Gamma regression with identity link was performed for our continuous outcome (LOS). Beta coefficient was reported to estimate the yearly change in LOS under their original scales. Age, primary insurance, race, Charlson comorbidity score, general or regional anesthesia, surgical service, and duration of surgery were adjusted in the regression analyses for outcomes. SAS 9.4 was used for analysis.
RESULTS
Patient characteristics are shown in Table 1. Overall, 62.8% patients were discharged from Orthopedic surgery service, 72.5% patients underwent elective surgery, and 88.8% received general anesthesia. Between 2012 and 2018, there was a significant increase in the median age of patients (from 60 years to 63 years), mean Charlson comorbidity score increased from 1.07 to 1.46, and median case mix index, a measure of patient acuity, increased from 2.10 to 2.36 (Appendix 2).
Comparing pre-SCM unadjusted rates reported in our prior study (January 2009 to July 2012) to post-SCM (September 2012 to June 2018; Appendix 3), patients with ≥1 medical complication decreased from 10.1% to 6.1%, LOS (mean ± standard deviation) changed from 5.4 ± 2.2 days to 4.6 ± 5.8 days, patients with ≥2 medical consultations decreased from 19.4% to 9.2%, rapid response team calls changed from 1% to 0.9%, code blues changed from 0.3% to 0.2%, and patients with top-box patient satisfaction score increased from 86.4% to 94.2%.5
In the adjusted analysis from 2012 to 2018, the odds of patients with ≥1 medical complication decreased by 3.8% per year (P = .01), estimated LOS decreased by 0.3 days per year (P < .0001), and the odds of rapid response team calls decreased by 12.2% per year (P = .001; Table 2). Changes over time in the odds of patients with ≥2 medical consultations, code blues, or top-box patient satisfaction score were not statistically significant (Table 2). Based on the LOS reduction pre- to post-SCM, there were estimated average direct cost savings of $3,424 per discharge between 2012 and 2018.
DISCUSSION
Since the implementation of SCM on Orthopedic and Neurosurgery services at our institution, there was a decrease in medical complications, LOS, and rapid response team calls. To our knowledge, this is one of the largest studies evaluating the benefits of SCM over 5.8 years. Similar to our prior studies on this SCM model of care,5,7 other studies have reported a decrease in medical complications,8-10 LOS,11-13 and cost of care14 with SCM.
While the changes in the unadjusted rates of outcomes over the years appeared to be small, while our patient population became older and sicker, there were significant changes in several of our outcomes in the adjusted analysis. We believe that SCM hospitalists have developed a skill set and understanding of these surgical patients over time and can manage more medically complex patients without an increase in medical complications or LOS. We attribute this to our unique SCM model in which the same hospitalists stay year round on the same surgical service. SCM hospitalists have built trusting relationships with the surgical team with greater involvement in decision making, care planning, and patient selection. With minimal turnover in the SCM group and with ongoing learning, SCM hospitalists can anticipate fluid or pain medication requirements after specific surgeries and the surgery-specific medical complications. SCM hospitalists are available on the patient units to provide timely intervention in case of medical deterioration; answer any questions from patients, families, or nursing while the surgical teams may be in the operating room; and coordinate with other medical consultants or outpatient providers as needed.
This study has several limitations. This is a single-center study at an academic institution, limited to two surgical services. We did not have a control group and multiple hospital-wide interventions may have affected these outcomes. This is an observational study in which unobserved variables may bias the results. We used ICD codes to identify medical complications, which relies on the quality of physician documentation. While our response rate of 21.1% for HCAHPS was comparable to the national average of 26.7%, it may not reliably represent our patient population.15 Lastly, we had limited financial data.
CONCLUSION
With the move toward value-based payment and increasing medical complexity of surgical patients, SCM by hospitalists may deliver high-quality care.
1. Auerbach AD, Wachter RM, Cheng HQ, et al. Comanagement of surgical patients between neurosurgeons and hospitalists. Arch Intern Med. 2010;170(22):2004-2010. https://doi.org/10.1001/archinternmed.2010.432
2. Ruiz ME, Merino RÁ, Rodríguez R, Sánchez GM, Alonso A, Barbero M. Effect of comanagement with internal medicine on hospital stay of patients admitted to the service of otolaryngology. Acta Otorrinolaringol Esp. 2015;66(5):264-268. https://doi.org/10.1016/j.otorri.2014.09.010.
3. Tadros RO, Faries PL, Malik R, et al. The effect of a hospitalist comanagement service on vascular surgery inpatients. J Vasc Surg. 2015;61(6):1550-1555. https://doi.org/10.1016/j.jvs.2015.01.006
4. Gregersen M, Mørch MM, Hougaard K, Damsgaard EM. Geriatric intervention in elderly patients with hip fracture in an orthopedic ward. J Inj Violence Res. 2012;4(2):45-51. https://doi.org/10.5249/jivr.v4i2.96
5. Rohatgi N, Loftus P, Grujic O, Cullen M, Hopkins J, Ahuja N. Surgical comanagement by hospitalists improves patient outcomes: A propensity score analysis. Ann Surg. 2016;264(2):275-282. https://doi.org/10.1097/SLA.0000000000001629
6. Polverejan E, Gardiner JC, Bradley CJ, Holmes-Rovner M, Rovner D. Estimating mean hospital cost as a function of length of stay and patient characteristics. Health Econ. 2003;12(11):935-947. https://doi.org/10.1002/hec.774
7. Rohatgi N, Wei PH, Grujic O, Ahuja N. Surgical Comanagement by hospitalists in colorectal surgery. J Am Coll Surg. 2018;227(4):404-410. https://doi.org/10.1016/j.jamcollsurg.2018.06.011
8. Huddleston JM, Long KH, Naessens JM, et al. Medical and surgical comanagement after elective hip and knee arthroplasty: A randomized, controlled trial. Ann Intern Med. 2004;141(1):28-38. https://doi.org/10.7326/0003-4819-141-1-200407060-00012.
9. Swart E, Vasudeva E, Makhni EC, Macaulay W, Bozic KJ. Dedicated perioperative hip fracture comanagement programs are cost-effective in high-volume centers: An economic analysis. Clin Orthop Relat Res. 2016;474(1):222-233. https://doi.org/10.1007/s11999-015-4494-4.
10. Iberti CT, Briones A, Gabriel E, Dunn AS. Hospitalist-vascular surgery comanagement: Effects on complications and mortality. Hosp Pract. 2016;44(5):233-236. https://doi.org/10.1080/21548331.2016.1259543.
11. Kammerlander C, Roth T, Friedman SM, et al. Ortho-geriatric service--A literature review comparing different models. Osteoporos Int. 2010;21(Suppl 4):S637-S646. https://doi.org/10.1007/s00198-010-1396-x.
12. Bracey DN, Kiymaz TC, Holst DC, et al. An orthopedic-hospitalist comanaged hip fracture service reduces inpatient length of stay. Geriatr Orthop Surg Rehabil. 2016;7(4):171-177. https://doi.org/10.1177/2151458516661383.
13. Duplantier NL, Briski DC, Luce LT, Meyer MS, Ochsner JL, Chimento GF. The effects of a hospitalist comanagement model for joint arthroplasty patients in a teaching facility. J Arthroplasty. 2016;31(3):567-572. https://doi.org/10.1016/j.arth.2015.10.010.
14. Roy A, Heckman MG, Roy V. Associations between the hospitalist model of care and quality-of-care-related outcomes in patients undergoing hip fracture surgery. Mayo Clin Proc. 2006;81(1):28-31. https://doi.org/10.4065/81.1.28.
15. Godden E, Paseka A, Gnida J, Inguanzo J. The impact of response rate on Hospital Consumer Assessment of Healthcare Providers and System (HCAHPS) dimension scores. Patient Exp J. 2019;6(1):105-114. https://doi.org/10.35680/2372-0247.1357.
© 2020 Society of Hospital Medicine
Lean-Based Redesign of Multidisciplinary Rounds on General Medicine Service
Given that multiple disciplines are often involved in caring for patients admitted to the hospital, timely communication, collaboration, and coordination amongst various disciplines is necessary for safe and effective patient care.1 With the focus on improving patient satisfaction and throughput in hospitals, it is also important to make more accurate predictions of the discharge date and allow time for patients and their families to prepare for discharge.2-4
Multidisciplinary rounds (MDR) are defined as structured daily communication amongst key members of the patient’s care team (eg, nurses, physicians, case managers, social workers, pharmacists, and rehabilitation services). MDR have shown to be a useful strategy for ensuring that all members of the care team are updated on the plan of care for the patient.5 During MDR, a brief “check-in” discussing the patient’s plan of care, pending needs, and barriers to discharge allows all team members, patients, and families to effectively coordinate care and plan and prepare for discharge.
Multiple studies have reported increased collaboration and improved communication between disciplines with the use of such multidisciplinary rounding.2,5-7 Additionally, MDR have been shown to improve patient outcomes8 and reduce adverse events,9 length of stay (LOS),6,8 cost of care,8 and readmissions.1
We redesigned MDR on the general medicine wards at our institution in October 2014 by using Lean management techniques. Lean is defined as a set of philosophies and methods that aim to create transformation in thinking, behavior, and culture in each process, with the goal of maximizing the value for the patients and providers, adding efficiency, and reducing waste and waits.10
In this study, we evaluate whether this new model of MDR was associated with a decrease in the LOS. We also evaluate whether this new model of MDR was associated with an increase in discharges before noon, documentation of estimated discharge date (EDD) in our electronic health record (EHR), and patient satisfaction.
METHODS
Setting, Design, and Patients
The study was conducted on the teaching general medicine service at our institution, an urban, 484-bed academic hospital. The general medicine service has patients on 4 inpatient units (total of 95 beds) and is managed by 5 teaching service teams.
We performed a pre-post study. The preperiod (in which the old model of MDR was followed) included 4000 patients discharged between September 1, 2013, and October 22, 2014. The postperiod (in which the new model of MDR was followed) included 2085 patients discharged between October 23, 2014, and April 30, 2015. We excluded 139 patients that died in the hospital prior to discharge and patients on the nonteaching and/or private practice service.
All data were provided by our institution’s Digital Solutions Department. Our institutional review board issued a letter of determination exempting this study from further review because it was deemed to be a quality improvement initiative.
Use of Lean Management to Redesign our MDR
Our institution has incorporated the Lean management system to continually add value to services through the elimination of waste, thus simultaneously optimizing the quality of patient care, cost, and patient satisfaction.11 Lean, derived from the Toyota Production System, has long been used in manufacturing and in recent decades has spread to healthcare.12 We leveraged the following 3 key Lean techniques to redesign our MDR: (1) value stream management (VSM), (2) rapid process improvement workshops (RPIW), and (3) active daily management (ADM), as detailed in supplementary Appendix 1.
Interventions
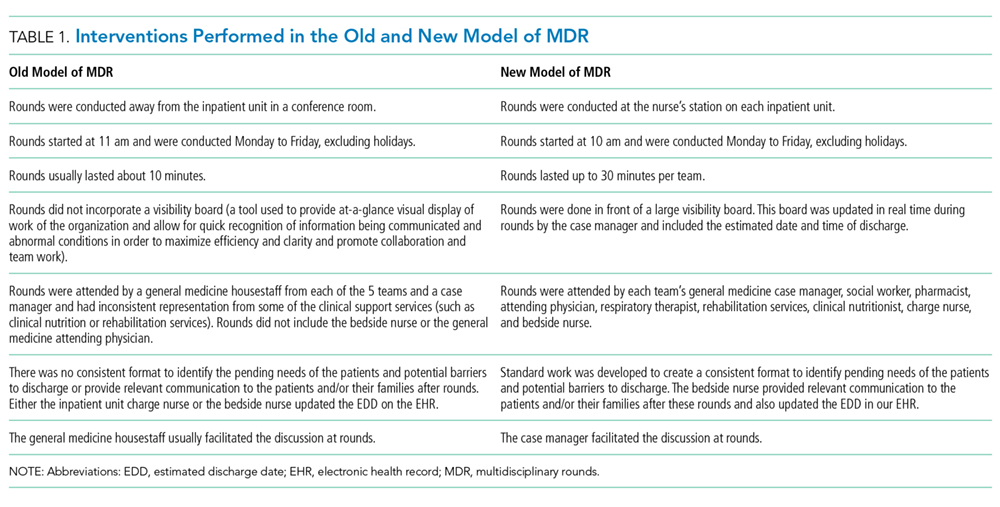
Outcomes
The primary outcome was mean LOS. The secondary outcomes were (1) discharges before noon, (2) recording of the EDD in our EHR within 24 hours of admission (as time stamped on our EHR), and (3) patient satisfaction.
Data for patient satisfaction were obtained using the Press Ganey survey. We used data on patient satisfaction scores for the following 2 relevant questions on this survey: (1) extent to which the patient felt ready to be discharged and (2) how well staff worked together to care for the patient. Proportions of the “top-box” (“very good”) were used for the analysis. These survey data were available on 467 patients (11.7%) in the preperiod and 188 patients (9.0%) in the postperiod.
Data Analysis
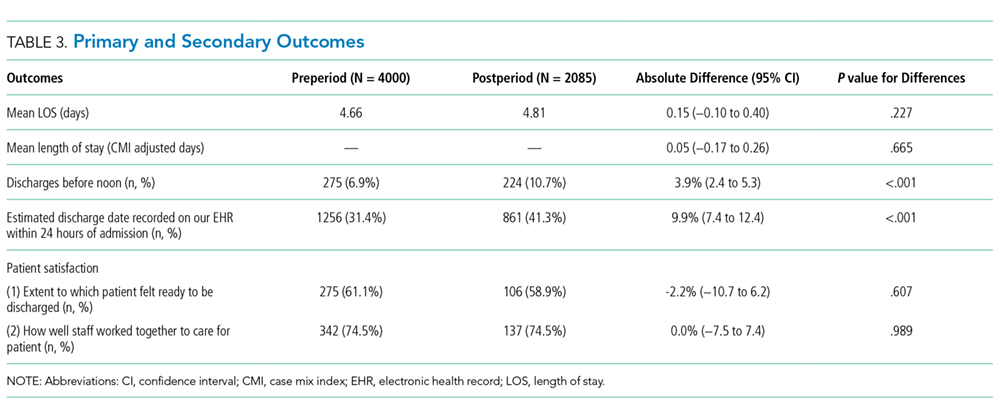
A sensitivity analysis was conducted on a second cohort that included a subset of patients from the preperiod between November 1, 2013, and April 30, 2014, and a subset of patients from the postperiod between November 1, 2014, and April 1, 2015, to control for the calendar period (supplementary Appendix 2).
All analyses were conducted in R version 3.3.0, with the linear mixed-effects model lme4 statistical package.13,14
RESULTS
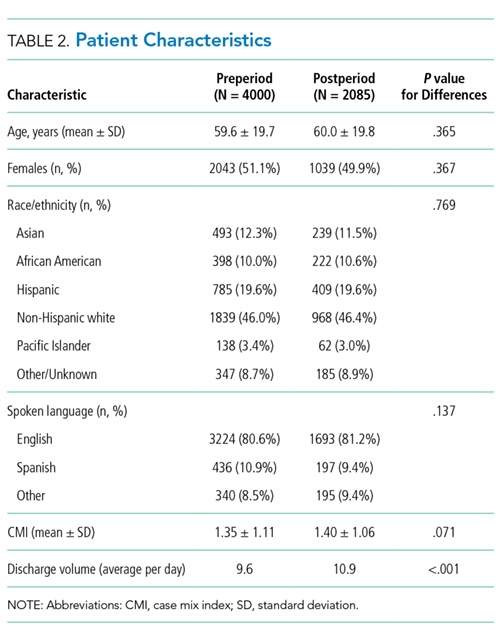
Table 3 shows the differences in the outcomes between the pre- and postperiods. There was no change in the LOS or LOS adjusted for CMI. There was a 3.9% increase in discharges before noon in the postperiod compared with the preperiod (95% CI, 2.4% to 5.3%; P < .001). There was a 9.9% increase in the percentage of patients for whom the EDD was recorded in our EHR within 24 hours of admission (95% CI, 7.4% to 12.4%; P < .001). There was no change in the “top-box” patient satisfaction scores.
There were only marginal differences in the results between the entire cohort and a second subset cohort used for sensitivity analysis (supplementary Appendix 2).
DISCUSSION
In our study, there was no change in the mean LOS with the new model of MDR. There was an increase in discharges before noon and in recording of the EDD in our EHR within 24 hours of admission in the postperiod when the Lean-based new model of MDR was utilized. There was no change in patient satisfaction. With no change in staffing, we were able to accommodate the increase in the discharge volume in the postperiod.
We believe our results are attributable to several factors, including clearly defined roles and responsibilities for all participants of MDR, the inclusion of more experienced general medicine attending physician (compared with housestaff), Lean management techniques to identify gaps in the patient’s journey from emergency department to discharge using VSM, the development of appropriate workflows and standard work on how the multidisciplinary teams would work together at RPIWs, and ADM to ensure sustainability and engagement among frontline members and institutional leaders. In order to sustain this, we planned to continue monitoring data in daily, weekly, and monthly forums with senior physician and administrative leaders. Planning for additional interventions is underway, including moving MDR to the bedside, instituting an afternoon “check-in” that would enable more detailed action planning, and addressing barriers in a timely manner for patients ready to discharge the following day.
Our study has a few limitations. First, this is an observational study that cannot determine causation. Second, this is a single-center study conducted on patients only on the general medicine teaching service. Third, there were several concurrent interventions implemented at our institution to improve LOS, throughput, and patient satisfaction in addition to MDR, thus making it difficult to isolate the impact of our intervention. Fourth, in the new model of MDR, rounds took place only 5 days per week, thereby possibly limiting the potential impact on our outcomes. Fifth, while we showed improvements in the discharges before noon and recording of EDD in the post period, we were not able to achieve our target of 25% discharges before noon or 100% recording of EDD in this time period. We believe the limited amount of time between the pre- and postperiods to allow for adoption and learning of the processes might have contributed to the underestimation of the impact of the new model of MDR, thereby limiting our ability to achieve our targets. Sixth, the response rate on the Press Ganey survey was low, and we did not directly survey patients or families for their satisfaction with MDR.
Our study has several strengths. To our knowledge, this is the first study to embed Lean management techniques in the design of MDR in the inpatient setting. While several studies have demonstrated improvements in discharges before noon through the implementation of MDR, they have not incorporated Lean management techniques, which we believe are critical to ensure the sustainability of results.1,3,5,6,8,15 Second, while it was not measured, there was a high level of provider engagement in the process in the new model of MDR. Third, because the MDR were conducted at the nurse’s station on each inpatient unit in the new model instead of in a conference room, it was well attended by all members of the multidisciplinary team. Fourth, the presence of a visibility board allowed for all team members to have easy access to visual feedback throughout the day, even if they were not present at the MDR. Fifth, we believe that there was also more accurate estimation of the date and time of discharge in the new model of MDR because the discussion was facilitated by the case manager, who is experienced in identifying barriers to discharge (compared with the housestaff in the old model of MDR), and included the more experienced attending physician. Finally, the consistent presence of a multidisciplinary team at MDR allowed for the incorporation of everyone’s concerns at one time, thereby limiting the need for paging multiple disciplines throughout the day, which led to quicker resolution of issues and assignment of pending tasks.
In conclusion, our study shows no change in the mean LOS when the Lean-based model of MDR was utilized. Our study demonstrates an increase in discharges before noon and in recording of EDD on our EHR within 24 hours of admission in the post period when the Lean-based model of MDR was utilized. There was no change in patient satisfaction. While this study was conducted at an academic medical center on the general medicine wards, we believe our new model of MDR, which leveraged Lean management techniques, may successfully impact patient flow in all inpatient clinical services and nonteaching hospitals.
Disclosure
The authors report no financial conflicts of interest and have nothing to disclose.
1. Townsend-Gervis M, Cornell P, Vardaman JM. Interdisciplinary Rounds and Structured Communication Reduce Re-Admissions and Improve Some Patient Outcomes. West J Nurs Res. 2014;36(7):917-928. PubMed
2. Vazirani S, Hays RD, Shapiro MF, Cowan M. Effect of a multidisciplinary intervention on communication and collaboration among physicians and nurses. Am J Crit Care. 2005;14(1):71-77. PubMed
3. Wertheimer B, Jacobs RE, Bailey M, et al. Discharge before noon: an achievable hospital goal. J Hosp Med. 2014;9(4):210-214. PubMed
4. Wertheimer B, Jacobs RE, Iturrate E, Bailey M, Hochman K. Discharge before noon: Effect on throughput and sustainability. J Hosp Med. 2015;10(10):664-669. PubMed
5. Halm MA, Gagner S, Goering M, Sabo J, Smith M, Zaccagnini M. Interdisciplinary rounds: impact on patients, families, and staff. Clin Nurse Spec. 2003;17(3):133-142. PubMed
6. O’Mahony S, Mazur E, Charney P, Wang Y, Fine J. Use of multidisciplinary rounds to simultaneously improve quality outcomes, enhance resident education, and shorten length of stay. J Gen Intern Med. 2007;22(8):1073-1079. PubMed
7. Reimer N, Herbener L. Round and round we go: rounding strategies to impact exemplary professional practice. Clin J Oncol Nurs. 2014;18(6):654-660. PubMed
8. Curley C, McEachern JE, Speroff T. A firm trial of interdisciplinary rounds on the inpatient medical wards: an intervention designed using continuous quality improvement. Med Care. 1998;36(8 Suppl):AS4-AS12. PubMed
9. Baggs JG, Ryan SA, Phelps CE, Richeson JF, Johnson JE. The association between interdisciplinary collaboration and patient outcomes in a medical intensive care unit. Heart Lung. 1992;21(1):18-24. PubMed
10. Lawal AK, Rotter T, Kinsman L, et al. Lean management in health care: definition, concepts, methodology and effects reported (systematic review protocol). Syst Rev. 2014;3:103. PubMed
11. Liker JK. Toyota Way: 14 Management Principles from the World’s Greatest Manufacturer. New York, Chicago, San Francisco, Athens, London, Madrid, Mexico City, Milan, New Delhi, Singapore, Sydney, Toronto: McGraw-Hill Education; 2004.
12. Kane M, Chui K, Rimicci J, et al. Lean Manufacturing Improves Emergency Department Throughput and Patient Satisfaction. J Nurs Adm. 2015;45(9):429-434. PubMed
13. R Core Team. R: A language and environment for statistical computing. R Foundation for Statistical Computing, Vienna, Austria. 2016. http://www.R-project.org/. Accessed November 7, 2017.
14. Bates D, Mächler M, Bolker B, Walker S. Fitting Linear Mixed-Effects Models Using lme4. J Stat Softw. 2015;67(1):1-48.
15. O’Leary KJ, Buck R, Fligiel HM, et al. Structured interdisciplinary rounds in a medical teaching unit: improving patient safety. Arch Intern Med. 2011;171(7):678-684. PubMed
Given that multiple disciplines are often involved in caring for patients admitted to the hospital, timely communication, collaboration, and coordination amongst various disciplines is necessary for safe and effective patient care.1 With the focus on improving patient satisfaction and throughput in hospitals, it is also important to make more accurate predictions of the discharge date and allow time for patients and their families to prepare for discharge.2-4
Multidisciplinary rounds (MDR) are defined as structured daily communication amongst key members of the patient’s care team (eg, nurses, physicians, case managers, social workers, pharmacists, and rehabilitation services). MDR have shown to be a useful strategy for ensuring that all members of the care team are updated on the plan of care for the patient.5 During MDR, a brief “check-in” discussing the patient’s plan of care, pending needs, and barriers to discharge allows all team members, patients, and families to effectively coordinate care and plan and prepare for discharge.
Multiple studies have reported increased collaboration and improved communication between disciplines with the use of such multidisciplinary rounding.2,5-7 Additionally, MDR have been shown to improve patient outcomes8 and reduce adverse events,9 length of stay (LOS),6,8 cost of care,8 and readmissions.1
We redesigned MDR on the general medicine wards at our institution in October 2014 by using Lean management techniques. Lean is defined as a set of philosophies and methods that aim to create transformation in thinking, behavior, and culture in each process, with the goal of maximizing the value for the patients and providers, adding efficiency, and reducing waste and waits.10
In this study, we evaluate whether this new model of MDR was associated with a decrease in the LOS. We also evaluate whether this new model of MDR was associated with an increase in discharges before noon, documentation of estimated discharge date (EDD) in our electronic health record (EHR), and patient satisfaction.
METHODS
Setting, Design, and Patients
The study was conducted on the teaching general medicine service at our institution, an urban, 484-bed academic hospital. The general medicine service has patients on 4 inpatient units (total of 95 beds) and is managed by 5 teaching service teams.
We performed a pre-post study. The preperiod (in which the old model of MDR was followed) included 4000 patients discharged between September 1, 2013, and October 22, 2014. The postperiod (in which the new model of MDR was followed) included 2085 patients discharged between October 23, 2014, and April 30, 2015. We excluded 139 patients that died in the hospital prior to discharge and patients on the nonteaching and/or private practice service.
All data were provided by our institution’s Digital Solutions Department. Our institutional review board issued a letter of determination exempting this study from further review because it was deemed to be a quality improvement initiative.
Use of Lean Management to Redesign our MDR
Our institution has incorporated the Lean management system to continually add value to services through the elimination of waste, thus simultaneously optimizing the quality of patient care, cost, and patient satisfaction.11 Lean, derived from the Toyota Production System, has long been used in manufacturing and in recent decades has spread to healthcare.12 We leveraged the following 3 key Lean techniques to redesign our MDR: (1) value stream management (VSM), (2) rapid process improvement workshops (RPIW), and (3) active daily management (ADM), as detailed in supplementary Appendix 1.
Interventions
Outcomes
The primary outcome was mean LOS. The secondary outcomes were (1) discharges before noon, (2) recording of the EDD in our EHR within 24 hours of admission (as time stamped on our EHR), and (3) patient satisfaction.
Data for patient satisfaction were obtained using the Press Ganey survey. We used data on patient satisfaction scores for the following 2 relevant questions on this survey: (1) extent to which the patient felt ready to be discharged and (2) how well staff worked together to care for the patient. Proportions of the “top-box” (“very good”) were used for the analysis. These survey data were available on 467 patients (11.7%) in the preperiod and 188 patients (9.0%) in the postperiod.
Data Analysis
A sensitivity analysis was conducted on a second cohort that included a subset of patients from the preperiod between November 1, 2013, and April 30, 2014, and a subset of patients from the postperiod between November 1, 2014, and April 1, 2015, to control for the calendar period (supplementary Appendix 2).
All analyses were conducted in R version 3.3.0, with the linear mixed-effects model lme4 statistical package.13,14
RESULTS
Table 3 shows the differences in the outcomes between the pre- and postperiods. There was no change in the LOS or LOS adjusted for CMI. There was a 3.9% increase in discharges before noon in the postperiod compared with the preperiod (95% CI, 2.4% to 5.3%; P < .001). There was a 9.9% increase in the percentage of patients for whom the EDD was recorded in our EHR within 24 hours of admission (95% CI, 7.4% to 12.4%; P < .001). There was no change in the “top-box” patient satisfaction scores.
There were only marginal differences in the results between the entire cohort and a second subset cohort used for sensitivity analysis (supplementary Appendix 2).
DISCUSSION
In our study, there was no change in the mean LOS with the new model of MDR. There was an increase in discharges before noon and in recording of the EDD in our EHR within 24 hours of admission in the postperiod when the Lean-based new model of MDR was utilized. There was no change in patient satisfaction. With no change in staffing, we were able to accommodate the increase in the discharge volume in the postperiod.
We believe our results are attributable to several factors, including clearly defined roles and responsibilities for all participants of MDR, the inclusion of more experienced general medicine attending physician (compared with housestaff), Lean management techniques to identify gaps in the patient’s journey from emergency department to discharge using VSM, the development of appropriate workflows and standard work on how the multidisciplinary teams would work together at RPIWs, and ADM to ensure sustainability and engagement among frontline members and institutional leaders. In order to sustain this, we planned to continue monitoring data in daily, weekly, and monthly forums with senior physician and administrative leaders. Planning for additional interventions is underway, including moving MDR to the bedside, instituting an afternoon “check-in” that would enable more detailed action planning, and addressing barriers in a timely manner for patients ready to discharge the following day.
Our study has a few limitations. First, this is an observational study that cannot determine causation. Second, this is a single-center study conducted on patients only on the general medicine teaching service. Third, there were several concurrent interventions implemented at our institution to improve LOS, throughput, and patient satisfaction in addition to MDR, thus making it difficult to isolate the impact of our intervention. Fourth, in the new model of MDR, rounds took place only 5 days per week, thereby possibly limiting the potential impact on our outcomes. Fifth, while we showed improvements in the discharges before noon and recording of EDD in the post period, we were not able to achieve our target of 25% discharges before noon or 100% recording of EDD in this time period. We believe the limited amount of time between the pre- and postperiods to allow for adoption and learning of the processes might have contributed to the underestimation of the impact of the new model of MDR, thereby limiting our ability to achieve our targets. Sixth, the response rate on the Press Ganey survey was low, and we did not directly survey patients or families for their satisfaction with MDR.
Our study has several strengths. To our knowledge, this is the first study to embed Lean management techniques in the design of MDR in the inpatient setting. While several studies have demonstrated improvements in discharges before noon through the implementation of MDR, they have not incorporated Lean management techniques, which we believe are critical to ensure the sustainability of results.1,3,5,6,8,15 Second, while it was not measured, there was a high level of provider engagement in the process in the new model of MDR. Third, because the MDR were conducted at the nurse’s station on each inpatient unit in the new model instead of in a conference room, it was well attended by all members of the multidisciplinary team. Fourth, the presence of a visibility board allowed for all team members to have easy access to visual feedback throughout the day, even if they were not present at the MDR. Fifth, we believe that there was also more accurate estimation of the date and time of discharge in the new model of MDR because the discussion was facilitated by the case manager, who is experienced in identifying barriers to discharge (compared with the housestaff in the old model of MDR), and included the more experienced attending physician. Finally, the consistent presence of a multidisciplinary team at MDR allowed for the incorporation of everyone’s concerns at one time, thereby limiting the need for paging multiple disciplines throughout the day, which led to quicker resolution of issues and assignment of pending tasks.
In conclusion, our study shows no change in the mean LOS when the Lean-based model of MDR was utilized. Our study demonstrates an increase in discharges before noon and in recording of EDD on our EHR within 24 hours of admission in the post period when the Lean-based model of MDR was utilized. There was no change in patient satisfaction. While this study was conducted at an academic medical center on the general medicine wards, we believe our new model of MDR, which leveraged Lean management techniques, may successfully impact patient flow in all inpatient clinical services and nonteaching hospitals.
Disclosure
The authors report no financial conflicts of interest and have nothing to disclose.
1. Townsend-Gervis M, Cornell P, Vardaman JM. Interdisciplinary Rounds and Structured Communication Reduce Re-Admissions and Improve Some Patient Outcomes. West J Nurs Res. 2014;36(7):917-928. PubMed
2. Vazirani S, Hays RD, Shapiro MF, Cowan M. Effect of a multidisciplinary intervention on communication and collaboration among physicians and nurses. Am J Crit Care. 2005;14(1):71-77. PubMed
3. Wertheimer B, Jacobs RE, Bailey M, et al. Discharge before noon: an achievable hospital goal. J Hosp Med. 2014;9(4):210-214. PubMed
4. Wertheimer B, Jacobs RE, Iturrate E, Bailey M, Hochman K. Discharge before noon: Effect on throughput and sustainability. J Hosp Med. 2015;10(10):664-669. PubMed
5. Halm MA, Gagner S, Goering M, Sabo J, Smith M, Zaccagnini M. Interdisciplinary rounds: impact on patients, families, and staff. Clin Nurse Spec. 2003;17(3):133-142. PubMed
6. O’Mahony S, Mazur E, Charney P, Wang Y, Fine J. Use of multidisciplinary rounds to simultaneously improve quality outcomes, enhance resident education, and shorten length of stay. J Gen Intern Med. 2007;22(8):1073-1079. PubMed
7. Reimer N, Herbener L. Round and round we go: rounding strategies to impact exemplary professional practice. Clin J Oncol Nurs. 2014;18(6):654-660. PubMed
8. Curley C, McEachern JE, Speroff T. A firm trial of interdisciplinary rounds on the inpatient medical wards: an intervention designed using continuous quality improvement. Med Care. 1998;36(8 Suppl):AS4-AS12. PubMed
9. Baggs JG, Ryan SA, Phelps CE, Richeson JF, Johnson JE. The association between interdisciplinary collaboration and patient outcomes in a medical intensive care unit. Heart Lung. 1992;21(1):18-24. PubMed
10. Lawal AK, Rotter T, Kinsman L, et al. Lean management in health care: definition, concepts, methodology and effects reported (systematic review protocol). Syst Rev. 2014;3:103. PubMed
11. Liker JK. Toyota Way: 14 Management Principles from the World’s Greatest Manufacturer. New York, Chicago, San Francisco, Athens, London, Madrid, Mexico City, Milan, New Delhi, Singapore, Sydney, Toronto: McGraw-Hill Education; 2004.
12. Kane M, Chui K, Rimicci J, et al. Lean Manufacturing Improves Emergency Department Throughput and Patient Satisfaction. J Nurs Adm. 2015;45(9):429-434. PubMed
13. R Core Team. R: A language and environment for statistical computing. R Foundation for Statistical Computing, Vienna, Austria. 2016. http://www.R-project.org/. Accessed November 7, 2017.
14. Bates D, Mächler M, Bolker B, Walker S. Fitting Linear Mixed-Effects Models Using lme4. J Stat Softw. 2015;67(1):1-48.
15. O’Leary KJ, Buck R, Fligiel HM, et al. Structured interdisciplinary rounds in a medical teaching unit: improving patient safety. Arch Intern Med. 2011;171(7):678-684. PubMed
© 2018 Society of Hospital Medicine