User login
Procalcitonin-guided antibiotic stewardship for lower respiratory tract infection
Dynamics of the assay must be considered
Case
A 50-year-old female presents with 3 days of cough, subjective fevers, myalgias, and dyspnea. She feels she “may have caught something” while volunteering at a preschool. She has hypertension, congestive heart failure, and 20 pack-years of smoking. Chest x-ray shows bibasilar consolidation versus atelectasis. Vital signs are notable for an O2 saturation of 93%. White blood cell count and differential are normal. Procalcitonin level is 0.4 mcg/L.

Overview of the issue
Lower respiratory tract infections (LRTI) are common in the practice of hospital medicine; however, the primary symptoms of cough and dyspnea can be caused by a myriad of noninfectious conditions. Even when infection is suggested by the clinical presentation, the distinction between bacterial and viral etiologies can be challenging, complicating decisions about antibiotic use. Attention to antibiotic stewardship is a growing concern in U.S. hospitals, where the CDC estimates that as many as 50% of antibiotic orders are inappropriate or entirely unnecessary.1 Antibiotic overuse is a driver of multidrug-resistant organisms and increasing rates of Clostridium difficile infection. A diagnostic test to enhance physicians’ ability to target patients who would benefit from antibiotics could be a useful tool to combat the complications of antibiotic overuse. (See Figure 1.) 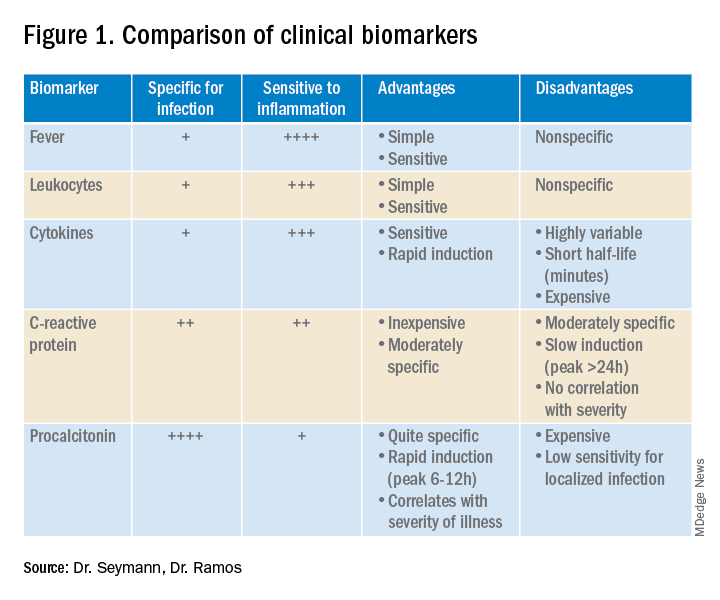
Procalcitonin is produced in the thyroidal C-cells as a prohormone which is processed intracellularly and secreted as calcitonin in response to serum calcium levels. However, intact procalcitonin protein can be secreted from many other tissues in the presence of cytokines such as interleukin 1-beta, tumor necrosis factor-alpha, and lipopolysaccharide, typically released in response to systemic bacterial infections. Conversely, cytokines present in acute viral illness (interferon-gamma) suppress procalcitonin release. This dichotomy presents an opportunity to use procalcitonin to differentiate bacterial from nonbacterial etiologies in various clinical scenarios including LRTI.
Overview of the data
Multiple studies have demonstrated that procalcitonin can be safely used to guide antibiotic prescribing in patients with LRTI. The first large multicenter randomized controlled trial to address the topic was the Swiss PROHOSP study.2 Investigators randomized 1,359 patients hospitalized with LRTI to procalcitonin (PCT) guided therapy or guideline-based therapy. After an initial PCT level was measured, antibiotic prescribing in the PCT arm of the study was directed by a prespecified protocol; specifically, clinicians were discouraged from prescribing antibiotics in patients with PCT levels less than 0.25 mcg/L. (See Figure 2.)
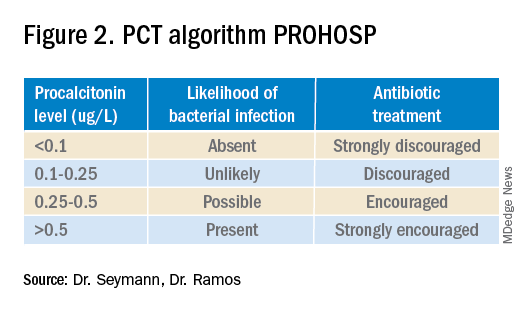
For patients who were particularly ill or unstable at admission, the protocol allowed for antibiotics despite a low PCT level, but repeat measurement within 24 hours and accompanying treatment recommendations were reinforced with the treatment team. Clinicians caring for patients in the control arm were presented with condition-specific clinical practice guidelines to reinforce antibiotic choices. In both arms, the final decision on antibiotic treatment remained with the physician.
Results from the PROHOSP study showed no difference in the combined outcome of death, intensive care unit admission, or complications in the ensuing 30 days, but antibiotic use was significantly reduced. Mean antibiotic exposure dropped from 8.7 to 5.7 days, a reduction of 35%, with the largest decrease among patients with chronic obstructive pulmonary disease (COPD) and acute bronchitis. Antibiotic-related adverse effects fell by 8.2%. Strengths of the study included a very high rate of protocol compliance (90%) by the treating clinicians.
A systematic review of all available studies of procalcitonin-guided therapy for LRTI was published in 2018 and included 26 randomized controlled trials encompassing 6,708 patients in 12 countries. Findings confirmed an overall reduction of 2.4 days in antibiotic exposure, 6% reduction in antibiotic-related adverse effects, and importantly a 17% relative risk reduction in mortality.3
Similar benefits of PCT-guided therapy have been demonstrated even among severely ill patients. A meta-analysis including 523 patients with bacteremia noted mean reduction in antibiotic exposure of 2.86 days, without excess mortality.4 A second meta-analysis of 4,482 critically ill patients admitted to the ICU with sepsis demonstrated not only a reduction in antibiotic exposure, but in mortality as well. Despite a relatively small decrease in antibiotic duration of 1.19 days, the investigators found an 11% reduction in mortality (P = .03) in the PCT-guided group.5
One notable outlier among the many positive studies on PCT-guided antibiotic therapy is the 2018 PROACT study performed in U.S. hospitals over 4 years.6 Its design was similar to the PROHOSP study, however, in contrast to the majority of other trials, the investigators were unable to demonstrate a reduction in antibiotic exposure, leading them to conclude that PCT guidance may not be a useful tool for antibiotic stewardship.
Unfortunately, significant differences in the compliance with the study protocol (90% in PROHOSP vs. 63% in PROACT), and a much healthier patient population (91% of the patients had a PCT less than 0.25, and a majority of patients had asthma which is not normally treated with antibiotics) hamper the generalizability of the PROACT findings. Rather than indicating a failure of PCT, the findings of the study underscore the fact that the utility of any lab test is limited unless it is applied in an appropriate diagnostic setting.
For hospitalists, the most clinically useful role for PCT testing is to guide the duration of antibiotic therapy. Although the literature supports short-course antibiotic therapy in many common conditions seen by hospitalists (Table 1), data suggest overprescribing remains prevalent. Several recent studies targeting LRTI underscore this point.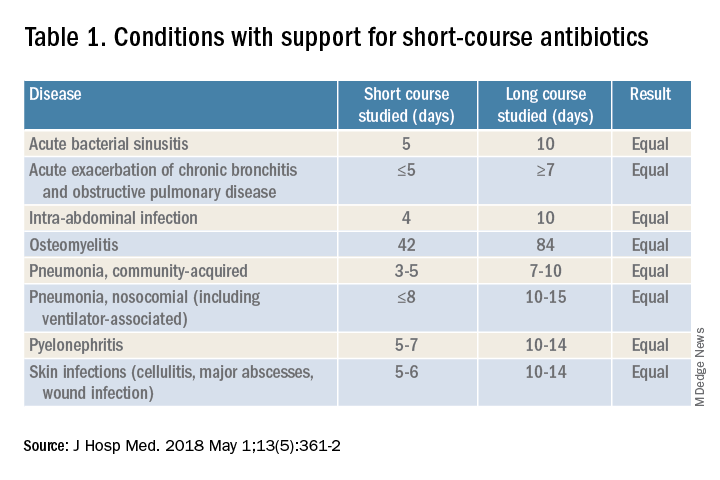
Despite guidelines advocating for treatment of uncomplicated community-acquired pneumonia (CAP) for no more than 5-7 days, two recent retrospective studies suggest most patients receive longer courses. A review of more than 150,000 patients across the United States with uncomplicated CAP documented a mean antibiotic duration of 9.5 days, with close to 70% of patients receiving more than 7 days of therapy.7 A multicenter study of CAP patients hospitalized in Michigan noted similar findings, with a mean 2-day excess duration of therapy or 2,526 excess days of treatment per 1,000 discharges.8 Though some who argue against procalcitonin’s utility cite the fact that existing guidelines already support short-course therapy, obviating the need for biomarker guidance, clinicians have not yet universally adopted this practice. Using a PCT algorithm can decrease duration of therapy and thereby reduce unnecessary antibiotic use. PCT levels less than 0.25 mcg/L support withholding or discontinuing antibiotics, or consideration of an alternative diagnosis.
The dynamics of the PCT assay must be considered in order to use it appropriately. Levels of PCT rise within 3-6 hours of infection, so patients presenting extremely early in the disease course may have falsely low levels. PCT levels correlate with severity of illness and should fall within 2-3 days of initiation of appropriate therapy. A repeat PCT in 2-3 days can be used to help time antibiotic cessation. Studies support stopping antibiotics in stable patients once the PCT level falls below 0.25 mcg/L or drops by 80% in patients with severe elevations. Lack of improvement suggests inadequate antibiotic therapy and is predictive of excess mortality.
Most drivers of false-positive PCT levels are rare and easily identifiable. (See Figure 3.) However, like troponin, patients with chronic kidney disease have delayed PCT clearance, so baseline levels may be about double the normal range. If a baseline is known, monitoring the rise and fall of PCT levels remains clinically useful in this population.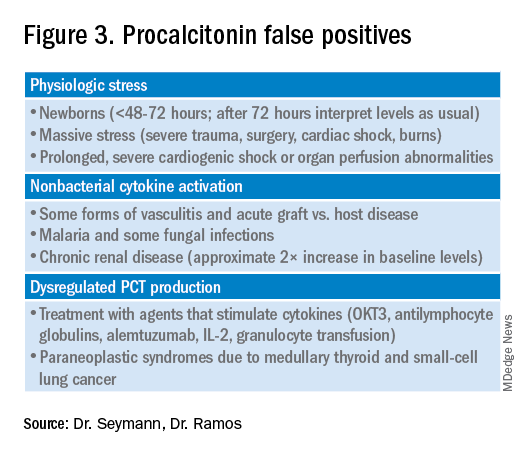
Application of data to case
In reviewing the case, the differential includes a viral upper respiratory infection, an acute exacerbation of COPD, decompensated heart failure, or bacterial pneumonia. The lab and imaging findings are nonspecific, but a PCT level less than 0.25 mcg/L raises concern for an acute bacterial pneumonia. Given that PCT levels rise in bacterial infection and are suppressed in viral infections, treating this patient with antibiotics seems prudent. In this case the relatively mild elevation suggests a less severe infection or a presentation early in the disease course. A repeat PCT in 2-3 days will guide timing for antibiotic cessation.
Bottom line
Thoughtful procalcitonin-guided antibiotic therapy for LRTI may further current antibiotic stewardship initiatives targeting reduction of inappropriate antimicrobial use, which may ultimately reduce rates of Clostridium difficile infections and the emergence of multidrug-resistant organisms.
Dr. Seymann and Dr. Ramos are clinical professors in the division of hospital medicine, department of medicine, at the University of California San Diego.
Key points
- Initial PCT level can help distinguish between viral and bacterial pneumonias.
- PCT levels rise in response to acute bacterial infections and are suppressed in viral infections.
- PCT levels below 0.25 mcg/L suggest that antibiotics can be safely withheld in otherwise stable patients.
- PCT levels correlate with severity of illness and prognosis.
- Rise of PCT is rapid (3-6 hours), and levels fall quickly with appropriate treatment (2-3 days).
- Serial PCT levels can be used to guide duration of antibiotic therapy.
References
1. CDC. Core elements of hospital antibiotic stewardship programs. Atlanta: U.S. Department of Health & Human Services. 2014. Available at www.cdc.gov/getsmart/healthcare/ implementation/core-elements.html.
2. Schuetz P et al. Effect of procalcitonin-based guidelines vs. standard guidelines on antibiotic use in lower respiratory tract infections: The ProHOSP randomized controlled trial. JAMA. 2009;302(10):1059-66. doi: 10.1001/jama.2009.1297.
3. Schuetz P et al. Effect of procalcitonin-guided antibiotic treatment on mortality in acute respiratory infections: A patient level meta-analysis. Lancet Infect Dis. 2018;18(1):95-107. doi: 10.1016/S1473-3099(17)30592-3.
4. Meier MA et al. Procalcitonin-guided antibiotic treatment in patients with positive blood cultures: A patient-level meta-analysis of randomized trials. Clin Infect Dis. 2019;69(3):388-96. doi: 10.1093/cid/ciy917.
5. Wirz Y et al. Effect of procalcitonin-guided antibiotic treatment on clinical outcomes in intensive care unit patients with infection and sepsis patients: A patient-level meta-analysis of randomized trials. Crit Care. 2018;22(1):191. doi: 10.1186/s13054-018-2125-7.
6. Huang DT et al. Procalcitonin-guided use of antibiotics for lower respiratory tract infection. N Engl J Med. 2018 Jul 19;379(3):236-49. doi: 10.1056/NEJMoa1802670.
7. Yi SH et al. Duration of antibiotic use among adults with uncomplicated community-acquired pneumonia requiring hospitalization in the United States. Clin Infect Dis. 2018;66(9):1333-41. doi: 10.1093/cid/cix986.
8. Vaughn V et al. Excess antibiotic treatment duration and adverse events in patients hospitalized with pneumonia: A multihospital cohort study. Ann Intern Med. 2019; 171(3):153-63. doi: 10.7326/M18-3640.
Quiz
1. A 57-year-old male is hospitalized for treatment of community-acquired pneumonia with IV azithromycin and ceftriaxone. PCT level on day 1 = 0.35 mcg/L. On day 4 of antibiotics the PCT level is 0.15 mcg/L. What should be done regarding the antibiotic course?
a. Continue antibiotics for a total course of 5 days.
b. Continue antibiotics for a total course of 7 days.
c. Stop antibiotics.
d. Continue antibiotics and repeat a PCT level the next day.
Answer: The best answer is c. Evidence suggests that 5 days of therapy is adequate treatment for uncomplicated community-acquired pneumonia. Procalcitonin-guided therapy allows for further tailoring of the regimen to the individual patient. Since this patient has clinically improved, and the PCT level is less than 0.25 mcg/L, it is reasonable to discontinue treatment and avoid unnecessary antibiotic days.
2. A 42-year-old female with known CKD stage 4 is hospitalized with suspected community-acquired pneumonia. Procalcitonin level is elevated at 0.6 mcg/L. How should the patient be treated?
a. Ignore the PCT as levels are falsely elevated due to CKD.
b. Treat with antibiotics for suspected community-acquired pneumonia.
c. Repeat PCT level in the morning.
d. Check a C-reactive protein level instead.
Answer: The best answer is b. Although decreased renal function can delay clearance of PCT, levels in CKD are typically about twice normal. In this case, when pneumonia is clinically suspected, the level of 0.6 mcg/L would correspond to a level of approximately 0.3 mcg/L and support a decision to treat with antibiotics.
3. A 36-year-old male develops sudden onset of dyspnea, cough, fever, and chills and proceeds rapidly to the emergency department. He is hypoxic, febrile, and has a leukocytosis. The PCT level is checked and found to be 0.2 mcg/L. Chest imaging shows a right middle lobe consolidation. How should the patient be treated?
a. Hold antibiotics.
b. Start antibiotic therapy.
c. Hold antibiotics and repeat PCT level in the morning.
Answer: The best answer is b. The clinical scenario suggests bacterial pneumonia. Given the sudden onset and early presentation to the ED, it is likely that the PCT level has not had time to peak. PCT levels typically begin to rise in 3-6 hours from the time of infection. Withholding antibiotics until the level exceeds 0.25 mcg/L would not be recommended when clinical judgment suggests otherwise.
4. Which of the following noninfectious scenarios does NOT cause an elevated PCT level?
a. Bone marrow transplant patient with acute graft versus host disease of the skin.
b. Patient presenting with paraneoplastic syndrome from small cell lung cancer.
c. Patient with cirrhosis presenting with hepatic encephalopathy.
d. Patient presenting with severe trauma from a motor vehicle accident.
Answer: The answer is c. Cirrhosis and/or hepatic encephalopathy does not cause a falsely elevated PCT level. Acute graft versus host disease, paraneoplastic syndrome from small cell lung cancer or medullary thyroid cancer, and massive stress such as severe trauma can cause elevations in PCT.
Additional reading
Spellberg B. The maturing antibiotic mantra: Shorter is still better. J Hosp Med. 2018;13:361-2. doi: 10.12788/jhm.2904.
Soni NJ et al. Procalcitonin-guided antibiotic therapy: A systematic review and meta-analysis. J Hosp Med. 2013;8:530-540. doi: 10.1002/jhm.2067.
Rhee C. Using procalcitonin to guide antibiotic therapy. Open Forum Infect Dis. 2017;4(1):ofw249. doi: 10.1093/ofid/ofw249.
Sager R et al. Procalcitonin-guided diagnosis and antibiotic stewardship revisited. BMC Med. 2017;15. doi: 10.1186/s12916-017-0795-7.
Dynamics of the assay must be considered
Dynamics of the assay must be considered
Case
A 50-year-old female presents with 3 days of cough, subjective fevers, myalgias, and dyspnea. She feels she “may have caught something” while volunteering at a preschool. She has hypertension, congestive heart failure, and 20 pack-years of smoking. Chest x-ray shows bibasilar consolidation versus atelectasis. Vital signs are notable for an O2 saturation of 93%. White blood cell count and differential are normal. Procalcitonin level is 0.4 mcg/L.
Overview of the issue
Lower respiratory tract infections (LRTI) are common in the practice of hospital medicine; however, the primary symptoms of cough and dyspnea can be caused by a myriad of noninfectious conditions. Even when infection is suggested by the clinical presentation, the distinction between bacterial and viral etiologies can be challenging, complicating decisions about antibiotic use. Attention to antibiotic stewardship is a growing concern in U.S. hospitals, where the CDC estimates that as many as 50% of antibiotic orders are inappropriate or entirely unnecessary.1 Antibiotic overuse is a driver of multidrug-resistant organisms and increasing rates of Clostridium difficile infection. A diagnostic test to enhance physicians’ ability to target patients who would benefit from antibiotics could be a useful tool to combat the complications of antibiotic overuse. (See Figure 1.)
Procalcitonin is produced in the thyroidal C-cells as a prohormone which is processed intracellularly and secreted as calcitonin in response to serum calcium levels. However, intact procalcitonin protein can be secreted from many other tissues in the presence of cytokines such as interleukin 1-beta, tumor necrosis factor-alpha, and lipopolysaccharide, typically released in response to systemic bacterial infections. Conversely, cytokines present in acute viral illness (interferon-gamma) suppress procalcitonin release. This dichotomy presents an opportunity to use procalcitonin to differentiate bacterial from nonbacterial etiologies in various clinical scenarios including LRTI.
Overview of the data
Multiple studies have demonstrated that procalcitonin can be safely used to guide antibiotic prescribing in patients with LRTI. The first large multicenter randomized controlled trial to address the topic was the Swiss PROHOSP study.2 Investigators randomized 1,359 patients hospitalized with LRTI to procalcitonin (PCT) guided therapy or guideline-based therapy. After an initial PCT level was measured, antibiotic prescribing in the PCT arm of the study was directed by a prespecified protocol; specifically, clinicians were discouraged from prescribing antibiotics in patients with PCT levels less than 0.25 mcg/L. (See Figure 2.)
For patients who were particularly ill or unstable at admission, the protocol allowed for antibiotics despite a low PCT level, but repeat measurement within 24 hours and accompanying treatment recommendations were reinforced with the treatment team. Clinicians caring for patients in the control arm were presented with condition-specific clinical practice guidelines to reinforce antibiotic choices. In both arms, the final decision on antibiotic treatment remained with the physician.
Results from the PROHOSP study showed no difference in the combined outcome of death, intensive care unit admission, or complications in the ensuing 30 days, but antibiotic use was significantly reduced. Mean antibiotic exposure dropped from 8.7 to 5.7 days, a reduction of 35%, with the largest decrease among patients with chronic obstructive pulmonary disease (COPD) and acute bronchitis. Antibiotic-related adverse effects fell by 8.2%. Strengths of the study included a very high rate of protocol compliance (90%) by the treating clinicians.
A systematic review of all available studies of procalcitonin-guided therapy for LRTI was published in 2018 and included 26 randomized controlled trials encompassing 6,708 patients in 12 countries. Findings confirmed an overall reduction of 2.4 days in antibiotic exposure, 6% reduction in antibiotic-related adverse effects, and importantly a 17% relative risk reduction in mortality.3
Similar benefits of PCT-guided therapy have been demonstrated even among severely ill patients. A meta-analysis including 523 patients with bacteremia noted mean reduction in antibiotic exposure of 2.86 days, without excess mortality.4 A second meta-analysis of 4,482 critically ill patients admitted to the ICU with sepsis demonstrated not only a reduction in antibiotic exposure, but in mortality as well. Despite a relatively small decrease in antibiotic duration of 1.19 days, the investigators found an 11% reduction in mortality (P = .03) in the PCT-guided group.5
One notable outlier among the many positive studies on PCT-guided antibiotic therapy is the 2018 PROACT study performed in U.S. hospitals over 4 years.6 Its design was similar to the PROHOSP study, however, in contrast to the majority of other trials, the investigators were unable to demonstrate a reduction in antibiotic exposure, leading them to conclude that PCT guidance may not be a useful tool for antibiotic stewardship.
Unfortunately, significant differences in the compliance with the study protocol (90% in PROHOSP vs. 63% in PROACT), and a much healthier patient population (91% of the patients had a PCT less than 0.25, and a majority of patients had asthma which is not normally treated with antibiotics) hamper the generalizability of the PROACT findings. Rather than indicating a failure of PCT, the findings of the study underscore the fact that the utility of any lab test is limited unless it is applied in an appropriate diagnostic setting.
For hospitalists, the most clinically useful role for PCT testing is to guide the duration of antibiotic therapy. Although the literature supports short-course antibiotic therapy in many common conditions seen by hospitalists (Table 1), data suggest overprescribing remains prevalent. Several recent studies targeting LRTI underscore this point.
Despite guidelines advocating for treatment of uncomplicated community-acquired pneumonia (CAP) for no more than 5-7 days, two recent retrospective studies suggest most patients receive longer courses. A review of more than 150,000 patients across the United States with uncomplicated CAP documented a mean antibiotic duration of 9.5 days, with close to 70% of patients receiving more than 7 days of therapy.7 A multicenter study of CAP patients hospitalized in Michigan noted similar findings, with a mean 2-day excess duration of therapy or 2,526 excess days of treatment per 1,000 discharges.8 Though some who argue against procalcitonin’s utility cite the fact that existing guidelines already support short-course therapy, obviating the need for biomarker guidance, clinicians have not yet universally adopted this practice. Using a PCT algorithm can decrease duration of therapy and thereby reduce unnecessary antibiotic use. PCT levels less than 0.25 mcg/L support withholding or discontinuing antibiotics, or consideration of an alternative diagnosis.
The dynamics of the PCT assay must be considered in order to use it appropriately. Levels of PCT rise within 3-6 hours of infection, so patients presenting extremely early in the disease course may have falsely low levels. PCT levels correlate with severity of illness and should fall within 2-3 days of initiation of appropriate therapy. A repeat PCT in 2-3 days can be used to help time antibiotic cessation. Studies support stopping antibiotics in stable patients once the PCT level falls below 0.25 mcg/L or drops by 80% in patients with severe elevations. Lack of improvement suggests inadequate antibiotic therapy and is predictive of excess mortality.
Most drivers of false-positive PCT levels are rare and easily identifiable. (See Figure 3.) However, like troponin, patients with chronic kidney disease have delayed PCT clearance, so baseline levels may be about double the normal range. If a baseline is known, monitoring the rise and fall of PCT levels remains clinically useful in this population.
Application of data to case
In reviewing the case, the differential includes a viral upper respiratory infection, an acute exacerbation of COPD, decompensated heart failure, or bacterial pneumonia. The lab and imaging findings are nonspecific, but a PCT level less than 0.25 mcg/L raises concern for an acute bacterial pneumonia. Given that PCT levels rise in bacterial infection and are suppressed in viral infections, treating this patient with antibiotics seems prudent. In this case the relatively mild elevation suggests a less severe infection or a presentation early in the disease course. A repeat PCT in 2-3 days will guide timing for antibiotic cessation.
Bottom line
Thoughtful procalcitonin-guided antibiotic therapy for LRTI may further current antibiotic stewardship initiatives targeting reduction of inappropriate antimicrobial use, which may ultimately reduce rates of Clostridium difficile infections and the emergence of multidrug-resistant organisms.
Dr. Seymann and Dr. Ramos are clinical professors in the division of hospital medicine, department of medicine, at the University of California San Diego.
Key points
- Initial PCT level can help distinguish between viral and bacterial pneumonias.
- PCT levels rise in response to acute bacterial infections and are suppressed in viral infections.
- PCT levels below 0.25 mcg/L suggest that antibiotics can be safely withheld in otherwise stable patients.
- PCT levels correlate with severity of illness and prognosis.
- Rise of PCT is rapid (3-6 hours), and levels fall quickly with appropriate treatment (2-3 days).
- Serial PCT levels can be used to guide duration of antibiotic therapy.
References
1. CDC. Core elements of hospital antibiotic stewardship programs. Atlanta: U.S. Department of Health & Human Services. 2014. Available at www.cdc.gov/getsmart/healthcare/ implementation/core-elements.html.
2. Schuetz P et al. Effect of procalcitonin-based guidelines vs. standard guidelines on antibiotic use in lower respiratory tract infections: The ProHOSP randomized controlled trial. JAMA. 2009;302(10):1059-66. doi: 10.1001/jama.2009.1297.
3. Schuetz P et al. Effect of procalcitonin-guided antibiotic treatment on mortality in acute respiratory infections: A patient level meta-analysis. Lancet Infect Dis. 2018;18(1):95-107. doi: 10.1016/S1473-3099(17)30592-3.
4. Meier MA et al. Procalcitonin-guided antibiotic treatment in patients with positive blood cultures: A patient-level meta-analysis of randomized trials. Clin Infect Dis. 2019;69(3):388-96. doi: 10.1093/cid/ciy917.
5. Wirz Y et al. Effect of procalcitonin-guided antibiotic treatment on clinical outcomes in intensive care unit patients with infection and sepsis patients: A patient-level meta-analysis of randomized trials. Crit Care. 2018;22(1):191. doi: 10.1186/s13054-018-2125-7.
6. Huang DT et al. Procalcitonin-guided use of antibiotics for lower respiratory tract infection. N Engl J Med. 2018 Jul 19;379(3):236-49. doi: 10.1056/NEJMoa1802670.
7. Yi SH et al. Duration of antibiotic use among adults with uncomplicated community-acquired pneumonia requiring hospitalization in the United States. Clin Infect Dis. 2018;66(9):1333-41. doi: 10.1093/cid/cix986.
8. Vaughn V et al. Excess antibiotic treatment duration and adverse events in patients hospitalized with pneumonia: A multihospital cohort study. Ann Intern Med. 2019; 171(3):153-63. doi: 10.7326/M18-3640.
Quiz
1. A 57-year-old male is hospitalized for treatment of community-acquired pneumonia with IV azithromycin and ceftriaxone. PCT level on day 1 = 0.35 mcg/L. On day 4 of antibiotics the PCT level is 0.15 mcg/L. What should be done regarding the antibiotic course?
a. Continue antibiotics for a total course of 5 days.
b. Continue antibiotics for a total course of 7 days.
c. Stop antibiotics.
d. Continue antibiotics and repeat a PCT level the next day.
Answer: The best answer is c. Evidence suggests that 5 days of therapy is adequate treatment for uncomplicated community-acquired pneumonia. Procalcitonin-guided therapy allows for further tailoring of the regimen to the individual patient. Since this patient has clinically improved, and the PCT level is less than 0.25 mcg/L, it is reasonable to discontinue treatment and avoid unnecessary antibiotic days.
2. A 42-year-old female with known CKD stage 4 is hospitalized with suspected community-acquired pneumonia. Procalcitonin level is elevated at 0.6 mcg/L. How should the patient be treated?
a. Ignore the PCT as levels are falsely elevated due to CKD.
b. Treat with antibiotics for suspected community-acquired pneumonia.
c. Repeat PCT level in the morning.
d. Check a C-reactive protein level instead.
Answer: The best answer is b. Although decreased renal function can delay clearance of PCT, levels in CKD are typically about twice normal. In this case, when pneumonia is clinically suspected, the level of 0.6 mcg/L would correspond to a level of approximately 0.3 mcg/L and support a decision to treat with antibiotics.
3. A 36-year-old male develops sudden onset of dyspnea, cough, fever, and chills and proceeds rapidly to the emergency department. He is hypoxic, febrile, and has a leukocytosis. The PCT level is checked and found to be 0.2 mcg/L. Chest imaging shows a right middle lobe consolidation. How should the patient be treated?
a. Hold antibiotics.
b. Start antibiotic therapy.
c. Hold antibiotics and repeat PCT level in the morning.
Answer: The best answer is b. The clinical scenario suggests bacterial pneumonia. Given the sudden onset and early presentation to the ED, it is likely that the PCT level has not had time to peak. PCT levels typically begin to rise in 3-6 hours from the time of infection. Withholding antibiotics until the level exceeds 0.25 mcg/L would not be recommended when clinical judgment suggests otherwise.
4. Which of the following noninfectious scenarios does NOT cause an elevated PCT level?
a. Bone marrow transplant patient with acute graft versus host disease of the skin.
b. Patient presenting with paraneoplastic syndrome from small cell lung cancer.
c. Patient with cirrhosis presenting with hepatic encephalopathy.
d. Patient presenting with severe trauma from a motor vehicle accident.
Answer: The answer is c. Cirrhosis and/or hepatic encephalopathy does not cause a falsely elevated PCT level. Acute graft versus host disease, paraneoplastic syndrome from small cell lung cancer or medullary thyroid cancer, and massive stress such as severe trauma can cause elevations in PCT.
Additional reading
Spellberg B. The maturing antibiotic mantra: Shorter is still better. J Hosp Med. 2018;13:361-2. doi: 10.12788/jhm.2904.
Soni NJ et al. Procalcitonin-guided antibiotic therapy: A systematic review and meta-analysis. J Hosp Med. 2013;8:530-540. doi: 10.1002/jhm.2067.
Rhee C. Using procalcitonin to guide antibiotic therapy. Open Forum Infect Dis. 2017;4(1):ofw249. doi: 10.1093/ofid/ofw249.
Sager R et al. Procalcitonin-guided diagnosis and antibiotic stewardship revisited. BMC Med. 2017;15. doi: 10.1186/s12916-017-0795-7.
Transitioning From Infusion Insulin
Hyperglycemia due to diabetes or stress is prevalent in the intensive care unit (ICU) and general ward setting. Umpierrez et al.1 reported hyperglycemia in 38% of hospitalized ward patients with 26% having a known history of diabetes. While patients with hyperglycemia admitted to the ICU are primarily treated with infusion insulin, those on the general wards usually receive a subcutaneous regimen of insulin. How best to transition patients from infusion insulin to a subcutaneous regimen remains elusive and under evaluated.
A recent observational pilot study of 24 surgical and 17 cardiac/medical intensive care patients at our university‐based hospital found that glycemic control significantly deteriorated when patients with diabetes transitioned from infusion insulin to subcutaneous insulin. A total of 21 critical care patients with a history of diabetes failed to receive basal insulin prior to discontinuation of the drip and developed uncontrolled hyperglycemia (mean glucose Day 1 of 216 mg/dL and Day 2 of 197 mg/dL). Patients without a history of diabetes did well post transition with a mean glucose of 142 mg/dL Day 1 and 133 mg/dL Day 2. A similar study by Czosnowski et al.2 demonstrated a significant increase in blood glucose from 123 26 mg/dL to 168 50 mg/dL upon discontinuation of infusion insulin.
This failed transition is disappointing, especially in view of the existence of a reliable subcutaneous (SC) insulin order set at our institution, but not surprising, as this is an inherently complex process. The severity of illness, the amount and mode of nutritional intake, geographic location, and provider team may all be in flux at the time of this transition. A few centers have demonstrated that a much improved transition is possible,36 however many of these solutions involve technology or incremental personnel that may not be available or the descriptions may lack sufficient detail to implement theses strategies with confidence elsewhere.
Therefore, we designed and piloted a protocol, coordinated by a multidisciplinary team, to transition patients from infusion insulin to SC insulin. The successful implementation of this protocol could serve as a blueprint to other institutions without the need for additional technology or personnel.
Methods
Patient Population/Setting
This was a prospective study of patients admitted to either the medical/cardiac intensive care unit (MICU/CCU) or surgical intensive care unit (SICU) at an academic medical facility and placed on infusion insulin for >24 hours. The Institutional Review Board (IRB) approved the study for prospective chart review and anonymous results reporting without individual consent.
Patients in the SICU were initiated on infusion insulin after 2 blood glucose readings were above 150 mg/dL, whereas initiation was left to the discretion of the attending physician in the MICU/CCU. A computerized system created in‐house recommends insulin infusion rates based on point‐of‐care (POC) glucose measurements with a target range of 91 mg/dL to 150 mg/dL.
Inclusion/Exclusion Criteria
All patients on continuous insulin infusion admitted to the SICU or the MICU/CCU between May 2008 and September 2008 were evaluated for the study (Figure 1). Patients were excluded from analysis if they were on the infusion for less than 24 hours, had a liver transplant, were discharged within 48 hours of transition, were made comfort care or transitioned to an insulin pump. All other patients were included in the final analysis.

Transition Protocol
Step 1: Does the Patient Need Basal SC Insulin?
Patients were recommended to receive basal SC insulin if they either: (1) were on medications for diabetes; (2) had an A1c 6%; or (3) received the equivalent of 60 mg of prednisone; AND had an infusion rate 1 unit/hour (Supporting Information Appendix 1). Patients on infusion insulin due to stress hyperglycemia, regardless of the infusion rate, were not placed on basal SC insulin. Patients on high dose steroids due to spinal injuries were excluded because their duration of steroid use was typically less than 48 hours and usually ended prior to the time of transition. The protocol recommends premeal correctional insulin for those not qualifying for basal insulin.
In order to establish patients in need of basal/nutritional insulin we opted to use A1c as well as past medical history to identify patients with diabetes. The American Diabetes Association (ADA) has recently accepted using an A1c 6.5% to make a new diagnosis of diabetes.7 In a 2‐week trial prior to initiating the protocol we used a cut off A1c of 6.5%. However, we found that patients with an A1c of 6% to 6.5% had poor glucose control post transition; therefore we chose 6% as our identifier. In addition, using a cut off A1c of 6% was reported by Rohlfing et al.8 and Greci et al.9 to be more than 97% sensitive at identifying a new diagnosis of diabetes.
To ensure an A1c was ordered and available at the time of transition, critical care pharmacists were given Pharmacy and Therapeutics Committee authorization to order an A1c at the start of the infusion. Pharmacists would also guide the primary team through the protocol's recommendations as well as alert the project team when a patient was expected to transition.
Step 2: Evaluate the Patient's Nutritional Intake to Calculate the Total Daily Dose (TDD) of Insulin
TDD is the total amount of insulin needed to cover both the nutritional and basal requirements of a patient over the course of 24 hours. TDD was calculated by averaging the hourly drip rate over the prior 6 hours and multiplying by 20 if taking in full nutrition or 40 if taking minimal nutrition while on the drip. A higher multiplier was used for those on minimal nutrition with the expectation that their insulin requirements would double once tolerating a full diet. Full nutrition was defined as eating >50% of meals, on goal tube feeds, or receiving total parenteral nutrition (TPN). Minimal nutrition was defined as taking nothing by mouth (or NPO), tolerating <50% of meals, or on a clear liquid diet.
Step 3: Divide the TDD Into the Appropriate Components of Insulin Treatment (Basal, Nutritional and Correction), Depending on the Nutritional Status
In Step 3, the TDD was evenly divided into basal and nutritional insulin. A total of 50% of the TDD was given as glargine (Lantus) 2 hours prior to stopping the infusion. The remaining 50% was divided into nutritional components as either Regular insulin every 6 hours for patients on tube feeds or lispro (Humalog) before meals if tolerating an oral diet. For patients on minimal nutrition, the 50% nutritional insulin dose was not initiated until the patient was tolerating full nutrition.
The protocol recommended basal insulin administration 2 hours prior to infusion discontinuation as recommended by the American Association of Clinical Endocrinologists (AACE) and ADA consensus statement on inpatient glycemic control as well as pharmacokinetics.10, 11 For these reasons, failure to receive basal insulin prior to transition was viewed as failure to follow the protocol.
Safety features of the protocol included a maximum TDD of 100 units unless the patient was on >100 units/day of insulin prior to admission. A pager was carried by rotating hospitalists or pharmacist study investigators at all hours during the protocol implementation phase to answer any questions regarding a patient's transition.
Data Collection/Monitoring
A multidisciplinary team consisting of hospitalists, ICU pharmacists, critical care physicians and nursing representatives was assembled during the study period. This team was responsible for protocol implementation, data collection, and surveillance of patient response to the protocol. Educational sessions with house staff and nurses in each unit were held prior to the beginning of the study as well as continued monthly educational efforts during the study. In addition, biweekly huddles to review ongoing patient transitions as well as more formal monthly reviews were held.
The primary objective was to improve glycemic control, defined as the mean daily glucose, during the first 48 hours post transition without a significant increase in the percentage of patients with hypoglycemia (41‐70 mg/dL) or severe hypoglycemia (40 mg/dL). Secondary endpoints included the percent of patients with severe hyperglycemia (300 mg/dL), length of stay (LOS) calculated from the day of transition, number of restarts back onto infusion insulin within 72 hours of transition, and day‐weighted glucose mean up to 12 days following transition for patients with diabetes.
Glucose values were collected and averaged over 6‐hour periods for 48 hours post transition. For patients with diabetes, POC glucose values were collected up to 12 days of hospitalization. Day‐weighted means were obtained by calculating the mean glucose for each hospital day, averaged across all hospital days.12
Analysis
Subjects were divided by the presence or absence of diabetes. Those with diabetes were recommended to receive basal SC insulin during the transition period. Within each group, subjects were further divided by adherence to the protocol. Failure to transition per protocol was defined as: not receiving at least 80% of the recommended basal insulin dose, receiving the initial dose of insulin after the drip was discontinued, or receiving basal insulin when none was recommended.
Descriptive statistics within subgroups comparing age, gender, LOS by analysis of variance for continuous data and by chi‐square for nominal data, were compared. Twenty‐four and 48‐hour post transition mean glucose values and the 12 day weighted‐mean glucose were compared using analysis of variance (Stata ver. 10). All data are expressed as mean standard deviation with a significance value established at P < 0.05.
Results
A total of 210 episodes of infusion insulin in ICU patients were evaluated for the study from May of 2008 to September 2008 (Figure 1). Ninety‐six of these episodes were excluded, most commonly due to time on infusion insulin <24 hours or transition to comfort care. The remaining 114 infusions were eligible to use the protocol. Because the protocol recommends insulin therapy based on a diagnosis of diabetes, patients were further divided into these subcategories. Of these 114 transitions, the protocol was followed 66 times (58%).
Patients With Diabetes
(Table 1: Patient Demographics; Table 2: Insulin Use and Glycemic Control; Figure 2: Transition Graph).
| Patients With Diabetes | P Value | Patients Without Diabetes | P Value | |||
|---|---|---|---|---|---|---|
| Protocol Followed, n = 29 Patients* | Protocol NOT Followed, n = 33 Patients | Protocol Followed, n = 30 Patients | Protocol NOT Followed, n = 9 Patients | |||
| ||||||
| Average age, years, mean SD | 57.7 12.1 | 57.8 12.3 | 0.681 | 56.5 18.1 | 62.4 15.5 | 0.532 |
| Male patients | 21 (72%) | 21 (63%) | 0.58 | 20 (66%) | 7 (77%) | 0.691 |
| BMI | 30.7 7.2 | 28.6 6.8 | 0.180 | 27 5.4 | 25.2 3 | 0.081 |
| History of diabetes* | 18 (64%) | 25 (86%) | 0.07 | 0 | 0 | |
| Mean Hgb A1c (%) | 6.61.2 | 7.3 1.8 | 0.136 | 5.6 0.3 | 5.4 0.4 | 0.095 |
| Full nutrition | 26 (79%) | 24 (61%) | 0.131 | 23 (70%) | 9 (100%) | |
| On hemodialysis | 5 (17%) | 9 (27%) | 0.380 | 3 (10%) | 0 | |
| On >60 mg prednisone or equivalent per day | 7 (24%) | 10 (30%) | 0.632 | 0 | 0 | |
| Patients With Diabetes | P Value | Patients Without Diabetes | P Value | |||
|---|---|---|---|---|---|---|
| Protocol Followed, n = 33 transitions | Protocol NOT followed, n = 39 transitions | Protocol Followed, n = 33 transitions | Protocol NOT Followed, n = 9 transitions | |||
| ||||||
| Average infusion rate, hours | 3.96 3.15 | 3.74 3.64 | 0.1597 | 2.34 1.5 | 4.78 1.6 | <0.001 |
| Average BG on infusion insulin (mg/dL) | 122.5 27.5 | 122.5 31.8 | 0.844 | 115.1 22.7 | 127.5 27.2 | 0.006 |
| Average basal dose (units) given | 34.5 14.4 | 14.4 15.3 | <0.001 | 0 | 32.7 | <0.001 |
| Hours before () or after (+) infusion stopped basal insulin given | 1.13 0.9 | 11.6 9.3 | <0.001 | n/a | 0.33 | * |
| Average BG 6 hours post transition (mg/dL) | 143.7 39.4 | 182 62.5 | 0.019 | 150.2 54.9 | 142.1 34.1 | 0.624 |
| Average BG 0 to 24 hours post transition (mg/dL) | 167.98 50.24 | 211.02 81.01 | <0.001 | 150.24 54.9 | 150.12 32.4 | 0.600 |
| Total insulin used from 0 to 24 hours (units) | 65 32.2 | 26.7 25.4 | <0.001 | 3.2 4.1 | 51.3 30.3 | <0.001 |
| Average BG 25 to 48 hours post transition (mg/dL) | 176.1 55.25 | 218.2 88.54 | <0.001 | 153 35.3 | 154.4 46.7 | 0.711 |
| Total insulin used from 25 to 48 hours (units) | 60.5 35.4 | 28.1 24.4 | <0.001 | 2.8 3.8 | 44.9 34 | <0.001 |
| # of patients with severe hypoglycemia (<40 mg/dL) | 1 (3%) | 1 (2.6%) | * | 0 | 1 | * |
| # of patients with hypoglycemia (4170 mg/dL) | 3 (9%) | 2 (5.1%) | * | 1 | 0 | * |
| % of BG values in goal range (80180 mg/dL) (# in range/total #) | 60.2% (153/254) | 38.2% (104/272) | 0.004 | 80.1% (173/216) | 75.4% (49/65) | 0.83 |
| # of patients with severe hyperglycemia (>300 mg/dL) | 5 (15.2%) | 19 (48.7%) | 0.002 | 1 (3%) | 1 (11.1%) | * |
| LOS from transition (days) | 14.6 11.3 | 14 11.4 | 0.836 | 25.3 24.4 | 13.6 7.5 | 0.168 |
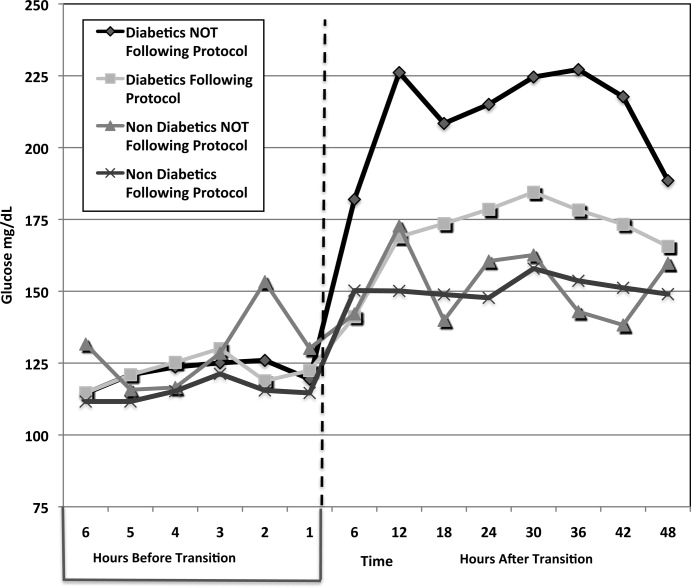
A total of 62 individual patients accounted for 72 separate transitions in patients with diabetes based on past medical history or an A1c 6% (n = 14). Of these 72 transitions, 33 (46%) adhered to the protocol while the remaining 39 (54%) transitions varied from the protocol at the treatment team's discretion. Despite similar insulin infusion rates and mean glucose values pretransition, patients with diabetes following the protocol had better glycemic control at both 24 hours and 48 hours after transition than those patients transitioned without the protocol. Day 1 mean blood glucose was 168 mg/dL vs. 211 mg/dL (P = <0.001) and day 2 mean blood glucose was 176 mg/dL vs. 218 mg/dL (P = <0.001) in protocol vs. nonprotocol patients with diabetes respectively (Figure 2).
There was a severe hypoglycemic event (40 mg/dL) in 1 patient with diabetes following the protocol and 1 patient not following the protocol within 48 hours of transition. Both events were secondary to nutritional‐insulin mismatch with emesis after insulin in one case and tube feeds being held in the second case. These findings were consistent with our prior examination of hypoglycemia cases.13 Severe hyperglycemia (glucose 300mg/dL) occurred in 5 (15 %) patients following the protocol vs. 19 (49%) patients not following protocol (P = 0.002.) Patients with diabetes following the protocol received significantly more insulin in the first 24 hours (mean of 65 units vs. 27 units, P 0.001) and 24 to 48 hours after transition (mean of 61 units vs. 28 units, p0.001) than those not following protocol.
An alternate method used at our institution and others14, 15 to calculate TDD is based on the patient's weight and body habitus. When we compared the projected TDD based on weight with the TDD using the transition protocol, we found that the weight based method was much less aggressive. For patients following the protocol, the weight based method projected a mean TDD of 46.3 16.9 units whereas the protocol projected a mean TDD of 65 33.2 units (P = 0.001).
Patients with diabetes following protocol received basal insulin an average of 1.13 hours prior to discontinuing the insulin infusion versus 11.6 hours after for those not following protocol.
Three patients with diabetes following the protocol and 3 patients with diabetes not following the protocol were restarted on infusion insulin within 72 hours of transition.
LOS from final transition to discharge was similar between protocol vs. nonprotocol patients (14.6 vs. 14 days, P = 0.836).
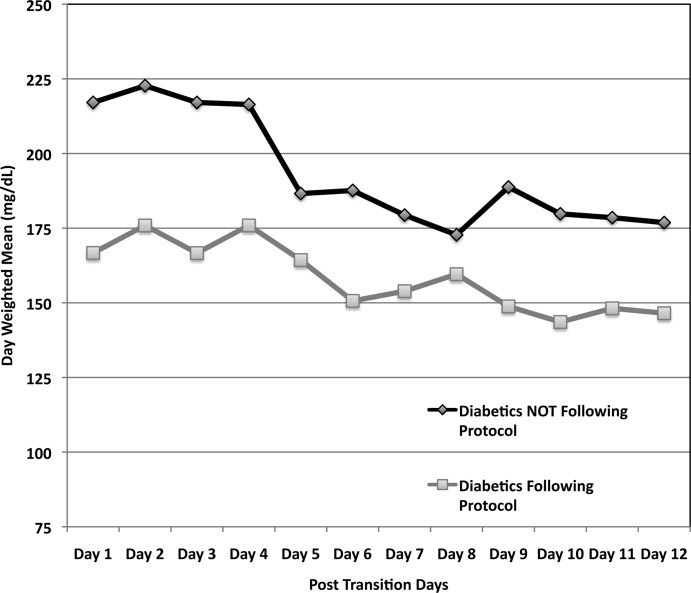
Figure 3 demonstrates that when used correctly, the protocol provides an extended period of glycemic control up to 12 days post transition. Patients transitioned per protocol had a day‐weighted mean glucose of 155 mg/dL vs. 184 mg/dL (P = 0.043) in patients not following protocol. There was only 1 glucose value less than 40 mg/dL between days 2 to 12 in the protocol group.
Patients Without Diabetes
Of the 39 individual patients without diabetes there were 42 transition events, 33 transitions (78.6%) were per protocol and placed on correctional insulin only. The remaining 9 transitions failed to follow protocol in that basal insulin was prescribed, but these patients maintained comparable glycemic control without an increase in hypoglycemic events. Following transition, patients without diabetes on protocol maintained a mean glucose of 150 mg/dL in the first 24 hours and 153 mg/dL in 24 to 48 hours post transition. They required a mean daily correctional insulin dose of 3.2 units on Day 1 and 2.8 units on Day 2 despite having an average drip rate of 2.3 units/hour at the time of transition (Table 2). There were no severe hypoglycemic events and 80% of blood sugars were within the goal range of 80 mg/dL to 180 mg/dL. Only 1 patient had a single blood glucose of >300mg/dL. No patient was restarted on infusion insulin once transitioned.
Patients without diabetes had a longer LOS after transition off of infusion insulin when compared to their diabetic counterparts (22 vs. 14 days).
Discussion
This study demonstrates the utility of hospitalist‐pharmacist collaboration in the creation and implementation of a safe and effective transition protocol for patients on infusion insulin. The protocol identifies patients appropriate for transition to a basal/nutritional insulin regimen versus those who will do well with premeal correctional insulin alone. Daily mean glucose was improved post transition for diabetic patients following the protocol compared to those not following the protocol without an increase in hypoglycemic events.
We found an equal number of insulin infusion restarts within 72 hours of transition and a similar LOS in protocol vs. nonprotocol patients with diabetes. The LOS was increased for patients without diabetes. This may be due to worse outcomes noted in patients with stress hyperglycemia in other studies.1, 16
The use of the higher multiplier for patients on minimal nutrition led to confusion among many protocol users. The protocol has since been modified to start by averaging the infusion rate over the prior 6 hours and then multiplying by 20 for all patients. This essentially calculates 80% of projected insulin requirements for the next 24 hours based on the patient's current needs. This calculation is then given as 50% basal and 50% nutritional for those on full nutrition vs. 100% basal for those on minimal nutrition. This protocol change has no impact on the amount of insulin received by the patient, but is more intuitive to providers. Instead of calculating the TDD as the projected requirement when full nutrition is obtained, the TDD is now calculated based on current insulin needs, and then doubled when patients who are receiving minimal nutrition advance to full nutrition.
Our study is limited by the lack of a true randomized control group. In lieu of this, we used our patients who did not follow protocol as our control. While not truly randomized, this group is comparable based on their age, gender mix, infusion rate, mean A1c, and projected TDD. This group was also similar to our preprotocol group mentioned in the Introduction.
Additional study limitations include the small number of nondiabetic patients not following the protocol (n = 9). We noted higher infusion rates in nondiabetics not following protocol versus those following protocol, which may have driven the primary team to give basal insulin. It is possible that these 9 patients were not yet ready to transition from infusion insulin or had other stressors not measured in our study. Unfortunately their small population size limits more extensive analysis.
The protocol was followed only 50% of the time for a variety of reasons. Patients who transitioned at night or on weekends were monitored by covering pharmacists and physicians who may not have been familiar with the protocol. Many physicians and nurses remain fearful of hypoglycemia and the outcomes of our study were not yet available for education. Some reported difficulty fully understanding how to use the protocol and why a higher multiplier was used for patients who were on minimal nutrition.
Efforts to improve adherence to the protocol are ongoing with some success, aided by the data demonstrating the safety and efficacy of the transition protocol.
Conclusion
By collaborating with ICU pharmacists we were able to design and implement a protocol that successfully and safely transitioned patients from infusion insulin to subcutaneous insulin. Patients following the protocol had a higher percentage of glucose values within the goal glucose range of 80 mg/dL to 180 mg/dL. In the future, we hope to automate the calculation of TDD and directly recommend a basal/bolus regimen for the clinical provider.
- ,,,,,.Hyperglycemia: an independent marker of in‐hospital mortality in patients with undiagnosed diabetes.J Clin Endocrinol Metab.2002;87:978–982.
- ,,,,,.Evaluation of glycemic control following discontinuation of an intensive insulin protocol.J Hosp Med.2009;4:28–34.
- ,,, et al.Inpatient management of hyperglycemia: the Northwestern experience.Endocr Pract.2006;12:491–505.
- ,,,.Intravenous insulin infusion therapy: indications, methods, and transition to subcutaneous insulin therapy.Endocr Pract.2004;10Suppl 2:71–80.
- ,,, et al.Conversion of intravenous insulin infusions to subcutaneously administered insulin glargine in patients with hyperglycemia.Endocr Pract.2006;12:641–650.
- ,.Effects of outcome on in‐hospital transition from intravenous insulin infusion to subcutaneous therapy.Am J Cardiol.2006;98:557–564.
- International Expert Committee report on the role of the A1C assay in the diagnosis of diabetes.Diabetes Care.2009;32:1327–1334.
- ,,, et al.Use of GHb (HbA1c) in screening for undiagnosed diabetes in the U.S. population.Diabetes Care.2000;23:187–191.
- ,,, et al.Utility of HbA(1c) levels for diabetes case finding in hospitalized patients with hyperglycemia.Diabetes Care.2003;26:1064–1068.
- ,,, et al.American Association of Clinical Endocrinologists and American Diabetes Association consensus statement on inpatient glycemic control.Endocr Pract.2009;15(4):353–369.
- ,,, et al.Pharmacokinetics and pharmacodynamics of subcutaneous injection of long‐acting human insulin analog glargine, NPH insulin, and ultralente human insulin and continuous subcutaneous infusion of insulin lispro.Diabetes.2000;49:2142–2148.
- ,,, et al.“Glucometrics”‐‐assessing the quality of inpatient glucose management.Diabetes Technol Ther.2006;8:560–569.
- ,,.Iatrogenic Inpatient Hypoglycemia: Risk Factors, Treatment, and Prevention: Analysis of Current Practice at an Academic Medical Center With Implications for Improvement Efforts.Diabetes Spectr.2008;21:241–247.
- ,,, et al.Management of diabetes and hyperglycemia in hospitals.Diabetes Care.2004;27:553–591.
- .Insulin management of diabetic patients on general medical and surgical floors.Endocr Pract.2006;12Suppl 3:86–90.
- ,,,.Inadequate blood glucose control is associated with in‐hospital mortality and morbidity in diabetic and nondiabetic patients undergoing cardiac surgery.Circulation.2008;118:113–123.
Hyperglycemia due to diabetes or stress is prevalent in the intensive care unit (ICU) and general ward setting. Umpierrez et al.1 reported hyperglycemia in 38% of hospitalized ward patients with 26% having a known history of diabetes. While patients with hyperglycemia admitted to the ICU are primarily treated with infusion insulin, those on the general wards usually receive a subcutaneous regimen of insulin. How best to transition patients from infusion insulin to a subcutaneous regimen remains elusive and under evaluated.
A recent observational pilot study of 24 surgical and 17 cardiac/medical intensive care patients at our university‐based hospital found that glycemic control significantly deteriorated when patients with diabetes transitioned from infusion insulin to subcutaneous insulin. A total of 21 critical care patients with a history of diabetes failed to receive basal insulin prior to discontinuation of the drip and developed uncontrolled hyperglycemia (mean glucose Day 1 of 216 mg/dL and Day 2 of 197 mg/dL). Patients without a history of diabetes did well post transition with a mean glucose of 142 mg/dL Day 1 and 133 mg/dL Day 2. A similar study by Czosnowski et al.2 demonstrated a significant increase in blood glucose from 123 26 mg/dL to 168 50 mg/dL upon discontinuation of infusion insulin.
This failed transition is disappointing, especially in view of the existence of a reliable subcutaneous (SC) insulin order set at our institution, but not surprising, as this is an inherently complex process. The severity of illness, the amount and mode of nutritional intake, geographic location, and provider team may all be in flux at the time of this transition. A few centers have demonstrated that a much improved transition is possible,36 however many of these solutions involve technology or incremental personnel that may not be available or the descriptions may lack sufficient detail to implement theses strategies with confidence elsewhere.
Therefore, we designed and piloted a protocol, coordinated by a multidisciplinary team, to transition patients from infusion insulin to SC insulin. The successful implementation of this protocol could serve as a blueprint to other institutions without the need for additional technology or personnel.
Methods
Patient Population/Setting
This was a prospective study of patients admitted to either the medical/cardiac intensive care unit (MICU/CCU) or surgical intensive care unit (SICU) at an academic medical facility and placed on infusion insulin for >24 hours. The Institutional Review Board (IRB) approved the study for prospective chart review and anonymous results reporting without individual consent.
Patients in the SICU were initiated on infusion insulin after 2 blood glucose readings were above 150 mg/dL, whereas initiation was left to the discretion of the attending physician in the MICU/CCU. A computerized system created in‐house recommends insulin infusion rates based on point‐of‐care (POC) glucose measurements with a target range of 91 mg/dL to 150 mg/dL.
Inclusion/Exclusion Criteria
All patients on continuous insulin infusion admitted to the SICU or the MICU/CCU between May 2008 and September 2008 were evaluated for the study (Figure 1). Patients were excluded from analysis if they were on the infusion for less than 24 hours, had a liver transplant, were discharged within 48 hours of transition, were made comfort care or transitioned to an insulin pump. All other patients were included in the final analysis.
Transition Protocol
Step 1: Does the Patient Need Basal SC Insulin?
Patients were recommended to receive basal SC insulin if they either: (1) were on medications for diabetes; (2) had an A1c 6%; or (3) received the equivalent of 60 mg of prednisone; AND had an infusion rate 1 unit/hour (Supporting Information Appendix 1). Patients on infusion insulin due to stress hyperglycemia, regardless of the infusion rate, were not placed on basal SC insulin. Patients on high dose steroids due to spinal injuries were excluded because their duration of steroid use was typically less than 48 hours and usually ended prior to the time of transition. The protocol recommends premeal correctional insulin for those not qualifying for basal insulin.
In order to establish patients in need of basal/nutritional insulin we opted to use A1c as well as past medical history to identify patients with diabetes. The American Diabetes Association (ADA) has recently accepted using an A1c 6.5% to make a new diagnosis of diabetes.7 In a 2‐week trial prior to initiating the protocol we used a cut off A1c of 6.5%. However, we found that patients with an A1c of 6% to 6.5% had poor glucose control post transition; therefore we chose 6% as our identifier. In addition, using a cut off A1c of 6% was reported by Rohlfing et al.8 and Greci et al.9 to be more than 97% sensitive at identifying a new diagnosis of diabetes.
To ensure an A1c was ordered and available at the time of transition, critical care pharmacists were given Pharmacy and Therapeutics Committee authorization to order an A1c at the start of the infusion. Pharmacists would also guide the primary team through the protocol's recommendations as well as alert the project team when a patient was expected to transition.
Step 2: Evaluate the Patient's Nutritional Intake to Calculate the Total Daily Dose (TDD) of Insulin
TDD is the total amount of insulin needed to cover both the nutritional and basal requirements of a patient over the course of 24 hours. TDD was calculated by averaging the hourly drip rate over the prior 6 hours and multiplying by 20 if taking in full nutrition or 40 if taking minimal nutrition while on the drip. A higher multiplier was used for those on minimal nutrition with the expectation that their insulin requirements would double once tolerating a full diet. Full nutrition was defined as eating >50% of meals, on goal tube feeds, or receiving total parenteral nutrition (TPN). Minimal nutrition was defined as taking nothing by mouth (or NPO), tolerating <50% of meals, or on a clear liquid diet.
Step 3: Divide the TDD Into the Appropriate Components of Insulin Treatment (Basal, Nutritional and Correction), Depending on the Nutritional Status
In Step 3, the TDD was evenly divided into basal and nutritional insulin. A total of 50% of the TDD was given as glargine (Lantus) 2 hours prior to stopping the infusion. The remaining 50% was divided into nutritional components as either Regular insulin every 6 hours for patients on tube feeds or lispro (Humalog) before meals if tolerating an oral diet. For patients on minimal nutrition, the 50% nutritional insulin dose was not initiated until the patient was tolerating full nutrition.
The protocol recommended basal insulin administration 2 hours prior to infusion discontinuation as recommended by the American Association of Clinical Endocrinologists (AACE) and ADA consensus statement on inpatient glycemic control as well as pharmacokinetics.10, 11 For these reasons, failure to receive basal insulin prior to transition was viewed as failure to follow the protocol.
Safety features of the protocol included a maximum TDD of 100 units unless the patient was on >100 units/day of insulin prior to admission. A pager was carried by rotating hospitalists or pharmacist study investigators at all hours during the protocol implementation phase to answer any questions regarding a patient's transition.
Data Collection/Monitoring
A multidisciplinary team consisting of hospitalists, ICU pharmacists, critical care physicians and nursing representatives was assembled during the study period. This team was responsible for protocol implementation, data collection, and surveillance of patient response to the protocol. Educational sessions with house staff and nurses in each unit were held prior to the beginning of the study as well as continued monthly educational efforts during the study. In addition, biweekly huddles to review ongoing patient transitions as well as more formal monthly reviews were held.
The primary objective was to improve glycemic control, defined as the mean daily glucose, during the first 48 hours post transition without a significant increase in the percentage of patients with hypoglycemia (41‐70 mg/dL) or severe hypoglycemia (40 mg/dL). Secondary endpoints included the percent of patients with severe hyperglycemia (300 mg/dL), length of stay (LOS) calculated from the day of transition, number of restarts back onto infusion insulin within 72 hours of transition, and day‐weighted glucose mean up to 12 days following transition for patients with diabetes.
Glucose values were collected and averaged over 6‐hour periods for 48 hours post transition. For patients with diabetes, POC glucose values were collected up to 12 days of hospitalization. Day‐weighted means were obtained by calculating the mean glucose for each hospital day, averaged across all hospital days.12
Analysis
Subjects were divided by the presence or absence of diabetes. Those with diabetes were recommended to receive basal SC insulin during the transition period. Within each group, subjects were further divided by adherence to the protocol. Failure to transition per protocol was defined as: not receiving at least 80% of the recommended basal insulin dose, receiving the initial dose of insulin after the drip was discontinued, or receiving basal insulin when none was recommended.
Descriptive statistics within subgroups comparing age, gender, LOS by analysis of variance for continuous data and by chi‐square for nominal data, were compared. Twenty‐four and 48‐hour post transition mean glucose values and the 12 day weighted‐mean glucose were compared using analysis of variance (Stata ver. 10). All data are expressed as mean standard deviation with a significance value established at P < 0.05.
Results
A total of 210 episodes of infusion insulin in ICU patients were evaluated for the study from May of 2008 to September 2008 (Figure 1). Ninety‐six of these episodes were excluded, most commonly due to time on infusion insulin <24 hours or transition to comfort care. The remaining 114 infusions were eligible to use the protocol. Because the protocol recommends insulin therapy based on a diagnosis of diabetes, patients were further divided into these subcategories. Of these 114 transitions, the protocol was followed 66 times (58%).
Patients With Diabetes
(Table 1: Patient Demographics; Table 2: Insulin Use and Glycemic Control; Figure 2: Transition Graph).
| Patients With Diabetes | P Value | Patients Without Diabetes | P Value | |||
|---|---|---|---|---|---|---|
| Protocol Followed, n = 29 Patients* | Protocol NOT Followed, n = 33 Patients | Protocol Followed, n = 30 Patients | Protocol NOT Followed, n = 9 Patients | |||
| ||||||
| Average age, years, mean SD | 57.7 12.1 | 57.8 12.3 | 0.681 | 56.5 18.1 | 62.4 15.5 | 0.532 |
| Male patients | 21 (72%) | 21 (63%) | 0.58 | 20 (66%) | 7 (77%) | 0.691 |
| BMI | 30.7 7.2 | 28.6 6.8 | 0.180 | 27 5.4 | 25.2 3 | 0.081 |
| History of diabetes* | 18 (64%) | 25 (86%) | 0.07 | 0 | 0 | |
| Mean Hgb A1c (%) | 6.61.2 | 7.3 1.8 | 0.136 | 5.6 0.3 | 5.4 0.4 | 0.095 |
| Full nutrition | 26 (79%) | 24 (61%) | 0.131 | 23 (70%) | 9 (100%) | |
| On hemodialysis | 5 (17%) | 9 (27%) | 0.380 | 3 (10%) | 0 | |
| On >60 mg prednisone or equivalent per day | 7 (24%) | 10 (30%) | 0.632 | 0 | 0 | |
| Patients With Diabetes | P Value | Patients Without Diabetes | P Value | |||
|---|---|---|---|---|---|---|
| Protocol Followed, n = 33 transitions | Protocol NOT followed, n = 39 transitions | Protocol Followed, n = 33 transitions | Protocol NOT Followed, n = 9 transitions | |||
| ||||||
| Average infusion rate, hours | 3.96 3.15 | 3.74 3.64 | 0.1597 | 2.34 1.5 | 4.78 1.6 | <0.001 |
| Average BG on infusion insulin (mg/dL) | 122.5 27.5 | 122.5 31.8 | 0.844 | 115.1 22.7 | 127.5 27.2 | 0.006 |
| Average basal dose (units) given | 34.5 14.4 | 14.4 15.3 | <0.001 | 0 | 32.7 | <0.001 |
| Hours before () or after (+) infusion stopped basal insulin given | 1.13 0.9 | 11.6 9.3 | <0.001 | n/a | 0.33 | * |
| Average BG 6 hours post transition (mg/dL) | 143.7 39.4 | 182 62.5 | 0.019 | 150.2 54.9 | 142.1 34.1 | 0.624 |
| Average BG 0 to 24 hours post transition (mg/dL) | 167.98 50.24 | 211.02 81.01 | <0.001 | 150.24 54.9 | 150.12 32.4 | 0.600 |
| Total insulin used from 0 to 24 hours (units) | 65 32.2 | 26.7 25.4 | <0.001 | 3.2 4.1 | 51.3 30.3 | <0.001 |
| Average BG 25 to 48 hours post transition (mg/dL) | 176.1 55.25 | 218.2 88.54 | <0.001 | 153 35.3 | 154.4 46.7 | 0.711 |
| Total insulin used from 25 to 48 hours (units) | 60.5 35.4 | 28.1 24.4 | <0.001 | 2.8 3.8 | 44.9 34 | <0.001 |
| # of patients with severe hypoglycemia (<40 mg/dL) | 1 (3%) | 1 (2.6%) | * | 0 | 1 | * |
| # of patients with hypoglycemia (4170 mg/dL) | 3 (9%) | 2 (5.1%) | * | 1 | 0 | * |
| % of BG values in goal range (80180 mg/dL) (# in range/total #) | 60.2% (153/254) | 38.2% (104/272) | 0.004 | 80.1% (173/216) | 75.4% (49/65) | 0.83 |
| # of patients with severe hyperglycemia (>300 mg/dL) | 5 (15.2%) | 19 (48.7%) | 0.002 | 1 (3%) | 1 (11.1%) | * |
| LOS from transition (days) | 14.6 11.3 | 14 11.4 | 0.836 | 25.3 24.4 | 13.6 7.5 | 0.168 |
A total of 62 individual patients accounted for 72 separate transitions in patients with diabetes based on past medical history or an A1c 6% (n = 14). Of these 72 transitions, 33 (46%) adhered to the protocol while the remaining 39 (54%) transitions varied from the protocol at the treatment team's discretion. Despite similar insulin infusion rates and mean glucose values pretransition, patients with diabetes following the protocol had better glycemic control at both 24 hours and 48 hours after transition than those patients transitioned without the protocol. Day 1 mean blood glucose was 168 mg/dL vs. 211 mg/dL (P = <0.001) and day 2 mean blood glucose was 176 mg/dL vs. 218 mg/dL (P = <0.001) in protocol vs. nonprotocol patients with diabetes respectively (Figure 2).
There was a severe hypoglycemic event (40 mg/dL) in 1 patient with diabetes following the protocol and 1 patient not following the protocol within 48 hours of transition. Both events were secondary to nutritional‐insulin mismatch with emesis after insulin in one case and tube feeds being held in the second case. These findings were consistent with our prior examination of hypoglycemia cases.13 Severe hyperglycemia (glucose 300mg/dL) occurred in 5 (15 %) patients following the protocol vs. 19 (49%) patients not following protocol (P = 0.002.) Patients with diabetes following the protocol received significantly more insulin in the first 24 hours (mean of 65 units vs. 27 units, P 0.001) and 24 to 48 hours after transition (mean of 61 units vs. 28 units, p0.001) than those not following protocol.
An alternate method used at our institution and others14, 15 to calculate TDD is based on the patient's weight and body habitus. When we compared the projected TDD based on weight with the TDD using the transition protocol, we found that the weight based method was much less aggressive. For patients following the protocol, the weight based method projected a mean TDD of 46.3 16.9 units whereas the protocol projected a mean TDD of 65 33.2 units (P = 0.001).
Patients with diabetes following protocol received basal insulin an average of 1.13 hours prior to discontinuing the insulin infusion versus 11.6 hours after for those not following protocol.
Three patients with diabetes following the protocol and 3 patients with diabetes not following the protocol were restarted on infusion insulin within 72 hours of transition.
LOS from final transition to discharge was similar between protocol vs. nonprotocol patients (14.6 vs. 14 days, P = 0.836).
Figure 3 demonstrates that when used correctly, the protocol provides an extended period of glycemic control up to 12 days post transition. Patients transitioned per protocol had a day‐weighted mean glucose of 155 mg/dL vs. 184 mg/dL (P = 0.043) in patients not following protocol. There was only 1 glucose value less than 40 mg/dL between days 2 to 12 in the protocol group.
Patients Without Diabetes
Of the 39 individual patients without diabetes there were 42 transition events, 33 transitions (78.6%) were per protocol and placed on correctional insulin only. The remaining 9 transitions failed to follow protocol in that basal insulin was prescribed, but these patients maintained comparable glycemic control without an increase in hypoglycemic events. Following transition, patients without diabetes on protocol maintained a mean glucose of 150 mg/dL in the first 24 hours and 153 mg/dL in 24 to 48 hours post transition. They required a mean daily correctional insulin dose of 3.2 units on Day 1 and 2.8 units on Day 2 despite having an average drip rate of 2.3 units/hour at the time of transition (Table 2). There were no severe hypoglycemic events and 80% of blood sugars were within the goal range of 80 mg/dL to 180 mg/dL. Only 1 patient had a single blood glucose of >300mg/dL. No patient was restarted on infusion insulin once transitioned.
Patients without diabetes had a longer LOS after transition off of infusion insulin when compared to their diabetic counterparts (22 vs. 14 days).
Discussion
This study demonstrates the utility of hospitalist‐pharmacist collaboration in the creation and implementation of a safe and effective transition protocol for patients on infusion insulin. The protocol identifies patients appropriate for transition to a basal/nutritional insulin regimen versus those who will do well with premeal correctional insulin alone. Daily mean glucose was improved post transition for diabetic patients following the protocol compared to those not following the protocol without an increase in hypoglycemic events.
We found an equal number of insulin infusion restarts within 72 hours of transition and a similar LOS in protocol vs. nonprotocol patients with diabetes. The LOS was increased for patients without diabetes. This may be due to worse outcomes noted in patients with stress hyperglycemia in other studies.1, 16
The use of the higher multiplier for patients on minimal nutrition led to confusion among many protocol users. The protocol has since been modified to start by averaging the infusion rate over the prior 6 hours and then multiplying by 20 for all patients. This essentially calculates 80% of projected insulin requirements for the next 24 hours based on the patient's current needs. This calculation is then given as 50% basal and 50% nutritional for those on full nutrition vs. 100% basal for those on minimal nutrition. This protocol change has no impact on the amount of insulin received by the patient, but is more intuitive to providers. Instead of calculating the TDD as the projected requirement when full nutrition is obtained, the TDD is now calculated based on current insulin needs, and then doubled when patients who are receiving minimal nutrition advance to full nutrition.
Our study is limited by the lack of a true randomized control group. In lieu of this, we used our patients who did not follow protocol as our control. While not truly randomized, this group is comparable based on their age, gender mix, infusion rate, mean A1c, and projected TDD. This group was also similar to our preprotocol group mentioned in the Introduction.
Additional study limitations include the small number of nondiabetic patients not following the protocol (n = 9). We noted higher infusion rates in nondiabetics not following protocol versus those following protocol, which may have driven the primary team to give basal insulin. It is possible that these 9 patients were not yet ready to transition from infusion insulin or had other stressors not measured in our study. Unfortunately their small population size limits more extensive analysis.
The protocol was followed only 50% of the time for a variety of reasons. Patients who transitioned at night or on weekends were monitored by covering pharmacists and physicians who may not have been familiar with the protocol. Many physicians and nurses remain fearful of hypoglycemia and the outcomes of our study were not yet available for education. Some reported difficulty fully understanding how to use the protocol and why a higher multiplier was used for patients who were on minimal nutrition.
Efforts to improve adherence to the protocol are ongoing with some success, aided by the data demonstrating the safety and efficacy of the transition protocol.
Conclusion
By collaborating with ICU pharmacists we were able to design and implement a protocol that successfully and safely transitioned patients from infusion insulin to subcutaneous insulin. Patients following the protocol had a higher percentage of glucose values within the goal glucose range of 80 mg/dL to 180 mg/dL. In the future, we hope to automate the calculation of TDD and directly recommend a basal/bolus regimen for the clinical provider.
- ,,,,,.Hyperglycemia: an independent marker of in‐hospital mortality in patients with undiagnosed diabetes.J Clin Endocrinol Metab.2002;87:978–982.
- ,,,,,.Evaluation of glycemic control following discontinuation of an intensive insulin protocol.J Hosp Med.2009;4:28–34.
- ,,, et al.Inpatient management of hyperglycemia: the Northwestern experience.Endocr Pract.2006;12:491–505.
- ,,,.Intravenous insulin infusion therapy: indications, methods, and transition to subcutaneous insulin therapy.Endocr Pract.2004;10Suppl 2:71–80.
- ,,, et al.Conversion of intravenous insulin infusions to subcutaneously administered insulin glargine in patients with hyperglycemia.Endocr Pract.2006;12:641–650.
- ,.Effects of outcome on in‐hospital transition from intravenous insulin infusion to subcutaneous therapy.Am J Cardiol.2006;98:557–564.
- International Expert Committee report on the role of the A1C assay in the diagnosis of diabetes.Diabetes Care.2009;32:1327–1334.
- ,,, et al.Use of GHb (HbA1c) in screening for undiagnosed diabetes in the U.S. population.Diabetes Care.2000;23:187–191.
- ,,, et al.Utility of HbA(1c) levels for diabetes case finding in hospitalized patients with hyperglycemia.Diabetes Care.2003;26:1064–1068.
- ,,, et al.American Association of Clinical Endocrinologists and American Diabetes Association consensus statement on inpatient glycemic control.Endocr Pract.2009;15(4):353–369.
- ,,, et al.Pharmacokinetics and pharmacodynamics of subcutaneous injection of long‐acting human insulin analog glargine, NPH insulin, and ultralente human insulin and continuous subcutaneous infusion of insulin lispro.Diabetes.2000;49:2142–2148.
- ,,, et al.“Glucometrics”‐‐assessing the quality of inpatient glucose management.Diabetes Technol Ther.2006;8:560–569.
- ,,.Iatrogenic Inpatient Hypoglycemia: Risk Factors, Treatment, and Prevention: Analysis of Current Practice at an Academic Medical Center With Implications for Improvement Efforts.Diabetes Spectr.2008;21:241–247.
- ,,, et al.Management of diabetes and hyperglycemia in hospitals.Diabetes Care.2004;27:553–591.
- .Insulin management of diabetic patients on general medical and surgical floors.Endocr Pract.2006;12Suppl 3:86–90.
- ,,,.Inadequate blood glucose control is associated with in‐hospital mortality and morbidity in diabetic and nondiabetic patients undergoing cardiac surgery.Circulation.2008;118:113–123.
Copyright © 2010 Society of Hospital Medicine