User login
Dabigatran: Will it change clinical practice?
Dabigatran etexilate (Pradaxa) is a new oral anticoagulant that has distinct advantages over warfarin (Coumadin) in terms of its ease of administration, efficacy, and safety.
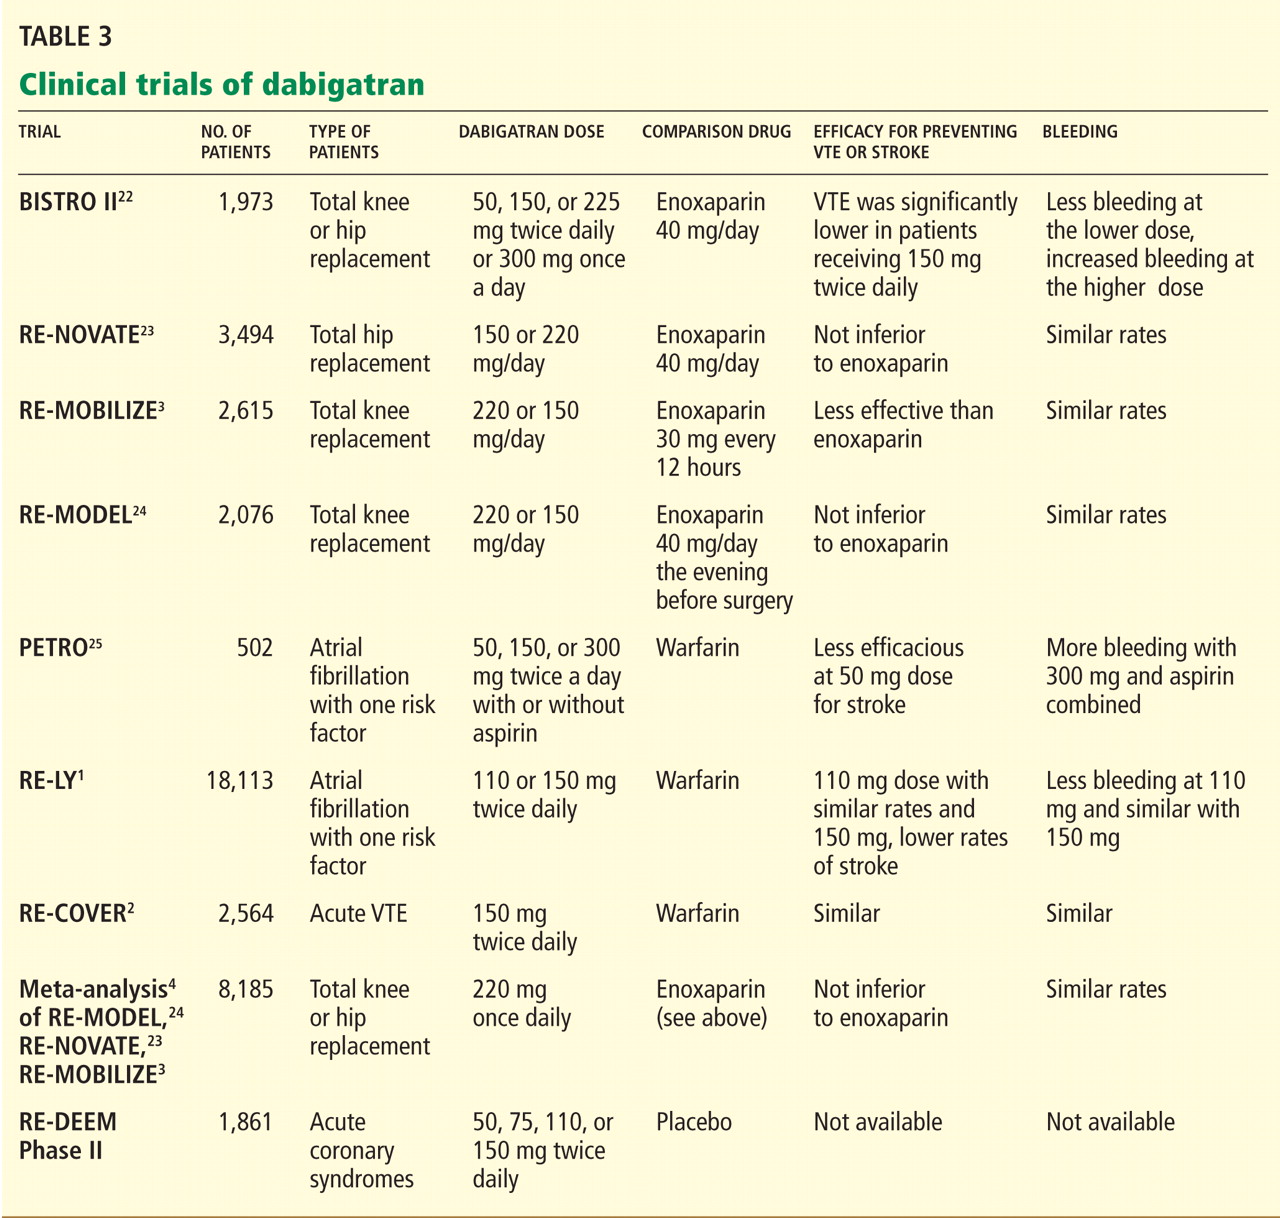
In the Randomized Evaluation of Long-Term Anticoagulation Therapy (RE-LY trial),1 in patients with nonvalvular atrial fibrillation, dabigatran 110 mg twice a day was found to be as good as warfarin in preventing systemic embolization and stroke (the primary outcome of the study), and at 150 mg twice a day it was superior.1 It has also shown efficacy in treating acute deep vein thrombosis and pulmonary embolism and in preventing these complications in orthopedic surgical patients.2–4
Dabigatran has been approved in 75 countries. It carries the trade name Pradaxa in Europe and the United States and Pradax in Canada. In October 2010, the US Food and Drug Administration (FDA) Cardiovascular and Renal Drugs Advisory Committee endorsed two twice-daily doses (75 mg and 150 mg) of dabigatran for the prevention of systemic embolization and stroke in patients with nonvalvular atrial fibrillation.
However, dabigatran is relatively expensive, and its current high cost might be a barrier to its wider use.
MANY PATIENTS NEED ANTICOAGULATION
Anticoagulation plays a vital role in the primary and secondary prevention of stroke in patients with atrial fibrillation and of pulmonary embolism in patients with venous thromboembolism. It is also used during cardiothoracic and vascular surgery, endovascular procedures, and dialysis and in patients with mechanical heart valves and hypercoagulable conditions.
Atrial fibrillation affects 3.03 million people in the United States (2005 figures), and this number is predicted to be as high as 7.56 million by 2050.5 More than 10% of people over the age of 80 years have it, and the lifetime risk of developing it is approximately 25%.6,7 Its most serious complication is ischemic stroke (the risk of which increases with age) and systemic embolization.5,8
Until the recent introduction of dabigatran, the only oral anticoagulant available in the United States for treating patients with atrial fibrillation was warfarin. Although warfarin has a number of disadvantages (see below), it is actually very effective for preventing ischemic stroke, reducing the incidence by as much as 65%.9,10
Venous thromboembolism is the third most common cardiovascular disorder after myocardial infarction and stroke.11 Although its exact incidence is unknown, nearly 1 million cases of it (incident or recurrent, fatal and nonfatal events) occur in the United States each year.12 Many patients with venous thromboembolism need oral anticoagulation long-term, and currently warfarin remains the only option for them as well.
NEEDED: A BETTER ANTICOAGULANT
Warfarin has been the most commonly prescribed oral anticoagulant in the United States for more than 60 years. As of 2004, more than 30 million outpatient prescriptions for it were filled annually in this country alone.13 However, warfarin has several important limitations.
Warfarin has a narrow therapeutic index. Patients taking it require monitoring of their international normalized ratio (INR) and frequent dose adjustments, and this is time-consuming and inconvenient. The target INR for patients with venous thromboembolism and atrial fibrillation is 2.0 to 3.0, whereas patients with a mechanical heart valve need a higher INR (2.5 to 3.5). If the INR is below these ranges, warfarin is less effective, with a risk of new thrombosis. On the other hand, if the INR is too high, there is a risk of bleeding.14 In fact, the most important side effect of warfarin is the risk of major and minor bleeding.13 However, even in well-designed clinical trials in which patients are closely managed, only 55% to 60% of patients regularly achieve their therapeutic target INR.1,2,14,15
Warfarin also interacts with many drugs and with some foods. Compliance is difficult. It has a slow onset of action. Genetic variations require dose adjustments. When switching from a parenteral anticoagulant, overlapping is required. Skin necrosis is a possible side effect. And warfarin is teratogenic.
Despite these limitations, the American College of Chest Physicians endorses warfarin to prevent or treat venous thromboembolism, and to prevent stroke in patients with atrial fibrillation.16
DABIGATRAN, A THROMBIN INHIBITOR
A prodrug, dabigatran is rapidly absorbed and converted to its active form. Its plasma concentration reaches a peak 1.5 to 3 hours after an oral dose, and it has an elimination half-life of 12 to 14 hours. About 80% of its excretion is by the kidneys and the remaining 20% is through bile.
Dabigatran is not metabolized by cytochrome P450 isoenzymes, and therefore it has few major interactions with other drugs. An exception is rifampin, a P-glycoprotein inducer that blocks dabigatran’s absorption in the gut, so this combination should be avoided. Another is quinidine, a strong P-glycoprotein inhibitor that is contraindicated for use with dabigatran. Also, amiodarone (Cordarone), another P-glycoprotein inhibitor, increases blood levels of dabigatran, and therefore a lower dose of dabigatran is recommended if these drugs are given together.18–20
DOES DABIGATRAN NEED MONITORING? CAN IT EVEN BE MONITORED?
Dabigatran has a predictable pharmacodynamic effect, and current data indicate it does not need regular monitoring.18–20 However, one may need to be able to measure the drug’s activity in certain situations, such as suspected overdose, bleeding, need for emergency surgery, impaired renal function, pregnancy, and obesity, and in children.20
Dabigatran has little effect on the prothrombin time or the INR, even at therapeutic concentrations.19 Further, its effect on the activated partial thromboplastin time (aPTT) is neither linear nor dose-dependent, and the aPTT reaches a plateau and becomes less sensitive at very high concentrations. Therefore, the aPTT does not appear to be an appropriate test to monitor dabigatran’s therapeutic anticoagulant effect, although it does provide a qualitative indication of anticoagulant activity.18,19
The thrombin time is a very sensitive method for determining if dabigatran is present, but the test lacks standardization; the ecarin clotting time provides better evidence of the dose but is not readily available at most institutions.18,19,21
EVALUATED IN CLINICAL TRIALS
DABIGATRAN IS EXPENSIVE BUT MAY BE COST-EFFECTIVE
The estimated price of dabigatran 150 mg twice a day in the United States is about $6.75 to $8.00 per day.26,27
Warfarin, in contrast, costs as little as $50 per year.28 However, this low price does not include the cost of monitoring the INR (office visits and laboratory testing), and these combined expenses are much higher than the price of the warfarin itself.29 In addition, warfarin requires time-consuming management when bridging to a parenteral anticoagulant (for reversal of its anticoagulant action) before routine health maintenance procedures such as dental work and colonoscopy and interventional procedures and surgery. Any bleeding complication will also add to its cost and will be associated with a decrease in the patient’s perceived health and quality of life, but this is true for both drugs.30
In today’s health care environment, controlling costs is a universal priority, but it may be unfair to compare the cost of dabigatran with that of warfarin alone. The expense and morbidity associated with stroke and intracranial bleeding are high, and if patients on dabigatran have fewer strokes (as seen in the RE-LY trial with dabigatran 150 mg twice a day) and no added expense of monitoring, then dabigatran may be cost-effective.
Freeman et al31 analyzed the cost-effectiveness of dabigatran, using an estimated cost of $13.70 per day and data from the RE-LY trial. They concluded that dabigatran may be a cost-effective alternative to warfarin in preventing ischemic stroke in patients considered at higher risk for ischemic stroke or intracranial hemorrhage, ie, those with a CHADS2 score of 1 or higher or equivalent. (The CHADS2 score is calculated as 1 point each for congestive heart failure, hypertension, age 75 or older, and diabetes mellitus; 2 points for prior stroke or transient ischemic attack.)
As more new-generation oral anticoagulants become available (see below), the price of dabigatran will undoubtedly decrease. Until then, warfarin will remain a cost-effective and cost-saving drug that cannot yet be considered obsolete.
WHO SHOULD RECEIVE DABIGATRAN?
The ideal patient for dabigatran treatment is not yet defined. The decision to convert a patient’s treatment from warfarin to dabigatran will likely depend on several factors, including the patient’s response to warfarin and the physician’s comfort with this new drug.
Many patients do extremely well with warfarin, requiring infrequent monitoring to maintain a therapeutic INR and having no bleeding complications. For them, it would be more practical to continue warfarin. Another reason for staying with warfarin would be if twice-a-day dosing would pose a problem.
Dabigatran would be a reasonable choice for a patient whose INR is erratic, who requires more frequent monitoring, for whom cost is not an issue, and for whom there is concern about dietary or drug interactions.
Another consideration is whether the patient has access to a health care facility for warfarin monitoring: this is difficult for those who cannot drive, who depend on others for transportation, and who live in rural areas.
Additionally, dabigatran may be a cost-effective alternative to warfarin for a patient with a high CHADS2 score who is considered at a higher risk for stroke.31
In all cases, the option should be considered only after an open discussion with the patient about the risks and benefits of this new drug.
WHO SHOULD NOT RECEIVE IT?
Dabigatran is a twice-daily drug with a short half-life. No patient with a history of poor compliance will be a good candidate for dabigatran. Since there are no practical laboratory tests for monitoring compliance, one will have to reinforce at every visit the importance of taking this medication according to instructions.
Patients with underlying kidney disease will need close monitoring of their creatinine clearance, with dose adjustment if renal function deteriorates.
Additionally, one should use caution when prescribing dabigatran to obese patients, pregnant women, or children until more is known about its use in these populations.
ADVANTAGES AND DISADVANTAGES OF DABIGATRAN
A reason may be that patients with atrial fibrillation and poor INR control have higher rates of death, stroke, myocardial infarction, and major bleeding.14 In most clinical trials, only 55% to 60% of patients achieve a therapeutic INR on warfarin, leaving them at risk of thrombosis or, conversely, bleeding.1,2,15,32 Dabigatran has predictable pharmacokinetics, and its twice-daily dosing allows for less variability in its anticoagulant effect, making it more consistently therapeutic with less potential for bleeding or thrombosis.1
The Canadian Cardiovascular Society included dabigatran in its 2010 guidelines on atrial fibrillation, recommending it or warfarin.33 The American College of Cardiology, the American Heart Association, and the Heart Rhythm Society now give dabigatran a class I B recommendation (benefit greater than risk, but limited populations studied) in secondary stroke prevention.34
On the other hand, major concerns are the lack of an antidote for dabigatran and a lack of experience in treating bleeding complications. Since dabigatran is not monitored, physicians may be uncertain if we are overdosing or undertreating. As we gain experience, we will learn how to treat bleeding complications. Until then, it will be important to anticipate this problem and to develop an algorithm based on the best available evidence in managing this complication.
Although the overall rates of bleeding in the RE-LY trial were lower with dabigatran than with warfarin, there were more gastrointestinal bleeding events with the 150-mg dose of dabigatran, which was not readily explained.
Further, the rate of dyspepsia was almost twice as high with dabigatran than with warfarin, regardless of the dose of dabigatran. There were also more dropouts in the 2nd year of follow-up in the dabigatran groups, with gastrointestinal intolerance being one of the major reasons. Therefore, dyspepsia may cause intolerance and noncompliance.1
Dabigatran must be taken twice a day and has a relatively short half-life. For a noncompliant patient, missing one or two doses will cause a reversal of its anticoagulation effect, leaving the patient susceptible to thrombosis. In comparison, warfarin has a longer half-life and is taken once a day, so missing a dose is less likely to result in a similar reversal of its anticoagulant effect.
SPECIAL CONDITIONS
Switching from other anticoagulants to dabigatran
When making the transition from a subcutaneously administered anticoagulant, ie, a low-molecular-weight heparin or the anti-Xa inhibitor fondaparinux (Arixtra), dabigatran should be started 0 to 2 hours before the next subcutaneous dose of the parenteral anticoagulant was to be given.21,35
When switching from unfractionated heparin given by continuous intravenous infusion, the first dose of dabigatran should be given at the time the infusion is stopped.
When switching from warfarin, dabigatran should be started once the patient’s INR is less than 2.0.
Switching from dabigatran to a parenteral anticoagulant
When switching from dabigatran back to a parenteral anticoagulant, allow 12 to 24 hours after the last dabigatran dose before starting the parenteral agent.21,35
Elective surgery or invasive procedures
The manufacturer recommends stopping dabigatran 1 to 2 days before elective surgery for patients who have normal renal function and a low risk of bleeding, or 3 to 5 days before surgery for patients who have a creatinine clearance of 50 mL/min or less. Before major surgery or placement of a spinal or epidural catheter, the manufacturer recommends that dabigatran be held even longer.35
If emergency surgery is needed
If emergency surgery is needed, the clinician must use his or her judgment as to the risks of bleeding vs those of postponing the surgery.21,35
Overdose or bleeding
No antidote for dabigatran is currently available. It has a short half-life (12–14 hours), and the treatment for overdose or bleeding is to discontinue it immediately, maintain adequate diuresis, and transfuse fresh-frozen plasma or red blood cells as indicated.
The role of activated charcoal given orally to reduce absorption is under evaluation, but the charcoal must be given within 1 to 2 hours after the overdose is taken.21
Dabigatran does not bind very much to plasma proteins and hence is dialyzable—an approach that may be necessary in cases of persistent or life-threatening bleeding.
Recombinant activated factor VII or prothrombin complex concentrates may be additional options in cases of severe bleeding.18,21
TOPICS OF FUTURE RESEARCH
A limitation of the dabigatran trials was that they did not enroll patients who had renal or liver impairment, cancer, or other comorbidities; pregnant women; or children. Other topics of future research include its use in patients weighing less than 48 kg or more than 110 kg, its efficacy in patients with thrombophilia, in patients with mechanical heart valves, and in long-term follow-up and the use of thrombolytics in patients with acute stroke who are on dabigatran.
WILL DABIGATRAN CHANGE CLINICAL PRACTICE?
Despite some of the challenges listed above, we believe that dabigatran is likely to change medical practice in patients requiring anticoagulation.
Dabigatran’s biggest use will most likely be in patients with atrial fibrillation, mainly because this is the largest group of people receiving anticoagulation. In addition, the incidence of atrial fibrillation rises with age, the US population is living longer, and patients generally require life-long anticoagulation once this condition develops.
Dabigatran may be approved for additional indications in the near future. It has already shown efficacy in primary and secondary prevention of venous thromboembolism. Other important areas to be studied include its use in patients with mechanical heart valves and thrombophilia.
Whether dabigatran will be a worthy substitute for the parenteral anticoagulants (heparin, low-molecular-weight heparins, or factor Xa inhibitors) is not yet known, but it will have an enormous impact on anticoagulation management if proved efficacious.
If dabigatran becomes a major substitute for warfarin, it will affect the anticoagulation clinics, with their well-trained staff, that are currently monitoring millions of patients in the United States. These clinics would no longer be needed, and laboratory and technical costs could be saved. A downside is that patients on dabigatran will not be as closely supervised and reminded to take their medication as patients on warfarin are now at these clinics. Instead, they will likely be supervised by their own physician (or assistants), who will need to become familiar with this anticoagulant. This may affect compliance with dabigatran.
OTHER NEW ORAL ANTICOAGULANTS ARE ON THE WAY
Other oral anticoagulants, including rivaroxaban (Xarelto) and apixaban (Eliquis), have been under study and show promise in preventing both thrombotic stroke and venous thromboembolism. They will likely compete with dabigatran once they are approved.
Rivaroxaban, an oral direct factor Xa inhibitor, is being investigated for stroke prevention in patients with atrial fibrillation. It has also been shown to be not inferior to (and to be less expensive than) enoxaparin in treating and preventing venous thromboembolism in patients undergoing hip or knee arthroplasty.32,36,37 Rivaroxaban has recently been approved by the FDA for this indication.
Apixaban, another direct factor Xa inhibitor, is also being studied for the prevention of stroke and systemic embolism in patients with nonvalvular atrial fibrillation. To date, there are no head-to-head trials comparing dabigatran with either of these new oral anticoagulants.
- Connolly SJ, Ezekowitz MD, Yusuf S, et al. Dabigatran versus warfarin in patients with atrial fibrillation. N Engl J Med 2009; 361:1139–1151.
- Schulman S, Kearon C, Kakkar AK, et al. Dabigatran versus warfarin in the treatment of acute venous thromboembolism. N Engl J Med 2009; 361:2342–2352.
- RE-MOBILIZE Writing Committee; Ginsberg JS, Davidson BL, Comp PC, et al. Oral thrombin inhibitor dabigatran etexilate vs North American enoxaparin regimen for prevention of venous thromboembolism after knee arthroplasty surgery. J Arthroplasty 2009; 24:1–9.
- Wolowacz SE, Roskell NS, Plumb JM, Caprini JA, Eriksson BI. Efficacy and safety of dabigatran etexilate for the prevention of venous thromboembolism following total hip or knee arthroplasty. A meta-analysis. Thromb Haemost 2009; 101:77–85.
- Naccarelli GV, Varker H, Lin J, Schulman KL. Increasing prevalence of atrial fibrillation and flutter in the United States. Am J Cardiol 2009; 104:1534–1539.
- Krahn AD, Manfreda J, Tate RB, Mathewson FA, Cuddy TE. The natural history of atrial fibrillation: incidence, risk factors, and prognosis in the Manitoba follow-up study. Am J Med 1995; 98:476–484.
- Lloyd-Jones DM, Wang TJ, Leip EP, et al. Lifetime risk for development of atrial fibrillation: the Framingham Heart Study. Circulation 2004; 110:1042–1046.
- Wolf PA, Abbott RD, Kannel WB. Atrial fibrillation as an independent risk factor for stroke: the Framingham study. Stroke 1991; 22:983–988.
- Go AS, Hylek EM, Chang Y, et al. Anticoagulation therapy for stroke prevention in atrial fibrillation: how well do randomized trials translate into clinical practice? JAMA 2003; 290:2685–2692.
- Singer DE, Chang Y, Fang MC, et al. The net clinical benefit of warfarin anticoagulation in atrial fibrillation. Ann Intern Med 2009; 151:297–305.
- Goldhaber SZ. Pulmonary embolism thrombolysis: a clarion call for international collaboration. J Am Coll Cardiol 1992; 19:246–247.
- Heit JA. The epidemiology of venous thromboembolism in the community. Arterioscler Thromb Vasc Biol 2008; 28:370–372.
- Wysowski DK, Nourjah P, Swartz L. Bleeding complications with warfarin use: a prevalent adverse effect resulting in regulatory action. Arch Intern Med 2007; 167:1414–1419.
- White HD, Gruber M, Feyzi J, et al. Comparison of outcomes among patients randomized to warfarin therapy according to anticoagulant control: results from SPORTIF III and V. Arch Intern Med 2007; 167:239–245.
- ACTIVE Writing Group of the ACTIVE Investigators; Connolly S, Pogue J, Hart R, et al. Clopidogrel plus aspirin versus oral anticoagulation for atrial fibrillation in the Atrial Fibrillation Clopidogrel Trial with Irbesartan for prevention of Vascular Events (ACTIVE W): a randomised controlled trial. Lancet 2006; 367:1903–1912.
- Geerts WH, Bergqvist D, Pineo GF, et al. Prevention of venous thromboembolism: American College of Chest Physicians evidence-based clinical practice guidelines (8th edition). Chest 2008; 133(6 suppl):381S–453S.
- Mungall D. BIBR-1048 Boehringer Ingelheim. Curr Opin Investig Drugs 2002; 3:905–907.
- Stangier J, Clemens A. Pharmacology, pharmacokinetics, and pharmacodynamics of dabigatran etexilate, an oral direct thrombin inhibitor. Clin Appl Thromb Hemost 2009; 15(suppl 1):9S–16S.
- Eisert WG, Hauel N, Stangier J, Wienen W, Clemens A, van Ryn J. Dabigatran: an oral novel potent reversible nonpeptide inhibitor of thrombin. Arterioscler Thromb Vasc Biol 2010; 30:1885–1889.
- Bounameaux H, Reber G. New oral antithrombotics: a need for laboratory monitoring. Against. J Thromb Haemost 2010; 8:627–630.
- van Ryn J, Stangier J, Haertter S, et al. Dabigatran etexilate—a novel, reversible, oral direct thrombin inhibitor: interpretation of coagulation assays and reversal of anticoagulant activity. Thromb Haemost 2010; 103:1116–1127.
- Eriksson BI, Dahl OE, Buller HR, et al. A new oral direct thrombin inhibitor, dabigatran etexilate, compared with enoxaparin for prevention of thromboembolic events following total hip or knee replacement: the BISTRO II randomized trial. J Thromb Haemost 2005; 3:103–111.
- Eriksson BI, Dahl OE, Rosencher N, et al. Dabigatran etexilate versus enoxaparin for prevention of venous thromboembolism after total hip replacement: a randomised, double-blind, non-inferiority trial. Lancet 2007; 370:949–956.
- Eriksson BI, Dahl OE, Rosencher N, et al. Oral dabigatran etexilate vs. subcutaneous enoxaparin for the prevention of venous thromboembolism after total knee replacement: the RE-MODEL randomized trial. J Thromb Haemost 2007; 5:2178–2185.
- Ezekowitz MD, Reilly PA, Nehmiz G, et al. Dabigatran with or without concomitant aspirin compared with warfarin alone in patients with nonvalvular atrial fibrillation (PETRO study). Am J Cardiol 2007; 100:1419–1426.
- Burger L. Bayer rival Boehringer prices blood pill at $6.75. Reuters, October 26, 2010. Available at http://www.reuters.com. Accessed September 12, 2011.
- Drugstore.com. Pradaxa. http://www.drugstore.com/pradaxa/bottle-60-150mg-capsules/qxn00597013554. Accessed September 10, 2011.
- Wal-Mart Stores, Inc. Retail Prescription Program Drug List. http://i.walmartimages.com/i/if/hmp/fusion/customer_list.pdf. Accessed September 10, 2011.
- Teachey DT. Dabigatran versus warfarin for venous thromboembolism (letter). N Engl J Med 2010; 362:1050; author reply1050–1051.
- Lancaster TR, Singer DE, Sheehan MA, et al. The impact of long-term warfarin therapy on quality of life. Evidence from a randomized trial. Boston Area Anticoagulation Trial for Atrial Fibrillation Investigators. Arch Intern Med 1991; 151:1944–1949.
- Freeman JV, Zhu RP, Owens DK, et al. Cost-effectiveness of dabigatran compared with warfarin for stroke prevention in atrial fibrillation. Ann Intern Med 2011; 154:1–11.
- EINSTEIN Investigators; Bauersachs R, Berkowitz SD, Brenner B, et al. Oral rivaroxaban for symptomatic venous thromboembolism. N Engl J Med 2010; 363:2499–2510.
- Cairns JA, Connolly S, McMurtry S, Stephenson M, Talajic M; CCS Atrial Fibrillation Guidelines Committee. Canadian Cardiovascular Society atrial fibrillation guidelines 2010: prevention of stroke and systemic embolization in atrial fibrillation and flutter. Can J Cardiol 2011; 27:74–90.
- Wann LS, Curtis AB, January CT, et al. 2011 ACCF/AHA/HRS focused update on the management of patients with atrial fibrillation (update on dabigatran): a Report of the American College of Cardiology Foundation/American Heart Association Task Force on Practice Guidelines. Circulation 2011; 123:1144–1150.
- Boehringer Ingelheim. Pradaxa prescribing information. http://www.pradaxa.com. Accessed September 8, 2011.
- Huisman MV, Quinlan DJ, Dahl OE, Schulman S. Enoxaparin versus dabigatran or rivaroxaban for thromboprophylaxis after hip or knee arthroplasty: results of separate pooled analyses of phase III multicenter randomized trials. Circ Cardiovasc Qual Outcomes 2010; 3:652–660.
- McCullagh L, Tilson L, Walsh C, Barry M. A cost-effectiveness model comparing rivaroxaban and dabigatran etexilate with enoxaparin sodium as thromboprophylaxis after total hip and total knee replacement in the Irish healthcare setting. Pharmacoeconomics 2009; 27:829–846.
Dabigatran etexilate (Pradaxa) is a new oral anticoagulant that has distinct advantages over warfarin (Coumadin) in terms of its ease of administration, efficacy, and safety.
In the Randomized Evaluation of Long-Term Anticoagulation Therapy (RE-LY trial),1 in patients with nonvalvular atrial fibrillation, dabigatran 110 mg twice a day was found to be as good as warfarin in preventing systemic embolization and stroke (the primary outcome of the study), and at 150 mg twice a day it was superior.1 It has also shown efficacy in treating acute deep vein thrombosis and pulmonary embolism and in preventing these complications in orthopedic surgical patients.2–4
Dabigatran has been approved in 75 countries. It carries the trade name Pradaxa in Europe and the United States and Pradax in Canada. In October 2010, the US Food and Drug Administration (FDA) Cardiovascular and Renal Drugs Advisory Committee endorsed two twice-daily doses (75 mg and 150 mg) of dabigatran for the prevention of systemic embolization and stroke in patients with nonvalvular atrial fibrillation.
However, dabigatran is relatively expensive, and its current high cost might be a barrier to its wider use.
MANY PATIENTS NEED ANTICOAGULATION
Anticoagulation plays a vital role in the primary and secondary prevention of stroke in patients with atrial fibrillation and of pulmonary embolism in patients with venous thromboembolism. It is also used during cardiothoracic and vascular surgery, endovascular procedures, and dialysis and in patients with mechanical heart valves and hypercoagulable conditions.
Atrial fibrillation affects 3.03 million people in the United States (2005 figures), and this number is predicted to be as high as 7.56 million by 2050.5 More than 10% of people over the age of 80 years have it, and the lifetime risk of developing it is approximately 25%.6,7 Its most serious complication is ischemic stroke (the risk of which increases with age) and systemic embolization.5,8
Until the recent introduction of dabigatran, the only oral anticoagulant available in the United States for treating patients with atrial fibrillation was warfarin. Although warfarin has a number of disadvantages (see below), it is actually very effective for preventing ischemic stroke, reducing the incidence by as much as 65%.9,10
Venous thromboembolism is the third most common cardiovascular disorder after myocardial infarction and stroke.11 Although its exact incidence is unknown, nearly 1 million cases of it (incident or recurrent, fatal and nonfatal events) occur in the United States each year.12 Many patients with venous thromboembolism need oral anticoagulation long-term, and currently warfarin remains the only option for them as well.
NEEDED: A BETTER ANTICOAGULANT
Warfarin has been the most commonly prescribed oral anticoagulant in the United States for more than 60 years. As of 2004, more than 30 million outpatient prescriptions for it were filled annually in this country alone.13 However, warfarin has several important limitations.
Warfarin has a narrow therapeutic index. Patients taking it require monitoring of their international normalized ratio (INR) and frequent dose adjustments, and this is time-consuming and inconvenient. The target INR for patients with venous thromboembolism and atrial fibrillation is 2.0 to 3.0, whereas patients with a mechanical heart valve need a higher INR (2.5 to 3.5). If the INR is below these ranges, warfarin is less effective, with a risk of new thrombosis. On the other hand, if the INR is too high, there is a risk of bleeding.14 In fact, the most important side effect of warfarin is the risk of major and minor bleeding.13 However, even in well-designed clinical trials in which patients are closely managed, only 55% to 60% of patients regularly achieve their therapeutic target INR.1,2,14,15
Warfarin also interacts with many drugs and with some foods. Compliance is difficult. It has a slow onset of action. Genetic variations require dose adjustments. When switching from a parenteral anticoagulant, overlapping is required. Skin necrosis is a possible side effect. And warfarin is teratogenic.
Despite these limitations, the American College of Chest Physicians endorses warfarin to prevent or treat venous thromboembolism, and to prevent stroke in patients with atrial fibrillation.16
DABIGATRAN, A THROMBIN INHIBITOR
A prodrug, dabigatran is rapidly absorbed and converted to its active form. Its plasma concentration reaches a peak 1.5 to 3 hours after an oral dose, and it has an elimination half-life of 12 to 14 hours. About 80% of its excretion is by the kidneys and the remaining 20% is through bile.
Dabigatran is not metabolized by cytochrome P450 isoenzymes, and therefore it has few major interactions with other drugs. An exception is rifampin, a P-glycoprotein inducer that blocks dabigatran’s absorption in the gut, so this combination should be avoided. Another is quinidine, a strong P-glycoprotein inhibitor that is contraindicated for use with dabigatran. Also, amiodarone (Cordarone), another P-glycoprotein inhibitor, increases blood levels of dabigatran, and therefore a lower dose of dabigatran is recommended if these drugs are given together.18–20
DOES DABIGATRAN NEED MONITORING? CAN IT EVEN BE MONITORED?
Dabigatran has a predictable pharmacodynamic effect, and current data indicate it does not need regular monitoring.18–20 However, one may need to be able to measure the drug’s activity in certain situations, such as suspected overdose, bleeding, need for emergency surgery, impaired renal function, pregnancy, and obesity, and in children.20
Dabigatran has little effect on the prothrombin time or the INR, even at therapeutic concentrations.19 Further, its effect on the activated partial thromboplastin time (aPTT) is neither linear nor dose-dependent, and the aPTT reaches a plateau and becomes less sensitive at very high concentrations. Therefore, the aPTT does not appear to be an appropriate test to monitor dabigatran’s therapeutic anticoagulant effect, although it does provide a qualitative indication of anticoagulant activity.18,19
The thrombin time is a very sensitive method for determining if dabigatran is present, but the test lacks standardization; the ecarin clotting time provides better evidence of the dose but is not readily available at most institutions.18,19,21
EVALUATED IN CLINICAL TRIALS
DABIGATRAN IS EXPENSIVE BUT MAY BE COST-EFFECTIVE
The estimated price of dabigatran 150 mg twice a day in the United States is about $6.75 to $8.00 per day.26,27
Warfarin, in contrast, costs as little as $50 per year.28 However, this low price does not include the cost of monitoring the INR (office visits and laboratory testing), and these combined expenses are much higher than the price of the warfarin itself.29 In addition, warfarin requires time-consuming management when bridging to a parenteral anticoagulant (for reversal of its anticoagulant action) before routine health maintenance procedures such as dental work and colonoscopy and interventional procedures and surgery. Any bleeding complication will also add to its cost and will be associated with a decrease in the patient’s perceived health and quality of life, but this is true for both drugs.30
In today’s health care environment, controlling costs is a universal priority, but it may be unfair to compare the cost of dabigatran with that of warfarin alone. The expense and morbidity associated with stroke and intracranial bleeding are high, and if patients on dabigatran have fewer strokes (as seen in the RE-LY trial with dabigatran 150 mg twice a day) and no added expense of monitoring, then dabigatran may be cost-effective.
Freeman et al31 analyzed the cost-effectiveness of dabigatran, using an estimated cost of $13.70 per day and data from the RE-LY trial. They concluded that dabigatran may be a cost-effective alternative to warfarin in preventing ischemic stroke in patients considered at higher risk for ischemic stroke or intracranial hemorrhage, ie, those with a CHADS2 score of 1 or higher or equivalent. (The CHADS2 score is calculated as 1 point each for congestive heart failure, hypertension, age 75 or older, and diabetes mellitus; 2 points for prior stroke or transient ischemic attack.)
As more new-generation oral anticoagulants become available (see below), the price of dabigatran will undoubtedly decrease. Until then, warfarin will remain a cost-effective and cost-saving drug that cannot yet be considered obsolete.
WHO SHOULD RECEIVE DABIGATRAN?
The ideal patient for dabigatran treatment is not yet defined. The decision to convert a patient’s treatment from warfarin to dabigatran will likely depend on several factors, including the patient’s response to warfarin and the physician’s comfort with this new drug.
Many patients do extremely well with warfarin, requiring infrequent monitoring to maintain a therapeutic INR and having no bleeding complications. For them, it would be more practical to continue warfarin. Another reason for staying with warfarin would be if twice-a-day dosing would pose a problem.
Dabigatran would be a reasonable choice for a patient whose INR is erratic, who requires more frequent monitoring, for whom cost is not an issue, and for whom there is concern about dietary or drug interactions.
Another consideration is whether the patient has access to a health care facility for warfarin monitoring: this is difficult for those who cannot drive, who depend on others for transportation, and who live in rural areas.
Additionally, dabigatran may be a cost-effective alternative to warfarin for a patient with a high CHADS2 score who is considered at a higher risk for stroke.31
In all cases, the option should be considered only after an open discussion with the patient about the risks and benefits of this new drug.
WHO SHOULD NOT RECEIVE IT?
Dabigatran is a twice-daily drug with a short half-life. No patient with a history of poor compliance will be a good candidate for dabigatran. Since there are no practical laboratory tests for monitoring compliance, one will have to reinforce at every visit the importance of taking this medication according to instructions.
Patients with underlying kidney disease will need close monitoring of their creatinine clearance, with dose adjustment if renal function deteriorates.
Additionally, one should use caution when prescribing dabigatran to obese patients, pregnant women, or children until more is known about its use in these populations.
ADVANTAGES AND DISADVANTAGES OF DABIGATRAN
A reason may be that patients with atrial fibrillation and poor INR control have higher rates of death, stroke, myocardial infarction, and major bleeding.14 In most clinical trials, only 55% to 60% of patients achieve a therapeutic INR on warfarin, leaving them at risk of thrombosis or, conversely, bleeding.1,2,15,32 Dabigatran has predictable pharmacokinetics, and its twice-daily dosing allows for less variability in its anticoagulant effect, making it more consistently therapeutic with less potential for bleeding or thrombosis.1
The Canadian Cardiovascular Society included dabigatran in its 2010 guidelines on atrial fibrillation, recommending it or warfarin.33 The American College of Cardiology, the American Heart Association, and the Heart Rhythm Society now give dabigatran a class I B recommendation (benefit greater than risk, but limited populations studied) in secondary stroke prevention.34
On the other hand, major concerns are the lack of an antidote for dabigatran and a lack of experience in treating bleeding complications. Since dabigatran is not monitored, physicians may be uncertain if we are overdosing or undertreating. As we gain experience, we will learn how to treat bleeding complications. Until then, it will be important to anticipate this problem and to develop an algorithm based on the best available evidence in managing this complication.
Although the overall rates of bleeding in the RE-LY trial were lower with dabigatran than with warfarin, there were more gastrointestinal bleeding events with the 150-mg dose of dabigatran, which was not readily explained.
Further, the rate of dyspepsia was almost twice as high with dabigatran than with warfarin, regardless of the dose of dabigatran. There were also more dropouts in the 2nd year of follow-up in the dabigatran groups, with gastrointestinal intolerance being one of the major reasons. Therefore, dyspepsia may cause intolerance and noncompliance.1
Dabigatran must be taken twice a day and has a relatively short half-life. For a noncompliant patient, missing one or two doses will cause a reversal of its anticoagulation effect, leaving the patient susceptible to thrombosis. In comparison, warfarin has a longer half-life and is taken once a day, so missing a dose is less likely to result in a similar reversal of its anticoagulant effect.
SPECIAL CONDITIONS
Switching from other anticoagulants to dabigatran
When making the transition from a subcutaneously administered anticoagulant, ie, a low-molecular-weight heparin or the anti-Xa inhibitor fondaparinux (Arixtra), dabigatran should be started 0 to 2 hours before the next subcutaneous dose of the parenteral anticoagulant was to be given.21,35
When switching from unfractionated heparin given by continuous intravenous infusion, the first dose of dabigatran should be given at the time the infusion is stopped.
When switching from warfarin, dabigatran should be started once the patient’s INR is less than 2.0.
Switching from dabigatran to a parenteral anticoagulant
When switching from dabigatran back to a parenteral anticoagulant, allow 12 to 24 hours after the last dabigatran dose before starting the parenteral agent.21,35
Elective surgery or invasive procedures
The manufacturer recommends stopping dabigatran 1 to 2 days before elective surgery for patients who have normal renal function and a low risk of bleeding, or 3 to 5 days before surgery for patients who have a creatinine clearance of 50 mL/min or less. Before major surgery or placement of a spinal or epidural catheter, the manufacturer recommends that dabigatran be held even longer.35
If emergency surgery is needed
If emergency surgery is needed, the clinician must use his or her judgment as to the risks of bleeding vs those of postponing the surgery.21,35
Overdose or bleeding
No antidote for dabigatran is currently available. It has a short half-life (12–14 hours), and the treatment for overdose or bleeding is to discontinue it immediately, maintain adequate diuresis, and transfuse fresh-frozen plasma or red blood cells as indicated.
The role of activated charcoal given orally to reduce absorption is under evaluation, but the charcoal must be given within 1 to 2 hours after the overdose is taken.21
Dabigatran does not bind very much to plasma proteins and hence is dialyzable—an approach that may be necessary in cases of persistent or life-threatening bleeding.
Recombinant activated factor VII or prothrombin complex concentrates may be additional options in cases of severe bleeding.18,21
TOPICS OF FUTURE RESEARCH
A limitation of the dabigatran trials was that they did not enroll patients who had renal or liver impairment, cancer, or other comorbidities; pregnant women; or children. Other topics of future research include its use in patients weighing less than 48 kg or more than 110 kg, its efficacy in patients with thrombophilia, in patients with mechanical heart valves, and in long-term follow-up and the use of thrombolytics in patients with acute stroke who are on dabigatran.
WILL DABIGATRAN CHANGE CLINICAL PRACTICE?
Despite some of the challenges listed above, we believe that dabigatran is likely to change medical practice in patients requiring anticoagulation.
Dabigatran’s biggest use will most likely be in patients with atrial fibrillation, mainly because this is the largest group of people receiving anticoagulation. In addition, the incidence of atrial fibrillation rises with age, the US population is living longer, and patients generally require life-long anticoagulation once this condition develops.
Dabigatran may be approved for additional indications in the near future. It has already shown efficacy in primary and secondary prevention of venous thromboembolism. Other important areas to be studied include its use in patients with mechanical heart valves and thrombophilia.
Whether dabigatran will be a worthy substitute for the parenteral anticoagulants (heparin, low-molecular-weight heparins, or factor Xa inhibitors) is not yet known, but it will have an enormous impact on anticoagulation management if proved efficacious.
If dabigatran becomes a major substitute for warfarin, it will affect the anticoagulation clinics, with their well-trained staff, that are currently monitoring millions of patients in the United States. These clinics would no longer be needed, and laboratory and technical costs could be saved. A downside is that patients on dabigatran will not be as closely supervised and reminded to take their medication as patients on warfarin are now at these clinics. Instead, they will likely be supervised by their own physician (or assistants), who will need to become familiar with this anticoagulant. This may affect compliance with dabigatran.
OTHER NEW ORAL ANTICOAGULANTS ARE ON THE WAY
Other oral anticoagulants, including rivaroxaban (Xarelto) and apixaban (Eliquis), have been under study and show promise in preventing both thrombotic stroke and venous thromboembolism. They will likely compete with dabigatran once they are approved.
Rivaroxaban, an oral direct factor Xa inhibitor, is being investigated for stroke prevention in patients with atrial fibrillation. It has also been shown to be not inferior to (and to be less expensive than) enoxaparin in treating and preventing venous thromboembolism in patients undergoing hip or knee arthroplasty.32,36,37 Rivaroxaban has recently been approved by the FDA for this indication.
Apixaban, another direct factor Xa inhibitor, is also being studied for the prevention of stroke and systemic embolism in patients with nonvalvular atrial fibrillation. To date, there are no head-to-head trials comparing dabigatran with either of these new oral anticoagulants.
- Connolly SJ, Ezekowitz MD, Yusuf S, et al. Dabigatran versus warfarin in patients with atrial fibrillation. N Engl J Med 2009; 361:1139–1151.
- Schulman S, Kearon C, Kakkar AK, et al. Dabigatran versus warfarin in the treatment of acute venous thromboembolism. N Engl J Med 2009; 361:2342–2352.
- RE-MOBILIZE Writing Committee; Ginsberg JS, Davidson BL, Comp PC, et al. Oral thrombin inhibitor dabigatran etexilate vs North American enoxaparin regimen for prevention of venous thromboembolism after knee arthroplasty surgery. J Arthroplasty 2009; 24:1–9.
- Wolowacz SE, Roskell NS, Plumb JM, Caprini JA, Eriksson BI. Efficacy and safety of dabigatran etexilate for the prevention of venous thromboembolism following total hip or knee arthroplasty. A meta-analysis. Thromb Haemost 2009; 101:77–85.
- Naccarelli GV, Varker H, Lin J, Schulman KL. Increasing prevalence of atrial fibrillation and flutter in the United States. Am J Cardiol 2009; 104:1534–1539.
- Krahn AD, Manfreda J, Tate RB, Mathewson FA, Cuddy TE. The natural history of atrial fibrillation: incidence, risk factors, and prognosis in the Manitoba follow-up study. Am J Med 1995; 98:476–484.
- Lloyd-Jones DM, Wang TJ, Leip EP, et al. Lifetime risk for development of atrial fibrillation: the Framingham Heart Study. Circulation 2004; 110:1042–1046.
- Wolf PA, Abbott RD, Kannel WB. Atrial fibrillation as an independent risk factor for stroke: the Framingham study. Stroke 1991; 22:983–988.
- Go AS, Hylek EM, Chang Y, et al. Anticoagulation therapy for stroke prevention in atrial fibrillation: how well do randomized trials translate into clinical practice? JAMA 2003; 290:2685–2692.
- Singer DE, Chang Y, Fang MC, et al. The net clinical benefit of warfarin anticoagulation in atrial fibrillation. Ann Intern Med 2009; 151:297–305.
- Goldhaber SZ. Pulmonary embolism thrombolysis: a clarion call for international collaboration. J Am Coll Cardiol 1992; 19:246–247.
- Heit JA. The epidemiology of venous thromboembolism in the community. Arterioscler Thromb Vasc Biol 2008; 28:370–372.
- Wysowski DK, Nourjah P, Swartz L. Bleeding complications with warfarin use: a prevalent adverse effect resulting in regulatory action. Arch Intern Med 2007; 167:1414–1419.
- White HD, Gruber M, Feyzi J, et al. Comparison of outcomes among patients randomized to warfarin therapy according to anticoagulant control: results from SPORTIF III and V. Arch Intern Med 2007; 167:239–245.
- ACTIVE Writing Group of the ACTIVE Investigators; Connolly S, Pogue J, Hart R, et al. Clopidogrel plus aspirin versus oral anticoagulation for atrial fibrillation in the Atrial Fibrillation Clopidogrel Trial with Irbesartan for prevention of Vascular Events (ACTIVE W): a randomised controlled trial. Lancet 2006; 367:1903–1912.
- Geerts WH, Bergqvist D, Pineo GF, et al. Prevention of venous thromboembolism: American College of Chest Physicians evidence-based clinical practice guidelines (8th edition). Chest 2008; 133(6 suppl):381S–453S.
- Mungall D. BIBR-1048 Boehringer Ingelheim. Curr Opin Investig Drugs 2002; 3:905–907.
- Stangier J, Clemens A. Pharmacology, pharmacokinetics, and pharmacodynamics of dabigatran etexilate, an oral direct thrombin inhibitor. Clin Appl Thromb Hemost 2009; 15(suppl 1):9S–16S.
- Eisert WG, Hauel N, Stangier J, Wienen W, Clemens A, van Ryn J. Dabigatran: an oral novel potent reversible nonpeptide inhibitor of thrombin. Arterioscler Thromb Vasc Biol 2010; 30:1885–1889.
- Bounameaux H, Reber G. New oral antithrombotics: a need for laboratory monitoring. Against. J Thromb Haemost 2010; 8:627–630.
- van Ryn J, Stangier J, Haertter S, et al. Dabigatran etexilate—a novel, reversible, oral direct thrombin inhibitor: interpretation of coagulation assays and reversal of anticoagulant activity. Thromb Haemost 2010; 103:1116–1127.
- Eriksson BI, Dahl OE, Buller HR, et al. A new oral direct thrombin inhibitor, dabigatran etexilate, compared with enoxaparin for prevention of thromboembolic events following total hip or knee replacement: the BISTRO II randomized trial. J Thromb Haemost 2005; 3:103–111.
- Eriksson BI, Dahl OE, Rosencher N, et al. Dabigatran etexilate versus enoxaparin for prevention of venous thromboembolism after total hip replacement: a randomised, double-blind, non-inferiority trial. Lancet 2007; 370:949–956.
- Eriksson BI, Dahl OE, Rosencher N, et al. Oral dabigatran etexilate vs. subcutaneous enoxaparin for the prevention of venous thromboembolism after total knee replacement: the RE-MODEL randomized trial. J Thromb Haemost 2007; 5:2178–2185.
- Ezekowitz MD, Reilly PA, Nehmiz G, et al. Dabigatran with or without concomitant aspirin compared with warfarin alone in patients with nonvalvular atrial fibrillation (PETRO study). Am J Cardiol 2007; 100:1419–1426.
- Burger L. Bayer rival Boehringer prices blood pill at $6.75. Reuters, October 26, 2010. Available at http://www.reuters.com. Accessed September 12, 2011.
- Drugstore.com. Pradaxa. http://www.drugstore.com/pradaxa/bottle-60-150mg-capsules/qxn00597013554. Accessed September 10, 2011.
- Wal-Mart Stores, Inc. Retail Prescription Program Drug List. http://i.walmartimages.com/i/if/hmp/fusion/customer_list.pdf. Accessed September 10, 2011.
- Teachey DT. Dabigatran versus warfarin for venous thromboembolism (letter). N Engl J Med 2010; 362:1050; author reply1050–1051.
- Lancaster TR, Singer DE, Sheehan MA, et al. The impact of long-term warfarin therapy on quality of life. Evidence from a randomized trial. Boston Area Anticoagulation Trial for Atrial Fibrillation Investigators. Arch Intern Med 1991; 151:1944–1949.
- Freeman JV, Zhu RP, Owens DK, et al. Cost-effectiveness of dabigatran compared with warfarin for stroke prevention in atrial fibrillation. Ann Intern Med 2011; 154:1–11.
- EINSTEIN Investigators; Bauersachs R, Berkowitz SD, Brenner B, et al. Oral rivaroxaban for symptomatic venous thromboembolism. N Engl J Med 2010; 363:2499–2510.
- Cairns JA, Connolly S, McMurtry S, Stephenson M, Talajic M; CCS Atrial Fibrillation Guidelines Committee. Canadian Cardiovascular Society atrial fibrillation guidelines 2010: prevention of stroke and systemic embolization in atrial fibrillation and flutter. Can J Cardiol 2011; 27:74–90.
- Wann LS, Curtis AB, January CT, et al. 2011 ACCF/AHA/HRS focused update on the management of patients with atrial fibrillation (update on dabigatran): a Report of the American College of Cardiology Foundation/American Heart Association Task Force on Practice Guidelines. Circulation 2011; 123:1144–1150.
- Boehringer Ingelheim. Pradaxa prescribing information. http://www.pradaxa.com. Accessed September 8, 2011.
- Huisman MV, Quinlan DJ, Dahl OE, Schulman S. Enoxaparin versus dabigatran or rivaroxaban for thromboprophylaxis after hip or knee arthroplasty: results of separate pooled analyses of phase III multicenter randomized trials. Circ Cardiovasc Qual Outcomes 2010; 3:652–660.
- McCullagh L, Tilson L, Walsh C, Barry M. A cost-effectiveness model comparing rivaroxaban and dabigatran etexilate with enoxaparin sodium as thromboprophylaxis after total hip and total knee replacement in the Irish healthcare setting. Pharmacoeconomics 2009; 27:829–846.
KEY POINTS
- Dabigatran is a potent, reversible, direct thrombin inhibitor. Available only in oral form, it has a rapid onset of action, a predictable anticoagulant response, and few major interactions.
- Dabigatran does not require dose adjustments (except for renal insufficiency) or monitoring of its effect during treatment.
- In trials in patients with nonvalvular atrial fibrillation, two different doses of dabigatran were compared with warfarin. Less bleeding occurred with the lower dose than with warfarin, while the higher dose was more effective than warfarin in preventing stroke and systemic embolization.
- The American College of Cardiology, the American Heart Association, and the Heart Rhythm Society have given dabigatran a class I B recommendation for secondary stroke prevention in patients with nonvalvular atrial fibrillation.
What is the optimal duration of bisphosphonate therapy?
Almost all the data about the safety and efficacy of bisphosphonate drugs for treating osteoporosis are from patients who took them for less than 5 years.
Reports of adverse effects with prolonged use have caused concern about the long-term safety of this class of drugs. This is particularly important because these drugs are retained in the skeleton longer than 10 years, because there are physiologic reasons why excessive bisphosphonate-induced inhibition of bone turnover could be damaging, and because many healthy postmenopausal women have been prescribed bisphosphonates in the hope of preventing fractures that are not expected to occur for 20 to 30 years.
Because information from trials is scant, opinions differ over whether bisphosphonates should be continued indefinitely. In this article, I summarize the physiologic mechanisms of these drugs, review the scant existing data about their effects beyond 5 years, and describe my approach to bisphosphonate therapy (while waiting for better evidence).
MORE THAN 4 MILLION WOMEN TAKE BISPHOSPHONATES
The first medical use of a bisphosphonate was in 1967, when a girl with myositis ossificans was given etidronate (Didronel) because it inhibited mineralization. Two years later, it was given to patients with Paget disease of bone because it was found to inhibit bone resorption.1 Etidronate could not be given for longer than 6 months, however, because patients developed osteomalacia.
Adding a nitrogen to the molecule dramatically increased its potency and led to the second generation of bisphosphonates. Alendronate (Fosamax), the first amino-bisphosphonate, became available in 1995, It was followed by risedronate (Actonel), ibandronate (Boniva), and zoledronic acid (Reclast). These drugs are potent inhibitors of bone resorption; however, in clinical doses they do not inhibit mineralization and therefore do not cause osteomalacia.
Randomized clinical trials involving more than 30,000 patients have provided grade A evidence that these drugs reduce the incidence of fragility fractures in patients with osteoporosis.2 Furthermore, observational studies have confirmed that they prevent fractures and have a good safety profile in clinical practice.
Therefore, the use of these drugs has become common. In 2008, an estimated 4 million women in the United States were taking them.3
BISPHOSPHONATES STRENGTHEN BONE BY INHIBITING RESORPTION
On a molecular level, bisphosphonates inhibit farnesyl pyrophosphate synthase, an enzyme necessary for formation of the cytoskeleton in osteoclasts. Thus, they strongly inhibit bone resorption. They do not appear to directly inhibit osteoblasts, the cells that form new bone, but they substantially decrease bone formation indirectly.4
To understand how inhibition of bone resorption affects bone physiology, it is necessary to appreciate the nature of bone remodeling. Bone is not like the skin, which is continually forming a new layer and sloughing off the old. Instead, bone is renewed in small units. It takes about 5 years to remodel cancellous bone and 13 years to remodel cortical bone5; at any one time, about 8% of the surface is being remodeled.
The first step occurs at a spot on the surface, where the osteoclasts resorb some bone to form a pit that looks like a pothole. Then a team of osteoblasts is formed and fills the pit with new bone over the next 3 to 6 months. When first formed, the new bone is mainly collagen and, like the tip of the nose, is not very stiff, but with mineral deposition the bone becomes stronger, like the bridge of the nose. The new bone gradually accumulates mineral and becomes harder and denser over the next 3 years.
When a bisphosphonate is given, the osteoclasts abruptly stop resorbing the bone, but osteoblasts continue to fill the pits that were there when the bisphosphonate was started. For the next several months, while the previous pits are being filled, the bone volume increases slightly. Thereafter, rates of both bone resorption and bone formation are very low.
A misconception: Bisphosphonates build bone
While semantically it is true that the bone formation rate in patients taking bisphosphonates is within the normal premenopausal range, this often-repeated statement is essentially misleading.
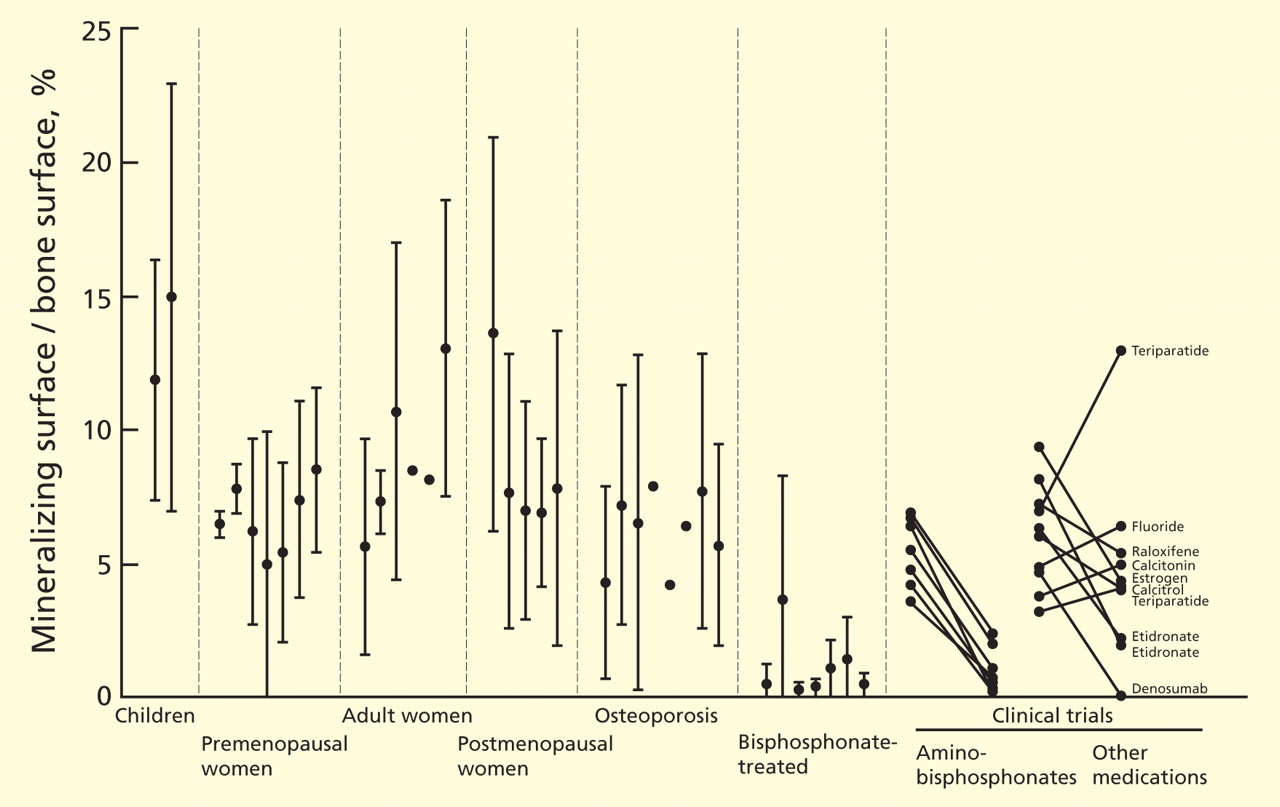
With continued bisphosphonate use, the bone gradually becomes more dense. There is no further new bone, but the existing bone matrix is packed more tightly with mineral crystals.9 The old bone is not resorbed. The bone density, measured radiographically, increases most rapidly during the first 6 months (while resorption pits are filling in) and more gradually over the next 3 years (while bone is becoming more mineralized).
Another common misunderstanding is that the bone density increases because the drugs are “building bone.” After 3 years, the bone density in the femur reaches a plateau.10 I have seen patients who were very worried because their bone density was no longer increasing, and their physicians did not realize that this is the expected pattern. The spinal bone density continues to increase modestly, but some of this may be from disk space narrowing, harder bone edges, and soft-tissue calcifications. Spinal bone density frequently increases even in those on placebo.
Bisphosphonates suppress markers of bone turnover
These changes in bone remodeling with bisphosphonates are reflected by changes in markers of bone formation and resorption. The levels of markers of bone resorption—N-telopeptide cross-linked type I collagen (NTx) and C-telopeptide cross-linked type I collagen (CTx)—decrease rapidly and remain low. The markers of bone formation—propeptide of type I collagen, bone alkaline phosphatase, and osteocalcin—decrease gradually over 3 to 6 months and then remain low. As measured directly at the bone, bone formation appears to be more suppressed than as measured by biochemical markers in the serum.
In a risedronate trial,11 the fracture rate decreased as the biochemical markers of bone turnover decreased, except when the markers were very low, in which case the fracture rate increased.
Without remodeling, cracks can accumulate
The bisphosphonates do not significantly increase bone volume, but they prevent microscopic architectural deterioration of the bone, as shown on microscopic computed tomographic imaging.12 This prevents fractures for at least 5 years.
But bisphosphonates may have long-term negative effects. One purpose of bone remodeling is to refresh the bone and to repair the microscopic damage that accumulates within any structure. Without remodeling, cracks can accumulate. Because the development and repair of microcracks is complex, it is difficult to predict what will happen with long-term bisphosphonate use. Studies of biopsies from women taking bisphosphonates long-term are inconsistent: one study found accumulation of microcracks,13 but another did not.8
STUDIES OF LONG-TERM USE: FOCUS ON FRACTURES
For this review, I consider long-term bisphosphonate use to be greater than 5 years, and I will focus on fractures. Bone density is only a surrogate end point. Unfortunately, this fact is often not emphasized in the training of young physicians.
The best illustration of this point was in a randomized clinical trial of fluoride,14 in which the bone density of the treated group increased by 8% per year for 4 years, for a total increase of 32%. This is more than we ever see with current therapies. But the patients had more fractures with fluoride than with placebo. This is because the quality of bone produced after fluoride treatment is poor, and although the bone is denser, it is weaker.
Observational studies of fracture incidence in patients who continued taking bisphosphonates compared with those who stopped provide some weak evidence about long-term effectiveness.
Curtis et al15 found, in 9,063 women who were prescribed bisphosphonates, that those who stopped taking them during the first 2 years had higher rates of hip fracture than compliant patients. Those who took bisphosphonates for 3 years and then stopped had a rate of hip fracture during the next year similar to that of those who continued taking the drugs.
Meijer et al16 used a database in the Netherlands to examine the fracture rates in 14,750 women who started taking a bisphosphonate for osteoporosis between 1996 and 2004. More than half of the women stopped taking the drug during the first year, and they served as the control group. Those who took bisphosphonates for 3 to 4 years had significantly fewer fractures than those who stopped during the first year (odds ratio 0.54). However, those who took them for 5 to 6 years had slightly more fractures than those who took them for less than a year.
Mellström et al17 performed a 2-year uncontrolled extension of a 5-year trial of risedronate that had blinded controls.18 Initially, 407 women were in the risedronate group; 68 completed 7 years.
The vertebral fracture rate in the placebo group was 7.6% per year during years 0 through 3. In the risedronate group, the rate was 4.7% per year during years 0 through 3 and 3.8% per year during years 6 and 7. Nonvertebral fractures occurred in 10.9% of risedronate-treated patients during the first 3 years and in 6% during the last 2 years. Markers of bone turnover remained reduced throughout the 7 years. Bone mineral density of the spine and hip did not change from years 5 to 7. The study did not include those who took risedronate for 5 years and then discontinued it.
Bone et al19 performed a similar, 10-year uncontrolled extension of a 3-year controlled trial of alendronate.20 There were 398 patients randomly assigned to alendronate, and 164 remained in the study for 8 to 10 years.
During years 8 through 10, bone mineral density of the spine increased by about 2%; no change was seen in the hip or total body. The nonvertebral fracture rate was similar in years 0 through 3 and years 6 through 10. Vertebral fractures occurred in approximately 3% of women in the first 3 years and in 9% in the last 5 years.
The FLEX trial: Continuing alendronate vs stopping
Only one study compared continuing a bisphosphonate vs stopping it. The Fracture Intervention Trial Long-Term Extension (FLEX)10 was an extension of the Fracture Intervention Trial (FIT)21,22 of alendronate. I am reviewing this study in detail because it is the only one that randomized patients and was double-blinded.
In the original trial,21,22 3,236 women were in the alendronate group. After a mean of 5 years on alendronate, 1,099 of them were randomized into the alendronate or placebo group.10 Those with T scores lower than −3.5 or who had lost bone density during the first 5 years were excluded.
The bone mineral density of the hip in the placebo group decreased by 3.4%, whereas in the alendronate group it decreased by 1.0%. At the spine, the placebo group gained less than the alendronate group.
Despite these differences in bone density, no significant difference was noted in the rates of all clinical fractures, nonvertebral fractures, vertebral fractures as measured on radiographs taken for the study (“morphometric” fractures, 11.3% vs 9.8%), or in the number of severe vertebral fractures (those with more than a two-grade change on radiography) between those who took alendronate for 10 years and those who took it for 5 years followed by placebo for 5 years.
However, fewer “clinical spine fractures” were observed in the group continuing alendronate (2.4% vs 5.3%). A clinical spine fracture was one diagnosed by the patient’s personal physician.
In FIT, these clinical fractures were painful in 90% of patients, and although the community radiographs were reviewed by a central radiologist, only 73% of the fractures were confirmed by subsequent measurements on the per protocol radiographs done at the study centers. About one-fourth of the morphometric fractures were also clinical fractures.23 Therefore, I think morphometric fractures provide the best evidence about the effects of treatment—ie, that treatment beyond 5 years is not beneficial. Other physicians, however, disagree, emphasizing the 55% reduction in clinical fractures.24
Markers of bone turnover gradually increased after discontinuation but remained lower than baseline even after 5 years without alendronate.10 There were no significant differences in fracture rates between the placebo and alendronate groups in those with baseline bone mineral density T scores less than −2.5.10 Also, after age adjustment, the fracture incidence was similar in the FIT and the FLEX studies.
Several years later, the authors published a post hoc subgroup analysis of these data.25 The patients were divided into six subgroups based on bone density and the presence of vertebral fractures at baseline. This is weak evidence, but I include it because reviews in the literature have emphasized only the positive findings, or have misquoted the data: Schwartz et al stated that in those with T scores of −2.5 or below, the risk of nonvertebral fracture was reduced by 50%25; and Shane26 concluded in an editorial that the use of alendronate for 10 years, rather than for 5 years, was associated with significantly fewer new vertebral fractures and nonvertebral fractures in patients with a bone mineral density T score of −2.5 or below.26
ATYPICAL FEMUR FRACTURES
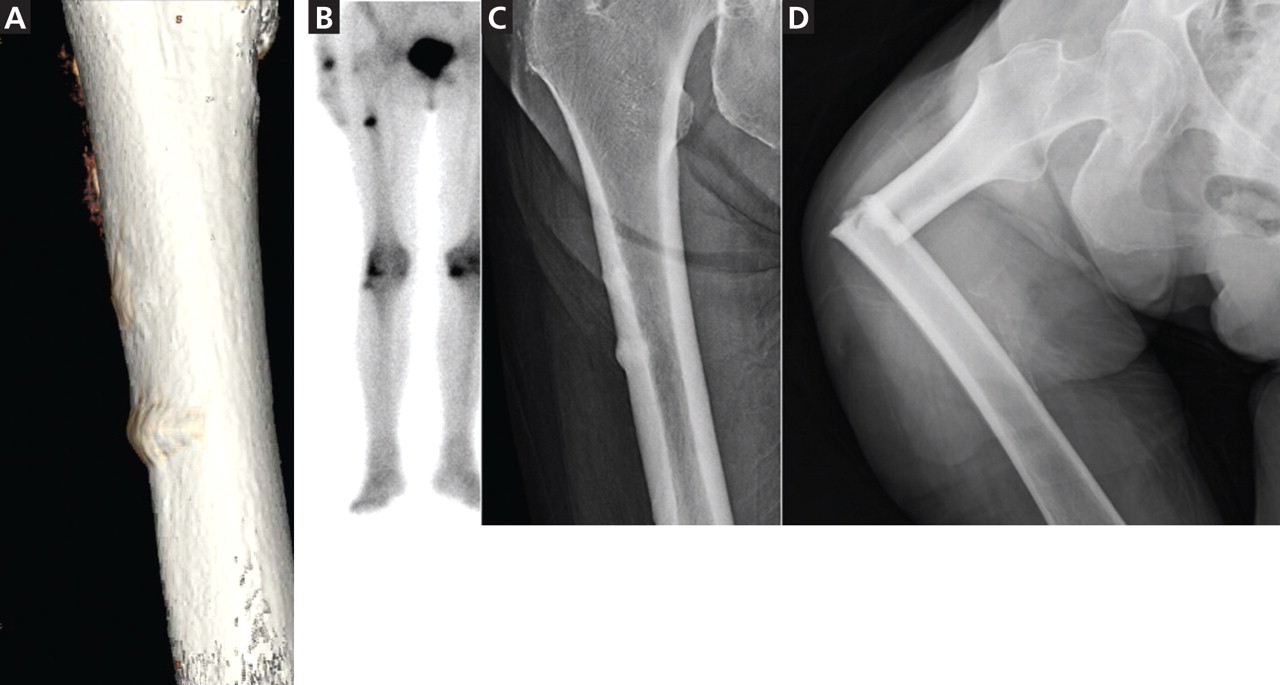
By March 2011, there were 55 papers describing a total of 283 cases, and about 85 individual cases (listed online in Ott SM. Osteoporosis and Bone Physiology. http://courses.washington.edu/bonephys/opsubtroch.html. Accessed 7/30/2011).
The mean age of the patients was 65, bisphosphonate use was longer than 5 years in 77% of cases, and bilateral fractures were seen in 48%.
The fractures occur with minor trauma, such as tripping, stepping off an elevator, or being jolted by a subway stop, and a disproportionate number of cases involve no trauma. They are often preceded by leg pain, typically in the mid-thigh.
These fractures are characterized by radiographic findings of a transverse fracture, with thickened cortices near the site of the fracture. Often, there is a peak on the cortex that may precede the fracture. These fractures initiate on the lateral side, and it is striking that they occur in the same horizontal plane on the contralateral side.
Radiographs and bone scans show stress fractures on the lateral side of the femur that resemble Looser zones (ie, dark lines seen radiographically). These radiographic features are not typical in osteoporosis but are reminiscent of the stress fractures seen with hypophosphatasia, an inherited disease characterized by severely decreased bone formation.31
Bone biopsy specimens show very low bone formation rates, but this is not a necessary feature. At the fracture site itself there is bone activity. For example, pathologists from St. Louis reviewed all iliac crest bone biopsies from patients seen between 2004 and 2007 who had an unusual cortical fracture while taking a bisphosphonate. An absence of double tetracycline labels was seen in 11 of the 16 patients.32
The first reports were anecdotal cases, then some centers reported systematic surveys of their patients. In a key report, Neviaser et al33 reviewed all low-trauma subtrochanteric fractures in their large hospital and found 20 cases with the atypical radiographic appearance; 19 of the patients in these cases had been taking a bisphosphonate. A similar survey in Australia found 41 cases with atypical radiographic features (out of 79 subtrochanteric low-trauma fractures), and all of the patients had been taking a bisphosphonate.34
By now, more than 230 cases have been reported. The estimated incidence is 1 in 1,000, based on a review of operative cases and radiographs.35
However, just because the drugs are associated with the fractures does not mean they caused the fractures, because the patients who took bisphosphonates were more likely to get a fracture in the first place. This confounding by indication makes it difficult to prove beyond a doubt that bisphosphonates cause atypical fractures.
Further, some studies have found no association between bisphosphonates and subtrochanteric fractures.36,37 These database analyses have relied on the coding of the International Classification of Diseases, Ninth Revision (ICD-9), and not on the examination of radiographs. We reviewed the ability of ICD-9 codes to identify subtrochanteric fractures and found that the predictive ability was only 36%.38 Even for fractures in the correct location, the codes cannot tell which cases have the typical spiral or comminuted fractures seen in osteoporosis and which have the unusual features of the bisphosphonate-associated fractures. Subtrochanteric and shaft fractures are about 10 times less common than hip fractures, and the atypical ones are about 10 times less common than typical ones, so studies based on ICD-9 codes cannot exonerate bisphosphonates.
A report of nearly 15,000 patients from randomized clinical trials did not find a significant incidence of subtrochanteric fractures, but the radiographs were not examined and only 500 of the patients had taken the medication for longer than 5 years.39
A population-based, nested case-control study using a database from Ontario, Canada, found an increased risk of diaphyseal femoral fractures in patients who had taken bisphosphonates longer than 5 years. The study included only women who had started bisphosphonates when they were older than 68, so many of the atypical fractures would have been missed. The investigators did not review the radiographs, so they combined both osteoporotic and atypical diaphyseal fractures in their analysis.40
At the 2010 meeting of the American Society for Bone and Mineral Research, preliminary data were presented from a systematic review of radiographs of patients with fractures of the femur from a health care plan with data about the use of medications. The incidence of atypical fractures increased progressively with the duration of bisphosphonate use, and was significantly higher after 5 years compared with less than 3 years.28
OTHER POSSIBLE ADVERSE EFFECTS
There have been conflicting reports about esophageal cancer with bisphosphonate use.41,42
Another possible adverse effect, osteonecrosis of the jaw, may have occurred in 1.4% of patients with cancer who were treated for 3 years with high intravenous doses of bisphosphonates (about 10 to 12 times the doses recommended for osteoporosis).43 This adverse effect is rare in patients with osteoporosis, occurring in less than 1 in 10,000 exposed patients.44
BISPHOSPHONATES SHOULD BE USED WHEN THEY ARE INDICATED
The focus of this paper is on the duration of use, but concern about long-term use should not discourage physicians or patients from using these drugs when there is a high risk of an osteoporotic fracture within the next 10 years, particularly in elderly patients who have experienced a vertebral compression fracture or a hip fracture. Patients with a vertebral fracture have a one-in-five chance of fracturing another vertebra, which is a far higher risk than any of the known long-term side effects from treatment, and bisphosphonates are effective at reducing the risk.
Low bone density alone can be used as an indication for bisphosphonates if the hip T score is lower than −2.5. A cost-effectiveness study concluded that alendronate was beneficial in these cases.45 In the FIT patients without a vertebral fracture at baseline, the overall fracture rate was significantly decreased by 36% with alendronate in those with a hip T score lower than −2.5, but there was no difference between placebo and alendronate in those with T scores between −2 and −2.5, and a 14% (nonsignificant) higher fracture rate when the T score was better than −2.0.22
A new method of calculating the risk of an osteoporotic fracture is the FRAX prediction tool (http://www.shef.ac.uk/FRAX), and one group has suggested that treatment is indicated when the 10-year risk of a hip fracture is greater than 3%.46 Another group, from the United Kingdom, suggests using a sliding scale depending on the fracture risk and the age.47
It is not always clear what to do when the hip fracture risk is greater than 3% for the next decade but the T score is better than −2.5. These patients have other factors that contribute to fracture risk. Their therapy must be individualized, and if they are at risk of fracture because of low weight, smoking, or alcohol use, it makes more sense to focus the approach on those treatable factors.
Women who have osteopenia and have not had a fragility fracture are often treated with bisphosphonates with the intent of preventing osteoporosis in the distant future. This approach is based on hope, not evidence, and several editorial reviews have concluded that these women do not need drug therapy.48–50
MY RECOMMENDATION: STOP AFTER 5 YEARS
Bisphosphonates reduce the incidence of devastating osteoporotic fractures in patients with osteoporosis, but that does not mean they should be used indefinitely.
After 5 years, the overall fracture risk is the same in patients who keep taking bisphosphonates as in patients who discontinue them. Therefore, I think these drugs are no longer necessary after 5 years. The post hoc subgroup analysis that showed benefit in only one of six groups of the FLEX study does not provide compelling evidence to continue taking bisphosphonates.
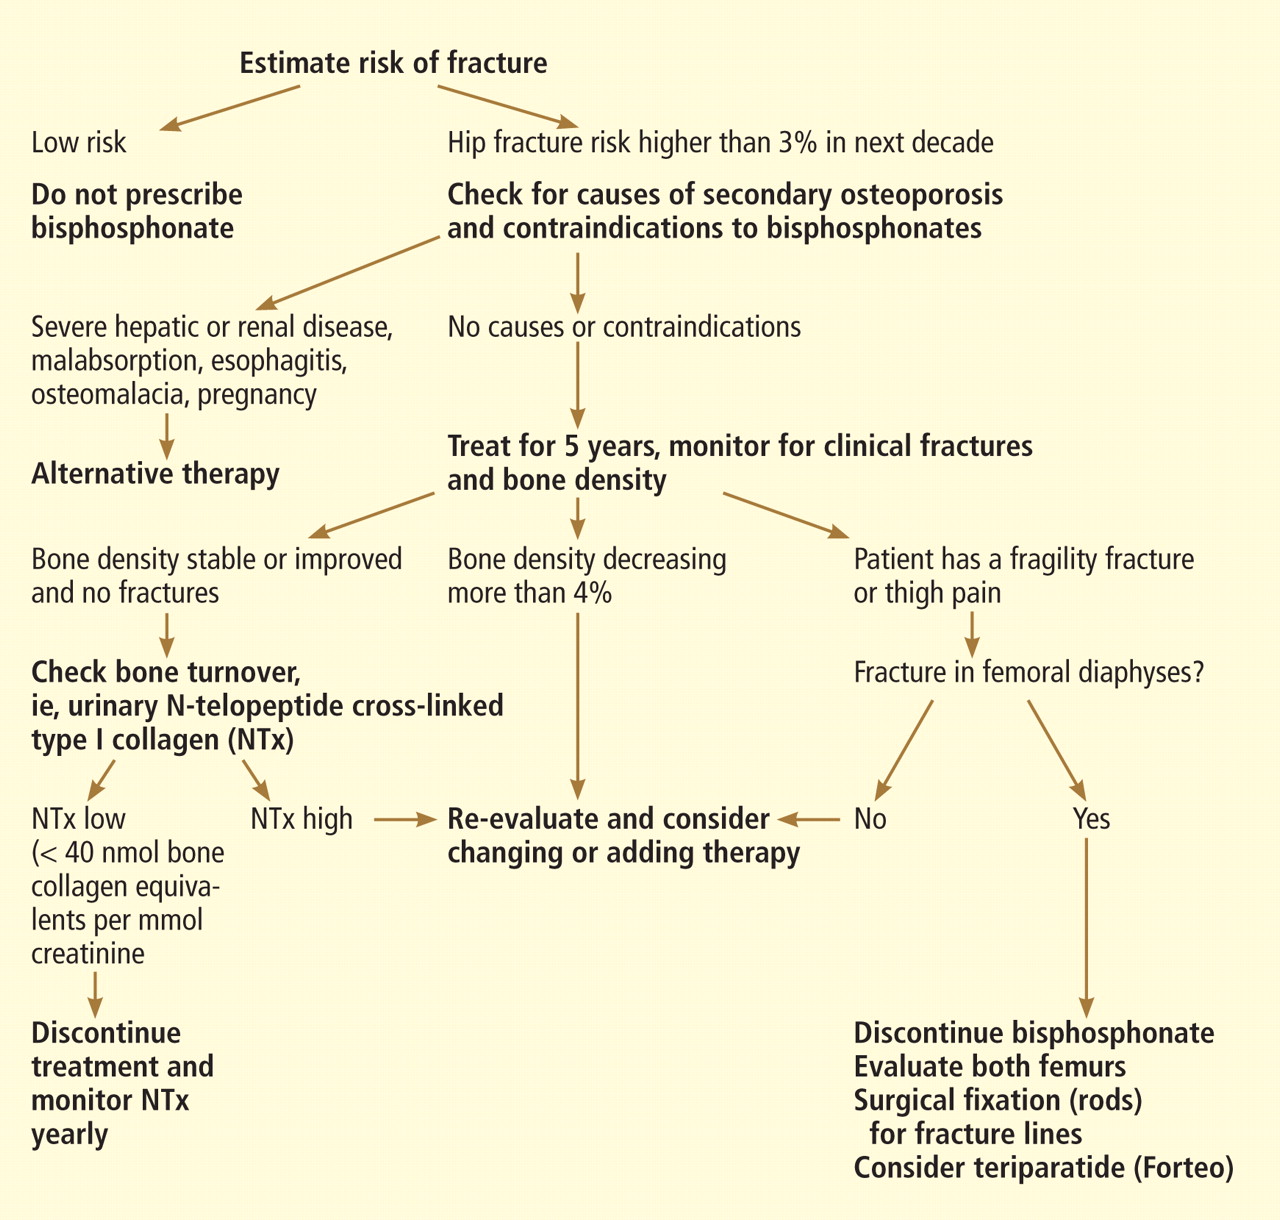
While awaiting better studies, we use the approach shown in the algorithm in Figure 4.
Follow the patient with bone resorption markers
In patients who have shown some improvement in bone density during 5 years of bisphosphonate treatment and who have not had any fractures, I measure a marker of bone resorption at the end of 5 years.
The use of a biochemical marker to assess patients treated with anti-turnover drugs has not been studied in a formal trial, so we have no grade A evidence for recommending it. However, there have been many papers describing the effects of bisphosphonates on these markers, and it makes physiologic sense to use them in situations where decisions must be made when there is not enough evidence.
In FIT (a trial of alendronate), we reported that the change in bone turnover markers was significantly related to the reduction in fracture risk, and the effect was at least as strong as that observed with a 1-year change in bone density. Those with a 30% decrease in bone alkaline phosphatase had a significant reduction in fracture risk.51
Furthermore, in those patients who were compliant with bisphosphonate treatment, the reduction in fractures with alendronate treatment was significantly better in those who initially had a high bone turnover.52
Similarly, with risedronate, the change in NTx accounted for half of the effect on fracture reduction during the clinical trial, and there was little further improvement in fracture benefit below a decrease of 35% to 40%.10
The baseline NTx level in these clinical trials was about 70 nmol bone collagen equivalents per millimole of creatinine (nmol BCE/mmol Cr) in the risedronate study and 60 in the alendronate study, and in both the fracture reduction was seen at a level of about 40. The FLEX study measured NTx after 5 years, and the average was 19 nmol BCE/mmol Cr. This increased to 22 after 3 years without alendronate.53 At 5 years, the turnover markers had gradually increased but were still 7% to 24% lower than baseline.10
These markers have a diurnal rhythm and daily variation, but despite these limitations they do help identify low bone resorption.
In our hospital, NTx is the most economical marker, and my patients prefer a urine sample to a blood test. Therefore, we measure the NTx and consider values lower than 40 nmol BCE/mmol Cr to be satisfactory.
If the NTx is as low as expected, I discontinue the bisphosphonate. The patient remains on 1,200 mg/day of calcium and 1,000 U/day vitamin D supplementation and is encouraged to exercise.
Bone density tends to be stable for 1 or 2 years after stopping a bisphosphonate, and the biochemical markers of bone resorption remain reduced for several years. We remeasure the urine NTx level annually, and if it increases to more than 40 nmol BCE/mmol Cr an antiresorptive medication is given: either the bisphosphonate is restarted or raloxifene (Evista), calcitonin (Miacalcin), or denosumab (Prolia) is used.
Bone density is less helpful, but reassuring
Bone density is less helpful because it decreases even though the markers of bone resorption remain low. Although one could argue that bone density is not helpful in monitoring patients on therapy, I think it is reassuring to know the patient is not excessively losing bone.
Checking at 2-year intervals is reasonable. If the bone density shows a consistent decrease greater than 6% (which is greater than the difference we can see from patients walking around the room), then we would re-evaluate the patient and consider adding another medication.
If the bone density decreases but the biomarkers are low, then clinical judgment must be used. The bone density result may be erroneous due to different positioning or different regions of interest.
If turnover markers are not reduced
If a patient has been prescribed a bisphosphonate for 5 years but the NTx level is not reduced, I reevaluate the patient. Some are not taking the medication or are not taking it properly. The absorption of oral bisphosphonates is quite low in terms of bioavailability, and this decreases to nearly zero if the medication is taken with food. Some patients may have another disease, such as hyperparathyroidism, malignancy, hyperthyroidism, weight loss, malabsorption, celiac sprue, or vitamin D deficiency.
If repeated biochemical tests show high bone resorption and if the bone density response is suboptimal without a secondary cause, I often switch to an intravenous form of bisphosphonate because some patients do not seem to absorb the oral doses.
If a patient has had a fracture
If a patient has had a fracture despite several years of bisphosphonate therapy, I first check for any other medical problems. The bone markers are, unfortunately, not very helpful because they increase after a fracture and stay elevated for at least 4 months.54 If there are no contraindications, treatment with teriparatide (Forteo) is a reasonable choice. There is evidence from human biopsy studies that teriparatide can reduce the number of microcracks that were related to bisphosphonate treatment,13 and can increase the bone formation rate even when there has been prior bisphosphonate treatment.55–57 Although the anabolic response is blunted, it is still there.58
If the patient remains at high risk
A frail patient with a high risk of fracture presents a challenge, especially one who needs treatment with glucocorticoids or who still has a hip T score below −3. Many physicians are uneasy about discontinuing all osteoporosis-specific drugs, even after 5 years of successful bisphosphonate treatment. In these patients anabolic medications make the most sense. Currently, teriparatide is the only one available, but others are being developed. Bone becomes resistant to the anabolic effects of teriparatide after about 18 months, so this drug cannot be used indefinitely. What we really need are longer-lasting anabolic medicines!
If the patient has thigh pain
Finally, in patients with thigh pain, radiography of the femur should be done to check for a stress fracture. Magnetic resonance imaging or computed tomography may be needed to diagnose a hairline fracture.
If there are already radiographic changes that precede the atypical fractures, then bisphosphonates should be discontinued. In a follow-up observational study of 16 patients who already had one fracture, all four whose contralateral side showed a fracture line (the “dreaded black line”) eventually completed the fracture.59
Another study found that five of six incomplete fractures went on to a complete fracture if not surgically stabilized with rods.60 This is an indication for prophylactic rodding of the femur.
Teriparatide use and rodding of a femur with thickening but not a fracture line must be decided on an individual basis and should be considered more strongly in those with pain in the thigh.
- Francis MD, Valent DJ. Historical perspectives on the clinical development of bisphosphonates in the treatment of bone diseases. J Musculoskelet Neuronal Interact 2007; 7:2–8.
- Bilezikian JP. Efficacy of bisphosphonates in reducing fracture risk in postmenopausal osteoporosis. Am J Med 2009; 122(suppl 2):S14–S21.
- Siris ES, Pasquale MK, Wang Y, Watts NB. Estimating bisphosphonate use and fracture reduction among US women aged 45 years and older, 2001–2008. J Bone Miner Res 2011; 26:3–11.
- Russell RG, Xia Z, Dunford JE, et al. Bisphosphonates: an update on mechanisms of action and how these relate to clinical efficacy. Ann N Y Acad Sci 2007; 1117:209–257.
- Parfitt AM. Misconceptions (2): turnover is always higher in cancellous than in cortical bone. Bone 2002; 30:807–809.
- Han ZH, Palnitkar S, Rao DS, Nelson D, Parfitt AM. Effects of ethnicity and age or menopause on the remodeling and turnover of iliac bone: implications for mechanisms of bone loss. J Bone Miner Res 1997; 12:498–508.
- Chavassieux PM, Arlot ME, Reda C, Wei L, Yates AJ, Meunier PJ. Histomorphometric assessment of the long-term effects of alendronate on bone quality and remodeling in patients with osteoporosis. J Clin Invest 1997; 100:1475–1480.
- Chapurlat RD, Arlot M, Burt-Pichat B, et al. Microcrack frequency and bone remodeling in postmenopausal osteoporotic women on long-term bisphosphonates: a bone biopsy study. J Bone Miner Res 2007; 22:1502–1509.
- Boivin G, Meunier PJ. Effects of bisphosphonates on matrix mineralization. J Musculoskelet Neuronal Interact 2002; 2:538–543.
- Black DM, Schwartz AV, Ensrud KE, et al; FLEX Research Group. Effects of continuing or stopping alendronate after 5 years of treatment: the Fracture Intervention Trial Long-term Extension (FLEX): a randomized trial. JAMA 2006; 296:2927–2938.
- Eastell R, Hannon RA, Garnero P, Campbell MJ, Delmas PD. Relationship of early changes in bone resorption to the reduction in fracture risk with risedronate: review of statistical analysis. J Bone Miner Res 2007; 22:1656–1660.
- Borah B, Dufresne TE, Chmielewski PA, Johnson TD, Chines A, Manhart MD. Risedronate preserves bone architecture in postmenopausal women with osteoporosis as measured by three-dimensional microcomputed tomography. Bone 2004; 34:736–746.
- Stepan JJ, Dobnig H, Burr DB, et al. Histomorphometric changes by teriparatide in alendronate pre-treated women with osteoporosis (abstract). Presented at the Annual Meeting of the American Society of Bone and Mineral Research, Montreal 2008: #1019.
- Riggs BL, Hodgson SF, O’Fallon WM, et al. Effect of fluoride treatment on the fracture rate in postmenopausal women with osteoporosis. N Engl J Med 1990; 322:802–809.
- Curtis JR, Westfall AO, Cheng H, Delzell E, Saag KG. Risk of hip fracture after bisphosphonate discontinuation: implications for a drug holiday. Osteoporos Int 2008; 19:1613–1620.
- Meijer WM, Penning-van Beest FJ, Olson M, Herings RM. Relationship between duration of compliant bisphosphonate use and the risk of osteoporotic fractures. Curr Med Res Opin 2008; 24:3217–3222.
- Mellström DD, Sörensen OH, Goemaere S, Roux C, Johnson TD, Chines AA. Seven years of treatment with risedronate in women with postmenopausal osteoporosis. Calcif Tissue Int 2004; 75:462–468.
- Reginster J, Minne HW, Sorensen OH, et al. Randomized trial of the effects of risedronate on vertebral fractures in women with established postmenopausal osteoporosis. Vertebral Efficacy with Risedronate Therapy (VERT) Study Group. Osteoporos Int 2000; 11:83–91.
- Bone HG, Hosking D, Devogelaer JP, et al; Alendronate Phase III Osteoporosis Treatment Study Group. Ten years’ experience with alendronate for osteoporosis in postmenopausal women. N Engl J Med 2004; 350:1189–1199.
- Liberman UA, Weiss SR, Bröll J, et al. Effect of oral alendronate on bone mineral density and the incidence of fractures in postmenopausal osteoporosis. The Alendronate Phase III Osteoporosis Treatment Study Group. N Engl J Med 1995; 333:1437–1443.
- Black DM, Cummings SR, Karpf DB, et al; Fracture Intervention Trial Research Group. Randomised trial of effect of alendronate on risk of fracture in women with existing vertebral fractures. Lancet 1996; 348:1535–1541.
- Cummings SR, Black DM, Thompson DE, et al. Effect of alendronate on risk of fracture in women with low bone density but without vertebral fractures: results from the Fracture Intervention Trial. JAMA 1998; 280:2077–2082.
- Fink HA, Milavetz DL, Palermo L, et al. What proportion of incident radiographic vertebral deformities is clinically diagnosed and vice versa? J Bone Miner Res 2005; 20:1216–1222.
- Watts NB, Diab DL. Long-term use of bisphosphonates in osteoporosis. J Clin Endocrinol Metab 2010; 95:1555–1565.
- Schwartz AV, Bauer DC, Cummings SR, et al; FLEX Research Group. Efficacy of continued alendronate for fractures in women with and without prevalent vertebral fracture: the FLEX trial. J Bone Miner Res 2010; 25:976–982.
- Shane E. Evolving data about subtrochanteric fractures and bisphosphonates (editorial). N Engl J Med 2010; 362:1825–1827.
- Sellmeyer DE. Atypical fractures as a potential complication of long-term bisphosphonate therapy. JAMA 2010; 304:1480–1484.
- Shane E, Burr D, Ebeling PR, et al; American Society for Bone and Mineral Research. Atypical subtrochanteric and diaphyseal femoral fractures: report of a task force of the American Society for Bone and Mineral Research. J Bone Miner Res 2010; 25:2267–2294.
- Giusti A, Hamdy NA, Papapoulos SE. Atypical fractures of the femur and bisphosphonate therapy: a systematic review of case/case series studies. Bone 2010; 47:169–180.
- Rizzoli R, Akesson K, Bouxsein M, et al. Subtrochanteric fractures after long-term treatment with bisphosphonates: a European Society on Clinical and Economic Aspects of Osteoporosis and Osteoarthritis, and International Osteoporosis Foundation Working Group Report. Osteoporos Int 2011; 22:373–390.
- Whyte MP. Atypical femoral fractures, bisphosphonates, and adult hypophosphatasia. J Bone Miner Res 2009; 24:1132–1134.
- Armamento-Villareal R, Napoli N, Panwar V, Novack D. Suppressed bone turnover during alendronate therapy for high-turnover osteoporosis. N Engl J Med 2006; 355:2048–2050.
- Neviaser AS, Lane JM, Lenart BA, Edobor-Osula F, Lorich DG. Low-energy femoral shaft fractures associated with alendronate use. J Orthop Trauma 2008; 22:346–350.
- Isaacs JD, Shidiak L, Harris IA, Szomor ZL. Femoral insufficiency fractures associated with prolonged bisphosphonate therapy. Clin Orthop Relat Res 2010; 468:3384–3392.
- Schilcher J, Aspenberg P. Incidence of stress fractures of the femoral shaft in women treated with bisphosphonate. Acta Orthop 2009; 80:413–415.
- Abrahamsen B, Eiken P, Eastell R. Cumulative alendronate dose and the long-term absolute risk of subtrochanteric and diaphyseal femur fractures: a register-based national cohort analysis. J Clin Endocrinol Metab 2010; 95:5258–5265.
- Kim SY, Schneeweiss S, Katz JN, Levin R, Solomon DH. Oral bisphosphonates and risk of subtrochanteric or diaphyseal femur fractures in a population-based cohort. J Bone Miner Res 2010. [Epub ahead of print]
- Spangler L, Ott SM, Scholes D. Utility of automated data in identifying femoral shaft and subtrochanteric (diaphyseal) fractures. Osteoporos Int. 2010. [Epub ahead of print]
- Black DM, Kelly MP, Genant HK, et al; Fracture Intervention Trial Steering Committee; HORIZON Pivotal Fracture Trial Steering Committee. Bisphosphonates and fractures of the subtrochanteric or diaphyseal femur. N Engl J Med 2010; 362:1761–1771.
- Park-Wyllie LY, Mamdani MM, Juurlink DN, et al. Bisphosphonate use and the risk of subtrochanteric or femoral shaft fractures in older women. JAMA 2011; 305:783–789.
- Green J, Czanner G, Reeves G, Watson J, Wise L, Beral V. Oral bisphosphonates and risk of cancer of oesophagus, stomach, and colorectum: case-control analysis within a UK primary care cohort. BMJ 2010; 341:c4444.
- Cardwell CR, Abnet CC, Cantwell MM, Murray LJ. Exposure to oral bisphosphonates and risk of esophageal cancer. JAMA 2010; 304:657–663.
- Stopeck AT, Lipton A, Body JJ, et al. Denosumab compared with zoledronic acid for the treatment of bone metastases in patients with advanced breast cancer: a randomized, double-blind study. J Clin Oncol 2010; 28:5132–5139.
- Khosla S, Burr D, Cauley J, et al; American Society for Bone and Mineral Research. Bisphosphonate-associated osteonecrosis of the jaw: report of a task force of the American Society for Bone and Mineral Research. J Bone Miner Res 2007; 22:1479–1491.
- Schousboe JT, Ensrud KE, Nyman JA, Kane RL, Melton LJ. Cost-effectiveness of vertebral fracture assessment to detect prevalent vertebral deformity and select postmenopausal women with a femoral neck T-score > −2.5 for alendronate therapy: a modeling study. J Clin Densitom 2006; 9:133–143.
- Dawson-Hughes B; National Osteoporosis Foundation Guide Committee. A revised clinician’s guide to the prevention and treatment of osteoporosis. J Clin Endocrinol Metab 2008; 93:2463–2465.
- Compston J, Cooper A, Cooper C, et al; the National Osteoporosis Guideline Group (NOGG). Guidelines for the diagnosis and management of osteoporosis in postmenopausal women and men from the age of 50 years in the UK. Maturitas 2009; 62:105–108.
- Cummings SR. A 55-year-old woman with osteopenia. JAMA 2006; 296:2601–2610.
- Khosla S, Melton LJ. Clinical practice. Osteopenia. N Engl J Med 2007; 356:2293–2300.
- McClung MR. Osteopenia: to treat or not to treat? Ann Intern Med 2005; 142:796–797.
- Bauer DC, Black DM, Garnero P, et al; Fracture Intervention Trial Study Group. Change in bone turnover and hip, non-spine, and vertebral fracture in alendronate-treated women: the fracture intervention trial. J Bone Miner Res 2004; 19:1250–1258.
- Bauer DC, Garnero P, Hochberg MC, et al; for the Fracture Intervention Research Group. Pretreatment levels of bone turnover and the anti-fracture efficacy of alendronate: the fracture intervention trial. J Bone Miner Res 2006; 21:292–299.
- Ensrud KE, Barrett-Connor EL, Schwartz A, et al; Fracture Intervention Trial Long-Term Extension Research Group. Randomized trial of effect of alendronate continuation versus discontinuation in women with low BMD: results from the Fracture Intervention Trial long-term extension. J Bone Miner Res 2004; 19:1259–1269.
- Ivaska KK, Gerdhem P, Akesson K, Garnero P, Obrant KJ. Effect of fracture on bone turnover markers: a longitudinal study comparing marker levels before and after injury in 113 elderly women. J Bone Miner Res 2007; 22:1155–1164.
- Cosman F, Nieves JW, Zion M, Barbuto N, Lindsay R. Retreatment with teriparatide one year after the first teriparatide course in patients on continued long-term alendronate. J Bone Miner Res 2009; 24:1110–1115.
- Jobke B, Pfeifer M, Minne HW. Teriparatide following bisphosphonates: initial and long-term effects on microarchitecture and bone remodeling at the human iliac crest. Connect Tissue Res 2009; 50:46–54.
- Miller PD, Delmas PD, Lindsay R, et al; Open-label Study to Determine How Prior Therapy with Alendronate or Risedronate in Postmenopausal Women with Osteoporosis Influences the Clinical Effectiveness of Teriparatide Investigators. Early responsiveness of women with osteoporosis to teriparatide after therapy with alendronate or risedronate. J Clin Endocrinol Metab 2008; 93:3785–3793.
- Ettinger B, San Martin J, Crans G, Pavo I. Differential effects of teriparatide on BMD after treatment with raloxifene or alendronate. J Bone Miner Res 2004; 19:745–751.
- Koh JS, Goh SK, Png MA, Kwek EB, Howe TS. Femoral cortical stress lesions in long-term bisphosphonate therapy: a herald of impending fracture? J Orthop Trauma 2010; 24:75–81.
- Banffy MB, Vrahas MS, Ready JE, Abraham JA. Nonoperative versus prophylactic treatment of bisphosphonate-associated femoral stress fractures. Clin Orthop Relat Res 2011; 469:2028–2034.
Almost all the data about the safety and efficacy of bisphosphonate drugs for treating osteoporosis are from patients who took them for less than 5 years.
Reports of adverse effects with prolonged use have caused concern about the long-term safety of this class of drugs. This is particularly important because these drugs are retained in the skeleton longer than 10 years, because there are physiologic reasons why excessive bisphosphonate-induced inhibition of bone turnover could be damaging, and because many healthy postmenopausal women have been prescribed bisphosphonates in the hope of preventing fractures that are not expected to occur for 20 to 30 years.
Because information from trials is scant, opinions differ over whether bisphosphonates should be continued indefinitely. In this article, I summarize the physiologic mechanisms of these drugs, review the scant existing data about their effects beyond 5 years, and describe my approach to bisphosphonate therapy (while waiting for better evidence).
MORE THAN 4 MILLION WOMEN TAKE BISPHOSPHONATES
The first medical use of a bisphosphonate was in 1967, when a girl with myositis ossificans was given etidronate (Didronel) because it inhibited mineralization. Two years later, it was given to patients with Paget disease of bone because it was found to inhibit bone resorption.1 Etidronate could not be given for longer than 6 months, however, because patients developed osteomalacia.
Adding a nitrogen to the molecule dramatically increased its potency and led to the second generation of bisphosphonates. Alendronate (Fosamax), the first amino-bisphosphonate, became available in 1995, It was followed by risedronate (Actonel), ibandronate (Boniva), and zoledronic acid (Reclast). These drugs are potent inhibitors of bone resorption; however, in clinical doses they do not inhibit mineralization and therefore do not cause osteomalacia.
Randomized clinical trials involving more than 30,000 patients have provided grade A evidence that these drugs reduce the incidence of fragility fractures in patients with osteoporosis.2 Furthermore, observational studies have confirmed that they prevent fractures and have a good safety profile in clinical practice.
Therefore, the use of these drugs has become common. In 2008, an estimated 4 million women in the United States were taking them.3
BISPHOSPHONATES STRENGTHEN BONE BY INHIBITING RESORPTION
On a molecular level, bisphosphonates inhibit farnesyl pyrophosphate synthase, an enzyme necessary for formation of the cytoskeleton in osteoclasts. Thus, they strongly inhibit bone resorption. They do not appear to directly inhibit osteoblasts, the cells that form new bone, but they substantially decrease bone formation indirectly.4
To understand how inhibition of bone resorption affects bone physiology, it is necessary to appreciate the nature of bone remodeling. Bone is not like the skin, which is continually forming a new layer and sloughing off the old. Instead, bone is renewed in small units. It takes about 5 years to remodel cancellous bone and 13 years to remodel cortical bone5; at any one time, about 8% of the surface is being remodeled.
The first step occurs at a spot on the surface, where the osteoclasts resorb some bone to form a pit that looks like a pothole. Then a team of osteoblasts is formed and fills the pit with new bone over the next 3 to 6 months. When first formed, the new bone is mainly collagen and, like the tip of the nose, is not very stiff, but with mineral deposition the bone becomes stronger, like the bridge of the nose. The new bone gradually accumulates mineral and becomes harder and denser over the next 3 years.
When a bisphosphonate is given, the osteoclasts abruptly stop resorbing the bone, but osteoblasts continue to fill the pits that were there when the bisphosphonate was started. For the next several months, while the previous pits are being filled, the bone volume increases slightly. Thereafter, rates of both bone resorption and bone formation are very low.
A misconception: Bisphosphonates build bone
While semantically it is true that the bone formation rate in patients taking bisphosphonates is within the normal premenopausal range, this often-repeated statement is essentially misleading.
With continued bisphosphonate use, the bone gradually becomes more dense. There is no further new bone, but the existing bone matrix is packed more tightly with mineral crystals.9 The old bone is not resorbed. The bone density, measured radiographically, increases most rapidly during the first 6 months (while resorption pits are filling in) and more gradually over the next 3 years (while bone is becoming more mineralized).
Another common misunderstanding is that the bone density increases because the drugs are “building bone.” After 3 years, the bone density in the femur reaches a plateau.10 I have seen patients who were very worried because their bone density was no longer increasing, and their physicians did not realize that this is the expected pattern. The spinal bone density continues to increase modestly, but some of this may be from disk space narrowing, harder bone edges, and soft-tissue calcifications. Spinal bone density frequently increases even in those on placebo.
Bisphosphonates suppress markers of bone turnover
These changes in bone remodeling with bisphosphonates are reflected by changes in markers of bone formation and resorption. The levels of markers of bone resorption—N-telopeptide cross-linked type I collagen (NTx) and C-telopeptide cross-linked type I collagen (CTx)—decrease rapidly and remain low. The markers of bone formation—propeptide of type I collagen, bone alkaline phosphatase, and osteocalcin—decrease gradually over 3 to 6 months and then remain low. As measured directly at the bone, bone formation appears to be more suppressed than as measured by biochemical markers in the serum.
In a risedronate trial,11 the fracture rate decreased as the biochemical markers of bone turnover decreased, except when the markers were very low, in which case the fracture rate increased.
Without remodeling, cracks can accumulate
The bisphosphonates do not significantly increase bone volume, but they prevent microscopic architectural deterioration of the bone, as shown on microscopic computed tomographic imaging.12 This prevents fractures for at least 5 years.
But bisphosphonates may have long-term negative effects. One purpose of bone remodeling is to refresh the bone and to repair the microscopic damage that accumulates within any structure. Without remodeling, cracks can accumulate. Because the development and repair of microcracks is complex, it is difficult to predict what will happen with long-term bisphosphonate use. Studies of biopsies from women taking bisphosphonates long-term are inconsistent: one study found accumulation of microcracks,13 but another did not.8
STUDIES OF LONG-TERM USE: FOCUS ON FRACTURES
For this review, I consider long-term bisphosphonate use to be greater than 5 years, and I will focus on fractures. Bone density is only a surrogate end point. Unfortunately, this fact is often not emphasized in the training of young physicians.
The best illustration of this point was in a randomized clinical trial of fluoride,14 in which the bone density of the treated group increased by 8% per year for 4 years, for a total increase of 32%. This is more than we ever see with current therapies. But the patients had more fractures with fluoride than with placebo. This is because the quality of bone produced after fluoride treatment is poor, and although the bone is denser, it is weaker.
Observational studies of fracture incidence in patients who continued taking bisphosphonates compared with those who stopped provide some weak evidence about long-term effectiveness.
Curtis et al15 found, in 9,063 women who were prescribed bisphosphonates, that those who stopped taking them during the first 2 years had higher rates of hip fracture than compliant patients. Those who took bisphosphonates for 3 years and then stopped had a rate of hip fracture during the next year similar to that of those who continued taking the drugs.
Meijer et al16 used a database in the Netherlands to examine the fracture rates in 14,750 women who started taking a bisphosphonate for osteoporosis between 1996 and 2004. More than half of the women stopped taking the drug during the first year, and they served as the control group. Those who took bisphosphonates for 3 to 4 years had significantly fewer fractures than those who stopped during the first year (odds ratio 0.54). However, those who took them for 5 to 6 years had slightly more fractures than those who took them for less than a year.
Mellström et al17 performed a 2-year uncontrolled extension of a 5-year trial of risedronate that had blinded controls.18 Initially, 407 women were in the risedronate group; 68 completed 7 years.
The vertebral fracture rate in the placebo group was 7.6% per year during years 0 through 3. In the risedronate group, the rate was 4.7% per year during years 0 through 3 and 3.8% per year during years 6 and 7. Nonvertebral fractures occurred in 10.9% of risedronate-treated patients during the first 3 years and in 6% during the last 2 years. Markers of bone turnover remained reduced throughout the 7 years. Bone mineral density of the spine and hip did not change from years 5 to 7. The study did not include those who took risedronate for 5 years and then discontinued it.
Bone et al19 performed a similar, 10-year uncontrolled extension of a 3-year controlled trial of alendronate.20 There were 398 patients randomly assigned to alendronate, and 164 remained in the study for 8 to 10 years.
During years 8 through 10, bone mineral density of the spine increased by about 2%; no change was seen in the hip or total body. The nonvertebral fracture rate was similar in years 0 through 3 and years 6 through 10. Vertebral fractures occurred in approximately 3% of women in the first 3 years and in 9% in the last 5 years.
The FLEX trial: Continuing alendronate vs stopping
Only one study compared continuing a bisphosphonate vs stopping it. The Fracture Intervention Trial Long-Term Extension (FLEX)10 was an extension of the Fracture Intervention Trial (FIT)21,22 of alendronate. I am reviewing this study in detail because it is the only one that randomized patients and was double-blinded.
In the original trial,21,22 3,236 women were in the alendronate group. After a mean of 5 years on alendronate, 1,099 of them were randomized into the alendronate or placebo group.10 Those with T scores lower than −3.5 or who had lost bone density during the first 5 years were excluded.
The bone mineral density of the hip in the placebo group decreased by 3.4%, whereas in the alendronate group it decreased by 1.0%. At the spine, the placebo group gained less than the alendronate group.
Despite these differences in bone density, no significant difference was noted in the rates of all clinical fractures, nonvertebral fractures, vertebral fractures as measured on radiographs taken for the study (“morphometric” fractures, 11.3% vs 9.8%), or in the number of severe vertebral fractures (those with more than a two-grade change on radiography) between those who took alendronate for 10 years and those who took it for 5 years followed by placebo for 5 years.
However, fewer “clinical spine fractures” were observed in the group continuing alendronate (2.4% vs 5.3%). A clinical spine fracture was one diagnosed by the patient’s personal physician.
In FIT, these clinical fractures were painful in 90% of patients, and although the community radiographs were reviewed by a central radiologist, only 73% of the fractures were confirmed by subsequent measurements on the per protocol radiographs done at the study centers. About one-fourth of the morphometric fractures were also clinical fractures.23 Therefore, I think morphometric fractures provide the best evidence about the effects of treatment—ie, that treatment beyond 5 years is not beneficial. Other physicians, however, disagree, emphasizing the 55% reduction in clinical fractures.24
Markers of bone turnover gradually increased after discontinuation but remained lower than baseline even after 5 years without alendronate.10 There were no significant differences in fracture rates between the placebo and alendronate groups in those with baseline bone mineral density T scores less than −2.5.10 Also, after age adjustment, the fracture incidence was similar in the FIT and the FLEX studies.
Several years later, the authors published a post hoc subgroup analysis of these data.25 The patients were divided into six subgroups based on bone density and the presence of vertebral fractures at baseline. This is weak evidence, but I include it because reviews in the literature have emphasized only the positive findings, or have misquoted the data: Schwartz et al stated that in those with T scores of −2.5 or below, the risk of nonvertebral fracture was reduced by 50%25; and Shane26 concluded in an editorial that the use of alendronate for 10 years, rather than for 5 years, was associated with significantly fewer new vertebral fractures and nonvertebral fractures in patients with a bone mineral density T score of −2.5 or below.26
ATYPICAL FEMUR FRACTURES
By March 2011, there were 55 papers describing a total of 283 cases, and about 85 individual cases (listed online in Ott SM. Osteoporosis and Bone Physiology. http://courses.washington.edu/bonephys/opsubtroch.html. Accessed 7/30/2011).
The mean age of the patients was 65, bisphosphonate use was longer than 5 years in 77% of cases, and bilateral fractures were seen in 48%.
The fractures occur with minor trauma, such as tripping, stepping off an elevator, or being jolted by a subway stop, and a disproportionate number of cases involve no trauma. They are often preceded by leg pain, typically in the mid-thigh.
These fractures are characterized by radiographic findings of a transverse fracture, with thickened cortices near the site of the fracture. Often, there is a peak on the cortex that may precede the fracture. These fractures initiate on the lateral side, and it is striking that they occur in the same horizontal plane on the contralateral side.
Radiographs and bone scans show stress fractures on the lateral side of the femur that resemble Looser zones (ie, dark lines seen radiographically). These radiographic features are not typical in osteoporosis but are reminiscent of the stress fractures seen with hypophosphatasia, an inherited disease characterized by severely decreased bone formation.31
Bone biopsy specimens show very low bone formation rates, but this is not a necessary feature. At the fracture site itself there is bone activity. For example, pathologists from St. Louis reviewed all iliac crest bone biopsies from patients seen between 2004 and 2007 who had an unusual cortical fracture while taking a bisphosphonate. An absence of double tetracycline labels was seen in 11 of the 16 patients.32
The first reports were anecdotal cases, then some centers reported systematic surveys of their patients. In a key report, Neviaser et al33 reviewed all low-trauma subtrochanteric fractures in their large hospital and found 20 cases with the atypical radiographic appearance; 19 of the patients in these cases had been taking a bisphosphonate. A similar survey in Australia found 41 cases with atypical radiographic features (out of 79 subtrochanteric low-trauma fractures), and all of the patients had been taking a bisphosphonate.34
By now, more than 230 cases have been reported. The estimated incidence is 1 in 1,000, based on a review of operative cases and radiographs.35
However, just because the drugs are associated with the fractures does not mean they caused the fractures, because the patients who took bisphosphonates were more likely to get a fracture in the first place. This confounding by indication makes it difficult to prove beyond a doubt that bisphosphonates cause atypical fractures.
Further, some studies have found no association between bisphosphonates and subtrochanteric fractures.36,37 These database analyses have relied on the coding of the International Classification of Diseases, Ninth Revision (ICD-9), and not on the examination of radiographs. We reviewed the ability of ICD-9 codes to identify subtrochanteric fractures and found that the predictive ability was only 36%.38 Even for fractures in the correct location, the codes cannot tell which cases have the typical spiral or comminuted fractures seen in osteoporosis and which have the unusual features of the bisphosphonate-associated fractures. Subtrochanteric and shaft fractures are about 10 times less common than hip fractures, and the atypical ones are about 10 times less common than typical ones, so studies based on ICD-9 codes cannot exonerate bisphosphonates.
A report of nearly 15,000 patients from randomized clinical trials did not find a significant incidence of subtrochanteric fractures, but the radiographs were not examined and only 500 of the patients had taken the medication for longer than 5 years.39
A population-based, nested case-control study using a database from Ontario, Canada, found an increased risk of diaphyseal femoral fractures in patients who had taken bisphosphonates longer than 5 years. The study included only women who had started bisphosphonates when they were older than 68, so many of the atypical fractures would have been missed. The investigators did not review the radiographs, so they combined both osteoporotic and atypical diaphyseal fractures in their analysis.40
At the 2010 meeting of the American Society for Bone and Mineral Research, preliminary data were presented from a systematic review of radiographs of patients with fractures of the femur from a health care plan with data about the use of medications. The incidence of atypical fractures increased progressively with the duration of bisphosphonate use, and was significantly higher after 5 years compared with less than 3 years.28
OTHER POSSIBLE ADVERSE EFFECTS
There have been conflicting reports about esophageal cancer with bisphosphonate use.41,42
Another possible adverse effect, osteonecrosis of the jaw, may have occurred in 1.4% of patients with cancer who were treated for 3 years with high intravenous doses of bisphosphonates (about 10 to 12 times the doses recommended for osteoporosis).43 This adverse effect is rare in patients with osteoporosis, occurring in less than 1 in 10,000 exposed patients.44
BISPHOSPHONATES SHOULD BE USED WHEN THEY ARE INDICATED
The focus of this paper is on the duration of use, but concern about long-term use should not discourage physicians or patients from using these drugs when there is a high risk of an osteoporotic fracture within the next 10 years, particularly in elderly patients who have experienced a vertebral compression fracture or a hip fracture. Patients with a vertebral fracture have a one-in-five chance of fracturing another vertebra, which is a far higher risk than any of the known long-term side effects from treatment, and bisphosphonates are effective at reducing the risk.
Low bone density alone can be used as an indication for bisphosphonates if the hip T score is lower than −2.5. A cost-effectiveness study concluded that alendronate was beneficial in these cases.45 In the FIT patients without a vertebral fracture at baseline, the overall fracture rate was significantly decreased by 36% with alendronate in those with a hip T score lower than −2.5, but there was no difference between placebo and alendronate in those with T scores between −2 and −2.5, and a 14% (nonsignificant) higher fracture rate when the T score was better than −2.0.22
A new method of calculating the risk of an osteoporotic fracture is the FRAX prediction tool (http://www.shef.ac.uk/FRAX), and one group has suggested that treatment is indicated when the 10-year risk of a hip fracture is greater than 3%.46 Another group, from the United Kingdom, suggests using a sliding scale depending on the fracture risk and the age.47
It is not always clear what to do when the hip fracture risk is greater than 3% for the next decade but the T score is better than −2.5. These patients have other factors that contribute to fracture risk. Their therapy must be individualized, and if they are at risk of fracture because of low weight, smoking, or alcohol use, it makes more sense to focus the approach on those treatable factors.
Women who have osteopenia and have not had a fragility fracture are often treated with bisphosphonates with the intent of preventing osteoporosis in the distant future. This approach is based on hope, not evidence, and several editorial reviews have concluded that these women do not need drug therapy.48–50
MY RECOMMENDATION: STOP AFTER 5 YEARS
Bisphosphonates reduce the incidence of devastating osteoporotic fractures in patients with osteoporosis, but that does not mean they should be used indefinitely.
After 5 years, the overall fracture risk is the same in patients who keep taking bisphosphonates as in patients who discontinue them. Therefore, I think these drugs are no longer necessary after 5 years. The post hoc subgroup analysis that showed benefit in only one of six groups of the FLEX study does not provide compelling evidence to continue taking bisphosphonates.
While awaiting better studies, we use the approach shown in the algorithm in Figure 4.
Follow the patient with bone resorption markers
In patients who have shown some improvement in bone density during 5 years of bisphosphonate treatment and who have not had any fractures, I measure a marker of bone resorption at the end of 5 years.
The use of a biochemical marker to assess patients treated with anti-turnover drugs has not been studied in a formal trial, so we have no grade A evidence for recommending it. However, there have been many papers describing the effects of bisphosphonates on these markers, and it makes physiologic sense to use them in situations where decisions must be made when there is not enough evidence.
In FIT (a trial of alendronate), we reported that the change in bone turnover markers was significantly related to the reduction in fracture risk, and the effect was at least as strong as that observed with a 1-year change in bone density. Those with a 30% decrease in bone alkaline phosphatase had a significant reduction in fracture risk.51
Furthermore, in those patients who were compliant with bisphosphonate treatment, the reduction in fractures with alendronate treatment was significantly better in those who initially had a high bone turnover.52
Similarly, with risedronate, the change in NTx accounted for half of the effect on fracture reduction during the clinical trial, and there was little further improvement in fracture benefit below a decrease of 35% to 40%.10
The baseline NTx level in these clinical trials was about 70 nmol bone collagen equivalents per millimole of creatinine (nmol BCE/mmol Cr) in the risedronate study and 60 in the alendronate study, and in both the fracture reduction was seen at a level of about 40. The FLEX study measured NTx after 5 years, and the average was 19 nmol BCE/mmol Cr. This increased to 22 after 3 years without alendronate.53 At 5 years, the turnover markers had gradually increased but were still 7% to 24% lower than baseline.10
These markers have a diurnal rhythm and daily variation, but despite these limitations they do help identify low bone resorption.
In our hospital, NTx is the most economical marker, and my patients prefer a urine sample to a blood test. Therefore, we measure the NTx and consider values lower than 40 nmol BCE/mmol Cr to be satisfactory.
If the NTx is as low as expected, I discontinue the bisphosphonate. The patient remains on 1,200 mg/day of calcium and 1,000 U/day vitamin D supplementation and is encouraged to exercise.
Bone density tends to be stable for 1 or 2 years after stopping a bisphosphonate, and the biochemical markers of bone resorption remain reduced for several years. We remeasure the urine NTx level annually, and if it increases to more than 40 nmol BCE/mmol Cr an antiresorptive medication is given: either the bisphosphonate is restarted or raloxifene (Evista), calcitonin (Miacalcin), or denosumab (Prolia) is used.
Bone density is less helpful, but reassuring
Bone density is less helpful because it decreases even though the markers of bone resorption remain low. Although one could argue that bone density is not helpful in monitoring patients on therapy, I think it is reassuring to know the patient is not excessively losing bone.
Checking at 2-year intervals is reasonable. If the bone density shows a consistent decrease greater than 6% (which is greater than the difference we can see from patients walking around the room), then we would re-evaluate the patient and consider adding another medication.
If the bone density decreases but the biomarkers are low, then clinical judgment must be used. The bone density result may be erroneous due to different positioning or different regions of interest.
If turnover markers are not reduced
If a patient has been prescribed a bisphosphonate for 5 years but the NTx level is not reduced, I reevaluate the patient. Some are not taking the medication or are not taking it properly. The absorption of oral bisphosphonates is quite low in terms of bioavailability, and this decreases to nearly zero if the medication is taken with food. Some patients may have another disease, such as hyperparathyroidism, malignancy, hyperthyroidism, weight loss, malabsorption, celiac sprue, or vitamin D deficiency.
If repeated biochemical tests show high bone resorption and if the bone density response is suboptimal without a secondary cause, I often switch to an intravenous form of bisphosphonate because some patients do not seem to absorb the oral doses.
If a patient has had a fracture
If a patient has had a fracture despite several years of bisphosphonate therapy, I first check for any other medical problems. The bone markers are, unfortunately, not very helpful because they increase after a fracture and stay elevated for at least 4 months.54 If there are no contraindications, treatment with teriparatide (Forteo) is a reasonable choice. There is evidence from human biopsy studies that teriparatide can reduce the number of microcracks that were related to bisphosphonate treatment,13 and can increase the bone formation rate even when there has been prior bisphosphonate treatment.55–57 Although the anabolic response is blunted, it is still there.58
If the patient remains at high risk
A frail patient with a high risk of fracture presents a challenge, especially one who needs treatment with glucocorticoids or who still has a hip T score below −3. Many physicians are uneasy about discontinuing all osteoporosis-specific drugs, even after 5 years of successful bisphosphonate treatment. In these patients anabolic medications make the most sense. Currently, teriparatide is the only one available, but others are being developed. Bone becomes resistant to the anabolic effects of teriparatide after about 18 months, so this drug cannot be used indefinitely. What we really need are longer-lasting anabolic medicines!
If the patient has thigh pain
Finally, in patients with thigh pain, radiography of the femur should be done to check for a stress fracture. Magnetic resonance imaging or computed tomography may be needed to diagnose a hairline fracture.
If there are already radiographic changes that precede the atypical fractures, then bisphosphonates should be discontinued. In a follow-up observational study of 16 patients who already had one fracture, all four whose contralateral side showed a fracture line (the “dreaded black line”) eventually completed the fracture.59
Another study found that five of six incomplete fractures went on to a complete fracture if not surgically stabilized with rods.60 This is an indication for prophylactic rodding of the femur.
Teriparatide use and rodding of a femur with thickening but not a fracture line must be decided on an individual basis and should be considered more strongly in those with pain in the thigh.
- Francis MD, Valent DJ. Historical perspectives on the clinical development of bisphosphonates in the treatment of bone diseases. J Musculoskelet Neuronal Interact 2007; 7:2–8.
- Bilezikian JP. Efficacy of bisphosphonates in reducing fracture risk in postmenopausal osteoporosis. Am J Med 2009; 122(suppl 2):S14–S21.
- Siris ES, Pasquale MK, Wang Y, Watts NB. Estimating bisphosphonate use and fracture reduction among US women aged 45 years and older, 2001–2008. J Bone Miner Res 2011; 26:3–11.
- Russell RG, Xia Z, Dunford JE, et al. Bisphosphonates: an update on mechanisms of action and how these relate to clinical efficacy. Ann N Y Acad Sci 2007; 1117:209–257.
- Parfitt AM. Misconceptions (2): turnover is always higher in cancellous than in cortical bone. Bone 2002; 30:807–809.
- Han ZH, Palnitkar S, Rao DS, Nelson D, Parfitt AM. Effects of ethnicity and age or menopause on the remodeling and turnover of iliac bone: implications for mechanisms of bone loss. J Bone Miner Res 1997; 12:498–508.
- Chavassieux PM, Arlot ME, Reda C, Wei L, Yates AJ, Meunier PJ. Histomorphometric assessment of the long-term effects of alendronate on bone quality and remodeling in patients with osteoporosis. J Clin Invest 1997; 100:1475–1480.
- Chapurlat RD, Arlot M, Burt-Pichat B, et al. Microcrack frequency and bone remodeling in postmenopausal osteoporotic women on long-term bisphosphonates: a bone biopsy study. J Bone Miner Res 2007; 22:1502–1509.
- Boivin G, Meunier PJ. Effects of bisphosphonates on matrix mineralization. J Musculoskelet Neuronal Interact 2002; 2:538–543.
- Black DM, Schwartz AV, Ensrud KE, et al; FLEX Research Group. Effects of continuing or stopping alendronate after 5 years of treatment: the Fracture Intervention Trial Long-term Extension (FLEX): a randomized trial. JAMA 2006; 296:2927–2938.
- Eastell R, Hannon RA, Garnero P, Campbell MJ, Delmas PD. Relationship of early changes in bone resorption to the reduction in fracture risk with risedronate: review of statistical analysis. J Bone Miner Res 2007; 22:1656–1660.
- Borah B, Dufresne TE, Chmielewski PA, Johnson TD, Chines A, Manhart MD. Risedronate preserves bone architecture in postmenopausal women with osteoporosis as measured by three-dimensional microcomputed tomography. Bone 2004; 34:736–746.
- Stepan JJ, Dobnig H, Burr DB, et al. Histomorphometric changes by teriparatide in alendronate pre-treated women with osteoporosis (abstract). Presented at the Annual Meeting of the American Society of Bone and Mineral Research, Montreal 2008: #1019.
- Riggs BL, Hodgson SF, O’Fallon WM, et al. Effect of fluoride treatment on the fracture rate in postmenopausal women with osteoporosis. N Engl J Med 1990; 322:802–809.
- Curtis JR, Westfall AO, Cheng H, Delzell E, Saag KG. Risk of hip fracture after bisphosphonate discontinuation: implications for a drug holiday. Osteoporos Int 2008; 19:1613–1620.
- Meijer WM, Penning-van Beest FJ, Olson M, Herings RM. Relationship between duration of compliant bisphosphonate use and the risk of osteoporotic fractures. Curr Med Res Opin 2008; 24:3217–3222.
- Mellström DD, Sörensen OH, Goemaere S, Roux C, Johnson TD, Chines AA. Seven years of treatment with risedronate in women with postmenopausal osteoporosis. Calcif Tissue Int 2004; 75:462–468.
- Reginster J, Minne HW, Sorensen OH, et al. Randomized trial of the effects of risedronate on vertebral fractures in women with established postmenopausal osteoporosis. Vertebral Efficacy with Risedronate Therapy (VERT) Study Group. Osteoporos Int 2000; 11:83–91.
- Bone HG, Hosking D, Devogelaer JP, et al; Alendronate Phase III Osteoporosis Treatment Study Group. Ten years’ experience with alendronate for osteoporosis in postmenopausal women. N Engl J Med 2004; 350:1189–1199.
- Liberman UA, Weiss SR, Bröll J, et al. Effect of oral alendronate on bone mineral density and the incidence of fractures in postmenopausal osteoporosis. The Alendronate Phase III Osteoporosis Treatment Study Group. N Engl J Med 1995; 333:1437–1443.
- Black DM, Cummings SR, Karpf DB, et al; Fracture Intervention Trial Research Group. Randomised trial of effect of alendronate on risk of fracture in women with existing vertebral fractures. Lancet 1996; 348:1535–1541.
- Cummings SR, Black DM, Thompson DE, et al. Effect of alendronate on risk of fracture in women with low bone density but without vertebral fractures: results from the Fracture Intervention Trial. JAMA 1998; 280:2077–2082.
- Fink HA, Milavetz DL, Palermo L, et al. What proportion of incident radiographic vertebral deformities is clinically diagnosed and vice versa? J Bone Miner Res 2005; 20:1216–1222.
- Watts NB, Diab DL. Long-term use of bisphosphonates in osteoporosis. J Clin Endocrinol Metab 2010; 95:1555–1565.
- Schwartz AV, Bauer DC, Cummings SR, et al; FLEX Research Group. Efficacy of continued alendronate for fractures in women with and without prevalent vertebral fracture: the FLEX trial. J Bone Miner Res 2010; 25:976–982.
- Shane E. Evolving data about subtrochanteric fractures and bisphosphonates (editorial). N Engl J Med 2010; 362:1825–1827.
- Sellmeyer DE. Atypical fractures as a potential complication of long-term bisphosphonate therapy. JAMA 2010; 304:1480–1484.
- Shane E, Burr D, Ebeling PR, et al; American Society for Bone and Mineral Research. Atypical subtrochanteric and diaphyseal femoral fractures: report of a task force of the American Society for Bone and Mineral Research. J Bone Miner Res 2010; 25:2267–2294.
- Giusti A, Hamdy NA, Papapoulos SE. Atypical fractures of the femur and bisphosphonate therapy: a systematic review of case/case series studies. Bone 2010; 47:169–180.
- Rizzoli R, Akesson K, Bouxsein M, et al. Subtrochanteric fractures after long-term treatment with bisphosphonates: a European Society on Clinical and Economic Aspects of Osteoporosis and Osteoarthritis, and International Osteoporosis Foundation Working Group Report. Osteoporos Int 2011; 22:373–390.
- Whyte MP. Atypical femoral fractures, bisphosphonates, and adult hypophosphatasia. J Bone Miner Res 2009; 24:1132–1134.
- Armamento-Villareal R, Napoli N, Panwar V, Novack D. Suppressed bone turnover during alendronate therapy for high-turnover osteoporosis. N Engl J Med 2006; 355:2048–2050.
- Neviaser AS, Lane JM, Lenart BA, Edobor-Osula F, Lorich DG. Low-energy femoral shaft fractures associated with alendronate use. J Orthop Trauma 2008; 22:346–350.
- Isaacs JD, Shidiak L, Harris IA, Szomor ZL. Femoral insufficiency fractures associated with prolonged bisphosphonate therapy. Clin Orthop Relat Res 2010; 468:3384–3392.
- Schilcher J, Aspenberg P. Incidence of stress fractures of the femoral shaft in women treated with bisphosphonate. Acta Orthop 2009; 80:413–415.
- Abrahamsen B, Eiken P, Eastell R. Cumulative alendronate dose and the long-term absolute risk of subtrochanteric and diaphyseal femur fractures: a register-based national cohort analysis. J Clin Endocrinol Metab 2010; 95:5258–5265.
- Kim SY, Schneeweiss S, Katz JN, Levin R, Solomon DH. Oral bisphosphonates and risk of subtrochanteric or diaphyseal femur fractures in a population-based cohort. J Bone Miner Res 2010. [Epub ahead of print]
- Spangler L, Ott SM, Scholes D. Utility of automated data in identifying femoral shaft and subtrochanteric (diaphyseal) fractures. Osteoporos Int. 2010. [Epub ahead of print]
- Black DM, Kelly MP, Genant HK, et al; Fracture Intervention Trial Steering Committee; HORIZON Pivotal Fracture Trial Steering Committee. Bisphosphonates and fractures of the subtrochanteric or diaphyseal femur. N Engl J Med 2010; 362:1761–1771.
- Park-Wyllie LY, Mamdani MM, Juurlink DN, et al. Bisphosphonate use and the risk of subtrochanteric or femoral shaft fractures in older women. JAMA 2011; 305:783–789.
- Green J, Czanner G, Reeves G, Watson J, Wise L, Beral V. Oral bisphosphonates and risk of cancer of oesophagus, stomach, and colorectum: case-control analysis within a UK primary care cohort. BMJ 2010; 341:c4444.
- Cardwell CR, Abnet CC, Cantwell MM, Murray LJ. Exposure to oral bisphosphonates and risk of esophageal cancer. JAMA 2010; 304:657–663.
- Stopeck AT, Lipton A, Body JJ, et al. Denosumab compared with zoledronic acid for the treatment of bone metastases in patients with advanced breast cancer: a randomized, double-blind study. J Clin Oncol 2010; 28:5132–5139.
- Khosla S, Burr D, Cauley J, et al; American Society for Bone and Mineral Research. Bisphosphonate-associated osteonecrosis of the jaw: report of a task force of the American Society for Bone and Mineral Research. J Bone Miner Res 2007; 22:1479–1491.
- Schousboe JT, Ensrud KE, Nyman JA, Kane RL, Melton LJ. Cost-effectiveness of vertebral fracture assessment to detect prevalent vertebral deformity and select postmenopausal women with a femoral neck T-score > −2.5 for alendronate therapy: a modeling study. J Clin Densitom 2006; 9:133–143.
- Dawson-Hughes B; National Osteoporosis Foundation Guide Committee. A revised clinician’s guide to the prevention and treatment of osteoporosis. J Clin Endocrinol Metab 2008; 93:2463–2465.
- Compston J, Cooper A, Cooper C, et al; the National Osteoporosis Guideline Group (NOGG). Guidelines for the diagnosis and management of osteoporosis in postmenopausal women and men from the age of 50 years in the UK. Maturitas 2009; 62:105–108.
- Cummings SR. A 55-year-old woman with osteopenia. JAMA 2006; 296:2601–2610.
- Khosla S, Melton LJ. Clinical practice. Osteopenia. N Engl J Med 2007; 356:2293–2300.
- McClung MR. Osteopenia: to treat or not to treat? Ann Intern Med 2005; 142:796–797.
- Bauer DC, Black DM, Garnero P, et al; Fracture Intervention Trial Study Group. Change in bone turnover and hip, non-spine, and vertebral fracture in alendronate-treated women: the fracture intervention trial. J Bone Miner Res 2004; 19:1250–1258.
- Bauer DC, Garnero P, Hochberg MC, et al; for the Fracture Intervention Research Group. Pretreatment levels of bone turnover and the anti-fracture efficacy of alendronate: the fracture intervention trial. J Bone Miner Res 2006; 21:292–299.
- Ensrud KE, Barrett-Connor EL, Schwartz A, et al; Fracture Intervention Trial Long-Term Extension Research Group. Randomized trial of effect of alendronate continuation versus discontinuation in women with low BMD: results from the Fracture Intervention Trial long-term extension. J Bone Miner Res 2004; 19:1259–1269.
- Ivaska KK, Gerdhem P, Akesson K, Garnero P, Obrant KJ. Effect of fracture on bone turnover markers: a longitudinal study comparing marker levels before and after injury in 113 elderly women. J Bone Miner Res 2007; 22:1155–1164.
- Cosman F, Nieves JW, Zion M, Barbuto N, Lindsay R. Retreatment with teriparatide one year after the first teriparatide course in patients on continued long-term alendronate. J Bone Miner Res 2009; 24:1110–1115.
- Jobke B, Pfeifer M, Minne HW. Teriparatide following bisphosphonates: initial and long-term effects on microarchitecture and bone remodeling at the human iliac crest. Connect Tissue Res 2009; 50:46–54.
- Miller PD, Delmas PD, Lindsay R, et al; Open-label Study to Determine How Prior Therapy with Alendronate or Risedronate in Postmenopausal Women with Osteoporosis Influences the Clinical Effectiveness of Teriparatide Investigators. Early responsiveness of women with osteoporosis to teriparatide after therapy with alendronate or risedronate. J Clin Endocrinol Metab 2008; 93:3785–3793.
- Ettinger B, San Martin J, Crans G, Pavo I. Differential effects of teriparatide on BMD after treatment with raloxifene or alendronate. J Bone Miner Res 2004; 19:745–751.
- Koh JS, Goh SK, Png MA, Kwek EB, Howe TS. Femoral cortical stress lesions in long-term bisphosphonate therapy: a herald of impending fracture? J Orthop Trauma 2010; 24:75–81.
- Banffy MB, Vrahas MS, Ready JE, Abraham JA. Nonoperative versus prophylactic treatment of bisphosphonate-associated femoral stress fractures. Clin Orthop Relat Res 2011; 469:2028–2034.
KEY POINTS
- Bisphosphonates reduce the risk of osteoporotic fractures, including devastating hip and spine fractures.
- As with any drugs, bisphosphonates should not be used indiscriminately. They are indicated for patients at high risk of fracture, especially those with vertebral fractures or a hip bone density T score lower than −2.5.
- There is little evidence to guide physicians about the duration of bisphosphonate therapy beyond 5 years. One study with marginal power did not show any difference in fracture rates between those who continued taking alendronate and those who discontinued after 5 years (JAMA 2006; 296:2927–2938).
- Evidence is accumulating that the risk of atypical fracture of the femur increases after 5 years of bisphosphonate use.
- Anabolic drugs are needed; the only one currently available is teriparatide (Forteo), which can be used when fractures occur despite (or perhaps because of) bisphosphonate use.

Vancomycin: A 50-something-year-old antibiotic we still don’t understand
In the past half-century, vancomycin has gone from near-orphan status to being one of the most often used antibiotics in our formulary. The driving force for its use is clear: the evolution of Staphylococcus aureus. At first, vancomycin was used to treat infections caused by penicillin-resistant strains. However, the discovery of methicillin curbed its use for more than 2 decades.1
Then, as methicillin-resistant S aureus (MRSA) began to spread in the 1980s, the use of vancomycin began to increase, and with the rise in community-associated MRSA infections in the 1990s, it became even more widely prescribed. The recent Infectious Diseases Society of America (IDSA) guidelines for treatment of infections due to MRSA are replete with references to the use of vancomycin.2
Another factor driving the use of vancomycin is the increased prevalence of device-associated infections, many of which are caused by coagulase-negative staphylococci and other organisms that colonize the skin.3 Many of these bacteria are susceptible only to vancomycin; they may be associated with infections of vascular catheters, cardiac valves, pacemakers, implantable cardioverter-defibrillators, orthopedic implants, neurosurgical devices, and other devices.
To use vancomycin appropriately, we need to recognize the changing minimum inhibitory concentrations (MICs), to select proper doses and dosing intervals, and to know how to monitor its use. Despite more than 50 years of experience with vancomycin, we sometimes find ourselves with more questions than answers about its optimal use.
WHAT IS VANCOMYCIN?
Vancomycin is a glycopeptide antibiotic isolated from a strain of Streptomyces orientalis discovered in a soil sample from Borneo in the mid-1950s.1 It exerts its action by binding to a d-alanyl-d-alanine cell wall precursor necessary for peptidoglycan cross-linking and, therefore, for inhibiting bacterial cell wall synthesis.
Vancomycin is bactericidal against most gram-positive species, including streptococci and staphylococci, with the exception of Enterococcus species, for which it is bacteriostatic. Though it is bactericidal, it appears to kill bacteria more slowly than beta-lactam antibiotics, and therefore it may take longer to clear bacteremia.4
WHAT IS THE BEST WAY TO DOSE VANCOMYCIN?
Vancomycin is widely distributed to most tissues, with an approximate volume of distribution of 0.4 to 1 L/kg; 50% to 55% is protein-bound. Because of this large volume of distribution, vancomycin’s dosing is based on actual body weight.
Vancomycin is not metabolized and is primarily excreted unchanged in the urine via glomerular filtration. It therefore requires dosage adjustments for renal insufficiency.
Vancomycin’s molecular weight is 1,485.73 Da, making it less susceptible to removal by dialysis than smaller molecules. Dosing of vancomycin in patients on hemodialysis depends on many factors specific to the dialysis center, including but not limited to the type of filter used, the duration of filtration, and whether high-flux filtration is used.
Is continuous intravenous infusion better than standard dosing?
Giving vancomycin by continuous infusion has been suggested as a way to optimize its serum concentration and improve its clinical effectiveness.
Wysocki et al5 conducted a multicenter, prospective, randomized study comparing continuous and intermittent intravenous infusions of vancomycin (the latter every 12 hours) to treat severe hospital-acquired MRSA infections, including bloodstream infections and pneumonia. Although blood concentrations above 10 μg/mL were reached more than 30 hours faster with continuous infusions than with intermittent ones, the microbiologic and clinical outcomes were similar with either method.
James et al6 compared the pharmacodynamics of conventional dosing of vancomycin (ie, 1 g every 12 hours) and continuous infusion in 10 patients with suspected or documented gram-positive infections in a prospective, randomized, crossover study. While no adverse effects were observed, the authors also found no statistically significant difference between the treatment groups in the pharmacodynamic variables investigated, including the area under the curve (AUC) divided by the MIC (the AUC-MIC ratio).
In view of the currently available data, the guidelines for monitoring vancomycin therapy note that there does not appear to be any difference in patient outcomes with continuous infusion vs intermittent dosing.7
Should a loading dose be given?
Another proposed strategy for optimizing vancomycin’s effectiveness is to give a higher initial dose, ie, a loading dose.
Wang et al8 performed a single-center study in 28 patients who received a 25 mg/kg loading dose at a rate of 500 mg/hour. This loading dose was safe, but the authors did not evaluate its efficacy.
Mohammedi et al9 compared loading doses of 500 mg and 15 mg/kg in critically ill patients receiving vancomycin by continuous infusion. The weight-based loading dose produced higher post-dose levels and a significantly higher rate of clinical cure, but there was no significant difference in the rate of survival to discharge from the intensive care unit.
While the use of a loading dose appears to be safe and likely leads to more rapid attainment of therapeutic blood levels, we lack data on whether it improves clinical outcomes, and further study is needed to determine its role.
WHAT IS THE BEST WAY TO MONITOR VANCOMYCIN THERAPY?
Whether and how to use the serum vancomycin concentration to adjust the dosing has been a matter of debate for many years. Convincing evidence that vancomycin levels predict clinical outcomes or that measuring them prevents toxicity is lacking.7
A consensus statement from the American Society of Health-System Pharmacists, the IDSA, and the Society of Infectious Diseases Pharmacists7 contains recommendations for monitoring vancomycin therapy, based on a critical evaluation of the available scientific evidence. Their recommendations:
- Vancomycin serum concentrations should be checked to optimize therapy and used as a surrogate marker of effectiveness.
- Trough, rather than peak, levels should be monitored.
- Trough levels should be checked just before the fourth dose, when steady-state levels are likely to have been achieved. More frequent monitoring may be considered in patients with fluctuating renal function.
- Trough levels should be higher than 10 mg/L to prevent the development of resistance.
- To improve antibiotic penetration and optimize the likelihood of achieving pharmacokinetic and pharmacodynamic targets, trough levels of 15 to 20 mg/L are recommended for pathogens with a vancomycin MIC of 1 mg/L or higher and for complicated infections such as endocarditis, osteomyelitis, meningitis, and hospital-acquired pneumonia.
- For prolonged courses, it is appropriate to check vancomycin levels weekly in hemodynamically stable patients and more often in those who are not hemodynamically stable.
IS VANCOMYCIN NEPHROTOXIC?
In the 1950s, vancomycin formulations were sometimes called “Mississippi mud” because of the many impurities they contained.1 These impurities were associated with significant nephrotoxicity. Better purification methods used in the manufacture of current formulations mitigate this problem, resulting in a lower incidence of nephrotoxicity.
Over the last several years, organizations such as the American Thoracic Society and the IDSA have recommended targeting higher vancomycin trough concentrations.10 The consequent widespread use of higher doses has renewed interest in vancomycin’s potential nephrotoxicity.
Lodise et al,11 in a cohort study, examined the incidence of nephrotoxicity with higher daily doses of vancomycin (≥ 4 g/day), lower daily doses (< 4 g/day), and linezolid (Zyvox). They defined nephrotoxicity as an increase in serum creatinine of 0.5 mg/dL or a decrease in calculated creatinine clearance of 50% from baseline on 2 consecutive days.
The incidence of nephrotoxicity was significantly higher in the high-dose vancomycin group (34.6%) than in the low-dose vancomycin group (10.9%) and in the linezolid group (6.7%) (P = .001). Additional factors associated with nephrotoxicity in this study included baseline creatinine clearance less than 86.6 mL/minute, weight greater than 101.4 kg (223.5 lb), and being in an intensive care unit.
Hidayat et al12 investigated outcomes in patients with high vs low vancomycin trough levels (≥ 15 mg/L vs < 15 mg/L) in a prospective cohort study. Sixty-three patients achieved an average vancomycin trough of 15 to 20 mg/L, and of these, 11 developed nephrotoxicity, compared with no patients in the low-trough group (P = .01). Of the 11 who developed nephrotoxicity, 10 were concomitantly taking other potentially nephrotoxic agents.
Comment. The data on vancomycin and nephrotoxicity are mostly from studies that had limitations such as small numbers of patients, retrospective design, and variable definitions of nephrotoxicity. Many of the patients in these studies had additional factors contributing to nephrotoxicity, including hemodynamic instability and concomitant exposure to other nephrotoxins. Additionally, the sequence of events (nephrotoxicity leading to elevated vancomycin levels vs elevated vancomycin levels causing nephrotoxicity) is still debatable.
The incidence of nephrotoxicity associated with vancomycin therapy is difficult to determine. However, based on current information, the incidence of nephrotoxicity appears to be low when vancomycin is used as monotherapy.
IS S AUREUS BECOMING RESISTANT TO VANCOMYCIN?
An issue of increasing importance in health care settings is the emergence of vancomycin-intermediate S aureus (VISA) and vancomycin-resistant S aureus (VRSA). Eleven cases of VRSA were identified in the United States from 2002 to 2005.13 All cases of VRSA in the United States have involved the incorporation of enterococcal vanA cassette into the S aureus genome.14 While true VRSA isolates remain rare, VISA isolates are becoming more common.
Heteroresistant VISA: An emerging subpopulation of MRSA
Another population of S aureus that has emerged is heteroresistant vancomycin-intermediate S aureus (hVISA). It is defined as the presence of subpopulations of VISA within a population of MRSA at a rate of one organism per 105 to 106 organisms. With traditional testing methods, the vancomycin MIC for the entire population of the strain is within the susceptible range.15 These hVISA populations are thought to be precursors to the development of VISA.16
The resistance to vancomycin in hVISA and VISA populations is due to increased cell wall thickness, altered penicillin-binding protein profiles, and decreased cell wall autolysis.
While the true prevalence of hVISA is difficult to predict because of challenges in microbiological detection and probably varies between geographic regions and individual institutions, different studies have reported hVISA rates between 2% and 13% of all MRSA isolates.15–17
Reduced vancomycin susceptibility can develop regardless of methicillin susceptibility.18
While hVISA is not common, its presence is thought to be a predictor of failing vancomycin therapy.15
Factors associated with hVISA bacteremia include high-bacterial-load infections, treatment failure (including persistent bacteremia for more than 7 days), and initially low serum vancomycin levels.15
‘MIC creep’: Is it real?
Also worrisome, the average vancomycin MIC for S aureus has been shifting upward, based on reports from several institutions, although it is still within the susceptible range.19,20 However, this “MIC creep” likely reflects, at least in part, differences in MIC testing and varying methods used to analyze the data.19,20
Holmes and Jorgensen,21 in a single-institution study of MRSA isolates recovered from bacteremic patients from 1999 to 2006, determined that no MIC creep existed when they tested vancomycin MICs using the broth microdilution method. The authors found the MIC90 (ie, the MIC in at least 90% of the isolates) remained less than 1 mg/L during each year of the study.
Sader et al,22 in a multicenter study, evaluated 1,800 MRSA bloodstream isolates from nine hospitals across the United States from 2002 to 2006. Vancomycin MICs were again measured by broth microdilution methods. The mode MIC remained stable at 0.625 mg/L during the study period, and the authors did not detect a trend of rising MICs.
The inconsistency between reports of MIC creep at single institutions and the absence of this phenomenon in large, multicenter studies seems to imply that vancomycin MIC creep is not occurring on a grand scale.
Vancomycin tolerance
Another troubling matter with S aureus and vancomycin is the issue of tolerance. Vancomycin tolerance, defined in terms of increased minimum bactericidal concentration, represents a loss of bactericidal activity. Tolerance to vancomycin can occur even if the MIC remains in the susceptible range.23
Safdar and Rolston,24 in an observational study from a cancer center, reported that of eight cases of bacteremia that was resistant to vancomycin therapy, three were caused by S aureus.
Sakoulas et al25 found that higher levels of vancomycin bactericidal activity were associated with higher rates of clinical success; however, they found no effect on the mortality rate.
The issue of vancomycin tolerance remains controversial, and because testing for it is impractical in clinical microbiology laboratories, its implications outside the research arena are difficult to ascertain at present.
IS VANCOMYCIN STILL THE BEST DRUG FOR S AUREUS?
MIC break points have been lowered
In 2006, the Clinical Laboratories and Standards Institute lowered its break points for vancomycin MIC categories for S aureus:
- Susceptible: ≤ 2 mg/L (formerly ≤ 4 mg/L)
- Intermediate: 4–8 mg/L (formerly 8–16 mg/L)
- Resistant: ≥ 16 mg/L (formerly ≥ 32 mg/L).
The rationales for these changes were that the lower break points would better detect hVISA, and that cases have been reported of clinical treatment failure of S aureus infections in which the MICs for vancomycin were 4 mg/L.26
Since 2006, the question has been raised whether to lower the break points even further. A reason for this proposal comes from an enhanced understanding of the pharmacokinetics and pharmacodynamics of vancomycin.
The variable most closely associated with clinical response to vancomycin is the AUC-MIC ratio. An AUC-MIC ratio of 400 or higher may be associated with better outcomes in patients with serious S aureus infection. A study of 108 patients with S aureus infection of the lower respiratory tract indicated that organism eradication was more likely if the AUC-MIC ratio was 400 or greater compared with values less than 400, and this was statistically significant.27 However, in cases of S aureus infection with a vancomycin MIC of 2 mg/L or higher, this ratio may not be achievable.
A prospective study of 414 MRSA bacteremia episodes found a vancomycin MIC of 2 mg/L to be a predictor of death.28 The authors concluded that vancomycin may not be the optimal treatment for MRSA with a vancomycin MIC of 2 mg/L.28 Additional studies have also suggested a possible decrease in response to vancomycin in MRSA isolates with elevated MICs within the susceptible range.25,29
Recent guidelines from the IDSA recommend using the clinical response, regardless of the MIC, to guide antimicrobial selection for isolates with MICs in the susceptible range.2
Combination therapy with vancomycin
As vancomycin use has increased, therapeutic failures with vancomycin have become apparent. Combination therapy has been suggested as an option to increase the efficacy of vancomycin when treating complicated infections.
Rifampin plus vancomycin is controversial.30 The combination is theoretically beneficial, especially in infections associated with prosthetic devices. However, clinical studies have failed to convincingly support its use, and some have suggested that it might prolong bacteremia. In addition, it has numerous drug interactions to consider and adverse effects.31
Gentamicin plus vancomycin. The evidence supporting the use of this combination is weak at best. It appears that clinicians may have extrapolated from the success reported by Korzeniowski and Sande,32 who found that methicillin-susceptible S aureus bacteremia was cleared faster if gentamicin was added to nafcillin. A more recent study33 that compared daptomycin (Cubicin) monotherapy with combined vancomycin and gentamicin to treat MRSA bacteremia and endocarditis showed a better overall success rate with daptomycin (44% vs 32.6%), but the difference was not statistically significant.
Gentamicin has some toxicity. Even short-term use (for the first 4 days of therapy) at low doses for bacteremia and endocarditis due to staphylococci has been associated with a higher rate of renal adverse events, including a significant decrease in creatinine clearance.34
Clindamycin or linezolid plus vancomycin is used to decrease toxin production by S aureus.30
While combination therapy with vancomycin is recommended in specific clinical situations, and the combinations are synergistic in vitro, information is lacking about clinical outcomes to support their use.
Don’t use vancomycin when another drug would be better
Vancomycin continues to be the drug of choice in many circumstances, but in some instances its role is under scrutiny and another drug might be better.
Beta-lactams. In patients with infection due to methicillin-susceptible S aureus, failure rates are higher with vancomycin than with beta-lactam therapy, specifically nafcillin.35–37 Beta-lactam antibiotics are thus the drugs of choice for treating infection with beta-lactam-susceptible strains of S aureus.
Linezolid. In theory, linezolid’s ability to decrease production of the S aureus Panton-Valentine leukocidin (PVL) toxin may be an advantage over vancomycin for treating necrotizing pneumonias. For the treatment of MRSA pneumonia, however, controversy exists as to whether linezolid is superior to vancomycin. An analysis of two prospective, randomized, double-blind studies of patients with MRSA pneumonia suggested that initial therapy with linezolid was associated with better survival and clinical cure rates,38 but a subsequent meta-analysis did not substantiate this finding.39 An additional comparative study has been completed, and analysis of the results is in progress.
Daptomycin, approved for skin and soft-tissue infections and bacteremias, including those with right-sided endocarditis, is a lipopeptide antibiotic with a spectrum of action similar to that of vancomycin.40 Daptomycin is also active against many strains of vancomycin-resistant enterococci. As noted above, in the MRSA subgroup of the pivotal comparative study of treatment for S aureus bacteremia and endocarditis, the success rate for daptomycin-treated patients (44.4%) was better than that for patients treated with vancomycin plus gentamicin (32.6%), but the difference was not statistically significant.33,41
The creatine phosphokinase concentration should be monitored weekly in patients on daptomycin.42 Daptomycin is inactivated by lung surfactant and should not be used to treat pneumonia.
Other treatment options approved by the US Food and Drug Administration (FDA) for MRSA infections include tigecycline (Tygacil), quinupristin-dalfopristin (Synercid), telavancin (Vibativ), and ceftaroline (Teflaro).
Tigecycline is a glycylcycline with bacteriostatic activity against S aureus and wide distribution to the tissues.43
Quinupristin-dalfopristin, a streptogramin antibiotic, has activity against S aureus. Its use may be associated with severe myalgias, sometimes leading patients to stop taking it.
Telavancin, recently approved by the FDA, is a lipoglycopeptide antibiotic.44 It is currently approved to treat complicated skin and skin structure infections and was found to be not inferior to vancomycin. An important side effect of this agent is nephrotoxicity. A negative pregnancy test is required before using this agent in women of childbearing potential.
Ceftaroline, a fifth-generation cephalosporin active against MRSA, has been approved by the FDA for the treatment of skin and skin structure infections and community-acquired pneumonia.45
- Murray BE, Nannini EC. Glycopeptides (vancomycin and teicoplanin), streptogramins (quinupristin-dalfopristin), and lipopeptides (daptomycin). In:Mandell GL, Bennett JE, Dolin R, editors. Mandell, Douglas, and Bennett’s Principles and Practice of Infectious Diseases. 7th ed. Philadelphia, PA: Churchill Livingstone/Elsevier; 2010:449–468.
- Liu C, Bayer A, Cosgrove SE, et al. Clinical practice guidelines by the Infectious Diseases Society of America for the treatment of methicillin-resistant Staphylococcus aureus infections in adults and children. Clin Infect Dis 2011; 52:285–292.
- Baddour LM, Epstein AE, Erickson CC, et al; American Heart Association Rheumatic Fever, Endocarditis, and Kawasaki Disease Committee. Update on cardiovascular implantable electronic device infections and their management: a scientific statement from the American Heart Association. Circulation 2010; 121:458–477.
- Chang FY, Peacock JE, Musher DM, et al. Staphylococcus aureus bacteremia: recurrence and the impact of antibiotic treatment in a prospective multicenter study. Medicine (Baltimore) 2003; 82:333–339.
- Wysocki M, Delatour F, Faurisson F, et al. Continuous versus intermittent infusion of vancomycin in severe staphylococcal infections: prospective multicenter randomized study. Antimicrob Agents Chemother 2001; 45:2460–2467.
- James JK, Palmer SM, Levine DP, Rybak MJ. Comparison of conventional dosing versus continuous-infusion vancomycin therapy for patients with suspected or documented gram-positive infections. Antimicrob Agents Chemother 1996; 40:696–700.
- Rybak M, Lomaestro B, Rotschafer JC, et al. Therapeutic monitoring of vancomycin in adult patients: a consensus review of the American Society of Health-System Pharmacists, the Infectious Diseases Society of America, and the Society of Infectious Diseases Pharmacists. Am J Health Syst Pharm 2009; 66:82–98.
- Wang JT, Fang CT, Chen YC, Chang SC. Necessity of a loading dose when using vancomycin in critically ill patients (letter). J Antimicrob Chemother 2001; 47:246.
- Mohammedi I, Descloux E, Argaud L, Le Scanff J, Robert D. Loading dose of vancomycin in critically ill patients: 15 mg/kg is a better choice than 500 mg. Int J Antimicrob Agents 2006; 27:259–262.
- American Thoracic Society; Infectious Diseases Society of America. Guidelines for the management of adults with hospital-acquired, ventilator-associated, and healthcare-associated pneumonia. Am J Respir Crit Care Med 2005; 171:388–416.
- Lodise TP, Lomaestro B, Graves J, Drusano GL. Larger vancomycin doses (at least four grams per day) are associated with an increased incidence of nephrotoxicity. Antimicrob Agents Chemother 2008; 52:1330–1336.
- Hidayat LK, Hsu DI, Quist R, Shriner KA, Wong-Beringer A. High-dose vancomycin therapy for methicillin-resistant Staphylococcus aureus infections: efficacy and toxicity. Arch Intern Med 2006; 166:2138–2144.
- Centers for Disease Control and Prevention. CDC reminds clinical laboratories and healthcare infection preventionists of their role in the search and containment of vancomycin-resistant Staphylococcus aureus (VRSA), May 2010. http://emergency.cdc.gov/coca/reminders/2010/2010may06.asp. Accessed June 7, 2011.
- Sievert DM, Rudrik JT, Patel JB, McDonald LC, Wilkins MJ, Hageman JC. Vancomycin-resistant Staphylococcus aureus in the United States, 2002–2006. Clin Infect Dis 2008; 46:668–674.
- Charles PG, Ward PB, Johnson PD, Howden BP, Grayson ML. Clinical features associated with bacteremia due to heterogeneous vancomycin-intermediate Staphylococcus aureus. Clin Infect Dis 2004; 38:448–451.
- Liu C, Chambers HF. Staphylococcus aureus with heterogeneous resistance to vancomycin: epidemiology, clinical significance, and critical assessment of diagnostic methods. Antimicrob Agents Chemother 2003; 47:3040–3045.
- Sader HS, Jones RN, Rossi KL, Rybak MJ. Occurrence of vancomycin-tolerant and heterogeneous vancomycin-intermediate strains (hVISA) among Staphylococcus aureus causing bloodstream infections in nine USA hospitals. J Antimicrob Chemother 2009; 64:1024–1028.
- Pillai SK, Wennersten C, Venkataraman L, Eliopoulos GM, Moellering RC, Karchmer AW. Development of reduced vancomycin susceptibility in methicillin-susceptible Staphylococcus aureus. Clin Infect Dis 2009; 49:1169–1174.
- Wang G, Hindler JF, Ward KW, Bruckner DA. Increased vancomycin MICs for Staphylococcus aureus clinical isolates from a university hospital during a 5-year period. J Clin Microbiol 2006; 44:3883–3886.
- Steinkraus G, White R, Friedrich L. Vancomycin MIC creep in nonvancomycin-intermediate Staphylococcus aureus (VISA), vancomycin-susceptible clinical methicillin-resistant S. aureus (MRSA) blood isolates from 2001–05. J Antimicrob Chemother 2007; 60:788–794.
- Holmes RL, Jorgensen JH. Inhibitory activities of 11 antimicrobial agents and bactericidal activities of vancomycin and daptomycin against invasive methicillin-resistant Staphylococcus aureus isolates obtained from 1999 through 2006. Antimicrob Agents Chemother 2008; 52:757–760.
- Sader HS, Fey PD, Limaye AP, et al. Evaluation of vancomycin and daptomycin potency trends (MIC creep) against methicillin-resistant Staphylococcus aureus isolates collected in nine U.S. medical centers from 2002 to 2006. Antimicrob Agents Chemother 2009; 53:4127–4132.
- May J, Shannon K, King A, French G. Glycopeptide tolerance in Staphylococcus aureus. J Antimicrob Chemother 1998; 42:189–197.
- Safdar A, Rolston KV. Vancomycin tolerance, a potential mechanism for refractory gram-positive bacteremia observational study in patients with cancer. Cancer 2006; 106:1815–1820.
- Sakoulas G, Moise-Broder PA, Schentag J, Forrest A, Moellering RC, Eliopoulos GM. Relationship of MIC and bactericidal activity to efficacy of vancomycin for treatment of methicillin-resistant Staphylococcus aureus bacteremia. J Clin Microbiol 2004; 42:2398–2402.
- Tenover FC, Moellering RC. The rationale for revising the Clinical and Laboratory Standards Institute vancomycin minimal inhibitory concentration interpretive criteria for Staphylococcus aureus. Clin Infect Dis 2007; 44:1208–1215.
- Moise-Broder PA, Forrest A, Birmingham MC, Schentag JJ. Pharmacodynamics of vancomycin and other antimicrobials in patients with Staphylococcus aureus lower respiratory tract infections. Clin Pharmacokinet 2004; 43:925–942.
- Soriano A, Marco F, Martínez JA, et al. Influence of vancomycin minimum inhibitory concentration on the treatment of methicillin-resistant Staphylococcus aureus bacteremia. Clin Infect Dis 2008; 46:193–200.
- Lodise TP, Graves J, Evans A, et al. Relationship between vancomycin MIC and failure among patients with methicillin-resistant Staphylococcus aureus bacteremia treated with vancomycin. Antimicrob Agents Chemother 2008; 52:3315–3320.
- Deresinski S. Vancomycin in combination with other antibiotics for the treatment of serious methicillin-resistant Staphylococcus aureus infections. Clin Infect Dis 2009; 49:1072–1079.
- Levine DP, Fromm BS, Reddy BR. Slow response to vancomycin or vancomycin plus rifampin in methicillin-resistant Staphylococcus aureus endocarditis. Ann Intern Med 1991; 115:674–680.
- Korzeniowski O, Sande MA. Combination antimicrobial therapy for Staphylococcus aureus endocarditis in patients addicted to parenteral drugs and in nonaddicts: a prospective study. Ann Intern Med 1982; 97:496–503.
- Rehm SJ, Boucher H, Levine D, et al. Daptomycin versus vancomycin plus gentamicin for treatment of bacteraemia and endocarditis due to Staphylococcus aureus: subset analysis of patients infected with methicillin-resistant isolates. J Antimicrob Chemother 2008; 62:1413–1421.
- Cosgrove SE, Vigliani GA, Fowler VG, et al. Initial low-dose gentamicin for Staphylococcus aureus bacteremia and endocarditis is nephrotoxic. Clin Infect Dis 2009; 48:713–721.
- Small PM, Chambers HF. Vancomycin for Staphylococcus aureus endocarditis in intravenous drug users. Antimicrob Agents Chemother 1990; 34:1227–1231.
- Gentry CA, Rodvold KA, Novak RM, Hershow RC, Naderer OJ. Retrospective evaluation of therapies for Staphylococcus aureus endocarditis. Pharmacotherapy 1997; 17:990–997.
- Chang FY, Peacock JE, Musher DM, et al. Staphylococcus aureus bacteremia: recurrence and the impact of antibiotic treatment in a prospective multicenter study. Medicine (Baltimore) 2003; 82:333–339.
- Wunderink RG, Rello J, Cammarata SK, Croos-Dabrera RV, Kollef MH. Linezolid vs vancomycin: analysis of two double-blind studies of patients with methicillin-resistant Staphylococcus aureus nosocomial pneumonia. Chest 2003; 124:1789–1797.
- Kalil AC, Murthy MH, Hermsen ED, Neto FK, Sun J, Rupp ME. Linezolid versus vancomycin or teicoplanin for nosocomial pneumonia: a systematic review and meta-analysis. Crit Care Med 2010; 38:1802–1808.
- Kosmidis C, Levine DP. Daptomycin: pharmacology and clinical use. Expert Opin Pharmacother 2010; 11:615–625.
- Fowler VG, Boucher HW, Corey GR, et al; S aureus Endocarditis and Bacteremia Study Group. Daptomycin versus standard therapy for bacteremia and endocarditis caused by Staphylococcus aureus. N Engl J Med 2006; 355:653–665.
- Daptomycin package insert. Lexington, MA. Cubist Pharmaceuticals, Inc. November 2010. www.cubicin.com/pdf/PrescribingInformation.pdf. Accessed June 7, 2011.
- Peterson LR. A review of tigecycline—the first glycylcycline. Int J Antimicrob Agents 2008; 32(suppl 4):S215–S222.
- Saravolatz LD, Stein GE, Johnson LB. Telavancin: a novel lipoglycopeptide. Clin Infect Dis 2009; 49:1908–1914.
- Ceftaroline package insert. St. Louis, MO. Forest Pharmaceuticals. October 2010.
In the past half-century, vancomycin has gone from near-orphan status to being one of the most often used antibiotics in our formulary. The driving force for its use is clear: the evolution of Staphylococcus aureus. At first, vancomycin was used to treat infections caused by penicillin-resistant strains. However, the discovery of methicillin curbed its use for more than 2 decades.1
Then, as methicillin-resistant S aureus (MRSA) began to spread in the 1980s, the use of vancomycin began to increase, and with the rise in community-associated MRSA infections in the 1990s, it became even more widely prescribed. The recent Infectious Diseases Society of America (IDSA) guidelines for treatment of infections due to MRSA are replete with references to the use of vancomycin.2
Another factor driving the use of vancomycin is the increased prevalence of device-associated infections, many of which are caused by coagulase-negative staphylococci and other organisms that colonize the skin.3 Many of these bacteria are susceptible only to vancomycin; they may be associated with infections of vascular catheters, cardiac valves, pacemakers, implantable cardioverter-defibrillators, orthopedic implants, neurosurgical devices, and other devices.
To use vancomycin appropriately, we need to recognize the changing minimum inhibitory concentrations (MICs), to select proper doses and dosing intervals, and to know how to monitor its use. Despite more than 50 years of experience with vancomycin, we sometimes find ourselves with more questions than answers about its optimal use.
WHAT IS VANCOMYCIN?
Vancomycin is a glycopeptide antibiotic isolated from a strain of Streptomyces orientalis discovered in a soil sample from Borneo in the mid-1950s.1 It exerts its action by binding to a d-alanyl-d-alanine cell wall precursor necessary for peptidoglycan cross-linking and, therefore, for inhibiting bacterial cell wall synthesis.
Vancomycin is bactericidal against most gram-positive species, including streptococci and staphylococci, with the exception of Enterococcus species, for which it is bacteriostatic. Though it is bactericidal, it appears to kill bacteria more slowly than beta-lactam antibiotics, and therefore it may take longer to clear bacteremia.4
WHAT IS THE BEST WAY TO DOSE VANCOMYCIN?
Vancomycin is widely distributed to most tissues, with an approximate volume of distribution of 0.4 to 1 L/kg; 50% to 55% is protein-bound. Because of this large volume of distribution, vancomycin’s dosing is based on actual body weight.
Vancomycin is not metabolized and is primarily excreted unchanged in the urine via glomerular filtration. It therefore requires dosage adjustments for renal insufficiency.
Vancomycin’s molecular weight is 1,485.73 Da, making it less susceptible to removal by dialysis than smaller molecules. Dosing of vancomycin in patients on hemodialysis depends on many factors specific to the dialysis center, including but not limited to the type of filter used, the duration of filtration, and whether high-flux filtration is used.
Is continuous intravenous infusion better than standard dosing?
Giving vancomycin by continuous infusion has been suggested as a way to optimize its serum concentration and improve its clinical effectiveness.
Wysocki et al5 conducted a multicenter, prospective, randomized study comparing continuous and intermittent intravenous infusions of vancomycin (the latter every 12 hours) to treat severe hospital-acquired MRSA infections, including bloodstream infections and pneumonia. Although blood concentrations above 10 μg/mL were reached more than 30 hours faster with continuous infusions than with intermittent ones, the microbiologic and clinical outcomes were similar with either method.
James et al6 compared the pharmacodynamics of conventional dosing of vancomycin (ie, 1 g every 12 hours) and continuous infusion in 10 patients with suspected or documented gram-positive infections in a prospective, randomized, crossover study. While no adverse effects were observed, the authors also found no statistically significant difference between the treatment groups in the pharmacodynamic variables investigated, including the area under the curve (AUC) divided by the MIC (the AUC-MIC ratio).
In view of the currently available data, the guidelines for monitoring vancomycin therapy note that there does not appear to be any difference in patient outcomes with continuous infusion vs intermittent dosing.7
Should a loading dose be given?
Another proposed strategy for optimizing vancomycin’s effectiveness is to give a higher initial dose, ie, a loading dose.
Wang et al8 performed a single-center study in 28 patients who received a 25 mg/kg loading dose at a rate of 500 mg/hour. This loading dose was safe, but the authors did not evaluate its efficacy.
Mohammedi et al9 compared loading doses of 500 mg and 15 mg/kg in critically ill patients receiving vancomycin by continuous infusion. The weight-based loading dose produced higher post-dose levels and a significantly higher rate of clinical cure, but there was no significant difference in the rate of survival to discharge from the intensive care unit.
While the use of a loading dose appears to be safe and likely leads to more rapid attainment of therapeutic blood levels, we lack data on whether it improves clinical outcomes, and further study is needed to determine its role.
WHAT IS THE BEST WAY TO MONITOR VANCOMYCIN THERAPY?
Whether and how to use the serum vancomycin concentration to adjust the dosing has been a matter of debate for many years. Convincing evidence that vancomycin levels predict clinical outcomes or that measuring them prevents toxicity is lacking.7
A consensus statement from the American Society of Health-System Pharmacists, the IDSA, and the Society of Infectious Diseases Pharmacists7 contains recommendations for monitoring vancomycin therapy, based on a critical evaluation of the available scientific evidence. Their recommendations:
- Vancomycin serum concentrations should be checked to optimize therapy and used as a surrogate marker of effectiveness.
- Trough, rather than peak, levels should be monitored.
- Trough levels should be checked just before the fourth dose, when steady-state levels are likely to have been achieved. More frequent monitoring may be considered in patients with fluctuating renal function.
- Trough levels should be higher than 10 mg/L to prevent the development of resistance.
- To improve antibiotic penetration and optimize the likelihood of achieving pharmacokinetic and pharmacodynamic targets, trough levels of 15 to 20 mg/L are recommended for pathogens with a vancomycin MIC of 1 mg/L or higher and for complicated infections such as endocarditis, osteomyelitis, meningitis, and hospital-acquired pneumonia.
- For prolonged courses, it is appropriate to check vancomycin levels weekly in hemodynamically stable patients and more often in those who are not hemodynamically stable.
IS VANCOMYCIN NEPHROTOXIC?
In the 1950s, vancomycin formulations were sometimes called “Mississippi mud” because of the many impurities they contained.1 These impurities were associated with significant nephrotoxicity. Better purification methods used in the manufacture of current formulations mitigate this problem, resulting in a lower incidence of nephrotoxicity.
Over the last several years, organizations such as the American Thoracic Society and the IDSA have recommended targeting higher vancomycin trough concentrations.10 The consequent widespread use of higher doses has renewed interest in vancomycin’s potential nephrotoxicity.
Lodise et al,11 in a cohort study, examined the incidence of nephrotoxicity with higher daily doses of vancomycin (≥ 4 g/day), lower daily doses (< 4 g/day), and linezolid (Zyvox). They defined nephrotoxicity as an increase in serum creatinine of 0.5 mg/dL or a decrease in calculated creatinine clearance of 50% from baseline on 2 consecutive days.
The incidence of nephrotoxicity was significantly higher in the high-dose vancomycin group (34.6%) than in the low-dose vancomycin group (10.9%) and in the linezolid group (6.7%) (P = .001). Additional factors associated with nephrotoxicity in this study included baseline creatinine clearance less than 86.6 mL/minute, weight greater than 101.4 kg (223.5 lb), and being in an intensive care unit.
Hidayat et al12 investigated outcomes in patients with high vs low vancomycin trough levels (≥ 15 mg/L vs < 15 mg/L) in a prospective cohort study. Sixty-three patients achieved an average vancomycin trough of 15 to 20 mg/L, and of these, 11 developed nephrotoxicity, compared with no patients in the low-trough group (P = .01). Of the 11 who developed nephrotoxicity, 10 were concomitantly taking other potentially nephrotoxic agents.
Comment. The data on vancomycin and nephrotoxicity are mostly from studies that had limitations such as small numbers of patients, retrospective design, and variable definitions of nephrotoxicity. Many of the patients in these studies had additional factors contributing to nephrotoxicity, including hemodynamic instability and concomitant exposure to other nephrotoxins. Additionally, the sequence of events (nephrotoxicity leading to elevated vancomycin levels vs elevated vancomycin levels causing nephrotoxicity) is still debatable.
The incidence of nephrotoxicity associated with vancomycin therapy is difficult to determine. However, based on current information, the incidence of nephrotoxicity appears to be low when vancomycin is used as monotherapy.
IS S AUREUS BECOMING RESISTANT TO VANCOMYCIN?
An issue of increasing importance in health care settings is the emergence of vancomycin-intermediate S aureus (VISA) and vancomycin-resistant S aureus (VRSA). Eleven cases of VRSA were identified in the United States from 2002 to 2005.13 All cases of VRSA in the United States have involved the incorporation of enterococcal vanA cassette into the S aureus genome.14 While true VRSA isolates remain rare, VISA isolates are becoming more common.
Heteroresistant VISA: An emerging subpopulation of MRSA
Another population of S aureus that has emerged is heteroresistant vancomycin-intermediate S aureus (hVISA). It is defined as the presence of subpopulations of VISA within a population of MRSA at a rate of one organism per 105 to 106 organisms. With traditional testing methods, the vancomycin MIC for the entire population of the strain is within the susceptible range.15 These hVISA populations are thought to be precursors to the development of VISA.16
The resistance to vancomycin in hVISA and VISA populations is due to increased cell wall thickness, altered penicillin-binding protein profiles, and decreased cell wall autolysis.
While the true prevalence of hVISA is difficult to predict because of challenges in microbiological detection and probably varies between geographic regions and individual institutions, different studies have reported hVISA rates between 2% and 13% of all MRSA isolates.15–17
Reduced vancomycin susceptibility can develop regardless of methicillin susceptibility.18
While hVISA is not common, its presence is thought to be a predictor of failing vancomycin therapy.15
Factors associated with hVISA bacteremia include high-bacterial-load infections, treatment failure (including persistent bacteremia for more than 7 days), and initially low serum vancomycin levels.15
‘MIC creep’: Is it real?
Also worrisome, the average vancomycin MIC for S aureus has been shifting upward, based on reports from several institutions, although it is still within the susceptible range.19,20 However, this “MIC creep” likely reflects, at least in part, differences in MIC testing and varying methods used to analyze the data.19,20
Holmes and Jorgensen,21 in a single-institution study of MRSA isolates recovered from bacteremic patients from 1999 to 2006, determined that no MIC creep existed when they tested vancomycin MICs using the broth microdilution method. The authors found the MIC90 (ie, the MIC in at least 90% of the isolates) remained less than 1 mg/L during each year of the study.
Sader et al,22 in a multicenter study, evaluated 1,800 MRSA bloodstream isolates from nine hospitals across the United States from 2002 to 2006. Vancomycin MICs were again measured by broth microdilution methods. The mode MIC remained stable at 0.625 mg/L during the study period, and the authors did not detect a trend of rising MICs.
The inconsistency between reports of MIC creep at single institutions and the absence of this phenomenon in large, multicenter studies seems to imply that vancomycin MIC creep is not occurring on a grand scale.
Vancomycin tolerance
Another troubling matter with S aureus and vancomycin is the issue of tolerance. Vancomycin tolerance, defined in terms of increased minimum bactericidal concentration, represents a loss of bactericidal activity. Tolerance to vancomycin can occur even if the MIC remains in the susceptible range.23
Safdar and Rolston,24 in an observational study from a cancer center, reported that of eight cases of bacteremia that was resistant to vancomycin therapy, three were caused by S aureus.
Sakoulas et al25 found that higher levels of vancomycin bactericidal activity were associated with higher rates of clinical success; however, they found no effect on the mortality rate.
The issue of vancomycin tolerance remains controversial, and because testing for it is impractical in clinical microbiology laboratories, its implications outside the research arena are difficult to ascertain at present.
IS VANCOMYCIN STILL THE BEST DRUG FOR S AUREUS?
MIC break points have been lowered
In 2006, the Clinical Laboratories and Standards Institute lowered its break points for vancomycin MIC categories for S aureus:
- Susceptible: ≤ 2 mg/L (formerly ≤ 4 mg/L)
- Intermediate: 4–8 mg/L (formerly 8–16 mg/L)
- Resistant: ≥ 16 mg/L (formerly ≥ 32 mg/L).
The rationales for these changes were that the lower break points would better detect hVISA, and that cases have been reported of clinical treatment failure of S aureus infections in which the MICs for vancomycin were 4 mg/L.26
Since 2006, the question has been raised whether to lower the break points even further. A reason for this proposal comes from an enhanced understanding of the pharmacokinetics and pharmacodynamics of vancomycin.
The variable most closely associated with clinical response to vancomycin is the AUC-MIC ratio. An AUC-MIC ratio of 400 or higher may be associated with better outcomes in patients with serious S aureus infection. A study of 108 patients with S aureus infection of the lower respiratory tract indicated that organism eradication was more likely if the AUC-MIC ratio was 400 or greater compared with values less than 400, and this was statistically significant.27 However, in cases of S aureus infection with a vancomycin MIC of 2 mg/L or higher, this ratio may not be achievable.
A prospective study of 414 MRSA bacteremia episodes found a vancomycin MIC of 2 mg/L to be a predictor of death.28 The authors concluded that vancomycin may not be the optimal treatment for MRSA with a vancomycin MIC of 2 mg/L.28 Additional studies have also suggested a possible decrease in response to vancomycin in MRSA isolates with elevated MICs within the susceptible range.25,29
Recent guidelines from the IDSA recommend using the clinical response, regardless of the MIC, to guide antimicrobial selection for isolates with MICs in the susceptible range.2
Combination therapy with vancomycin
As vancomycin use has increased, therapeutic failures with vancomycin have become apparent. Combination therapy has been suggested as an option to increase the efficacy of vancomycin when treating complicated infections.
Rifampin plus vancomycin is controversial.30 The combination is theoretically beneficial, especially in infections associated with prosthetic devices. However, clinical studies have failed to convincingly support its use, and some have suggested that it might prolong bacteremia. In addition, it has numerous drug interactions to consider and adverse effects.31
Gentamicin plus vancomycin. The evidence supporting the use of this combination is weak at best. It appears that clinicians may have extrapolated from the success reported by Korzeniowski and Sande,32 who found that methicillin-susceptible S aureus bacteremia was cleared faster if gentamicin was added to nafcillin. A more recent study33 that compared daptomycin (Cubicin) monotherapy with combined vancomycin and gentamicin to treat MRSA bacteremia and endocarditis showed a better overall success rate with daptomycin (44% vs 32.6%), but the difference was not statistically significant.
Gentamicin has some toxicity. Even short-term use (for the first 4 days of therapy) at low doses for bacteremia and endocarditis due to staphylococci has been associated with a higher rate of renal adverse events, including a significant decrease in creatinine clearance.34
Clindamycin or linezolid plus vancomycin is used to decrease toxin production by S aureus.30
While combination therapy with vancomycin is recommended in specific clinical situations, and the combinations are synergistic in vitro, information is lacking about clinical outcomes to support their use.
Don’t use vancomycin when another drug would be better
Vancomycin continues to be the drug of choice in many circumstances, but in some instances its role is under scrutiny and another drug might be better.
Beta-lactams. In patients with infection due to methicillin-susceptible S aureus, failure rates are higher with vancomycin than with beta-lactam therapy, specifically nafcillin.35–37 Beta-lactam antibiotics are thus the drugs of choice for treating infection with beta-lactam-susceptible strains of S aureus.
Linezolid. In theory, linezolid’s ability to decrease production of the S aureus Panton-Valentine leukocidin (PVL) toxin may be an advantage over vancomycin for treating necrotizing pneumonias. For the treatment of MRSA pneumonia, however, controversy exists as to whether linezolid is superior to vancomycin. An analysis of two prospective, randomized, double-blind studies of patients with MRSA pneumonia suggested that initial therapy with linezolid was associated with better survival and clinical cure rates,38 but a subsequent meta-analysis did not substantiate this finding.39 An additional comparative study has been completed, and analysis of the results is in progress.
Daptomycin, approved for skin and soft-tissue infections and bacteremias, including those with right-sided endocarditis, is a lipopeptide antibiotic with a spectrum of action similar to that of vancomycin.40 Daptomycin is also active against many strains of vancomycin-resistant enterococci. As noted above, in the MRSA subgroup of the pivotal comparative study of treatment for S aureus bacteremia and endocarditis, the success rate for daptomycin-treated patients (44.4%) was better than that for patients treated with vancomycin plus gentamicin (32.6%), but the difference was not statistically significant.33,41
The creatine phosphokinase concentration should be monitored weekly in patients on daptomycin.42 Daptomycin is inactivated by lung surfactant and should not be used to treat pneumonia.
Other treatment options approved by the US Food and Drug Administration (FDA) for MRSA infections include tigecycline (Tygacil), quinupristin-dalfopristin (Synercid), telavancin (Vibativ), and ceftaroline (Teflaro).
Tigecycline is a glycylcycline with bacteriostatic activity against S aureus and wide distribution to the tissues.43
Quinupristin-dalfopristin, a streptogramin antibiotic, has activity against S aureus. Its use may be associated with severe myalgias, sometimes leading patients to stop taking it.
Telavancin, recently approved by the FDA, is a lipoglycopeptide antibiotic.44 It is currently approved to treat complicated skin and skin structure infections and was found to be not inferior to vancomycin. An important side effect of this agent is nephrotoxicity. A negative pregnancy test is required before using this agent in women of childbearing potential.
Ceftaroline, a fifth-generation cephalosporin active against MRSA, has been approved by the FDA for the treatment of skin and skin structure infections and community-acquired pneumonia.45
- Murray BE, Nannini EC. Glycopeptides (vancomycin and teicoplanin), streptogramins (quinupristin-dalfopristin), and lipopeptides (daptomycin). In:Mandell GL, Bennett JE, Dolin R, editors. Mandell, Douglas, and Bennett’s Principles and Practice of Infectious Diseases. 7th ed. Philadelphia, PA: Churchill Livingstone/Elsevier; 2010:449–468.
- Liu C, Bayer A, Cosgrove SE, et al. Clinical practice guidelines by the Infectious Diseases Society of America for the treatment of methicillin-resistant Staphylococcus aureus infections in adults and children. Clin Infect Dis 2011; 52:285–292.
- Baddour LM, Epstein AE, Erickson CC, et al; American Heart Association Rheumatic Fever, Endocarditis, and Kawasaki Disease Committee. Update on cardiovascular implantable electronic device infections and their management: a scientific statement from the American Heart Association. Circulation 2010; 121:458–477.
- Chang FY, Peacock JE, Musher DM, et al. Staphylococcus aureus bacteremia: recurrence and the impact of antibiotic treatment in a prospective multicenter study. Medicine (Baltimore) 2003; 82:333–339.
- Wysocki M, Delatour F, Faurisson F, et al. Continuous versus intermittent infusion of vancomycin in severe staphylococcal infections: prospective multicenter randomized study. Antimicrob Agents Chemother 2001; 45:2460–2467.
- James JK, Palmer SM, Levine DP, Rybak MJ. Comparison of conventional dosing versus continuous-infusion vancomycin therapy for patients with suspected or documented gram-positive infections. Antimicrob Agents Chemother 1996; 40:696–700.
- Rybak M, Lomaestro B, Rotschafer JC, et al. Therapeutic monitoring of vancomycin in adult patients: a consensus review of the American Society of Health-System Pharmacists, the Infectious Diseases Society of America, and the Society of Infectious Diseases Pharmacists. Am J Health Syst Pharm 2009; 66:82–98.
- Wang JT, Fang CT, Chen YC, Chang SC. Necessity of a loading dose when using vancomycin in critically ill patients (letter). J Antimicrob Chemother 2001; 47:246.
- Mohammedi I, Descloux E, Argaud L, Le Scanff J, Robert D. Loading dose of vancomycin in critically ill patients: 15 mg/kg is a better choice than 500 mg. Int J Antimicrob Agents 2006; 27:259–262.
- American Thoracic Society; Infectious Diseases Society of America. Guidelines for the management of adults with hospital-acquired, ventilator-associated, and healthcare-associated pneumonia. Am J Respir Crit Care Med 2005; 171:388–416.
- Lodise TP, Lomaestro B, Graves J, Drusano GL. Larger vancomycin doses (at least four grams per day) are associated with an increased incidence of nephrotoxicity. Antimicrob Agents Chemother 2008; 52:1330–1336.
- Hidayat LK, Hsu DI, Quist R, Shriner KA, Wong-Beringer A. High-dose vancomycin therapy for methicillin-resistant Staphylococcus aureus infections: efficacy and toxicity. Arch Intern Med 2006; 166:2138–2144.
- Centers for Disease Control and Prevention. CDC reminds clinical laboratories and healthcare infection preventionists of their role in the search and containment of vancomycin-resistant Staphylococcus aureus (VRSA), May 2010. http://emergency.cdc.gov/coca/reminders/2010/2010may06.asp. Accessed June 7, 2011.
- Sievert DM, Rudrik JT, Patel JB, McDonald LC, Wilkins MJ, Hageman JC. Vancomycin-resistant Staphylococcus aureus in the United States, 2002–2006. Clin Infect Dis 2008; 46:668–674.
- Charles PG, Ward PB, Johnson PD, Howden BP, Grayson ML. Clinical features associated with bacteremia due to heterogeneous vancomycin-intermediate Staphylococcus aureus. Clin Infect Dis 2004; 38:448–451.
- Liu C, Chambers HF. Staphylococcus aureus with heterogeneous resistance to vancomycin: epidemiology, clinical significance, and critical assessment of diagnostic methods. Antimicrob Agents Chemother 2003; 47:3040–3045.
- Sader HS, Jones RN, Rossi KL, Rybak MJ. Occurrence of vancomycin-tolerant and heterogeneous vancomycin-intermediate strains (hVISA) among Staphylococcus aureus causing bloodstream infections in nine USA hospitals. J Antimicrob Chemother 2009; 64:1024–1028.
- Pillai SK, Wennersten C, Venkataraman L, Eliopoulos GM, Moellering RC, Karchmer AW. Development of reduced vancomycin susceptibility in methicillin-susceptible Staphylococcus aureus. Clin Infect Dis 2009; 49:1169–1174.
- Wang G, Hindler JF, Ward KW, Bruckner DA. Increased vancomycin MICs for Staphylococcus aureus clinical isolates from a university hospital during a 5-year period. J Clin Microbiol 2006; 44:3883–3886.
- Steinkraus G, White R, Friedrich L. Vancomycin MIC creep in nonvancomycin-intermediate Staphylococcus aureus (VISA), vancomycin-susceptible clinical methicillin-resistant S. aureus (MRSA) blood isolates from 2001–05. J Antimicrob Chemother 2007; 60:788–794.
- Holmes RL, Jorgensen JH. Inhibitory activities of 11 antimicrobial agents and bactericidal activities of vancomycin and daptomycin against invasive methicillin-resistant Staphylococcus aureus isolates obtained from 1999 through 2006. Antimicrob Agents Chemother 2008; 52:757–760.
- Sader HS, Fey PD, Limaye AP, et al. Evaluation of vancomycin and daptomycin potency trends (MIC creep) against methicillin-resistant Staphylococcus aureus isolates collected in nine U.S. medical centers from 2002 to 2006. Antimicrob Agents Chemother 2009; 53:4127–4132.
- May J, Shannon K, King A, French G. Glycopeptide tolerance in Staphylococcus aureus. J Antimicrob Chemother 1998; 42:189–197.
- Safdar A, Rolston KV. Vancomycin tolerance, a potential mechanism for refractory gram-positive bacteremia observational study in patients with cancer. Cancer 2006; 106:1815–1820.
- Sakoulas G, Moise-Broder PA, Schentag J, Forrest A, Moellering RC, Eliopoulos GM. Relationship of MIC and bactericidal activity to efficacy of vancomycin for treatment of methicillin-resistant Staphylococcus aureus bacteremia. J Clin Microbiol 2004; 42:2398–2402.
- Tenover FC, Moellering RC. The rationale for revising the Clinical and Laboratory Standards Institute vancomycin minimal inhibitory concentration interpretive criteria for Staphylococcus aureus. Clin Infect Dis 2007; 44:1208–1215.
- Moise-Broder PA, Forrest A, Birmingham MC, Schentag JJ. Pharmacodynamics of vancomycin and other antimicrobials in patients with Staphylococcus aureus lower respiratory tract infections. Clin Pharmacokinet 2004; 43:925–942.
- Soriano A, Marco F, Martínez JA, et al. Influence of vancomycin minimum inhibitory concentration on the treatment of methicillin-resistant Staphylococcus aureus bacteremia. Clin Infect Dis 2008; 46:193–200.
- Lodise TP, Graves J, Evans A, et al. Relationship between vancomycin MIC and failure among patients with methicillin-resistant Staphylococcus aureus bacteremia treated with vancomycin. Antimicrob Agents Chemother 2008; 52:3315–3320.
- Deresinski S. Vancomycin in combination with other antibiotics for the treatment of serious methicillin-resistant Staphylococcus aureus infections. Clin Infect Dis 2009; 49:1072–1079.
- Levine DP, Fromm BS, Reddy BR. Slow response to vancomycin or vancomycin plus rifampin in methicillin-resistant Staphylococcus aureus endocarditis. Ann Intern Med 1991; 115:674–680.
- Korzeniowski O, Sande MA. Combination antimicrobial therapy for Staphylococcus aureus endocarditis in patients addicted to parenteral drugs and in nonaddicts: a prospective study. Ann Intern Med 1982; 97:496–503.
- Rehm SJ, Boucher H, Levine D, et al. Daptomycin versus vancomycin plus gentamicin for treatment of bacteraemia and endocarditis due to Staphylococcus aureus: subset analysis of patients infected with methicillin-resistant isolates. J Antimicrob Chemother 2008; 62:1413–1421.
- Cosgrove SE, Vigliani GA, Fowler VG, et al. Initial low-dose gentamicin for Staphylococcus aureus bacteremia and endocarditis is nephrotoxic. Clin Infect Dis 2009; 48:713–721.
- Small PM, Chambers HF. Vancomycin for Staphylococcus aureus endocarditis in intravenous drug users. Antimicrob Agents Chemother 1990; 34:1227–1231.
- Gentry CA, Rodvold KA, Novak RM, Hershow RC, Naderer OJ. Retrospective evaluation of therapies for Staphylococcus aureus endocarditis. Pharmacotherapy 1997; 17:990–997.
- Chang FY, Peacock JE, Musher DM, et al. Staphylococcus aureus bacteremia: recurrence and the impact of antibiotic treatment in a prospective multicenter study. Medicine (Baltimore) 2003; 82:333–339.
- Wunderink RG, Rello J, Cammarata SK, Croos-Dabrera RV, Kollef MH. Linezolid vs vancomycin: analysis of two double-blind studies of patients with methicillin-resistant Staphylococcus aureus nosocomial pneumonia. Chest 2003; 124:1789–1797.
- Kalil AC, Murthy MH, Hermsen ED, Neto FK, Sun J, Rupp ME. Linezolid versus vancomycin or teicoplanin for nosocomial pneumonia: a systematic review and meta-analysis. Crit Care Med 2010; 38:1802–1808.
- Kosmidis C, Levine DP. Daptomycin: pharmacology and clinical use. Expert Opin Pharmacother 2010; 11:615–625.
- Fowler VG, Boucher HW, Corey GR, et al; S aureus Endocarditis and Bacteremia Study Group. Daptomycin versus standard therapy for bacteremia and endocarditis caused by Staphylococcus aureus. N Engl J Med 2006; 355:653–665.
- Daptomycin package insert. Lexington, MA. Cubist Pharmaceuticals, Inc. November 2010. www.cubicin.com/pdf/PrescribingInformation.pdf. Accessed June 7, 2011.
- Peterson LR. A review of tigecycline—the first glycylcycline. Int J Antimicrob Agents 2008; 32(suppl 4):S215–S222.
- Saravolatz LD, Stein GE, Johnson LB. Telavancin: a novel lipoglycopeptide. Clin Infect Dis 2009; 49:1908–1914.
- Ceftaroline package insert. St. Louis, MO. Forest Pharmaceuticals. October 2010.
KEY POINTS
- Giving vancomycin by continuous infusion appears to offer no advantage over giving it every 12 hours.
- Therapeutic blood levels can be reached more quickly if a loading dose is given, but whether this offers a clinical advantage is unclear.
- The trough vancomycin serum concentration should be greater than 10 mg/L to prevent the development of resistance, and trough levels of 15 to 20 mg/L are recommended if the minimum inhibitory concentration (MIC) is 1 mg/L or higher.
- Whether S aureus is becoming resistant to vancomycin is not clear.
- The variable most closely associated with clinical response to vancomycin is the area under the curve (AUC) divided by the MIC (the AUC-MIC ratio), which should be greater than 400.
Insulin treatment for type 2 diabetes: When to start, which to use
Many patients with type 2 diabetes eventually need insulin, as their ability to produce their own insulin from pancreatic beta cells declines progressively.1 The questions remain as to when insulin therapy should be started, and which regimen is the most appropriate.
Guidelines from professional societies differ on these points,2,3 as do individual clinicians. Moreover, antidiabetic treatment is an evolving topic. Many new drugs—oral agents as well as injectable analogues of glucagon-like peptide-1 (GLP1) and insulin formulations—have become available in the last 15 years.
In this paper, I advocate an individualized approach and review the indications for insulin treatment, the available preparations, the pros and cons of each regimen, and how the properties of each type of insulin influence attempts to intensify the regimen.
Coexisting physiologic and medical conditions such as pregnancy and chronic renal failure and drugs such as glucocorticoids may alter insulin requirements. I will not cover these special situations, as they deserve separate, detailed discussions.
WHEN SHOULD INSULIN BE STARTED? TWO VIEWS
Early on, patients can be adequately managed with lifestyle modifications and oral hypoglycemic agents or injections of a GLP1 analogue, either alone or in combination with oral medication. Later, some patients reach a point at which insulin therapy becomes the main treatment, similar to patients with type 1 diabetes.
The American Diabetes Association (ADA), in a consensus statement,2 has called for using insulin early in the disease if lifestyle management and monotherapy with metformin (Glucophage) fail to control glucose or if lifestyle management is not adequate and metformin is contraindicated. The ADA’s goal hemoglobin A1c level is less than 7% for most patients.
The American Association of Clinical Endocrinologists (AACE) and the American College of Endocrinology (ACE), in another consensus statement, use an algorithm stratified by hemoglobin A1c level, in which insulin is mostly reserved for when combination therapy fails.3 Their goal hemoglobin A1c level is 6.5% or less for most patients.
Comment. Both consensus statements make exceptions for patients presenting with very high blood glucose and hemoglobin A1c levels and those who have contraindications to drugs other than insulin. These patients should start insulin immediately, along with lifestyle management.2,3
Both consensus statements give priority to safety. The AACE/ACE statement gives more weight to the risk of hypoglycemia with insulin treatment, whereas the ADA gives more weight to the risk of edema and congestive heart failure with thiazolidinedione drugs (although both insulin and thiazolidinediones cause weight gain) and to adequate validation of treatments in clinical trials.
Ongoing clinical trials may add insight to this issue. For example, the Outcome Reduction With Initial Glargine Intervention (ORIGIN) study is investigating the effects of the long-acting insulin glargine (Lantus) in early diabetes with regard to glycemic control, safety, and cardiovascular outcomes.4 This study is expected to end this year (2011). The safety of alternative treatment options is also under investigation and scrutiny. In the interim, individualized treatment should be considered, as we will see below.
MY VIEW: AN INDIVIDUALIZED APPROACH
The decision to start insulin therapy should be made individually, based on several factors:
- Whether the patient is willing to try it
- The degree of hyperglycemia
- How relevant the potential side effects of insulin are to the patient compared with those of other hypoglycemic agents
- Whether oral hypoglycemic agents with or without GLP1 analogues are expected to provide the desired benefit
- The patient’s work schedule and lifestyle factors
- Cost
- The availability of nurses, diabetes educators, and others to implement and follow the insulin treatment.
Will patients accept insulin?
Factors that affect whether patients comply with a treatment include the number of pills or injections they must take per day, how often they must check their blood glucose, adverse effects, lifestyle limitations caused by the treatment (especially insulin), and cost. Most patients feel better when their glucose levels are under good control, which is a major motivation for initiating and adhering to insulin. The anticipated reduction of diabetic complications further enhances compliance.
Education promotes compliance. Patients need to know that type 2 diabetes tends to progress and that in time their treatment will have to be intensified, with higher doses of their current drugs and new drugs added or substituted, possibly including insulin. This information is best given early, ie, when the diagnosis is made, even if hyperglycemia is mild at that time.
With newer insulin preparations and delivery devices available, more patients are finding insulin treatment acceptable.
The glycemic goal should be individualized
The key issue is glycemic control. If glycemic control is worsening or if the hemoglobin A1c level remains above the goal, then the treatment strategy should be readdressed.
In general, one should try to achieve the best possible glycemic control with the few est adverse effects. Adequate dietary management with a regular meal schedule and predictable carbohydrate intake for each meal helps to avoid or at least minimize the two most important adverse effects of insulin, ie, weight gain and hypoglycemia.
For most patients, I believe a goal hemoglobin A1c level of less than 7% is reasonable.2 For others, a less stringent goal might be more appropriate, such as 7.5%. Several factors affect this decision, including whether the patient is willing to follow a complex insulin regimen (such as a basal-bolus regimen), his or her work schedule, other lifestyle factors, the duration of diabetes, the type or types of insulin used, coexisting medical conditions, the frequency of hypoglycemia, unawareness of hypoglycemia, age, prognosis, life expectancy, and cost.5
If hyperglycemia is severe (Table 1),2 the goal might not be clear when insulin therapy is started. It should become obvious with ongoing follow-up.
Previously untreated patients presenting with severe hyperglycemia are a heterogeneous group. Many of them have had diabetes for a relatively short time and were recently diagnosed. These patients are likely to safely achieve near-normal glycemic control. Some of them might be adequately treated with oral hypoglycemic agents; if insulin is used, transitioning from insulin to oral hypoglycemic agents may be feasible.2
Some untreated patients may have had diabetes for several years and have advanced disease and therefore might be more difficult to treat. Only 21 (57%) of 37 previously untreated patients intensively treated with insulin reached the goal fasting glucose level of less than 126 mg/dL in one study.6 The only way to evaluate the feasibility of achieving near-normal glycemia safely is by following the patient’s progress over time.
The patient’s glycemic goal should be reevaluated periodically and may need to be adjusted over time, based on changes in any of the factors discussed above.
Risk of hypoglycemia
The goal should be looser in difficult-to-treat patients, ie, those with frequent hypoglycemia and decreased awareness of hypoglycemia.
Patients with advanced diabetes whose glucose levels continue to fluctuate widely after lifestyle management and the insulin regimen have been addressed should also have a looser goal. These fluctuations of glucose levels are surrogate markers for the degree of insulin deficiency. Attempting to achieve near-normal glycemic levels in this situation would be associated with a higher risk of hypoglycemia.
A higher risk of hypoglycemia and its complications (eg, falling and accidents, especially among operators of heavy machinery, construction workers, and drivers) is another reason for adopting a relaxed goal of glycemic control.
ADDING BASAL INSULIN TO ORAL HYPOGLYCEMIC THERAPY
When glycemic control worsens or is not adequate despite the use of oral hypoglycemic agents, often the next step is to add basal insulin therapy, ie, once-daily doses of a long-acting insulin.
NPH, detemir, or glargine?
Most often, glargine or detemir (Levemir) insulin is used. Detemir can also be given twice daily if needed. If cost is a concern, neutral protamine Hagedorn (NPH, Humulin N, Novolin N) insulin once daily at bedtime or twice daily is a reasonable alternative.
Costs of basal insulins are $22 to $50 per 1,000-unit vial for NPH, $70 to $90 per 1,000-unit vial for detemir and glargine, and $170 to $200 for a box of five detemir or glargine pens (containing 1,500 units total). Complicating this issue, vials should not be used for more than 1 month, and thus, the cost of vials vs pens depends on dosage.
Detemir vs NPH. In a trial in patients with inadequately controlled type 2 diabetes who had never taken insulin before and who were taking one or more oral hypoglycemic drugs, the addition of detemir insulin once daily or NPH at bedtime resulted in similar improvements in hemoglobin A1c (a decrease of about 1.5%).10
Detemir had several advantages over NPH. First, the incidence of nocturnal hypoglycemia was 50% lower with detemir at bedtime than with NPH at bedtime, and 87% lower with detemir in the morning than with bedtime NPH.10 In another trial,11 the risk of hypoglycemia at any time of day was 47% lower with insulin detemir than with NPH, and the risk of nocturnal hypoglycemia was 55% lower.
The risk of nocturnal hypoglycemia is lower if detemir is taken in the morning than at bedtime, although the total frequency of hypoglycemic episodes is the same.10 Therefore, another decision after starting basal insulin, based on the patient’s glucose trends and frequency of hypoglycemic events, would be whether insulin should be taken in the morning or at bedtime.
The second advantage of detemir is that it causes less weight gain: 0.7 kg at 20 weeks with detemir at bedtime vs 1.6 kg with NPH at bedtime.10
Further, detemir insulin was associated with less within-subject variability in the fasting glucose level than with NPH when these insulins were used in a basal-bolus regimen.12
Hermansen et al11 found that if the dosage of basal insulin was aggressively increased, 70% of patients achieved a hemoglobin A1c target of less than 7% with either NPH or detemir insulin, with fewer hypoglycemic episodes in patients treated with detemir.
Therefore, adding basal insulin to oral therapy is adequate for many patients who are new to insulin. Many patients would need more, such as the addition of insulin before meals.
Glargine vs NPH. Compared with adding NPH, adding glargine to a regimen of oral hypoglycemic agents controls blood glucose levels better and with less fluctuation in glucose levels, a lower risk of hypoglycemia, and less weight gain.13–15 These results were the same when using glargine with either metformin13 or glimeperide (Amaryl).14
Glargine is usually given once daily at bedtime. One study suggested that giving it in the morning is more effective.14
Detemir vs glargine. Studies that compared detemir and glargine revealed more similarities than differences in their clinical benefits.16,17 Both preparations effectively lower glucose levels and improve quality of life.18
Titrating the insulin regimen is a key in achieving adequate glycemic control. This includes teaching patients how to adjust their insulin, for example by increasing the dosage of glargine or detemir by 2 units every 4 to 7 days until adequate glycemic control is achieved, unless hypoglycemia becomes a barrier.
BASAL VS PRANDIAL INSULIN
Once-daily insulin injection is relatively convenient, but it comes with a limitation: it does not adequately control postprandial hyperglycemia. A solution is insulin before meals, ie, prandial insulin.
Kazda et al19 compared three regimens in patients not taking oral hypoglycemic agents: rapid-acting insulin lispro (Humalog) before each meal, a mix of 50% lispro and 50% protamine lispro (Humalog Mix 50/50) (the protamine delays its release) before each meal, and glargine at bedtime. The absolute change in hemoglobin A1c was −0.3% in the glargine group, −1.1% in the lispro group, and −1.2% in the lispro mix group. The glargine group had better control of fasting glucose.
Similar advantages of better glycemic control and fewer nocturnal hypoglycemic episodes were seen in trials of a mixture of 25% lispro and 75% protamine lispro before meals compared with glargine insulin in patients on simultaneous treatment with oral hypoglycemic agents.20,21 Buse et al21 reported that more patients achieved a hemoglobin A1c level below 7% with this lispro mix (47%) than with glargine (40%). The absolute difference in mean hemoglobin A1c between the two groups was minimal, although it reached statistical significance. As expected, weight gain was less in the glargine group.21
Kann et al22 reported that glycemic control was also better with a mixture of 30% aspart and 70% protamine aspart (NovoLog Mix 70/30) twice a day along with metformin than with glargine insulin once a day along with oral glimepiride, a sulfonylurea. Further, in this study, weight gain was noted in the glargine-glimepiride group only.22 Therefore, the advantage of less weight gain has not been always reproducible in glargine studies.
Comment. These studies point to the contribution of postprandial glucose to hemoglobin A1c.23–25 In patients with satisfactory glycemic control, the postprandial glucose level seems to be the major contributor to hemoglobin A1c. When glycemic control worsens, the contribution of fasting glucose to hemoglobin A1c increases.23
Premixed insulins (lispro mix and aspart mix) provide basal coverage and control postprandial hyperglycemia. Therefore, prandial premixed insulin therapy is expected to be superior to basal insulin therapy. Premixed insulin could be considered as a simplified basal-bolus regimen (see below).
The superiority of prandial (rapid-acting) insulin alone over basal insulin therapy, as seen in the study by Kazda et al,19 has not been reproducible in other studies. For example, in one study, once-daily glargine resulted in a similar improvement in hemoglobin A1c, a lower rate of hypoglycemic episodes, and greater patient satisfaction with treatment compared with lispro insulin before meals.26 This issue remains debatable because all the trials have been open-label and thus are subject to limitations.
The main lesson is that either glargine or lispro monotherapy is a reasonable option and results in better glycemic control in patients for whom two oral hypoglycemic agents have failed. Further, both fasting and postprandial hyperglycemia are important to address. In patients with severe hyperglycemia, a combination of prandial and basal insulin may be indicated. One would expect neither basal nor prandial (bolus) insulin to be adequate in this situation.
In conclusion, adding basal insulin to oral hypoglycemic agents is a reasonable option in the advancement of diabetes therapy and has become a common way to introduce insulin. It is simple and less labor-intensive for patients and medical groups than a basal-bolus regimen. Patients usually find it acceptable. The future availability of an easy-to-deliver, safe, and effective prandial insulin may change the current treatment paradigm; several newer prandial insulins are under investigation.
In advanced diabetes, both prandial and fasting glucose levels are crucial to address. Some patients may need to be started on both basal and prandial insulin simultaneously, depending on their degree of hyperglycemia, the duration of diabetes, coexisting medical conditions, and the goal of glycemic control.
BASAL-BOLUS INSULIN REGIMENS
In the advanced stages of type 2 diabetes, as insulin deficiency worsens, patients need to start giving themselves injections of a rapid-acting insulin—regular, lispro, aspart, or glulisine (Apidra) before meals, in addition to once- or twice-daily basal insulin injections. Such a “basal-bolus” regimen could also be used for newly diagnosed patients presenting with severe hyperglycemia. In addition, some patients on basal insulin plus oral hypoglycemic drugs may develop contraindications to their oral drugs. Adding bolus insulin becomes the main option for these patients too.
For others, a basal-bolus regimen might be chosen purely because of cost. For example, a regimen of NPH and regular insulin (multiple daily injections or premixed) would be significantly less expensive than multiple oral hypoglycemic agents.
Currently, only a few classes of oral hypoglycemic drugs are available in generic formulations. For example, generic glimeperide and metformin cost as little as $4 to $12 per month, while the costs of brand-name oral hypoglycemic agents are in the range of $170 to $200 per month. In contrast, premixed NPH plus regular insulin such as Novolin 70/30 and Humulin 70/30 cost between $22 and $70 per vial.
A basal-bolus regimen should provide 50% of the total daily insulin in the form of basal insulin. A regimen of 50% basal and 50% bolus seemed to provide better glycemic control than a regimen of 35% basal and 65% bolus in several studies.27,28
In patients already taking a single daily dose of basal insulin along with oral hypoglycemic agents, the dosage of basal insulin is usually raised gradually until adequate glycemic control is achieved. A main question is when to add prandial insulin. There is no clear cutoff for a basal insulin dosage at which prandial insulin should be added.
In the Treat-to-Target Trial,29 almost 60% of patients achieved a hemoglobin A1c level of 7% or less with the addition of either glargine or NPH insulin (basal insulin only) to oral hypoglycemic agents during 24 weeks of follow-up. As expected, glargine caused less nocturnal hypoglycemia. Fewer than half the patients who achieved a hemoglobin A1c level less than 7% had no documented nocturnal hypoglycemia (33% of glargine-treated patients and 27% of NPH-treated patients).
Type 2 diabetes is progressive1; over time, patients treated with once-daily basal insulin often require multiple daily injections.
Adding prandial to basal insulin clearly results in better glycemic control and less glucose variability.19,20,22,30–33 Two major factors in deciding to start prandial insulin are the degree of hyperglycemia and the patient’s acceptance of multiple daily injections. The higher the blood glucose levels, the sooner prandial insulin should be added, especially if hyperglycemia is influencing the prognosis of a coexisting condition or a diabetic complication (eg, an infected foot ulcer).
Adding prandial insulin should be also considered if the dosage of basal insulin has progressively been increased and the hemoglobin A1c level is not improving, especially if a patient has both inadequate glycemic control and frequent hypoglycemia, or if the morning glucose level is within the desired range (indicating there is no room for a further increase in the basal insulin dose) in association with inadequate control of hemoglobin A1c.
What is the best basal insulin for a basal-bolus regimen?
Glargine and detemir were shown to be equally effective as the basal component of a basal-bolus regimen.34,35 Findings were similar to those of studies comparing NPH, detemir, and glargine added, by themselves, to oral hypoglycemic agents. When possible, either glargine or detemir is favored because of less hypoglycemia and less weight gain than with NPH. Weight gain is the least with detemir.
Adding prandial insulin to a basal regimen
In general, whether to add prandial insulin can be decided on the basis of the patient’s record of blood glucose monitoring. Insulin could be added before breakfast if the pre-lunch glucose level is elevated, or before lunch if the dinnertime blood glucose level is elevated, or before dinner if the bedtime blood glucose level is elevated—or a combination of these. Prandial insulin can be started at a low dose (4–6 units) and increased gradually.
In the case of poor glycemic control on a high dosage of basal insulin, a reasonable first step would be to change the regimen to a basal-bolus regimen (about 50% basal and 50% bolus) with no change or a small decrease in the total daily dosage of insulin to avoid hypoglycemia. For example, in a patient on 80 units of glargine or detemir insulin who has inadequate control, the regimen could be changed to 35 units of either glargine or detemir and 10 to 12 units of lispro, aspart, or glulisine before each meal as the bolus component.
Further adjustments of the insulin dosage can be made according to the results of glucose monitoring before each meal and at bedtime. In all case scenarios, the insulin regimen should be re-evaluated routinely during the advancement of therapy from single daily injection of basal insulin to multiple daily injections. Redistribution of total insulin dosage to 50% basal and 50% bolus (divided into three doses before meals) should be considered for patients who continue to have fluctuations of glucose levels, inadequate control, or frequent hypoglycemia. This ratio seems to provide better control for most patients.27,28
Starting with a basal-bolus regimen
For patients new to insulin who are starting a basal-bolus regimen, a dosage based on total body weight could be considered. The requirements vary significantly based on dietary management, level of physical activity, stress (especially illnesses), use of oral hypoglycemic agents, and degree of hyperglycemia.
A lower dosage of insulin (0.2 units per kg) should be considered for people with mild stress, with milder hyperglycemia, or on treatment with oral hypoglycemic agents. Elderly patients and patients with renal or liver failure are at higher risk of hypoglycemia and should also receive a lower dosage of insulin, at least to start with.
Others could be started on a dosage of 0.3 to 0.5 units/kg. Fifty percent of the calculated dosage could be given as basal insulin and 50% given as bolus (divided into three doses, before meals). Subsequently, the dosage would need to be titrated on the basis of the record of glucose monitoring.
Choosing a prandial insulin
Rapid-acting insulin analogues (lispro, aspart, and glulisine) control postprandial glucose levels better than regular insulin and cause less hypoglycemia. Their pharmacokinetics enable them to be taken within a few minutes of the start of a meal, or even after the meal if the patient forgets to take an injection before the meal.
For example, in one study,36 taking aspart immediately before the meal provided better glycemic control than taking regular insulin 30 minutes before meals. In a basal-bolus regimen, the use of aspart along with detemir resulted in glycemic control similar to that provided by twice-daily NPH and regular insulin, with less hypoglycemia.37
The dosage of prandial insulin can be adjusted according to the amount of carbohydrates in each meal (the insulin-to-carbohydrate ratio), as in patients with type 1 diabetes. This approach was associated with less weight gain.38
IS THERE STILL A ROLE FOR PREMIXED INSULIN PREPARATIONS?
Basal-bolus insulin regimens have gained popularity because the prandial doses can easily be adjusted according to carbohydrate intake, glucose level (on a sliding scale), variations in meal time, missed meals (eg, when having a procedure), and exercise. For example, the dose of prandial insulin can be reduced if the patient expects to exercise within 2 or 3 hours after the meal.
Some patients may not accept giving themselves four or five injections per day with a basal-bolus regimen. They may accept a simpler regimen, ie, giving themselves three injections of a premixed insulin per day, one before each meal.
Compared with a basal-bolus regimen, the possibility of achieving adequate glycemic control using lispro mix (50% lispro, 50% lispro protamine suspension) before meals seemed to depend on the goal of glycemic control. Its use in one study showed similar ability to achieve hemoglobin A1c less than 7.5% compared with a basal-bolus regimen of glargine and lispro. For a goal hemoglobin A1c level of less than 7%, the use of glargine and lispro was superior. The rate of hypoglycemia was similar with both strategies.39 These findings imply that the goal hemoglobin A1c should be more relaxed (< 7.5%) when using lispro mix (50% lispro) three times daily before meals.
Biphasic insulin aspart (a mix of aspart and protamine aspart) given three times daily provided similar improvement in glycemic control with no difference in the frequency of hypoglycemia compared with a basal-bolus regimen of NPH and aspart.40 Further, the use of biphasic insulin aspart seemed to provide better glycemic control with less weight gain compared with premixed human insulin (70% NPH, 30% regular insulin).41
Therefore, simpler premixed insulin regimens remain reasonable options for selected patients who do not accept a more complex insulin regimen (basal-bolus) or cannot adhere to it for any reason, especially if premixed insulin is given before meals three times daily. In fact, recent studies have focused on comparing premixed insulin three times daily with basal-bolus regimens (detemir or glargine as basal insulin along with pre-meal insulin analogue).
Glycemic control is harder to achieve with premixed insulin twice daily, mainly because of a higher frequency of hypoglycemia.42 In Europe, the use of premixed insulin three times daily is a popular option, whereas in the United States, a twice-daily schedule has been more common.
COST VS CONTROL
Newer insulin analogues make insulin treatment safer and more accepted by patients. The availability of several options for insulin regimens allows individualization of the treatment according to the patient’s acceptance, the safety profile, and the cost.
Patient selection and insulin titration are key issues in ensuring the achievement of adequate control with the fewest side effects. Lifestyle management (diet and physical activity) enhances the efficacy of insulin therapy and reduces the chances of side effects, namely fluctuation of glucose levels, hypoglycemic episodes, and weight gain.
Human insulins (NPH and regular) remain the least expensive, especially when using premixed NPH-regular insulin 70/30. Their use should be considered when the cost of medication is a major concern for the patient. A more relaxed goal of glycemic control may be considered in order to avoid hypoglycemia when using those insulin preparations, such as a hemoglobin A1c level less than 7.5% or even in the range of 7.5% to 8.5%, depending on the expected seasonal variation of hemoglobin A1c (which is higher in winter43), individual factors, and whether the premixed insulin is used twice or three times daily.
RE-EVALUATE THE REGIMEN ROUTINELY
The insulin regimen should be re-evaluated routinely. It might need to be changed in response to the dynamic multifactorial process of progression of diabetes, change in stress level, presence or resolution of intercurrent illnesses, risk of hypoglycemia, concerns about weight gain, and cost.
Finally, adjustment of the regimen should be considered in response to improvement of glycemic control related to improvement of dietary management, exercising, weight loss, and medical therapies.
- UK Prospective Diabetes Study 16. Overview of 6 years’ therapy of type II diabetes: a progressive disease. UK Prospective Diabetes Study Group. Diabetes 1995; 44:1249–1258.
- Nathan DM, Buse JB, Davidson MB, et al; American Diabetes Association. Medical management of hyperglycemia in type 2 diabetes: a consensus algorithm for the initiation and adjustment of therapy: a consensus statement of the American Diabetes Association and the European Association for the Study of Diabetes. Diabetes Care 2009; 32:193–203.
- Rodbard HW, Jellinger PS, Davidson JA, et al. Statement by an American Association of Clinical Endocrinologists/American College of Endocrinology consensus panel on type 2 diabetes mellitus: an algorithm for glycemic control. Endocr Pract 2009; 15:540–558.
- ClinicalTrials.gov. The ORIGIN Trial (Outcome Reduction With Initial Glargine Intervention). http://clinicaltrials.gov/ct2/show/NCT00069784. Accessed 2/11/11.
- American Diabetes Association. Standards of medical care in diabetes—2010. Diabetes Care 2010; 33(suppl 1):S11–S61.
- Retnakaran R, Qi Y, Opsteen C, Vivero E, Zinman B. Initial short-term intensive insulin therapy as a strategy for evaluating the preservation of beta-cell function with oral antidiabetic medications: a pilot study with sitagliptin. Diabetes Obes Metab 2010; 12:909–915.
- Zoungas S, Patel A, Chalmers J, et al; ADVANCE Collaborative Group. Severe hypoglycemia and risks of vascular events and death. N Engl J Med 2010; 363:1410–1418.
- Akram K, Pedersen-Bjergaard U, Borch-Johnsen K, Thorsteinsson B. Frequency and risk factors of severe hypoglycemia in insulin-treated type 2 diabetes: a literature survey. J Diabetes Complications 2006; 20:402–408.
- Cryer PE. Chapter 19. Hypoglycemia. In: Jameson JL, editor. Harrison’s Endocrinology. McGraw Hill, 2006:355–363.
- Philis-Tsimikas A, Charpentier G, Clauson P, Ravn GM, Roberts VL, Thorsteinsson B. Comparison of once-daily insulin detemir with NPH insulin added to a regimen of oral antidiabetic drugs in poorly controlled type 2 diabetes. Clin Ther 2006; 28:1569–1581. Erratum in: Clin Ther 2006; 28:1967.
- Hermansen K, Davies M, Derezinski T, Martinez Ravn G, Clauson P, Home P. A 26-week, randomized, parallel, treat-to-target trial comparing insulin detemir with NPH insulin as add-on therapy to oral glucose-lowering drugs in insulin-naive people with type 2 diabetes. Diabetes Care 2006; 29:1269–1274. Erratum in: Diabetes Care 2007; 30:1035.
- Haak T, Tiengo A, Draeger E, Suntum M, Waldhäusl W. Lower within-subject variability of fasting blood glucose and reduced weight gain with insulin detemir compared to NPH insulin in patients with type 2 diabetes. Diabetes Obes Metab 2005; 7:56–64.
- Yki-Järvinen H, Kauppinen-Mäkelin R, Tiikkainen M, et al. Insulin glargine or NPH combined with metformin in type 2 diabetes: the LANMET study. Diabetalogia 2006; 49:442–451.
- Fritsche A, Schweitzer MA, Häring HU; 4001 Study Group. Glimepiride combined with morning insulin glargine, bedtime neutral protamine hagedorn insulin, or bedtime insulin glargine in patients with type 2 diabetes. A randomized, controlled trial. Ann Intern Med 2003; 138:952–959.
- Rosenstock J, Schwartz SL, Clark CM, Park GD, Donley DW, Edwards MB. Basal insulin therapy in type 2 diabetes: 28-week comparison of insulin glargine (HOE 901) and NPH insulin. Diabetes Care 2001; 24:631–636.
- Rosenstock J, Davies M, Home PD, Larsen J, Koenen C, Schernthaner G. A randomised, 52-week, treat-to-target trial comparing insulin detemir with insulin glargine when administered as add-on to glucose-lowering drugs in insulin-naive people with type 2 diabetes. Diabetologia 2008; 51:408–416.
- King AB. Once-daily insulin detemir is comparable to once-daily insulin glargine in providing glycaemic control over 24 h in patients with type 2 diabetes: a double-blind, randomized, crossover study. Diabetes Obes Metab 2009; 11:69–71.
- Swinnen SG, Snoek FJ, Dain MP, DeVries JH, Hoekstra JB, Holleman F. Rationale, design, and baseline data of the insulin glargine (Lantus) versus insulin detemir (Levemir) Treat-To-Target (L2T3) study: a multinational, randomized noninferiority trial of basal insulin initiation in type 2 diabetes. Diabetes Technol Ther 2009; 11:739–743.
- Kazda C, Hülstrunk H, Helsberg K, Langer F, Forst T, Hanefeld M. Prandial insulin substitution with insulin lispro or insulin lispro mid mixture vs. basal therapy with insulin glargine: a randomized controlled trial in patients with type 2 diabetes beginning insulin therapy. J Diabetes Complications 2006; 20:145–152.
- Malone JK, Bai S, Campaigne BN, Reviriego J, Augendre-Ferrante B. Twice-daily pre-mixed insulin rather than basal insulin therapy alone results in better overall glycaemic control in patients with type 2 diabetes. Diabet Med 2005; 22:374–381.
- Buse JB, Wolffenbuttel BH, Herman WH, et al. DURAbility of basal versus lispro mix 75/25 insulin efficacy (DURABLE) trial 24-week results: safety and efficacy of insulin lispro mix 75/25 versus insulin glargine added to oral antihyperglycemic drugs in patients with type 2 diabetes. Diabetes Care 2009; 32:1007–1013.
- Kann PH, Wascher T, Zackova V, et al. Starting insulin therapy in type 2 diabetes: twice-daily biphasic insulin Aspart 30 plus metformin versus once-daily insulin glargine plus glimepiride. Exp Clin Endocrinol Diabetes 2006; 114:527–532.
- Monnier L, Colette C, Monnier L, Colette C. Contributions of fasting and postprandial glucose to hemoglobin A1c. Endocr Pract 2006; 12(suppl 1):42–46.
- Woerle HJ, Pimenta WP, Meyer C, et al. Diagnostic and therapeutic implications of relationships between fasting, 2-hour postchallenge plasma glucose and hemoglobin A1c values. Arch Intern Med 2004; 164:1627–1632.
- Schrot RJ. Targeting plasma glucose: preprandial versus postprandial. Clinical Diabetes 2004; 22:169–172.
- Bretzel RG, Nuber U, Landgraf W, Owens DR, Bradley C, Linn T. Once-daily basal insulin glargine versus thrice-daily prandial insulin lispro in people with type 2 diabetes on oral hypoglycaemic agents (APOLLO): an open randomised controlled trial. Lancet 2008; 371:1073–1084.
- Tamaki M, Shimizu T, Kanazawa A, Fujitani Y, Watada H, Kawamori R, Hirose T. Effects of changes in basal/total daily insulin ratio in type 2 diabetes patients on intensive insulin therapy including insulin glargine (JUN-LAN Study 6). Diabetes Res Clin Pract 2008; 81:e1–e3.
- Yokoyama H, Tada J, Kamikawa F, Kanno S, Yokota Y, Kuramitsu M. Efficacy of conversion from bedtime NPH insulin to morning insulin glargine in type 2 diabetic patients on basal-prandial insulin therapy. Diabetes Res Clin Pract 2006; 73:35–40.
- Riddle MC, Rosenstock J, Gerich J; Insulin Glargine 4002 Study Investigators. The Treat-To-Target trial: randomized addition of glargine or human NPH insulin to oral therapy of type 2 diabetic patients. Diabetes Care 2003; 26:3080–3086.
- Davies M, Sinnassamy P, Storms F, Gomis R; ATLANTUS Study Group. Insulin glargine-based therapy improves glycemic control in patients with type 2 diabetes sub-optimally controlled on premixed insulin therapies. Diabetes Res Clin Pract 2008; 79:368–375.
- Jacober SJ, Scism-Bacon JL, Zagar AJ. A comparison of intensive mixture therapy with basal insulin therapy in insulin-naïve patients with type 2 diabetes receiving oral antidiabetes agents. Diabetes Obes Metab 2006; 8:448–455.
- Hirsch IB, Yuan H, Campaigne BN, Tan MH. Impact of prandial plus basal vs basal insulin on glycemic variability in type 2 diabetic patients. Endocr Pract 2009; 15:343–348.
- Robbins DC, Beisswenger PJ, Ceriello A, et al. Mealtime 50/50 basal + prandial insulin analogue mixture with a basal insulin analogue, both plus metformin, in the achievement of target HbA1c and pre- and postprandial blood glucose levels in patients with type 2 diabetes: a multinational, 24-week, randomized, open-label, parallel-group comparison. Clin Ther 2007; 29:2349–2364.
- Hollander P, Cooper J, Bregnhøj J, Pedersen CB. A 52-week, multinational, open-label, parallel-group, noninferiority, treat-to-target trial comparing insulin detemir with insulin glargine in a basal-bolus regimen with mealtime insulin aspart in patients with type 2 diabetes. Clin Ther 2008; 30:1976–1987.
- Raskin P, Gylvin T, Weng W, Chaykin L. Comparison of insulin detemir and insulin glargine using a basal-bolus regimen in a randomized, controlled clinical study in patients with type 2 diabetes. Diabetes Metab Res Rev 2009; 25:542–548.
- Perriello G, Pampanelli S, Porcellati F, et al. Insulin aspart improves meal time glycaemic control in patients with type 2 diabetes: a randomized, stratified, double-blind and cross-over trial. Diabet Med 2005; 22:606–611.
- Umpierrez GE, Hor T, Smiley D, et al. Comparison of inpatient insulin regimens with detemir plus aspart versus neutral protamine hagedorn plus regular in medical patients with type 2 diabetes. J Clin Endocrinol Metab 2009; 94:564–569.
- Bergenstal RM, Johnson M, Powers MA, et al. Adjust to target in type 2 diabetes: comparison of a simple algorithm with carbohydrate counting for adjustment of mealtime insulin glulisine. Diabetes Care 2008; 31:1305–1310.
- Rosenstock J, Ahmann AJ, Colon G, Scism-Bacon J, Jiang H, Martin S. Advancing insulin therapy in type 2 diabetes previously treated with glargine plus oral agents: prandial premixed (insulin lispro protamine suspension/lispro) versus basal/bolus (glargine/lispro) therapy. Diabetes Care 2008; 31:20–25.
- Ligthelm RJ, Mouritzen U, Lynggaard H, et al. Biphasic insulin aspart given thrice daily is as efficacious as a basal-bolus insulin regimen with four daily injections: a randomised open-label parallel group four months comparison in patients with type 2 diabetes. Exp Clin Endocrinol Diabetes 2006; 114:511–519.
- Velojic-Golubovic M, Mikic D, Pesic M, Dimic D, Radenkovic S, Antic S. Biphasic insulin aspart 30: better glycemic control than with premixed human insulin 30 in obese patients with type 2 diabetes. J Endocrinol Invest 2009; 32:23–27.
- Holman RR, Farmer AJ, Davies MJ, et al; 4-T Study Group. Three-year efficacy of complex insulin regimens in type 2 diabetes. N Engl Med 2009; 361:1736–1747.
- Tseng CL, Brimacombe M, Xie M, et al. Seasonal patterns in monthly hemoglobin A1c values. Am J Epidemiol 2005; 161:565–574.
Many patients with type 2 diabetes eventually need insulin, as their ability to produce their own insulin from pancreatic beta cells declines progressively.1 The questions remain as to when insulin therapy should be started, and which regimen is the most appropriate.
Guidelines from professional societies differ on these points,2,3 as do individual clinicians. Moreover, antidiabetic treatment is an evolving topic. Many new drugs—oral agents as well as injectable analogues of glucagon-like peptide-1 (GLP1) and insulin formulations—have become available in the last 15 years.
In this paper, I advocate an individualized approach and review the indications for insulin treatment, the available preparations, the pros and cons of each regimen, and how the properties of each type of insulin influence attempts to intensify the regimen.
Coexisting physiologic and medical conditions such as pregnancy and chronic renal failure and drugs such as glucocorticoids may alter insulin requirements. I will not cover these special situations, as they deserve separate, detailed discussions.
WHEN SHOULD INSULIN BE STARTED? TWO VIEWS
Early on, patients can be adequately managed with lifestyle modifications and oral hypoglycemic agents or injections of a GLP1 analogue, either alone or in combination with oral medication. Later, some patients reach a point at which insulin therapy becomes the main treatment, similar to patients with type 1 diabetes.
The American Diabetes Association (ADA), in a consensus statement,2 has called for using insulin early in the disease if lifestyle management and monotherapy with metformin (Glucophage) fail to control glucose or if lifestyle management is not adequate and metformin is contraindicated. The ADA’s goal hemoglobin A1c level is less than 7% for most patients.
The American Association of Clinical Endocrinologists (AACE) and the American College of Endocrinology (ACE), in another consensus statement, use an algorithm stratified by hemoglobin A1c level, in which insulin is mostly reserved for when combination therapy fails.3 Their goal hemoglobin A1c level is 6.5% or less for most patients.
Comment. Both consensus statements make exceptions for patients presenting with very high blood glucose and hemoglobin A1c levels and those who have contraindications to drugs other than insulin. These patients should start insulin immediately, along with lifestyle management.2,3
Both consensus statements give priority to safety. The AACE/ACE statement gives more weight to the risk of hypoglycemia with insulin treatment, whereas the ADA gives more weight to the risk of edema and congestive heart failure with thiazolidinedione drugs (although both insulin and thiazolidinediones cause weight gain) and to adequate validation of treatments in clinical trials.
Ongoing clinical trials may add insight to this issue. For example, the Outcome Reduction With Initial Glargine Intervention (ORIGIN) study is investigating the effects of the long-acting insulin glargine (Lantus) in early diabetes with regard to glycemic control, safety, and cardiovascular outcomes.4 This study is expected to end this year (2011). The safety of alternative treatment options is also under investigation and scrutiny. In the interim, individualized treatment should be considered, as we will see below.
MY VIEW: AN INDIVIDUALIZED APPROACH
The decision to start insulin therapy should be made individually, based on several factors:
- Whether the patient is willing to try it
- The degree of hyperglycemia
- How relevant the potential side effects of insulin are to the patient compared with those of other hypoglycemic agents
- Whether oral hypoglycemic agents with or without GLP1 analogues are expected to provide the desired benefit
- The patient’s work schedule and lifestyle factors
- Cost
- The availability of nurses, diabetes educators, and others to implement and follow the insulin treatment.
Will patients accept insulin?
Factors that affect whether patients comply with a treatment include the number of pills or injections they must take per day, how often they must check their blood glucose, adverse effects, lifestyle limitations caused by the treatment (especially insulin), and cost. Most patients feel better when their glucose levels are under good control, which is a major motivation for initiating and adhering to insulin. The anticipated reduction of diabetic complications further enhances compliance.
Education promotes compliance. Patients need to know that type 2 diabetes tends to progress and that in time their treatment will have to be intensified, with higher doses of their current drugs and new drugs added or substituted, possibly including insulin. This information is best given early, ie, when the diagnosis is made, even if hyperglycemia is mild at that time.
With newer insulin preparations and delivery devices available, more patients are finding insulin treatment acceptable.
The glycemic goal should be individualized
The key issue is glycemic control. If glycemic control is worsening or if the hemoglobin A1c level remains above the goal, then the treatment strategy should be readdressed.
In general, one should try to achieve the best possible glycemic control with the few est adverse effects. Adequate dietary management with a regular meal schedule and predictable carbohydrate intake for each meal helps to avoid or at least minimize the two most important adverse effects of insulin, ie, weight gain and hypoglycemia.
For most patients, I believe a goal hemoglobin A1c level of less than 7% is reasonable.2 For others, a less stringent goal might be more appropriate, such as 7.5%. Several factors affect this decision, including whether the patient is willing to follow a complex insulin regimen (such as a basal-bolus regimen), his or her work schedule, other lifestyle factors, the duration of diabetes, the type or types of insulin used, coexisting medical conditions, the frequency of hypoglycemia, unawareness of hypoglycemia, age, prognosis, life expectancy, and cost.5
If hyperglycemia is severe (Table 1),2 the goal might not be clear when insulin therapy is started. It should become obvious with ongoing follow-up.
Previously untreated patients presenting with severe hyperglycemia are a heterogeneous group. Many of them have had diabetes for a relatively short time and were recently diagnosed. These patients are likely to safely achieve near-normal glycemic control. Some of them might be adequately treated with oral hypoglycemic agents; if insulin is used, transitioning from insulin to oral hypoglycemic agents may be feasible.2
Some untreated patients may have had diabetes for several years and have advanced disease and therefore might be more difficult to treat. Only 21 (57%) of 37 previously untreated patients intensively treated with insulin reached the goal fasting glucose level of less than 126 mg/dL in one study.6 The only way to evaluate the feasibility of achieving near-normal glycemia safely is by following the patient’s progress over time.
The patient’s glycemic goal should be reevaluated periodically and may need to be adjusted over time, based on changes in any of the factors discussed above.
Risk of hypoglycemia
The goal should be looser in difficult-to-treat patients, ie, those with frequent hypoglycemia and decreased awareness of hypoglycemia.
Patients with advanced diabetes whose glucose levels continue to fluctuate widely after lifestyle management and the insulin regimen have been addressed should also have a looser goal. These fluctuations of glucose levels are surrogate markers for the degree of insulin deficiency. Attempting to achieve near-normal glycemic levels in this situation would be associated with a higher risk of hypoglycemia.
A higher risk of hypoglycemia and its complications (eg, falling and accidents, especially among operators of heavy machinery, construction workers, and drivers) is another reason for adopting a relaxed goal of glycemic control.
ADDING BASAL INSULIN TO ORAL HYPOGLYCEMIC THERAPY
When glycemic control worsens or is not adequate despite the use of oral hypoglycemic agents, often the next step is to add basal insulin therapy, ie, once-daily doses of a long-acting insulin.
NPH, detemir, or glargine?
Most often, glargine or detemir (Levemir) insulin is used. Detemir can also be given twice daily if needed. If cost is a concern, neutral protamine Hagedorn (NPH, Humulin N, Novolin N) insulin once daily at bedtime or twice daily is a reasonable alternative.
Costs of basal insulins are $22 to $50 per 1,000-unit vial for NPH, $70 to $90 per 1,000-unit vial for detemir and glargine, and $170 to $200 for a box of five detemir or glargine pens (containing 1,500 units total). Complicating this issue, vials should not be used for more than 1 month, and thus, the cost of vials vs pens depends on dosage.
Detemir vs NPH. In a trial in patients with inadequately controlled type 2 diabetes who had never taken insulin before and who were taking one or more oral hypoglycemic drugs, the addition of detemir insulin once daily or NPH at bedtime resulted in similar improvements in hemoglobin A1c (a decrease of about 1.5%).10
Detemir had several advantages over NPH. First, the incidence of nocturnal hypoglycemia was 50% lower with detemir at bedtime than with NPH at bedtime, and 87% lower with detemir in the morning than with bedtime NPH.10 In another trial,11 the risk of hypoglycemia at any time of day was 47% lower with insulin detemir than with NPH, and the risk of nocturnal hypoglycemia was 55% lower.
The risk of nocturnal hypoglycemia is lower if detemir is taken in the morning than at bedtime, although the total frequency of hypoglycemic episodes is the same.10 Therefore, another decision after starting basal insulin, based on the patient’s glucose trends and frequency of hypoglycemic events, would be whether insulin should be taken in the morning or at bedtime.
The second advantage of detemir is that it causes less weight gain: 0.7 kg at 20 weeks with detemir at bedtime vs 1.6 kg with NPH at bedtime.10
Further, detemir insulin was associated with less within-subject variability in the fasting glucose level than with NPH when these insulins were used in a basal-bolus regimen.12
Hermansen et al11 found that if the dosage of basal insulin was aggressively increased, 70% of patients achieved a hemoglobin A1c target of less than 7% with either NPH or detemir insulin, with fewer hypoglycemic episodes in patients treated with detemir.
Therefore, adding basal insulin to oral therapy is adequate for many patients who are new to insulin. Many patients would need more, such as the addition of insulin before meals.
Glargine vs NPH. Compared with adding NPH, adding glargine to a regimen of oral hypoglycemic agents controls blood glucose levels better and with less fluctuation in glucose levels, a lower risk of hypoglycemia, and less weight gain.13–15 These results were the same when using glargine with either metformin13 or glimeperide (Amaryl).14
Glargine is usually given once daily at bedtime. One study suggested that giving it in the morning is more effective.14
Detemir vs glargine. Studies that compared detemir and glargine revealed more similarities than differences in their clinical benefits.16,17 Both preparations effectively lower glucose levels and improve quality of life.18
Titrating the insulin regimen is a key in achieving adequate glycemic control. This includes teaching patients how to adjust their insulin, for example by increasing the dosage of glargine or detemir by 2 units every 4 to 7 days until adequate glycemic control is achieved, unless hypoglycemia becomes a barrier.
BASAL VS PRANDIAL INSULIN
Once-daily insulin injection is relatively convenient, but it comes with a limitation: it does not adequately control postprandial hyperglycemia. A solution is insulin before meals, ie, prandial insulin.
Kazda et al19 compared three regimens in patients not taking oral hypoglycemic agents: rapid-acting insulin lispro (Humalog) before each meal, a mix of 50% lispro and 50% protamine lispro (Humalog Mix 50/50) (the protamine delays its release) before each meal, and glargine at bedtime. The absolute change in hemoglobin A1c was −0.3% in the glargine group, −1.1% in the lispro group, and −1.2% in the lispro mix group. The glargine group had better control of fasting glucose.
Similar advantages of better glycemic control and fewer nocturnal hypoglycemic episodes were seen in trials of a mixture of 25% lispro and 75% protamine lispro before meals compared with glargine insulin in patients on simultaneous treatment with oral hypoglycemic agents.20,21 Buse et al21 reported that more patients achieved a hemoglobin A1c level below 7% with this lispro mix (47%) than with glargine (40%). The absolute difference in mean hemoglobin A1c between the two groups was minimal, although it reached statistical significance. As expected, weight gain was less in the glargine group.21
Kann et al22 reported that glycemic control was also better with a mixture of 30% aspart and 70% protamine aspart (NovoLog Mix 70/30) twice a day along with metformin than with glargine insulin once a day along with oral glimepiride, a sulfonylurea. Further, in this study, weight gain was noted in the glargine-glimepiride group only.22 Therefore, the advantage of less weight gain has not been always reproducible in glargine studies.
Comment. These studies point to the contribution of postprandial glucose to hemoglobin A1c.23–25 In patients with satisfactory glycemic control, the postprandial glucose level seems to be the major contributor to hemoglobin A1c. When glycemic control worsens, the contribution of fasting glucose to hemoglobin A1c increases.23
Premixed insulins (lispro mix and aspart mix) provide basal coverage and control postprandial hyperglycemia. Therefore, prandial premixed insulin therapy is expected to be superior to basal insulin therapy. Premixed insulin could be considered as a simplified basal-bolus regimen (see below).
The superiority of prandial (rapid-acting) insulin alone over basal insulin therapy, as seen in the study by Kazda et al,19 has not been reproducible in other studies. For example, in one study, once-daily glargine resulted in a similar improvement in hemoglobin A1c, a lower rate of hypoglycemic episodes, and greater patient satisfaction with treatment compared with lispro insulin before meals.26 This issue remains debatable because all the trials have been open-label and thus are subject to limitations.
The main lesson is that either glargine or lispro monotherapy is a reasonable option and results in better glycemic control in patients for whom two oral hypoglycemic agents have failed. Further, both fasting and postprandial hyperglycemia are important to address. In patients with severe hyperglycemia, a combination of prandial and basal insulin may be indicated. One would expect neither basal nor prandial (bolus) insulin to be adequate in this situation.
In conclusion, adding basal insulin to oral hypoglycemic agents is a reasonable option in the advancement of diabetes therapy and has become a common way to introduce insulin. It is simple and less labor-intensive for patients and medical groups than a basal-bolus regimen. Patients usually find it acceptable. The future availability of an easy-to-deliver, safe, and effective prandial insulin may change the current treatment paradigm; several newer prandial insulins are under investigation.
In advanced diabetes, both prandial and fasting glucose levels are crucial to address. Some patients may need to be started on both basal and prandial insulin simultaneously, depending on their degree of hyperglycemia, the duration of diabetes, coexisting medical conditions, and the goal of glycemic control.
BASAL-BOLUS INSULIN REGIMENS
In the advanced stages of type 2 diabetes, as insulin deficiency worsens, patients need to start giving themselves injections of a rapid-acting insulin—regular, lispro, aspart, or glulisine (Apidra) before meals, in addition to once- or twice-daily basal insulin injections. Such a “basal-bolus” regimen could also be used for newly diagnosed patients presenting with severe hyperglycemia. In addition, some patients on basal insulin plus oral hypoglycemic drugs may develop contraindications to their oral drugs. Adding bolus insulin becomes the main option for these patients too.
For others, a basal-bolus regimen might be chosen purely because of cost. For example, a regimen of NPH and regular insulin (multiple daily injections or premixed) would be significantly less expensive than multiple oral hypoglycemic agents.
Currently, only a few classes of oral hypoglycemic drugs are available in generic formulations. For example, generic glimeperide and metformin cost as little as $4 to $12 per month, while the costs of brand-name oral hypoglycemic agents are in the range of $170 to $200 per month. In contrast, premixed NPH plus regular insulin such as Novolin 70/30 and Humulin 70/30 cost between $22 and $70 per vial.
A basal-bolus regimen should provide 50% of the total daily insulin in the form of basal insulin. A regimen of 50% basal and 50% bolus seemed to provide better glycemic control than a regimen of 35% basal and 65% bolus in several studies.27,28
In patients already taking a single daily dose of basal insulin along with oral hypoglycemic agents, the dosage of basal insulin is usually raised gradually until adequate glycemic control is achieved. A main question is when to add prandial insulin. There is no clear cutoff for a basal insulin dosage at which prandial insulin should be added.
In the Treat-to-Target Trial,29 almost 60% of patients achieved a hemoglobin A1c level of 7% or less with the addition of either glargine or NPH insulin (basal insulin only) to oral hypoglycemic agents during 24 weeks of follow-up. As expected, glargine caused less nocturnal hypoglycemia. Fewer than half the patients who achieved a hemoglobin A1c level less than 7% had no documented nocturnal hypoglycemia (33% of glargine-treated patients and 27% of NPH-treated patients).
Type 2 diabetes is progressive1; over time, patients treated with once-daily basal insulin often require multiple daily injections.
Adding prandial to basal insulin clearly results in better glycemic control and less glucose variability.19,20,22,30–33 Two major factors in deciding to start prandial insulin are the degree of hyperglycemia and the patient’s acceptance of multiple daily injections. The higher the blood glucose levels, the sooner prandial insulin should be added, especially if hyperglycemia is influencing the prognosis of a coexisting condition or a diabetic complication (eg, an infected foot ulcer).
Adding prandial insulin should be also considered if the dosage of basal insulin has progressively been increased and the hemoglobin A1c level is not improving, especially if a patient has both inadequate glycemic control and frequent hypoglycemia, or if the morning glucose level is within the desired range (indicating there is no room for a further increase in the basal insulin dose) in association with inadequate control of hemoglobin A1c.
What is the best basal insulin for a basal-bolus regimen?
Glargine and detemir were shown to be equally effective as the basal component of a basal-bolus regimen.34,35 Findings were similar to those of studies comparing NPH, detemir, and glargine added, by themselves, to oral hypoglycemic agents. When possible, either glargine or detemir is favored because of less hypoglycemia and less weight gain than with NPH. Weight gain is the least with detemir.
Adding prandial insulin to a basal regimen
In general, whether to add prandial insulin can be decided on the basis of the patient’s record of blood glucose monitoring. Insulin could be added before breakfast if the pre-lunch glucose level is elevated, or before lunch if the dinnertime blood glucose level is elevated, or before dinner if the bedtime blood glucose level is elevated—or a combination of these. Prandial insulin can be started at a low dose (4–6 units) and increased gradually.
In the case of poor glycemic control on a high dosage of basal insulin, a reasonable first step would be to change the regimen to a basal-bolus regimen (about 50% basal and 50% bolus) with no change or a small decrease in the total daily dosage of insulin to avoid hypoglycemia. For example, in a patient on 80 units of glargine or detemir insulin who has inadequate control, the regimen could be changed to 35 units of either glargine or detemir and 10 to 12 units of lispro, aspart, or glulisine before each meal as the bolus component.
Further adjustments of the insulin dosage can be made according to the results of glucose monitoring before each meal and at bedtime. In all case scenarios, the insulin regimen should be re-evaluated routinely during the advancement of therapy from single daily injection of basal insulin to multiple daily injections. Redistribution of total insulin dosage to 50% basal and 50% bolus (divided into three doses before meals) should be considered for patients who continue to have fluctuations of glucose levels, inadequate control, or frequent hypoglycemia. This ratio seems to provide better control for most patients.27,28
Starting with a basal-bolus regimen
For patients new to insulin who are starting a basal-bolus regimen, a dosage based on total body weight could be considered. The requirements vary significantly based on dietary management, level of physical activity, stress (especially illnesses), use of oral hypoglycemic agents, and degree of hyperglycemia.
A lower dosage of insulin (0.2 units per kg) should be considered for people with mild stress, with milder hyperglycemia, or on treatment with oral hypoglycemic agents. Elderly patients and patients with renal or liver failure are at higher risk of hypoglycemia and should also receive a lower dosage of insulin, at least to start with.
Others could be started on a dosage of 0.3 to 0.5 units/kg. Fifty percent of the calculated dosage could be given as basal insulin and 50% given as bolus (divided into three doses, before meals). Subsequently, the dosage would need to be titrated on the basis of the record of glucose monitoring.
Choosing a prandial insulin
Rapid-acting insulin analogues (lispro, aspart, and glulisine) control postprandial glucose levels better than regular insulin and cause less hypoglycemia. Their pharmacokinetics enable them to be taken within a few minutes of the start of a meal, or even after the meal if the patient forgets to take an injection before the meal.
For example, in one study,36 taking aspart immediately before the meal provided better glycemic control than taking regular insulin 30 minutes before meals. In a basal-bolus regimen, the use of aspart along with detemir resulted in glycemic control similar to that provided by twice-daily NPH and regular insulin, with less hypoglycemia.37
The dosage of prandial insulin can be adjusted according to the amount of carbohydrates in each meal (the insulin-to-carbohydrate ratio), as in patients with type 1 diabetes. This approach was associated with less weight gain.38
IS THERE STILL A ROLE FOR PREMIXED INSULIN PREPARATIONS?
Basal-bolus insulin regimens have gained popularity because the prandial doses can easily be adjusted according to carbohydrate intake, glucose level (on a sliding scale), variations in meal time, missed meals (eg, when having a procedure), and exercise. For example, the dose of prandial insulin can be reduced if the patient expects to exercise within 2 or 3 hours after the meal.
Some patients may not accept giving themselves four or five injections per day with a basal-bolus regimen. They may accept a simpler regimen, ie, giving themselves three injections of a premixed insulin per day, one before each meal.
Compared with a basal-bolus regimen, the possibility of achieving adequate glycemic control using lispro mix (50% lispro, 50% lispro protamine suspension) before meals seemed to depend on the goal of glycemic control. Its use in one study showed similar ability to achieve hemoglobin A1c less than 7.5% compared with a basal-bolus regimen of glargine and lispro. For a goal hemoglobin A1c level of less than 7%, the use of glargine and lispro was superior. The rate of hypoglycemia was similar with both strategies.39 These findings imply that the goal hemoglobin A1c should be more relaxed (< 7.5%) when using lispro mix (50% lispro) three times daily before meals.
Biphasic insulin aspart (a mix of aspart and protamine aspart) given three times daily provided similar improvement in glycemic control with no difference in the frequency of hypoglycemia compared with a basal-bolus regimen of NPH and aspart.40 Further, the use of biphasic insulin aspart seemed to provide better glycemic control with less weight gain compared with premixed human insulin (70% NPH, 30% regular insulin).41
Therefore, simpler premixed insulin regimens remain reasonable options for selected patients who do not accept a more complex insulin regimen (basal-bolus) or cannot adhere to it for any reason, especially if premixed insulin is given before meals three times daily. In fact, recent studies have focused on comparing premixed insulin three times daily with basal-bolus regimens (detemir or glargine as basal insulin along with pre-meal insulin analogue).
Glycemic control is harder to achieve with premixed insulin twice daily, mainly because of a higher frequency of hypoglycemia.42 In Europe, the use of premixed insulin three times daily is a popular option, whereas in the United States, a twice-daily schedule has been more common.
COST VS CONTROL
Newer insulin analogues make insulin treatment safer and more accepted by patients. The availability of several options for insulin regimens allows individualization of the treatment according to the patient’s acceptance, the safety profile, and the cost.
Patient selection and insulin titration are key issues in ensuring the achievement of adequate control with the fewest side effects. Lifestyle management (diet and physical activity) enhances the efficacy of insulin therapy and reduces the chances of side effects, namely fluctuation of glucose levels, hypoglycemic episodes, and weight gain.
Human insulins (NPH and regular) remain the least expensive, especially when using premixed NPH-regular insulin 70/30. Their use should be considered when the cost of medication is a major concern for the patient. A more relaxed goal of glycemic control may be considered in order to avoid hypoglycemia when using those insulin preparations, such as a hemoglobin A1c level less than 7.5% or even in the range of 7.5% to 8.5%, depending on the expected seasonal variation of hemoglobin A1c (which is higher in winter43), individual factors, and whether the premixed insulin is used twice or three times daily.
RE-EVALUATE THE REGIMEN ROUTINELY
The insulin regimen should be re-evaluated routinely. It might need to be changed in response to the dynamic multifactorial process of progression of diabetes, change in stress level, presence or resolution of intercurrent illnesses, risk of hypoglycemia, concerns about weight gain, and cost.
Finally, adjustment of the regimen should be considered in response to improvement of glycemic control related to improvement of dietary management, exercising, weight loss, and medical therapies.
- UK Prospective Diabetes Study 16. Overview of 6 years’ therapy of type II diabetes: a progressive disease. UK Prospective Diabetes Study Group. Diabetes 1995; 44:1249–1258.
- Nathan DM, Buse JB, Davidson MB, et al; American Diabetes Association. Medical management of hyperglycemia in type 2 diabetes: a consensus algorithm for the initiation and adjustment of therapy: a consensus statement of the American Diabetes Association and the European Association for the Study of Diabetes. Diabetes Care 2009; 32:193–203.
- Rodbard HW, Jellinger PS, Davidson JA, et al. Statement by an American Association of Clinical Endocrinologists/American College of Endocrinology consensus panel on type 2 diabetes mellitus: an algorithm for glycemic control. Endocr Pract 2009; 15:540–558.
- ClinicalTrials.gov. The ORIGIN Trial (Outcome Reduction With Initial Glargine Intervention). http://clinicaltrials.gov/ct2/show/NCT00069784. Accessed 2/11/11.
- American Diabetes Association. Standards of medical care in diabetes—2010. Diabetes Care 2010; 33(suppl 1):S11–S61.
- Retnakaran R, Qi Y, Opsteen C, Vivero E, Zinman B. Initial short-term intensive insulin therapy as a strategy for evaluating the preservation of beta-cell function with oral antidiabetic medications: a pilot study with sitagliptin. Diabetes Obes Metab 2010; 12:909–915.
- Zoungas S, Patel A, Chalmers J, et al; ADVANCE Collaborative Group. Severe hypoglycemia and risks of vascular events and death. N Engl J Med 2010; 363:1410–1418.
- Akram K, Pedersen-Bjergaard U, Borch-Johnsen K, Thorsteinsson B. Frequency and risk factors of severe hypoglycemia in insulin-treated type 2 diabetes: a literature survey. J Diabetes Complications 2006; 20:402–408.
- Cryer PE. Chapter 19. Hypoglycemia. In: Jameson JL, editor. Harrison’s Endocrinology. McGraw Hill, 2006:355–363.
- Philis-Tsimikas A, Charpentier G, Clauson P, Ravn GM, Roberts VL, Thorsteinsson B. Comparison of once-daily insulin detemir with NPH insulin added to a regimen of oral antidiabetic drugs in poorly controlled type 2 diabetes. Clin Ther 2006; 28:1569–1581. Erratum in: Clin Ther 2006; 28:1967.
- Hermansen K, Davies M, Derezinski T, Martinez Ravn G, Clauson P, Home P. A 26-week, randomized, parallel, treat-to-target trial comparing insulin detemir with NPH insulin as add-on therapy to oral glucose-lowering drugs in insulin-naive people with type 2 diabetes. Diabetes Care 2006; 29:1269–1274. Erratum in: Diabetes Care 2007; 30:1035.
- Haak T, Tiengo A, Draeger E, Suntum M, Waldhäusl W. Lower within-subject variability of fasting blood glucose and reduced weight gain with insulin detemir compared to NPH insulin in patients with type 2 diabetes. Diabetes Obes Metab 2005; 7:56–64.
- Yki-Järvinen H, Kauppinen-Mäkelin R, Tiikkainen M, et al. Insulin glargine or NPH combined with metformin in type 2 diabetes: the LANMET study. Diabetalogia 2006; 49:442–451.
- Fritsche A, Schweitzer MA, Häring HU; 4001 Study Group. Glimepiride combined with morning insulin glargine, bedtime neutral protamine hagedorn insulin, or bedtime insulin glargine in patients with type 2 diabetes. A randomized, controlled trial. Ann Intern Med 2003; 138:952–959.
- Rosenstock J, Schwartz SL, Clark CM, Park GD, Donley DW, Edwards MB. Basal insulin therapy in type 2 diabetes: 28-week comparison of insulin glargine (HOE 901) and NPH insulin. Diabetes Care 2001; 24:631–636.
- Rosenstock J, Davies M, Home PD, Larsen J, Koenen C, Schernthaner G. A randomised, 52-week, treat-to-target trial comparing insulin detemir with insulin glargine when administered as add-on to glucose-lowering drugs in insulin-naive people with type 2 diabetes. Diabetologia 2008; 51:408–416.
- King AB. Once-daily insulin detemir is comparable to once-daily insulin glargine in providing glycaemic control over 24 h in patients with type 2 diabetes: a double-blind, randomized, crossover study. Diabetes Obes Metab 2009; 11:69–71.
- Swinnen SG, Snoek FJ, Dain MP, DeVries JH, Hoekstra JB, Holleman F. Rationale, design, and baseline data of the insulin glargine (Lantus) versus insulin detemir (Levemir) Treat-To-Target (L2T3) study: a multinational, randomized noninferiority trial of basal insulin initiation in type 2 diabetes. Diabetes Technol Ther 2009; 11:739–743.
- Kazda C, Hülstrunk H, Helsberg K, Langer F, Forst T, Hanefeld M. Prandial insulin substitution with insulin lispro or insulin lispro mid mixture vs. basal therapy with insulin glargine: a randomized controlled trial in patients with type 2 diabetes beginning insulin therapy. J Diabetes Complications 2006; 20:145–152.
- Malone JK, Bai S, Campaigne BN, Reviriego J, Augendre-Ferrante B. Twice-daily pre-mixed insulin rather than basal insulin therapy alone results in better overall glycaemic control in patients with type 2 diabetes. Diabet Med 2005; 22:374–381.
- Buse JB, Wolffenbuttel BH, Herman WH, et al. DURAbility of basal versus lispro mix 75/25 insulin efficacy (DURABLE) trial 24-week results: safety and efficacy of insulin lispro mix 75/25 versus insulin glargine added to oral antihyperglycemic drugs in patients with type 2 diabetes. Diabetes Care 2009; 32:1007–1013.
- Kann PH, Wascher T, Zackova V, et al. Starting insulin therapy in type 2 diabetes: twice-daily biphasic insulin Aspart 30 plus metformin versus once-daily insulin glargine plus glimepiride. Exp Clin Endocrinol Diabetes 2006; 114:527–532.
- Monnier L, Colette C, Monnier L, Colette C. Contributions of fasting and postprandial glucose to hemoglobin A1c. Endocr Pract 2006; 12(suppl 1):42–46.
- Woerle HJ, Pimenta WP, Meyer C, et al. Diagnostic and therapeutic implications of relationships between fasting, 2-hour postchallenge plasma glucose and hemoglobin A1c values. Arch Intern Med 2004; 164:1627–1632.
- Schrot RJ. Targeting plasma glucose: preprandial versus postprandial. Clinical Diabetes 2004; 22:169–172.
- Bretzel RG, Nuber U, Landgraf W, Owens DR, Bradley C, Linn T. Once-daily basal insulin glargine versus thrice-daily prandial insulin lispro in people with type 2 diabetes on oral hypoglycaemic agents (APOLLO): an open randomised controlled trial. Lancet 2008; 371:1073–1084.
- Tamaki M, Shimizu T, Kanazawa A, Fujitani Y, Watada H, Kawamori R, Hirose T. Effects of changes in basal/total daily insulin ratio in type 2 diabetes patients on intensive insulin therapy including insulin glargine (JUN-LAN Study 6). Diabetes Res Clin Pract 2008; 81:e1–e3.
- Yokoyama H, Tada J, Kamikawa F, Kanno S, Yokota Y, Kuramitsu M. Efficacy of conversion from bedtime NPH insulin to morning insulin glargine in type 2 diabetic patients on basal-prandial insulin therapy. Diabetes Res Clin Pract 2006; 73:35–40.
- Riddle MC, Rosenstock J, Gerich J; Insulin Glargine 4002 Study Investigators. The Treat-To-Target trial: randomized addition of glargine or human NPH insulin to oral therapy of type 2 diabetic patients. Diabetes Care 2003; 26:3080–3086.
- Davies M, Sinnassamy P, Storms F, Gomis R; ATLANTUS Study Group. Insulin glargine-based therapy improves glycemic control in patients with type 2 diabetes sub-optimally controlled on premixed insulin therapies. Diabetes Res Clin Pract 2008; 79:368–375.
- Jacober SJ, Scism-Bacon JL, Zagar AJ. A comparison of intensive mixture therapy with basal insulin therapy in insulin-naïve patients with type 2 diabetes receiving oral antidiabetes agents. Diabetes Obes Metab 2006; 8:448–455.
- Hirsch IB, Yuan H, Campaigne BN, Tan MH. Impact of prandial plus basal vs basal insulin on glycemic variability in type 2 diabetic patients. Endocr Pract 2009; 15:343–348.
- Robbins DC, Beisswenger PJ, Ceriello A, et al. Mealtime 50/50 basal + prandial insulin analogue mixture with a basal insulin analogue, both plus metformin, in the achievement of target HbA1c and pre- and postprandial blood glucose levels in patients with type 2 diabetes: a multinational, 24-week, randomized, open-label, parallel-group comparison. Clin Ther 2007; 29:2349–2364.
- Hollander P, Cooper J, Bregnhøj J, Pedersen CB. A 52-week, multinational, open-label, parallel-group, noninferiority, treat-to-target trial comparing insulin detemir with insulin glargine in a basal-bolus regimen with mealtime insulin aspart in patients with type 2 diabetes. Clin Ther 2008; 30:1976–1987.
- Raskin P, Gylvin T, Weng W, Chaykin L. Comparison of insulin detemir and insulin glargine using a basal-bolus regimen in a randomized, controlled clinical study in patients with type 2 diabetes. Diabetes Metab Res Rev 2009; 25:542–548.
- Perriello G, Pampanelli S, Porcellati F, et al. Insulin aspart improves meal time glycaemic control in patients with type 2 diabetes: a randomized, stratified, double-blind and cross-over trial. Diabet Med 2005; 22:606–611.
- Umpierrez GE, Hor T, Smiley D, et al. Comparison of inpatient insulin regimens with detemir plus aspart versus neutral protamine hagedorn plus regular in medical patients with type 2 diabetes. J Clin Endocrinol Metab 2009; 94:564–569.
- Bergenstal RM, Johnson M, Powers MA, et al. Adjust to target in type 2 diabetes: comparison of a simple algorithm with carbohydrate counting for adjustment of mealtime insulin glulisine. Diabetes Care 2008; 31:1305–1310.
- Rosenstock J, Ahmann AJ, Colon G, Scism-Bacon J, Jiang H, Martin S. Advancing insulin therapy in type 2 diabetes previously treated with glargine plus oral agents: prandial premixed (insulin lispro protamine suspension/lispro) versus basal/bolus (glargine/lispro) therapy. Diabetes Care 2008; 31:20–25.
- Ligthelm RJ, Mouritzen U, Lynggaard H, et al. Biphasic insulin aspart given thrice daily is as efficacious as a basal-bolus insulin regimen with four daily injections: a randomised open-label parallel group four months comparison in patients with type 2 diabetes. Exp Clin Endocrinol Diabetes 2006; 114:511–519.
- Velojic-Golubovic M, Mikic D, Pesic M, Dimic D, Radenkovic S, Antic S. Biphasic insulin aspart 30: better glycemic control than with premixed human insulin 30 in obese patients with type 2 diabetes. J Endocrinol Invest 2009; 32:23–27.
- Holman RR, Farmer AJ, Davies MJ, et al; 4-T Study Group. Three-year efficacy of complex insulin regimens in type 2 diabetes. N Engl Med 2009; 361:1736–1747.
- Tseng CL, Brimacombe M, Xie M, et al. Seasonal patterns in monthly hemoglobin A1c values. Am J Epidemiol 2005; 161:565–574.
KEY POINTS
- Whether to start insulin therapy and which regimen to use depend on a number of factors, including the patient’s acceptance and willingness to adhere to the therapy.
- A common way to start is to add a once-daily dose of a long-acting insulin at bedtime (basal insulin) to the patient’s antidiabetic regimen.
- Basal regimens do not control postprandial hyperglycemia very well. Another option is to take a long-acting (basal) insulin along with a rapid-acting (prandial or bolus) insulin before meals. Multiple formulations of premixed insulins are available and are convenient to use among new users.
- Basal-bolus regimens, which involve injections of rapid-acting insulin before meals and long-acting insulin at bedtime, are gaining popularity. Their cost and the number of injections may affect patient acceptance of this treatment.
Dronedarone for atrial fibrillation: How does it compare with amiodarone?
Dronedarone (Multaq), approved by the US Food and Drug Administration in July 2009, is a congener of the antiarrhythmic drug amiodarone (Cordarone). Designed in the hope that it would be safer than amiodarone, its official indication is to lower the risk of hospitalization in patients with paroxysmal or persistent atrial fibrillation or atrial flutter. However, its precise role in the management of atrial fibrillation is yet to be defined. If dronedarone remains well tolerated, it may permit clinicians to pursue a rhythm control strategy more often. In this article, we present a progress report on this new agent.
BETTER ANTIARRHYTHMIC DRUGS ARE NEEDED
Atrial fibrillation increases the risk of stroke fivefold and accounts for 15% to 20% of all strokes.1 It also increases the risk of heart failure. Drugs are the mainstay of therapy, but many antiarrhythmic drugs are not very effective and cause cardiac and extracardiac toxicity. Thus, the need for safe and effective new drugs.2
Much effort is going into the development of drugs that target specific ion channels or proteins expressed predominantly in atrial myocardium. The rationale is to avoid the unwanted effects of ionic currents on the ventricle and thus avoid ventricular proarrhythmic effects. At the same time, alternatives to the multiple channel blocker amiodarone, the mainstay of heart rhythm control therapy in atrial fibrillation, are being developed to retain the electrophysiologic efficacy of the mother compound but avoid its extracardiac toxicity.
RATE CONTROL VS RHYTHM CONTROL
In the acute care setting, heart rate control with atrioventricular nodal agents (beta-blockers, calcium channel blockers, and digitalis) is the preferred initial strategy in most hemodynamically stable patients presenting with new-onset atrial fibrillation.3
Since we lack an effective method for maintaining sinus rhythm without incurring significant adverse effects, rate control is also often chosen for chronic management of atrial fibrillation. This is particularly true for patients who have no symptoms or only minimal symptoms and in whom adequate rate control is easily attained. Indeed, results of large clinical trials suggest that rate control is satisfactory for many patients.
The main purpose of rate control is to control symptoms as opposed to merely lowering the ventricular rate. Effective rate control often prevents hemodynamic instability in patients with underlying heart disease who present acutely with atrial fibrillation. In patients with permanent atrial fibrillation, the RACE II study4 (Rate Control Efficacy in Permanent Atrial Fibrillation: a Comparison between Lenient Versus Strict Rate Control II), during a 3-year follow-up, showed that lenient rate control (resting heart rate < 110 beats per minute) is not inferior to strict rate control (resting heart rate < 80 beats per minute) in preventing major cardiovascular events (heart failure, stroke) or arrhythmic events such as syncope and sustained ventricular tachycardia.4
As a long-term strategy, rate control also prevents tachycardia-induced cardiomyopathy, reduces the risk of worsening of underlying heart failure, and can improve symptoms and quality of life.
Although maintenance of sinus rhythm is most likely associated with a survival benefit, heart rhythm control with antiarrhythmic drugs has not shown an advantage over rate control in overall or cardiovascular death rates, thromboembolic complications, or impact on heart failure. Indeed, a rhythm control strategy has been associated only with better exercise tolerance and, although less clear, with better quality of life.5
One possible explanation as to why a rhythm control strategy has not been shown to be superior to a rate control strategy is the side effects of the presently available drugs for rhythm control.
In a subgroup analysis of the Atrial Fibrillation Follow-up Investigation of Rhythm Management (AFFIRM) trial,6 antiarrhythmic therapy was associated with a 49% increase in the mortality rate that offset the benefits of conversion and maintenance of sinus rhythm, which was associated with a 53% reduction in mortality rates.
The hope is that newer drugs with less toxicity may produce better outcomes for patients treated with rhythm control.
AN ANALOGUE OF AMIODARONE, WITHOUT THE IODINE
Dronedarone is a structurally modified version of amiodarone, the antiarrhythmic drug that has shown the greatest efficacy at maintaining sinus rhythm in patients with paroxysmal atrial fibrillation. Although historically amiodarone has been effective in maintaining sinus rhythm and has been used safely in patients with advanced heart failure, its use has been limited by cumulative and often irreversible extracardiac organ toxicity.
Dronedarone was designed to match amiodarone’s efficacy but with a better safety profile. An iodine radical makes up more than one-third of amiodarone’s molecular weight. The omission of iodine in dronedarone was intended to reduce the likelihood of toxic side effects.
Dronedarone is a benzofuran derivative pharmacologically related to amiodarone, with the addition of a methylsulfonamide group. This reduces lipophilicity and the propensity to cross the blood-brain barrier; over a 2-year period this drug has not been shown to have neurotoxic effects.7
Dronedarone has proved efficacious without toxic or proarrhythmic effects and has minimal side effects, but concerns remain regarding its use in advanced heart failure. To date, its adverse-event profile appears comparable to that of placebo. However, whether its efficacy and incidence of adverse effects are comparable to what has been reported in the literature may take time to assess.
DRONEDARONE’S PHARMACOLOGY
Dronedarone, like amiodarone, blocks multiple sodium and potassium ion channels. It also exerts an antiadrenergic effect by noncompetitive binding to beta-adrenergic receptors as well as by inhibiting an agonist-induced increase in adenylate cyclase activity.8 Compared with amiodarone, dronedarone is a more potent blocker of peak sodium current.
Dronedarone is largely metabolized by the hepatic enzyme cytochrome P450 3A4 isoform (CYP3A4). Only 6% of dronedarone is excreted renally; however, no trial has yet assessed dronedarone’s safety in patients with marked kidney dysfunction.89
Dronedarone’s steady-state terminal elimination half-life is approximately 30 hours. When taken twice a day, it achieves steady-state concentrations in 5 to 7 days.
Dronedarone is available only for oral administration at 400 mg twice daily. Dose adjustment or titration is not recommended.
CLINICAL TRIALS OF DRONEDARONE
Dronedarone vs placebo
ATHENA (A Placebo-Controlled, Double-Blind, Parallel Arm Trial to Assess the Efficacy of Dronedarone 400 mg bid for the Prevention of Cardiovascular Hospitalization or Death From any Cause in Patients With Atrial Fibrillation/Atrial Flutter)10 was a prospective, double-blind study to assess morbidity and death rates in 4,628 patients with atrial fibrillation or atrial flutter and at least one other cardiovascular risk factor.
EURIDIS and ADONIS. Two trials,11 EURIDIS (European Trial in Atrial Fibrillation or Flutter Patients Receiving Dronedarone for the Maintenance of Sinus Rhythm) and ADONIS (American-Australian Trial With Dronedarone in Atrial Fibrillation or Flutter Patients for the Maintenance of Sinus Rhythm), enrolled a total of more than 1,200 patients and showed that dronedarone 400 mg twice a day produced a significantly lower rate of recurrence of atrial fibrillation after electrical cardioversion compared with placebo.
Overall, treatment with dronedarone significantly reduced the risk of a first recurrence of atrial fibrillation by 22% (ADONIS) and 27.5% (EURIDIS) (Table 1).
ERATO (Efficacy and Safety of Dronedarone for the Control of Ventricular Rate During Atrial Fibrillation),12 an additional phase III study, showed that dronedarone controlled the heart rate in patients with persistently accelerated ventricular rates despite concomitant standard therapy with a beta-blocker, digitalis, or a calcium-channel blocker. Dronedarone reduced the mean 24-hour heart rate by 11.7 beats per minute and the maximal exercise ventricular rate by 24.5 beats per minute at the 14th day.
ANDROMEDA (Anti-arrhythmic Trial With Dronedarone in Moderate to Severe CHF Evaluating Morbidity Decrease)13 was a study not of patients with atrial fibrillation but rather of patients with symptomatic congestive heart failure, a left ventricular ejection fraction of 35% or less, and recent hospitalization with new or worsening heart failure. The study was terminated early because of a higher rate of death with dronedarone13 (Table 1).
Dronedarone vs amiodarone
DIONYSOS (Efficacy and Safety of Dronedarone Versus Amiodarone for the Maintenance of Sinus Rhythm in Patients With Atrial Fibrillation)14 was a randomized double-blind trial. It evaluated the efficacy and safety of dronedarone (400 mg twice daily) or amiodarone (600 mg daily for 28 days, then 200 mg daily thereafter) for at least 6 months for the maintenance of sinus rhythm in patients with atrial fibrillation. It enrolled 504 patients with persistent atrial fibrillation; patients had not previously taken amiodarone. Dronedarone was less effective than amiodarone in maintaining sinus rhythm: the rate of recurrent atrial fibrillation was 63% with dronedarone and 42% with amiodarone. But dronedarone was associated with fewer adverse effects and less need for premature discontinuation of drug treatment at a mean follow-up of 7 months (Table 1).
WHERE DOES DRONEDARONE FIT IN ATRIAL FIBRILLATION MANAGEMENT?
Dronedarone is indicated in persistent or paroxysmal atrial fibrillation, based on the observed reduction of the rate of hospitalization. It is indicated for the maintenance of sinus rhythm and may be used in patients with persistent or paroxysmal atrial fibrillation and flutter who are in sinus rhythm or will be undergoing cardioversion soon after starting the drug. Dronedarone has no role in the acute management of atrial fibrillation, such as in cardioversion to sinus rhythm in the emergency department.
We do not have substantial evidence of the efficacy of dronedarone in patients with resistant atrial fibrillation, in whom multiple antiarrhythmics have failed to maintain sinus rhythm, and no published trial has used the inclusion criterion of treatment failure with other antiarrhythmic drugs.
The role of dronedarone in heart failure with preserved systolic function is unclear. Patients taking dronedarone are twice as likely as those taking amiodarone to have a recurrence of atrial fibrillation.
The main advantage of dronedarone is its lower adverse effect profile. However, this statement is based on only a few years of observation. If the patient has developed adverse effects with amiodarone, or if the clinician is concerned about the risk of serious adverse effects, dronedarone presents an alternative for those patients without heart failure or significant left ventricular dysfunction. One such group may be younger patients, because of concerns about the cumulative effects of amiodarone taken over a lifetime.
Dronedarone may represent an acceptable alternative to many of the current antiarrhythmic drugs. Based on the results of the Cardiac Arrhythmia Suppression Trial (CAST),15 class IC antiarrhythmics such as flecainide (Tambocor) are generally avoided in patients with prior myocardial infarction or with known or even suspected coronary artery disease. Similarly, sotalol (Betapace) is generally avoided in patients with marked left ventricular hypertrophy because of adverse effects.16 Dofetilide (Tikosyn) and often sotalol require hospitalization with telemetric monitoring for QTc prolongation and the risk of proarrhythmia with torsades de pointes. Dronedarone, however, generally can be safely started in the outpatient setting.
As when considering prescribing any antiarrhythmic, the clinician must assess the patient’s thromboembolic risk, since this risk persists with a rhythm control strategy.
There is substantial evidence from the ATHENA trial,10 in which 30% of the patients had coronary artery disease, that dronedarone is safe and effective in patients with coronary artery disease. Its use in patients who have undergone coronary artery bypass surgery remains to be defined.
WHEN SHOULD WE SWITCH PATIENTS TO DRONEDARONE?
Preliminary experience suggests that dronedarone, unlike most antiarrhythmic drugs, can be safely started about 48 hours after amiodarone is discontinued. Cumulative toxicity has not been noted with dronedarone. Caution should be exercised when switching if the patient has baseline bradycardia or QT interval prolongation. No algorithm has been developed for switching from other antiarrhythmic drugs to dronedarone.
CONTRAINDICATIONS TO DRONEDARONE
Dronedarone is contraindicated in:
- Patients with New York Heart Association (NYHA) class IV heart failure or NYHA class II or III heart failure with recent decompensation requiring hospitalization or referral to a specialized heart failure clinic
- Patients with second- or third-degree atrioventricular block or sick sinus syndrome (except when used in conjunction with a functioning pacemaker) or bradycardia (a heart rate < 50 beats per minute)
- Patients with a QTc interval of 500 ms or longer
- Patients with severe hepatic impairment
- Women who are pregnant, are attempting to become pregnant, or are breast-feeding
- Patients taking potent CYP3A inhibitors—antifungals like ketoconazole (Nizoral), itraconazole (Sporanox), or voriconazole (VFEND); macrolide antibiotics like telithromycin (Ketek) or clarithromycin (Biaxin); protease inhibitors; or other drugs that prolong the QT interval.
In patients with new or worsening heart failure, one should consider suspending or stopping dronedarone therapy.
DRONEDARONE’S ADVERSE EFFECTS
In trials to date, dronedarone has not shown evidence of proarrhythmia (tachyarrhythmia or bradyarrythmia), torsades de pointes, or amiodarone-like organ toxicity affecting the thyroid or the lungs. Recently, rare cases of severe hepatic injury were associated with dronedarone; therefore, periodic liver function testing is advised for patients taking dronedarone, especially during the first 6 months of therapy.
Dronedarone has been associated with higher rates of diarrhea, nausea, bradycardia, QT interval prolongation, and cutaneous rash compared with placebo. In DAFNE (Dronedarone Atrial Fibrillation Study After Electrical Cardioversion),17 10.8% of patients taking dronedarone had to stop taking it because of adverse events. With 800 mg daily, the discontinuation rate was only 3.9%. The most common cause of drug discontinuation was gastrointestinal effects. Anecdotal reports suggest that the gastrointestinal side effects may be self-limited and may not always require discontinuation of the drug.
Serum creatinine levels increase by about 0.1 mg/dL after the start of treatment. This elevation occurs after 1 to 2 days, reaches a plateau after 7 days, and is reversible. The mechanism is thought to be that dronedarone partially inhibits tubular organic cation transporters, which in turn reduces renal creatinine clearance by about 18%, but with no evidence of an effect on glomerular filtration, renal plasma flow, or electrolyte exchanges.18 A limited increase in serum creatinine is, therefore, expected with dronedarone treatment, but this does not mean there is a decline in renal function.
DRONEDARONE AND POTENTIAL DRUG INTERACTIONS
Warfarin. Dronedarone does not increase the international normalized ratio when used with warfarin (Coumadin).
Verapamil, diltiazem. Dose reduction is required to avoid bradyarrhythmias with co-administration of moderate CYP3A4 inhibitors such as verapamil (Calan, Verelan) and diltiazem (Cardizem).
Simvastatin. Dronedarone increases levels of simvastatin (Zocor), a CYP3A4 substrate, two to four times, thus increasing the risk of statin-induced myopathy.
Digoxin. Dronedarone increases the serum digoxin concentration about 2.5 times, and this necessitates monitoring the digoxin level and possibly reducing the digoxin dose.13
Diuretics. Hypokalemia and hypomagnesemia may occur with concomitant administration of potassium-depleting diuretics. Potassium levels should be maintained in the normal range before and during administration of dronedarone.
Tacrolimus, sirolimus. Dronedarone may increase levels of tacrolimus (Prograf) or sirolimus (Rapamune) in posttransplantation patients. This requires dose monitoring and adjustment in concomitant therapy with these agents.
COST VARIES
The cost of dronedarone varies based on factors that include location. Dronedarone’s retail cost ranges from $3.20 to $4.00 per pill (approximately $7.20 per day). It is not available in generic form. It is presently covered by many health plans as a tier 2 drug, representing a $15 to $40 monthly copay.
MORE DATA NEEDED
Dronedarone represents the first in what may well be a number of new antiarrhythmic drugs for the treatment of patients with paroxysmal atrial fibrillation. Although less efficacious then amiodarone, dronedarone appears to be better tolerated and have less serious side effects. It is contraindicated in patients with severe systolic dysfunction and in those with recent heart failure decompensation. It appears safe in coronary artery disease and marked left ventricular hypertrophy, unlike flecainide, propafenone (Rythmol), and sotalol.
To further understand how dronedarone will fare against other antiarrhythmic drugs, more studies with longer follow-up are needed. These studies need to demonstrate superior tolerability of dronedarone, acceptable quality of life without unacceptable loss of efficacy, or a decrease in morbidity or mortality rates compared with amiodarone.
Dronedarone can be safely started in most patients on an outpatient basis. The risk of proarrhythmia with dronedarone appears to be very low.
- Mathew ST, Patel J, Joseph S. Atrial fibrillation: mechanistic insights and treatment options. Eur J Intern Med 2009; 20:672–681.
- Schmitt J, Ehrlich JR, Hohnloser SH. New antiarrhythmic drugs for the treatment of atrial fibrillation. Herz 2008; 33:562–567.
- Wyse DG, Waldo AL, DiMarco JP, et al; Atrial Fibrillation Follow-up Investigation of Rhythm Management (AFFIRM) Investigators. A comparison of rate control and rhythm control in patients with atrial fibrillation. N Engl J Med 2002; 347:1825–1833.
- Van Gelder IC, Groenveld HF, Crijns HJ, et al; RACE II Investigators. Lenient versus strict rate control in patients with atrial fibrillation. N Engl J Med 2010; 362:1363–1373.
- Singh BN, Singh SN, Reda DJ, et al; Sotalol Amiodarone Atrial Fibrillation Efficacy Trial (SAFE-T) Investigators. Amiodarone versus sotalol for atrial fibrillation. N Engl J Med 2005; 352:1861–1872.
- The AFFIRM Investigators. Relationships between sinus rhythm, treatment, and survival in the Atrial Fibrillation Follow-Up Investigation of Rhythm Management (AFFIRM) study. Circulation 2004; 109:1509–1513.
- Van Beeren HC, Jong WM, Kaptein E, Visser TJ, Bakker O, Wiersinga WM. Dronerarone [sic] acts as a selective inhibitor of 3,5,3′-triiodothyronine binding to thyroid hormone receptor-alpha1: in vitro and in vivo evidence. Endocrinology 2003; 144:552–558.
- Patel C, Yan GX, Kowey PR. Dronedarone. Circulation 2009; 120:636–644.
- Dale KM, White CM. Dronedarone: an amiodarone analog for the treatment of atrial fibrillation and atrial flutter. Ann Pharmacother 2007; 41:599–605.
- Hohnloser SH, Crijns HJ, van Eickels M; ATHENA Investigators. Effect of dronedarone on cardiovascular events in atrial fibrillation. N Engl J Med 2009; 360:668–678.
- Singh BN, Connolly SJ, Crijns HJ, et al; EURIDIS and ADONIS Investigators. Dronedarone for maintenance of sinus rhythm in atrial fibrillation or flutter. N Engl J Med 2007; 357:987–999.
- Davy JM, Herold M, Hoglund CERATO Study Investigators. Dronedarone for the control of ventricular rate in permanent atrial fibrillation: the Efficacy and safety of dRonedArone for the cOntrol of ventricular rate during atrial fibrillation (ERATO) study. Am Heart J 2008; 156:527.e1–e9.
- Køber L, Torp-Pedersen C, McMurray JJ; Dronedarone Study Group. Increased mortality after dronedarone therapy for severe heart failure. N Engl J Med 2008; 358:2678–2687.
- Le Heuzey JY, De Ferrari GM, Radzik D, Santini M, Zhu J, Davy JM. A short-term, randomized, double-blind, parallel-group study to evaluate the efficacy and safety of dronedarone versus amiodarone in patients with persistent atrial fibrillation: the DIONYSOS study. J Cardiovasc Electrophysiol 2010; 21:597–605.
- The Cardiac Arrhythmia Suppression Trial (CAST) Investigators. Preliminary report: effect of encainide and flecainide on mortality in a randomized trial of arrhythmia suppression after myocardial infarction. N Engl J Med 1989; 321:406–412.
- Pratt CM. Clinical implications of the Survival With Oral D-sotalol (SWORD) trial: an investigation of patients with left ventricular dysfunction after myocardial infarction. Card Electrophysiol Rev 1998; 2:28–29.
- Touboul P, Brugada J, Capucci A, Crijns HJ, Edvardsson N, Hohnloser SH. Dronedarone for prevention of atrial fibrillation: a dose-ranging study. Eur Heart J 2003; 24:1481–1487.
- Tschuppert Y, Buclin T, Rothuizen LE, et al. Effect of dronedarone on renal function in healthy subjects. Br J Clin Pharmacol 2007; 64:785–791.
Dronedarone (Multaq), approved by the US Food and Drug Administration in July 2009, is a congener of the antiarrhythmic drug amiodarone (Cordarone). Designed in the hope that it would be safer than amiodarone, its official indication is to lower the risk of hospitalization in patients with paroxysmal or persistent atrial fibrillation or atrial flutter. However, its precise role in the management of atrial fibrillation is yet to be defined. If dronedarone remains well tolerated, it may permit clinicians to pursue a rhythm control strategy more often. In this article, we present a progress report on this new agent.
BETTER ANTIARRHYTHMIC DRUGS ARE NEEDED
Atrial fibrillation increases the risk of stroke fivefold and accounts for 15% to 20% of all strokes.1 It also increases the risk of heart failure. Drugs are the mainstay of therapy, but many antiarrhythmic drugs are not very effective and cause cardiac and extracardiac toxicity. Thus, the need for safe and effective new drugs.2
Much effort is going into the development of drugs that target specific ion channels or proteins expressed predominantly in atrial myocardium. The rationale is to avoid the unwanted effects of ionic currents on the ventricle and thus avoid ventricular proarrhythmic effects. At the same time, alternatives to the multiple channel blocker amiodarone, the mainstay of heart rhythm control therapy in atrial fibrillation, are being developed to retain the electrophysiologic efficacy of the mother compound but avoid its extracardiac toxicity.
RATE CONTROL VS RHYTHM CONTROL
In the acute care setting, heart rate control with atrioventricular nodal agents (beta-blockers, calcium channel blockers, and digitalis) is the preferred initial strategy in most hemodynamically stable patients presenting with new-onset atrial fibrillation.3
Since we lack an effective method for maintaining sinus rhythm without incurring significant adverse effects, rate control is also often chosen for chronic management of atrial fibrillation. This is particularly true for patients who have no symptoms or only minimal symptoms and in whom adequate rate control is easily attained. Indeed, results of large clinical trials suggest that rate control is satisfactory for many patients.
The main purpose of rate control is to control symptoms as opposed to merely lowering the ventricular rate. Effective rate control often prevents hemodynamic instability in patients with underlying heart disease who present acutely with atrial fibrillation. In patients with permanent atrial fibrillation, the RACE II study4 (Rate Control Efficacy in Permanent Atrial Fibrillation: a Comparison between Lenient Versus Strict Rate Control II), during a 3-year follow-up, showed that lenient rate control (resting heart rate < 110 beats per minute) is not inferior to strict rate control (resting heart rate < 80 beats per minute) in preventing major cardiovascular events (heart failure, stroke) or arrhythmic events such as syncope and sustained ventricular tachycardia.4
As a long-term strategy, rate control also prevents tachycardia-induced cardiomyopathy, reduces the risk of worsening of underlying heart failure, and can improve symptoms and quality of life.
Although maintenance of sinus rhythm is most likely associated with a survival benefit, heart rhythm control with antiarrhythmic drugs has not shown an advantage over rate control in overall or cardiovascular death rates, thromboembolic complications, or impact on heart failure. Indeed, a rhythm control strategy has been associated only with better exercise tolerance and, although less clear, with better quality of life.5
One possible explanation as to why a rhythm control strategy has not been shown to be superior to a rate control strategy is the side effects of the presently available drugs for rhythm control.
In a subgroup analysis of the Atrial Fibrillation Follow-up Investigation of Rhythm Management (AFFIRM) trial,6 antiarrhythmic therapy was associated with a 49% increase in the mortality rate that offset the benefits of conversion and maintenance of sinus rhythm, which was associated with a 53% reduction in mortality rates.
The hope is that newer drugs with less toxicity may produce better outcomes for patients treated with rhythm control.
AN ANALOGUE OF AMIODARONE, WITHOUT THE IODINE
Dronedarone is a structurally modified version of amiodarone, the antiarrhythmic drug that has shown the greatest efficacy at maintaining sinus rhythm in patients with paroxysmal atrial fibrillation. Although historically amiodarone has been effective in maintaining sinus rhythm and has been used safely in patients with advanced heart failure, its use has been limited by cumulative and often irreversible extracardiac organ toxicity.
Dronedarone was designed to match amiodarone’s efficacy but with a better safety profile. An iodine radical makes up more than one-third of amiodarone’s molecular weight. The omission of iodine in dronedarone was intended to reduce the likelihood of toxic side effects.
Dronedarone is a benzofuran derivative pharmacologically related to amiodarone, with the addition of a methylsulfonamide group. This reduces lipophilicity and the propensity to cross the blood-brain barrier; over a 2-year period this drug has not been shown to have neurotoxic effects.7
Dronedarone has proved efficacious without toxic or proarrhythmic effects and has minimal side effects, but concerns remain regarding its use in advanced heart failure. To date, its adverse-event profile appears comparable to that of placebo. However, whether its efficacy and incidence of adverse effects are comparable to what has been reported in the literature may take time to assess.
DRONEDARONE’S PHARMACOLOGY
Dronedarone, like amiodarone, blocks multiple sodium and potassium ion channels. It also exerts an antiadrenergic effect by noncompetitive binding to beta-adrenergic receptors as well as by inhibiting an agonist-induced increase in adenylate cyclase activity.8 Compared with amiodarone, dronedarone is a more potent blocker of peak sodium current.
Dronedarone is largely metabolized by the hepatic enzyme cytochrome P450 3A4 isoform (CYP3A4). Only 6% of dronedarone is excreted renally; however, no trial has yet assessed dronedarone’s safety in patients with marked kidney dysfunction.89
Dronedarone’s steady-state terminal elimination half-life is approximately 30 hours. When taken twice a day, it achieves steady-state concentrations in 5 to 7 days.
Dronedarone is available only for oral administration at 400 mg twice daily. Dose adjustment or titration is not recommended.
CLINICAL TRIALS OF DRONEDARONE
Dronedarone vs placebo
ATHENA (A Placebo-Controlled, Double-Blind, Parallel Arm Trial to Assess the Efficacy of Dronedarone 400 mg bid for the Prevention of Cardiovascular Hospitalization or Death From any Cause in Patients With Atrial Fibrillation/Atrial Flutter)10 was a prospective, double-blind study to assess morbidity and death rates in 4,628 patients with atrial fibrillation or atrial flutter and at least one other cardiovascular risk factor.
EURIDIS and ADONIS. Two trials,11 EURIDIS (European Trial in Atrial Fibrillation or Flutter Patients Receiving Dronedarone for the Maintenance of Sinus Rhythm) and ADONIS (American-Australian Trial With Dronedarone in Atrial Fibrillation or Flutter Patients for the Maintenance of Sinus Rhythm), enrolled a total of more than 1,200 patients and showed that dronedarone 400 mg twice a day produced a significantly lower rate of recurrence of atrial fibrillation after electrical cardioversion compared with placebo.
Overall, treatment with dronedarone significantly reduced the risk of a first recurrence of atrial fibrillation by 22% (ADONIS) and 27.5% (EURIDIS) (Table 1).
ERATO (Efficacy and Safety of Dronedarone for the Control of Ventricular Rate During Atrial Fibrillation),12 an additional phase III study, showed that dronedarone controlled the heart rate in patients with persistently accelerated ventricular rates despite concomitant standard therapy with a beta-blocker, digitalis, or a calcium-channel blocker. Dronedarone reduced the mean 24-hour heart rate by 11.7 beats per minute and the maximal exercise ventricular rate by 24.5 beats per minute at the 14th day.
ANDROMEDA (Anti-arrhythmic Trial With Dronedarone in Moderate to Severe CHF Evaluating Morbidity Decrease)13 was a study not of patients with atrial fibrillation but rather of patients with symptomatic congestive heart failure, a left ventricular ejection fraction of 35% or less, and recent hospitalization with new or worsening heart failure. The study was terminated early because of a higher rate of death with dronedarone13 (Table 1).
Dronedarone vs amiodarone
DIONYSOS (Efficacy and Safety of Dronedarone Versus Amiodarone for the Maintenance of Sinus Rhythm in Patients With Atrial Fibrillation)14 was a randomized double-blind trial. It evaluated the efficacy and safety of dronedarone (400 mg twice daily) or amiodarone (600 mg daily for 28 days, then 200 mg daily thereafter) for at least 6 months for the maintenance of sinus rhythm in patients with atrial fibrillation. It enrolled 504 patients with persistent atrial fibrillation; patients had not previously taken amiodarone. Dronedarone was less effective than amiodarone in maintaining sinus rhythm: the rate of recurrent atrial fibrillation was 63% with dronedarone and 42% with amiodarone. But dronedarone was associated with fewer adverse effects and less need for premature discontinuation of drug treatment at a mean follow-up of 7 months (Table 1).
WHERE DOES DRONEDARONE FIT IN ATRIAL FIBRILLATION MANAGEMENT?
Dronedarone is indicated in persistent or paroxysmal atrial fibrillation, based on the observed reduction of the rate of hospitalization. It is indicated for the maintenance of sinus rhythm and may be used in patients with persistent or paroxysmal atrial fibrillation and flutter who are in sinus rhythm or will be undergoing cardioversion soon after starting the drug. Dronedarone has no role in the acute management of atrial fibrillation, such as in cardioversion to sinus rhythm in the emergency department.
We do not have substantial evidence of the efficacy of dronedarone in patients with resistant atrial fibrillation, in whom multiple antiarrhythmics have failed to maintain sinus rhythm, and no published trial has used the inclusion criterion of treatment failure with other antiarrhythmic drugs.
The role of dronedarone in heart failure with preserved systolic function is unclear. Patients taking dronedarone are twice as likely as those taking amiodarone to have a recurrence of atrial fibrillation.
The main advantage of dronedarone is its lower adverse effect profile. However, this statement is based on only a few years of observation. If the patient has developed adverse effects with amiodarone, or if the clinician is concerned about the risk of serious adverse effects, dronedarone presents an alternative for those patients without heart failure or significant left ventricular dysfunction. One such group may be younger patients, because of concerns about the cumulative effects of amiodarone taken over a lifetime.
Dronedarone may represent an acceptable alternative to many of the current antiarrhythmic drugs. Based on the results of the Cardiac Arrhythmia Suppression Trial (CAST),15 class IC antiarrhythmics such as flecainide (Tambocor) are generally avoided in patients with prior myocardial infarction or with known or even suspected coronary artery disease. Similarly, sotalol (Betapace) is generally avoided in patients with marked left ventricular hypertrophy because of adverse effects.16 Dofetilide (Tikosyn) and often sotalol require hospitalization with telemetric monitoring for QTc prolongation and the risk of proarrhythmia with torsades de pointes. Dronedarone, however, generally can be safely started in the outpatient setting.
As when considering prescribing any antiarrhythmic, the clinician must assess the patient’s thromboembolic risk, since this risk persists with a rhythm control strategy.
There is substantial evidence from the ATHENA trial,10 in which 30% of the patients had coronary artery disease, that dronedarone is safe and effective in patients with coronary artery disease. Its use in patients who have undergone coronary artery bypass surgery remains to be defined.
WHEN SHOULD WE SWITCH PATIENTS TO DRONEDARONE?
Preliminary experience suggests that dronedarone, unlike most antiarrhythmic drugs, can be safely started about 48 hours after amiodarone is discontinued. Cumulative toxicity has not been noted with dronedarone. Caution should be exercised when switching if the patient has baseline bradycardia or QT interval prolongation. No algorithm has been developed for switching from other antiarrhythmic drugs to dronedarone.
CONTRAINDICATIONS TO DRONEDARONE
Dronedarone is contraindicated in:
- Patients with New York Heart Association (NYHA) class IV heart failure or NYHA class II or III heart failure with recent decompensation requiring hospitalization or referral to a specialized heart failure clinic
- Patients with second- or third-degree atrioventricular block or sick sinus syndrome (except when used in conjunction with a functioning pacemaker) or bradycardia (a heart rate < 50 beats per minute)
- Patients with a QTc interval of 500 ms or longer
- Patients with severe hepatic impairment
- Women who are pregnant, are attempting to become pregnant, or are breast-feeding
- Patients taking potent CYP3A inhibitors—antifungals like ketoconazole (Nizoral), itraconazole (Sporanox), or voriconazole (VFEND); macrolide antibiotics like telithromycin (Ketek) or clarithromycin (Biaxin); protease inhibitors; or other drugs that prolong the QT interval.
In patients with new or worsening heart failure, one should consider suspending or stopping dronedarone therapy.
DRONEDARONE’S ADVERSE EFFECTS
In trials to date, dronedarone has not shown evidence of proarrhythmia (tachyarrhythmia or bradyarrythmia), torsades de pointes, or amiodarone-like organ toxicity affecting the thyroid or the lungs. Recently, rare cases of severe hepatic injury were associated with dronedarone; therefore, periodic liver function testing is advised for patients taking dronedarone, especially during the first 6 months of therapy.
Dronedarone has been associated with higher rates of diarrhea, nausea, bradycardia, QT interval prolongation, and cutaneous rash compared with placebo. In DAFNE (Dronedarone Atrial Fibrillation Study After Electrical Cardioversion),17 10.8% of patients taking dronedarone had to stop taking it because of adverse events. With 800 mg daily, the discontinuation rate was only 3.9%. The most common cause of drug discontinuation was gastrointestinal effects. Anecdotal reports suggest that the gastrointestinal side effects may be self-limited and may not always require discontinuation of the drug.
Serum creatinine levels increase by about 0.1 mg/dL after the start of treatment. This elevation occurs after 1 to 2 days, reaches a plateau after 7 days, and is reversible. The mechanism is thought to be that dronedarone partially inhibits tubular organic cation transporters, which in turn reduces renal creatinine clearance by about 18%, but with no evidence of an effect on glomerular filtration, renal plasma flow, or electrolyte exchanges.18 A limited increase in serum creatinine is, therefore, expected with dronedarone treatment, but this does not mean there is a decline in renal function.
DRONEDARONE AND POTENTIAL DRUG INTERACTIONS
Warfarin. Dronedarone does not increase the international normalized ratio when used with warfarin (Coumadin).
Verapamil, diltiazem. Dose reduction is required to avoid bradyarrhythmias with co-administration of moderate CYP3A4 inhibitors such as verapamil (Calan, Verelan) and diltiazem (Cardizem).
Simvastatin. Dronedarone increases levels of simvastatin (Zocor), a CYP3A4 substrate, two to four times, thus increasing the risk of statin-induced myopathy.
Digoxin. Dronedarone increases the serum digoxin concentration about 2.5 times, and this necessitates monitoring the digoxin level and possibly reducing the digoxin dose.13
Diuretics. Hypokalemia and hypomagnesemia may occur with concomitant administration of potassium-depleting diuretics. Potassium levels should be maintained in the normal range before and during administration of dronedarone.
Tacrolimus, sirolimus. Dronedarone may increase levels of tacrolimus (Prograf) or sirolimus (Rapamune) in posttransplantation patients. This requires dose monitoring and adjustment in concomitant therapy with these agents.
COST VARIES
The cost of dronedarone varies based on factors that include location. Dronedarone’s retail cost ranges from $3.20 to $4.00 per pill (approximately $7.20 per day). It is not available in generic form. It is presently covered by many health plans as a tier 2 drug, representing a $15 to $40 monthly copay.
MORE DATA NEEDED
Dronedarone represents the first in what may well be a number of new antiarrhythmic drugs for the treatment of patients with paroxysmal atrial fibrillation. Although less efficacious then amiodarone, dronedarone appears to be better tolerated and have less serious side effects. It is contraindicated in patients with severe systolic dysfunction and in those with recent heart failure decompensation. It appears safe in coronary artery disease and marked left ventricular hypertrophy, unlike flecainide, propafenone (Rythmol), and sotalol.
To further understand how dronedarone will fare against other antiarrhythmic drugs, more studies with longer follow-up are needed. These studies need to demonstrate superior tolerability of dronedarone, acceptable quality of life without unacceptable loss of efficacy, or a decrease in morbidity or mortality rates compared with amiodarone.
Dronedarone can be safely started in most patients on an outpatient basis. The risk of proarrhythmia with dronedarone appears to be very low.
- Mathew ST, Patel J, Joseph S. Atrial fibrillation: mechanistic insights and treatment options. Eur J Intern Med 2009; 20:672–681.
- Schmitt J, Ehrlich JR, Hohnloser SH. New antiarrhythmic drugs for the treatment of atrial fibrillation. Herz 2008; 33:562–567.
- Wyse DG, Waldo AL, DiMarco JP, et al; Atrial Fibrillation Follow-up Investigation of Rhythm Management (AFFIRM) Investigators. A comparison of rate control and rhythm control in patients with atrial fibrillation. N Engl J Med 2002; 347:1825–1833.
- Van Gelder IC, Groenveld HF, Crijns HJ, et al; RACE II Investigators. Lenient versus strict rate control in patients with atrial fibrillation. N Engl J Med 2010; 362:1363–1373.
- Singh BN, Singh SN, Reda DJ, et al; Sotalol Amiodarone Atrial Fibrillation Efficacy Trial (SAFE-T) Investigators. Amiodarone versus sotalol for atrial fibrillation. N Engl J Med 2005; 352:1861–1872.
- The AFFIRM Investigators. Relationships between sinus rhythm, treatment, and survival in the Atrial Fibrillation Follow-Up Investigation of Rhythm Management (AFFIRM) study. Circulation 2004; 109:1509–1513.
- Van Beeren HC, Jong WM, Kaptein E, Visser TJ, Bakker O, Wiersinga WM. Dronerarone [sic] acts as a selective inhibitor of 3,5,3′-triiodothyronine binding to thyroid hormone receptor-alpha1: in vitro and in vivo evidence. Endocrinology 2003; 144:552–558.
- Patel C, Yan GX, Kowey PR. Dronedarone. Circulation 2009; 120:636–644.
- Dale KM, White CM. Dronedarone: an amiodarone analog for the treatment of atrial fibrillation and atrial flutter. Ann Pharmacother 2007; 41:599–605.
- Hohnloser SH, Crijns HJ, van Eickels M; ATHENA Investigators. Effect of dronedarone on cardiovascular events in atrial fibrillation. N Engl J Med 2009; 360:668–678.
- Singh BN, Connolly SJ, Crijns HJ, et al; EURIDIS and ADONIS Investigators. Dronedarone for maintenance of sinus rhythm in atrial fibrillation or flutter. N Engl J Med 2007; 357:987–999.
- Davy JM, Herold M, Hoglund CERATO Study Investigators. Dronedarone for the control of ventricular rate in permanent atrial fibrillation: the Efficacy and safety of dRonedArone for the cOntrol of ventricular rate during atrial fibrillation (ERATO) study. Am Heart J 2008; 156:527.e1–e9.
- Køber L, Torp-Pedersen C, McMurray JJ; Dronedarone Study Group. Increased mortality after dronedarone therapy for severe heart failure. N Engl J Med 2008; 358:2678–2687.
- Le Heuzey JY, De Ferrari GM, Radzik D, Santini M, Zhu J, Davy JM. A short-term, randomized, double-blind, parallel-group study to evaluate the efficacy and safety of dronedarone versus amiodarone in patients with persistent atrial fibrillation: the DIONYSOS study. J Cardiovasc Electrophysiol 2010; 21:597–605.
- The Cardiac Arrhythmia Suppression Trial (CAST) Investigators. Preliminary report: effect of encainide and flecainide on mortality in a randomized trial of arrhythmia suppression after myocardial infarction. N Engl J Med 1989; 321:406–412.
- Pratt CM. Clinical implications of the Survival With Oral D-sotalol (SWORD) trial: an investigation of patients with left ventricular dysfunction after myocardial infarction. Card Electrophysiol Rev 1998; 2:28–29.
- Touboul P, Brugada J, Capucci A, Crijns HJ, Edvardsson N, Hohnloser SH. Dronedarone for prevention of atrial fibrillation: a dose-ranging study. Eur Heart J 2003; 24:1481–1487.
- Tschuppert Y, Buclin T, Rothuizen LE, et al. Effect of dronedarone on renal function in healthy subjects. Br J Clin Pharmacol 2007; 64:785–791.
KEY POINTS
- Patients with persistent or paroxysmal atrial fibrillation are candidates for dronedarone therapy if they are in sinus rhythm or will be cardioverted soon after starting. This drug is not indicated for the acute management of atrial fibrillation, for example, in the emergency department.
- Dronedarone is an option if a patient cannot tolerate amiodarone or has an underlying condition such as pulmonary or thyroid disease that is a contraindication to amiodarone.
- Dronedarone is contraindicated in patients with significant left ventricular dysfunction or heart failure with recent decompensation.
- The ultimate role for dronedarone is yet to be defined. Little evidence exists as to whether it will succeed when other drugs have failed.
MAO inhibitors: Risks, benefits, and lore
Monoamine oxidase (MAO) inhibitors were the first drugs for treating depression. Introduced in the 1950s, they were used extensively for the next two decades. Their use declined substantially since then because of their reported side effects, their food and drug interactions, and the introduction of new classes of antidepressants.
This trend may be changing. These drugs can be effective in major depressive disorder, and particularly in major depressive disorder with atypical features and in treatment-resistant depression.
New, selective MAO inhibitors are being developed. Moreover, the selegiline transdermal system (Emsam),1,2 introduced in 2006, offers the potential advantage of eliminating the need for burdensome dietary restrictions and has renewed interest in this group of drugs.
In this article, we discuss the history, pharmacology, safety and tolerability of MAO inhibitors, and we summarize recent MAO inhibitor research. Our goal is to familiarize physicians with this class of drugs, including recent updates regarding their safety profile and liberalized dietary recommendations.
DEPRESSION IS COMMON, DIFFICULT
Depression affects 121 million people worldwide.3 According to a study that compared two surveys of 40,000 people each, the prevalence of major depressive disorder in the United States more than doubled (from 3.3% to 7.0%) from 1992 to 2002.4 Another survey, in 2002 and 2003, revealed the lifetime prevalence of major depressive disorder to be 16.6%.5
Treatments for depression have expanded over the past 20 years, with new classes of drugs such as selective serotonin reuptake inhibitors (SSRIs) and serotonin-norepinephrine reuptake inhibitors (SNRIs). However, depression has remained a difficult condition to treat. In the National Institute of Mental Health’s Sequenced Treatment Alternatives to Relieve Depression (STAR*D) study,6 the remission rate in patients treated with the SSRI citalopram (Celexa) for up to 14 weeks was 28% using one measure and 33% using another. Diversifying and understanding existing and emerging therapeutic options is important to the effective treatment of this disease.
THE RISE AND FALL OF MAO INHIBITORS
The first antidepressant introduced was an MAO inhibitor, iproniazid, followed shortly thereafter by a tricyclic antidepressant, imipramine (Tofranil). When iproniazid, originally an antituberculosis agent, was promoted for its antidepressant properties in the 1950s, very little was known about its side effects. It was later removed from the market because of hepatotoxicity, but several other MAO inhibitors had surfaced for the treatment of depression—eg, phenelzine (Nardil), isocarboxazid (Marplan), and tranylcypromine (Parnate).
Currently, MAO inhibitors are typically reserved for third- or fourth-line treatment. As a result, even psychiatrists have little experience with these agents. In a 1999 survey of the Michigan Psychiatric Association,7 12% of practicing psychiatrists said they had never prescribed an MAO inhibitor, another 27% had not prescribed one in the prior 3 years, and only 2% said they prescribed them frequently. A decade earlier, about 25% had said they prescribed them often.8
The prescription rate of MAO inhibitors has remained low during the past 10 years. In a Canadian population-based study9 conducted among older adults in a large health care database from January 1997 to April 2007, the yearly incidence of MAO inhibitor prescriptions decreased from a rate of 3.1 per 100,000 to 1.4 per 100,000. Drug interactions, side effects, preference for other treatments, and dietary restrictions were the reasons most often cited for not prescribing these drugs.7
The side effects of MAO inhibitors were recognized by the mid-1960s, when more than 40 cases of tyramine-induced hypertensive crisis were reported (particularly with tranylcypromine).10,11 Many of the reported events happened after the patient ate tyramine-rich foods such as aged cheese (hence, “the cheese reaction”—more on this below) or drank draft beer.10,11 The US Food and Drug Administration (FDA) consequently established dietary restrictions for patients taking MAO inhibitors, but people found the guidelines cumbersome and often switched to newer drugs that did not require a restrictive diet, such as tricyclics and, much later (in the 1980s), SSRIs.
MAO HAS TWO SUBTYPES
MAO is a flavin-containing enzyme critical for regulating neurotransmitter levels by catabolizing endogenous monoamines (eg, norepinephrine, serotonin, and dopamine) and exogenous amines (eg, dietary tyramine). It is found throughout the body but is more highly concentrated in the liver, kidneys, intestinal wall, and brain.
MAO has two subtypes, isoenzyme A (MAO-A) and isoenzyme B (MAO-B), which vary in their distribution. MAO-A is found primarily in the intestinal tract, liver, and peripheral adrenergic neurons (adrenal glands, arterial vessels, and sympathetic nerves) and preferentially metabolizes serotonin and norepinephrine. MAO-B is found mostly in the brain and liver. However, both isotypes are found in all of the areas mentioned. Since 80% of intestinal MAO is MAO-A, this isoenzyme is primarily responsible for degradation of tyramine, and thus inhibition of MAO-A is associated with the cheese reaction.10,11
TYPES OF MAO INHIBITORS
MAO inhibitors can be classified on the basis of whether they are nonselective or selective for either MAO-A or MAO-B, and whether their effect is reversible.
Nonselective MAO inhibitors are phenelzine, isocarboxazid, and tranylcypromine.
Selective MAO inhibitors. Selegiline is selective for MAO-B. Clorgyline is selective for MAO-A, but it is not available in the United States.
A reversible MAO inhibitor is moclobemide (not available in the United States).
Do selectivity and reversibility matter?
Classic MAO inhibitors such as tranylcypromine and phenelzine are neither reversible (binding to the enzyme for the extent of its lifetime of 14–28 days) nor selective for the subtypes. These drugs were used extensively several decades ago to treat atypical depression, anxiety, and phobias. The only selective MAO inhibitor now available in the United States is selegiline, which inhibits MAO-B at low doses but loses its selectivity at dosages greater than 20 mg/day.
Experimental studies suggest that inhibition of more than 70% of MAO-A activity is necessary for the antidepressant effect of selegiline.12 At oral doses that selectively inhibit MAO-B (5–10 mg/day), selegiline does not seem to have potent antidepressant activity, although it does show success as an adjunctive treatment for Parkinson disease and does not necessitate any dietary restriction. Only at higher oral doses (20–60 mg/day), at which MAO-B selectivity is lost, is the antidepressant effect seen. But the higher doses necessitate dietary restrictions. Therefore, patients who are taking the oral selective MAO inhibitor selegiline have to follow the same dietary restrictions as patients taking the nonselective ones.
Reversible inhibitors of MAO-A have the distinction of being easily displaced by ingested tyramine in the gut and thus do not cause the cheese reaction. However, the only reversible agent available in the world market is moclobemide. It is not available in the United States, and appears to be less effective than older, nonselective MAO inhibitors.13
SELEGILINE TRANSDERMAL SYSTEM
The selegiline transdermal system (Emsam) is the first FDA-approved transdermal patch for treatment of major depression. Patients who are using Emsam at its lowest effective dose of 6 mg/24 hours do not need to follow the dietary restrictions that are needed for all oral MAO inhibitors.
Pharmacokinetics of the selegiline patch
With the transdermal patch, selegiline is extensively absorbed through the skin. Plasma levels are maintained over a 24-hour period, allowing once-daily application. Patches are available that deliver 6, 9, or 12 mg per 24 hours. Steady-state plasma levels are reached after about 5 days.
The bioavailability of selegiline is about 75% with the transdermal delivery system vs 4.4% after oral administration, the lower number being due to first-pass metabolism.1 About 90% of selegiline is bound to plasma proteins and quickly penetrates the central nervous system.
This drug is metabolized by cytochrome P450 isoenzymes, including CYP2C9, CYP2B6, and CYP3A4. Its metabolites are l-methamphetamine and n-desmethylselegiline.
Clinical research showed that dosage adjustments were not necessary in specific populations studied, including patients with various stages of renal or hepatic failure.1 Clearance of selegiline was independent of dose, age, sex, renal function, body weight, or concomitant medications.1
Advantages of the patch system
Since selegiline delivered via the patch is not absorbed through the gut, it has little effect on gut MAO-A and therefore is unlikely to lead to tyramine-induced hypertensive crisis. Studies of the selegiline patch show that inhibition of more than 80% of gut MAO-A is necessary to impair metabolism of tyramine in the gut.1 Therefore, the 6-mg patch will not significantly impair tyramine degradation in the gut. In phase III testing of the selegiline patch, no hypertensive crises were reported among 2,656 outpatients without dietary restrictions. However, it is still recommended that patients on the 9-mg and 12-mg patches follow a tyramine-free diet.1
Although there are no data available to suggest that higher dosages are more effective, it is recommended that the dose be titrated in 3-mg increments at intervals of at least 2 weeks until the maximum recommended dosage of 12 mg/24 hours is reached.2
Disadvantage of the selegiline patch: Cost
The selegiline patch is expensive: $692.99 for 1 month’s supply at a dose of 6 mg/24 hours and $638.99 for 1 month’s supply at a dose of 9 or 12 mg/24 hours (verified with a national pharmacy chain at the time of this writing). Insurance coverage for the patch varies, and documentation may be required from the physician. Oral MAO inhibitors are much less expensive.
SAFETY, TOLERABILITY OF MAO INHIBITORS
Side effects of oral agents
Orthostatic hypotension, dizziness, drowsiness, insomnia, and nausea are the most frequently reported side effects of oral MAO inhibitors.14,15 These side effects can generally be managed symptomatically by slowing the titration, dividing the doses, changing the time it is taken, or, in the case of orthostatic hypotension, increasing fluid intake.14 Phenelzine has the strongest association with sedation.14
Weight gain, edema, muscle pain, myoclonus, paresthesias, sexual dysfunction, and, rarely, hepatotoxicity are late side effects.15–18 Paresthesias, an infrequent side effect, are often treated with pyridoxine supplementation.15
Transient hypertensive episodes within 2 hours after ingestion of MAO inhibitors, which were independent of dietary or drug interactions, have been reported.19 The hypertensive episodes are usually self-limited but in rare cases result in hypertensive crisis.19–21
Serotonin syndrome has been reported with MAO inhibitor monotherapy in rare cases.22 Serotonin syndrome is characterized by mental status changes, restlessness, myoclonus, hyperreflexia, diaphoresis, or evidence of autonomic hyperactivity.23 The syndrome is potentially fatal and is treated symptomatically by removing the offending drugs and giving intravenous rehydration.23
Side effects of the selegiline patch
The most common adverse events with the selegiline patch include application-site reaction (24% vs 12% with placebo), headache (18% vs 17%), insomnia, diarrhea, dry mouth, and dyspepsia.24,25 Dose-related orthostatic hypotension was reported (occurring in 9.8% vs 6.7% with placebo) and was most likely to occur in elderly patients.25 It is suggested that insomnia may be lessened by removing the patch before bedtime. Also, rotating the patch application sites and prompt topical treatment of irritation may lessen local effects.24
Observe a washout period when switching between serotonergic drugs
Most MAO inhibitors irreversibly inhibit MAO for the life of the enzyme, and thus the physiologic effects of phenelzine, isocarboxazid, and tranylcypromine last for up to 2 to 3 weeks.26 Although the elimination half-life of typical MAO inhibitors is short (1.5–4 hours),27,28 their physiologic effects are long-lasting.14
Switching from a MAO inhibitor to another serotonergic agent. Concomitant use of MAO inhibitors and other serotonergic drugs is associated with the risk of serotonin syndrome. After stopping an MAO inhibitor, a 14-day washout period is recommended before starting another serotonergic agent.29 Patients should continue to be monitored closely after the washout period, as cases of serotonin syndrome have been reported later.30 A 14-day washout period is also recommended when switching between MAO inhibitors, although more rapid switches have been made safely.31
Switching from another serotonergic agent to an oral MAO inhibitor. Similarly, a 14-day washout period (or five half-lives) is necessary after stopping most of the serotonergic agents mentioned above before beginning treatment with an oral MAO inhibitor. Fluoxetine (Prozac) has a longer half-life and therefore requires a longer washout period, ie, 5 weeks.
Switching from another serotonergic agent to the selegiline patch. When switching to the selegiline patch from another serotonergic drug, the washout period is 1 week after stopping most drugs or 5 weeks after stopping fluoxetine. One must wait 2 weeks after stopping the selegiline patch before starting therapy with any of the other serotonergic drugs.
Drugs to avoid due to interactions
Several studies suggested a hazardous combination of nonsubcutaneous sumatriptans (5-HT1B/1D agonists) and MAO-B inhibitors, while subcutaneous sumatriptan migraine-abortive treatment and MAO-B inhibitors appear to be safe.36,37
Also, amphetamines, cough-and-cold preparations, and weight-reducing preparations that contain vasoconstrictors (eg, pseudoephedrine, phenylephrine, phenylpropanolamine, and ephedrine) should be avoided, as the risk of hypertensive crisis increases with these products.
Patients on MAO inhibitors should wear a medical alert bracelet in case they need to undergo emergency surgery and are unable to verbally communicate their drug history. They should be instructed to alert all health care providers about their MAO inhibitor use.14
Beware of worsening depression
Physicians, patients, and family members should be advised to observe for worsening depression or “suicidality” during the course of treatment with MAO inhibitors, as with all antidepressants.
Diet can be more lenient than in the past
The dietary restrictions classically advised for patients taking oral MAO inhibitors were established to prevent hypertensive crises associated with tyramine ingestion. However, some of these restrictions were unsubstantiated,38 and evidence from more recent studies suggests that they are unnecessarily strict39 and may lead to resistance by the physician, the patient, or both to using this potentially beneficial therapy.14 There is also a risk that patients will inadvertently discover that a food that was in the “restricted” list caused them no harm upon ingestion and thus will become cavalier about dietary adherence.39
To prevent dietary noncompliance, physicians should conduct ongoing diet surveys and encourage adherence to evidence-based dietary recommendations.40
The FDA and drug-package inserts for oral MAO inhibitors continue to recommend stringent dietary restrictions, including no aged cheeses or meats, soy sauce, soy beans, soy paste, miso soup, Italian green beans (fava beans), snow peas, broad bean pods, sauerkraut, kimchee, concentrated yeast extracts (Marmite), wine, beer (including alcohol-free beer), and many other foods. However, several studies have measured the tyramine content of food and determined that less than 6 mg per serving is generally safe.39,41 The results of these investigations have led to more lenient dietary guidelines.39
Absolute dietary restrictions include39:
- Aged cheeses and meats
- Banana peels
- Broad bean (fava) pods
- Spoiled meats
- Marmite
- Sauerkraut
- Soybean products
- Draft beers.
Among the many foods determined to be unnecessarily restricted are avocados; bananas; beef or chicken bouillon; chocolate; fresh and mild cheeses, eg, ricotta, cottage cheese, cream cheese, processed cheese slices; fresh meat, poultry, or fish; meat gravy (fresh); monosodium glutamate; peanuts; properly stored pickled or smoked fish (eg, herring); raspberries; and yeast extracts (except Marmite).39
Dietary restrictions should continue for 2 weeks after stopping an MAO inhibitor.
Dietary restrictions for the selegiline patch
Tyramine-containing foods pose less risk with the selegiline patch than with oral MAO inhibitors, and studies42 show that the 6-mg patch does not necessitate dietary restrictions. The accumulating data suggest that the risk of a tyramine-induced event is extremely low with the patch even in doses above 6 mg. But in the meantime, the recommendations for the 9-mg and 12-mg patches remain the same as for the classic oral MAO inhibitors, and tyramine-containing food should be restricted.
EFFICACY OF MAO INHIBITORS IN CLINICAL PRACTICE
Data from numerous studies suggest MAO inhibitors are effective in managing major depressive disorder, and specifically atypical depression,43–48 treatment-resistant major depressive disorder,49,50 and bipolar depression.51,52 Guidelines from the American Psychiatric Association and the British Association for Psychopharmacology suggest that MAO inhibitors be recommended for treatment of major depressive disorder in patients with atypical features and when other antidepressants have failed.53
MAO inhibitors have also been used in the treatment of Parkinson disease, bulimia, anxiety disorders, anorexia nervosa, and body dysmorphic disorder.54
Major depressive disorder
In controlled trials in outpatients with depression who were treated with therapeutic doses of MAO inhibitors, the response rate was 50% to 70%.55 When tranylcypromine was used in severely depressed inpatients, its efficacy was comparable to that of electroconvulsive therapy, imipramine, and amitriptyline.56 Thase et al,57 in a meta-analysis, found that the MAO inhibitors tranylcypromine, phenelzine, and isocarboxazid were equally effective in treating depression.
Atypical depression
Atypical depression is one of the most common subtypes of major depressive disorder. Diagnostic criteria for major depressive disorder with atypical features include mood reactivity and two of the following: weight gain or hyperphagia, hypersomnolence, leaden paralysis, or an enduring pattern of rejection sensitivity.58 An estimated 30% of outpatients with unipolar depression meet these criteria.59
Multiple randomized controlled trials showed that MAO inhibitors were superior to tricyclic antidepressants in treating atypical depression. One study, involving more than 400 patients, determined that atypical depression responded better to phenelzine than to imipramine.43 Another study evaluating 153 critically depressed patients showed significantly greater response with phenelzine than with imipramine or placebo.49 Furthermore, in another double-blind controlled crossover study, 89 mood-reactive, nonmelancholic, chronically depressed outpatients were found to have a striking response to phenelzine after being unresponsive to imipramine.50 Another report48 indicated that in a double-blind, randomized, placebo-controlled trial among 119 patients with atypical depression treated for 6 weeks, the overall response rates were 78% with phenelzine, 50% with imipramine, and 28% with placebo.
A recent meta-analysis of treatment trials in atypical depression revealed a large mean effect size of 0.45 for the superiority of MAO inhibitors over placebo and a medium mean effect size of 0.27 for the superiority of MAO inhibitors over tricyclic antidepressants.60 Additionally, in a randomized, double-blind placebo-controlled trial, patients with comorbid atypical depression and bulimia showed significant improvement in both bulimic and depressive symptoms when given phenelzine vs imipramine or placebo.61
The current data comparing SSRIs and MAO inhibitors in the treatment of atypical depression are limited. The above-mentioned meta-analysis of three such trials (when moclobemide was used in two out of three trials) revealed no significant difference in efficacy.60 However, the authors themselves warned about the limitations of the studies, including low power to detect differences. Parker and Crawford59 compared self-rating of effectiveness of the various previous treatments in patients with depression with and without atypical features using an online survey. The analysis of the responses of 1,934 patients showed no overall difference in treatment response to both drug and non-drug therapies between respondents with and without atypical features, except with SSRIs. The “atypical” group had a significantly lower mean effectiveness score for SSRIs overall, and a lower mean effectiveness rating for two of six SSRIs examined. The authors speculated that even though there was no differential outcome detected in individuals with atypical depression treated with MAO inhibitors, this negative finding may simply have reflected the low prevalence of sample respondents who received MAO inhibitors (which was 4% in the “atypical depression” group of 338).59
Treatment-resistant depression
The ultimate goal in treating major depressive disorder is to achieve complete remission. If complete remission is not achieved, the risk of relapse is high,62,63 as is the risk of more severe future depressive episodes63 and death from any cause.64 Therefore, the ability of clinicians to make appropriate and evidence-based changes in treatment strategy is of high importance.
The use of MAO inhibitors as a third-line or fourth-line choice for treatment-resistant depression is supported by a number of studies.49,50,65–67 MAO inhibitors appear to be especially effective in the subgroup of patients who have treatment-resistant depression with atypical or anergic bipolar features.
Bipolar depression
Anergic bipolar depression is defined as a condition associated with fatigue, psychomotor retardation, and at least one reversed neurovegetative symptom in a patient with bipolar disorder meeting the criteria for a major depressive episode. According to several trials,51,52,68 MAO inhibitors may be more effective than a tricyclic antidepressant in the treatment of anergic bipolar depression. However, more studies are required to determine the role of antidepressants in general and MAO inhibitors in particular in the management of bipolar depression.
Efficacy of the selegiline patch
The efficacy of the selegiline patch in the treatment of depression was examined in four double-blind placebo-controlled studies.69–72 There were three short-term studies (a 6-week study of 177 patients,69 an 8-week study of 265 patients,72 and an 8-week study of 289 patients70) and a fixed-dose 1-year relapse prevention study of 322 patients.71 The inclusion criterion for the short-term studies was diagnosis of a first or a recurrent episode of major depressive disorder in patients with a Hamilton Depression Rating Scale (HDRS) score higher than 20. The HDRS score was used to assess improvement in depressive symptoms. In all studies, patients on active patch had significant improvement in depressive symptoms on the HDRS compared with placebo. In the relapse prevention study,71 patients with major depressive disorder that responded to transdermal selegiline 6 mg within the first 10 weeks were stratified either to continue receiving the selegiline 6-mg patch or to receive placebo. Those continually receiving selegiline experienced a significantly longer time to relapse. At 12 months, the relapse rate was 16.8% with the selegiline patch vs 30.7% with placebo. The patch was reported to be well tolerated, with the most common side effect being application site reaction. The adherence to the treatment was high—84.2% in the active-patch group and 89.6% in the placebo group.71
DO MAO INHIBITORS HAVE A PLACE IN PRIMARY CARE?
MAO inhibitors have secured their place in the history of psychiatry as the first antidepressants. Overall, MAO inhibitors remain underused. However, with the introduction of new and selective MAO inhibitors including the selegiline patch, and with data suggesting efficacy in the management of certain subtypes of depression, we expect that interest in this class of drugs will grow among psychiatrists. Based on the current guidelines for MAO inhibitors to be used as a third- or fourth-line treatment, as well as on research data, it is premature to recommend their more extensive use in a primary care setting. Whether this will change in the future depends on both the research advances and new, safer formulations of MAO inhibitors.
- EMSAM, Selegiline Transdermal System. NDA 21,336/21,708. Psychopharmacologic Drugs Advisory Committee. October 26, 2005. www.fda.gov/ohrms/dockets/AC/05/briefing/2005-4186B2_01_01_Somerset-EMSAM.pdf. Accessed October 28, 2010.
- Patkar AA, Pae CU, Masand PS. Transdermal selegiline: the new generation of monoamine oxidase inhibitors. CNS Spectr 2006; 11:363–375.
- World Health Organization. Depression. www.who.int/mental_health/management/depression/definition/en/. Accessed October 28, 2010.
- Compton WM, Conway KP, Stinson FS, Grant BF. Changes in the prevalence of major depression and comorbid substance use disorders in the United States between 1991–1992 and 2001–2002. Am J Psychiatry 2006; 163:2141–2147.
- Kessler RC, Berglund P, Demler O, Jin R, Merikangas KR, Walters EE. Lifetime prevalence and age-of-onset distributions of DSM-IV disorders in the National Comorbidity Survey Replication. Arch Gen Psychiatry 2005; 62:593–602.
- Trivedi MH, Rush AJ, Wisniewski SR, et al; STAR*D Study Team. Evaluation of outcomes with citalopram for depression using measurement-based care in STAR*D: implications for clinical practice. Am J Psychiatry 2006; 163:28–40.
- Balon R, Mufti R, Arfken CL. A survey of prescribing practices for monoamine oxidase inhibitors. Psychiatr Serv 1999; 50:945–947.
- Clary C, Mandos LA, Schweizer E. Results of a brief survey on the prescribing practices for monoamine oxidase inhibitor antidepressants. J Clin Psychiatry 1990; 51:226–231.
- Shulman KI, Fischer HD, Herrmann N, Huo CY, Anderson GM, Rochon PA. Current prescription patterns and safety profile of irreversible monoamine oxidase inhibitors: a population-based cohort study of older adults. J Clin Psychiatry 2009; 70:1681–1686.
- Horwitz D, Lovenberg W, Engelman K, Sjoerdsma A. Monoamine oxidase inhibitors, tyramine, and cheese. JAMA 1964; 188:1108–1110.
- Asatoor AM, Levi AJ, Milne MD. Tranylcypromine and cheese. Lancet 1963; 2:733–734.
- Gordon MN, Muller CD, Sherman KA, Morgan DG, Azzaro AJ, Wecker L. Oral versus transdermal selegiline: antidepressant-like activity in rats. Pharmacol Biochem Behav 1999; 63:501–506.
- Lotufu-Neto F, Trivedi M, Thase ME. Meta-analysis of the reversible inhibitors of monoamine oxidase type A moclobemide and brofaromine for the treatment of depression. Neuropsychopharmacology 1999; 20:226–247.
- Fiedorowicz JG, Swartz KL. The role of monoamine oxidase inhibitors in current psychiatric practice. J Psychiatr Pract 2004; 10:239–248.
- Evans DL, Davidson J, Raft D. Early and late side effects of phenelzine. J Clin Psychopharmacol 1982; 2:208–210.
- Fava M. Weight gain and antidepressants. J Clin Psychiatry 2000; 61(suppl 11):37–41.
- Rabkin J, Quitkin F, Harrison W, Tricamo E, McGrath P. Adverse reactions to monoamine oxidase inhibitors. Part I. A comparative study. J Clin Psychopharmacol 1984; 4:270–278.
- Gomez-Gil E, Salmeron JM, Mas A. Phenelzine-induced fulminant hepatic failure. Ann Intern Med 1996; 124:692–693.
- Lavin MR, Mendelwitz A, Kronig MH. Spontaneous hypertensive reactions with monoamine oxidase inhibitors. Biol Psychiatry 1993; 34:146–151.
- Fallon B, Foote B, Walsh BT, Roose SP. “Spontaneous” hypertensive episodes with monoamine oxidase inhibitors. J Clin Psychiatry 1988; 49:163–165.
- Linet LS. Mysterious MAOI hypertensive episodes. J Clin Psychiatry 1986; 47:563–565.
- Fisher P. Serotonin syndrome in the elderly after antidepressive monotherapy. J Clin Psychopharmacol 1995; 15:440–442.
- Sternback H. The serotonin syndrome. Am J Psychiatry 1991; 148:705–713.
- Thase M. Novel transdermal delivery formulation of the monoamine oxidase inhibitor selegiline nearing release for treatment of depression. J Clin Psychiatry 2006; 67:671–672.
- Lee KC, Chen JJ. Transdermal selegiline for the treatment of major depressive disorder. Neuropsychiatr Dis Treat 2007; 3:527–537.
- Cooper AJ. Tyramine and irreversible monoamine oxidase inhibitors in clinical practice. Br J Psychiatry Suppl 1989; Oct(6):38–45.
- Mallinger AG, Smith E. Pharmacokinetics of monoamine oxidase inhibitors. Psychopharmacol Bull 1991; 27:493–502.
- Fulton B, Benfield P. Moclobemide. An update of its pharmacological properties and therapeutic use. Drugs 1996; 52:450–474.
- Marangell LB. Switching antidepressants for treatment-resistant major depression. J Clin Psychiatry 2001; 62(suppl 18):12–17.
- Gitlin MJ. Venlafaxine, monoamine oxidase inhibitors, and the serotonin syndrome. J Clin Psychopharmacol 1997; 17:66–67.
- Szuba MP, Hornig-Rohan M, Amsterdam JD. Rapid conversion from one monoamine oxidase inhibitor to another. J Clin Psychiatry 1997; 58:307–310.
- Lorenz RA, Vandenberg AM, Canepa EA. Serotonergic antidepressants and linezolid: a retrospective chart review and presentation of cases. Int J Psychiatry Med 2008; 38:81–90.
- Miller DG, Lovell EO. Antibiotic-induced serotonin syndrome. J Emerg Med 2008, May 1(Epub ahead of print).
- Das PK, Wakentin DI, Hewko R, Forrest DL. Serotonin syndrome after concomitant treatment with linezolid and meperidine. Clin Infect Dis 2008; 46:264–265.
- Packer S, Berman SA. Serotonin syndrome precipitated by the monoamine oxidase inhibitor linezolid. Am J Psychiatry 2007; 164:346–347.
- Diamond S. The use of sumatriptan in patients on monoamine oxidase inhibitors. Neurology 1995; 45:1039–1040.
- Fox AW. Subcutaneous sumatriptan pharmacokinetics: delimiting the monoamine oxidase inhibitor effect. Headache 2010; 50:249–255.
- Folks DG. Monoamine oxidase inhibitors: reappraisal of dietary consideration. J Clin Psychopharmacol 1983; 3:249–252.
- Gardner DM, Shulman KI, Walker SE, Tailor SA. The making of a user friendly MAOI diet. J Clin Psychiatry 1996; 57:99–104.
- Sweet RA, Brown EJ, Heimberg RG, et al. Monoamine oxidase inhibitor dietary restrictions: what are we asking patients to give up? J Clin Psychiatry 1995; 56:196–201.
- Shulman KI, Walker SE. Refining the MAOI diet: tyramine content of pizzas and soy products. J Clin Psychiatry 1999; 60:191–193.
- Azzaro AJ, Vandenberg CM, Blob LF, et al. Tyramine pressor sensitivity during treatment with the selegiline transdermal system 6 mg/24 h in healthy subjects. J Clin Pharmacol 2006; 46:933–944.
- Quitkin FM, Stewart JW, McGrath PJ, et al. Columbia atypical depression. A subgroup of depressives with better response to MAOI than to tricyclic antidepressants or placebo. Br J Psychiatry Suppl 1993; Sep(21):30–34.
- Davidson J, Pelton S. Forms of atypical depression and their response to antidepressant drugs. Psychiatry Res 1986; 17:87–95.
- Liebowitz MR, Quitkin FM, Stewart JW, et al. Antidepressant specificity in atypical depression. Arch Gen Psychiatry 1988; 45:129–137.
- Krishnan KR. Revisiting monoamine oxidase inhibitors. J Clin Psychiatry 2007; 68(suppl 8):35–41.
- Rapaport MH, Thase ME. Translating the evidence on atypical depression into clinical practice. J Clin Psychiatry 2007; 68:e11.
- Liebowitz MR. Depression with anxiety and atypical depression. J Clin Psychiatry 1993; 54(suppl):10–14.
- Stewart JW, McGrath PJ, Quitkin FM, et al. Chronic depression: response to placebo, imipramine, and phenelzine. J Clin Psychopharmacol 1993; 13:391–396.
- McGrath PJ, Stewart JW, Nunes EV, et al. A double-blind crossover trial of imipramine and phenelzine for outpatients with treatment-refractory depression. Am J Psychiatry 1993; 150:118–123.
- Zarate CA, Tohen M, Baraibar G, Kando JC, Mirin J. Prescribing trends of antidepressants in bipolar depression. J Clin Psychiatry 1995; 56:260–264.
- Mallinger AG, Frank E, Thase ME, Barwell MM, Diazgranados N, Luckenbaugh DA, Kupfer DJ. Revisiting the effectiveness of standard antidepressants in bipolar disorder: are monoamine oxidase inhibitors superior? Psychopharmacol Bull 2009; 42:64–74.
- Anderson IM, Nutt DJ, Deakin JF. Evidence-based guidelines for treating depressive disorders with antidepressants: a revision of the 1993 British Association for Psychopharmacology guidelines. British Association for Psychopharmacology. J Psychopharmacol 2000; 14:3–20.
- Liebowitz MR, Hollander E, Schneier F, et al. Reversible and irreversible monoamine oxidase inhibitors in other psychiatric disorders. Acta Psychiatr Scand Suppl 1990; 360:29–34.
- Davidson JR, Giller EL, Zisook S, Overall JE. An efficacy study of isocarboxazid and placebo in depression, and its relationship to depressive nosology. Arch Gen Psychiatry 1988; 45:120–127.
- Razani J, White KL, White J, et al. The safety and efficacy of combined amitriptyline and tranylcypromine antidepressant treatment: a controlled trial. Arch Gen Psychiatry 1983; 40:657–661.
- Thase ME, Triverdi MH, Rush AJ. MAOIs in the contemporary treatment of depression. Neuropsychopharmacology 1995; 12:185–219.
- American Psychiatric Association. Diagnostic and Statistical Manual of Mental Disorders, Fourth Edition, Text Revision. Washington, DC, American Psychiatric Association, 2000.
- Parker G, Crawford J. Atypical depression: retrospective self-reporting of treatment effectiveness. Acta Psychiatr Scand 2009; 120:213–221.
- Henkel V, Mergl R, Algaier AK, Kohnen R, Moller HJ, Hergerl U. Treatment of depression with atypical features: a meta-analytic approach. Psychiatry Res 2006; 141:89–101.
- Rothschild R, Quitkin HM, Quitkin FM, et al. A double-blind placebo-controlled comparison of phenelzine and imipramine in the treatment of bulimia in atypical depressives. Int J Eat Disord 1994; 15:1–9.
- Paykel ES. Achieving gains beyond response. Acta Psychiatr Scand Suppl 2002;12–17.
- Judd LL, Paulus MJ, Schettler PJ, et al. Does incomplete recovery from first life-time major depressive episode herald a chronic course of illness? Am J Psychiatry 2000; 157:1501–1504.
- Murphy JM, Monson RR, Olivier DC, Sobol AM, Leighton AH. Affective disorders and mortality: a general population study. Arch Gen Psychiatry 1987; 44:473–480.
- Thase ME, Frank E, Mallinger AG, Hamer T, Kupfer DJ. Treatment of imipramine-resistant recurrent depression, III: efficacy of monoamine oxidase inhibitors. J Clin Psychiatry 1992; 53:5–11.
- Thase ME, Mallinger AG, McKnight D, Himmelhoch JM. Treatment of imipramine-resistant recurrent depression, IV: a double blind crossover study of tranylcypromine for anergic bipolar depression. Am J Psychiatry 1992; 149:195–198.
- Quitkin FM, McGrath PJ, Stewart JW, et al. Atypical depression, panic attacks, and response to imipramine and phenelzine: a replication. Arch Gen Psychiatry 1990; 47:935–941.
- Himmelhoch JM, Thase ME, Mallinger AG, Houck P. Tranylcypromine versus imipramine in anergic bipolar depression. Am J Psychiatry 1991; 148:910–916.
- Bodkin JA, Amsterdam JD. Transdermal selegiline in major depression: a double-blind, placebo-controlled, parallel-group study in outpatients. Am J Psychiatry 2002; 159:1869–1875.
- Amsterdam JD. A double-blind, placebo-controlled trial of the safety and efficacy of selegiline transdermal system without dietary restrictions in patients with major depressive disorder. J Clin Psychiatry 2003; 64:208–214.
- Amsterdam JD, Bodkin JA. Selegiline transdermal system in the prevention of relapse of major depressive disorder: a 52-week, double-blind, placebo-substitution, parallel-group clinical trial. J Clin Psychopharmacol 2006; 26:579–586.
- Feiger AD, Rickels K, Rynn MA, et al. Selegiline transdermal system for the treatment of major depressive disorder: an 8-week, double-blind, placebo-controlled, flexible-dose titration trial. J Clin Psychiatry 2006; 67:1354–1361.
Monoamine oxidase (MAO) inhibitors were the first drugs for treating depression. Introduced in the 1950s, they were used extensively for the next two decades. Their use declined substantially since then because of their reported side effects, their food and drug interactions, and the introduction of new classes of antidepressants.
This trend may be changing. These drugs can be effective in major depressive disorder, and particularly in major depressive disorder with atypical features and in treatment-resistant depression.
New, selective MAO inhibitors are being developed. Moreover, the selegiline transdermal system (Emsam),1,2 introduced in 2006, offers the potential advantage of eliminating the need for burdensome dietary restrictions and has renewed interest in this group of drugs.
In this article, we discuss the history, pharmacology, safety and tolerability of MAO inhibitors, and we summarize recent MAO inhibitor research. Our goal is to familiarize physicians with this class of drugs, including recent updates regarding their safety profile and liberalized dietary recommendations.
DEPRESSION IS COMMON, DIFFICULT
Depression affects 121 million people worldwide.3 According to a study that compared two surveys of 40,000 people each, the prevalence of major depressive disorder in the United States more than doubled (from 3.3% to 7.0%) from 1992 to 2002.4 Another survey, in 2002 and 2003, revealed the lifetime prevalence of major depressive disorder to be 16.6%.5
Treatments for depression have expanded over the past 20 years, with new classes of drugs such as selective serotonin reuptake inhibitors (SSRIs) and serotonin-norepinephrine reuptake inhibitors (SNRIs). However, depression has remained a difficult condition to treat. In the National Institute of Mental Health’s Sequenced Treatment Alternatives to Relieve Depression (STAR*D) study,6 the remission rate in patients treated with the SSRI citalopram (Celexa) for up to 14 weeks was 28% using one measure and 33% using another. Diversifying and understanding existing and emerging therapeutic options is important to the effective treatment of this disease.
THE RISE AND FALL OF MAO INHIBITORS
The first antidepressant introduced was an MAO inhibitor, iproniazid, followed shortly thereafter by a tricyclic antidepressant, imipramine (Tofranil). When iproniazid, originally an antituberculosis agent, was promoted for its antidepressant properties in the 1950s, very little was known about its side effects. It was later removed from the market because of hepatotoxicity, but several other MAO inhibitors had surfaced for the treatment of depression—eg, phenelzine (Nardil), isocarboxazid (Marplan), and tranylcypromine (Parnate).
Currently, MAO inhibitors are typically reserved for third- or fourth-line treatment. As a result, even psychiatrists have little experience with these agents. In a 1999 survey of the Michigan Psychiatric Association,7 12% of practicing psychiatrists said they had never prescribed an MAO inhibitor, another 27% had not prescribed one in the prior 3 years, and only 2% said they prescribed them frequently. A decade earlier, about 25% had said they prescribed them often.8
The prescription rate of MAO inhibitors has remained low during the past 10 years. In a Canadian population-based study9 conducted among older adults in a large health care database from January 1997 to April 2007, the yearly incidence of MAO inhibitor prescriptions decreased from a rate of 3.1 per 100,000 to 1.4 per 100,000. Drug interactions, side effects, preference for other treatments, and dietary restrictions were the reasons most often cited for not prescribing these drugs.7
The side effects of MAO inhibitors were recognized by the mid-1960s, when more than 40 cases of tyramine-induced hypertensive crisis were reported (particularly with tranylcypromine).10,11 Many of the reported events happened after the patient ate tyramine-rich foods such as aged cheese (hence, “the cheese reaction”—more on this below) or drank draft beer.10,11 The US Food and Drug Administration (FDA) consequently established dietary restrictions for patients taking MAO inhibitors, but people found the guidelines cumbersome and often switched to newer drugs that did not require a restrictive diet, such as tricyclics and, much later (in the 1980s), SSRIs.
MAO HAS TWO SUBTYPES
MAO is a flavin-containing enzyme critical for regulating neurotransmitter levels by catabolizing endogenous monoamines (eg, norepinephrine, serotonin, and dopamine) and exogenous amines (eg, dietary tyramine). It is found throughout the body but is more highly concentrated in the liver, kidneys, intestinal wall, and brain.
MAO has two subtypes, isoenzyme A (MAO-A) and isoenzyme B (MAO-B), which vary in their distribution. MAO-A is found primarily in the intestinal tract, liver, and peripheral adrenergic neurons (adrenal glands, arterial vessels, and sympathetic nerves) and preferentially metabolizes serotonin and norepinephrine. MAO-B is found mostly in the brain and liver. However, both isotypes are found in all of the areas mentioned. Since 80% of intestinal MAO is MAO-A, this isoenzyme is primarily responsible for degradation of tyramine, and thus inhibition of MAO-A is associated with the cheese reaction.10,11
TYPES OF MAO INHIBITORS
MAO inhibitors can be classified on the basis of whether they are nonselective or selective for either MAO-A or MAO-B, and whether their effect is reversible.
Nonselective MAO inhibitors are phenelzine, isocarboxazid, and tranylcypromine.
Selective MAO inhibitors. Selegiline is selective for MAO-B. Clorgyline is selective for MAO-A, but it is not available in the United States.
A reversible MAO inhibitor is moclobemide (not available in the United States).
Do selectivity and reversibility matter?
Classic MAO inhibitors such as tranylcypromine and phenelzine are neither reversible (binding to the enzyme for the extent of its lifetime of 14–28 days) nor selective for the subtypes. These drugs were used extensively several decades ago to treat atypical depression, anxiety, and phobias. The only selective MAO inhibitor now available in the United States is selegiline, which inhibits MAO-B at low doses but loses its selectivity at dosages greater than 20 mg/day.
Experimental studies suggest that inhibition of more than 70% of MAO-A activity is necessary for the antidepressant effect of selegiline.12 At oral doses that selectively inhibit MAO-B (5–10 mg/day), selegiline does not seem to have potent antidepressant activity, although it does show success as an adjunctive treatment for Parkinson disease and does not necessitate any dietary restriction. Only at higher oral doses (20–60 mg/day), at which MAO-B selectivity is lost, is the antidepressant effect seen. But the higher doses necessitate dietary restrictions. Therefore, patients who are taking the oral selective MAO inhibitor selegiline have to follow the same dietary restrictions as patients taking the nonselective ones.
Reversible inhibitors of MAO-A have the distinction of being easily displaced by ingested tyramine in the gut and thus do not cause the cheese reaction. However, the only reversible agent available in the world market is moclobemide. It is not available in the United States, and appears to be less effective than older, nonselective MAO inhibitors.13
SELEGILINE TRANSDERMAL SYSTEM
The selegiline transdermal system (Emsam) is the first FDA-approved transdermal patch for treatment of major depression. Patients who are using Emsam at its lowest effective dose of 6 mg/24 hours do not need to follow the dietary restrictions that are needed for all oral MAO inhibitors.
Pharmacokinetics of the selegiline patch
With the transdermal patch, selegiline is extensively absorbed through the skin. Plasma levels are maintained over a 24-hour period, allowing once-daily application. Patches are available that deliver 6, 9, or 12 mg per 24 hours. Steady-state plasma levels are reached after about 5 days.
The bioavailability of selegiline is about 75% with the transdermal delivery system vs 4.4% after oral administration, the lower number being due to first-pass metabolism.1 About 90% of selegiline is bound to plasma proteins and quickly penetrates the central nervous system.
This drug is metabolized by cytochrome P450 isoenzymes, including CYP2C9, CYP2B6, and CYP3A4. Its metabolites are l-methamphetamine and n-desmethylselegiline.
Clinical research showed that dosage adjustments were not necessary in specific populations studied, including patients with various stages of renal or hepatic failure.1 Clearance of selegiline was independent of dose, age, sex, renal function, body weight, or concomitant medications.1
Advantages of the patch system
Since selegiline delivered via the patch is not absorbed through the gut, it has little effect on gut MAO-A and therefore is unlikely to lead to tyramine-induced hypertensive crisis. Studies of the selegiline patch show that inhibition of more than 80% of gut MAO-A is necessary to impair metabolism of tyramine in the gut.1 Therefore, the 6-mg patch will not significantly impair tyramine degradation in the gut. In phase III testing of the selegiline patch, no hypertensive crises were reported among 2,656 outpatients without dietary restrictions. However, it is still recommended that patients on the 9-mg and 12-mg patches follow a tyramine-free diet.1
Although there are no data available to suggest that higher dosages are more effective, it is recommended that the dose be titrated in 3-mg increments at intervals of at least 2 weeks until the maximum recommended dosage of 12 mg/24 hours is reached.2
Disadvantage of the selegiline patch: Cost
The selegiline patch is expensive: $692.99 for 1 month’s supply at a dose of 6 mg/24 hours and $638.99 for 1 month’s supply at a dose of 9 or 12 mg/24 hours (verified with a national pharmacy chain at the time of this writing). Insurance coverage for the patch varies, and documentation may be required from the physician. Oral MAO inhibitors are much less expensive.
SAFETY, TOLERABILITY OF MAO INHIBITORS
Side effects of oral agents
Orthostatic hypotension, dizziness, drowsiness, insomnia, and nausea are the most frequently reported side effects of oral MAO inhibitors.14,15 These side effects can generally be managed symptomatically by slowing the titration, dividing the doses, changing the time it is taken, or, in the case of orthostatic hypotension, increasing fluid intake.14 Phenelzine has the strongest association with sedation.14
Weight gain, edema, muscle pain, myoclonus, paresthesias, sexual dysfunction, and, rarely, hepatotoxicity are late side effects.15–18 Paresthesias, an infrequent side effect, are often treated with pyridoxine supplementation.15
Transient hypertensive episodes within 2 hours after ingestion of MAO inhibitors, which were independent of dietary or drug interactions, have been reported.19 The hypertensive episodes are usually self-limited but in rare cases result in hypertensive crisis.19–21
Serotonin syndrome has been reported with MAO inhibitor monotherapy in rare cases.22 Serotonin syndrome is characterized by mental status changes, restlessness, myoclonus, hyperreflexia, diaphoresis, or evidence of autonomic hyperactivity.23 The syndrome is potentially fatal and is treated symptomatically by removing the offending drugs and giving intravenous rehydration.23
Side effects of the selegiline patch
The most common adverse events with the selegiline patch include application-site reaction (24% vs 12% with placebo), headache (18% vs 17%), insomnia, diarrhea, dry mouth, and dyspepsia.24,25 Dose-related orthostatic hypotension was reported (occurring in 9.8% vs 6.7% with placebo) and was most likely to occur in elderly patients.25 It is suggested that insomnia may be lessened by removing the patch before bedtime. Also, rotating the patch application sites and prompt topical treatment of irritation may lessen local effects.24
Observe a washout period when switching between serotonergic drugs
Most MAO inhibitors irreversibly inhibit MAO for the life of the enzyme, and thus the physiologic effects of phenelzine, isocarboxazid, and tranylcypromine last for up to 2 to 3 weeks.26 Although the elimination half-life of typical MAO inhibitors is short (1.5–4 hours),27,28 their physiologic effects are long-lasting.14
Switching from a MAO inhibitor to another serotonergic agent. Concomitant use of MAO inhibitors and other serotonergic drugs is associated with the risk of serotonin syndrome. After stopping an MAO inhibitor, a 14-day washout period is recommended before starting another serotonergic agent.29 Patients should continue to be monitored closely after the washout period, as cases of serotonin syndrome have been reported later.30 A 14-day washout period is also recommended when switching between MAO inhibitors, although more rapid switches have been made safely.31
Switching from another serotonergic agent to an oral MAO inhibitor. Similarly, a 14-day washout period (or five half-lives) is necessary after stopping most of the serotonergic agents mentioned above before beginning treatment with an oral MAO inhibitor. Fluoxetine (Prozac) has a longer half-life and therefore requires a longer washout period, ie, 5 weeks.
Switching from another serotonergic agent to the selegiline patch. When switching to the selegiline patch from another serotonergic drug, the washout period is 1 week after stopping most drugs or 5 weeks after stopping fluoxetine. One must wait 2 weeks after stopping the selegiline patch before starting therapy with any of the other serotonergic drugs.
Drugs to avoid due to interactions
Several studies suggested a hazardous combination of nonsubcutaneous sumatriptans (5-HT1B/1D agonists) and MAO-B inhibitors, while subcutaneous sumatriptan migraine-abortive treatment and MAO-B inhibitors appear to be safe.36,37
Also, amphetamines, cough-and-cold preparations, and weight-reducing preparations that contain vasoconstrictors (eg, pseudoephedrine, phenylephrine, phenylpropanolamine, and ephedrine) should be avoided, as the risk of hypertensive crisis increases with these products.
Patients on MAO inhibitors should wear a medical alert bracelet in case they need to undergo emergency surgery and are unable to verbally communicate their drug history. They should be instructed to alert all health care providers about their MAO inhibitor use.14
Beware of worsening depression
Physicians, patients, and family members should be advised to observe for worsening depression or “suicidality” during the course of treatment with MAO inhibitors, as with all antidepressants.
Diet can be more lenient than in the past
The dietary restrictions classically advised for patients taking oral MAO inhibitors were established to prevent hypertensive crises associated with tyramine ingestion. However, some of these restrictions were unsubstantiated,38 and evidence from more recent studies suggests that they are unnecessarily strict39 and may lead to resistance by the physician, the patient, or both to using this potentially beneficial therapy.14 There is also a risk that patients will inadvertently discover that a food that was in the “restricted” list caused them no harm upon ingestion and thus will become cavalier about dietary adherence.39
To prevent dietary noncompliance, physicians should conduct ongoing diet surveys and encourage adherence to evidence-based dietary recommendations.40
The FDA and drug-package inserts for oral MAO inhibitors continue to recommend stringent dietary restrictions, including no aged cheeses or meats, soy sauce, soy beans, soy paste, miso soup, Italian green beans (fava beans), snow peas, broad bean pods, sauerkraut, kimchee, concentrated yeast extracts (Marmite), wine, beer (including alcohol-free beer), and many other foods. However, several studies have measured the tyramine content of food and determined that less than 6 mg per serving is generally safe.39,41 The results of these investigations have led to more lenient dietary guidelines.39
Absolute dietary restrictions include39:
- Aged cheeses and meats
- Banana peels
- Broad bean (fava) pods
- Spoiled meats
- Marmite
- Sauerkraut
- Soybean products
- Draft beers.
Among the many foods determined to be unnecessarily restricted are avocados; bananas; beef or chicken bouillon; chocolate; fresh and mild cheeses, eg, ricotta, cottage cheese, cream cheese, processed cheese slices; fresh meat, poultry, or fish; meat gravy (fresh); monosodium glutamate; peanuts; properly stored pickled or smoked fish (eg, herring); raspberries; and yeast extracts (except Marmite).39
Dietary restrictions should continue for 2 weeks after stopping an MAO inhibitor.
Dietary restrictions for the selegiline patch
Tyramine-containing foods pose less risk with the selegiline patch than with oral MAO inhibitors, and studies42 show that the 6-mg patch does not necessitate dietary restrictions. The accumulating data suggest that the risk of a tyramine-induced event is extremely low with the patch even in doses above 6 mg. But in the meantime, the recommendations for the 9-mg and 12-mg patches remain the same as for the classic oral MAO inhibitors, and tyramine-containing food should be restricted.
EFFICACY OF MAO INHIBITORS IN CLINICAL PRACTICE
Data from numerous studies suggest MAO inhibitors are effective in managing major depressive disorder, and specifically atypical depression,43–48 treatment-resistant major depressive disorder,49,50 and bipolar depression.51,52 Guidelines from the American Psychiatric Association and the British Association for Psychopharmacology suggest that MAO inhibitors be recommended for treatment of major depressive disorder in patients with atypical features and when other antidepressants have failed.53
MAO inhibitors have also been used in the treatment of Parkinson disease, bulimia, anxiety disorders, anorexia nervosa, and body dysmorphic disorder.54
Major depressive disorder
In controlled trials in outpatients with depression who were treated with therapeutic doses of MAO inhibitors, the response rate was 50% to 70%.55 When tranylcypromine was used in severely depressed inpatients, its efficacy was comparable to that of electroconvulsive therapy, imipramine, and amitriptyline.56 Thase et al,57 in a meta-analysis, found that the MAO inhibitors tranylcypromine, phenelzine, and isocarboxazid were equally effective in treating depression.
Atypical depression
Atypical depression is one of the most common subtypes of major depressive disorder. Diagnostic criteria for major depressive disorder with atypical features include mood reactivity and two of the following: weight gain or hyperphagia, hypersomnolence, leaden paralysis, or an enduring pattern of rejection sensitivity.58 An estimated 30% of outpatients with unipolar depression meet these criteria.59
Multiple randomized controlled trials showed that MAO inhibitors were superior to tricyclic antidepressants in treating atypical depression. One study, involving more than 400 patients, determined that atypical depression responded better to phenelzine than to imipramine.43 Another study evaluating 153 critically depressed patients showed significantly greater response with phenelzine than with imipramine or placebo.49 Furthermore, in another double-blind controlled crossover study, 89 mood-reactive, nonmelancholic, chronically depressed outpatients were found to have a striking response to phenelzine after being unresponsive to imipramine.50 Another report48 indicated that in a double-blind, randomized, placebo-controlled trial among 119 patients with atypical depression treated for 6 weeks, the overall response rates were 78% with phenelzine, 50% with imipramine, and 28% with placebo.
A recent meta-analysis of treatment trials in atypical depression revealed a large mean effect size of 0.45 for the superiority of MAO inhibitors over placebo and a medium mean effect size of 0.27 for the superiority of MAO inhibitors over tricyclic antidepressants.60 Additionally, in a randomized, double-blind placebo-controlled trial, patients with comorbid atypical depression and bulimia showed significant improvement in both bulimic and depressive symptoms when given phenelzine vs imipramine or placebo.61
The current data comparing SSRIs and MAO inhibitors in the treatment of atypical depression are limited. The above-mentioned meta-analysis of three such trials (when moclobemide was used in two out of three trials) revealed no significant difference in efficacy.60 However, the authors themselves warned about the limitations of the studies, including low power to detect differences. Parker and Crawford59 compared self-rating of effectiveness of the various previous treatments in patients with depression with and without atypical features using an online survey. The analysis of the responses of 1,934 patients showed no overall difference in treatment response to both drug and non-drug therapies between respondents with and without atypical features, except with SSRIs. The “atypical” group had a significantly lower mean effectiveness score for SSRIs overall, and a lower mean effectiveness rating for two of six SSRIs examined. The authors speculated that even though there was no differential outcome detected in individuals with atypical depression treated with MAO inhibitors, this negative finding may simply have reflected the low prevalence of sample respondents who received MAO inhibitors (which was 4% in the “atypical depression” group of 338).59
Treatment-resistant depression
The ultimate goal in treating major depressive disorder is to achieve complete remission. If complete remission is not achieved, the risk of relapse is high,62,63 as is the risk of more severe future depressive episodes63 and death from any cause.64 Therefore, the ability of clinicians to make appropriate and evidence-based changes in treatment strategy is of high importance.
The use of MAO inhibitors as a third-line or fourth-line choice for treatment-resistant depression is supported by a number of studies.49,50,65–67 MAO inhibitors appear to be especially effective in the subgroup of patients who have treatment-resistant depression with atypical or anergic bipolar features.
Bipolar depression
Anergic bipolar depression is defined as a condition associated with fatigue, psychomotor retardation, and at least one reversed neurovegetative symptom in a patient with bipolar disorder meeting the criteria for a major depressive episode. According to several trials,51,52,68 MAO inhibitors may be more effective than a tricyclic antidepressant in the treatment of anergic bipolar depression. However, more studies are required to determine the role of antidepressants in general and MAO inhibitors in particular in the management of bipolar depression.
Efficacy of the selegiline patch
The efficacy of the selegiline patch in the treatment of depression was examined in four double-blind placebo-controlled studies.69–72 There were three short-term studies (a 6-week study of 177 patients,69 an 8-week study of 265 patients,72 and an 8-week study of 289 patients70) and a fixed-dose 1-year relapse prevention study of 322 patients.71 The inclusion criterion for the short-term studies was diagnosis of a first or a recurrent episode of major depressive disorder in patients with a Hamilton Depression Rating Scale (HDRS) score higher than 20. The HDRS score was used to assess improvement in depressive symptoms. In all studies, patients on active patch had significant improvement in depressive symptoms on the HDRS compared with placebo. In the relapse prevention study,71 patients with major depressive disorder that responded to transdermal selegiline 6 mg within the first 10 weeks were stratified either to continue receiving the selegiline 6-mg patch or to receive placebo. Those continually receiving selegiline experienced a significantly longer time to relapse. At 12 months, the relapse rate was 16.8% with the selegiline patch vs 30.7% with placebo. The patch was reported to be well tolerated, with the most common side effect being application site reaction. The adherence to the treatment was high—84.2% in the active-patch group and 89.6% in the placebo group.71
DO MAO INHIBITORS HAVE A PLACE IN PRIMARY CARE?
MAO inhibitors have secured their place in the history of psychiatry as the first antidepressants. Overall, MAO inhibitors remain underused. However, with the introduction of new and selective MAO inhibitors including the selegiline patch, and with data suggesting efficacy in the management of certain subtypes of depression, we expect that interest in this class of drugs will grow among psychiatrists. Based on the current guidelines for MAO inhibitors to be used as a third- or fourth-line treatment, as well as on research data, it is premature to recommend their more extensive use in a primary care setting. Whether this will change in the future depends on both the research advances and new, safer formulations of MAO inhibitors.
- EMSAM, Selegiline Transdermal System. NDA 21,336/21,708. Psychopharmacologic Drugs Advisory Committee. October 26, 2005. www.fda.gov/ohrms/dockets/AC/05/briefing/2005-4186B2_01_01_Somerset-EMSAM.pdf. Accessed October 28, 2010.
- Patkar AA, Pae CU, Masand PS. Transdermal selegiline: the new generation of monoamine oxidase inhibitors. CNS Spectr 2006; 11:363–375.
- World Health Organization. Depression. www.who.int/mental_health/management/depression/definition/en/. Accessed October 28, 2010.
- Compton WM, Conway KP, Stinson FS, Grant BF. Changes in the prevalence of major depression and comorbid substance use disorders in the United States between 1991–1992 and 2001–2002. Am J Psychiatry 2006; 163:2141–2147.
- Kessler RC, Berglund P, Demler O, Jin R, Merikangas KR, Walters EE. Lifetime prevalence and age-of-onset distributions of DSM-IV disorders in the National Comorbidity Survey Replication. Arch Gen Psychiatry 2005; 62:593–602.
- Trivedi MH, Rush AJ, Wisniewski SR, et al; STAR*D Study Team. Evaluation of outcomes with citalopram for depression using measurement-based care in STAR*D: implications for clinical practice. Am J Psychiatry 2006; 163:28–40.
- Balon R, Mufti R, Arfken CL. A survey of prescribing practices for monoamine oxidase inhibitors. Psychiatr Serv 1999; 50:945–947.
- Clary C, Mandos LA, Schweizer E. Results of a brief survey on the prescribing practices for monoamine oxidase inhibitor antidepressants. J Clin Psychiatry 1990; 51:226–231.
- Shulman KI, Fischer HD, Herrmann N, Huo CY, Anderson GM, Rochon PA. Current prescription patterns and safety profile of irreversible monoamine oxidase inhibitors: a population-based cohort study of older adults. J Clin Psychiatry 2009; 70:1681–1686.
- Horwitz D, Lovenberg W, Engelman K, Sjoerdsma A. Monoamine oxidase inhibitors, tyramine, and cheese. JAMA 1964; 188:1108–1110.
- Asatoor AM, Levi AJ, Milne MD. Tranylcypromine and cheese. Lancet 1963; 2:733–734.
- Gordon MN, Muller CD, Sherman KA, Morgan DG, Azzaro AJ, Wecker L. Oral versus transdermal selegiline: antidepressant-like activity in rats. Pharmacol Biochem Behav 1999; 63:501–506.
- Lotufu-Neto F, Trivedi M, Thase ME. Meta-analysis of the reversible inhibitors of monoamine oxidase type A moclobemide and brofaromine for the treatment of depression. Neuropsychopharmacology 1999; 20:226–247.
- Fiedorowicz JG, Swartz KL. The role of monoamine oxidase inhibitors in current psychiatric practice. J Psychiatr Pract 2004; 10:239–248.
- Evans DL, Davidson J, Raft D. Early and late side effects of phenelzine. J Clin Psychopharmacol 1982; 2:208–210.
- Fava M. Weight gain and antidepressants. J Clin Psychiatry 2000; 61(suppl 11):37–41.
- Rabkin J, Quitkin F, Harrison W, Tricamo E, McGrath P. Adverse reactions to monoamine oxidase inhibitors. Part I. A comparative study. J Clin Psychopharmacol 1984; 4:270–278.
- Gomez-Gil E, Salmeron JM, Mas A. Phenelzine-induced fulminant hepatic failure. Ann Intern Med 1996; 124:692–693.
- Lavin MR, Mendelwitz A, Kronig MH. Spontaneous hypertensive reactions with monoamine oxidase inhibitors. Biol Psychiatry 1993; 34:146–151.
- Fallon B, Foote B, Walsh BT, Roose SP. “Spontaneous” hypertensive episodes with monoamine oxidase inhibitors. J Clin Psychiatry 1988; 49:163–165.
- Linet LS. Mysterious MAOI hypertensive episodes. J Clin Psychiatry 1986; 47:563–565.
- Fisher P. Serotonin syndrome in the elderly after antidepressive monotherapy. J Clin Psychopharmacol 1995; 15:440–442.
- Sternback H. The serotonin syndrome. Am J Psychiatry 1991; 148:705–713.
- Thase M. Novel transdermal delivery formulation of the monoamine oxidase inhibitor selegiline nearing release for treatment of depression. J Clin Psychiatry 2006; 67:671–672.
- Lee KC, Chen JJ. Transdermal selegiline for the treatment of major depressive disorder. Neuropsychiatr Dis Treat 2007; 3:527–537.
- Cooper AJ. Tyramine and irreversible monoamine oxidase inhibitors in clinical practice. Br J Psychiatry Suppl 1989; Oct(6):38–45.
- Mallinger AG, Smith E. Pharmacokinetics of monoamine oxidase inhibitors. Psychopharmacol Bull 1991; 27:493–502.
- Fulton B, Benfield P. Moclobemide. An update of its pharmacological properties and therapeutic use. Drugs 1996; 52:450–474.
- Marangell LB. Switching antidepressants for treatment-resistant major depression. J Clin Psychiatry 2001; 62(suppl 18):12–17.
- Gitlin MJ. Venlafaxine, monoamine oxidase inhibitors, and the serotonin syndrome. J Clin Psychopharmacol 1997; 17:66–67.
- Szuba MP, Hornig-Rohan M, Amsterdam JD. Rapid conversion from one monoamine oxidase inhibitor to another. J Clin Psychiatry 1997; 58:307–310.
- Lorenz RA, Vandenberg AM, Canepa EA. Serotonergic antidepressants and linezolid: a retrospective chart review and presentation of cases. Int J Psychiatry Med 2008; 38:81–90.
- Miller DG, Lovell EO. Antibiotic-induced serotonin syndrome. J Emerg Med 2008, May 1(Epub ahead of print).
- Das PK, Wakentin DI, Hewko R, Forrest DL. Serotonin syndrome after concomitant treatment with linezolid and meperidine. Clin Infect Dis 2008; 46:264–265.
- Packer S, Berman SA. Serotonin syndrome precipitated by the monoamine oxidase inhibitor linezolid. Am J Psychiatry 2007; 164:346–347.
- Diamond S. The use of sumatriptan in patients on monoamine oxidase inhibitors. Neurology 1995; 45:1039–1040.
- Fox AW. Subcutaneous sumatriptan pharmacokinetics: delimiting the monoamine oxidase inhibitor effect. Headache 2010; 50:249–255.
- Folks DG. Monoamine oxidase inhibitors: reappraisal of dietary consideration. J Clin Psychopharmacol 1983; 3:249–252.
- Gardner DM, Shulman KI, Walker SE, Tailor SA. The making of a user friendly MAOI diet. J Clin Psychiatry 1996; 57:99–104.
- Sweet RA, Brown EJ, Heimberg RG, et al. Monoamine oxidase inhibitor dietary restrictions: what are we asking patients to give up? J Clin Psychiatry 1995; 56:196–201.
- Shulman KI, Walker SE. Refining the MAOI diet: tyramine content of pizzas and soy products. J Clin Psychiatry 1999; 60:191–193.
- Azzaro AJ, Vandenberg CM, Blob LF, et al. Tyramine pressor sensitivity during treatment with the selegiline transdermal system 6 mg/24 h in healthy subjects. J Clin Pharmacol 2006; 46:933–944.
- Quitkin FM, Stewart JW, McGrath PJ, et al. Columbia atypical depression. A subgroup of depressives with better response to MAOI than to tricyclic antidepressants or placebo. Br J Psychiatry Suppl 1993; Sep(21):30–34.
- Davidson J, Pelton S. Forms of atypical depression and their response to antidepressant drugs. Psychiatry Res 1986; 17:87–95.
- Liebowitz MR, Quitkin FM, Stewart JW, et al. Antidepressant specificity in atypical depression. Arch Gen Psychiatry 1988; 45:129–137.
- Krishnan KR. Revisiting monoamine oxidase inhibitors. J Clin Psychiatry 2007; 68(suppl 8):35–41.
- Rapaport MH, Thase ME. Translating the evidence on atypical depression into clinical practice. J Clin Psychiatry 2007; 68:e11.
- Liebowitz MR. Depression with anxiety and atypical depression. J Clin Psychiatry 1993; 54(suppl):10–14.
- Stewart JW, McGrath PJ, Quitkin FM, et al. Chronic depression: response to placebo, imipramine, and phenelzine. J Clin Psychopharmacol 1993; 13:391–396.
- McGrath PJ, Stewart JW, Nunes EV, et al. A double-blind crossover trial of imipramine and phenelzine for outpatients with treatment-refractory depression. Am J Psychiatry 1993; 150:118–123.
- Zarate CA, Tohen M, Baraibar G, Kando JC, Mirin J. Prescribing trends of antidepressants in bipolar depression. J Clin Psychiatry 1995; 56:260–264.
- Mallinger AG, Frank E, Thase ME, Barwell MM, Diazgranados N, Luckenbaugh DA, Kupfer DJ. Revisiting the effectiveness of standard antidepressants in bipolar disorder: are monoamine oxidase inhibitors superior? Psychopharmacol Bull 2009; 42:64–74.
- Anderson IM, Nutt DJ, Deakin JF. Evidence-based guidelines for treating depressive disorders with antidepressants: a revision of the 1993 British Association for Psychopharmacology guidelines. British Association for Psychopharmacology. J Psychopharmacol 2000; 14:3–20.
- Liebowitz MR, Hollander E, Schneier F, et al. Reversible and irreversible monoamine oxidase inhibitors in other psychiatric disorders. Acta Psychiatr Scand Suppl 1990; 360:29–34.
- Davidson JR, Giller EL, Zisook S, Overall JE. An efficacy study of isocarboxazid and placebo in depression, and its relationship to depressive nosology. Arch Gen Psychiatry 1988; 45:120–127.
- Razani J, White KL, White J, et al. The safety and efficacy of combined amitriptyline and tranylcypromine antidepressant treatment: a controlled trial. Arch Gen Psychiatry 1983; 40:657–661.
- Thase ME, Triverdi MH, Rush AJ. MAOIs in the contemporary treatment of depression. Neuropsychopharmacology 1995; 12:185–219.
- American Psychiatric Association. Diagnostic and Statistical Manual of Mental Disorders, Fourth Edition, Text Revision. Washington, DC, American Psychiatric Association, 2000.
- Parker G, Crawford J. Atypical depression: retrospective self-reporting of treatment effectiveness. Acta Psychiatr Scand 2009; 120:213–221.
- Henkel V, Mergl R, Algaier AK, Kohnen R, Moller HJ, Hergerl U. Treatment of depression with atypical features: a meta-analytic approach. Psychiatry Res 2006; 141:89–101.
- Rothschild R, Quitkin HM, Quitkin FM, et al. A double-blind placebo-controlled comparison of phenelzine and imipramine in the treatment of bulimia in atypical depressives. Int J Eat Disord 1994; 15:1–9.
- Paykel ES. Achieving gains beyond response. Acta Psychiatr Scand Suppl 2002;12–17.
- Judd LL, Paulus MJ, Schettler PJ, et al. Does incomplete recovery from first life-time major depressive episode herald a chronic course of illness? Am J Psychiatry 2000; 157:1501–1504.
- Murphy JM, Monson RR, Olivier DC, Sobol AM, Leighton AH. Affective disorders and mortality: a general population study. Arch Gen Psychiatry 1987; 44:473–480.
- Thase ME, Frank E, Mallinger AG, Hamer T, Kupfer DJ. Treatment of imipramine-resistant recurrent depression, III: efficacy of monoamine oxidase inhibitors. J Clin Psychiatry 1992; 53:5–11.
- Thase ME, Mallinger AG, McKnight D, Himmelhoch JM. Treatment of imipramine-resistant recurrent depression, IV: a double blind crossover study of tranylcypromine for anergic bipolar depression. Am J Psychiatry 1992; 149:195–198.
- Quitkin FM, McGrath PJ, Stewart JW, et al. Atypical depression, panic attacks, and response to imipramine and phenelzine: a replication. Arch Gen Psychiatry 1990; 47:935–941.
- Himmelhoch JM, Thase ME, Mallinger AG, Houck P. Tranylcypromine versus imipramine in anergic bipolar depression. Am J Psychiatry 1991; 148:910–916.
- Bodkin JA, Amsterdam JD. Transdermal selegiline in major depression: a double-blind, placebo-controlled, parallel-group study in outpatients. Am J Psychiatry 2002; 159:1869–1875.
- Amsterdam JD. A double-blind, placebo-controlled trial of the safety and efficacy of selegiline transdermal system without dietary restrictions in patients with major depressive disorder. J Clin Psychiatry 2003; 64:208–214.
- Amsterdam JD, Bodkin JA. Selegiline transdermal system in the prevention of relapse of major depressive disorder: a 52-week, double-blind, placebo-substitution, parallel-group clinical trial. J Clin Psychopharmacol 2006; 26:579–586.
- Feiger AD, Rickels K, Rynn MA, et al. Selegiline transdermal system for the treatment of major depressive disorder: an 8-week, double-blind, placebo-controlled, flexible-dose titration trial. J Clin Psychiatry 2006; 67:1354–1361.
KEY POINTS
- Data from multiple studies suggest the efficacy of MAO inhibitors in the management of major depressive disorder and, in particular, major depressive disorder with atypical features and in treatment-resistant depression.
- When using oral MAO inhibitors, patients must follow a low-tyramine diet to avoid the “cheese reaction,” ie, tyramine-induced hypertensive crisis. However, recent studies suggest that traditional dietary advice may be unnecessarily restrictive.
- The selegiline transdermal system (Emsam) is the first approved transdermal patch for treatment of major depression. Unlike oral MAO inhibitors, the patch can be used without the dietary restrictions at its lowest effective dose of 6 mg/24 hours. Because of its transdermal delivery, it has the advantage of not inhibiting the metabolism of dietary tyramine by MAO subtype A in the gut, while providing antidepressant effect in the brain. The patch may be a promising alternative to existing strategies for the management of major depressive disorder.
Coenzyme Q10: A therapy for hypertension and statin-induced myalgia?
Coenzyme Q10 supplements have been purported to be effective for treating a variety of disorders,1,2 in particular hypertension and statin-induced myalgia.
Several studies3–7 found that coenzyme Q10 supplementation significantly lowered blood pressure in hypertensive patients. Moreover, some trials have demonstrated that statin therapy reduces serum or muscle levels of coenzyme Q10,8–14 prompting investigations to determine whether coenzyme Q10 deficiency is related to statin-induced muscle pain.15–17
In this review, we discuss the efficacy and safety of coenzyme Q10 supplementation in patients with hypertension and those taking statins, and some of the caveats about using supplements that are not approved by the US Food and Drug Administration (FDA), as well as the bioavailability and quality of available formulations.
WHAT IS COENZYME Q10?
Coenzyme Q10, also known as coenzyme Q, ubidecarenone, and ubiquinone, is found in all human cells, with the highest concentrations in the heart, liver, kidney, and pancreas.1,2 It is a potent antioxidant, a membrane stabilizer, and an integral cofactor in the mitochondrial respiratory chain, helping to generate adenosine triphosphate, the major cellular energy source.1,2,18 It may also regulate genes associated with cell metabolism.19
RATIONALE FOR SUPPLEMENTATION
Coenzyme Q10 supplementation has been used, recommended, or studied in heart failure, hypertension, parkinsonism, mitochondrial encephalomyopathies, and other ailments.
In hypertension
Depending on the class, various antihypertensive drugs can have adverse effects such as depression, cough, and cardiac and renal dysfunction. 20,21 Furthermore, many patients need to take more than one drug to control their blood pressure, increasing their risk of side effects. Some researchers believe coenzyme Q10 supplementation may reduce the need to take multiple antihypertensive drugs.5
Coenzyme Q10 appears to lower blood pressure. The exact mechanism is not known, but one theory is that it reduces peripheral resistance by preserving nitric oxide.21 Nitric oxide relaxes peripheral arteries, lowering blood pressure. In some forms of hypertension, superoxide radicals that inactivate nitric oxide are overproduced; coenzyme Q10, with its antioxidant effects, may prevent the inactivation of nitric oxide by these free radicals. Alternatively, coenzyme Q10 may boost the production of the prostaglandin prostacyclin (PGI2) a potent vasodilator and inhibitor of platelet aggregation, or it may enhance the sensitivity of arterial smooth muscle to PGI2, or both.1,22
In patients taking statins
Hydroxymethylglutaryl coenzyme A reductase inhibitors (statins), first-line agents for lowering cholesterol levels to prevent cardiovascular disease, are some of the most commonly prescribed medications.23,24 However, statin therapy carries a risk of myopathy, which can range from muscle aches to rhabdomyolysis. 23,24
In a clinical advisory,25 the American College of Cardiology, the American Heart Association, and the National Heart, Lung, and Blood Institute recommend that patients on statin therapy who experience muscle soreness, tenderness, or pain with serum creatine kinase levels 3 to 10 times the upper limit of normal should have their creatine kinase level checked weekly. If the level is 3 to 10 times the upper limit of normal, statin therapy may be continued, but if it exceeds 10 times the upper limit, then statins and other potential offending agents (eg, niacin, fibrate) need to be discontinued.
Statins inhibit the synthesis of cholesterol by reducing the production of mevalonate, a precursor of both cholesterol and coenzyme Q10. Since both cholesterol and coenzyme Q10 are produced by the same pathway, it is not surprising that statins have been reported to reduce serum and muscle coenzyme Q10 levels.9–14 However, one study did not report a significant reduction of coenzyme Q10 levels in muscle tissue in patients treated with simvastatin 20 mg for 6 months.26
Nonetheless, researchers have hypothesized that a reduction in coenzyme Q10 levels in muscle tissue causes mitochondrial dysfunction, which could increase the risk of statininduced myopathy,13–17 and some believe that treatment with coenzyme Q10 may reduce myalgic symptoms and allow patients to remain on statin therapy.13,24
Researchers have investigated the potential of coenzyme Q10 supplementation to reduce or prevent statin-induced myopathy.15–17 (More on this below.)
Interestingly, a randomized, placebo-controlled trial27 found that 6 months of daily therapy with simvastatin (Zocor) 20 mg or pravastatin (Pravachol) 40 mg lowered systolic and diastolic blood pressure significantly in patients with no documented history of cardiovascular disease or diabetes. A possible mechanism of statin-induced blood pressure reduction is the up-regulation of endothelial nitric oxide synthetase, a potent vasodilator. Coenzyme Q10 levels were not assessed during this study. Whether coenzyme Q10 supplementation used to treat statin-induced myalgia enhances or inhibits the antihypertensive effects of statins is not yet known.
EVIDENCE OF EFFECTIVENESS IN HYPERTENSION
Rosenfeldt et al28 performed a meta-analysis and found that some trials documented statistically significant reductions in diastolic or systolic blood pressure or both, while others reported negligible effects.3,29 In one small trial,30 blood pressures actually went up in patients taking coenzyme Q10. Coenzyme Q10 dosages and length of therapy varied from study to study in the meta-analysis. Only minor adverse effects such as gastrointestinal upset and headache were reported.
Yamagami et al3 randomly assigned 20 patients with hypertension and a low coenzyme Q10 level to receive 100 mg of coenzyme Q10 or placebo daily for 12 weeks. Patients continued their usual antihypertensive regimen during the study period. Blood pressures, coenzyme Q10 levels, and antihypertensive drugs used were comparable between the study groups.
After 12 weeks of therapy, the mean coenzyme Q10 level in the active-treatment group had more than doubled, from 0.704 to 1.597 μg/mL. This group also experienced a statistically significant drop in systolic blood pressure, from 167 mm Hg at baseline to 148 mm Hg at 12 weeks. In the placebo group, the systolic blood pressure was 168 mm Hg at baseline and 164 mm Hg at 12 weeks; the change was not statistically significant. Diastolic pressure was not significantly lower at 12 weeks than at baseline in either group.
The authors concluded that coenzyme Q10 supplementation brought a mild reduction in high blood pressure in patients who had low coenzyme Q10 serum levels.
Digiesi et al31 randomized 18 patients with essential hypertension to receive either coenzyme Q10 100 mg or placebo daily for 10 weeks. All antihypertensive therapy was discontinued at baseline. After the first 10 weeks, patients went through a 2-week washout period and then were switched to the opposite therapy for an additional 10 weeks. Mean baseline blood pressure values were 167 mm Hg systolic and 103 mm Hg diastolic.
Those taking the supplement had a statistically significant decrease in systolic and diastolic pressures (P < .001). The antihypertensive effect was noted in the 3rd or 4th week of active treatment and persisted for the duration of therapy. The effects dissipated 7 to 10 days after coenzyme Q10 was stopped.
Langsjoen et al5 evaluated the effects of adding coenzyme Q10 to the antihypertensive drug regimen of 109 patients who had a primary diagnosis of essential hypertension in a prospective observational study. Patients with hypertension as a secondary diagnosis and other cardiovascular diseases were excluded. Variable doses of coenzyme Q10 were given, adjusted according to clinical response and to achieve serum levels greater than 2.0 μg/mL. The average dose was 225 mg/day; the mean serum level attained was 3.02 μg/mL.
Over several months, patients taking the supplement had a reduction in mean systolic pressure from 159 mm Hg at baseline to 147 mm Hg (P < .001), and a reduction in mean diastolic pressure from 94 to 85 mm Hg (P < .001). Thirty-seven percent of patients were able to discontinue one antihypertensive drug, 11% discontinued two drugs, and 4% were able to stop taking three drugs. However, 46% remained on the same antihypertensive regimen, and 3% needed an additional drug.
Singh et al6 randomized 64 patients who had coronary artery disease and who had been on antihypertensive drugs for more than 1 year to receive either B-complex vitamins or coenzyme Q10 (hydrosoluble Q-Gel) 60 mg orally once daily for 8 weeks. Five patients were not available for follow-up; therefore, only 59 patients were evaluated. Fifty-five (93%) of the 59 patients were taking only one antihypertensive drug. Initial antihypertensive drug use was similar between study groups and was continued throughout the trial.
After 8 weeks of therapy, the coenzyme Q10 group had significantly lower systolic and diastolic blood pressure than the placebo group (P < .05 for both). There was also a statistically significant decrease in the dosage of antihypertensive drugs in the coenzyme Q10 group but not in the placebo group (P < .05), reflecting coenzyme Q10’s additive antihypertensive effect.
Burke et al7 randomized 41 men and 35 women with isolated systolic hypertension (systolic pressure 150–170 mm Hg, diastolic pressure < 90 mm Hg) to receive a twice-daily dose of 60 mg of emulsified coenzyme Q10 (hydrosoluble Q-Gel) with 150 IU of vitamin E or placebo containing vitamin E alone for 12 weeks. The study also included 5 men and 4 women with normal blood pressure, all of whom received coenzyme Q10. A total of 80 patients completed treatment. The primary goal of the study was to determine the efficacy of coenzyme Q10 in the treatment of isolated systolic hypertension in patients without comorbid conditions. Blood pressures were monitored twice a week during the trial, by the same nurse.
After 12 weeks of treatment, the mean reduction in systolic pressure in hypertensive patients on coenzyme Q10 was 17.8 ± 7.3 mm Hg. There were no significant changes in diastolic pressure in any study group with treatment. Patients with isolated systolic hypertension who were taking coenzyme Q10 had a statistically significant reduction in systolic pressure compared with baseline and placebo (P < .01 for both). Approximately 55% of patients on coenzyme Q10 achieved a reduction in systolic pressure of 4 mm Hg or greater, while 45% did not respond to therapy. The mean plasma coenzyme Q10 level of the treatment group increased from 0.47 ± 0.19 μg/mL to 2.69 ± 0.54 μg/mL after 12 weeks; however, the study did not have the statistical power to demonstrate a relationship between coenzyme Q10 levels and changes in blood pressure. Twenty-seven (34%) of the 80 patients were taking a statin while on coenzyme Q10 therapy.
STUDIES IN STATIN-INDUCED MYOPATHY
Thibault et al32 and Kim et al33 reported that patients taking lovastatin (Mevacor) at dosages as high as 35 mg/kg/day to inhibit tumor growth achieved symptomatic relief of statin-induced musculoskeletal toxicity after coenzyme Q10 supplementation.
Caso et al15 performed a small pilot study in 32 patients to determine if coenzyme Q10 supplementation would improve myalgic symptoms in patients treated with statins. In this double-blind, randomized trial, patients received either coenzyme Q10 100 mg/day or vitamin E 400 IU/day for 30 days. The extent of muscle pain and its interference with daily activities were determined before and after therapy using the Brief Pain Inventory Questionnaire. The statins were atorvastatin (Lipitor) 10 mg or 20 mg, lovastatin 40 mg, pravastatin 40 mg, and simvastatin 10, 20, 40, and 80 mg. Five patients in the coenzyme Q10 group and four patients in the vitamin E group were taking nonsteroidal anti-inflammatory drugs before and during the trial. The intensity of muscle pain and its interference with daily activities were similar between study groups before the start of therapy.
After 30 days of treatment with coenzyme Q10, the pain intensity had decreased significantly from baseline (P < .001). In contrast, no change in pain intensity from baseline was noted in patients receiving vitamin E. The Pain Severity Score was significantly different between study groups, favoring the coenzyme Q10 group (P < .001). Sixteen of 18 patients on coenzyme Q10 reported a reduction in pain, while only 3 of 14 patients on vitamin E reported a similar response. Also, the interference of pain with daily activities significantly improved with coenzyme Q10 (P < .02), whereas vitamin E did not have a significant impact on this.
Young et al17 randomized 44 patients with prior statin-induced myalgia to receive increasing doses of simvastatin (10–40 mg/day) in combination with either coenzyme Q10 (Q-Gel) 200 mg/day or placebo. The primary goal was to determine if coenzyme Q10 supplementation would help improve statin tolerance in patients with a history of statininduced myalgia. Plasma coenzyme Q10 and lipid levels were measured at baseline and at the end of the study. The intensity of myalgia was assessed with a visual analogue scale.
At 12 weeks, the coenzyme Q10 plasma level was significantly higher in the treatment group than in the placebo group (P < .001). However, no differences were noted between groups in the number of patients who tolerated the 40-mg/day simvastatin dose (P = .34) or in the number of patients who remained on any simvastatin dose (P = .47). Additionally, myalgia scores did not differ between groups (P = .63). The authors acknowledged that there were only small increases in the myalgia pain scores reported in either group. Therefore, patients in the treatment group may not have experienced sufficiently severe muscle pain to have benefited from coenzyme Q10 supplementation.
IS COENZYME Q10 SAFE?
Studies have indicated that these supplements are well tolerated, with relatively few adverse effects or potential drug interactions.1,2,34
The FDA does not routinely assess the purity or quality of over-the-counter coenzyme Q10 products.35 However, the United States Pharmacopeia (USP) does test dietary supplements to make sure that they are not mislabeled and that they do not contain contaminants. 36
A USP-verified dietary supplement should:
- Contain the exact ingredients listed on the label in the listed potency and amounts
- Not include harmful levels of certain contaminants such as lead, mercury, pesticides, or bacteria
- Appropriately disintegrate and release its contents into the body within a specified period of time
- Be produced using the FDA’s current Good Manufacturing Practices.36
Side effects, contraindications, warnings
Coenzyme Q10 is a relatively safe dietary supplement. It is contraindicated in patients who are allergic to it or to any of its components.2 Most clinical trials have not reported significant adverse effects that necessitated stopping therapy.34 However, gastrointestinal effects such as abdominal discomfort, nausea, vomiting, diarrhea, and anorexia have occurred.1,2,34 Allergic rash and headache have also been reported.1,2,34 In addition, coenzyme Q10’s antiplatelet effect may increase the risk of bleeding. 37,38 It undergoes biotransformation in the liver and is eliminated primarily via the biliary tract,39 so it can accumulate in patients with hepatic impairment or biliary obstruction.
Interactions with drugs
Coenzyme Q10’s effects on platelet function may increase the risk of bleeding in patients taking antiplatelet drugs such as aspirin or clopidogrel (Plavix).37,38 On the other hand, since it acts like vitamin K, it may counteract the anticoagulant effects of warfarin (Coumadin). 1,2,40
Coenzyme Q10 may have an additive antihypertensive effect when given with antihypertensive drugs.41
Coenzyme Q10 may improve beta-cell function and enhance insulin sensitivity, which may reduce insulin requirements for diabetic patients.42,43
SLOWLY ABSORBED
Coenzyme Q10 is absorbed slowly from the gastrointestinal tract, possibly because it has a high molecular weight and is not very watersoluble. 39
One pharmacokinetic study found that after a single 100-mg oral dose of coenzyme Q10, the mean peak plasma levels of about 1 μg/mL occurred between 5 and 10 hours (mean 6.5 hours).44 Coenzyme Q10 100 mg given orally three times daily produced a mean steadystate plasma level of 5.4 μg/mL; about 90% of this steady-state concentration was achieved after 4 days.39
Some formulations have significantly better oral bioavailability and therefore produce higher plasma levels. Soft-gel capsules, especially those with vegetable oil or vitamin E, may have better absorption.43
A pharmacokinetic study showed that the area under the curve of the plasma coenzyme Q10 concentration was more than twice as high with Q-Gel soft-gel capsules, a completely solubilized formulation, than with softgel capsules with an oil suspension, powderfilled hard-shell capsules, or regular tablets.45 Another study reported that colloidal-Q10, a formulation contained in VESIsorb (a novel drug delivery system sold as CoQsource) had greater bioavailability than solubilized and oil-based preparations.46 Commercially available solubilized preparations containing ubiquinol, a metabolized form of coenzyme Q10, have been shown to produce higher serum levels than solubilized products.47
Of note: unless the manufacturer claims that its product is water-soluble, the USP does not evaluate its dissolution rate.48 Therefore, USP-verified coenzyme Q10 products that are not water-soluble may have lower bioavailability than their solubilized counterparts.
Dry dosage forms of coenzyme Q10 (eg, tablets, capsules) may be more readily absorbed if taken with a fatty meal.43
SLOWLY ELIMINATED
Taken orally, coenzyme Q10 has a low clearance rate, with an elimination half-life of about 34 hours.39
After absorption, exogenous coenzyme Q10 is taken up by chylomicrons that transport it to the liver, where it is incorporated into verylow-density lipoproteins. It is then distributed to various organs, including the adrenal glands, spleen, kidneys, lungs, and heart. Coenzyme Q10 is eliminated primarily via the biliary tract. About 60% of an oral dose is eliminated in the feces during chronic oral administration.39
TWICE-DAILY DOSING
A typical daily dose of coenzyme Q10 for treating hypertension is 120 to 200 mg, usually given orally in two divided doses.1 For statininduced myopathy, 100 to 200 mg orally daily has been used.1
Coenzyme Q10 is given in divided doses to enhance its absorption and to minimize gastrointestinal effects.1,43 Taking it with a fatty meal may also increase its absorption.43
Since solubilized forms of coenzyme Q10 and ubiquinol have significantly greater bioavailability than nonsolubilized forms, the therapeutic dose of these formulations may be lower.47
MONITORING DURING TREATMENT
Without supplementation, the mean serum level of endogenous coenzyme Q10 has been reported to be 0.99 ± 0.30 mg/L (range 0.55– 1.87).18 Serum levels above 2 μg/mL have been associated with significant reductions in blood pressure.5,7,28
The possible effects of coenzyme Q10 on blood pressure, blood glucose levels, serum creatine kinase levels, and myopathic symptoms should be kept in mind when monitoring patients who have hypertension,41 diabetes,41,42 or statin-induced myalgia.15,17 Coenzyme Q10’s possible potentiating effects on antiplatelet drugs and its inhibitory effect on warfarin should be kept in mind as well.
COST VARIES
Coenzyme Q10 is available in different dosage forms (eg, regular and rapid-release softgel capsules, regular and chewable tablets, chewable wafers, and liquid) from a variety of manufacturers. Products come in different strengths, typically ranging from 30 to 400 mg. USP-verified formulations are listed at www.usp.org/USPVerified/dietarySupplements/under “Verified Supplements.” Only USP-verified products that claim to be water-soluble meet USP dissolution requirements.
The cost varies, depending on the vendor. In general, dosage forms with greater bioavailability, such as Q-Gel and ubiquinol supplements, are more expensive. For example, a regimen of 60 mg twice daily of regular-release coenzyme Q capsules may cost approximately $20 per month, compared with $60 per month for the same supply of Q-Gel Ultra capsules. However, in some cases, supplements that produce higher serum levels may be more cost-effective.
CURRENT ROLE IN THERAPY
As an antihypertensive adjunct
Several small clinical trials have shown that coenzyme Q10 supplementation can lower blood pressure. The supplements were reported to be safe and well tolerated. Moreover, some patients with essential hypertension who were taking coenzyme Q10 were able to discontinue one or more antihypertensive drugs. A significant reduction in blood pressure with use of coenzyme Q10 would be expected to reduce the adverse consequences of hypertension in the same manner as conventional antihypertensive agents.
However, no large, double-blind, randomized study has evaluated the impact of coenzyme Q10 when taken with other antihypertensive drugs (eg, angiotensin-converting enzyme inhibitors, beta-blockers, diuretics) on specific clinical end points such as the incidence of stroke or death from a major cardiac event. Furthermore, its effects on cardiac function, exercise tolerance, and quality of life have not been determined.
The bottom line. In some cases, it seems reasonable to recommend this product as an adjunct to conventional antihypertensive therapy. Larger, well-designed clinical trials of coenzyme Q10’s antihypertensive effects on specific clinical end points such as the risk of stroke or myocardial infarction are needed to define its true therapeutic value.
As a treatment for statin-induced myalgia
Clinical evidence supporting coenzyme Q10’s use in the treatment of statin-induced myopathy is limited. Whether coenzyme Q10 is depleted from muscle tissue during statin therapy has not been confirmed. Supplementation helped reduce the severity of musculoskeletal effects of megadoses of lovastatin. However, clinical trials of coenzyme Q10 in the treatment of myalgia associated with antilipidemic statin doses did not consistently report significant improvement. Nevertheless, coenzyme Q10 has been shown to be relatively safe, with few adverse effects.
The bottom line. In some cases, coenzyme Q could be considered as a possible treatment for statin-induced myalgia, pending large-scale studies to determine if it is truly effective for this purpose.
- Jelin JM, Gregory PJ, et al. Natural medicines comprehensive database/compiled by the editors of Pharmacist’s Letter, Prescriber’s Letter. 11th ed. Stockton, CA: Therapeutic Research Faculty; 2009:452–457.
- Fetrow CW, Avila JR. Professional’s Handbook of Complementary & Alternative Medicines. 2nd ed. Springhouse, PA: Springhouse; 2001:211–215.
- Yamagami T, Takagi M, Akagami H, et al. Effect of coenzyme Q10 on essential hypertension, a double-blind controlled study. In:Folkers K, Yamamura Y, editors. Biomedical and Clinical Aspects of Coenzyme Q10: Proceedings of the Fifth International Symposium on the Biomedical and Clinical Aspects of Coenzyme Q10, vol 5. Amsterdam: Elsevier Science Publishers; 1986:337–343.
- Digiesi V, Cantini F, Oradei A, et al. Coenzyme Q10 in essential hypertension. Mol Aspects Med 1994; 15(suppl):S257–S263.
- Langsjoen P, Langsjoen P, Willis R, Folkers K. Treatment of essential hypertension with coenzyme Q10. Mol Aspects Med 1994; 15(suppl):S265–S272.
- Singh RB, Niaz MA, Rastogi SS, Shukla PK, Thakur AS. Effect of hydrosoluble coenzyme Q10 on blood pressures and insulin resistance in hypertensive patients with coronary artery disease. J Hum Hypertens 1999; 13:203–208.
- Burke BE, Neuenschwander R, Olson RD. Randomized, double-blind, placebo-controlled trial of coenzyme Q10 in isolated systolic hypertension. South Med J 2001; 94:1112–1117.
- De Pinieux G, Chariot P, Ammi-Saïd M, et al. Lipidlowering drugs and mitochondrial function: effects of HMG-CoA reductase inhibitors on serum ubiquinone and blood lactate/pyruvate ratio. Br J Clin Pharmacol 1996; 42:333–337.
- Mortensen SA, Leth A, Agner E, Rohde M. Dose-related decrease of serum coenzyme Q10 during treatment with HMG-CoA reductase inhibitors. Mol Aspects Med 1997; 18(suppl):S137–S144.
- Ghirlanda G, Oradei A, Manto A, et al. Evidence of plasma CoQ10-lowering effect by HMG-CoA reductase inhibitors: a double-blind, placebo-controlled study. J Clin Pharmacol 1993; 33:226–229.
- Folkers K, Langsjoen P, Willis R, et al. Lovastatin decreases coenzyme Q10 levels in humans. Proc Natl Acad Sci U S A 1990; 87:8931–8934.
- Watts GF, Castelluccio C, Rice-Evans C, Taub NA, Baum H, Quinn PJ. Plasma coenzyme Q10 (ubiquinone) concentrations in patients treated with simvastatin. J Clin Pathol 1993; 46:1055–1057.
- Lamperti C, Naini AB, Lucchini V, et al. Muscle coenzyme Q10 level in statin-related myopathy. Arch Neurol 2005; 62:1709–1712.
- Päivä H, Thelen KM, Van Coster R, et al. High-dose statins and skeletal muscle metabolism in humans: a randomized, controlled trial. Clin Pharmacol Ther 2005; 78:60–68.
- Caso G, Kelly P, McNurlan MA, Lawson WE. Effect of coenzyme Q10 on myopathic symptoms in patients treated with statins. Am J Cardiol 2007; 99:1409–1412.
- Marcoff L, Thompson PD. The role of coenzyme Q10 in statin-associated myopathy: a systematic review. J Am Coll Cardiol 2007; 49:2231–2237.
- Young JM, Florkowski CM, Molyneux SL, et al. Effect of coenzyme Q(10) supplementation on simvastatin-induced myalgia. Am J Cardiol 2007; 100:1400–1403.
- Berthold HK, Naini A, Di Mauro S, et al. Effect of ezetimibe and/or simvastatin on coenzyme Q10 levels in plasma: a randomised trial. Drug Saf 2006; 29:703–712.
- Groneberg DA, Kindermann B, Althammer M, et al. Coenzyme Q10 affects expression of genes involved in cell signalling, metabolism and transport in human CaCo-2 cells. Int J Biochem Cell Biol 2005; 37:1208–1218.
- Hadj A, Pepe S, Rosenfeldt F. The clinical application of metabolic therapy for cardiovascular disease. Heart Lung Circ 2007; 16(suppl 3):S56–S64.
- Pepe S, Marasco SF, Haas SJ, Sheeran FL, Krum H, Rosenfeldt FL. Coenzyme Q10 in cardiovascular disease. Mitochondrion 2007; 7(suppl 1):S154–S167.
- Lönnrot K, Pörsti I, Alho H, Wu X, Hervonen A, Tolvanen JP. Control of arterial tone after long-term coenzyme Q10 supplementation in senescent rats. Br J Pharmacol 1998; 124:1500–1506.
- Sewright KA, Clarkson PM, Thompson PD. Statin myopathy: incidence, risk factors, and pathophysiology. Curr Atheroscler Rep 2007; 9:389–396.
- Radcliffe KA, Campbell WW. Statin myopathy. Curr Neurol Neurosci Rep 2008; 8:66–72.
- Pasternak RC, Smith SC, Bairey-Merz CN, Grundy SM, Cleeman JI, Lenfant C. ACC/AHA/NHLBI clinical advisory on the use and safety of statins. Circulation 2002; 106:1024–1028.
- Laaksonen R, Jokelainen K, Laakso J, et al. The effect of simvastatin treatment on natural antioxidants in low-density lipoproteins and high-energy phosphates and ubiquinone in skeletal muscle. Am J Cardiol 1996; 77:851–854.
- Golomb BA, Dimsdale JE, White HL, Ritchie JB, Criqui MH. Reduction in blood pressure with statins: results from the UCSD Statin Study, a randomized trial. Arch Intern Med 2008; 168:721–727.
- Rosenfeldt FL, Haas SJ, Krum H, et al. Coenzyme Q10 in the treatment of hypertension: a meta-analysis of the clinical trials. J Hum Hypertens 2007; 21:297–306.
- Yamagami T, Shibata N, Folkers K. Bioenergetics in clinical medicine. Studies on coenzyme Q10 and essential hypertension. Res Commun Chem Pathol Pharmacol 1975; 11:273–288.
- Yamagami T, Shibata N, Folkers K. Study of coenzyme Q10. In:Folkers K, Yamamura Y, editors. Biomedical and clinical aspects of coenzyme Q10: proceedings of the International Symposium on Coenzyme Q10, held at Lake Yamanaka, Japan, September 16/17, 1976, a Naito Foundation symposium. Amsterdam: Elsevier Scientific Publishing Company; 1977:231–242.
- Digiesi V, Cantini F, Brodbeck B. Effect of coenzyme Q10 on essential arterial hypertension. Curr Ther Res; 1990; 47:841–845.
- Thibault A, Samid D, Tompkins AC, et al. Phase I study of lovastatin, an inhibitor of the mevalonate pathway, in patients with cancer. Clin Cancer Res 1996; 2:483–491.
- Kim WS, Kim MM, Choi HJ, et al. Phase II study of high-dose lova-statin in patients with advanced gastric adenocarcinoma. Invest New Drugs 2001; 19:81–83.
- Hidaka T, Fujii K, Funahashi I, Fukutomi N, Hosoe K. Safety assessment of coenzyme Q10 (CoQ10). Biofactors 2008; 32:199–208.
- US Food and Drug Administration. Consumer Information on Dietary Supplements. Overview of Dietary Supplements. http://www.fda.gov/Food/DietarySupplements/ConsumerInformation/. Accessed May 25, 2010.
- US Pharmacopeia. The USP Dietary Supplement Verification Program http://www.usp.org/USPVerified/dietary-Supplements/. Accessed May 25, 2010.
- Serebruany VL, Ordonez JV, Herzog WR, et al. Dietary coenzyme Q10 supplementation alters platelet size and inhibits human vitronectin (CD51/CD61) receptor expression. J Cardiovasc Pharmacol 1997; 29:16–22.
- A close look at coenzyme Q10 and policosanol. Do these supplements live up to their claims for improving heart health? Harv Heart Lett 2002; 13:6.
- Greenberg S, Frishman WH. Co-enzyme Q10: a new drug for cardiovascular disease. J Clin Pharmacol 1990; 30:596–608.
- Singh U, Devaraj S, Jialal I. Coenzyme Q10 supplementation and heart failure. Nutr Rev 2007; 65:286–293.
- Bonakdar RA, Guarneri E. Coenzyme Q10. Am Fam Physician 2005; 72:1065–1070.
- Hodgson JM, Watts GF, Playford DA, Burke V, Croft KD. Coenzyme Q10 improves blood pressure and glycaemic control: a controlled trial in subjects with type 2 diabetes. Eur J Clin Nutr 2002; 56:1137–1142.
- Pepping J. Coenzyme Q10. Am J Health Syst Pharm 1999; 56:519–521.
- Tomono Y, Hasegawa J, Seki T, Motegi K, Morishita N. Pharmacokinetic study of deuterium-labelled coenzyme Q10 in man. Int J Clin Pharmacol Ther Toxicol 1986; 24:536–541.
- Chopra RK, Goldman R, Sinatra ST, Bhagavan HN. Relative bioavailability of coenzyme Q10 formulations in human subjects. Int J Vitam Nutr Res 1998; 68:109–113.
- Liu ZX, Artmann C. Relative bioavailability comparison of different coenzyme Q10 formulations with a novel delivery system. Altern Ther Health Med 2009; 15:42–46.
- Bhagavan HN, Chopra RK. Plasma coenzyme Q10 response to oral ingestion of coenzyme Q10 formulations. Mitochondrion 2007; 7(suppl 1):S78–S88.
- The United States Pharmacopeia. Ubidecarenone Capsules Monograph. 32nd Revision. Baltimore: United Book Press, 2009:1080.
Coenzyme Q10 supplements have been purported to be effective for treating a variety of disorders,1,2 in particular hypertension and statin-induced myalgia.
Several studies3–7 found that coenzyme Q10 supplementation significantly lowered blood pressure in hypertensive patients. Moreover, some trials have demonstrated that statin therapy reduces serum or muscle levels of coenzyme Q10,8–14 prompting investigations to determine whether coenzyme Q10 deficiency is related to statin-induced muscle pain.15–17
In this review, we discuss the efficacy and safety of coenzyme Q10 supplementation in patients with hypertension and those taking statins, and some of the caveats about using supplements that are not approved by the US Food and Drug Administration (FDA), as well as the bioavailability and quality of available formulations.
WHAT IS COENZYME Q10?
Coenzyme Q10, also known as coenzyme Q, ubidecarenone, and ubiquinone, is found in all human cells, with the highest concentrations in the heart, liver, kidney, and pancreas.1,2 It is a potent antioxidant, a membrane stabilizer, and an integral cofactor in the mitochondrial respiratory chain, helping to generate adenosine triphosphate, the major cellular energy source.1,2,18 It may also regulate genes associated with cell metabolism.19
RATIONALE FOR SUPPLEMENTATION
Coenzyme Q10 supplementation has been used, recommended, or studied in heart failure, hypertension, parkinsonism, mitochondrial encephalomyopathies, and other ailments.
In hypertension
Depending on the class, various antihypertensive drugs can have adverse effects such as depression, cough, and cardiac and renal dysfunction. 20,21 Furthermore, many patients need to take more than one drug to control their blood pressure, increasing their risk of side effects. Some researchers believe coenzyme Q10 supplementation may reduce the need to take multiple antihypertensive drugs.5
Coenzyme Q10 appears to lower blood pressure. The exact mechanism is not known, but one theory is that it reduces peripheral resistance by preserving nitric oxide.21 Nitric oxide relaxes peripheral arteries, lowering blood pressure. In some forms of hypertension, superoxide radicals that inactivate nitric oxide are overproduced; coenzyme Q10, with its antioxidant effects, may prevent the inactivation of nitric oxide by these free radicals. Alternatively, coenzyme Q10 may boost the production of the prostaglandin prostacyclin (PGI2) a potent vasodilator and inhibitor of platelet aggregation, or it may enhance the sensitivity of arterial smooth muscle to PGI2, or both.1,22
In patients taking statins
Hydroxymethylglutaryl coenzyme A reductase inhibitors (statins), first-line agents for lowering cholesterol levels to prevent cardiovascular disease, are some of the most commonly prescribed medications.23,24 However, statin therapy carries a risk of myopathy, which can range from muscle aches to rhabdomyolysis. 23,24
In a clinical advisory,25 the American College of Cardiology, the American Heart Association, and the National Heart, Lung, and Blood Institute recommend that patients on statin therapy who experience muscle soreness, tenderness, or pain with serum creatine kinase levels 3 to 10 times the upper limit of normal should have their creatine kinase level checked weekly. If the level is 3 to 10 times the upper limit of normal, statin therapy may be continued, but if it exceeds 10 times the upper limit, then statins and other potential offending agents (eg, niacin, fibrate) need to be discontinued.
Statins inhibit the synthesis of cholesterol by reducing the production of mevalonate, a precursor of both cholesterol and coenzyme Q10. Since both cholesterol and coenzyme Q10 are produced by the same pathway, it is not surprising that statins have been reported to reduce serum and muscle coenzyme Q10 levels.9–14 However, one study did not report a significant reduction of coenzyme Q10 levels in muscle tissue in patients treated with simvastatin 20 mg for 6 months.26
Nonetheless, researchers have hypothesized that a reduction in coenzyme Q10 levels in muscle tissue causes mitochondrial dysfunction, which could increase the risk of statininduced myopathy,13–17 and some believe that treatment with coenzyme Q10 may reduce myalgic symptoms and allow patients to remain on statin therapy.13,24
Researchers have investigated the potential of coenzyme Q10 supplementation to reduce or prevent statin-induced myopathy.15–17 (More on this below.)
Interestingly, a randomized, placebo-controlled trial27 found that 6 months of daily therapy with simvastatin (Zocor) 20 mg or pravastatin (Pravachol) 40 mg lowered systolic and diastolic blood pressure significantly in patients with no documented history of cardiovascular disease or diabetes. A possible mechanism of statin-induced blood pressure reduction is the up-regulation of endothelial nitric oxide synthetase, a potent vasodilator. Coenzyme Q10 levels were not assessed during this study. Whether coenzyme Q10 supplementation used to treat statin-induced myalgia enhances or inhibits the antihypertensive effects of statins is not yet known.
EVIDENCE OF EFFECTIVENESS IN HYPERTENSION
Rosenfeldt et al28 performed a meta-analysis and found that some trials documented statistically significant reductions in diastolic or systolic blood pressure or both, while others reported negligible effects.3,29 In one small trial,30 blood pressures actually went up in patients taking coenzyme Q10. Coenzyme Q10 dosages and length of therapy varied from study to study in the meta-analysis. Only minor adverse effects such as gastrointestinal upset and headache were reported.
Yamagami et al3 randomly assigned 20 patients with hypertension and a low coenzyme Q10 level to receive 100 mg of coenzyme Q10 or placebo daily for 12 weeks. Patients continued their usual antihypertensive regimen during the study period. Blood pressures, coenzyme Q10 levels, and antihypertensive drugs used were comparable between the study groups.
After 12 weeks of therapy, the mean coenzyme Q10 level in the active-treatment group had more than doubled, from 0.704 to 1.597 μg/mL. This group also experienced a statistically significant drop in systolic blood pressure, from 167 mm Hg at baseline to 148 mm Hg at 12 weeks. In the placebo group, the systolic blood pressure was 168 mm Hg at baseline and 164 mm Hg at 12 weeks; the change was not statistically significant. Diastolic pressure was not significantly lower at 12 weeks than at baseline in either group.
The authors concluded that coenzyme Q10 supplementation brought a mild reduction in high blood pressure in patients who had low coenzyme Q10 serum levels.
Digiesi et al31 randomized 18 patients with essential hypertension to receive either coenzyme Q10 100 mg or placebo daily for 10 weeks. All antihypertensive therapy was discontinued at baseline. After the first 10 weeks, patients went through a 2-week washout period and then were switched to the opposite therapy for an additional 10 weeks. Mean baseline blood pressure values were 167 mm Hg systolic and 103 mm Hg diastolic.
Those taking the supplement had a statistically significant decrease in systolic and diastolic pressures (P < .001). The antihypertensive effect was noted in the 3rd or 4th week of active treatment and persisted for the duration of therapy. The effects dissipated 7 to 10 days after coenzyme Q10 was stopped.
Langsjoen et al5 evaluated the effects of adding coenzyme Q10 to the antihypertensive drug regimen of 109 patients who had a primary diagnosis of essential hypertension in a prospective observational study. Patients with hypertension as a secondary diagnosis and other cardiovascular diseases were excluded. Variable doses of coenzyme Q10 were given, adjusted according to clinical response and to achieve serum levels greater than 2.0 μg/mL. The average dose was 225 mg/day; the mean serum level attained was 3.02 μg/mL.
Over several months, patients taking the supplement had a reduction in mean systolic pressure from 159 mm Hg at baseline to 147 mm Hg (P < .001), and a reduction in mean diastolic pressure from 94 to 85 mm Hg (P < .001). Thirty-seven percent of patients were able to discontinue one antihypertensive drug, 11% discontinued two drugs, and 4% were able to stop taking three drugs. However, 46% remained on the same antihypertensive regimen, and 3% needed an additional drug.
Singh et al6 randomized 64 patients who had coronary artery disease and who had been on antihypertensive drugs for more than 1 year to receive either B-complex vitamins or coenzyme Q10 (hydrosoluble Q-Gel) 60 mg orally once daily for 8 weeks. Five patients were not available for follow-up; therefore, only 59 patients were evaluated. Fifty-five (93%) of the 59 patients were taking only one antihypertensive drug. Initial antihypertensive drug use was similar between study groups and was continued throughout the trial.
After 8 weeks of therapy, the coenzyme Q10 group had significantly lower systolic and diastolic blood pressure than the placebo group (P < .05 for both). There was also a statistically significant decrease in the dosage of antihypertensive drugs in the coenzyme Q10 group but not in the placebo group (P < .05), reflecting coenzyme Q10’s additive antihypertensive effect.
Burke et al7 randomized 41 men and 35 women with isolated systolic hypertension (systolic pressure 150–170 mm Hg, diastolic pressure < 90 mm Hg) to receive a twice-daily dose of 60 mg of emulsified coenzyme Q10 (hydrosoluble Q-Gel) with 150 IU of vitamin E or placebo containing vitamin E alone for 12 weeks. The study also included 5 men and 4 women with normal blood pressure, all of whom received coenzyme Q10. A total of 80 patients completed treatment. The primary goal of the study was to determine the efficacy of coenzyme Q10 in the treatment of isolated systolic hypertension in patients without comorbid conditions. Blood pressures were monitored twice a week during the trial, by the same nurse.
After 12 weeks of treatment, the mean reduction in systolic pressure in hypertensive patients on coenzyme Q10 was 17.8 ± 7.3 mm Hg. There were no significant changes in diastolic pressure in any study group with treatment. Patients with isolated systolic hypertension who were taking coenzyme Q10 had a statistically significant reduction in systolic pressure compared with baseline and placebo (P < .01 for both). Approximately 55% of patients on coenzyme Q10 achieved a reduction in systolic pressure of 4 mm Hg or greater, while 45% did not respond to therapy. The mean plasma coenzyme Q10 level of the treatment group increased from 0.47 ± 0.19 μg/mL to 2.69 ± 0.54 μg/mL after 12 weeks; however, the study did not have the statistical power to demonstrate a relationship between coenzyme Q10 levels and changes in blood pressure. Twenty-seven (34%) of the 80 patients were taking a statin while on coenzyme Q10 therapy.
STUDIES IN STATIN-INDUCED MYOPATHY
Thibault et al32 and Kim et al33 reported that patients taking lovastatin (Mevacor) at dosages as high as 35 mg/kg/day to inhibit tumor growth achieved symptomatic relief of statin-induced musculoskeletal toxicity after coenzyme Q10 supplementation.
Caso et al15 performed a small pilot study in 32 patients to determine if coenzyme Q10 supplementation would improve myalgic symptoms in patients treated with statins. In this double-blind, randomized trial, patients received either coenzyme Q10 100 mg/day or vitamin E 400 IU/day for 30 days. The extent of muscle pain and its interference with daily activities were determined before and after therapy using the Brief Pain Inventory Questionnaire. The statins were atorvastatin (Lipitor) 10 mg or 20 mg, lovastatin 40 mg, pravastatin 40 mg, and simvastatin 10, 20, 40, and 80 mg. Five patients in the coenzyme Q10 group and four patients in the vitamin E group were taking nonsteroidal anti-inflammatory drugs before and during the trial. The intensity of muscle pain and its interference with daily activities were similar between study groups before the start of therapy.
After 30 days of treatment with coenzyme Q10, the pain intensity had decreased significantly from baseline (P < .001). In contrast, no change in pain intensity from baseline was noted in patients receiving vitamin E. The Pain Severity Score was significantly different between study groups, favoring the coenzyme Q10 group (P < .001). Sixteen of 18 patients on coenzyme Q10 reported a reduction in pain, while only 3 of 14 patients on vitamin E reported a similar response. Also, the interference of pain with daily activities significantly improved with coenzyme Q10 (P < .02), whereas vitamin E did not have a significant impact on this.
Young et al17 randomized 44 patients with prior statin-induced myalgia to receive increasing doses of simvastatin (10–40 mg/day) in combination with either coenzyme Q10 (Q-Gel) 200 mg/day or placebo. The primary goal was to determine if coenzyme Q10 supplementation would help improve statin tolerance in patients with a history of statininduced myalgia. Plasma coenzyme Q10 and lipid levels were measured at baseline and at the end of the study. The intensity of myalgia was assessed with a visual analogue scale.
At 12 weeks, the coenzyme Q10 plasma level was significantly higher in the treatment group than in the placebo group (P < .001). However, no differences were noted between groups in the number of patients who tolerated the 40-mg/day simvastatin dose (P = .34) or in the number of patients who remained on any simvastatin dose (P = .47). Additionally, myalgia scores did not differ between groups (P = .63). The authors acknowledged that there were only small increases in the myalgia pain scores reported in either group. Therefore, patients in the treatment group may not have experienced sufficiently severe muscle pain to have benefited from coenzyme Q10 supplementation.
IS COENZYME Q10 SAFE?
Studies have indicated that these supplements are well tolerated, with relatively few adverse effects or potential drug interactions.1,2,34
The FDA does not routinely assess the purity or quality of over-the-counter coenzyme Q10 products.35 However, the United States Pharmacopeia (USP) does test dietary supplements to make sure that they are not mislabeled and that they do not contain contaminants. 36
A USP-verified dietary supplement should:
- Contain the exact ingredients listed on the label in the listed potency and amounts
- Not include harmful levels of certain contaminants such as lead, mercury, pesticides, or bacteria
- Appropriately disintegrate and release its contents into the body within a specified period of time
- Be produced using the FDA’s current Good Manufacturing Practices.36
Side effects, contraindications, warnings
Coenzyme Q10 is a relatively safe dietary supplement. It is contraindicated in patients who are allergic to it or to any of its components.2 Most clinical trials have not reported significant adverse effects that necessitated stopping therapy.34 However, gastrointestinal effects such as abdominal discomfort, nausea, vomiting, diarrhea, and anorexia have occurred.1,2,34 Allergic rash and headache have also been reported.1,2,34 In addition, coenzyme Q10’s antiplatelet effect may increase the risk of bleeding. 37,38 It undergoes biotransformation in the liver and is eliminated primarily via the biliary tract,39 so it can accumulate in patients with hepatic impairment or biliary obstruction.
Interactions with drugs
Coenzyme Q10’s effects on platelet function may increase the risk of bleeding in patients taking antiplatelet drugs such as aspirin or clopidogrel (Plavix).37,38 On the other hand, since it acts like vitamin K, it may counteract the anticoagulant effects of warfarin (Coumadin). 1,2,40
Coenzyme Q10 may have an additive antihypertensive effect when given with antihypertensive drugs.41
Coenzyme Q10 may improve beta-cell function and enhance insulin sensitivity, which may reduce insulin requirements for diabetic patients.42,43
SLOWLY ABSORBED
Coenzyme Q10 is absorbed slowly from the gastrointestinal tract, possibly because it has a high molecular weight and is not very watersoluble. 39
One pharmacokinetic study found that after a single 100-mg oral dose of coenzyme Q10, the mean peak plasma levels of about 1 μg/mL occurred between 5 and 10 hours (mean 6.5 hours).44 Coenzyme Q10 100 mg given orally three times daily produced a mean steadystate plasma level of 5.4 μg/mL; about 90% of this steady-state concentration was achieved after 4 days.39
Some formulations have significantly better oral bioavailability and therefore produce higher plasma levels. Soft-gel capsules, especially those with vegetable oil or vitamin E, may have better absorption.43
A pharmacokinetic study showed that the area under the curve of the plasma coenzyme Q10 concentration was more than twice as high with Q-Gel soft-gel capsules, a completely solubilized formulation, than with softgel capsules with an oil suspension, powderfilled hard-shell capsules, or regular tablets.45 Another study reported that colloidal-Q10, a formulation contained in VESIsorb (a novel drug delivery system sold as CoQsource) had greater bioavailability than solubilized and oil-based preparations.46 Commercially available solubilized preparations containing ubiquinol, a metabolized form of coenzyme Q10, have been shown to produce higher serum levels than solubilized products.47
Of note: unless the manufacturer claims that its product is water-soluble, the USP does not evaluate its dissolution rate.48 Therefore, USP-verified coenzyme Q10 products that are not water-soluble may have lower bioavailability than their solubilized counterparts.
Dry dosage forms of coenzyme Q10 (eg, tablets, capsules) may be more readily absorbed if taken with a fatty meal.43
SLOWLY ELIMINATED
Taken orally, coenzyme Q10 has a low clearance rate, with an elimination half-life of about 34 hours.39
After absorption, exogenous coenzyme Q10 is taken up by chylomicrons that transport it to the liver, where it is incorporated into verylow-density lipoproteins. It is then distributed to various organs, including the adrenal glands, spleen, kidneys, lungs, and heart. Coenzyme Q10 is eliminated primarily via the biliary tract. About 60% of an oral dose is eliminated in the feces during chronic oral administration.39
TWICE-DAILY DOSING
A typical daily dose of coenzyme Q10 for treating hypertension is 120 to 200 mg, usually given orally in two divided doses.1 For statininduced myopathy, 100 to 200 mg orally daily has been used.1
Coenzyme Q10 is given in divided doses to enhance its absorption and to minimize gastrointestinal effects.1,43 Taking it with a fatty meal may also increase its absorption.43
Since solubilized forms of coenzyme Q10 and ubiquinol have significantly greater bioavailability than nonsolubilized forms, the therapeutic dose of these formulations may be lower.47
MONITORING DURING TREATMENT
Without supplementation, the mean serum level of endogenous coenzyme Q10 has been reported to be 0.99 ± 0.30 mg/L (range 0.55– 1.87).18 Serum levels above 2 μg/mL have been associated with significant reductions in blood pressure.5,7,28
The possible effects of coenzyme Q10 on blood pressure, blood glucose levels, serum creatine kinase levels, and myopathic symptoms should be kept in mind when monitoring patients who have hypertension,41 diabetes,41,42 or statin-induced myalgia.15,17 Coenzyme Q10’s possible potentiating effects on antiplatelet drugs and its inhibitory effect on warfarin should be kept in mind as well.
COST VARIES
Coenzyme Q10 is available in different dosage forms (eg, regular and rapid-release softgel capsules, regular and chewable tablets, chewable wafers, and liquid) from a variety of manufacturers. Products come in different strengths, typically ranging from 30 to 400 mg. USP-verified formulations are listed at www.usp.org/USPVerified/dietarySupplements/under “Verified Supplements.” Only USP-verified products that claim to be water-soluble meet USP dissolution requirements.
The cost varies, depending on the vendor. In general, dosage forms with greater bioavailability, such as Q-Gel and ubiquinol supplements, are more expensive. For example, a regimen of 60 mg twice daily of regular-release coenzyme Q capsules may cost approximately $20 per month, compared with $60 per month for the same supply of Q-Gel Ultra capsules. However, in some cases, supplements that produce higher serum levels may be more cost-effective.
CURRENT ROLE IN THERAPY
As an antihypertensive adjunct
Several small clinical trials have shown that coenzyme Q10 supplementation can lower blood pressure. The supplements were reported to be safe and well tolerated. Moreover, some patients with essential hypertension who were taking coenzyme Q10 were able to discontinue one or more antihypertensive drugs. A significant reduction in blood pressure with use of coenzyme Q10 would be expected to reduce the adverse consequences of hypertension in the same manner as conventional antihypertensive agents.
However, no large, double-blind, randomized study has evaluated the impact of coenzyme Q10 when taken with other antihypertensive drugs (eg, angiotensin-converting enzyme inhibitors, beta-blockers, diuretics) on specific clinical end points such as the incidence of stroke or death from a major cardiac event. Furthermore, its effects on cardiac function, exercise tolerance, and quality of life have not been determined.
The bottom line. In some cases, it seems reasonable to recommend this product as an adjunct to conventional antihypertensive therapy. Larger, well-designed clinical trials of coenzyme Q10’s antihypertensive effects on specific clinical end points such as the risk of stroke or myocardial infarction are needed to define its true therapeutic value.
As a treatment for statin-induced myalgia
Clinical evidence supporting coenzyme Q10’s use in the treatment of statin-induced myopathy is limited. Whether coenzyme Q10 is depleted from muscle tissue during statin therapy has not been confirmed. Supplementation helped reduce the severity of musculoskeletal effects of megadoses of lovastatin. However, clinical trials of coenzyme Q10 in the treatment of myalgia associated with antilipidemic statin doses did not consistently report significant improvement. Nevertheless, coenzyme Q10 has been shown to be relatively safe, with few adverse effects.
The bottom line. In some cases, coenzyme Q could be considered as a possible treatment for statin-induced myalgia, pending large-scale studies to determine if it is truly effective for this purpose.
- Jelin JM, Gregory PJ, et al. Natural medicines comprehensive database/compiled by the editors of Pharmacist’s Letter, Prescriber’s Letter. 11th ed. Stockton, CA: Therapeutic Research Faculty; 2009:452–457.
- Fetrow CW, Avila JR. Professional’s Handbook of Complementary & Alternative Medicines. 2nd ed. Springhouse, PA: Springhouse; 2001:211–215.
- Yamagami T, Takagi M, Akagami H, et al. Effect of coenzyme Q10 on essential hypertension, a double-blind controlled study. In:Folkers K, Yamamura Y, editors. Biomedical and Clinical Aspects of Coenzyme Q10: Proceedings of the Fifth International Symposium on the Biomedical and Clinical Aspects of Coenzyme Q10, vol 5. Amsterdam: Elsevier Science Publishers; 1986:337–343.
- Digiesi V, Cantini F, Oradei A, et al. Coenzyme Q10 in essential hypertension. Mol Aspects Med 1994; 15(suppl):S257–S263.
- Langsjoen P, Langsjoen P, Willis R, Folkers K. Treatment of essential hypertension with coenzyme Q10. Mol Aspects Med 1994; 15(suppl):S265–S272.
- Singh RB, Niaz MA, Rastogi SS, Shukla PK, Thakur AS. Effect of hydrosoluble coenzyme Q10 on blood pressures and insulin resistance in hypertensive patients with coronary artery disease. J Hum Hypertens 1999; 13:203–208.
- Burke BE, Neuenschwander R, Olson RD. Randomized, double-blind, placebo-controlled trial of coenzyme Q10 in isolated systolic hypertension. South Med J 2001; 94:1112–1117.
- De Pinieux G, Chariot P, Ammi-Saïd M, et al. Lipidlowering drugs and mitochondrial function: effects of HMG-CoA reductase inhibitors on serum ubiquinone and blood lactate/pyruvate ratio. Br J Clin Pharmacol 1996; 42:333–337.
- Mortensen SA, Leth A, Agner E, Rohde M. Dose-related decrease of serum coenzyme Q10 during treatment with HMG-CoA reductase inhibitors. Mol Aspects Med 1997; 18(suppl):S137–S144.
- Ghirlanda G, Oradei A, Manto A, et al. Evidence of plasma CoQ10-lowering effect by HMG-CoA reductase inhibitors: a double-blind, placebo-controlled study. J Clin Pharmacol 1993; 33:226–229.
- Folkers K, Langsjoen P, Willis R, et al. Lovastatin decreases coenzyme Q10 levels in humans. Proc Natl Acad Sci U S A 1990; 87:8931–8934.
- Watts GF, Castelluccio C, Rice-Evans C, Taub NA, Baum H, Quinn PJ. Plasma coenzyme Q10 (ubiquinone) concentrations in patients treated with simvastatin. J Clin Pathol 1993; 46:1055–1057.
- Lamperti C, Naini AB, Lucchini V, et al. Muscle coenzyme Q10 level in statin-related myopathy. Arch Neurol 2005; 62:1709–1712.
- Päivä H, Thelen KM, Van Coster R, et al. High-dose statins and skeletal muscle metabolism in humans: a randomized, controlled trial. Clin Pharmacol Ther 2005; 78:60–68.
- Caso G, Kelly P, McNurlan MA, Lawson WE. Effect of coenzyme Q10 on myopathic symptoms in patients treated with statins. Am J Cardiol 2007; 99:1409–1412.
- Marcoff L, Thompson PD. The role of coenzyme Q10 in statin-associated myopathy: a systematic review. J Am Coll Cardiol 2007; 49:2231–2237.
- Young JM, Florkowski CM, Molyneux SL, et al. Effect of coenzyme Q(10) supplementation on simvastatin-induced myalgia. Am J Cardiol 2007; 100:1400–1403.
- Berthold HK, Naini A, Di Mauro S, et al. Effect of ezetimibe and/or simvastatin on coenzyme Q10 levels in plasma: a randomised trial. Drug Saf 2006; 29:703–712.
- Groneberg DA, Kindermann B, Althammer M, et al. Coenzyme Q10 affects expression of genes involved in cell signalling, metabolism and transport in human CaCo-2 cells. Int J Biochem Cell Biol 2005; 37:1208–1218.
- Hadj A, Pepe S, Rosenfeldt F. The clinical application of metabolic therapy for cardiovascular disease. Heart Lung Circ 2007; 16(suppl 3):S56–S64.
- Pepe S, Marasco SF, Haas SJ, Sheeran FL, Krum H, Rosenfeldt FL. Coenzyme Q10 in cardiovascular disease. Mitochondrion 2007; 7(suppl 1):S154–S167.
- Lönnrot K, Pörsti I, Alho H, Wu X, Hervonen A, Tolvanen JP. Control of arterial tone after long-term coenzyme Q10 supplementation in senescent rats. Br J Pharmacol 1998; 124:1500–1506.
- Sewright KA, Clarkson PM, Thompson PD. Statin myopathy: incidence, risk factors, and pathophysiology. Curr Atheroscler Rep 2007; 9:389–396.
- Radcliffe KA, Campbell WW. Statin myopathy. Curr Neurol Neurosci Rep 2008; 8:66–72.
- Pasternak RC, Smith SC, Bairey-Merz CN, Grundy SM, Cleeman JI, Lenfant C. ACC/AHA/NHLBI clinical advisory on the use and safety of statins. Circulation 2002; 106:1024–1028.
- Laaksonen R, Jokelainen K, Laakso J, et al. The effect of simvastatin treatment on natural antioxidants in low-density lipoproteins and high-energy phosphates and ubiquinone in skeletal muscle. Am J Cardiol 1996; 77:851–854.
- Golomb BA, Dimsdale JE, White HL, Ritchie JB, Criqui MH. Reduction in blood pressure with statins: results from the UCSD Statin Study, a randomized trial. Arch Intern Med 2008; 168:721–727.
- Rosenfeldt FL, Haas SJ, Krum H, et al. Coenzyme Q10 in the treatment of hypertension: a meta-analysis of the clinical trials. J Hum Hypertens 2007; 21:297–306.
- Yamagami T, Shibata N, Folkers K. Bioenergetics in clinical medicine. Studies on coenzyme Q10 and essential hypertension. Res Commun Chem Pathol Pharmacol 1975; 11:273–288.
- Yamagami T, Shibata N, Folkers K. Study of coenzyme Q10. In:Folkers K, Yamamura Y, editors. Biomedical and clinical aspects of coenzyme Q10: proceedings of the International Symposium on Coenzyme Q10, held at Lake Yamanaka, Japan, September 16/17, 1976, a Naito Foundation symposium. Amsterdam: Elsevier Scientific Publishing Company; 1977:231–242.
- Digiesi V, Cantini F, Brodbeck B. Effect of coenzyme Q10 on essential arterial hypertension. Curr Ther Res; 1990; 47:841–845.
- Thibault A, Samid D, Tompkins AC, et al. Phase I study of lovastatin, an inhibitor of the mevalonate pathway, in patients with cancer. Clin Cancer Res 1996; 2:483–491.
- Kim WS, Kim MM, Choi HJ, et al. Phase II study of high-dose lova-statin in patients with advanced gastric adenocarcinoma. Invest New Drugs 2001; 19:81–83.
- Hidaka T, Fujii K, Funahashi I, Fukutomi N, Hosoe K. Safety assessment of coenzyme Q10 (CoQ10). Biofactors 2008; 32:199–208.
- US Food and Drug Administration. Consumer Information on Dietary Supplements. Overview of Dietary Supplements. http://www.fda.gov/Food/DietarySupplements/ConsumerInformation/. Accessed May 25, 2010.
- US Pharmacopeia. The USP Dietary Supplement Verification Program http://www.usp.org/USPVerified/dietary-Supplements/. Accessed May 25, 2010.
- Serebruany VL, Ordonez JV, Herzog WR, et al. Dietary coenzyme Q10 supplementation alters platelet size and inhibits human vitronectin (CD51/CD61) receptor expression. J Cardiovasc Pharmacol 1997; 29:16–22.
- A close look at coenzyme Q10 and policosanol. Do these supplements live up to their claims for improving heart health? Harv Heart Lett 2002; 13:6.
- Greenberg S, Frishman WH. Co-enzyme Q10: a new drug for cardiovascular disease. J Clin Pharmacol 1990; 30:596–608.
- Singh U, Devaraj S, Jialal I. Coenzyme Q10 supplementation and heart failure. Nutr Rev 2007; 65:286–293.
- Bonakdar RA, Guarneri E. Coenzyme Q10. Am Fam Physician 2005; 72:1065–1070.
- Hodgson JM, Watts GF, Playford DA, Burke V, Croft KD. Coenzyme Q10 improves blood pressure and glycaemic control: a controlled trial in subjects with type 2 diabetes. Eur J Clin Nutr 2002; 56:1137–1142.
- Pepping J. Coenzyme Q10. Am J Health Syst Pharm 1999; 56:519–521.
- Tomono Y, Hasegawa J, Seki T, Motegi K, Morishita N. Pharmacokinetic study of deuterium-labelled coenzyme Q10 in man. Int J Clin Pharmacol Ther Toxicol 1986; 24:536–541.
- Chopra RK, Goldman R, Sinatra ST, Bhagavan HN. Relative bioavailability of coenzyme Q10 formulations in human subjects. Int J Vitam Nutr Res 1998; 68:109–113.
- Liu ZX, Artmann C. Relative bioavailability comparison of different coenzyme Q10 formulations with a novel delivery system. Altern Ther Health Med 2009; 15:42–46.
- Bhagavan HN, Chopra RK. Plasma coenzyme Q10 response to oral ingestion of coenzyme Q10 formulations. Mitochondrion 2007; 7(suppl 1):S78–S88.
- The United States Pharmacopeia. Ubidecarenone Capsules Monograph. 32nd Revision. Baltimore: United Book Press, 2009:1080.
KEY POINTS
- In some clinical trials, coenzyme Q10 supplements significantly lowered diastolic and systolic blood pressure.
- Statins may lower coenzyme Q10 serum levels, and some investigators have evaluated the relationship between coenzyme Q10 deficiency and statin-related myalgia, but more evidence is needed to support the use of coenzyme Q10 supplements to prevent or treat myalgia.
- Coenzyme Q10 supplementation appears to be relatively safe. Most clinical trials have not reported significant side effects that necessitated stopping therapy. Gastrointestinal effects include abdominal discomfort, nausea, vomiting, diarrhea, and anorexia. Allergic rash and headache have also been reported.
Omeprazole and clopidogrel: Should clinicians be worried?
Many clinicians are concerned about a possible interaction between the proton pump inhibitor omeprazole (Prilosec) and the antiplatelet drug clopidogrel (Plavix), which is often given to patients as part of dual antiplatelet therapy after an acute coronary syndrome or a percutaneous coronary intervention. Indeed, the US Food and Drug Administration (FDA) has warned that omeprazole reduces the antiplatelet effect of clopidogrel.
Although we should not take such warnings lightly, we also should not be alarmed. The data on which the FDA warning was based came mostly from laboratory assays of platelet function. Preliminary results from a randomized, controlled clinical trial with hard end points show that, for the time being, we should not change the way we manage patients.
PROTON PUMP INHIBITORS DECREASE GASTROINTESTINAL BLEEDING
Dual antiplatelet therapy with aspirin and clopidogrel decreases the risk of major adverse cardiac events after an acute coronary syndrome or a percutaneous coronary intervention compared with aspirin alone.1 However, it also increases the risk of gastrointestinal bleeding. A recent analysis determined that dual antiplatelet therapy was the most significant risk factor associated with serious or fatal gastrointestinal bleeding in high-risk survivors of myocardial infarction.2
Given the risks of significant morbidity and death in patients on dual antiplatelet therapy who develop gastrointestinal bleeding, an expert consensus panel recommended the use of proton pump inhibitors in patients on dual antiplatelet therapy who have risk factors for gastrointestinal bleeding.3 Accordingly, these drugs are commonly used for gastrointestinal protection in patients requiring dual antiplatelet therapy.
A POSSIBLE CYP450 INTERACTION
Clopidogrel is metabolized from a prodrug to its active metabolite by the cytochrome P450 (CYP450) system. Proton pump inhibitors also are metabolized by the CYP450 system.4 Proton pump inhibitors are thought to diminish the activity of clopidogrel via inhibition of the CYP2C19 isoenzyme. However, the clinical significance of this inhibition is not clear. Different drugs of this class inhibit the CYP450 system to varying degrees.
The potential interaction between proton pump inhibitors and clopidogrel is worrisome for many physicians, since adverse cardiovascular outcomes are more common in patients in whom the antiplatelet response to clopidogrel is impaired.1 This interaction led to the publication of numerous articles, and prompted the FDA to carefully analyze the potential clinical implications.
In several randomized trials, omeprazole diminished the response to clopidogrel (measured via platelet function assays).5,6 It is unclear if this is a class effect, as proton pump inhibitors other than omeprazole have not consistently been shown to have this effect.6,7 Observational studies of the effect of co-administration of a proton pump inhibitor and clopidogrel on cardiovascular outcomes following acute coronary syndromes have had conflicting findings.8–11
THE FDA ISSUES AN ADVISORY
Given the reports of an impaired platelet response to clopidogrel with omeprazole, the FDA asked the manufacturer for data on this potential interaction. The data showed diminished platelet inhibition when clopidogrel was co-administered with omeprazole or when the two were taken 12 hours apart.
On November 17, 2009, the FDA issued a patient advisory and updated the patient safety information on the package insert for clopidogrel about this drug interaction.12 Specifically, the FDA warns that omeprazole reduces the antiplatelet effect of clopidogrel by about 50%. The FDA warning sparked debate in the medical community, as the decision was based in part on ex vivo data.
POST HOC ANALYSES FROM RANDOMIZED CONTROLLED TRIALS
Several post hoc analyses of large randomized clinical trials have studied the potential interaction between proton pump inhibitors and clopidogrel.
In the Clopidogrel for the Reduction of Events During Observation (CREDO) trial, clopidogrel reduced the incidence of death, myocardial infarction, or stroke to a similar extent regardless of baseline use of a proton pump inhibitor.13
In patients undergoing percutaneous coronary intervention, the Prasugrel in Comparison to Clopidogrel for Inhibition of Platelet Activation and Aggregation—Thrombolysis in Myocardial Infarction 44 (PRINCIPLE-TIMI 44) trial found that those taking a proton pump inhibitor had significantly less platelet inhibition with clopidogrel compared with those not on one.14 However, patients taking prasugrel (Effient) and a proton pump inhibitor only had a slight trend towards diminished platelet inhibition.14
The Trial to Assess Improvement in Therapeutic Outcomes by Optimizing Platelet Inhibition With Prasugrel—Thrombolysis in Myocardial Infarction 38 (TRITON-TIMI 38) found that proton pump inhibitors did not influence the long-term outcome of cardiovascular death, myocardial infarction, or stroke for patients on clopidogrel or prasugrel after an acute coronary syndrome.14 A subanalysis did not reveal any differences between omeprazole or other drugs of this class as to an effect on the primary outcome.
Though informative, the results of these post hoc analyses need to be validated with data from randomized clinical trials.
‘COGENT’ TRIAL HALTED EARLY, BUT PRELIMINARY RESULTS AVAILABLE
The Clopidogrel and the Optimization of Gastrointestinal Events (COGENT) trial was the first randomized clinical study of the effect of the interaction between clopidogrel and omeprazole on cardiovascular and gastrointestinal outcomes.15 In a double-blind fashion, patients with acute coronary syndromes or undergoing percutaneous coronary interventions were randomized to receive a fixed-dose combination pill containing either clopidogrel and delayed-release omeprazole or clopidogrel alone. All patients also received aspirin.
Unfortunately, the trial was stopped early because the sponsor declared bankruptcy. However, preliminary results revealed no significant difference in cardiovascular outcomes for patients on clopidogrel and omeprazole compared with clopidogrel alone.15 Furthermore, adverse gastrointestinal events were significantly fewer in patients on clopidogrel and omeprazole.
Thus, omeprazole appears to be safe and may offer gastrointestinal protection to patients on dual antiplatelet therapy, though we need to await publication of the full results.
‘SPICE ’ TRIAL TO EVALUATE POSSIBLE MECHANISMS OF INTERACTION
The Evaluation of the Influence of Statins and Proton Pump Inhibitors on Clopidogrel Antiplatelet Effects (SPICE) trial is a mechanistic study that will evaluate platelet function and genetic polymorphisms in patients on clopidogrel and aspirin after a percutaneous coronary intervention. They will be randomized to statin therapy plus different proton pump inhibitors.16 Prior concerns about an ex vivo interaction between clopidogrel and certain statins were not validated by clinical data.17
OUR RECOMMENDATIONS
Based on the current evidence, patients on aspirin and clopidogrel who have an indication for a proton pump inhibitor or who are at risk of gastrointestinal bleeding can continue or start taking a proton pump inhibitor, including omeprazole.
Switching to another proton pump inhibitor is not currently supported by any randomized clinical trial, nor is changing to a histamine H2-receptor antagonist. The effect of proton pump inhibitors other than omeprazole on clopidogrel is unclear, and it is not known if the interaction with clopidogrel is a class effect or specific to certain drugs of this class.18 On the other hand, we still have no compelling evidence of any major clinical interaction between alternative proton pump inhibitors and clopidogrel.18
Also, separating the dosing times of clopidogrel and omeprazole by 12 hours is not supported by any randomized clinical trial, and runs contrary to at least some ex vivo data.
It is important that all physicians assess the need for a proton pump inhibitor in their patients, as overuse of these drugs has been documented in certain settings.19
Clopidogrel and omeprazole share a common metabolic link via CYP2C19. Omeprazole, along with some other proton pump inhibitors, interacts with clopidogrel at the level of the CYP450 system. Platelet function studies show that platelet inhibition by clopidogrel is impaired, though the astute clinician should be aware of the wide variability associated with platelet function assays and clopidogrel.1,20 However, what may appear to be an interaction at the enzymatic level does not necessarily translate into worse clinical outcomes. Additionally, reliance on nonrandomized studies rather than on randomized clinical trials can be misleading.
- Depta JP, Bhatt DL. Aspirin and platelet adenosine diphosphate receptor antagonists in acute coronary syndromes and percutaneous coronary intervention: role in therapy and strategies to overcome resistance. Am J Cardiovasc Drugs 2008; 8:91–112.
- Moukarbel GV, Signorovitch JE, Pfeffer MA, et al. Gastrointestinal bleeding in high risk survivors of myocardial infarction: the VALIANT trial. Eur Heart J 2009; 30:2226–2232.
- Bhatt DL, Scheiman J, Abraham NS, et al; American College of Cardiology Foundation Task Force on Clinical Expert Consensus Documents. ACCF/ACG/AHA 2008 expert consensus document on reducing the gastrointestinal risks of antiplatelet therapy and NSAID use: a report of the American College of Cardiology Foundation Task Force on Clinical Expert Consensus Documents. J Am Coll Cardiol 2008; 52:1502–1517.
- Li XQ, Andersson TB, Ahlström M, Weidolf L. Comparison of inhibitory effects of the proton pump-inhibiting drugs omeprazole, esomeprazole, lansoprazole, pantoprazole, and rabeprazole on human cytochrome P450 activities. Drug Metab Dispos 2004; 32:821–827.
- Gilard M, Arnaud B, Cornily JC, et al. Influence of omeprazole on the antiplatelet action of clopidogrel associated with aspirin: the randomized, double-blind OCLA (Omeprazole CLopidogrel Aspirin) study. J Am Coll Cardiol 2008; 51:256–260.
- Cuisset T, Frere C, Quilici J, et al. Comparison of omeprazole and pantoprazole influence on a high 150-mg clopidogrel maintenance dose. The PACA (Proton Pump Inhibitors and Clopidogrel Association) prospective randomized study. J Am Coll Cardiol 2009; 54:1149–1153.
- Siller-Matula JM, Spiel AO, Lang IM, Kreiner G, Christ G, Jilma B. Effects of pantoprazole and esomeprazole on platelet inhibition by clopidogrel. Am Heart J 2009; 157:148.e1–148.e5.
- Aubert RE, Epstein RS, Teagarden JR, et al. Proton pump inhibitors effect on clopidogrel effectiveness: the Clopidogrel Medco Outcomes Study [abstract]. Circulation 2008; 118( suppl):S28–10–2008.
- Ho PM, Maddox TM, Wang L, et al. Risk of adverse outcomes associated with concomitant use of clopidogrel and proton pump inhibitors following acute coronary syndrome. JAMA 2009; 301:937–944.
- Juurlink DN, Gomes T, Ko DT, et al. A population-based study of the drug interaction between proton pump inhibitors and clopidogrel. CMAJ 2009; 180:713–718.
- Rassen JA, Choudhry NK, Avorn J, Schneeweiss S. Cardiovascular outcomes and mortality in patients using clopidogrel with proton pump inhibitors after percutaneous coronary intervention or acute coronary syndrome. Circulation 2009; 120:2322–2329.
- US Food and Drug Administration. Public health advisory: updated safety information about a drug interaction between clopidogrel bisulfate (marketed as Plavix) and omeprazole (marketed as Prilosec and Prilosec OTC). www.fda.gov/Drugs/DrugSafety/PublicHealthAdvisories/ucm190825.htm. Accessed 1/6/2010.
- Dunn SP, Macaulay TE, Brennan DM, et al. Baseline proton pump inhibitor use associated with increased cardiovascular events with and without the use of clopidogrel in the CREDO trial. Circulation 2008; 118:S_815. Abstract 3999.
- O‘Donoghue ML, Braunwald E, Antman EM, et al. Pharmacodynamic effect and clinical efficacy of clopidogrel and prasugrel with or without a proton-pump inhibitor: an analysis of two randomised trials. Lancet 2009; 374:989–997.
- Bhatt DL. COGENT: A prospective, randomized, placebo-controlled trial of omeprazole in patients receiving aspirin and clopidogrel. Presented at Transcatheter Cardiovascular Therapeutics; September 24, 2009; San Francisco, Calif.
- National Institutes of Health. Evaluation of the Influence of Statins and Proton Pump Inhibitors on Clopidogrel Antiplatelet Effects (SPICE). http://clinicaltrials.gov/ct2/show/NCT00930670. Accessed 1/6/2010.
- Saw J, Brennan DM, Steinhubl SR, et al. Lack of evidence of clopidogrel-statin interaction in the CHARISMA trial. J Am Coll Cardiol 2007; 50:291–295.
- Laine L, Hennekens C. Proton pump inhibitor and clopidogrel interaction: fact or fiction? Am J Gastroenterol 2009 Nov 10. [Epub ahead of print].
- Forgacs I, Loganayagam A. Overprescribing proton pump inhibitors. BMJ 2008; 336:2–3.
- Serebruany VL, Steinhubl SR, Berger PB, Malinin AI, Bhatt DL, Topol EJ. Variability in platelet responsiveness to clopidogrel among 544 individuals. J Am Coll Cardiol 2005; 45:246–251.
Many clinicians are concerned about a possible interaction between the proton pump inhibitor omeprazole (Prilosec) and the antiplatelet drug clopidogrel (Plavix), which is often given to patients as part of dual antiplatelet therapy after an acute coronary syndrome or a percutaneous coronary intervention. Indeed, the US Food and Drug Administration (FDA) has warned that omeprazole reduces the antiplatelet effect of clopidogrel.
Although we should not take such warnings lightly, we also should not be alarmed. The data on which the FDA warning was based came mostly from laboratory assays of platelet function. Preliminary results from a randomized, controlled clinical trial with hard end points show that, for the time being, we should not change the way we manage patients.
PROTON PUMP INHIBITORS DECREASE GASTROINTESTINAL BLEEDING
Dual antiplatelet therapy with aspirin and clopidogrel decreases the risk of major adverse cardiac events after an acute coronary syndrome or a percutaneous coronary intervention compared with aspirin alone.1 However, it also increases the risk of gastrointestinal bleeding. A recent analysis determined that dual antiplatelet therapy was the most significant risk factor associated with serious or fatal gastrointestinal bleeding in high-risk survivors of myocardial infarction.2
Given the risks of significant morbidity and death in patients on dual antiplatelet therapy who develop gastrointestinal bleeding, an expert consensus panel recommended the use of proton pump inhibitors in patients on dual antiplatelet therapy who have risk factors for gastrointestinal bleeding.3 Accordingly, these drugs are commonly used for gastrointestinal protection in patients requiring dual antiplatelet therapy.
A POSSIBLE CYP450 INTERACTION
Clopidogrel is metabolized from a prodrug to its active metabolite by the cytochrome P450 (CYP450) system. Proton pump inhibitors also are metabolized by the CYP450 system.4 Proton pump inhibitors are thought to diminish the activity of clopidogrel via inhibition of the CYP2C19 isoenzyme. However, the clinical significance of this inhibition is not clear. Different drugs of this class inhibit the CYP450 system to varying degrees.
The potential interaction between proton pump inhibitors and clopidogrel is worrisome for many physicians, since adverse cardiovascular outcomes are more common in patients in whom the antiplatelet response to clopidogrel is impaired.1 This interaction led to the publication of numerous articles, and prompted the FDA to carefully analyze the potential clinical implications.
In several randomized trials, omeprazole diminished the response to clopidogrel (measured via platelet function assays).5,6 It is unclear if this is a class effect, as proton pump inhibitors other than omeprazole have not consistently been shown to have this effect.6,7 Observational studies of the effect of co-administration of a proton pump inhibitor and clopidogrel on cardiovascular outcomes following acute coronary syndromes have had conflicting findings.8–11
THE FDA ISSUES AN ADVISORY
Given the reports of an impaired platelet response to clopidogrel with omeprazole, the FDA asked the manufacturer for data on this potential interaction. The data showed diminished platelet inhibition when clopidogrel was co-administered with omeprazole or when the two were taken 12 hours apart.
On November 17, 2009, the FDA issued a patient advisory and updated the patient safety information on the package insert for clopidogrel about this drug interaction.12 Specifically, the FDA warns that omeprazole reduces the antiplatelet effect of clopidogrel by about 50%. The FDA warning sparked debate in the medical community, as the decision was based in part on ex vivo data.
POST HOC ANALYSES FROM RANDOMIZED CONTROLLED TRIALS
Several post hoc analyses of large randomized clinical trials have studied the potential interaction between proton pump inhibitors and clopidogrel.
In the Clopidogrel for the Reduction of Events During Observation (CREDO) trial, clopidogrel reduced the incidence of death, myocardial infarction, or stroke to a similar extent regardless of baseline use of a proton pump inhibitor.13
In patients undergoing percutaneous coronary intervention, the Prasugrel in Comparison to Clopidogrel for Inhibition of Platelet Activation and Aggregation—Thrombolysis in Myocardial Infarction 44 (PRINCIPLE-TIMI 44) trial found that those taking a proton pump inhibitor had significantly less platelet inhibition with clopidogrel compared with those not on one.14 However, patients taking prasugrel (Effient) and a proton pump inhibitor only had a slight trend towards diminished platelet inhibition.14
The Trial to Assess Improvement in Therapeutic Outcomes by Optimizing Platelet Inhibition With Prasugrel—Thrombolysis in Myocardial Infarction 38 (TRITON-TIMI 38) found that proton pump inhibitors did not influence the long-term outcome of cardiovascular death, myocardial infarction, or stroke for patients on clopidogrel or prasugrel after an acute coronary syndrome.14 A subanalysis did not reveal any differences between omeprazole or other drugs of this class as to an effect on the primary outcome.
Though informative, the results of these post hoc analyses need to be validated with data from randomized clinical trials.
‘COGENT’ TRIAL HALTED EARLY, BUT PRELIMINARY RESULTS AVAILABLE
The Clopidogrel and the Optimization of Gastrointestinal Events (COGENT) trial was the first randomized clinical study of the effect of the interaction between clopidogrel and omeprazole on cardiovascular and gastrointestinal outcomes.15 In a double-blind fashion, patients with acute coronary syndromes or undergoing percutaneous coronary interventions were randomized to receive a fixed-dose combination pill containing either clopidogrel and delayed-release omeprazole or clopidogrel alone. All patients also received aspirin.
Unfortunately, the trial was stopped early because the sponsor declared bankruptcy. However, preliminary results revealed no significant difference in cardiovascular outcomes for patients on clopidogrel and omeprazole compared with clopidogrel alone.15 Furthermore, adverse gastrointestinal events were significantly fewer in patients on clopidogrel and omeprazole.
Thus, omeprazole appears to be safe and may offer gastrointestinal protection to patients on dual antiplatelet therapy, though we need to await publication of the full results.
‘SPICE ’ TRIAL TO EVALUATE POSSIBLE MECHANISMS OF INTERACTION
The Evaluation of the Influence of Statins and Proton Pump Inhibitors on Clopidogrel Antiplatelet Effects (SPICE) trial is a mechanistic study that will evaluate platelet function and genetic polymorphisms in patients on clopidogrel and aspirin after a percutaneous coronary intervention. They will be randomized to statin therapy plus different proton pump inhibitors.16 Prior concerns about an ex vivo interaction between clopidogrel and certain statins were not validated by clinical data.17
OUR RECOMMENDATIONS
Based on the current evidence, patients on aspirin and clopidogrel who have an indication for a proton pump inhibitor or who are at risk of gastrointestinal bleeding can continue or start taking a proton pump inhibitor, including omeprazole.
Switching to another proton pump inhibitor is not currently supported by any randomized clinical trial, nor is changing to a histamine H2-receptor antagonist. The effect of proton pump inhibitors other than omeprazole on clopidogrel is unclear, and it is not known if the interaction with clopidogrel is a class effect or specific to certain drugs of this class.18 On the other hand, we still have no compelling evidence of any major clinical interaction between alternative proton pump inhibitors and clopidogrel.18
Also, separating the dosing times of clopidogrel and omeprazole by 12 hours is not supported by any randomized clinical trial, and runs contrary to at least some ex vivo data.
It is important that all physicians assess the need for a proton pump inhibitor in their patients, as overuse of these drugs has been documented in certain settings.19
Clopidogrel and omeprazole share a common metabolic link via CYP2C19. Omeprazole, along with some other proton pump inhibitors, interacts with clopidogrel at the level of the CYP450 system. Platelet function studies show that platelet inhibition by clopidogrel is impaired, though the astute clinician should be aware of the wide variability associated with platelet function assays and clopidogrel.1,20 However, what may appear to be an interaction at the enzymatic level does not necessarily translate into worse clinical outcomes. Additionally, reliance on nonrandomized studies rather than on randomized clinical trials can be misleading.
- Depta JP, Bhatt DL. Aspirin and platelet adenosine diphosphate receptor antagonists in acute coronary syndromes and percutaneous coronary intervention: role in therapy and strategies to overcome resistance. Am J Cardiovasc Drugs 2008; 8:91–112.
- Moukarbel GV, Signorovitch JE, Pfeffer MA, et al. Gastrointestinal bleeding in high risk survivors of myocardial infarction: the VALIANT trial. Eur Heart J 2009; 30:2226–2232.
- Bhatt DL, Scheiman J, Abraham NS, et al; American College of Cardiology Foundation Task Force on Clinical Expert Consensus Documents. ACCF/ACG/AHA 2008 expert consensus document on reducing the gastrointestinal risks of antiplatelet therapy and NSAID use: a report of the American College of Cardiology Foundation Task Force on Clinical Expert Consensus Documents. J Am Coll Cardiol 2008; 52:1502–1517.
- Li XQ, Andersson TB, Ahlström M, Weidolf L. Comparison of inhibitory effects of the proton pump-inhibiting drugs omeprazole, esomeprazole, lansoprazole, pantoprazole, and rabeprazole on human cytochrome P450 activities. Drug Metab Dispos 2004; 32:821–827.
- Gilard M, Arnaud B, Cornily JC, et al. Influence of omeprazole on the antiplatelet action of clopidogrel associated with aspirin: the randomized, double-blind OCLA (Omeprazole CLopidogrel Aspirin) study. J Am Coll Cardiol 2008; 51:256–260.
- Cuisset T, Frere C, Quilici J, et al. Comparison of omeprazole and pantoprazole influence on a high 150-mg clopidogrel maintenance dose. The PACA (Proton Pump Inhibitors and Clopidogrel Association) prospective randomized study. J Am Coll Cardiol 2009; 54:1149–1153.
- Siller-Matula JM, Spiel AO, Lang IM, Kreiner G, Christ G, Jilma B. Effects of pantoprazole and esomeprazole on platelet inhibition by clopidogrel. Am Heart J 2009; 157:148.e1–148.e5.
- Aubert RE, Epstein RS, Teagarden JR, et al. Proton pump inhibitors effect on clopidogrel effectiveness: the Clopidogrel Medco Outcomes Study [abstract]. Circulation 2008; 118( suppl):S28–10–2008.
- Ho PM, Maddox TM, Wang L, et al. Risk of adverse outcomes associated with concomitant use of clopidogrel and proton pump inhibitors following acute coronary syndrome. JAMA 2009; 301:937–944.
- Juurlink DN, Gomes T, Ko DT, et al. A population-based study of the drug interaction between proton pump inhibitors and clopidogrel. CMAJ 2009; 180:713–718.
- Rassen JA, Choudhry NK, Avorn J, Schneeweiss S. Cardiovascular outcomes and mortality in patients using clopidogrel with proton pump inhibitors after percutaneous coronary intervention or acute coronary syndrome. Circulation 2009; 120:2322–2329.
- US Food and Drug Administration. Public health advisory: updated safety information about a drug interaction between clopidogrel bisulfate (marketed as Plavix) and omeprazole (marketed as Prilosec and Prilosec OTC). www.fda.gov/Drugs/DrugSafety/PublicHealthAdvisories/ucm190825.htm. Accessed 1/6/2010.
- Dunn SP, Macaulay TE, Brennan DM, et al. Baseline proton pump inhibitor use associated with increased cardiovascular events with and without the use of clopidogrel in the CREDO trial. Circulation 2008; 118:S_815. Abstract 3999.
- O‘Donoghue ML, Braunwald E, Antman EM, et al. Pharmacodynamic effect and clinical efficacy of clopidogrel and prasugrel with or without a proton-pump inhibitor: an analysis of two randomised trials. Lancet 2009; 374:989–997.
- Bhatt DL. COGENT: A prospective, randomized, placebo-controlled trial of omeprazole in patients receiving aspirin and clopidogrel. Presented at Transcatheter Cardiovascular Therapeutics; September 24, 2009; San Francisco, Calif.
- National Institutes of Health. Evaluation of the Influence of Statins and Proton Pump Inhibitors on Clopidogrel Antiplatelet Effects (SPICE). http://clinicaltrials.gov/ct2/show/NCT00930670. Accessed 1/6/2010.
- Saw J, Brennan DM, Steinhubl SR, et al. Lack of evidence of clopidogrel-statin interaction in the CHARISMA trial. J Am Coll Cardiol 2007; 50:291–295.
- Laine L, Hennekens C. Proton pump inhibitor and clopidogrel interaction: fact or fiction? Am J Gastroenterol 2009 Nov 10. [Epub ahead of print].
- Forgacs I, Loganayagam A. Overprescribing proton pump inhibitors. BMJ 2008; 336:2–3.
- Serebruany VL, Steinhubl SR, Berger PB, Malinin AI, Bhatt DL, Topol EJ. Variability in platelet responsiveness to clopidogrel among 544 individuals. J Am Coll Cardiol 2005; 45:246–251.
KEY POINTS
- Proton pump inhibitors such as omeprazole reduce the risk of gastrointestinal bleeding in patients on antiplatelet therapy after an acute coronary syndrome or percutaneous coronary intervention.
- Omeprazole diminishes the antiplatelet activity of clopidogrel by inhibiting the CYP2C19 isoenzyme.
- Although the interaction between omeprazole and clopidogrel can be demonstrated on platelet function studies, the clinical significance of this interaction is not clear.
Acetaminophen: Old drug, new warnings
Editor’s note: Portions of this article are based on an article previously published in an internal Cleveland Clinic publication, Pharmacotherapy Update. The version here has been revised, updated, and peer-reviewed.
This drug is generally considered safe, but high doses can be toxic. The number of overdoses is worrisome. In 2006 alone, the American Association of Poison Control Centers implicated acetaminophen in nearly 140,000 poisoning cases, in which more than 100 patients died.2 It is responsible for more emergency room visits than any other drug on the market.
According to a position statement from the American Association for the Study of Liver Diseases (AASLD),3 the incidence of acetaminophen-related liver toxicity has been steadily increasing over the past decade, and this drug is now the most common cause of acute liver failure.
MANY OVERDOSES ARE UNINTENTIONAL
Cases of acetaminophen-related liver toxicity can be categorized as either intentional (ie, due to a suicide attempt) or unintentional (ie, due to multiple therapeutic but excessive doses over a period of time, usually more than 3 days).
Up to 50% of cases are unintentional. Bower et al4 reviewed cases of acute liver failure that occurred in the Atlanta, GA, area between November 2000 and October 2004. Acetaminophen was the most common cause in adult patients. Of greater concern is that 61% of the acetaminophen-related cases were due to unintentional overdose. According to the Institute for Safe Medication Practices,5 one hospital (not named) reported that an average of one patient per day was given more than the recommended maximum daily acetaminophen dose of 4 g while in the hospital.
Many patients take more than one acetaminophen product
Unintentional overdoses or “therapeutic misadventures” are most often due to taking multiple products that contain acetaminophen, taking acetaminophen-narcotic combinations, and impulsive behavior involving a lack of understanding of possible injury in consuming multiple acetaminophen-containing products.3
In the US Food and Drug Administration (FDA) Medwatch Database, in 307 cases of unintentional acetaminophen overdose between 1998 and 2001, 25% of patients had been taking more than one acetaminophencontaining product.5
Larson et al6 found that one-third of patients who had had an unintentional acetaminophen overdose were taking an acetaminophen-narcotic combination in addition to another acetaminophen-containing product.
Many consumers don’t know they are taking acetaminophen
Many consumers don’t know that some of the drugs they take contain acetaminophen. This may be because many drug labels contain abbreviations for acetaminophen such as “APAP” or have inconsistent formatting that makes it difficult to determine if the product contains acetaminophen.
Others may not be aware of the total maximum recommended daily dose or may not be able to calculate the total daily intake from the information on the label. The problem is not only with over-the-counter products. For example, if a physician prescribes one or two tablets of hydrocodone/acetaminophen (Vicodin) 5 mg/500 mg every 4 to 6 hours, a patient could easily exceed the recommended maximum daily dose of 4 g of acetaminophen.
Toxicity can occur even at therapeutic doses
Acetaminophen hepatotoxicity can also occur even with therapeutic doses in certain conditions. Risk factors:
- Chronic alcohol use (ie, more than three drinks per day)
- Malnutrition
- Concurrent use of drugs that induce cytochrome P450 (CYP450) enzymes (more on this below).6
FIRST USED IN 1893
Acetaminophen was first used in medicine in 1893, and it became widely used after 1949, when it was found to be a less-toxic metabolite of two parent compounds, acetanilide and phenacetin.1
Acetaminophen is an effective antipyretic and analgesic, but its anti-inflammatory properties are minimal, especially compared with nonsteroidal anti-inflammatory drugs (NSAIDs). Nevertheless, acetaminophen is preferred over NSAIDs in some patients because it carries a lower risk of gastrointestinal toxicity (eg, ulceration, bleeding) and so may be better tolerated.1
INDICATIONS AND DOSAGE
Acetaminophen is indicated for mild to moderate pain or fever, including the pain of osteoarthritis. It is not recommended for chronic inflammatory conditions such as rheumatoid arthritis, since it lacks anti-inflammatory properties.
In adults and in children over age 12, the usual dosage is 325 to 650 mg orally or rectally every 4 to 6 hours, or 1,000 mg three to four times daily.
The current package label recommends that the total daily dose not exceed 4 g in most adults. Lower maximum daily doses (eg, 2 g) are recommended in patients who may be at higher risk of hepatotoxicity, such as those who drink heavily, are malnourished, or take enzyme-inducing drugs. Tylenol products currently include an alcohol warning, advising those who consume three or more alcoholic drinks a day to ask their doctor if they should take acetaminophen.
In children up to 12 years of age, the recommended dosage is 10 to 15 mg/kg orally or rectally every 4 to 6 hours. The maximum dosing for children in this age group should not exceed five doses (or 50 to 75 mg/kg) in 24 hours.7 In children under age 2 or weighing less than 11 kg, acetaminophen should only be used under the direction of a physician.
MOST ACETAMINOPHEN IS CONJUGATED AND THEN EXCRETED IN THE URINE
Acetaminophen usually has excellent bioavailability (up to 98%), but the exact amount absorbed varies, depending on the dosage form and concomitant use of other drugs.8
At therapeutic doses, the elimination halflife is about 2 hours. Peak plasma concentrations are reached 30 to 60 minutes after the dose is taken,1 but taking acetaminophen with opioids, anticholinergic drugs, or even food may delay the time to peak concentration by delaying gastric emptying.8
NAPQI is a toxic metabolite
Under normal circumstances, a small amount of acetaminophen undergoes hepatic metabolism by a different pathway, ie, by CYP450 enzymes, primarily CYP2E1 and to a lesser extent CYP1A2, CYP2A6, and CYP3A4, forming a toxic metabolite, N-acetyl-p-benzoquinone imine (NAPQI). Then, the sulfhydryl groups of glutathione convert NAPQI into harmless metabolites that are excreted in the urine.1,7
Well tolerated and relatively safe
At recommended doses, acetaminophen is well tolerated, and it is considered relatively safe when used according to labeling instructions.
Rarely, patients experience an erythematous or urticarial rash or other allergic complications.1
However, acetaminophen is a dose-dependent hepatotoxin, and excessive doses (intentional or unintentional) may lead to acute liver failure. In addition, even in therapeutic doses, acetaminophen may still cause transient liver enzyme elevations and possibly hepatotoxicity, particularly in people who are malnourished or alcoholic or are taking certain CYP450-inducing drugs.3,6,10
HOW ACETAMINOPHEN CAN INJURE THE LIVER
Glucuronidation and sulfation, the major metabolic pathways, become saturated after an acetaminophen overdose.7 When this happens, more of the toxic metabolite NAPQI is formed by CYP450-mediated N-hydroxylation. When glutathione is depleted after large doses of acetaminophen or in malnourished people, the toxic metabolite accumulates, resulting in liver damage (Figure 1).6
The liver is damaged by two mechanisms. In one, NAPQI binds to hepatic cell macromolecules, causing dysfunction of the enzymatic systems, structural and metabolic disarray, and eventually necrotic cell death. The other mechanism is oxidative stress due to depletion of glutathione.
In children, single acetaminophen doses of 120 to 150 mg/kg of body weight have been associated with hepatotoxicity,11 as have single doses of more than 150 mg/kg or a total dose of greater than 7.5 g in adults. However, the minimal dose associated with liver injury has ranged from 4 to 10 g, and in healthy volunteers even therapeutic doses of 1 g orally every 6 hours resulted in mild liver injury.12
Patients who are malnourished or fasting are thought to be at greater risk of acetaminophen hepatotoxicity because they may be deficient in glutathione at baseline. In addition, even at lower-than-therapeutic doses, induction of CYP450 enzymes by drugs or chronic alcohol consumption may lead to an increase in the formation of NAPQI, increasing the risk of hepatotoxicity. Examples of drugs that induce CYP450 enzymes to produce more NAPQI include the anticonvuslants phenytoin (Dilantin) and phenobarbital.
CLINICAL PRESENTATION OF ACETAMINOPHEN OVERDOSE
The diagnosis of acetaminophen overdose is often established by a thorough history. The pertinent information may be difficult to obtain, however, because the patient may be confused or stuporous at presentation, may not know that the overthe-counter products he or she has been taking contain acetaminophen, or may be embarrassed about taking too much acetaminophen.13
In acute intentional overdose, signs may not be apparent immediately
The symptoms of toxicity may not be apparent immediately after ingestion of an acute overdose of acetaminophen, but early recognition and treatment can prevent more severe liver damage, decreasing morbidity and the risk of death.9
Phase 1 of an acetaminophen overdose begins shortly after ingestion and can last for 12 to 24 hours. Patients may have signs of gastrointestinal upset, nausea, vomiting, anorexia, diaphoresis, and pallor. Although the signs and symptoms show a consistent pattern and are more pronounced after larger acute overdoses, they are not diagnostic or specific.
Phase 2 (up to 48 hours after ingestion). Patients may begin to feel better during this phase. However, the hepatic enzyme levels, the prothrombin time (PT), and the international normalized ratio (INR) may continue to rise, and right upper quadrant pain may develop. Additionally, other laboratory results may be abnormal, and renal insufficiency can occur due to acetaminophen-induced renal tubular necrosis.6 Most patients receive the antidote, acetylcysteine (Mycomyst, Acetadote) before or during this phase, and consequently, liver function gradually returns to normal.
Phase 3, if reached, may be marked by severe hepatic necrosis, typically 3 to 5 days after ingestion. Symptoms during this phase range from less severe (eg, nausea and general malaise) to more severe (eg, confusion and stupor). Also, at this time, liver enzyme levels can be as high as 10,000 IU/L or even higher, and lactic acidosis and coagulopathy may worsen. If death should occur, it is most likely from complications associated with fulminant hepatic failure, including cerebral edema, multiorgan-system failure, or sepsis.6
Phase 4. Patients who recover generally have complete recovery of liver function with no long-term sequelae..
In unintentional overdoses, patients may have low drug levels
Many patients who present with unintentional acetaminophen toxicity have been taking the drug or products that contain the drug over several days to treat an acute or chronic medical condition. They often have low or undetectable serum acetaminophen levels after 2 to 3 days of nonspecific symptoms.12
MANAGING ACETAMINOPHENHEN OVERDOSE
Unintentional overdoses occur over a more prolonged period, and therefore the nomogram is not useful in this situation.
Acetylcysteine is the antidote
Acetylcysteine is the antidote for acetaminophen toxicity and should be given within 8 hours of ingestion for maximal protection against hepatic injury in patients whose serum acetaminophen levels are above the “possible” toxicity line on the nomogram.15 If acetaminophen overdose is suspected but the time elapsed since ingestion cannot be determined, acetylcysteine should be given immediately regardless of the quantity of acetaminophen ingested. 16 In cases of unintentional overdose, it is often given at the discretion of the physician.
Acetylcysteine limits the toxicity of acetaminophen by increasing glutathione stores, binding with NAPQI as a substitute for glutathione, and enhancing sulfate conjugation.6 It may further limit acetaminophen toxicity by nonspecific mechanisms including anti-inflammatory, antioxidant, inotropic, and vasodilating effects.6 In addition, it may prevent further hepatic damage in any patient thought to have acetaminophen-related liver toxicity even beyond the first 12 hours of an overdose.1
Acetylcysteine is available in an oral (Mucomyst) and an intravenous (Acetadote) formulation, which are similar in efficacy. Because many patients find the taste of the oral solution unpleasant and difficult to tolerate, it should be diluted in a 1:3 ratio with cola, orange juice, or other drink to mask its flavor. This mixture should be used within 1 hour of preparation.
Anaphylactoid reactions have occurred in patients receiving intravenous acetylcysteine for acetaminophen overdose soon after the infusion was started, most commonly during the loading dose. The frequency of infusion-related reactions has been reported to be 0.2% to 20.8%.15
The recommended dosage for intravenous acetylcysteine is a loading dose of 150 mg/kg given over 60 minutes, followed by a second dose of 50 mg/kg given over 4 hours, and finally a third dose of 100 mg/kg given over 16 hours.15 For oral acetylcysteine, the loading dose is 140 mg/kg followed by 70 mg/kg every 4 hours for 17 additional doses.17
Other measures
Activated charcoal can be used if the patient presents within 1 to 2 hours after taking acetaminophen. However, the rapid gastrointestinal absorption of acetaminophen makes this treatment ineffective in most cases.9
FINDINGS FROM LARGE REGISTRIES
Findings in adults
Ostapowicz et al,19 as part of the Acute Liver Failure Study Group, in 2002 prospectively characterized the short-term outcomes of acute liver failure in a large number of patients at 17 tertiary care centers in the United States over approximately 41 months. All centers except one performed liver transplants. Eligible patients had to meet criteria for acute liver failure, including an INR higher than 1.5, evidence of hepatic encephalopathy, and presentation within 26 weeks of illness onset without apparent chronic liver disease.
Of the 308 cases of acute liver failure, 120 (39%) were from acetaminophen overdose, making this drug the most common cause of acute liver failure. Forty-four (37%) of the patients with acetaminophen-related acute liver failure were trying to commit suicide, 57% of cases were accidental, and the remaining reasons for acetaminophen overdose were unknown. The median amount ingested was 13.2 g/day (range 2.6–75 g), and 99 (83%) of the 120 patients took more than 4 g/day.
The patients with acetaminophen-related acute liver toxicity differed from those with other causes of acute liver failure such as idiosyncratic drug reactions or indeterminate causes. The acetaminophen group had a shorter duration of disease and higher serum levels of alanine aminotransferase (ALT), aspartate aminotransferase (AST), and serum creatinine than those with acute liver failure from other causes. They also had lower bilirubin levels and a lower arterial pH.
Rates of liver transplantation were 6% in the acetaminophen group, 53% in the group with other drug-induced liver toxicity, 51% in the indeterminate group, and 36% in the remaining groups. Of the acetaminophen group, 47% met the criteria for transplantation, but only 57% of those eligible were listed for transplantation. Those excluded from the transplant list had medical contraindications or were excluded for psychosocial reasons. The short-term transplant-free survival rate was 68% in the acetaminophen group.
Overall, 11% of the patients died, including 28% of the acetaminophen group. The authors concluded that most cases of liver injury in the United States are due to medications and may be preventable.
Larson et al,20 as part of the Acute Liver Failure Study Group, examined the incidence, risk factors, and outcomes of acetaminopheninduced acute liver failure at 22 tertiary care centers in the United States over a 6-year period. Of the 662 patients in the study, 302 had acetaminophen-related toxicity and 275 were included in the final analysis; some of them had been included in the study by Ostapowicz et al.19 During the study period, the number of cases of acute liver toxicity related to acetaminophen increased from 28% to 51%.
Of the patients enrolled in the study, 56% met the criteria for potentially toxic acetaminophen ingestion. Of those who met the criteria, 77% had detectable acetaminophen levels in their serum, and 91% had ALT levels higher than 1,000 IU/L. The time between ingestion and symptom onset ranged from 1 to 32 days, and the median dose was 24 g (range 1.2–180 g).
Of the overdose cases, 48% were unintentional, 44% were intentional, and the remaining 8% had no definable reason. Of the patients in the unintentional-overdose group, 38% were using more than one acetaminophen-containing product and 63% were taking combination products containing narcotics. Overeall, 44% of patients reported using narcotic-acetaminophen combination products. The unintentional-overdose group had lower serum acetaminophen levels than the intentional-overdose group, but they were more likely to present with severe hepatic encephalopathy.
The number of patients with an unintentional overdose was worrisome. Furthermore, one-third of the patients who were receiving an acetaminophen-narcotic combination product were taking an additional acetaminophencontaining product. The authors concluded that unintentional overdose is the leading cause of acetaminophen-related hepatotoxicity, and efforts to limit the over-the-counter package size and to restrict prescriptions of acetaminophen-narcotic combinations may be necessary to decrease the incidence of this preventable cause of acute liver failure.
Findings in children
Squires et al21 and the Pediatric Acute Liver Failure Study Group examined the pathogenesis, treatment, and outcome of acute liver failure in children (any age from birth to 18 years) with no previous evidence of chronic liver disease, evidence of acute liver injury, or hepatic-based coagulopathy. From December 1999 to December 2004, 348 patients were enrolled.
Fourteen percent of the cases were due to acetaminophen. The median dose of acetaminophen ingested was 183 mg/kg. Most of these patients were white and female, and 96% were over age 3. Hepatic encephalopathy was more common in the non-acetaminophen groups than in the acetaminophen group, although this is often difficult to assess in infants and children. Children with acetaminophen toxicity had the highest rate of spontaneous recovery: 45 (94%) of 48 recovered.
Although there are fewer acetaminophenrelated cases of acute liver failure in children than in adults, the use of acetaminophen in children is still worrisome. The authors concluded that if they do not have hepatic encephalopathy, children with acetaminopheninduced liver toxicity have an excellent prognosis.
THE FDA LOOKS AT THE PROBLEM
Why overdoses occur
A recent FDA report22 cited the following reasons for acetaminophen overdose:
- Some patients may experience liver injury at doses only slightly above the recommended 4-g daily limit.
- Some patients may be more prone to liver injury from acetaminophen.
- The symptoms associated with liver injury due to acetaminophen can be nonspecific and tend to evolve over several days.
- Many acetaminophen-containing products are available, including over-the-counter and prescription drugs with many different strengths and indications.
- Consumers are unaware of the risk of liver toxicity with acetaminophen.
- Prescription products are not always clearly labeled with acetaminophen as an ingredient.
- Pediatric dosage forms are available in many different concentrations.
New package labeling
Recommendations from an advisory panel
In addition, an FDA advisory panel recommended decreasing the maximum recommended daily dose (possibly to 3,250 mg/day in adults, although this is not final) to help prevent overdoses, and reducing the maximum amount in a single nonprescription dose of the drug to 650 mg.23 The panel also voted (by a narrow margin) to ban all acetaminophen-narcotic combination products.
As of this writing, the FDA has not adopted these recommendations. (Although the FDA is not obliged to follow the advice of its advisory panels, in most cases it does.) The recommendations about acetaminophen could take years to implement fully.
THE UNITED KINGDOM ACTED IN 1998
In response to a rising number of analgesicrelated deaths, the United Kingdom enacted legislation in 1998 to limit the package size available to consumers.24 Packages sold in general stores can contain no more than 16 capsules, while those sold in pharmacies can contain 24. Blister packs were also introduced to make it harder for people to impulsively take handfuls of tablets.25
Two studies since then both found that the number of deaths related to paracetamol (as acetaminophen is known in the United Kingdom) had fallen since the legislation was implemented.24,26 Greene et al27 found that patients who ingested potentially toxic doses of paracetamol had obtained the drug “in a manner contravening the 1998 legislation.”27 In other words, shops in London were not obeying the law.
SUMMARY
The new labeling and the proposed changes are sensible and draw needed attention to the problem of acetaminophen toxicity. To prevent unintentional acetaminophen overdoses, education of patients and health care professionals is urgently needed so that the dangers of consuming excess acetaminophen daily are understood.
- Burke A, Smyth EM, Fitzgerald GA. Analgesic-antipyretic agents: pharmacotherapy of gout. In:Brunton LL, Lazo JS, Parker K, editors. Goodman and Gilman’s the Pharmacological Basis of Therapeutics, 11th ed. New York: McGraw-Hill, 2006:671–716.
- Bronstein AC, Spyker DA, Cantilena LR, Green J, Rumack BH, Heard SE. 2006 Annual Report of the American Association of Poison Control Centers National Poison Data System (NPDS). Clin Toxicol (Phila) 2007; 45:815–917.
- Schwartz J, Stravitz T, Lee WM; American Association for the Study of Liver Disease Study Group. AASLD position on acetaminophen. www.aasld.org/about/publicpolicy/Documents/Public%2520Policy%2520Documents/AcetaminophenPosition.pdf.
- Bower WA, Johns M, Margolis HS, Williams IT, Bell BP. Populationbased surveillance for acute liver failure. Am J Gastroenterol 2007; 102:2459–2463.
- Institute for Safe Medication Practices. How are you preventing acetaminophen overdoses? www.ismp.org/newsletters/acutecare/articles/20030808.asp. Accessed 11/17/2009.
- Larson AM. Acetaminophen hepatotoxicity. Clin Liver Dis 2007; 11:525–548.
- Tylenol package insert. Fort Washington, PA: McNeil-PPC Inc.; 1999.
- Bizovi KE, Hendrickson RG. Chapter 34. Acetaminophen. In:Hoffman RS, Nelson LS, Howland MA, Lewin NA, Flomenbaum NE, Goldfrank LR, editors. Goldfrank’s Manual of Toxicologic Emergencies. 3rd ed. McGraw-Hill: New York, 2007. www.accessemergencymedicine.com/content.aspx?aID=88781. Accessed 11/7/2009.
- Hung OL, Nelson LS. Chapter 171. Acetaminophen. In:Tintinalli JE, Kelen GD, Stapcynski S, editors. Tintinalli's Emergency Medicine: A Comprehensive Study Guide. 6th ed. McGraw-Hill: New York, 2004. www.accessmedicine.com/content.aspx?aID=602606. Accessed 11/17/2009.
- Watkins PB, Kaplowitz N, Slattery JT, et al. Aminotransferase elevations in healthy adults receiving 4 grams of acetaminophen daily: a randomized controlled trial. JAMA 2006; 296:87–93.
- American Academy of Pediatrics Committee on Drugs. Acetaminophen toxicity in children. Pediatrics 2001; 108:1020–1024.
- Fontana RJ. Acute liver failure including acetaminophen overdose. Med Clin North Am 2008; 92:761–794.
- Heard KJ. Acetylcysteine for acetaminophen poisoning. N Engl J Med 2008; 359:285–292.
- Rumack BH, Matthew H. Acetaminophen poisoning and toxicity. Pediatrics 1975; 55:871–876.
- Acetadote package insert. Nashville, TN: Cumberland Pharmaceuticals; 2008Dec.
- Polson J, Lee WM; American Association for the Study of Liver Disease. AASLD position paper: the management of acute liver failure. Hepatology 2005; 41:1179–1197.
- Product Information: acetylcysteine inhalation solution, acetylcysteine inhalation solution. Hospira,Inc, Lake Forest, IL, 2004.
- O’Grady JG, Alexander GJ, Hayllar KM, Williams R. Early indicators of prognosis in fulminant hepatic failure. Gastroenterology 1989; 97:439–445.
- Ostapowicz G, Fontana RJ, Schiødt FV, et al. Results of a prospective study of acute liver failure at 17 tertiary care centers in the United States. Ann Intern Med 2002; 137:947–954.
- Larson AM, Polson J, Fontana RJ, et al. Acetaminophen-induced acute liver failure: results of a United States multicenter, prospective study. Hepatology 2005; 42:1364–1372.
- Squires RH, Shneider BL, Bucuvalas J, et al. Acute liver failure in children: the first 348 patients in the Pediatric Acute Liver Failure Study Group. J Pediatr 2006; 148:652–658.
- US Food and Drug Administration. Questions and answers on final rule for labeling changes to over-the-counter pain relievers. www.fda.gov/Drugs/NewsEvents/ucm144068.htm. Accessed 10/30/2009.
- Perrone M. FDA panel recommends smaller doses of painkillers. Associated Press. Adelphi, MD. June 30, 2009.
- Hawton K, Simkin S, Deeks J, et al. UK legislation on analgesic packs: before and after study of long term effect on poisonings. BMJ 2004; 329:1076.
- Hughes B, Durran A, Langford NJ, Mutimer D. Paracetamol poisoning—impact of pack size restrictions. J Clin Pharmacol Ther 2003; 28:307–310.
- Wilkinson S, Taylor G, Templeton L, Mistral W, Salter E, Bennett P. Admissions to hospital for deliberate self-harm in England 1995–2000: an analysis of hospital episode statistics. J Public Health Med 2002; 24:179–183.
- Greene SL, Dargan PI, Leman P, Jones AL. Paracetamol availability and recent changes in paracetamol poisoning: is the 1998 legislation limiting availability of paracetamol being followed? Postgrad Med J 2006; 82:520–523.
Editor’s note: Portions of this article are based on an article previously published in an internal Cleveland Clinic publication, Pharmacotherapy Update. The version here has been revised, updated, and peer-reviewed.
This drug is generally considered safe, but high doses can be toxic. The number of overdoses is worrisome. In 2006 alone, the American Association of Poison Control Centers implicated acetaminophen in nearly 140,000 poisoning cases, in which more than 100 patients died.2 It is responsible for more emergency room visits than any other drug on the market.
According to a position statement from the American Association for the Study of Liver Diseases (AASLD),3 the incidence of acetaminophen-related liver toxicity has been steadily increasing over the past decade, and this drug is now the most common cause of acute liver failure.
MANY OVERDOSES ARE UNINTENTIONAL
Cases of acetaminophen-related liver toxicity can be categorized as either intentional (ie, due to a suicide attempt) or unintentional (ie, due to multiple therapeutic but excessive doses over a period of time, usually more than 3 days).
Up to 50% of cases are unintentional. Bower et al4 reviewed cases of acute liver failure that occurred in the Atlanta, GA, area between November 2000 and October 2004. Acetaminophen was the most common cause in adult patients. Of greater concern is that 61% of the acetaminophen-related cases were due to unintentional overdose. According to the Institute for Safe Medication Practices,5 one hospital (not named) reported that an average of one patient per day was given more than the recommended maximum daily acetaminophen dose of 4 g while in the hospital.
Many patients take more than one acetaminophen product
Unintentional overdoses or “therapeutic misadventures” are most often due to taking multiple products that contain acetaminophen, taking acetaminophen-narcotic combinations, and impulsive behavior involving a lack of understanding of possible injury in consuming multiple acetaminophen-containing products.3
In the US Food and Drug Administration (FDA) Medwatch Database, in 307 cases of unintentional acetaminophen overdose between 1998 and 2001, 25% of patients had been taking more than one acetaminophencontaining product.5
Larson et al6 found that one-third of patients who had had an unintentional acetaminophen overdose were taking an acetaminophen-narcotic combination in addition to another acetaminophen-containing product.
Many consumers don’t know they are taking acetaminophen
Many consumers don’t know that some of the drugs they take contain acetaminophen. This may be because many drug labels contain abbreviations for acetaminophen such as “APAP” or have inconsistent formatting that makes it difficult to determine if the product contains acetaminophen.
Others may not be aware of the total maximum recommended daily dose or may not be able to calculate the total daily intake from the information on the label. The problem is not only with over-the-counter products. For example, if a physician prescribes one or two tablets of hydrocodone/acetaminophen (Vicodin) 5 mg/500 mg every 4 to 6 hours, a patient could easily exceed the recommended maximum daily dose of 4 g of acetaminophen.
Toxicity can occur even at therapeutic doses
Acetaminophen hepatotoxicity can also occur even with therapeutic doses in certain conditions. Risk factors:
- Chronic alcohol use (ie, more than three drinks per day)
- Malnutrition
- Concurrent use of drugs that induce cytochrome P450 (CYP450) enzymes (more on this below).6
FIRST USED IN 1893
Acetaminophen was first used in medicine in 1893, and it became widely used after 1949, when it was found to be a less-toxic metabolite of two parent compounds, acetanilide and phenacetin.1
Acetaminophen is an effective antipyretic and analgesic, but its anti-inflammatory properties are minimal, especially compared with nonsteroidal anti-inflammatory drugs (NSAIDs). Nevertheless, acetaminophen is preferred over NSAIDs in some patients because it carries a lower risk of gastrointestinal toxicity (eg, ulceration, bleeding) and so may be better tolerated.1
INDICATIONS AND DOSAGE
Acetaminophen is indicated for mild to moderate pain or fever, including the pain of osteoarthritis. It is not recommended for chronic inflammatory conditions such as rheumatoid arthritis, since it lacks anti-inflammatory properties.
In adults and in children over age 12, the usual dosage is 325 to 650 mg orally or rectally every 4 to 6 hours, or 1,000 mg three to four times daily.
The current package label recommends that the total daily dose not exceed 4 g in most adults. Lower maximum daily doses (eg, 2 g) are recommended in patients who may be at higher risk of hepatotoxicity, such as those who drink heavily, are malnourished, or take enzyme-inducing drugs. Tylenol products currently include an alcohol warning, advising those who consume three or more alcoholic drinks a day to ask their doctor if they should take acetaminophen.
In children up to 12 years of age, the recommended dosage is 10 to 15 mg/kg orally or rectally every 4 to 6 hours. The maximum dosing for children in this age group should not exceed five doses (or 50 to 75 mg/kg) in 24 hours.7 In children under age 2 or weighing less than 11 kg, acetaminophen should only be used under the direction of a physician.
MOST ACETAMINOPHEN IS CONJUGATED AND THEN EXCRETED IN THE URINE
Acetaminophen usually has excellent bioavailability (up to 98%), but the exact amount absorbed varies, depending on the dosage form and concomitant use of other drugs.8
At therapeutic doses, the elimination halflife is about 2 hours. Peak plasma concentrations are reached 30 to 60 minutes after the dose is taken,1 but taking acetaminophen with opioids, anticholinergic drugs, or even food may delay the time to peak concentration by delaying gastric emptying.8
NAPQI is a toxic metabolite
Under normal circumstances, a small amount of acetaminophen undergoes hepatic metabolism by a different pathway, ie, by CYP450 enzymes, primarily CYP2E1 and to a lesser extent CYP1A2, CYP2A6, and CYP3A4, forming a toxic metabolite, N-acetyl-p-benzoquinone imine (NAPQI). Then, the sulfhydryl groups of glutathione convert NAPQI into harmless metabolites that are excreted in the urine.1,7
Well tolerated and relatively safe
At recommended doses, acetaminophen is well tolerated, and it is considered relatively safe when used according to labeling instructions.
Rarely, patients experience an erythematous or urticarial rash or other allergic complications.1
However, acetaminophen is a dose-dependent hepatotoxin, and excessive doses (intentional or unintentional) may lead to acute liver failure. In addition, even in therapeutic doses, acetaminophen may still cause transient liver enzyme elevations and possibly hepatotoxicity, particularly in people who are malnourished or alcoholic or are taking certain CYP450-inducing drugs.3,6,10
HOW ACETAMINOPHEN CAN INJURE THE LIVER
Glucuronidation and sulfation, the major metabolic pathways, become saturated after an acetaminophen overdose.7 When this happens, more of the toxic metabolite NAPQI is formed by CYP450-mediated N-hydroxylation. When glutathione is depleted after large doses of acetaminophen or in malnourished people, the toxic metabolite accumulates, resulting in liver damage (Figure 1).6
The liver is damaged by two mechanisms. In one, NAPQI binds to hepatic cell macromolecules, causing dysfunction of the enzymatic systems, structural and metabolic disarray, and eventually necrotic cell death. The other mechanism is oxidative stress due to depletion of glutathione.
In children, single acetaminophen doses of 120 to 150 mg/kg of body weight have been associated with hepatotoxicity,11 as have single doses of more than 150 mg/kg or a total dose of greater than 7.5 g in adults. However, the minimal dose associated with liver injury has ranged from 4 to 10 g, and in healthy volunteers even therapeutic doses of 1 g orally every 6 hours resulted in mild liver injury.12
Patients who are malnourished or fasting are thought to be at greater risk of acetaminophen hepatotoxicity because they may be deficient in glutathione at baseline. In addition, even at lower-than-therapeutic doses, induction of CYP450 enzymes by drugs or chronic alcohol consumption may lead to an increase in the formation of NAPQI, increasing the risk of hepatotoxicity. Examples of drugs that induce CYP450 enzymes to produce more NAPQI include the anticonvuslants phenytoin (Dilantin) and phenobarbital.
CLINICAL PRESENTATION OF ACETAMINOPHEN OVERDOSE
The diagnosis of acetaminophen overdose is often established by a thorough history. The pertinent information may be difficult to obtain, however, because the patient may be confused or stuporous at presentation, may not know that the overthe-counter products he or she has been taking contain acetaminophen, or may be embarrassed about taking too much acetaminophen.13
In acute intentional overdose, signs may not be apparent immediately
The symptoms of toxicity may not be apparent immediately after ingestion of an acute overdose of acetaminophen, but early recognition and treatment can prevent more severe liver damage, decreasing morbidity and the risk of death.9
Phase 1 of an acetaminophen overdose begins shortly after ingestion and can last for 12 to 24 hours. Patients may have signs of gastrointestinal upset, nausea, vomiting, anorexia, diaphoresis, and pallor. Although the signs and symptoms show a consistent pattern and are more pronounced after larger acute overdoses, they are not diagnostic or specific.
Phase 2 (up to 48 hours after ingestion). Patients may begin to feel better during this phase. However, the hepatic enzyme levels, the prothrombin time (PT), and the international normalized ratio (INR) may continue to rise, and right upper quadrant pain may develop. Additionally, other laboratory results may be abnormal, and renal insufficiency can occur due to acetaminophen-induced renal tubular necrosis.6 Most patients receive the antidote, acetylcysteine (Mycomyst, Acetadote) before or during this phase, and consequently, liver function gradually returns to normal.
Phase 3, if reached, may be marked by severe hepatic necrosis, typically 3 to 5 days after ingestion. Symptoms during this phase range from less severe (eg, nausea and general malaise) to more severe (eg, confusion and stupor). Also, at this time, liver enzyme levels can be as high as 10,000 IU/L or even higher, and lactic acidosis and coagulopathy may worsen. If death should occur, it is most likely from complications associated with fulminant hepatic failure, including cerebral edema, multiorgan-system failure, or sepsis.6
Phase 4. Patients who recover generally have complete recovery of liver function with no long-term sequelae..
In unintentional overdoses, patients may have low drug levels
Many patients who present with unintentional acetaminophen toxicity have been taking the drug or products that contain the drug over several days to treat an acute or chronic medical condition. They often have low or undetectable serum acetaminophen levels after 2 to 3 days of nonspecific symptoms.12
MANAGING ACETAMINOPHENHEN OVERDOSE
Unintentional overdoses occur over a more prolonged period, and therefore the nomogram is not useful in this situation.
Acetylcysteine is the antidote
Acetylcysteine is the antidote for acetaminophen toxicity and should be given within 8 hours of ingestion for maximal protection against hepatic injury in patients whose serum acetaminophen levels are above the “possible” toxicity line on the nomogram.15 If acetaminophen overdose is suspected but the time elapsed since ingestion cannot be determined, acetylcysteine should be given immediately regardless of the quantity of acetaminophen ingested. 16 In cases of unintentional overdose, it is often given at the discretion of the physician.
Acetylcysteine limits the toxicity of acetaminophen by increasing glutathione stores, binding with NAPQI as a substitute for glutathione, and enhancing sulfate conjugation.6 It may further limit acetaminophen toxicity by nonspecific mechanisms including anti-inflammatory, antioxidant, inotropic, and vasodilating effects.6 In addition, it may prevent further hepatic damage in any patient thought to have acetaminophen-related liver toxicity even beyond the first 12 hours of an overdose.1
Acetylcysteine is available in an oral (Mucomyst) and an intravenous (Acetadote) formulation, which are similar in efficacy. Because many patients find the taste of the oral solution unpleasant and difficult to tolerate, it should be diluted in a 1:3 ratio with cola, orange juice, or other drink to mask its flavor. This mixture should be used within 1 hour of preparation.
Anaphylactoid reactions have occurred in patients receiving intravenous acetylcysteine for acetaminophen overdose soon after the infusion was started, most commonly during the loading dose. The frequency of infusion-related reactions has been reported to be 0.2% to 20.8%.15
The recommended dosage for intravenous acetylcysteine is a loading dose of 150 mg/kg given over 60 minutes, followed by a second dose of 50 mg/kg given over 4 hours, and finally a third dose of 100 mg/kg given over 16 hours.15 For oral acetylcysteine, the loading dose is 140 mg/kg followed by 70 mg/kg every 4 hours for 17 additional doses.17
Other measures
Activated charcoal can be used if the patient presents within 1 to 2 hours after taking acetaminophen. However, the rapid gastrointestinal absorption of acetaminophen makes this treatment ineffective in most cases.9
FINDINGS FROM LARGE REGISTRIES
Findings in adults
Ostapowicz et al,19 as part of the Acute Liver Failure Study Group, in 2002 prospectively characterized the short-term outcomes of acute liver failure in a large number of patients at 17 tertiary care centers in the United States over approximately 41 months. All centers except one performed liver transplants. Eligible patients had to meet criteria for acute liver failure, including an INR higher than 1.5, evidence of hepatic encephalopathy, and presentation within 26 weeks of illness onset without apparent chronic liver disease.
Of the 308 cases of acute liver failure, 120 (39%) were from acetaminophen overdose, making this drug the most common cause of acute liver failure. Forty-four (37%) of the patients with acetaminophen-related acute liver failure were trying to commit suicide, 57% of cases were accidental, and the remaining reasons for acetaminophen overdose were unknown. The median amount ingested was 13.2 g/day (range 2.6–75 g), and 99 (83%) of the 120 patients took more than 4 g/day.
The patients with acetaminophen-related acute liver toxicity differed from those with other causes of acute liver failure such as idiosyncratic drug reactions or indeterminate causes. The acetaminophen group had a shorter duration of disease and higher serum levels of alanine aminotransferase (ALT), aspartate aminotransferase (AST), and serum creatinine than those with acute liver failure from other causes. They also had lower bilirubin levels and a lower arterial pH.
Rates of liver transplantation were 6% in the acetaminophen group, 53% in the group with other drug-induced liver toxicity, 51% in the indeterminate group, and 36% in the remaining groups. Of the acetaminophen group, 47% met the criteria for transplantation, but only 57% of those eligible were listed for transplantation. Those excluded from the transplant list had medical contraindications or were excluded for psychosocial reasons. The short-term transplant-free survival rate was 68% in the acetaminophen group.
Overall, 11% of the patients died, including 28% of the acetaminophen group. The authors concluded that most cases of liver injury in the United States are due to medications and may be preventable.
Larson et al,20 as part of the Acute Liver Failure Study Group, examined the incidence, risk factors, and outcomes of acetaminopheninduced acute liver failure at 22 tertiary care centers in the United States over a 6-year period. Of the 662 patients in the study, 302 had acetaminophen-related toxicity and 275 were included in the final analysis; some of them had been included in the study by Ostapowicz et al.19 During the study period, the number of cases of acute liver toxicity related to acetaminophen increased from 28% to 51%.
Of the patients enrolled in the study, 56% met the criteria for potentially toxic acetaminophen ingestion. Of those who met the criteria, 77% had detectable acetaminophen levels in their serum, and 91% had ALT levels higher than 1,000 IU/L. The time between ingestion and symptom onset ranged from 1 to 32 days, and the median dose was 24 g (range 1.2–180 g).
Of the overdose cases, 48% were unintentional, 44% were intentional, and the remaining 8% had no definable reason. Of the patients in the unintentional-overdose group, 38% were using more than one acetaminophen-containing product and 63% were taking combination products containing narcotics. Overeall, 44% of patients reported using narcotic-acetaminophen combination products. The unintentional-overdose group had lower serum acetaminophen levels than the intentional-overdose group, but they were more likely to present with severe hepatic encephalopathy.
The number of patients with an unintentional overdose was worrisome. Furthermore, one-third of the patients who were receiving an acetaminophen-narcotic combination product were taking an additional acetaminophencontaining product. The authors concluded that unintentional overdose is the leading cause of acetaminophen-related hepatotoxicity, and efforts to limit the over-the-counter package size and to restrict prescriptions of acetaminophen-narcotic combinations may be necessary to decrease the incidence of this preventable cause of acute liver failure.
Findings in children
Squires et al21 and the Pediatric Acute Liver Failure Study Group examined the pathogenesis, treatment, and outcome of acute liver failure in children (any age from birth to 18 years) with no previous evidence of chronic liver disease, evidence of acute liver injury, or hepatic-based coagulopathy. From December 1999 to December 2004, 348 patients were enrolled.
Fourteen percent of the cases were due to acetaminophen. The median dose of acetaminophen ingested was 183 mg/kg. Most of these patients were white and female, and 96% were over age 3. Hepatic encephalopathy was more common in the non-acetaminophen groups than in the acetaminophen group, although this is often difficult to assess in infants and children. Children with acetaminophen toxicity had the highest rate of spontaneous recovery: 45 (94%) of 48 recovered.
Although there are fewer acetaminophenrelated cases of acute liver failure in children than in adults, the use of acetaminophen in children is still worrisome. The authors concluded that if they do not have hepatic encephalopathy, children with acetaminopheninduced liver toxicity have an excellent prognosis.
THE FDA LOOKS AT THE PROBLEM
Why overdoses occur
A recent FDA report22 cited the following reasons for acetaminophen overdose:
- Some patients may experience liver injury at doses only slightly above the recommended 4-g daily limit.
- Some patients may be more prone to liver injury from acetaminophen.
- The symptoms associated with liver injury due to acetaminophen can be nonspecific and tend to evolve over several days.
- Many acetaminophen-containing products are available, including over-the-counter and prescription drugs with many different strengths and indications.
- Consumers are unaware of the risk of liver toxicity with acetaminophen.
- Prescription products are not always clearly labeled with acetaminophen as an ingredient.
- Pediatric dosage forms are available in many different concentrations.
New package labeling
Recommendations from an advisory panel
In addition, an FDA advisory panel recommended decreasing the maximum recommended daily dose (possibly to 3,250 mg/day in adults, although this is not final) to help prevent overdoses, and reducing the maximum amount in a single nonprescription dose of the drug to 650 mg.23 The panel also voted (by a narrow margin) to ban all acetaminophen-narcotic combination products.
As of this writing, the FDA has not adopted these recommendations. (Although the FDA is not obliged to follow the advice of its advisory panels, in most cases it does.) The recommendations about acetaminophen could take years to implement fully.
THE UNITED KINGDOM ACTED IN 1998
In response to a rising number of analgesicrelated deaths, the United Kingdom enacted legislation in 1998 to limit the package size available to consumers.24 Packages sold in general stores can contain no more than 16 capsules, while those sold in pharmacies can contain 24. Blister packs were also introduced to make it harder for people to impulsively take handfuls of tablets.25
Two studies since then both found that the number of deaths related to paracetamol (as acetaminophen is known in the United Kingdom) had fallen since the legislation was implemented.24,26 Greene et al27 found that patients who ingested potentially toxic doses of paracetamol had obtained the drug “in a manner contravening the 1998 legislation.”27 In other words, shops in London were not obeying the law.
SUMMARY
The new labeling and the proposed changes are sensible and draw needed attention to the problem of acetaminophen toxicity. To prevent unintentional acetaminophen overdoses, education of patients and health care professionals is urgently needed so that the dangers of consuming excess acetaminophen daily are understood.
- Burke A, Smyth EM, Fitzgerald GA. Analgesic-antipyretic agents: pharmacotherapy of gout. In:Brunton LL, Lazo JS, Parker K, editors. Goodman and Gilman’s the Pharmacological Basis of Therapeutics, 11th ed. New York: McGraw-Hill, 2006:671–716.
- Bronstein AC, Spyker DA, Cantilena LR, Green J, Rumack BH, Heard SE. 2006 Annual Report of the American Association of Poison Control Centers National Poison Data System (NPDS). Clin Toxicol (Phila) 2007; 45:815–917.
- Schwartz J, Stravitz T, Lee WM; American Association for the Study of Liver Disease Study Group. AASLD position on acetaminophen. www.aasld.org/about/publicpolicy/Documents/Public%2520Policy%2520Documents/AcetaminophenPosition.pdf.
- Bower WA, Johns M, Margolis HS, Williams IT, Bell BP. Populationbased surveillance for acute liver failure. Am J Gastroenterol 2007; 102:2459–2463.
- Institute for Safe Medication Practices. How are you preventing acetaminophen overdoses? www.ismp.org/newsletters/acutecare/articles/20030808.asp. Accessed 11/17/2009.
- Larson AM. Acetaminophen hepatotoxicity. Clin Liver Dis 2007; 11:525–548.
- Tylenol package insert. Fort Washington, PA: McNeil-PPC Inc.; 1999.
- Bizovi KE, Hendrickson RG. Chapter 34. Acetaminophen. In:Hoffman RS, Nelson LS, Howland MA, Lewin NA, Flomenbaum NE, Goldfrank LR, editors. Goldfrank’s Manual of Toxicologic Emergencies. 3rd ed. McGraw-Hill: New York, 2007. www.accessemergencymedicine.com/content.aspx?aID=88781. Accessed 11/7/2009.
- Hung OL, Nelson LS. Chapter 171. Acetaminophen. In:Tintinalli JE, Kelen GD, Stapcynski S, editors. Tintinalli's Emergency Medicine: A Comprehensive Study Guide. 6th ed. McGraw-Hill: New York, 2004. www.accessmedicine.com/content.aspx?aID=602606. Accessed 11/17/2009.
- Watkins PB, Kaplowitz N, Slattery JT, et al. Aminotransferase elevations in healthy adults receiving 4 grams of acetaminophen daily: a randomized controlled trial. JAMA 2006; 296:87–93.
- American Academy of Pediatrics Committee on Drugs. Acetaminophen toxicity in children. Pediatrics 2001; 108:1020–1024.
- Fontana RJ. Acute liver failure including acetaminophen overdose. Med Clin North Am 2008; 92:761–794.
- Heard KJ. Acetylcysteine for acetaminophen poisoning. N Engl J Med 2008; 359:285–292.
- Rumack BH, Matthew H. Acetaminophen poisoning and toxicity. Pediatrics 1975; 55:871–876.
- Acetadote package insert. Nashville, TN: Cumberland Pharmaceuticals; 2008Dec.
- Polson J, Lee WM; American Association for the Study of Liver Disease. AASLD position paper: the management of acute liver failure. Hepatology 2005; 41:1179–1197.
- Product Information: acetylcysteine inhalation solution, acetylcysteine inhalation solution. Hospira,Inc, Lake Forest, IL, 2004.
- O’Grady JG, Alexander GJ, Hayllar KM, Williams R. Early indicators of prognosis in fulminant hepatic failure. Gastroenterology 1989; 97:439–445.
- Ostapowicz G, Fontana RJ, Schiødt FV, et al. Results of a prospective study of acute liver failure at 17 tertiary care centers in the United States. Ann Intern Med 2002; 137:947–954.
- Larson AM, Polson J, Fontana RJ, et al. Acetaminophen-induced acute liver failure: results of a United States multicenter, prospective study. Hepatology 2005; 42:1364–1372.
- Squires RH, Shneider BL, Bucuvalas J, et al. Acute liver failure in children: the first 348 patients in the Pediatric Acute Liver Failure Study Group. J Pediatr 2006; 148:652–658.
- US Food and Drug Administration. Questions and answers on final rule for labeling changes to over-the-counter pain relievers. www.fda.gov/Drugs/NewsEvents/ucm144068.htm. Accessed 10/30/2009.
- Perrone M. FDA panel recommends smaller doses of painkillers. Associated Press. Adelphi, MD. June 30, 2009.
- Hawton K, Simkin S, Deeks J, et al. UK legislation on analgesic packs: before and after study of long term effect on poisonings. BMJ 2004; 329:1076.
- Hughes B, Durran A, Langford NJ, Mutimer D. Paracetamol poisoning—impact of pack size restrictions. J Clin Pharmacol Ther 2003; 28:307–310.
- Wilkinson S, Taylor G, Templeton L, Mistral W, Salter E, Bennett P. Admissions to hospital for deliberate self-harm in England 1995–2000: an analysis of hospital episode statistics. J Public Health Med 2002; 24:179–183.
- Greene SL, Dargan PI, Leman P, Jones AL. Paracetamol availability and recent changes in paracetamol poisoning: is the 1998 legislation limiting availability of paracetamol being followed? Postgrad Med J 2006; 82:520–523.
KEY POINTS
- Acetaminophen is the leading cause of acute liver failure in the United States, and nearly half of acetaminophenassociated cases are due to unintentional overdose.
- In many cases of unintentional overdose, patients took more than one acetaminophen-containing product and did not know that both products contained this drug.
- Prescribers need to inform all patients, especially vulnerable ones (eg, those taking enzyme-inducing drugs, those who chronically use alcohol, and those who are malnourished) of the risks associated with acetaminophen.
- Although no consensus has been reached on what is a safe dose in patients with liver disease, 4 g/day is too much: a total daily dose of no more than 2 g is recommended to decrease the risk of toxicity in these patients.
Prasugrel for acute coronary syndromes: Faster, more potent, but higher bleeding risk
Prasugrel (Effient) is more potent and consistent in its effects than clopidogrel (Plavix), thus preventing more thrombotic events—but at a price of more bleeding. Therefore, the drugs must be appropriately selected for the individual patient.
Over the last 9 years, the thienopyridines—ticlopidine (Ticlid), clopidogrel, and now prasugrel—have become essential tools for treating acute coronary syndromes.
The usual underlying mechanism of acute coronary syndromes is thrombosis, caused by rupture of atherosclerotic plaque.1 Accordingly, antithrombotic agents—aspirin, heparin, lowmolecular-weight heparin, glycoprotein IIb/IIIa inhibitors, the direct thrombin inhibitor bivalirudin (Angiomax), and thienopyridines—have all been shown to reduce the risk of major adverse cardiac outcomes in this setting.
In this article, we review the pharmacology and evidence of effectiveness of the thienopyridine drugs, focusing on prasugrel, the latest thienopyridine to be approved by the US Food and Drug Administration (FDA).
THIENOPYRIDINES INHIBIT PLATELET ACTIVATION AND AGGREGATION
Thienopyridines are prodrugs that require conversion by hepatic cytochrome P450 enzymes. The active metabolites bind irreversibly to platelet P2Y12 receptors. Consequently, they permanently block signalling mediated by platelet adenosine diphosphate-P2Y12 receptors, thereby inhibiting glycoprotein IIb/IIIa receptor activation and platelet aggregation.
Aspirin, in contrast, inhibits platelets by blocking the thromboxane-mediated pathway. Therefore, the combination of aspirin plus a thienopyridine has an additive effect.2
The effect of thienopyridines on platelets is irreversible. Therefore, although the half-life of prasugrel’s active metabolite is 3.7 hours, its inhibitory effects last for 96 hours, essentially the time for half the body’s circulating platelets to be replaced.
TICLOPIDINE, THE FIRST THIENOPYRIDINE
Ticlopidine was the first thienopyridine to be approved by the FDA. Its initial studies in unstable angina were small, their designs did not call for patients to concurrently receive aspirin, and all they showed was that ticlopidine was about as beneficial as aspirin. Consequently, the studies had little impact on clinical practice.3
In a pivotal trial,4 patients who received coronary stents were randomized to afterward receive either the combination of ticlopidine plus aspirin or anticoagulation therapy with heparin, phenprocoumon (a coumarin derivative available in Europe), and aspirin. At 30 days, an ischemic complication (death, myocardial infarction [MI], repeat intervention) had occurred in 6.2% of the anticoagulation therapy group vs 1.6% of the ticlopidine group, a risk reduction of 75%. Rates of stent occlusion, MI, and revascularization were 80% to 85% lower in the ticlodipine group. This study paved the way for widespread use of thienopyridines.
Ticlopidine’s use was limited, however, by a 2.4% incidence of serious granulocytopenia and rare cases of thrombocytopenic purpura.
BENEFIT OF CLOPIDOGREL
Although prasugrel is the focus of this review, the trials of prasugrel all compared its efficacy with that of clopidogrel. Furthermore, many patients should still receive clopidogrel and not prasugrel, so it is important to be familiar with the evidence of clopidogrel’s benefit.
Once approved for clinical use, clopidogrel was substituted for ticlopidine in patients undergoing coronary stenting on the basis of studies showing it to be at least as effective as ticlopidine and more tolerable. A series of trials of clopidogrel were done in patients across a spectrum of risk groups, from those at high risk of coronary heart disease to those presenting with ST-elevation MI. The time of pretreatment in the studies ranged from 3 hours to 6 days before percutaneous coronary intervention, and the duration of treatment following intervention ranged from 30 days to 1 year.
Clopidogrel in non-ST-elevation acute coronary syndromes
The CURE trial2 (Clopidogrel in Unstable Angina to Prevent Recurrent Events), published in 2001, established clopidogrel as a therapy for unstable ischemic syndromes, whether treated medically or with revascularization. In that trial, 12,562 patients with acute coronary syndromes without ST elevation (ie, unstable angina or non-ST-elevation MI), as defined by electrocardiographic changes or positive cardiac markers, were randomized to receive clopidogrel (a 300-mg loading dose followed by 75-mg maintenance doses) or placebo for a mean duration of 9 months. All patients also received aspirin 75 mg to 325 mg daily.
The composite outcome of death from cardiovascular causes, nonfatal MI, or stroke occurred in 20% fewer patients treated with clopidogrel than with placebo (9.3% vs 11.4%). The benefit was similar in patients undergoing revascularization compared with those treated medically.
Although there were significantly more cases of major bleeding in the clopidogrel group than in the placebo group (3.7% vs 2.7%), the number of episodes of life-threatening bleeding or hemorrhagic strokes was the same.
PCI-CURE5 was a substudy of the CURE trial in patients who underwent a percutaneous coronary intervention. Patients were pretreated with clopidogrel or placebo for a mean of 6 days before the procedure. Afterward, they all received clopidogrel plus aspirin in an unblinded fashion for 2 to 4 weeks, and then the randomized study drug was resumed for a mean of 8 months.
Significantly fewer adverse events occurred in the clopidogrel group as tallied at the time of the intervention, 1 month later, and 8 months later.
Clopidogrel in ST-elevation acute MI
The CLARITY-TIMI 28 trial6 (Clopidogrel as Adjunctive Reperfusion Therapy—Thrombolysis in Myocardial Infarction 28) showed that adding clopidogrel (a 300-mg loading dose, then 75 mg daily) to aspirin benefitted patients with ST-elevation MI receiving fibrinolytic therapy. At 30 days, cardiovascular death, recurrent MI, or urgent revascularization had occurred in 11.6% of the clopidogrel group vs 14.1% of the placebo group, a statistically significant difference. The rates of major or minor bleeding were no higher in the clopidogrel group than in the placebo group, an especially remarkable finding in patients receiving thrombolytic therapy.
PCI-CLARITY.7 About half of the patients in the CLARITY trial ultimately underwent a percutaneous coronary intervention after fibrinolytic therapy, with results reported as the PCI-CLARITY substudy. Like those in PCI-CURE, these patients were randomized to receive pretreatment with either clopidogrel or placebo before the procedure, in this study for a median of 3 days. Both groups received clopidogrel afterward. At 30 days from randomization, the outcome of cardiovascular death, MI, or stroke had occurred in 7.5% of the clopidogrel group compared with 12.0% of the placebo group, which was statistically significant, without any significant excess in the rates of major or minor bleeding.
COMMIT8 (the Clopidogrel and Metoprolol in Myocardial Infarction Trial) also showed clopidogrel to be beneficial in patients with acute MI. This trial included more than 45,000 patients in China with acute MI, 93% of whom had ST-segment elevation. In contrast to CLARITY, in COMMIT barely more than half of the patients received fibrinolysis, fewer than 5% proceeded to percutaneous interventions, and no loading dose was given: patients in the clopidogrel group received 75 mg/day from the outset.
At 15 days, the incidence of death, reinfarction, or stroke was 9.2% with clopidogrel compared with 10.1% with placebo, a small but statistically significant difference. Again, the rate of major bleeding was not significantly higher, either overall or in patients over age 70.
Of note, patients over age 75 were excluded from CLARITY, and as mentioned, no loading dose was used in COMMIT. Thus, for patients receiving fibrinolysis who are over age 75, there is no evidence to support the safety of a loading dose, and clopidogrel should be started at 75 mg daily.
Clopidogrel in elective percutaneous coronary intervention
The CREDO trial9 (Clopidogrel for the Reduction of Events During Observation) was in patients referred for elective percutaneous coronary intervention. Three to 24 hours before the procedure, the patients received either a 300-mg loading dose of clopidogrel or placebo; afterward, all patients received clopidogrel 75 mg/day for 28 days. All patients also received aspirin.
A clopidogrel loading dose 3 to 24 hours before the intervention did not produce a statistically significant reduction in ischemic events, although a post hoc subgroup analysis suggested that patients who received the loading dose between 6 and 24 hours before did benefit, with a relative risk reduction of 38.6% in the composite end point (P = .051).
After 28 days, the patients who had received the clopidogrel loading dose were continued on clopidogrel, while those in the placebo group were switched back to placebo. At 1 year, the investigators found a significantly lower rate of the composite end point with the prolonged course of clopidogrel (8.5% vs 11.5%).
In summary, these studies found clopidogrel to be beneficial in a broad spectrum of coronary diseases. Subgroup analyses suggest that pretreatment before percutaneous coronary intervention provides additional benefit, particularly if clopidogrel is given at least 6 hours in advance (the time necessary for clopidogrel to cause substantial platelet inhibition).
SOME PATIENTS RESPOND LESS TO CLOPIDOGREL
The level of platelet inhibition induced by clopidogrel varies. In different studies, the frequency of clopidogrel “nonresponsiveness” ranged from 5% to 56% of patients, depending on which test and which cutoff values were used. The distribution of responses to clopidogrel is wide and fits a normal gaussian curve.10
A large fraction of the population carries a gene that may account for some of the interpatient variation in platelet inhibition with clopidogrel. Carriers of a reduced-function CYP2C19 allele—approximately 30% of people in one study—have significantly lower levels of the active metabolite of clopidogrel, less platelet inhibition from clopidogrel therapy, and a 53% higher rate of death from cardiovascular causes, MI, or stroke.11
PRASUGREL, THE NEWEST THIENOPYRIDINE
Prasugrel, FDA-approved in July 2009 for the treatment of acute coronary syndromes, is given in an oral loading dose of 60 mg followed by an oral maintenance dose of 10 mg daily.
Pharmacology of prasugrel vs clopidogrel
As noted previously, the thienopyridines are prodrugs that require hepatic conversion to exert antiplatelet effects.
Metabolism. Prasugrel’s hepatic activation involves a single step, in contrast to the multiple-step process required for activation of clopidogrel. Clopidogrel is primarily hydrolyzed by intestinal and plasma esterases to an inactive terminal metabolite, with the residual unhydrolized drug undergoing a two-step metabolism that depends on cytochrome P450 enzymes. Prasugrel is also extensively hydrolyzed by these esterases, but the intermediate product is then metabolized in a single step to the active sulfhydryl compound, mainly by CYP3A4 and CYP2B6.
Thus, about 80% of an orally absorbed dose of prasugrel is converted to active drug, compared with only 10% to 20% of absorbed clopidogrel.
Time to peak effect. With clopidogrel, maximal inhibition of platelet aggregation occurs 3 to 5 days after starting therapy with 75 mg daily without a loading dose, but within 4 to 6 hours if a loading dose of 300 to 600 mg is given. In contrast, a prasugrel loading dose produces more than 80% of its platelet inhibitory effects by 30 minutes, and peak activity is observed within 4 hours.12 The platelet inhibition induced by prasugrel at 30 minutes after administration is comparable to the peak effect of clopidogrel at 6 hours.13
Dose-response. Prasugrel’s inhibition of platelet aggregation is dose-related.
Prasugrel is about 10 times more potent than clopidogrel and 100 times more potent than ticlopidine. Thus, treatment with 5 mg of prasugrel results in inhibition of platelet activity (distributed in a gaussian curve) very similar to that produced by 75 mg of clopidogrel. On the other hand, even a maintenance dose of 150 mg of clopidogrel inhibits platelet activity to a lesser degree than 10 mg of prasugrel (46% vs 61%),14 so clopidogrel appears to reach a plateau of platelet inhibition that prasugrel can overcome.
At the approved dose of prasugrel, inhibition of platelet aggregation is significantly greater and there are fewer “nonresponders” than with clopidogrel.
Interactions. Drugs that inhibit CYP3A4 do not inhibit the efficacy of prasugrel, but they can inhibit that of clopidogrel. Some commonly used drugs that have this effect are the statins (eg, atorvastain [Lipitor]) and the macrolide antibiotics (eg, erythromycin). Furthermore, whereas proton pump inhibitors have been shown to diminish the effect of clopidogrel by reducing the formation of its active metabolite, no such effect has been noted with prasugrel.
Prasugrel in phase 2 trials: Finding the optimal dosage
A phase 2 trial compared three prasugrel regimens (loading dose/daily maintenance dose of 40 mg/7.5 mg, 60 mg/10 mg, and 60 mg/15 mg) and standard clopidogrel therapy (300 mg/75 mg) in patients undergoing elective or urgent percutaneous coronary intervention.15 No significant difference in outcomes was seen in the groups receiving the three prasugrel regimens. However, more “minimal bleeding events” (defined by the criteria of the TIMI trial16) occurred with high-dose prasugrel than with lower-dose prasugrel or with clopidogrel, leading to use of the intermediate-dose prasugrel regimen (60-mg loading dose, 10-mg daily maintenance) for later trials.
Another phase 2 trial randomized 201 patients undergoing elective percutaneous coronary intervention to receive prasugrel 60 mg/10 mg or clopidogrel 600 mg/150 mg.14 In all patients, the loading dose was given about 1 hour before cardiac catheterization. As soon as 30 minutes after the loading dose, platelet inhibition was superior with prasugrel (31% vs 5% inhibition of platelet aggregation), and it remained significantly higher at 6 hours (75% vs 32%) and during the maintenance phase (61% vs 46%).
Phase 3 trial of prasugrel vs clopidogrel: TRITON-TIMI 38
Only one large phase 3 trial of prasugrel has been completed: TRITON-TIMI 38 (the Trial to Assess Improvement in Therapeutic Outcomes by Optimizing Platelet Inhibition With Prasugrel—Thrombolysis in Myocardial Infarction),17 which enrolled adults with moderate-risk to high-risk acute coronary syndromes scheduled to undergo a percutaneous coronary intervention. In this trial, 10,074 patients were enrolled who had moderate-to high-risk unstable angina or non-ST-elevation MI, and 3,534 patients were enrolled who had ST-elevation MI.
Patients were randomized to receive prasugrel (a 60-mg loading dose, then 10 mg daily) or clopidogrel (a 300-mg loading dose, then 75 mg daily) and were treated for 6 to 15 months. All patients also received aspirin.
These benefits came at a price of more bleeding. Of those patients who did not undergo coronary artery bypass grafting, more experienced bleeding in the prasugrel group than in the clopidogrel group (2.4% vs 1.8%, P = .03), including a higher rate of life-threatening bleeding (1.4% vs 0.89%, P = .01) and fatal bleeding (0.4% vs 0.1%, P = .002). More patients discontinued prasugrel because of hemorrhage (2.5% vs 1.4%, P < .001). In patients who proceeded to coronary artery bypass grafting, the rate of major bleeding was more than four times higher in those who received prasugrel than in those who received clopidogrel (13.4% vs 3.2%, P < .001).
A higher rate of adverse events related to colon cancer was also noted in patients treated with prasugrel, although the authors suggest this may have resulted from the stronger antiplatelet effects of prasugrel bringing more tumors to medical attention due to bleeding.
Overall death rates did not differ significantly between the treatment groups.
In a post hoc analysis,18 prasugrel was superior to clopidogrel in preventing ischemic events both during the first 3 days following randomization (the “loading phase”) and for the remainder of the trial (the “maintenance phase”). Whereas bleeding risk was similar with the two drugs during the loading phase, prasugrel was subsequently associated with more bleeding during the maintenance phase.
Certain patient subgroups had no net benefit or even suffered harm from prasugrel compared with clopidogrel.17 Patients with previous stroke or transient ischemic attack had net harm from prasugrel (hazard ratio 1.54, P = .04) and showed a strong trend toward a greater rate of major bleeding (P = .06). Patients age 75 and older and those weighing less than 60 kg had no net benefit from prasugrel.
Cost of prasugrel
Prasugrel is currently priced at 18% more than clopidogrel, with average wholesale prices per pill of $6.65 for prasugrel 10 mg compared with $5.63 for clopidogrel 75 mg. (Prasugrel 10-mg pills cost $6.33 at drugstore.com or $7.60 at CVS; clopidogrel 75-mg pills cost $5.33 at drugstore.com or $6.43 at CVS.) The patent on clopidogrel expires in November 2011, after which the price differential is expected to become significantly greater.
TICAGRELOR, A REVERSIBLE ORAL AGENT
Ticagrelor, the first reversible oral P2Y12 receptor antagonist, is an alternative to thienopyridine therapy for acute coronary syndromes.
Ticagrelor is quickly absorbed, does not require metabolic activation, and has a rapid antiplatelet effect and offset of effect, which closely follow drug-exposure levels. In a large randomized controlled trial in patients with acute coronary syndromes with or without STsegment elevation, treatment with ticagrelor compared with clopidogrel resulted in a significant reduction in death from vascular causes, MI, or stroke (9.8% vs 11.7%).19
Given its reversible effect on platelet inhibition, ticagrelor may be preferred in patients whose coronary anatomy is unknown and for whom coronary artery bypass grafting is deemed probable. It is still undergoing trials and is not yet approved.
TAKE-HOME POINTS
Prasugrel is more potent, more rapid in onset, and more consistent in inhibiting platelet aggregation than clopidogrel. A large clinical trial17 found prasugrel to be superior to clopidogrel for patients with moderate-to high-risk acute coronary syndromes with high probability of undergoing a percutaneous coronary intervention.
Who should receive prasugrel, and how?
Prasugrel should be given after angiography to patients with non-ST-elevation acute coronary syndromes or at presentation to patients with ST-elevation MI. When used for planned percutaneous coronary intervention, prasugrel should be given at least 30 minutes before the intervention, as was done in phase 2 trials (although its routine use in this situation is not recommended—see below).
It is given in a one-time loading dose of 60 mg by mouth and then maintained with 10 mg by mouth once daily for at least 1 year. (At least 9 months of treatment with a thienopyridine is indicated for patients with acute coronary syndromes who are medically treated, and at least 1 year is indicated following urgent or elective percutaneous coronary intervention, including balloon angioplasty and placement of a bare-metal or drug-eluting stent.)
Who should not receive prasugrel?
For now, prasugrel should be avoided in favor of clopidogrel in patients at higher risk of bleeding. It is clearly contraindicated in patients with prior transient ischemic attack or stroke, for whom the risk of serious bleeding seems to be prohibitive. It should generally be avoided in patients age 75 and older, although it might be considered in those at particularly high risk of stent thrombosis, such as those with diabetes or prior MI. In patients weighing less than 60 kg, the package insert advises a reduced dose (5 mg), although clinical evidence for this practice is lacking.
As yet, we have no data assuring that prasugrel is safe to use in combination with fibrinolytic agents, so patients on thrombolytic therapy for acute MI should continue to receive clopidogrel starting immediately after lysis. Furthermore, in patients who proceeded to coronary artery bypass grafting, the rate of major bleeding was more than four times higher in the prasugrel group than in the clopidogrel group in the TRITON-TIMI 38 trial.17 No thienopyridine should be given to patients likely to proceed to coronary artery bypass grafting.
Only clopidogrel has evidence supporting its use as an alternative to aspirin for patients with atherosclerotic disease who cannot tolerate aspirin. Neither drug has evidence for use for primary prevention.
Other areas of uncertainty
Prior to angiography. Indications for prasugrel are currently limited by the narrow scope of the trial data. TRITON-TIMI 38,17 the only large trial completed to date, randomized patients to receive prasugrel only after their coronary anatomy was known, except for ST-elevation MI patients. It is unknown whether the benefits of prasugrel will outweigh the higher risk of bleeding in patients with acute coronary syndromes who do not proceed to percutaneous coronary interventions.
A clinical trial is currently under way comparing prasugrel with clopidogrel in 10,000 patients with acute coronary syndromes who will be medically managed without planned revascularization: A Comparison of Prasugrel and Clopidogrel in Acute Coronary Syndrome Subjects (TRILOGY ACS), ClinicalTrials.gov Identifier: NCT00699998. The trial has an estimated completion date of March 2011.
In cases of non-ST-elevation acute coronary syndrome, it is reasonable to wait to give a thienopyridine until after the coronary anatomy has been defined, if angiography will be completed soon after presentation. For example, a 1-hour delay before giving prasugrel still delivers antiplatelet therapy more quickly than giving clopidogrel on presentation. If longer delays are expected before angiography, however, the patient should be given a loading dose of clopidogrel “up front,” in accordance with guidelines published by the American College of Cardiology, American Heart Association, and European Society of Cardiology,20 which recommend starting a thienopyridine early during hospitalization based on trial data with clopidogrel.
Patients undergoing elective percutaneous coronary intervention are at lower risk of stent thrombosis and other ischemic complications, so it is possible that the benefits of prasugrel would not outweigh the risks in these patients. Thus, prasugrel cannot yet be recommended for routine elective percutaneous coronary intervention except in individual cases in which the interventionalist feels that the patient may be at higher risk of thrombosis.
- Yeghiazarians Y, Braunstein JB, Askari A, Stone PH. Unstable angina pectoris. N Engl J Med 2000; 342:101–114.
- Yusuf S, Zhao F, Mehta SR, Chrolavicius S, Tognoni G, Fox KK; Clopidogrel in Unstable Angina to Prevent Recurrent Events Trial Investigators. Effects of clopidogrel in addition to aspirin in patients with acute coronary syndromes without ST-segment elevation. N Engl J Med 2001; 345:494–502.
- Balsano F, Rizzon P, Violi F, et al. Antiplatelet treatment with ticlopidine in unstable angina. A controlled multicenter clinical trial. The Studio della Ticlopidina nell'Angina Instabile Group. Circulation 1990; 82:17–26.
- Schömig A, Neumann FJ, Kastrati A, et al. A randomized comparison of antiplatelet and anticoagulant therapy after the placement of coronary-artery stents. N Engl J Med 1996; 334:1084–1089.
- Mehta SR, Yusuf S, Peters RJG, et al; Clopidogrel in Unstable Angina to Prevent Recurrent Events Trial (CURE) Investigators. Effects of pretreatment with clopidogrel and aspirin followed by long-term therapy in patients undergoing percutaneous coronary intervention: the PCI-CURE study. Lancet 2001; 358:527–533.
- Sabatine MS, Cannon CP, Gibson CM, et al; CLA RITY-TIMI 28 Investigators. Addition of clopidogrel to aspirin and fibrinolytic therapy for myocardial infarction with STsegment elevation. N Engl J Med 2005; 352:1179–1189.
- Sabatine MS, Cannon CP, Gibson CM, et al; Clopidogrel as Adjunctive Reperfusion Therapy (CLARITY)-Thrombolysis in Myocardial Infarction (TIMI) 28 Investigators. Effect of clopidogrel pretreatment before percutaneous coronary intervention in patients with ST-elevation myocardial infarction treated with fibrinolytics: the PCI-CLARITY study. JAMA 2005: 294:1224–1232.
- Chen ZM, Jiang LX, Chen YP, et al; COMMIT (ClOpidogrel and Metoprolol in Myocardial Infarction Trial) collaborative group. Addition of clopidogrel to aspirin in 45,852 patients with acute myocardial infarction: randomised placebo-controlled trial. Lancet 2005; 366:1607–1621.
- Steinhubl SR, Berger PB, Mann JT, et al; CREDO Investigators. Clopidogrel for the reduction of events during observation. Early and sustained dual oral antiplatelet therapy following percutaneous coronary intervention: a randomized controlled trial. JAMA 2002; 288:2411–2420.
- Serebruany VL, Steinhubl SR, Berger PB, Malinin AI, Bhatt DL, Topol EJ. Variability in platelet responsiveness to clopidogrel among 544 individuals. J Am Coll Cardiol 2005; 45:246–251.
- Mega JL, Close SL, Wiviott SD, et al. Cytochrome P-450 polymorphisms and response to clopidogrel. N Engl J Med 2009; 360:354–362.
- Helft G, Osende JI, Worthley SG, et al. Acute antithrombotic effect of a front-loaded regimen of clopidogrel in patients with atherosclerosis on aspirin. Arterioscler Thromb Vasc Biol 2000; 20:2316–2321.
- Weerakkody GJ, Jakubowski JA, Brandt JT, et al. Comparison of speed of onset of platelet inhibition after loading doses of clopidogrel versus prasugrel in healthy volunteers and correlation with responder status. Am J Cardiol 2007; 100:331–336.
- Wiviott SD, Trenk D, Frelinger AL, et al; PRINCIPLETIMI 44 Investigators. Prasugrel compared with high loading-and maintenance-dose clopidogrel in patients with planned percutaneous coronary intervention: the Prasugrel in Comparison to Clopidogrel for Inhibition of Platelet Activation and Aggregation-Thrombolysis in Myocardial Infarction 44 trial. Circulation 2007; 116:2923–2932.
- Wiviott SD, Antman EM, Winters KJ, et al; JUMBO-TIMI 26 Investigators. Randomized comparison of prasugrel (CS-747, LY640315), a novel thienopyridine P2Y12 antagonist, with clopidogrel in percutaneous coronary intervention: results of the Joint Utilization of Medications to Block Platelets Optimally (JUMBO)-TIMI 26 Trial. Circulation 2005; 111:3366–3373.
- Bovill EG, Terrin ML, Stump DC, et al. Hemorrhagic events during therapy with recombinant tissue-type plasminogen activator, heparin, and aspirin for acute myocardial infarction. Results of the Thrombolysis in Myocardial Infarction (TIMI) Phase II Trial. Ann Intern Med 1991; 115:256–265.
- Wiviott SD, Braunwald E, McCabe CH, et al; TRITONTIMI 38 Investigators. Prasugrel versus clopidogrel in patients with acute coronary syndromes. N Engl J Med 2007; 357:2001–2015.
- Antman EM, Wiviott SD, Murphy SA, et al. Early and late benefits of prasugrel in patients with acute coronary syndromes undergoing percutaneous coronary intervention: a TRITON-TIMI 38 (TRial to Assess Improvement in Therapeutic Outcomes by Optimizing Platelet InhibitioN with Prasugrel-Thrombolysis In Myocardial Infarction) analysis. J Am Coll Cardiol 2008; 51:2028–2033.
- Wallentin L, Becker RC, Budaj A, Freij A, Thorsén M, et al; PLATO Investigators. Ticagrelor versus clopidogrel in patients with acute coronary syndromes. N Engl J Med 2009; 361:1045–1057.
- Braunwald E, Antman EM, Beasley JW, et al. ACC/AHA 2002 guideline update for the management of patients with unstable angina and non–ST-segment elevation myocardial infarction—summary article*1: A report of the American College of Cardiology/American Heart Association task force on practice guidelines (Committee on the Management of Patients With Unstable Angina). J Am Coll Cardiol 2002; 40:1366–1374.
Prasugrel (Effient) is more potent and consistent in its effects than clopidogrel (Plavix), thus preventing more thrombotic events—but at a price of more bleeding. Therefore, the drugs must be appropriately selected for the individual patient.
Over the last 9 years, the thienopyridines—ticlopidine (Ticlid), clopidogrel, and now prasugrel—have become essential tools for treating acute coronary syndromes.
The usual underlying mechanism of acute coronary syndromes is thrombosis, caused by rupture of atherosclerotic plaque.1 Accordingly, antithrombotic agents—aspirin, heparin, lowmolecular-weight heparin, glycoprotein IIb/IIIa inhibitors, the direct thrombin inhibitor bivalirudin (Angiomax), and thienopyridines—have all been shown to reduce the risk of major adverse cardiac outcomes in this setting.
In this article, we review the pharmacology and evidence of effectiveness of the thienopyridine drugs, focusing on prasugrel, the latest thienopyridine to be approved by the US Food and Drug Administration (FDA).
THIENOPYRIDINES INHIBIT PLATELET ACTIVATION AND AGGREGATION
Thienopyridines are prodrugs that require conversion by hepatic cytochrome P450 enzymes. The active metabolites bind irreversibly to platelet P2Y12 receptors. Consequently, they permanently block signalling mediated by platelet adenosine diphosphate-P2Y12 receptors, thereby inhibiting glycoprotein IIb/IIIa receptor activation and platelet aggregation.
Aspirin, in contrast, inhibits platelets by blocking the thromboxane-mediated pathway. Therefore, the combination of aspirin plus a thienopyridine has an additive effect.2
The effect of thienopyridines on platelets is irreversible. Therefore, although the half-life of prasugrel’s active metabolite is 3.7 hours, its inhibitory effects last for 96 hours, essentially the time for half the body’s circulating platelets to be replaced.
TICLOPIDINE, THE FIRST THIENOPYRIDINE
Ticlopidine was the first thienopyridine to be approved by the FDA. Its initial studies in unstable angina were small, their designs did not call for patients to concurrently receive aspirin, and all they showed was that ticlopidine was about as beneficial as aspirin. Consequently, the studies had little impact on clinical practice.3
In a pivotal trial,4 patients who received coronary stents were randomized to afterward receive either the combination of ticlopidine plus aspirin or anticoagulation therapy with heparin, phenprocoumon (a coumarin derivative available in Europe), and aspirin. At 30 days, an ischemic complication (death, myocardial infarction [MI], repeat intervention) had occurred in 6.2% of the anticoagulation therapy group vs 1.6% of the ticlopidine group, a risk reduction of 75%. Rates of stent occlusion, MI, and revascularization were 80% to 85% lower in the ticlodipine group. This study paved the way for widespread use of thienopyridines.
Ticlopidine’s use was limited, however, by a 2.4% incidence of serious granulocytopenia and rare cases of thrombocytopenic purpura.
BENEFIT OF CLOPIDOGREL
Although prasugrel is the focus of this review, the trials of prasugrel all compared its efficacy with that of clopidogrel. Furthermore, many patients should still receive clopidogrel and not prasugrel, so it is important to be familiar with the evidence of clopidogrel’s benefit.
Once approved for clinical use, clopidogrel was substituted for ticlopidine in patients undergoing coronary stenting on the basis of studies showing it to be at least as effective as ticlopidine and more tolerable. A series of trials of clopidogrel were done in patients across a spectrum of risk groups, from those at high risk of coronary heart disease to those presenting with ST-elevation MI. The time of pretreatment in the studies ranged from 3 hours to 6 days before percutaneous coronary intervention, and the duration of treatment following intervention ranged from 30 days to 1 year.
Clopidogrel in non-ST-elevation acute coronary syndromes
The CURE trial2 (Clopidogrel in Unstable Angina to Prevent Recurrent Events), published in 2001, established clopidogrel as a therapy for unstable ischemic syndromes, whether treated medically or with revascularization. In that trial, 12,562 patients with acute coronary syndromes without ST elevation (ie, unstable angina or non-ST-elevation MI), as defined by electrocardiographic changes or positive cardiac markers, were randomized to receive clopidogrel (a 300-mg loading dose followed by 75-mg maintenance doses) or placebo for a mean duration of 9 months. All patients also received aspirin 75 mg to 325 mg daily.
The composite outcome of death from cardiovascular causes, nonfatal MI, or stroke occurred in 20% fewer patients treated with clopidogrel than with placebo (9.3% vs 11.4%). The benefit was similar in patients undergoing revascularization compared with those treated medically.
Although there were significantly more cases of major bleeding in the clopidogrel group than in the placebo group (3.7% vs 2.7%), the number of episodes of life-threatening bleeding or hemorrhagic strokes was the same.
PCI-CURE5 was a substudy of the CURE trial in patients who underwent a percutaneous coronary intervention. Patients were pretreated with clopidogrel or placebo for a mean of 6 days before the procedure. Afterward, they all received clopidogrel plus aspirin in an unblinded fashion for 2 to 4 weeks, and then the randomized study drug was resumed for a mean of 8 months.
Significantly fewer adverse events occurred in the clopidogrel group as tallied at the time of the intervention, 1 month later, and 8 months later.
Clopidogrel in ST-elevation acute MI
The CLARITY-TIMI 28 trial6 (Clopidogrel as Adjunctive Reperfusion Therapy—Thrombolysis in Myocardial Infarction 28) showed that adding clopidogrel (a 300-mg loading dose, then 75 mg daily) to aspirin benefitted patients with ST-elevation MI receiving fibrinolytic therapy. At 30 days, cardiovascular death, recurrent MI, or urgent revascularization had occurred in 11.6% of the clopidogrel group vs 14.1% of the placebo group, a statistically significant difference. The rates of major or minor bleeding were no higher in the clopidogrel group than in the placebo group, an especially remarkable finding in patients receiving thrombolytic therapy.
PCI-CLARITY.7 About half of the patients in the CLARITY trial ultimately underwent a percutaneous coronary intervention after fibrinolytic therapy, with results reported as the PCI-CLARITY substudy. Like those in PCI-CURE, these patients were randomized to receive pretreatment with either clopidogrel or placebo before the procedure, in this study for a median of 3 days. Both groups received clopidogrel afterward. At 30 days from randomization, the outcome of cardiovascular death, MI, or stroke had occurred in 7.5% of the clopidogrel group compared with 12.0% of the placebo group, which was statistically significant, without any significant excess in the rates of major or minor bleeding.
COMMIT8 (the Clopidogrel and Metoprolol in Myocardial Infarction Trial) also showed clopidogrel to be beneficial in patients with acute MI. This trial included more than 45,000 patients in China with acute MI, 93% of whom had ST-segment elevation. In contrast to CLARITY, in COMMIT barely more than half of the patients received fibrinolysis, fewer than 5% proceeded to percutaneous interventions, and no loading dose was given: patients in the clopidogrel group received 75 mg/day from the outset.
At 15 days, the incidence of death, reinfarction, or stroke was 9.2% with clopidogrel compared with 10.1% with placebo, a small but statistically significant difference. Again, the rate of major bleeding was not significantly higher, either overall or in patients over age 70.
Of note, patients over age 75 were excluded from CLARITY, and as mentioned, no loading dose was used in COMMIT. Thus, for patients receiving fibrinolysis who are over age 75, there is no evidence to support the safety of a loading dose, and clopidogrel should be started at 75 mg daily.
Clopidogrel in elective percutaneous coronary intervention
The CREDO trial9 (Clopidogrel for the Reduction of Events During Observation) was in patients referred for elective percutaneous coronary intervention. Three to 24 hours before the procedure, the patients received either a 300-mg loading dose of clopidogrel or placebo; afterward, all patients received clopidogrel 75 mg/day for 28 days. All patients also received aspirin.
A clopidogrel loading dose 3 to 24 hours before the intervention did not produce a statistically significant reduction in ischemic events, although a post hoc subgroup analysis suggested that patients who received the loading dose between 6 and 24 hours before did benefit, with a relative risk reduction of 38.6% in the composite end point (P = .051).
After 28 days, the patients who had received the clopidogrel loading dose were continued on clopidogrel, while those in the placebo group were switched back to placebo. At 1 year, the investigators found a significantly lower rate of the composite end point with the prolonged course of clopidogrel (8.5% vs 11.5%).
In summary, these studies found clopidogrel to be beneficial in a broad spectrum of coronary diseases. Subgroup analyses suggest that pretreatment before percutaneous coronary intervention provides additional benefit, particularly if clopidogrel is given at least 6 hours in advance (the time necessary for clopidogrel to cause substantial platelet inhibition).
SOME PATIENTS RESPOND LESS TO CLOPIDOGREL
The level of platelet inhibition induced by clopidogrel varies. In different studies, the frequency of clopidogrel “nonresponsiveness” ranged from 5% to 56% of patients, depending on which test and which cutoff values were used. The distribution of responses to clopidogrel is wide and fits a normal gaussian curve.10
A large fraction of the population carries a gene that may account for some of the interpatient variation in platelet inhibition with clopidogrel. Carriers of a reduced-function CYP2C19 allele—approximately 30% of people in one study—have significantly lower levels of the active metabolite of clopidogrel, less platelet inhibition from clopidogrel therapy, and a 53% higher rate of death from cardiovascular causes, MI, or stroke.11
PRASUGREL, THE NEWEST THIENOPYRIDINE
Prasugrel, FDA-approved in July 2009 for the treatment of acute coronary syndromes, is given in an oral loading dose of 60 mg followed by an oral maintenance dose of 10 mg daily.
Pharmacology of prasugrel vs clopidogrel
As noted previously, the thienopyridines are prodrugs that require hepatic conversion to exert antiplatelet effects.
Metabolism. Prasugrel’s hepatic activation involves a single step, in contrast to the multiple-step process required for activation of clopidogrel. Clopidogrel is primarily hydrolyzed by intestinal and plasma esterases to an inactive terminal metabolite, with the residual unhydrolized drug undergoing a two-step metabolism that depends on cytochrome P450 enzymes. Prasugrel is also extensively hydrolyzed by these esterases, but the intermediate product is then metabolized in a single step to the active sulfhydryl compound, mainly by CYP3A4 and CYP2B6.
Thus, about 80% of an orally absorbed dose of prasugrel is converted to active drug, compared with only 10% to 20% of absorbed clopidogrel.
Time to peak effect. With clopidogrel, maximal inhibition of platelet aggregation occurs 3 to 5 days after starting therapy with 75 mg daily without a loading dose, but within 4 to 6 hours if a loading dose of 300 to 600 mg is given. In contrast, a prasugrel loading dose produces more than 80% of its platelet inhibitory effects by 30 minutes, and peak activity is observed within 4 hours.12 The platelet inhibition induced by prasugrel at 30 minutes after administration is comparable to the peak effect of clopidogrel at 6 hours.13
Dose-response. Prasugrel’s inhibition of platelet aggregation is dose-related.
Prasugrel is about 10 times more potent than clopidogrel and 100 times more potent than ticlopidine. Thus, treatment with 5 mg of prasugrel results in inhibition of platelet activity (distributed in a gaussian curve) very similar to that produced by 75 mg of clopidogrel. On the other hand, even a maintenance dose of 150 mg of clopidogrel inhibits platelet activity to a lesser degree than 10 mg of prasugrel (46% vs 61%),14 so clopidogrel appears to reach a plateau of platelet inhibition that prasugrel can overcome.
At the approved dose of prasugrel, inhibition of platelet aggregation is significantly greater and there are fewer “nonresponders” than with clopidogrel.
Interactions. Drugs that inhibit CYP3A4 do not inhibit the efficacy of prasugrel, but they can inhibit that of clopidogrel. Some commonly used drugs that have this effect are the statins (eg, atorvastain [Lipitor]) and the macrolide antibiotics (eg, erythromycin). Furthermore, whereas proton pump inhibitors have been shown to diminish the effect of clopidogrel by reducing the formation of its active metabolite, no such effect has been noted with prasugrel.
Prasugrel in phase 2 trials: Finding the optimal dosage
A phase 2 trial compared three prasugrel regimens (loading dose/daily maintenance dose of 40 mg/7.5 mg, 60 mg/10 mg, and 60 mg/15 mg) and standard clopidogrel therapy (300 mg/75 mg) in patients undergoing elective or urgent percutaneous coronary intervention.15 No significant difference in outcomes was seen in the groups receiving the three prasugrel regimens. However, more “minimal bleeding events” (defined by the criteria of the TIMI trial16) occurred with high-dose prasugrel than with lower-dose prasugrel or with clopidogrel, leading to use of the intermediate-dose prasugrel regimen (60-mg loading dose, 10-mg daily maintenance) for later trials.
Another phase 2 trial randomized 201 patients undergoing elective percutaneous coronary intervention to receive prasugrel 60 mg/10 mg or clopidogrel 600 mg/150 mg.14 In all patients, the loading dose was given about 1 hour before cardiac catheterization. As soon as 30 minutes after the loading dose, platelet inhibition was superior with prasugrel (31% vs 5% inhibition of platelet aggregation), and it remained significantly higher at 6 hours (75% vs 32%) and during the maintenance phase (61% vs 46%).
Phase 3 trial of prasugrel vs clopidogrel: TRITON-TIMI 38
Only one large phase 3 trial of prasugrel has been completed: TRITON-TIMI 38 (the Trial to Assess Improvement in Therapeutic Outcomes by Optimizing Platelet Inhibition With Prasugrel—Thrombolysis in Myocardial Infarction),17 which enrolled adults with moderate-risk to high-risk acute coronary syndromes scheduled to undergo a percutaneous coronary intervention. In this trial, 10,074 patients were enrolled who had moderate-to high-risk unstable angina or non-ST-elevation MI, and 3,534 patients were enrolled who had ST-elevation MI.
Patients were randomized to receive prasugrel (a 60-mg loading dose, then 10 mg daily) or clopidogrel (a 300-mg loading dose, then 75 mg daily) and were treated for 6 to 15 months. All patients also received aspirin.
These benefits came at a price of more bleeding. Of those patients who did not undergo coronary artery bypass grafting, more experienced bleeding in the prasugrel group than in the clopidogrel group (2.4% vs 1.8%, P = .03), including a higher rate of life-threatening bleeding (1.4% vs 0.89%, P = .01) and fatal bleeding (0.4% vs 0.1%, P = .002). More patients discontinued prasugrel because of hemorrhage (2.5% vs 1.4%, P < .001). In patients who proceeded to coronary artery bypass grafting, the rate of major bleeding was more than four times higher in those who received prasugrel than in those who received clopidogrel (13.4% vs 3.2%, P < .001).
A higher rate of adverse events related to colon cancer was also noted in patients treated with prasugrel, although the authors suggest this may have resulted from the stronger antiplatelet effects of prasugrel bringing more tumors to medical attention due to bleeding.
Overall death rates did not differ significantly between the treatment groups.
In a post hoc analysis,18 prasugrel was superior to clopidogrel in preventing ischemic events both during the first 3 days following randomization (the “loading phase”) and for the remainder of the trial (the “maintenance phase”). Whereas bleeding risk was similar with the two drugs during the loading phase, prasugrel was subsequently associated with more bleeding during the maintenance phase.
Certain patient subgroups had no net benefit or even suffered harm from prasugrel compared with clopidogrel.17 Patients with previous stroke or transient ischemic attack had net harm from prasugrel (hazard ratio 1.54, P = .04) and showed a strong trend toward a greater rate of major bleeding (P = .06). Patients age 75 and older and those weighing less than 60 kg had no net benefit from prasugrel.
Cost of prasugrel
Prasugrel is currently priced at 18% more than clopidogrel, with average wholesale prices per pill of $6.65 for prasugrel 10 mg compared with $5.63 for clopidogrel 75 mg. (Prasugrel 10-mg pills cost $6.33 at drugstore.com or $7.60 at CVS; clopidogrel 75-mg pills cost $5.33 at drugstore.com or $6.43 at CVS.) The patent on clopidogrel expires in November 2011, after which the price differential is expected to become significantly greater.
TICAGRELOR, A REVERSIBLE ORAL AGENT
Ticagrelor, the first reversible oral P2Y12 receptor antagonist, is an alternative to thienopyridine therapy for acute coronary syndromes.
Ticagrelor is quickly absorbed, does not require metabolic activation, and has a rapid antiplatelet effect and offset of effect, which closely follow drug-exposure levels. In a large randomized controlled trial in patients with acute coronary syndromes with or without STsegment elevation, treatment with ticagrelor compared with clopidogrel resulted in a significant reduction in death from vascular causes, MI, or stroke (9.8% vs 11.7%).19
Given its reversible effect on platelet inhibition, ticagrelor may be preferred in patients whose coronary anatomy is unknown and for whom coronary artery bypass grafting is deemed probable. It is still undergoing trials and is not yet approved.
TAKE-HOME POINTS
Prasugrel is more potent, more rapid in onset, and more consistent in inhibiting platelet aggregation than clopidogrel. A large clinical trial17 found prasugrel to be superior to clopidogrel for patients with moderate-to high-risk acute coronary syndromes with high probability of undergoing a percutaneous coronary intervention.
Who should receive prasugrel, and how?
Prasugrel should be given after angiography to patients with non-ST-elevation acute coronary syndromes or at presentation to patients with ST-elevation MI. When used for planned percutaneous coronary intervention, prasugrel should be given at least 30 minutes before the intervention, as was done in phase 2 trials (although its routine use in this situation is not recommended—see below).
It is given in a one-time loading dose of 60 mg by mouth and then maintained with 10 mg by mouth once daily for at least 1 year. (At least 9 months of treatment with a thienopyridine is indicated for patients with acute coronary syndromes who are medically treated, and at least 1 year is indicated following urgent or elective percutaneous coronary intervention, including balloon angioplasty and placement of a bare-metal or drug-eluting stent.)
Who should not receive prasugrel?
For now, prasugrel should be avoided in favor of clopidogrel in patients at higher risk of bleeding. It is clearly contraindicated in patients with prior transient ischemic attack or stroke, for whom the risk of serious bleeding seems to be prohibitive. It should generally be avoided in patients age 75 and older, although it might be considered in those at particularly high risk of stent thrombosis, such as those with diabetes or prior MI. In patients weighing less than 60 kg, the package insert advises a reduced dose (5 mg), although clinical evidence for this practice is lacking.
As yet, we have no data assuring that prasugrel is safe to use in combination with fibrinolytic agents, so patients on thrombolytic therapy for acute MI should continue to receive clopidogrel starting immediately after lysis. Furthermore, in patients who proceeded to coronary artery bypass grafting, the rate of major bleeding was more than four times higher in the prasugrel group than in the clopidogrel group in the TRITON-TIMI 38 trial.17 No thienopyridine should be given to patients likely to proceed to coronary artery bypass grafting.
Only clopidogrel has evidence supporting its use as an alternative to aspirin for patients with atherosclerotic disease who cannot tolerate aspirin. Neither drug has evidence for use for primary prevention.
Other areas of uncertainty
Prior to angiography. Indications for prasugrel are currently limited by the narrow scope of the trial data. TRITON-TIMI 38,17 the only large trial completed to date, randomized patients to receive prasugrel only after their coronary anatomy was known, except for ST-elevation MI patients. It is unknown whether the benefits of prasugrel will outweigh the higher risk of bleeding in patients with acute coronary syndromes who do not proceed to percutaneous coronary interventions.
A clinical trial is currently under way comparing prasugrel with clopidogrel in 10,000 patients with acute coronary syndromes who will be medically managed without planned revascularization: A Comparison of Prasugrel and Clopidogrel in Acute Coronary Syndrome Subjects (TRILOGY ACS), ClinicalTrials.gov Identifier: NCT00699998. The trial has an estimated completion date of March 2011.
In cases of non-ST-elevation acute coronary syndrome, it is reasonable to wait to give a thienopyridine until after the coronary anatomy has been defined, if angiography will be completed soon after presentation. For example, a 1-hour delay before giving prasugrel still delivers antiplatelet therapy more quickly than giving clopidogrel on presentation. If longer delays are expected before angiography, however, the patient should be given a loading dose of clopidogrel “up front,” in accordance with guidelines published by the American College of Cardiology, American Heart Association, and European Society of Cardiology,20 which recommend starting a thienopyridine early during hospitalization based on trial data with clopidogrel.
Patients undergoing elective percutaneous coronary intervention are at lower risk of stent thrombosis and other ischemic complications, so it is possible that the benefits of prasugrel would not outweigh the risks in these patients. Thus, prasugrel cannot yet be recommended for routine elective percutaneous coronary intervention except in individual cases in which the interventionalist feels that the patient may be at higher risk of thrombosis.
- Yeghiazarians Y, Braunstein JB, Askari A, Stone PH. Unstable angina pectoris. N Engl J Med 2000; 342:101–114.
- Yusuf S, Zhao F, Mehta SR, Chrolavicius S, Tognoni G, Fox KK; Clopidogrel in Unstable Angina to Prevent Recurrent Events Trial Investigators. Effects of clopidogrel in addition to aspirin in patients with acute coronary syndromes without ST-segment elevation. N Engl J Med 2001; 345:494–502.
- Balsano F, Rizzon P, Violi F, et al. Antiplatelet treatment with ticlopidine in unstable angina. A controlled multicenter clinical trial. The Studio della Ticlopidina nell'Angina Instabile Group. Circulation 1990; 82:17–26.
- Schömig A, Neumann FJ, Kastrati A, et al. A randomized comparison of antiplatelet and anticoagulant therapy after the placement of coronary-artery stents. N Engl J Med 1996; 334:1084–1089.
- Mehta SR, Yusuf S, Peters RJG, et al; Clopidogrel in Unstable Angina to Prevent Recurrent Events Trial (CURE) Investigators. Effects of pretreatment with clopidogrel and aspirin followed by long-term therapy in patients undergoing percutaneous coronary intervention: the PCI-CURE study. Lancet 2001; 358:527–533.
- Sabatine MS, Cannon CP, Gibson CM, et al; CLA RITY-TIMI 28 Investigators. Addition of clopidogrel to aspirin and fibrinolytic therapy for myocardial infarction with STsegment elevation. N Engl J Med 2005; 352:1179–1189.
- Sabatine MS, Cannon CP, Gibson CM, et al; Clopidogrel as Adjunctive Reperfusion Therapy (CLARITY)-Thrombolysis in Myocardial Infarction (TIMI) 28 Investigators. Effect of clopidogrel pretreatment before percutaneous coronary intervention in patients with ST-elevation myocardial infarction treated with fibrinolytics: the PCI-CLARITY study. JAMA 2005: 294:1224–1232.
- Chen ZM, Jiang LX, Chen YP, et al; COMMIT (ClOpidogrel and Metoprolol in Myocardial Infarction Trial) collaborative group. Addition of clopidogrel to aspirin in 45,852 patients with acute myocardial infarction: randomised placebo-controlled trial. Lancet 2005; 366:1607–1621.
- Steinhubl SR, Berger PB, Mann JT, et al; CREDO Investigators. Clopidogrel for the reduction of events during observation. Early and sustained dual oral antiplatelet therapy following percutaneous coronary intervention: a randomized controlled trial. JAMA 2002; 288:2411–2420.
- Serebruany VL, Steinhubl SR, Berger PB, Malinin AI, Bhatt DL, Topol EJ. Variability in platelet responsiveness to clopidogrel among 544 individuals. J Am Coll Cardiol 2005; 45:246–251.
- Mega JL, Close SL, Wiviott SD, et al. Cytochrome P-450 polymorphisms and response to clopidogrel. N Engl J Med 2009; 360:354–362.
- Helft G, Osende JI, Worthley SG, et al. Acute antithrombotic effect of a front-loaded regimen of clopidogrel in patients with atherosclerosis on aspirin. Arterioscler Thromb Vasc Biol 2000; 20:2316–2321.
- Weerakkody GJ, Jakubowski JA, Brandt JT, et al. Comparison of speed of onset of platelet inhibition after loading doses of clopidogrel versus prasugrel in healthy volunteers and correlation with responder status. Am J Cardiol 2007; 100:331–336.
- Wiviott SD, Trenk D, Frelinger AL, et al; PRINCIPLETIMI 44 Investigators. Prasugrel compared with high loading-and maintenance-dose clopidogrel in patients with planned percutaneous coronary intervention: the Prasugrel in Comparison to Clopidogrel for Inhibition of Platelet Activation and Aggregation-Thrombolysis in Myocardial Infarction 44 trial. Circulation 2007; 116:2923–2932.
- Wiviott SD, Antman EM, Winters KJ, et al; JUMBO-TIMI 26 Investigators. Randomized comparison of prasugrel (CS-747, LY640315), a novel thienopyridine P2Y12 antagonist, with clopidogrel in percutaneous coronary intervention: results of the Joint Utilization of Medications to Block Platelets Optimally (JUMBO)-TIMI 26 Trial. Circulation 2005; 111:3366–3373.
- Bovill EG, Terrin ML, Stump DC, et al. Hemorrhagic events during therapy with recombinant tissue-type plasminogen activator, heparin, and aspirin for acute myocardial infarction. Results of the Thrombolysis in Myocardial Infarction (TIMI) Phase II Trial. Ann Intern Med 1991; 115:256–265.
- Wiviott SD, Braunwald E, McCabe CH, et al; TRITONTIMI 38 Investigators. Prasugrel versus clopidogrel in patients with acute coronary syndromes. N Engl J Med 2007; 357:2001–2015.
- Antman EM, Wiviott SD, Murphy SA, et al. Early and late benefits of prasugrel in patients with acute coronary syndromes undergoing percutaneous coronary intervention: a TRITON-TIMI 38 (TRial to Assess Improvement in Therapeutic Outcomes by Optimizing Platelet InhibitioN with Prasugrel-Thrombolysis In Myocardial Infarction) analysis. J Am Coll Cardiol 2008; 51:2028–2033.
- Wallentin L, Becker RC, Budaj A, Freij A, Thorsén M, et al; PLATO Investigators. Ticagrelor versus clopidogrel in patients with acute coronary syndromes. N Engl J Med 2009; 361:1045–1057.
- Braunwald E, Antman EM, Beasley JW, et al. ACC/AHA 2002 guideline update for the management of patients with unstable angina and non–ST-segment elevation myocardial infarction—summary article*1: A report of the American College of Cardiology/American Heart Association task force on practice guidelines (Committee on the Management of Patients With Unstable Angina). J Am Coll Cardiol 2002; 40:1366–1374.
KEY POINTS
- The thienopyridines—ticlopidine (Ticlid), clopidogrel (Plavix), and now prasugrel—reduce the risk of death from and serious complications of acute coronary syndromes by inhibiting platelet aggregation.
- Compared with clopidogrel, prasugrel is more potent, faster in onset, and more consistent in inhibiting platelets.
- Prasugrel should be avoided in patients at higher risk of bleeding, including those with a history of stroke or transient ischemic attack, those age 75 or older, or those who weigh less than 60 kg.