User login
The State of Hospital Medicine Is Strong
Editor's Note: Listen to Dr. Smith share more of his views on the State of Hospital Medicine report.
2016 is the “Year of the Hospitalist,” a sobriquet meant as a proud nod to the specialty’s maturation as a fixture in hospitals across the country. Hospital medicine is no longer the new kid on the block as it has assumed care for the vast majority of hospitalized patients nationwide.
One could understand then if the ever-rising salaries hospitalists have commanded for 20 years might have finally plateaued, particularly as tightening budgets have C-suite administrators looking to trim costs.
Think again.

“Growth suggests that there is still a huge demand,” says Leslie Flores, MHA, a partner in Nelson Flores Hospital Medicine Consultants and a member of SHM’s Practice Analysis Committee. “The demand for hospitalists still exceeds the supply, and so recruiting hospitalists, particularly to nonurban areas, is really challenging and is requiring more money.”
The SoHM is a biennial partnership between SHM and MGMA that provides HM group leaders and rank-and-file hospitalists a litany of benchmarks for salaries, workloads, and everything that informs those two topics. Call it the specialty’s empirical roadmap.
“Often, compensation information relative to staffing information is proprietary, so hospitalists are in a position where they are dependent upon their hospital stakeholders to have access to this information, but they are also the same stakeholders with whom they negotiate their contracts,” says G. Randy Smith, MD, MS, FRCP(Edin), SFHM, an assistant professor in the Division of Hospital Medicine at Northwestern University Feinberg School of Medicine in Chicago and a member of SHM’s Practice Analysis Committee. “The State of Hospital Medicine report by SHM provides an opportunity for hospitalists to have an independent view of the compensation and workforce distribution factors that can impact negotiations with their hospital stakeholders. It’s a very powerful tool.”
Compensation Data
Rachel Lovins, MD, SFHM, CPE, voraciously reads every SoHM report because she uses its keynote compensation data to benchmark what she should pay her staff.
“I make a promise to my group,” says Dr. Lovins, chief of hospital medicine and vice chair of the Department of Medicine at Middlesex Hospital in Middletown, Conn. “I promise them that we will always be at or above what is standard for our areas. So for me, I have to look every time.”
Promises like that are getting more expensive to keep.
Hospitalists in the East region earn a median compensation of $245,977, up 3.1% from the $238,676 figure reported in 2014. But the East, where the bulk of the country’s population lives and where competition for hospitalists is typically lessened, is by far the lowest-paid region.
Hospitalists in the South continue to earn the most, with a median compensation of $301,833, up a whopping 16.9% from $258,020 from 2013. Hospitalists in the West earned a median of $275,658 (up 10.3% from $249,894), while Midwestern hospitalists saw a median compensation of $285,213 (up 8.9% from $261,868).
In addition to year-over-year growth, HM is also seeing outsized growth as compared with family medicine physicians, according to MGMA data. From 2011 to 2015, family medicine hospitalists saw an average compensation increase of 4.7%, bringing the average salary to $285,213. During the same period, family medicine physicians who are not hospitalists and don’t practice obstetrics saw an average annual compensation increase of only 3%, bringing the average salary to $230,456.
“The hospitalist can save the hospital considerable amounts of money because of their ability to better manage the patient and improve the quality of care at the same time,” says David Gans, MSHA, FACMPE, MGMA’s senior fellow of industry affairs. “Hospitals, they have recognized that, and therefore, there is considerable competition for recruiting and retaining hospitalists.”
To that end, 96.3% of HM groups (HMGs) received financial support in addition to their professional fee revenue. That’s up from 89% of HMGs that relied last year on their host hospitals. The median support is $157,535 per full-time employee (FTE), up just 1%. Correspondingly, SoHM reported 8.5% of HMGs received enough income from professional fee revenue to cover expenses, up from 6% two years ago.
Industry watchers predicted that, in two years, fee revenue would have to rise to offset hospitals’ inability to pay. The early returns seem to show that bearing out.
“We’re pretty close to that breaking point,” Flores says. “When we go around the country and do consulting work, we are hearing many more hospital leaders telling us, ‘We’re concerned about how much money this program is costing us, and we are getting to the point where we can’t afford it.’”
Productivity Stalls
While compensation continues to climb, productivity flattened out in this year’s report.
Median relative value units (RVUs) dipped slightly from the figure reported in 2014, to 4,252 from 4,297. But the tally is still ahead of 2012’s total of 4,159. Median collection-to-work RVUs also ticked down from 2014’s tally, to $50.29 from $51.50 in 2013.
Flores largely attributes the falling metrics of productivity to the evolution of HMGs that have standardized their scheduling to the point that most HMGs now offer vacation time.
“So the number of groups that are working 182 days is fewer, and we see a lot more groups that are working something like 168 days or 172 days,” she says. “And if a hospitalist works fewer shifts, even if they see the same number of patients per shift, they’re going to generate less productivity over the course of the year, so that’s part of it.”
Andrew White, MD, SFHM, director of the HM service at the University of Washington Medical Center in Seattle, says the report’s value is in avoiding a myopic approach to how HMGs operate. For example, RVUs are an important metric of productivity, but not all shifts should be expected to produce the same.
For example, it’d be valuable to use the report to see how hard your nocturnists are working compared with other sites, says Dr. White, also a member of the Practice Analysis Committee.
“The fundamental issue with working at night is that not everybody wants to do it, and so you have to recognize that it’s a pain to do and you have to either pay those people more, have them work less, or acknowledge that they’re going to be less productive,” he says. “We use the survey to assess all three of those things and then can work with our nocturnists to reach an agreement about a fair approach to their job structure that’s actually informed by national benchmarks. That process has helped us to pick, for example, how many nights per year they should work or what their salaries should look like compared to the day hospitalists.”
Dr. White says that because the report is comprehensive and includes broad participation, he’s able to use it as a benchmark to make hiring and service structure decisions.
“It also helps me to keep abreast of some trends that may be occurring in the broader workplace that we aren’t participating in but maybe should be or should be thinking about,” he says.
The report’s subsections are also critical for comparing one HMG to others, Dr. White says.
“Obviously, there is the aggregate data there to look at the average program,” he says. “But really as a hospitalist group leader, you want to know what are other programs like mine doing, and it allows you to drill down into that data.”
Survey Limitations
Any hospitalist worth their weight in scrubs knows that any medical study is only as good as its limitations. And while SoHM is a trove of valuable data information, Flores always cautions against taking data points as gospel.
“People should understand what the numbers are telling us, what goes into those numbers, and take them not with a grain of salt but take them for what they are,” she says.
For example, Flores says, look at productivity metrics per shift. Day shifts have traditionally driven that figure, and those shifts are typically busy. But night shifts have fewer patients and less productivity.
“So as more and more hospitals get 24-hour in-house coverage and have doctors working low-productivity night shifts, that [productivity] number might fall,” she says.
That sort of nuanced analysis of productivity can’t be found anywhere else, says Dr. Lovins.
These are “data that we don’t normally get from our administration,” she says, “information on things like staffing and patient loads, and how much more the director makes than the people that work for the director, and how much more nighttime people make than daytime people make. There is no other way for me to get that information, and it’s very important to make sure that our program is fair.”
Aside from fair, the data points are essential talking points as HMGs negotiate contracts and other arrangements with their administrators.
“It’s a reference point so that everybody feels like we’re using data from a national source that everyone can agree upon as fair,” says Dr. White.
In Dr. White’s case, he doesn’t have many local academic programs to benchmark against. And comparing to private, for-profit hospitals isn’t the proverbial apples-to-apples comparison. Having vetted regional and national figures for comparison is incredibly valuable, particularly since he doesn’t have to compile the data.
“If I had to go call all those group leaders and figure out what they were doing, it would be pretty exhausting,” he says.
Alternative Payment Models
Dr. Smith says that one area where the report will become even more valuable over the next few years is addressing alternative payment models (APMs). In particular, HM leaders say they’re excited about being drivers in one of the largest APMs: the Bundled Payments for Care Improvement (BCPI) initiative. In short, the program covers 48 defined episodes of care, including medical and surgical, that could begin three days prior to admission and stretch 30, 60, or 90 days post-discharge.
Dr. Smith thinks it’s still a bit too early to see from the report how APMs have affected compensation.
“We’re still relatively in the early days of bundled-payment models, so in that regard, the State of Hospital Medicine Report still represents very much a starting point with regard to where hospital medicine groups will find themselves as they start to encounter challenges,” he says.
Perhaps more important, Gans doesn’t expect that the maturation of APMs will result in decreased compensation for hospitalists.
“In a hospital environment where the hospital is being reimbursed a set amount for a complete hospital admission and follow-up care and potential readmissions, that is an episodic payment already,” he says. “Consequently, the incentive is there today to better manage the patient and to attain the care coordination and care management necessary for that patient to be discharged and not readmitted.”
In fact, the SHM/MGMA data tell him that the basic economic theory of supply and demand continues to drive hospitalist compensation even 20 years after the field was given its name. He says rising compensation, even as more practices look to hire nurse practitioners or physician assistants as less expensive alternatives, shows no sign of letting up.
“I think demand will continue to be there,” Gans adds. “There may be in the long run some lessening of demand for hospitalists, but I don’t see that for years.”
Richard Quinn is a freelance writer in New Jersey.
Is Burnout a Problem?

Burnout has become a major concern across the healthcare spectrum, particularly in cognitive fields such as hospital medicine where physicians can work long days or weeks with little sleep and a lot of pressure.
But despite hospitalists branching into multiple new arenas over the past decade (surgical co-management and informatics, to name a few), burnout has never registered as a significant problem in SHM’s reports. In fact, the 2016 State of Hospital Medicine Report finds that the median turnover rate for physicians “only continues to decline year after year.”
The biennial report found a turnover rate of 6.9% for responding physicians who serve adults only. That’s down from 8% in 2014 and 14% in 2010.
Turnover rate, however, may not be the best measure of burnout levels, one hospitalist admits.
“It could be tempting to think that a decrease in turnover rates would equal to decreased burnout—it might also be that individuals could get so burnt out everywhere that they no longer see that leaving one hospital medicine group for another is a viable cure,” says G. Randy Smith, MD, MS, FRCP(Edin), SFHM, an assistant professor in the Division of Hospital Medicine at Northwestern University Feinberg School of Medicine in Chicago and a member of SHM’s Practice Analysis Committee.
Dr. Smith says SHM is actively trying to address burnout outside of the SoHM but that additional questions added to the report in future years could help home in on the phenomenon.
“There are other ways that burnout can manifest,” he adds. “There is concern that it can manifest in decreased patient satisfaction, in more sick leave, diagnostic error, and decreased ability to teach effectively in academic institutions. … Burnout can still very much remain an issue for a hospitalist group even if they see that their turnover rates are level relative to a regional or national average.”
—Richard Quinn
Editor's Note: Listen to Dr. Smith share more of his views on the State of Hospital Medicine report.
2016 is the “Year of the Hospitalist,” a sobriquet meant as a proud nod to the specialty’s maturation as a fixture in hospitals across the country. Hospital medicine is no longer the new kid on the block as it has assumed care for the vast majority of hospitalized patients nationwide.
One could understand then if the ever-rising salaries hospitalists have commanded for 20 years might have finally plateaued, particularly as tightening budgets have C-suite administrators looking to trim costs.
Think again.
“Growth suggests that there is still a huge demand,” says Leslie Flores, MHA, a partner in Nelson Flores Hospital Medicine Consultants and a member of SHM’s Practice Analysis Committee. “The demand for hospitalists still exceeds the supply, and so recruiting hospitalists, particularly to nonurban areas, is really challenging and is requiring more money.”
The SoHM is a biennial partnership between SHM and MGMA that provides HM group leaders and rank-and-file hospitalists a litany of benchmarks for salaries, workloads, and everything that informs those two topics. Call it the specialty’s empirical roadmap.
“Often, compensation information relative to staffing information is proprietary, so hospitalists are in a position where they are dependent upon their hospital stakeholders to have access to this information, but they are also the same stakeholders with whom they negotiate their contracts,” says G. Randy Smith, MD, MS, FRCP(Edin), SFHM, an assistant professor in the Division of Hospital Medicine at Northwestern University Feinberg School of Medicine in Chicago and a member of SHM’s Practice Analysis Committee. “The State of Hospital Medicine report by SHM provides an opportunity for hospitalists to have an independent view of the compensation and workforce distribution factors that can impact negotiations with their hospital stakeholders. It’s a very powerful tool.”
Compensation Data
Rachel Lovins, MD, SFHM, CPE, voraciously reads every SoHM report because she uses its keynote compensation data to benchmark what she should pay her staff.
“I make a promise to my group,” says Dr. Lovins, chief of hospital medicine and vice chair of the Department of Medicine at Middlesex Hospital in Middletown, Conn. “I promise them that we will always be at or above what is standard for our areas. So for me, I have to look every time.”
Promises like that are getting more expensive to keep.
Hospitalists in the East region earn a median compensation of $245,977, up 3.1% from the $238,676 figure reported in 2014. But the East, where the bulk of the country’s population lives and where competition for hospitalists is typically lessened, is by far the lowest-paid region.
Hospitalists in the South continue to earn the most, with a median compensation of $301,833, up a whopping 16.9% from $258,020 from 2013. Hospitalists in the West earned a median of $275,658 (up 10.3% from $249,894), while Midwestern hospitalists saw a median compensation of $285,213 (up 8.9% from $261,868).
In addition to year-over-year growth, HM is also seeing outsized growth as compared with family medicine physicians, according to MGMA data. From 2011 to 2015, family medicine hospitalists saw an average compensation increase of 4.7%, bringing the average salary to $285,213. During the same period, family medicine physicians who are not hospitalists and don’t practice obstetrics saw an average annual compensation increase of only 3%, bringing the average salary to $230,456.
“The hospitalist can save the hospital considerable amounts of money because of their ability to better manage the patient and improve the quality of care at the same time,” says David Gans, MSHA, FACMPE, MGMA’s senior fellow of industry affairs. “Hospitals, they have recognized that, and therefore, there is considerable competition for recruiting and retaining hospitalists.”
To that end, 96.3% of HM groups (HMGs) received financial support in addition to their professional fee revenue. That’s up from 89% of HMGs that relied last year on their host hospitals. The median support is $157,535 per full-time employee (FTE), up just 1%. Correspondingly, SoHM reported 8.5% of HMGs received enough income from professional fee revenue to cover expenses, up from 6% two years ago.
Industry watchers predicted that, in two years, fee revenue would have to rise to offset hospitals’ inability to pay. The early returns seem to show that bearing out.
“We’re pretty close to that breaking point,” Flores says. “When we go around the country and do consulting work, we are hearing many more hospital leaders telling us, ‘We’re concerned about how much money this program is costing us, and we are getting to the point where we can’t afford it.’”
Productivity Stalls
While compensation continues to climb, productivity flattened out in this year’s report.
Median relative value units (RVUs) dipped slightly from the figure reported in 2014, to 4,252 from 4,297. But the tally is still ahead of 2012’s total of 4,159. Median collection-to-work RVUs also ticked down from 2014’s tally, to $50.29 from $51.50 in 2013.
Flores largely attributes the falling metrics of productivity to the evolution of HMGs that have standardized their scheduling to the point that most HMGs now offer vacation time.
“So the number of groups that are working 182 days is fewer, and we see a lot more groups that are working something like 168 days or 172 days,” she says. “And if a hospitalist works fewer shifts, even if they see the same number of patients per shift, they’re going to generate less productivity over the course of the year, so that’s part of it.”
Andrew White, MD, SFHM, director of the HM service at the University of Washington Medical Center in Seattle, says the report’s value is in avoiding a myopic approach to how HMGs operate. For example, RVUs are an important metric of productivity, but not all shifts should be expected to produce the same.
For example, it’d be valuable to use the report to see how hard your nocturnists are working compared with other sites, says Dr. White, also a member of the Practice Analysis Committee.
“The fundamental issue with working at night is that not everybody wants to do it, and so you have to recognize that it’s a pain to do and you have to either pay those people more, have them work less, or acknowledge that they’re going to be less productive,” he says. “We use the survey to assess all three of those things and then can work with our nocturnists to reach an agreement about a fair approach to their job structure that’s actually informed by national benchmarks. That process has helped us to pick, for example, how many nights per year they should work or what their salaries should look like compared to the day hospitalists.”
Dr. White says that because the report is comprehensive and includes broad participation, he’s able to use it as a benchmark to make hiring and service structure decisions.
“It also helps me to keep abreast of some trends that may be occurring in the broader workplace that we aren’t participating in but maybe should be or should be thinking about,” he says.
The report’s subsections are also critical for comparing one HMG to others, Dr. White says.
“Obviously, there is the aggregate data there to look at the average program,” he says. “But really as a hospitalist group leader, you want to know what are other programs like mine doing, and it allows you to drill down into that data.”
Survey Limitations
Any hospitalist worth their weight in scrubs knows that any medical study is only as good as its limitations. And while SoHM is a trove of valuable data information, Flores always cautions against taking data points as gospel.
“People should understand what the numbers are telling us, what goes into those numbers, and take them not with a grain of salt but take them for what they are,” she says.
For example, Flores says, look at productivity metrics per shift. Day shifts have traditionally driven that figure, and those shifts are typically busy. But night shifts have fewer patients and less productivity.
“So as more and more hospitals get 24-hour in-house coverage and have doctors working low-productivity night shifts, that [productivity] number might fall,” she says.
That sort of nuanced analysis of productivity can’t be found anywhere else, says Dr. Lovins.
These are “data that we don’t normally get from our administration,” she says, “information on things like staffing and patient loads, and how much more the director makes than the people that work for the director, and how much more nighttime people make than daytime people make. There is no other way for me to get that information, and it’s very important to make sure that our program is fair.”
Aside from fair, the data points are essential talking points as HMGs negotiate contracts and other arrangements with their administrators.
“It’s a reference point so that everybody feels like we’re using data from a national source that everyone can agree upon as fair,” says Dr. White.
In Dr. White’s case, he doesn’t have many local academic programs to benchmark against. And comparing to private, for-profit hospitals isn’t the proverbial apples-to-apples comparison. Having vetted regional and national figures for comparison is incredibly valuable, particularly since he doesn’t have to compile the data.
“If I had to go call all those group leaders and figure out what they were doing, it would be pretty exhausting,” he says.
Alternative Payment Models
Dr. Smith says that one area where the report will become even more valuable over the next few years is addressing alternative payment models (APMs). In particular, HM leaders say they’re excited about being drivers in one of the largest APMs: the Bundled Payments for Care Improvement (BCPI) initiative. In short, the program covers 48 defined episodes of care, including medical and surgical, that could begin three days prior to admission and stretch 30, 60, or 90 days post-discharge.
Dr. Smith thinks it’s still a bit too early to see from the report how APMs have affected compensation.
“We’re still relatively in the early days of bundled-payment models, so in that regard, the State of Hospital Medicine Report still represents very much a starting point with regard to where hospital medicine groups will find themselves as they start to encounter challenges,” he says.
Perhaps more important, Gans doesn’t expect that the maturation of APMs will result in decreased compensation for hospitalists.
“In a hospital environment where the hospital is being reimbursed a set amount for a complete hospital admission and follow-up care and potential readmissions, that is an episodic payment already,” he says. “Consequently, the incentive is there today to better manage the patient and to attain the care coordination and care management necessary for that patient to be discharged and not readmitted.”
In fact, the SHM/MGMA data tell him that the basic economic theory of supply and demand continues to drive hospitalist compensation even 20 years after the field was given its name. He says rising compensation, even as more practices look to hire nurse practitioners or physician assistants as less expensive alternatives, shows no sign of letting up.
“I think demand will continue to be there,” Gans adds. “There may be in the long run some lessening of demand for hospitalists, but I don’t see that for years.”
Richard Quinn is a freelance writer in New Jersey.
Is Burnout a Problem?
Burnout has become a major concern across the healthcare spectrum, particularly in cognitive fields such as hospital medicine where physicians can work long days or weeks with little sleep and a lot of pressure.
But despite hospitalists branching into multiple new arenas over the past decade (surgical co-management and informatics, to name a few), burnout has never registered as a significant problem in SHM’s reports. In fact, the 2016 State of Hospital Medicine Report finds that the median turnover rate for physicians “only continues to decline year after year.”
The biennial report found a turnover rate of 6.9% for responding physicians who serve adults only. That’s down from 8% in 2014 and 14% in 2010.
Turnover rate, however, may not be the best measure of burnout levels, one hospitalist admits.
“It could be tempting to think that a decrease in turnover rates would equal to decreased burnout—it might also be that individuals could get so burnt out everywhere that they no longer see that leaving one hospital medicine group for another is a viable cure,” says G. Randy Smith, MD, MS, FRCP(Edin), SFHM, an assistant professor in the Division of Hospital Medicine at Northwestern University Feinberg School of Medicine in Chicago and a member of SHM’s Practice Analysis Committee.
Dr. Smith says SHM is actively trying to address burnout outside of the SoHM but that additional questions added to the report in future years could help home in on the phenomenon.
“There are other ways that burnout can manifest,” he adds. “There is concern that it can manifest in decreased patient satisfaction, in more sick leave, diagnostic error, and decreased ability to teach effectively in academic institutions. … Burnout can still very much remain an issue for a hospitalist group even if they see that their turnover rates are level relative to a regional or national average.”
—Richard Quinn
Health sector claims 4 spots among top 10 lobbyers in 2016
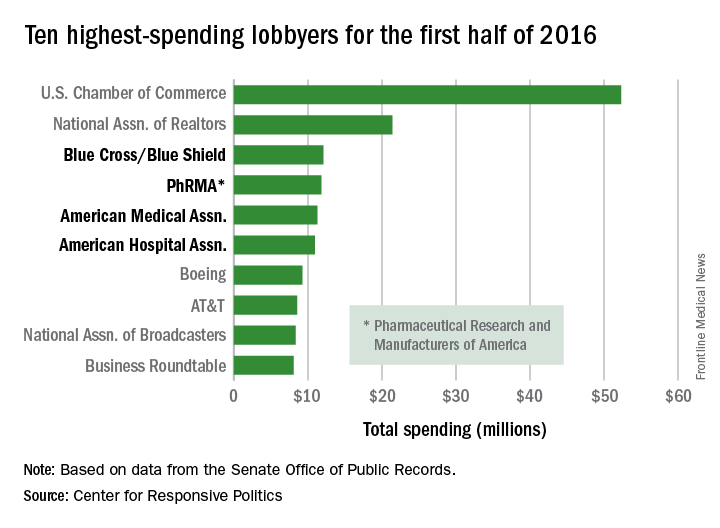
Four of the 10 highest-spending lobbyers for the first half of 2016 were in the health sector, with Blue Cross/Blue Shield occupying the sector’s top spot by a relatively small margin, according to the Center for Responsive Politics.
The four health-sectors concerns filled spots 3-6 in the overall top 10. Blue Cross/Blue Shield spent almost $12.1 million on lobbying in the first half of the year, putting it just ahead of the Pharmaceutical Research and Manufacturers of America (PhRMA), which spent $11.8 million. The American Medical Association was next at $11.3 million, followed by the American Hospital Association at $10.9 million, the center reported on OpenSecrets.org.

After those four, the next-highest health-sector spender was Pfizer, which put up almost $6.2 million in lobbying – good for 18th place for the first half of 2016. The health sector itself was the highest spending of the 121 ranked, taking a $266 million bite out of the total $1.6 billion lobbying pie for the year so far, according to the center’s analysis of data downloaded from the Senate Office of Public Records on Aug. 9.
The perennial leading spender on lobbying, the U.S. Chamber of Commerce, was well ahead of second place, with its $52.3 million more than doubling the $21.4 million spent by the National Association of Realtors. The two groups have finished 1-2 in lobbying spending every year since 2012, and the Chamber of Commerce has been the leading spender since 2001, data on OpenSecrets show.
Four of the 10 highest-spending lobbyers for the first half of 2016 were in the health sector, with Blue Cross/Blue Shield occupying the sector’s top spot by a relatively small margin, according to the Center for Responsive Politics.
The four health-sectors concerns filled spots 3-6 in the overall top 10. Blue Cross/Blue Shield spent almost $12.1 million on lobbying in the first half of the year, putting it just ahead of the Pharmaceutical Research and Manufacturers of America (PhRMA), which spent $11.8 million. The American Medical Association was next at $11.3 million, followed by the American Hospital Association at $10.9 million, the center reported on OpenSecrets.org.
After those four, the next-highest health-sector spender was Pfizer, which put up almost $6.2 million in lobbying – good for 18th place for the first half of 2016. The health sector itself was the highest spending of the 121 ranked, taking a $266 million bite out of the total $1.6 billion lobbying pie for the year so far, according to the center’s analysis of data downloaded from the Senate Office of Public Records on Aug. 9.
The perennial leading spender on lobbying, the U.S. Chamber of Commerce, was well ahead of second place, with its $52.3 million more than doubling the $21.4 million spent by the National Association of Realtors. The two groups have finished 1-2 in lobbying spending every year since 2012, and the Chamber of Commerce has been the leading spender since 2001, data on OpenSecrets show.
Study: One hour with patients means two hours on EHR
Physicians are spending twice as much time on electronic health records as they are face to face with patients, according to a new study by the American Medical Association.
Researchers observed 57 physicians in four specialties (family medicine, internal medicine, cardiology, and orthopedics) and found that for every hour of direct clinical face time with patients, nearly 2 additional hours is spent on EHR and desk work within the clinic day. Additionally, based on diaries kept by 21 of the participating physicians, another 1-2 hours of personal time were spent each night doing additional computer and clerical work, according to the study published Sept. 5 in Annals of Internal Medicine (2016. doi: 10.7326/M16-0961).

“Over the years, doctors have recognized that more and more of their time was spent on nonpatient care, activities but probably haven’t recognized the magnitude of that change,” Christine Sinsky, MD, vice president of professional satisfaction at the AMA and lead author on the study, said in an interview. “Our study was able to help to quantify that and paint that picture.”
Overall, physicians spent 27% of their day dealing directly with patients, while 49% of the time was spent on EHR and desk work. In the examination room with patients, physicians spent 53% of time on direct clinical face time and 37% on EHR and desk work.
The situation “is the cumulative effect of many, many well-intended efforts that individually might have made sense, but taken collectively have paradoxically made it harder for physicians to deliver quality of care and harder for patients to get the quality of care they deserve,” she said.
EHR development should be focused on reducing the time-cost of providing care on their platforms, Dr. Sinsky recommended.
She noted that for her practice, it takes 32 clicks to order and record a flu shot. “I think vendors have a responsibility to minimize time, to minimize clicks involved in a task.”
She added that “regulators have a responsibility to not just add more and more regulations without first identifying the time-cost of complying with that regulation and without adding up the total cost of complying with regulation.”
Future regulations on EHRs must add flexibility when it comes to who is entering information into the system, she said. “Many regulations are either written with the explicit statement – or it is implied or an institution might overinterpret the regulation – that the physician is the one who must do the keyboarding into the record,” she said, noting that although not primarily studied in the research, preliminary data suggests that doctors who had documentation support were able to spend more time with their patients.
Finally, physicians themselves need to be stronger advocates for the changes they need to enable them to better serve their patients.
In addition to Dr. Sinsky, three other study authors are employed by AMA, which funded the study. No other financial conflicts were reported.
Physicians are spending twice as much time on electronic health records as they are face to face with patients, according to a new study by the American Medical Association.
Researchers observed 57 physicians in four specialties (family medicine, internal medicine, cardiology, and orthopedics) and found that for every hour of direct clinical face time with patients, nearly 2 additional hours is spent on EHR and desk work within the clinic day. Additionally, based on diaries kept by 21 of the participating physicians, another 1-2 hours of personal time were spent each night doing additional computer and clerical work, according to the study published Sept. 5 in Annals of Internal Medicine (2016. doi: 10.7326/M16-0961).
“Over the years, doctors have recognized that more and more of their time was spent on nonpatient care, activities but probably haven’t recognized the magnitude of that change,” Christine Sinsky, MD, vice president of professional satisfaction at the AMA and lead author on the study, said in an interview. “Our study was able to help to quantify that and paint that picture.”
Overall, physicians spent 27% of their day dealing directly with patients, while 49% of the time was spent on EHR and desk work. In the examination room with patients, physicians spent 53% of time on direct clinical face time and 37% on EHR and desk work.
The situation “is the cumulative effect of many, many well-intended efforts that individually might have made sense, but taken collectively have paradoxically made it harder for physicians to deliver quality of care and harder for patients to get the quality of care they deserve,” she said.
EHR development should be focused on reducing the time-cost of providing care on their platforms, Dr. Sinsky recommended.
She noted that for her practice, it takes 32 clicks to order and record a flu shot. “I think vendors have a responsibility to minimize time, to minimize clicks involved in a task.”
She added that “regulators have a responsibility to not just add more and more regulations without first identifying the time-cost of complying with that regulation and without adding up the total cost of complying with regulation.”
Future regulations on EHRs must add flexibility when it comes to who is entering information into the system, she said. “Many regulations are either written with the explicit statement – or it is implied or an institution might overinterpret the regulation – that the physician is the one who must do the keyboarding into the record,” she said, noting that although not primarily studied in the research, preliminary data suggests that doctors who had documentation support were able to spend more time with their patients.
Finally, physicians themselves need to be stronger advocates for the changes they need to enable them to better serve their patients.
In addition to Dr. Sinsky, three other study authors are employed by AMA, which funded the study. No other financial conflicts were reported.
FROM ANNALS OF INTERNAL MEDICINE

CMS offers lower-stress reporting options for MACRA in 2017
Physicians will have options for when they can start meeting the requirements for the Merit-based Incentive Payment System (MIPS) track under regulations that implement the Medicare Access and CHIP Reauthorization Act.
The options are designed to allow physicians a variety of ways to get started with the new Quality Payment Program – the term CMS has given the MACRA-legislated reforms – and provide more limited ways to participate in 2017.
Option 1: Test the quality payment program in 2017 by submitting data without facing any negative payment adjustments. This will give physicians the year to make sure their processes are in place and ready for broader participation in 2018 and beyond.
Option 2: Delay the start of the performance period and participate for just part of 2017. Depending on how long a physician delays reporting quality information back to CMS, they could still qualify for a smaller bonus payment.
Option 3: Participate for the entire calendar year as called for by the law and be eligible for the full participation bonuses.
Option 4: For those who qualify, participate in an Advanced Alternative Payment Model (APM) beginning next year.
The final regulations for implementing MACRA will be released on Nov. 1, CMS Acting Administrator Andy Slavitt wrote in a blog post published Sept. 8.
“However you choose to participate in 2017, we will have resources available to assist you and walk you through what needs to be done,” Mr. Slavitt wrote.

ACOs score slight bump in bonus payments
Accountable care organizations participating in the Medicare Shared Savings Program generated $466 million in savings in 2015, up from $411 million in 2014, the Centers for Medicare & Medicaid Services announced.
Despite the growth in savings, there was little growth in the number of ACOs that qualified for bonus payments based on the savings they were able to generate.

Of 392 participants in Medicare Shared Savings Programand 12 Pioneer ACO Model participants, 31% (125) received bonus payments in 2015, as compared with 27% (97 organizations from a pool of 20 Pioneer ACOs and 333 ACO shared savings program participants) in 2014, according to a CMS report.
The agency noted that another 83 ACOs in the Shared Savings Program and two Pioneer ACOs generated savings in 2015 but did not qualify for bonus payments. Of the four Pioneer ACOs that recorded losses, only one incurred losses great enough to require payment to CMS.
On the quality side, the mean quality score among Pioneer ACOs increased to 92% in 2015, the fourth year of the program, up from 87% in 2014. Quality scores have risen each year, with a growth of 21% from the first year.
Participants in the Shared Savings Program that reported quality measures in both 2014 and 2015 improved on 84% of the quality measures that were reported in both years. In four measures – screening risk for future falls, depression screening and follow-up, blood pressure screening and follow-up, and administering pneumonia vaccine – the average quality performance improvement was more than 15% year-over-year.
The National Association of ACOs said it was “disappointed” in the small bump in financial bonuses.
“The results are not as strong as we, and many of our ACO members, had hoped for,” NAACOS President and CEO Clif Gaus, ScD, said in a statement. “But overall, we are pleased to see the results show a positive trend for the program,” noting that despite being only a few years old, the the participating ACOs “have accomplished a lot to reduce cost and improve quality.”
Accountable care organizations participating in the Medicare Shared Savings Program generated $466 million in savings in 2015, up from $411 million in 2014, the Centers for Medicare & Medicaid Services announced.
Despite the growth in savings, there was little growth in the number of ACOs that qualified for bonus payments based on the savings they were able to generate.
Of 392 participants in Medicare Shared Savings Programand 12 Pioneer ACO Model participants, 31% (125) received bonus payments in 2015, as compared with 27% (97 organizations from a pool of 20 Pioneer ACOs and 333 ACO shared savings program participants) in 2014, according to a CMS report.
The agency noted that another 83 ACOs in the Shared Savings Program and two Pioneer ACOs generated savings in 2015 but did not qualify for bonus payments. Of the four Pioneer ACOs that recorded losses, only one incurred losses great enough to require payment to CMS.
On the quality side, the mean quality score among Pioneer ACOs increased to 92% in 2015, the fourth year of the program, up from 87% in 2014. Quality scores have risen each year, with a growth of 21% from the first year.
Participants in the Shared Savings Program that reported quality measures in both 2014 and 2015 improved on 84% of the quality measures that were reported in both years. In four measures – screening risk for future falls, depression screening and follow-up, blood pressure screening and follow-up, and administering pneumonia vaccine – the average quality performance improvement was more than 15% year-over-year.
The National Association of ACOs said it was “disappointed” in the small bump in financial bonuses.
“The results are not as strong as we, and many of our ACO members, had hoped for,” NAACOS President and CEO Clif Gaus, ScD, said in a statement. “But overall, we are pleased to see the results show a positive trend for the program,” noting that despite being only a few years old, the the participating ACOs “have accomplished a lot to reduce cost and improve quality.”

The ED Is a Safer Place…and Can Be Safer Still
Improving medication accuracy, transitions of care, health information technology, and other ED patient-safety strategies are offered in this month’s Emergency Medicine cover article, “Patient Safety in the Emergency Department,” by emergency physician (EP)/toxicologist Brenna M. Farmer, MD, a colleague for many years.
As Dr Farmer notes in her introduction, patient safety—in the ED and elsewhere—has received a great deal of attention since the publication of the two landmark Institute of Medicine (IOM) studies in 1999 and 2001 that documented an enormous number of medical errors and recommended improvements in medical care. More than a decade and a half after their publication, is there any evidence that these reports have led to a reduction in the number of serious adverse effects and deaths due to medical errors?
Although most EPs believe that ED safety measures have reduced the overall number of errors, there is a scarcity of published data demonstrating a direct cause-and-effect relationship in reducing the number of adverse events and deaths. A recent analysis of National Hospital Ambulatory Medical Care Survey data by EPs Kanzaria, Probst, and Hsia (Health Aff [Millwood]. 2016;35[7]:1303-1308) found that ED death rates dropped by nearly 50% between 1997 and 2011. Most of this reporting period includes the years following the IOM reports before the implementation of the Affordable Care Act measures. One might reasonably assume that the decrease in ED death rates since 1997 is at least partly due to the safety measures described by Dr Farmer. However, Kanzaria et al hypothesize that the reduction is probably due to palliative and prehospital care efforts which “shift the locus of deaths,” to recent advances in emergency critical care, and to public health successes in smoking cessation, motor vehicle safety, etc. Conspicuously absent from their list of possible measures responsible for the reduction in ED death rates are ED safety measures.
If Kanzaria et al are correct in attributing the reduction in ED deaths to measures taken by others to decrease the number of dying patients brought to EDs, then it may be reasonable to look for the benefit of eliminating serious ED errors to a decrease in death rates after patients leave the ED for inpatient services. Though inpatient death-rate data is available only since 2005, Kanzaria et al report no significant change in the inpatient death rate between 2005 and 2011. It is possible, however, that the improvements in ED critical care hypothesized by the authors to be partly responsible for reducing ED death rates enable sicker patients to survive longer and ultimately succumb to their serious illnesses as inpatients. If so, this could offset any evident reduction in inpatient mortality from the avoidance of serious errors in the ED.
In any case, Dr Farmer does present direct evidence that safety measures are effective in reducing morbidity, and probably mortality. For example, in one study cited, medication errors were 13.5 times less likely to occur when an ED pharmacist was present, and clearly, avoiding doubling the doses of potent cardiac medications or sedative hypnotics, avoiding dangerous drug interactions, and choosing the correct type, dose, and time of administration of antibiotics and all meds must be responsible for reducing morbidity and ultimately mortality. It is also worth recalling that with respect to patient safety, emergency medicine is undoubtedly the safest medical specialty ever created, pioneering from its inception 24/7 bedside attending presence and mandatory recertifications, years to decades before other specialties adopted these practices. Thanks to these efforts, EDs are much safer than they had been previously, and by implementing the measures described by Dr Farmer will be safer still.

Spreading Innovation among Hospitalists

“Increasingly, we are not having faculty who are going up for promotion and reliably running into challenges around mentorship, national reputation, and having a network outside of their local hospital that is critical for advancement,” says lead author Ethan Cumbler, MD, FHM, FACP, of the Department of Medicine at the University of Colorado School of Medicine. “Hospital medicine as a movement is built on a foundation of innovation, and so as a specialty, we have a mandate to not only innovate but to disseminate those innovations.”
The model of the visiting professorship described in the paper takes midcareer academic hospitalists and provides an infrastructure for reciprocal faculty exchanges. This provides a forum to increase professional networks.
“We found that both junior faculty and our visiting professors saw value in advancing those goals,” Dr. Cumbler says. “We also saw evidence of the spread of ideas and new shared scholarship derived from having these reciprocal visits.”
This has model relevance for nonacademic hospitals, too. For example, it’d be useful for hospital medicine groups to share ideas with one another, Dr. Cumbler says.
“This is a simple structure, but it’s just like a small pebble thrown into a large body of water can create ripples which affect distant shores—sometimes it’s very simple concepts that are worth pursuing,” he says.
Reference
- Cumbler E, Herzke C, Smalligan R, Glasheen JJ, O’Malley C, Pierce JR Jr. Visiting professorship in hospital medicine: an innovative twist for a growing specialty [published online ahead of print June 23, 2016]. J Hosp Med. doi:10.1002/jhm.2625.

Cycling accounts for the most sports-related ED visits
Bicycle riding results in more visits to the emergency department than any other sports activity, according to the Agency for Healthcare Research and Quality.
In 2013, cycling accounted for 13.7% of the 2.8 million ED visits in which the patient was discharged. Walking/marching/hiking was next with 12.1% of ED visits, while unspecified sports activities were third with 10.3% of visits. Team sports took the next two spots: basketball accounted for 9.6% of visits and football accounted for 7.5%, the AHRQ reported.

Among those under age 18 years, who accounted for over 1.5 million ED visits (54.7%) in 2013, football was associated with the most visits for boys (16.4%) and school recess/summer camp led to the most visits (12.8%) for girls. Bicycle riding was the leading reason for males aged 18-44 (16%) and 45-64 (34.9%), while walking/marching/hiking was the leading reason for females aged 18-44 (25.6%) and 45-64 years (49%). For those older than 65 years, walking/marching/hiking was the most common reason for ED visits among both men (54.3%) and women (79.7%), according to data from the Nationwide Emergency Department Sample.
The most common injuries in 2013 for sports-related ED visits (discharged) were sprains (24%), fractures (21%), and superficial injuries (18%). Among the top 10 injury-producing sports activities, cycling had the highest rate of superficial injuries at 26%, school recess/summer camp had the highest fracture rate (42%), and basketball led with a sprain rate of 40%, the AHRQ said.
Bicycle riding results in more visits to the emergency department than any other sports activity, according to the Agency for Healthcare Research and Quality.
In 2013, cycling accounted for 13.7% of the 2.8 million ED visits in which the patient was discharged. Walking/marching/hiking was next with 12.1% of ED visits, while unspecified sports activities were third with 10.3% of visits. Team sports took the next two spots: basketball accounted for 9.6% of visits and football accounted for 7.5%, the AHRQ reported.
Among those under age 18 years, who accounted for over 1.5 million ED visits (54.7%) in 2013, football was associated with the most visits for boys (16.4%) and school recess/summer camp led to the most visits (12.8%) for girls. Bicycle riding was the leading reason for males aged 18-44 (16%) and 45-64 (34.9%), while walking/marching/hiking was the leading reason for females aged 18-44 (25.6%) and 45-64 years (49%). For those older than 65 years, walking/marching/hiking was the most common reason for ED visits among both men (54.3%) and women (79.7%), according to data from the Nationwide Emergency Department Sample.
The most common injuries in 2013 for sports-related ED visits (discharged) were sprains (24%), fractures (21%), and superficial injuries (18%). Among the top 10 injury-producing sports activities, cycling had the highest rate of superficial injuries at 26%, school recess/summer camp had the highest fracture rate (42%), and basketball led with a sprain rate of 40%, the AHRQ said.
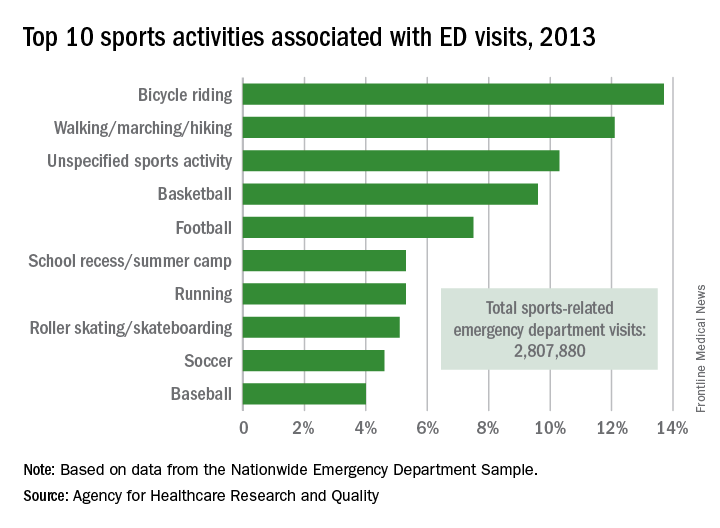
Thinking through the State of Hospital Medicine Report
sSHM’s 2016 State of Hospital Medicine Report (SoHM) is now available, and it’s unquestionably the best source of detail regarding how hospital medicine groups are configured and operated.1
The SoHM is published in even years and combines data from two sources:
- Hospitalist data from Medical Group Management Association’s Physician Compensation and Productivity Survey. Within the SoHM, you will find the same figures for hospitalist compensation, production, and a few related metrics that are from the MGMA survey report.
- SHM’s survey of hospital medicine groups. This survey drills into significant detail on things like scope of clinical practice, staffing levels, work schedules, bonus metrics, CPT code distribution, roles for NPs and PAs, and the amount of financial support provided to the group.
There are several new topics in this year’s SoHM, including CME allowances, utilization of prolonged service codes, and charge capture methodologies being used by hospital medicine groups. My colleague, Leslie Flores, has been very involved in the survey for 10 years and has written a blog with more details.
One Caveat …
The mix of survey respondents varies and includes a much larger portion of hospital medicine groups employed by multi-state management companies than prior surveys. Even if a parameter hasn’t changed for any hospitalist group, the fact that responses come from different contingents of the hospitalist workforce can result in a different result from one survey to the next. It is difficult to be certain if variations across successive surveys reflect a real change in the marketplace or are a function of variation in the respondent population.
Now let’s review and analyze some of this year’s survey findings for hospital medicine groups caring for adults:
Financial Support Stayed Flat
The amount of financial support provided to a hospital medicine group per FTE has increased significantly in every prior survey. This money typically comes from the hospital that the hospital medicine group serves and is sometimes referred to as the “subsidy.” For hospital medicine groups serving adults, it was $139,000 in 2012 and $156,000 in 2014.
The current survey showed a median of $157,500, essentially unchanged from two years prior. This is either an aberration in the survey (e.g., a result of a different survey population) or an indicator that this amount has begun to level off. Clearly, there is an upper limit to the amount of financial support the marketplace can support, but from my experience working with hospitalist groups around the country, I haven’t seen evidence that we’ve reached that point. I suspect it is an aberration and future surveys will show a continued rising trend, though perhaps not as rapidly as in years past.
Compensation Method Is Evolving
A mean of 14.7% of compensation was tied to production, up from around 10% in prior surveys. And the portion tied to performance (e.g., patient satisfaction, quality metrics) was unchanged at 6%. It’s interesting that despite proliferation of pay-for-performance programs and increasing emphasis on quality and value, it is the productivity portion of compensation that increased. It’s hard to know if that is a meaningful trend.
Compensation Amount Continues to Increase
For hospitalists caring for adults, the median amount of compensation rose to $278,746, up from $253,000 in 2014, $234,000 in 2013, and $221,000 in 2011. These figures come from the MGMA survey, and the financial support figures above come from the separate SHM survey. That means it’s impossible to make firm conclusions about how the numbers do or don’t interrelate.
Don’t forget that surveys report all forms of compensation, including base, production, bonus, extra shifts, and other elements. This year’s $278,746 includes all the bonus dollars earned by each hospitalist in the survey. We can make a very rough guess at the bonus by multiplying the portion of total compensation tied to performance in the SHM survey (6%) by the total compensation ($278,746) from the MGMA survey, which comes to $13,397. But we still don’t know the portion of the total bonus dollars available that represents. My experience is that the total bonus dollars available is around $20,000 or more at most hospital medicine groups. Therefore, a doctor who earned $13,397 presumably didn’t meet all performance goals.
A Deeper Dive into Hospital Medicine Group Finances
It is really interesting to ponder where the dollars come from to fund higher hospitalist compensation if the financial support provided per FTE hasn’t increased. Perhaps hospitalists are generating more encounters, work relative value units (wRVUs), or professional fee collections?
Median professional fee collections were $213,000 this year, up from $151,000 in the prior survey two years ago. This increase could, in theory, fully fund the higher hospitalist compensation without the need for an increase in other sources of revenue.
So why are collections up? It could be because hospitalists are coding the average visit at a higher level: 2.02 wRVUs per encounter this year compared to 1.97 in 2014 and 1.91 in 2012. The survey can’t help distinguish whether this increase is because we’re seeing more complex patients or whether we’re improving our documentation to catch up with the complexity of the patients we’ve been seeing all along. I suspect it is both.
The increase in wRVUs per encounter, however, is offset by a continued downward trend in numbers of encounters: 1,684 this year compared to 1,850 in 2014 and 2,078 in 2012. The total wRVUs generated per hospitalist in a year stayed about the same at 4,247 compared to 4,298 in 2014.
The best explanation for why total collections are up would be that payor rates have increased. But Medicare, which accounts for about 60%–65% of the payor mix for most hospital medicine groups, hasn’t increased rates enough to explain this, and I’m not aware of other payor classes that have increased significantly. Another explanation could be that hospital medicine groups are simply doing a better job with billing and collections and other revenue-cycle management activities, resulting in increased revenue.
I guess it shouldn’t be surprising that some of the survey results don’t seem internally consistent. The data come from two different surveys, the response rate for each question varies, and other issues mean the survey just can’t provide that level of precision. We also need to keep in mind that analyses like I’ve provided here are only very rough explanations. But I think they’re still valuable to think about even if they don’t provide definitive answers. TH
Reference
- 2016 State of Hospital Medicine Report. Society of Hospital Medicine website. Accessed August 9, 2016.
Multifocal effort needed to rein in prescription prices
Enforcing more stringent requirements for exclusivity rights, ensuring timely generic drug availability, and providing greater opportunities for meaningful price negotiation by government payers could help combat high medication costs in the United States, according to an analysis published Aug. 23 in JAMA.
Per capita prescription drug spending in the United States exceeds that in all other countries, largely fueled by brand-name drug prices rising at rates far beyond the consumer price index. For example, in 2013, per capita spending on prescription drugs was $858, compared with an average of $400 for 19 other industrialized nations, according to the analysis conducted by Aaron S. Kesselheim, MD, of Brigham & Women’s Hospital, Boston, and colleagues. In addition, between 2008 and 2015, prices for the most commonly used brand-name drugs in the United States rose by 164%, far more than the consumer price index increased (12%), authors reported (JAMA 2016. doi: 10.1001/jama.2016.11237).

“We found that indeed, drug prices in the United States are much high than anywhere else in the world and the main contributors to that are the U.S. drug marketplace which allows drug companies to charge whatever the market will bear and then in many respects, places limitations on the ability of payers to try to negotiate lower drug prices,” Dr. Kesselheim said in a video interview for JAMA.
To reduce high drug prices, authors propose better federal oversight of drug makers who attempt to extend market exclusivity. For example, changing how the U.S. Patent and Trademark Office interprets novelty and non-obviousness when issuing drug patents could help avoid new secondary patents based on clinically irrelevant changes to active drug products. Other strategies outlined include:
• Decrease industry expenses. Reviews have pointed to the increasing expenditures for drug research and development, with the suggestion that steps be taken to make companies’ investments more efficient.
• Pass state laws permitting substitution of clinically similar drugs within the same class in carefully selected circumstances.
• Increase attention to the generic drug marketplace. Proposed federal legislation would forbid brand-name manufacturers from refusing to share samples of products with generic drug manufacturers for necessary bioequivalence studies.
• Authorize Medicare to negotiate prices of drugs paid for by Medicare Part D plans.
Physicians can also play a role in decreasing drug prices by discussing drug prices and choices with patients and limiting practices such as writing “dispense as written” prescriptions to avoid generic medications, Dr. Kesselheim noted. More education about drug costs and value-based prescribing integrated into physicians’ initial and continuing education could also be beneficial.
“There needs to be more education of patients and physicians about the implications of high drug prices and ways they can ensure that the prescribing they are doing is of highest value,” Dr. Kesselheim said in the video interview.
On Twitter @legal_med
Enforcing more stringent requirements for exclusivity rights, ensuring timely generic drug availability, and providing greater opportunities for meaningful price negotiation by government payers could help combat high medication costs in the United States, according to an analysis published Aug. 23 in JAMA.
Per capita prescription drug spending in the United States exceeds that in all other countries, largely fueled by brand-name drug prices rising at rates far beyond the consumer price index. For example, in 2013, per capita spending on prescription drugs was $858, compared with an average of $400 for 19 other industrialized nations, according to the analysis conducted by Aaron S. Kesselheim, MD, of Brigham & Women’s Hospital, Boston, and colleagues. In addition, between 2008 and 2015, prices for the most commonly used brand-name drugs in the United States rose by 164%, far more than the consumer price index increased (12%), authors reported (JAMA 2016. doi: 10.1001/jama.2016.11237).
“We found that indeed, drug prices in the United States are much high than anywhere else in the world and the main contributors to that are the U.S. drug marketplace which allows drug companies to charge whatever the market will bear and then in many respects, places limitations on the ability of payers to try to negotiate lower drug prices,” Dr. Kesselheim said in a video interview for JAMA.
To reduce high drug prices, authors propose better federal oversight of drug makers who attempt to extend market exclusivity. For example, changing how the U.S. Patent and Trademark Office interprets novelty and non-obviousness when issuing drug patents could help avoid new secondary patents based on clinically irrelevant changes to active drug products. Other strategies outlined include:
• Decrease industry expenses. Reviews have pointed to the increasing expenditures for drug research and development, with the suggestion that steps be taken to make companies’ investments more efficient.
• Pass state laws permitting substitution of clinically similar drugs within the same class in carefully selected circumstances.
• Increase attention to the generic drug marketplace. Proposed federal legislation would forbid brand-name manufacturers from refusing to share samples of products with generic drug manufacturers for necessary bioequivalence studies.
• Authorize Medicare to negotiate prices of drugs paid for by Medicare Part D plans.
Physicians can also play a role in decreasing drug prices by discussing drug prices and choices with patients and limiting practices such as writing “dispense as written” prescriptions to avoid generic medications, Dr. Kesselheim noted. More education about drug costs and value-based prescribing integrated into physicians’ initial and continuing education could also be beneficial.
“There needs to be more education of patients and physicians about the implications of high drug prices and ways they can ensure that the prescribing they are doing is of highest value,” Dr. Kesselheim said in the video interview.
On Twitter @legal_med
FROM JAMA
Key clinical point: Enforcing more stringent requirements for exclusivity rights could lower medication costs.
Major finding: Per capita prescription drug spending in the United States exceeds that in all other countries.
Data source: Analysis of the peer-reviewed medical and health policy literature from January 2015 through July 2016.
Disclosures: Dr. Kesselheim reported no relevant financial conflicts of interest. The study was supported by two independent think tanks.