User login
When is it safe to forego a CT in kids with head trauma?
Use these newly derived and validated clinical prediction rules to decide which kids need a CT scan after head injury.1
STRENGTH OF RECOMMENDATION
A: Based on consistent, good-quality patient-oriented evidence.
Kuppermann N, Holmes JF, Dayan PS, et al. Identification of children at very low risk of clinically-important brain injuries after head trauma: a prospective cohort study. Lancet. 2009;374:1160-1170.
ILLUSTRATIVE CASE
An anxious mother rushes into your office carrying her 22-month-old son, who fell and hit his head an hour ago. The child has an egg-sized lump on his forehead. Upon questioning his mom about the incident, you learn that the boy fell from a seated position on a chair, which was about 2 feet off the ground. He did not lose consciousness and has no palpable skull fracture—and has been behaving normally ever since. Nonetheless, his mother wants to know if she should take the boy to the emergency department (ED) for a computed tomography (CT) head scan, “just to be safe.” What should you tell her?
Traumatic brain injury (TBI) is a leading cause of childhood morbidity and mortality. In the United States, pediatric head trauma is responsible for 7200 deaths, 60,000 hospitalizations, and more than 600,000 ED visits annually. 2 CT is the diagnostic standard when significant injury from head trauma is suspected, and more than half of all children brought to EDs as a result of head trauma undergo CT scanning. 3
CT is not risk free
CT scans are not benign, however. In addition to the risks associated with sedation, diagnostic radiation is a carcinogen. It is estimated that between 1 in 1000 and 1 in 5000 head CT scans results in a lethal malignancy, and the younger the child, the greater the risk. 4 Thus, when a child incurs a head injury, it is vital to weigh the potential benefit of imaging (discovering a serious, but treatable, injury) and the risk (CT-induced cancer).
Clinical prediction rules for head imaging in children have traditionally been less reliable than those for adults, especially for preverbal children. Guidelines agree that for children with moderate or severe head injury or with a Glasgow Coma Scale (GCS) score ≤13, CT is definitely recommended. 5 The guidelines are less clear regarding the necessity of CT imaging for children with a GCS of 14 or 15.
Eight head trauma clinical prediction rules for kids existed as of December 2008, and they differed considerably in population characteristics, predictors, outcomes, and performance. Only 2 of the 8 prediction rules were derived from high-quality studies, and none were validated in a population separate from their derivation group. 6 A high-quality, high-performing, validated rule was needed to identify children at low risk for serious, treatable head injury—for whom head CT would be unnecessary.
STUDY SUMMARY: Large study yields 2 validated age-based rules
Researchers from the Pediatric Emergency Care Applied Research Network (PECARN) conducted a prospective cohort study to first derive, and then to validate, clinical prediction rules to identify children at very low risk for clinically important traumatic brain injury (ciTBI). They defined ciTBI as death as a result of TBI, need for neurosurgical intervention, intubation of >24 hours, or hospitalization for >2 nights for TBI.
Twenty-five North American EDs enrolled patients younger than 18 years with GCS scores of 14 or 15 who presented within 24 hours of head trauma. Patients were excluded if the mechanism of injury was trivial (ie, ground-level falls or walking or running into stationary objects with no signs or symptoms of head trauma other than scalp abrasions or lacerations). Also excluded were children who had incurred a penetrating trauma, had a known brain tumor or preexisting neurologic disorder that complicated assessment, or had undergone imaging for the head injury at an outside facility. Of 57,030 potential participants, 42,412 patients qualified for the study.
Because the researchers set out to develop 2 pediatric clinical prediction rules—1 for children <2 years of age (preverbal) and 1 for kids ≥2—they divided participants into these age groups. Both groups were further divided into derivation cohorts (8502 preverbal patients and 25,283 patients ≥2 years) and validation cohorts (2216 and 6411 patients, respectively).
Based on their clinical assessment, emergency physicians obtained CT scans for a total of 14,969 children and found ciTBIs in 376—35% and 0.9% of the 42,412 study participants, respectively. Sixty patients required neurosurgery. Investigators ascertained outcomes for the 65% of participants who did not undergo CT imaging via telephone, medical record, and morgue record follow-up; 96 patients returned to a participating health care facility for subsequent care and CT scanning as a result. Of those 96, 5 patients were found to have a TBI. One child had a ciTBI and was hospitalized for 2 nights for a cerebral contusion.
The investigators used established prediction rule methods and Standards for the Reporting of Diagnostic Accuracy Studies (STARD) guidelines to derive the rules. They assigned a relative cost of 500 to 1 for failure to identify a patient with ciTBI vs incorrect classification of a patient who did not have a ciTBI.
Negative finding=0 of 6 predictors
The rules that were derived and validated on the basis of this study are more detailed than previous pediatric prediction rules. For children <2 years, the new standard features 6 factors: altered mental status, palpable skull fracture, loss of consciousness (LOC) for ≥5 seconds, nonfrontal scalp hematoma, severe injury mechanism, and acting abnormally (according to the parents).
The prediction rule for children ≥2 years has 6 criteria, as well, with some key differences. While it, too, includes altered mental status and severe injury mechanism, it also includes clinical signs of basilar skull fracture, any LOC, a history of vomiting, and severe headache. The criteria are further defined, as follows:
Altered mental status: GCS <15, agitation, somnolence, repetitive questions, or slow response to verbal communication.
Severe injury mechanism: Motor vehicle crash with patient ejection, death of another passenger, or vehicle rollover; pedestrian or bicyclist without a helmet struck by a motor vehicle; falls of >3 feet for children <2 years and >5 feet for children ≥2; or head struck by a high-impact object.
Clinical signs of basilar skull fracture: Retroauricular bruising—Battle’s sign (peri-orbital bruising)—raccoon eyes, hemotympanum, or cerebrospinal fluid otorrhea or rhinorrhea.
In both prediction rules, a child is considered negative and, therefore, not in need of a CT scan, only if he or she has none of the 6 clinical predictors of ciTBI.
New rules are highly predictive
In the validation cohorts, the rule for children <2 years had a 100% negative predictive value for ciTBI (95% confidence interval [CI], 99.7-100) and a sensitivity of 100% (95% CI, 86.3-100). The rule for the older children had a negative predictive value of 99.95% (95% CI, 99.81-99.99) and a sensitivity of 96.8% (95% CI, 89-99.6).
In a child who has no clinical predictors, the risk of ciTBI is negligible—and, considering the risk of malignancy from CT scanning, imaging is not recommended. Recommendations for how to proceed if a child has any predictive factors depend on the clinical scenario and age of the patient. In children with a GCS score of 14 or with other signs of altered mental status or palpable skull fracture in those <2 years, or signs of basilar skull fracture in kids ≥2, the risk of ciTBI is slightly greater than 4%. CT is definitely recommended.
In children with a GCS score of 15 and a severe mechanism of injury or any other isolated prediction factor (LOC >5 seconds, non-frontal hematoma, or not acting normally according to a parent in kids <2; any history of LOC, severe headache, or history of vomiting in patients ≥2), the risk of ciTBI is less than 1%. For these children, either CT or observation may be appropriate, as determined by other factors, including clinician experience and patient/parent preference. CT scanning should be given greater consideration in patients who have multiple findings, worsening symptoms, or are <3 months old.
WHAT’S NEW: Rules shed light on hazy areas
These new PECARN rules perform much better than previous pediatric clinical predictors and differ in several ways from the 8 older pediatric head CT imaging rules. The key provisions are the same—if a child has a change in mental status with palpable or visible signs of skull fracture, proceed to imaging. However, this study clarifies which of the other predictors are most important. A severe mechanism of injury is important for all ages. For younger, preverbal children, a nonfrontal hematoma and a parental report of abnormal behavior are important predictors; vomiting or a LOC for <5 seconds is not. For children ≥2 years, vomiting, headache, and any LOC are important; a hematoma is not.
CAVEATS: Clinical decision making is still key
The PECARN rules should guide, rather than dictate, clinical decision making. They use a narrow definition of “clinically important” TBI outcomes—basically death, neurosurgery to prevent death, or prolonged observation to prevent neurosurgery. There are other important, albeit less dire, clinical decisions associated with TBI for which a brain CT may be useful—determining if a high school athlete can safely complete the football season or whether a child should receive anticonvulsant medication to decrease the likelihood of posttraumatic seizures.
We worry, too, that some providers may be tempted to use the rules for after-hours telephone triage. However, clinical assessment of the presence of signs of skull fracture, basilar or otherwise, requires in-person assessment by an experienced clinician.
CHALLENGES TO IMPLEMENTATION: Over- (or under-) reliance on the rules
The PECARN decision rules should simplify head trauma assessment in children. Physicians should first check for altered mental status and signs of skull fracture and immediately send the patient for imaging if either is present. Otherwise, physicians should continue the assessment—looking for the other clinical predictors and ordering a brain CT if 1 or more are found. However, risk of ciTBI is only 1% when only 1 prediction criterion is present. These cases require careful consideration of the potential benefit and risk.
Some emergency physicians may resist using a checklist approach, even one as useful as the PECARN decision guide, and continue to rely solely on their clinical judgment. And some parents are likely to insist on a CT scan for reassurance that there is no TBI, despite the absence of any clinical predictors.
Acknowledgements
The PURLs Surveillance System is supported in part by Grant Number UL1RR024999 from the National Center for Research Resources; the grant is a Clinical Translational Science Award to the University of Chicago. The content is solely the responsibility of the authors and does not necessarily represent the official views of either the National Center for Research Resources or the National Institutes of Health.
The authors wish to thank Sarah-Anne Schumann, MD, Department of Medicine, University of Chicago, for her guidance in the preparation of this manuscript.
PURLs methodology
This study was selected and evaluated using FPIN’s Priority Updates from the Research Literature (PURL) Surveillance System methodology. The criteria and findings leading to the selection of this study as a PURL can be accessed at www.jfponline.com/purls
Click here to view PURL METHODOLOGY
1. Kuppermann N, Holmes JF, Dayan PS, et al. Identification of children at very low risk of clinically-important brain injuries after head trauma: a prospective cohort study. Lancet. 2009;374:1160-1170.
2. National Center for Injury Prevention and Control. Traumatic brain injury in the United States: assessing outcomes in children. CDC; 2006. Available at: http://www.cdc.gov/ncipc/tbi/tbi_report/index.htm . Accessed December 3, 2009.
3. Klassen TP, Reed MH, Stiell IG, et al. Variation in utilization of computed tomography scanning for the investigation of minor head trauma in children: a Canadian experience. Acad Emerg Med. 2000;7:739-744.
4. Brenner DJ. Estimating cancer risks from pediatric CT: going from the qualitative to the quantitative. Pediatr Radiol. 2002;32:228-231.
5. National Guideline Clearing House, ACR Appropriateness Criteria, 2008. Available at: www.guidelines.gov/summary/summary.aspx?doc_id=13670&nbr=007004&string=head+AND+trauma . Accessed December 3, 2009.
6. Maguire JL, Boutis K, Uleryk EM, et al. Should a head-injured child receive a head CT scan? A systematic review of clinical prediction rules. Pediatrics. 2009;124:e145-e154.
Use these newly derived and validated clinical prediction rules to decide which kids need a CT scan after head injury.1
STRENGTH OF RECOMMENDATION
A: Based on consistent, good-quality patient-oriented evidence.
Kuppermann N, Holmes JF, Dayan PS, et al. Identification of children at very low risk of clinically-important brain injuries after head trauma: a prospective cohort study. Lancet. 2009;374:1160-1170.
ILLUSTRATIVE CASE
An anxious mother rushes into your office carrying her 22-month-old son, who fell and hit his head an hour ago. The child has an egg-sized lump on his forehead. Upon questioning his mom about the incident, you learn that the boy fell from a seated position on a chair, which was about 2 feet off the ground. He did not lose consciousness and has no palpable skull fracture—and has been behaving normally ever since. Nonetheless, his mother wants to know if she should take the boy to the emergency department (ED) for a computed tomography (CT) head scan, “just to be safe.” What should you tell her?
Traumatic brain injury (TBI) is a leading cause of childhood morbidity and mortality. In the United States, pediatric head trauma is responsible for 7200 deaths, 60,000 hospitalizations, and more than 600,000 ED visits annually. 2 CT is the diagnostic standard when significant injury from head trauma is suspected, and more than half of all children brought to EDs as a result of head trauma undergo CT scanning. 3
CT is not risk free
CT scans are not benign, however. In addition to the risks associated with sedation, diagnostic radiation is a carcinogen. It is estimated that between 1 in 1000 and 1 in 5000 head CT scans results in a lethal malignancy, and the younger the child, the greater the risk. 4 Thus, when a child incurs a head injury, it is vital to weigh the potential benefit of imaging (discovering a serious, but treatable, injury) and the risk (CT-induced cancer).
Clinical prediction rules for head imaging in children have traditionally been less reliable than those for adults, especially for preverbal children. Guidelines agree that for children with moderate or severe head injury or with a Glasgow Coma Scale (GCS) score ≤13, CT is definitely recommended. 5 The guidelines are less clear regarding the necessity of CT imaging for children with a GCS of 14 or 15.
Eight head trauma clinical prediction rules for kids existed as of December 2008, and they differed considerably in population characteristics, predictors, outcomes, and performance. Only 2 of the 8 prediction rules were derived from high-quality studies, and none were validated in a population separate from their derivation group. 6 A high-quality, high-performing, validated rule was needed to identify children at low risk for serious, treatable head injury—for whom head CT would be unnecessary.
STUDY SUMMARY: Large study yields 2 validated age-based rules
Researchers from the Pediatric Emergency Care Applied Research Network (PECARN) conducted a prospective cohort study to first derive, and then to validate, clinical prediction rules to identify children at very low risk for clinically important traumatic brain injury (ciTBI). They defined ciTBI as death as a result of TBI, need for neurosurgical intervention, intubation of >24 hours, or hospitalization for >2 nights for TBI.
Twenty-five North American EDs enrolled patients younger than 18 years with GCS scores of 14 or 15 who presented within 24 hours of head trauma. Patients were excluded if the mechanism of injury was trivial (ie, ground-level falls or walking or running into stationary objects with no signs or symptoms of head trauma other than scalp abrasions or lacerations). Also excluded were children who had incurred a penetrating trauma, had a known brain tumor or preexisting neurologic disorder that complicated assessment, or had undergone imaging for the head injury at an outside facility. Of 57,030 potential participants, 42,412 patients qualified for the study.
Because the researchers set out to develop 2 pediatric clinical prediction rules—1 for children <2 years of age (preverbal) and 1 for kids ≥2—they divided participants into these age groups. Both groups were further divided into derivation cohorts (8502 preverbal patients and 25,283 patients ≥2 years) and validation cohorts (2216 and 6411 patients, respectively).
Based on their clinical assessment, emergency physicians obtained CT scans for a total of 14,969 children and found ciTBIs in 376—35% and 0.9% of the 42,412 study participants, respectively. Sixty patients required neurosurgery. Investigators ascertained outcomes for the 65% of participants who did not undergo CT imaging via telephone, medical record, and morgue record follow-up; 96 patients returned to a participating health care facility for subsequent care and CT scanning as a result. Of those 96, 5 patients were found to have a TBI. One child had a ciTBI and was hospitalized for 2 nights for a cerebral contusion.
The investigators used established prediction rule methods and Standards for the Reporting of Diagnostic Accuracy Studies (STARD) guidelines to derive the rules. They assigned a relative cost of 500 to 1 for failure to identify a patient with ciTBI vs incorrect classification of a patient who did not have a ciTBI.
Negative finding=0 of 6 predictors
The rules that were derived and validated on the basis of this study are more detailed than previous pediatric prediction rules. For children <2 years, the new standard features 6 factors: altered mental status, palpable skull fracture, loss of consciousness (LOC) for ≥5 seconds, nonfrontal scalp hematoma, severe injury mechanism, and acting abnormally (according to the parents).
The prediction rule for children ≥2 years has 6 criteria, as well, with some key differences. While it, too, includes altered mental status and severe injury mechanism, it also includes clinical signs of basilar skull fracture, any LOC, a history of vomiting, and severe headache. The criteria are further defined, as follows:
Altered mental status: GCS <15, agitation, somnolence, repetitive questions, or slow response to verbal communication.
Severe injury mechanism: Motor vehicle crash with patient ejection, death of another passenger, or vehicle rollover; pedestrian or bicyclist without a helmet struck by a motor vehicle; falls of >3 feet for children <2 years and >5 feet for children ≥2; or head struck by a high-impact object.
Clinical signs of basilar skull fracture: Retroauricular bruising—Battle’s sign (peri-orbital bruising)—raccoon eyes, hemotympanum, or cerebrospinal fluid otorrhea or rhinorrhea.
In both prediction rules, a child is considered negative and, therefore, not in need of a CT scan, only if he or she has none of the 6 clinical predictors of ciTBI.
New rules are highly predictive
In the validation cohorts, the rule for children <2 years had a 100% negative predictive value for ciTBI (95% confidence interval [CI], 99.7-100) and a sensitivity of 100% (95% CI, 86.3-100). The rule for the older children had a negative predictive value of 99.95% (95% CI, 99.81-99.99) and a sensitivity of 96.8% (95% CI, 89-99.6).
In a child who has no clinical predictors, the risk of ciTBI is negligible—and, considering the risk of malignancy from CT scanning, imaging is not recommended. Recommendations for how to proceed if a child has any predictive factors depend on the clinical scenario and age of the patient. In children with a GCS score of 14 or with other signs of altered mental status or palpable skull fracture in those <2 years, or signs of basilar skull fracture in kids ≥2, the risk of ciTBI is slightly greater than 4%. CT is definitely recommended.
In children with a GCS score of 15 and a severe mechanism of injury or any other isolated prediction factor (LOC >5 seconds, non-frontal hematoma, or not acting normally according to a parent in kids <2; any history of LOC, severe headache, or history of vomiting in patients ≥2), the risk of ciTBI is less than 1%. For these children, either CT or observation may be appropriate, as determined by other factors, including clinician experience and patient/parent preference. CT scanning should be given greater consideration in patients who have multiple findings, worsening symptoms, or are <3 months old.
WHAT’S NEW: Rules shed light on hazy areas
These new PECARN rules perform much better than previous pediatric clinical predictors and differ in several ways from the 8 older pediatric head CT imaging rules. The key provisions are the same—if a child has a change in mental status with palpable or visible signs of skull fracture, proceed to imaging. However, this study clarifies which of the other predictors are most important. A severe mechanism of injury is important for all ages. For younger, preverbal children, a nonfrontal hematoma and a parental report of abnormal behavior are important predictors; vomiting or a LOC for <5 seconds is not. For children ≥2 years, vomiting, headache, and any LOC are important; a hematoma is not.
CAVEATS: Clinical decision making is still key
The PECARN rules should guide, rather than dictate, clinical decision making. They use a narrow definition of “clinically important” TBI outcomes—basically death, neurosurgery to prevent death, or prolonged observation to prevent neurosurgery. There are other important, albeit less dire, clinical decisions associated with TBI for which a brain CT may be useful—determining if a high school athlete can safely complete the football season or whether a child should receive anticonvulsant medication to decrease the likelihood of posttraumatic seizures.
We worry, too, that some providers may be tempted to use the rules for after-hours telephone triage. However, clinical assessment of the presence of signs of skull fracture, basilar or otherwise, requires in-person assessment by an experienced clinician.
CHALLENGES TO IMPLEMENTATION: Over- (or under-) reliance on the rules
The PECARN decision rules should simplify head trauma assessment in children. Physicians should first check for altered mental status and signs of skull fracture and immediately send the patient for imaging if either is present. Otherwise, physicians should continue the assessment—looking for the other clinical predictors and ordering a brain CT if 1 or more are found. However, risk of ciTBI is only 1% when only 1 prediction criterion is present. These cases require careful consideration of the potential benefit and risk.
Some emergency physicians may resist using a checklist approach, even one as useful as the PECARN decision guide, and continue to rely solely on their clinical judgment. And some parents are likely to insist on a CT scan for reassurance that there is no TBI, despite the absence of any clinical predictors.
Acknowledgements
The PURLs Surveillance System is supported in part by Grant Number UL1RR024999 from the National Center for Research Resources; the grant is a Clinical Translational Science Award to the University of Chicago. The content is solely the responsibility of the authors and does not necessarily represent the official views of either the National Center for Research Resources or the National Institutes of Health.
The authors wish to thank Sarah-Anne Schumann, MD, Department of Medicine, University of Chicago, for her guidance in the preparation of this manuscript.
PURLs methodology
This study was selected and evaluated using FPIN’s Priority Updates from the Research Literature (PURL) Surveillance System methodology. The criteria and findings leading to the selection of this study as a PURL can be accessed at www.jfponline.com/purls
Click here to view PURL METHODOLOGY
1. Kuppermann N, Holmes JF, Dayan PS, et al. Identification of children at very low risk of clinically-important brain injuries after head trauma: a prospective cohort study. Lancet. 2009;374:1160-1170.
2. National Center for Injury Prevention and Control. Traumatic brain injury in the United States: assessing outcomes in children. CDC; 2006. Available at: http://www.cdc.gov/ncipc/tbi/tbi_report/index.htm . Accessed December 3, 2009.
3. Klassen TP, Reed MH, Stiell IG, et al. Variation in utilization of computed tomography scanning for the investigation of minor head trauma in children: a Canadian experience. Acad Emerg Med. 2000;7:739-744.
4. Brenner DJ. Estimating cancer risks from pediatric CT: going from the qualitative to the quantitative. Pediatr Radiol. 2002;32:228-231.
5. National Guideline Clearing House, ACR Appropriateness Criteria, 2008. Available at: www.guidelines.gov/summary/summary.aspx?doc_id=13670&nbr=007004&string=head+AND+trauma . Accessed December 3, 2009.
6. Maguire JL, Boutis K, Uleryk EM, et al. Should a head-injured child receive a head CT scan? A systematic review of clinical prediction rules. Pediatrics. 2009;124:e145-e154.
Copyright © 2010 The Family Physicians Inquiries Network.
All rights reserved.
Start a statin prior to vascular surgery
HMG-CoA reductase inhibitors (statins), initiated 30 days before noncardiac vascular surgery, reduce the incidence of postoperative cardiac complications, including fatal myocardial infarction.1,2
STRENGTH OF RECOMMENDATION
A: 1 new randomized controlled trial (RCT), and 1 smaller, older RCT.
Schouten O, Boersma E, Hoeks S, et al. Fluvastatin and perioperative events in patients undergoing vascular surgery. N Engl J Med. 2009;361:980-989.
Durazzo AE, Machado FS, Ikeoka DT, et al. Reduction in cardiovascular events after vascular surgery with atorvastatin: a randomized trial. J Vasc Surg. 2004;39:967-975.
ILLUSTRATIVE CASE
A 67-year-old man with recurrent transient ischemic attacks comes in for a preoperative evaluation for carotid endarterectomy. The patient’s total cholesterol is 207 mg/dL and his low-density lipoprotein cholesterol (LDL-C) is 109 mg/dL. He takes metoprolol and lisinopril for hypertension.
Should you start him on a statin before surgery?
Nearly 25% of patients with peripheral vascular disease suffer from a cardiac event within 72 hours of elective, noncardiac vascular surgery.3 While most of these “complications” have minimal clinical impact and are detected by biochemical markers alone, some patients experience serious cardiac complications—including fatal myocardial infarction (MI).
That’s not surprising, given that most patients who require noncardiac vascular surgery suffer from severe coronary vascular disease.4 What is surprising is that most candidates for noncardiac vascular surgery are not put on statins prior to undergoing surgery.1,2,5
Statins were thought to increase—not prevent—complications
Until recently, taking statins during the perioperative period was believed to increase complications, including statin-associated myopathy. Indeed, guidelines from the American Heart Association (AHA), American College of Cardiology (ACC), and National Heart, Lung and Blood Institute (NHLBI) suggest that it is prudent to withhold statins during hospitalization for major surgery.6
1 small study hinted at value of perioperative statins
A small Brazilian trial conducted in 2004 called the AHA/ACC/NHLBI guidelines into question. the researchers studied 100 patients slated for noncardiac vascular surgery who were randomized to receive either 20 mg atorvastatin (Lipitor) or placebo preoperatively —and monitored them for cardiac events 6 months postoperatively. They found that the incidence of cardiac events (cardiac death, nonfatal MI, stroke, or unstable angina) was more than 3 times higher in the placebo group compared with patients receiving atorvastatin (26% vs 8%, number needed to treat [NNT]=5.6; P=.031).2
The results of this small single study, although suggestive, were not sufficiently convincing to change recommendations about the preoperative use of statins, however. A more comprehensive study was needed to alter standard practice, and the Schouten study that we report on below fits the bill.1
STUDY SUMMARY: Preoperative statin use cuts risk in half
Schouten et al followed 500 patients, who were randomized to receive either 80 mg extended-release fluvastatin (Lescol XL) or placebo for a median of 37 days prior to surgery.1 All enrollees were older than 40 years of age and were scheduled for noncardiac vascular surgery. the reasons for the surgery were abdominal aortic aneurysm repair (47.5%), lower limb arterial reconstruction (38.6%), or carotid artery endarterectomy (13.9%). Patients who were taking long-term beta-blocker therapy were continued on it; otherwise, bisoprolol 2.5 mg was initiated at the screening visit. Patients who were already taking statins (<50% of potential subjects) were excluded. Other exclusions were a contraindication to statin therapy; emergent surgery; and a repeat procedure within the last 29 days. Patients with unstable coronary artery disease or extensive stress-induced ischemia consistent with left main artery disease (or its equivalent) were also excluded.
The primary study outcome was myocardial ischemia, determined by continuous electrocardiogram (EKG) monitoring in the first 48 hours postsurgery and by 12-lead EKG recordings on days 3, 7, and 30. Troponin T levels were measured on postoperative days 1, 3, 7, and 30, as well. the principal secondary end point was either death from cardiovascular causes or nonfatal MI. MI was diagnosed by characteristic ischemic symptoms, with EKG evidence of ischemia or positive troponin T with characteristic rising and falling values.
To gauge fluvastatin’s effect on biomarkers, lipids, high-sensitivity C-reactive protein, and interleukin-6 were measured upon initiation of the medication and on the day of admission for surgery. Serum creatine kinase, alanine aminotransferase (ALT) levels, clinical myopathy, and rhabdomyolysis were monitored as safety measures, with levels measured prior to randomization, on the day of admission, and on postoperative days 1, 3, 7, and 30.
Both groups were similar in age (mean of 66 years), total serum cholesterol levels, risk factors for cardiac events, and medication use. About 75% of the enrollees were men. At baseline, 51% of the participants had a total cholesterol <213 mg/dL, and 39% had an LDL-C <116 mg/dL. Within 30 days after surgery, 27 (10.8%) of those in the fluvastatin group and 47 (19%) of patients in the placebo group had evidence of myocardial ischemia (hazard ratio=0.55; 95% confidence interval [CI], 0.34-0.88; P=.01). the NNT to prevent 1 patient from experiencing myocardial ischemia was 12.
Statin users had fewer MIs. A total of 6 patients receiving fluvastatin died, with 4 deaths attributed to cardiovascular causes. In the placebo group, 12 patients died, 8 of which were ascribed to cardiovascular causes. Eight patients in the fluvastatin group experienced nonfatal MIs, compared with 17 patients in the placebo group (NNT=19 to prevent 1 nonfatal MI or cardiac death (hazard ratio= 0.47; 95% CI, 0.24-0.94; P=.03).
Effects of statins were evident preoperatively. At the time of surgery, patients in the fluvastatin group had, on average, a 20% reduction in their total cholesterol and a 24% reduction in LDL-C; in the placebo group, total cholesterol had fallen by 4% and LDL-C, by 3%.
Patients receiving fluvastatin had an average 21% decrease in C-reactive protein, compared with a 3% increase for the placebo group. Interleukin-6 levels also were reduced far more in the fluvastatin group (33% vs a 4% reduction in the placebo group [P<.001]).
The medication was well tolerated. Overall, 6.8% of participants discontinued the study because of side effects, including 16 (6.4%) patients in the fluvastatin group and 18 (7.3%) in the placebo group. (After surgery, 115 [23.1%] of patients in the statin group temporarily discontinued the drug because of an inability to take oral medications for a median of 2 days.)
Rates of increase in creatine kinase of >10× the upper limit of normal (ULN) were similar between the fluvastatin and placebo groups (4% vs 3.2%, respectively). Increases in ALT to >3× ULN were more frequent in the placebo group compared with the fluvastatin group (5.3%, placebo; 3.2%, fluvastatin). No cases of myopathy or rhabdomyolysis were observed in either group.
WHAT’S NEW: Preop statins can be a lifesaver
The initiation of fluvastatin prior to vascular surgery reduced the incidence of cardiovascular events by 50%—a remarkable result. While patients at the highest risk were excluded from the study, those with lower cardiac risk nonetheless benefi ted from statin therapy. Experts have not typically recommended statins in the perioperative period for this patient population. the results of this study make it clear that they should.
CAVEATS: Extended-release formulation may have affected outcome
The statin used in this study was a longacting formulation, which may have protected patients who were unable to take oral medicines postoperatively. While we don’t know if the extended-release formulation made a difference in this study, we do know that atorvastatin was effective in the Brazilian study discussed earlier.
CHALLENGES TO IMPLEMENTATION: Preop statins may be overlooked
Not all patients see a primary care physician prior to undergoing vascular surgery. This means that it will sometimes be left to surgeons or other specialists to initiate statin therapy prior to surgery, and they may or may not do so.
Optimal timing is unknown. It is not clear how little time a patient scheduled for vascular surgery could spend on a statin and still reap these benefits. Nor do we know if the benefits would extend to patients undergoing other types of surgery; in a large study of patients undergoing all kinds of major noncardiac surgery, no benefits of perioperative statins were found.7
Adherence to the medication regimen presents another challenge, at least for some patients. In this case, however, we think the prospect of preventing major cardiac events postoperatively simply by taking statins for a month should be compelling enough to convince patients to take their medicine.
Acknowledgement
The PURLs Surveillance System is supported in part by Grant Number UL1RR024999 from the National Center for Research Resources; the grant is a Clinical Translational Science Award to the University of Chicago. The content is solely the responsibility of the authors and does not necessarily represent the ofcial views of either the National Center for Research Resources or the National Institutes of Health.
Click here to view PURL METHODOLOGY
1. Schouten O, Boersma E, Hoeks SE, et al. Fluvastatin and perioperative events in patients undergoing vascular surgery. N Engl J Med. 2009;361:980-989.
2. Durazzo AE, Machado FS, Ikeoka DT, et al. Reduction in cardiovascular events after vascular surgery with atorvastatin: a randomized trial. J Vasc Surg. 2004;39:967-975.
3. Pasternak RC, Smith SC, Jr, Bairey-Merz CN, et al. ACC/AHA/ NHLBI Clinical advisory on the use and safety of statins. Circulation. 2002;106:1024-1028.
4. Landesberg G, Shatz V, Akopnik I, et al. Association of cardiac troponin, CK-MB, and postoperative myocardial ischemia with long-term survival after major vascular surgery. J Am Coll Cardiol. 2003;42:1547-1554.
5. Hertzer NR, Beven EG, Young JR, et al. Coronary artery disease in peripheral vascular patients. A classification of 1000 coronary angiograms and results of surgical management. Ann Surg. 1984;199:223-233.
6. Brady AR, Gibbs JS, Greenhalgh RM, et al. Perioperative betablockade (POBBLE) for patients undergoing infrarenal vascular surgery: results of a randomized double-blind controlled trial. J Vasc Surg. 2005;41:602-609.
7. Dunkelgrun M, Boersma E, Schouten O, et al. Bisoprolol and fluvastatin for the reduction of perioperative cardiac mortality and myocardial infarction in intermediate-risk patients undergoing noncardiovascular surgery: a randomized controlled trial (DECREASE-IV). Ann Surg. 2009;249:921-926.
HMG-CoA reductase inhibitors (statins), initiated 30 days before noncardiac vascular surgery, reduce the incidence of postoperative cardiac complications, including fatal myocardial infarction.1,2
STRENGTH OF RECOMMENDATION
A: 1 new randomized controlled trial (RCT), and 1 smaller, older RCT.
Schouten O, Boersma E, Hoeks S, et al. Fluvastatin and perioperative events in patients undergoing vascular surgery. N Engl J Med. 2009;361:980-989.
Durazzo AE, Machado FS, Ikeoka DT, et al. Reduction in cardiovascular events after vascular surgery with atorvastatin: a randomized trial. J Vasc Surg. 2004;39:967-975.
ILLUSTRATIVE CASE
A 67-year-old man with recurrent transient ischemic attacks comes in for a preoperative evaluation for carotid endarterectomy. The patient’s total cholesterol is 207 mg/dL and his low-density lipoprotein cholesterol (LDL-C) is 109 mg/dL. He takes metoprolol and lisinopril for hypertension.
Should you start him on a statin before surgery?
Nearly 25% of patients with peripheral vascular disease suffer from a cardiac event within 72 hours of elective, noncardiac vascular surgery.3 While most of these “complications” have minimal clinical impact and are detected by biochemical markers alone, some patients experience serious cardiac complications—including fatal myocardial infarction (MI).
That’s not surprising, given that most patients who require noncardiac vascular surgery suffer from severe coronary vascular disease.4 What is surprising is that most candidates for noncardiac vascular surgery are not put on statins prior to undergoing surgery.1,2,5
Statins were thought to increase—not prevent—complications
Until recently, taking statins during the perioperative period was believed to increase complications, including statin-associated myopathy. Indeed, guidelines from the American Heart Association (AHA), American College of Cardiology (ACC), and National Heart, Lung and Blood Institute (NHLBI) suggest that it is prudent to withhold statins during hospitalization for major surgery.6
1 small study hinted at value of perioperative statins
A small Brazilian trial conducted in 2004 called the AHA/ACC/NHLBI guidelines into question. the researchers studied 100 patients slated for noncardiac vascular surgery who were randomized to receive either 20 mg atorvastatin (Lipitor) or placebo preoperatively —and monitored them for cardiac events 6 months postoperatively. They found that the incidence of cardiac events (cardiac death, nonfatal MI, stroke, or unstable angina) was more than 3 times higher in the placebo group compared with patients receiving atorvastatin (26% vs 8%, number needed to treat [NNT]=5.6; P=.031).2
The results of this small single study, although suggestive, were not sufficiently convincing to change recommendations about the preoperative use of statins, however. A more comprehensive study was needed to alter standard practice, and the Schouten study that we report on below fits the bill.1
STUDY SUMMARY: Preoperative statin use cuts risk in half
Schouten et al followed 500 patients, who were randomized to receive either 80 mg extended-release fluvastatin (Lescol XL) or placebo for a median of 37 days prior to surgery.1 All enrollees were older than 40 years of age and were scheduled for noncardiac vascular surgery. the reasons for the surgery were abdominal aortic aneurysm repair (47.5%), lower limb arterial reconstruction (38.6%), or carotid artery endarterectomy (13.9%). Patients who were taking long-term beta-blocker therapy were continued on it; otherwise, bisoprolol 2.5 mg was initiated at the screening visit. Patients who were already taking statins (<50% of potential subjects) were excluded. Other exclusions were a contraindication to statin therapy; emergent surgery; and a repeat procedure within the last 29 days. Patients with unstable coronary artery disease or extensive stress-induced ischemia consistent with left main artery disease (or its equivalent) were also excluded.
The primary study outcome was myocardial ischemia, determined by continuous electrocardiogram (EKG) monitoring in the first 48 hours postsurgery and by 12-lead EKG recordings on days 3, 7, and 30. Troponin T levels were measured on postoperative days 1, 3, 7, and 30, as well. the principal secondary end point was either death from cardiovascular causes or nonfatal MI. MI was diagnosed by characteristic ischemic symptoms, with EKG evidence of ischemia or positive troponin T with characteristic rising and falling values.
To gauge fluvastatin’s effect on biomarkers, lipids, high-sensitivity C-reactive protein, and interleukin-6 were measured upon initiation of the medication and on the day of admission for surgery. Serum creatine kinase, alanine aminotransferase (ALT) levels, clinical myopathy, and rhabdomyolysis were monitored as safety measures, with levels measured prior to randomization, on the day of admission, and on postoperative days 1, 3, 7, and 30.
Both groups were similar in age (mean of 66 years), total serum cholesterol levels, risk factors for cardiac events, and medication use. About 75% of the enrollees were men. At baseline, 51% of the participants had a total cholesterol <213 mg/dL, and 39% had an LDL-C <116 mg/dL. Within 30 days after surgery, 27 (10.8%) of those in the fluvastatin group and 47 (19%) of patients in the placebo group had evidence of myocardial ischemia (hazard ratio=0.55; 95% confidence interval [CI], 0.34-0.88; P=.01). the NNT to prevent 1 patient from experiencing myocardial ischemia was 12.
Statin users had fewer MIs. A total of 6 patients receiving fluvastatin died, with 4 deaths attributed to cardiovascular causes. In the placebo group, 12 patients died, 8 of which were ascribed to cardiovascular causes. Eight patients in the fluvastatin group experienced nonfatal MIs, compared with 17 patients in the placebo group (NNT=19 to prevent 1 nonfatal MI or cardiac death (hazard ratio= 0.47; 95% CI, 0.24-0.94; P=.03).
Effects of statins were evident preoperatively. At the time of surgery, patients in the fluvastatin group had, on average, a 20% reduction in their total cholesterol and a 24% reduction in LDL-C; in the placebo group, total cholesterol had fallen by 4% and LDL-C, by 3%.
Patients receiving fluvastatin had an average 21% decrease in C-reactive protein, compared with a 3% increase for the placebo group. Interleukin-6 levels also were reduced far more in the fluvastatin group (33% vs a 4% reduction in the placebo group [P<.001]).
The medication was well tolerated. Overall, 6.8% of participants discontinued the study because of side effects, including 16 (6.4%) patients in the fluvastatin group and 18 (7.3%) in the placebo group. (After surgery, 115 [23.1%] of patients in the statin group temporarily discontinued the drug because of an inability to take oral medications for a median of 2 days.)
Rates of increase in creatine kinase of >10× the upper limit of normal (ULN) were similar between the fluvastatin and placebo groups (4% vs 3.2%, respectively). Increases in ALT to >3× ULN were more frequent in the placebo group compared with the fluvastatin group (5.3%, placebo; 3.2%, fluvastatin). No cases of myopathy or rhabdomyolysis were observed in either group.
WHAT’S NEW: Preop statins can be a lifesaver
The initiation of fluvastatin prior to vascular surgery reduced the incidence of cardiovascular events by 50%—a remarkable result. While patients at the highest risk were excluded from the study, those with lower cardiac risk nonetheless benefi ted from statin therapy. Experts have not typically recommended statins in the perioperative period for this patient population. the results of this study make it clear that they should.
CAVEATS: Extended-release formulation may have affected outcome
The statin used in this study was a longacting formulation, which may have protected patients who were unable to take oral medicines postoperatively. While we don’t know if the extended-release formulation made a difference in this study, we do know that atorvastatin was effective in the Brazilian study discussed earlier.
CHALLENGES TO IMPLEMENTATION: Preop statins may be overlooked
Not all patients see a primary care physician prior to undergoing vascular surgery. This means that it will sometimes be left to surgeons or other specialists to initiate statin therapy prior to surgery, and they may or may not do so.
Optimal timing is unknown. It is not clear how little time a patient scheduled for vascular surgery could spend on a statin and still reap these benefits. Nor do we know if the benefits would extend to patients undergoing other types of surgery; in a large study of patients undergoing all kinds of major noncardiac surgery, no benefits of perioperative statins were found.7
Adherence to the medication regimen presents another challenge, at least for some patients. In this case, however, we think the prospect of preventing major cardiac events postoperatively simply by taking statins for a month should be compelling enough to convince patients to take their medicine.
Acknowledgement
The PURLs Surveillance System is supported in part by Grant Number UL1RR024999 from the National Center for Research Resources; the grant is a Clinical Translational Science Award to the University of Chicago. The content is solely the responsibility of the authors and does not necessarily represent the ofcial views of either the National Center for Research Resources or the National Institutes of Health.
Click here to view PURL METHODOLOGY
1. Schouten O, Boersma E, Hoeks SE, et al. Fluvastatin and perioperative events in patients undergoing vascular surgery. N Engl J Med. 2009;361:980-989.
2. Durazzo AE, Machado FS, Ikeoka DT, et al. Reduction in cardiovascular events after vascular surgery with atorvastatin: a randomized trial. J Vasc Surg. 2004;39:967-975.
3. Pasternak RC, Smith SC, Jr, Bairey-Merz CN, et al. ACC/AHA/ NHLBI Clinical advisory on the use and safety of statins. Circulation. 2002;106:1024-1028.
4. Landesberg G, Shatz V, Akopnik I, et al. Association of cardiac troponin, CK-MB, and postoperative myocardial ischemia with long-term survival after major vascular surgery. J Am Coll Cardiol. 2003;42:1547-1554.
5. Hertzer NR, Beven EG, Young JR, et al. Coronary artery disease in peripheral vascular patients. A classification of 1000 coronary angiograms and results of surgical management. Ann Surg. 1984;199:223-233.
6. Brady AR, Gibbs JS, Greenhalgh RM, et al. Perioperative betablockade (POBBLE) for patients undergoing infrarenal vascular surgery: results of a randomized double-blind controlled trial. J Vasc Surg. 2005;41:602-609.
7. Dunkelgrun M, Boersma E, Schouten O, et al. Bisoprolol and fluvastatin for the reduction of perioperative cardiac mortality and myocardial infarction in intermediate-risk patients undergoing noncardiovascular surgery: a randomized controlled trial (DECREASE-IV). Ann Surg. 2009;249:921-926.
Copyright © 2010 The Family Physicians Inquiries Network.
All rights reserved.
Help patients prevent repeat ankle injury
Advise patients being treated for ankle sprain that reinjury—which is especially common during the first year—can result in chronic pain or disability, and that a home-based proprioceptive training program has been shown to significantly reduce the risk of recurrent sprain.1
STRENGTH OF RECOMMENDATION
A: Based on a high-quality randomized controlled trial (RCT).
Hupperets MD, Verhagen EA, van Mechelen W. Effect of unsupervised home based proprioceptive training on recurrences of ankle sprain: randomised controlled trial. BMJ. 2009;339:b2684.
ILLUSTRATIVE CASE
A 35-year-old man comes to see you 1 day after injuring his left ankle, which he inverted while playing racquetball in a semicompetitive league. After a clinical exam, you diagnose an ankle sprain. You advise him to wrap the ankle for protection and recommend rest, ice, compression, and elevation. Besides treatment for the current sprain, however, he asks what he can do after recovery to prevent ankle reinjury.
What can you tell him?
An estimated 23,000 ankle sprains occur every day in the United States, which amounts to approximately 1 in every 10,000 people.2 In many sports, ankle sprain is the most common injury,3 partly because an athlete who incurs a first ankle sprain is at increased risk of another.4-6 The risk of reinjury is highest in the year immediately following the initial sprain.6-8
Long-term effects of repeat sprains
About half of recurrent ankle sprains result in chronic pain or disability, so preventing repeat sprains is an important patient-oriented treatment goal. Various modalities, including bracing, taping, and warm-up and strengthening exercises, have been used to prevent recurrence of ankle sprain. Proprioceptive training has also been suggested.5,9 A Cochrane review in 2001 found limited evidence for reduction of ankle sprain recurrence after proprioceptive exercises.10 Until the study reviewed in this PURL, its effectiveness remained uncertain.
STUDY SUMMARY: Exercise program reduces risk
Hupperets et al1 investigated the effectiveness of a home-based proprioceptive training program to prevent ankle sprain recurrence. Enrollees (N=522) in this well-done RCT were active sports participants ranging in age from 12 to 70 years, all of whom had incurred ankle sprains in the preceding 2 months. They were recruited throughout The Netherlands using a variety of medical channels—emergency departments, general practices, and physical therapy offices—and advertisements in newspapers and sports magazines, at sports tournaments, and on the Internet.
The athletes were randomized to the intervention or control group, with stratification for sex, type of enrollment, and type of care they initially received for the ankle sprain—which the participants in both groups received without interference from the authors. (Among the enrollees were 181 people who did not receive any medical care for their sprains.)
Participants in the intervention group were given an instructional DVD, a balance board, and an exercise sheet, with further instructions available on a Web site. They were told to engage in 3 self-guided treatment sessions per week for 8 weeks, with a maximum duration of 30 minutes per session. The regimen included a series of exercises such as the 1-legged stance, in which the patient slightly flexes the weight-bearing leg at the knee, hip, and ankle while the foot of the other leg is off the floor, then switches legs after a minute. The exercises involved increasing levels of difficulty—performed on an even surface, on an even surface with the eyes closed, or on a balance board.
The primary outcome was a self-reported new sprain of the previously injured ankle during 1000 hours of exposure to sports in a year of follow-up. Severe sprain—defined as a sprain leading to loss of sports time or resulting in health care costs or lost productivity—was a secondary outcome. Cox regression analysis was used to compare risk of a recurrent ankle sprain between the intervention and control groups, using an intention-to-treat analysis.
At the 1-year point, 56 of the 256 participants in the intervention group (22%) and 89 of the 266 participants in the control group (33%) reported recurrent ankle sprains. The risk of recurrence per 1000 hours of exposure for the intervention group was significantly lower (relative risk [RR]=0.63; 95% confidence interval [CI], 0.45–0.88) compared with the control group. Nine people would need to be treated to prevent 1 recurrent ankle sprain.
Similarly, significantly lower risks for severe sprains were found for the intervention group, as indicated by loss of sports time (RR=0.53; 95% CI, 0.32–0.88) and health care costs (RR=0.25; 95% CI, 0.12–0.50).
WHAT’S NEW?: High-quality study supports self-guided training program
This is the first RCT to assess the effect of a nonsupervised home-based proprioceptive training program, in addition to usual care, on the recurrence of ankle sprain. Two earlier studies had evaluated balance board exercises to prevent initial ankle injuries in young athletes, and both found these exercises to be effective.8,11 But prior studies evaluating prevention of recurrent ankle sprain have had methodology weaknesses or small sample sizes.12-14
One other RCT had studied the effect of an exercise program that included balance boards on the risk of ankle sprain recurrence and found a significant difference in favor or the intervention group (absolute risk reduction=22%).15 But the exercise program in that study was supervised by professionals rather than self-guided by patients. The study was also marred by significant loss to follow-up (27%), and the information on reinjury was collected retrospectively a year after the acute ankle sprain.
By comparison, the study done by Hupperets et al had a large sample size, minimal loss to follow-up (14%), and monthly check-in with patients to assess reinjury. The results show an absolute reduction of 11% in the risk of recurrence of ankle sprain. The evidence brought forth by this high-quality RCT supports adding a home-based proprioceptive training program for every patient with an acute ankle sprain to reduce the incidence of sprain recurrence.
CAVEATS: Will patients do their exercises?
One concern highlighted by this study is compliance with the treatment regimen. Only 23% of those in the intervention group fully complied with the 8-week program, 29% were partially compliant, 35% were not compliant, and 13% were of unknown compliance.
We think these findings reflect the compliance seen in the real world, so it is encouraging to know that the intervention was nonetheless effective. Clearly, some proprioceptive training is better than none; the optimal amount is not known.
Generalizability is another concern, since this study focused on athletes. However, the investigators included a wide spectrum of patients (ages 12-70 years, male and female, and those engaged in all levels of sports activity). Furthermore, since the mechanism of injury for lateral ankle sprain is generally the same, we think it is reasonable to assume that ankle sprains not related to sports would benefit from a proprioceptive program, as well.
CHALLENGES TO IMPLEMENTATION: No significant barriers exist
The treatment does not have any significant adverse effects and should be easy to recommend. Balance boards can be obtained from a sporting goods supplier or online, at a cost of $13 to $35. Some busy physician practices may not have the time or staff to teach patients how to carry out these exercises. In that case, a 1-time referral to a physical therapist should be sufficient.
Acknowledgment
The PURLs Surveillance System is supported in part by Grant Number UL1RR024999 from the National Center for Research Resources, a Clinical Translational Science Award to the University of Chicago. The content is solely the responsibility of the authors and does not necessarily represent the official views of the National Center for Research Resources or the National Institutes of Health.
Click here to view PURL METHODOLOGY
1. Hupperets MD, Verhagen EA, van Mechelen W. Effect of unsupervised home based proprioceptive training on recurrences of ankle sprain: randomised controlled trial. BMJ. 2009;339:b2684.
2. Kannus P, Renstrom P. Treatment for acute tears of the lateral ligaments of the ankle. Operation, cast, or early controlled mobilization. J Bone Joint Surg Am. 1991;73:305-312.
3. Fong DT, Hong Y, Chan LK, et al. A systematic review on ankle injury and ankle sprain in sports. Sports Med. 2007;37:73-94.
4. Meeuwisse WH, Tyreman H, Hagel B, et al. A dynamic model of etiology in sport injury: the recursive nature of risk and causation. Clin J Sport Med. 2007;17:215-219.
5. Kaminski TW, Buckley BD, Powers ME, et al. Effect of strength and proprioception training on eversion to inversion strength ratios in subjects with unilateral functional ankle instability. Br J Sports Med. 2003;37:410-415.
6. Bahr R, Bahr IA. Incidence of acute volleyball injuries: a prospective cohort study of injury mechanisms and risk factors. Scand J Med Sci Sports. 1997;7:166-171.
7. Milgrom C, Shlamkovitch N, Finestone A, et al. Risk factors for lateral ankle sprain: a prospective study among military recruits. Foot Ankle. 1991;12:26-30.
8. Wedderkopp N, Kaltoft M, Holm R, et al. Comparison of two intervention programmes in young female players in European handball—with and without ankle disc. Scand J Med Sci Sports. 2003;13:371-375.
9. Hupperets MD, Verhagen EA, van Mechelen W. Effect of sensorimotor training on morphological, neurophysiological and functional characteristics of the ankle: a critical review. Sports Med. 2009;39:591-605.
10. Handoll HH, Rowe BH, Quinn KM, et al. Interventions for preventing ankle ligament injuries. Cochrane Database Syst Rev. 2001;(3):CD000018.-
11. Verhagen EA, Van der Beek AJ, Bouter LM, et al. A one season prospective cohort study of volleyball injuries. Br J Sports Med. 2004;38:477-481.
12. Tropp H, Askling C, Gillquist J. Prevention of ankle sprains. Am J Sports Med. 1985;13:259-262.
13. Wedderkopp N, Kaltoft M, Lundgaard B, et al. Prevention of injuries in young female players in European team handball. A prospective intervention study. Scand J Med Sci Sports. 1999;9:41-47.
14. Wester JU, Jespersen SM, Nielsen KD, et al. Wobble board training after partial sprains of the lateral ligaments of the ankle: A prospective randomized study. J Orthop Sports Phys Ther. 1996;23:332-336.
15. Holme E, Magnusson SP, Becher K, et al. The effect of supervised rehabilitation on strength, postural sway, position sense and re-injury risk after acute ankle ligament sprain. Scand J Med Sci Sports. 1999;9:104-109.
Advise patients being treated for ankle sprain that reinjury—which is especially common during the first year—can result in chronic pain or disability, and that a home-based proprioceptive training program has been shown to significantly reduce the risk of recurrent sprain.1
STRENGTH OF RECOMMENDATION
A: Based on a high-quality randomized controlled trial (RCT).
Hupperets MD, Verhagen EA, van Mechelen W. Effect of unsupervised home based proprioceptive training on recurrences of ankle sprain: randomised controlled trial. BMJ. 2009;339:b2684.
ILLUSTRATIVE CASE
A 35-year-old man comes to see you 1 day after injuring his left ankle, which he inverted while playing racquetball in a semicompetitive league. After a clinical exam, you diagnose an ankle sprain. You advise him to wrap the ankle for protection and recommend rest, ice, compression, and elevation. Besides treatment for the current sprain, however, he asks what he can do after recovery to prevent ankle reinjury.
What can you tell him?
An estimated 23,000 ankle sprains occur every day in the United States, which amounts to approximately 1 in every 10,000 people.2 In many sports, ankle sprain is the most common injury,3 partly because an athlete who incurs a first ankle sprain is at increased risk of another.4-6 The risk of reinjury is highest in the year immediately following the initial sprain.6-8
Long-term effects of repeat sprains
About half of recurrent ankle sprains result in chronic pain or disability, so preventing repeat sprains is an important patient-oriented treatment goal. Various modalities, including bracing, taping, and warm-up and strengthening exercises, have been used to prevent recurrence of ankle sprain. Proprioceptive training has also been suggested.5,9 A Cochrane review in 2001 found limited evidence for reduction of ankle sprain recurrence after proprioceptive exercises.10 Until the study reviewed in this PURL, its effectiveness remained uncertain.
STUDY SUMMARY: Exercise program reduces risk
Hupperets et al1 investigated the effectiveness of a home-based proprioceptive training program to prevent ankle sprain recurrence. Enrollees (N=522) in this well-done RCT were active sports participants ranging in age from 12 to 70 years, all of whom had incurred ankle sprains in the preceding 2 months. They were recruited throughout The Netherlands using a variety of medical channels—emergency departments, general practices, and physical therapy offices—and advertisements in newspapers and sports magazines, at sports tournaments, and on the Internet.
The athletes were randomized to the intervention or control group, with stratification for sex, type of enrollment, and type of care they initially received for the ankle sprain—which the participants in both groups received without interference from the authors. (Among the enrollees were 181 people who did not receive any medical care for their sprains.)
Participants in the intervention group were given an instructional DVD, a balance board, and an exercise sheet, with further instructions available on a Web site. They were told to engage in 3 self-guided treatment sessions per week for 8 weeks, with a maximum duration of 30 minutes per session. The regimen included a series of exercises such as the 1-legged stance, in which the patient slightly flexes the weight-bearing leg at the knee, hip, and ankle while the foot of the other leg is off the floor, then switches legs after a minute. The exercises involved increasing levels of difficulty—performed on an even surface, on an even surface with the eyes closed, or on a balance board.
The primary outcome was a self-reported new sprain of the previously injured ankle during 1000 hours of exposure to sports in a year of follow-up. Severe sprain—defined as a sprain leading to loss of sports time or resulting in health care costs or lost productivity—was a secondary outcome. Cox regression analysis was used to compare risk of a recurrent ankle sprain between the intervention and control groups, using an intention-to-treat analysis.
At the 1-year point, 56 of the 256 participants in the intervention group (22%) and 89 of the 266 participants in the control group (33%) reported recurrent ankle sprains. The risk of recurrence per 1000 hours of exposure for the intervention group was significantly lower (relative risk [RR]=0.63; 95% confidence interval [CI], 0.45–0.88) compared with the control group. Nine people would need to be treated to prevent 1 recurrent ankle sprain.
Similarly, significantly lower risks for severe sprains were found for the intervention group, as indicated by loss of sports time (RR=0.53; 95% CI, 0.32–0.88) and health care costs (RR=0.25; 95% CI, 0.12–0.50).
WHAT’S NEW?: High-quality study supports self-guided training program
This is the first RCT to assess the effect of a nonsupervised home-based proprioceptive training program, in addition to usual care, on the recurrence of ankle sprain. Two earlier studies had evaluated balance board exercises to prevent initial ankle injuries in young athletes, and both found these exercises to be effective.8,11 But prior studies evaluating prevention of recurrent ankle sprain have had methodology weaknesses or small sample sizes.12-14
One other RCT had studied the effect of an exercise program that included balance boards on the risk of ankle sprain recurrence and found a significant difference in favor or the intervention group (absolute risk reduction=22%).15 But the exercise program in that study was supervised by professionals rather than self-guided by patients. The study was also marred by significant loss to follow-up (27%), and the information on reinjury was collected retrospectively a year after the acute ankle sprain.
By comparison, the study done by Hupperets et al had a large sample size, minimal loss to follow-up (14%), and monthly check-in with patients to assess reinjury. The results show an absolute reduction of 11% in the risk of recurrence of ankle sprain. The evidence brought forth by this high-quality RCT supports adding a home-based proprioceptive training program for every patient with an acute ankle sprain to reduce the incidence of sprain recurrence.
CAVEATS: Will patients do their exercises?
One concern highlighted by this study is compliance with the treatment regimen. Only 23% of those in the intervention group fully complied with the 8-week program, 29% were partially compliant, 35% were not compliant, and 13% were of unknown compliance.
We think these findings reflect the compliance seen in the real world, so it is encouraging to know that the intervention was nonetheless effective. Clearly, some proprioceptive training is better than none; the optimal amount is not known.
Generalizability is another concern, since this study focused on athletes. However, the investigators included a wide spectrum of patients (ages 12-70 years, male and female, and those engaged in all levels of sports activity). Furthermore, since the mechanism of injury for lateral ankle sprain is generally the same, we think it is reasonable to assume that ankle sprains not related to sports would benefit from a proprioceptive program, as well.
CHALLENGES TO IMPLEMENTATION: No significant barriers exist
The treatment does not have any significant adverse effects and should be easy to recommend. Balance boards can be obtained from a sporting goods supplier or online, at a cost of $13 to $35. Some busy physician practices may not have the time or staff to teach patients how to carry out these exercises. In that case, a 1-time referral to a physical therapist should be sufficient.
Acknowledgment
The PURLs Surveillance System is supported in part by Grant Number UL1RR024999 from the National Center for Research Resources, a Clinical Translational Science Award to the University of Chicago. The content is solely the responsibility of the authors and does not necessarily represent the official views of the National Center for Research Resources or the National Institutes of Health.
Click here to view PURL METHODOLOGY
1. Hupperets MD, Verhagen EA, van Mechelen W. Effect of unsupervised home based proprioceptive training on recurrences of ankle sprain: randomised controlled trial. BMJ. 2009;339:b2684.
2. Kannus P, Renstrom P. Treatment for acute tears of the lateral ligaments of the ankle. Operation, cast, or early controlled mobilization. J Bone Joint Surg Am. 1991;73:305-312.
3. Fong DT, Hong Y, Chan LK, et al. A systematic review on ankle injury and ankle sprain in sports. Sports Med. 2007;37:73-94.
4. Meeuwisse WH, Tyreman H, Hagel B, et al. A dynamic model of etiology in sport injury: the recursive nature of risk and causation. Clin J Sport Med. 2007;17:215-219.
5. Kaminski TW, Buckley BD, Powers ME, et al. Effect of strength and proprioception training on eversion to inversion strength ratios in subjects with unilateral functional ankle instability. Br J Sports Med. 2003;37:410-415.
6. Bahr R, Bahr IA. Incidence of acute volleyball injuries: a prospective cohort study of injury mechanisms and risk factors. Scand J Med Sci Sports. 1997;7:166-171.
7. Milgrom C, Shlamkovitch N, Finestone A, et al. Risk factors for lateral ankle sprain: a prospective study among military recruits. Foot Ankle. 1991;12:26-30.
8. Wedderkopp N, Kaltoft M, Holm R, et al. Comparison of two intervention programmes in young female players in European handball—with and without ankle disc. Scand J Med Sci Sports. 2003;13:371-375.
9. Hupperets MD, Verhagen EA, van Mechelen W. Effect of sensorimotor training on morphological, neurophysiological and functional characteristics of the ankle: a critical review. Sports Med. 2009;39:591-605.
10. Handoll HH, Rowe BH, Quinn KM, et al. Interventions for preventing ankle ligament injuries. Cochrane Database Syst Rev. 2001;(3):CD000018.-
11. Verhagen EA, Van der Beek AJ, Bouter LM, et al. A one season prospective cohort study of volleyball injuries. Br J Sports Med. 2004;38:477-481.
12. Tropp H, Askling C, Gillquist J. Prevention of ankle sprains. Am J Sports Med. 1985;13:259-262.
13. Wedderkopp N, Kaltoft M, Lundgaard B, et al. Prevention of injuries in young female players in European team handball. A prospective intervention study. Scand J Med Sci Sports. 1999;9:41-47.
14. Wester JU, Jespersen SM, Nielsen KD, et al. Wobble board training after partial sprains of the lateral ligaments of the ankle: A prospective randomized study. J Orthop Sports Phys Ther. 1996;23:332-336.
15. Holme E, Magnusson SP, Becher K, et al. The effect of supervised rehabilitation on strength, postural sway, position sense and re-injury risk after acute ankle ligament sprain. Scand J Med Sci Sports. 1999;9:104-109.
Copyright © 2010 The Family Physicians Inquiries Network.
All rights reserved.
Vertebroplasty for osteoporotic fracture? Think twice
Think twice before recommending vertebroplasty (VP) for symptomatic osteoporotic compression fractures. New studies suggest that it has little benefit; thus, VP should be considered only after other, more conservative options fail.1,2
STRENGTH OF RECOMMENDATION
A: Consistent, high-quality randomized controlled trials (RCTs)
Kallmes DF, Comstock BA, Heagerty PJ, et al. A randomized trial of vertebroplasty for osteoporotic spinal fractures. N Engl J Med. 2009;361:569-579.
Buchbinder R, Osborne RH, Ebeling PR, et al. A randomized trial of vertebroplasty for painful osteoporotic vertebral fractures. N Engl J Med. 2009;361:557-568.
ILLUSTRATIVE CASE
A 72-year-old woman with a history of osteoporosis is being treated with a bisphosphonate, calcium, and vitamin D. She’s in your office today because of the sudden onset of midline lower back pain after minor trauma. X-ray reveals an uncomplicated osteoporotic fracture of L2, with 50% loss of vertebral height. When she returns in a few weeks, the patient still has significant pain (7 on a scale of 0-10) that is not well controlled with hydrocodone and acetaminophen. Should you refer her for vertebroplasty?
Each year in the United States, approximately 750,000 vertebral fractures occur.3 The traditional treatments for osteoporotic vertebral compression fractures include bed rest, pain medication, braces, and therapy for osteoporosis. Since the late 1990s, however, vertebroplasty (VP)—the percutaneous injection of acrylic bone cement (polymethylmethacrylate, or PMMA) into the affected vertebra under radiologic guidance—has become the preferred treatment, particularly for painful vertebral fractures that do not respond to conservative treatment.
Widely used, but not much evidence
Despite a lack of rigorous scientific evidence of VP’s efficacy, the number of procedures nearly doubled from 2001 to 2005 among Medicare enrollees—from 45 per 100,000 to 87 per 100,000.4 A meta-analysis of 74 (mostly observational) studies of VP for osteoporotic compression fractures found good evidence for improved pain control in the first 2 weeks. At 3 months, the analysis found only fair evidence of benefit, and at 2 years, there was no apparent benefit.5
Complications are primarily related to cement extravasation, but are usually not symptomatic. The overall symptomatic complication rate is less than 4%.6 There is conflicting evidence regarding whether VP increases the risk of fracture in other vertebrae.7
Prior to the 2 studies reviewed in this PURL, there were only 2 RCTs comparing vertebroplasty with conservative medical management. The VERTOS trial8 randomized 34 people with osteoporotic vertebral compression fractures (of 6 weeks’ to 6 months’ duration and refractory to medical therapy) to either VP or conservative treatment. The VP patients had improved pain scores and decreased use of analgesic agents at 24 hours, compared with the conservative treatment group. But at the end of the 2-week trial, there was no difference in pain scores between the 2 groups.
The other RCT of VP vs conservative therapy randomized 50 patients with acute or subacute osteoporotic fractures (the average age of fracture was 6-8 days) to VP or conservative care.9 There was significant pain improvement in VP patients at 24 hours, but no significant difference in pain scores between the 2 groups at 3 months. This study was significantly flawed, however, because the researchers failed to collect pain measurements at study entry for a substantial number of patients.
STUDY SUMMARIES: Vertebroplasty lacks benefits
Both INVEST (the Kallmes study)1 and the Buchbinder study2 were blinded, randomized, placebo-controlled trials of VP. INVEST, performed at 11 sites in the United States, United Kingdom, and Australia, enrolled 131 patients. The Buchbinder study enrolled 78 patients at 4 sites in Australia. Both enrolled patients with painful osteoporotic fractures of less than 1 year’s duration. Exclusions for both trials included a suspicion of neoplasm in the vertebral body, substantial retropulsion of bony fragments, medical conditions that would preclude surgery, and an inability to obtain consent or conduct follow-up.
Participants in both trials had similar baseline characteristics: They were primarily Caucasian and female, with an average age in the mid-70s. The average pain intensity at enrollment was about 7 on a 0- to 10-point visual analog scale (VAS). The average time since the fracture causing the pain was 4 to 5 months in INVEST and about 2 months in the Buchbinder study. Both trials used appropriate randomization, blinding, and intention-to-treat analysis.
Blinding featured sham procedures. In both studies, the researchers used elaborate measures to ensure blinding: The control patients were prepped in the fluoroscopy suite as if they were about to undergo VP. They received local anesthesia down to the periosteum of the vertebra. The PMMA was opened and mixed in the room to allow its distinctive smell to permeate. Patients also received verbal and physical cues that simulated the procedure, and spinal images were obtained.
INVEST used pain and disability at 1 month as the primary end points. There was minimal difference in pain intensity (3.9 on VAS for the VP group, vs 4.6 for the controls). There was also little difference in back pain-related disability at 1 month, with scores on the Roland Morris Disability scale decreasing (from a baseline of 16.6 for the VP group and 17.5 for the control group) to 12 and 13, respectively (P=.49). Nor were there any statistically significant differences in pain or disability at earlier intervals (the researchers compared the scores of the VP and control groups at 3 days and 14 days.) The authors also looked at 7 other measures of pain and functioning and found no significant differences in any of them at the end of 1 month.
To encourage enrollment, patients in the INVEST trial were allowed to cross over after 1 month. At that time, 12% of those in the VP group and 43% of those in the control group took advantage of this provision and had the alternate “procedure.” Both groups of cross-over patients had more pain than those who did not make the switch. Although both of these groups showed improvement at the 3-month mark, they still had higher pain levels than their counterparts who did not cross over.
The Buchbinder study used overall pain on a 10-point VAS at 3 months as its primary end point. The researchers also recorded 7 other measurements and assessed participants at 1 week, 1 month, 3 months, and 6 months. At 3 months, there was no significant difference in the change in pain scores between the treatment and placebo groups: Mean pain scores for those who underwent VP decreased from 7.4 to 5.1, while the placebo group’s average pain scores went from 7.1 to 5.4. Similarly, there was no difference between the treatment and placebo groups in the change in pain scores at 1 week or 6 months—and no difference between the groups at any time for the other 7 measures of pain and function.
WHAT’S NEW: Trials cast doubt on established procedure
VP has essentially become the standard of care for painful osteoporotic vertebral fractures, bolstered by a long list of methodologically inferior studies that have lent support to the procedure’s efficacy. These 2 studies are the first to incorporate a sham procedure that supports true placebo control. The complete lack of benefit for VP compared with conservative management in these well-done trials calls into question the results of prior reports.
CAVEATS: Sample size, study design
Researchers in both studies had considerable difficulty enrolling patients. Both were multi center trials and enrolled patients over a 4-year period; nonetheless, taken together, only about 200 patients consented. The researchers faced opposition from referring doctors and patients alike, who believed that the possibility of receiving a placebo treatment rather than VP constituted inferior care.
In addition to their relatively small size, these studies enrolled patients with fairly chronic fractures. It has been postulated that VP has a higher likelihood of success with acute fractures, but that was not the focus of these trials. The majority of the fractures in trial participants were not acute (<4 weeks). Neither trial was designed for analysis based on the chronicity of the fracture, and neither found a difference in outcome based on fracture duration.
Because these trials were not designed, or robust enough, for subgroup analysis, we don’t know if there is a population that might benefit (ie, severity of the compression, acuteness of the fracture, or premorbid health, etc). In addition, these results do not apply to the use of VP for other reasons—malignant spinal neoplasms or vertebral hemangiomas, for example.
Finally, it is important to remember that these trials did not strictly compare VP with conservative treatment. The sham treatment may have had significant placebo power that is greater than that of typical conservative treatment.
CHALLENGES TO IMPLEMENTATION: Support for VP is well established
Anecdotal results, established treatment patterns, and numerous low-quality studies support the use of VP for vertebral compression fracture. Medicare and other insurers had reviewed the evidence prior to these 2 trials and agreed to reimburse for the procedure. It remains to be seen whether these 2 trials will be sufficient to overcome these barriers and change practice patterns.
At a minimum, however, it is prudent to reserve VP for patients who have intractable symptoms until further trials are undertaken to determine whether VP really works, and if so, for which patients.
Acknowledgement
The PURLs Surveillance System is supported in part by Grant Number UL1RR024999 from the National Center for Research Resources, a Clinical Translational Science Award to the University of Chicago. The content is solely the responsibility of the authors and does not necessarily represent the official views of the National Center for Research Resources or the National Institutes of Health.
1. Kallmes DF, Comstock BA, Heagerty PJ, et al. A randomized trial of vertebroplasty for osteoporotic spinal fractures. N Engl J Med. 2009;361:569-579.
2. Buchbinder R, Osborne RH, Ebeling PR, et al. A randomized trial of vertebroplasty for painful osteoporotic vertebral fractures. N Engl J Med. 2009;361:557-568.
3. Weinstein JN. Balancing science and informed choice in decisions about vertebroplasty. N Engl J Med. 2009;361:619-621.
4. Gray DT, Hollingworth W, Onwudiwe N, et al. Thoracic and lumbar vertebroplasties performed in US Medicare enrollees, 2001-2005. JAMA. 2007;298:1760-1762.
5. McGirt MJ, Parker SL, Wolinsky JP, et al. Vertebroplasty and kyphoplasty for the treatment of vertebral compression fractures: an evidenced-based review of the literature. Spine J. 2009;9:501-508.
6. Lee MJ, Dumonski M, Cahill P, et al. Percutaneous treatment of vertebral compression fractures: a meta-analysis of complications. Spine. 2009;34:1228-1232.
7. Hulme PA, Krebs J, Ferguson S, et al. Vertebroplasty and kyphoplasty: a systematic review of 69 clinical studies. Spine. 2006;31:1983-2001.
8. Voormolen MH, Mali WP, Lohle PN, et al. Percutaneous vertebroplasty compared with optimal pain medication treatment: short-term clinical outcome of patients with subacute or chronic painful osteoporotic vertebral compression fractures. The VERTOS study. AJNR Am J Neuroradiol. 2007;28:555-560.
9. Rousing R, Andersen MO, Jespersen SM, et al. Percutaneous vertebroplasty compared to conservative treatment in patients with painful acute or subacute osteoporotic vertebral fractures: three-months follow-up in a clinical randomized study. Spine. 2009;34:1349-1354.
Think twice before recommending vertebroplasty (VP) for symptomatic osteoporotic compression fractures. New studies suggest that it has little benefit; thus, VP should be considered only after other, more conservative options fail.1,2
STRENGTH OF RECOMMENDATION
A: Consistent, high-quality randomized controlled trials (RCTs)
Kallmes DF, Comstock BA, Heagerty PJ, et al. A randomized trial of vertebroplasty for osteoporotic spinal fractures. N Engl J Med. 2009;361:569-579.
Buchbinder R, Osborne RH, Ebeling PR, et al. A randomized trial of vertebroplasty for painful osteoporotic vertebral fractures. N Engl J Med. 2009;361:557-568.
ILLUSTRATIVE CASE
A 72-year-old woman with a history of osteoporosis is being treated with a bisphosphonate, calcium, and vitamin D. She’s in your office today because of the sudden onset of midline lower back pain after minor trauma. X-ray reveals an uncomplicated osteoporotic fracture of L2, with 50% loss of vertebral height. When she returns in a few weeks, the patient still has significant pain (7 on a scale of 0-10) that is not well controlled with hydrocodone and acetaminophen. Should you refer her for vertebroplasty?
Each year in the United States, approximately 750,000 vertebral fractures occur.3 The traditional treatments for osteoporotic vertebral compression fractures include bed rest, pain medication, braces, and therapy for osteoporosis. Since the late 1990s, however, vertebroplasty (VP)—the percutaneous injection of acrylic bone cement (polymethylmethacrylate, or PMMA) into the affected vertebra under radiologic guidance—has become the preferred treatment, particularly for painful vertebral fractures that do not respond to conservative treatment.
Widely used, but not much evidence
Despite a lack of rigorous scientific evidence of VP’s efficacy, the number of procedures nearly doubled from 2001 to 2005 among Medicare enrollees—from 45 per 100,000 to 87 per 100,000.4 A meta-analysis of 74 (mostly observational) studies of VP for osteoporotic compression fractures found good evidence for improved pain control in the first 2 weeks. At 3 months, the analysis found only fair evidence of benefit, and at 2 years, there was no apparent benefit.5
Complications are primarily related to cement extravasation, but are usually not symptomatic. The overall symptomatic complication rate is less than 4%.6 There is conflicting evidence regarding whether VP increases the risk of fracture in other vertebrae.7
Prior to the 2 studies reviewed in this PURL, there were only 2 RCTs comparing vertebroplasty with conservative medical management. The VERTOS trial8 randomized 34 people with osteoporotic vertebral compression fractures (of 6 weeks’ to 6 months’ duration and refractory to medical therapy) to either VP or conservative treatment. The VP patients had improved pain scores and decreased use of analgesic agents at 24 hours, compared with the conservative treatment group. But at the end of the 2-week trial, there was no difference in pain scores between the 2 groups.
The other RCT of VP vs conservative therapy randomized 50 patients with acute or subacute osteoporotic fractures (the average age of fracture was 6-8 days) to VP or conservative care.9 There was significant pain improvement in VP patients at 24 hours, but no significant difference in pain scores between the 2 groups at 3 months. This study was significantly flawed, however, because the researchers failed to collect pain measurements at study entry for a substantial number of patients.
STUDY SUMMARIES: Vertebroplasty lacks benefits
Both INVEST (the Kallmes study)1 and the Buchbinder study2 were blinded, randomized, placebo-controlled trials of VP. INVEST, performed at 11 sites in the United States, United Kingdom, and Australia, enrolled 131 patients. The Buchbinder study enrolled 78 patients at 4 sites in Australia. Both enrolled patients with painful osteoporotic fractures of less than 1 year’s duration. Exclusions for both trials included a suspicion of neoplasm in the vertebral body, substantial retropulsion of bony fragments, medical conditions that would preclude surgery, and an inability to obtain consent or conduct follow-up.
Participants in both trials had similar baseline characteristics: They were primarily Caucasian and female, with an average age in the mid-70s. The average pain intensity at enrollment was about 7 on a 0- to 10-point visual analog scale (VAS). The average time since the fracture causing the pain was 4 to 5 months in INVEST and about 2 months in the Buchbinder study. Both trials used appropriate randomization, blinding, and intention-to-treat analysis.
Blinding featured sham procedures. In both studies, the researchers used elaborate measures to ensure blinding: The control patients were prepped in the fluoroscopy suite as if they were about to undergo VP. They received local anesthesia down to the periosteum of the vertebra. The PMMA was opened and mixed in the room to allow its distinctive smell to permeate. Patients also received verbal and physical cues that simulated the procedure, and spinal images were obtained.
INVEST used pain and disability at 1 month as the primary end points. There was minimal difference in pain intensity (3.9 on VAS for the VP group, vs 4.6 for the controls). There was also little difference in back pain-related disability at 1 month, with scores on the Roland Morris Disability scale decreasing (from a baseline of 16.6 for the VP group and 17.5 for the control group) to 12 and 13, respectively (P=.49). Nor were there any statistically significant differences in pain or disability at earlier intervals (the researchers compared the scores of the VP and control groups at 3 days and 14 days.) The authors also looked at 7 other measures of pain and functioning and found no significant differences in any of them at the end of 1 month.
To encourage enrollment, patients in the INVEST trial were allowed to cross over after 1 month. At that time, 12% of those in the VP group and 43% of those in the control group took advantage of this provision and had the alternate “procedure.” Both groups of cross-over patients had more pain than those who did not make the switch. Although both of these groups showed improvement at the 3-month mark, they still had higher pain levels than their counterparts who did not cross over.
The Buchbinder study used overall pain on a 10-point VAS at 3 months as its primary end point. The researchers also recorded 7 other measurements and assessed participants at 1 week, 1 month, 3 months, and 6 months. At 3 months, there was no significant difference in the change in pain scores between the treatment and placebo groups: Mean pain scores for those who underwent VP decreased from 7.4 to 5.1, while the placebo group’s average pain scores went from 7.1 to 5.4. Similarly, there was no difference between the treatment and placebo groups in the change in pain scores at 1 week or 6 months—and no difference between the groups at any time for the other 7 measures of pain and function.
WHAT’S NEW: Trials cast doubt on established procedure
VP has essentially become the standard of care for painful osteoporotic vertebral fractures, bolstered by a long list of methodologically inferior studies that have lent support to the procedure’s efficacy. These 2 studies are the first to incorporate a sham procedure that supports true placebo control. The complete lack of benefit for VP compared with conservative management in these well-done trials calls into question the results of prior reports.
CAVEATS: Sample size, study design
Researchers in both studies had considerable difficulty enrolling patients. Both were multi center trials and enrolled patients over a 4-year period; nonetheless, taken together, only about 200 patients consented. The researchers faced opposition from referring doctors and patients alike, who believed that the possibility of receiving a placebo treatment rather than VP constituted inferior care.
In addition to their relatively small size, these studies enrolled patients with fairly chronic fractures. It has been postulated that VP has a higher likelihood of success with acute fractures, but that was not the focus of these trials. The majority of the fractures in trial participants were not acute (<4 weeks). Neither trial was designed for analysis based on the chronicity of the fracture, and neither found a difference in outcome based on fracture duration.
Because these trials were not designed, or robust enough, for subgroup analysis, we don’t know if there is a population that might benefit (ie, severity of the compression, acuteness of the fracture, or premorbid health, etc). In addition, these results do not apply to the use of VP for other reasons—malignant spinal neoplasms or vertebral hemangiomas, for example.
Finally, it is important to remember that these trials did not strictly compare VP with conservative treatment. The sham treatment may have had significant placebo power that is greater than that of typical conservative treatment.
CHALLENGES TO IMPLEMENTATION: Support for VP is well established
Anecdotal results, established treatment patterns, and numerous low-quality studies support the use of VP for vertebral compression fracture. Medicare and other insurers had reviewed the evidence prior to these 2 trials and agreed to reimburse for the procedure. It remains to be seen whether these 2 trials will be sufficient to overcome these barriers and change practice patterns.
At a minimum, however, it is prudent to reserve VP for patients who have intractable symptoms until further trials are undertaken to determine whether VP really works, and if so, for which patients.
Acknowledgement
The PURLs Surveillance System is supported in part by Grant Number UL1RR024999 from the National Center for Research Resources, a Clinical Translational Science Award to the University of Chicago. The content is solely the responsibility of the authors and does not necessarily represent the official views of the National Center for Research Resources or the National Institutes of Health.
1. Kallmes DF, Comstock BA, Heagerty PJ, et al. A randomized trial of vertebroplasty for osteoporotic spinal fractures. N Engl J Med. 2009;361:569-579.
2. Buchbinder R, Osborne RH, Ebeling PR, et al. A randomized trial of vertebroplasty for painful osteoporotic vertebral fractures. N Engl J Med. 2009;361:557-568.
3. Weinstein JN. Balancing science and informed choice in decisions about vertebroplasty. N Engl J Med. 2009;361:619-621.
4. Gray DT, Hollingworth W, Onwudiwe N, et al. Thoracic and lumbar vertebroplasties performed in US Medicare enrollees, 2001-2005. JAMA. 2007;298:1760-1762.
5. McGirt MJ, Parker SL, Wolinsky JP, et al. Vertebroplasty and kyphoplasty for the treatment of vertebral compression fractures: an evidenced-based review of the literature. Spine J. 2009;9:501-508.
6. Lee MJ, Dumonski M, Cahill P, et al. Percutaneous treatment of vertebral compression fractures: a meta-analysis of complications. Spine. 2009;34:1228-1232.
7. Hulme PA, Krebs J, Ferguson S, et al. Vertebroplasty and kyphoplasty: a systematic review of 69 clinical studies. Spine. 2006;31:1983-2001.
8. Voormolen MH, Mali WP, Lohle PN, et al. Percutaneous vertebroplasty compared with optimal pain medication treatment: short-term clinical outcome of patients with subacute or chronic painful osteoporotic vertebral compression fractures. The VERTOS study. AJNR Am J Neuroradiol. 2007;28:555-560.
9. Rousing R, Andersen MO, Jespersen SM, et al. Percutaneous vertebroplasty compared to conservative treatment in patients with painful acute or subacute osteoporotic vertebral fractures: three-months follow-up in a clinical randomized study. Spine. 2009;34:1349-1354.
Copyright © 2009 The Family Physicians Inquiries Network.
All rights reserved.
Bisphosphonate therapy: When not to monitor BMD
After starting patients on bisphosphonates for osteoporosis, wait at least 3 years before ordering a repeat dual-energy x-ray absorptiometry (DXA) scan.1
STRENGTH OF RECOMMENDATION
C: Based on a secondary analysis of a large randomized controlled trial.
Bell KL, Hayen A, Macaskill P, et al. Value of routine monitoring of bone mineral density after starting bisphosphonate treatment: secondary analysis of treatment data. BMJ. 2009;338:b2266.
ILLUSTRATIVE CASE
CASE: Ms. K, a 68-year-old woman diagnosed with osteoporosis on a screening DXA scan a year ago, has been taking a bisphosphonate ever since. She’s anxious to know whether the medication is working and asks if it’s time for a repeat DXA scan. What should you tell her?
Fragility fractures from osteoporosis are common in postmenopausal women. In the year 2000 alone, an estimated 9 million such fractures occurred worldwide.2 Treatment with bisphosphonates has been found to reduce the risk of fragility fractures,3 and the United States Preventive Services Task Force (USPSTF) recommends a DXA scan to screen for osteoporosis in women older than 65 years and some younger women at increased risk.4
Monitoring treatment: How often?
Although recommendations for how often to monitor bone mineral density (BMD) after initiating treatment vary, the consensus has been that periodic monitoring is useful. But there have been no randomized trials evaluating BMD testing in patients taking bisphosphonates.
The use of DXA scans to identify osteoporosis has been shown to be a cost-effective strategy in women older than 65 years,5 but there has not been a cost/benefit analysis of follow-up DXA scanning after initiating treatment. The cost of a scan ranges from about $150 to $300, and it is not known how many patients undergo repeat DXA scanning after starting treatment.
STUDY SUMMARY: Yearly scans are not helpful
The study we report on here is a secondary analysis of data from the Fracture Intervention Trial (FIT).6 In 1993, FIT randomized 6457 US women ages 55 to 80 years with low hip bone density to either alendronate or placebo. The initial dose of alendronate was 5 mg/d, but was later increased to 10 mg/d when other studies found that the higher dose was more effective. FIT showed that alendronate increased BMD and decreased the risk of vertebral fracture.7
Bell et al1 used a mixed-model statistical analysis to compare “within-person variation” in BMD (variation in DXA results over time in individuals) and “between-person variation” in BMD (variation in DXA results over time in the population of patients). The BMD of all FIT participants in both the control and treatment groups was measured at baseline and at the 1-, 2-, and 3-year marks. Each individual was always tested on the same scanner to minimize differences in machinery.
Individual results vary from year to year. The researchers found that the within-person variation was about 10 times greater than the between-person variation. This finding suggests that the precision of DXA scan measurements is not that reliable from 1 test to another.
The average annual increase in BMD in patients in the alendronate group was 0.0085 g/cm2—which is smaller than the typical year-to-year (within-person) variation of 0.013 g/cm2. It would therefore be difficult to differentiate the medication’s effect from the random variation inherent in DXA scans.
Response is favorable after 3 years of treatment. While there is variation in test results from year to year, longer-term findings are more reliable. After 3 years of treatment, 97.5% of patients taking alendronate had an increase in hip BMD of at least 0.019 g/cm2, with a strong correlation between hip and spine measurements. Although this represents a relatively small change in Z and T scores, this increase in hip BMD is considered a favorable response that warrants continued treatment. These findings are consistent with a previous analysis of BMD monitoring in women taking bisphosphonates, in which those who had the largest drop in BMD after the first year of treatment typically had a large gain over the second year.8
WHAT’S NEW: Now we know early testing is unnecessary
Not many studies are available to provide guidance about the interval between BMD measurements after starting a bisphosphonate. This study advises us that it is not necessary to recheck BMD for at least 3 years after starting treatment. Elimination of early repeat DXA testing could result in significant cost savings.
CAVEATS: Findings contradict usual recommendations
Physicians should be aware that the conclusion of this study is not in line with recommendations from a number of prominent organizations. The American Association of Clinical Endocrinology,9 the National Osteoporosis Foundation,10 and the North American Menopause Society11 all recommend follow-up DXA testing in 1 or 2 years.
High-risk patient exception. The delay in repeat DXA testing may not be appropriate for patients at higher risk of bone density loss. However, a separate analysis of higher-risk groups was not done.
Finally, while the findings of Bell et al suggest that we should wait at least 3 years before retesting, it is still not clear whether there is any benefit to repeat DXA testing at any interval, given the nearly universal response rate. It is also possible that advances in DXA technology will reduce some of the variation in BMD results.
CHALLENGES TO IMPLEMENTATION: Anxious patients
Patients like Ms. K may ask their physicians to retest well before 3 years. Yet those who undergo scanning after a shorter interval may be discouraged by early results. Advising patients that the treatment is almost uniformly effective in increasing BMD should reassure them that sticking with treatment is worthwhile.
Acknowledgment
The PURLs Surveillance System is supported in part by Grant Number UL1RR024999 from the National Center for Research Resources, a Clinical Translational Science Award to the University of Chicago. The content is solely the responsibility of the authors and does not necessarily represent the official views of the National Center for Research Resources or the National Institutes of Health.
1. Bell KL, Hayen A, Macaskill P, et al. Value of routine monitoring of bone mineral density after starting bisphosphonate treatment: secondary analysis of treatment data. BMJ. 2009;338:b2266.-
2. Johnell O, Kanis JA. An estimate of the worldwide prevalence and disability associated with osteoporotic fractures. Osteoporos Int. 2006;17:1726.-
3. MacLean C, Newberry S, et al. Systematic review: comparative effectiveness of treatments to prevent fractures in men and women with low bone density or osteoporosis. Ann Intern Med. 2008;148:197-213.
4. Agency for Healthcare Research and Quality United States Preventive Services Task Force. Screening for osteoporosis in postmenopausal women. Available at: http://www.ahrq.gov/clinic/3rduspstf/osteoporosis/osteorr.htm . Accessed October 13, 2009.
5. Schousboe JT. Cost effectiveness of screen-and-treat strategies for low bone mineral density: how do we screen, who do we screen, and who do we treat? Appl Health Econ Health Policy. 2008;6:1-18.
6. Black DM, Nevitt MC, Cauley J, et al. Design of the fracture intervention trial. Osteopor Int. 2003;3(suppl 3):S29-S39.
7. Cummings S, Black D, Thompson D, et al. Effect of alendronate on risk of fracture in women with low bone density but without vertebral fractures. JAMA. 1998;280:2077-2082.
8. Cummings S, Palermo B, Browner W, et al. Monitoring osteoporosis therapy with bone densitometry: misleading changes and regression to the mean. Fracture Intervention Trial Research Group. JAMA. 2000;283:1318-1321.
9. AACE Osteoporosis Task Force American Association of Clinical Endocrinologists medical guidelines for clinical practice for the prevention and treatment of postmenopausal osteoporosis: 2001 edition with selected updates for 2003. Endocr Pract. 2003;9:544-564.
10. National Osteoporosis Foundation Clinician’s Guide to Prevention and Treatment of Osteoporosis. Washington DC: NOF; 2008.
11. Management of postmenopausal osteoporosis: position statement of the North American Menopause Society Menopause. 2002;9:84-101.
After starting patients on bisphosphonates for osteoporosis, wait at least 3 years before ordering a repeat dual-energy x-ray absorptiometry (DXA) scan.1
STRENGTH OF RECOMMENDATION
C: Based on a secondary analysis of a large randomized controlled trial.
Bell KL, Hayen A, Macaskill P, et al. Value of routine monitoring of bone mineral density after starting bisphosphonate treatment: secondary analysis of treatment data. BMJ. 2009;338:b2266.
ILLUSTRATIVE CASE
CASE: Ms. K, a 68-year-old woman diagnosed with osteoporosis on a screening DXA scan a year ago, has been taking a bisphosphonate ever since. She’s anxious to know whether the medication is working and asks if it’s time for a repeat DXA scan. What should you tell her?
Fragility fractures from osteoporosis are common in postmenopausal women. In the year 2000 alone, an estimated 9 million such fractures occurred worldwide.2 Treatment with bisphosphonates has been found to reduce the risk of fragility fractures,3 and the United States Preventive Services Task Force (USPSTF) recommends a DXA scan to screen for osteoporosis in women older than 65 years and some younger women at increased risk.4
Monitoring treatment: How often?
Although recommendations for how often to monitor bone mineral density (BMD) after initiating treatment vary, the consensus has been that periodic monitoring is useful. But there have been no randomized trials evaluating BMD testing in patients taking bisphosphonates.
The use of DXA scans to identify osteoporosis has been shown to be a cost-effective strategy in women older than 65 years,5 but there has not been a cost/benefit analysis of follow-up DXA scanning after initiating treatment. The cost of a scan ranges from about $150 to $300, and it is not known how many patients undergo repeat DXA scanning after starting treatment.
STUDY SUMMARY: Yearly scans are not helpful
The study we report on here is a secondary analysis of data from the Fracture Intervention Trial (FIT).6 In 1993, FIT randomized 6457 US women ages 55 to 80 years with low hip bone density to either alendronate or placebo. The initial dose of alendronate was 5 mg/d, but was later increased to 10 mg/d when other studies found that the higher dose was more effective. FIT showed that alendronate increased BMD and decreased the risk of vertebral fracture.7
Bell et al1 used a mixed-model statistical analysis to compare “within-person variation” in BMD (variation in DXA results over time in individuals) and “between-person variation” in BMD (variation in DXA results over time in the population of patients). The BMD of all FIT participants in both the control and treatment groups was measured at baseline and at the 1-, 2-, and 3-year marks. Each individual was always tested on the same scanner to minimize differences in machinery.
Individual results vary from year to year. The researchers found that the within-person variation was about 10 times greater than the between-person variation. This finding suggests that the precision of DXA scan measurements is not that reliable from 1 test to another.
The average annual increase in BMD in patients in the alendronate group was 0.0085 g/cm2—which is smaller than the typical year-to-year (within-person) variation of 0.013 g/cm2. It would therefore be difficult to differentiate the medication’s effect from the random variation inherent in DXA scans.
Response is favorable after 3 years of treatment. While there is variation in test results from year to year, longer-term findings are more reliable. After 3 years of treatment, 97.5% of patients taking alendronate had an increase in hip BMD of at least 0.019 g/cm2, with a strong correlation between hip and spine measurements. Although this represents a relatively small change in Z and T scores, this increase in hip BMD is considered a favorable response that warrants continued treatment. These findings are consistent with a previous analysis of BMD monitoring in women taking bisphosphonates, in which those who had the largest drop in BMD after the first year of treatment typically had a large gain over the second year.8
WHAT’S NEW: Now we know early testing is unnecessary
Not many studies are available to provide guidance about the interval between BMD measurements after starting a bisphosphonate. This study advises us that it is not necessary to recheck BMD for at least 3 years after starting treatment. Elimination of early repeat DXA testing could result in significant cost savings.
CAVEATS: Findings contradict usual recommendations
Physicians should be aware that the conclusion of this study is not in line with recommendations from a number of prominent organizations. The American Association of Clinical Endocrinology,9 the National Osteoporosis Foundation,10 and the North American Menopause Society11 all recommend follow-up DXA testing in 1 or 2 years.
High-risk patient exception. The delay in repeat DXA testing may not be appropriate for patients at higher risk of bone density loss. However, a separate analysis of higher-risk groups was not done.
Finally, while the findings of Bell et al suggest that we should wait at least 3 years before retesting, it is still not clear whether there is any benefit to repeat DXA testing at any interval, given the nearly universal response rate. It is also possible that advances in DXA technology will reduce some of the variation in BMD results.
CHALLENGES TO IMPLEMENTATION: Anxious patients
Patients like Ms. K may ask their physicians to retest well before 3 years. Yet those who undergo scanning after a shorter interval may be discouraged by early results. Advising patients that the treatment is almost uniformly effective in increasing BMD should reassure them that sticking with treatment is worthwhile.
Acknowledgment
The PURLs Surveillance System is supported in part by Grant Number UL1RR024999 from the National Center for Research Resources, a Clinical Translational Science Award to the University of Chicago. The content is solely the responsibility of the authors and does not necessarily represent the official views of the National Center for Research Resources or the National Institutes of Health.
1. Bell KL, Hayen A, Macaskill P, et al. Value of routine monitoring of bone mineral density after starting bisphosphonate treatment: secondary analysis of treatment data. BMJ. 2009;338:b2266.-
2. Johnell O, Kanis JA. An estimate of the worldwide prevalence and disability associated with osteoporotic fractures. Osteoporos Int. 2006;17:1726.-
3. MacLean C, Newberry S, et al. Systematic review: comparative effectiveness of treatments to prevent fractures in men and women with low bone density or osteoporosis. Ann Intern Med. 2008;148:197-213.
4. Agency for Healthcare Research and Quality United States Preventive Services Task Force. Screening for osteoporosis in postmenopausal women. Available at: http://www.ahrq.gov/clinic/3rduspstf/osteoporosis/osteorr.htm . Accessed October 13, 2009.
5. Schousboe JT. Cost effectiveness of screen-and-treat strategies for low bone mineral density: how do we screen, who do we screen, and who do we treat? Appl Health Econ Health Policy. 2008;6:1-18.
6. Black DM, Nevitt MC, Cauley J, et al. Design of the fracture intervention trial. Osteopor Int. 2003;3(suppl 3):S29-S39.
7. Cummings S, Black D, Thompson D, et al. Effect of alendronate on risk of fracture in women with low bone density but without vertebral fractures. JAMA. 1998;280:2077-2082.
8. Cummings S, Palermo B, Browner W, et al. Monitoring osteoporosis therapy with bone densitometry: misleading changes and regression to the mean. Fracture Intervention Trial Research Group. JAMA. 2000;283:1318-1321.
9. AACE Osteoporosis Task Force American Association of Clinical Endocrinologists medical guidelines for clinical practice for the prevention and treatment of postmenopausal osteoporosis: 2001 edition with selected updates for 2003. Endocr Pract. 2003;9:544-564.
10. National Osteoporosis Foundation Clinician’s Guide to Prevention and Treatment of Osteoporosis. Washington DC: NOF; 2008.
11. Management of postmenopausal osteoporosis: position statement of the North American Menopause Society Menopause. 2002;9:84-101.
Copyright © 2009 The Family Physicians Inquiries Network.
All rights reserved.
Ovary-sparing hysterectomy: Is it right for your patient?
Advise patients undergoing hysterectomy for benign conditions that there are benefits to conserving their ovaries. The risk of coronary heart disease (CHD) and death is lower in women whose ovaries are conserved, compared with those who have had them removed.1
Strength of recommendation:
B: A large, high-quality observational study.
Parker WH, Broder MS, Chang E, et al. Ovarian conservation at the time of hysterectomy and long-term health outcomes in the Nurses’ Health Study. Obstet Gynecol. 2009;113:1027-1037.
ILLUSTRATIVE CASE
A 44-year-old woman with a family history of early CHD is considering hysterectomy for painful uterine fibroids. She’s thinking about undergoing concurrent bilateral oophorectomy to prevent ovarian cancer and asks for your input. How would you advise her?
Hysterectomy is the most common gynecologic surgery in the United States. In 2003, more than 600,000 hysterectomies were performed; 89% were not associated with malignancies.2
Ovarian conservation is not the norm
Data from the University Health-System Consortium Clinical Database indicate that between 2002 and 2008, about 55% of women who had a hysterectomy that was not cancer-related underwent oophorectomy. Rates of concurrent oophorectomy included:
- 68% of women ages 65 and older
- 77% of women ages 51 to 64
- 48% of women ages 31 to 50
- 3% of women ages 18 to 30.
A recent analysis from the Centers for Disease Control and Prevention found that among women who underwent hysterectomy for any reason between 1994 and 1998, 55% also had their ovaries removed.3
Hormones and CHD: An unanswered question
Over the last several decades, there has been a great deal of interest in the relationship between hormones and CHD, much of it stemming from the controversy about hormone replacement therapy (HRT). The findings of the Women’s Health Initiative implicated combined exogenous hormones (estrogen and progestin) as a risk factor for CHD.4 Endogenous hormone production, however, may protect against CHD; some studies have demonstrated a decreased risk of cardiovascular death with later age of menopause.5,6
Current oophorectomy recommendations are age-specific. The American College of Obstetricians and Gynecologists (ACOG) recommends that strong consideration be given to ovarian conservation in premenopausal women who are not at risk for ovarian cancer. For postmenopausal women, however, ACOG recommends consideration of oophorectomy as prophylaxis.7 These recommendations are based on expert opinion. Previous studies suggest that ovarian conservation may improve survival in specific age groups.8,9 The large, high-quality observational study reviewed here provides further guidance about the role of ovarian conservation across all age groups.
STUDY SUMMARY: Oophorectomy increases risk of CHD and death
This observational study1 was part of the Nurses’ Health Study. It included 29,380 women, of which 16,345 (55.6%) underwent hysterectomy with bilateral oophorectomy and 13,035 (44.4%) had hysterectomy with ovarian conservation. Women with unilateral oophorectomy were excluded, as were those who had a history of CHD or stroke, and women for whom pertinent data, such as age, were missing. A follow-up survey was sent to participants every 2 years for 24 years, with an average return rate of 90%.
Women who had undergone bilateral oophorectomy had an increased risk of CHD and all-cause mortality ( TABLE ). The authors estimated that with a postsurgical life span of approximately 35 years, every 9 oophorectomies would result in 1 additional death. The authors also pointed out there were no age exceptions: Ovarian-sparing surgery was linked to improved survival in every age group.
Oophorectomy did have a protective effect against breast cancer, ovarian cancer (number needed to treat=220), and total cancer incidence, but it was associated with an increased incidence of lung cancer (number needed to harm=190) and total cancer mortality. There was no significant difference in rates of stroke, pulmonary embolus, colorectal cancer, or hip fracture.
TABLE
Oophorectomy (vs ovarian conservation) increases key risks1
| RISK FACTOR | MULTIVARIATE–ADJUSTED HR (95% CI) |
|---|---|
| CHD (fatal and nonfatal) | 1.17 (1.02-1.35) |
| Breast cancer | 0.75 (0.68-0.84) |
| Lung cancer | 1.26 (1.02-1.56) |
| Ovarian cancer | 0.04 (0.01-0.09) |
| Total cancer | 0.90 (0.84-0.96) |
| Total cancer mortality | 1.17 (1.04-1.32) |
| All-cause mortality | 1.12 (1.03-1.21) |
| CHD, coronary heart disease; CI, confidence interval; HR, hazard ratio. | |
WHAT’S NEW: Ovarian conservation: Better for all ages
The evidence is clear: Conserving the ovaries, rather than removing them, during hysterectomy is associated with a lower risk of CHD and both all-cause and cancer-related mortality.
What about the patient’s age? A 2005 analysis suggested that ovarian conservation conferred a survival benefit compared to oophorectomy in women <65 years.8 Similarly, a 2006 cohort study found increased mortality in women <45 years who underwent concurrent oophorectomy.9 But this is the first study to demonstrate that ovarian-sparing surgery is associated with improved survival in women of every age group.
CAVEATS: Study sample and HRT use could affect outcome
The average age of patients in the treatment (oophorectomy) arm was higher than that of patients in the control group; the women in the treatment group were older at the time of hysterectomy (46.8 vs 43.3 years), as well. This should not bias the results, which were adjusted by age and many other variables.
Nonrepresentative sample. This group of nurses is not representative of the general population in several important aspects, including socioeconomic status, educational level, and race (94% Caucasian). This may limit the generalizability of the findings.
Study design. The observational design and the fact that the patients themselves decided whether or not to undergo oophorectomy also raise the possibility of unmeasured confounding factors.
Cancer risk. Women with known BRCA mutations were not studied separately, but the results were adjusted for family history of breast or ovarian cancer. The authors stated that a subgroup analysis of women with a family history of ovarian cancer had similar outcomes, although the data were not included
HRT use. As might be expected, patients in the oophorectomy arm of the study were more likely to use HRT. Since the completion of the study in 2000, practice recommendations have shifted against combined HRT use. Unopposed estrogen, which is not thought to increase the incidence of cardiovascular disease, remains a treatment option for women who have undergone hysterectomy and oophorectomy. But the overall effect of unopposed estrogen on survival is still uncertain.4 It is unclear how the recent decline in the use of exogenous hormones would affect these results.
BARRIERS TO IMPLEMENTATION: FP-GYN communication can be difficult
This study provides important information for primary care physicians to discuss with female patients and their gynecologists. However, some doctors may not have relationships with the gynecologists in their community, or have limited (or no) influence or input into which specialists their patients see. In addition, some gynecologists may hesitate to perform hysterectomy without oophorectomy in some cases for technical reasons.10
Concern about prevention of ovarian cancer must be balanced with increased risk of mortality and CHD events. It may be helpful to tell patients who are about to undergo hysterectomy for a benign condition that women are nearly 30 times more likely to die of cardiovascular disease (CHD or stroke) than ovarian cancer (413,800/year vs 14,700/year).11
Acknowledgement
The PURLs Surveillance System is supported in part by Grant Number UL1RR024999 from the National Center for Research Resources, a Clinical Translational Science Award to the University of Chicago. The content is solely the responsibility of the authors and does not necessarily represent the official views of the National Center for Research Resources or the National Institutes of Health.
The authors wish to acknowledge Sofia Medvedev, PhD, of the University HealthSystem Consortium in Oak Brook, Ill, for analysis of the National Ambulatory Medical Care Survey data and the UHC Clinical Database.
PURLs methodology
This study was selected and evaluated using FPIN’s Priority Updates from the Research Literature (PURL) Surveillance System methodology. The criteria and findings leading to the selection of this study as a PURL can be accessed at www.jfponline.com/purls.
1. Parker WH, Broder MS, Chang E, et al. Ovarian conservation at the time of hysterectomy and long-term health outcomes in the Nurses’ Health Study. Obstet Gynecol. 2009;113:1027-1037.
2. Wu JM, Wechter ME, Geller EJ, et al. Hysterectomy rates in the United States, 2003. Obstet Gynecol. 2007;110:1091.-
3. Agency for Healthcare Research and Quality. Healthcare Cost and Utilization Project (HCUP), 1988-2001: a federal-state industry partnership in health data. July 2003. Available at http://www.cdc.gov/mmwr/preview/mmwrhtml/ss5105al.htm. Accessed June 8, 2009.
4. Anderson GL, Limacher M, Assaf AF, et al. Effect of conjugated equine estrogen in postmenopausal women with hysterectomy: the Women’s Health Initiative randomized controlled trial. JAMA. 2004;291:1701.-
5. Ossewaarde ME, Bots ML, Verbeek AL, et al. Age at menopause, cause-specific mortality and total life expectancy. Epidemiology. 2005;16:556-562.
6. Atsma F, Bartelink M, Grobbee D, et al. Postmenopausal status and early menopause as independent risk factors for cardiovascular disease: a meta-analysis. Menopause. 2006;13:265-279.
7. American College of Obstetricians and Gynecologists. Elective and risk-reducing salpingo-oophorectomy. ACOG Practice Bulletin No 89. Washington, DC: ACOG; 2008.
8. Parker WH, Broder MS, Liu Z, et al. Ovarian conservation at the time of hysterectomy for benign disease. Obstet Gynecol. 2005;106:219-226.
9. Rocca W, Grossardt B, de Andrade M, et al. Survival patterns after oophorectomy in premenopausal women: a population-based cohort study. Lancet Oncol. 2006;7:821-828.
10. Priver D. Oophorectomy in young women may not be so harmful. OBG Management. 2009;21(8):11.-
11. Kung H, Hoyert D, Xu J, et al. Deaths: final data for 2005. Natl Vital Stat Rep. 2008;56:1-120.
Advise patients undergoing hysterectomy for benign conditions that there are benefits to conserving their ovaries. The risk of coronary heart disease (CHD) and death is lower in women whose ovaries are conserved, compared with those who have had them removed.1
Strength of recommendation:
B: A large, high-quality observational study.
Parker WH, Broder MS, Chang E, et al. Ovarian conservation at the time of hysterectomy and long-term health outcomes in the Nurses’ Health Study. Obstet Gynecol. 2009;113:1027-1037.
ILLUSTRATIVE CASE
A 44-year-old woman with a family history of early CHD is considering hysterectomy for painful uterine fibroids. She’s thinking about undergoing concurrent bilateral oophorectomy to prevent ovarian cancer and asks for your input. How would you advise her?
Hysterectomy is the most common gynecologic surgery in the United States. In 2003, more than 600,000 hysterectomies were performed; 89% were not associated with malignancies.2
Ovarian conservation is not the norm
Data from the University Health-System Consortium Clinical Database indicate that between 2002 and 2008, about 55% of women who had a hysterectomy that was not cancer-related underwent oophorectomy. Rates of concurrent oophorectomy included:
- 68% of women ages 65 and older
- 77% of women ages 51 to 64
- 48% of women ages 31 to 50
- 3% of women ages 18 to 30.
A recent analysis from the Centers for Disease Control and Prevention found that among women who underwent hysterectomy for any reason between 1994 and 1998, 55% also had their ovaries removed.3
Hormones and CHD: An unanswered question
Over the last several decades, there has been a great deal of interest in the relationship between hormones and CHD, much of it stemming from the controversy about hormone replacement therapy (HRT). The findings of the Women’s Health Initiative implicated combined exogenous hormones (estrogen and progestin) as a risk factor for CHD.4 Endogenous hormone production, however, may protect against CHD; some studies have demonstrated a decreased risk of cardiovascular death with later age of menopause.5,6
Current oophorectomy recommendations are age-specific. The American College of Obstetricians and Gynecologists (ACOG) recommends that strong consideration be given to ovarian conservation in premenopausal women who are not at risk for ovarian cancer. For postmenopausal women, however, ACOG recommends consideration of oophorectomy as prophylaxis.7 These recommendations are based on expert opinion. Previous studies suggest that ovarian conservation may improve survival in specific age groups.8,9 The large, high-quality observational study reviewed here provides further guidance about the role of ovarian conservation across all age groups.
STUDY SUMMARY: Oophorectomy increases risk of CHD and death
This observational study1 was part of the Nurses’ Health Study. It included 29,380 women, of which 16,345 (55.6%) underwent hysterectomy with bilateral oophorectomy and 13,035 (44.4%) had hysterectomy with ovarian conservation. Women with unilateral oophorectomy were excluded, as were those who had a history of CHD or stroke, and women for whom pertinent data, such as age, were missing. A follow-up survey was sent to participants every 2 years for 24 years, with an average return rate of 90%.
Women who had undergone bilateral oophorectomy had an increased risk of CHD and all-cause mortality ( TABLE ). The authors estimated that with a postsurgical life span of approximately 35 years, every 9 oophorectomies would result in 1 additional death. The authors also pointed out there were no age exceptions: Ovarian-sparing surgery was linked to improved survival in every age group.
Oophorectomy did have a protective effect against breast cancer, ovarian cancer (number needed to treat=220), and total cancer incidence, but it was associated with an increased incidence of lung cancer (number needed to harm=190) and total cancer mortality. There was no significant difference in rates of stroke, pulmonary embolus, colorectal cancer, or hip fracture.
TABLE
Oophorectomy (vs ovarian conservation) increases key risks1
| RISK FACTOR | MULTIVARIATE–ADJUSTED HR (95% CI) |
|---|---|
| CHD (fatal and nonfatal) | 1.17 (1.02-1.35) |
| Breast cancer | 0.75 (0.68-0.84) |
| Lung cancer | 1.26 (1.02-1.56) |
| Ovarian cancer | 0.04 (0.01-0.09) |
| Total cancer | 0.90 (0.84-0.96) |
| Total cancer mortality | 1.17 (1.04-1.32) |
| All-cause mortality | 1.12 (1.03-1.21) |
| CHD, coronary heart disease; CI, confidence interval; HR, hazard ratio. | |
WHAT’S NEW: Ovarian conservation: Better for all ages
The evidence is clear: Conserving the ovaries, rather than removing them, during hysterectomy is associated with a lower risk of CHD and both all-cause and cancer-related mortality.
What about the patient’s age? A 2005 analysis suggested that ovarian conservation conferred a survival benefit compared to oophorectomy in women <65 years.8 Similarly, a 2006 cohort study found increased mortality in women <45 years who underwent concurrent oophorectomy.9 But this is the first study to demonstrate that ovarian-sparing surgery is associated with improved survival in women of every age group.
CAVEATS: Study sample and HRT use could affect outcome
The average age of patients in the treatment (oophorectomy) arm was higher than that of patients in the control group; the women in the treatment group were older at the time of hysterectomy (46.8 vs 43.3 years), as well. This should not bias the results, which were adjusted by age and many other variables.
Nonrepresentative sample. This group of nurses is not representative of the general population in several important aspects, including socioeconomic status, educational level, and race (94% Caucasian). This may limit the generalizability of the findings.
Study design. The observational design and the fact that the patients themselves decided whether or not to undergo oophorectomy also raise the possibility of unmeasured confounding factors.
Cancer risk. Women with known BRCA mutations were not studied separately, but the results were adjusted for family history of breast or ovarian cancer. The authors stated that a subgroup analysis of women with a family history of ovarian cancer had similar outcomes, although the data were not included
HRT use. As might be expected, patients in the oophorectomy arm of the study were more likely to use HRT. Since the completion of the study in 2000, practice recommendations have shifted against combined HRT use. Unopposed estrogen, which is not thought to increase the incidence of cardiovascular disease, remains a treatment option for women who have undergone hysterectomy and oophorectomy. But the overall effect of unopposed estrogen on survival is still uncertain.4 It is unclear how the recent decline in the use of exogenous hormones would affect these results.
BARRIERS TO IMPLEMENTATION: FP-GYN communication can be difficult
This study provides important information for primary care physicians to discuss with female patients and their gynecologists. However, some doctors may not have relationships with the gynecologists in their community, or have limited (or no) influence or input into which specialists their patients see. In addition, some gynecologists may hesitate to perform hysterectomy without oophorectomy in some cases for technical reasons.10
Concern about prevention of ovarian cancer must be balanced with increased risk of mortality and CHD events. It may be helpful to tell patients who are about to undergo hysterectomy for a benign condition that women are nearly 30 times more likely to die of cardiovascular disease (CHD or stroke) than ovarian cancer (413,800/year vs 14,700/year).11
Acknowledgement
The PURLs Surveillance System is supported in part by Grant Number UL1RR024999 from the National Center for Research Resources, a Clinical Translational Science Award to the University of Chicago. The content is solely the responsibility of the authors and does not necessarily represent the official views of the National Center for Research Resources or the National Institutes of Health.
The authors wish to acknowledge Sofia Medvedev, PhD, of the University HealthSystem Consortium in Oak Brook, Ill, for analysis of the National Ambulatory Medical Care Survey data and the UHC Clinical Database.
PURLs methodology
This study was selected and evaluated using FPIN’s Priority Updates from the Research Literature (PURL) Surveillance System methodology. The criteria and findings leading to the selection of this study as a PURL can be accessed at www.jfponline.com/purls.
1. Parker WH, Broder MS, Chang E, et al. Ovarian conservation at the time of hysterectomy and long-term health outcomes in the Nurses’ Health Study. Obstet Gynecol. 2009;113:1027-1037.
2. Wu JM, Wechter ME, Geller EJ, et al. Hysterectomy rates in the United States, 2003. Obstet Gynecol. 2007;110:1091.-
3. Agency for Healthcare Research and Quality. Healthcare Cost and Utilization Project (HCUP), 1988-2001: a federal-state industry partnership in health data. July 2003. Available at http://www.cdc.gov/mmwr/preview/mmwrhtml/ss5105al.htm. Accessed June 8, 2009.
4. Anderson GL, Limacher M, Assaf AF, et al. Effect of conjugated equine estrogen in postmenopausal women with hysterectomy: the Women’s Health Initiative randomized controlled trial. JAMA. 2004;291:1701.-
5. Ossewaarde ME, Bots ML, Verbeek AL, et al. Age at menopause, cause-specific mortality and total life expectancy. Epidemiology. 2005;16:556-562.
6. Atsma F, Bartelink M, Grobbee D, et al. Postmenopausal status and early menopause as independent risk factors for cardiovascular disease: a meta-analysis. Menopause. 2006;13:265-279.
7. American College of Obstetricians and Gynecologists. Elective and risk-reducing salpingo-oophorectomy. ACOG Practice Bulletin No 89. Washington, DC: ACOG; 2008.
8. Parker WH, Broder MS, Liu Z, et al. Ovarian conservation at the time of hysterectomy for benign disease. Obstet Gynecol. 2005;106:219-226.
9. Rocca W, Grossardt B, de Andrade M, et al. Survival patterns after oophorectomy in premenopausal women: a population-based cohort study. Lancet Oncol. 2006;7:821-828.
10. Priver D. Oophorectomy in young women may not be so harmful. OBG Management. 2009;21(8):11.-
11. Kung H, Hoyert D, Xu J, et al. Deaths: final data for 2005. Natl Vital Stat Rep. 2008;56:1-120.
Copyright © 2009 The Family Physicians Inquiries Network.
All rights reserved.
Glucose control: How low should you go with the critically ill?
For hyperglycemic patients admitted to an intensive care unit (ICU), the target blood glucose level should be ≤180 mg/dL, not 81 to 108 mg/dL. More aggressive glucose lowering is associated with a higher mortality rate.1
Strength of recommendation
B: Based on a single, high-quality randomized clinical trial.
Finfer S, Chittock DR, Su SY, et al; NICE-SUGAR Study Investigators. Intensive versus conventional glucose control in critically ill patients. N Engl J Med. 2009;360:1283-1297.
ILLUSTRATIVE CASE
A 71-year-old woman with diabetes and coronary artery disease has just been admitted to the ICU, where she’ll receive treatment for sepsis, multilobar pneumonia, and respiratory failure requiring mechanical ventilation. Her blood sugar is 253 mg/dL. In writing her admission orders, you contemplate targets for glycemic control. How low should you go?
Hyperglycemia is common in patients admitted to intensive care, whether or not they have diabetes. Elevated blood sugar is associated with stress and trauma and affects both postoperative and critically ill medical patients. A wealth of evidence has demonstrated that hyperglycemia is associated with poorer outcomes and increased mortality in this patient population, including those with myocardial infarction, stroke, trauma, and other medical conditions.2-5 Thus, intensive glucose control is the standard of care in the ICU, based on consensus guidelines from such groups as the American Diabetes Association (ADA) and the Surviving Sepsis Campaign—an initiative developed by 3 critical care organizations and endorsed by 16 specialty groups.6-8
Is intense therapy better? Study results differ
The association between hyperglycemia and an increased risk of death led investigators to study the effectiveness of aggressive treatment with insulin in decreasing morbidity and mortality. A 2004 meta-analysis of 35 trials comparing insulin vs no insulin in critically ill hospitalized patients demonstrated a 15% reduction in short-term mortality among patients treated with insulin.9 A 2008 meta-analysis of 29 randomized trials, including data from 8432 adult ICU patients, compared intensive insulin therapy with conventional therapy—and found that intensive therapy did not lower hospital mortality rates compared with conventional therapy. In addition, this meta-analysis revealed a marked increase in severe hypoglycemia (blood sugar ≤40 mg/dL) in the intensive therapy group.10 (The intensive therapy group included studies with glucose goals of ≤110 mg/dL and <150 mg/dL in about equal numbers; conventional therapy goals were generally between 180 and 200 mg/dL.)
The studies included in both the meta-analyses, however, were mostly small, single-center trials, and of low-to-medium quality. In addition, methods for achieving glycemic control varied. Nonetheless, current consensus guidelines set a goal for glucose levels of 80 to 110 mg/dL for all critically ill hospitalized patients.6-8 But because of the lack of sufficient high-quality evidence from a single large RCT, Finfer et al conducted the large study described here to clearly establish that intensive glycemic control decreases all-cause mortality. Given their hypothesis, the results were surprising.
STUDY SUMMARY: Intensive therapy does more harm than help
NICE-SUGAR (Normoglycaemia in Intensive Care Evaluation-Survival Using Glucose Algorithm Regulation) was a large-scale, multicenter, multinational trial comparing aggressive blood sugar control (goal 81-108 mg/dL) with conventional therapy (goal ≤180 mg/dL) in 6104 critically ill hospitalized patients with hyperglycemia. Patients were followed for 90 days. The primary end point was death from any cause 90 days after randomization. Secondary outcomes included survival time during the first 90 days, specific cause of death, duration of mechanical ventilation, renal replacement therapy, and length of stays in the ICU and in the hospital. Other outcomes included death from any cause within 28 days, place of death, new organ failure, positive blood culture, blood transfusion, and units of blood transfused.
The study was conducted in 42 hospitals in Canada, Australia, and New Zealand. Patients had to have an anticipated ICU admission of 3 days or more and randomization had to occur within 24 hours of admission. The study protocol was discontinued when patients began eating or were discharged from the ICU; if they were readmitted to the ICU within 90 days of randomization, the study protocol was resumed.
Treatment assignment was revealed to clinical staff after randomization, and was determined by a specific algorithm ( https://studies.thegeorgeinstitute.org/nice/ ). Blood sugar levels were managed with insulin infusions.
In the conventional group, insulin was started at 1 unit/h for glucose levels >180 mg/dL, and decreased or stopped when levels were <144 mg/dL, depending on previous glucose value and current rate of drip. In the intensive therapy group, insulin was initiated for lower levels (blood sugar >109 mg/dL) and at a higher rate (2 units/h). The insulin rate was decreased or maintained for glucose levels from 64 to 80 mg/dL, depending on previous glucose value and current rate of drip. Insulin was withheld for blood sugar levels of <64 mg/dL.
Contrary to the hypothesis, intensive therapy spelled trouble. Patients with intensive glycemic control had an all-cause mortality rate of 27.5%, compared with a rate of 24.9% for patients in the conventional therapy group (P=.04, number needed to harm [NNH]=38). Severe hypoglycemia (glucose ≤40 mg/dL) occurred in 6.8% of those in the intensive therapy group, compared with 0.5% in the conventional therapy group (P=.03, NNH=16).
Most of the deaths in both groups occurred in the ICU or in the hospital. Deaths from cardiovascular causes were more common among those in the intensive therapy group. There were no significant differences in any other outcomes. The mean glucose level in the intensive therapy group was 118, vs 145 mg/dL in the conventional therapy group.
For multivariate and subgroup analyses, the patients were assigned strata (Canada or Australia/New Zealand; operative vs nonoperative admission) or classified into groups (traumatic vs atraumatic; diabetes vs no diabetes; corticosteroids in previous 72 hours or not; high vs low critical illness symptom severity) based on predefined characteristics. No subgroups had significantly improved outcomes with intensive therapy.1
WHAT’S NEW: Now we know: Don’t go too low
This study, in contrast to a number of smaller studies of lower quality, demonstrates a higher all-cause mortality rate at 90 days for critically ill patients receiving intensive glucose therapy. It is now clear that, among critically ill hospitalized patients, aiming for intensive glucose control (81-108 mg/dL) is associated with an increased rate of severe hypoglycemic events and all-cause mortality at 90 days. The previously used goal of conventional therapy (≤180 mg/dL) is safer.
CAVEATS: Study population may not reflect primary care
There are 2 caveats to this study. The first is that because of the nature of the research, it was impossible to maintain blinding of the clinical staff to patient assignments. The second important caveat pertains to the severity of illness among participants in this multicenter study: Most of these patients were in ICUs at tertiary care medical centers and had an expected ICU length of stay of 3 or more days. Although many family physicians manage patients in ICUs, the patients randomized in this study may represent a sicker than average patient population for some hospitals.
CHALLENGES TO IMPLEMENTATION: Some may doubt validity of this outcome
Less aggressive glycemic control for critically ill patients should be easier to achieve, not more difficult. However, a change in glucose targets may require new admission order sets and, notably, reeducation of physicians and nurses who have been convinced by earlier studies that more intensive glucose control is superior.
Acknowledgments
The PURLs Surveillance System is supported in part by Grant Number UL1RR024999 from the National Center for Research Resources, a Clinical Translational Science Award to the University of Chicago. The content is solely the responsibility of the authors and does not necessarily represent the official views of the National Center for Research Resources or the National Institutes of Health.
PURLs methodology
This study was selected and evaluated using FPIN’s Priority Updates from the Research Literature (PURL) Surveillance System methodology. The criteria and findings leading to the selection of this study as a PURL can be accessed at www.jfponline.com/purls.
1. Finfer S, Chittock DR, Su SY, et al. NICE-SUGAR Study Investigators. Intensive versus conventional glucose control in critically ill patients. N Engl J Med. 2009;360:1283-1297.
2. Capes SE, Hunt D, Malmberg K, et al. Stress hyperglycaemia and increased risk of death after myocardial infarction in patients with and without diabetes: a systematic overview. Lancet. 2000;355:773-778.
3. Capes SE, Hunt D, Malmberg K, et al. Stress hyperglycemia and prognosis of stroke in nondiabetic and diabetic patients: a systematic overview. Stroke. 2001;32:2426-2432.
4. Gale SC, Sicoutris C, Reilly PM, et al. Poor glycemic control is associated with increased mortality in critically ill trauma patients. Am Surg. 2007;73:454-460.
5. Krinsley JS. Association between hyperglycemia and increased hospital mortality in a heterogeneous population of critically ill patients. Mayo Clin Proc. 2003;78:1471-1478.
6. Standards of medical care in diabetes—2008. Diabetes Care. 2008;31(suppl 1):S12-S54.
7. Rodbard HW, Blonde L, Braithwaite SS, et al. American Association of Clinical Endocrinologists medical guidelines for clinical practice for the management of diabetes mellitus. Endocr Pract. 2007;13(suppl 1):1-68.
8. Dellinger RP, Levy MM, Carlet JM, et al. Surviving Sepsis Campaign: international guidelines for management of severe sepsis and septic shock: 2008. Crit Care Med. 2008;36:296-327.
9. Pittas AG, Siegel RD, Lau J. Insulin therapy for critically ill hospitalized patients: a meta-analysis of randomized controlled trials. Arch Intern Med. 2004;164:2005-2011.
10. Wiener RS, Wiener DC, Larson RJ. Benefits and risks of tight glucose control in critically ill adults: a meta-analysis. JAMA. 2008;300:933-944.
For hyperglycemic patients admitted to an intensive care unit (ICU), the target blood glucose level should be ≤180 mg/dL, not 81 to 108 mg/dL. More aggressive glucose lowering is associated with a higher mortality rate.1
Strength of recommendation
B: Based on a single, high-quality randomized clinical trial.
Finfer S, Chittock DR, Su SY, et al; NICE-SUGAR Study Investigators. Intensive versus conventional glucose control in critically ill patients. N Engl J Med. 2009;360:1283-1297.
ILLUSTRATIVE CASE
A 71-year-old woman with diabetes and coronary artery disease has just been admitted to the ICU, where she’ll receive treatment for sepsis, multilobar pneumonia, and respiratory failure requiring mechanical ventilation. Her blood sugar is 253 mg/dL. In writing her admission orders, you contemplate targets for glycemic control. How low should you go?
Hyperglycemia is common in patients admitted to intensive care, whether or not they have diabetes. Elevated blood sugar is associated with stress and trauma and affects both postoperative and critically ill medical patients. A wealth of evidence has demonstrated that hyperglycemia is associated with poorer outcomes and increased mortality in this patient population, including those with myocardial infarction, stroke, trauma, and other medical conditions.2-5 Thus, intensive glucose control is the standard of care in the ICU, based on consensus guidelines from such groups as the American Diabetes Association (ADA) and the Surviving Sepsis Campaign—an initiative developed by 3 critical care organizations and endorsed by 16 specialty groups.6-8
Is intense therapy better? Study results differ
The association between hyperglycemia and an increased risk of death led investigators to study the effectiveness of aggressive treatment with insulin in decreasing morbidity and mortality. A 2004 meta-analysis of 35 trials comparing insulin vs no insulin in critically ill hospitalized patients demonstrated a 15% reduction in short-term mortality among patients treated with insulin.9 A 2008 meta-analysis of 29 randomized trials, including data from 8432 adult ICU patients, compared intensive insulin therapy with conventional therapy—and found that intensive therapy did not lower hospital mortality rates compared with conventional therapy. In addition, this meta-analysis revealed a marked increase in severe hypoglycemia (blood sugar ≤40 mg/dL) in the intensive therapy group.10 (The intensive therapy group included studies with glucose goals of ≤110 mg/dL and <150 mg/dL in about equal numbers; conventional therapy goals were generally between 180 and 200 mg/dL.)
The studies included in both the meta-analyses, however, were mostly small, single-center trials, and of low-to-medium quality. In addition, methods for achieving glycemic control varied. Nonetheless, current consensus guidelines set a goal for glucose levels of 80 to 110 mg/dL for all critically ill hospitalized patients.6-8 But because of the lack of sufficient high-quality evidence from a single large RCT, Finfer et al conducted the large study described here to clearly establish that intensive glycemic control decreases all-cause mortality. Given their hypothesis, the results were surprising.
STUDY SUMMARY: Intensive therapy does more harm than help
NICE-SUGAR (Normoglycaemia in Intensive Care Evaluation-Survival Using Glucose Algorithm Regulation) was a large-scale, multicenter, multinational trial comparing aggressive blood sugar control (goal 81-108 mg/dL) with conventional therapy (goal ≤180 mg/dL) in 6104 critically ill hospitalized patients with hyperglycemia. Patients were followed for 90 days. The primary end point was death from any cause 90 days after randomization. Secondary outcomes included survival time during the first 90 days, specific cause of death, duration of mechanical ventilation, renal replacement therapy, and length of stays in the ICU and in the hospital. Other outcomes included death from any cause within 28 days, place of death, new organ failure, positive blood culture, blood transfusion, and units of blood transfused.
The study was conducted in 42 hospitals in Canada, Australia, and New Zealand. Patients had to have an anticipated ICU admission of 3 days or more and randomization had to occur within 24 hours of admission. The study protocol was discontinued when patients began eating or were discharged from the ICU; if they were readmitted to the ICU within 90 days of randomization, the study protocol was resumed.
Treatment assignment was revealed to clinical staff after randomization, and was determined by a specific algorithm ( https://studies.thegeorgeinstitute.org/nice/ ). Blood sugar levels were managed with insulin infusions.
In the conventional group, insulin was started at 1 unit/h for glucose levels >180 mg/dL, and decreased or stopped when levels were <144 mg/dL, depending on previous glucose value and current rate of drip. In the intensive therapy group, insulin was initiated for lower levels (blood sugar >109 mg/dL) and at a higher rate (2 units/h). The insulin rate was decreased or maintained for glucose levels from 64 to 80 mg/dL, depending on previous glucose value and current rate of drip. Insulin was withheld for blood sugar levels of <64 mg/dL.
Contrary to the hypothesis, intensive therapy spelled trouble. Patients with intensive glycemic control had an all-cause mortality rate of 27.5%, compared with a rate of 24.9% for patients in the conventional therapy group (P=.04, number needed to harm [NNH]=38). Severe hypoglycemia (glucose ≤40 mg/dL) occurred in 6.8% of those in the intensive therapy group, compared with 0.5% in the conventional therapy group (P=.03, NNH=16).
Most of the deaths in both groups occurred in the ICU or in the hospital. Deaths from cardiovascular causes were more common among those in the intensive therapy group. There were no significant differences in any other outcomes. The mean glucose level in the intensive therapy group was 118, vs 145 mg/dL in the conventional therapy group.
For multivariate and subgroup analyses, the patients were assigned strata (Canada or Australia/New Zealand; operative vs nonoperative admission) or classified into groups (traumatic vs atraumatic; diabetes vs no diabetes; corticosteroids in previous 72 hours or not; high vs low critical illness symptom severity) based on predefined characteristics. No subgroups had significantly improved outcomes with intensive therapy.1
WHAT’S NEW: Now we know: Don’t go too low
This study, in contrast to a number of smaller studies of lower quality, demonstrates a higher all-cause mortality rate at 90 days for critically ill patients receiving intensive glucose therapy. It is now clear that, among critically ill hospitalized patients, aiming for intensive glucose control (81-108 mg/dL) is associated with an increased rate of severe hypoglycemic events and all-cause mortality at 90 days. The previously used goal of conventional therapy (≤180 mg/dL) is safer.
CAVEATS: Study population may not reflect primary care
There are 2 caveats to this study. The first is that because of the nature of the research, it was impossible to maintain blinding of the clinical staff to patient assignments. The second important caveat pertains to the severity of illness among participants in this multicenter study: Most of these patients were in ICUs at tertiary care medical centers and had an expected ICU length of stay of 3 or more days. Although many family physicians manage patients in ICUs, the patients randomized in this study may represent a sicker than average patient population for some hospitals.
CHALLENGES TO IMPLEMENTATION: Some may doubt validity of this outcome
Less aggressive glycemic control for critically ill patients should be easier to achieve, not more difficult. However, a change in glucose targets may require new admission order sets and, notably, reeducation of physicians and nurses who have been convinced by earlier studies that more intensive glucose control is superior.
Acknowledgments
The PURLs Surveillance System is supported in part by Grant Number UL1RR024999 from the National Center for Research Resources, a Clinical Translational Science Award to the University of Chicago. The content is solely the responsibility of the authors and does not necessarily represent the official views of the National Center for Research Resources or the National Institutes of Health.
PURLs methodology
This study was selected and evaluated using FPIN’s Priority Updates from the Research Literature (PURL) Surveillance System methodology. The criteria and findings leading to the selection of this study as a PURL can be accessed at www.jfponline.com/purls.
1. Finfer S, Chittock DR, Su SY, et al. NICE-SUGAR Study Investigators. Intensive versus conventional glucose control in critically ill patients. N Engl J Med. 2009;360:1283-1297.
2. Capes SE, Hunt D, Malmberg K, et al. Stress hyperglycaemia and increased risk of death after myocardial infarction in patients with and without diabetes: a systematic overview. Lancet. 2000;355:773-778.
3. Capes SE, Hunt D, Malmberg K, et al. Stress hyperglycemia and prognosis of stroke in nondiabetic and diabetic patients: a systematic overview. Stroke. 2001;32:2426-2432.
4. Gale SC, Sicoutris C, Reilly PM, et al. Poor glycemic control is associated with increased mortality in critically ill trauma patients. Am Surg. 2007;73:454-460.
5. Krinsley JS. Association between hyperglycemia and increased hospital mortality in a heterogeneous population of critically ill patients. Mayo Clin Proc. 2003;78:1471-1478.
6. Standards of medical care in diabetes—2008. Diabetes Care. 2008;31(suppl 1):S12-S54.
7. Rodbard HW, Blonde L, Braithwaite SS, et al. American Association of Clinical Endocrinologists medical guidelines for clinical practice for the management of diabetes mellitus. Endocr Pract. 2007;13(suppl 1):1-68.
8. Dellinger RP, Levy MM, Carlet JM, et al. Surviving Sepsis Campaign: international guidelines for management of severe sepsis and septic shock: 2008. Crit Care Med. 2008;36:296-327.
9. Pittas AG, Siegel RD, Lau J. Insulin therapy for critically ill hospitalized patients: a meta-analysis of randomized controlled trials. Arch Intern Med. 2004;164:2005-2011.
10. Wiener RS, Wiener DC, Larson RJ. Benefits and risks of tight glucose control in critically ill adults: a meta-analysis. JAMA. 2008;300:933-944.
Copyright © 2009 The Family Physicians Inquiries Network.
All rights reserved.
Use physical therapy to head off this deformity in infants
Identify infants with positional preference early and consider referral to pediatric physical therapy at 7 or 8 weeks to prevent severe deformational plagiocephaly (DP).1
Strength of recommendation:
B: Based on a single well-done randomized controlled trial (RCT).
van Vlimmeren LA, van der Graaf Y, Boere-Boonekamp MM, et al. Effect of pediatric physical therapy on deformational plagiocephaly in children with positional preference: a randomized controlled trial. Arch Pediatr Adolesc Med. 2008;162:712-718.
ILLUSTRATIVE CASE
During a routine checkup of a 2-month-old boy, you notice that the left side of his head is slightly flatter than the right and his forehead protrudes forward more on the left than the right. His birth history and development are normal. You wonder if the asymmetry will resolve as the infant grows older or whether you should suggest immediate treatment.
The American Academy of Pediatrics recommends putting babies to sleep on their backs to reduce the risk of sudden infant death syndrome. As more parents have followed this recommendation, the incidence of positional preference and DP has increased, presumably because external pressure distorts the malleable infant cranium. Prenatal and intrapartum factors also can cause DP, but sleeping on the back likely accounts for the recent increase.2-4
Not just a cosmetic issue
Although many clinicians consider skull deformities to be purely cosmetic,5 plagiocephaly is associated with auditory processing disorders, mandibular asymmetry, and visual field defects. Head deformities resulting from premature fusion of the cranial sutures (craniosynostosis) have been linked to an increased incidence of speech-language, cognitive, behavioral, and neurodevelopmental abnormalities.6,7 Whether these associations are causal is not yet known.5 Many parents believe that unattractive facial features lead to adverse effects on children, such as teasing and poor self-esteem.5,6
Conservative treatments for positional preference and DP include parental counseling, counter-positioning, simple exercises, and orthotic devices such as helmets.8 Scientific evidence supporting the effectiveness of these approaches is weak. The study we review in this PURL provides strong evidence of the effectiveness of 1 intervention—physical therapy (PT).
STUDY SUMMARY: Early physical therapy prevents severe DP
van Vlimmeren and colleagues conducted a prospective RCT comparing PT with usual care for preventing DP.1 From a group of 400 infants born consecutively in the Netherlands, they identified 65 with positional preference at 7 weeks of age and randomized them to PT or a control group. Pediatric physical therapists blinded to group allocation evaluated each infant at 6 and 12 months. Babies with congenital muscular torticollis (defined as preferential posture of the head and asymmetrical cervical movements caused by a unilateral contracture of the sternocleidomastoid muscle), dysmorphisms, or congenital syndromes were excluded.
The PT and control groups were comparable at baseline. Parents of infants in the control group received a pamphlet about basic preventive measures, but no additional instructions. Infants in the intervention group received standardized pediatric PT from trained therapists who were unaware of the results of the infants’ baseline assessments.
PT consisted of 8 sessions between 7 weeks and 6 months of age. The first 4 sessions were held weekly; subsequent sessions occurred every 2 to 3 weeks. The second through fifth sessions took place at the infant’s home.
The intervention included exercises to reduce positional preference and stimulate motor development, along with parental counseling about counter-positioning, handling, nursing, and the causes of positional preference. Parents received a pamphlet describing basic measures to prevent DP. The therapists also encouraged earlier and more frequent play times in the prone position (“tummy time”). PT was discontinued when the infant no longer demonstrated positional preference while awake or asleep, parents were following advice about handling, and the baby exhibited no signs of motor developmental delay or asymmetries.
The primary outcome was severe DP, measured as an oblique diameter difference index (ODDI) score of 104% or more—a score representing asymmetry of the skull that is obviously noticeable and therefore considered clinically relevant.9 The secondary outcome measures were symmetry in posture and active movements, motor development, and passive range of motion of the cervical spine.
Intervention reduced DP at 6 and 12 months. By 6 months of age, the number of infants in the intervention group with severe DP had decreased significantly from 53% to 30%, compared with a decrease from 63% to 56% in the control group (relative risk [RR]=0.54; 95% confidence interval [CI], 0.30-0.98; number needed to treat [NNT]=3.85). At 12 months, the number of babies in the intervention group with severe DP had decreased further, to 24%, whereas the number in the control group remained unchanged at 56% (RR=0.43; 95% CI, 0.22-0.85; NNT=3.13).
Secondary outcomes comparable. No major differences in secondary outcomes were noted between the 2 groups. At 6 and 12 months of age, none of the infants had positional preference or differences in motor development. Passive range of motion of the cervical spine was within normal range and symmetrical in all infants at baseline and at 6 and 12 months. However, at the 6-month evaluation, parents of babies in the intervention group demonstrated greater symmetry and less left orientation in nursing, positioning, and handling of the infants.
WHAT’S NEW: Early intervention trumps conservative therapies
This is the first RCT of a pediatric PT program to treat infants with positional preference to prevent severe plagiocephaly, and the study provides strong evidence to support this practice. The study included healthy infants, much like the ones we encounter in primary care practice. If, as we suspect, many of us have been recommending conservative therapies, we have reason to consider referral for this increasingly common clinical problem.
CAVEATS: Study did not focus on serious deficits
This study excluded infants with congenital muscular torticollis, dysmorphisms, or other congenital syndromes. We need to be aware of these causes of DP, which may warrant additional referrals beyond pediatric PT. In addition, DP should be distinguished from craniosynostosis, which requires referral for surgical evaluation and treatment.
Cosmetic issues vs more serious problems. DP is the most benign of the many causes of head deformities. The outcomes of this trial mainly addressed the cosmetic issue rather than more serious deficits associated with plagiocephaly. Nevertheless, we believe that cosmetic considerations are important to parents and children. What’s more, the intervention carries no risk of adverse effects and produces notable benefit. We conclude that discussing PT referral with parents is the appropriate practice change to implement based on this study.
Infant age, length of follow-up. Because this study did not evaluate the impact of the intervention on infants older than 7 to 8 weeks, it is not clear whether PT would be as effective if begun later in infancy. The relatively short follow-up (12 months) precludes conclusions about outcomes such as social functioning and school performance.
CHALLENGES TO IMPLEMENTATION: A matter of time
The incidence of positional preference has been reported to be as high as 22% at 7 weeks, making it a relatively common problem encountered by family physicians.7 Most children with positional preference do not develop DP and when they do, it is typically a cosmetic problem. Ruling out torticollis, craniosynostosis, and other congenital causes is critical. Ascertaining parental preference is a major consideration in the decision to refer for PT. All of this takes time.
However, parents are often concerned about their baby’s misshapen skull. We think that addressing positional preference is time well spent, especially since we now have evidence that a noninvasive approach—PT—can effectively prevent DP.
Acknowledgments
The PURLs Surveillance System is supported in part by Grant Number UL1RR024999 from the National Center for Research Resources, a Clinical Translational Science Award to the university of Chicago. The content is solely the responsibility of the authors and does not necessarily represent the official views of the National Center for Research Resources or the National Institutes of Health.
PURLs methodology
This study was selected and evaluated using FPIN’s Priority Updates from the Research Literature (PURL) Surveillance System methodology. The criteria and findings leading to the selection of this study as a PURL can be accessed at www.jfponline.com/purls.
1. van Vlimmeren LA, van der Graaf Y, Boere-Boonekamp MM, et al. Effect of pediatric physical therapy on deformational plagiocephaly in children with positional preference. Arch Pediatr Adolesc Med. 2008;162:712-718.
2. de Jonge GA, Engelberts AC, Koomen-Liefting AJ, et al. Cot death and prone sleeping position in the Netherlands. BMJ. 1989;298:722.-
3. Engelberts AC, de Jonge GA. Choice of sleeping position for infants: possible association with cot death. Arch Dis Child. 1990;65:462-467.
4. American Academy of Pediatrics Task Force on Infant Positioning and SIDS. Positioning and SIDS. Pediatrics. 1992;89:1120-1126.
5. Balan P, Kushnerenko E, Sahlin P, et al. Auditory ERPs reveal brain dysfunction in infants with plagiocephaly. J Craniofac Surg. 2002;13:520-525.
6. St John D, Mulliken JB, Kaban LB, et al. Anthropometric analysis of mandibular asymmetry in infants with deformational posterior plagiocephaly. J Oral Maxillofac Surg. 2002;60:873-877.
7. Hutchison BL, Hutchison LA, Thompson JM, et al. Plagiocephaly and brachycephaly in the first two years of life: a prospective cohort study. Pediatrics. 2004;114:970-980.
8. Speltz ML, Kapp-Simon KA, Cunningham M, et al. Single-suture craniosynostosis: a review of neurobehavioral research and theory. J Pediatr Psychol. 2004;29:651-668.
9. van Vlimmeren LA, Takken T, van Adrichem LN, et al. Plagiocephalometry: a non-invasive method to quantify asymmetry of the skull; a reliability study. Eur J Pediatr. 2006;165:149-157.
Identify infants with positional preference early and consider referral to pediatric physical therapy at 7 or 8 weeks to prevent severe deformational plagiocephaly (DP).1
Strength of recommendation:
B: Based on a single well-done randomized controlled trial (RCT).
van Vlimmeren LA, van der Graaf Y, Boere-Boonekamp MM, et al. Effect of pediatric physical therapy on deformational plagiocephaly in children with positional preference: a randomized controlled trial. Arch Pediatr Adolesc Med. 2008;162:712-718.
ILLUSTRATIVE CASE
During a routine checkup of a 2-month-old boy, you notice that the left side of his head is slightly flatter than the right and his forehead protrudes forward more on the left than the right. His birth history and development are normal. You wonder if the asymmetry will resolve as the infant grows older or whether you should suggest immediate treatment.
The American Academy of Pediatrics recommends putting babies to sleep on their backs to reduce the risk of sudden infant death syndrome. As more parents have followed this recommendation, the incidence of positional preference and DP has increased, presumably because external pressure distorts the malleable infant cranium. Prenatal and intrapartum factors also can cause DP, but sleeping on the back likely accounts for the recent increase.2-4
Not just a cosmetic issue
Although many clinicians consider skull deformities to be purely cosmetic,5 plagiocephaly is associated with auditory processing disorders, mandibular asymmetry, and visual field defects. Head deformities resulting from premature fusion of the cranial sutures (craniosynostosis) have been linked to an increased incidence of speech-language, cognitive, behavioral, and neurodevelopmental abnormalities.6,7 Whether these associations are causal is not yet known.5 Many parents believe that unattractive facial features lead to adverse effects on children, such as teasing and poor self-esteem.5,6
Conservative treatments for positional preference and DP include parental counseling, counter-positioning, simple exercises, and orthotic devices such as helmets.8 Scientific evidence supporting the effectiveness of these approaches is weak. The study we review in this PURL provides strong evidence of the effectiveness of 1 intervention—physical therapy (PT).
STUDY SUMMARY: Early physical therapy prevents severe DP
van Vlimmeren and colleagues conducted a prospective RCT comparing PT with usual care for preventing DP.1 From a group of 400 infants born consecutively in the Netherlands, they identified 65 with positional preference at 7 weeks of age and randomized them to PT or a control group. Pediatric physical therapists blinded to group allocation evaluated each infant at 6 and 12 months. Babies with congenital muscular torticollis (defined as preferential posture of the head and asymmetrical cervical movements caused by a unilateral contracture of the sternocleidomastoid muscle), dysmorphisms, or congenital syndromes were excluded.
The PT and control groups were comparable at baseline. Parents of infants in the control group received a pamphlet about basic preventive measures, but no additional instructions. Infants in the intervention group received standardized pediatric PT from trained therapists who were unaware of the results of the infants’ baseline assessments.
PT consisted of 8 sessions between 7 weeks and 6 months of age. The first 4 sessions were held weekly; subsequent sessions occurred every 2 to 3 weeks. The second through fifth sessions took place at the infant’s home.
The intervention included exercises to reduce positional preference and stimulate motor development, along with parental counseling about counter-positioning, handling, nursing, and the causes of positional preference. Parents received a pamphlet describing basic measures to prevent DP. The therapists also encouraged earlier and more frequent play times in the prone position (“tummy time”). PT was discontinued when the infant no longer demonstrated positional preference while awake or asleep, parents were following advice about handling, and the baby exhibited no signs of motor developmental delay or asymmetries.
The primary outcome was severe DP, measured as an oblique diameter difference index (ODDI) score of 104% or more—a score representing asymmetry of the skull that is obviously noticeable and therefore considered clinically relevant.9 The secondary outcome measures were symmetry in posture and active movements, motor development, and passive range of motion of the cervical spine.
Intervention reduced DP at 6 and 12 months. By 6 months of age, the number of infants in the intervention group with severe DP had decreased significantly from 53% to 30%, compared with a decrease from 63% to 56% in the control group (relative risk [RR]=0.54; 95% confidence interval [CI], 0.30-0.98; number needed to treat [NNT]=3.85). At 12 months, the number of babies in the intervention group with severe DP had decreased further, to 24%, whereas the number in the control group remained unchanged at 56% (RR=0.43; 95% CI, 0.22-0.85; NNT=3.13).
Secondary outcomes comparable. No major differences in secondary outcomes were noted between the 2 groups. At 6 and 12 months of age, none of the infants had positional preference or differences in motor development. Passive range of motion of the cervical spine was within normal range and symmetrical in all infants at baseline and at 6 and 12 months. However, at the 6-month evaluation, parents of babies in the intervention group demonstrated greater symmetry and less left orientation in nursing, positioning, and handling of the infants.
WHAT’S NEW: Early intervention trumps conservative therapies
This is the first RCT of a pediatric PT program to treat infants with positional preference to prevent severe plagiocephaly, and the study provides strong evidence to support this practice. The study included healthy infants, much like the ones we encounter in primary care practice. If, as we suspect, many of us have been recommending conservative therapies, we have reason to consider referral for this increasingly common clinical problem.
CAVEATS: Study did not focus on serious deficits
This study excluded infants with congenital muscular torticollis, dysmorphisms, or other congenital syndromes. We need to be aware of these causes of DP, which may warrant additional referrals beyond pediatric PT. In addition, DP should be distinguished from craniosynostosis, which requires referral for surgical evaluation and treatment.
Cosmetic issues vs more serious problems. DP is the most benign of the many causes of head deformities. The outcomes of this trial mainly addressed the cosmetic issue rather than more serious deficits associated with plagiocephaly. Nevertheless, we believe that cosmetic considerations are important to parents and children. What’s more, the intervention carries no risk of adverse effects and produces notable benefit. We conclude that discussing PT referral with parents is the appropriate practice change to implement based on this study.
Infant age, length of follow-up. Because this study did not evaluate the impact of the intervention on infants older than 7 to 8 weeks, it is not clear whether PT would be as effective if begun later in infancy. The relatively short follow-up (12 months) precludes conclusions about outcomes such as social functioning and school performance.
CHALLENGES TO IMPLEMENTATION: A matter of time
The incidence of positional preference has been reported to be as high as 22% at 7 weeks, making it a relatively common problem encountered by family physicians.7 Most children with positional preference do not develop DP and when they do, it is typically a cosmetic problem. Ruling out torticollis, craniosynostosis, and other congenital causes is critical. Ascertaining parental preference is a major consideration in the decision to refer for PT. All of this takes time.
However, parents are often concerned about their baby’s misshapen skull. We think that addressing positional preference is time well spent, especially since we now have evidence that a noninvasive approach—PT—can effectively prevent DP.
Acknowledgments
The PURLs Surveillance System is supported in part by Grant Number UL1RR024999 from the National Center for Research Resources, a Clinical Translational Science Award to the university of Chicago. The content is solely the responsibility of the authors and does not necessarily represent the official views of the National Center for Research Resources or the National Institutes of Health.
PURLs methodology
This study was selected and evaluated using FPIN’s Priority Updates from the Research Literature (PURL) Surveillance System methodology. The criteria and findings leading to the selection of this study as a PURL can be accessed at www.jfponline.com/purls.
1. van Vlimmeren LA, van der Graaf Y, Boere-Boonekamp MM, et al. Effect of pediatric physical therapy on deformational plagiocephaly in children with positional preference. Arch Pediatr Adolesc Med. 2008;162:712-718.
2. de Jonge GA, Engelberts AC, Koomen-Liefting AJ, et al. Cot death and prone sleeping position in the Netherlands. BMJ. 1989;298:722.-
3. Engelberts AC, de Jonge GA. Choice of sleeping position for infants: possible association with cot death. Arch Dis Child. 1990;65:462-467.
4. American Academy of Pediatrics Task Force on Infant Positioning and SIDS. Positioning and SIDS. Pediatrics. 1992;89:1120-1126.
5. Balan P, Kushnerenko E, Sahlin P, et al. Auditory ERPs reveal brain dysfunction in infants with plagiocephaly. J Craniofac Surg. 2002;13:520-525.
6. St John D, Mulliken JB, Kaban LB, et al. Anthropometric analysis of mandibular asymmetry in infants with deformational posterior plagiocephaly. J Oral Maxillofac Surg. 2002;60:873-877.
7. Hutchison BL, Hutchison LA, Thompson JM, et al. Plagiocephaly and brachycephaly in the first two years of life: a prospective cohort study. Pediatrics. 2004;114:970-980.
8. Speltz ML, Kapp-Simon KA, Cunningham M, et al. Single-suture craniosynostosis: a review of neurobehavioral research and theory. J Pediatr Psychol. 2004;29:651-668.
9. van Vlimmeren LA, Takken T, van Adrichem LN, et al. Plagiocephalometry: a non-invasive method to quantify asymmetry of the skull; a reliability study. Eur J Pediatr. 2006;165:149-157.
Copyright © 2009 The Family Physicians Inquiries Network.
All rights reserved.
Initiating antidepressant therapy? Try these 2 drugs first
When you initiate antidepressant therapy for patients who have not been treated for depression previously, select either sertraline or escitalopram. A large meta-analysis found these medications to be superior to other “new-generation” antidepressants.1
Strength of recommendation
A: Meta-analysis of 117 high-quality studies.
Cipriani A, Furukawa TA, Salanti G, et al. Comparative efficacy and acceptability of 12 new-generation antidepressants: a multiple-treatments meta-analysis. Lancet. 2009;373:746-758.
ILLUSTRATIVE CASE
Mrs. D is a 45-year-old patient whom you’ve treated for type 2 diabetes for several years. On her latest visit, she reports a loss of energy and difficulty sleeping and wonders if they could be related to the diabetes. As you explore further and question Mrs. D about these symptoms, she becomes tearful—and tells you she has episodes of sadness and no longer enjoys things the way she used to. Although she has no past history of depression, when you suggest that her symptoms may be an indication of depression, she readily agrees.
You discuss treatment options, including antidepressants and therapy. Mrs. D decides to try medication. But with so many antidepressants on the market, how do you determine which to choose?
Major depression is the fourth leading cause of disease globally, according to the World Health Organization.2 Depression is common in the United States as well, and primary care physicians are often the ones who are diagnosing and treating it. In fact, the US Preventive Services Task Force recently expanded its recommendation that primary care providers screen adults for depression, to include adolescents ages 12 to 18 years.3 When depression is diagnosed, physicians must help patients decide on an initial treatment plan.
All antidepressants are not equal
Options for initial treatment of unipolar major depression include psychotherapy and the use of an antidepressant. For mild and moderate depression, psychotherapy alone is as effective as medication. Combined psychotherapy and antidepressants are more effective than either treatment alone for all degrees of depression.4
The ideal medication for depression would be a drug with a high level of effectiveness and a low side-effect profile; until now, however, there has been little evidence to support 1 antidepressant over another. Previous meta-analyses have concluded that there are no significant differences in either efficacy or acceptability among the various second-generation antidepressants on the market.5,6 Thus, physicians have historically made initial monotherapy treatment decisions based on side effects and cost.7,8 The meta-analysis we report on here tells a different story, providing strong evidence that some antidepressants are more effective and better tolerated than others.
STUDY SUMMARY: Meta-analysis reveals 2 “best” drugs
Cipriani et al1 conducted a systematic review and multiple-treatments meta-analysis of 117 prospective randomized controlled trials (RCTs). Taken together, the RCTs evaluated the comparative efficacy and acceptability of 12 second-generation antidepressants: bupropion, citalopram, duloxetine, escitalopram, fluoxetine, fluvoxamine, milnacipran, mirtazapine, paroxetine, reboxetine, sertraline, and venlafaxine. The methodology of this meta-analysis differed from that of traditional meta-analyses by allowing the integration of data from both direct and indirect comparisons. (An indirect comparison is one in which drugs from different trials are assessed by combining the results of their effectiveness and comparing the combined finding with the effectiveness of a drug that all the trials have in common.) Previous studies, based only on direct comparisons, yielded inconsistent results.
The studies included in this meta-analysis were all RCTs in which 1 of these 12 antidepressants was tested against 1, or several, other second-generation antidepressants as monotherapy for the acute treatment phase of unipolar major depression. The authors excluded placebo-controlled trials in order to evaluate efficacy and acceptability of the study medications relative to other commonly used antidepressants. They defined acute treatment as 8 weeks of antidepressant therapy, with a range of 6 to 12 weeks. The primary outcomes studied were response to treatment and dropout rate.
Response to treatment (efficacy) was constructed as a Yes or No variable; a positive response was defined as a reduction of ≥50% in symptom score on either the Hamilton depression rating scale or the Montgomery-Asberg rating scale, or a rating of “improved” or “very much improved” on the clinical global impression at 8 weeks. Efficacy was calculated on an intention-to-treat basis; if data were missing for a participant, that person was classified as a nonresponder.
Dropout rate was used to represent acceptability, as the authors believed it to be a more clinically meaningful measure than either side effects or symptom scores. Comparative efficacy and acceptability were analyzed. Fluoxetine—the first of the second-generation antidepressants—was used as the reference medication. The ( FIGURE ) shows the outcomes for 9 of the antidepressants, compared with those of fluoxetine. The other 2 antidepressants, milnacipran and reboxetine, are omitted because they are not available in the United States.
The overall meta-analysis included 25,928 individuals, with 24,595 in the efficacy analysis and 24,693 in the acceptability analysis. Nearly two-thirds (64%) of the participants were women. The mean duration of follow-up was 8.1 weeks, and mean sample size per study was 110. Studies of women with postpartum depression were excluded.
Escitalopram and sertraline stand out. Overall, escitalopram, mirtazapine, sertraline, and venlafaxine were significantly more efficacious than fluoxetine or the other medications. Bupropion, citalopram, escitalopram, and sertraline were better tolerated than the other antidepressants. Escitalopram and sertraline were found to have the best combination of efficacy and acceptability.
Efficacy results. Fifty-nine percent of participants responded to sertraline, vs a 52% response rate for fluoxetine (number needed to treat [NNT]=14). Similarly, 52% of participants responded to escitalopram, compared with 47% of those taking fluoxetine (NNT=20).
Acceptability results. In terms of dropout rate, 28% of participants discontinued fluoxetine, vs 24% of patients taking sertraline. This means that 25 patients would need to be treated with sertraline, rather than fluoxetine, to avoid 1 discontinuation. In the comparison of fluoxetine vs escitalopram, 25% discontinued fluoxetine, compared with 24% who discontinued escitalopram.
The efficacy and acceptability of sertraline and escitalopram compared with other second-generation antidepressant medications show similar trends.
The generic advantage. The investigators recommend sertraline as the best choice for an initial antidepressant because it is available in generic form and is therefore lower in cost. They further recommend that sertraline, instead of fluoxetine or placebo, be the new standard against which other antidepressants are compared.
FIGURE
Sertraline and escitalopram come out on top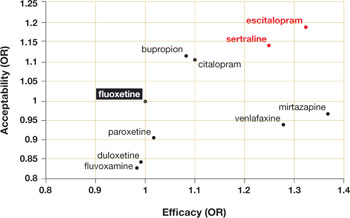
Using fluoxetine as the reference medication, the researchers analyzed various second-generation antidepressants. Sertraline and escitalopram had the best combination of efficacy and acceptability.
OR, odds ratio.
Source: Cipriani A et al. Lancet. 2009.1
WHAT’S NEW?: Antidepressant choice is evidence-based
We now have solid evidence for choosing sertraline or escitalopram as the first medication to use when treating a patient with newly diagnosed depression. This represents a practice change because antidepressants that are less effective and less acceptable have been chosen more frequently than either of these medications. That conclusion is based on our analysis of the National Ambulatory Medical Care Survey database for outpatient and ambulatory clinic visits in 2005-2006 (the most recent data available). We conducted this analysis to determine which of the second-generation antidepressants were prescribed most for initial monotherapy of major depression.
Our finding: An estimated 4 million patients ages 18 years and older diagnosed with depression in the course of the study year received new prescriptions for a single antidepressant. Six medications accounted for 90% of the prescriptions, in the following order:
- fluoxetine (Prozac)
- duloxetine (Cymbalta)
- escitalopram (Lexapro)
- paroxetine (Paxil)
- venlafaxine (Effexor)
- sertraline (Zoloft).
Sertraline and escitalopram, the drugs shown to be most effective and acceptable in the Cipriani meta-analysis, accounted for 11.8% and 14.5% of the prescriptions, respectively.
CAVEATS: Meta-analysis looked only at acute treatment phase
The results of this study are limited to initial therapy as measured at 8 weeks. Little long-term outcome data are available; response to initial therapy may not be a predictor of full remission or long-term success. Current guidelines suggest maintenance of the initial successful therapy, often with increasing intervals between visits, to prevent relapse.9
This study does not add new insight into long-term response rates. Nor does it deal with choice of a replacement or second antidepressant for nonresponders or those who cannot tolerate the initial drug.
What’s more, the study covers drug treatment alone, which may not be the best initial treatment for depression. Psychotherapy, in the form of cognitive behavioral therapy or interpersonal therapy, when available, is equally effective, has fewer potential physiologic side effects, and may produce longer-lasting results.10,11
Little is known about study design
The authors of this study had access only to limited information about inclusion criteria and the composition of initial study populations or settings. There is a difference between a trial designed to evaluate the “efficacy” of an intervention (“the beneficial and harmful effects of an intervention under controlled circumstances”) and the “effectiveness” of an intervention (the “beneficial and harmful effects of the intervention under usual circumstances”).12 It is not clear which of the 117 studies were efficacy studies and which were effectiveness studies. This may limit the overall generalizability of the study results to a primary care population.
Studies included in this meta-analysis were selected exclusively from published literature. There is some evidence that there is a bias toward the publication of studies with positive results, which may have the effect of overstating the effectiveness of a given antidepressant.13 However, we have no reason to believe that this bias would favor any particular drug.
Most of the included studies were sponsored by drug companies. Notably, pharmaceutical companies have the option of continuing to conduct trials of medications until a study results in a positive finding for their medication, with no penalty for the suppression of equivocal or negative results (negative publication bias). Under current FDA guidelines, there is little transparency to the consumer as to how many trials have been undertaken and the direction of the results, published or unpublished.14
We doubt that either publication bias or the design and sponsorship of the studies included in this meta-analysis present significant threats to the validity of these findings over other sources upon which guidelines rely, given that these issues are common to much of the research on pharmacologic therapy. We also doubt that the compensation of the authors by pharmaceutical companies would bias the outcome of the study in this instance. One of the authors (TAF) received compensation from Pfizer, the maker of Zoloft, which is also available as generic sertraline. None of the authors received compensation from Forest Pharmaceuticals, the makers of Lexapro (escitalopram).
CHALLENGES TO IMPLEMENTATION: No major barriers are anticipated
Both sertraline and escitalopram are covered by most health insurers. As noted above, sertraline is available in generic formulation, and is therefore much less expensive than escitalopram. In a check of online drug prices, we found a prescription for a 3-month supply of Lexapro (10 mg) to cost about $250; a 3-month supply of generic sertraline (100 mg) from the same sources would cost approximately $35 (www.pharmcychecker.com). Both Pfizer, the maker of Zoloft, and Forest Pharmaceuticals, the maker of Lexapro, have patient assistance programs to make these medications available to low-income, uninsured patients.
Acknowledgements
The PURLs Surveillance System is supported in part by Grant Number UL1RR02499 from the National Center for Research Resources, a Clinical Translational Science Award to the University of Chicago. The content is solely the responsibility of the authors and does not necessarily represent the official views of the National Center for Research Resources or the National Institutes of Health.
The authors wish to acknowledge Sofia Medvedev, PhD, of the University HealthSystem Consortium in Oak Brook, Ill, for analysis of the National Ambulatory Medical Care Survey data and the UHC Clinical Database.
1. Cipriani A, Furukawa TA, Salanti G, et al. Comparative efficacy and acceptability of 12 new-generation antidepressants: a multiple-treatments meta-analysis. Lancet. 2009;373:746-758.
2. Murray CJ, Lopez AD. Global Burden of Disease. Cambridge, MA: Harvard University Press; 1996.
3. Williams SB, O’Connor EA, Eder M, et al. Screening for child and adolescent depression in primary care settings: a systematic evidence review for the U.S. Preventive Services Task Force. Pediatrics. 2009;123:e716-e735.
4. Timonen M, Liukkonen T. Management of depression in adults. BMJ. 2008;336:435-439.
5. Gartlehner G, Hansen RA, Thieda P, et al. Comparative Effectiveness of Second-Generation Antidepressants in the Pharmacologic Treatment of Adult Depression. Comparative Effectiveness Review No. 7. (Prepared by RTI International-University of North Carolina Evidence Based Practice Center under Contract No. 290-02-0016.) Rockville, MD: Agency for Healthcare Research and Quality; January 2007. Available at: www.effectivehealthcare.ahrq.gov/reports/final.cfm. Accessed May 18, 2009.
6. Hansen RA, Gartlehner G, Lohr KN, et al. Efficacy and safety of second-generation antidepressants in the treatment of major depressive disorder. Ann Intern Med. 2005;143:415-426.
7. Adams SM, Miller KE, Zylstra RG. Pharmacologic management of adult depression. Am Fam Physician. 2008;77:785-792.
8. Qaseem A, Snow V, Denberg TD, et al. Using second-generation antidepressants to treat depressive disorders: a clinical practice guideline from the American College of Physicians. Ann Intern Med. 2008;149:725-733.
9. DeRubeis RJ, Hollon SD, Amsterdam JD, et al. Cognitive therapy vs medications in the treatment of moderate to severe depression. Arch Gen Psychiatry. 2005;62:409-416.
10. deMello MF, de Jesus MJ, Bacaltchuk J, et al. A systematic review of research findings on the efficacy of interpersonal therapy for depressive disorders. Eur Arch Psychiatry Clin Neurosci. 2005;255:75-82.
11. APA Practice Guidelines. Practice guideline for the treatment of patients with major depressive disorder, second edition. Available at: http://www.psychiatryonline.com/content.aspx?aID=48727. Accessed June 16, 2009.
12. Sackett D. An introduction to performing therapeutic trials. In: Haynes RB, Sackett DL, et al, eds. Clinical Epidemiology: How to Do Clinical Practice Research. 3rd ed. Philadelphia, PA: Lippincott Williams & Wilkins; 2006.
13. Turner EH, Matthews AM, Linardatos E, et al. Selective publication of antidepressant trials and its influence on apparent efficacy. N Engl J Med. 2008;358:252-260.
14. Mathew SJ, Charney DS. Publication bias and the efficacy of antidepressants. Am J Psychiatry. 2009;166:140-145.
PURLs methodology This study was selected and evaluated using FPIN’s Priority Updates from the Research Literature (PURL) Surveillance System methodology. The criteria and findings leading to the selection of this study as a PURL can be accessed at www.jfponline.com/purls.
When you initiate antidepressant therapy for patients who have not been treated for depression previously, select either sertraline or escitalopram. A large meta-analysis found these medications to be superior to other “new-generation” antidepressants.1
Strength of recommendation
A: Meta-analysis of 117 high-quality studies.
Cipriani A, Furukawa TA, Salanti G, et al. Comparative efficacy and acceptability of 12 new-generation antidepressants: a multiple-treatments meta-analysis. Lancet. 2009;373:746-758.
ILLUSTRATIVE CASE
Mrs. D is a 45-year-old patient whom you’ve treated for type 2 diabetes for several years. On her latest visit, she reports a loss of energy and difficulty sleeping and wonders if they could be related to the diabetes. As you explore further and question Mrs. D about these symptoms, she becomes tearful—and tells you she has episodes of sadness and no longer enjoys things the way she used to. Although she has no past history of depression, when you suggest that her symptoms may be an indication of depression, she readily agrees.
You discuss treatment options, including antidepressants and therapy. Mrs. D decides to try medication. But with so many antidepressants on the market, how do you determine which to choose?
Major depression is the fourth leading cause of disease globally, according to the World Health Organization.2 Depression is common in the United States as well, and primary care physicians are often the ones who are diagnosing and treating it. In fact, the US Preventive Services Task Force recently expanded its recommendation that primary care providers screen adults for depression, to include adolescents ages 12 to 18 years.3 When depression is diagnosed, physicians must help patients decide on an initial treatment plan.
All antidepressants are not equal
Options for initial treatment of unipolar major depression include psychotherapy and the use of an antidepressant. For mild and moderate depression, psychotherapy alone is as effective as medication. Combined psychotherapy and antidepressants are more effective than either treatment alone for all degrees of depression.4
The ideal medication for depression would be a drug with a high level of effectiveness and a low side-effect profile; until now, however, there has been little evidence to support 1 antidepressant over another. Previous meta-analyses have concluded that there are no significant differences in either efficacy or acceptability among the various second-generation antidepressants on the market.5,6 Thus, physicians have historically made initial monotherapy treatment decisions based on side effects and cost.7,8 The meta-analysis we report on here tells a different story, providing strong evidence that some antidepressants are more effective and better tolerated than others.
STUDY SUMMARY: Meta-analysis reveals 2 “best” drugs
Cipriani et al1 conducted a systematic review and multiple-treatments meta-analysis of 117 prospective randomized controlled trials (RCTs). Taken together, the RCTs evaluated the comparative efficacy and acceptability of 12 second-generation antidepressants: bupropion, citalopram, duloxetine, escitalopram, fluoxetine, fluvoxamine, milnacipran, mirtazapine, paroxetine, reboxetine, sertraline, and venlafaxine. The methodology of this meta-analysis differed from that of traditional meta-analyses by allowing the integration of data from both direct and indirect comparisons. (An indirect comparison is one in which drugs from different trials are assessed by combining the results of their effectiveness and comparing the combined finding with the effectiveness of a drug that all the trials have in common.) Previous studies, based only on direct comparisons, yielded inconsistent results.
The studies included in this meta-analysis were all RCTs in which 1 of these 12 antidepressants was tested against 1, or several, other second-generation antidepressants as monotherapy for the acute treatment phase of unipolar major depression. The authors excluded placebo-controlled trials in order to evaluate efficacy and acceptability of the study medications relative to other commonly used antidepressants. They defined acute treatment as 8 weeks of antidepressant therapy, with a range of 6 to 12 weeks. The primary outcomes studied were response to treatment and dropout rate.
Response to treatment (efficacy) was constructed as a Yes or No variable; a positive response was defined as a reduction of ≥50% in symptom score on either the Hamilton depression rating scale or the Montgomery-Asberg rating scale, or a rating of “improved” or “very much improved” on the clinical global impression at 8 weeks. Efficacy was calculated on an intention-to-treat basis; if data were missing for a participant, that person was classified as a nonresponder.
Dropout rate was used to represent acceptability, as the authors believed it to be a more clinically meaningful measure than either side effects or symptom scores. Comparative efficacy and acceptability were analyzed. Fluoxetine—the first of the second-generation antidepressants—was used as the reference medication. The ( FIGURE ) shows the outcomes for 9 of the antidepressants, compared with those of fluoxetine. The other 2 antidepressants, milnacipran and reboxetine, are omitted because they are not available in the United States.
The overall meta-analysis included 25,928 individuals, with 24,595 in the efficacy analysis and 24,693 in the acceptability analysis. Nearly two-thirds (64%) of the participants were women. The mean duration of follow-up was 8.1 weeks, and mean sample size per study was 110. Studies of women with postpartum depression were excluded.
Escitalopram and sertraline stand out. Overall, escitalopram, mirtazapine, sertraline, and venlafaxine were significantly more efficacious than fluoxetine or the other medications. Bupropion, citalopram, escitalopram, and sertraline were better tolerated than the other antidepressants. Escitalopram and sertraline were found to have the best combination of efficacy and acceptability.
Efficacy results. Fifty-nine percent of participants responded to sertraline, vs a 52% response rate for fluoxetine (number needed to treat [NNT]=14). Similarly, 52% of participants responded to escitalopram, compared with 47% of those taking fluoxetine (NNT=20).
Acceptability results. In terms of dropout rate, 28% of participants discontinued fluoxetine, vs 24% of patients taking sertraline. This means that 25 patients would need to be treated with sertraline, rather than fluoxetine, to avoid 1 discontinuation. In the comparison of fluoxetine vs escitalopram, 25% discontinued fluoxetine, compared with 24% who discontinued escitalopram.
The efficacy and acceptability of sertraline and escitalopram compared with other second-generation antidepressant medications show similar trends.
The generic advantage. The investigators recommend sertraline as the best choice for an initial antidepressant because it is available in generic form and is therefore lower in cost. They further recommend that sertraline, instead of fluoxetine or placebo, be the new standard against which other antidepressants are compared.
FIGURE
Sertraline and escitalopram come out on top
Using fluoxetine as the reference medication, the researchers analyzed various second-generation antidepressants. Sertraline and escitalopram had the best combination of efficacy and acceptability.
OR, odds ratio.
Source: Cipriani A et al. Lancet. 2009.1
WHAT’S NEW?: Antidepressant choice is evidence-based
We now have solid evidence for choosing sertraline or escitalopram as the first medication to use when treating a patient with newly diagnosed depression. This represents a practice change because antidepressants that are less effective and less acceptable have been chosen more frequently than either of these medications. That conclusion is based on our analysis of the National Ambulatory Medical Care Survey database for outpatient and ambulatory clinic visits in 2005-2006 (the most recent data available). We conducted this analysis to determine which of the second-generation antidepressants were prescribed most for initial monotherapy of major depression.
Our finding: An estimated 4 million patients ages 18 years and older diagnosed with depression in the course of the study year received new prescriptions for a single antidepressant. Six medications accounted for 90% of the prescriptions, in the following order:
- fluoxetine (Prozac)
- duloxetine (Cymbalta)
- escitalopram (Lexapro)
- paroxetine (Paxil)
- venlafaxine (Effexor)
- sertraline (Zoloft).
Sertraline and escitalopram, the drugs shown to be most effective and acceptable in the Cipriani meta-analysis, accounted for 11.8% and 14.5% of the prescriptions, respectively.
CAVEATS: Meta-analysis looked only at acute treatment phase
The results of this study are limited to initial therapy as measured at 8 weeks. Little long-term outcome data are available; response to initial therapy may not be a predictor of full remission or long-term success. Current guidelines suggest maintenance of the initial successful therapy, often with increasing intervals between visits, to prevent relapse.9
This study does not add new insight into long-term response rates. Nor does it deal with choice of a replacement or second antidepressant for nonresponders or those who cannot tolerate the initial drug.
What’s more, the study covers drug treatment alone, which may not be the best initial treatment for depression. Psychotherapy, in the form of cognitive behavioral therapy or interpersonal therapy, when available, is equally effective, has fewer potential physiologic side effects, and may produce longer-lasting results.10,11
Little is known about study design
The authors of this study had access only to limited information about inclusion criteria and the composition of initial study populations or settings. There is a difference between a trial designed to evaluate the “efficacy” of an intervention (“the beneficial and harmful effects of an intervention under controlled circumstances”) and the “effectiveness” of an intervention (the “beneficial and harmful effects of the intervention under usual circumstances”).12 It is not clear which of the 117 studies were efficacy studies and which were effectiveness studies. This may limit the overall generalizability of the study results to a primary care population.
Studies included in this meta-analysis were selected exclusively from published literature. There is some evidence that there is a bias toward the publication of studies with positive results, which may have the effect of overstating the effectiveness of a given antidepressant.13 However, we have no reason to believe that this bias would favor any particular drug.
Most of the included studies were sponsored by drug companies. Notably, pharmaceutical companies have the option of continuing to conduct trials of medications until a study results in a positive finding for their medication, with no penalty for the suppression of equivocal or negative results (negative publication bias). Under current FDA guidelines, there is little transparency to the consumer as to how many trials have been undertaken and the direction of the results, published or unpublished.14
We doubt that either publication bias or the design and sponsorship of the studies included in this meta-analysis present significant threats to the validity of these findings over other sources upon which guidelines rely, given that these issues are common to much of the research on pharmacologic therapy. We also doubt that the compensation of the authors by pharmaceutical companies would bias the outcome of the study in this instance. One of the authors (TAF) received compensation from Pfizer, the maker of Zoloft, which is also available as generic sertraline. None of the authors received compensation from Forest Pharmaceuticals, the makers of Lexapro (escitalopram).
CHALLENGES TO IMPLEMENTATION: No major barriers are anticipated
Both sertraline and escitalopram are covered by most health insurers. As noted above, sertraline is available in generic formulation, and is therefore much less expensive than escitalopram. In a check of online drug prices, we found a prescription for a 3-month supply of Lexapro (10 mg) to cost about $250; a 3-month supply of generic sertraline (100 mg) from the same sources would cost approximately $35 (www.pharmcychecker.com). Both Pfizer, the maker of Zoloft, and Forest Pharmaceuticals, the maker of Lexapro, have patient assistance programs to make these medications available to low-income, uninsured patients.
Acknowledgements
The PURLs Surveillance System is supported in part by Grant Number UL1RR02499 from the National Center for Research Resources, a Clinical Translational Science Award to the University of Chicago. The content is solely the responsibility of the authors and does not necessarily represent the official views of the National Center for Research Resources or the National Institutes of Health.
The authors wish to acknowledge Sofia Medvedev, PhD, of the University HealthSystem Consortium in Oak Brook, Ill, for analysis of the National Ambulatory Medical Care Survey data and the UHC Clinical Database.
1. Cipriani A, Furukawa TA, Salanti G, et al. Comparative efficacy and acceptability of 12 new-generation antidepressants: a multiple-treatments meta-analysis. Lancet. 2009;373:746-758.
2. Murray CJ, Lopez AD. Global Burden of Disease. Cambridge, MA: Harvard University Press; 1996.
3. Williams SB, O’Connor EA, Eder M, et al. Screening for child and adolescent depression in primary care settings: a systematic evidence review for the U.S. Preventive Services Task Force. Pediatrics. 2009;123:e716-e735.
4. Timonen M, Liukkonen T. Management of depression in adults. BMJ. 2008;336:435-439.
5. Gartlehner G, Hansen RA, Thieda P, et al. Comparative Effectiveness of Second-Generation Antidepressants in the Pharmacologic Treatment of Adult Depression. Comparative Effectiveness Review No. 7. (Prepared by RTI International-University of North Carolina Evidence Based Practice Center under Contract No. 290-02-0016.) Rockville, MD: Agency for Healthcare Research and Quality; January 2007. Available at: www.effectivehealthcare.ahrq.gov/reports/final.cfm. Accessed May 18, 2009.
6. Hansen RA, Gartlehner G, Lohr KN, et al. Efficacy and safety of second-generation antidepressants in the treatment of major depressive disorder. Ann Intern Med. 2005;143:415-426.
7. Adams SM, Miller KE, Zylstra RG. Pharmacologic management of adult depression. Am Fam Physician. 2008;77:785-792.
8. Qaseem A, Snow V, Denberg TD, et al. Using second-generation antidepressants to treat depressive disorders: a clinical practice guideline from the American College of Physicians. Ann Intern Med. 2008;149:725-733.
9. DeRubeis RJ, Hollon SD, Amsterdam JD, et al. Cognitive therapy vs medications in the treatment of moderate to severe depression. Arch Gen Psychiatry. 2005;62:409-416.
10. deMello MF, de Jesus MJ, Bacaltchuk J, et al. A systematic review of research findings on the efficacy of interpersonal therapy for depressive disorders. Eur Arch Psychiatry Clin Neurosci. 2005;255:75-82.
11. APA Practice Guidelines. Practice guideline for the treatment of patients with major depressive disorder, second edition. Available at: http://www.psychiatryonline.com/content.aspx?aID=48727. Accessed June 16, 2009.
12. Sackett D. An introduction to performing therapeutic trials. In: Haynes RB, Sackett DL, et al, eds. Clinical Epidemiology: How to Do Clinical Practice Research. 3rd ed. Philadelphia, PA: Lippincott Williams & Wilkins; 2006.
13. Turner EH, Matthews AM, Linardatos E, et al. Selective publication of antidepressant trials and its influence on apparent efficacy. N Engl J Med. 2008;358:252-260.
14. Mathew SJ, Charney DS. Publication bias and the efficacy of antidepressants. Am J Psychiatry. 2009;166:140-145.
PURLs methodology This study was selected and evaluated using FPIN’s Priority Updates from the Research Literature (PURL) Surveillance System methodology. The criteria and findings leading to the selection of this study as a PURL can be accessed at www.jfponline.com/purls.
Copyright © 2009 The Family Physicians Inquiries Network.
All rights reserved.
Migraine treatment “tweak” could reduce office visits
Add dexamethasone to the standard treatment of moderate to severe migraine headache; a single dose (8-24 mg) may prevent short-term recurrence, resulting in less need for medication and fewer repeat visits to the office or emergency department.1
Strength of recommendation:
A: A meta-analysis
Singh A, Alter HJ, Zaia B. Does the addition of dexamethasone to standard therapy for acute migraine headache decrease the incidence of recurrent headache for patients treated in the emergency department? A meta-analysis and systematic review of the literature. Acad Emerg Med. 2008;15:1223-1233.
ILLUSTRATIVE CASE
A 35-year-old woman comes to your office with a headache that has persisted for 24 hours—the typical duration of her migraines, she says. She is nauseated, photophobic, and has a right-sided headache that she rates as moderate to severe. You’ve read about the potential role of corticosteroids in treating acute migraine and wonder whether to add dexamethasone (Decadron) to the standard treatment.
Migraine headaches present a therapeutic challenge: You need to determine which therapeutic regimen is best, not only for immediate relief, but also for its ability to prevent recurrence. With up to two-thirds of migraine patients experiencing another headache within 24 to 48 hours of treatment,1 many seek repeat treatment within a short time frame.2 As such, they’re at risk for medication overuse, which may contribute to an increase in both the intensity and frequency of symptoms.3
A steroid may blunt inflammatory response
The pathogenesis of migraine headache is poorly understood. One theory is that migraines are associated with a neurogenic inflammatory response with the release of vasoactive neuropeptide. This inflammation is thought to be responsible for the initiation and perpetuation of the headache.1 It therefore follows that the addition of a steroid to standard migraine therapy may blunt this inflammatory response. Several small studies have investigated this possibility, but they had inadequate power to detect a meaningful difference. The meta-analysis detailed in this PURL makes a stronger case.
STUDY SUMMARY: Only 1 steroid studied, but it delivered
Singh and colleagues performed a systematic search for randomized controlled trials (RCTs) studying the use of corticosteroids in the emergency department (ED) as a treatment adjunct for migraine headache.1 They used rigorous search methods and well-defined inclusion criteria. The primary outcome of interest was the proportion of migraine patients who reported symptoms of moderate or severe headache at 24- to 72-hour follow-up.
Seven studies, with a total of 742 patients, met the inclusion criteria. All were RCTs in which participants and providers were blinded to treatment assignments, and all involved the addition of dexamethasone. No studies evaluating other steroids were found in the literature review. The patients were all diagnosed as having acute migraine headache by the ED physician, based on International Headache Society criteria.4
The adjunctive therapy—dexamethasone or placebo—was initiated in the ED, in addition to routine treatment. The standard migraine treatment was not the same for all the RCTs and was based on physician choice. Routinely used medications included metoclopramide (Reglan), ketorolac (Toradol), chlorpromazine (Compazine), and diphenhydramine (Benadryl). Doses of dexamethasone also varied, ranging from 8 to 24 mg; the median dose was 15 mg. All studies cited the proportion of migraine patients who had self-reported moderate to severe headache at 24 to 72 hours after treatment.
Dexamethasone prevents 1 recurrence in 10. The meta-analysis revealed a moderate benefit when dexamethasone was added to standard therapy for migraine headache in the ED. The addition of dexamethasone to standard migraine therapy prevented almost 1 in 10 patients from experiencing moderate to severe recurrent headache in 24 to 72 hours (relative risk [RR]=0.87, 95% confidence interval [CI], 0.80-0.95). Transient side effects occurred in about 25% of patients in both the treatment and placebo groups.
Sensitivity analysis indicated that this meta-analysis was fairly robust, with no single trial dominating the results. There was no evidence of missing studies due to publication bias. These results are consistent with a similar meta-analysis, which also included 7 studies, all but 1 of which were the same.5
WHAT’S NEW?: Earlier findings gain strength in numbers
This meta-analysis demonstrates that adjunctive therapy with a steroid is a viable option in the management of acute migraines—an intervention that each of the individual 7 RCTs was too small to justify on its own. Specifically, the addition of dexamethasone to standard migraine treatment may prevent severe recurrent pain that would otherwise necessitate a repeat visit to the ED—or to your office.
CAVEATS: Will it work in an office setting?
This meta-analysis addresses more severe headache recurrences, which are likely to lead patients to seek additional medication or repeat evaluation. Indeed, all 7 RCTs included in the evaluation were performed in an ED setting. And 6 of the 7 trials assessed dexamethasone administered parenterally, which may not be possible in some office settings. In the single trial in which the steroid was administered orally, patients were given 8 mg dexamethasone in addition to intravenous phenothiazines. In the 63 patients included in that study, the relative risk of recurrent headache was 0.69 (95% CI, 0.33-1.45). However, among those with a headache duration of <24 hours (n=40, 63.5%), the relative risk was 0.33 (95% CI, 0.11-1.05).6
Other questions: It is not clear from this single trial whether oral dexamethasone is as effective as IV administration. Nor is it clear whether other corticosteroids will work as well, as no studies of other agents have been reported.1,5 The lowest effective dose of dexamethasone is also not known.
BARRIERS TO IMPLEMENTATION: Repeat steroid use raises risk of complications
Based on this meta-analysis, it is unclear whether IV administration is required for the desired benefit. Another potential concern is associated with the administration of frequent dexamethasone boluses in patients with frequent migraines, which could lead to any one of a number of steroid-related adverse reactions, including osteonecrosis.7 The risks of steroid-related complications should be considered in using this therapy, especially for patients receiving multiple doses of dexamethasone.
Acknowledgements
The PURLs Surveillance System is supported in part by Grant Number UL1RR02499 from the National Center for Research Resources, a Clinical Translational Science Award to the University of Chicago. The content is solely the responsibility of the authors and does not necessarily represent the official views of the National Center for Research Resources or the National Institutes of Health.
1. Singh A, Alter HJ, Zaia B. Does the addition of dexamethasone to standard therapy for acute migraine headache decrease the incidence of recurrent headache for patients treated in the emergency department? A meta-analysis and systematic review of the literature. Acad Emerg Med. 2008;15:1223-1233.
2. Chan BT, Ovens HJ. Chronic migraineurs: an important subgroup of patients who visit emergency departments frequently. Ann Emerg Med. 2004;43:238-242.
3. Bigal ME, Lipton RB. Excessive acute migraine medication use and migraine progression. Neurology. 2008;71:1821-1828.
4. Martin V, Elkind A. Diagnosis and classification of primary headache disorders. In: Standards of Care Committee, National Headache Foundation, ed. Standards of care for headache diagnosis and treatment. Chicago, IL: National Headache Foundation; 2004:4-18.
5. Colman I, Friedman BW, Brown MD, et al. Parenteral dexamethasone for acute severe migraine headache: meta-analysis of randomised controlled trials for preventing recurrence. BMJ. 2008;336:1359-1361.
6. Kelly AM, Kerr D, Clooney M. Impact of oral dexamethasone versus placebo after ED treatment of migraine with phenothiazines on the rate of recurrent headache: a randomised controlled trial. Emerg Med J. 2008;25:26-29.
7. Hussain A, Young WB. Steroids and aseptic osteonecrosis (AON) in migraine patients. Headache. 2007;47:600-604.
PURLs methodology This study was selected and evaluated using FPIN’s Priority Updates from the Research Literature (PURL) Surveillance System methodology. The criteria and findings leading to the selection of this study as a PURL can be accessed at www.jfponline.com/purls.
Add dexamethasone to the standard treatment of moderate to severe migraine headache; a single dose (8-24 mg) may prevent short-term recurrence, resulting in less need for medication and fewer repeat visits to the office or emergency department.1
Strength of recommendation:
A: A meta-analysis
Singh A, Alter HJ, Zaia B. Does the addition of dexamethasone to standard therapy for acute migraine headache decrease the incidence of recurrent headache for patients treated in the emergency department? A meta-analysis and systematic review of the literature. Acad Emerg Med. 2008;15:1223-1233.
ILLUSTRATIVE CASE
A 35-year-old woman comes to your office with a headache that has persisted for 24 hours—the typical duration of her migraines, she says. She is nauseated, photophobic, and has a right-sided headache that she rates as moderate to severe. You’ve read about the potential role of corticosteroids in treating acute migraine and wonder whether to add dexamethasone (Decadron) to the standard treatment.
Migraine headaches present a therapeutic challenge: You need to determine which therapeutic regimen is best, not only for immediate relief, but also for its ability to prevent recurrence. With up to two-thirds of migraine patients experiencing another headache within 24 to 48 hours of treatment,1 many seek repeat treatment within a short time frame.2 As such, they’re at risk for medication overuse, which may contribute to an increase in both the intensity and frequency of symptoms.3
A steroid may blunt inflammatory response
The pathogenesis of migraine headache is poorly understood. One theory is that migraines are associated with a neurogenic inflammatory response with the release of vasoactive neuropeptide. This inflammation is thought to be responsible for the initiation and perpetuation of the headache.1 It therefore follows that the addition of a steroid to standard migraine therapy may blunt this inflammatory response. Several small studies have investigated this possibility, but they had inadequate power to detect a meaningful difference. The meta-analysis detailed in this PURL makes a stronger case.
STUDY SUMMARY: Only 1 steroid studied, but it delivered
Singh and colleagues performed a systematic search for randomized controlled trials (RCTs) studying the use of corticosteroids in the emergency department (ED) as a treatment adjunct for migraine headache.1 They used rigorous search methods and well-defined inclusion criteria. The primary outcome of interest was the proportion of migraine patients who reported symptoms of moderate or severe headache at 24- to 72-hour follow-up.
Seven studies, with a total of 742 patients, met the inclusion criteria. All were RCTs in which participants and providers were blinded to treatment assignments, and all involved the addition of dexamethasone. No studies evaluating other steroids were found in the literature review. The patients were all diagnosed as having acute migraine headache by the ED physician, based on International Headache Society criteria.4
The adjunctive therapy—dexamethasone or placebo—was initiated in the ED, in addition to routine treatment. The standard migraine treatment was not the same for all the RCTs and was based on physician choice. Routinely used medications included metoclopramide (Reglan), ketorolac (Toradol), chlorpromazine (Compazine), and diphenhydramine (Benadryl). Doses of dexamethasone also varied, ranging from 8 to 24 mg; the median dose was 15 mg. All studies cited the proportion of migraine patients who had self-reported moderate to severe headache at 24 to 72 hours after treatment.
Dexamethasone prevents 1 recurrence in 10. The meta-analysis revealed a moderate benefit when dexamethasone was added to standard therapy for migraine headache in the ED. The addition of dexamethasone to standard migraine therapy prevented almost 1 in 10 patients from experiencing moderate to severe recurrent headache in 24 to 72 hours (relative risk [RR]=0.87, 95% confidence interval [CI], 0.80-0.95). Transient side effects occurred in about 25% of patients in both the treatment and placebo groups.
Sensitivity analysis indicated that this meta-analysis was fairly robust, with no single trial dominating the results. There was no evidence of missing studies due to publication bias. These results are consistent with a similar meta-analysis, which also included 7 studies, all but 1 of which were the same.5
WHAT’S NEW?: Earlier findings gain strength in numbers
This meta-analysis demonstrates that adjunctive therapy with a steroid is a viable option in the management of acute migraines—an intervention that each of the individual 7 RCTs was too small to justify on its own. Specifically, the addition of dexamethasone to standard migraine treatment may prevent severe recurrent pain that would otherwise necessitate a repeat visit to the ED—or to your office.
CAVEATS: Will it work in an office setting?
This meta-analysis addresses more severe headache recurrences, which are likely to lead patients to seek additional medication or repeat evaluation. Indeed, all 7 RCTs included in the evaluation were performed in an ED setting. And 6 of the 7 trials assessed dexamethasone administered parenterally, which may not be possible in some office settings. In the single trial in which the steroid was administered orally, patients were given 8 mg dexamethasone in addition to intravenous phenothiazines. In the 63 patients included in that study, the relative risk of recurrent headache was 0.69 (95% CI, 0.33-1.45). However, among those with a headache duration of <24 hours (n=40, 63.5%), the relative risk was 0.33 (95% CI, 0.11-1.05).6
Other questions: It is not clear from this single trial whether oral dexamethasone is as effective as IV administration. Nor is it clear whether other corticosteroids will work as well, as no studies of other agents have been reported.1,5 The lowest effective dose of dexamethasone is also not known.
BARRIERS TO IMPLEMENTATION: Repeat steroid use raises risk of complications
Based on this meta-analysis, it is unclear whether IV administration is required for the desired benefit. Another potential concern is associated with the administration of frequent dexamethasone boluses in patients with frequent migraines, which could lead to any one of a number of steroid-related adverse reactions, including osteonecrosis.7 The risks of steroid-related complications should be considered in using this therapy, especially for patients receiving multiple doses of dexamethasone.
Acknowledgements
The PURLs Surveillance System is supported in part by Grant Number UL1RR02499 from the National Center for Research Resources, a Clinical Translational Science Award to the University of Chicago. The content is solely the responsibility of the authors and does not necessarily represent the official views of the National Center for Research Resources or the National Institutes of Health.
1. Singh A, Alter HJ, Zaia B. Does the addition of dexamethasone to standard therapy for acute migraine headache decrease the incidence of recurrent headache for patients treated in the emergency department? A meta-analysis and systematic review of the literature. Acad Emerg Med. 2008;15:1223-1233.
2. Chan BT, Ovens HJ. Chronic migraineurs: an important subgroup of patients who visit emergency departments frequently. Ann Emerg Med. 2004;43:238-242.
3. Bigal ME, Lipton RB. Excessive acute migraine medication use and migraine progression. Neurology. 2008;71:1821-1828.
4. Martin V, Elkind A. Diagnosis and classification of primary headache disorders. In: Standards of Care Committee, National Headache Foundation, ed. Standards of care for headache diagnosis and treatment. Chicago, IL: National Headache Foundation; 2004:4-18.
5. Colman I, Friedman BW, Brown MD, et al. Parenteral dexamethasone for acute severe migraine headache: meta-analysis of randomised controlled trials for preventing recurrence. BMJ. 2008;336:1359-1361.
6. Kelly AM, Kerr D, Clooney M. Impact of oral dexamethasone versus placebo after ED treatment of migraine with phenothiazines on the rate of recurrent headache: a randomised controlled trial. Emerg Med J. 2008;25:26-29.
7. Hussain A, Young WB. Steroids and aseptic osteonecrosis (AON) in migraine patients. Headache. 2007;47:600-604.
PURLs methodology This study was selected and evaluated using FPIN’s Priority Updates from the Research Literature (PURL) Surveillance System methodology. The criteria and findings leading to the selection of this study as a PURL can be accessed at www.jfponline.com/purls.
Copyright © 2009 The Family Physicians Inquiries Network.
All rights reserved.