User login
Simple Patient Care Instructions Translate Best: Safety Guidelines for Physician Use of Google Translate
From the University of Arizona College of Medicine – Tucson, Tucson, AZ.
Abstract
- Objective: To determine predictors of quality and safety of machine translation (Google Translate) of patient care instructions (PCIs), and to determine if machine back translation is useful in quality assessment.
- Methods: 100 sample English PCIs were contributed by 88 clinical faculty. Each example PCI was up to 3 sentences of typical patient instruction that might be included in an after visit summary. Google Translate was used to first translate the English to Spanish, then back to English. A panel of 6 English/Spanish translators assessed the Spanish translations for safety and quality. A panel of 6 English-speaking health care workers assessed the back translation. A 5-point scale was used to assess quality. Safety was assessed as safe or unsafe.
- Results: Google Translate was usually (> 90%) capable of safe and comprehensible translation from English to Spanish. Instructions with incresed complexity, especially regarding medications, were prone to unsafe translation. Back translation was not reliable in detecting unsafe Spanish.
- Conclusion: Google Translate is a continuously evolving resource for clinicians that offers the promise of improved physician-patient communication. Simple declarative sentences are most reliably translated with high quality and safety.
Keywords: translation; machine translation; electronic health record; after-visit summary; patient safety; physician-patient communication.
Acore measure of the meaningful use of electronic health records incentive program is the generation and provision of the after visit summary (AVS), a mechanism for physicians to provide patients with a written summary of the patient encounter [1,2]. Although not a required element for meaningful use, free text patient care instructions (PCIs) provide the physician an opportunity to improve patient engagement either at the time of service or through the patient portal [3] by providing a short written summary of the key points of the office visit based upon the visit’s clinical discussion. For patients who do not speak English, a verbal translation service is required [4], but seldom are specific patient instructions provided in writing in the patient’s preferred language. A mechanism to improve communication might be through translation of the PCI into the patient’s preferred language. Spanish is the most common language, other than English, spoken at home in the United States [5,6]. For this reason, we chose to investigate if it is feasible to use machine translation (Google Translate) to safely and reliably translate a variety of PCIs from English to Spanish, and to assess the types of translation errors and ambiguities that might result in unsafe communication. We further investigate if machine back translation might allow the author of patient care instructions to evaluate the quality of the Spanish machine translation.
There is evidence to suggest that patient communication and satisfaction will improve if portions of the AVS are communicated in Spanish to primarily Spanish-speaking patients. Pavlik et al conducted a randomized controlled trial on the association of patient recall, satisfaction, and adherence to the information communicated in an AVS, in a largely Hispanic (61%) primary care clinic setting [7]. The AVS was provided in English. They noted that Spanish speakers wished to receive information in Spanish, although most had access to translation by a family member. They also noted that a lack of ability to provide an AVS in Spanish was a concern among providers. There was no difference in recall or satisfaction between English and Spanish speakers with respect to medications and allergies, suggesting that not all portions of the AVS might need to be translated.
Machine translation refers to the automated process of translating one language to another. The most recent methods of machine translation, as exemplified by Google Translate (Google Inc., Mountain View, CA), do not use rules of grammar and dictionaries to perform translations but instead use artificial neural networks to learn from “millions of examples” of translation [8]. However, unsupervised machine translation can result in serious errors [9]. Patil gives as an example of a serious error of translation from English (“Your child is fitting”) to Swahili (“Your child is dead”). In British parlance, “fitting” is a term for “having a seizure” and represents an example of a term that is context sensitive. However, others note that there is reason to be optimistic about the state of machine translation for biomedical text [10].
One method of assessing translation quality is through back translation, where one translator takes the author’s work into the desired target language, and then a different translator takes the target language back to the language of the author. Like the children’s game Chinese Whispers (Telephone in the United States) [11], where a “secret message” is whispered from one child to the next and spoken aloud at the end of the line of children, back translation can test to see if a message “gets through.” In this analogy, when information is machine translated from English to Spanish, and then machine translated from Spanish to English (Figure), we can compare the initial message to the final translation to see if the message “gets through.” We further investigate if machine back translation might allow a non-Spanish speaking author of PCIs to evaluate the quality of the Spanish translation. 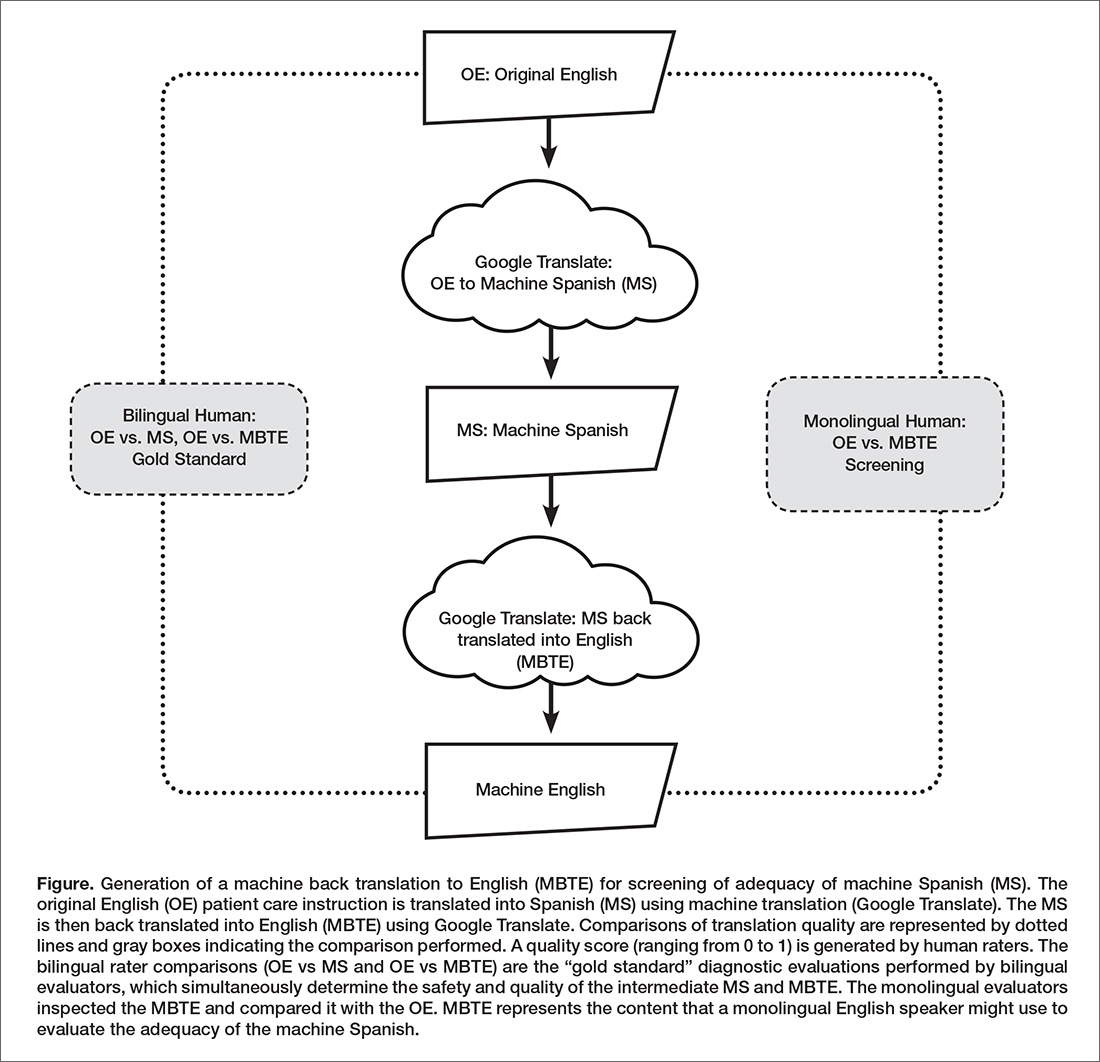
Our intention was to determine if machine back translation [12] could be used by an English-only author to assess the quality of an intermediate Spanish translation. If poorly worded Spanish translated back into poorly worded English, the author might choose to either refine their original message until an acceptable machine back translation was achieved or to not release the Spanish translation to the patient. We were also concerned that there might be instances where the intermediate Spanish was unacceptable, but when translated back into English by machine translation, relatively acceptable English might result. If this were the case, then back translation would fail to detect a relatively poor intermediate Spanish translation.
Methods
Patient Care Instructions
Original English PCIs
Example original English PCIs were solicited from the clinical faculty and resident staff of the University of Arizona College of Medicine by an email-based survey tool (Qualtrics, Inc, Provo UT). The solicitation stated the following:
We are conducting a study to assess how well Google Translate might perform in translating patient instructions from English to Spanish. Would you please take the time to type three sentences that might comprise a typical “nugget” of patient instruction using language that you would typically include in an After Visit Summary for a patient? An example might be: “Take two Tylenol 325 mg tablets every four hours while awake for the next two days. If you have a sudden increase in pain or fever, or begin vomiting, call our office. Drink plenty of fluids.”
A total of 100 PCIs were collected. The breadth of the clinical practice and writing styles of a College of Medicine faculty are represented: not all were completely clear or were well-formed sentences, but did represent examples provided by busy clinicians of typical language that they would provide in an AVS PCI.
Machine Translation into Spanish
The 100 original English (OE) PCIs were submitted to the Google Translate web interface (https://translate.google.com/) by cutting and pasting and selecting “Spanish,” resulting in machine Spanish. The translations were performed in January 2016. No specific version number is provided by Google on their web page, and the service is described to be constantly evolving (https://translate.google.com/about/intl/en_ALL/contribute.html).
Machine Back Translation into English (MBTE)
Google Translate was then used to translate the machine Spanish back into into English. MBTE represents the content that a monolingual English speaker might use to evaluate the machine Spanish.
Ratings of Translation Quality and Safety
Two panels of 6 raters evaluated machine Spanish and MBTE quality and safety. A bilingual English/Spanish speaking panel simultaneously evaluated the machine Spanish and MBTE compared to OE, with the goal of inferring where in the process an undesirable back translation error occurred. Bilingual raters were experienced bilingual clinicians or certified translators. A monolingual English speaking panel also evaluated the MBTE (compared to OE). They could only infer the quality and safety of the machine Spanish indirectly through inspection of MBTE, and their assessment was free of the potential bias of knowledge of the intermediate Spanish translation.
The raters used Likert scales to rate grammar similarity and content similarity (scale from 1 to 5: 1 = very dissimilar, 5 = identical). For each PCI, grammar and content scores for each rater were summed and then divided by 10 to yield a within-rater quality score ranging from 0 to 1. A panel-level (bilingual or monolingual) quality score was calculated by averaging the quality scores across raters.
Safety of translation was rated as 0 or Safe (“While the translation may be awkward, it is not dangerous” or 1 or Unsafe (“A dangerous translation error is present that might cause harm to the patient if instructions were followed”). If any panel member considered an item to be unsafe, the item as a whole was scored as unsafe.
Data Analysis
Descriptive Summary of PCI Contributions
The 100 PCIs were summarized in terms of volume (word count), complexity (Flesch-Kincaid Grade Level index [13]), and content (medication names, references, formatting) (Table 1). Word count and grade level were calculated using Microsoft Word (Microsoft Corp, Redmond WA). 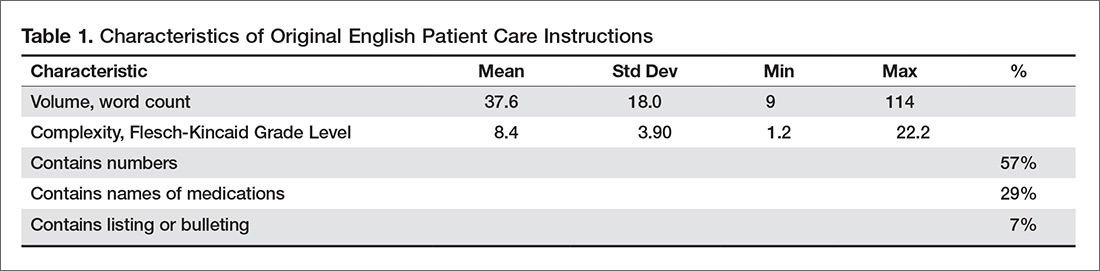
Safety Analysis
Concordance analysis. A safety translation concern as defined in this study (“might cause harm”) is very subjective. To reduce some of the variation in assessment of safety, we identified 4 members of the bilingual panel whose safety assessments of MBTE were most similar to the most concordant 4 monolingual raters’ assessment of MBTE safety. The goal was to select the bilingual panel of 4 that was most “typical” of the behavior of a “typical” monolingual individual with respect to assessing the safety of an individual MBTE translation. We then used this bilingual panel to identify 2 sets of “unsafe” machine Spanish and MBTE PCI translations: PCIs where ANY of the 4 bilingual raters identified a safety concern in machine Spanish or MBTE, and PCIs where MOST (at least 3) of the 4 bilingual raters agree that PCI translation was “unsafe”.
An expansion of Cohen’s kappa was used to identify the most concordant pairing of 4 bilingual panel members and 4 monolingual panel members [14]. All pairwise comparisons of monolingual and bilingual panel members were coded as follows: +1 was scored when 2 raters were concordant (both scored safe or unsafe) and –1 was scored for discordant pairs. For the 225 possible pairings of 4 panel members (15 combinations of 4 of 6 bilingual, 15 combinations of 4 of 6 monolingual raters), the 100 PCI items scores ranged from +16 (absolute agreement of the 2 panels of 4) to –16 (absolute discordance). For each pairing, we summed the scores for the 100 PCIs to determine the most concordant 4 monolingual and 4 bilingual raters (highest summed scores), which were then used for all subsequent analyses of safety and quality.
Original English characteristics of unsafe translation.
A logistic regression was performed with safety as the dependent variable (safe/unsafe defined by bilingual raters) with explanatory variables of word count, grade level, and reference to medication in OE.
Quality Assessment
Bilingual and monolingual raters assessments of translation quality. We assessed the correlation between the bilingual quality ratings of machine Spanish vs. MBTE and conducted paired t tests comparing mean bilingual machine Spanish and MBTE ratings. High correlation and absence of a significant difference in means would support the notion that MBTE could be used to reliably assess machine Spanish quality.
We also assessed the correlation between bilingual quality assessments of MS vs. monolingual raters’ assessments of MBTE, and conducted paired comparison t tests comparing bilingual machine Spanish and monolingual MBTE quality ratings. These analyses assess the ability of an English-only reader of MBTE to predict the quality of machine Spanish, as determined by a bilingual rater. High correlation and absence of a significant difference in means would support the notion that MBTE could be used by an English-only speaker to reliably assess machine Spanish quality.
Associations between original English content and translation quality. Objective measures of original English were correlated via stepwise linear regression with bilingual assessment of machine Spanish quality.
Results
PCI Contributions
Example PCIs were contributed by 88 individuals and are summarized in Table 1. The 100 original English PCIs and the machine Spanish and MBTE translations obtained via Google Translate are available from the authors upon request.
Safety
Concordance Analysis
The 6 monolingual and bilingual raters agreed on the safety of 73 MBTE PCIs. The most concordant pairings of 4 agreed on 81 items. The least and most concordant pairings had concordance values of 0.68 and 0.84, respectively. Subsequent analyses include data from only the 4 most concordant monolingual and bilingual raters.
Bilingual and Monolingual Safety Ratings
Both bilingual and monolingual raters assessed MBTE. On average, bilingual ratings of MBTE of safety were higher (0.987) than monolingual ratings (0.925) (t = –3.897, P = 0.0002).
Identification of Unsafe Translations in Machine Spanish and MBTE
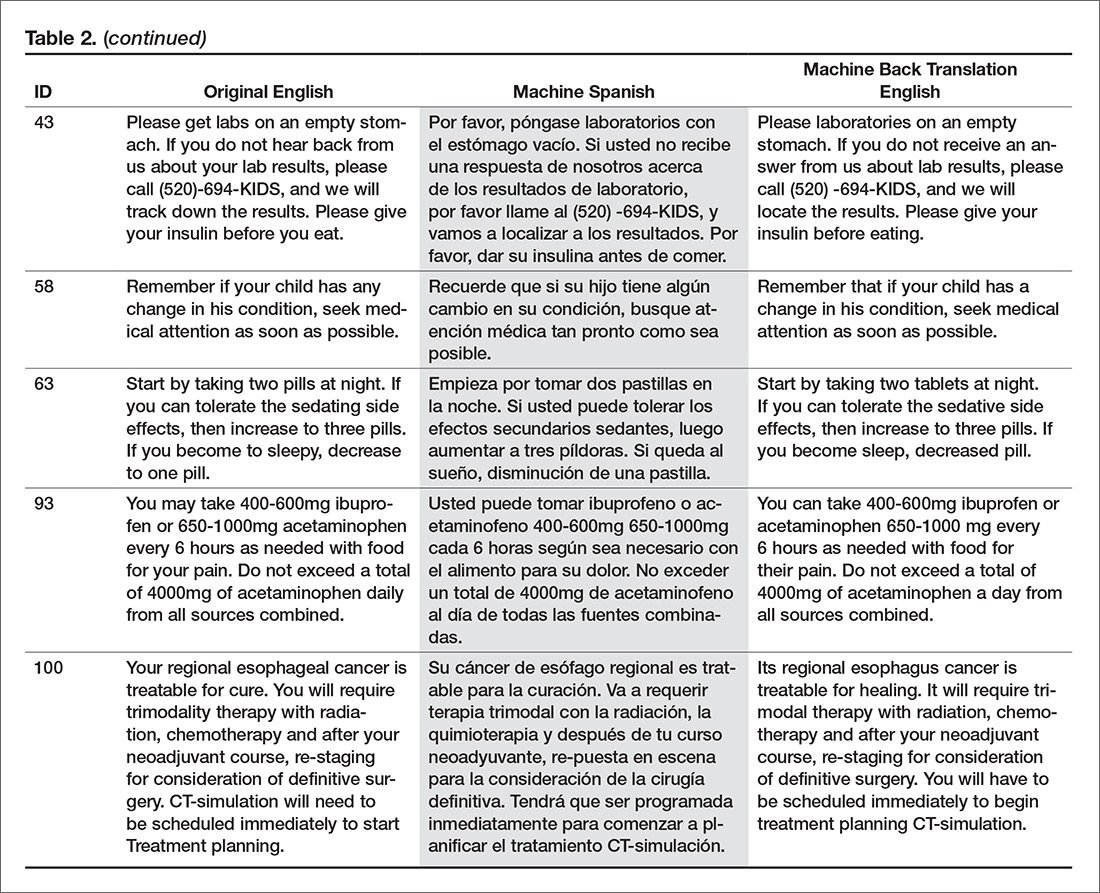
The bilingual panel identified 11 translations (either machine Spanish or MBTE) as unsafe: MS translation was unsafe for 9 items, MBTE unsafe for 5 items, with some items identified as unsafe in terms of both machine Spanish and MBTE. The original English, machine Spanish, and MBTE for these PCIs are listed in Table 2. One item (#93) revealed a machine Spanish drug dosing ambiguity that was not present in the MBTE, with safety concern expressed by 3 of 4 bilingual raters. 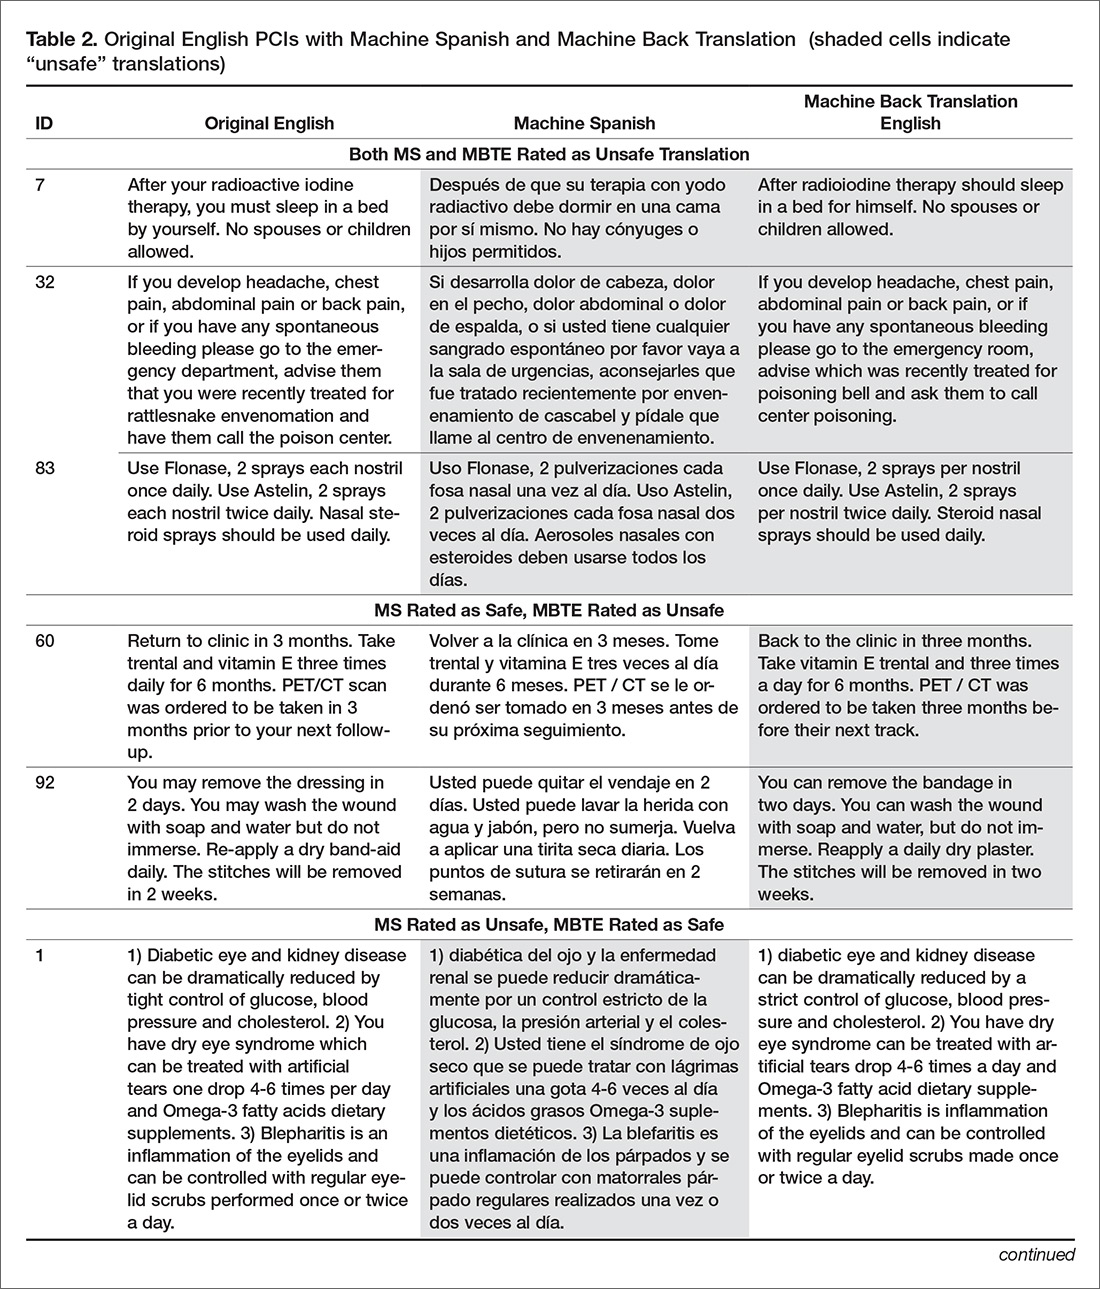
Original English c haracteristics of Unsafe Translation
A stepwise logistic regression was performed to evaluate whether characteristics of the original English text predicted the PCI being judged as having a safe or unsafe machine Spanish translation. The explanatory variables (listed in Table 1) evaluated were word count, reading grade level, inclusion of reference to a specific medication, inclusion of numbers (as in "take 2 tablets"), and inclusion of numbered statements (as in "1. Call if your cough worsens"). The stepwise selection procedure dropped number references and numbered sentences, although post hoc analysis showed that number references and medication references occurred so commonly together that they were essentially interchangeable. The final regression model included word count, reading grade level, and medication reference. The significant factors of reading grade level and medication reference had odds ratio (95% confidence interval) of 1.12 (1.01 to 1.41) and 4.91 (1.07 to 22.7) respectively (P = 0.042 each). As reading grade level includes word count per sentence and syllable count per word as linear predictors, the inclusion of word count in the model is likely to increase the discrimination of complex words of many syllables in predicting the occurrence of unsafe machine Spanish.
Quality
Bilingual and Monolingual Raters Assessments of Quality
The bilingual evaluators found similar mean quality for machine Spanish (mean 0.855, SD 0.0859) and MBTE (0.857, SD 0.0755) (P = 0.811). However, the correlation of R2=0.355 (P = 0.000) suggests that despite similarity in mean ratings, a good forward translation from original English to machine Spanish did not assure a good back translation from machine Spanish to MBTE. No difference in mean MBTE quality was identified between bilingual (0.857, SD 0.0754) and monolingual (0.852, SD 0.126) raters (P = 0.598), with correlation R2=0.565 (P = 0.000).
Discussion
In this article, we have collected a corpus of example PCIs across a large number of authors, and investigated how well Google Translate was able to translate the example instructions first to Spanish, and then back again to English. We learned that one can not always spot a problem in the intermediate Spanish by inspection of the back-translated English. We also learned that simple sentences were least likely to be associated with troublesome translations, and that specific instructions about medication usage should probably be approached with great care.
We learned that some authors readily use simple language (eg: “Have your blood work drawn in the lab in the next two weeks,” reading level 1.2) while others gravitate to very complex language (“If you develop headache, chest pain, abdominal pain or back pain, or if you have any spontaneous bleeding please go to the emergency department, advise them that you were recently treated for rattlesnake envenomation and have them call the poison center,” reading level 20.2).
The development in confidence in machine translation can be compared to development of self-driving cars. At early stages of development, the self-driving cars had drivers with a foot near the brake and hands near the steering wheel, ready to take over at any instant. Now, after much data has been collected, there is evidence that the machine may operate more predictably and safely than some human drivers [15,16]. Should the self-driving cars always have an operator behind the wheel, supervising the function of the software, and ready to take over at any instant, or is the purpose of the self-driving car to allow non-drivers to be transported in an automobile that they either cannot operate or choose not to operate at that time?
The benefit of using professional interpreters in communicating clinically significant data is unquestioned, especially when compared to ad-hoc interpreters who lack professional understanding of context [4]. Like a good human driver (as compared to a self-driving car that is operated by a program that is still learning), a qualified human translator will outperform machine translation in complex tasks. Similarly, for relatively simple translations that are meant to be generated by human speakers to be understood by individuals with a grammar school education and vocabulary, is the state of machine translation such that less human translation is now required?
Our use of 2 teams of evaluators allowed us to use the game of Telephone analogy to provide insight into how well the machine translation proceeded, first to Spanish, then back to English. Mostly (90 times in 100), an acceptable Spanish translation resulted in an acceptable English back translation. In 2 instances (Samples 7 and 32), the first translation into Spanish was unacceptable, and a subsequent translation back to English was also unacceptable, as might be expected. In 2 instances (Samples 60 and 92), the Spanish translation was acceptable, but the translation back to English was unacceptable. The rules of Telephone worked 94 times in 100.
Still, 6 times in 100, the unexpected occurred, where a relatively poor Spanish translation returned a relatively acceptable English back translation. The rules of Telephone were not followed. The Spanish in the middle was garbled, but became acceptable when translated back to English. A fluent Spanish speaker found the intermediate Spanish to be of concern, and the back translation did not identify the concern. This argues against widespread adoption of machine back translation for quality assessment, at least until better understanding of the limitations of machine back translation are better understood. Looking at examples where back translation “worked” is useful. In the 6 instances where the intermediate Spanish was judged to be unacceptable, but the English back translation acceptable, complex sentence structures were found, along with medication instructions.
Not tested was if the raters found the original English instructions to be unclear or unsafe as a starting point. Here is where we find the potential benefit of the present study, as it provides insight into the type of content that seems to translate well in this set of data. where the machine Spanish error was not present in MBTE. Overall, ratings of translation quality by bilingual and monolingual raters was high, suggesting that there may be some utility in the machine translation with safeguards other than, or in addition to, inspection of machine back translation of machine Spanish. We found there was an astonishing range in reading difficulty across the contributed samples. While the average estimated grade level for comprehension of the original English contributions was the 8th grade, the maximum was 22, indicating extreme complexity of both words used and sentence length.
In gathering the example PCIs, we did not give any additional instructions to the authors to limit complexity, we only asked for their “typical” language, and if the examples received are indeed typical, the instructions we provide are often quite complex. Wu [17] explored the readability of medical information intended for the public and found that on average, 18 years of education would be required to read and understand the clinical trial descriptions available at ClinicalTrials.gov. It seems apparent that the first step to improving the safety of machine translation is to simplify the task of the translator, by making the language that is used for translation as unambiguous and straightforward as possible. The article by Patil and Davies on the use of Google Translate in the clinic [9] generated a considerable number of rapid responses (similar to letters to the editor) [18]. The responses emphasized the need to keep the language used simple, the sentences short, and the communication direct.
A simple and straightforward suggestion to improve all patient care instructions (not just those anticipated to be translated) would be to display the Flesch-Kincaid reading level in real time as the content is generated. The computer resources required to perform reading level analysis are nearly identical to those required for real-time spell checking: a dictionary that breaks words into syllables. Showing authors the reading level in real time would provide a tool to improve all instructions, not just those intended for translation. Limiting the dictionary to specifically exclude potentially dangerous, complex, or confusing words as well as forbidden abbreviations would further identify troublesome language to the author, and would improve communication overall. Implementing such real-time feedback to authors of patient instructions is a logical next step in adding utility to the electronic health record.
It is important that culture and contextual understanding is taken into consideration while organizations use interpretation services. In the United States, federal law requires that language interpreters employed by health care organization receiving federal funds are not only bilingual but also bicultural [16]. We did not find examples of dangerous synonyms being misapplied in translation, but we cannot rule out the possibility that such errors can occur. This is beyond the scope of typical machine translation software.
Our data suggest that use of medication names and dosing frequencies should not be repeated in the PCI where confusion can arise from imprecise language translation. Translation ambiguities that generate safety concerns in PCI might be mitigated by moving such content into structured areas of the AVS.
Conclusion
This study suggests that 9 times out of 10, the quality of machine translation using Google Translate is acceptable in terms of quality and safety. Currently, machine back translation may fail to reveal a relatively poor translation from English to Spanish. This study showed that increasing sentence complexity, as measured by the reading level index, was associated with a significant (P < 0.05) increase in unsafe machine translation. Similarly, including medication instructions in machine translations were associated with increased risk (P < 0.05) of machine translation safety error in this study.
A simple way to improve communication now would be to display the reading level to authors of patient communication content in real time, and limit the dictionary of acceptable words to forbid the use of known ambiguous terms or forbidden abbreviations. This would teach authors to use simple language, and increase the chance that translation (either human or machine) would be effective. This preliminary study suggests that keeping medication dosing instructions in a structured format is advisable, as is keeping sentences simple. As with spoken language [4], starting with clear, simple to understand English instructions provides the best machine translations into Spanish.
The Clinical Machine Translation Study Group: Todd W. Altenbernd, Steven Bedrick, Mark D. Berg, Nerida Berrios, Mark A. Brown, Colleen K. Cagno, Charles B. Cairns, Elizabeth Calhoun, Raymond Carmody, Tara F. Carr, Clara Choo, Melissa L. Cox, Janiel Cragun, Rachel E.M. Cramton, Paola Davis, Archita Desai, Sarah M. Desoky, Sean Elliot, Mindi J. Fain, Albert Fiorello, Hillary Franke, Kimberly Gerhart, Victor Jose Gonzalez, Aaron John Goshinska, Lynn M. Gries, Erin M. Harvey, Karen Herbst, Elizabeth Juneman, Lauren Marie Imbornoni, Anita Koshy, Lisa Laughlin, Christina M. Laukaitis, Kwan Lee, Hong Lei, Joseph M. Miller, Prashanthinie Mohan, Wayne J. Morgan, Jarrod Mosier, Leigh A. Neumayer, Valentine Nfonsam, Vivienne Ng, Terence O'Keeffe, Merri Pendergrass, Jessie M. Pettit, John Leander Po, Claudia Marie Prospero Ponce, Sydney Rice, Marie Anoushka Ricker, Arielle E. Rubin, Robert J. Segal, Aurora A.G. Selpides, Whitney A. Smith, Jordana M. Smith, William Stevenson, Amy N. Sussman, Ole J. Thienhaus, Patrick Tsai, J. Daniel Twelker, Richard Wahl, Jillian Wang, Mingwu Wang, Samuel C. Werner, Mark D. Wheeler, Jason Wild, Sun Kun Yi, Karl Andrew Yousef, Le Yu.
Corresponding author: Joseph M. Miller, MD, MPH, Department of Ophthalmology and Vision Science, University of Arizona, 655 North Alvernon Way, Suite 108, Tucson AZ 85711, jmiller@eyes.arizona.edu.
Financial disclosures: None.
1. Hummel J, Evans P. Providing clinical summaries to patients after each office visit: a technical guide. Qualis Health 2012. Accessed 14 Mar 2016 at http://hit.qualishealth.org/sites/default/files/hit.qualishealth.org/Providing-Clinical-Summaries-0712.pdf.
2. Neuberger M, Dontje K, Holzman G, et al. Examination of office visit patient preferences for the after-visit summary (AVS). Persp Health Infor Manage 2014;11:1d.
3. Kruse CS, Bolton K, Freriks G. The effect of patient portals on quality outcomes and its implications to meaningful use: a systematic review. J Med Internet Res 2015;17:e44.
4. Schoonover, K. Using a medical interpreter with persons of limited English proficiency. J Clin Outcomes Manage 2016;23:567–75.
5. Shin HB, Bruno R. Language use and English-speaking ability: 2000. Census 2000 Brief. Accessed 9 Nov 2017 at https://census.gov/content/dam/Census/library/publications/2013/acs/acs-22.pdf.
6. Lewis MP, Simons GF, Fennig CD, editors. Ethnologue: languages of the Americas and the Pacific. 19th ed. Dallas: Sil International; 2016.
7. Pavlik V, Brown AE, Nash S, et al. Association of patient recall, satisfaction, and adherence to content of an electronic health record (EHR)-generated after visit summary: a randomized clinical trial. J Am Board Fam Med 2014;27:209–18.
8. Johnson M, Schuster M, Le QV, et al. Google’s multilingual neural machine translation system: enabling zero-shot translation. Accessed 9 Nov 2017 at https://arxiv.org/pdf/1611.04558.pdf.
9. Patil S, Davies P. Use of Google Translate in medical communication: evaluation of accuracy. BMJ 2014;349:g7392.
10. Kaliyadan F, Gopinathan Pillai S. The use of Google language tools as an interpretation aid in cross-cultural doctor-patient interaction: a pilot study. Inform Prim Care 2010;18:141–3.
11. Zhang Y, Zhou S, Zhang Z, et al. Rumor evolution in social networks. Physical Review E 2013;87.
12. Shingenobu T. Evaluation and usability of back translation for intercultural communication. In: N. Aykin, editor. Usability and internationalization. Global and local user interfaces. UI-HCII 2007, Lecture Notes in Computer Science, vol 4560. Springer, Berlin, Heidelberg.
13. Kincaid JP, Fishburne Jr RP, Rogers RL, et al. Derivation of new readability formulas (automated readability index, fog count and Flesch reading ease formula) for Navy enlisted personnel. Naval Technical Training Command Millington TN Research Branch. 1975. Accessed 7 May 2016 at http://www.dtic.mil/dtic/tr/fulltext/u2/a006655.pdf.
14. Kwiecien R, Kopp-Schneider A, Blettner M. Concordance analysis—part 16 of a series on evaluation of scientific publications. Dtsch Arztebl Int 2011;108:515–21.
15. Goodall N. Ethical decision making during automated vehicle crashes. Transportation Research Record: Journal of the Transportation Research Board 2014;2424:58–65.
16. Kalra N, Groves D. The enemy of good: estimating the cost of waiting for nearly perfect automated vehicles. Santa Monica, CA: RAND Corporation, 2017.
17. Wu DT, Hanauer DA., Mei Q, et al. Assessing the readability of ClinicalTrials.gov. J Am Med Inform Assoc 2016;23:269–75.
18. Responses to: Use of Google Translate in medical communication: evaluation of accuracy. BMJ 2014;349:g7392 Accessed 10 Dec 2017 at www.bmj.com/content/349/bmj.g7392/rapid-responses.
19. Nápoles AM, Santoyo-Olsson J, Karliner LS, et al. Inaccurate language interpretation and its clinical significance in the medical encounters of Spanish-speaking Latinos. Med Care 2015;53:940–7.
From the University of Arizona College of Medicine – Tucson, Tucson, AZ.
Abstract
- Objective: To determine predictors of quality and safety of machine translation (Google Translate) of patient care instructions (PCIs), and to determine if machine back translation is useful in quality assessment.
- Methods: 100 sample English PCIs were contributed by 88 clinical faculty. Each example PCI was up to 3 sentences of typical patient instruction that might be included in an after visit summary. Google Translate was used to first translate the English to Spanish, then back to English. A panel of 6 English/Spanish translators assessed the Spanish translations for safety and quality. A panel of 6 English-speaking health care workers assessed the back translation. A 5-point scale was used to assess quality. Safety was assessed as safe or unsafe.
- Results: Google Translate was usually (> 90%) capable of safe and comprehensible translation from English to Spanish. Instructions with incresed complexity, especially regarding medications, were prone to unsafe translation. Back translation was not reliable in detecting unsafe Spanish.
- Conclusion: Google Translate is a continuously evolving resource for clinicians that offers the promise of improved physician-patient communication. Simple declarative sentences are most reliably translated with high quality and safety.
Keywords: translation; machine translation; electronic health record; after-visit summary; patient safety; physician-patient communication.
Acore measure of the meaningful use of electronic health records incentive program is the generation and provision of the after visit summary (AVS), a mechanism for physicians to provide patients with a written summary of the patient encounter [1,2]. Although not a required element for meaningful use, free text patient care instructions (PCIs) provide the physician an opportunity to improve patient engagement either at the time of service or through the patient portal [3] by providing a short written summary of the key points of the office visit based upon the visit’s clinical discussion. For patients who do not speak English, a verbal translation service is required [4], but seldom are specific patient instructions provided in writing in the patient’s preferred language. A mechanism to improve communication might be through translation of the PCI into the patient’s preferred language. Spanish is the most common language, other than English, spoken at home in the United States [5,6]. For this reason, we chose to investigate if it is feasible to use machine translation (Google Translate) to safely and reliably translate a variety of PCIs from English to Spanish, and to assess the types of translation errors and ambiguities that might result in unsafe communication. We further investigate if machine back translation might allow the author of patient care instructions to evaluate the quality of the Spanish machine translation.
There is evidence to suggest that patient communication and satisfaction will improve if portions of the AVS are communicated in Spanish to primarily Spanish-speaking patients. Pavlik et al conducted a randomized controlled trial on the association of patient recall, satisfaction, and adherence to the information communicated in an AVS, in a largely Hispanic (61%) primary care clinic setting [7]. The AVS was provided in English. They noted that Spanish speakers wished to receive information in Spanish, although most had access to translation by a family member. They also noted that a lack of ability to provide an AVS in Spanish was a concern among providers. There was no difference in recall or satisfaction between English and Spanish speakers with respect to medications and allergies, suggesting that not all portions of the AVS might need to be translated.
Machine translation refers to the automated process of translating one language to another. The most recent methods of machine translation, as exemplified by Google Translate (Google Inc., Mountain View, CA), do not use rules of grammar and dictionaries to perform translations but instead use artificial neural networks to learn from “millions of examples” of translation [8]. However, unsupervised machine translation can result in serious errors [9]. Patil gives as an example of a serious error of translation from English (“Your child is fitting”) to Swahili (“Your child is dead”). In British parlance, “fitting” is a term for “having a seizure” and represents an example of a term that is context sensitive. However, others note that there is reason to be optimistic about the state of machine translation for biomedical text [10].
One method of assessing translation quality is through back translation, where one translator takes the author’s work into the desired target language, and then a different translator takes the target language back to the language of the author. Like the children’s game Chinese Whispers (Telephone in the United States) [11], where a “secret message” is whispered from one child to the next and spoken aloud at the end of the line of children, back translation can test to see if a message “gets through.” In this analogy, when information is machine translated from English to Spanish, and then machine translated from Spanish to English (Figure), we can compare the initial message to the final translation to see if the message “gets through.” We further investigate if machine back translation might allow a non-Spanish speaking author of PCIs to evaluate the quality of the Spanish translation.
Our intention was to determine if machine back translation [12] could be used by an English-only author to assess the quality of an intermediate Spanish translation. If poorly worded Spanish translated back into poorly worded English, the author might choose to either refine their original message until an acceptable machine back translation was achieved or to not release the Spanish translation to the patient. We were also concerned that there might be instances where the intermediate Spanish was unacceptable, but when translated back into English by machine translation, relatively acceptable English might result. If this were the case, then back translation would fail to detect a relatively poor intermediate Spanish translation.
Methods
Patient Care Instructions
Original English PCIs
Example original English PCIs were solicited from the clinical faculty and resident staff of the University of Arizona College of Medicine by an email-based survey tool (Qualtrics, Inc, Provo UT). The solicitation stated the following:
We are conducting a study to assess how well Google Translate might perform in translating patient instructions from English to Spanish. Would you please take the time to type three sentences that might comprise a typical “nugget” of patient instruction using language that you would typically include in an After Visit Summary for a patient? An example might be: “Take two Tylenol 325 mg tablets every four hours while awake for the next two days. If you have a sudden increase in pain or fever, or begin vomiting, call our office. Drink plenty of fluids.”
A total of 100 PCIs were collected. The breadth of the clinical practice and writing styles of a College of Medicine faculty are represented: not all were completely clear or were well-formed sentences, but did represent examples provided by busy clinicians of typical language that they would provide in an AVS PCI.
Machine Translation into Spanish
The 100 original English (OE) PCIs were submitted to the Google Translate web interface (https://translate.google.com/) by cutting and pasting and selecting “Spanish,” resulting in machine Spanish. The translations were performed in January 2016. No specific version number is provided by Google on their web page, and the service is described to be constantly evolving (https://translate.google.com/about/intl/en_ALL/contribute.html).
Machine Back Translation into English (MBTE)
Google Translate was then used to translate the machine Spanish back into into English. MBTE represents the content that a monolingual English speaker might use to evaluate the machine Spanish.
Ratings of Translation Quality and Safety
Two panels of 6 raters evaluated machine Spanish and MBTE quality and safety. A bilingual English/Spanish speaking panel simultaneously evaluated the machine Spanish and MBTE compared to OE, with the goal of inferring where in the process an undesirable back translation error occurred. Bilingual raters were experienced bilingual clinicians or certified translators. A monolingual English speaking panel also evaluated the MBTE (compared to OE). They could only infer the quality and safety of the machine Spanish indirectly through inspection of MBTE, and their assessment was free of the potential bias of knowledge of the intermediate Spanish translation.
The raters used Likert scales to rate grammar similarity and content similarity (scale from 1 to 5: 1 = very dissimilar, 5 = identical). For each PCI, grammar and content scores for each rater were summed and then divided by 10 to yield a within-rater quality score ranging from 0 to 1. A panel-level (bilingual or monolingual) quality score was calculated by averaging the quality scores across raters.
Safety of translation was rated as 0 or Safe (“While the translation may be awkward, it is not dangerous” or 1 or Unsafe (“A dangerous translation error is present that might cause harm to the patient if instructions were followed”). If any panel member considered an item to be unsafe, the item as a whole was scored as unsafe.
Data Analysis
Descriptive Summary of PCI Contributions
The 100 PCIs were summarized in terms of volume (word count), complexity (Flesch-Kincaid Grade Level index [13]), and content (medication names, references, formatting) (Table 1). Word count and grade level were calculated using Microsoft Word (Microsoft Corp, Redmond WA).
Safety Analysis
Concordance analysis. A safety translation concern as defined in this study (“might cause harm”) is very subjective. To reduce some of the variation in assessment of safety, we identified 4 members of the bilingual panel whose safety assessments of MBTE were most similar to the most concordant 4 monolingual raters’ assessment of MBTE safety. The goal was to select the bilingual panel of 4 that was most “typical” of the behavior of a “typical” monolingual individual with respect to assessing the safety of an individual MBTE translation. We then used this bilingual panel to identify 2 sets of “unsafe” machine Spanish and MBTE PCI translations: PCIs where ANY of the 4 bilingual raters identified a safety concern in machine Spanish or MBTE, and PCIs where MOST (at least 3) of the 4 bilingual raters agree that PCI translation was “unsafe”.
An expansion of Cohen’s kappa was used to identify the most concordant pairing of 4 bilingual panel members and 4 monolingual panel members [14]. All pairwise comparisons of monolingual and bilingual panel members were coded as follows: +1 was scored when 2 raters were concordant (both scored safe or unsafe) and –1 was scored for discordant pairs. For the 225 possible pairings of 4 panel members (15 combinations of 4 of 6 bilingual, 15 combinations of 4 of 6 monolingual raters), the 100 PCI items scores ranged from +16 (absolute agreement of the 2 panels of 4) to –16 (absolute discordance). For each pairing, we summed the scores for the 100 PCIs to determine the most concordant 4 monolingual and 4 bilingual raters (highest summed scores), which were then used for all subsequent analyses of safety and quality.
Original English characteristics of unsafe translation.
A logistic regression was performed with safety as the dependent variable (safe/unsafe defined by bilingual raters) with explanatory variables of word count, grade level, and reference to medication in OE.
Quality Assessment
Bilingual and monolingual raters assessments of translation quality. We assessed the correlation between the bilingual quality ratings of machine Spanish vs. MBTE and conducted paired t tests comparing mean bilingual machine Spanish and MBTE ratings. High correlation and absence of a significant difference in means would support the notion that MBTE could be used to reliably assess machine Spanish quality.
We also assessed the correlation between bilingual quality assessments of MS vs. monolingual raters’ assessments of MBTE, and conducted paired comparison t tests comparing bilingual machine Spanish and monolingual MBTE quality ratings. These analyses assess the ability of an English-only reader of MBTE to predict the quality of machine Spanish, as determined by a bilingual rater. High correlation and absence of a significant difference in means would support the notion that MBTE could be used by an English-only speaker to reliably assess machine Spanish quality.
Associations between original English content and translation quality. Objective measures of original English were correlated via stepwise linear regression with bilingual assessment of machine Spanish quality.
Results
PCI Contributions
Example PCIs were contributed by 88 individuals and are summarized in Table 1. The 100 original English PCIs and the machine Spanish and MBTE translations obtained via Google Translate are available from the authors upon request.
Safety
Concordance Analysis
The 6 monolingual and bilingual raters agreed on the safety of 73 MBTE PCIs. The most concordant pairings of 4 agreed on 81 items. The least and most concordant pairings had concordance values of 0.68 and 0.84, respectively. Subsequent analyses include data from only the 4 most concordant monolingual and bilingual raters.
Bilingual and Monolingual Safety Ratings
Both bilingual and monolingual raters assessed MBTE. On average, bilingual ratings of MBTE of safety were higher (0.987) than monolingual ratings (0.925) (t = –3.897, P = 0.0002).
Identification of Unsafe Translations in Machine Spanish and MBTE
The bilingual panel identified 11 translations (either machine Spanish or MBTE) as unsafe: MS translation was unsafe for 9 items, MBTE unsafe for 5 items, with some items identified as unsafe in terms of both machine Spanish and MBTE. The original English, machine Spanish, and MBTE for these PCIs are listed in Table 2. One item (#93) revealed a machine Spanish drug dosing ambiguity that was not present in the MBTE, with safety concern expressed by 3 of 4 bilingual raters.
Original English c haracteristics of Unsafe Translation
A stepwise logistic regression was performed to evaluate whether characteristics of the original English text predicted the PCI being judged as having a safe or unsafe machine Spanish translation. The explanatory variables (listed in Table 1) evaluated were word count, reading grade level, inclusion of reference to a specific medication, inclusion of numbers (as in "take 2 tablets"), and inclusion of numbered statements (as in "1. Call if your cough worsens"). The stepwise selection procedure dropped number references and numbered sentences, although post hoc analysis showed that number references and medication references occurred so commonly together that they were essentially interchangeable. The final regression model included word count, reading grade level, and medication reference. The significant factors of reading grade level and medication reference had odds ratio (95% confidence interval) of 1.12 (1.01 to 1.41) and 4.91 (1.07 to 22.7) respectively (P = 0.042 each). As reading grade level includes word count per sentence and syllable count per word as linear predictors, the inclusion of word count in the model is likely to increase the discrimination of complex words of many syllables in predicting the occurrence of unsafe machine Spanish.
Quality
Bilingual and Monolingual Raters Assessments of Quality
The bilingual evaluators found similar mean quality for machine Spanish (mean 0.855, SD 0.0859) and MBTE (0.857, SD 0.0755) (P = 0.811). However, the correlation of R2=0.355 (P = 0.000) suggests that despite similarity in mean ratings, a good forward translation from original English to machine Spanish did not assure a good back translation from machine Spanish to MBTE. No difference in mean MBTE quality was identified between bilingual (0.857, SD 0.0754) and monolingual (0.852, SD 0.126) raters (P = 0.598), with correlation R2=0.565 (P = 0.000).
Discussion
In this article, we have collected a corpus of example PCIs across a large number of authors, and investigated how well Google Translate was able to translate the example instructions first to Spanish, and then back again to English. We learned that one can not always spot a problem in the intermediate Spanish by inspection of the back-translated English. We also learned that simple sentences were least likely to be associated with troublesome translations, and that specific instructions about medication usage should probably be approached with great care.
We learned that some authors readily use simple language (eg: “Have your blood work drawn in the lab in the next two weeks,” reading level 1.2) while others gravitate to very complex language (“If you develop headache, chest pain, abdominal pain or back pain, or if you have any spontaneous bleeding please go to the emergency department, advise them that you were recently treated for rattlesnake envenomation and have them call the poison center,” reading level 20.2).
The development in confidence in machine translation can be compared to development of self-driving cars. At early stages of development, the self-driving cars had drivers with a foot near the brake and hands near the steering wheel, ready to take over at any instant. Now, after much data has been collected, there is evidence that the machine may operate more predictably and safely than some human drivers [15,16]. Should the self-driving cars always have an operator behind the wheel, supervising the function of the software, and ready to take over at any instant, or is the purpose of the self-driving car to allow non-drivers to be transported in an automobile that they either cannot operate or choose not to operate at that time?
The benefit of using professional interpreters in communicating clinically significant data is unquestioned, especially when compared to ad-hoc interpreters who lack professional understanding of context [4]. Like a good human driver (as compared to a self-driving car that is operated by a program that is still learning), a qualified human translator will outperform machine translation in complex tasks. Similarly, for relatively simple translations that are meant to be generated by human speakers to be understood by individuals with a grammar school education and vocabulary, is the state of machine translation such that less human translation is now required?
Our use of 2 teams of evaluators allowed us to use the game of Telephone analogy to provide insight into how well the machine translation proceeded, first to Spanish, then back to English. Mostly (90 times in 100), an acceptable Spanish translation resulted in an acceptable English back translation. In 2 instances (Samples 7 and 32), the first translation into Spanish was unacceptable, and a subsequent translation back to English was also unacceptable, as might be expected. In 2 instances (Samples 60 and 92), the Spanish translation was acceptable, but the translation back to English was unacceptable. The rules of Telephone worked 94 times in 100.
Still, 6 times in 100, the unexpected occurred, where a relatively poor Spanish translation returned a relatively acceptable English back translation. The rules of Telephone were not followed. The Spanish in the middle was garbled, but became acceptable when translated back to English. A fluent Spanish speaker found the intermediate Spanish to be of concern, and the back translation did not identify the concern. This argues against widespread adoption of machine back translation for quality assessment, at least until better understanding of the limitations of machine back translation are better understood. Looking at examples where back translation “worked” is useful. In the 6 instances where the intermediate Spanish was judged to be unacceptable, but the English back translation acceptable, complex sentence structures were found, along with medication instructions.
Not tested was if the raters found the original English instructions to be unclear or unsafe as a starting point. Here is where we find the potential benefit of the present study, as it provides insight into the type of content that seems to translate well in this set of data. where the machine Spanish error was not present in MBTE. Overall, ratings of translation quality by bilingual and monolingual raters was high, suggesting that there may be some utility in the machine translation with safeguards other than, or in addition to, inspection of machine back translation of machine Spanish. We found there was an astonishing range in reading difficulty across the contributed samples. While the average estimated grade level for comprehension of the original English contributions was the 8th grade, the maximum was 22, indicating extreme complexity of both words used and sentence length.
In gathering the example PCIs, we did not give any additional instructions to the authors to limit complexity, we only asked for their “typical” language, and if the examples received are indeed typical, the instructions we provide are often quite complex. Wu [17] explored the readability of medical information intended for the public and found that on average, 18 years of education would be required to read and understand the clinical trial descriptions available at ClinicalTrials.gov. It seems apparent that the first step to improving the safety of machine translation is to simplify the task of the translator, by making the language that is used for translation as unambiguous and straightforward as possible. The article by Patil and Davies on the use of Google Translate in the clinic [9] generated a considerable number of rapid responses (similar to letters to the editor) [18]. The responses emphasized the need to keep the language used simple, the sentences short, and the communication direct.
A simple and straightforward suggestion to improve all patient care instructions (not just those anticipated to be translated) would be to display the Flesch-Kincaid reading level in real time as the content is generated. The computer resources required to perform reading level analysis are nearly identical to those required for real-time spell checking: a dictionary that breaks words into syllables. Showing authors the reading level in real time would provide a tool to improve all instructions, not just those intended for translation. Limiting the dictionary to specifically exclude potentially dangerous, complex, or confusing words as well as forbidden abbreviations would further identify troublesome language to the author, and would improve communication overall. Implementing such real-time feedback to authors of patient instructions is a logical next step in adding utility to the electronic health record.
It is important that culture and contextual understanding is taken into consideration while organizations use interpretation services. In the United States, federal law requires that language interpreters employed by health care organization receiving federal funds are not only bilingual but also bicultural [16]. We did not find examples of dangerous synonyms being misapplied in translation, but we cannot rule out the possibility that such errors can occur. This is beyond the scope of typical machine translation software.
Our data suggest that use of medication names and dosing frequencies should not be repeated in the PCI where confusion can arise from imprecise language translation. Translation ambiguities that generate safety concerns in PCI might be mitigated by moving such content into structured areas of the AVS.
Conclusion
This study suggests that 9 times out of 10, the quality of machine translation using Google Translate is acceptable in terms of quality and safety. Currently, machine back translation may fail to reveal a relatively poor translation from English to Spanish. This study showed that increasing sentence complexity, as measured by the reading level index, was associated with a significant (P < 0.05) increase in unsafe machine translation. Similarly, including medication instructions in machine translations were associated with increased risk (P < 0.05) of machine translation safety error in this study.
A simple way to improve communication now would be to display the reading level to authors of patient communication content in real time, and limit the dictionary of acceptable words to forbid the use of known ambiguous terms or forbidden abbreviations. This would teach authors to use simple language, and increase the chance that translation (either human or machine) would be effective. This preliminary study suggests that keeping medication dosing instructions in a structured format is advisable, as is keeping sentences simple. As with spoken language [4], starting with clear, simple to understand English instructions provides the best machine translations into Spanish.
The Clinical Machine Translation Study Group: Todd W. Altenbernd, Steven Bedrick, Mark D. Berg, Nerida Berrios, Mark A. Brown, Colleen K. Cagno, Charles B. Cairns, Elizabeth Calhoun, Raymond Carmody, Tara F. Carr, Clara Choo, Melissa L. Cox, Janiel Cragun, Rachel E.M. Cramton, Paola Davis, Archita Desai, Sarah M. Desoky, Sean Elliot, Mindi J. Fain, Albert Fiorello, Hillary Franke, Kimberly Gerhart, Victor Jose Gonzalez, Aaron John Goshinska, Lynn M. Gries, Erin M. Harvey, Karen Herbst, Elizabeth Juneman, Lauren Marie Imbornoni, Anita Koshy, Lisa Laughlin, Christina M. Laukaitis, Kwan Lee, Hong Lei, Joseph M. Miller, Prashanthinie Mohan, Wayne J. Morgan, Jarrod Mosier, Leigh A. Neumayer, Valentine Nfonsam, Vivienne Ng, Terence O'Keeffe, Merri Pendergrass, Jessie M. Pettit, John Leander Po, Claudia Marie Prospero Ponce, Sydney Rice, Marie Anoushka Ricker, Arielle E. Rubin, Robert J. Segal, Aurora A.G. Selpides, Whitney A. Smith, Jordana M. Smith, William Stevenson, Amy N. Sussman, Ole J. Thienhaus, Patrick Tsai, J. Daniel Twelker, Richard Wahl, Jillian Wang, Mingwu Wang, Samuel C. Werner, Mark D. Wheeler, Jason Wild, Sun Kun Yi, Karl Andrew Yousef, Le Yu.
Corresponding author: Joseph M. Miller, MD, MPH, Department of Ophthalmology and Vision Science, University of Arizona, 655 North Alvernon Way, Suite 108, Tucson AZ 85711, jmiller@eyes.arizona.edu.
Financial disclosures: None.
1. Hummel J, Evans P. Providing clinical summaries to patients after each office visit: a technical guide. Qualis Health 2012. Accessed 14 Mar 2016 at http://hit.qualishealth.org/sites/default/files/hit.qualishealth.org/Providing-Clinical-Summaries-0712.pdf.
2. Neuberger M, Dontje K, Holzman G, et al. Examination of office visit patient preferences for the after-visit summary (AVS). Persp Health Infor Manage 2014;11:1d.
3. Kruse CS, Bolton K, Freriks G. The effect of patient portals on quality outcomes and its implications to meaningful use: a systematic review. J Med Internet Res 2015;17:e44.
4. Schoonover, K. Using a medical interpreter with persons of limited English proficiency. J Clin Outcomes Manage 2016;23:567–75.
5. Shin HB, Bruno R. Language use and English-speaking ability: 2000. Census 2000 Brief. Accessed 9 Nov 2017 at https://census.gov/content/dam/Census/library/publications/2013/acs/acs-22.pdf.
6. Lewis MP, Simons GF, Fennig CD, editors. Ethnologue: languages of the Americas and the Pacific. 19th ed. Dallas: Sil International; 2016.
7. Pavlik V, Brown AE, Nash S, et al. Association of patient recall, satisfaction, and adherence to content of an electronic health record (EHR)-generated after visit summary: a randomized clinical trial. J Am Board Fam Med 2014;27:209–18.
8. Johnson M, Schuster M, Le QV, et al. Google’s multilingual neural machine translation system: enabling zero-shot translation. Accessed 9 Nov 2017 at https://arxiv.org/pdf/1611.04558.pdf.
9. Patil S, Davies P. Use of Google Translate in medical communication: evaluation of accuracy. BMJ 2014;349:g7392.
10. Kaliyadan F, Gopinathan Pillai S. The use of Google language tools as an interpretation aid in cross-cultural doctor-patient interaction: a pilot study. Inform Prim Care 2010;18:141–3.
11. Zhang Y, Zhou S, Zhang Z, et al. Rumor evolution in social networks. Physical Review E 2013;87.
12. Shingenobu T. Evaluation and usability of back translation for intercultural communication. In: N. Aykin, editor. Usability and internationalization. Global and local user interfaces. UI-HCII 2007, Lecture Notes in Computer Science, vol 4560. Springer, Berlin, Heidelberg.
13. Kincaid JP, Fishburne Jr RP, Rogers RL, et al. Derivation of new readability formulas (automated readability index, fog count and Flesch reading ease formula) for Navy enlisted personnel. Naval Technical Training Command Millington TN Research Branch. 1975. Accessed 7 May 2016 at http://www.dtic.mil/dtic/tr/fulltext/u2/a006655.pdf.
14. Kwiecien R, Kopp-Schneider A, Blettner M. Concordance analysis—part 16 of a series on evaluation of scientific publications. Dtsch Arztebl Int 2011;108:515–21.
15. Goodall N. Ethical decision making during automated vehicle crashes. Transportation Research Record: Journal of the Transportation Research Board 2014;2424:58–65.
16. Kalra N, Groves D. The enemy of good: estimating the cost of waiting for nearly perfect automated vehicles. Santa Monica, CA: RAND Corporation, 2017.
17. Wu DT, Hanauer DA., Mei Q, et al. Assessing the readability of ClinicalTrials.gov. J Am Med Inform Assoc 2016;23:269–75.
18. Responses to: Use of Google Translate in medical communication: evaluation of accuracy. BMJ 2014;349:g7392 Accessed 10 Dec 2017 at www.bmj.com/content/349/bmj.g7392/rapid-responses.
19. Nápoles AM, Santoyo-Olsson J, Karliner LS, et al. Inaccurate language interpretation and its clinical significance in the medical encounters of Spanish-speaking Latinos. Med Care 2015;53:940–7.
Evaluation of an Enhanced Discharge Summary Template: Building a Better Handoff Document
From the Department of Internal Medicine, University of Nebraska Medical Center, Omaha, NE.
Abstract
- Objective: To design and implement an enhanced discharge summary for use by internal medicine providers and evaluate its impact.
- Methods. Pre/post-intervention study in which discharge summaries created in the 3 months before (n = 57) and 3 months after (n = 57) introduction of an enhanced discharge summary template were assessed using a 24-item scoring instrument. Measures evaluated included a composite discharge summary quality score, individual content item scores, global rating score, redundant documentation of consultants and procedures, documentation of non-active conditions, discharge summary word count, and time to completion. Physician satisfaction with the enhanced discharge summary was evaluated by survey.
- Results: The composite discharge summary quality score increased following the intervention (19.07 vs. 13.37, P < 0.001). Ten items showed improved documentation, including documented need for follow-up tests, cognitive status, code status, and communication with the next provider. The global rating score improved from 3.04 to 3.46 (P = 0.01). Discharge summary word count decreased from 717 to 701 (P = 0.002), with no change in the time to discharge summary completion. Surveyed physicians reported improved satisfaction with the enhanced discharge summary compared with the prior template.
- Conclusion: An enhanced discharge summary, designed to serve as a handoff between inpatient and outpatient providers, improved quality without negative effects on document length, time to completion, or physician satisfaction.
Patient safety is often compromised during the transition period following an acute hospitalization. Half of patients may experience an error related to discontinuity of care between inpatient and outpatient providers [1], frequently resulting in preventable adverse events [2,3]. The discharge summary document serves as the primary and often only method of communication between inpatient and outpatient providers [4,5]. Despite its intended purpose, the discharge summary is frequently unavailable at the time of post-discharge clinic visits [4,6,7]. Even when available, the traditional discharge summary may have limited effectiveness as a handoff document due to disorganization or excessive length [8–11].
The Joint Commission requires that a minimum set of elements are documented in every discharge summary, including reason for hospitalization, significant findings, procedures and treatment provided, discharge condition, patient and family instructions, and medication reconciliation [12]. Unfortunately, the required components fail to address many of the complexities encountered in the discharge process and have not adapted to changes in health care delivery. Discharge summary elements related to patients’ future care plans are often inaccurate or omitted [13], including pending diagnostic tests [14–17], recommended outpatient evaluations [18], pertinent discharge condition information [19], and medication changes [1,20,21].
In 2007, the Transitions of Care Consensus Conference made recommendations to address quality gaps in care transitions from inpatient to outpatient settings. This policy statement recommended the adoption of standard discharge summary templates and provided guidance on the addition of specific data elements, including patients’ preferences and goals and clear delineation of care responsibility during the transition period [22]. The use of note templates within the electronic health record (EHR) may help prevent omission of certain data elements [23,24], but inclusion of higher-level management information may require that health providers rethink the function and structure of the discharge summary. Rather than a “captain’s log” narrative of inpatient events, the discharge summary should be considered a handoff document, meant to communicate “a strategic plan for future care. . .lessons learned. . .unresolved issues, and include a projection of how the author believes patients’ clinical condition will evolve over time” [25].
We created and implemented an evidence-based, enhanced discharge summary template to serve as a practical handoff document between inpatient and outpatient providers. This article reports on the evaluation of the enhanced discharge summary in comparison to a traditional discharge summary template.
Methods
Setting
The intervention took place within the inpatient internal medicine service at a 621-bed academic medical center. The internal medicine service includes teaching and non-teaching teams that collectively discharge approximately 4700 patients per year. Approximately 40 staff physicians and 75 residents per year rotate on the inpatient service. The hospital system uses an EHR that supports all clinical activities, including documentation and physician order entry. The EHR also automatically faxes discharge summaries to the primary care physician (PCP) of record when finalized by the inpatient provider. Prior to the intervention, a default discharge summary template was used throughout the hospital system. No formal education on discharge summary composition was provided to inpatient providers or residents prior to this project. This research project was approved by the university institutional review board and was performed without external funding.
Template Redesign
The project was initiated by 2 hospital medicine physicians (CJS and MB) who recruited volunteer representatives from key stakeholder groups to participate in a quality improvement project. The final template redesign team was made up of 4 hospital medicine physicians, 2 ambulatory clinic physicians, 1 internal medicine chief resident, and 1 second-year internal medicine house officer. Two of the physicians (MB and AV) were the departmental EHR champions, serving as the liaisons between providers and EHR technology support/administration. Hospital administration provided analytics and EHR build-support. The team created an enhanced discharge summary template based on recommendations from professional societies [22,26] and published literature [25,27]. We made 4 key changes to the existing discharge summary template.
First, we added a section to the template that listed information crucial to follow-up care needs: tests needed after discharge and provider responsible for follow-up, pending labs at the time of discharge and provider responsible for follow-up, and follow-up appointment information. Provider feedback suggested these elements were frequently omitted or difficult to locate within the body of the discharge summary, so this section was prioritized at the top of the template. To stress the importance of direct communication, we added a heading asking for documentation of contact with the PCP.
Second, in recognition of the increasingly complicated condition of many of our discharging patients, we introduced subheadings and menus that addressed specific elements of patient condition, including cognitive status, indwelling lines and catheters, and activity level at discharge.
Third, a menu-supported section on advance care planning was added that included both code status and an outline of goals-of-care discussions that occurred during the hospitalization.
Finally, we made the template well-organized and succinct. The stand-alone diagnosis list from the pre-intervention template was eliminated and incorporated as part of the problem-based hospital course. In addition, EHR enhancements were introduced to minimize repetition in the lists of consultants, procedures, and chronic medical conditions. We added discrete, prioritized headings with drop down menus and minimized redundancies found in the prior generic template. For example, auto-populated information in the prior default discharge summary included redundant and clinically irrelevant consultants (eg, multiple listings for pharmacy consultation), procedures (eg, recurring hemodialysis encounters), and stable, chronic conditions (eg, hyperlipidemia) that lengthened the discharge summary without adding to its function as a handoff document.
The template was pilot-tested for 2 weeks with teaching and non-teaching teams. A focus group of 5 inpatient providers gave feedback via semi-structured interviews. The research team also solicited unstructured feedback from hospital medicine providers during a required standing administrative meeting. These suggestions informed revisions to the enhanced discharge summary, which was then made the default option for all internal medicine providers.
Education
A 30-minute educational session was developed and delivered by the authors. The objectives of the didactic portion were to describe how discharge summaries can impact patient care, understand how discharge summaries serve as a handoff document, list the components of an effective discharge summary, and describe strategies to avoid common errors in writing discharge summaries. The session included a review of pertinent literature [1,12,13,21], an outline of discharge summary best-practices [22,25], and an introduction to the new template. Trainers reviewed strategies for keeping the discharge summary concise, including using problem-based formatting, focusing on active hospital problems, and eliminating unnecessary or redundant information. Participants were encouraged to complete their discharge summaries and directly contact outpatient providers within 24 hours of discharge. Following the didactic session, participants critically reviewed an example discharge summary and discussed what was done well, what was done poorly, and what strategies they would have used to make it a more effective handoff document. Residents rotating on the inpatient internal medicine services received the education during their mandatory monthly orientation. Faculty physicians were provided the education at a required section meeting.
Quality Scoring of Discharge Summaries and Analysis
To evaluate the quality of discharge summaries, we developed a scoring instrument to measure inclusion of 24 key elements (Table 1). The scoring instrument (available from the authors) was pilot tested by 4 general internal medicine physicians on 5 sample discharge summaries. After independent scoring, this group met with members of the research team to provide feedback. Iterative revisions were made to the scoring instrument until scorers reached consensus in their understanding and application of the scoring instrument. Each discharge summary received a quality score from 0 to 24, based on the number of elements found to be present. Secondary quality metrics included a global quality rating using a 1 to 5 scale (described in Results); frequency of redundant documentation of consultants and procedures; frequency of documentation of non-active, chronic conditions; the length of the discharge summary (total word count); and time to completion. 
We analyzed a sample of discharge summaries completed during the 3-month period prior to the intervention and the 3-month period following the intervention. A non-stratified random technique was employed by an independent party to generate discharge summary samples from the EHR. Living patients discharged from the internal medicine services after an inpatient admission of at least 48 hours were eligible for inclusion. Each discharge summary was scored by 2 general internal medicine physicians. Each scoring dyad comprised one of the authors paired with a volunteer non–research team member who scored discharge summaries independently. Discordant results were examined by the dyad and settled by consensus.
Physician Survey
We surveyed inpatient and outpatient physicians to determine their views about discharge summaries and their views about the template before and after the intervention. Respondents were asked to indicate to what degree they agreed with statements using a 5-point Likert scale. An email containing a consent cover letter and a link to an anonymous online survey was sent to residents rotating on internal medicine services during the study period and all hospital medicine faculty. Outpatient providers affiliated with the hospital system were sent the survey if they had received at least 5 discharge summaries from the internal medicine services over the preceding 6 months. Post-intervention surveys were timed to capture responses after an adequate exposure to the enhanced discharge summary template. Inpatient physicians were re-surveyed 3 months after introduction of the enhanced discharge summary and outpatient providers were re-surveyed after 1 year.
Statistical Analysis
We reviewed 10 pre-intervention discharge summaries to estimate baseline discharge summary quality scores. Anticipating a two-fold improvement following the intervention [24], we calculated a goal sample size of 108 discharge summaries (54 pre- and 54 post-intervention) assuming alpha of 0.05 and 80% power using a two-tailed chi-square test. Expecting that some discharge summaries may not meet our inclusion criteria, 114 summaries (57 pre- and 57 post-intervention) were included in the final sample. All analyses were performed on Stata v10.1 (StataCorp; College Station, TX).
For discharge summary quality scoring, inter-rater reliability was measured by calculating the kappa statistic and percent agreement for scoring elements. Chi-square analysis was used to compare individual scoring elements before and after the intervention when the sample size was 5 or greater. Fisher’s exact test was used when the sample size was less than 5. Counts, including number of inactive diagnoses, redundant consults, redundant procedures, and total words were compared using univariate Poisson regression. Wilcoxon rank sum analysis was utilized to compare pre-intervention to post-intervention composite scores and global scores. Patient and provider characteristics were compared using the t-test, chi-square test, Fisher’s exact test, or Wilcoxon rank sum, as appropriate.
For the surveys, pre-intervention and post-intervention matched pairs were compared. Likert score responses were analyzed using the Wilcoxon signed-rank test.
Results
Discharge Summary Quality Scores
Characteristics of the pre- and post-intervention discharge summaries are displayed in Table 2. Both samples were similar with respect to patient demographics, length of stay, medical complexity, and provider characteristics. The mean composite discharge summary quality score improved from 13.4 at baseline to 19.1 in the post-intervention sample (P < 0.001) (Table 3). Ten of 24 quality elements exhibited significant improvement following the intervention, but 3 items were documented less often after the intervention (Table 3). 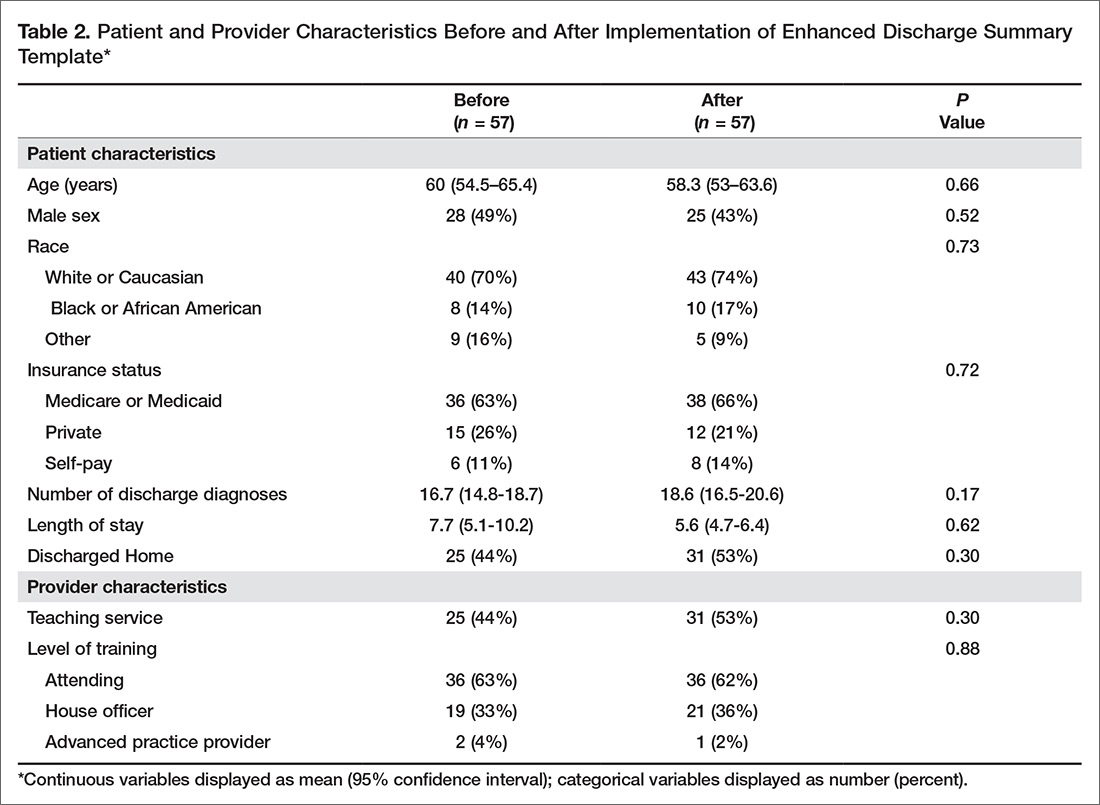
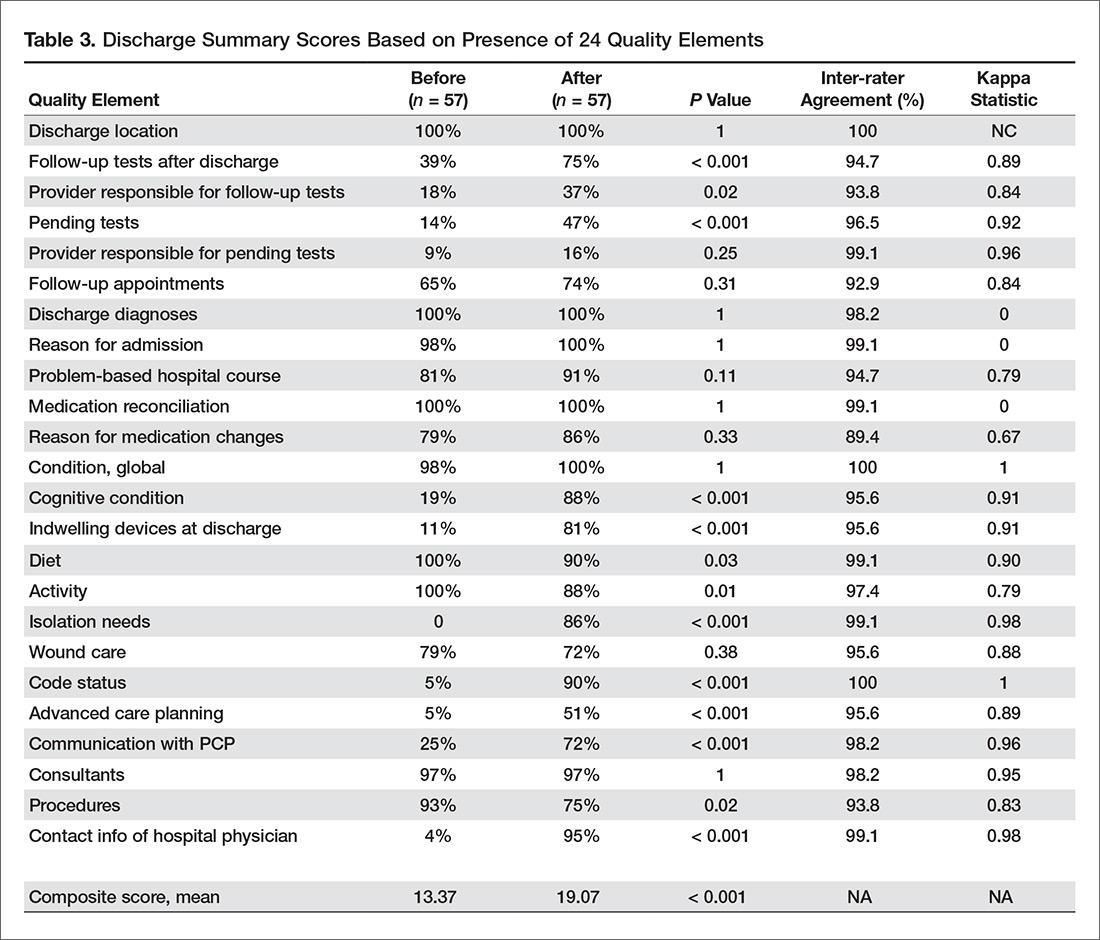
The global rating of discharge summary quality improved from 3.04 to 3.46 (P = 0.010) (Table 4). Documentation of superfluous and redundant information decreased in the 3 areas evaluated: number of non-active, chronic diagnoses (2.33 to 1.35, P < 0.001), redundant consults (1.4 to 0.09, P < 0.001), and redundant procedures (0.74 to 0.26, P < 0.001). Inter-rater reliability was generally high for individual items, although kappa score was not calculable in one case and scores of zero were obtained for 3 highly concordant items. Inter-rater reliability was moderate for global rating (kappa = 0.59). The overall length of discharge summaries decreased from 717 to 701 words (P = 0.002). There was no significant change in time to discharge summary completion following the intervention (10.9 hours pre-intervention vs. 14.5 post-intervention, P = 0.605) (Table 4). 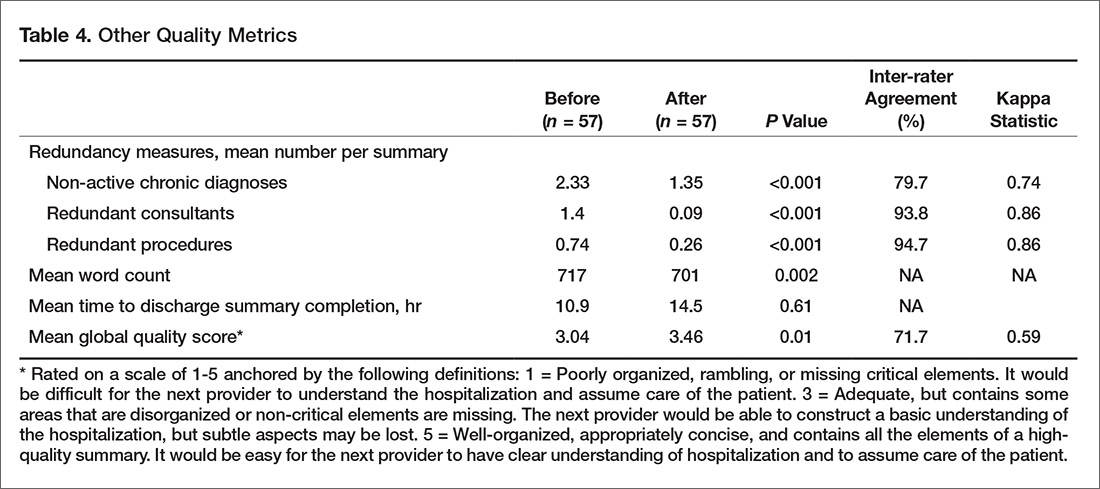
Survey Results
The inpatient provider response rate for the pre-intervention survey was 51/86 (59%) and 33/65 (51%) for the post-intervention survey, resulting in 21 paired responses. House officers represented the majority of paired respondents (14/21, 66%) with hospitalist faculty making up the remainder. Among outpatient physicians, the pre-intervention response rate was 19/25 (76%) and the post-intervention rate was 20/25 (80%), resulting in 16 paired responses. Half (8/16) of outpatient physicians provided only outpatient care, the other half practicing in a traditional model, providing both inpatient and outpatient care. Nearly half (7/16) had been in practice for over 15 years. Inpatient physicians’ agreement with all 4 statements related to discharge summary quality improved, including their perception of discharge summary effectiveness as a handoff document (P = 0.004). Inpatient providers estimated that the enhanced discharge summary took significantly less time to complete (19.3 vs. 24.6 minutes, P = 0.043). Outpatient providers’ perceptions of discharge summary quality trended toward improvement but did not reach statistical significance (Table 5). 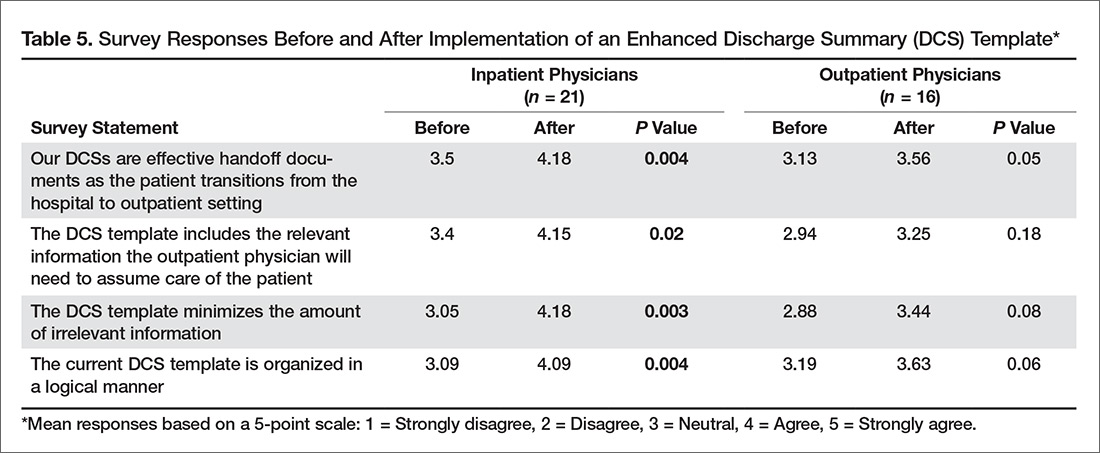
Discussion
We found that a restructured note template in combination with physician education can improve discharge summary quality without sacrificing timeliness of note completion, document length, or physician satisfaction. The Joint Commission requires that discharge summaries include condition at discharge, but global assessments such as “good” or “stable” provide little clinically meaningful information to the next provider. Through our enhanced discharge summary we were able to significantly improve communication of several more specific elements relevant to discharge condition, including cognitive status. Similar to prior studies [7,13], cognitive condition was rarely documented prior to our intervention, but improved to 88% after introduction of the enhanced discharge summary. This is especially important, as we found that 25% of the post-intervention patients had a cognitive deficit at discharge. This information is critical for the next provider, who assumes responsibility for monitoring the patient’s trajectory.
Similarly, we improved the inclusion of patient preferences regarding advanced care planning. Whereas code status was rarely included the pre-intervention discharge summaries, we found that 1 in 5 patients in the post-intervention group did not want cardiopulmonary resuscitation. Beyond code status, we were also able to improve documentation of other advanced care conversations, such as end-of-life planning and power-of-attorney assignment. These conversations are increasingly common in the inpatient setting [28] but inconsistently documented [29,30].
To encourage inpatient-outpatient provider communication, the enhanced discharge summary template prompted documentation of communication with the PCP, with a resultant improvement from 25% to 72% (P < 0.001). The template also increased documentation of contact information for the hospital provider from 4% to 95% (P < 0.001). This improvement is notable, as hospital and outpatient physicians communicate infrequently [4,5], despite the fact that direct, “high-touch” communication is often preferred [10,11].
Our intervention builds upon prior research [23,24,31] through its deliberate focus on template formatting, evaluation of comprehensive clinical data elements using clearly defined scoring criteria, inclusion of teaching and non-teaching inpatient services, and assessment of inpatient and outpatient provider satisfaction. By restructuring the enhanced discharge summary template, we were able to improve documentation of clinical information, patient preferences, and physician communication, while keeping notes concise, prioritized, and timely. This restructuring included re-ordering information within the note, adding clear headings, devising intuitive drop-down menus, and removing unnecessary information. The amount of redundant information, document length, and perceived time required to write the discharge summary improved in the post-intervention period. Finally, our intervention was carried out with few resources and without financial incentives.
Although we found overall improvements following our intervention, there were several notable exceptions. Three content areas that were routinely documented in the pre-intervention period showed significant declines in the post-intervention phase: diet, activity, and procedures. Additionally, despite improvements in the post-intervention group, certain elements continued to be unreliably communicated in the discharge summary. Sporadic inclusion of pending tests (47%) was a particularly concerning finding. One possible explanation is that the addition of new elements and a focus on concise documentation encouraged physicians to skip or delete these areas of the enhanced discharge summary. It is also possible that reliance on drop-down menus and manual text entry, rather than auto-populated data, contributed to these deficits. As organizations re-design their electronic note templates, they should consider different content importing options [32] based on local institutional needs, culture, and EHR capabilities [33].
This study had several limitations. It was conducted at a single academic institution, so findings may not be generalizable to other settings. Although the magnitude and specificity of many of the measured outcomes suggests they were caused by the intervention, our pre/post study design cannot rule out the possibility that time-varying factors other than the intervention may have influenced our findings. We also used a novel scoring instrument, as a psychometrically tested discharge summary scoring instrument was not available at the time of the study [34]. Because it was based on similar concepts and evidence, the scoring instrument mirrored the data elements included in the intervention, which may have biased our results away from the null. However, the global rating score, which provided an overall appraisal of discharge summary quality unrelated to specific elements of the intervention, also showed significant improvement following the intervention. The distinct formatting of pre- and post-intervention templates meant that scorers were not blinded, thus making social desirability bias a possibility. We attempted to minimize the risk for bias by having all discharge summaries scored by 2 scorers, including one physician who was not a member of the research team. Small sample sizes, particularly with regard to the outpatient survey, may have contributed to type II errors. Additionally, although the discharge summary education was delivered during required meetings, we did not track attendance, so we were unable analyze for differences between providers who received the education and those that did not. Finally, while we evaluated discharge summaries for inclusion of key information, we did not perform chart reviews or contact PCPs to confirm the accuracy of documented information. Future study should evaluate the sustainability of our intervention and its impact on patient-level outcomes.
In conclusion, we found that revising our electronic template to better function as a handoff document could improve discharge summary quality. While most content areas evaluated showed improvement, there were several elements that were negatively impacted. Hospitals should be deliberate when reformatting their discharge summary templates so as to balance the need for efficient, manageable template navigation with accurate, complete, and necessary information.
Corresponding author: Christopher J. Smith, MD, 986430 Nebraska Medical Center Omaha, NE 68198-6430 Email: csmithj@unmc.edu.
Financial disclosures: None.
1. Moore C, Wisnivesky J, Williams S, McGinn T. Medical errors related to discontinuity of care from an inpatient to an outpatient setting. J Gen Intern Med 2003;18:646–51.
2. Forster AJ, Murff HJ, Peterson JF, et al. The incidence and severity of adverse events affecting patients after discharge from the hospital. Ann Intern Med 2003;138:161–7.
3. Forster AJ, Murff HJ, Peterson JF, et al. Adverse drug events occurring following hospital discharge. J Gen Intern Med 2005;20:317–23.
4. Kripalani S, LeFevre F, Phillips CO, et al. Deficits in communication and information transfer between hospital-based and primary care physicians: implications for patient safety and continuity of care. JAMA 2007;297:831–41.
5. Bell CM, Schnipper JL, Auerbach AD, et al. Association of communication between hospital-based physicians and primary care providers with patient outcomes. J Gen Intern Med 2009;24:381–6.
6. van Walraven C, Seth R, Austin PC, Laupacis A. Effect of discharge summary availability during post-discharge visits on hospital readmission. J Gen Intern Med 2002;17:186-92.
7. Horwitz LI, Jenq GY, Brewster UC, et al. Comprehensive quality of discharge summaries at an academic medical center. J Hosp Med 2013;8:436–43.
8. van Walraven C, Rokosh E. What is necessary for high-quality discharge summaries? Am J Med Qual 1999;14:160–9.
9. van Walraven C, Duke SM, Weinberg AL, Wells PS. Standardized or narrative discharge summaries. Which do family physicians prefer? Can Fam Physician 1998;44:62–9.
10. Sheu L, Fung K, Mourad M, et al. We need to talk: Primary care provider communication at discharge in the era of a shared electronic medical record. J Hosp Med 2015;10:307–10.
11. Jones CD, Vu MB, O’Donnell CM, et al. A failure to communicate: a qualitative exploration of care coordination between hospitalists and primary care providers around patient hospitalizations. J Gen Intern Med 2015;30:417–24.
12. Kind AJH, Smith MA. Documentation of mandated discharge summary components in transitions from acute to subacute care. In: Henriksen K, Battles JB, Keyes MA, Grady ML, editors. Advances in patient safety: new directions and alternative approaches (Vol 2: Culture and Redesign). Rockville, MD: Agency for Healthcare Quality and Research; 2008.
13. Kind AJ, Thorpe CT, Sattin JA, et al. Provider characteristics, clinical-work processes and their relationship to discharge summary quality for sub-acute care patients. J Gen Intern Med 2012;27:78–84.
14. Roy CL, Poon EG, Karson AS, et al. Patient safety concerns arising from test results that return after hospital discharge. Ann Intern Med 2005;143:121–8.
15. Were MC, Li X, Kesterson J, et al. Adequacy of hospital discharge summaries in documenting tests with pending results and outpatient follow-up providers. J Gen Intern Med 2009;24:1002–6.
16. Walz SE, Smith M, Cox E, et al. Pending laboratory tests and the hospital discharge summary in patients discharged to sub-acute care. J Gen Intern Med 2011;26:393–8.
17. Kantor MA, Evans KH, Shieh L. Pending studies at hospital discharge: a pre-post analysis of an electronic medical record tool to improve communication at hospital discharge. J Gen Intern Med 2015;30:312–8.
18. Moore C, McGinn T, Halm E. Tying up loose ends: discharging patients with unresolved medical issues. Arch Intern Med 2007;167:1305–11.
19. Al-Damluji MS, Dzara K, Hodshon B, et al. Hospital variation in quality of discharge summaries for patients hospitalized with heart failure exacerbation. Circulation Cardiovasc Qual Outcomes 2015;8:77–86.
20. Coleman EA, Smith JD, Raha D, Min SJ. Posthospital medication discrepancies: prevalence and contributing factors. Arch Intern Med 2005;165:1842–7.
21. Lindquist LA, Yamahiro A, Garrett A, et al. Primary care physician communication at hospital discharge reduces medication discrepancies. J Hosp Med 2013;8:672–7.
22. Snow V, Beck D, Budnitz T, et al. Transitions of care consensus policy statement: American College of Physicians, Society of General Internal Medicine, Society of Hospital Medicine, American Geriatrics Society, American College of Emergency Physicians, and Society for Academic Emergency Medicine. J Hosp Med 2009;4:364–70.
23. O’Leary KJ, Liebovitz DM, Feinglass J, et al. Creating a better discharge summary: improvement in quality and timeliness using an electronic discharge summary. J Hosp Med 2009;4:219–25.
24. Bischoff K, Goel A, Hollander H, et al. The Housestaff Incentive Program: improving the timeliness and quality of discharge summaries by engaging residents in quality improvement. BMJ Qual Safety 2013;22:768–74.
25. Lenert LA, Sakaguchi FH, Weir CR. Rethinking the discharge summary: a focus on handoff communication. Acad Med 2014;89:393–8.
26. Halasyamani L, Kripalani S, Coleman E, et al. Transition of care for hospitalized elderly patients--development of a discharge checklist for hospitalists. J Hosp Med 2006;1:354–60.
27. Kripalani S, Jackson AT, Schnipper JL, Coleman EA. Promoting effective transitions of care at hospital discharge: a review of key issues for hospitalists. J Hosp Med 2007;2:314–23.
28. Huijberts S, Buurman BM, de Rooij SE. End-of-life care during and after an acute hospitalization in older patients with cancer, end-stage organ failure, or frailty: A sub-analysis of a prospective cohort study. Palliat Med 2016;30:75–82.
29. Butler J, Binney Z, Kalogeropoulos A, et al. Advance directives among hospitalized patients with heart failure. JACC Heart Fail 2015;3:112–21.
30. Oulton J, Rhodes SM, Howe C, et al. Advance directives for older adults in the emergency department: a systematic review. J Palliat Med 2015;18:500–5.
31. Shaikh U, Slee C. Triple duty: integrating graduate medical education with maintenance of board certification to improve clinician communication at hospital discharge. J Grad Med Educ 2015;7:462–5.
32. Weis JM, Levy PC. Copy, paste, and cloned notes in electronic health records: prevalence, benefits, risks, and best practice recommendations. Chest 2014;145:632–8.
33. Dixon DR. The behavioral side of information technology. Int J Med Inform 1999;56:117–23.
34. Hommos MS, Kuperman EF, Kamath A, Kreiter CD. The development and evaluation of a novel instrument assessing residents’ discharge summaries. Acad Med 2017;92:550–5.
From the Department of Internal Medicine, University of Nebraska Medical Center, Omaha, NE.
Abstract
- Objective: To design and implement an enhanced discharge summary for use by internal medicine providers and evaluate its impact.
- Methods. Pre/post-intervention study in which discharge summaries created in the 3 months before (n = 57) and 3 months after (n = 57) introduction of an enhanced discharge summary template were assessed using a 24-item scoring instrument. Measures evaluated included a composite discharge summary quality score, individual content item scores, global rating score, redundant documentation of consultants and procedures, documentation of non-active conditions, discharge summary word count, and time to completion. Physician satisfaction with the enhanced discharge summary was evaluated by survey.
- Results: The composite discharge summary quality score increased following the intervention (19.07 vs. 13.37, P < 0.001). Ten items showed improved documentation, including documented need for follow-up tests, cognitive status, code status, and communication with the next provider. The global rating score improved from 3.04 to 3.46 (P = 0.01). Discharge summary word count decreased from 717 to 701 (P = 0.002), with no change in the time to discharge summary completion. Surveyed physicians reported improved satisfaction with the enhanced discharge summary compared with the prior template.
- Conclusion: An enhanced discharge summary, designed to serve as a handoff between inpatient and outpatient providers, improved quality without negative effects on document length, time to completion, or physician satisfaction.
Patient safety is often compromised during the transition period following an acute hospitalization. Half of patients may experience an error related to discontinuity of care between inpatient and outpatient providers [1], frequently resulting in preventable adverse events [2,3]. The discharge summary document serves as the primary and often only method of communication between inpatient and outpatient providers [4,5]. Despite its intended purpose, the discharge summary is frequently unavailable at the time of post-discharge clinic visits [4,6,7]. Even when available, the traditional discharge summary may have limited effectiveness as a handoff document due to disorganization or excessive length [8–11].
The Joint Commission requires that a minimum set of elements are documented in every discharge summary, including reason for hospitalization, significant findings, procedures and treatment provided, discharge condition, patient and family instructions, and medication reconciliation [12]. Unfortunately, the required components fail to address many of the complexities encountered in the discharge process and have not adapted to changes in health care delivery. Discharge summary elements related to patients’ future care plans are often inaccurate or omitted [13], including pending diagnostic tests [14–17], recommended outpatient evaluations [18], pertinent discharge condition information [19], and medication changes [1,20,21].
In 2007, the Transitions of Care Consensus Conference made recommendations to address quality gaps in care transitions from inpatient to outpatient settings. This policy statement recommended the adoption of standard discharge summary templates and provided guidance on the addition of specific data elements, including patients’ preferences and goals and clear delineation of care responsibility during the transition period [22]. The use of note templates within the electronic health record (EHR) may help prevent omission of certain data elements [23,24], but inclusion of higher-level management information may require that health providers rethink the function and structure of the discharge summary. Rather than a “captain’s log” narrative of inpatient events, the discharge summary should be considered a handoff document, meant to communicate “a strategic plan for future care. . .lessons learned. . .unresolved issues, and include a projection of how the author believes patients’ clinical condition will evolve over time” [25].
We created and implemented an evidence-based, enhanced discharge summary template to serve as a practical handoff document between inpatient and outpatient providers. This article reports on the evaluation of the enhanced discharge summary in comparison to a traditional discharge summary template.
Methods
Setting
The intervention took place within the inpatient internal medicine service at a 621-bed academic medical center. The internal medicine service includes teaching and non-teaching teams that collectively discharge approximately 4700 patients per year. Approximately 40 staff physicians and 75 residents per year rotate on the inpatient service. The hospital system uses an EHR that supports all clinical activities, including documentation and physician order entry. The EHR also automatically faxes discharge summaries to the primary care physician (PCP) of record when finalized by the inpatient provider. Prior to the intervention, a default discharge summary template was used throughout the hospital system. No formal education on discharge summary composition was provided to inpatient providers or residents prior to this project. This research project was approved by the university institutional review board and was performed without external funding.
Template Redesign
The project was initiated by 2 hospital medicine physicians (CJS and MB) who recruited volunteer representatives from key stakeholder groups to participate in a quality improvement project. The final template redesign team was made up of 4 hospital medicine physicians, 2 ambulatory clinic physicians, 1 internal medicine chief resident, and 1 second-year internal medicine house officer. Two of the physicians (MB and AV) were the departmental EHR champions, serving as the liaisons between providers and EHR technology support/administration. Hospital administration provided analytics and EHR build-support. The team created an enhanced discharge summary template based on recommendations from professional societies [22,26] and published literature [25,27]. We made 4 key changes to the existing discharge summary template.
First, we added a section to the template that listed information crucial to follow-up care needs: tests needed after discharge and provider responsible for follow-up, pending labs at the time of discharge and provider responsible for follow-up, and follow-up appointment information. Provider feedback suggested these elements were frequently omitted or difficult to locate within the body of the discharge summary, so this section was prioritized at the top of the template. To stress the importance of direct communication, we added a heading asking for documentation of contact with the PCP.
Second, in recognition of the increasingly complicated condition of many of our discharging patients, we introduced subheadings and menus that addressed specific elements of patient condition, including cognitive status, indwelling lines and catheters, and activity level at discharge.
Third, a menu-supported section on advance care planning was added that included both code status and an outline of goals-of-care discussions that occurred during the hospitalization.
Finally, we made the template well-organized and succinct. The stand-alone diagnosis list from the pre-intervention template was eliminated and incorporated as part of the problem-based hospital course. In addition, EHR enhancements were introduced to minimize repetition in the lists of consultants, procedures, and chronic medical conditions. We added discrete, prioritized headings with drop down menus and minimized redundancies found in the prior generic template. For example, auto-populated information in the prior default discharge summary included redundant and clinically irrelevant consultants (eg, multiple listings for pharmacy consultation), procedures (eg, recurring hemodialysis encounters), and stable, chronic conditions (eg, hyperlipidemia) that lengthened the discharge summary without adding to its function as a handoff document.
The template was pilot-tested for 2 weeks with teaching and non-teaching teams. A focus group of 5 inpatient providers gave feedback via semi-structured interviews. The research team also solicited unstructured feedback from hospital medicine providers during a required standing administrative meeting. These suggestions informed revisions to the enhanced discharge summary, which was then made the default option for all internal medicine providers.
Education
A 30-minute educational session was developed and delivered by the authors. The objectives of the didactic portion were to describe how discharge summaries can impact patient care, understand how discharge summaries serve as a handoff document, list the components of an effective discharge summary, and describe strategies to avoid common errors in writing discharge summaries. The session included a review of pertinent literature [1,12,13,21], an outline of discharge summary best-practices [22,25], and an introduction to the new template. Trainers reviewed strategies for keeping the discharge summary concise, including using problem-based formatting, focusing on active hospital problems, and eliminating unnecessary or redundant information. Participants were encouraged to complete their discharge summaries and directly contact outpatient providers within 24 hours of discharge. Following the didactic session, participants critically reviewed an example discharge summary and discussed what was done well, what was done poorly, and what strategies they would have used to make it a more effective handoff document. Residents rotating on the inpatient internal medicine services received the education during their mandatory monthly orientation. Faculty physicians were provided the education at a required section meeting.
Quality Scoring of Discharge Summaries and Analysis
To evaluate the quality of discharge summaries, we developed a scoring instrument to measure inclusion of 24 key elements (Table 1). The scoring instrument (available from the authors) was pilot tested by 4 general internal medicine physicians on 5 sample discharge summaries. After independent scoring, this group met with members of the research team to provide feedback. Iterative revisions were made to the scoring instrument until scorers reached consensus in their understanding and application of the scoring instrument. Each discharge summary received a quality score from 0 to 24, based on the number of elements found to be present. Secondary quality metrics included a global quality rating using a 1 to 5 scale (described in Results); frequency of redundant documentation of consultants and procedures; frequency of documentation of non-active, chronic conditions; the length of the discharge summary (total word count); and time to completion.
We analyzed a sample of discharge summaries completed during the 3-month period prior to the intervention and the 3-month period following the intervention. A non-stratified random technique was employed by an independent party to generate discharge summary samples from the EHR. Living patients discharged from the internal medicine services after an inpatient admission of at least 48 hours were eligible for inclusion. Each discharge summary was scored by 2 general internal medicine physicians. Each scoring dyad comprised one of the authors paired with a volunteer non–research team member who scored discharge summaries independently. Discordant results were examined by the dyad and settled by consensus.
Physician Survey
We surveyed inpatient and outpatient physicians to determine their views about discharge summaries and their views about the template before and after the intervention. Respondents were asked to indicate to what degree they agreed with statements using a 5-point Likert scale. An email containing a consent cover letter and a link to an anonymous online survey was sent to residents rotating on internal medicine services during the study period and all hospital medicine faculty. Outpatient providers affiliated with the hospital system were sent the survey if they had received at least 5 discharge summaries from the internal medicine services over the preceding 6 months. Post-intervention surveys were timed to capture responses after an adequate exposure to the enhanced discharge summary template. Inpatient physicians were re-surveyed 3 months after introduction of the enhanced discharge summary and outpatient providers were re-surveyed after 1 year.
Statistical Analysis
We reviewed 10 pre-intervention discharge summaries to estimate baseline discharge summary quality scores. Anticipating a two-fold improvement following the intervention [24], we calculated a goal sample size of 108 discharge summaries (54 pre- and 54 post-intervention) assuming alpha of 0.05 and 80% power using a two-tailed chi-square test. Expecting that some discharge summaries may not meet our inclusion criteria, 114 summaries (57 pre- and 57 post-intervention) were included in the final sample. All analyses were performed on Stata v10.1 (StataCorp; College Station, TX).
For discharge summary quality scoring, inter-rater reliability was measured by calculating the kappa statistic and percent agreement for scoring elements. Chi-square analysis was used to compare individual scoring elements before and after the intervention when the sample size was 5 or greater. Fisher’s exact test was used when the sample size was less than 5. Counts, including number of inactive diagnoses, redundant consults, redundant procedures, and total words were compared using univariate Poisson regression. Wilcoxon rank sum analysis was utilized to compare pre-intervention to post-intervention composite scores and global scores. Patient and provider characteristics were compared using the t-test, chi-square test, Fisher’s exact test, or Wilcoxon rank sum, as appropriate.
For the surveys, pre-intervention and post-intervention matched pairs were compared. Likert score responses were analyzed using the Wilcoxon signed-rank test.
Results
Discharge Summary Quality Scores
Characteristics of the pre- and post-intervention discharge summaries are displayed in Table 2. Both samples were similar with respect to patient demographics, length of stay, medical complexity, and provider characteristics. The mean composite discharge summary quality score improved from 13.4 at baseline to 19.1 in the post-intervention sample (P < 0.001) (Table 3). Ten of 24 quality elements exhibited significant improvement following the intervention, but 3 items were documented less often after the intervention (Table 3).
The global rating of discharge summary quality improved from 3.04 to 3.46 (P = 0.010) (Table 4). Documentation of superfluous and redundant information decreased in the 3 areas evaluated: number of non-active, chronic diagnoses (2.33 to 1.35, P < 0.001), redundant consults (1.4 to 0.09, P < 0.001), and redundant procedures (0.74 to 0.26, P < 0.001). Inter-rater reliability was generally high for individual items, although kappa score was not calculable in one case and scores of zero were obtained for 3 highly concordant items. Inter-rater reliability was moderate for global rating (kappa = 0.59). The overall length of discharge summaries decreased from 717 to 701 words (P = 0.002). There was no significant change in time to discharge summary completion following the intervention (10.9 hours pre-intervention vs. 14.5 post-intervention, P = 0.605) (Table 4).
Survey Results
The inpatient provider response rate for the pre-intervention survey was 51/86 (59%) and 33/65 (51%) for the post-intervention survey, resulting in 21 paired responses. House officers represented the majority of paired respondents (14/21, 66%) with hospitalist faculty making up the remainder. Among outpatient physicians, the pre-intervention response rate was 19/25 (76%) and the post-intervention rate was 20/25 (80%), resulting in 16 paired responses. Half (8/16) of outpatient physicians provided only outpatient care, the other half practicing in a traditional model, providing both inpatient and outpatient care. Nearly half (7/16) had been in practice for over 15 years. Inpatient physicians’ agreement with all 4 statements related to discharge summary quality improved, including their perception of discharge summary effectiveness as a handoff document (P = 0.004). Inpatient providers estimated that the enhanced discharge summary took significantly less time to complete (19.3 vs. 24.6 minutes, P = 0.043). Outpatient providers’ perceptions of discharge summary quality trended toward improvement but did not reach statistical significance (Table 5).
Discussion
We found that a restructured note template in combination with physician education can improve discharge summary quality without sacrificing timeliness of note completion, document length, or physician satisfaction. The Joint Commission requires that discharge summaries include condition at discharge, but global assessments such as “good” or “stable” provide little clinically meaningful information to the next provider. Through our enhanced discharge summary we were able to significantly improve communication of several more specific elements relevant to discharge condition, including cognitive status. Similar to prior studies [7,13], cognitive condition was rarely documented prior to our intervention, but improved to 88% after introduction of the enhanced discharge summary. This is especially important, as we found that 25% of the post-intervention patients had a cognitive deficit at discharge. This information is critical for the next provider, who assumes responsibility for monitoring the patient’s trajectory.
Similarly, we improved the inclusion of patient preferences regarding advanced care planning. Whereas code status was rarely included the pre-intervention discharge summaries, we found that 1 in 5 patients in the post-intervention group did not want cardiopulmonary resuscitation. Beyond code status, we were also able to improve documentation of other advanced care conversations, such as end-of-life planning and power-of-attorney assignment. These conversations are increasingly common in the inpatient setting [28] but inconsistently documented [29,30].
To encourage inpatient-outpatient provider communication, the enhanced discharge summary template prompted documentation of communication with the PCP, with a resultant improvement from 25% to 72% (P < 0.001). The template also increased documentation of contact information for the hospital provider from 4% to 95% (P < 0.001). This improvement is notable, as hospital and outpatient physicians communicate infrequently [4,5], despite the fact that direct, “high-touch” communication is often preferred [10,11].
Our intervention builds upon prior research [23,24,31] through its deliberate focus on template formatting, evaluation of comprehensive clinical data elements using clearly defined scoring criteria, inclusion of teaching and non-teaching inpatient services, and assessment of inpatient and outpatient provider satisfaction. By restructuring the enhanced discharge summary template, we were able to improve documentation of clinical information, patient preferences, and physician communication, while keeping notes concise, prioritized, and timely. This restructuring included re-ordering information within the note, adding clear headings, devising intuitive drop-down menus, and removing unnecessary information. The amount of redundant information, document length, and perceived time required to write the discharge summary improved in the post-intervention period. Finally, our intervention was carried out with few resources and without financial incentives.
Although we found overall improvements following our intervention, there were several notable exceptions. Three content areas that were routinely documented in the pre-intervention period showed significant declines in the post-intervention phase: diet, activity, and procedures. Additionally, despite improvements in the post-intervention group, certain elements continued to be unreliably communicated in the discharge summary. Sporadic inclusion of pending tests (47%) was a particularly concerning finding. One possible explanation is that the addition of new elements and a focus on concise documentation encouraged physicians to skip or delete these areas of the enhanced discharge summary. It is also possible that reliance on drop-down menus and manual text entry, rather than auto-populated data, contributed to these deficits. As organizations re-design their electronic note templates, they should consider different content importing options [32] based on local institutional needs, culture, and EHR capabilities [33].
This study had several limitations. It was conducted at a single academic institution, so findings may not be generalizable to other settings. Although the magnitude and specificity of many of the measured outcomes suggests they were caused by the intervention, our pre/post study design cannot rule out the possibility that time-varying factors other than the intervention may have influenced our findings. We also used a novel scoring instrument, as a psychometrically tested discharge summary scoring instrument was not available at the time of the study [34]. Because it was based on similar concepts and evidence, the scoring instrument mirrored the data elements included in the intervention, which may have biased our results away from the null. However, the global rating score, which provided an overall appraisal of discharge summary quality unrelated to specific elements of the intervention, also showed significant improvement following the intervention. The distinct formatting of pre- and post-intervention templates meant that scorers were not blinded, thus making social desirability bias a possibility. We attempted to minimize the risk for bias by having all discharge summaries scored by 2 scorers, including one physician who was not a member of the research team. Small sample sizes, particularly with regard to the outpatient survey, may have contributed to type II errors. Additionally, although the discharge summary education was delivered during required meetings, we did not track attendance, so we were unable analyze for differences between providers who received the education and those that did not. Finally, while we evaluated discharge summaries for inclusion of key information, we did not perform chart reviews or contact PCPs to confirm the accuracy of documented information. Future study should evaluate the sustainability of our intervention and its impact on patient-level outcomes.
In conclusion, we found that revising our electronic template to better function as a handoff document could improve discharge summary quality. While most content areas evaluated showed improvement, there were several elements that were negatively impacted. Hospitals should be deliberate when reformatting their discharge summary templates so as to balance the need for efficient, manageable template navigation with accurate, complete, and necessary information.
Corresponding author: Christopher J. Smith, MD, 986430 Nebraska Medical Center Omaha, NE 68198-6430 Email: csmithj@unmc.edu.
Financial disclosures: None.
1. Moore C, Wisnivesky J, Williams S, McGinn T. Medical errors related to discontinuity of care from an inpatient to an outpatient setting. J Gen Intern Med 2003;18:646–51.
2. Forster AJ, Murff HJ, Peterson JF, et al. The incidence and severity of adverse events affecting patients after discharge from the hospital. Ann Intern Med 2003;138:161–7.
3. Forster AJ, Murff HJ, Peterson JF, et al. Adverse drug events occurring following hospital discharge. J Gen Intern Med 2005;20:317–23.
4. Kripalani S, LeFevre F, Phillips CO, et al. Deficits in communication and information transfer between hospital-based and primary care physicians: implications for patient safety and continuity of care. JAMA 2007;297:831–41.
5. Bell CM, Schnipper JL, Auerbach AD, et al. Association of communication between hospital-based physicians and primary care providers with patient outcomes. J Gen Intern Med 2009;24:381–6.
6. van Walraven C, Seth R, Austin PC, Laupacis A. Effect of discharge summary availability during post-discharge visits on hospital readmission. J Gen Intern Med 2002;17:186-92.
7. Horwitz LI, Jenq GY, Brewster UC, et al. Comprehensive quality of discharge summaries at an academic medical center. J Hosp Med 2013;8:436–43.
8. van Walraven C, Rokosh E. What is necessary for high-quality discharge summaries? Am J Med Qual 1999;14:160–9.
9. van Walraven C, Duke SM, Weinberg AL, Wells PS. Standardized or narrative discharge summaries. Which do family physicians prefer? Can Fam Physician 1998;44:62–9.
10. Sheu L, Fung K, Mourad M, et al. We need to talk: Primary care provider communication at discharge in the era of a shared electronic medical record. J Hosp Med 2015;10:307–10.
11. Jones CD, Vu MB, O’Donnell CM, et al. A failure to communicate: a qualitative exploration of care coordination between hospitalists and primary care providers around patient hospitalizations. J Gen Intern Med 2015;30:417–24.
12. Kind AJH, Smith MA. Documentation of mandated discharge summary components in transitions from acute to subacute care. In: Henriksen K, Battles JB, Keyes MA, Grady ML, editors. Advances in patient safety: new directions and alternative approaches (Vol 2: Culture and Redesign). Rockville, MD: Agency for Healthcare Quality and Research; 2008.
13. Kind AJ, Thorpe CT, Sattin JA, et al. Provider characteristics, clinical-work processes and their relationship to discharge summary quality for sub-acute care patients. J Gen Intern Med 2012;27:78–84.
14. Roy CL, Poon EG, Karson AS, et al. Patient safety concerns arising from test results that return after hospital discharge. Ann Intern Med 2005;143:121–8.
15. Were MC, Li X, Kesterson J, et al. Adequacy of hospital discharge summaries in documenting tests with pending results and outpatient follow-up providers. J Gen Intern Med 2009;24:1002–6.
16. Walz SE, Smith M, Cox E, et al. Pending laboratory tests and the hospital discharge summary in patients discharged to sub-acute care. J Gen Intern Med 2011;26:393–8.
17. Kantor MA, Evans KH, Shieh L. Pending studies at hospital discharge: a pre-post analysis of an electronic medical record tool to improve communication at hospital discharge. J Gen Intern Med 2015;30:312–8.
18. Moore C, McGinn T, Halm E. Tying up loose ends: discharging patients with unresolved medical issues. Arch Intern Med 2007;167:1305–11.
19. Al-Damluji MS, Dzara K, Hodshon B, et al. Hospital variation in quality of discharge summaries for patients hospitalized with heart failure exacerbation. Circulation Cardiovasc Qual Outcomes 2015;8:77–86.
20. Coleman EA, Smith JD, Raha D, Min SJ. Posthospital medication discrepancies: prevalence and contributing factors. Arch Intern Med 2005;165:1842–7.
21. Lindquist LA, Yamahiro A, Garrett A, et al. Primary care physician communication at hospital discharge reduces medication discrepancies. J Hosp Med 2013;8:672–7.
22. Snow V, Beck D, Budnitz T, et al. Transitions of care consensus policy statement: American College of Physicians, Society of General Internal Medicine, Society of Hospital Medicine, American Geriatrics Society, American College of Emergency Physicians, and Society for Academic Emergency Medicine. J Hosp Med 2009;4:364–70.
23. O’Leary KJ, Liebovitz DM, Feinglass J, et al. Creating a better discharge summary: improvement in quality and timeliness using an electronic discharge summary. J Hosp Med 2009;4:219–25.
24. Bischoff K, Goel A, Hollander H, et al. The Housestaff Incentive Program: improving the timeliness and quality of discharge summaries by engaging residents in quality improvement. BMJ Qual Safety 2013;22:768–74.
25. Lenert LA, Sakaguchi FH, Weir CR. Rethinking the discharge summary: a focus on handoff communication. Acad Med 2014;89:393–8.
26. Halasyamani L, Kripalani S, Coleman E, et al. Transition of care for hospitalized elderly patients--development of a discharge checklist for hospitalists. J Hosp Med 2006;1:354–60.
27. Kripalani S, Jackson AT, Schnipper JL, Coleman EA. Promoting effective transitions of care at hospital discharge: a review of key issues for hospitalists. J Hosp Med 2007;2:314–23.
28. Huijberts S, Buurman BM, de Rooij SE. End-of-life care during and after an acute hospitalization in older patients with cancer, end-stage organ failure, or frailty: A sub-analysis of a prospective cohort study. Palliat Med 2016;30:75–82.
29. Butler J, Binney Z, Kalogeropoulos A, et al. Advance directives among hospitalized patients with heart failure. JACC Heart Fail 2015;3:112–21.
30. Oulton J, Rhodes SM, Howe C, et al. Advance directives for older adults in the emergency department: a systematic review. J Palliat Med 2015;18:500–5.
31. Shaikh U, Slee C. Triple duty: integrating graduate medical education with maintenance of board certification to improve clinician communication at hospital discharge. J Grad Med Educ 2015;7:462–5.
32. Weis JM, Levy PC. Copy, paste, and cloned notes in electronic health records: prevalence, benefits, risks, and best practice recommendations. Chest 2014;145:632–8.
33. Dixon DR. The behavioral side of information technology. Int J Med Inform 1999;56:117–23.
34. Hommos MS, Kuperman EF, Kamath A, Kreiter CD. The development and evaluation of a novel instrument assessing residents’ discharge summaries. Acad Med 2017;92:550–5.
Using Clinical Decision Support to Reduce Inappropriate Imaging: A Health Care Improvement Case Study
From the Office of Science Policy and Communications, National Institute on Drug Abuse, National Institutes of Health, Rockville, MD, and George Washington University, Washington, DC (Dr. Jones), Office of the National Coordinator for Health Information Technology, US Department of Health and Human Services, Washington, DC (Mr. Swain), and Banner Health, Phoenix, AZ (Ms. Burdick).
Abstract
- Objective: Clinical decision support (CDS) can be a useful tool to decrease inappropriate imaging by providing evidence-based information to clinicians at the point of care. The objective of this case study is to highlight lessons from a health care improvement initiative using CDS to encourage use of ultrasound rather than computed tomography (CT) scans as an initial diagnostic tool for suspected appendicitis in pediatric patients.
- Methods: The percentage of suspected pediatric appendicitis cases receiving ultrasounds and CT scans was calculated using electronic health record data. Four steps for implementing health information technology were identified in a literature scan that guided data collection and analysis: planning, software customization and workflow design, training and user support, and optimization.
- Results: During the fourth quarter of 2010, 1 in 7 pediatric patients with suspected appendicitis received an ultrasound and almost half received a CT scan. By the first quarter of 2012, ultrasounds were performed in 40.8% of these cases and the use of CT scans declined to 39.9% of suspected pediatric appendicitis cases.
- Conclusion: Four lessons emerged. First, all levels of staff should be involved in the planning process to make organizational priorities actionable and build buy-in for each healthcare improvement initiative. Second, it takes time to design and test the alert to ensure that clinical guidelines are being properly applied. Third, re-engineering the workflow is critical for usability; in this case, ensuring the availability of ultrasound staff was particularly important. Finally, the effectiveness of CDS depends on applying relevant evidence-based practice guidelines to real-time patient data.
Diagnostic imaging is a useful tool for identifying and guiding the treatment of many health conditions, but evidence indicates that health care providers do not always use imaging appropriately. In fact, a substantial proportion of diagnostic imaging procedures performed in hospital and ambulatory settings are not supported by clinical guideline recommendations [1,2]. Spending on diagnostic imaging is rapidly increasing, and some patients receive unnecessary radiation exposure that can lead to adverse health impacts [3]. Inappropriate imaging falls into 3 broad categories: imaging that does not conform to clinical guidelines, imaging that is contraindicated due to an allergy or implantable medical device, and imaging that might be clinically indicated but is duplicative of prior imaging services.
Clinical decision support (CDS) functionality supports health care improvement initiatives to narrow the gap between evidence-based practices and routine care [4]. CDS merges patient-specific clinical information with relevant information about evidence-based practices, providing health care providers with timely information to guide decisions at the point of care [5]. Decision support is most commonly delivered in the form of alerts and reminders [6]. CDS can be effective in reducing adverse drug events [7], sepsis [8,9], and other conditions in hospital [10–12] and ambulatory settings [13,14].
For the evaluation of suspected appendicitis in children, ultrasound is the preferred initial consideration for imaging examination [15]. Evidence suggests that CDS can increase the use of ultrasound for suspected pediatric appendicitis [16,17] and has affirmed the utility of ultrasound as a first-line diagnostic tool for suspected appendicitis [18,19]. In the Choosing Wisely campaign, the American College of Surgeons and the American College of Radiology have both endorsed ultrasound as an option to consider prior to conducting a CT scan to evaluate suspected appendicitis in children [15].
Banner Health, a large health system headquartered in Phoenix, Arizona, implemented a health care improvement initiative using CDS functionality to encourage providers to use ultrasound instead of CT as a first-line diagnostic tool for suspected pediatric appendicitis. We conducted a site visit to Banner Health, an organization who had had attained a high score on the EMR Adoption Model [20] to examine their implementation process. We sought to build on previous research examining the use of health information technology to improve performance in large health systems [21–23].
Methods
Setting
Banner Health is a large not-for-profit health system that is comprised of 24 acute care hospitals across several states, as well as ambulatory medical practices, behavioral health, home care, and ambulatory surgery centers [24,25]. The health system is the largest employer in Arizona and one of the largest in the United States with over 50,000 employees. Banner Health has been nationally recognized for clinical quality [26], an innovative leadership team [27], and using health IT to improve quality [20]. The health system was also selected as one of the Centers for Medicare & Medicaid Services (CMS) Pioneer Accountable Care Organizations.
Site Visit
The first 2 authors conducted a 2-day site visit to the Banner Health headquarters in Phoenix, Arizona in November 2013. The team conducted discussions with over 20 individuals, including health system leadership, frontline clinicians in several units of an acute care hospital, staff members in 2 telehealth hubs—including a tele-ICU hub—and trainers in a simulation facility that is used for staff training. The discussions were conducted with groups of staff or on an individual basis, as appropriate. At the outset of the project, an environmental scan of relevant grey and peer-reviewed literature was conducted under contract on behalf of the authors to guide data collection and analysis [28]. An interview protocol was created to guide the discussions. The protocol contained modules that were used during each discussion, if relevant. The modules addressed topics such as technical issues with designing and deploying health information technology functionalities such as clinical decision support systems, the organizational processes and structures needed to launch health care improvement initiatives, and using health information technology care coordination. Within each module, questions probed about the challenges that arose and the solutions to these challenges, with a focus on the four phases of implementing a health information technology intervention: functionality planning, software customization and workflow design, training and user support, and optimization. To assist with interpreting the qualitative findings, an evolving outline of the findings was maintained. Salient themes and conceptual categories were tracked, which helped the researchers organize, synthesize, and interpret the information collected during the site visit. Once the authors chose to focus on clinical decision support, summary notes from the discussions were reviewed for relevant information, and this information was compiled and organized under the rubric of the four implementation phases. The findings and key themes from the discussion notes were distilled into key lessons for the field.
Data obtained included the percentage of pediatric patients with suspected appendicitis who received ultrasounds and CT scans each month from 1 October 2010 through 31 March 2012. Banner Health staff originally collected the data to support the implementation of health care improvement initiative; the use of these data in this paper is a secondary use [29].
This manuscript was prepared using the SQUIRE 2.0 guidelines [30]. No patient-identifiable data were used, so institutional review board approval was not sought.
Results
The 4 steps of implementing CDS can be described as functionality planning, software customization and workflow design, training and user support, and optimization [31].
Pre-Implementation
The use of computerized provider order entry (CPOE) is a precursor to using clinical decision support, since orders must be entered electronically to be subject to CDS review. Banner Health deployed CPOE to its various facilities starting in 2008. The deployment was staged in a rolling fashion with one or two facilities going live every few months so that the deployment team was available at each facility.
Phase 1: Planning
In contrast to many large health systems, the organization has a single board of directors that oversees the entire system of over 37,000 employees. Activities and relationships to promote the use of evidence-based practices are built into the organizational structure. For example, Banner Health maintains a Care Management Council, a group comprised of clinical and administrative leadership to provide executive oversight of health care improvement projects. The Council convenes on a quarterly basis to review and approve the adoption of new clinical practice guidelines, policies, and standardized standing orders that have been developed by multidisciplinary groups of physicians and other clinicians. A key focus of the Council is ensuring consistent application of evidence-based guidelines to clinical care and disseminating knowledge of clinical best practices across a large and complex enterprise.
Interdisciplinary clinical consensus groups support the Council’s work. These groups are comprised of administrative and program management staff, physicians and other clinicians, and engineers. Each clinical consensus group focuses on emerging issues and improvement opportunities within a specific clinical domain and leads the implementation of health care improvement initiatives in that domain. Providers and staff at all levels of the organization were involved in planning and implementing the health care improvement initiative in inappropriate imaging. This increased buy-in and staff support, which are associated with successful health care improvement initiatives [32]. Banner Health staff rallied around the idea of addressing inappropriate imaging as a key priority initiative. The teams that implement each initiative include an engineer that focuses on redesigning clinical workflows for each initiative. There is also an organizational unit responsible for project management that provides teams with logistical and operational support.
Phase 2: Software Customization and Workflow Redesign
Once the clinical consensus group selected inappropriate imaging as a priority, the next step was to examine the process flow for imaging ordering. In 2011 Banner Health integrated CDS functionality with CPOE into the electronic health record. Before the use of CDS, inpatient and emergency department imaging orders were simply transmitted to imaging staff after the order was entered. After CDS implementation, the process flow begins with an inpatient imaging order and entailed checking the order against clinical guidelines on the proper use of imaging. If the image order did not conform to guidelines, which in this case indicate that ultrasound should be used before CT scans as a diagnostic tool for suspected pediatric appendicitis, the CDS system triggered an alert [15].
Bringing the perspective and skill sets of engineers to the process of redesigning clinical workflows was particularly valuable [33]. While CDS has the potential to reduce inpatient inappropriate imaging, effectiveness depends on adjusting workflows to ensure that the information provided by CDS alerts and reminders is actionable. To reduce alert fatigue among the clinical staff, the team identified the appropriate level of workflow interruption for each alert and reminder (hard stop, workflow interruption, or informational) [5,6].
The design principles that were used to design the alert include intuitive system development to promote ease of use, one set of screen formats and data definitions, and a set of consistent core reports and standard system output formats across facilities. The alert’s appearance was tailored for maximal impact and covered most of the screen. Color contrast was used, but since some people are color-blind, the meaning of the alert did not depend on the color contrast. The alerts included recommendations for changing the treatment plan to encourage using ultrasound as a first-line diagnostic tool. Minimizing the number of clicks to accept the proposed treatment plan change in the alert is desirable.
Phase 3: Training and User Support
Training and support structures and tools were critical to the rollout of the inappropriate imaging alerts. Providers were reminded about clinical best practices and informed during staff meetings about the new CDS rules. In addition, various types of training and support were available to clinicians and staff during the rollout process. Dedicated time for end-user training provided an opportunity to identify and cultivate super-users. These super-users not only helped provide technical support to their colleagues, but also helped create excitement for the initiative. A centralized support desk provided telephone support for providers in facilities throughout the Banner Health system. Site managers were provided toolkits to support providers and staff throughout the implementation process. The toolkits included frequently asked questions and answers, and were maintained as ‘living documents’ that were updated based on emerging issues and questions.
To keep things on track, project managers from the central project management department were involved in the initiative to provide direct project management services to the initiative. They also worked to instill project management competencies throughout the organization, applying a train-the-trainer approach to disseminate best practices for enhancing communication among team members, implementing workflow changes, and monitoring the results.
Phase 4: Optimization
The optimization phase is continuous and continues to the present day. Notably, the success of the CDS rules depends on the availability of current clinical information for each patient, in addition to information about the treatment plan. For this initiative, Banner Health maintained aggregated clinical patient data in the data warehouse that aggregated data from disparate sources, including billing and EHR data from different care settings such as ambulatory offices, inpatient units, the emergency department, home care, and ambulatory surgery centers. The data warehouse is housed in a strategically chosen physical location to minimize the threat of natural disasters, and cloud-based backup is also used. A master patient index and provider credentialing system are integrated with the data warehouse. Query-based health information exchange is used, when possible, to collect information on care received by patients outside of the Banner Health system.
It is important to note that many CDS alerts are over-ridden without changes to clinical care [34]. Previous research indicates that alert fatigue from “false positives” can impede the effectiveness of alerts [35]. Banner Health monitors the rate at which CDS alerts are over-ridden. Figure 1 shows the percentage of all alerts for radiation exposure—including the alert related to using ultrasound as a diagnostic tool for pediatric appendicitis—that led to order cancellations. The percentage of CT orders that generated the alert and were cancelled fell from 18.9% in March 2011 to 13.6% in February 2012. The rate of order cancellations might have declined over time due to a change in provider behavior from the alert. That is, if inappropriate CT scan orders declined over time, then providers would cancel a decreasing percentage of the CT scan orders that prompted an alert. 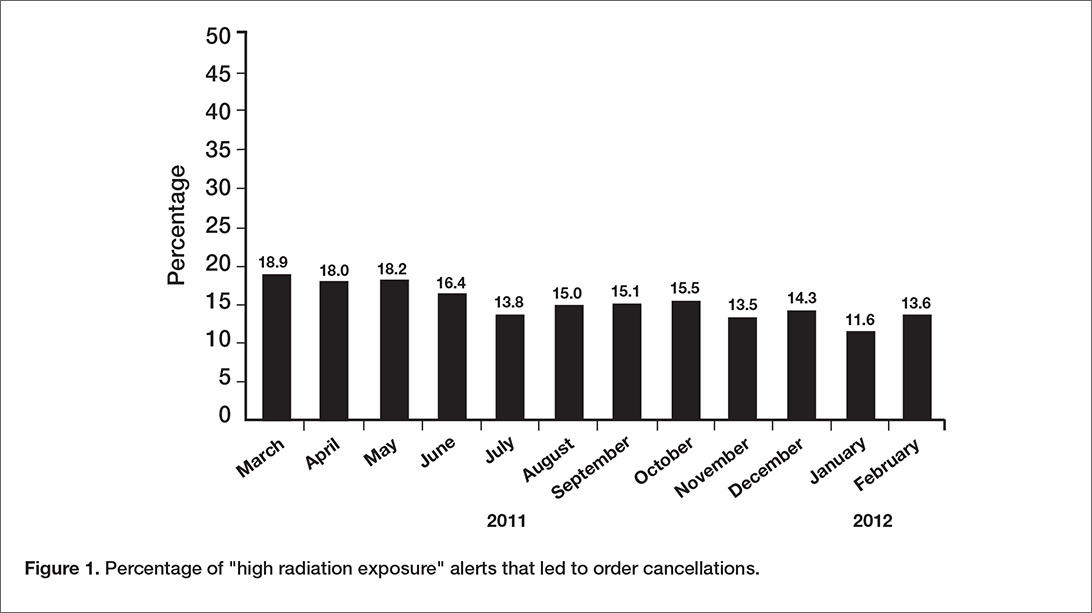
Imaging Use
In Figure 2, data on the use of the 2 imaging procedures for the diagnosis of pediatric appendicitis is presented. During the fourth quarter of 2010, almost half of pediatric patients with suspected appendicitis received a CT scan and only about 1 in 7 received an ultrasound. After the clinical decision support alert was put in place to remind providers to perform an ultrasound as a first-line diagnostic tool, the use of ultrasounds increased sharply. By the first quarter of 2012, ultrasounds were performed in 40.8% of these cases and the use of CT scans declined to 39.9% of suspected pediatric appendicitis cases. 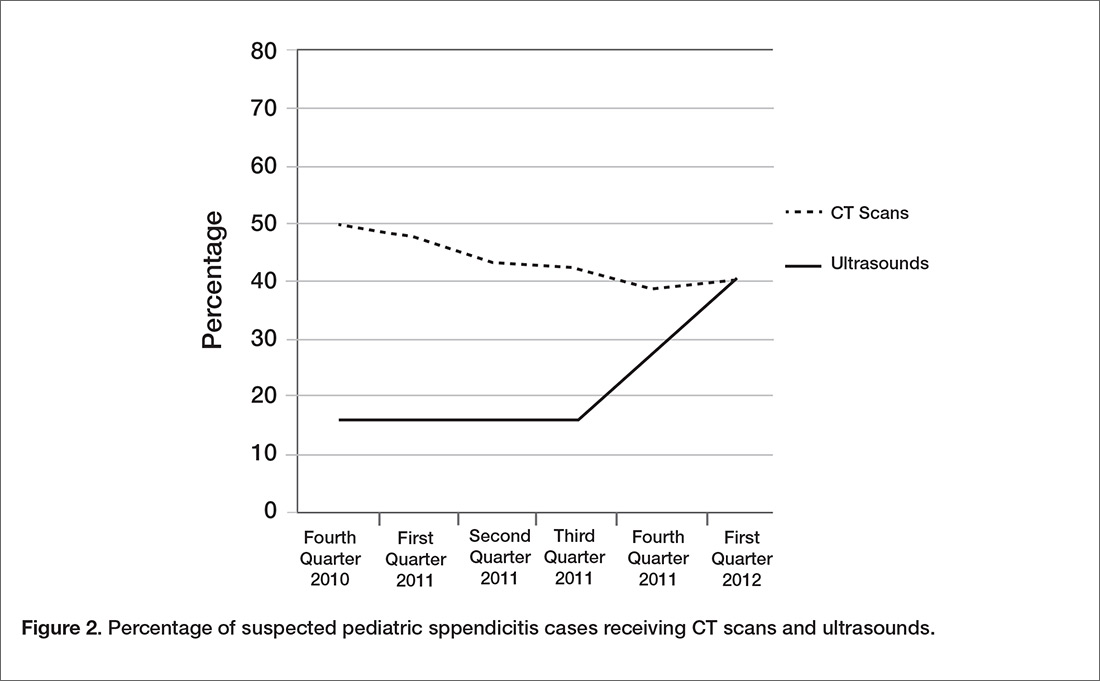
Discussion
This case study discusses the application of CDS functionality in a health care improvement initiative to address inappropriate imaging in a large health system. Four main implementation lessons emerge for the field. First, it is important to involve all levels of staff in the planning process to ensure that health care improvement activities are prioritized correctly and to build buy-in for the priorities addressed with health care improvement activities. Second, it is necessary to allow time to design the alert or reminder, as well as testing it during the implementation process to ensure that clinical guidelines are being properly applied. Third, re-engineering the workflow and ensuring usability of the alert or reminder are important, and using the skills of trained engineers helps in this process. Ensuring the availability of trained ultrasound staff was particularly important to this initiative. Finally, the effectiveness of CDS depends on having complete data for each patient, as well as up-to-date information on the relevant evidence-based practice guidelines.
These results can help guide the implementation of health care improvement initiatives that use CDS functionality to address inappropriate imaging. The adoption of electronic health records with CDS functionality was incentivized and supported by the Medicare and Medicaid Electronic Health Record Incentive Programs; the Medicare program now exists as part of MACRA. Using CDS to reduce inappropriate imaging is required for Medicare fee-for-service patients in the 2014 Protecting Access to Medicare Act (PAMA), highlighting the critical nature of these results, which can guide implementation of CDS to reduce inappropriate imaging [41].
As noted above, the optimization phase is continuous. Banner Health still encourages use of ultrasounds as a first-line diagnostic tool for pediatric appendicitis. Identifying which patients should immediately receive CT scans is difficult, and sometimes the decision depends on the availability of staff to conduct the ultrasound scans. Ways to maximize the productivity of ultrasound technicians have been explored. Another focus area since the original implementation of this health care improvement initiative has been health information exchange, to ensure that complete, up-to-date information is available for each patient.
Banner Health often implements CDS in conjunction with other health IT functionalities. For example, CDS and telehealth are used together to improve care in the intensive care unit (ICU) for patients with sepsis and delirium. An offsite hub of experienced ICU physicians and nurses remotely monitors ICU patients in facilities across Banner Health, using cameras with zoom capability. The intensive care specialists in the tele-hub act as part of the care team; in addition to receiving video feed, they communicate verbally with patients and ICU staff members. Predictive analytics are used to generate clinical decision support alerts and reminders, with a special focus on early intervention if a patient’s clinical indicators are trending downward. The 4 lessons described in this study were also used in the ICU sepsis and delirium initiative; staff were involved in the planning process, alerts and reminders were thoroughly tested, the workflow was adjusted to accommodate the physicians in the tele-ICU hub, and up-to-date and complete clinical information for each patient is maintained. In addition, the design principles for alerts described in this study, such as covering most of the screen and providing recommendations for changing the treatment plan within the alert itself, were also used in the ICU sepsis and delirium initiative.
One limitation of this study is that it was conducted at a single health system. Thus, the findings might not be generalizable to other health systems, particularly if a robust health IT infrastructure is not in place. The culture of Banner Health values quality and involved providers and staff at all levels in selecting and implementing health care improvement initiatives. In addition, engineers assisted with implementation. Finally, the study design does not permit conclusions about the causality of the decline in CT scans and the increase in ultrasounds for suspected pediatric appendicitis cases; unobserved factors might have contributed to the changes in CT and ultrasound use.
Future research should focus on ways to improve the implementation and organization learning process, particularly through engagement of frontline staff by leadership [36] and explore how to operationalize previous findings indicating that innovations in hospital settings are more likely to be sustained when intrinsically rewarding to staff, either by making clinician and staff jobs easier to perform or more gratifying [37]. Future research should focus on facilitating health information exchange between providers in different health systems.
Disclaimer: The views expressed in the article are solely the views of the authors and do not represent those of the National Institutes of Health or the U.S. Government.
Acknowledgments: The authors wish to thank the Banner Health team for taking time to share their insights on how health information technology can be used for health care improvement initiatives, especially John Hensing. We also thank Michael Furukawa of the Agency for Healthcare Research and Quality, formerly of the Office of the National Coordinator for Health Information Technology, who played a key role in the conceptualization of this study and data collection.
Corresponding author: Emily Jones, PhD, MPP, National Institutes of Health, 6001 Executive Blvd., #5232 Rockville, MD 20852, emilybjones@gmail.com.
Financial disclosures: None
1. Lehnert B, Bree R. Analysis of appropriateness of outpatient CT and MRI referred from primary care clinics at an academic medical center: how critical is the need for improved decision support? J Am Coll Radiol 2010;7:192–7.
2. Ip I, Schneider L, Hanson R, et al. Adoption and meaningful use of computed physician order entry with an integrated clinical decision support system for radiology: ten-year analysis in an urban teaching hospital. J Am Coll Radiol 2012;9:129–36.
3. Bernardy M, Ullrich C, Rawson J, et al. Strategies for managing imaging utilization. J Am Coll Radiol 2009;6:844–50.
4. Amland R, Dean B, Yu HT et al. Computed clinical decision support to prevent venous thromboembolism among hospitalized patients: proximal outcomes from a multiyear quality improvement project. J Healthcare Qual 2015;37:221–31.
5. Kahn C. Improving outcomes in radiology: bringing computer-based decision support and education to the point of care. Acad Radiology 2005;12:409–14.
6. Phansalkar S, Desai A, Bell D et al. High-priority drug-drug interactions for use in electronic health records. J Am Med Inform Assoc 2012;19:735–43.
7. Wolfstadt J, Gurwitz J, Field T, et al. The effect of computed physician order entry with clinical decision support on the rates of adverse drug events: a systematic review. J Gen Intern Med 2008;23:451–8.
8. Amland R, Hahn-Cover K. Clinical decision support for early recognition of sepsis. Am J Med Qual 2014;1–8.
9. Amland R, Haley J, Lyons J. A multidisciplinary sepsis program enabled by a two-stage clinical decision support system: factors that influence patient outcomes. Am J Med Qual 2015;1–8.
10. Umscheid C, Hanish A, Chittams J, et al. Effectiveness of a novel and scalable clinical decision support intervention to improve venous thromboembolism prophylaxis: a quasi-experimental study. BMC Med Inform Dec Making 2012;12:92–104.
11. Mack EH, Wheeler DS, Embi PJ. Clinical decision support systems in the pediatric intensive care unit. Pediatric Crit Care Med 2009;10:23–8.
12. Kollef M, Heard K, Chen Y, et al. Mortality and length of stay trends following implementation of a rapid response system and real-time automated clinical deterioration alerts. Am J Med Qual 2015; online first.
13. Ali S, Giordano R, Lakhani S, Walker D. A review of randomized controlled trials of medical record powered clinical decision support system to improve quality of diabetes care. Int J Med Informatics 2016;87:91–100.
14. Gill J, Mainous A, Koopman R et al. Impact of EHR-based clinical decision support on adherence to guidelines for patients on NSAIDs: a randomized controlled trial. Ann Fam Med 2011;9:22–30.
15. Choosing Wisely. Accessed 1 May 2017 at http://www.choosingwisely.org/clinician-lists/#keyword=appendicitis.
16. Hendrickson M, Wey A, Gaillard P, Kharbanda A. Implementation of an electronic clinical decision support tool for pediatric appendicitis within a hospital network. Pediatric Emerg Care 2017 (online first).
17. Kharbanda A, Madhok M, Krause E, et al. Implementation of electronic clinical decision support for pediatric appendicitis. Pediatrics 2016;137:e20151745.
18. Schuh S, Chan K, Langer J, et al. Properties of serial ultrasound clinical diagnostic pathway in suspected appendicitis and related computed tomography use. Acad Emerg Med 2015;22:406–14.
19. Ramarajan N, Krishnamoorthi R, Barth R, et al. An interdisciplinary initiative to reduce radiation exposure: evaluation of appendicitis in a pediatric emergency department with clinical assessment supported by a staged ultrasound and computed tomography pathway. Acad Emerg Med 2009;16:1258–65.
20. HIMSS Analytics. Stage 7 Hospitals. Accessed at www.himssanalytics.org/emram/stage7Hospitals.aspx.
21. Rizer M, et al. Top 10 lessons learned from electronic health record implementation in a large academic medical center. Perspectives in Health Information Management. Summer 2015.
22. Cosgrove DM, Fisher M, Gabow P, et al. Ten strategies to lower costs, improve quality, and engage patients: the view from leading health system CEOs. Health Aff (Millwood) 2013;32:321–7.
23. Cresswell KM, Bates DW, Sheikh A. Ten key considerations for the successful implementation and adoption of large-scale health information technology. J Am Med Inform Assoc 2013 Apr 18.
24. Hensing JA. The quest for upper-quartile performance at Banner Health. J Healthc Qual 2008;30:18–24
25. Hensing J, Dahlen D, Warden M, et al. Measuring the benefits of IT-enabled care transformation. Healthc Financ Manage 2008;62:74–80.
26. Truven Health Analytics. 15 Top Health Systems Study. 6th ed. April 2014. Accessed at http://100tophospitals.com/portals/2/assets/15-Top-Health-Systems-Study.pdf.
27. Aiello M. 2011 Top leadership team awards recognize big moves. Health Leaders Media. August 2011. Accessed at www.healthleadersmedia.com/page-2/LED-269808/2011-Top-Leadership-Team-Awards-Recognize-Big-Moves.
 28. Rosenthal D, Stout M. Radiology order entry: features and performance requirements. J Am Coll Radiol 2006;3:554–7.
29. Kirsh S, Wu WC, Edelman D, Aron D. Research versus quality improvement: distinct or a distinction without a difference? A case study comparison of two studies. Jt Comm J Qual Patient Safety 2014;40:365–75.
30. Ogrinc G, Davies L, Goodman D, et al. SQUIRE 2.0 (Standards for Quality Improvement Reporting Excellence): revised publication guidelines from a detailed consensus process. BMJ Qual Saf 2015;0:1–7.
31. Blavin F, Ramos C, Shah A, Devers K. Lessons from the literature on electronic health record implementation.1 Aug 2013. The Urban Institute. Prepared for the Office of the National Coordinator for Health Information Technology. Available at www.urban.org/research/publication/lessons-literature-electronic-health-record-implementation.
32. Needleman J, Pearson ML, Upenieks VV, et al. Engaging frontline staff in performance improvement: the American Organization of Nurse Executives implementation of transforming care at the beside collaborative. Jt Comm J Qual Patient Safety 2016;42:61–9.
33. Jones E, Swain M, Patel V, Furukawa M. Supporting HITECH implementation and assessing lessons for the future: the role of program evaluation. Healthcare: The Journal of Delivery Science and Innovation 2014;2:4–8.
34. Phansalkar S, Zachariah M, Seidling H, et al. Evaluation of medication alerts in electronic health records for compliance with human factors principles. J Am Med Inform Assoc 2014;21:e332–e340.
35. Handler S, Altman R, Perera S, et al. A systematic review of the performance characteristics of clinical event monitor signals to detect adverse drug events in the hospital setting. J Am Med Inform Assoc 2007;14:451–8.
36. Singer S, Rivard P, Hayes J, et al. Improving patient care through leadership engagement with frontline staff: a Department of Veteran Affairs study. Jt Comm J Qual Patient Safety 2013;39):349–60.
37. Brewster A, Curry L, Cherlin E, et al. Integrating new practices: a qualitative study of how hospital innovations become routine. Implement Sci 2015;5(10):168.
From the Office of Science Policy and Communications, National Institute on Drug Abuse, National Institutes of Health, Rockville, MD, and George Washington University, Washington, DC (Dr. Jones), Office of the National Coordinator for Health Information Technology, US Department of Health and Human Services, Washington, DC (Mr. Swain), and Banner Health, Phoenix, AZ (Ms. Burdick).
Abstract
- Objective: Clinical decision support (CDS) can be a useful tool to decrease inappropriate imaging by providing evidence-based information to clinicians at the point of care. The objective of this case study is to highlight lessons from a health care improvement initiative using CDS to encourage use of ultrasound rather than computed tomography (CT) scans as an initial diagnostic tool for suspected appendicitis in pediatric patients.
- Methods: The percentage of suspected pediatric appendicitis cases receiving ultrasounds and CT scans was calculated using electronic health record data. Four steps for implementing health information technology were identified in a literature scan that guided data collection and analysis: planning, software customization and workflow design, training and user support, and optimization.
- Results: During the fourth quarter of 2010, 1 in 7 pediatric patients with suspected appendicitis received an ultrasound and almost half received a CT scan. By the first quarter of 2012, ultrasounds were performed in 40.8% of these cases and the use of CT scans declined to 39.9% of suspected pediatric appendicitis cases.
- Conclusion: Four lessons emerged. First, all levels of staff should be involved in the planning process to make organizational priorities actionable and build buy-in for each healthcare improvement initiative. Second, it takes time to design and test the alert to ensure that clinical guidelines are being properly applied. Third, re-engineering the workflow is critical for usability; in this case, ensuring the availability of ultrasound staff was particularly important. Finally, the effectiveness of CDS depends on applying relevant evidence-based practice guidelines to real-time patient data.
Diagnostic imaging is a useful tool for identifying and guiding the treatment of many health conditions, but evidence indicates that health care providers do not always use imaging appropriately. In fact, a substantial proportion of diagnostic imaging procedures performed in hospital and ambulatory settings are not supported by clinical guideline recommendations [1,2]. Spending on diagnostic imaging is rapidly increasing, and some patients receive unnecessary radiation exposure that can lead to adverse health impacts [3]. Inappropriate imaging falls into 3 broad categories: imaging that does not conform to clinical guidelines, imaging that is contraindicated due to an allergy or implantable medical device, and imaging that might be clinically indicated but is duplicative of prior imaging services.
Clinical decision support (CDS) functionality supports health care improvement initiatives to narrow the gap between evidence-based practices and routine care [4]. CDS merges patient-specific clinical information with relevant information about evidence-based practices, providing health care providers with timely information to guide decisions at the point of care [5]. Decision support is most commonly delivered in the form of alerts and reminders [6]. CDS can be effective in reducing adverse drug events [7], sepsis [8,9], and other conditions in hospital [10–12] and ambulatory settings [13,14].
For the evaluation of suspected appendicitis in children, ultrasound is the preferred initial consideration for imaging examination [15]. Evidence suggests that CDS can increase the use of ultrasound for suspected pediatric appendicitis [16,17] and has affirmed the utility of ultrasound as a first-line diagnostic tool for suspected appendicitis [18,19]. In the Choosing Wisely campaign, the American College of Surgeons and the American College of Radiology have both endorsed ultrasound as an option to consider prior to conducting a CT scan to evaluate suspected appendicitis in children [15].
Banner Health, a large health system headquartered in Phoenix, Arizona, implemented a health care improvement initiative using CDS functionality to encourage providers to use ultrasound instead of CT as a first-line diagnostic tool for suspected pediatric appendicitis. We conducted a site visit to Banner Health, an organization who had had attained a high score on the EMR Adoption Model [20] to examine their implementation process. We sought to build on previous research examining the use of health information technology to improve performance in large health systems [21–23].
Methods
Setting
Banner Health is a large not-for-profit health system that is comprised of 24 acute care hospitals across several states, as well as ambulatory medical practices, behavioral health, home care, and ambulatory surgery centers [24,25]. The health system is the largest employer in Arizona and one of the largest in the United States with over 50,000 employees. Banner Health has been nationally recognized for clinical quality [26], an innovative leadership team [27], and using health IT to improve quality [20]. The health system was also selected as one of the Centers for Medicare & Medicaid Services (CMS) Pioneer Accountable Care Organizations.
Site Visit
The first 2 authors conducted a 2-day site visit to the Banner Health headquarters in Phoenix, Arizona in November 2013. The team conducted discussions with over 20 individuals, including health system leadership, frontline clinicians in several units of an acute care hospital, staff members in 2 telehealth hubs—including a tele-ICU hub—and trainers in a simulation facility that is used for staff training. The discussions were conducted with groups of staff or on an individual basis, as appropriate. At the outset of the project, an environmental scan of relevant grey and peer-reviewed literature was conducted under contract on behalf of the authors to guide data collection and analysis [28]. An interview protocol was created to guide the discussions. The protocol contained modules that were used during each discussion, if relevant. The modules addressed topics such as technical issues with designing and deploying health information technology functionalities such as clinical decision support systems, the organizational processes and structures needed to launch health care improvement initiatives, and using health information technology care coordination. Within each module, questions probed about the challenges that arose and the solutions to these challenges, with a focus on the four phases of implementing a health information technology intervention: functionality planning, software customization and workflow design, training and user support, and optimization. To assist with interpreting the qualitative findings, an evolving outline of the findings was maintained. Salient themes and conceptual categories were tracked, which helped the researchers organize, synthesize, and interpret the information collected during the site visit. Once the authors chose to focus on clinical decision support, summary notes from the discussions were reviewed for relevant information, and this information was compiled and organized under the rubric of the four implementation phases. The findings and key themes from the discussion notes were distilled into key lessons for the field.
Data obtained included the percentage of pediatric patients with suspected appendicitis who received ultrasounds and CT scans each month from 1 October 2010 through 31 March 2012. Banner Health staff originally collected the data to support the implementation of health care improvement initiative; the use of these data in this paper is a secondary use [29].
This manuscript was prepared using the SQUIRE 2.0 guidelines [30]. No patient-identifiable data were used, so institutional review board approval was not sought.
Results
The 4 steps of implementing CDS can be described as functionality planning, software customization and workflow design, training and user support, and optimization [31].
Pre-Implementation
The use of computerized provider order entry (CPOE) is a precursor to using clinical decision support, since orders must be entered electronically to be subject to CDS review. Banner Health deployed CPOE to its various facilities starting in 2008. The deployment was staged in a rolling fashion with one or two facilities going live every few months so that the deployment team was available at each facility.
Phase 1: Planning
In contrast to many large health systems, the organization has a single board of directors that oversees the entire system of over 37,000 employees. Activities and relationships to promote the use of evidence-based practices are built into the organizational structure. For example, Banner Health maintains a Care Management Council, a group comprised of clinical and administrative leadership to provide executive oversight of health care improvement projects. The Council convenes on a quarterly basis to review and approve the adoption of new clinical practice guidelines, policies, and standardized standing orders that have been developed by multidisciplinary groups of physicians and other clinicians. A key focus of the Council is ensuring consistent application of evidence-based guidelines to clinical care and disseminating knowledge of clinical best practices across a large and complex enterprise.
Interdisciplinary clinical consensus groups support the Council’s work. These groups are comprised of administrative and program management staff, physicians and other clinicians, and engineers. Each clinical consensus group focuses on emerging issues and improvement opportunities within a specific clinical domain and leads the implementation of health care improvement initiatives in that domain. Providers and staff at all levels of the organization were involved in planning and implementing the health care improvement initiative in inappropriate imaging. This increased buy-in and staff support, which are associated with successful health care improvement initiatives [32]. Banner Health staff rallied around the idea of addressing inappropriate imaging as a key priority initiative. The teams that implement each initiative include an engineer that focuses on redesigning clinical workflows for each initiative. There is also an organizational unit responsible for project management that provides teams with logistical and operational support.
Phase 2: Software Customization and Workflow Redesign
Once the clinical consensus group selected inappropriate imaging as a priority, the next step was to examine the process flow for imaging ordering. In 2011 Banner Health integrated CDS functionality with CPOE into the electronic health record. Before the use of CDS, inpatient and emergency department imaging orders were simply transmitted to imaging staff after the order was entered. After CDS implementation, the process flow begins with an inpatient imaging order and entailed checking the order against clinical guidelines on the proper use of imaging. If the image order did not conform to guidelines, which in this case indicate that ultrasound should be used before CT scans as a diagnostic tool for suspected pediatric appendicitis, the CDS system triggered an alert [15].
Bringing the perspective and skill sets of engineers to the process of redesigning clinical workflows was particularly valuable [33]. While CDS has the potential to reduce inpatient inappropriate imaging, effectiveness depends on adjusting workflows to ensure that the information provided by CDS alerts and reminders is actionable. To reduce alert fatigue among the clinical staff, the team identified the appropriate level of workflow interruption for each alert and reminder (hard stop, workflow interruption, or informational) [5,6].
The design principles that were used to design the alert include intuitive system development to promote ease of use, one set of screen formats and data definitions, and a set of consistent core reports and standard system output formats across facilities. The alert’s appearance was tailored for maximal impact and covered most of the screen. Color contrast was used, but since some people are color-blind, the meaning of the alert did not depend on the color contrast. The alerts included recommendations for changing the treatment plan to encourage using ultrasound as a first-line diagnostic tool. Minimizing the number of clicks to accept the proposed treatment plan change in the alert is desirable.
Phase 3: Training and User Support
Training and support structures and tools were critical to the rollout of the inappropriate imaging alerts. Providers were reminded about clinical best practices and informed during staff meetings about the new CDS rules. In addition, various types of training and support were available to clinicians and staff during the rollout process. Dedicated time for end-user training provided an opportunity to identify and cultivate super-users. These super-users not only helped provide technical support to their colleagues, but also helped create excitement for the initiative. A centralized support desk provided telephone support for providers in facilities throughout the Banner Health system. Site managers were provided toolkits to support providers and staff throughout the implementation process. The toolkits included frequently asked questions and answers, and were maintained as ‘living documents’ that were updated based on emerging issues and questions.
To keep things on track, project managers from the central project management department were involved in the initiative to provide direct project management services to the initiative. They also worked to instill project management competencies throughout the organization, applying a train-the-trainer approach to disseminate best practices for enhancing communication among team members, implementing workflow changes, and monitoring the results.
Phase 4: Optimization
The optimization phase is continuous and continues to the present day. Notably, the success of the CDS rules depends on the availability of current clinical information for each patient, in addition to information about the treatment plan. For this initiative, Banner Health maintained aggregated clinical patient data in the data warehouse that aggregated data from disparate sources, including billing and EHR data from different care settings such as ambulatory offices, inpatient units, the emergency department, home care, and ambulatory surgery centers. The data warehouse is housed in a strategically chosen physical location to minimize the threat of natural disasters, and cloud-based backup is also used. A master patient index and provider credentialing system are integrated with the data warehouse. Query-based health information exchange is used, when possible, to collect information on care received by patients outside of the Banner Health system.
It is important to note that many CDS alerts are over-ridden without changes to clinical care [34]. Previous research indicates that alert fatigue from “false positives” can impede the effectiveness of alerts [35]. Banner Health monitors the rate at which CDS alerts are over-ridden. Figure 1 shows the percentage of all alerts for radiation exposure—including the alert related to using ultrasound as a diagnostic tool for pediatric appendicitis—that led to order cancellations. The percentage of CT orders that generated the alert and were cancelled fell from 18.9% in March 2011 to 13.6% in February 2012. The rate of order cancellations might have declined over time due to a change in provider behavior from the alert. That is, if inappropriate CT scan orders declined over time, then providers would cancel a decreasing percentage of the CT scan orders that prompted an alert.
Imaging Use
In Figure 2, data on the use of the 2 imaging procedures for the diagnosis of pediatric appendicitis is presented. During the fourth quarter of 2010, almost half of pediatric patients with suspected appendicitis received a CT scan and only about 1 in 7 received an ultrasound. After the clinical decision support alert was put in place to remind providers to perform an ultrasound as a first-line diagnostic tool, the use of ultrasounds increased sharply. By the first quarter of 2012, ultrasounds were performed in 40.8% of these cases and the use of CT scans declined to 39.9% of suspected pediatric appendicitis cases.
Discussion
This case study discusses the application of CDS functionality in a health care improvement initiative to address inappropriate imaging in a large health system. Four main implementation lessons emerge for the field. First, it is important to involve all levels of staff in the planning process to ensure that health care improvement activities are prioritized correctly and to build buy-in for the priorities addressed with health care improvement activities. Second, it is necessary to allow time to design the alert or reminder, as well as testing it during the implementation process to ensure that clinical guidelines are being properly applied. Third, re-engineering the workflow and ensuring usability of the alert or reminder are important, and using the skills of trained engineers helps in this process. Ensuring the availability of trained ultrasound staff was particularly important to this initiative. Finally, the effectiveness of CDS depends on having complete data for each patient, as well as up-to-date information on the relevant evidence-based practice guidelines.
These results can help guide the implementation of health care improvement initiatives that use CDS functionality to address inappropriate imaging. The adoption of electronic health records with CDS functionality was incentivized and supported by the Medicare and Medicaid Electronic Health Record Incentive Programs; the Medicare program now exists as part of MACRA. Using CDS to reduce inappropriate imaging is required for Medicare fee-for-service patients in the 2014 Protecting Access to Medicare Act (PAMA), highlighting the critical nature of these results, which can guide implementation of CDS to reduce inappropriate imaging [41].
As noted above, the optimization phase is continuous. Banner Health still encourages use of ultrasounds as a first-line diagnostic tool for pediatric appendicitis. Identifying which patients should immediately receive CT scans is difficult, and sometimes the decision depends on the availability of staff to conduct the ultrasound scans. Ways to maximize the productivity of ultrasound technicians have been explored. Another focus area since the original implementation of this health care improvement initiative has been health information exchange, to ensure that complete, up-to-date information is available for each patient.
Banner Health often implements CDS in conjunction with other health IT functionalities. For example, CDS and telehealth are used together to improve care in the intensive care unit (ICU) for patients with sepsis and delirium. An offsite hub of experienced ICU physicians and nurses remotely monitors ICU patients in facilities across Banner Health, using cameras with zoom capability. The intensive care specialists in the tele-hub act as part of the care team; in addition to receiving video feed, they communicate verbally with patients and ICU staff members. Predictive analytics are used to generate clinical decision support alerts and reminders, with a special focus on early intervention if a patient’s clinical indicators are trending downward. The 4 lessons described in this study were also used in the ICU sepsis and delirium initiative; staff were involved in the planning process, alerts and reminders were thoroughly tested, the workflow was adjusted to accommodate the physicians in the tele-ICU hub, and up-to-date and complete clinical information for each patient is maintained. In addition, the design principles for alerts described in this study, such as covering most of the screen and providing recommendations for changing the treatment plan within the alert itself, were also used in the ICU sepsis and delirium initiative.
One limitation of this study is that it was conducted at a single health system. Thus, the findings might not be generalizable to other health systems, particularly if a robust health IT infrastructure is not in place. The culture of Banner Health values quality and involved providers and staff at all levels in selecting and implementing health care improvement initiatives. In addition, engineers assisted with implementation. Finally, the study design does not permit conclusions about the causality of the decline in CT scans and the increase in ultrasounds for suspected pediatric appendicitis cases; unobserved factors might have contributed to the changes in CT and ultrasound use.
Future research should focus on ways to improve the implementation and organization learning process, particularly through engagement of frontline staff by leadership [36] and explore how to operationalize previous findings indicating that innovations in hospital settings are more likely to be sustained when intrinsically rewarding to staff, either by making clinician and staff jobs easier to perform or more gratifying [37]. Future research should focus on facilitating health information exchange between providers in different health systems.
Disclaimer: The views expressed in the article are solely the views of the authors and do not represent those of the National Institutes of Health or the U.S. Government.
Acknowledgments: The authors wish to thank the Banner Health team for taking time to share their insights on how health information technology can be used for health care improvement initiatives, especially John Hensing. We also thank Michael Furukawa of the Agency for Healthcare Research and Quality, formerly of the Office of the National Coordinator for Health Information Technology, who played a key role in the conceptualization of this study and data collection.
Corresponding author: Emily Jones, PhD, MPP, National Institutes of Health, 6001 Executive Blvd., #5232 Rockville, MD 20852, emilybjones@gmail.com.
Financial disclosures: None
1. Lehnert B, Bree R. Analysis of appropriateness of outpatient CT and MRI referred from primary care clinics at an academic medical center: how critical is the need for improved decision support? J Am Coll Radiol 2010;7:192–7.
2. Ip I, Schneider L, Hanson R, et al. Adoption and meaningful use of computed physician order entry with an integrated clinical decision support system for radiology: ten-year analysis in an urban teaching hospital. J Am Coll Radiol 2012;9:129–36.
3. Bernardy M, Ullrich C, Rawson J, et al. Strategies for managing imaging utilization. J Am Coll Radiol 2009;6:844–50.
4. Amland R, Dean B, Yu HT et al. Computed clinical decision support to prevent venous thromboembolism among hospitalized patients: proximal outcomes from a multiyear quality improvement project. J Healthcare Qual 2015;37:221–31.
5. Kahn C. Improving outcomes in radiology: bringing computer-based decision support and education to the point of care. Acad Radiology 2005;12:409–14.
6. Phansalkar S, Desai A, Bell D et al. High-priority drug-drug interactions for use in electronic health records. J Am Med Inform Assoc 2012;19:735–43.
7. Wolfstadt J, Gurwitz J, Field T, et al. The effect of computed physician order entry with clinical decision support on the rates of adverse drug events: a systematic review. J Gen Intern Med 2008;23:451–8.
8. Amland R, Hahn-Cover K. Clinical decision support for early recognition of sepsis. Am J Med Qual 2014;1–8.
9. Amland R, Haley J, Lyons J. A multidisciplinary sepsis program enabled by a two-stage clinical decision support system: factors that influence patient outcomes. Am J Med Qual 2015;1–8.
10. Umscheid C, Hanish A, Chittams J, et al. Effectiveness of a novel and scalable clinical decision support intervention to improve venous thromboembolism prophylaxis: a quasi-experimental study. BMC Med Inform Dec Making 2012;12:92–104.
11. Mack EH, Wheeler DS, Embi PJ. Clinical decision support systems in the pediatric intensive care unit. Pediatric Crit Care Med 2009;10:23–8.
12. Kollef M, Heard K, Chen Y, et al. Mortality and length of stay trends following implementation of a rapid response system and real-time automated clinical deterioration alerts. Am J Med Qual 2015; online first.
13. Ali S, Giordano R, Lakhani S, Walker D. A review of randomized controlled trials of medical record powered clinical decision support system to improve quality of diabetes care. Int J Med Informatics 2016;87:91–100.
14. Gill J, Mainous A, Koopman R et al. Impact of EHR-based clinical decision support on adherence to guidelines for patients on NSAIDs: a randomized controlled trial. Ann Fam Med 2011;9:22–30.
15. Choosing Wisely. Accessed 1 May 2017 at http://www.choosingwisely.org/clinician-lists/#keyword=appendicitis.
16. Hendrickson M, Wey A, Gaillard P, Kharbanda A. Implementation of an electronic clinical decision support tool for pediatric appendicitis within a hospital network. Pediatric Emerg Care 2017 (online first).
17. Kharbanda A, Madhok M, Krause E, et al. Implementation of electronic clinical decision support for pediatric appendicitis. Pediatrics 2016;137:e20151745.
18. Schuh S, Chan K, Langer J, et al. Properties of serial ultrasound clinical diagnostic pathway in suspected appendicitis and related computed tomography use. Acad Emerg Med 2015;22:406–14.
19. Ramarajan N, Krishnamoorthi R, Barth R, et al. An interdisciplinary initiative to reduce radiation exposure: evaluation of appendicitis in a pediatric emergency department with clinical assessment supported by a staged ultrasound and computed tomography pathway. Acad Emerg Med 2009;16:1258–65.
20. HIMSS Analytics. Stage 7 Hospitals. Accessed at www.himssanalytics.org/emram/stage7Hospitals.aspx.
21. Rizer M, et al. Top 10 lessons learned from electronic health record implementation in a large academic medical center. Perspectives in Health Information Management. Summer 2015.
22. Cosgrove DM, Fisher M, Gabow P, et al. Ten strategies to lower costs, improve quality, and engage patients: the view from leading health system CEOs. Health Aff (Millwood) 2013;32:321–7.
23. Cresswell KM, Bates DW, Sheikh A. Ten key considerations for the successful implementation and adoption of large-scale health information technology. J Am Med Inform Assoc 2013 Apr 18.
24. Hensing JA. The quest for upper-quartile performance at Banner Health. J Healthc Qual 2008;30:18–24
25. Hensing J, Dahlen D, Warden M, et al. Measuring the benefits of IT-enabled care transformation. Healthc Financ Manage 2008;62:74–80.
26. Truven Health Analytics. 15 Top Health Systems Study. 6th ed. April 2014. Accessed at http://100tophospitals.com/portals/2/assets/15-Top-Health-Systems-Study.pdf.
27. Aiello M. 2011 Top leadership team awards recognize big moves. Health Leaders Media. August 2011. Accessed at www.healthleadersmedia.com/page-2/LED-269808/2011-Top-Leadership-Team-Awards-Recognize-Big-Moves.
28. Rosenthal D, Stout M. Radiology order entry: features and performance requirements. J Am Coll Radiol 2006;3:554–7.
29. Kirsh S, Wu WC, Edelman D, Aron D. Research versus quality improvement: distinct or a distinction without a difference? A case study comparison of two studies. Jt Comm J Qual Patient Safety 2014;40:365–75.
30. Ogrinc G, Davies L, Goodman D, et al. SQUIRE 2.0 (Standards for Quality Improvement Reporting Excellence): revised publication guidelines from a detailed consensus process. BMJ Qual Saf 2015;0:1–7.
31. Blavin F, Ramos C, Shah A, Devers K. Lessons from the literature on electronic health record implementation.1 Aug 2013. The Urban Institute. Prepared for the Office of the National Coordinator for Health Information Technology. Available at www.urban.org/research/publication/lessons-literature-electronic-health-record-implementation.
32. Needleman J, Pearson ML, Upenieks VV, et al. Engaging frontline staff in performance improvement: the American Organization of Nurse Executives implementation of transforming care at the beside collaborative. Jt Comm J Qual Patient Safety 2016;42:61–9.
33. Jones E, Swain M, Patel V, Furukawa M. Supporting HITECH implementation and assessing lessons for the future: the role of program evaluation. Healthcare: The Journal of Delivery Science and Innovation 2014;2:4–8.
34. Phansalkar S, Zachariah M, Seidling H, et al. Evaluation of medication alerts in electronic health records for compliance with human factors principles. J Am Med Inform Assoc 2014;21:e332–e340.
35. Handler S, Altman R, Perera S, et al. A systematic review of the performance characteristics of clinical event monitor signals to detect adverse drug events in the hospital setting. J Am Med Inform Assoc 2007;14:451–8.
36. Singer S, Rivard P, Hayes J, et al. Improving patient care through leadership engagement with frontline staff: a Department of Veteran Affairs study. Jt Comm J Qual Patient Safety 2013;39):349–60.
37. Brewster A, Curry L, Cherlin E, et al. Integrating new practices: a qualitative study of how hospital innovations become routine. Implement Sci 2015;5(10):168.
Delivering Palliative Care in a Community Hospital: Experiences and Lessons Learned from the Front Lines
From the Division of Palliative Care, Butler Health System, Butler, PA (Drs. Stein, Reefer, Selvaggi, Ms. Doverspike); the University of Pittsburgh Medical Center, Pittsburgh, PA (Dr. Rajagopal); and the Duke Cancer Institute and Duke Fuqua School of Business, Durham, NC (Dr. Kamal).
Abstract
- Objective: To describe an approach to develop a community-centric palliative care program in a rural community health system and to review data collected over the program’s first year.
- Methods: We describe the underlying foundations of our program development including the health system’s prioritization of a palliative care program, funding opportunities, collaboration with community supports, and the importance of building a team and program that reflects a community’s needs. Data were collected through a program-maintained spreadsheet and a data monitoring system available through the Global Palliative Care Quality Alliance.
- Results: 516 new inpatient consultations were seen during the first year, for a penetration of 3.7%. The demographics of the patients who received consultation reflect that of the surrounding community. Over 50% of patients seen within the first year died, and hospice utilization at home and within facilities and inpatient hospice units increased. In addition, 79% of the patients seen by the palliative care team had a confirmed code status of do not resuscitate and do not intubate.
- Conclusions: Butler Health System’s approach to development of a palliative care program has resulted in increasing utilization of palliative care services in the hospital. Having hospital administration support, community support, and understanding the individualized needs of a community has been essential for the program’s expansion.
Key words: palliative care; program development; community hospital; rural.
Since its inception, palliative care has been committed to providing specialty-level consultation services to individuals with serious illness and their loved ones. The field has focused heavily on growth and acceptance, consistently moving upstream with regards to illness trajectory, across diseases, and across demographic variables such as age (eg, pediatric quality of life programs) and race (eg, community outreach programs addressing racial disparities in hospice use). An important frontier that remains challenging for much of the field is expansion into the community setting, where resources, implicit acceptance, and patient populations may vary.
As health system leaders appreciate the positive impacts palliative medicine on patient care and care quality, barriers to implementing palliative care programs in community hospitals must be addressed in ways tailored to the unique needs of smaller organizations and their communities. The goal of this paper is to outline the approach taken to develop Butler Health System’s community-centric palliative care program, describe our program’s underlying foundation rooted in community supports, and recount steps we have taken thus far to impact patient care in our hospital, health system, and community through the program’s first year.
Community Hospital Palliative Care—The Necessity and the Challenges
Palliative care has made strides in its growth and acceptance in the last decade; yet, the distribution of that growth has been skewed. Although 67% of hospitals now report access to specialist palliative care programs, most of the 148% growth over the last decade has been actualized in larger hospitals. Ninety percent of hospitals with greater than 300 beds report palliative care service availability whereas only 56% of small hospitals were identified to have this specialty care [1].
The inequity of access is also seen in other countries. A recent Canadian study retrospectively examined access to care of 23,860 deceased patients in Nova Scotia. Although they found 40.9% of study subjects were enrolled in a palliative care program at urban, academic centers, patients in a rural setting were only a third as likely to be enrolled in a palliative care program [2]. This access gap has important effects on patient-level outcomes, as evidence has consistently demonstrated that patients in rural settings who receive palliative care have decreased unnecessary hospitalizations and less in-hospital deaths [3].
While evidence of improved outcomes is strong, important barriers stand in the way. In a 2013 study, 374 health care providers at 236 rural hospitals in 7 states were interviewed to determine barriers to providing palliative care in rural settings. Barriers identified include a lack of administrative support, access to basic palliative care training for primary care physicians, and limited relationships to hospices [4]. Additional challenges include lack of access to tertiary-level specialty clinicians, access to and misconceptions about prescription medications, transportation for patients and providers, and incorporating a patient’s community supports [5–7].
Proposed Solutions
Techniques to improve palliative care access for rural and community centers that have been previously reviewed in the literature include videoconferencing with tertiary care experts in palliative care and education through small community-level lectures [8–10]. Goals of rural and suburban palliative care programs are broadly similar to programs at academic medical centers; however, few studies have identified impact of palliative medicine on patient care in community settings. In one suburban practice, a study found that patients were more likely to die at home if they had multiple caregivers, increased length of time under palliative care, and older age upon referral [11].
The United States has few large-scale pilot programs attempting to address the palliative needs of a more suburban or rural population. Of these, the Minnesota Rural Palliative Care Initiative developed by Stratis Health is perhaps the best publicized. Stratis Health developed and led an 18-month learning collaborative from October 2008 to April 2010 through which community teams developed or improved palliative care services. Through this initiative, a community-based health care practice model was developed that took advantage of the strong interrelationships within rural communities. After 18 months, 6 out of 10 rural Minnesota communities had formal palliative care programs, and 8 to 9 out of 10 had capabilities to at least address advance directives as well as provider and community education [12]. In another initiative, the NIH established a new suburban clinic with tertiary providers specifically for resource intensive, underserved patients [13]. The clinic was established by partnering with a service that was already in place in the community. Twenty-seven patients were seen within 7 months. The most common consults were patients with numerous comorbidities and chronic pain rather than terminal diagnoses. Given the intensive need of these patients, the authors felt that a consultation service and an interdisciplinary team that included psychosocial/spiritual/social work providers offered the most efficient method of delivering advanced palliative care needs.
The research regarding both solutions to challenges and novel methods of addressing the care gap remains sparse as evidenced by the conclusions of multiple systematic reviews and meta-analyses and the inability of the Cochrane review to find papers meeting inclusion criteria regarding techniques of community support in palliative care [14,15]. There remains a need to identify practical techniques of implementing palliative care in rural and suburban settings.
The Butler Health System Experience
In August 2015, we set out to start the first hospital-based palliative care consultation service in the Butler Health System. The health system is a nonprofit, single-hospital system anchored by Butler Memorial Hospital, a 294-bed community hospital located within a rural Pennsylvania county of 186,000 residents, 35 miles north of Pittsburgh. Butler County consists of a predominantly white, non-Hispanic population with over 15% of the residents being older than 65 years of age. The median household income is $61,000 earned primarily through blue collar occupations [16]. Driven by 53 employed primary care physicians, the health system provides services for 75,000 patients at sites covering an area of 4000 square miles. The hospital provides general medical, critical, surgical and subspecialty care and behavior health services as a regional referral center for 4 surrounding rural counties, accepting 12,500 inpatient admissions annually. A hospitalist service admits the majority of oncology patients, and the intensive care unit (ICU) is an open unit, where patients are admitted to the hospitalist, primary care, or surgical service.
While no formal needs assessment was performed prior to program development, perceptions of inadequate pain control, overuse of naloxone, underutilization of hospice services, and lack of consistent quality in end-of-life care were identified. These concerns were voiced at the levels of direct patient care on the floors, and by nursing and physician hospital leadership. Prior to our program, the chief medical officer attended the national Center to Advance Palliative Care conference to better understand the field of palliative care and its impact on improving quality of care. Concurrently, our health system was expanding its inpatient capabilities (eg, advanced neurologic and cardiac services), resulting in admissions with increased disease severity and illness complexity. With the vision of improved patient care, prioritizing quality end-of-life care and symptom management, the hospital board and administration overwhelmingly supported the development of the palliative care program, philosophically and financially.
Laying a Foundation—Funding, Collaboration, and Team Building
Funding and staffing are 2 important factors when building any program. Sources of funding for palliative care programs may include hospital support, billing revenue, grants, and philanthropy. Program development was a priority for the hospital and community. To help offset costs, efforts to raise financial support focused on utilizing the health system’s annual fundraising events. Through the generosity of individuals in the community, the hospital’s annual gala event, and donations from the hospital’s auxiliary, a total of $230,000 was raised prior to program initiation. Funds budgeted through direct hospital support and fundraising were allocated towards hiring palliative care team members and community marketing projects.
The hospital’s surrounding community is fortunate to have 2 local inpatient hospice facilities, and these relationships were imperative to providing quality end-of-life care preceding our palliative care program. A formal partnership was previously established with one while the other remains an important referral facility due to its proximity to the hospital. These hospice services are encouraged to participate in our weekly palliative care interdisciplinary team meetings. Their incorporation has improved coordination, continuity, and translation of care upon patient discharge from the acute hospital setting. Additionally, the relationships have been beneficial in tracking patients’ outcomes and data collection.
The standard structure of a palliative care team described by the Joint Commission and National Consensus Panel for Palliative Care consists of a physician, registered nurse or advanced practice provider, chaplaincy, and social work. Despite this recommendation, less than 40% of surveyed hospitals met the criteria, and less than 25% have dedicated funding to cover these positions [17]. Upon inception of our palliative care program, 2.6 funded full-time equivalents (FTEs) were allocated. These positions included a physician (1.0 FTE), a physician assistant (1.0 FTE), and a part time palliative care social worker (0.6 FTE). The 2015 National Palliative Care Registry found that 3.2 funded FTEs per 10,000 admissions is the average for hospitals with 150 to 299 beds [17]. The uncertainty of the utilization and consult volume, and the limited amount of qualified palliative care trained practitioners, resulted in the palliative program starting below this mean at 2.1 funded FTEs per 10,000 admissions. All the funded positions were located on site at the hospital. The pre-existing volunteer hospital chaplain service was identified as the pastoral care component for the program.
Increased FTEs have been associated with increased palliative care service penetration and ultimately in decreased time to consult [18]. In response to increasing consult volumes, concerns for delays in time to consult, and in preparation for expansion to an outpatient service, the palliative care department acquired an additional funded physician FTE (1.0). Ultimately the service reached a total of 3.6 FTE for inpatient services during its first 12 months; proportionately this resulted in an increase to 2.9 FTE per 10,000 admissions based on the yearly admission rate of 12,500 patients.
Educational Outreach
The success of a palliative care program depends on other clinicians’ acceptance and referral to the clinical program. We took a 2-pronged approach, focusing on both hospital-based and community-based education. The hospital-based nursing education included 30-minute presentations on general overviews of palliative care, differences between palliative care and hospice, and acute symptom management at the end of life. The palliative care team presented to all medical, surgical, and intensive care units and encompassed all shifts of nursing staff. These lectures included pre- and post-tests to assess for impact and feedback. Similar educational presentations, as well as an hour-long presentation on opioids and palliative care, were available for physicians for CME opportunities. We also distributed concise palliative care referral packets to outpatient primary care offices through the health system’s marketing team. The referral packets included examples of diagnoses, clinical scenarios, and symptoms to assist in the physicians’ understanding of palliative care services. The palliative care team also met with clinic office managers to discuss the program and answer questions.
There were also educational opportunities for patients and families in our community. Taking advantage of previously developed partnerships between the hospital system and local media outlets, the palliative care team performed local radio spots to educate the community on topics including an overview of palliative care, how to request palliative care, and the difference between palliative care and hospice care. We partnered with a local hospice agency and developed a well-received bereavement seminar for patients, family members, and employees and included the topic of advanced care planning.
Data Collection
We collect data using 2 different tools: a self-maintained spreadsheet shared between our palliative care clinicians, and a collective data tool (QDACT) included in our membership with and maintained by the Global Palliative Care Quality Alliance. Data collected and tracked in our spreadsheet includes date of consult, patient age, primary and secondary diagnoses, disposition, goals of care discussions, date of death, and 30-day readmissions. Through the QDACT data monitoring program, we are tracking and analyzing quality measures including symptom assessment and management and code status conversion. The QDACT database also provides financial data specific to our institution such as cost savings based on our billing, readmission rates, and length of stay.
Results
Projections, Volumes, and Penetration
Prior to the start of our program, our chief medical office used Center to Advance Palliative Care tools to project inpatient consultation volumes at our institution. Variables that are recommended by this center to guide projections include number of hospital admissions per year, hospital occupancy, disposition to hospice, as well as generalized estimations of inpatient mortality rates. Based on our data, it was expected that our program would receive 204 new inpatient consults in our first year, and 774 follow-up visits. Our actual new inpatient consults totaled 516, with 919 follow-up visits. Palliative care penetration (percentage of annual hospital admissions seen by the palliative care team) our first year was 3.7% (Table 1). 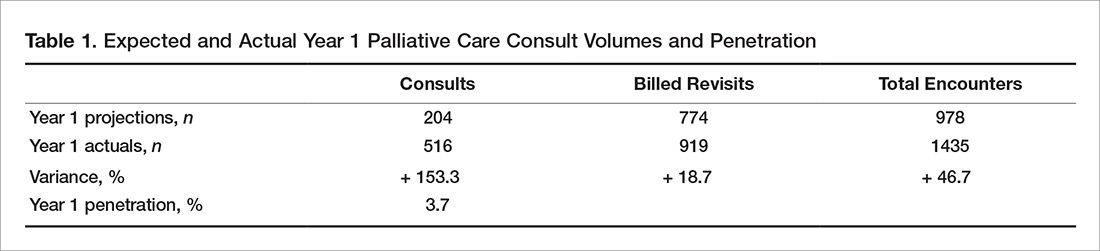
Consultation Demographics
The demographics of the patients seen by the palliative care team reflect that of Butler County’s Medicare fee-for-service (FFS) population (Table 2); however, differences were seen at the state and national level with regard to ethnicity (Table 2). 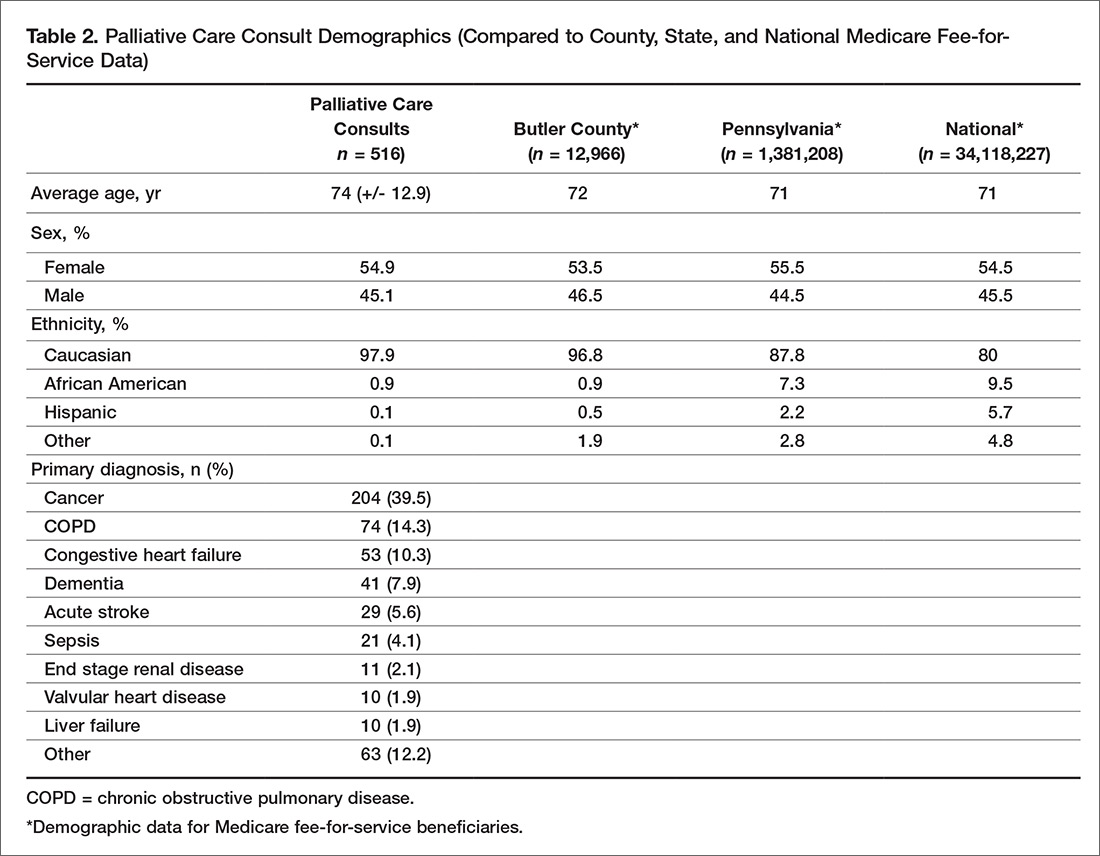
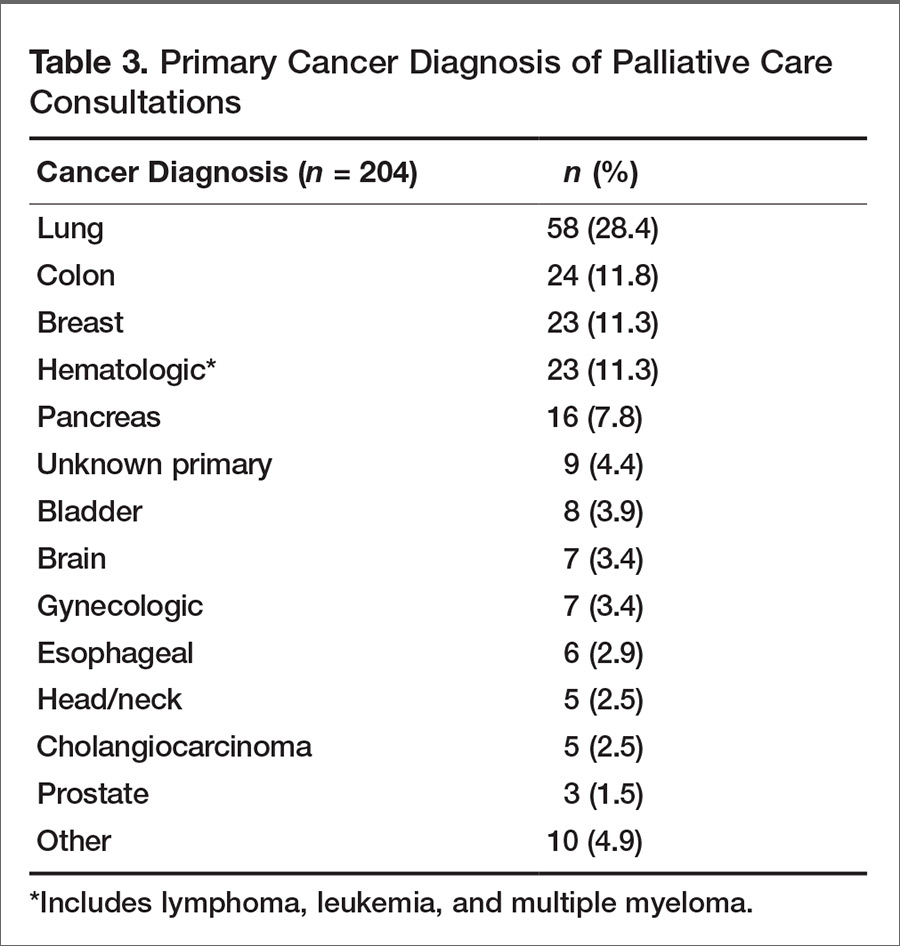
Almost half of consultations (49%) were placed by the hospitalist service. Since the ICU is an open unit, critical care consults are not adequately reflected by analysis of the ordering physician alone. Analysis of consultation location revealed that 27% of inpatient consults were located within the ICU.
Patient Outcomes and Disposition
Outcomes and discharge data from the first year were collected and reviewed. Ten percent of the patients seen by palliative care died in the hospital, and 51% of patients that were seen by palliative care died within the program’s first year. Thirty-seven percent of patients discharged from the hospital utilized hospice services at home, in residential nursing facility, or at an inpatient hospice unit. The remaining 53% were discharged without hospice services to home or facility (Figure).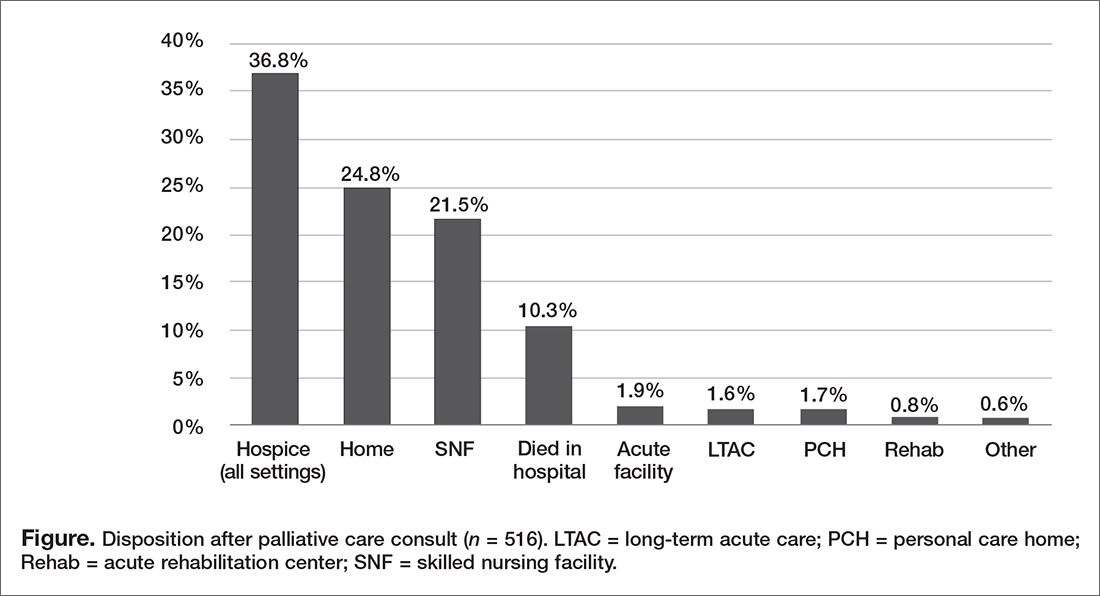
Hospice utilization by the health system increased during our first year. Compared to the 2014 calendar year, there were a total of 263 referrals for hospice services. During the first year of the palliative care program, which started August 2015, there were a total of 293 referrals. Of the 293 total hospice referrals, 190 (64.8%) of these referrals were for patients seen by the palliative care team.
Change of Code Status
Code status and changes in codes status data were collected. Of 462 individual patients prior to or at the time of palliative care consults, 43% were full code, 4% limited code, 8% unknown status, and 45% Do Not Resuscitate. After palliative care consult, 61% of the patients who were previously full/limited/unknown converted to do not resuscitate and do not intubate status. In total, 79% of patients seen by palliative care had a confirmed code status of Do Not Resuscitate and Do Not Intubate status after consult.
Discussion
In our first year, our palliative care program exceeded the expected number of inpatient consults, corresponding with a penetration of 3.7%. With the increase of funded FTEs, preliminary data shows that the department’s penetration continues to rise remaining consistent with the data and expectations [18]. During the second year, it is anticipated that over 600 inpatient palliative care consultations will be performed with an estimated penetration of 4%. This increasing penetration reflects the rising utilization of palliative care within our hospital. Since inception of the program, the service has expanded into an outpatient clinic 2 days per week. The palliative care clinic is staffed by a registered nurse (funded 0.6 FTE) and covered by the same physicians and physician assistant providing the inpatient services. The department acquired an unfunded but designated chaplaincy volunteer to assist with patients’ spiritual needs. We believe that the success of our program during the first year was related to multiple factors: a focus of integration and education by the palliative care department, health system administration buy-in, and identification of surrounding community needs.
In addition to patient care, our palliative care department also prioritizes “tangible” impacts to better establish our contributions to the health system. We have done this through participation on hospital committees, hospital policy revision teams, and by developing innovative solutions such as a terminal extubation protocol and order set for our ICU. The health system and its administration have recognized the importance of educating nursing and physician staff on palliative care services, and have supported these continued efforts alongside our clinical obligations.
Concurrent with administration buy-in, financial supports for our palliative care services were initially supplemented by the health system. Our department understands the importance of recognizing limitations of resources in communities and their hospitals. In efforts to minimize the department’s impact on our own health system’s financial resources, we have strived to offset our costs. We helped the hospital system meet pay-for-performance palliative care metrics set by the large local insurers resulting in financial hospital reimbursement valued at $600,000 in 2016.
The question of how the program may translate into other communities raises a major limitation: the homogeneity our population. The community surrounding the hospital is primarily Caucasian, with minimal representation of minority populations. While the patient population seen by our palliative care team is reflective of our surrounding county, it does not represent Medicare FFS beneficiaries on a national level or many other types of community hospitals across the country. Variations of ethnicity, age, diagnoses, and faith are fundamental, which highlights the importance of understanding the community in which a program is developed.
The rising trajectory of our palliative care service utilization has prompted a discussion of future endeavors for our program. Expectations for a continued shortage of hospice and palliative care physicians [19] and concerns for practitioner burnout [20] underlie our thoughtful approach to expansion of inpatient and outpatient services. At this time, potential projects include a consultation trigger system and incorporation of palliative care providers in ICU rounding, as well as possible expansion of outpatient services through implantation of an advanced practitioner into surrounding nursing homes and primary care offices.
We have found a growing utilization of our program at Butler Health System. Our first year experience has highlighted the importance of identifying community and hospital administrative champions as a foundation. Additionally, understanding the specific characteristics of one’s surrounding community may allow for improved integration and acceptance of palliative care in a community setting. Our program continues to work with the health system, community, and philanthropic organizations to expand the ever-growing need for palliative care services.
1. Dumanovsky T, Augustin R, Rogers M, et al. The growth of palliative care in U.S. hospitals: a status report. J Palliat Med 2016;19:8–15.
2. Lavergne MR, Lethbridge L, Johnston G, et al. Examining palliative care program use and place of death in rural and urban contexts: a Canadian population-based study using linked data. Rural Remote Health 2015;15:3134.
3. Seow H, Brazil K, Sussman J, et al. Impact of community based, specialist palliative care teams on hospitalisations and emergency department visits late in life and hospital deaths: a pooled analysis. BMJ 2014;348:g3496.
4. Fink RM, Oman KS, Youngwerth J, et al. A palliative care needs assessment of rural hospitals. J Palliat Med 2013;16:638–44.
5. Dumont S, Jacobs P, Turcotte V, et al. Palliative care costs in Canada: A descriptive comparison of studies of urban and rural patients near end of life. J Palliat Med 2015;29:908–17.
6. Kaasalainen S, Brazil K, Williams A, et al. Nurses' experiences providing palliative care to individuals living in rural communities: aspects of the physical residential setting. Rural Remote Health 2014;14:2728.
7. Ahmed N, Bestall JC, Ahmedzai SH, et al. Systematic review of the problems and issues of accessing specialist palliative care by patients, carers and health and social care professionals. J Palliat Med 2004;18:525–42.
8. Ray RA, Fried O, Lindsay D. Palliative care professional education via video conference builds confidence to deliver palliative care in rural and remote locations. BMC Health Serv Res 2014;14:272.
9. Bakitas MA, Elk R, Astin M, et al. Systematic review of palliative care in the rural setting. Cancer Control 2015;22:450–64.
10. Akiyama M, Hirai K, Takebayashi T, et al. The effects of community-wide dissemination of information on perceptions of palliative care, knowledge about opioids, and sense of security among cancer patients, their families, and the general public. Support Care Cancer 2016;24: 347–56.
11. Maida V. Factors that promote success in home palliative care: a study of a large suburban palliative care practice. J Palliat Care 2002;18:282–6.
12. Ceronsky L, Shearer J, Weng K, et al. Minnesota Rural Palliative Care Initiative: building palliative care capacity in rural Minnesota. J Palliat Med 2013;16:310–3.
13. Aggarwal SK, Ghosh A, Cheng MJ, et al. Initiating pain and palliative care outpatient services for the suburban underserved in Montgomery County, Maryland: Lessons learned at the NIH Clinical Center and MobileMed. Palliat Support Care 2015;16:1–6.
14. Rainsford S, MacLeod RD, Glasgow NJ. Place of death in rural palliative care: A systematic review. J Palliat Med 2016;30:745–63.
15. Horey D, Street AF, O'Connor M, et al. Training and supportive programs for palliative care volunteers in community settings. Cochrane Database Syst Rev 2015 Jul 20;(7):CD009500.
16. The United States Census Bureau: QuickFacts: Butler County, Pennsylvania. Accessed 10 Mar 2017 at www.census.gov/quickfacts/table/PST045216/42019,00.
17. Spetz J, Dudley N, Trupin L, et al. Few hospital palliative care programs meet national staffing recommendations. Health Aff 2016;35:1690–7.
18. Dumanovsky T, Rogers M, Spragens LH, et al. Impact of Staffing on Access to Palliative Care in U.S. Hospitals. J Palliat Med. 2015 Dec; 18(12). Pages 998-999.
19. Lupu D, American Academy of Hospice and Palliative Medicine Workforce Task Force. Estimate of current hospice and palliative medicine physician workforce shortage. J Pain Symptom Manage 2010;40:899–911.
20. Kamal AH, Bull JK, Wolf SP, et al. Prevalence and predictors of burnout among hospice and palliative care clinicians in the U.S. J Pain Symptom Manage 2016;51:690–6.
From the Division of Palliative Care, Butler Health System, Butler, PA (Drs. Stein, Reefer, Selvaggi, Ms. Doverspike); the University of Pittsburgh Medical Center, Pittsburgh, PA (Dr. Rajagopal); and the Duke Cancer Institute and Duke Fuqua School of Business, Durham, NC (Dr. Kamal).
Abstract
- Objective: To describe an approach to develop a community-centric palliative care program in a rural community health system and to review data collected over the program’s first year.
- Methods: We describe the underlying foundations of our program development including the health system’s prioritization of a palliative care program, funding opportunities, collaboration with community supports, and the importance of building a team and program that reflects a community’s needs. Data were collected through a program-maintained spreadsheet and a data monitoring system available through the Global Palliative Care Quality Alliance.
- Results: 516 new inpatient consultations were seen during the first year, for a penetration of 3.7%. The demographics of the patients who received consultation reflect that of the surrounding community. Over 50% of patients seen within the first year died, and hospice utilization at home and within facilities and inpatient hospice units increased. In addition, 79% of the patients seen by the palliative care team had a confirmed code status of do not resuscitate and do not intubate.
- Conclusions: Butler Health System’s approach to development of a palliative care program has resulted in increasing utilization of palliative care services in the hospital. Having hospital administration support, community support, and understanding the individualized needs of a community has been essential for the program’s expansion.
Key words: palliative care; program development; community hospital; rural.
Since its inception, palliative care has been committed to providing specialty-level consultation services to individuals with serious illness and their loved ones. The field has focused heavily on growth and acceptance, consistently moving upstream with regards to illness trajectory, across diseases, and across demographic variables such as age (eg, pediatric quality of life programs) and race (eg, community outreach programs addressing racial disparities in hospice use). An important frontier that remains challenging for much of the field is expansion into the community setting, where resources, implicit acceptance, and patient populations may vary.
As health system leaders appreciate the positive impacts palliative medicine on patient care and care quality, barriers to implementing palliative care programs in community hospitals must be addressed in ways tailored to the unique needs of smaller organizations and their communities. The goal of this paper is to outline the approach taken to develop Butler Health System’s community-centric palliative care program, describe our program’s underlying foundation rooted in community supports, and recount steps we have taken thus far to impact patient care in our hospital, health system, and community through the program’s first year.
Community Hospital Palliative Care—The Necessity and the Challenges
Palliative care has made strides in its growth and acceptance in the last decade; yet, the distribution of that growth has been skewed. Although 67% of hospitals now report access to specialist palliative care programs, most of the 148% growth over the last decade has been actualized in larger hospitals. Ninety percent of hospitals with greater than 300 beds report palliative care service availability whereas only 56% of small hospitals were identified to have this specialty care [1].
The inequity of access is also seen in other countries. A recent Canadian study retrospectively examined access to care of 23,860 deceased patients in Nova Scotia. Although they found 40.9% of study subjects were enrolled in a palliative care program at urban, academic centers, patients in a rural setting were only a third as likely to be enrolled in a palliative care program [2]. This access gap has important effects on patient-level outcomes, as evidence has consistently demonstrated that patients in rural settings who receive palliative care have decreased unnecessary hospitalizations and less in-hospital deaths [3].
While evidence of improved outcomes is strong, important barriers stand in the way. In a 2013 study, 374 health care providers at 236 rural hospitals in 7 states were interviewed to determine barriers to providing palliative care in rural settings. Barriers identified include a lack of administrative support, access to basic palliative care training for primary care physicians, and limited relationships to hospices [4]. Additional challenges include lack of access to tertiary-level specialty clinicians, access to and misconceptions about prescription medications, transportation for patients and providers, and incorporating a patient’s community supports [5–7].
Proposed Solutions
Techniques to improve palliative care access for rural and community centers that have been previously reviewed in the literature include videoconferencing with tertiary care experts in palliative care and education through small community-level lectures [8–10]. Goals of rural and suburban palliative care programs are broadly similar to programs at academic medical centers; however, few studies have identified impact of palliative medicine on patient care in community settings. In one suburban practice, a study found that patients were more likely to die at home if they had multiple caregivers, increased length of time under palliative care, and older age upon referral [11].
The United States has few large-scale pilot programs attempting to address the palliative needs of a more suburban or rural population. Of these, the Minnesota Rural Palliative Care Initiative developed by Stratis Health is perhaps the best publicized. Stratis Health developed and led an 18-month learning collaborative from October 2008 to April 2010 through which community teams developed or improved palliative care services. Through this initiative, a community-based health care practice model was developed that took advantage of the strong interrelationships within rural communities. After 18 months, 6 out of 10 rural Minnesota communities had formal palliative care programs, and 8 to 9 out of 10 had capabilities to at least address advance directives as well as provider and community education [12]. In another initiative, the NIH established a new suburban clinic with tertiary providers specifically for resource intensive, underserved patients [13]. The clinic was established by partnering with a service that was already in place in the community. Twenty-seven patients were seen within 7 months. The most common consults were patients with numerous comorbidities and chronic pain rather than terminal diagnoses. Given the intensive need of these patients, the authors felt that a consultation service and an interdisciplinary team that included psychosocial/spiritual/social work providers offered the most efficient method of delivering advanced palliative care needs.
The research regarding both solutions to challenges and novel methods of addressing the care gap remains sparse as evidenced by the conclusions of multiple systematic reviews and meta-analyses and the inability of the Cochrane review to find papers meeting inclusion criteria regarding techniques of community support in palliative care [14,15]. There remains a need to identify practical techniques of implementing palliative care in rural and suburban settings.
The Butler Health System Experience
In August 2015, we set out to start the first hospital-based palliative care consultation service in the Butler Health System. The health system is a nonprofit, single-hospital system anchored by Butler Memorial Hospital, a 294-bed community hospital located within a rural Pennsylvania county of 186,000 residents, 35 miles north of Pittsburgh. Butler County consists of a predominantly white, non-Hispanic population with over 15% of the residents being older than 65 years of age. The median household income is $61,000 earned primarily through blue collar occupations [16]. Driven by 53 employed primary care physicians, the health system provides services for 75,000 patients at sites covering an area of 4000 square miles. The hospital provides general medical, critical, surgical and subspecialty care and behavior health services as a regional referral center for 4 surrounding rural counties, accepting 12,500 inpatient admissions annually. A hospitalist service admits the majority of oncology patients, and the intensive care unit (ICU) is an open unit, where patients are admitted to the hospitalist, primary care, or surgical service.
While no formal needs assessment was performed prior to program development, perceptions of inadequate pain control, overuse of naloxone, underutilization of hospice services, and lack of consistent quality in end-of-life care were identified. These concerns were voiced at the levels of direct patient care on the floors, and by nursing and physician hospital leadership. Prior to our program, the chief medical officer attended the national Center to Advance Palliative Care conference to better understand the field of palliative care and its impact on improving quality of care. Concurrently, our health system was expanding its inpatient capabilities (eg, advanced neurologic and cardiac services), resulting in admissions with increased disease severity and illness complexity. With the vision of improved patient care, prioritizing quality end-of-life care and symptom management, the hospital board and administration overwhelmingly supported the development of the palliative care program, philosophically and financially.
Laying a Foundation—Funding, Collaboration, and Team Building
Funding and staffing are 2 important factors when building any program. Sources of funding for palliative care programs may include hospital support, billing revenue, grants, and philanthropy. Program development was a priority for the hospital and community. To help offset costs, efforts to raise financial support focused on utilizing the health system’s annual fundraising events. Through the generosity of individuals in the community, the hospital’s annual gala event, and donations from the hospital’s auxiliary, a total of $230,000 was raised prior to program initiation. Funds budgeted through direct hospital support and fundraising were allocated towards hiring palliative care team members and community marketing projects.
The hospital’s surrounding community is fortunate to have 2 local inpatient hospice facilities, and these relationships were imperative to providing quality end-of-life care preceding our palliative care program. A formal partnership was previously established with one while the other remains an important referral facility due to its proximity to the hospital. These hospice services are encouraged to participate in our weekly palliative care interdisciplinary team meetings. Their incorporation has improved coordination, continuity, and translation of care upon patient discharge from the acute hospital setting. Additionally, the relationships have been beneficial in tracking patients’ outcomes and data collection.
The standard structure of a palliative care team described by the Joint Commission and National Consensus Panel for Palliative Care consists of a physician, registered nurse or advanced practice provider, chaplaincy, and social work. Despite this recommendation, less than 40% of surveyed hospitals met the criteria, and less than 25% have dedicated funding to cover these positions [17]. Upon inception of our palliative care program, 2.6 funded full-time equivalents (FTEs) were allocated. These positions included a physician (1.0 FTE), a physician assistant (1.0 FTE), and a part time palliative care social worker (0.6 FTE). The 2015 National Palliative Care Registry found that 3.2 funded FTEs per 10,000 admissions is the average for hospitals with 150 to 299 beds [17]. The uncertainty of the utilization and consult volume, and the limited amount of qualified palliative care trained practitioners, resulted in the palliative program starting below this mean at 2.1 funded FTEs per 10,000 admissions. All the funded positions were located on site at the hospital. The pre-existing volunteer hospital chaplain service was identified as the pastoral care component for the program.
Increased FTEs have been associated with increased palliative care service penetration and ultimately in decreased time to consult [18]. In response to increasing consult volumes, concerns for delays in time to consult, and in preparation for expansion to an outpatient service, the palliative care department acquired an additional funded physician FTE (1.0). Ultimately the service reached a total of 3.6 FTE for inpatient services during its first 12 months; proportionately this resulted in an increase to 2.9 FTE per 10,000 admissions based on the yearly admission rate of 12,500 patients.
Educational Outreach
The success of a palliative care program depends on other clinicians’ acceptance and referral to the clinical program. We took a 2-pronged approach, focusing on both hospital-based and community-based education. The hospital-based nursing education included 30-minute presentations on general overviews of palliative care, differences between palliative care and hospice, and acute symptom management at the end of life. The palliative care team presented to all medical, surgical, and intensive care units and encompassed all shifts of nursing staff. These lectures included pre- and post-tests to assess for impact and feedback. Similar educational presentations, as well as an hour-long presentation on opioids and palliative care, were available for physicians for CME opportunities. We also distributed concise palliative care referral packets to outpatient primary care offices through the health system’s marketing team. The referral packets included examples of diagnoses, clinical scenarios, and symptoms to assist in the physicians’ understanding of palliative care services. The palliative care team also met with clinic office managers to discuss the program and answer questions.
There were also educational opportunities for patients and families in our community. Taking advantage of previously developed partnerships between the hospital system and local media outlets, the palliative care team performed local radio spots to educate the community on topics including an overview of palliative care, how to request palliative care, and the difference between palliative care and hospice care. We partnered with a local hospice agency and developed a well-received bereavement seminar for patients, family members, and employees and included the topic of advanced care planning.
Data Collection
We collect data using 2 different tools: a self-maintained spreadsheet shared between our palliative care clinicians, and a collective data tool (QDACT) included in our membership with and maintained by the Global Palliative Care Quality Alliance. Data collected and tracked in our spreadsheet includes date of consult, patient age, primary and secondary diagnoses, disposition, goals of care discussions, date of death, and 30-day readmissions. Through the QDACT data monitoring program, we are tracking and analyzing quality measures including symptom assessment and management and code status conversion. The QDACT database also provides financial data specific to our institution such as cost savings based on our billing, readmission rates, and length of stay.
Results
Projections, Volumes, and Penetration
Prior to the start of our program, our chief medical office used Center to Advance Palliative Care tools to project inpatient consultation volumes at our institution. Variables that are recommended by this center to guide projections include number of hospital admissions per year, hospital occupancy, disposition to hospice, as well as generalized estimations of inpatient mortality rates. Based on our data, it was expected that our program would receive 204 new inpatient consults in our first year, and 774 follow-up visits. Our actual new inpatient consults totaled 516, with 919 follow-up visits. Palliative care penetration (percentage of annual hospital admissions seen by the palliative care team) our first year was 3.7% (Table 1).
Consultation Demographics
The demographics of the patients seen by the palliative care team reflect that of Butler County’s Medicare fee-for-service (FFS) population (Table 2); however, differences were seen at the state and national level with regard to ethnicity (Table 2).
Almost half of consultations (49%) were placed by the hospitalist service. Since the ICU is an open unit, critical care consults are not adequately reflected by analysis of the ordering physician alone. Analysis of consultation location revealed that 27% of inpatient consults were located within the ICU.
Patient Outcomes and Disposition
Outcomes and discharge data from the first year were collected and reviewed. Ten percent of the patients seen by palliative care died in the hospital, and 51% of patients that were seen by palliative care died within the program’s first year. Thirty-seven percent of patients discharged from the hospital utilized hospice services at home, in residential nursing facility, or at an inpatient hospice unit. The remaining 53% were discharged without hospice services to home or facility (Figure).
Hospice utilization by the health system increased during our first year. Compared to the 2014 calendar year, there were a total of 263 referrals for hospice services. During the first year of the palliative care program, which started August 2015, there were a total of 293 referrals. Of the 293 total hospice referrals, 190 (64.8%) of these referrals were for patients seen by the palliative care team.
Change of Code Status
Code status and changes in codes status data were collected. Of 462 individual patients prior to or at the time of palliative care consults, 43% were full code, 4% limited code, 8% unknown status, and 45% Do Not Resuscitate. After palliative care consult, 61% of the patients who were previously full/limited/unknown converted to do not resuscitate and do not intubate status. In total, 79% of patients seen by palliative care had a confirmed code status of Do Not Resuscitate and Do Not Intubate status after consult.
Discussion
In our first year, our palliative care program exceeded the expected number of inpatient consults, corresponding with a penetration of 3.7%. With the increase of funded FTEs, preliminary data shows that the department’s penetration continues to rise remaining consistent with the data and expectations [18]. During the second year, it is anticipated that over 600 inpatient palliative care consultations will be performed with an estimated penetration of 4%. This increasing penetration reflects the rising utilization of palliative care within our hospital. Since inception of the program, the service has expanded into an outpatient clinic 2 days per week. The palliative care clinic is staffed by a registered nurse (funded 0.6 FTE) and covered by the same physicians and physician assistant providing the inpatient services. The department acquired an unfunded but designated chaplaincy volunteer to assist with patients’ spiritual needs. We believe that the success of our program during the first year was related to multiple factors: a focus of integration and education by the palliative care department, health system administration buy-in, and identification of surrounding community needs.
In addition to patient care, our palliative care department also prioritizes “tangible” impacts to better establish our contributions to the health system. We have done this through participation on hospital committees, hospital policy revision teams, and by developing innovative solutions such as a terminal extubation protocol and order set for our ICU. The health system and its administration have recognized the importance of educating nursing and physician staff on palliative care services, and have supported these continued efforts alongside our clinical obligations.
Concurrent with administration buy-in, financial supports for our palliative care services were initially supplemented by the health system. Our department understands the importance of recognizing limitations of resources in communities and their hospitals. In efforts to minimize the department’s impact on our own health system’s financial resources, we have strived to offset our costs. We helped the hospital system meet pay-for-performance palliative care metrics set by the large local insurers resulting in financial hospital reimbursement valued at $600,000 in 2016.
The question of how the program may translate into other communities raises a major limitation: the homogeneity our population. The community surrounding the hospital is primarily Caucasian, with minimal representation of minority populations. While the patient population seen by our palliative care team is reflective of our surrounding county, it does not represent Medicare FFS beneficiaries on a national level or many other types of community hospitals across the country. Variations of ethnicity, age, diagnoses, and faith are fundamental, which highlights the importance of understanding the community in which a program is developed.
The rising trajectory of our palliative care service utilization has prompted a discussion of future endeavors for our program. Expectations for a continued shortage of hospice and palliative care physicians [19] and concerns for practitioner burnout [20] underlie our thoughtful approach to expansion of inpatient and outpatient services. At this time, potential projects include a consultation trigger system and incorporation of palliative care providers in ICU rounding, as well as possible expansion of outpatient services through implantation of an advanced practitioner into surrounding nursing homes and primary care offices.
We have found a growing utilization of our program at Butler Health System. Our first year experience has highlighted the importance of identifying community and hospital administrative champions as a foundation. Additionally, understanding the specific characteristics of one’s surrounding community may allow for improved integration and acceptance of palliative care in a community setting. Our program continues to work with the health system, community, and philanthropic organizations to expand the ever-growing need for palliative care services.
1. Dumanovsky T, Augustin R, Rogers M, et al. The growth of palliative care in U.S. hospitals: a status report. J Palliat Med 2016;19:8–15.
2. Lavergne MR, Lethbridge L, Johnston G, et al. Examining palliative care program use and place of death in rural and urban contexts: a Canadian population-based study using linked data. Rural Remote Health 2015;15:3134.
3. Seow H, Brazil K, Sussman J, et al. Impact of community based, specialist palliative care teams on hospitalisations and emergency department visits late in life and hospital deaths: a pooled analysis. BMJ 2014;348:g3496.
4. Fink RM, Oman KS, Youngwerth J, et al. A palliative care needs assessment of rural hospitals. J Palliat Med 2013;16:638–44.
5. Dumont S, Jacobs P, Turcotte V, et al. Palliative care costs in Canada: A descriptive comparison of studies of urban and rural patients near end of life. J Palliat Med 2015;29:908–17.
6. Kaasalainen S, Brazil K, Williams A, et al. Nurses' experiences providing palliative care to individuals living in rural communities: aspects of the physical residential setting. Rural Remote Health 2014;14:2728.
7. Ahmed N, Bestall JC, Ahmedzai SH, et al. Systematic review of the problems and issues of accessing specialist palliative care by patients, carers and health and social care professionals. J Palliat Med 2004;18:525–42.
8. Ray RA, Fried O, Lindsay D. Palliative care professional education via video conference builds confidence to deliver palliative care in rural and remote locations. BMC Health Serv Res 2014;14:272.
9. Bakitas MA, Elk R, Astin M, et al. Systematic review of palliative care in the rural setting. Cancer Control 2015;22:450–64.
10. Akiyama M, Hirai K, Takebayashi T, et al. The effects of community-wide dissemination of information on perceptions of palliative care, knowledge about opioids, and sense of security among cancer patients, their families, and the general public. Support Care Cancer 2016;24: 347–56.
11. Maida V. Factors that promote success in home palliative care: a study of a large suburban palliative care practice. J Palliat Care 2002;18:282–6.
12. Ceronsky L, Shearer J, Weng K, et al. Minnesota Rural Palliative Care Initiative: building palliative care capacity in rural Minnesota. J Palliat Med 2013;16:310–3.
13. Aggarwal SK, Ghosh A, Cheng MJ, et al. Initiating pain and palliative care outpatient services for the suburban underserved in Montgomery County, Maryland: Lessons learned at the NIH Clinical Center and MobileMed. Palliat Support Care 2015;16:1–6.
14. Rainsford S, MacLeod RD, Glasgow NJ. Place of death in rural palliative care: A systematic review. J Palliat Med 2016;30:745–63.
15. Horey D, Street AF, O'Connor M, et al. Training and supportive programs for palliative care volunteers in community settings. Cochrane Database Syst Rev 2015 Jul 20;(7):CD009500.
16. The United States Census Bureau: QuickFacts: Butler County, Pennsylvania. Accessed 10 Mar 2017 at www.census.gov/quickfacts/table/PST045216/42019,00.
17. Spetz J, Dudley N, Trupin L, et al. Few hospital palliative care programs meet national staffing recommendations. Health Aff 2016;35:1690–7.
18. Dumanovsky T, Rogers M, Spragens LH, et al. Impact of Staffing on Access to Palliative Care in U.S. Hospitals. J Palliat Med. 2015 Dec; 18(12). Pages 998-999.
19. Lupu D, American Academy of Hospice and Palliative Medicine Workforce Task Force. Estimate of current hospice and palliative medicine physician workforce shortage. J Pain Symptom Manage 2010;40:899–911.
20. Kamal AH, Bull JK, Wolf SP, et al. Prevalence and predictors of burnout among hospice and palliative care clinicians in the U.S. J Pain Symptom Manage 2016;51:690–6.
The Impact of Two-Person Indwelling Urinary Catheter Insertion in the Emergency Department Using Technical and Socioadaptive Interventions
From Tampa General Hospital, Tampa, FL.
Abstract
- Objective: To decrease insertion-related catheter-associated urinary tract infections (CAUTIs) attributed to the emergency department (ED) as well as facility-wide within a large teaching hospital.
- Methods: Recommendations from the Agency for Healthcare Research and Quality (AHRQ) toolkit for reducing CAUTIs in hospital units were used to implement both technical and socioadaptive changes focused on prevention of insertion-related CAUTIs in the ED through a trial that required 2 licensed personnel for insertion of all urinary catheters. The process would include a safety time-out to confirm catheter appropriateness and review of the proper steps for insertion as a means to encompass and hardwire both the technical and socioadaptive aspects of the Comprehensive Unit-based Safety Project methodology into ED practice.
- Results: There was a 75% decrease in CAUTI rates following the intervention (P = 0.05). This reduction was sustained for at least 1 year following implementation.
- Conclusion: Using AHRQ recommendations to implement socioadaptive and technical changes through 2-person insertion of urinary catheters yielded a significant and sustainable decrease in insertion-related CAUTI rates and utilization of indwelling urinary catheters in the ED at Tampa General Hospital.
Key words: catheter-associated urinary tract infections; infection prevention; quality improvement; change model.
Each year an estimated 721,800 health care–associated infections occur in U.S. acute care hospitals, resulting in approximately 75,000 deaths [1]. Catheter-associated urinary tract infections (CAUTIs) account for an estimated 449,334 of health care–associated infections s annually [2]. The direct medical cost per CAUTI ranges from $749 to $1007, resulting in direct costs to U.S. facilities of over $340 million annually [2]. Although CAUTIs are one of the most common health care–associated infections, the literature has shown that following well established prevention guidelines can greatly reduce their incidence.
Since most health care–associated infections are preventable and cause unnecessary patient harm, there is pressure from regulatory bodies to prevent such events during a patient’s hospitalization. Prevention of CAUTIs is a Joint Commission National Patient Safety Goal, and as of 2008 the Centers for Medicare and Medicaid Services (CMS) does not reimburse hospitals for the cost of additional care as a result of a CAUTI. Additionally, facility CAUTI data is included in the CMS value-based purchasing program, which can withhold payments to hospitals based on performance, as well as the inpatient quality reporting program, which requires public reporting of CAUTI to receive a higher annual payment.
Even before the external pressures of regulatory bodies, Tampa General Hospital has strived to protect patients by preventing infections through implementing best practices via multidisciplinary committees to maximize impact. Tampa General Hospital, a private not-for-profit level 1 trauma center located in downtown Tampa, Florida, is a teaching facility affiliated with the University of South Florida Morsani College of Medicine. It is licensed for more than 1000 beds and serves 12 surrounding counties with a population in excess of 4 million.
Background
CAUTI data had been collected in all of the intensive care units at the hospital for several years, benchmarked against national unit-specific rates, with feedback provided to committees and the hospital board. However, in 2006, a multidisciplinary committee chaired by the chief operating officer known as Committee Targeting Zero (CTZ) was formed to review best practices and analyze all device-associated infection rates in an effort to reduce hospital-acquired infections. To target reduction of the CAUTI rate, a Foley stabilization device and renewed focus on hand hygiene were implemented, and CAUTI rates were reduced by over 50% by the end of 2007.
When CAUTI rates began to climb in 2008, additional interventions were implemented under the direction of CTZ, including a literature review for CAUTI prevention for any new or novel prevention strategies, reporting of each CAUTI to leadership of the attributed unit at the time of identification, ongoing surveillance of the appropriateness of indwelling urinary catheters at the unit level with feedback to CTZ, and mandatory education focused on infection of CAUTI and proper insertion for all staff inserting indwelling urinary catheters. Additionally, in 2009 an evaluation of an antibiotic-coated Foley catheter was implemented to further decrease rates, resulting in a statistically significant 42% reduction in the CAUTI rate as compared to 2008. Other prevention strategies instituted between 2010 and 2012 included increased availability of condom catheters, a closed system urine culture collection kit, and computer-based learning module for all staff inserting indwelling urinary catheters.
In 2013, the hospital included CAUTI prevention as part of a facility-wide initiative to decrease patient harm. A CAUTI committee led by senior leadership was convened to address CAUTI rates that exceeded national benchmarks. The multidisciplinary team began as a subcommittee of CTZ and was chaired by the chief nursing officer with the support of the chief operations officer and included representation from the infection prevention department and nursing unit leadership. After reviewing the Healthcare Infection Control Practices Advisory Committee’s (HICPAC) guideline for prevention of CAUTIs [3], the committee focused its efforts on appropriate indications for insertion and timely removal, aseptic insertion, and proper maintenance of indwelling urinary catheters.
The key accomplishments of the CAUTI committee during 2014 included development of a comprehensive genitourinary management policy, incorporation of CAUTI prevention into new employee orientation for all patient care staff, aseptic indwelling urinary catheter insertion competency check-off with return demonstration (teachback methodology) for all nursing staff, and reinforcement of insertion criteria and daily assessment for necessity with documentation of indications, and removal via nurse-driven protocol when necessary. Additionally, a requirement to document indications for ordering urine cultures and a pop-up reminder in the electronic medical record for patients with an indwelling urinary catheter requiring indications to continue, both targeted towards physicians and advanced practice providers, were implemented.
In conjunction with the technical changes, additional strategies were executed with the intent of facilitating a culture of patient safety and reinforcing the aforementioned technical changes. In 2014, the hospital implemented Franklin Covey’s “The Speed of Trust” methodology [4] and its associated 13 behaviors hospital-wide. Additionally, several of the inpatient units participated in a quality improvement project with either the Florida Hospital Engagement Network (HEN) [5] or the Agency for Healthcare Research and Quality (AHRQ) Comprehensive Unit-based Safety Program (CUSP) [6] national project. Physician engagement and education was accomplished through a white paper written by the infection prevention department, summarizing the current state of CAUTI within the facility and highlighting strategies to reduce infection, including evidence-based guidelines on ordering urine cultures.
In an attempt to target ongoing improvement strategies, CAUTIs were categorized as either insertion-related, occurring within 7 days of insertion, or maintenance-related, occurring greater than 7 days of insertion; the date of insertion was considered day 1. A review of the facility CAUTI data demonstrated that an opportunity to reduce insertion-related CAUTIs existed and a high volume of urinary catheters were inserted in the emergency department (ED). Therefore, ED leadership agreed to participate in the CUSP initiative for EDs beginning April 2014. The goals of the CUSP initiative include using best practices for CAUTI prevention through the implementation of both technical and socioadaptive changes.
Methods
CUSP Initiative
The CUSP initiative focuses specifically on improving processes for determining catheter appropriateness and promoting proper insertion techniques in addition to changes in culture to facilitate teamwork and communication amongst frontline staff and improve collaboration between the ED and inpatient units. To participate in the project, a multidisciplinary team that included ED leadership, infection prevention department, and nursing clinical quality and research specialists was established.
The team designed an intervention that required 2 licensed personnel for insertion of all urinary catheters. The process would include a safety time-out consisting of a pause before inserting the indwelling urinary catheter to confirm catheter appropriateness and review of the proper steps for insertion as a means to encompass and hardwire both the technical and socioadaptive aspects of the CUSP methodology into ED practice.
Rollout Using 4Es
January through March 2015 was the implementation period during which education and validation of practices were conducted. The 4Es model created by the Johns Hopkins University Quality and Safety Research Group was used to roll out the changes in practice to the ED staff; the 4Es are Engagement, Education, Execution, and Evaluation [7]. To engage staff, the scope of CAUTIs, including the implications to both patients and to the health care system as a whole, were presented from a local (hospital) and a national perspective. Education was achieved by outlining the new process in ED staff education sessions, as well as through handouts, emails, and during shift change huddles. The content included a checklist (Figure 1) staff would use to follow proper aseptic technique as well as reminders of the intent of the project. 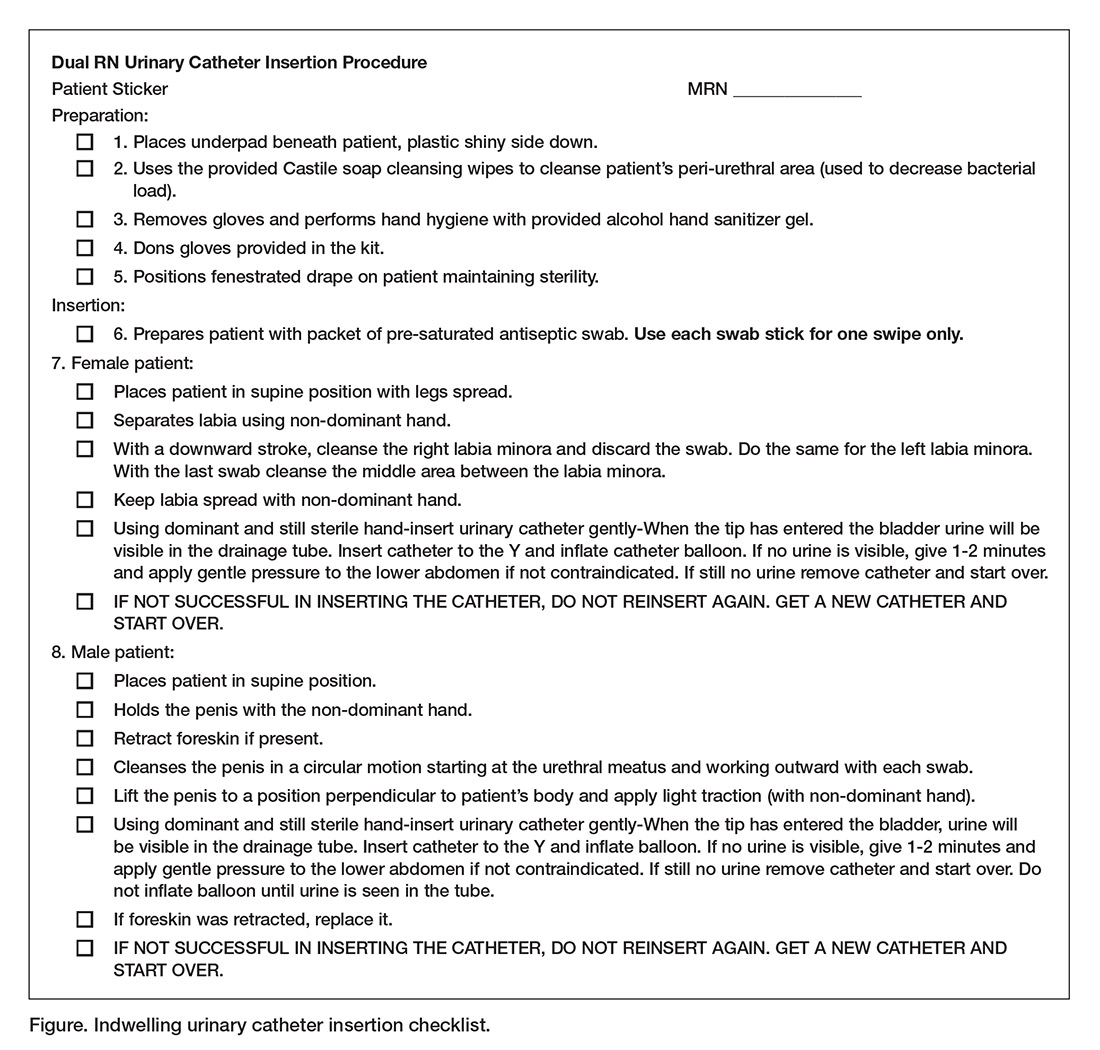
The process was executed through the use of a safety time-out completed by the 2 personnel (nurses) involved in the procedure prior to insertion of an indwelling urinary catheter. The time-out consisted of reviewing the insertion criteria to determine appropriateness for placement and the proper steps for insertion per hospital policy. The catheter was then inserted by one person while the second was solely responsible to assure compliance with proper aseptic technique. The procedure was stopped if aseptic technique was compromised. The indications for insertion and/or maintaining the urinary catheter are based on the HICPAC guidelines [3] and include the following:
- Acute urinary retention/obstruction
- Urologic, urethral or extensive abdominal surgical procedure
- Critically ill patient with unstable vital signs and requires close urine output monitoring (ICU patient receiving aggressive diuretic therapy, vasopressor/inotropic therapy, paralytic therapy, aggressive fluid management or titrated vasoactive medications)
- Stage 3 or 4 sacral or perineal pressure ulcer in a patient with incontinence
- End of life comfort
- Prevention of further trauma due to a difficult insertion
- Prolonged immobility due to unstable spinal fracture or pelvic fracture and inability to use bedpan.
During the implementation period, a process measure was used to evaluate the rollout. The compliance rate of returned insertion checklists versus the total number of insertions was calculated weekly and tracked over time. Although compliance was low at first, through several Plan-Do-Study-Act (PDSA) cycles conducted on a weekly basis, compliance steadily increased during the implementation period. Staff were also kept abreast of the compliance rates and progress of the project with weekly email updates and periodically in daily huddles during shift change.
Rollout Using 4Es
In parallel to the CUSP framework, the ED leadership team discretely used 6 of “The Speed of Trust” behaviors most relevant to the project to help drive the new process including get better, practice accountability, keep commitments, clarify expectations, deliver results, and create transparency. Get better was used to motivate staff to action in order to deliver the highest quality of care to our patients. Practice accountability was exercised by having the staff sign the checklist used in the new process. Deliver results was supported by the timely feedback of data to frontline staff to show whether the goal was being met. Clarifying expectations was demonstrated through feedback from weekly PDSA rapid cycles and constant reinforcement that all insertions must involve 2 personnel. Keeping commitments was established with an agreement amongst the staff and leadership to keep patients safe and deliver high quality care. Creating transparency was exemplified by explaining the initiative clearly to each patient and their family and allowing for any questions.
Outcomes Measurement
During the post-intervention period, progress was evaluated using 2 outcome measures: the insertion-related CAUTI rate and the catheter utilization ratio. National Healthcare Safety Network (NHSN) 2014 and 2015 criteria was used to identify any CAUTI [8] and for the purposes of this project, the insertion-related CAUTI rate was defined as the number of CAUTIs occurring ≤ 7 days after insertion, with the date of insertion being day 1, per 1000 catheters inserted in the ED. The utilization ratio was calculated from the number of catheters inserted per patient ED visits. The insertion-related CAUTI rates for the pre- and post-intervention periods were compared after excluding 2014 yeast CAUTIs to adjust for changes in the 2015 National Healthcare Safety Network CAUTI criteria, which removed yeast as an organism for CAUTI. The utilization ratio was also calculated and compared between pre- and post-intervention periods. All statistical analysis was done using the NHSN statistics calculator.
Results
During the pre-intervention period (April–December 2014) there were 10 infections and 1450 catheters inserted, which equates to an insertion-related CAUTI rate of 6.9/1,000 catheters. In the post-intervention period (April–December 2015), there were 2 infections and 1180 catheters placed, or an insertion-related CAUTI rate of 1.7/1000 catheters (Table 1)—a 75% decrease from the pre-intervention rate (P = 0.05).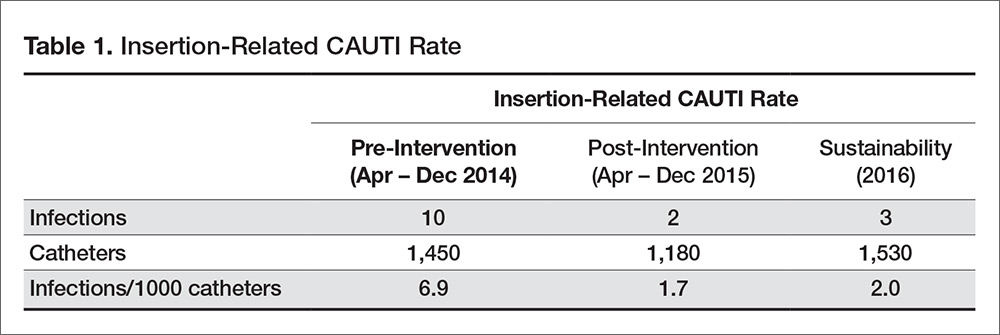
Additionally, the utilization ratio was calculated for 2014 and 2015 based on the number of catheter insertions per total patient ED visits in each year (Table 2). In 2014 the utilization ratio was 2.2 and in 2015 the utilization ratio was 1.7, representing a 23% reduction (P < 0.01).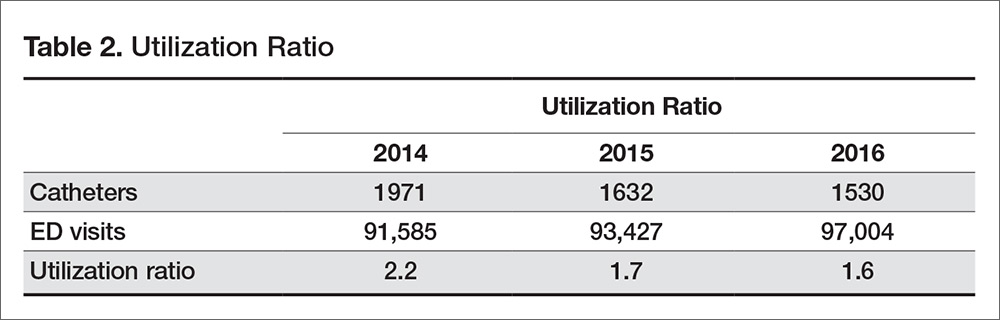
Following the post-intervention period, insertion-related rates and device utilization were also monitored in 2016. There were a total of 97,004 patient visits to the ED in 2016 with 1530 catheters inserted and 3 insertion-related CAUTIs attributed to the ED. The insertion-related CAUTI rate was 2.0/1000 catheters, which is statistically no different from the post-intervention period rate. The utilization ratio was 1.6, which is less than the post-intervention period (P < 0.01).
Discussion
As highlighted in the AHRQ toolkit [5], the project confirmed that using both technical and socioadaptive methodologies yielded a significant and sustainable impact on CAUTIs and utilization of indwelling urinary catheters. Prior to initiating the project, a review of the literature did not show any previous studies involving the insertion of urinary catheters by 2 licensed personnel. Since then, an acute care facility published data demonstrating a sustainable 39% reduction of CAUTI rates in an inpatient post-surgical unit within 6 months after the implementation of 2-person urinary catheter insertion [9]. The facility had also done extensive education and training on the CAUTI prevention best-practices prior to implementing the new insertion practices.
A key measure of success in regards to implementing cultural and technical changes is the sustainability of the results yielded after implementation. According to the AHRQ CAUTI toolkit, several specific strategies are necessary to successfully sustain prevention efforts. Implementing changes in the ED at our hospital in alignment with the goal of creating a culture of safety, incorporating the changes into daily work flow, employing both technical and socioadaptive interventions, empowering staff to stop the procedure if there are any concerns, and monitoring and communicating outcomes all ensure that the changes in practice will be sustained. Additionally, there is an engaged interdisciplinary CAUTI committee that continues to meet regularly as well as required yearly computer-based education for all frontline staff, and a “Safety Day” education session for all newly hired nurses where competency is assessed and validated for proper insertion and maintenance of a urinary catheter.
Initially, barriers for implementation included limited staff to ensure the presence of 2 licensed personnel for every urinary catheter insertion, lack of ability to collect checklist data in the electronic medical record and run compliance reports, and availability of the checklists at the onset of implementation. The staffing limitation seemed to work in favor of meeting the goals of the project, as staff were less likely to insert indwelling urinary catheters for inappropriate indications. In regards to the checklists, the barriers identified via the PDSA rapid cycles included inadequate locations to obtain checklists for use during insertion and drop-off locations for checklists after use. To increase availability and convenience, brightly colored folders labeled “FOLEY!” containing the checklists were placed both on the outside of the supply management stations and on the doors exiting the supply rooms where indwelling urinary catheter kits were located. Rounds were made on these folders approximately 1 to 2 times per week to be sure they remained full. In addition, more locations for dropping off completed forms were placed at all nursing stations as opposed to a single drop off location.
A limitation of the project is that there are not established metrics for infection rates in any outpatient setting nor are there established criteria to differentiate between insertion- and maintenance-related infections. While the metrics were created for the purposes of the project, they are easily reproducible within other health care facilities to track infection rates associated with outpatient areas. Additionally, by ensuring indications are met and proper insertion occurs in ED patients, the overall hospital’s CAUTI infection rate and standardized infection ratio are impacted, which are comparable across facilities. The criteria for differentiating between insertion and maintenance related infections was established in an attempt to define where the biggest vulnerabilities were with insertion versus maintenance. Days from insertion to infection were tracked for all infections, and arbitrarily a 7-day cutoff was used to consider the infection potentially insertion-related, as no evidence has been published to define this previously.
The lessons learned both during implementation of the changes in practice and the impact it can have on infection rates are valuable. Moving forward, Tampa General Hospital plans to spread dual personnel indwelling urinary catheter insertion as a best practice, first targeting inpatient units identified with the highest number of insertion-related infections as well as high device utilization ratios.
1. Magill SS, Edwards JR, Bamberg W, et al. Multistate point-prevalence survey of health care–associated infections. N Engl J Med 2014;370:1198–208.
2. Scott, RD. Center for Disease Control and Prevention. The direct medical costs of healthcare-associated infections in U.S. hospitals and the benefits of prevention. 2009. Accessed at https://www.cdc.gov/HAI/pdfs/hai/Scott_CostPaper.pdf.
3. Gould CV, Umscheid CA, Agarwal RK, et al. The Healthcare Infection Control Practices Advisory Committee (HICPAC). Guidelines for prevention of catheter-associated urinary tract infections. 2009. Accessed at http://www.cdc.gov/hicpac/pdf/CAUTI/CAUTIguideline2009final.pdf.
4. Covey SMR, Merrill RR. The speed of trust: the one thing that changes everything. New York: Free Press; 2008.
5. Florida Hospital Association Hospital Engagement Network. Update, March 2015. Florida Hospital Association, Orlando, FL. Accessed at www.fha.org/showDocument.aspx?f=2015HEN-Brief-Web.pdf.
6. Agency for Healthcare Research and Quality (AHRQ). Toolkit for reducing catheter-associated urinary tract infections in hospital units: implementation guide. 2014. Accessed at https://www.ahrq.gov/professionals/quality-patient-safety/hais/tools/cauti-hospitals/index.html.
7. Pronovost PJ, Berenholtz SM, Goeschel CA, et al. Creating high reliability in health care organizations. Health Serv Res 2006;41(4 Pt 2):1599–617.
8. Centers for Disease Control National Healthcare Safety Network. Urinary tract infection (catheter-associated urinary tract infection [CAUTI] and non-catheter-associated urinary tract infection [UTI]) and other urinary system infection [USI]) events. 2014. Accessed at https://www.cdc.gov/nhsn/pdfs/pscmanual/7psccauticurrent.pdf.
9. Belizario SM, Preventing urinary tract infections with a two-person catheter insertion procedure. Nursing 2015;45:67–9.
From Tampa General Hospital, Tampa, FL.
Abstract
- Objective: To decrease insertion-related catheter-associated urinary tract infections (CAUTIs) attributed to the emergency department (ED) as well as facility-wide within a large teaching hospital.
- Methods: Recommendations from the Agency for Healthcare Research and Quality (AHRQ) toolkit for reducing CAUTIs in hospital units were used to implement both technical and socioadaptive changes focused on prevention of insertion-related CAUTIs in the ED through a trial that required 2 licensed personnel for insertion of all urinary catheters. The process would include a safety time-out to confirm catheter appropriateness and review of the proper steps for insertion as a means to encompass and hardwire both the technical and socioadaptive aspects of the Comprehensive Unit-based Safety Project methodology into ED practice.
- Results: There was a 75% decrease in CAUTI rates following the intervention (P = 0.05). This reduction was sustained for at least 1 year following implementation.
- Conclusion: Using AHRQ recommendations to implement socioadaptive and technical changes through 2-person insertion of urinary catheters yielded a significant and sustainable decrease in insertion-related CAUTI rates and utilization of indwelling urinary catheters in the ED at Tampa General Hospital.
Key words: catheter-associated urinary tract infections; infection prevention; quality improvement; change model.
Each year an estimated 721,800 health care–associated infections occur in U.S. acute care hospitals, resulting in approximately 75,000 deaths [1]. Catheter-associated urinary tract infections (CAUTIs) account for an estimated 449,334 of health care–associated infections s annually [2]. The direct medical cost per CAUTI ranges from $749 to $1007, resulting in direct costs to U.S. facilities of over $340 million annually [2]. Although CAUTIs are one of the most common health care–associated infections, the literature has shown that following well established prevention guidelines can greatly reduce their incidence.
Since most health care–associated infections are preventable and cause unnecessary patient harm, there is pressure from regulatory bodies to prevent such events during a patient’s hospitalization. Prevention of CAUTIs is a Joint Commission National Patient Safety Goal, and as of 2008 the Centers for Medicare and Medicaid Services (CMS) does not reimburse hospitals for the cost of additional care as a result of a CAUTI. Additionally, facility CAUTI data is included in the CMS value-based purchasing program, which can withhold payments to hospitals based on performance, as well as the inpatient quality reporting program, which requires public reporting of CAUTI to receive a higher annual payment.
Even before the external pressures of regulatory bodies, Tampa General Hospital has strived to protect patients by preventing infections through implementing best practices via multidisciplinary committees to maximize impact. Tampa General Hospital, a private not-for-profit level 1 trauma center located in downtown Tampa, Florida, is a teaching facility affiliated with the University of South Florida Morsani College of Medicine. It is licensed for more than 1000 beds and serves 12 surrounding counties with a population in excess of 4 million.
Background
CAUTI data had been collected in all of the intensive care units at the hospital for several years, benchmarked against national unit-specific rates, with feedback provided to committees and the hospital board. However, in 2006, a multidisciplinary committee chaired by the chief operating officer known as Committee Targeting Zero (CTZ) was formed to review best practices and analyze all device-associated infection rates in an effort to reduce hospital-acquired infections. To target reduction of the CAUTI rate, a Foley stabilization device and renewed focus on hand hygiene were implemented, and CAUTI rates were reduced by over 50% by the end of 2007.
When CAUTI rates began to climb in 2008, additional interventions were implemented under the direction of CTZ, including a literature review for CAUTI prevention for any new or novel prevention strategies, reporting of each CAUTI to leadership of the attributed unit at the time of identification, ongoing surveillance of the appropriateness of indwelling urinary catheters at the unit level with feedback to CTZ, and mandatory education focused on infection of CAUTI and proper insertion for all staff inserting indwelling urinary catheters. Additionally, in 2009 an evaluation of an antibiotic-coated Foley catheter was implemented to further decrease rates, resulting in a statistically significant 42% reduction in the CAUTI rate as compared to 2008. Other prevention strategies instituted between 2010 and 2012 included increased availability of condom catheters, a closed system urine culture collection kit, and computer-based learning module for all staff inserting indwelling urinary catheters.
In 2013, the hospital included CAUTI prevention as part of a facility-wide initiative to decrease patient harm. A CAUTI committee led by senior leadership was convened to address CAUTI rates that exceeded national benchmarks. The multidisciplinary team began as a subcommittee of CTZ and was chaired by the chief nursing officer with the support of the chief operations officer and included representation from the infection prevention department and nursing unit leadership. After reviewing the Healthcare Infection Control Practices Advisory Committee’s (HICPAC) guideline for prevention of CAUTIs [3], the committee focused its efforts on appropriate indications for insertion and timely removal, aseptic insertion, and proper maintenance of indwelling urinary catheters.
The key accomplishments of the CAUTI committee during 2014 included development of a comprehensive genitourinary management policy, incorporation of CAUTI prevention into new employee orientation for all patient care staff, aseptic indwelling urinary catheter insertion competency check-off with return demonstration (teachback methodology) for all nursing staff, and reinforcement of insertion criteria and daily assessment for necessity with documentation of indications, and removal via nurse-driven protocol when necessary. Additionally, a requirement to document indications for ordering urine cultures and a pop-up reminder in the electronic medical record for patients with an indwelling urinary catheter requiring indications to continue, both targeted towards physicians and advanced practice providers, were implemented.
In conjunction with the technical changes, additional strategies were executed with the intent of facilitating a culture of patient safety and reinforcing the aforementioned technical changes. In 2014, the hospital implemented Franklin Covey’s “The Speed of Trust” methodology [4] and its associated 13 behaviors hospital-wide. Additionally, several of the inpatient units participated in a quality improvement project with either the Florida Hospital Engagement Network (HEN) [5] or the Agency for Healthcare Research and Quality (AHRQ) Comprehensive Unit-based Safety Program (CUSP) [6] national project. Physician engagement and education was accomplished through a white paper written by the infection prevention department, summarizing the current state of CAUTI within the facility and highlighting strategies to reduce infection, including evidence-based guidelines on ordering urine cultures.
In an attempt to target ongoing improvement strategies, CAUTIs were categorized as either insertion-related, occurring within 7 days of insertion, or maintenance-related, occurring greater than 7 days of insertion; the date of insertion was considered day 1. A review of the facility CAUTI data demonstrated that an opportunity to reduce insertion-related CAUTIs existed and a high volume of urinary catheters were inserted in the emergency department (ED). Therefore, ED leadership agreed to participate in the CUSP initiative for EDs beginning April 2014. The goals of the CUSP initiative include using best practices for CAUTI prevention through the implementation of both technical and socioadaptive changes.
Methods
CUSP Initiative
The CUSP initiative focuses specifically on improving processes for determining catheter appropriateness and promoting proper insertion techniques in addition to changes in culture to facilitate teamwork and communication amongst frontline staff and improve collaboration between the ED and inpatient units. To participate in the project, a multidisciplinary team that included ED leadership, infection prevention department, and nursing clinical quality and research specialists was established.
The team designed an intervention that required 2 licensed personnel for insertion of all urinary catheters. The process would include a safety time-out consisting of a pause before inserting the indwelling urinary catheter to confirm catheter appropriateness and review of the proper steps for insertion as a means to encompass and hardwire both the technical and socioadaptive aspects of the CUSP methodology into ED practice.
Rollout Using 4Es
January through March 2015 was the implementation period during which education and validation of practices were conducted. The 4Es model created by the Johns Hopkins University Quality and Safety Research Group was used to roll out the changes in practice to the ED staff; the 4Es are Engagement, Education, Execution, and Evaluation [7]. To engage staff, the scope of CAUTIs, including the implications to both patients and to the health care system as a whole, were presented from a local (hospital) and a national perspective. Education was achieved by outlining the new process in ED staff education sessions, as well as through handouts, emails, and during shift change huddles. The content included a checklist (Figure 1) staff would use to follow proper aseptic technique as well as reminders of the intent of the project.
The process was executed through the use of a safety time-out completed by the 2 personnel (nurses) involved in the procedure prior to insertion of an indwelling urinary catheter. The time-out consisted of reviewing the insertion criteria to determine appropriateness for placement and the proper steps for insertion per hospital policy. The catheter was then inserted by one person while the second was solely responsible to assure compliance with proper aseptic technique. The procedure was stopped if aseptic technique was compromised. The indications for insertion and/or maintaining the urinary catheter are based on the HICPAC guidelines [3] and include the following:
- Acute urinary retention/obstruction
- Urologic, urethral or extensive abdominal surgical procedure
- Critically ill patient with unstable vital signs and requires close urine output monitoring (ICU patient receiving aggressive diuretic therapy, vasopressor/inotropic therapy, paralytic therapy, aggressive fluid management or titrated vasoactive medications)
- Stage 3 or 4 sacral or perineal pressure ulcer in a patient with incontinence
- End of life comfort
- Prevention of further trauma due to a difficult insertion
- Prolonged immobility due to unstable spinal fracture or pelvic fracture and inability to use bedpan.
During the implementation period, a process measure was used to evaluate the rollout. The compliance rate of returned insertion checklists versus the total number of insertions was calculated weekly and tracked over time. Although compliance was low at first, through several Plan-Do-Study-Act (PDSA) cycles conducted on a weekly basis, compliance steadily increased during the implementation period. Staff were also kept abreast of the compliance rates and progress of the project with weekly email updates and periodically in daily huddles during shift change.
Rollout Using 4Es
In parallel to the CUSP framework, the ED leadership team discretely used 6 of “The Speed of Trust” behaviors most relevant to the project to help drive the new process including get better, practice accountability, keep commitments, clarify expectations, deliver results, and create transparency. Get better was used to motivate staff to action in order to deliver the highest quality of care to our patients. Practice accountability was exercised by having the staff sign the checklist used in the new process. Deliver results was supported by the timely feedback of data to frontline staff to show whether the goal was being met. Clarifying expectations was demonstrated through feedback from weekly PDSA rapid cycles and constant reinforcement that all insertions must involve 2 personnel. Keeping commitments was established with an agreement amongst the staff and leadership to keep patients safe and deliver high quality care. Creating transparency was exemplified by explaining the initiative clearly to each patient and their family and allowing for any questions.
Outcomes Measurement
During the post-intervention period, progress was evaluated using 2 outcome measures: the insertion-related CAUTI rate and the catheter utilization ratio. National Healthcare Safety Network (NHSN) 2014 and 2015 criteria was used to identify any CAUTI [8] and for the purposes of this project, the insertion-related CAUTI rate was defined as the number of CAUTIs occurring ≤ 7 days after insertion, with the date of insertion being day 1, per 1000 catheters inserted in the ED. The utilization ratio was calculated from the number of catheters inserted per patient ED visits. The insertion-related CAUTI rates for the pre- and post-intervention periods were compared after excluding 2014 yeast CAUTIs to adjust for changes in the 2015 National Healthcare Safety Network CAUTI criteria, which removed yeast as an organism for CAUTI. The utilization ratio was also calculated and compared between pre- and post-intervention periods. All statistical analysis was done using the NHSN statistics calculator.
Results
During the pre-intervention period (April–December 2014) there were 10 infections and 1450 catheters inserted, which equates to an insertion-related CAUTI rate of 6.9/1,000 catheters. In the post-intervention period (April–December 2015), there were 2 infections and 1180 catheters placed, or an insertion-related CAUTI rate of 1.7/1000 catheters (Table 1)—a 75% decrease from the pre-intervention rate (P = 0.05).
Additionally, the utilization ratio was calculated for 2014 and 2015 based on the number of catheter insertions per total patient ED visits in each year (Table 2). In 2014 the utilization ratio was 2.2 and in 2015 the utilization ratio was 1.7, representing a 23% reduction (P < 0.01).
Following the post-intervention period, insertion-related rates and device utilization were also monitored in 2016. There were a total of 97,004 patient visits to the ED in 2016 with 1530 catheters inserted and 3 insertion-related CAUTIs attributed to the ED. The insertion-related CAUTI rate was 2.0/1000 catheters, which is statistically no different from the post-intervention period rate. The utilization ratio was 1.6, which is less than the post-intervention period (P < 0.01).
Discussion
As highlighted in the AHRQ toolkit [5], the project confirmed that using both technical and socioadaptive methodologies yielded a significant and sustainable impact on CAUTIs and utilization of indwelling urinary catheters. Prior to initiating the project, a review of the literature did not show any previous studies involving the insertion of urinary catheters by 2 licensed personnel. Since then, an acute care facility published data demonstrating a sustainable 39% reduction of CAUTI rates in an inpatient post-surgical unit within 6 months after the implementation of 2-person urinary catheter insertion [9]. The facility had also done extensive education and training on the CAUTI prevention best-practices prior to implementing the new insertion practices.
A key measure of success in regards to implementing cultural and technical changes is the sustainability of the results yielded after implementation. According to the AHRQ CAUTI toolkit, several specific strategies are necessary to successfully sustain prevention efforts. Implementing changes in the ED at our hospital in alignment with the goal of creating a culture of safety, incorporating the changes into daily work flow, employing both technical and socioadaptive interventions, empowering staff to stop the procedure if there are any concerns, and monitoring and communicating outcomes all ensure that the changes in practice will be sustained. Additionally, there is an engaged interdisciplinary CAUTI committee that continues to meet regularly as well as required yearly computer-based education for all frontline staff, and a “Safety Day” education session for all newly hired nurses where competency is assessed and validated for proper insertion and maintenance of a urinary catheter.
Initially, barriers for implementation included limited staff to ensure the presence of 2 licensed personnel for every urinary catheter insertion, lack of ability to collect checklist data in the electronic medical record and run compliance reports, and availability of the checklists at the onset of implementation. The staffing limitation seemed to work in favor of meeting the goals of the project, as staff were less likely to insert indwelling urinary catheters for inappropriate indications. In regards to the checklists, the barriers identified via the PDSA rapid cycles included inadequate locations to obtain checklists for use during insertion and drop-off locations for checklists after use. To increase availability and convenience, brightly colored folders labeled “FOLEY!” containing the checklists were placed both on the outside of the supply management stations and on the doors exiting the supply rooms where indwelling urinary catheter kits were located. Rounds were made on these folders approximately 1 to 2 times per week to be sure they remained full. In addition, more locations for dropping off completed forms were placed at all nursing stations as opposed to a single drop off location.
A limitation of the project is that there are not established metrics for infection rates in any outpatient setting nor are there established criteria to differentiate between insertion- and maintenance-related infections. While the metrics were created for the purposes of the project, they are easily reproducible within other health care facilities to track infection rates associated with outpatient areas. Additionally, by ensuring indications are met and proper insertion occurs in ED patients, the overall hospital’s CAUTI infection rate and standardized infection ratio are impacted, which are comparable across facilities. The criteria for differentiating between insertion and maintenance related infections was established in an attempt to define where the biggest vulnerabilities were with insertion versus maintenance. Days from insertion to infection were tracked for all infections, and arbitrarily a 7-day cutoff was used to consider the infection potentially insertion-related, as no evidence has been published to define this previously.
The lessons learned both during implementation of the changes in practice and the impact it can have on infection rates are valuable. Moving forward, Tampa General Hospital plans to spread dual personnel indwelling urinary catheter insertion as a best practice, first targeting inpatient units identified with the highest number of insertion-related infections as well as high device utilization ratios.
1. Magill SS, Edwards JR, Bamberg W, et al. Multistate point-prevalence survey of health care–associated infections. N Engl J Med 2014;370:1198–208.
2. Scott, RD. Center for Disease Control and Prevention. The direct medical costs of healthcare-associated infections in U.S. hospitals and the benefits of prevention. 2009. Accessed at https://www.cdc.gov/HAI/pdfs/hai/Scott_CostPaper.pdf.
3. Gould CV, Umscheid CA, Agarwal RK, et al. The Healthcare Infection Control Practices Advisory Committee (HICPAC). Guidelines for prevention of catheter-associated urinary tract infections. 2009. Accessed at http://www.cdc.gov/hicpac/pdf/CAUTI/CAUTIguideline2009final.pdf.
4. Covey SMR, Merrill RR. The speed of trust: the one thing that changes everything. New York: Free Press; 2008.
5. Florida Hospital Association Hospital Engagement Network. Update, March 2015. Florida Hospital Association, Orlando, FL. Accessed at www.fha.org/showDocument.aspx?f=2015HEN-Brief-Web.pdf.
6. Agency for Healthcare Research and Quality (AHRQ). Toolkit for reducing catheter-associated urinary tract infections in hospital units: implementation guide. 2014. Accessed at https://www.ahrq.gov/professionals/quality-patient-safety/hais/tools/cauti-hospitals/index.html.
7. Pronovost PJ, Berenholtz SM, Goeschel CA, et al. Creating high reliability in health care organizations. Health Serv Res 2006;41(4 Pt 2):1599–617.
8. Centers for Disease Control National Healthcare Safety Network. Urinary tract infection (catheter-associated urinary tract infection [CAUTI] and non-catheter-associated urinary tract infection [UTI]) and other urinary system infection [USI]) events. 2014. Accessed at https://www.cdc.gov/nhsn/pdfs/pscmanual/7psccauticurrent.pdf.
9. Belizario SM, Preventing urinary tract infections with a two-person catheter insertion procedure. Nursing 2015;45:67–9.
Impact of an Educational Training Program on Restorative Care Practice of Nursing Assistants Working with Hospitalized Older Patients
Abstract
- Background: Acute and prolonged exposure to hospital medical care can cause hospital-associated deconditioning with deleterious effects on patient care provision and quality of life. Physical rehabilitation provided by allied healthcare professionals can enable reacquisition of function via professional input into attainment of set goals. Separate to rehabilitative efforts, restorative care optimizes independence by motivating individuals to maintain and restore function. Nursing assistants (NAs) provide a significant amount of direct patient care and are well placed to deliver restorative care.
- Objective: To increase proportional restorative care interactions with hospitalized older adults by training NAs.
- Methods: A prospective cohort quality improvement (QI) project was undertaken at 3 acute hospital wards (patient minimum age 65 years) and 2 community subacute care wards in the UK. NAs working within the target settings received a 2-part restorative care training package. The primary evaluation tool was 51 hours in total of observation measuring the proportional change in restorative care events delivered by NAs.
- Results: NA-led restorative care events increased from 40 (pre-intervention) to 94 (post-intervention), representing a statistically significant proportional increase from 74% to 92% (χ2(1) 9.53, P = 0.002). NAs on occasions inadvertently emphasized restriction of function to manage risk and oblige with rest periods.
- Conclusion: Investing in NAs can influence the amount of restorative care delivered to hospitalized older adults at risk of hospital-associated deconditioning. Continued investment in NAs is indicated to influence top-down, mandated restorative care practice in this patient group.
Key words: older people; restorative care; hospital associated deconditioning; nursing assistants; rehabilitation; training.
Hospital-associated deconditioning is defined as a significant decline in functional abilities developed through acute and prolonged exposure to a medical care facility environment, and is independent of that attributed to primary pathologies resulting in acute admission [1]. Considerable research on iatrogenic complications in older hospitalized populations [1–5] has shown the impacts of hospital-associated deconditioning and associated dysfunctions on quality of life for patients and the resultant burden on health and social care provision [6].
Physical rehabilitation has been shown to restore function through high-dose repetition of task-specific activity [7], and the benefits attributed to extra physical therapy include improved mobility, activity, and participation [8]. Simply defined, physical rehabilitation is the reacquisition of function through multidisciplinary assessment and professional therapeutic input in attainment of set goals. A more recent nomenclature in health settings is “restorative care,” defined as a philosophy of care that encourages, enables, and motivates individuals to maintain and restore function, thereby optimizing independence [9]. It has been clearly defined as a philosophy separate from that of rehabilitation [9] and remote from task-related or “custodial care,” which is designed to assist in meeting patients’ daily activity needs without any therapeutic value.
In UK rehabilitation wards, nursing staff provide 4.5 times as much direct patient care time compared with allied health professionals, with paraprofessional nursing assistants (NAs, equivalent to certified nurse assistants [CNAs] in the United States) responsible for half of this direct nursing care [10]. Kessler’s group examined the evolving role of NAs in UK hospitals [11]. From a national survey of 700 NAs and 600 trained nurses, the authors upheld the view that NAs act as direct caregivers including through routine tasks traditionally delivered by nurses. They identified that NAs exhibit distinct qualities, which are valued by qualified nurses, including routine task fulfilment and abilities relating to patients, which enable NAs to enhance care quality. Indeed, the national findings of Kessler’s group were generalizable to our own clinical setting where a NA cohort was a well-placed, available, and motivated resource to deliver therapeutically focused care for our hospitalized older population.
The theoretical relationship between care approaches is complex and represents a challenge for service users and policy makers. For instance, comprehensive rehabilitation delivery during an acute care episode may lead to users not seeking custodial care at home. Conversely, day-to-day activities realized by custodial care at home may lead to users not seeking acute rehabilitative care [12]. With stable resources being assigned to more dependent users in higher numbers, reactive care regardless of environment has often been the model of choice.
However, an economic rationale has developed more recently where investment in maintenance and preventative models results in healthcare savings with models including the 4Rs; reablement, reactivation, rehabilitation, and restorative care [13]. In North America, restorative care approaches have resulted in favorable results in nursing home facilities [14] and at home [15], and restorative care education and motivation training for nursing assistants was effective in supporting a change in beliefs and practice behaviors [16]. While results show restorative care practices in the non-acute care sector are advantageous, it is unknown whether these approaches if adopted in hospital settings affect subsequent healthcare utilization in the non-acute facilities, or even if they are feasible to implement in acute facilities by a staff group able to do so. Therefore, the purpose of this QI project was to deploy a restorative care educational intervention for NA staff working with hospitalized older adults with the aim of increasing the proportion of restorative care delivered.
Methods
Context
This project was conducted at a UK National Health Service university teaching hospital trust at 3 acute hospital wards (patient minimum age 65 years) and 2 community subacute care wards for older patients. Participants consisted of all permanent or long-term temporary (> 3 months continuous employment) NAs working in the target settings (n = 36). The QI project design is summarized in Figure 1. The project applied the 4Es translational approach to regulate the QI intervention: Engage, Educate, Execute, and Evaluate [17]. The reporting of this study follows SQUIRE guidance [18].
Intervention
The QI activity was a holistic educational process for all NA participants.
Didactic Study Day
Each NA attended a study day led by a physical therapist (up to 10 NAs per group). A student-centered training approach was adopted, recognizing variations in adult learning styles [19], and included seminar style theory, video case scenarios, group work, practical skills, open discussion, and reflection. The training package outline was compiled following consensus among the multi-disciplinary team working in the target settings and the steering group. Topics covered were theory on the risk of hospitalization and benefits of early mobilization; case scenarios and examples of restorative care; identifying and overcoming barriers to restorative care; identifying appro-priate patients for a restorative care approach; practical skills, including assisting patients out of bed, ambulation, and eating/drinking; and challenging, problem-solving scenarios. All participants received a course handbook to facilitate learning.
Ward-Based Practice
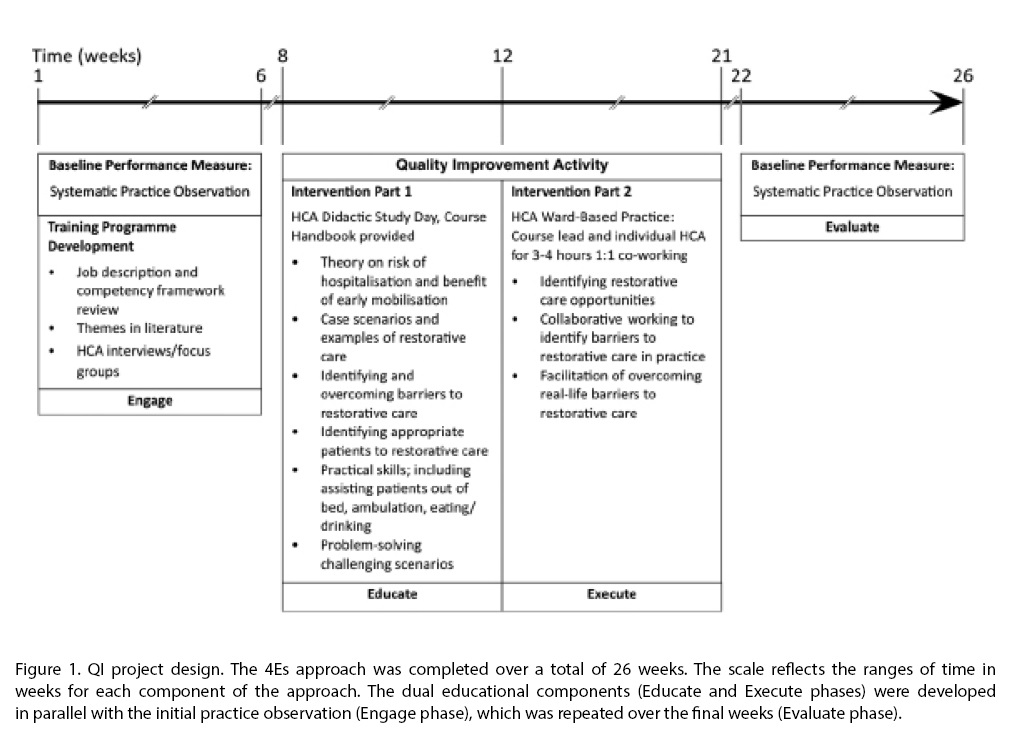
Measures
Type of Care Event
The quantity and nature of all NA-patient functional task-related care events was established by independent systematic observation pre- and post-intervention. Observers rated the type of care for observed patients as either custodial or restorative events using a tool described below. In addition, the numbers of patients receiving no restorative care events at all during observation was calculated to capture changes in rates between patients observed. The observational tool used was adapted from that utilized in a North American study of a long-term care facility [20], which demonstrated favorable intra-rater reliability (person separation reliability of 0.77), inter-rater reliability (80% to 100% agreement on each of the care behaviors), and validity (evidence of unidimensionality and good fit of the items). Adaptations accommodated for data collection in a hospital environment and alteration to UK nomenclature.
Three blinded volunteer assessors undertook observations. The observers monitored for activity in any 1 of 8 functional domains: bed mobility, transfers, mobility, washing and dressing, exercise, hygiene (mouth care/shaving/hair/nail care), toileting, and eating. Patient activity observed within these domains was identified as either a restorative or custodial care event. For example: “asks or encourages patient to walk/independently propel wheelchair to bathroom/toilet/day room/activities and gives them time to perform activity” was identified as a restorative care event, while “utilizes wheelchair instead of encourages ambulation and does not encourage patient to self-propel” was considered a custodial care event. All observations were carried out by student physical therapists in training or physical therapy assistants, all of whom were familiar in working in the acute facility with hospitalized older people. In an attempt to optimize internal consistency, observer skill was quality-controlled by ensuring observers were trained and their competency assessed in the use of the evaluation measurement tool.
Bays of 3 to 6 beds comprised each observation space. Three 90-minute time epochs were selected for observation—awakening (early morning), lunchtime (middle of the day), and afternoon (before evening meal)—with the aim that each time frame be observed on a minimum of 1 occasion on each of the 5 wards to generate a minimum of 15 observation sessions. Resources dictated observational periods to be 90-minutes maximum, per epoch, on weekdays only. The mean (range) time between the didactic study day and the ward-based practice day was 4 (1–8) weeks, and between the ward-based practice day and the second observational period was 6 (1–14) weeks.
Patient Characteristics
Differences in the acuity of patients between pre- and post-QI activity in the observational environments could influence care demands. Therefore, patient characteristics before and after the QI activity were measured to assess for stability. Prior to each session, observers recorded patient demographic details and current STRATIFY score, a predictive tool used at the time to segment fall risk [21], from patients’ clinical records. Two measures were used to offer contemporaneous representation of the observed population in the observation environment: a modified Barthel index [22], which provides a measure of activities of daily living [23], and the Abbreviated Mental Test Score [24], a simple diagnostic screen for cognitive impairment. All patients were considered as recuperating and thus eligible for observation except those with a “Patient-At-Risk” score ≥ 4, indicating physiological factors associated with established or impending critical illness [25], or if an end of life care plan was clearly detailed in the clinical record.
Data Analysis
Patient demographics are reported descriptively. Ordinal data are summarized using median and inter-quartile ranges (IQR), interval/ratio data using mean and standard deviation (SD) unless otherwise stated. Categorical data are reported as percentages. Comparison of observed patient samples before and after the QI period were compared with the Mann-Whitney U-test for ordinal data, 2 sample t tests for interval/ratio data, and chi squared tests of proportions for other variables.
Analyses were carried out using STATA 11 ME (StataCorp, College Station, TX) and SPSS v17 (SPSS, Chicago). Statistical significance was set at P ≤ 0.05.
Ethical Issues
This study was approved by the local UK NHS Trust clinical audit committee (Quality Improvement project 2038).
Results
Care Events by NAs
Observations were undertaken across the 5 wards on 14 workdays (Monday–Friday) over 6 weeks in the pre-QI period, and on 16 workdays over 4 weeks in the post-QI period, yielding a total of 51 hours of observation.
Overall, across all care environments, there was a statistically significant proportional increase in restorative care from 74% to 92% [χ2(1) 9.53, P = 0.002] (Figure 2). This represents an increase in restorative care events from 40 to 94. Observed custodial care events decreased from 14 to 8, a 43% reduction in custodial care events overall, a difference which remained irrespective of the environment (acute or subacute care), pre- and post-QI activity (P = 0.538 and P = 0.695, respectively).
There was a marked decrease in the number of patients receiving no NA-led restorative care events from 59 (74%) to 32 (48%) before and after QI activity respectively, [χ2 (1) 10.63, P = 0.001].
Patients Observed
Patient population characteristics remained stable during the course of the QI activity; there were no significant differences in the observed patient characteristics pre- and post-QI activity (Table). In 51 hours of observation undertaken by 3 independent observers there were 80 and 71 occupied beds before and after QI activity, respectively, representing a stable bed occupancy rate of 94% and 83% (P = 0.074). Of the occupied beds, 98.7% and 98.6% of patients (pre- and post-QI activity, respectively) were considered recuperating and therefore appropriate for a restorative care approach.
Discussion
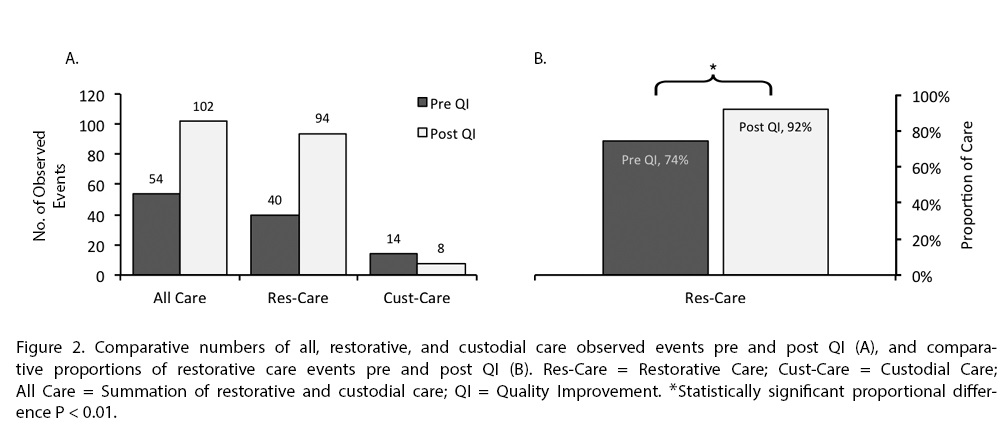
although significantly decreased from pre-QI proportions (74%). We therefore conclude that a meaningful decrease across patients receiving no restorative care and a meaningful increase in within-patient restorative care events post-QI intervention occurred.
Our study furthers research in methods of increasing restorative care events delivered by NAs. In a randomized controlled trial by Resnick et al [16], a structured 6-week restorative care program incorporating teaching NAs
restorative care philosophies (tier 1) and facilitating NAs to motivate residents to engage in functional activities (tier 2) was compared to placebo (a single 30-minute educational session in managing residents’ behavioral symptoms) [16]. Results showed the 6-week program led to more restorative care, with NAs demonstrating enhanced knowledge and expectations of restorative care outcomes and better job satisfaction. Our educational package (1 day) and ward-based-learning session (3–4 hours) was much shorter than Resnick et al’s 6-week intervention [16], and the optimal dose of educational packages for NAs is yet to be determined and needs to be addressed in future studies. Furthermore, while we found education increased restorative care across multiple environments, it is yet to be determined whether more restorative care has a positive impact on patient function downstream of an acute inpatient stay. In fact, determination of restorative care’s influence on augmenting rehabilitation outcomes is a neglected aspect of nursing-AHP practice that we aim to define and investigate in ongoing studies.
The patient population characteristics within the target wards were stable over the course of the QI project. Observed patients’ median Barthel (11) and Abbreviated Mental Test (6) scores remained stable and are indicative of high levels of day-to-day activity dependence [24,26–28]. Over the QI activity period it was therefore unsurprising that modest proportions of patients direc-ted their own care (28% and 33% pre and post-QI, respectively). Subsequently, demands on staff to lead patient care were substantial, leading to high risks of social or clinical iatrogenesis and hospital-associated deconditioning.
In a previous observational study, substantial patient inactivity was found in a highly dependent cohort of patients [29]. Fear of falling and insignificant emphasis on ambulation were cited as patient and organizational-centric reasons, respectively. Furthermore, in a selective observational study, patients receiving function-focused care (FFC; synonymous to restorative care) in an acute hospital environment developed less physical functional decline compared to those receiving custodial care [30]. However, patients who had fallen during their hospital stay received less FFC. The authors suggest limited FFC in fallers was deployed to minimize further risk but concluded there is need for nursing and therapy interventions that manage fall risks through endorsing functional activities instead of mobility restriction [30].
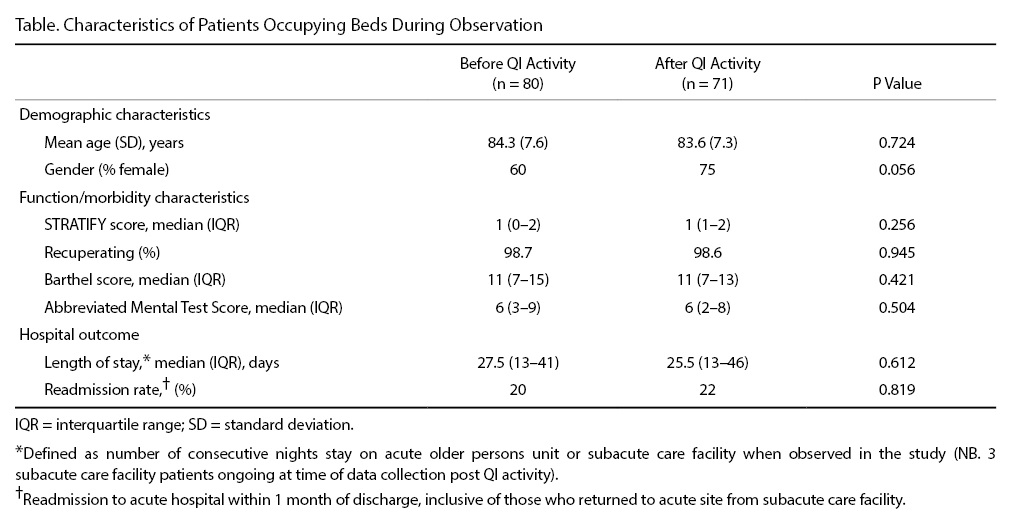
Limitations
While observational studies are more robust for measuring behavioral activities compared to self or proxy reporting [34], they are exposed to observer judgment and drift. An attempt was made to minimize this with the binary measurement of restorative versus custodial care and by random sampling of wards and time frames to capture an entire healthcare environment.
The observational study tool was based on one previously developed where acceptable reliability and validity was established and where observations were based on what individual care staff were practicing regardless of their operational environment [20]. In contrast, our observations were based in predetermined environmental spaces regardless of what care practice occurred within it. We consider our approach justifiable in minimizing observer influence on an individual’s practice by emphasizing to them that observers were interested in what happened in an environment [35,36]. However, we acknowledge the risk of under representation of care by observers not following the care delivery, and that local validity and reliability of our methods was not undertaken. Lastly, whilst training for observers was undertaken in this study to standardize the observations undertaken, validation of this method would be a feature required of any future experimental work.
Conclusions
Our findings support the current understanding of restorative care [14–16] and provides proof of concept that dedicating resources in a previously under-invested part of the workforce is feasible, well-accepted, and meaningful. The results are in keeping with the concept that the NA staff group is ready and able to fulfil their roles as direct caregivers, supporting and relieving other trained staff [11].
Corresponding author: Gareth D. Jones, MSc, Physiotherapy Dept, 3rd Fl Lambeth Wing, St Thomas’ Hospital, Westminster Bridge Rd, London SE1 7EH, UK, gareth.jones@gstt.nhs.uk.
Funding/support: This work was supported by a small grants application to the Guy's and St Thomas' Charity, project code S100414.
Financial disclosures: No conflicts of interest to declare.
Acknowledgment: The authors acknowledge members of the steering group for their input: Rebekah Schiff, Carrie-Ann Wood, Judith Centofanti, Judith Hall, and Richard Page; Anne Bisset-Smith and Claudia Jacob for their initial pilot work; Amanda Buttery, Lottie Prowse, and Ryan Mackie for practical assistance; Siobhan Crichton for her statistical help; and Jacky Jones, Michael Thacker, Tisha Pryor, and Sarah Ritchie for helping review the manuscript.
1. Kortebein P. Rehabilitation for hospital-associated deconditioning. Am J Phys Med Rehabil 2009;88:66–77.
2. Creditor MC. Hazards of hospitalization of the elderly. Ann Intern Med 1993;118:219–23.
3. Davydow DS, Hough CL, Levine DA, et al. Functional disability, cognitive impairment, and depression after hospitalization for pneumonia. Am J Med 2013;126:615–24.e5.
4. Sager MA, Franke T, Inouye SK, et al. Functional outcomes of acute medical illness and hospitalization in older persons. Arch Intern Med 1996;156:645–52.
5. Warshaw GA, Moore JT, Friedman SW, et al. Functional disability in the hospitalized elderly. JAMA 1982;248:847–50.
6. Covinsky KE, Pierluissi E, Johnston CB. Hospitalization-associated disability: "She was probably able to ambulate, but I'm not sure". JAMA 2011;306:1782–93.
7. Kwakkel G, Kollen B, Lindeman E. Understanding the pattern of functional recovery after stroke: facts and theories. Restor Neurol Neurosci 2004;22:281–99.
8. Peiris CL, Taylor NF, Shields N. Extra physical therapy reduces patient length of stay and improves functional outcomes and quality of life in people with acute or subacute conditions: a systematic review. Arch Phys Med
Rehabil 2011;92:1490–500.
9. Resnick B, Boltz M, Galik E, Pretzer-Aboff I. Restorative care nursing for older adults: a guide for all care settings. 2nd ed. New York: Springer; 2012.
10. Rudd AG, Jenkinson D, Grant RL, Hoffman A. Staffing levels and patient dependence in English stroke units. Clin Med (Lond). 2009;9:110–5.
11. Kessler I, Heron P, Dopson S, et al. The nature and consequences of support workers in a hospital setting, Final Report. London: National Institute for Health Research, Service Delivery and Organization Programme; 2010.
12. Kashner TM, Krompholz B, McDonnell C, et al. Acute and custodial care among impaired aged. J Aging Health 1990;2:28–41.
13. Sims-Gould J, Tong CE, Wallis-Mayer L, Ashe MC. Reablement, reactivation, rehabilitation and restorative interventions with older adults in receipt of home care: a systematic review. J Am Med Dir Assoc 2017;18:653–63.
14. Shanti C, Johnson J, Meyers AM, et al. Evaluation of the restorative care education and training program for nursing homes. Can J Aging 2005;24:115–26.
15. Tinetti ME, Baker D, Gallo WT, et al. Evaluation of restorative care vs usual care for older adults receiving an acute episode of home care. JAMA 2002;287:2098–105.
16. Resnick B, Gruber-Baldini AL, Galik E, et al. Changing the philosophy of care in long-term care: testing of the restorative care intervention. Gerontologist 2009;49:175–84.
17. Pronovost PJ, Berenholtz SM, Needham DM. Translating evidence into practice: a model for large scale knowledge translation. BMJ 2008;337:a1714.
18. Davidoff F, Batalden P, Stevens D, et al; SQUIRE development group. Publication guidelines for quality improvement studies in health care: evolution of the SQUIRE project. BMJ 2009;338:a3152.
19. Sweeney JF. Nurse education: learner-centred or teacher-centred? Nurse Educ Today 1986;6:257–62.
20. Resnick B, Rogers V, Galik E, Gruber-Baldini AL. Measuring restorative care provided by nursing assistants: reliability and validity of the Restorative Care Behavior Checklist. Nurs Res 2007;56:387–98.
21. Oliver D, Britton M, Seed P, et al. Development and evaluation of evidence based risk assessment tool (STRATIFY) to predict which elderly inpatients will fall: case-control and cohort studies. BMJ 1997;315:1049–53.
22. Colin C, Wade DT, Davies S, Horne V. The Barthel ADL Index: a reliability study. Int Disabil Stud 1988;10:61–3.
23. Richards SH, Peters TJ, Coast J, et al. Inter-rater reliability of the Barthel ADL index: how does a researcher compare to a nurse? Clin Rehabil 2000;14:72–8.
24. Hodkinson HM. Evaluation of a mental test score for assessment of mental impairment in the elderly. Age Ageing 1972;1:233–8.
25. Morgan CD, Baade LE. Neuropsychological testing and assessment scales for dementia of the Alzheimer's type. Psychiatr Clin North Am 1997;20:25–43.
26. Granger CV, Hamilton BB, Gresham GE, Kramer AA. The stroke rehabilitation outcome study: Part II. Relative merits of the total Barthel index score and a four-item subscore in predicting patient outcomes. Arch Phys Med Rehabil
1989;70:100–3.
27. MacKenzie DM, Copp P, Shaw RJ, Goodwin GM. Brief cognitive screening of the elderly: a comparison of the Mini-Mental State Examination (MMSE), Abbreviated Mental Test (AMT) and Mental Status Questionnaire (MSQ). Psychol Med
1996;26:427–30.
28. Uyttenboogaart M, Stewart RE, Vroomen PC, et al. Optimizing cutoff scores for the Barthel index and the modified Rankin scale for defining outcome in acute stroke trials. Stroke 2005;36:1984–7.
29. Callen BL, Mahoney JE, Grieves CB, et al. Frequency of hallway ambulation by hospitalized older adults on medical units of an academic hospital. Geriatr Nurs 2004;25:212–7.
30. Boltz M, Resnick B, Capezuti E, Shuluk J. Activity restriction vs. self-direction: hospitalised older adults' response to fear of falling. Int J Older People Nurs 2014;9:44–53.
31. Moyle W, Borbasi S, Wallis M, et al. Acute care management of older people with dementia: a qualitative perspective. J Clin Nurs 2011;20:420–8.
32. Olson DM, Borel CO, Laskowitz DT, et al. Quiet time: a nursing intervention to promote sleep in neurocritical care units. Am J Crit Care 2001;10:74–8.
33. Gardner C, Collins C, Osborne S, et al. Creating a therapeutic environment: a non-randomised controlled trial of a quiet time intervention for patients in acute care. Int J Nurs Stud 2009;46:778–86.
34. Kupek E. Bias and heteroscedastic memory error in self-reported health behavior: an investigation using covariance structure analysis. BMC Med Res Methodol 2002;2:14.
35. Fromme HB, Karani R, Downing SM. Direct observation in medical education: a review of the literature and evidence for validity. Mt Sinai J Med 2009;76:365–71.
36. Williams RG, Klamen DA, McGaghie WC. Cognitive, social and environmental sources of bias in clinical performance ratings. Teach Learn Med 2003;15:270–92.
Abstract
- Background: Acute and prolonged exposure to hospital medical care can cause hospital-associated deconditioning with deleterious effects on patient care provision and quality of life. Physical rehabilitation provided by allied healthcare professionals can enable reacquisition of function via professional input into attainment of set goals. Separate to rehabilitative efforts, restorative care optimizes independence by motivating individuals to maintain and restore function. Nursing assistants (NAs) provide a significant amount of direct patient care and are well placed to deliver restorative care.
- Objective: To increase proportional restorative care interactions with hospitalized older adults by training NAs.
- Methods: A prospective cohort quality improvement (QI) project was undertaken at 3 acute hospital wards (patient minimum age 65 years) and 2 community subacute care wards in the UK. NAs working within the target settings received a 2-part restorative care training package. The primary evaluation tool was 51 hours in total of observation measuring the proportional change in restorative care events delivered by NAs.
- Results: NA-led restorative care events increased from 40 (pre-intervention) to 94 (post-intervention), representing a statistically significant proportional increase from 74% to 92% (χ2(1) 9.53, P = 0.002). NAs on occasions inadvertently emphasized restriction of function to manage risk and oblige with rest periods.
- Conclusion: Investing in NAs can influence the amount of restorative care delivered to hospitalized older adults at risk of hospital-associated deconditioning. Continued investment in NAs is indicated to influence top-down, mandated restorative care practice in this patient group.
Key words: older people; restorative care; hospital associated deconditioning; nursing assistants; rehabilitation; training.
Hospital-associated deconditioning is defined as a significant decline in functional abilities developed through acute and prolonged exposure to a medical care facility environment, and is independent of that attributed to primary pathologies resulting in acute admission [1]. Considerable research on iatrogenic complications in older hospitalized populations [1–5] has shown the impacts of hospital-associated deconditioning and associated dysfunctions on quality of life for patients and the resultant burden on health and social care provision [6].
Physical rehabilitation has been shown to restore function through high-dose repetition of task-specific activity [7], and the benefits attributed to extra physical therapy include improved mobility, activity, and participation [8]. Simply defined, physical rehabilitation is the reacquisition of function through multidisciplinary assessment and professional therapeutic input in attainment of set goals. A more recent nomenclature in health settings is “restorative care,” defined as a philosophy of care that encourages, enables, and motivates individuals to maintain and restore function, thereby optimizing independence [9]. It has been clearly defined as a philosophy separate from that of rehabilitation [9] and remote from task-related or “custodial care,” which is designed to assist in meeting patients’ daily activity needs without any therapeutic value.
In UK rehabilitation wards, nursing staff provide 4.5 times as much direct patient care time compared with allied health professionals, with paraprofessional nursing assistants (NAs, equivalent to certified nurse assistants [CNAs] in the United States) responsible for half of this direct nursing care [10]. Kessler’s group examined the evolving role of NAs in UK hospitals [11]. From a national survey of 700 NAs and 600 trained nurses, the authors upheld the view that NAs act as direct caregivers including through routine tasks traditionally delivered by nurses. They identified that NAs exhibit distinct qualities, which are valued by qualified nurses, including routine task fulfilment and abilities relating to patients, which enable NAs to enhance care quality. Indeed, the national findings of Kessler’s group were generalizable to our own clinical setting where a NA cohort was a well-placed, available, and motivated resource to deliver therapeutically focused care for our hospitalized older population.
The theoretical relationship between care approaches is complex and represents a challenge for service users and policy makers. For instance, comprehensive rehabilitation delivery during an acute care episode may lead to users not seeking custodial care at home. Conversely, day-to-day activities realized by custodial care at home may lead to users not seeking acute rehabilitative care [12]. With stable resources being assigned to more dependent users in higher numbers, reactive care regardless of environment has often been the model of choice.
However, an economic rationale has developed more recently where investment in maintenance and preventative models results in healthcare savings with models including the 4Rs; reablement, reactivation, rehabilitation, and restorative care [13]. In North America, restorative care approaches have resulted in favorable results in nursing home facilities [14] and at home [15], and restorative care education and motivation training for nursing assistants was effective in supporting a change in beliefs and practice behaviors [16]. While results show restorative care practices in the non-acute care sector are advantageous, it is unknown whether these approaches if adopted in hospital settings affect subsequent healthcare utilization in the non-acute facilities, or even if they are feasible to implement in acute facilities by a staff group able to do so. Therefore, the purpose of this QI project was to deploy a restorative care educational intervention for NA staff working with hospitalized older adults with the aim of increasing the proportion of restorative care delivered.
Methods
Context
This project was conducted at a UK National Health Service university teaching hospital trust at 3 acute hospital wards (patient minimum age 65 years) and 2 community subacute care wards for older patients. Participants consisted of all permanent or long-term temporary (> 3 months continuous employment) NAs working in the target settings (n = 36). The QI project design is summarized in Figure 1. The project applied the 4Es translational approach to regulate the QI intervention: Engage, Educate, Execute, and Evaluate [17]. The reporting of this study follows SQUIRE guidance [18].
Intervention
The QI activity was a holistic educational process for all NA participants.
Didactic Study Day
Each NA attended a study day led by a physical therapist (up to 10 NAs per group). A student-centered training approach was adopted, recognizing variations in adult learning styles [19], and included seminar style theory, video case scenarios, group work, practical skills, open discussion, and reflection. The training package outline was compiled following consensus among the multi-disciplinary team working in the target settings and the steering group. Topics covered were theory on the risk of hospitalization and benefits of early mobilization; case scenarios and examples of restorative care; identifying and overcoming barriers to restorative care; identifying appro-priate patients for a restorative care approach; practical skills, including assisting patients out of bed, ambulation, and eating/drinking; and challenging, problem-solving scenarios. All participants received a course handbook to facilitate learning.
Ward-Based Practice
Measures
Type of Care Event
The quantity and nature of all NA-patient functional task-related care events was established by independent systematic observation pre- and post-intervention. Observers rated the type of care for observed patients as either custodial or restorative events using a tool described below. In addition, the numbers of patients receiving no restorative care events at all during observation was calculated to capture changes in rates between patients observed. The observational tool used was adapted from that utilized in a North American study of a long-term care facility [20], which demonstrated favorable intra-rater reliability (person separation reliability of 0.77), inter-rater reliability (80% to 100% agreement on each of the care behaviors), and validity (evidence of unidimensionality and good fit of the items). Adaptations accommodated for data collection in a hospital environment and alteration to UK nomenclature.
Three blinded volunteer assessors undertook observations. The observers monitored for activity in any 1 of 8 functional domains: bed mobility, transfers, mobility, washing and dressing, exercise, hygiene (mouth care/shaving/hair/nail care), toileting, and eating. Patient activity observed within these domains was identified as either a restorative or custodial care event. For example: “asks or encourages patient to walk/independently propel wheelchair to bathroom/toilet/day room/activities and gives them time to perform activity” was identified as a restorative care event, while “utilizes wheelchair instead of encourages ambulation and does not encourage patient to self-propel” was considered a custodial care event. All observations were carried out by student physical therapists in training or physical therapy assistants, all of whom were familiar in working in the acute facility with hospitalized older people. In an attempt to optimize internal consistency, observer skill was quality-controlled by ensuring observers were trained and their competency assessed in the use of the evaluation measurement tool.
Bays of 3 to 6 beds comprised each observation space. Three 90-minute time epochs were selected for observation—awakening (early morning), lunchtime (middle of the day), and afternoon (before evening meal)—with the aim that each time frame be observed on a minimum of 1 occasion on each of the 5 wards to generate a minimum of 15 observation sessions. Resources dictated observational periods to be 90-minutes maximum, per epoch, on weekdays only. The mean (range) time between the didactic study day and the ward-based practice day was 4 (1–8) weeks, and between the ward-based practice day and the second observational period was 6 (1–14) weeks.
Patient Characteristics
Differences in the acuity of patients between pre- and post-QI activity in the observational environments could influence care demands. Therefore, patient characteristics before and after the QI activity were measured to assess for stability. Prior to each session, observers recorded patient demographic details and current STRATIFY score, a predictive tool used at the time to segment fall risk [21], from patients’ clinical records. Two measures were used to offer contemporaneous representation of the observed population in the observation environment: a modified Barthel index [22], which provides a measure of activities of daily living [23], and the Abbreviated Mental Test Score [24], a simple diagnostic screen for cognitive impairment. All patients were considered as recuperating and thus eligible for observation except those with a “Patient-At-Risk” score ≥ 4, indicating physiological factors associated with established or impending critical illness [25], or if an end of life care plan was clearly detailed in the clinical record.
Data Analysis
Patient demographics are reported descriptively. Ordinal data are summarized using median and inter-quartile ranges (IQR), interval/ratio data using mean and standard deviation (SD) unless otherwise stated. Categorical data are reported as percentages. Comparison of observed patient samples before and after the QI period were compared with the Mann-Whitney U-test for ordinal data, 2 sample t tests for interval/ratio data, and chi squared tests of proportions for other variables.
Analyses were carried out using STATA 11 ME (StataCorp, College Station, TX) and SPSS v17 (SPSS, Chicago). Statistical significance was set at P ≤ 0.05.
Ethical Issues
This study was approved by the local UK NHS Trust clinical audit committee (Quality Improvement project 2038).
Results
Care Events by NAs
Observations were undertaken across the 5 wards on 14 workdays (Monday–Friday) over 6 weeks in the pre-QI period, and on 16 workdays over 4 weeks in the post-QI period, yielding a total of 51 hours of observation.
Overall, across all care environments, there was a statistically significant proportional increase in restorative care from 74% to 92% [χ2(1) 9.53, P = 0.002] (Figure 2). This represents an increase in restorative care events from 40 to 94. Observed custodial care events decreased from 14 to 8, a 43% reduction in custodial care events overall, a difference which remained irrespective of the environment (acute or subacute care), pre- and post-QI activity (P = 0.538 and P = 0.695, respectively).
There was a marked decrease in the number of patients receiving no NA-led restorative care events from 59 (74%) to 32 (48%) before and after QI activity respectively, [χ2 (1) 10.63, P = 0.001].
Patients Observed
Patient population characteristics remained stable during the course of the QI activity; there were no significant differences in the observed patient characteristics pre- and post-QI activity (Table). In 51 hours of observation undertaken by 3 independent observers there were 80 and 71 occupied beds before and after QI activity, respectively, representing a stable bed occupancy rate of 94% and 83% (P = 0.074). Of the occupied beds, 98.7% and 98.6% of patients (pre- and post-QI activity, respectively) were considered recuperating and therefore appropriate for a restorative care approach.
Discussion
although significantly decreased from pre-QI proportions (74%). We therefore conclude that a meaningful decrease across patients receiving no restorative care and a meaningful increase in within-patient restorative care events post-QI intervention occurred.
Our study furthers research in methods of increasing restorative care events delivered by NAs. In a randomized controlled trial by Resnick et al [16], a structured 6-week restorative care program incorporating teaching NAs
restorative care philosophies (tier 1) and facilitating NAs to motivate residents to engage in functional activities (tier 2) was compared to placebo (a single 30-minute educational session in managing residents’ behavioral symptoms) [16]. Results showed the 6-week program led to more restorative care, with NAs demonstrating enhanced knowledge and expectations of restorative care outcomes and better job satisfaction. Our educational package (1 day) and ward-based-learning session (3–4 hours) was much shorter than Resnick et al’s 6-week intervention [16], and the optimal dose of educational packages for NAs is yet to be determined and needs to be addressed in future studies. Furthermore, while we found education increased restorative care across multiple environments, it is yet to be determined whether more restorative care has a positive impact on patient function downstream of an acute inpatient stay. In fact, determination of restorative care’s influence on augmenting rehabilitation outcomes is a neglected aspect of nursing-AHP practice that we aim to define and investigate in ongoing studies.
The patient population characteristics within the target wards were stable over the course of the QI project. Observed patients’ median Barthel (11) and Abbreviated Mental Test (6) scores remained stable and are indicative of high levels of day-to-day activity dependence [24,26–28]. Over the QI activity period it was therefore unsurprising that modest proportions of patients direc-ted their own care (28% and 33% pre and post-QI, respectively). Subsequently, demands on staff to lead patient care were substantial, leading to high risks of social or clinical iatrogenesis and hospital-associated deconditioning.
In a previous observational study, substantial patient inactivity was found in a highly dependent cohort of patients [29]. Fear of falling and insignificant emphasis on ambulation were cited as patient and organizational-centric reasons, respectively. Furthermore, in a selective observational study, patients receiving function-focused care (FFC; synonymous to restorative care) in an acute hospital environment developed less physical functional decline compared to those receiving custodial care [30]. However, patients who had fallen during their hospital stay received less FFC. The authors suggest limited FFC in fallers was deployed to minimize further risk but concluded there is need for nursing and therapy interventions that manage fall risks through endorsing functional activities instead of mobility restriction [30].
Limitations
While observational studies are more robust for measuring behavioral activities compared to self or proxy reporting [34], they are exposed to observer judgment and drift. An attempt was made to minimize this with the binary measurement of restorative versus custodial care and by random sampling of wards and time frames to capture an entire healthcare environment.
The observational study tool was based on one previously developed where acceptable reliability and validity was established and where observations were based on what individual care staff were practicing regardless of their operational environment [20]. In contrast, our observations were based in predetermined environmental spaces regardless of what care practice occurred within it. We consider our approach justifiable in minimizing observer influence on an individual’s practice by emphasizing to them that observers were interested in what happened in an environment [35,36]. However, we acknowledge the risk of under representation of care by observers not following the care delivery, and that local validity and reliability of our methods was not undertaken. Lastly, whilst training for observers was undertaken in this study to standardize the observations undertaken, validation of this method would be a feature required of any future experimental work.
Conclusions
Our findings support the current understanding of restorative care [14–16] and provides proof of concept that dedicating resources in a previously under-invested part of the workforce is feasible, well-accepted, and meaningful. The results are in keeping with the concept that the NA staff group is ready and able to fulfil their roles as direct caregivers, supporting and relieving other trained staff [11].
Corresponding author: Gareth D. Jones, MSc, Physiotherapy Dept, 3rd Fl Lambeth Wing, St Thomas’ Hospital, Westminster Bridge Rd, London SE1 7EH, UK, gareth.jones@gstt.nhs.uk.
Funding/support: This work was supported by a small grants application to the Guy's and St Thomas' Charity, project code S100414.
Financial disclosures: No conflicts of interest to declare.
Acknowledgment: The authors acknowledge members of the steering group for their input: Rebekah Schiff, Carrie-Ann Wood, Judith Centofanti, Judith Hall, and Richard Page; Anne Bisset-Smith and Claudia Jacob for their initial pilot work; Amanda Buttery, Lottie Prowse, and Ryan Mackie for practical assistance; Siobhan Crichton for her statistical help; and Jacky Jones, Michael Thacker, Tisha Pryor, and Sarah Ritchie for helping review the manuscript.
1. Kortebein P. Rehabilitation for hospital-associated deconditioning. Am J Phys Med Rehabil 2009;88:66–77.
2. Creditor MC. Hazards of hospitalization of the elderly. Ann Intern Med 1993;118:219–23.
3. Davydow DS, Hough CL, Levine DA, et al. Functional disability, cognitive impairment, and depression after hospitalization for pneumonia. Am J Med 2013;126:615–24.e5.
4. Sager MA, Franke T, Inouye SK, et al. Functional outcomes of acute medical illness and hospitalization in older persons. Arch Intern Med 1996;156:645–52.
5. Warshaw GA, Moore JT, Friedman SW, et al. Functional disability in the hospitalized elderly. JAMA 1982;248:847–50.
6. Covinsky KE, Pierluissi E, Johnston CB. Hospitalization-associated disability: "She was probably able to ambulate, but I'm not sure". JAMA 2011;306:1782–93.
7. Kwakkel G, Kollen B, Lindeman E. Understanding the pattern of functional recovery after stroke: facts and theories. Restor Neurol Neurosci 2004;22:281–99.
8. Peiris CL, Taylor NF, Shields N. Extra physical therapy reduces patient length of stay and improves functional outcomes and quality of life in people with acute or subacute conditions: a systematic review. Arch Phys Med
Rehabil 2011;92:1490–500.
9. Resnick B, Boltz M, Galik E, Pretzer-Aboff I. Restorative care nursing for older adults: a guide for all care settings. 2nd ed. New York: Springer; 2012.
10. Rudd AG, Jenkinson D, Grant RL, Hoffman A. Staffing levels and patient dependence in English stroke units. Clin Med (Lond). 2009;9:110–5.
11. Kessler I, Heron P, Dopson S, et al. The nature and consequences of support workers in a hospital setting, Final Report. London: National Institute for Health Research, Service Delivery and Organization Programme; 2010.
12. Kashner TM, Krompholz B, McDonnell C, et al. Acute and custodial care among impaired aged. J Aging Health 1990;2:28–41.
13. Sims-Gould J, Tong CE, Wallis-Mayer L, Ashe MC. Reablement, reactivation, rehabilitation and restorative interventions with older adults in receipt of home care: a systematic review. J Am Med Dir Assoc 2017;18:653–63.
14. Shanti C, Johnson J, Meyers AM, et al. Evaluation of the restorative care education and training program for nursing homes. Can J Aging 2005;24:115–26.
15. Tinetti ME, Baker D, Gallo WT, et al. Evaluation of restorative care vs usual care for older adults receiving an acute episode of home care. JAMA 2002;287:2098–105.
16. Resnick B, Gruber-Baldini AL, Galik E, et al. Changing the philosophy of care in long-term care: testing of the restorative care intervention. Gerontologist 2009;49:175–84.
17. Pronovost PJ, Berenholtz SM, Needham DM. Translating evidence into practice: a model for large scale knowledge translation. BMJ 2008;337:a1714.
18. Davidoff F, Batalden P, Stevens D, et al; SQUIRE development group. Publication guidelines for quality improvement studies in health care: evolution of the SQUIRE project. BMJ 2009;338:a3152.
19. Sweeney JF. Nurse education: learner-centred or teacher-centred? Nurse Educ Today 1986;6:257–62.
20. Resnick B, Rogers V, Galik E, Gruber-Baldini AL. Measuring restorative care provided by nursing assistants: reliability and validity of the Restorative Care Behavior Checklist. Nurs Res 2007;56:387–98.
21. Oliver D, Britton M, Seed P, et al. Development and evaluation of evidence based risk assessment tool (STRATIFY) to predict which elderly inpatients will fall: case-control and cohort studies. BMJ 1997;315:1049–53.
22. Colin C, Wade DT, Davies S, Horne V. The Barthel ADL Index: a reliability study. Int Disabil Stud 1988;10:61–3.
23. Richards SH, Peters TJ, Coast J, et al. Inter-rater reliability of the Barthel ADL index: how does a researcher compare to a nurse? Clin Rehabil 2000;14:72–8.
24. Hodkinson HM. Evaluation of a mental test score for assessment of mental impairment in the elderly. Age Ageing 1972;1:233–8.
25. Morgan CD, Baade LE. Neuropsychological testing and assessment scales for dementia of the Alzheimer's type. Psychiatr Clin North Am 1997;20:25–43.
26. Granger CV, Hamilton BB, Gresham GE, Kramer AA. The stroke rehabilitation outcome study: Part II. Relative merits of the total Barthel index score and a four-item subscore in predicting patient outcomes. Arch Phys Med Rehabil
1989;70:100–3.
27. MacKenzie DM, Copp P, Shaw RJ, Goodwin GM. Brief cognitive screening of the elderly: a comparison of the Mini-Mental State Examination (MMSE), Abbreviated Mental Test (AMT) and Mental Status Questionnaire (MSQ). Psychol Med
1996;26:427–30.
28. Uyttenboogaart M, Stewart RE, Vroomen PC, et al. Optimizing cutoff scores for the Barthel index and the modified Rankin scale for defining outcome in acute stroke trials. Stroke 2005;36:1984–7.
29. Callen BL, Mahoney JE, Grieves CB, et al. Frequency of hallway ambulation by hospitalized older adults on medical units of an academic hospital. Geriatr Nurs 2004;25:212–7.
30. Boltz M, Resnick B, Capezuti E, Shuluk J. Activity restriction vs. self-direction: hospitalised older adults' response to fear of falling. Int J Older People Nurs 2014;9:44–53.
31. Moyle W, Borbasi S, Wallis M, et al. Acute care management of older people with dementia: a qualitative perspective. J Clin Nurs 2011;20:420–8.
32. Olson DM, Borel CO, Laskowitz DT, et al. Quiet time: a nursing intervention to promote sleep in neurocritical care units. Am J Crit Care 2001;10:74–8.
33. Gardner C, Collins C, Osborne S, et al. Creating a therapeutic environment: a non-randomised controlled trial of a quiet time intervention for patients in acute care. Int J Nurs Stud 2009;46:778–86.
34. Kupek E. Bias and heteroscedastic memory error in self-reported health behavior: an investigation using covariance structure analysis. BMC Med Res Methodol 2002;2:14.
35. Fromme HB, Karani R, Downing SM. Direct observation in medical education: a review of the literature and evidence for validity. Mt Sinai J Med 2009;76:365–71.
36. Williams RG, Klamen DA, McGaghie WC. Cognitive, social and environmental sources of bias in clinical performance ratings. Teach Learn Med 2003;15:270–92.
Implementation of the ABCDEF Bundle in an Academic Medical Center
Abstract
- Objective: To describe the highlights of our medical center’s implementation of the Society of Critical Care Medicine’s ABCDEF bundle in 3 medical intensive care units (ICUs).
- Methods: After a review of our current clinical practices and written clinical guidelines, we evaluated deficiencies in clinical care and employed a variety of educational and clinical change interventions for each element of the bundle. We utilized an interdisciplinary team approach to facilitate the change process.
- Results: As a result of our efforts, improvement in the accuracy of assessments of pain, agitation, and delir-ium across all clinical disciplines and improved adherence to clinical practice guidelines, protocols, and instruments for all bundle elements was seen. These changes have been sustained following completion of the data collection phase of the project.
- Conclusion: ICU care is a team effort. As a result of participation in this initiative, there has been an increased awareness of the bundle elements, improved collaboration among team members, and increased patient and family communication.
Key words: intensive care; delirium; sedation; mobility.
Admission to the intensive care unit (ICU) is a stressful and challenging time for patients and their families. In addition, significant negative sequelae following an ICU stay have been reported in the literature, including such post-ICU complications as post-traumatic stress disorder [1–9], depression [10,11], ICU-acquired weakness [12–19], and post-intensive care syndrome [20–23]. Pain, anxiety, and delirium all contribute to patient distress and agitation, and the prevention or treatment of pain, anxiety, and delirium in the ICU is an important goal. The Society of Critical Care Medicine (SCCM) developed the ABCDEF bundle (Table) to facilitate implementation of their 2013 clinical practice guidelines for the management of pain, agitation, and delirium (PAD) [24]. The bundle emphasizes an integrated approach to assessing, treating and preventing significant pain, over or undersedation, and delirium in critically ill patients.
In 2015, SCCM began the ICU Liberation Collaborative, a clinical care collaborative designed to implement the ABCDEF bundle through team-based care at hospitals and health systems across the country. The Liberation Collaborative’s intent was to “liberate” patients from iatrogenic aspects of care [25]. Our medical center participated in the collaborative. In this article, we describe the highlights of our medical center’s implementation of the ABCDEF bundle in 3 medical ICUs.
Settings
The Ohio State University Wexner Medical Center is a 1000+–bed academic medical center located in Columbus, Ohio, containing more than 180 ICU beds. These ICU beds provide care to patients with medical, surgical, burn, trauma, oncology, and transplantation needs. The care of the critically ill patient is central to the organization’s mission “to improve people’s lives through innovation in research, education and patient care.”
At the start of our colloborative participation, all of the ABCDEF bundle elements were protocolized in these ICUs. However, there was a lack of knowledge of the content of the bundle elements and corresponding guidelines among all members of our interdisciplinary teams, and our written protocols and guidelines supporting many of the bundle elements had inconsistent application across the 3 clinical settings.
We convened an ABCDEF bundle/ICU liberation team consisting of an interdisciplinary group of clinicians. The team leader was a critical care clinical nurse specialist. The project required outcome and demographic data collection for all patients in the collaborative as well as concurrent (daily) data collection on each bundle element. The clinical pharmacists who work in the MICUs and are part of daily interdisciplinary rounds collected the daily bundle element data while the patient demographic and outcome data were collected by the clinical nurse specialist, nurse practitioner, and clinical quality manager. Oversight and accountability for the ABCDEF bundle/ICU liberation project was provided by an interdisciplinary critical care quality committee. Our ABCDEF bundle/ICU liberation team met weekly to discuss progress of the initiative and provided monthly updates to the larger quality committee.
Impacting the Bundle—Nursing Assessments
The PAD guidelines recommend the routine assessment of pain, agitation, and delirium in ICU patients. For pain, they recommend the use of patient self-report or the use of a behavioral pain scale as the most valid and reliable method for completing this assessment [24]. Our medical center had chosen to use the Critical Care Pain Observation Tool (CPOT), a valid and reliable pain scale, for assessment of pain in patients who are unable to communicate [26], which had been in use in the clinical setting for over a year when this project began. For agitation, the PAD guidelines recommended assessment of the adequacy and depth of sedation using the Richmond Agitation Sedation Scale (RASS) or Sedation Agitation Scale (SAS) [24] for all ICU patients. Our medical center has chosen to use the RASS as our delirium assessment. The RASS had been in use in the clinical setting for approximately 10 years when this project started. For delirium assessment, the Confusion Assessment Method for ICU (CAM-ICU) [27] or the Intensive Care Delirium Screening Checklist (ICDSC) [28] is recommended. Our medical center used the CAM-ICU, which had been in place for approximately 10 years prior to the start of this project. Even though the assessment tools were in place in our MICU unit and hospital-based policies and guidelines, the accuracy of the assessments for PAD was questioned by many clinicians.
To improve the accuracy of our nursing assessments for PAD, a group of clinical nurse specialists and nursing educators developed an education and competency program for all critical care nursing staff. This education program focused on the PAD guidelines and our medical center’s chosen assessment tools. Education included in-person continuing education lectures, online modules, demonstrations, and practice in the clinical setting. After several months of education and practice, all staff registered nurses (RNs) had to demonstrate PAD assessment competency on a live person. We used standardized patients who followed written scenarios for all of the testing. The RN was given 1 of 8 scenarios and was charged with completing a PAD assessment on the standardized patient. RNs who did not pass had to review the education materials and re-test at a later date. More than 600 RNs completed the PAD competency. After completion of the PAD competency, the clinical nurse specialists observed clinical practice and audited nursing documentation. The accuracy of assessments for PAD had increased. Anecdotally, many our critical care clinicians acknowledged that they had increased confidence in the accuracy of the PAD assessments. There was increased agreement between the results of the assessments performed by all members of the interdisciplinary team.
Impacting the Bundle—Standardized Nurse Early Report Facilitation
Communication among the members of the interdisciplinary team is essential in caring for critically ill patients. One of the ways that the members of the interdisciplinary team communicate is through daily patient rounds. Our ABCDEF bundle/ICU liberation team members attend and participate in daily patient rounds in our 3 MICUs on a regular basis. The ABCDEF bundle/ICU liberation team members wanted to improve communication during patient rounds for all elements of the bundle.
Nurse Early Report Facilitation was a standard that was implemented approximately 5 years prior to the start of the ICU Liberation Collaborative. Nurse early report facilitation requires that the bedside staff RN starts the daily patient rounds discussion on each of his/her patients. The report given by the bedside RN was designed to last 60 to 90 seconds and provide dynamic information on the patient’s condition. Requiring the bedside RN to start the patient rounding provides the following benefits: requires bedside RN presence, provides up-to-the-minute information, increases bedside RN engagement in the patient’s plan of care, and allows for questions and answers. Compliance from the bedside RNs with this process of beginning patient rounds was very high; however, the information that was shared when the bedside RN began rounds was variable. Some bedside RNs provided a lengthy report on the patient while others provided 1 or 2 words.
The ABCDEF bundle/ICU liberation team members thought that a way to hardwire the ABCDEF bundle elements would be to add structure to the nurse early report. By using the ABCDEF elements as a guide, the ABCDEF bundle/ICU liberation team members developed the Structured Nurse Early Report Facilitation in which the bedside RN provides the following information at the beginning of each patient discussion during rounds: name of patient, overnight events (travels, clinical changes, etc.), pain (pain score and PRN use), agitation (RASS and PRN use), delirium (results of CAM-ICU). When the bedside RN performs the nurse early report using the structured format, the team is primed to discuss the A, B, C, and D elements of the bundle.
To implement the Structured Nurse Early Report Facilitation in the MICUs, the critical care clinical nurse specialists provided in-person education at the monthly staff meetings. They also sent emails, developed education bulletin boards, made reminder cards that were placed on the in-room computers, and distributed “badge buddy” reminder cards that fit on the RNs’ hospital ID badges. We provided emails and in-person education to our physician and nurse practitioner teams so they were aware of the changes. Our physician and nurse practitioners were encouraged to ask for information about any elements missing from the Structured Nurse Early Report in the early days of the process change.
After a few months, the critical care clinical nurse specialists reported that the Structured Nurse Early Report Facilitation was occurring for more than 80% of MICU patients. Besides the increase in information related to pain, agitation, and delirium, the Structured Nurse Early Report Facilitation increased the interdisciplinary team’s use of the term “delirium.” Prior to the structured nurse early report, most of the interdisciplinary team members were not naming delirium as a diagnosis for our MICU patients and used terms such as ICU psychosis, confused, and disoriented to describe the mental status of patients with delirium. As a result of this lack of naming, there may have been a lack of recognition of delirium. Using the word “delirium” has increased our interdisciplinary team’s awareness of this diagnosis and has increased the treatment of delirium in patients who have the diagnosis.
In addition to improved assessment and diagnosis, the clinical pharmacist began leading the discussions around choice of sedation during daily rounds. Team members began to discuss the patient’s sedation level, sedation goals, and develop a plan for each patient. This discussion included input from all members of the interdisciplinary team and allowed for a comprehensive patient-specific plan to be formed during the daily patient rounds episode.
Impacting the Bundle—Focus on Mobility
There have been many articles published in the critical care literature on the topic of mobility in the ICU. The evidence shows that early mobilization and rehabilitation of patients in ICUs is safe and may improve physical function, and reduce the duration of delirium, mechanical ventilation, and ICU length of stay [29–31]. Our institution had developed a critical care mobility guideline in 2008 for staff RNs to follow in determining the level of mobility that the patient required during the shift. Over the years, the mobility guideline was used less and less. As other tasks and interventions became a priority, mobility became an intervention that was completed for very few patients.
Our ABCDEF bundle/ICU liberation team determined that increasing mobility of our MICU patients needed to be a plan of care priority. We organized an interdisciplinary team to discuss the issues and barriers to mobility for our MICU patients. The interdisciplinary mobility team had representatives from medicine, nursing, respiratory therapy, physical therapy, occupational therapy, and speech therapy. Initially, this team sent a survey to all disciplines who provided care for the patients in the MICU. Data from this survey was analyzed by the team to determine next steps.
Despite the fact that there were responses from 6 unique disciplines, several common barriers emerged. The largest barrier to overcome was staffing/time for mobility. It was clear from the survey respondents that all health care team members were busy providing patient care. Any change in the mobility guideline or practice needed to make efficient use of the practitioner’s time. Other barriers included space/equipment, communication, patient schedules, knowledge, patient and staff safety, and unit culture. The interdisciplinary mobility team divided into smaller workgroups to tackle the issues and barriers.
Mobility Rounds
Mobility rounds were implemented to attempt to decrease the barriers of time, communication, and know-ledge. Mobility rounds were designed as a start to the shift discussion on the topic of mobility. Mobility rounds included a clinical nurse specialist, a physical therapist (PT), an occupational therapist (OT), and a pulmonary physician/ nurse practitioner. This team met at 7:30 each weekday morning and walked room-to-room through our MICUs. The mobility rounds team laid eyes on each patient, developed a mobility plan for the day, and communicated this plan with the staff RN assigned to the patient. Mobility rounds were completed on all 48 MICU patients in 30 minutes.
Having the mobility rounds team at each patient’s bedside was important in several ways. First, it allowed the team members to see each patient, which gave the patient an opportunity to be part of his/her mobility plan. Also, the staff RNs and respiratory therapists (RTs) were often in the patient’s room. This improved communication as the staff RNs and RTs discussed the mobility plan with the PT and OT. For patients who required many resources for a mobility session, the morning bedside meeting allowed RNs, RTs, PTs, OTs, and physicians to set a schedule for the day’s mobility session. Having a scheduled time for mobility increased staff and patient communication. Also, it allowed all of the team members to adjust their workloads to be present for a complex mobility session.
Another benefit of mobility rounds was the opportunity for the PT and OT team members to provide education to their nursing and physician colleagues. Many nursing and physician providers do not understand the intricacies of physical and occupational therapy practice. This daily dialogue provided the PT/OT a forum to explain which patients would benefit from PT/OT services and which would not. It allowed the RNs and physicians to hear the type of therapy provided on past sessions. It allowed the PT/OT to discuss and evaluate the appropriateness of each patient consult. It allowed the RN and physician to communicate which patients they felt were highest priority for therapy for that day. Mobility rounds are ongoing. Data are being collected to determine the impact of mobility rounds on the intensity of mobility for our MICU patients.
Nurse-Driven Mobility Guideline
Another subgroup revised the outdated critical care mobility guideline and developed the new “Nurse-Driven Critical Care Mobility Guideline.” The guideline has been approved through all of the medical center quality committees and is in the final copyright and publication stages, with implementation training to begin in the fall. The updated guideline is in an easy-to-read flowchart format and provides the staff RN with a pathway to follow to determine if mobility is safe for the patient. After determining safety, the staff RN uses the guideline to determine and perform the patient’s correct mobility interventions for his/her shift. The guideline has built in consultation points with the provider team and the therapy experts.
Other Mobility Issues
A third subgroup from the interdisciplinary mobility team has been working on the equipment and space barriers. This subgroup is evaluating equipment such as bedside chairs, specialty beds, and assistive devices. Many of our MICU patient rooms have overhead lifts built into the ceilings. This equipment is available to all staff at all times. The equipment/space subgroup made sure that there were slings for use with the overhead lifts in all of the MICU equipment rooms. They provided staff education on proper use of the overhead lifts. They worked with the financial department and MICU nurse managers to purchase 2 bariatric chairs for patient use in the MICU.
A fourth subgroup has been working on the electronic documentation system. They are partnering with members of the information technology department to update the nursing and provider documentation regarding mobility. They have also worked on updating and elaborating on the electronic activity orders for our MICU patients. There have been many changes to various patient order sets to clarify mobility and activity restrictions. The admission order set for our MICU patients has an activity order that allows our staff RNs to fully utilize the new nurse-driven critical care mobility guideline.
Impacting the Bundle—Family Engagement and Empowerment
Family support is important for all hospitalized patients but is crucial for ICU patients. The medical center implemented an open visitation policy for all ICUs in 2015. Despite open visitation, the communication between patients, families, and interdisciplinary ICU teams was deficient. Families spoke to many different team members and had difficulty remembering all of the information that they received.
To increase family participation in the care of the MICU patient, we invited family members to participate in daily rounds. The families were invited to listen and encouraged to ask questions. During daily rounds, there is a time when all care providers stop talking and allow family members to inquire about the proposed plan of care for their family member. For family members who cannot attend daily rounds, our ICU teams arrange daily in-person or telephone meetings to discuss the patient’s plan of care. RNs provide a daily telefamily call to update the designated family member on the patient’s status, answer questions, and provide support.
In addition to the medical support for families, there is an art therapy program integrated into the ICU to assist families while they are in the medical center. This program is run by a certified art therapist who holds art therapy classes 2 afternoons a week. This provides family members with respite time during long hospital days. There are also nondenominational services offered multiple times during the week and a respite area is located in the lobby of the medical center.
In addition to these programs, the medical center added full-time social workers to be available 24 hours a day/ 7 days a week. The social worker can provide social support for our patients and families as well as help facilitate accommodations for those who travel a far distance. The social worker plays in integral part on the ICU team, often bridging the gap for families that can be overlooked by the medical team.
Conclusion
Care of the ICU patient is complex. Too often we work in our silos of responsibility with our list of tasks for the day. Participating in the ABCDEF bundle/ICU Liberation Collaborative required us to work together as a team. We were able to have candid conversations that improved our understanding of other team members’ perspectives, helping us to reflect on our behaviors and overcome barriers to improving patient care.
Even though the ICU Liberation Collaborative has ended, our work at the medical center continues. We are in the process of evaluating all of the interventions, processes, and guideline updates that our ABCEDF bundle/ICU liberation team worked on during our 18-month program. There have been many improvements such as increased accuracy of pain and delirium assessments, along with improved treatment of pain in the MICU patient. We have noticed increased communication with the patient and family and among all of the members of the interdisciplinary team. We have changed our language to accurately reflect the patient’s sedation level by using the correct RASS score and delirium status by using the term “delirium” when this condition exists. There is increased collaboration among team members in the area of mobility. More patients are out of bed on bedside chairs and more patients are walking in the halls. Over the next several months our ABCEDF bundle/ICU liberation team will continue to review and analyze the data that we collected in the collaborative. We will use that data and the clinical changes we see on a daily basis to continue to improve the care for our MICU patients.
Corresponding author: Michele L. Weber, DNP, RN, CCRN, CCNS, AOCNS, OCN, ANP-BC, The Ohio State University Wexner Medical Center, 410 West 10th Ave., Columbus, OH 43210, Michele.weber@osumc.edu.
1. Svenningsen H, Egerod I, Christensen D, et al Symptoms of posttraumatic stress after intensive care delirium. Biomed Res Int 2015;2015:876–947.
2. Warlan H, Howland L. Posttraumatic stress syndrome associated with stays in the intensive care unit: importance of nurses; involvement. Crit Care Nurse 2015;35:44–52.
3. Bienvenu OJ, Gerstenblith TA. Posttraumatic stress disorder phenomena after critical illness. Crit Care Clin 2017;33:649–58.
4. Wintermann GB, Rosendahl J, Weidner K, et al. Risk factors of delayed onset posttraumatic stress disorder in chronically critically ill patients. J Nerv Ment Dis 2017 Jul 5.
5. Wolters AE, Peelen LM, Welling MC, et al. Long-term mental health problems after delirium in the ICU. Crit Care Med 2016;44:1808–13.
6. Wintermann GB, Weidner K, Stafuss B. Predictors of posttraumatic stress and quality of life in family members of chronically critically ill patients after intensive care Ann Intensive Care 2016;6:69.
7. Patel MD, Jackson JC, Morandi A et al. Incidence and risk factors for intensive care unit-related post-traumatic stress disorder in veterans and civilians Am J Respir Crit Care Med 2016;193:1373–81.
8. Girad TD, Shintani AK, Jackson JC et al. Risk factors for post-traumatic stress disorder symptoms following critical illness requiring mechanical ventilation: a prospective cohort study. Crit Care 2007;11:R28.
9. Jackson JC, Hart RP, Gordon SM, et al. Post-traumatic stress disorder and post-traumatic stress symptoms following critical illness in medical intensive care unit patients: assessing the magnitude of the problem. Crit Care 2007;11:R27.
10. Jackson JC, Pandharipande PP, Girad TD et al. Depression, post-traumatic stress disorder, and functional disability in survivors of critical illness in the BRAIN-ICU study: a longitudinal cohort study. Lancet Resp Med 2014;2:369–79.
11. Davydow DS, Hough CL, Langa KM, Iwashyna TJ. Depressive symptoms in spouses of older patients with severe sepsis. Crit Care Med 2012;40:2335–41.
12. Farhan H, Moeno-Duarte I, Latronico N, et al. Acquired muscle weakness in the surgical intensive care unit: nosology, epidemiology, diagnosis and prevention. Anesthesiology 2016;124:207–34.
13. Stevens, RD, Zink EK. Inflammatory signatures in ICU-acquired weakness. Crit Care Med 2017;45:1098–100.
14. Lotronico, N, Herridge M, Hopkins O, et al. The ICM research agenda on intensive care unit-acquired weakness. Intensive Care Med 2017 Mar 13.
15. Batt J, Herridge M, Dos Santos C. Mechanism of ICU-acquired weakness: skeletal muscle loss in critical illness. Intensive Care Med 2017 Mar 10.
16. Batt J, Mathur S, Katzberg HD. Mechanism of ICU-acquired weakness: muscle contractility in critical illness. Intensive Care Med 2017;43:584–86.
17. Schweickert WD, Hall J. ICU-acquired weakness. Chest 2007;131:1541–9.
18. Deem S. Intensive care unit-acquired muscle weakness. Repir Care 2006;51:1042–52.
19. Kahn J, Burnham EL, Moss M. Acquired weakness in the ICU: critical illness myopathy and polyneuropathy. Minerva Anesthesiol 2006;72:401–6.
20. Jeitziner MM, Hamers JP, Burgin R et al. Long-term consequences of pain, anxiety, and agitation for critically ill older patients after an intensive care unit stay. J Clin Nurs 2015;24:2419–28.
21. Svennigsen H, Langhorn L, Agard AS, Dereyer P. Post-ICU symptoms, consequences, and follow-up: an integrative review. Nurs Crit Care 2017;22:212–20.
22. Torres J, Carvalho D, Molinos E et al. The impact of the patient post-intensive care syndrome components upon caregiver burden. Med Intensiva 2017 Feb 7
23. Rawal G, Yadav S, Sumar R. Post-Intensive care syndrome: an overview. J Transl Int Med 2017;305:90–2.
24. Barr J, Fraser GL, Puntillo K , et al. Clinical practice guidelines for the management of pain, agitation, and delirium in adult patients in the intensive care unit. Crit Care Med 2013;41:263–306.
25. Ely EW. The ABCDEF bundle: science and philosophy of how ICU liberation serves patients and families. Crit Care Med 2017;45:321–30.
26. Gelinas C, Fillion L, Puntillo K, et al. Validation of the critical-care pain observation tool in adult patients. Am J Crit Care 2006;15:420–7.
27. Ely EW, Margolin R, Francis J, et al. Evaluation of delirium in critically ill patients: validation of the Confusion Assessment Method for the Intensive Care Unit (CAM-ICU). Crit Care Med 2001;29:1370–9.
28. Bergeron N, Dubois MJ, Dumont M, et al. Intensive Care Delirium Screening Checklist: Evaluation of a new screening tool. Intensive Care Med 2001;27:859–64.
29. Bailey P, Thomsen GE, Spuhler VJ, et al. Early activity is feasible and safe in respiratory failure patients. Crit Care Med 2007;35:139–45.
30. Morris PE. Moving our critically ill patients: Mobility barriers and benefits. Crit Care Clin 2007;23:1–20.
31. Nydahl P, Sricharoenchai T, Chandra S, et al. Safety of patient mobilization and rehabilitation in the intensive care unit. Systematic review with meta-analysis. Ann Am Thorac Soc 2017;14:766–77.
Abstract
- Objective: To describe the highlights of our medical center’s implementation of the Society of Critical Care Medicine’s ABCDEF bundle in 3 medical intensive care units (ICUs).
- Methods: After a review of our current clinical practices and written clinical guidelines, we evaluated deficiencies in clinical care and employed a variety of educational and clinical change interventions for each element of the bundle. We utilized an interdisciplinary team approach to facilitate the change process.
- Results: As a result of our efforts, improvement in the accuracy of assessments of pain, agitation, and delir-ium across all clinical disciplines and improved adherence to clinical practice guidelines, protocols, and instruments for all bundle elements was seen. These changes have been sustained following completion of the data collection phase of the project.
- Conclusion: ICU care is a team effort. As a result of participation in this initiative, there has been an increased awareness of the bundle elements, improved collaboration among team members, and increased patient and family communication.
Key words: intensive care; delirium; sedation; mobility.
Admission to the intensive care unit (ICU) is a stressful and challenging time for patients and their families. In addition, significant negative sequelae following an ICU stay have been reported in the literature, including such post-ICU complications as post-traumatic stress disorder [1–9], depression [10,11], ICU-acquired weakness [12–19], and post-intensive care syndrome [20–23]. Pain, anxiety, and delirium all contribute to patient distress and agitation, and the prevention or treatment of pain, anxiety, and delirium in the ICU is an important goal. The Society of Critical Care Medicine (SCCM) developed the ABCDEF bundle (Table) to facilitate implementation of their 2013 clinical practice guidelines for the management of pain, agitation, and delirium (PAD) [24]. The bundle emphasizes an integrated approach to assessing, treating and preventing significant pain, over or undersedation, and delirium in critically ill patients.
In 2015, SCCM began the ICU Liberation Collaborative, a clinical care collaborative designed to implement the ABCDEF bundle through team-based care at hospitals and health systems across the country. The Liberation Collaborative’s intent was to “liberate” patients from iatrogenic aspects of care [25]. Our medical center participated in the collaborative. In this article, we describe the highlights of our medical center’s implementation of the ABCDEF bundle in 3 medical ICUs.
Settings
The Ohio State University Wexner Medical Center is a 1000+–bed academic medical center located in Columbus, Ohio, containing more than 180 ICU beds. These ICU beds provide care to patients with medical, surgical, burn, trauma, oncology, and transplantation needs. The care of the critically ill patient is central to the organization’s mission “to improve people’s lives through innovation in research, education and patient care.”
At the start of our colloborative participation, all of the ABCDEF bundle elements were protocolized in these ICUs. However, there was a lack of knowledge of the content of the bundle elements and corresponding guidelines among all members of our interdisciplinary teams, and our written protocols and guidelines supporting many of the bundle elements had inconsistent application across the 3 clinical settings.
We convened an ABCDEF bundle/ICU liberation team consisting of an interdisciplinary group of clinicians. The team leader was a critical care clinical nurse specialist. The project required outcome and demographic data collection for all patients in the collaborative as well as concurrent (daily) data collection on each bundle element. The clinical pharmacists who work in the MICUs and are part of daily interdisciplinary rounds collected the daily bundle element data while the patient demographic and outcome data were collected by the clinical nurse specialist, nurse practitioner, and clinical quality manager. Oversight and accountability for the ABCDEF bundle/ICU liberation project was provided by an interdisciplinary critical care quality committee. Our ABCDEF bundle/ICU liberation team met weekly to discuss progress of the initiative and provided monthly updates to the larger quality committee.
Impacting the Bundle—Nursing Assessments
The PAD guidelines recommend the routine assessment of pain, agitation, and delirium in ICU patients. For pain, they recommend the use of patient self-report or the use of a behavioral pain scale as the most valid and reliable method for completing this assessment [24]. Our medical center had chosen to use the Critical Care Pain Observation Tool (CPOT), a valid and reliable pain scale, for assessment of pain in patients who are unable to communicate [26], which had been in use in the clinical setting for over a year when this project began. For agitation, the PAD guidelines recommended assessment of the adequacy and depth of sedation using the Richmond Agitation Sedation Scale (RASS) or Sedation Agitation Scale (SAS) [24] for all ICU patients. Our medical center has chosen to use the RASS as our delirium assessment. The RASS had been in use in the clinical setting for approximately 10 years when this project started. For delirium assessment, the Confusion Assessment Method for ICU (CAM-ICU) [27] or the Intensive Care Delirium Screening Checklist (ICDSC) [28] is recommended. Our medical center used the CAM-ICU, which had been in place for approximately 10 years prior to the start of this project. Even though the assessment tools were in place in our MICU unit and hospital-based policies and guidelines, the accuracy of the assessments for PAD was questioned by many clinicians.
To improve the accuracy of our nursing assessments for PAD, a group of clinical nurse specialists and nursing educators developed an education and competency program for all critical care nursing staff. This education program focused on the PAD guidelines and our medical center’s chosen assessment tools. Education included in-person continuing education lectures, online modules, demonstrations, and practice in the clinical setting. After several months of education and practice, all staff registered nurses (RNs) had to demonstrate PAD assessment competency on a live person. We used standardized patients who followed written scenarios for all of the testing. The RN was given 1 of 8 scenarios and was charged with completing a PAD assessment on the standardized patient. RNs who did not pass had to review the education materials and re-test at a later date. More than 600 RNs completed the PAD competency. After completion of the PAD competency, the clinical nurse specialists observed clinical practice and audited nursing documentation. The accuracy of assessments for PAD had increased. Anecdotally, many our critical care clinicians acknowledged that they had increased confidence in the accuracy of the PAD assessments. There was increased agreement between the results of the assessments performed by all members of the interdisciplinary team.
Impacting the Bundle—Standardized Nurse Early Report Facilitation
Communication among the members of the interdisciplinary team is essential in caring for critically ill patients. One of the ways that the members of the interdisciplinary team communicate is through daily patient rounds. Our ABCDEF bundle/ICU liberation team members attend and participate in daily patient rounds in our 3 MICUs on a regular basis. The ABCDEF bundle/ICU liberation team members wanted to improve communication during patient rounds for all elements of the bundle.
Nurse Early Report Facilitation was a standard that was implemented approximately 5 years prior to the start of the ICU Liberation Collaborative. Nurse early report facilitation requires that the bedside staff RN starts the daily patient rounds discussion on each of his/her patients. The report given by the bedside RN was designed to last 60 to 90 seconds and provide dynamic information on the patient’s condition. Requiring the bedside RN to start the patient rounding provides the following benefits: requires bedside RN presence, provides up-to-the-minute information, increases bedside RN engagement in the patient’s plan of care, and allows for questions and answers. Compliance from the bedside RNs with this process of beginning patient rounds was very high; however, the information that was shared when the bedside RN began rounds was variable. Some bedside RNs provided a lengthy report on the patient while others provided 1 or 2 words.
The ABCDEF bundle/ICU liberation team members thought that a way to hardwire the ABCDEF bundle elements would be to add structure to the nurse early report. By using the ABCDEF elements as a guide, the ABCDEF bundle/ICU liberation team members developed the Structured Nurse Early Report Facilitation in which the bedside RN provides the following information at the beginning of each patient discussion during rounds: name of patient, overnight events (travels, clinical changes, etc.), pain (pain score and PRN use), agitation (RASS and PRN use), delirium (results of CAM-ICU). When the bedside RN performs the nurse early report using the structured format, the team is primed to discuss the A, B, C, and D elements of the bundle.
To implement the Structured Nurse Early Report Facilitation in the MICUs, the critical care clinical nurse specialists provided in-person education at the monthly staff meetings. They also sent emails, developed education bulletin boards, made reminder cards that were placed on the in-room computers, and distributed “badge buddy” reminder cards that fit on the RNs’ hospital ID badges. We provided emails and in-person education to our physician and nurse practitioner teams so they were aware of the changes. Our physician and nurse practitioners were encouraged to ask for information about any elements missing from the Structured Nurse Early Report in the early days of the process change.
After a few months, the critical care clinical nurse specialists reported that the Structured Nurse Early Report Facilitation was occurring for more than 80% of MICU patients. Besides the increase in information related to pain, agitation, and delirium, the Structured Nurse Early Report Facilitation increased the interdisciplinary team’s use of the term “delirium.” Prior to the structured nurse early report, most of the interdisciplinary team members were not naming delirium as a diagnosis for our MICU patients and used terms such as ICU psychosis, confused, and disoriented to describe the mental status of patients with delirium. As a result of this lack of naming, there may have been a lack of recognition of delirium. Using the word “delirium” has increased our interdisciplinary team’s awareness of this diagnosis and has increased the treatment of delirium in patients who have the diagnosis.
In addition to improved assessment and diagnosis, the clinical pharmacist began leading the discussions around choice of sedation during daily rounds. Team members began to discuss the patient’s sedation level, sedation goals, and develop a plan for each patient. This discussion included input from all members of the interdisciplinary team and allowed for a comprehensive patient-specific plan to be formed during the daily patient rounds episode.
Impacting the Bundle—Focus on Mobility
There have been many articles published in the critical care literature on the topic of mobility in the ICU. The evidence shows that early mobilization and rehabilitation of patients in ICUs is safe and may improve physical function, and reduce the duration of delirium, mechanical ventilation, and ICU length of stay [29–31]. Our institution had developed a critical care mobility guideline in 2008 for staff RNs to follow in determining the level of mobility that the patient required during the shift. Over the years, the mobility guideline was used less and less. As other tasks and interventions became a priority, mobility became an intervention that was completed for very few patients.
Our ABCDEF bundle/ICU liberation team determined that increasing mobility of our MICU patients needed to be a plan of care priority. We organized an interdisciplinary team to discuss the issues and barriers to mobility for our MICU patients. The interdisciplinary mobility team had representatives from medicine, nursing, respiratory therapy, physical therapy, occupational therapy, and speech therapy. Initially, this team sent a survey to all disciplines who provided care for the patients in the MICU. Data from this survey was analyzed by the team to determine next steps.
Despite the fact that there were responses from 6 unique disciplines, several common barriers emerged. The largest barrier to overcome was staffing/time for mobility. It was clear from the survey respondents that all health care team members were busy providing patient care. Any change in the mobility guideline or practice needed to make efficient use of the practitioner’s time. Other barriers included space/equipment, communication, patient schedules, knowledge, patient and staff safety, and unit culture. The interdisciplinary mobility team divided into smaller workgroups to tackle the issues and barriers.
Mobility Rounds
Mobility rounds were implemented to attempt to decrease the barriers of time, communication, and know-ledge. Mobility rounds were designed as a start to the shift discussion on the topic of mobility. Mobility rounds included a clinical nurse specialist, a physical therapist (PT), an occupational therapist (OT), and a pulmonary physician/ nurse practitioner. This team met at 7:30 each weekday morning and walked room-to-room through our MICUs. The mobility rounds team laid eyes on each patient, developed a mobility plan for the day, and communicated this plan with the staff RN assigned to the patient. Mobility rounds were completed on all 48 MICU patients in 30 minutes.
Having the mobility rounds team at each patient’s bedside was important in several ways. First, it allowed the team members to see each patient, which gave the patient an opportunity to be part of his/her mobility plan. Also, the staff RNs and respiratory therapists (RTs) were often in the patient’s room. This improved communication as the staff RNs and RTs discussed the mobility plan with the PT and OT. For patients who required many resources for a mobility session, the morning bedside meeting allowed RNs, RTs, PTs, OTs, and physicians to set a schedule for the day’s mobility session. Having a scheduled time for mobility increased staff and patient communication. Also, it allowed all of the team members to adjust their workloads to be present for a complex mobility session.
Another benefit of mobility rounds was the opportunity for the PT and OT team members to provide education to their nursing and physician colleagues. Many nursing and physician providers do not understand the intricacies of physical and occupational therapy practice. This daily dialogue provided the PT/OT a forum to explain which patients would benefit from PT/OT services and which would not. It allowed the RNs and physicians to hear the type of therapy provided on past sessions. It allowed the PT/OT to discuss and evaluate the appropriateness of each patient consult. It allowed the RN and physician to communicate which patients they felt were highest priority for therapy for that day. Mobility rounds are ongoing. Data are being collected to determine the impact of mobility rounds on the intensity of mobility for our MICU patients.
Nurse-Driven Mobility Guideline
Another subgroup revised the outdated critical care mobility guideline and developed the new “Nurse-Driven Critical Care Mobility Guideline.” The guideline has been approved through all of the medical center quality committees and is in the final copyright and publication stages, with implementation training to begin in the fall. The updated guideline is in an easy-to-read flowchart format and provides the staff RN with a pathway to follow to determine if mobility is safe for the patient. After determining safety, the staff RN uses the guideline to determine and perform the patient’s correct mobility interventions for his/her shift. The guideline has built in consultation points with the provider team and the therapy experts.
Other Mobility Issues
A third subgroup from the interdisciplinary mobility team has been working on the equipment and space barriers. This subgroup is evaluating equipment such as bedside chairs, specialty beds, and assistive devices. Many of our MICU patient rooms have overhead lifts built into the ceilings. This equipment is available to all staff at all times. The equipment/space subgroup made sure that there were slings for use with the overhead lifts in all of the MICU equipment rooms. They provided staff education on proper use of the overhead lifts. They worked with the financial department and MICU nurse managers to purchase 2 bariatric chairs for patient use in the MICU.
A fourth subgroup has been working on the electronic documentation system. They are partnering with members of the information technology department to update the nursing and provider documentation regarding mobility. They have also worked on updating and elaborating on the electronic activity orders for our MICU patients. There have been many changes to various patient order sets to clarify mobility and activity restrictions. The admission order set for our MICU patients has an activity order that allows our staff RNs to fully utilize the new nurse-driven critical care mobility guideline.
Impacting the Bundle—Family Engagement and Empowerment
Family support is important for all hospitalized patients but is crucial for ICU patients. The medical center implemented an open visitation policy for all ICUs in 2015. Despite open visitation, the communication between patients, families, and interdisciplinary ICU teams was deficient. Families spoke to many different team members and had difficulty remembering all of the information that they received.
To increase family participation in the care of the MICU patient, we invited family members to participate in daily rounds. The families were invited to listen and encouraged to ask questions. During daily rounds, there is a time when all care providers stop talking and allow family members to inquire about the proposed plan of care for their family member. For family members who cannot attend daily rounds, our ICU teams arrange daily in-person or telephone meetings to discuss the patient’s plan of care. RNs provide a daily telefamily call to update the designated family member on the patient’s status, answer questions, and provide support.
In addition to the medical support for families, there is an art therapy program integrated into the ICU to assist families while they are in the medical center. This program is run by a certified art therapist who holds art therapy classes 2 afternoons a week. This provides family members with respite time during long hospital days. There are also nondenominational services offered multiple times during the week and a respite area is located in the lobby of the medical center.
In addition to these programs, the medical center added full-time social workers to be available 24 hours a day/ 7 days a week. The social worker can provide social support for our patients and families as well as help facilitate accommodations for those who travel a far distance. The social worker plays in integral part on the ICU team, often bridging the gap for families that can be overlooked by the medical team.
Conclusion
Care of the ICU patient is complex. Too often we work in our silos of responsibility with our list of tasks for the day. Participating in the ABCDEF bundle/ICU Liberation Collaborative required us to work together as a team. We were able to have candid conversations that improved our understanding of other team members’ perspectives, helping us to reflect on our behaviors and overcome barriers to improving patient care.
Even though the ICU Liberation Collaborative has ended, our work at the medical center continues. We are in the process of evaluating all of the interventions, processes, and guideline updates that our ABCEDF bundle/ICU liberation team worked on during our 18-month program. There have been many improvements such as increased accuracy of pain and delirium assessments, along with improved treatment of pain in the MICU patient. We have noticed increased communication with the patient and family and among all of the members of the interdisciplinary team. We have changed our language to accurately reflect the patient’s sedation level by using the correct RASS score and delirium status by using the term “delirium” when this condition exists. There is increased collaboration among team members in the area of mobility. More patients are out of bed on bedside chairs and more patients are walking in the halls. Over the next several months our ABCEDF bundle/ICU liberation team will continue to review and analyze the data that we collected in the collaborative. We will use that data and the clinical changes we see on a daily basis to continue to improve the care for our MICU patients.
Corresponding author: Michele L. Weber, DNP, RN, CCRN, CCNS, AOCNS, OCN, ANP-BC, The Ohio State University Wexner Medical Center, 410 West 10th Ave., Columbus, OH 43210, Michele.weber@osumc.edu.
1. Svenningsen H, Egerod I, Christensen D, et al Symptoms of posttraumatic stress after intensive care delirium. Biomed Res Int 2015;2015:876–947.
2. Warlan H, Howland L. Posttraumatic stress syndrome associated with stays in the intensive care unit: importance of nurses; involvement. Crit Care Nurse 2015;35:44–52.
3. Bienvenu OJ, Gerstenblith TA. Posttraumatic stress disorder phenomena after critical illness. Crit Care Clin 2017;33:649–58.
4. Wintermann GB, Rosendahl J, Weidner K, et al. Risk factors of delayed onset posttraumatic stress disorder in chronically critically ill patients. J Nerv Ment Dis 2017 Jul 5.
5. Wolters AE, Peelen LM, Welling MC, et al. Long-term mental health problems after delirium in the ICU. Crit Care Med 2016;44:1808–13.
6. Wintermann GB, Weidner K, Stafuss B. Predictors of posttraumatic stress and quality of life in family members of chronically critically ill patients after intensive care Ann Intensive Care 2016;6:69.
7. Patel MD, Jackson JC, Morandi A et al. Incidence and risk factors for intensive care unit-related post-traumatic stress disorder in veterans and civilians Am J Respir Crit Care Med 2016;193:1373–81.
8. Girad TD, Shintani AK, Jackson JC et al. Risk factors for post-traumatic stress disorder symptoms following critical illness requiring mechanical ventilation: a prospective cohort study. Crit Care 2007;11:R28.
9. Jackson JC, Hart RP, Gordon SM, et al. Post-traumatic stress disorder and post-traumatic stress symptoms following critical illness in medical intensive care unit patients: assessing the magnitude of the problem. Crit Care 2007;11:R27.
10. Jackson JC, Pandharipande PP, Girad TD et al. Depression, post-traumatic stress disorder, and functional disability in survivors of critical illness in the BRAIN-ICU study: a longitudinal cohort study. Lancet Resp Med 2014;2:369–79.
11. Davydow DS, Hough CL, Langa KM, Iwashyna TJ. Depressive symptoms in spouses of older patients with severe sepsis. Crit Care Med 2012;40:2335–41.
12. Farhan H, Moeno-Duarte I, Latronico N, et al. Acquired muscle weakness in the surgical intensive care unit: nosology, epidemiology, diagnosis and prevention. Anesthesiology 2016;124:207–34.
13. Stevens, RD, Zink EK. Inflammatory signatures in ICU-acquired weakness. Crit Care Med 2017;45:1098–100.
14. Lotronico, N, Herridge M, Hopkins O, et al. The ICM research agenda on intensive care unit-acquired weakness. Intensive Care Med 2017 Mar 13.
15. Batt J, Herridge M, Dos Santos C. Mechanism of ICU-acquired weakness: skeletal muscle loss in critical illness. Intensive Care Med 2017 Mar 10.
16. Batt J, Mathur S, Katzberg HD. Mechanism of ICU-acquired weakness: muscle contractility in critical illness. Intensive Care Med 2017;43:584–86.
17. Schweickert WD, Hall J. ICU-acquired weakness. Chest 2007;131:1541–9.
18. Deem S. Intensive care unit-acquired muscle weakness. Repir Care 2006;51:1042–52.
19. Kahn J, Burnham EL, Moss M. Acquired weakness in the ICU: critical illness myopathy and polyneuropathy. Minerva Anesthesiol 2006;72:401–6.
20. Jeitziner MM, Hamers JP, Burgin R et al. Long-term consequences of pain, anxiety, and agitation for critically ill older patients after an intensive care unit stay. J Clin Nurs 2015;24:2419–28.
21. Svennigsen H, Langhorn L, Agard AS, Dereyer P. Post-ICU symptoms, consequences, and follow-up: an integrative review. Nurs Crit Care 2017;22:212–20.
22. Torres J, Carvalho D, Molinos E et al. The impact of the patient post-intensive care syndrome components upon caregiver burden. Med Intensiva 2017 Feb 7
23. Rawal G, Yadav S, Sumar R. Post-Intensive care syndrome: an overview. J Transl Int Med 2017;305:90–2.
24. Barr J, Fraser GL, Puntillo K , et al. Clinical practice guidelines for the management of pain, agitation, and delirium in adult patients in the intensive care unit. Crit Care Med 2013;41:263–306.
25. Ely EW. The ABCDEF bundle: science and philosophy of how ICU liberation serves patients and families. Crit Care Med 2017;45:321–30.
26. Gelinas C, Fillion L, Puntillo K, et al. Validation of the critical-care pain observation tool in adult patients. Am J Crit Care 2006;15:420–7.
27. Ely EW, Margolin R, Francis J, et al. Evaluation of delirium in critically ill patients: validation of the Confusion Assessment Method for the Intensive Care Unit (CAM-ICU). Crit Care Med 2001;29:1370–9.
28. Bergeron N, Dubois MJ, Dumont M, et al. Intensive Care Delirium Screening Checklist: Evaluation of a new screening tool. Intensive Care Med 2001;27:859–64.
29. Bailey P, Thomsen GE, Spuhler VJ, et al. Early activity is feasible and safe in respiratory failure patients. Crit Care Med 2007;35:139–45.
30. Morris PE. Moving our critically ill patients: Mobility barriers and benefits. Crit Care Clin 2007;23:1–20.
31. Nydahl P, Sricharoenchai T, Chandra S, et al. Safety of patient mobilization and rehabilitation in the intensive care unit. Systematic review with meta-analysis. Ann Am Thorac Soc 2017;14:766–77.
Reducing Lost-to-Follow-Up Rates in Patients Discharged from an Early Psychosis Intervention Program
From the Early Psychosis Intervention Program, Institute of Mental Health, Singapore.
Abstract
- Objective: To develop and apply interventions to reduce lost-to-follow-up rates in patients discharged from an early psychosis intervention program.
- Methods: A team comprising clinical staff, case managers, and patients was formed to carry out a clinical practice improvement project. Tools such as brainstorming and root cause analysis were used to derive causes of patient loss to follow-up and interventions to address them were implemented. Plan, Do, Study, and Act cycles were used to evaluate the effectiveness of identified interventions.
- Results: After the 3 interventions were implemented, there was a decrease in the default rate, and the target default rate of 0% was achieved in less than 6 months.
- Conclusion: Easily implemented program changes led to rapid and sustained improvement in reducing lost-to-follow-up rates in patients discharged from an early psychosis intervention program.
Key words: Transfusion; red blood cells; plasma; platelets; veterans.
Psychosis is a mental illness in which affected individuals lose contact with reality. The lifetime prevalence of all psychotic disorders is 3.06% [1]. The typical symptoms consist of hallucinations, delusions, disorganized speech and thinking and negative symptoms (apathy, avolition, alogia, affective flattening, and anhedonia). Treatment is primarily with antipsychotics and psychological and social therapies.
The key to better prognosis is shortening the duration of untreated psychoses (DUP), defined as the period of time between the onset of psychosis and initiation of adequate treatment [2]. Longer DUP is one of the poorer prognostic factors in the outcome of first episode psychosis patients [3]. Over the past 2 decades, there has been considerable interest in developing and implementing specialized treatment programs for first episode psychosis [4], and early intervention is now a well-established therapeutic approach [5]. Early intervention has 2 elements that are distinct from standard care: early detection and phase-specific treatment (phase-specific treatment is a psychological, social, or physical treatment developed, or modified, specifically for use with people at an early stage of the illness). It is not only the initial care that is important, but regular follow up in the stable phase is necessary to reduce chances of relapse.
The Early Psychosis Intervention Programme (EPIP) in Singapore is a national program whose mission is early detection of young people with early psychosis or at risk of developing a psychotic illness and engagement with these individuals and families with the aim of providing accessible, empowering, individualized, evidence-based care in a least restrictive environment. The program was initiated in April 2001 under the auspices of the Ministry of Health, Singapore. EPIP has a multidisciplinary team of doctors, case managers, occupational therapists, psychologists, family therapists, social workers, and nurses to provide a comprehensive and personalized client-centered service across inpatient, outpatient, and community settings. The program spans 3 years and has 3 phases, beginning with acute intervention, followed by the stabilization phase, and then the stable phase, which focuses on relapse prevention, healthy lifestyle, stress management and plan for transition to downstream care. The frequency of visits and interaction with the team is tailored to suit individual patient needs and phase of care and can range from every day to once every 3 months. Following the 3-year program, clients are discharged from EPIP to continuity care (community psychiatry teams).
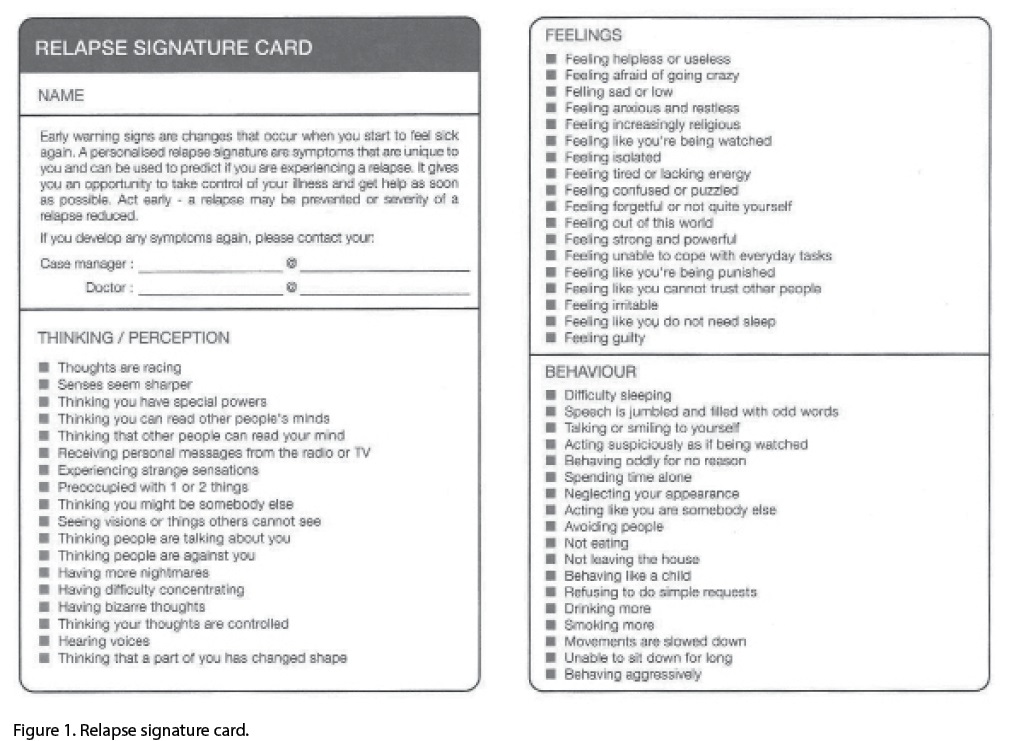
The relapse signature card was used every 2 months in the last 6 months during the period that the improvement project was ongoing. As it was found effective, now we use it every 6 months until 30 months and then every 2 months until conclusion of the 3-year program.
In addition, an appreciation card (Figure 2) was designed that is given to patients who keep their first downstream appointment. The card highlights independence and responsibility for one’s own care.
3. Provide a designated contact person
To ensure a smooth transition to the new service, we provided a designated person to contact for continuity care. Arrangement was made to transfer care to a specific community team of specific doctors and case managers, and their hospital contact details were provided on a card that was given to patients. Of the 8 patients who were transferred, 1 defaulted, 1 went overseas, 1 followed up with a private psychiatrist and the remaining 5 came for their first visit appointments.
Results
shown).
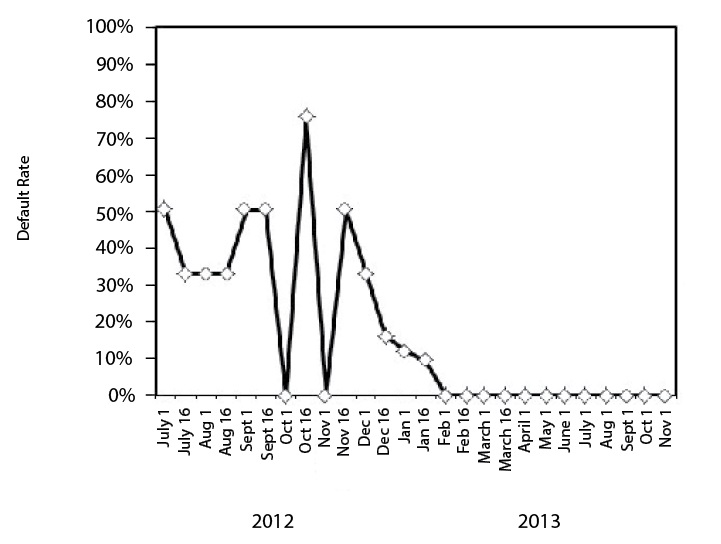
Figure 3. Run chart showing percentage of patients who failed to attend their first appointment with continuity care following transfer out of the program. Pre-intervention, default rates ranged from 9% to 75%. In the first 2 months after all the interventions were instituted (Dec 1 2012–March 1 2013), 2 patients defaulted, after which the default rate decreased to 0%.
Discussion
Making 3 small changes in our early psychosis intervention program led to rewarding gains in improving our patients’ follow-up with continuity care and the changes have become part of our standard operating procedure. In reviewing our processes to identify the root causes for loss of patients to follow-up, we found that obtaining the patient’s perspective was invaluable. It was interesting to learn that the word “discharge” might be impacting the way patients thought about follow-up after completion of the early intervention program. The interventions have become part of our standard operating procedure and we continue to audit the results every month to ensure that 0% default is being maintained. We are also looking into improving out psychoeducational materials for patients and caregivers and using more visual and interactive materials.
Corresponding author: Basu Sutapa, MD, Institute of Mental Health, Buangkok Green Medical Park, 10 Buangkok View, Singapore, S539747, Sutapa_Basu@imh.co.sg.
Financial disclosures: None.
1. Yung AR, Yuen HP, McGorry PD, et al. Mapping the onset of psychosis: the Comprehensive Assessment of At-Risk Mental States. Aust NZJ Psychiatry 2005;39:964–71.
2. Chang WC, Chan GH, Jim OT, et al. Optimal duration of an early intervention programme for first-episode psychosis: randomised controlled trial. Br J Psychiatry. 2015;206:
492–500.
3. Koch A, Gillis LS. Non-attendance of psychiatric outpatients. S Afr Med J 1991;80:289–91.
4. Mueser KT, Penn DL, Addington J, et al. The NAVIGATE Program for first-episode psychosis: rationale, overview, and description of psychosocial components. Psychiatr Serv 2015;66:680–90.
5. Marshall M, Rathbone J. Early intervention for psychosis. Cochrane Database Syst Rev 2011;(6):CD004718.
6. Mitchell AJ, Selmes T. Why don’t patients attend their appointments? Maintaining engagement with psychiatric services. Adv Psychiatr Treat 2007;13:423–34.
7. Magnes RM. Outpatient appointments: a necessary evil? A literature review and survey of patient attendance records. Psychiatr Bull 2008;32:458–60.
8. Appleby L, Shaw J, Amos T, et al. Suicide within 12 months of contact with mental health services: national clinical survey. Br Med J 1999;318:1235–39.
9. Chen A. Noncompliance in community psychiatry: a review of clinical interventions. Hosp Community Psychiatry 1991;
42:282–7.
10. Killaspy H, Banerjee S, King M, et al. Prospective controlled study of psychiatric outpatient nonattendance: characteristics and outcome. Br J Psych 2000;176:160–5.
11. Nelson EA, Maruish ME, Axler JL. Effects of discharge planning and compliance with outpatient appointments on readmission rates. Psychiatr Serv 2000;51:885–9.
12. Gutiérrez-Maldonado J, Caqueo-Urízar A, Kavanagh D. Burden of care and general health in families of patients with schizophrenia. Soc Psychiatr Epidemiol 2005;40:899–904.
13. Skarsholm H, Stoevring H, Nielsen B. Effect of a system-oriented intervention on compliance problems in schizophrenia: a pragmatic controlled trial. Schiz Res Treat 2014;
2014:789403.
14. The Clinical Practice Improvement Programme (CPIP), Institute of Healthcare Quality, National Healthcare Group 2002.
From the Early Psychosis Intervention Program, Institute of Mental Health, Singapore.
Abstract
- Objective: To develop and apply interventions to reduce lost-to-follow-up rates in patients discharged from an early psychosis intervention program.
- Methods: A team comprising clinical staff, case managers, and patients was formed to carry out a clinical practice improvement project. Tools such as brainstorming and root cause analysis were used to derive causes of patient loss to follow-up and interventions to address them were implemented. Plan, Do, Study, and Act cycles were used to evaluate the effectiveness of identified interventions.
- Results: After the 3 interventions were implemented, there was a decrease in the default rate, and the target default rate of 0% was achieved in less than 6 months.
- Conclusion: Easily implemented program changes led to rapid and sustained improvement in reducing lost-to-follow-up rates in patients discharged from an early psychosis intervention program.
Key words: Transfusion; red blood cells; plasma; platelets; veterans.
Psychosis is a mental illness in which affected individuals lose contact with reality. The lifetime prevalence of all psychotic disorders is 3.06% [1]. The typical symptoms consist of hallucinations, delusions, disorganized speech and thinking and negative symptoms (apathy, avolition, alogia, affective flattening, and anhedonia). Treatment is primarily with antipsychotics and psychological and social therapies.
The key to better prognosis is shortening the duration of untreated psychoses (DUP), defined as the period of time between the onset of psychosis and initiation of adequate treatment [2]. Longer DUP is one of the poorer prognostic factors in the outcome of first episode psychosis patients [3]. Over the past 2 decades, there has been considerable interest in developing and implementing specialized treatment programs for first episode psychosis [4], and early intervention is now a well-established therapeutic approach [5]. Early intervention has 2 elements that are distinct from standard care: early detection and phase-specific treatment (phase-specific treatment is a psychological, social, or physical treatment developed, or modified, specifically for use with people at an early stage of the illness). It is not only the initial care that is important, but regular follow up in the stable phase is necessary to reduce chances of relapse.
The Early Psychosis Intervention Programme (EPIP) in Singapore is a national program whose mission is early detection of young people with early psychosis or at risk of developing a psychotic illness and engagement with these individuals and families with the aim of providing accessible, empowering, individualized, evidence-based care in a least restrictive environment. The program was initiated in April 2001 under the auspices of the Ministry of Health, Singapore. EPIP has a multidisciplinary team of doctors, case managers, occupational therapists, psychologists, family therapists, social workers, and nurses to provide a comprehensive and personalized client-centered service across inpatient, outpatient, and community settings. The program spans 3 years and has 3 phases, beginning with acute intervention, followed by the stabilization phase, and then the stable phase, which focuses on relapse prevention, healthy lifestyle, stress management and plan for transition to downstream care. The frequency of visits and interaction with the team is tailored to suit individual patient needs and phase of care and can range from every day to once every 3 months. Following the 3-year program, clients are discharged from EPIP to continuity care (community psychiatry teams).
The relapse signature card was used every 2 months in the last 6 months during the period that the improvement project was ongoing. As it was found effective, now we use it every 6 months until 30 months and then every 2 months until conclusion of the 3-year program.
In addition, an appreciation card (Figure 2) was designed that is given to patients who keep their first downstream appointment. The card highlights independence and responsibility for one’s own care.
3. Provide a designated contact person
To ensure a smooth transition to the new service, we provided a designated person to contact for continuity care. Arrangement was made to transfer care to a specific community team of specific doctors and case managers, and their hospital contact details were provided on a card that was given to patients. Of the 8 patients who were transferred, 1 defaulted, 1 went overseas, 1 followed up with a private psychiatrist and the remaining 5 came for their first visit appointments.
Results
shown).
Figure 3. Run chart showing percentage of patients who failed to attend their first appointment with continuity care following transfer out of the program. Pre-intervention, default rates ranged from 9% to 75%. In the first 2 months after all the interventions were instituted (Dec 1 2012–March 1 2013), 2 patients defaulted, after which the default rate decreased to 0%.
Discussion
Making 3 small changes in our early psychosis intervention program led to rewarding gains in improving our patients’ follow-up with continuity care and the changes have become part of our standard operating procedure. In reviewing our processes to identify the root causes for loss of patients to follow-up, we found that obtaining the patient’s perspective was invaluable. It was interesting to learn that the word “discharge” might be impacting the way patients thought about follow-up after completion of the early intervention program. The interventions have become part of our standard operating procedure and we continue to audit the results every month to ensure that 0% default is being maintained. We are also looking into improving out psychoeducational materials for patients and caregivers and using more visual and interactive materials.
Corresponding author: Basu Sutapa, MD, Institute of Mental Health, Buangkok Green Medical Park, 10 Buangkok View, Singapore, S539747, Sutapa_Basu@imh.co.sg.
Financial disclosures: None.
1. Yung AR, Yuen HP, McGorry PD, et al. Mapping the onset of psychosis: the Comprehensive Assessment of At-Risk Mental States. Aust NZJ Psychiatry 2005;39:964–71.
2. Chang WC, Chan GH, Jim OT, et al. Optimal duration of an early intervention programme for first-episode psychosis: randomised controlled trial. Br J Psychiatry. 2015;206:
492–500.
3. Koch A, Gillis LS. Non-attendance of psychiatric outpatients. S Afr Med J 1991;80:289–91.
4. Mueser KT, Penn DL, Addington J, et al. The NAVIGATE Program for first-episode psychosis: rationale, overview, and description of psychosocial components. Psychiatr Serv 2015;66:680–90.
5. Marshall M, Rathbone J. Early intervention for psychosis. Cochrane Database Syst Rev 2011;(6):CD004718.
6. Mitchell AJ, Selmes T. Why don’t patients attend their appointments? Maintaining engagement with psychiatric services. Adv Psychiatr Treat 2007;13:423–34.
7. Magnes RM. Outpatient appointments: a necessary evil? A literature review and survey of patient attendance records. Psychiatr Bull 2008;32:458–60.
8. Appleby L, Shaw J, Amos T, et al. Suicide within 12 months of contact with mental health services: national clinical survey. Br Med J 1999;318:1235–39.
9. Chen A. Noncompliance in community psychiatry: a review of clinical interventions. Hosp Community Psychiatry 1991;
42:282–7.
10. Killaspy H, Banerjee S, King M, et al. Prospective controlled study of psychiatric outpatient nonattendance: characteristics and outcome. Br J Psych 2000;176:160–5.
11. Nelson EA, Maruish ME, Axler JL. Effects of discharge planning and compliance with outpatient appointments on readmission rates. Psychiatr Serv 2000;51:885–9.
12. Gutiérrez-Maldonado J, Caqueo-Urízar A, Kavanagh D. Burden of care and general health in families of patients with schizophrenia. Soc Psychiatr Epidemiol 2005;40:899–904.
13. Skarsholm H, Stoevring H, Nielsen B. Effect of a system-oriented intervention on compliance problems in schizophrenia: a pragmatic controlled trial. Schiz Res Treat 2014;
2014:789403.
14. The Clinical Practice Improvement Programme (CPIP), Institute of Healthcare Quality, National Healthcare Group 2002.
Cutting CAUTIs in Critical Care
From the Tucson Medical Center, Tucson, AZ.
Abstract
- Objective: To describe a quality improvement project to reduce catheter-associated urinary tract infections (CAUTIs) in an intensive care unit (ICU).
- Methods: Descriptive report.
- Results: CAUTIs are a common health care–associated infection that results in increased length of stay, patient discomfort, excess health care costs, and sometime mortality. However, many cases of CAUTIs are preventable. To address this problem at our institution, we enrolled in the Hospital Engagement Network (HEN) collaborative for the reduction of CAUTIs, utilizing the Comprehensive Unit-based Safety Program (CUSP) as the platform for our project. This article describes our project implementation, challenges encountered, and the lasting improvement we have achieved at our facility.
- Conclusion: By challenging the ICU culture, providing nursing with alternatives to urinary catheters, and promoting physician engagement, we were able to reduce catheter utilization and CAUTI rates in the ICU.
Hospital-acquired infections (HAIs) are important causes of morbidity and mortality in the United States [1]. Among HAIs, urinary tract infections are the 4th most common, with almost all cases caused by urethral instrumentation [2]. Catheter-associated urinary tract infections (CAUTIs) are associated with an increased hospital length of stay of 2 to 4 days and a cost of $400 million to $500 million annually [3]. As of 2015, the Centers for Medicare and Medicaid Services no longer reimburses hospitals for treating CAUTIs.
CAUTIs are a particular challenge in the intensive care unit (ICU) due to the high urinary catheter utilization rates. In our mixed medical/surgical ICU, the catheter utilization rate was 84% in 2012 and was the setting for the majority of CAUTIs in our hospital. The risk of CAUTI can be reduced by ensuring that catheters are used only when needed and removed as soon as possible; that catheters are placed using proper aseptic technique; and that the closed sterile drainage system is maintained. In 2013 we launched a project to improve our CAUTI rates and enrolled in the Hospital Engagement Network (HEN) collaborative for the reduction of CAUTIs, utilizing the Comprehensive Unit-based Safety Program (CUSP) [4] as the platform for our project. This article describes our project implementation, the challenges we encountered, and the lasting improvement we have achieved.
Setting
Tucson Medical Center is a 600-bed tertiary care hospital, the largest in southern Arizona, with over 1000 independent medical providers. The medical center is a locally governed, nonprofit teaching hospital that has been providing care to the city of Tucson, southern Arizona, southwest New Mexico, and northern Mexico for the past 70 years. There are 2 adult critical care units: a cardiovascular ICU and a mixed medical/surgical ICU. We focused our efforts and interventions on the mixed ICU, a 16-bed unit that includes medical, surgical (neuro, general and vascular), and neurological patient populations that had 19 CAUTIs in 2012, versus 2 CAUTIs in the cardiovascular ICU.
Project
Initial Phase
The first steps in our project were to develop our unit-based team, identify project goals, and review our current nursing practice and processes. First, using the template from the CUSP platform, we assembled a team that consisted of the chief nursing officer (executive sponsor), ICU medical director, nurse manager, infection control manager, infection control nurse, 4 nurse champions (2 two night shift 2 day shift), and a patient care technician.
The second step was to identify a realistic and achievable goal. A goal of a 20% reduction from our current utilization rate was selected. As our catheter utilization rates were consistently above 90%, we aimed to for a rate of less than 70%. In addition, we sought to reduce our CAUTI standardized infection ratio (number of health care–associated infections observed divided by the national predicted number) from 3.875 to less than 1.0.
In reviewing our current nursing practice and processes, we utilized the CUSP data collection tool and adapted it to meet our institutional needs. Figure 1 shows the original CUSP data collection tool, which is organized around 5 key questions about the catheter (eg, Is catheter present? Where it was placed? Why does the patient has a catheter today?) as well as lists appropriate and inappropriate indications. 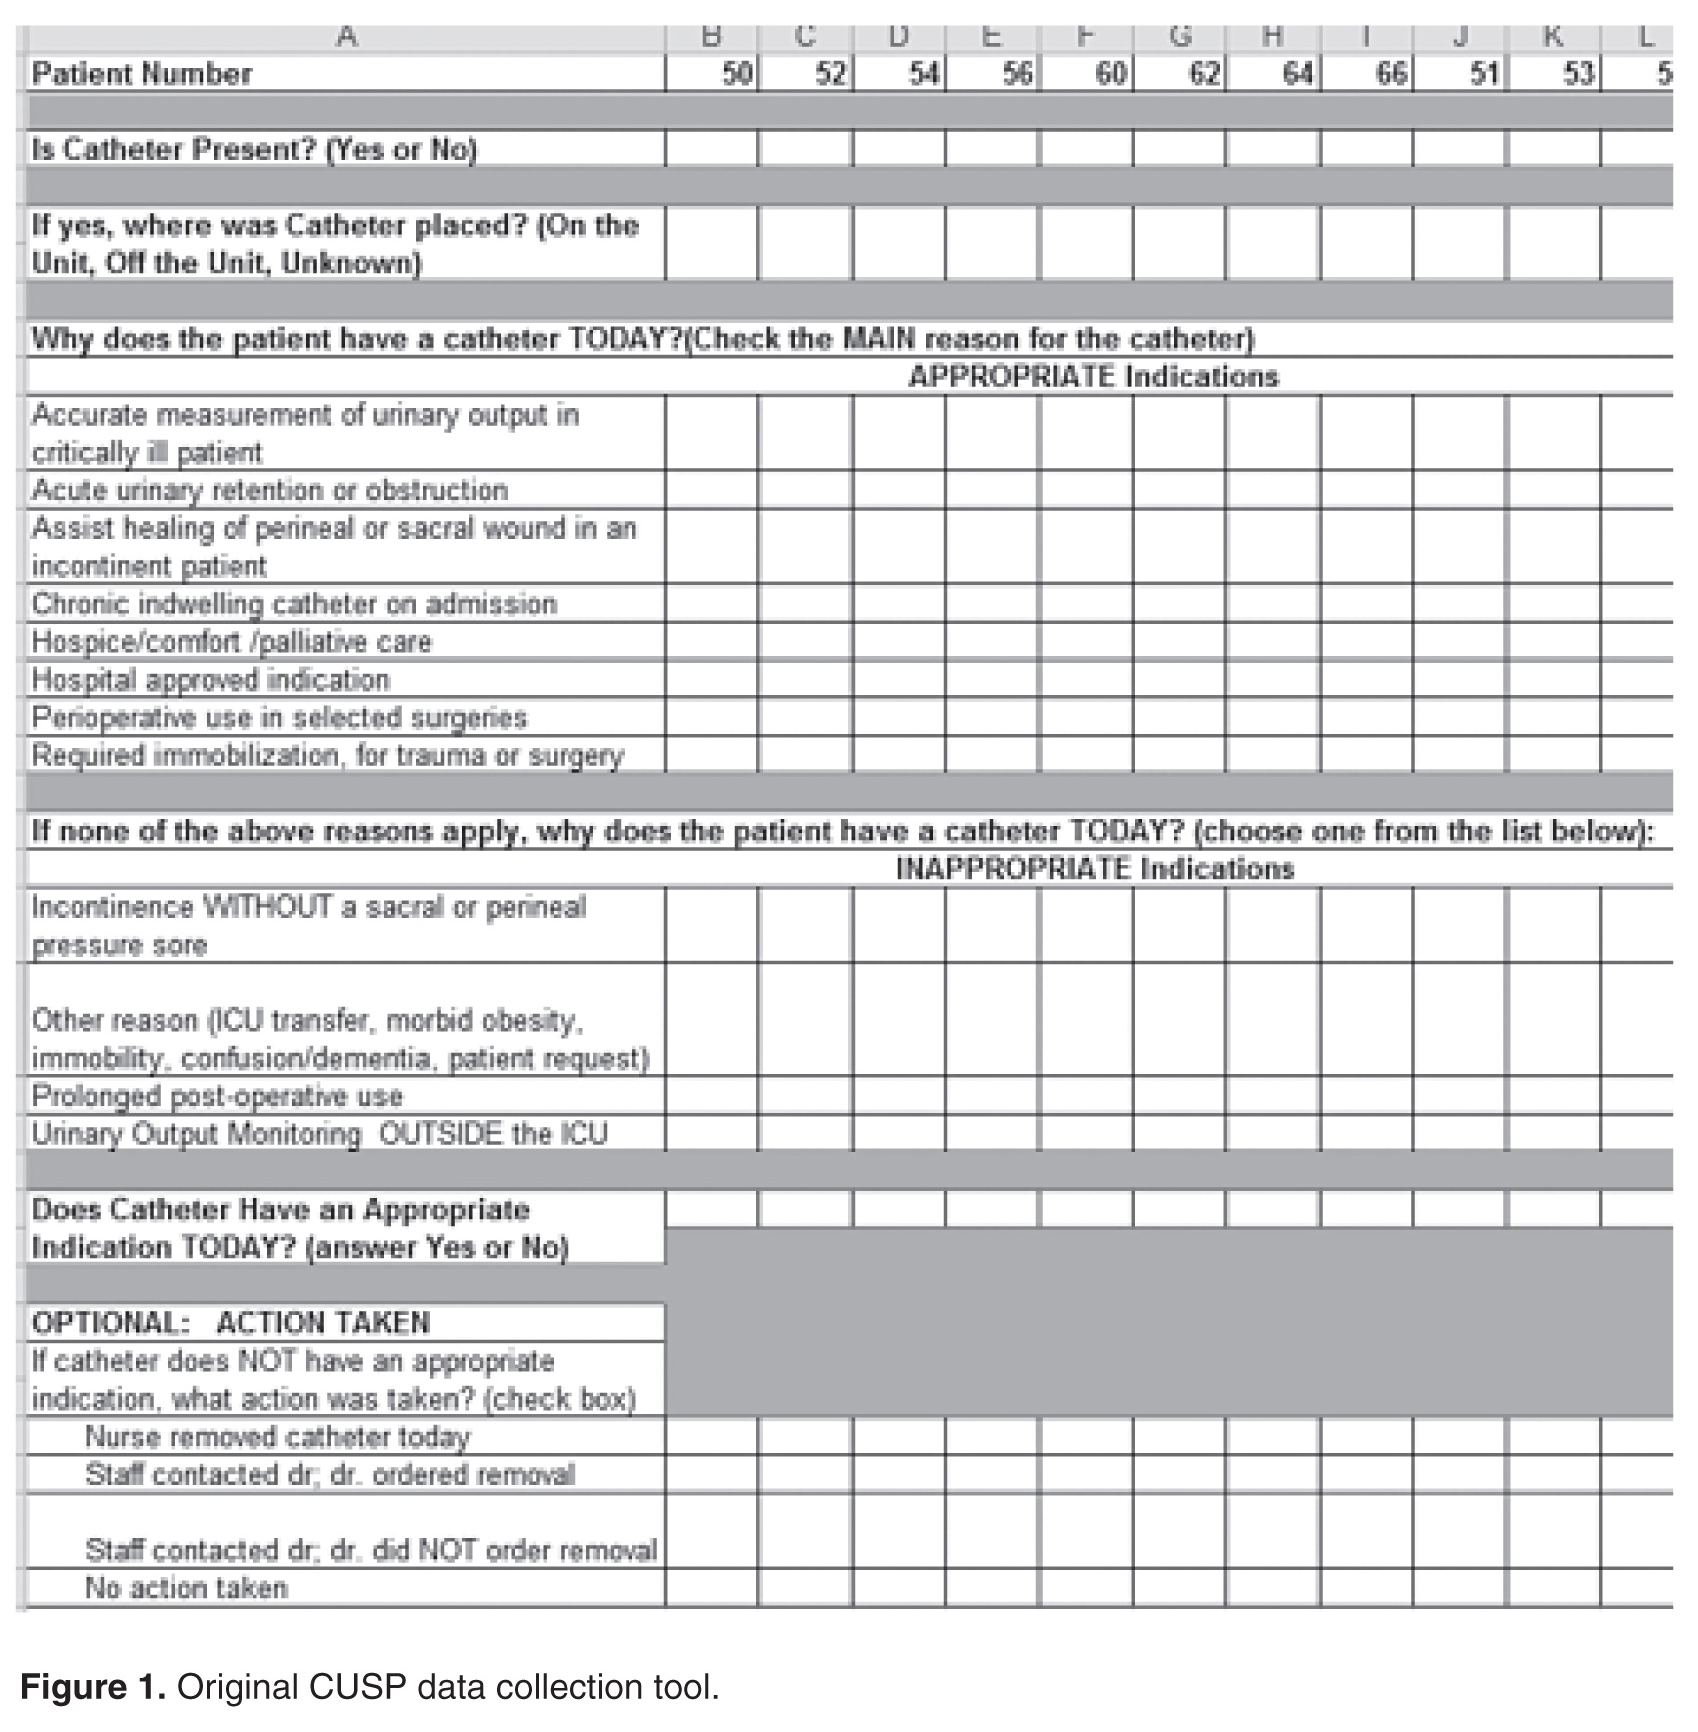
To implement the guidelines, we provided education to the nursing staff via emails, placed posters on the unit, and discussed appropriate and inappropriate indications during bedside conversations using the audit tool. As the project continued, these guidelines were reinforced daily when the question “why does your patient have a catheter today?” was posed to the nurses during the audit. Our chief nursing officer supported our implementation efforts by including a CAUTI prevention lecture with her monthly house-wide nursing education series called “lunch and learn.”
We added additional questions to the tool as we learned more about the practices and processes that were currently in use. For example, “accurate measurement of urinary output in the critically ill patient” was the most common reason given by nurses for keeping a catheter in. Upon further questioning, however, the common response was that “the doctor ordered it.” By adding “MD order” to the audit tool, we were able to track actual orders versus nurses falling back on old patterns. This data collection item also provided us the names and groups of physicians to approach and educate on our project goals. Two other helpful items added to the tool related to the catheter seal and stat lock (catheter securement device) placement. The data provided by these questions helped us recognize areas for improvement in nursing practice, supply issues, and the impact of other departments. For example, auditing showed that most of our catheters were placed in the emergency department (ED) and surgery. This gave us an opportunity to reach out to these units to discuss CAUTI reduction strategies. For example, after review of the ED catheter supplies, we discovered that they did not have a closed catheter insertion system with a urometer drainage bag. Therefore, when a patient was transferred to the ICU, the integrity of the urinary collection system had to be broken to place a urometer. Evidence has shown that breaking the integrity of the system increases a patient’s risk for a CAUTI [1]. Once this problem was identified, the ED inventory was changed to include the urometer as part of the closed system urinary insertion kit.
Active Phase
After the implementation phase, the next 15 months were dedicated to daily rounding and bedside auditing, the foundation of our project. Rounding was done by the unit manager or nurse champion and involved talking with the bedside nurse and completing the audit tool. These bedside conversations were an opportunity to review the HICPAC guidelines, identify education needs, and reinforce best practices. During these discussions, the nurses often would identify reasons to remove catheters.
The CAUTI team met monthly to review the previous month’s data, other observed opportunities for improvement, and any patient CAUTI information provided by our infection control nurse liaison. We conducted root cause analysis when CAUTIs developed, in which we reviewed the patient’s chart and sought to identify possible interventions that could have reduced the number of catheter days. Our findings were shared in staff meetings, newsletters, and through quality bulletin boards. We also recognized improved performance. Tokens that could be cashed in at the cafeteria for snacks or drinks were awarded to nurses who removed a urinary catheter. We also organized a celebration on the unit the first time we had 3 months without a CAUTI.
Challenges Encountered
Culture change is challenging. The entrenched mindset was that “If a patient is sick enough to be in an ICU, then they are sick enough to need a urinary catheter.” Standard nursing practice typically included placement of a urinary catheter immediately on arrival to the ICU if not already present. Over the years, placing a urinary catheter had become the norm in the ICU, with nurses noting concern about obtaining accurate measurement of urine output and prevention of skin breakdown from incontinence. We had to continually address these concerns to make progress on the project. By providing alternatives to urinary catheters, such as incontinence pads, external male collection devices in varying sizes, moisture barrier products, and scales to measure urine output, nurses were more willing to comply with catheter removal.
We worked with our wound and ostomy nurses to ensure we were providing the proper moisture barrier products and presented research to support that incontinence did not need to lead to pressure ulcers. The wound care team helped with guiding the use of products for incontinent patients to prevent incontinence-associated dermatitis and potential skin breakdown. Our administration financially supported our program, allowing us to bring in and trial supplies. As we identified products for use, we were able to place them into floor stock and make them easily available to nursing. Items such as wicking pads, skin protective creams, and alternatives to catheters were a vital part of our bedside toolkit to maintain our patient’s skin integrity.
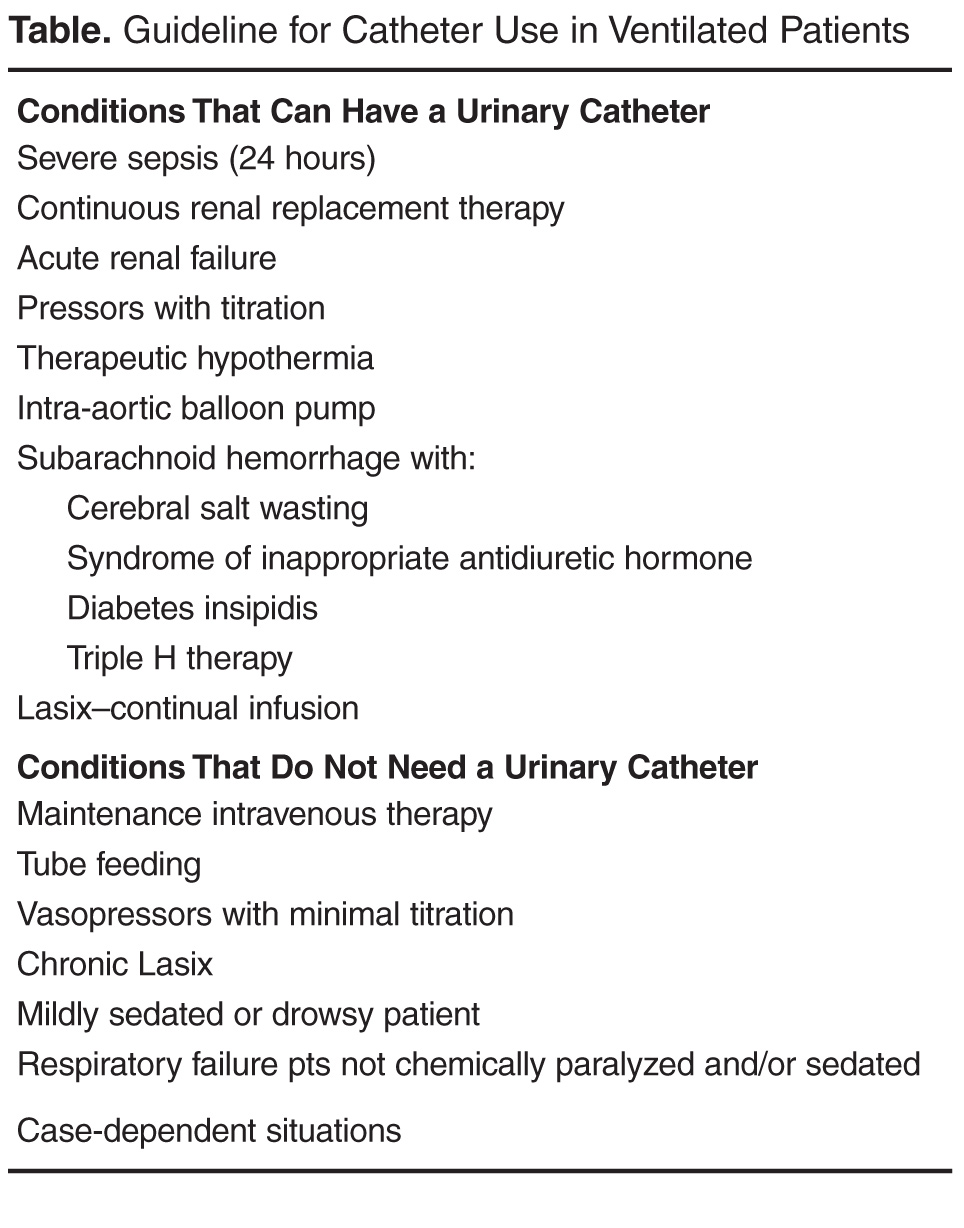
Both nurses and physicians were concerned about accurate measurement of output, specifically in surgical patients. The use of scales to weigh and measure output from an incontinent patient’s pads was helpful but sometimes inconvenient. From our surgeons' perspective, not having immediate hourly measurements of urine output to monitor risk for hypovolemia from third spacing of fluid or from abdominal compartment syndrome was not acceptable. Because of this concern, we did not see a decrease in early catheter removal among surgical patients. Daily conversations with nurses and surgeons at the bedside continue to be key to removing catheters as soon as the surgeon is comfortable that the patient is out of risk for hypovolemia.
Outcomes
Within the first month we saw an immediate drop in catheter utilization and had zero CAUTIs, but during the next 2 months there was a return to our previous rates (Figure 2 and Figure 3 [figures show combined mixed and cardiovascular ICU rates due to reporting requirements]). 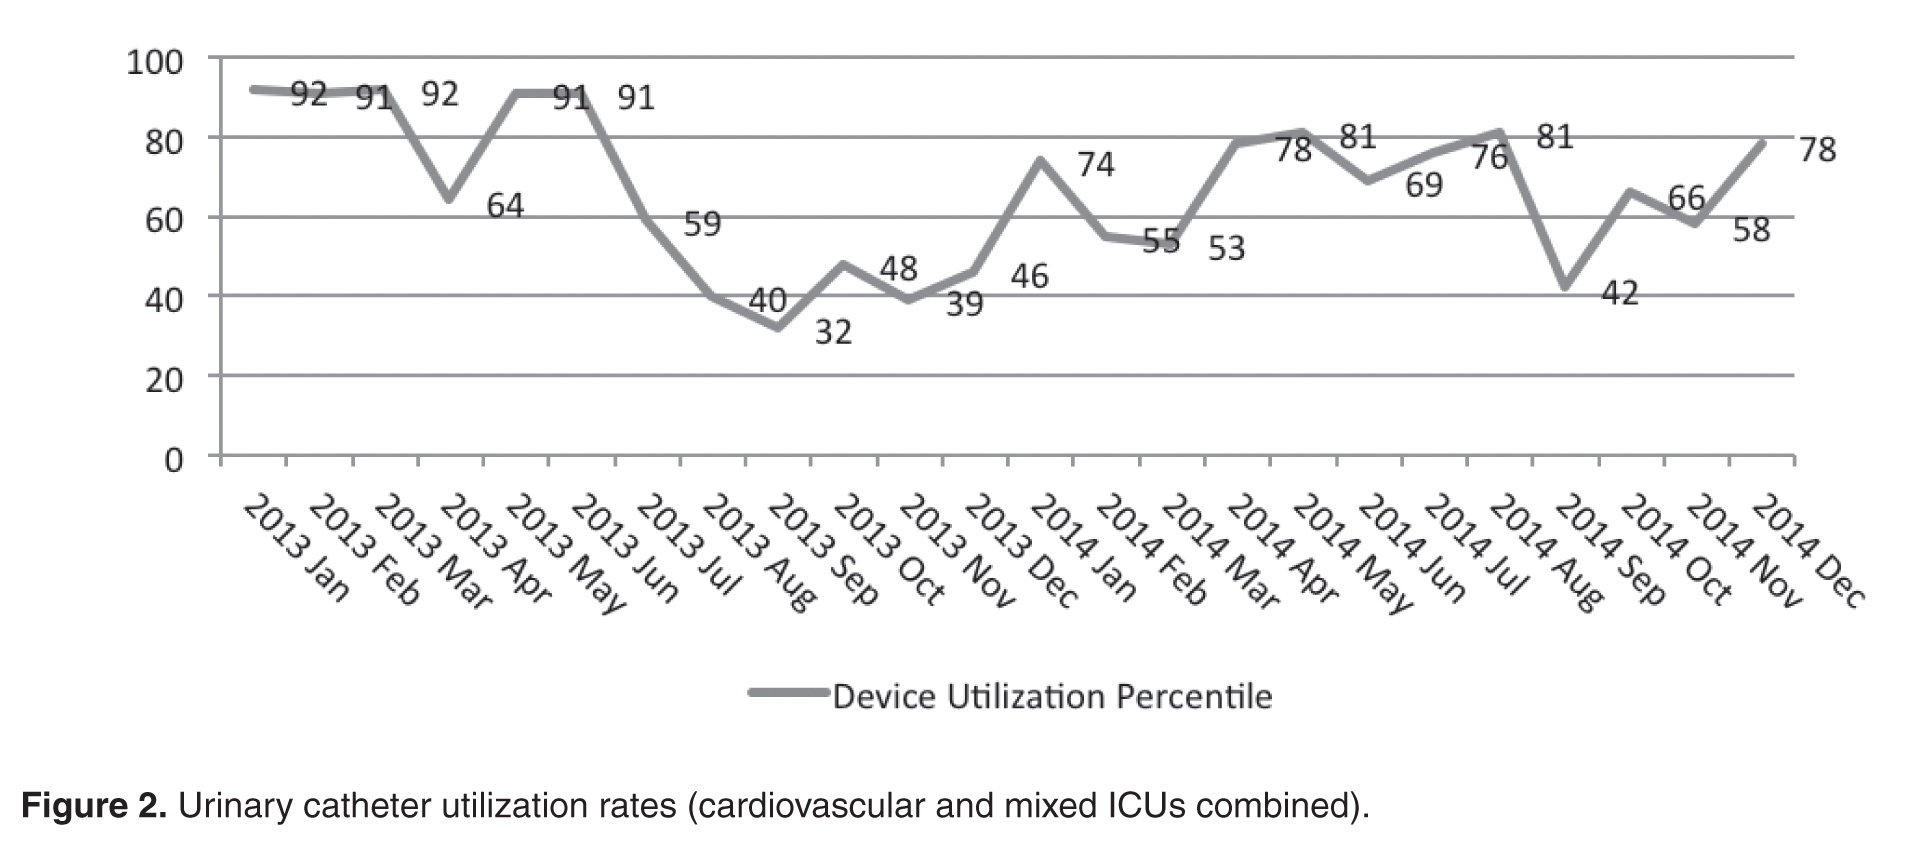
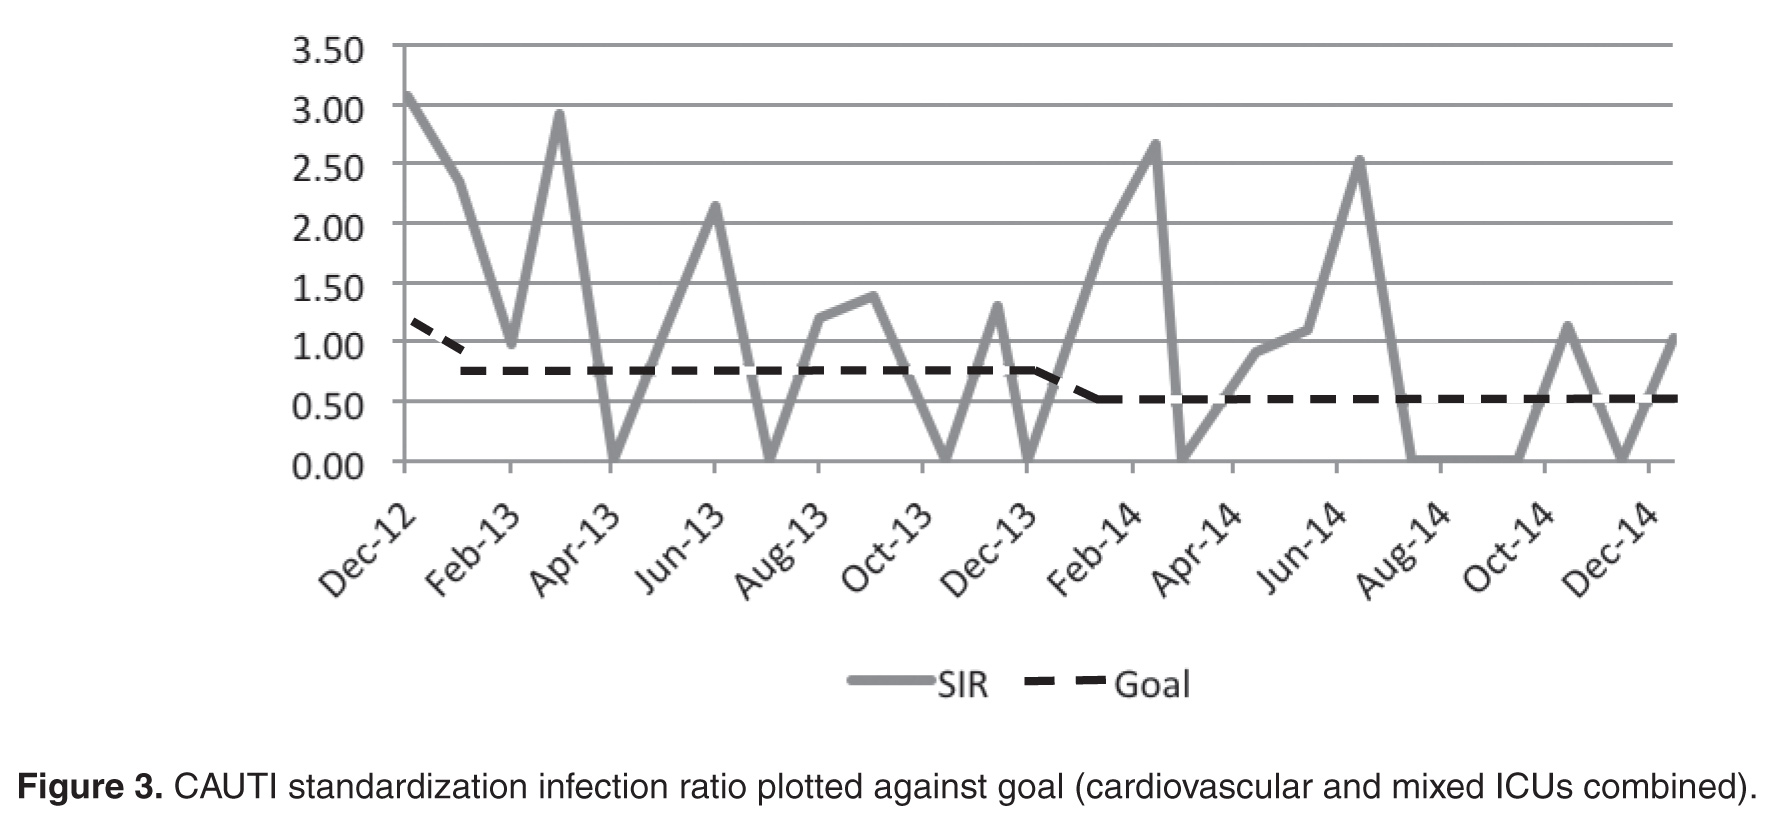
Although nursing is at the heart of this engagement, it is the combined efforts of all disciplines that promote the reduction of CAUTIs and improve patient outcomes. When our CAUTI counts plateaued at 10 annually in 2014–2015, we reached out to physicians and found that we had not adequately educated our medical and surgical staff of our project and goals. With the backing of a supportive and vocal ICU director, physician engagement has increased and there is more attention paid to catheter removal by our ICU intensivists. This collaborative approach has helped lower our rates even further in 2016 (n = 3). We achieved our CAUTI SIR goal of less than 1.0 , and changed our current goal to less than 0.5 (Figure 3).
In addition to greater intensivist engagement, the ED reduced their urinary catheter insertion rate from 12% to 4% for all patients transferring to an inpatient status. As previously mentioned, they are now placing catheters from kits that include urometers, so we do not have to break the integrity of the closed system after the patient it transferred to the ICU. We are also collaborating with surgical services to reduce catheter use. This is still a work in progress that requires collaboration with surgeons and hospitalists in changing departmental norms.
Conclusion
Through a combined effort involving a number of departments across the hospital, we were able to reduce catheter utilization and CAUTI rates in the ICU. We have seen a culture shift, with more ICU nursing staff questioning the use of catheters and requesting to have them removed during daily bedside rounds or simply removing them based on our nursing-driven protocol. Currently, both critical care units have been actively working on reducing CAUTI rates and have gone 310 days without a CAUTI.
Reluctance among ICU nurses to remove urinary catheters has declined; however, it is easy to fall back on the convenience of catheters. We have found that each rise in utilization rates and CAUTIs pointed to the need to refocus our effort on the daily bedside conversations. Unless we can eliminate the need for urinary catheters, there will always be a risk of a CAUTI. However, with advances in catheter technology, alternatives to catheters, and nursing education, the reduction in this hospital-acquired infection can be realized.
Acknowledgments: The author thanks our devoted infection control manager (now director), Nina Espinoza Mazzola, BSM, CIC. Our attaining success at the bedside is a reflection of her commitment as a resource and in providing support for nursing practice.
Corresponding author: Jennifer C. Tuttle, RN, MSNEd, CNRN, Tucson Medical Center, 5301 E. Grant Rd, Tucson, AZ 85712.
Financial disclosures: None.
1. Nicolle LE. Catheter-associated urinary tract infections. Antimicrob Resist Infect Control 2014;3:23.
2. Centers for Disease Control and Prevention (CDC). Urinary tract infection (catheter-associated urinary tract infection [cauti] and non-catheter-associated urinary tract infection [uti]) and other urinary system infection [usi]) events. 2017. Accessed at www.cdc.gov/nhsn/pdfs/pscmanual/7psccauticurrent.pdf.
3. Centers for Disease Control and Prevention. Catheter-associated urinary tract infection (cauti) toolkit. Accessed 5 Mar 2017 at www.cdc.gov/HAI/pdfs/toolkits/CAUTItoolkit_3_10.pdf.
4. On the CUSP implementation guide. Accessed at http://web.mhanet.com/cauti-implementation_guide_508.pdf.
5. Healthcare Infection Control Practice Advisory Committee (HICPAC). Guidelines for the prevention of catheter associated urinary tract infections 2009. Accessed 25 Feb 2017 at www.cdc.gov/infectioncontrol/pdf/guidelines/cauti-guidelines.pdf.
From the Tucson Medical Center, Tucson, AZ.
Abstract
- Objective: To describe a quality improvement project to reduce catheter-associated urinary tract infections (CAUTIs) in an intensive care unit (ICU).
- Methods: Descriptive report.
- Results: CAUTIs are a common health care–associated infection that results in increased length of stay, patient discomfort, excess health care costs, and sometime mortality. However, many cases of CAUTIs are preventable. To address this problem at our institution, we enrolled in the Hospital Engagement Network (HEN) collaborative for the reduction of CAUTIs, utilizing the Comprehensive Unit-based Safety Program (CUSP) as the platform for our project. This article describes our project implementation, challenges encountered, and the lasting improvement we have achieved at our facility.
- Conclusion: By challenging the ICU culture, providing nursing with alternatives to urinary catheters, and promoting physician engagement, we were able to reduce catheter utilization and CAUTI rates in the ICU.
Hospital-acquired infections (HAIs) are important causes of morbidity and mortality in the United States [1]. Among HAIs, urinary tract infections are the 4th most common, with almost all cases caused by urethral instrumentation [2]. Catheter-associated urinary tract infections (CAUTIs) are associated with an increased hospital length of stay of 2 to 4 days and a cost of $400 million to $500 million annually [3]. As of 2015, the Centers for Medicare and Medicaid Services no longer reimburses hospitals for treating CAUTIs.
CAUTIs are a particular challenge in the intensive care unit (ICU) due to the high urinary catheter utilization rates. In our mixed medical/surgical ICU, the catheter utilization rate was 84% in 2012 and was the setting for the majority of CAUTIs in our hospital. The risk of CAUTI can be reduced by ensuring that catheters are used only when needed and removed as soon as possible; that catheters are placed using proper aseptic technique; and that the closed sterile drainage system is maintained. In 2013 we launched a project to improve our CAUTI rates and enrolled in the Hospital Engagement Network (HEN) collaborative for the reduction of CAUTIs, utilizing the Comprehensive Unit-based Safety Program (CUSP) [4] as the platform for our project. This article describes our project implementation, the challenges we encountered, and the lasting improvement we have achieved.
Setting
Tucson Medical Center is a 600-bed tertiary care hospital, the largest in southern Arizona, with over 1000 independent medical providers. The medical center is a locally governed, nonprofit teaching hospital that has been providing care to the city of Tucson, southern Arizona, southwest New Mexico, and northern Mexico for the past 70 years. There are 2 adult critical care units: a cardiovascular ICU and a mixed medical/surgical ICU. We focused our efforts and interventions on the mixed ICU, a 16-bed unit that includes medical, surgical (neuro, general and vascular), and neurological patient populations that had 19 CAUTIs in 2012, versus 2 CAUTIs in the cardiovascular ICU.
Project
Initial Phase
The first steps in our project were to develop our unit-based team, identify project goals, and review our current nursing practice and processes. First, using the template from the CUSP platform, we assembled a team that consisted of the chief nursing officer (executive sponsor), ICU medical director, nurse manager, infection control manager, infection control nurse, 4 nurse champions (2 two night shift 2 day shift), and a patient care technician.
The second step was to identify a realistic and achievable goal. A goal of a 20% reduction from our current utilization rate was selected. As our catheter utilization rates were consistently above 90%, we aimed to for a rate of less than 70%. In addition, we sought to reduce our CAUTI standardized infection ratio (number of health care–associated infections observed divided by the national predicted number) from 3.875 to less than 1.0.
In reviewing our current nursing practice and processes, we utilized the CUSP data collection tool and adapted it to meet our institutional needs. Figure 1 shows the original CUSP data collection tool, which is organized around 5 key questions about the catheter (eg, Is catheter present? Where it was placed? Why does the patient has a catheter today?) as well as lists appropriate and inappropriate indications.
To implement the guidelines, we provided education to the nursing staff via emails, placed posters on the unit, and discussed appropriate and inappropriate indications during bedside conversations using the audit tool. As the project continued, these guidelines were reinforced daily when the question “why does your patient have a catheter today?” was posed to the nurses during the audit. Our chief nursing officer supported our implementation efforts by including a CAUTI prevention lecture with her monthly house-wide nursing education series called “lunch and learn.”
We added additional questions to the tool as we learned more about the practices and processes that were currently in use. For example, “accurate measurement of urinary output in the critically ill patient” was the most common reason given by nurses for keeping a catheter in. Upon further questioning, however, the common response was that “the doctor ordered it.” By adding “MD order” to the audit tool, we were able to track actual orders versus nurses falling back on old patterns. This data collection item also provided us the names and groups of physicians to approach and educate on our project goals. Two other helpful items added to the tool related to the catheter seal and stat lock (catheter securement device) placement. The data provided by these questions helped us recognize areas for improvement in nursing practice, supply issues, and the impact of other departments. For example, auditing showed that most of our catheters were placed in the emergency department (ED) and surgery. This gave us an opportunity to reach out to these units to discuss CAUTI reduction strategies. For example, after review of the ED catheter supplies, we discovered that they did not have a closed catheter insertion system with a urometer drainage bag. Therefore, when a patient was transferred to the ICU, the integrity of the urinary collection system had to be broken to place a urometer. Evidence has shown that breaking the integrity of the system increases a patient’s risk for a CAUTI [1]. Once this problem was identified, the ED inventory was changed to include the urometer as part of the closed system urinary insertion kit.
Active Phase
After the implementation phase, the next 15 months were dedicated to daily rounding and bedside auditing, the foundation of our project. Rounding was done by the unit manager or nurse champion and involved talking with the bedside nurse and completing the audit tool. These bedside conversations were an opportunity to review the HICPAC guidelines, identify education needs, and reinforce best practices. During these discussions, the nurses often would identify reasons to remove catheters.
The CAUTI team met monthly to review the previous month’s data, other observed opportunities for improvement, and any patient CAUTI information provided by our infection control nurse liaison. We conducted root cause analysis when CAUTIs developed, in which we reviewed the patient’s chart and sought to identify possible interventions that could have reduced the number of catheter days. Our findings were shared in staff meetings, newsletters, and through quality bulletin boards. We also recognized improved performance. Tokens that could be cashed in at the cafeteria for snacks or drinks were awarded to nurses who removed a urinary catheter. We also organized a celebration on the unit the first time we had 3 months without a CAUTI.
Challenges Encountered
Culture change is challenging. The entrenched mindset was that “If a patient is sick enough to be in an ICU, then they are sick enough to need a urinary catheter.” Standard nursing practice typically included placement of a urinary catheter immediately on arrival to the ICU if not already present. Over the years, placing a urinary catheter had become the norm in the ICU, with nurses noting concern about obtaining accurate measurement of urine output and prevention of skin breakdown from incontinence. We had to continually address these concerns to make progress on the project. By providing alternatives to urinary catheters, such as incontinence pads, external male collection devices in varying sizes, moisture barrier products, and scales to measure urine output, nurses were more willing to comply with catheter removal.
We worked with our wound and ostomy nurses to ensure we were providing the proper moisture barrier products and presented research to support that incontinence did not need to lead to pressure ulcers. The wound care team helped with guiding the use of products for incontinent patients to prevent incontinence-associated dermatitis and potential skin breakdown. Our administration financially supported our program, allowing us to bring in and trial supplies. As we identified products for use, we were able to place them into floor stock and make them easily available to nursing. Items such as wicking pads, skin protective creams, and alternatives to catheters were a vital part of our bedside toolkit to maintain our patient’s skin integrity.
Both nurses and physicians were concerned about accurate measurement of output, specifically in surgical patients. The use of scales to weigh and measure output from an incontinent patient’s pads was helpful but sometimes inconvenient. From our surgeons' perspective, not having immediate hourly measurements of urine output to monitor risk for hypovolemia from third spacing of fluid or from abdominal compartment syndrome was not acceptable. Because of this concern, we did not see a decrease in early catheter removal among surgical patients. Daily conversations with nurses and surgeons at the bedside continue to be key to removing catheters as soon as the surgeon is comfortable that the patient is out of risk for hypovolemia.
Outcomes
Within the first month we saw an immediate drop in catheter utilization and had zero CAUTIs, but during the next 2 months there was a return to our previous rates (Figure 2 and Figure 3 [figures show combined mixed and cardiovascular ICU rates due to reporting requirements]).
Although nursing is at the heart of this engagement, it is the combined efforts of all disciplines that promote the reduction of CAUTIs and improve patient outcomes. When our CAUTI counts plateaued at 10 annually in 2014–2015, we reached out to physicians and found that we had not adequately educated our medical and surgical staff of our project and goals. With the backing of a supportive and vocal ICU director, physician engagement has increased and there is more attention paid to catheter removal by our ICU intensivists. This collaborative approach has helped lower our rates even further in 2016 (n = 3). We achieved our CAUTI SIR goal of less than 1.0 , and changed our current goal to less than 0.5 (Figure 3).
In addition to greater intensivist engagement, the ED reduced their urinary catheter insertion rate from 12% to 4% for all patients transferring to an inpatient status. As previously mentioned, they are now placing catheters from kits that include urometers, so we do not have to break the integrity of the closed system after the patient it transferred to the ICU. We are also collaborating with surgical services to reduce catheter use. This is still a work in progress that requires collaboration with surgeons and hospitalists in changing departmental norms.
Conclusion
Through a combined effort involving a number of departments across the hospital, we were able to reduce catheter utilization and CAUTI rates in the ICU. We have seen a culture shift, with more ICU nursing staff questioning the use of catheters and requesting to have them removed during daily bedside rounds or simply removing them based on our nursing-driven protocol. Currently, both critical care units have been actively working on reducing CAUTI rates and have gone 310 days without a CAUTI.
Reluctance among ICU nurses to remove urinary catheters has declined; however, it is easy to fall back on the convenience of catheters. We have found that each rise in utilization rates and CAUTIs pointed to the need to refocus our effort on the daily bedside conversations. Unless we can eliminate the need for urinary catheters, there will always be a risk of a CAUTI. However, with advances in catheter technology, alternatives to catheters, and nursing education, the reduction in this hospital-acquired infection can be realized.
Acknowledgments: The author thanks our devoted infection control manager (now director), Nina Espinoza Mazzola, BSM, CIC. Our attaining success at the bedside is a reflection of her commitment as a resource and in providing support for nursing practice.
Corresponding author: Jennifer C. Tuttle, RN, MSNEd, CNRN, Tucson Medical Center, 5301 E. Grant Rd, Tucson, AZ 85712.
Financial disclosures: None.
1. Nicolle LE. Catheter-associated urinary tract infections. Antimicrob Resist Infect Control 2014;3:23.
2. Centers for Disease Control and Prevention (CDC). Urinary tract infection (catheter-associated urinary tract infection [cauti] and non-catheter-associated urinary tract infection [uti]) and other urinary system infection [usi]) events. 2017. Accessed at www.cdc.gov/nhsn/pdfs/pscmanual/7psccauticurrent.pdf.
3. Centers for Disease Control and Prevention. Catheter-associated urinary tract infection (cauti) toolkit. Accessed 5 Mar 2017 at www.cdc.gov/HAI/pdfs/toolkits/CAUTItoolkit_3_10.pdf.
4. On the CUSP implementation guide. Accessed at http://web.mhanet.com/cauti-implementation_guide_508.pdf.
5. Healthcare Infection Control Practice Advisory Committee (HICPAC). Guidelines for the prevention of catheter associated urinary tract infections 2009. Accessed 25 Feb 2017 at www.cdc.gov/infectioncontrol/pdf/guidelines/cauti-guidelines.pdf.
Making Quality Real for Physicians
From the Department of Medicine Quality Program, Brigham and Women’s Hospital (Drs. Pennant, McElrath, Coblyn, and Desai) and the Institute for Relevant Clinical Data Analytics, Boston Children’s Hospital, (Drs. Szent-Gyorgyi and Greenberg), Boston, MA.
Abstract
- Objectives: To describe the department of medicine quality program (DOMQP) at Brigham and Women’s Hospital (BWH).
- Methods: The program began in 2007 to engage physicians in local, specialty-specific quality efforts. The program has broadened its scope to include government mandates and hospital-wide priorities, such as maintenance of certification (MOC), “meaningful use (MU),” and medication reconciliation. More recently, we have evolved into a project-based program focusing on both chronic disease management and optimizing care pathways for high-risk inpatient conditions. Our key strategies are developing metrics, raising awareness, distilling information to front-line staff, highlighting relevant action items, and bringing feedback from front-line staff to hospital leadership.
- Results: We have developed 21 metrics across 13 clinical divisions, with performance improvement seen in > 50% of metrics. In 2014, we leveraged our quality metrics to earn MOC credit, with 100 physicians across 10 divisions earning MOC points through the Practice Assessment option. Additionally, department physicians achieved 90% compliance with our institutional medication reconciliation policy. The percentage of physicians achieving stage 1 MU was 98% in 2013, 99% in 2014, and 100% achieved stage 2 MU in 2015.
- Conclusion: Over the past 10 years, the DOMQP has played a unique role in promoting quality and serves as a model for QI within the hospital. We are well positioned to provide support to physicians and their practices as the health care environment continues to evolve.
Key words: quality improvement; quality measurement.
Within the past several years, the health care landscape in the United States has shifted considerably. New financial risk and quality-related incentive structures have been put in place, such as financial incentives to adopt electronic health records (EHRs) and to demonstrate “meaningful use (MU)” of these EHRs [1]. There is greater focus on value based payments, and accountable care organizations (ACOs) are proliferating [2–4]. Certification and training requirements have changed and require completion of performance improvement projects [5,6]. Upcoming changes to quality measurement and improvement through the Quality Payment Program will bring further changes to how clinicians are both monitored and incentivized or penalized [7]. The confluence of these efforts provides an impetus to incorporate quality measurement and improvement into the day to day practice of medicine.
In 2007, the department of medicine (DOM) at Brigham and Women’s Hospital (BWH), a teaching affiliate of Harvard Medical School and a founding member of Partners Healthcare, began a quality program (DOMQP) to engage physicians in local, specialty-specific quality efforts [8]. The program began by focusing on internally developed performance metrics to drive physician engagement. Later, the program expanded its focus to include more externally focused mandates from federal government and other accreditation bodies [9,10]. In this article, we discuss our efforts, including our early stage work and more recent focus in the areas of meaningful use, medication reconciliation, and maintenance of certification as well as our ongoing projects focused on chronic disease management and high-risk inpatient conditions.
Setting
The DOM has approximately 1400 physician faculty members and is the largest clinical department at BWH. The DOMQP is comprised of a medical director (0.35 FTE) and 2 project coordinators (2 FTE) who operate in a consultative capacity to liaison between the various levels of clinical leadership and frontline staff. The DOMQP serves 13 divisions: 11 medical specialties, primary care, and the hospitalist service.
Internally Driven, Specialty-Specific Quality Metrics
The early stages of our efforts focused on engaging clinical leadership and physicians, navigating the hospital’s information systems (IS) to develop quality reports within the EHR and implementing strategies for improvement. Until 30 May 2015, BWH utilized an internally developed EHR comprising a myriad of individual systems (eg, billing, electronic medication administration, clinical repository) that did not interface easily with one another. To resolve the IS challenges, we engaged many levels of the organization’s IS structure and requested updates or developed workaround solutions leading to the integration of the various datasets for comprehensive reporting. This resulted in a new agreement between the hospital and Partners that allowed for billing data to be sent to the same repository that housed the clinical data.
We developed at least one data report for each specialty division. The divisions selected a quality measure, and we worked with clinical leadership to define the numerator and denominator and identify any additional information they wanted in the report, eg, demographics, visit dates, labs. To produce the report, an IS consultant compiles the data elements on an excel spreadsheet. This spreadsheet is then manually chart reviewed by the DOMQP for accuracy before it is converted into a report. The report is then reviewed by the DOMQP to ensure the information is presented correctly and is easily interpreted, and then shared with the division champion(s), who determine how to message and introduce a proposed improvement effort before it is shared with the entire division.

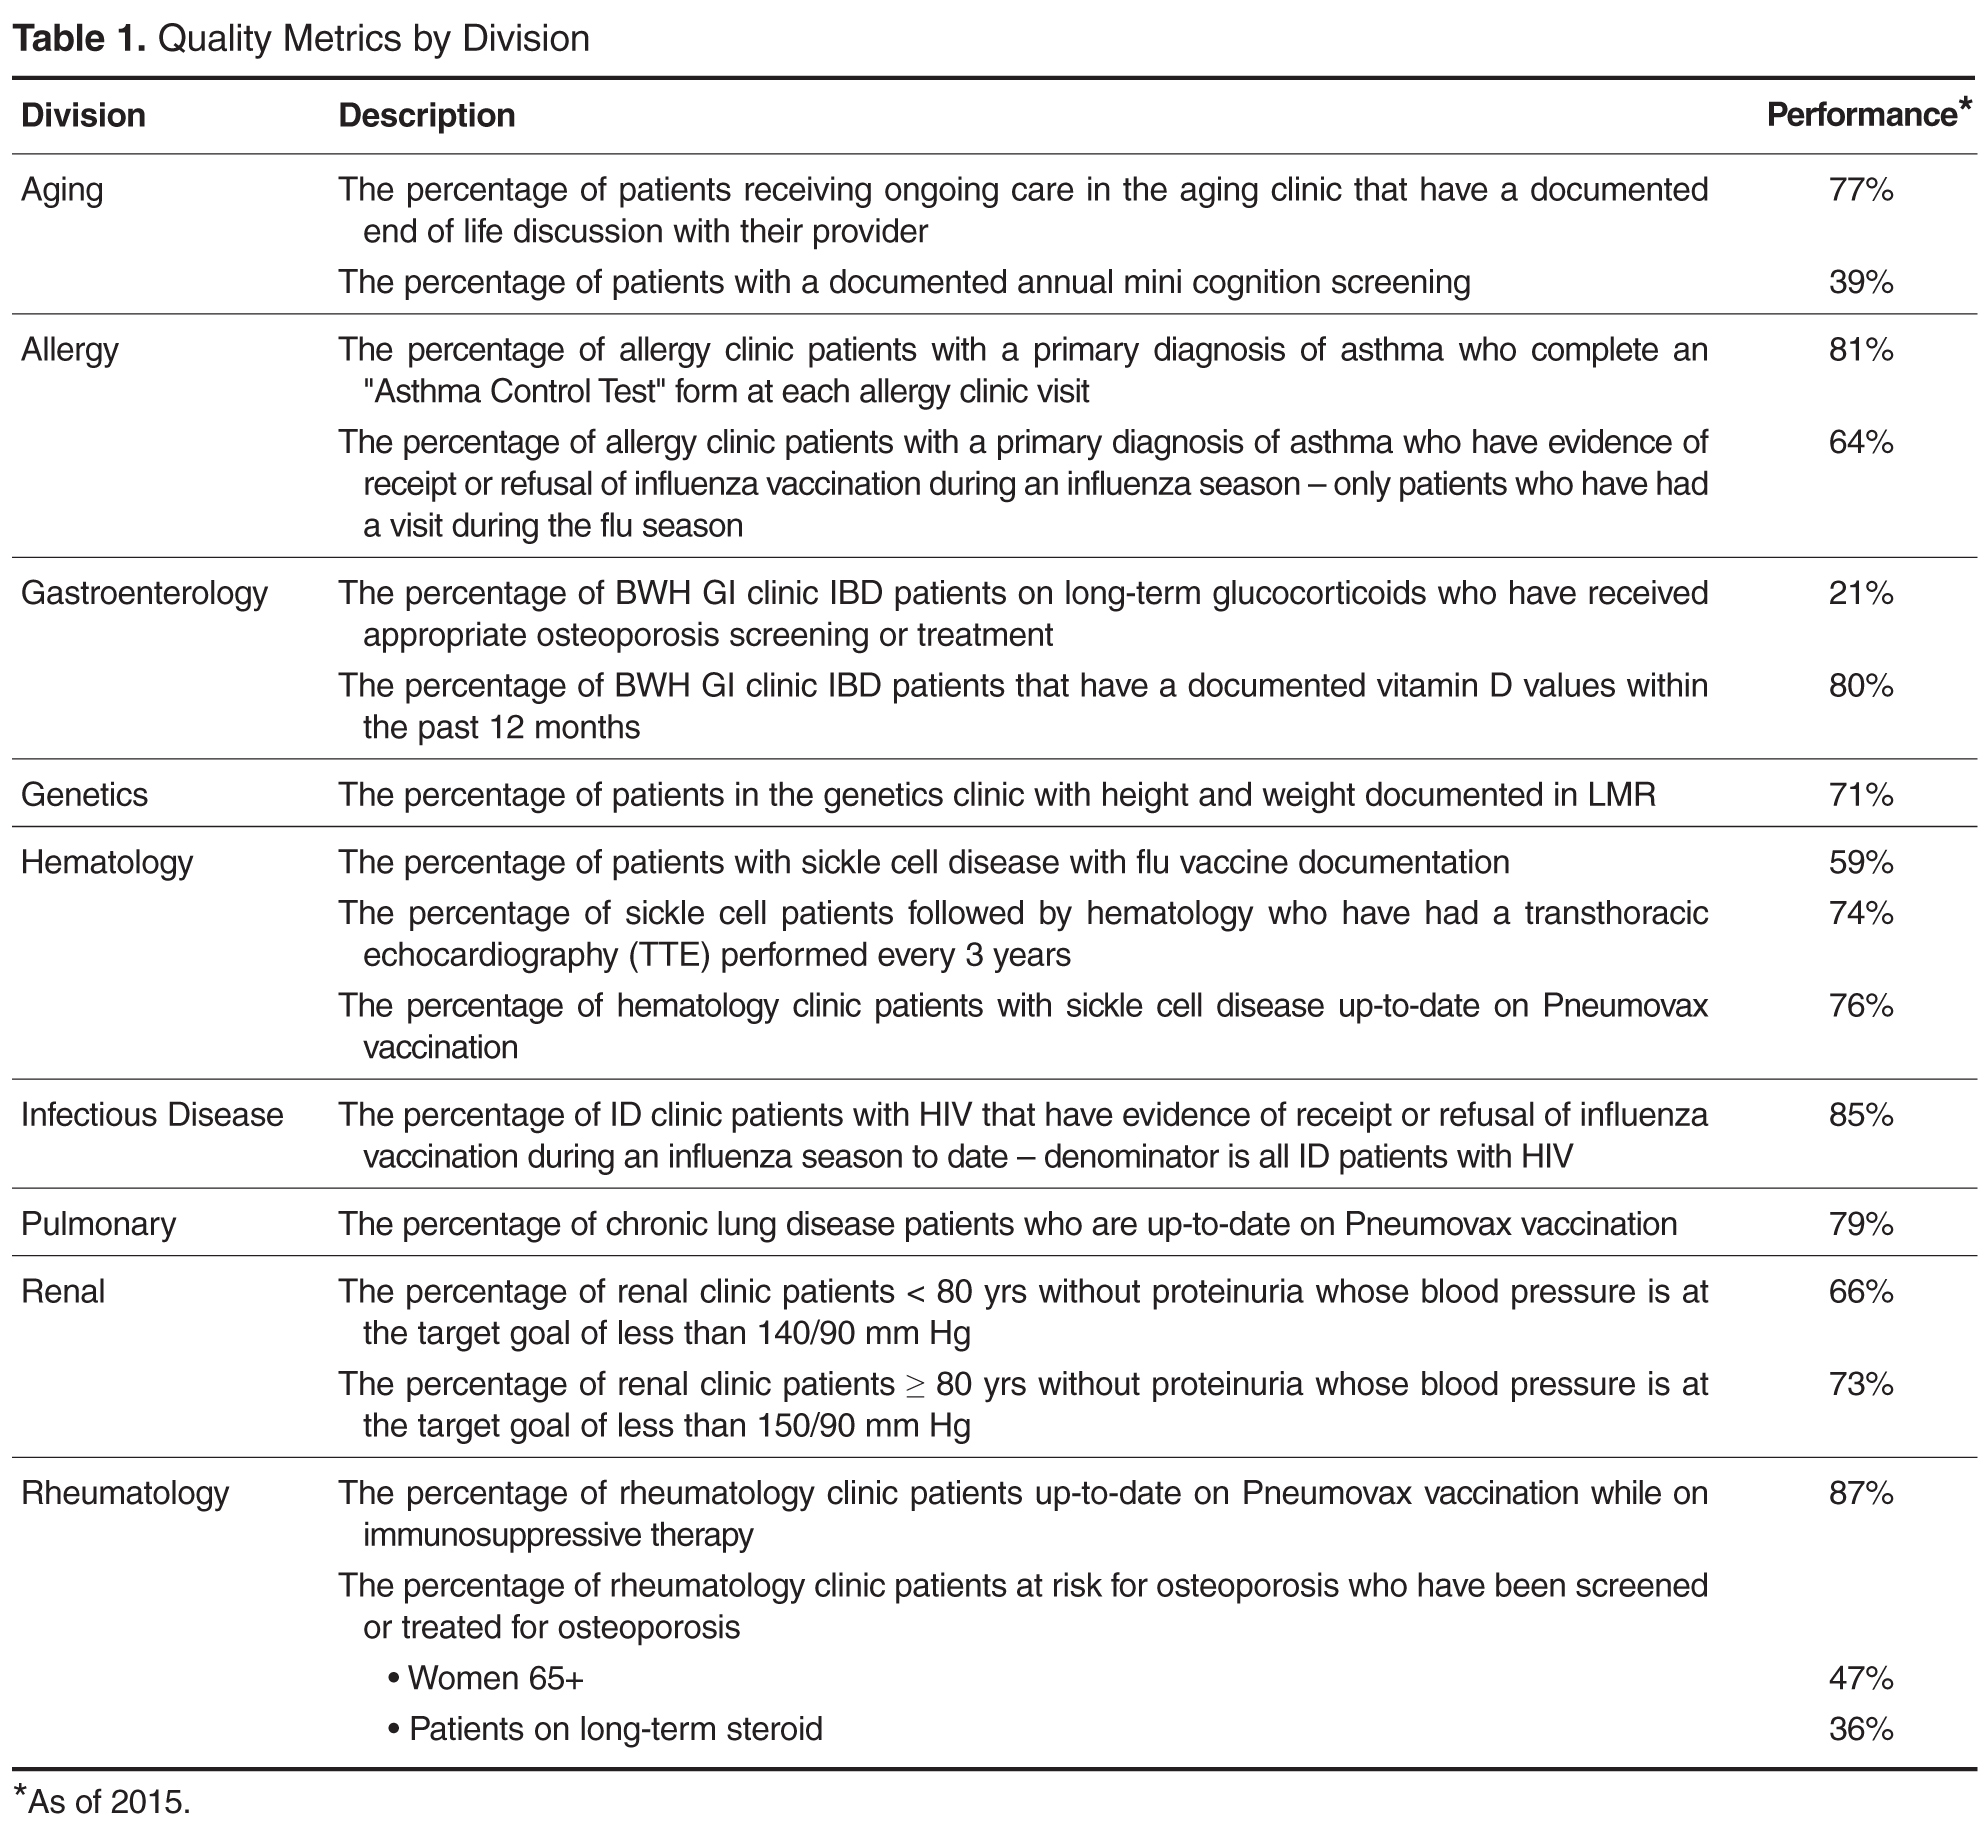
In an effort to improve influenza and pneumococcal vaccination rates, we worked closely with front-line clinicians and staff to create improvement strategies tailored to the patient population and clinic staffing structure in 4 divisions: allergy (order and document flu vaccinations for asthma patients), rheumatology (point-of-care standing pneumococcal paper-orders for immunosuppressed patients), infectious diseases (a nurse-driven influenza protocol was implemented for HIV patients), and pulmonary (letters sent to chronic lung disease patients asking them to bring documentation of prior pneumococcal vaccination to their next visit). We saw increases in vaccination rates across all 4 divisions using varied approaches to reach our goals [17].
Meaningful Use
Our team was responsible for ensuring that the DOM succeeded in the federal government’s MU program. Millions of dollars were at risk to the hospital and to physicians based on performance on various MU metrics. The hospital made this a priority and set a goal for 90% of eligible providers to successfully certify in Stage 1 as meaningful users in the first year of MU.

While working with the clinics to achieve meaningful use, we recognized that a range of staff members played a critical role in helping physicians meet MU metric targets. We worked with the clinic and departmental administrative leadership to set up a one-time bonus payment in 2013 to all DOM clinic staff, including medical assistants, licensed practical nurses, practice assistants, for appreciation of their significant efforts to help the physicians and the hospital achieve their MU goals. As health care delivery continues to rely more heavily on highly functional teams, acknowledgment of the efforts of non-clinical staff in helping front-line clinicians in achieving MU can help promote teamwork around a common goal.
Our partnership with the hospital MU team lead to a final tally of 98% of eligible providers meeting stage 1 in 2013, 99% in 2014 and 100% for the modified stage 2 in 2015 and 99% in 2016 for DOM specialty divisions, representing over 250 physicians.
Medication Reconciliation
The impetus for the hospital’s focus on medication reconciliation was the Joint Commission requirement that medications listed as prescribed in the EHR be reconciled with the patient at each visit [10]. The hospital’s quality and safety team created a hospital-wide metric aligned with hospital policy to measure how providers were reconciling medication lists during office visits. The medication reconciliation metric tallied visits when a medication change occurred (denominator) in which all of the medications originally prescribed by a physician in that specialty clinic were reconciled (numerator). This made it easier for specialists to buy-in to the metric because they were only responsible for the medications they prescribed and not the entire list. To meet the metric, physicians are required to take an action on each of the medications they prescribed by clicking taking, not taking, taking differently, or discontinuing. If the clinic has additional staff within the clinic to assist in the medication review process with the patient, physicians would receive credit for their actions once they had reviewed the medication list.
The metric BWH established to measure medication reconciliation was distinct and more rigorous than the medication reconciliation metric used to meet MU requirements. This presented a challenge in both physician communication regarding requirements and data sharing to drive performance improvement. Since the DOM is the largest and most prescribing department, we had to work with clinical and administrative leaders at the divisional level so that all staff understood the exact requirements and how to achieve them. When presenting to faculty we encountered many questions, and general resistance to more clicks in the EHR, as there was no universal “reconcile” button in the extant EHR. After breaking down the process into discrete components with staff and analyzing the data, we targeted outreach to the specific divisions and clinics that needed additional education and support. In our monthly email communication to division leadership, we displayed comparative data on all divisions within the DOM.

After we transitioned to a new vendor-based EHR in 2015, we developed a new medication reconciliation metric, aimed to align with Stage 2 MU requirements, and ensured all divisions had processes in place to review and reconcile medications. In our new EHR, medications lists are shared and viewable between ambulatory and inpatient environments and discharge summaries contain changes made to medications while inpatient. We have found that our performance on our new metric is 70.5% for February 2017 and we are continuing to educate physicians and staff on our new EHR functionality, our new electronic measurement and on workflows to help assist with improving performance with a short-term goal of 80%. We have found that our new EHR functionality does not match the ease of our old EHR functionality, which has made improvement on this metric a significant challenge for our clinicians and staff.
Maintenance of Certification
As of 2013, physicians who were board certified by the ABIM or ABMS were required to attain 20 practice assessment points showing participation in quality improvement activities for maintenance of certification (MOC). Although ABIM suspended the practice assessment requirement in 2015, it is likely that some component of quality improvement will be assessed in the future [5,19]. Prior to the changes in 2015, we were approached by the hospital leadership to roll out a new, streamlined process to leverage our existing quality metrics and established performance improvement plans in order to allow physicians to gain MOC credit. Each metric/project was vetted with 3 separate groups: the DOMQP, hospital leadership leading the MOC efforts, and Partners Healthcare, our overarching local health care system. We worked with our division physician champions and the physicians preparing for board re-certification to complete the one-time documentation required by the hospital for MOC. This process took approximately 6 months per project. Once the project was approved by all 3 channels, all physicians participating in the quality effort could get the practice assessment points by completing a simple attestation form.

Current Focus
After the stabilization of our new EHR and the re-creation of former reports, the program began to engage divisions in new measures. We still focus on chronic disease management and vaccinations but instead try to create a unified approach across multiple divisions within the DOM. Building upon our previous work in the renal division, over the past year we convened a hyper-tension work group comprising physician leads from endocrine, cardiology, renal, primary care, gerontology, neurology, pharmacy, and obstetrics. The goal of these meetings is to optimize blood pressure management across different patient populations by creating a centralized hospital approach with an algorithm agreed upon by the physician workgroup. We were able to secure additional internal grant funding to develop a pilot project where bluetooth blood pressure cuffs are given to eligible hypertensive patients in our pilot ambulatory practices. The daily blood pressure readings are transmitted into the EHR and a nurse practitioner or pharmacist contacts the patient at defined intervals to address any barriers and titrate medications as necessary. Analysis of the outcomes will be presented this fall. Similarly with vaccinations we are creating an automated order form within the EHR that will appear whenever a specialist places an order to start immunosuppressive medications. This will prompt the provider to order appropriate labs and vaccinations recommended for the course of treatment.
In addition to expanding upon previous metrics, we have expanded our scope to focus on patient safety measures, specifically, missed and delayed cancer diagnoses of the lung and colon. We are working on processes to track every patient with an abnormal finding from point of notification to completion of recommended follow-up at the appropriate intervals. Also we have now have 3 projects in the inpatient setting: chronic obstructive pulmonary disease (COPD) readmissions, and 2 standardized clinical assessment and management pathways (SCAMPs), one on acute kidney injury and the other on congestive heart failure [20]. The COPD project aims to have every patient admitted with COPD receive a pulmonary and respiratory consult during their stay and a follow-up visit with a pulmonologist. The goal of any SCAMP is to standardize care in an area where there is a lot of variability through the use of clinical pathways.
Communication Strategy
In order for the DOMQP to ensure that multiple quality requirements are met by all divisions, we have established a robust communication strategy with the goal of clear, concise, and relevant information-sharing with physicians and staff. We engage physicians through direct meetings, regular emails, and data reporting. The purpose of our outreach to the division faculty is threefold: (1) to educate physicians about hospital-wide programs, (2) to orient them to specific action items required for success, and (3) to funnel questions back to project leaders to ensure that the feedback of clinicians was incorporated into hospital wide quality initiatives. Our first challenge is to provide context for physicians about the project, be it based on accreditation, credentialing or a federal mandate. We work with the hospital project leaders to learn as much as possible about the efforts they are promoting so we can work in concert with them to highlight key messages to physicians.
Next, we establish a schedule to present at each clinical specialty faculty meeting on a regular basis (semi-annually to quarterly). At these meetings we present an overall picture of the key initiatives relevant to the division, identify milestones, offer clear timelines and prioritization of these projects, and narrow the focus of work to a few bulleted action items for all levels of the clinic staff to incorporate into its workflow. We then listen to questions and concerns and bring these back to the initiative leaders so that systematic changes can be made. Answers and updates are communicated back to the divisions, thus closing the communication loop. We interface with practice managers and clinical support staff to identify opportunities for them to support physicians in meeting initiative requirements [21,22].
In addition to presenting at faculty meetings, we present updates to departmental and hospital leadership, including vice chairs and division chiefs. These meetings include high-level data on performance as well as an opportunity to discuss the challenges we identified through our discussions with individual specialties. These forums are a good place to discuss overarching process issues or to disseminate answers to previous questions.
An important part of our communication plan involves our comprehensive monthly emails. For each initiative, we receive department level data on a monthly basis from the project leadership. We deconstruct these reports to enable us to evaluate our 13 divisions individually. We show performance at the physician level and highlight general areas where improvement is needed. We send monthly e-mails to division clinical and administrative leadership to apprise them of their division’s performance and inform them of areas that require concentrated effort. Depending on the initiative, we present data as a snapshot in time or trend over time. From 2012–2017 the DOMQP has helped to bridge the gap between large-scale rollouts of the new initiatives and the vast number of DOM physicians who required more specific education and tools to meet these new requirements.
Conclusion
The DOMQP has been working on quality within the department of medicine for the past 10 years. We have moved from initiating an internal quality program among the specialty providers, which required education among faculty and resolve to overcome many IS challenges, to serving as a resource for hospital-wide quality-related initiatives. We have developed a successful architecture for disseminating information and guiding faculty and administrative support toward success on a multitude of metrics that have implications on both finances and sound patient care. We have navigated the significant challenges associated with the large-scale change due to the EHR transition we underwent in 2015, including clinician burnout and fatigue, new EHR functionality, and the development of a new data reporting infrastructure and governance. The DOMQP continues to demonstrate that quality has a multifaceted role to play within a hospital.
As the health care environment continues to evolve, the need for this level of support for clinics will increase. The DOMQP is well positioned to provide continuing support to physicians and their practices in measuring and improving quality, with attention paid to such areas as coordination and efficacy of care, patient-reported outcomes, patient safety, and population health management. We believe that the DOMQP can serve as a model of a departmental quality program.
Acknowledgements: We would like to thank the department of medicine administration, faculty and support staff for their continuous effort and support in the work of clinical quality improvement.
Corresponding author: Sonali Desai, MD, MPH, Brigham & Women’s Hospital, 45 Francis St., PBB-B3, Boston, MA 02115, sdesai5@bwh.harvard.edu.
Financial disclosures: None.
1. Electronic health records (EHR) incentive programs. Accessed at www.cms.gov/Regulations-and Guidance/Legislation/EHRIncentivePrograms/index.html?redirect=/EHRIncentiveprograms/.
2. Accountable care organizations (ACO). Accessed at www.cms.gov/Medicare/Medicare-Fee-for-Service-Payment/ACO/index.html?redirect=/aco.
3. Quinn K. The 8 basic payment methods in health care. Ann Intern Med 2015;163:300–6.
4. Muhlestein D, McClellan M. Accountable care organizations in 2016: private and public-sector growth and dispersion. Health Aff blog 21 Apr 2016. Accessed at http://healthaffairs.org/blog/2016/04/21/accountable-care-organizations-in-2016-private-and-public-sector-growth-and-dispersion/.
5. ABIM. Maintenance of certification. Accessed 6 Oct 2015 at www.abim.org/maintenance-of-certification/.
6. Accreditation Council for Graduate Medical Education. CLER pathways to excellence. 2014. Accessed 6 Oct 2015 at www.acgme.org/acgmeweb/Portals/0/PDFs/CLER/CLER_Brochure.pdf.
7. Centers for Medicare and Medicaid Services. Quality payment program. Accessed 31 Mar 2017 at https://qpp.cms.gov/measures/quality.
8. Szent-Gyorgyi LE, Coblyn J, Turchin A, et al. Building a departmental quality program: a patient-based and provider-led approach. Acad Med 2011;86:314–20.
9. Brook RH, McGlynn EA, Shekelle PG. Defining and measuring quality of care: a perspective from US researchers. Int J Qual Health Care 2000;12:281–95.
10. The Joint Commision. National patient safety goals. Accessed at www.jointcommission.org/standards_information/npsgs.aspx.
11. Conway PH, Mostashari F, Clancy C. The future of quality measurement for improvement and accountability. JAMA 2013;309:2215–6.
12. Desai SP, Turchin A, Szent-Gyorgyi LE, et al. Routinely measuring and reporting pneumococcal vaccination among immunosuppressed rheumatology outpatients: the first step in improving quality. Rheumatology (Oxford) 2011;50:366–72.
13. Desai SP, Lu B, Szent-Gyorgyi LE, et al. Increasing pneumococcal vaccination for immunosuppressed patients: a cluster quality improvement trial. Arthritis Rheum 2013;65:39–47.
14. Deming Institute. PDSA cycle. Accessed at www.deming.org/theman/theories/pdsacycle.
15. McGlynn EA, Schneider EC, Kerr EA. Reimagining quality measurement. N Engl J Med 2014;371:2150–3.
16. Greenberg JO, Vakharia N, Szent-Gyorgyi LE, et al. Meaningful measurement: developing a measurement system to improve blood pressure control in patients with chronic kidney disease. J Am Med Inform Assoc 2013;20:e97–e101.
17. Pennant KN, Costa JJ, Fuhlbrigge AL, et al. Improving influenza and pneumococcal vaccination rates in ambulatory specialty practices. Open Forum Infect Dis 2015;2:ofv119.
18. Keogh C, Kachalia A, Fiumara K, et al. Ambulatory medication reconciliation: using a collaborative approach to process improvement at an academic medical center. Jt Comm J Qual Patient Saf 2016;42:186–94.
19. ABIM. Maintenance of certification FAQ. Accessed at www.abim.org/maintenance-of-certification/moc-faq/default.aspx.
20. Mendu ML, Ciociolo GR Jr, McLaughlin SR, et al. A decision-making algorithm for initiation and discontinuation of RRT in severe AKI. Clin J Am Soc Nephrol 2017;12:228–36.
21. Galvin RS, McGlynn EA. Using performance measurement to drive improvement: a road map for change. Med Care 2003;41:I48–60.
22. Glaser J, Hess R. Leveraging healthcare IT to improve operational performance. Healthc Financ Manage 2011;65:82–5.
From the Department of Medicine Quality Program, Brigham and Women’s Hospital (Drs. Pennant, McElrath, Coblyn, and Desai) and the Institute for Relevant Clinical Data Analytics, Boston Children’s Hospital, (Drs. Szent-Gyorgyi and Greenberg), Boston, MA.
Abstract
- Objectives: To describe the department of medicine quality program (DOMQP) at Brigham and Women’s Hospital (BWH).
- Methods: The program began in 2007 to engage physicians in local, specialty-specific quality efforts. The program has broadened its scope to include government mandates and hospital-wide priorities, such as maintenance of certification (MOC), “meaningful use (MU),” and medication reconciliation. More recently, we have evolved into a project-based program focusing on both chronic disease management and optimizing care pathways for high-risk inpatient conditions. Our key strategies are developing metrics, raising awareness, distilling information to front-line staff, highlighting relevant action items, and bringing feedback from front-line staff to hospital leadership.
- Results: We have developed 21 metrics across 13 clinical divisions, with performance improvement seen in > 50% of metrics. In 2014, we leveraged our quality metrics to earn MOC credit, with 100 physicians across 10 divisions earning MOC points through the Practice Assessment option. Additionally, department physicians achieved 90% compliance with our institutional medication reconciliation policy. The percentage of physicians achieving stage 1 MU was 98% in 2013, 99% in 2014, and 100% achieved stage 2 MU in 2015.
- Conclusion: Over the past 10 years, the DOMQP has played a unique role in promoting quality and serves as a model for QI within the hospital. We are well positioned to provide support to physicians and their practices as the health care environment continues to evolve.
Key words: quality improvement; quality measurement.
Within the past several years, the health care landscape in the United States has shifted considerably. New financial risk and quality-related incentive structures have been put in place, such as financial incentives to adopt electronic health records (EHRs) and to demonstrate “meaningful use (MU)” of these EHRs [1]. There is greater focus on value based payments, and accountable care organizations (ACOs) are proliferating [2–4]. Certification and training requirements have changed and require completion of performance improvement projects [5,6]. Upcoming changes to quality measurement and improvement through the Quality Payment Program will bring further changes to how clinicians are both monitored and incentivized or penalized [7]. The confluence of these efforts provides an impetus to incorporate quality measurement and improvement into the day to day practice of medicine.
In 2007, the department of medicine (DOM) at Brigham and Women’s Hospital (BWH), a teaching affiliate of Harvard Medical School and a founding member of Partners Healthcare, began a quality program (DOMQP) to engage physicians in local, specialty-specific quality efforts [8]. The program began by focusing on internally developed performance metrics to drive physician engagement. Later, the program expanded its focus to include more externally focused mandates from federal government and other accreditation bodies [9,10]. In this article, we discuss our efforts, including our early stage work and more recent focus in the areas of meaningful use, medication reconciliation, and maintenance of certification as well as our ongoing projects focused on chronic disease management and high-risk inpatient conditions.
Setting
The DOM has approximately 1400 physician faculty members and is the largest clinical department at BWH. The DOMQP is comprised of a medical director (0.35 FTE) and 2 project coordinators (2 FTE) who operate in a consultative capacity to liaison between the various levels of clinical leadership and frontline staff. The DOMQP serves 13 divisions: 11 medical specialties, primary care, and the hospitalist service.
Internally Driven, Specialty-Specific Quality Metrics
The early stages of our efforts focused on engaging clinical leadership and physicians, navigating the hospital’s information systems (IS) to develop quality reports within the EHR and implementing strategies for improvement. Until 30 May 2015, BWH utilized an internally developed EHR comprising a myriad of individual systems (eg, billing, electronic medication administration, clinical repository) that did not interface easily with one another. To resolve the IS challenges, we engaged many levels of the organization’s IS structure and requested updates or developed workaround solutions leading to the integration of the various datasets for comprehensive reporting. This resulted in a new agreement between the hospital and Partners that allowed for billing data to be sent to the same repository that housed the clinical data.
We developed at least one data report for each specialty division. The divisions selected a quality measure, and we worked with clinical leadership to define the numerator and denominator and identify any additional information they wanted in the report, eg, demographics, visit dates, labs. To produce the report, an IS consultant compiles the data elements on an excel spreadsheet. This spreadsheet is then manually chart reviewed by the DOMQP for accuracy before it is converted into a report. The report is then reviewed by the DOMQP to ensure the information is presented correctly and is easily interpreted, and then shared with the division champion(s), who determine how to message and introduce a proposed improvement effort before it is shared with the entire division.
In an effort to improve influenza and pneumococcal vaccination rates, we worked closely with front-line clinicians and staff to create improvement strategies tailored to the patient population and clinic staffing structure in 4 divisions: allergy (order and document flu vaccinations for asthma patients), rheumatology (point-of-care standing pneumococcal paper-orders for immunosuppressed patients), infectious diseases (a nurse-driven influenza protocol was implemented for HIV patients), and pulmonary (letters sent to chronic lung disease patients asking them to bring documentation of prior pneumococcal vaccination to their next visit). We saw increases in vaccination rates across all 4 divisions using varied approaches to reach our goals [17].
Meaningful Use
Our team was responsible for ensuring that the DOM succeeded in the federal government’s MU program. Millions of dollars were at risk to the hospital and to physicians based on performance on various MU metrics. The hospital made this a priority and set a goal for 90% of eligible providers to successfully certify in Stage 1 as meaningful users in the first year of MU.
While working with the clinics to achieve meaningful use, we recognized that a range of staff members played a critical role in helping physicians meet MU metric targets. We worked with the clinic and departmental administrative leadership to set up a one-time bonus payment in 2013 to all DOM clinic staff, including medical assistants, licensed practical nurses, practice assistants, for appreciation of their significant efforts to help the physicians and the hospital achieve their MU goals. As health care delivery continues to rely more heavily on highly functional teams, acknowledgment of the efforts of non-clinical staff in helping front-line clinicians in achieving MU can help promote teamwork around a common goal.
Our partnership with the hospital MU team lead to a final tally of 98% of eligible providers meeting stage 1 in 2013, 99% in 2014 and 100% for the modified stage 2 in 2015 and 99% in 2016 for DOM specialty divisions, representing over 250 physicians.
Medication Reconciliation
The impetus for the hospital’s focus on medication reconciliation was the Joint Commission requirement that medications listed as prescribed in the EHR be reconciled with the patient at each visit [10]. The hospital’s quality and safety team created a hospital-wide metric aligned with hospital policy to measure how providers were reconciling medication lists during office visits. The medication reconciliation metric tallied visits when a medication change occurred (denominator) in which all of the medications originally prescribed by a physician in that specialty clinic were reconciled (numerator). This made it easier for specialists to buy-in to the metric because they were only responsible for the medications they prescribed and not the entire list. To meet the metric, physicians are required to take an action on each of the medications they prescribed by clicking taking, not taking, taking differently, or discontinuing. If the clinic has additional staff within the clinic to assist in the medication review process with the patient, physicians would receive credit for their actions once they had reviewed the medication list.
The metric BWH established to measure medication reconciliation was distinct and more rigorous than the medication reconciliation metric used to meet MU requirements. This presented a challenge in both physician communication regarding requirements and data sharing to drive performance improvement. Since the DOM is the largest and most prescribing department, we had to work with clinical and administrative leaders at the divisional level so that all staff understood the exact requirements and how to achieve them. When presenting to faculty we encountered many questions, and general resistance to more clicks in the EHR, as there was no universal “reconcile” button in the extant EHR. After breaking down the process into discrete components with staff and analyzing the data, we targeted outreach to the specific divisions and clinics that needed additional education and support. In our monthly email communication to division leadership, we displayed comparative data on all divisions within the DOM.
After we transitioned to a new vendor-based EHR in 2015, we developed a new medication reconciliation metric, aimed to align with Stage 2 MU requirements, and ensured all divisions had processes in place to review and reconcile medications. In our new EHR, medications lists are shared and viewable between ambulatory and inpatient environments and discharge summaries contain changes made to medications while inpatient. We have found that our performance on our new metric is 70.5% for February 2017 and we are continuing to educate physicians and staff on our new EHR functionality, our new electronic measurement and on workflows to help assist with improving performance with a short-term goal of 80%. We have found that our new EHR functionality does not match the ease of our old EHR functionality, which has made improvement on this metric a significant challenge for our clinicians and staff.
Maintenance of Certification
As of 2013, physicians who were board certified by the ABIM or ABMS were required to attain 20 practice assessment points showing participation in quality improvement activities for maintenance of certification (MOC). Although ABIM suspended the practice assessment requirement in 2015, it is likely that some component of quality improvement will be assessed in the future [5,19]. Prior to the changes in 2015, we were approached by the hospital leadership to roll out a new, streamlined process to leverage our existing quality metrics and established performance improvement plans in order to allow physicians to gain MOC credit. Each metric/project was vetted with 3 separate groups: the DOMQP, hospital leadership leading the MOC efforts, and Partners Healthcare, our overarching local health care system. We worked with our division physician champions and the physicians preparing for board re-certification to complete the one-time documentation required by the hospital for MOC. This process took approximately 6 months per project. Once the project was approved by all 3 channels, all physicians participating in the quality effort could get the practice assessment points by completing a simple attestation form.
Current Focus
After the stabilization of our new EHR and the re-creation of former reports, the program began to engage divisions in new measures. We still focus on chronic disease management and vaccinations but instead try to create a unified approach across multiple divisions within the DOM. Building upon our previous work in the renal division, over the past year we convened a hyper-tension work group comprising physician leads from endocrine, cardiology, renal, primary care, gerontology, neurology, pharmacy, and obstetrics. The goal of these meetings is to optimize blood pressure management across different patient populations by creating a centralized hospital approach with an algorithm agreed upon by the physician workgroup. We were able to secure additional internal grant funding to develop a pilot project where bluetooth blood pressure cuffs are given to eligible hypertensive patients in our pilot ambulatory practices. The daily blood pressure readings are transmitted into the EHR and a nurse practitioner or pharmacist contacts the patient at defined intervals to address any barriers and titrate medications as necessary. Analysis of the outcomes will be presented this fall. Similarly with vaccinations we are creating an automated order form within the EHR that will appear whenever a specialist places an order to start immunosuppressive medications. This will prompt the provider to order appropriate labs and vaccinations recommended for the course of treatment.
In addition to expanding upon previous metrics, we have expanded our scope to focus on patient safety measures, specifically, missed and delayed cancer diagnoses of the lung and colon. We are working on processes to track every patient with an abnormal finding from point of notification to completion of recommended follow-up at the appropriate intervals. Also we have now have 3 projects in the inpatient setting: chronic obstructive pulmonary disease (COPD) readmissions, and 2 standardized clinical assessment and management pathways (SCAMPs), one on acute kidney injury and the other on congestive heart failure [20]. The COPD project aims to have every patient admitted with COPD receive a pulmonary and respiratory consult during their stay and a follow-up visit with a pulmonologist. The goal of any SCAMP is to standardize care in an area where there is a lot of variability through the use of clinical pathways.
Communication Strategy
In order for the DOMQP to ensure that multiple quality requirements are met by all divisions, we have established a robust communication strategy with the goal of clear, concise, and relevant information-sharing with physicians and staff. We engage physicians through direct meetings, regular emails, and data reporting. The purpose of our outreach to the division faculty is threefold: (1) to educate physicians about hospital-wide programs, (2) to orient them to specific action items required for success, and (3) to funnel questions back to project leaders to ensure that the feedback of clinicians was incorporated into hospital wide quality initiatives. Our first challenge is to provide context for physicians about the project, be it based on accreditation, credentialing or a federal mandate. We work with the hospital project leaders to learn as much as possible about the efforts they are promoting so we can work in concert with them to highlight key messages to physicians.
Next, we establish a schedule to present at each clinical specialty faculty meeting on a regular basis (semi-annually to quarterly). At these meetings we present an overall picture of the key initiatives relevant to the division, identify milestones, offer clear timelines and prioritization of these projects, and narrow the focus of work to a few bulleted action items for all levels of the clinic staff to incorporate into its workflow. We then listen to questions and concerns and bring these back to the initiative leaders so that systematic changes can be made. Answers and updates are communicated back to the divisions, thus closing the communication loop. We interface with practice managers and clinical support staff to identify opportunities for them to support physicians in meeting initiative requirements [21,22].
In addition to presenting at faculty meetings, we present updates to departmental and hospital leadership, including vice chairs and division chiefs. These meetings include high-level data on performance as well as an opportunity to discuss the challenges we identified through our discussions with individual specialties. These forums are a good place to discuss overarching process issues or to disseminate answers to previous questions.
An important part of our communication plan involves our comprehensive monthly emails. For each initiative, we receive department level data on a monthly basis from the project leadership. We deconstruct these reports to enable us to evaluate our 13 divisions individually. We show performance at the physician level and highlight general areas where improvement is needed. We send monthly e-mails to division clinical and administrative leadership to apprise them of their division’s performance and inform them of areas that require concentrated effort. Depending on the initiative, we present data as a snapshot in time or trend over time. From 2012–2017 the DOMQP has helped to bridge the gap between large-scale rollouts of the new initiatives and the vast number of DOM physicians who required more specific education and tools to meet these new requirements.
Conclusion
The DOMQP has been working on quality within the department of medicine for the past 10 years. We have moved from initiating an internal quality program among the specialty providers, which required education among faculty and resolve to overcome many IS challenges, to serving as a resource for hospital-wide quality-related initiatives. We have developed a successful architecture for disseminating information and guiding faculty and administrative support toward success on a multitude of metrics that have implications on both finances and sound patient care. We have navigated the significant challenges associated with the large-scale change due to the EHR transition we underwent in 2015, including clinician burnout and fatigue, new EHR functionality, and the development of a new data reporting infrastructure and governance. The DOMQP continues to demonstrate that quality has a multifaceted role to play within a hospital.
As the health care environment continues to evolve, the need for this level of support for clinics will increase. The DOMQP is well positioned to provide continuing support to physicians and their practices in measuring and improving quality, with attention paid to such areas as coordination and efficacy of care, patient-reported outcomes, patient safety, and population health management. We believe that the DOMQP can serve as a model of a departmental quality program.
Acknowledgements: We would like to thank the department of medicine administration, faculty and support staff for their continuous effort and support in the work of clinical quality improvement.
Corresponding author: Sonali Desai, MD, MPH, Brigham & Women’s Hospital, 45 Francis St., PBB-B3, Boston, MA 02115, sdesai5@bwh.harvard.edu.
Financial disclosures: None.
1. Electronic health records (EHR) incentive programs. Accessed at www.cms.gov/Regulations-and Guidance/Legislation/EHRIncentivePrograms/index.html?redirect=/EHRIncentiveprograms/.
2. Accountable care organizations (ACO). Accessed at www.cms.gov/Medicare/Medicare-Fee-for-Service-Payment/ACO/index.html?redirect=/aco.
3. Quinn K. The 8 basic payment methods in health care. Ann Intern Med 2015;163:300–6.
4. Muhlestein D, McClellan M. Accountable care organizations in 2016: private and public-sector growth and dispersion. Health Aff blog 21 Apr 2016. Accessed at http://healthaffairs.org/blog/2016/04/21/accountable-care-organizations-in-2016-private-and-public-sector-growth-and-dispersion/.
5. ABIM. Maintenance of certification. Accessed 6 Oct 2015 at www.abim.org/maintenance-of-certification/.
6. Accreditation Council for Graduate Medical Education. CLER pathways to excellence. 2014. Accessed 6 Oct 2015 at www.acgme.org/acgmeweb/Portals/0/PDFs/CLER/CLER_Brochure.pdf.
7. Centers for Medicare and Medicaid Services. Quality payment program. Accessed 31 Mar 2017 at https://qpp.cms.gov/measures/quality.
8. Szent-Gyorgyi LE, Coblyn J, Turchin A, et al. Building a departmental quality program: a patient-based and provider-led approach. Acad Med 2011;86:314–20.
9. Brook RH, McGlynn EA, Shekelle PG. Defining and measuring quality of care: a perspective from US researchers. Int J Qual Health Care 2000;12:281–95.
10. The Joint Commision. National patient safety goals. Accessed at www.jointcommission.org/standards_information/npsgs.aspx.
11. Conway PH, Mostashari F, Clancy C. The future of quality measurement for improvement and accountability. JAMA 2013;309:2215–6.
12. Desai SP, Turchin A, Szent-Gyorgyi LE, et al. Routinely measuring and reporting pneumococcal vaccination among immunosuppressed rheumatology outpatients: the first step in improving quality. Rheumatology (Oxford) 2011;50:366–72.
13. Desai SP, Lu B, Szent-Gyorgyi LE, et al. Increasing pneumococcal vaccination for immunosuppressed patients: a cluster quality improvement trial. Arthritis Rheum 2013;65:39–47.
14. Deming Institute. PDSA cycle. Accessed at www.deming.org/theman/theories/pdsacycle.
15. McGlynn EA, Schneider EC, Kerr EA. Reimagining quality measurement. N Engl J Med 2014;371:2150–3.
16. Greenberg JO, Vakharia N, Szent-Gyorgyi LE, et al. Meaningful measurement: developing a measurement system to improve blood pressure control in patients with chronic kidney disease. J Am Med Inform Assoc 2013;20:e97–e101.
17. Pennant KN, Costa JJ, Fuhlbrigge AL, et al. Improving influenza and pneumococcal vaccination rates in ambulatory specialty practices. Open Forum Infect Dis 2015;2:ofv119.
18. Keogh C, Kachalia A, Fiumara K, et al. Ambulatory medication reconciliation: using a collaborative approach to process improvement at an academic medical center. Jt Comm J Qual Patient Saf 2016;42:186–94.
19. ABIM. Maintenance of certification FAQ. Accessed at www.abim.org/maintenance-of-certification/moc-faq/default.aspx.
20. Mendu ML, Ciociolo GR Jr, McLaughlin SR, et al. A decision-making algorithm for initiation and discontinuation of RRT in severe AKI. Clin J Am Soc Nephrol 2017;12:228–36.
21. Galvin RS, McGlynn EA. Using performance measurement to drive improvement: a road map for change. Med Care 2003;41:I48–60.
22. Glaser J, Hess R. Leveraging healthcare IT to improve operational performance. Healthc Financ Manage 2011;65:82–5.