User login
Rapid-Cycle Innovation Testing of Text-Based Monitoring for Management of Postpartum Hypertension
From the Maternal and Child Health Research Program, Department of Obstetrics and Gynecology, Perelman School of Medicine at the University of Pennsylvania, Philadelphia, PA (Dr. Hirshberg, Dr. Srinivas); Hospital of the University of Pennsylvania, Department of Nursing, Department of Obstetrics and Gynecology, Philadelphia, PA (Ms. Bittle); Penn Medicine Center for Health Care Innovation, Perelman School of Medicine at the University of Pennsylvania, Philadelphia, PA (Mr. Vandertuyn, Ms. Mahraj, Dr. Asch, Mr. Rosin); and the Department of Family Medicine, University of Washington, Seattle, WA (Dr. Bennett).
Abstract
- Objective: To investigate engagement with a bidirectional text messaging system as an alternative to in-person follow-up for postpartum women with hypertensive disorders.
- Methods: We utilized rapid-cycle innovation processes to implement postpartum SMS text messaging follow-up in women with hypertensive disorders who delivered between September–December 2014. Patients were given electronic blood pressure cuffs and education before discharge. Standard texts reminded patients to send blood pressures daily on each of the 7 days post discharge. The study obstetrician sent text message responses based on a pre-specified management algorithm. Ability to meet ACOG guidelines was defined as receiving at least 1 reading on post-discharge days 1 or 2 and days 5, 6, or 7.
- Results: We enrolled 32 patients. Six (19%) returned for usual care office blood pressure checks. We received at least 1 blood pressure from 27 (84%) participants. Nearly 20 (65%) texted readings on 5 of the 7 days. 27 (84%) texted at least one reading on day 1 or 2, and 21 (66%) texted at least one pressure on day 5, 6, or 7 (P = 0.001 vs. usual care). Two patients required medications and none were readmitted for hypertension. Patients reported preference for home testing and text messaging over return visits.
- Conclusion: Remote blood pressure monitoring via text messaging is a patient-centered method for postpartum hypertension surveillance. Further testing is needed prior to widespread adoption within the broader obstetric community.
Key words: postpartum hypertension, remote monitoring, text-based intervention.
Hypertensive disease is a leading cause of maternal morbidity and mortality [1,2] and the leading cause of obstetric readmissions, accounting for 27% of obstetric readmissions in the United States in 2009 [3]. The majority of patients readmitted with hypertension have a diagnosis of hypertensive disorder of pregnancy on initial admission for delivery, indicating that these readmissions are the result of disease persistence or progression in contrast to new-onset disease. Peak blood pressure in these patients usually occurs 3 to 6 days postpartum [4–6] and is typically unaccompanied by warning symptoms. For these reasons, identifying patients who are at risk for persistent disease and being proactive in their postpartum care may decrease postpartum stroke and seizure. The recent Hypertension in Pregnancy guidelines provided by the American College of Obstetricians and Gynecologists (ACOG) recommend monitoring blood pressure for at least 72 hours postpartum (inpatient or outpatient) and again 7 to 10 days after delivery in women in whom a hypertensive disease of pregnancy is diagnosed [6].
Although there is a clear need for effective and reliable blood pressure surveillance for high-risk women soon after delivery, significant obstacles exist. Our own high-risk blood pressure transition clinic, which occurred every other week and was staffed by maternal-fetal medicine specialists, had an average attendance of only 30% over a 2-year period. Moreover, all of the hypertension-related readmissions occurred in the first 7 days post discharge, which was before the scheduled clinic visit for approximately 50% of patients. Phone call reminders were also found to be an ineffective strategy, as the women did not answer or return voice messages left by the practice. In fact, a postpartum unit quality improvement project validated that follow-up phone calls after discharge from the postpartum unit were less effective than text messaging when reminding women of their blood pressure follow-up appointment at the clinic [7].
As an alternative to in-person visits or traditional voice telephonic communication, mobile phone “Short Message Service” (SMS) text messaging has been used successfully in health care for appointment reminders, result reporting, support of medication and treatment adherence, and dosage adjustment [8–13]. As of 2014, 90% of American adults own a cell phone and over 79% of those send and receive text messages [14]. Among a young population, which is at high risk for hypertensive disorders of pregnancy, data further reveals a preference for text messaging over live calls [15]. Among low-income women under age 30, the rates of cell phone use and text communication are very high [14,15], making text-based surveillance a promising and more patient-centered strategy for a broad population.
We report the results of rapid-cycle innovation and implementation of active, remote surveillance of hypertension with new text message communication strategies in the first 7 days post-discharge. We chose a Plan-Do-Study-Act cycle approach, in which small tests are performed and studied and changes made to accelerate improvement, in order to enhance our ability to acquire blood pressure data [16,17]. The goals of the work were to (1) assess patient engagement using a remote method of blood pressure monitoring, (2) increase ascertainment of postpartum blood pressure data and obtain at least once daily blood pressure readings on all patients on post discharge days 1–2 and 5–7, which is in accordance with the recommended guidelines [6] for blood pressure surveillance, and (3) address all “at risk” severe range blood pressure readings within a short time interval and prior to the need for readmission. We describe a program of remote blood pressure monitoring and communication via text message designed to increase patient engagement and participation, thereby having the potential to result in earlier interventions, reduce readmissions, and decrease overall morbidity.
Methods
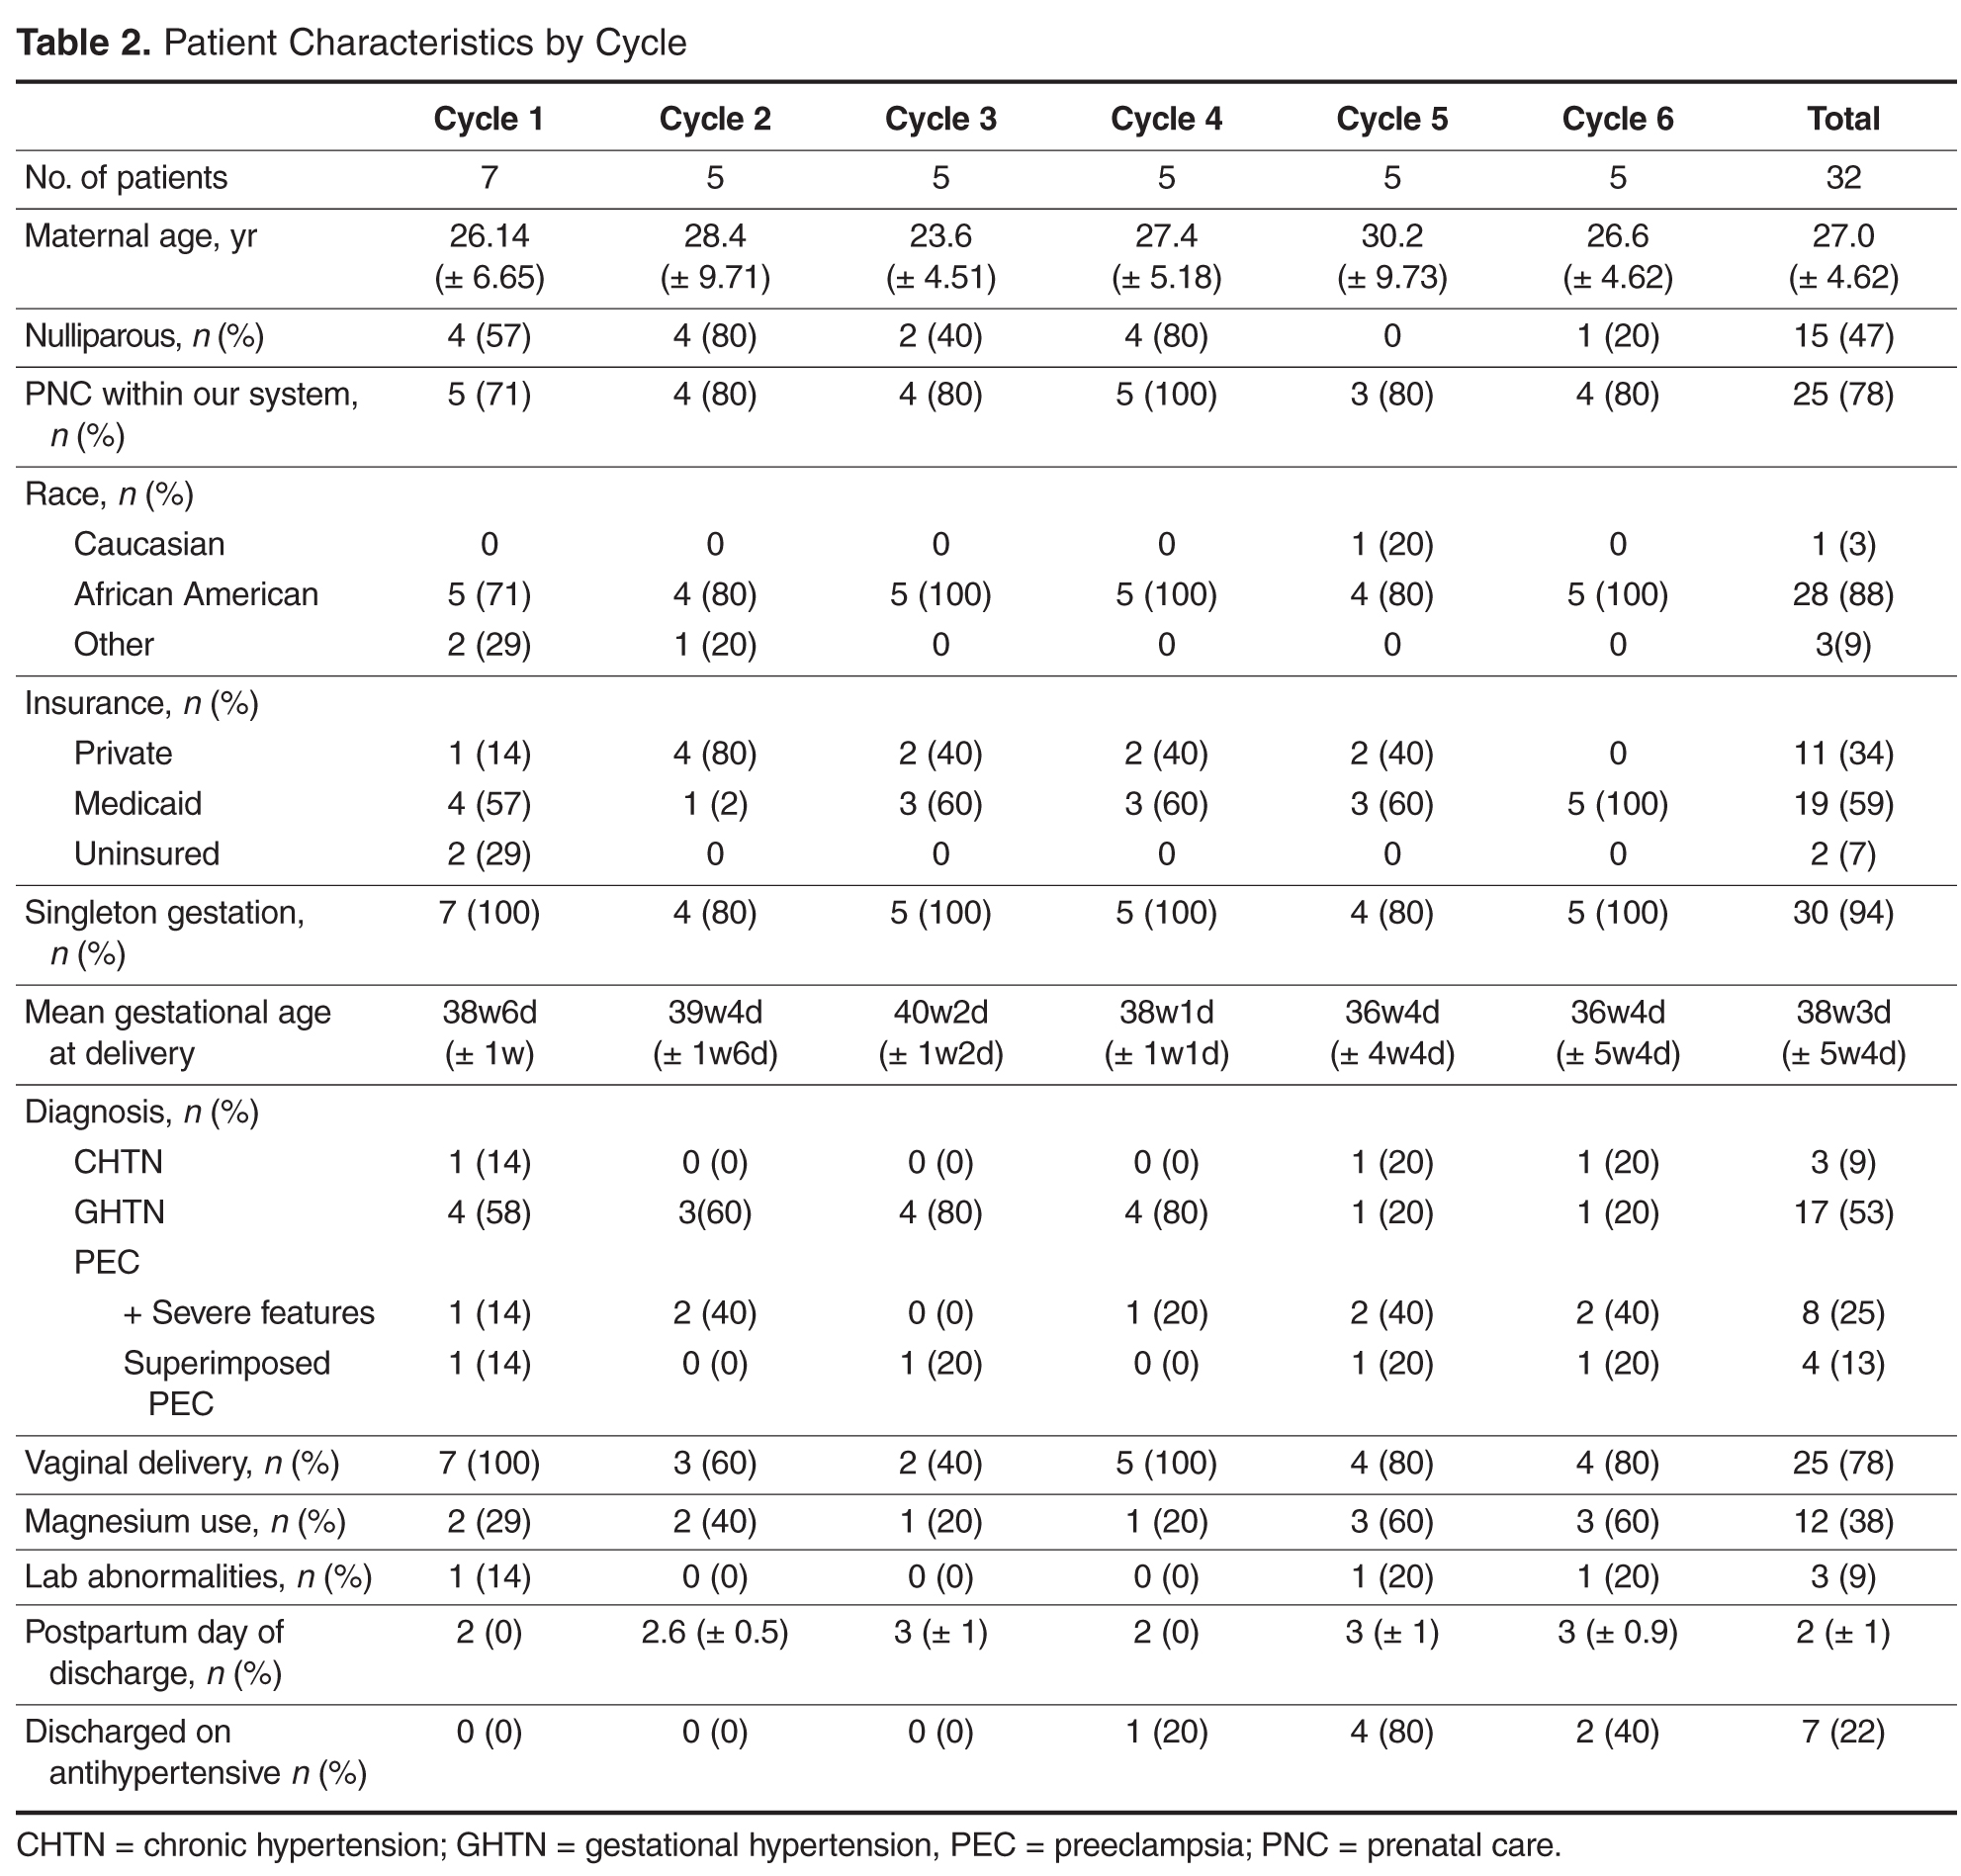
We performed a series of 6 rapid-cycle innovation devel-opment and implementation interventions with a cohort of women with chronic hypertension (CHTN), gestational hypertension (GHTN), or preeclampsia (with and without severe features and superimposed) who delivered at our institution between 20 September 2014 and 14 December 2014. All patients were > 18 years old, able to speak and read English, had a hypertension diag-nosis listed above, and had access to a cell phone with unlimited text messaging capabilities. Patients received standard postpartum care and were continued or started on antihypertensive medications based on a standardized postpartum hypertension protocol previously developed at our institution (available on request). This project was undertaken as a quality improvement initiative and as such was exempt from formal review by our institutional review board. However, all patients signed a waiver acknowledging that SMS texting is not a secure communications technology. A single research telephone was used for physician-patient communication to further ensure privacy.
Patients who qualified for the intervention study were recruited on the postpartum unit following delivery. Those who agreed to participate were provided with electronic blood pressure monitors (CVS Pharmacy automatic blood pressure monitor and Omron 3 Series upper arm blood pressure monitor) prior to discharge and instructed on their use. Patients were told to expect their first text message reminder to send in their blood pressure the day after discharge; an example of a text reminder is “Good morning. Please send us a blood pressure reading by 12 pm.” Patients were enrolled for 7 days post discharge and were interviewed regarding their experience at the end of their 7-day enrollment. As this was primarily a feasibility and quality improvement study, patients were also instructed to continue to follow up with the standard of care at the hypertension clinic visit.
For each of the 7 days following discharge from the hospital, patients received a standard text message in the morning and afternoon reminding them to text their blood pressure to the research telephone by a specific time. Reported blood pressures were reviewed and a standard response was sent by the study obstetrician based on an algorithm consistent with the institution’s postpartum hypertension protocol. Patients were sent reminders at all time points whether or not they had texted any BPs.
The ACOG Hypertension in Pregnancy guidelines recommend monitoring blood pressure at 72 hours postpartum (inpatient or outpatient) and again 7 to 10 days postpartum in women diagnosed with a hypertensive disorder of pregnancy [6]. We measured our ability to meet these guidelines by identifying how many patients texted blood pressures on post-discharge days 1 or 2 and post-discharge days 5, 6, or 7, as most patients were discharged home on postpartum day 2 or 3.
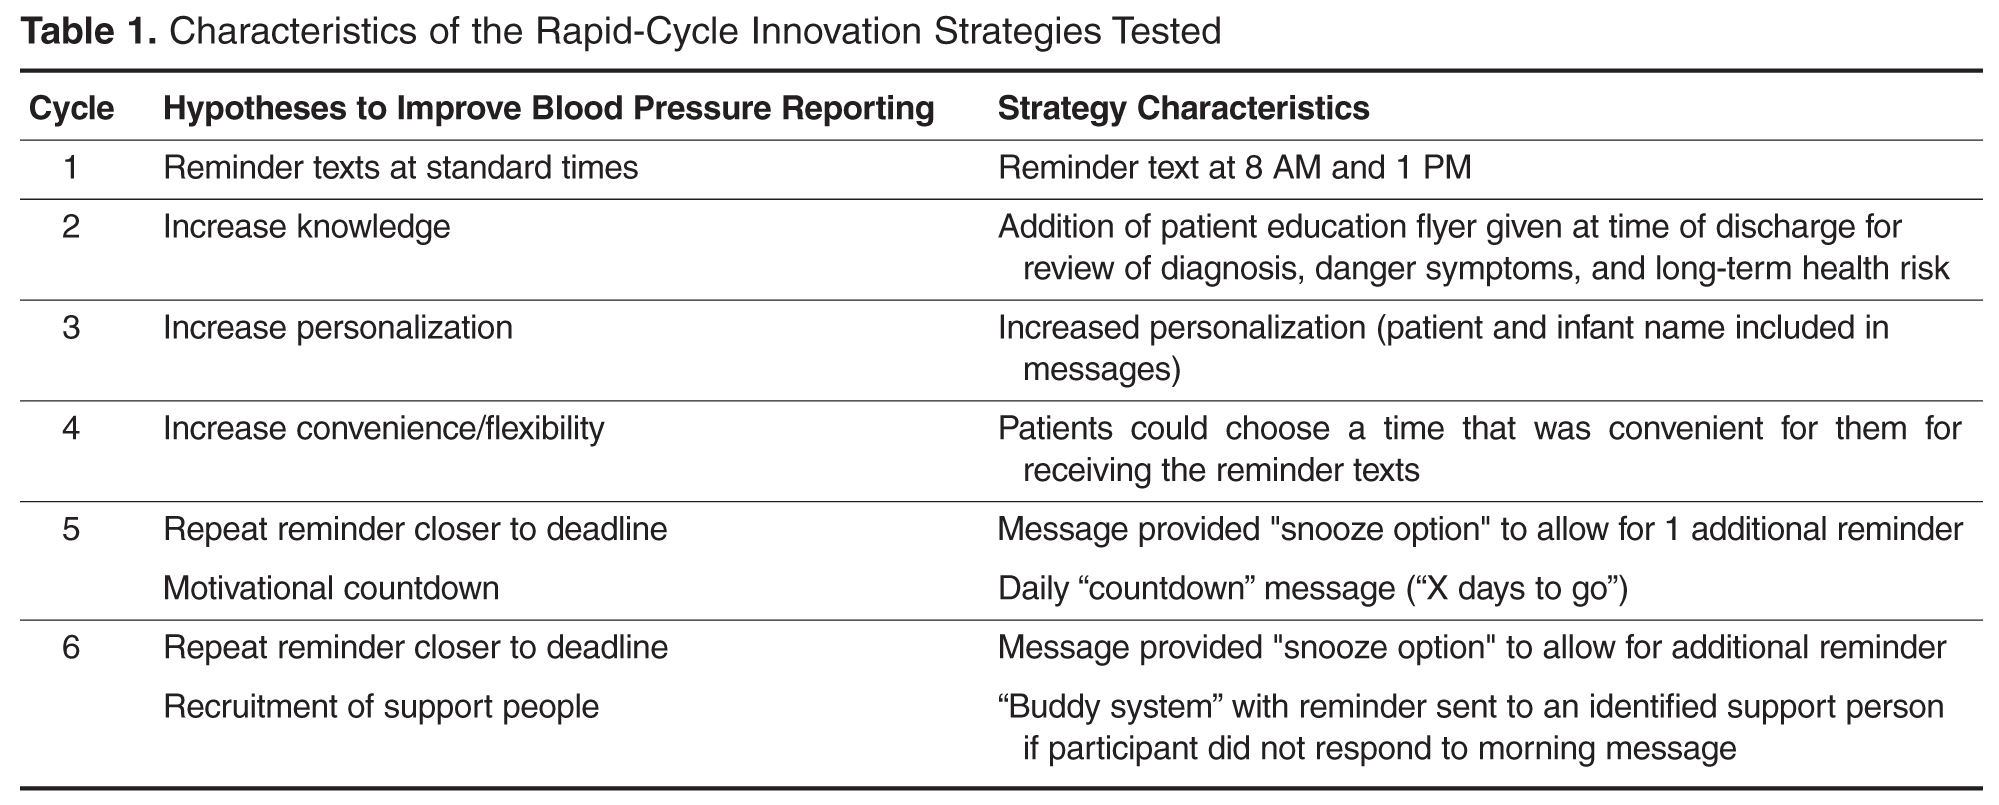
Strategies to enhance patient engagement were modified based on patient interviews and results from the immediately preceding cycle (for example, Cycle 1 interview information and results were used to make changes in Cycle 2), as well as studies on telemonitoring adherence in other populations [18]. The program ended after 6 cycles, as the study team felt there was sufficient promise to design an expanded platform suitable for a larger study.
Results
Overall
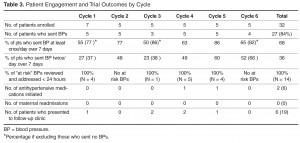
At the patient level, we received at least 1 blood pressure during the requested time frame from 27 of the 32 patients enrolled (84%). Nearly 65% of patients (20/32) texted at least 1 blood pressure reading on at least 5 out of the 7 days enrolled. 
By Cycle
Cycle 1 - Basic
Cycle 1 tested our basic hypothesis that patients would take their blood pressure at home and transmit the results by text message: 5 of 7 patients responded to our reminders, each transmitting blood pressures on at least 5 of the 7 days requested.
Four severe-range blood pressures, defined as systolic blood pressure ≥ 160 mm Hg or diastolic blood pressure ≥ 110 [6], were sent to the physician responder, two times each in 2 patients. All four “at risk” severe blood pressures were addressed within 24 hours of the text message. No medications were initiated, as elevated blood pressures were not persistent and patients were asymptomatic.
Cycle 2 - Education
Patients in Cycle 1 reported during their follow-up interview that they became more aware of the possible morbidity associated with persistent postpartum hypertension as the cycle progressed. Therefore, Cycle 2 tested our hypothesis that focused education would improve patient engagement.
All five patients in this cohort sent in at least one blood pressure during the cycle period. All transmitted at least one blood pressure text on post-discharge day 1 or 2. Four of the five patients (80%) also sent in at least one blood pressure on day 5, 6, or 7.
There were no significantly elevated blood pressures sent to the physician responder.
Cycle 3 - Personalization
Patients in Cycle 2 reported during their interview that they felt the text message responses from the provider were too automated. Cycle 3 tested our hypothesis that added personalization, with patient and infant names included in the messages, would improve engagement.
Three of five patients in this cohort sent at least one blood pressure text on post-discharge day 1 or 2 (60%). Only one patient (20%) also sent in at least one blood pressure on day 5, 6, or 7.
One significantly elevated blood pressure was sent to the physician responder. This blood pressure was addressed within 24 hours of the text message. No medications were initiated, as elevated blood pressures were not persistent and patients were asymptomatic.
Cycle 4 - Response Timing
Patients in Cycle 3 had lower response rates than previous cycles and noted that they wanted more flexibility in the time to respond, as their schedules were unpredictable with a newborn at home. Although they enjoyed the personalized aspect, they did not feel it influenced their responses, which is evidenced by the low response rate on days 5, 6, or 7. Therefore, Cycle 4 tested our hypothesis that allowing patients to commit to a time of their choice for receiving the reminder texts would improve their response rate.
All five patients enrolled in this cohort sent in at least one blood pressure. We received at least one blood pressure text on post-discharge day 1 or 2 from all five patients in this cycle (100%). Three of the five patients (60%) also sent in at least one blood pressure on day 5, 6, or 7.
Five severely elevated blood pressures were sent to the physician responder, all from a single patient. This patient had been discharged home on hydrochlorothiazide 12.5 mg for persistently elevated blood pressures while in the hospital after being diagnosed with severe preeclampsia. All five “at risk” blood pressures were addressed within 24 hours of the text message. On her fifth day of remote surveillance, 5 mg of amlodipine was added to her daily regimen for blood pressures ranging from 150–170/90–110 mm Hg. Her blood pressure at her 6-week postpartum visit was 120/60 mm Hg and she had seen her primary care doctor in the interim for further hypertension management.
Cycle 5 - Snooze and Countdown
Although most of the patients enrolled in Cycle 4 stated that they were very busy in the immediate postpartum period and not always able to respond in a timely fashion, allowing patients to receive the reminder text at their own designated convenient time did not increase engagement. Patients reported that while they always carried their cell phones, they did not always carry their blood pressure cuff, limiting their ability to send in a reading at the time of the reminder. Additionally, patients reported feeling less motivated to continue texting blood pressures towards the end of the cycle. Cycle 5 tested our hypothesis that patient engagement would improve if reminder text messages were sent closer to the morning or evening deadline. Patients were provided with the opportunity to request “snooze” response if they did have their cuff accessible. Additionally, standard responses were accompanied by a countdown message. For example, “Your blood pressure looks good. Four more days of checking your blood pressure to go.”
All five enrolled in this cohort sent in at least one blood pressure, and all (100%) transmitted at least one blood pressure text on post-discharge day 1 or 2 and on day 5, 6, or 7. Only two “snooze” requests were made over the course of the arm by a single patient, who responded both times after the additional reminder.
Four severely elevated blood pressures were sent to the physician responder, all from a single patient. This patient was diagnosed with preeclampsia with severe features on delivery admission, and her blood pressures normalized prior to discharge. All four “at risk” blood pressures were addressed within 24 hours of the text message. Due to persistently elevated diastolic blood pressures ranging from 110–120 mm Hg, she was started on hydrochlorothiazide 12.5 mg on day 6 of the cycle and monitored for additional days following cycle completion with improved blood pressures.
Cycle 6 - Snooze and Support Person
The patients in Cycle 5 were overall satisfied with their experience and did not provide any suggestions for change. However, we sought to see if integrating support persons into the protocol would affect engagement. Cycle 6 tested our hypothesis that patients would be more engaged if they had a self-identified support person reminding them to text their blood pressures. Patients provided the name of a support person to contact if a morning blood pressure was not received. Additionally, patients received the same “snooze” option as in Cycle 5. A total of five patients were enrolled in this cohort; one patient enrolled in the trial but did not send in any blood pressures despite daily reminders to both her and her support buddy. Only 2 additional buddy notifications were required in patients who did not send in a morning blood pressure reading and both times a subsequent blood pressure was sent. Two “snooze” requests were made over the course of the cycle by a single patient, who responded both times after the reminder.
Four of five patients in this cohort sent at least one blood pressure text on post-discharge day 1 or 2 (80%). Three patients (60%) also sent in at least one blood pressure on day 5, 6, or 7.
There were no significantly elevated blood pressures sent to the physician responder and no medications were initiated.
Post-Cycle Interviews
Overall, patients reported satisfaction with the text messaging system in their post-cycle interviews. The convenience of the intervention was acknowledged by many, including one patient who commented that “this was a lot better than having to pay for the bus and waiting for hours in some waiting room.” One patient also reported that the increased awareness was important, stating that “when [she] got home and realized that [her blood pressure] was still high, [she] did her own research and learned more about hypertension and preeclampsia.” Others reported that they still checked their blood pressure after the cycle, and “would have went longer than a week if they had asked me to.”
Discussions
Our results suggest that remote blood pressure monitoring via text message communication engages patients and shows promise as a convenient and effective means of hypertension surveillance in the immediate postpartum period, in accordance to ACOG guidelines. Additionally, we were able to test this monitoring system using inexpensive, rapid-cycle validation techniques. Although these techniques are insufficiently controlled and of inadequate statistical power for definitive results, they were able to provide quick evidence toward a pragmatic and workable solution to an important clinical problem within the specific clinical context of our practice, though the results are likely to generalize to other settings. We found varied compliance based on the different engagement strategies, and although no single cycle proved superior, overall patient participation was good and provides a basis for different texting options in future work. Developing a method that both engages patients and is streamlined for providers is critical to our ability to translate this recommendation into practice. Although we did not specifically test how the system works from a provider’s point of view, the study obstetricians believe that this would help and can be fit within the existing workflows of the practices at most institutions.
This rapid-cycle intervention study provides several additional lessons, as we were able to rapidly implement this on our unit and test several hypotheses related to patient engagement. Most patients found the text messaging system to be a convenient way to communicate with their obstetrician. Even when patients had prenatal care at other institutions and delivered at our hospital without a prior patient/physician relationship (n = 5), we were able to engage them in text messaging. However, there was some evidence of patient drop out over the course of the week, as patients were more likely to text in blood pressure in the first few days of the cycle than the last few days (Figure 2).
Other telemedicine interventions have been studied in maternity care and have had inconsistent results. The Cochrane review on telephone support for women during pregnancy and up to 6 weeks after birth found that interventions were mainly aimed at smoking cessation, breastfeeding continuation, preterm birth, and postpartum depression [19]. To date, none of the randomized trials in pregnancy or the postpartum period have focused on postpartum hypertension. The results of our interventions are encouraging and support the use of text messaging in obstetrical care, particularly in the postpartum period. While text messaging cannot provide all the information that can be obtained in a doctor’s visit, such as physical exam, urine dipsticks, and review of symptoms, it can identify the minority of patients that may need to be seen in the office based on the severity of their blood pressures.
While some cases of postpartum preeclampsia occur in the absence of peripartum disease, most readmitted patients are diagnosed with preeclampsia prior to delivery and readmission is due to worsening or persistence of disease and therefore, potentially preventable. These patients are the primary target of our intervention, as remote hypertension surveillance provides an opportunity to start or adjust medications and minimize both patient inconvenience and hospital cost of a readmission.
However, our feasibility study has some limitations. Despite overall patient satisfaction, acceptability, and compliance with text message monitoring of hypertension, the small sample size and qualitative nature of our cycles merits further pursuit and follow-up studies prior to implementation. Overall, we had only a small number of elevated blood pressures requiring intervention; however, this underscores the need to identify patients most at risk for persistent or delayed hypertension and the importance of developing a method of follow-up that engages all patients. Additionally, as patients were asked to both text in blood pressure values and also present for office visits, and therefore acted as their own control, it is not surprising that more patients were compliant with the simple texting method than standard of care; however, even when comparing texting compliance to historical attendance in our clinic of only 30%, our results remain promising.
While our results are encouraging, we believe it is important to test text messaging surveillance and patient compliance in a larger trial prior to implementing within the broader community. This study provides critical data to support the development of a HIPAA-compliant, automated monitoring system that can provide timely responses to patient texts using a provider derived response to blood pressure values. Future work includes the development of an automated hypertension tool as well as a randomized controlled trial to more rigorously compare office blood pressure visits to remote text message surveillance. If effective, use of text messaging technology may allow for an improved patient partnership and more robust follow-up data, especially in patients with less than optimal compliance, as well as the ability to improve maternal care and decrease morbidity and mortality.
Corresponding author: Adi Hirshberg, MD, Dept. of Maternal-Fetal Medicine, 2 Silverstein, 3400 Spruce St., Philadelphia, PA 19104, adi.hirshberg@uphs.upenn.edu.
Funding/support: Supported by a Penn Medicine Innovation Accelerator grant.
Financial disclosures. None reported.
1. Creanga AA, Berg CJ, Syverson C, et al. Pregnancy-related mortality in the United States, 2006-2010. Obstet Gynecol 2015;125:5–12.
2. Report of the National High Blood Pressure Education Program Working Group on High Blood Pressure in Pregnancy. Am J Obstet Gynecol 2000;183:S1–S22.
3. Muri JH, Crawford N, Jellen BC. Reducing avoidable obstetrical and neonatal readmissions. American Hospital Association. Accessed 20 Sep 2016 at www.aha.org/content/11/PerinatalReadmissionscall1.pdf.
4. Walters BN, Walters T. Hypertension in the puerperium. Lancet 1987;2:330.
5. Sibai BM. Etiology and management of postpartum hypertension-preeclampsia. Am J Obstet Gynecol 2012;206:470–5.
6. Executive summary: Hypertension in pregnancy. American College of Obstetricians and Gynecologists. Obstet Gynecol 2013;122:1122–31.
7. Scalise LF, Stringer M. Follow-up text messages for patients at high risk for postpartum hypertension. J Obstet Gynecol Neonatal Nurs 2015;44:S6.
8. Using health text messages to improve consumer health knowledge, behaviors, and outcomes: an environmental scan. Rockville, MD: U.S. Department of Health and Human Services; 2014.
9. Gurol-Urganci I, de Jongh T, Vodopivec-Jamsek V, et al. Mobile phone messaging reminders for attendance at healthcare appointments. Cochrane Database Syst Rev 2013;5;12:CD007458.
10. Saffari M, Ghanizadeh G, Koenig HG. Health education via mobile text messaging for glycemic control in adults with type 2 diabetes: a systematic review and meta-analysis. Prim Care Diabetes 2014;8:275–85.
11. Tran N, Coffma JM, Sumino K, Cabana MD. Patient reminder systems and asthma medication adherence: a systematic review. J Asthma 2014;51:536–43.
12. Horvath T, Azman H, Kennedy GE, Rutherford GW. Mobile phone text messaging for promoting adherence to antiretroviral therapy in patients with HIV infection. Cochrane Database Syst Rev 2012;3:CD009756.
13. Kannisto KA, Koivunen MF, Valimaki MA. Use of mobile phone text message reminders in health care services: a narrative literature review. J Med Internet Res 2010;16:e222.
14. Pew Research Center. Mobile technology fact sheet. Accessed 17 Dec 2014 at www.pewinternet.org/fact-sheets/mobile-technology-fact-sheet/.
15. Duggan M. Cell phone activities 2013. Pew Research Center’s Internet and American Life Project. Available at www.pewinternet.org/Reports/2013/Cell-Activities.aspx.
16. Langley G, Nolan K, Nolan T, et al. The improvement guide: a practical approach to enhancing organizational performance. San Francisco: Jossey-Bass; 1996.
17. Brown P, Hare D. Rapid cycle improvement: controlling change. J Ark Med Soc 2003;99:320–1.
18. Aikens JE, Trivedi R, Aron DC, Piette JD. Integrating support persons into diabetes telemonitoring to improve self-management and medication adherence. J Gen Intern Med 2015;30:319–26.
19. Lavender T, Richens Y, Milan SJ, et al. Telephone support for women during pregnancy and the first six weeks postpartum. Cochrane Database Syst Rev 2013;7:CD009338.
From the Maternal and Child Health Research Program, Department of Obstetrics and Gynecology, Perelman School of Medicine at the University of Pennsylvania, Philadelphia, PA (Dr. Hirshberg, Dr. Srinivas); Hospital of the University of Pennsylvania, Department of Nursing, Department of Obstetrics and Gynecology, Philadelphia, PA (Ms. Bittle); Penn Medicine Center for Health Care Innovation, Perelman School of Medicine at the University of Pennsylvania, Philadelphia, PA (Mr. Vandertuyn, Ms. Mahraj, Dr. Asch, Mr. Rosin); and the Department of Family Medicine, University of Washington, Seattle, WA (Dr. Bennett).
Abstract
- Objective: To investigate engagement with a bidirectional text messaging system as an alternative to in-person follow-up for postpartum women with hypertensive disorders.
- Methods: We utilized rapid-cycle innovation processes to implement postpartum SMS text messaging follow-up in women with hypertensive disorders who delivered between September–December 2014. Patients were given electronic blood pressure cuffs and education before discharge. Standard texts reminded patients to send blood pressures daily on each of the 7 days post discharge. The study obstetrician sent text message responses based on a pre-specified management algorithm. Ability to meet ACOG guidelines was defined as receiving at least 1 reading on post-discharge days 1 or 2 and days 5, 6, or 7.
- Results: We enrolled 32 patients. Six (19%) returned for usual care office blood pressure checks. We received at least 1 blood pressure from 27 (84%) participants. Nearly 20 (65%) texted readings on 5 of the 7 days. 27 (84%) texted at least one reading on day 1 or 2, and 21 (66%) texted at least one pressure on day 5, 6, or 7 (P = 0.001 vs. usual care). Two patients required medications and none were readmitted for hypertension. Patients reported preference for home testing and text messaging over return visits.
- Conclusion: Remote blood pressure monitoring via text messaging is a patient-centered method for postpartum hypertension surveillance. Further testing is needed prior to widespread adoption within the broader obstetric community.
Key words: postpartum hypertension, remote monitoring, text-based intervention.
Hypertensive disease is a leading cause of maternal morbidity and mortality [1,2] and the leading cause of obstetric readmissions, accounting for 27% of obstetric readmissions in the United States in 2009 [3]. The majority of patients readmitted with hypertension have a diagnosis of hypertensive disorder of pregnancy on initial admission for delivery, indicating that these readmissions are the result of disease persistence or progression in contrast to new-onset disease. Peak blood pressure in these patients usually occurs 3 to 6 days postpartum [4–6] and is typically unaccompanied by warning symptoms. For these reasons, identifying patients who are at risk for persistent disease and being proactive in their postpartum care may decrease postpartum stroke and seizure. The recent Hypertension in Pregnancy guidelines provided by the American College of Obstetricians and Gynecologists (ACOG) recommend monitoring blood pressure for at least 72 hours postpartum (inpatient or outpatient) and again 7 to 10 days after delivery in women in whom a hypertensive disease of pregnancy is diagnosed [6].
Although there is a clear need for effective and reliable blood pressure surveillance for high-risk women soon after delivery, significant obstacles exist. Our own high-risk blood pressure transition clinic, which occurred every other week and was staffed by maternal-fetal medicine specialists, had an average attendance of only 30% over a 2-year period. Moreover, all of the hypertension-related readmissions occurred in the first 7 days post discharge, which was before the scheduled clinic visit for approximately 50% of patients. Phone call reminders were also found to be an ineffective strategy, as the women did not answer or return voice messages left by the practice. In fact, a postpartum unit quality improvement project validated that follow-up phone calls after discharge from the postpartum unit were less effective than text messaging when reminding women of their blood pressure follow-up appointment at the clinic [7].
As an alternative to in-person visits or traditional voice telephonic communication, mobile phone “Short Message Service” (SMS) text messaging has been used successfully in health care for appointment reminders, result reporting, support of medication and treatment adherence, and dosage adjustment [8–13]. As of 2014, 90% of American adults own a cell phone and over 79% of those send and receive text messages [14]. Among a young population, which is at high risk for hypertensive disorders of pregnancy, data further reveals a preference for text messaging over live calls [15]. Among low-income women under age 30, the rates of cell phone use and text communication are very high [14,15], making text-based surveillance a promising and more patient-centered strategy for a broad population.
We report the results of rapid-cycle innovation and implementation of active, remote surveillance of hypertension with new text message communication strategies in the first 7 days post-discharge. We chose a Plan-Do-Study-Act cycle approach, in which small tests are performed and studied and changes made to accelerate improvement, in order to enhance our ability to acquire blood pressure data [16,17]. The goals of the work were to (1) assess patient engagement using a remote method of blood pressure monitoring, (2) increase ascertainment of postpartum blood pressure data and obtain at least once daily blood pressure readings on all patients on post discharge days 1–2 and 5–7, which is in accordance with the recommended guidelines [6] for blood pressure surveillance, and (3) address all “at risk” severe range blood pressure readings within a short time interval and prior to the need for readmission. We describe a program of remote blood pressure monitoring and communication via text message designed to increase patient engagement and participation, thereby having the potential to result in earlier interventions, reduce readmissions, and decrease overall morbidity.
Methods
We performed a series of 6 rapid-cycle innovation devel-opment and implementation interventions with a cohort of women with chronic hypertension (CHTN), gestational hypertension (GHTN), or preeclampsia (with and without severe features and superimposed) who delivered at our institution between 20 September 2014 and 14 December 2014. All patients were > 18 years old, able to speak and read English, had a hypertension diag-nosis listed above, and had access to a cell phone with unlimited text messaging capabilities. Patients received standard postpartum care and were continued or started on antihypertensive medications based on a standardized postpartum hypertension protocol previously developed at our institution (available on request). This project was undertaken as a quality improvement initiative and as such was exempt from formal review by our institutional review board. However, all patients signed a waiver acknowledging that SMS texting is not a secure communications technology. A single research telephone was used for physician-patient communication to further ensure privacy.
Patients who qualified for the intervention study were recruited on the postpartum unit following delivery. Those who agreed to participate were provided with electronic blood pressure monitors (CVS Pharmacy automatic blood pressure monitor and Omron 3 Series upper arm blood pressure monitor) prior to discharge and instructed on their use. Patients were told to expect their first text message reminder to send in their blood pressure the day after discharge; an example of a text reminder is “Good morning. Please send us a blood pressure reading by 12 pm.” Patients were enrolled for 7 days post discharge and were interviewed regarding their experience at the end of their 7-day enrollment. As this was primarily a feasibility and quality improvement study, patients were also instructed to continue to follow up with the standard of care at the hypertension clinic visit.
For each of the 7 days following discharge from the hospital, patients received a standard text message in the morning and afternoon reminding them to text their blood pressure to the research telephone by a specific time. Reported blood pressures were reviewed and a standard response was sent by the study obstetrician based on an algorithm consistent with the institution’s postpartum hypertension protocol. Patients were sent reminders at all time points whether or not they had texted any BPs.
The ACOG Hypertension in Pregnancy guidelines recommend monitoring blood pressure at 72 hours postpartum (inpatient or outpatient) and again 7 to 10 days postpartum in women diagnosed with a hypertensive disorder of pregnancy [6]. We measured our ability to meet these guidelines by identifying how many patients texted blood pressures on post-discharge days 1 or 2 and post-discharge days 5, 6, or 7, as most patients were discharged home on postpartum day 2 or 3.
Strategies to enhance patient engagement were modified based on patient interviews and results from the immediately preceding cycle (for example, Cycle 1 interview information and results were used to make changes in Cycle 2), as well as studies on telemonitoring adherence in other populations [18]. The program ended after 6 cycles, as the study team felt there was sufficient promise to design an expanded platform suitable for a larger study.
Results
Overall
At the patient level, we received at least 1 blood pressure during the requested time frame from 27 of the 32 patients enrolled (84%). Nearly 65% of patients (20/32) texted at least 1 blood pressure reading on at least 5 out of the 7 days enrolled.
By Cycle
Cycle 1 - Basic
Cycle 1 tested our basic hypothesis that patients would take their blood pressure at home and transmit the results by text message: 5 of 7 patients responded to our reminders, each transmitting blood pressures on at least 5 of the 7 days requested.
Four severe-range blood pressures, defined as systolic blood pressure ≥ 160 mm Hg or diastolic blood pressure ≥ 110 [6], were sent to the physician responder, two times each in 2 patients. All four “at risk” severe blood pressures were addressed within 24 hours of the text message. No medications were initiated, as elevated blood pressures were not persistent and patients were asymptomatic.
Cycle 2 - Education
Patients in Cycle 1 reported during their follow-up interview that they became more aware of the possible morbidity associated with persistent postpartum hypertension as the cycle progressed. Therefore, Cycle 2 tested our hypothesis that focused education would improve patient engagement.
All five patients in this cohort sent in at least one blood pressure during the cycle period. All transmitted at least one blood pressure text on post-discharge day 1 or 2. Four of the five patients (80%) also sent in at least one blood pressure on day 5, 6, or 7.
There were no significantly elevated blood pressures sent to the physician responder.
Cycle 3 - Personalization
Patients in Cycle 2 reported during their interview that they felt the text message responses from the provider were too automated. Cycle 3 tested our hypothesis that added personalization, with patient and infant names included in the messages, would improve engagement.
Three of five patients in this cohort sent at least one blood pressure text on post-discharge day 1 or 2 (60%). Only one patient (20%) also sent in at least one blood pressure on day 5, 6, or 7.
One significantly elevated blood pressure was sent to the physician responder. This blood pressure was addressed within 24 hours of the text message. No medications were initiated, as elevated blood pressures were not persistent and patients were asymptomatic.
Cycle 4 - Response Timing
Patients in Cycle 3 had lower response rates than previous cycles and noted that they wanted more flexibility in the time to respond, as their schedules were unpredictable with a newborn at home. Although they enjoyed the personalized aspect, they did not feel it influenced their responses, which is evidenced by the low response rate on days 5, 6, or 7. Therefore, Cycle 4 tested our hypothesis that allowing patients to commit to a time of their choice for receiving the reminder texts would improve their response rate.
All five patients enrolled in this cohort sent in at least one blood pressure. We received at least one blood pressure text on post-discharge day 1 or 2 from all five patients in this cycle (100%). Three of the five patients (60%) also sent in at least one blood pressure on day 5, 6, or 7.
Five severely elevated blood pressures were sent to the physician responder, all from a single patient. This patient had been discharged home on hydrochlorothiazide 12.5 mg for persistently elevated blood pressures while in the hospital after being diagnosed with severe preeclampsia. All five “at risk” blood pressures were addressed within 24 hours of the text message. On her fifth day of remote surveillance, 5 mg of amlodipine was added to her daily regimen for blood pressures ranging from 150–170/90–110 mm Hg. Her blood pressure at her 6-week postpartum visit was 120/60 mm Hg and she had seen her primary care doctor in the interim for further hypertension management.
Cycle 5 - Snooze and Countdown
Although most of the patients enrolled in Cycle 4 stated that they were very busy in the immediate postpartum period and not always able to respond in a timely fashion, allowing patients to receive the reminder text at their own designated convenient time did not increase engagement. Patients reported that while they always carried their cell phones, they did not always carry their blood pressure cuff, limiting their ability to send in a reading at the time of the reminder. Additionally, patients reported feeling less motivated to continue texting blood pressures towards the end of the cycle. Cycle 5 tested our hypothesis that patient engagement would improve if reminder text messages were sent closer to the morning or evening deadline. Patients were provided with the opportunity to request “snooze” response if they did have their cuff accessible. Additionally, standard responses were accompanied by a countdown message. For example, “Your blood pressure looks good. Four more days of checking your blood pressure to go.”
All five enrolled in this cohort sent in at least one blood pressure, and all (100%) transmitted at least one blood pressure text on post-discharge day 1 or 2 and on day 5, 6, or 7. Only two “snooze” requests were made over the course of the arm by a single patient, who responded both times after the additional reminder.
Four severely elevated blood pressures were sent to the physician responder, all from a single patient. This patient was diagnosed with preeclampsia with severe features on delivery admission, and her blood pressures normalized prior to discharge. All four “at risk” blood pressures were addressed within 24 hours of the text message. Due to persistently elevated diastolic blood pressures ranging from 110–120 mm Hg, she was started on hydrochlorothiazide 12.5 mg on day 6 of the cycle and monitored for additional days following cycle completion with improved blood pressures.
Cycle 6 - Snooze and Support Person
The patients in Cycle 5 were overall satisfied with their experience and did not provide any suggestions for change. However, we sought to see if integrating support persons into the protocol would affect engagement. Cycle 6 tested our hypothesis that patients would be more engaged if they had a self-identified support person reminding them to text their blood pressures. Patients provided the name of a support person to contact if a morning blood pressure was not received. Additionally, patients received the same “snooze” option as in Cycle 5. A total of five patients were enrolled in this cohort; one patient enrolled in the trial but did not send in any blood pressures despite daily reminders to both her and her support buddy. Only 2 additional buddy notifications were required in patients who did not send in a morning blood pressure reading and both times a subsequent blood pressure was sent. Two “snooze” requests were made over the course of the cycle by a single patient, who responded both times after the reminder.
Four of five patients in this cohort sent at least one blood pressure text on post-discharge day 1 or 2 (80%). Three patients (60%) also sent in at least one blood pressure on day 5, 6, or 7.
There were no significantly elevated blood pressures sent to the physician responder and no medications were initiated.
Post-Cycle Interviews
Overall, patients reported satisfaction with the text messaging system in their post-cycle interviews. The convenience of the intervention was acknowledged by many, including one patient who commented that “this was a lot better than having to pay for the bus and waiting for hours in some waiting room.” One patient also reported that the increased awareness was important, stating that “when [she] got home and realized that [her blood pressure] was still high, [she] did her own research and learned more about hypertension and preeclampsia.” Others reported that they still checked their blood pressure after the cycle, and “would have went longer than a week if they had asked me to.”
Discussions
Our results suggest that remote blood pressure monitoring via text message communication engages patients and shows promise as a convenient and effective means of hypertension surveillance in the immediate postpartum period, in accordance to ACOG guidelines. Additionally, we were able to test this monitoring system using inexpensive, rapid-cycle validation techniques. Although these techniques are insufficiently controlled and of inadequate statistical power for definitive results, they were able to provide quick evidence toward a pragmatic and workable solution to an important clinical problem within the specific clinical context of our practice, though the results are likely to generalize to other settings. We found varied compliance based on the different engagement strategies, and although no single cycle proved superior, overall patient participation was good and provides a basis for different texting options in future work. Developing a method that both engages patients and is streamlined for providers is critical to our ability to translate this recommendation into practice. Although we did not specifically test how the system works from a provider’s point of view, the study obstetricians believe that this would help and can be fit within the existing workflows of the practices at most institutions.
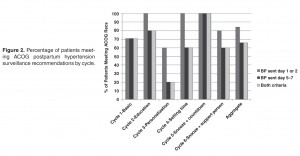
This rapid-cycle intervention study provides several additional lessons, as we were able to rapidly implement this on our unit and test several hypotheses related to patient engagement. Most patients found the text messaging system to be a convenient way to communicate with their obstetrician. Even when patients had prenatal care at other institutions and delivered at our hospital without a prior patient/physician relationship (n = 5), we were able to engage them in text messaging. However, there was some evidence of patient drop out over the course of the week, as patients were more likely to text in blood pressure in the first few days of the cycle than the last few days (Figure 2).
Other telemedicine interventions have been studied in maternity care and have had inconsistent results. The Cochrane review on telephone support for women during pregnancy and up to 6 weeks after birth found that interventions were mainly aimed at smoking cessation, breastfeeding continuation, preterm birth, and postpartum depression [19]. To date, none of the randomized trials in pregnancy or the postpartum period have focused on postpartum hypertension. The results of our interventions are encouraging and support the use of text messaging in obstetrical care, particularly in the postpartum period. While text messaging cannot provide all the information that can be obtained in a doctor’s visit, such as physical exam, urine dipsticks, and review of symptoms, it can identify the minority of patients that may need to be seen in the office based on the severity of their blood pressures.
While some cases of postpartum preeclampsia occur in the absence of peripartum disease, most readmitted patients are diagnosed with preeclampsia prior to delivery and readmission is due to worsening or persistence of disease and therefore, potentially preventable. These patients are the primary target of our intervention, as remote hypertension surveillance provides an opportunity to start or adjust medications and minimize both patient inconvenience and hospital cost of a readmission.
However, our feasibility study has some limitations. Despite overall patient satisfaction, acceptability, and compliance with text message monitoring of hypertension, the small sample size and qualitative nature of our cycles merits further pursuit and follow-up studies prior to implementation. Overall, we had only a small number of elevated blood pressures requiring intervention; however, this underscores the need to identify patients most at risk for persistent or delayed hypertension and the importance of developing a method of follow-up that engages all patients. Additionally, as patients were asked to both text in blood pressure values and also present for office visits, and therefore acted as their own control, it is not surprising that more patients were compliant with the simple texting method than standard of care; however, even when comparing texting compliance to historical attendance in our clinic of only 30%, our results remain promising.
While our results are encouraging, we believe it is important to test text messaging surveillance and patient compliance in a larger trial prior to implementing within the broader community. This study provides critical data to support the development of a HIPAA-compliant, automated monitoring system that can provide timely responses to patient texts using a provider derived response to blood pressure values. Future work includes the development of an automated hypertension tool as well as a randomized controlled trial to more rigorously compare office blood pressure visits to remote text message surveillance. If effective, use of text messaging technology may allow for an improved patient partnership and more robust follow-up data, especially in patients with less than optimal compliance, as well as the ability to improve maternal care and decrease morbidity and mortality.
Corresponding author: Adi Hirshberg, MD, Dept. of Maternal-Fetal Medicine, 2 Silverstein, 3400 Spruce St., Philadelphia, PA 19104, adi.hirshberg@uphs.upenn.edu.
Funding/support: Supported by a Penn Medicine Innovation Accelerator grant.
Financial disclosures. None reported.
From the Maternal and Child Health Research Program, Department of Obstetrics and Gynecology, Perelman School of Medicine at the University of Pennsylvania, Philadelphia, PA (Dr. Hirshberg, Dr. Srinivas); Hospital of the University of Pennsylvania, Department of Nursing, Department of Obstetrics and Gynecology, Philadelphia, PA (Ms. Bittle); Penn Medicine Center for Health Care Innovation, Perelman School of Medicine at the University of Pennsylvania, Philadelphia, PA (Mr. Vandertuyn, Ms. Mahraj, Dr. Asch, Mr. Rosin); and the Department of Family Medicine, University of Washington, Seattle, WA (Dr. Bennett).
Abstract
- Objective: To investigate engagement with a bidirectional text messaging system as an alternative to in-person follow-up for postpartum women with hypertensive disorders.
- Methods: We utilized rapid-cycle innovation processes to implement postpartum SMS text messaging follow-up in women with hypertensive disorders who delivered between September–December 2014. Patients were given electronic blood pressure cuffs and education before discharge. Standard texts reminded patients to send blood pressures daily on each of the 7 days post discharge. The study obstetrician sent text message responses based on a pre-specified management algorithm. Ability to meet ACOG guidelines was defined as receiving at least 1 reading on post-discharge days 1 or 2 and days 5, 6, or 7.
- Results: We enrolled 32 patients. Six (19%) returned for usual care office blood pressure checks. We received at least 1 blood pressure from 27 (84%) participants. Nearly 20 (65%) texted readings on 5 of the 7 days. 27 (84%) texted at least one reading on day 1 or 2, and 21 (66%) texted at least one pressure on day 5, 6, or 7 (P = 0.001 vs. usual care). Two patients required medications and none were readmitted for hypertension. Patients reported preference for home testing and text messaging over return visits.
- Conclusion: Remote blood pressure monitoring via text messaging is a patient-centered method for postpartum hypertension surveillance. Further testing is needed prior to widespread adoption within the broader obstetric community.
Key words: postpartum hypertension, remote monitoring, text-based intervention.
Hypertensive disease is a leading cause of maternal morbidity and mortality [1,2] and the leading cause of obstetric readmissions, accounting for 27% of obstetric readmissions in the United States in 2009 [3]. The majority of patients readmitted with hypertension have a diagnosis of hypertensive disorder of pregnancy on initial admission for delivery, indicating that these readmissions are the result of disease persistence or progression in contrast to new-onset disease. Peak blood pressure in these patients usually occurs 3 to 6 days postpartum [4–6] and is typically unaccompanied by warning symptoms. For these reasons, identifying patients who are at risk for persistent disease and being proactive in their postpartum care may decrease postpartum stroke and seizure. The recent Hypertension in Pregnancy guidelines provided by the American College of Obstetricians and Gynecologists (ACOG) recommend monitoring blood pressure for at least 72 hours postpartum (inpatient or outpatient) and again 7 to 10 days after delivery in women in whom a hypertensive disease of pregnancy is diagnosed [6].
Although there is a clear need for effective and reliable blood pressure surveillance for high-risk women soon after delivery, significant obstacles exist. Our own high-risk blood pressure transition clinic, which occurred every other week and was staffed by maternal-fetal medicine specialists, had an average attendance of only 30% over a 2-year period. Moreover, all of the hypertension-related readmissions occurred in the first 7 days post discharge, which was before the scheduled clinic visit for approximately 50% of patients. Phone call reminders were also found to be an ineffective strategy, as the women did not answer or return voice messages left by the practice. In fact, a postpartum unit quality improvement project validated that follow-up phone calls after discharge from the postpartum unit were less effective than text messaging when reminding women of their blood pressure follow-up appointment at the clinic [7].
As an alternative to in-person visits or traditional voice telephonic communication, mobile phone “Short Message Service” (SMS) text messaging has been used successfully in health care for appointment reminders, result reporting, support of medication and treatment adherence, and dosage adjustment [8–13]. As of 2014, 90% of American adults own a cell phone and over 79% of those send and receive text messages [14]. Among a young population, which is at high risk for hypertensive disorders of pregnancy, data further reveals a preference for text messaging over live calls [15]. Among low-income women under age 30, the rates of cell phone use and text communication are very high [14,15], making text-based surveillance a promising and more patient-centered strategy for a broad population.
We report the results of rapid-cycle innovation and implementation of active, remote surveillance of hypertension with new text message communication strategies in the first 7 days post-discharge. We chose a Plan-Do-Study-Act cycle approach, in which small tests are performed and studied and changes made to accelerate improvement, in order to enhance our ability to acquire blood pressure data [16,17]. The goals of the work were to (1) assess patient engagement using a remote method of blood pressure monitoring, (2) increase ascertainment of postpartum blood pressure data and obtain at least once daily blood pressure readings on all patients on post discharge days 1–2 and 5–7, which is in accordance with the recommended guidelines [6] for blood pressure surveillance, and (3) address all “at risk” severe range blood pressure readings within a short time interval and prior to the need for readmission. We describe a program of remote blood pressure monitoring and communication via text message designed to increase patient engagement and participation, thereby having the potential to result in earlier interventions, reduce readmissions, and decrease overall morbidity.
Methods
We performed a series of 6 rapid-cycle innovation devel-opment and implementation interventions with a cohort of women with chronic hypertension (CHTN), gestational hypertension (GHTN), or preeclampsia (with and without severe features and superimposed) who delivered at our institution between 20 September 2014 and 14 December 2014. All patients were > 18 years old, able to speak and read English, had a hypertension diag-nosis listed above, and had access to a cell phone with unlimited text messaging capabilities. Patients received standard postpartum care and were continued or started on antihypertensive medications based on a standardized postpartum hypertension protocol previously developed at our institution (available on request). This project was undertaken as a quality improvement initiative and as such was exempt from formal review by our institutional review board. However, all patients signed a waiver acknowledging that SMS texting is not a secure communications technology. A single research telephone was used for physician-patient communication to further ensure privacy.
Patients who qualified for the intervention study were recruited on the postpartum unit following delivery. Those who agreed to participate were provided with electronic blood pressure monitors (CVS Pharmacy automatic blood pressure monitor and Omron 3 Series upper arm blood pressure monitor) prior to discharge and instructed on their use. Patients were told to expect their first text message reminder to send in their blood pressure the day after discharge; an example of a text reminder is “Good morning. Please send us a blood pressure reading by 12 pm.” Patients were enrolled for 7 days post discharge and were interviewed regarding their experience at the end of their 7-day enrollment. As this was primarily a feasibility and quality improvement study, patients were also instructed to continue to follow up with the standard of care at the hypertension clinic visit.
For each of the 7 days following discharge from the hospital, patients received a standard text message in the morning and afternoon reminding them to text their blood pressure to the research telephone by a specific time. Reported blood pressures were reviewed and a standard response was sent by the study obstetrician based on an algorithm consistent with the institution’s postpartum hypertension protocol. Patients were sent reminders at all time points whether or not they had texted any BPs.
The ACOG Hypertension in Pregnancy guidelines recommend monitoring blood pressure at 72 hours postpartum (inpatient or outpatient) and again 7 to 10 days postpartum in women diagnosed with a hypertensive disorder of pregnancy [6]. We measured our ability to meet these guidelines by identifying how many patients texted blood pressures on post-discharge days 1 or 2 and post-discharge days 5, 6, or 7, as most patients were discharged home on postpartum day 2 or 3.
Strategies to enhance patient engagement were modified based on patient interviews and results from the immediately preceding cycle (for example, Cycle 1 interview information and results were used to make changes in Cycle 2), as well as studies on telemonitoring adherence in other populations [18]. The program ended after 6 cycles, as the study team felt there was sufficient promise to design an expanded platform suitable for a larger study.
Results
Overall
At the patient level, we received at least 1 blood pressure during the requested time frame from 27 of the 32 patients enrolled (84%). Nearly 65% of patients (20/32) texted at least 1 blood pressure reading on at least 5 out of the 7 days enrolled.
By Cycle
Cycle 1 - Basic
Cycle 1 tested our basic hypothesis that patients would take their blood pressure at home and transmit the results by text message: 5 of 7 patients responded to our reminders, each transmitting blood pressures on at least 5 of the 7 days requested.
Four severe-range blood pressures, defined as systolic blood pressure ≥ 160 mm Hg or diastolic blood pressure ≥ 110 [6], were sent to the physician responder, two times each in 2 patients. All four “at risk” severe blood pressures were addressed within 24 hours of the text message. No medications were initiated, as elevated blood pressures were not persistent and patients were asymptomatic.
Cycle 2 - Education
Patients in Cycle 1 reported during their follow-up interview that they became more aware of the possible morbidity associated with persistent postpartum hypertension as the cycle progressed. Therefore, Cycle 2 tested our hypothesis that focused education would improve patient engagement.
All five patients in this cohort sent in at least one blood pressure during the cycle period. All transmitted at least one blood pressure text on post-discharge day 1 or 2. Four of the five patients (80%) also sent in at least one blood pressure on day 5, 6, or 7.
There were no significantly elevated blood pressures sent to the physician responder.
Cycle 3 - Personalization
Patients in Cycle 2 reported during their interview that they felt the text message responses from the provider were too automated. Cycle 3 tested our hypothesis that added personalization, with patient and infant names included in the messages, would improve engagement.
Three of five patients in this cohort sent at least one blood pressure text on post-discharge day 1 or 2 (60%). Only one patient (20%) also sent in at least one blood pressure on day 5, 6, or 7.
One significantly elevated blood pressure was sent to the physician responder. This blood pressure was addressed within 24 hours of the text message. No medications were initiated, as elevated blood pressures were not persistent and patients were asymptomatic.
Cycle 4 - Response Timing
Patients in Cycle 3 had lower response rates than previous cycles and noted that they wanted more flexibility in the time to respond, as their schedules were unpredictable with a newborn at home. Although they enjoyed the personalized aspect, they did not feel it influenced their responses, which is evidenced by the low response rate on days 5, 6, or 7. Therefore, Cycle 4 tested our hypothesis that allowing patients to commit to a time of their choice for receiving the reminder texts would improve their response rate.
All five patients enrolled in this cohort sent in at least one blood pressure. We received at least one blood pressure text on post-discharge day 1 or 2 from all five patients in this cycle (100%). Three of the five patients (60%) also sent in at least one blood pressure on day 5, 6, or 7.
Five severely elevated blood pressures were sent to the physician responder, all from a single patient. This patient had been discharged home on hydrochlorothiazide 12.5 mg for persistently elevated blood pressures while in the hospital after being diagnosed with severe preeclampsia. All five “at risk” blood pressures were addressed within 24 hours of the text message. On her fifth day of remote surveillance, 5 mg of amlodipine was added to her daily regimen for blood pressures ranging from 150–170/90–110 mm Hg. Her blood pressure at her 6-week postpartum visit was 120/60 mm Hg and she had seen her primary care doctor in the interim for further hypertension management.
Cycle 5 - Snooze and Countdown
Although most of the patients enrolled in Cycle 4 stated that they were very busy in the immediate postpartum period and not always able to respond in a timely fashion, allowing patients to receive the reminder text at their own designated convenient time did not increase engagement. Patients reported that while they always carried their cell phones, they did not always carry their blood pressure cuff, limiting their ability to send in a reading at the time of the reminder. Additionally, patients reported feeling less motivated to continue texting blood pressures towards the end of the cycle. Cycle 5 tested our hypothesis that patient engagement would improve if reminder text messages were sent closer to the morning or evening deadline. Patients were provided with the opportunity to request “snooze” response if they did have their cuff accessible. Additionally, standard responses were accompanied by a countdown message. For example, “Your blood pressure looks good. Four more days of checking your blood pressure to go.”
All five enrolled in this cohort sent in at least one blood pressure, and all (100%) transmitted at least one blood pressure text on post-discharge day 1 or 2 and on day 5, 6, or 7. Only two “snooze” requests were made over the course of the arm by a single patient, who responded both times after the additional reminder.
Four severely elevated blood pressures were sent to the physician responder, all from a single patient. This patient was diagnosed with preeclampsia with severe features on delivery admission, and her blood pressures normalized prior to discharge. All four “at risk” blood pressures were addressed within 24 hours of the text message. Due to persistently elevated diastolic blood pressures ranging from 110–120 mm Hg, she was started on hydrochlorothiazide 12.5 mg on day 6 of the cycle and monitored for additional days following cycle completion with improved blood pressures.
Cycle 6 - Snooze and Support Person
The patients in Cycle 5 were overall satisfied with their experience and did not provide any suggestions for change. However, we sought to see if integrating support persons into the protocol would affect engagement. Cycle 6 tested our hypothesis that patients would be more engaged if they had a self-identified support person reminding them to text their blood pressures. Patients provided the name of a support person to contact if a morning blood pressure was not received. Additionally, patients received the same “snooze” option as in Cycle 5. A total of five patients were enrolled in this cohort; one patient enrolled in the trial but did not send in any blood pressures despite daily reminders to both her and her support buddy. Only 2 additional buddy notifications were required in patients who did not send in a morning blood pressure reading and both times a subsequent blood pressure was sent. Two “snooze” requests were made over the course of the cycle by a single patient, who responded both times after the reminder.
Four of five patients in this cohort sent at least one blood pressure text on post-discharge day 1 or 2 (80%). Three patients (60%) also sent in at least one blood pressure on day 5, 6, or 7.
There were no significantly elevated blood pressures sent to the physician responder and no medications were initiated.
Post-Cycle Interviews
Overall, patients reported satisfaction with the text messaging system in their post-cycle interviews. The convenience of the intervention was acknowledged by many, including one patient who commented that “this was a lot better than having to pay for the bus and waiting for hours in some waiting room.” One patient also reported that the increased awareness was important, stating that “when [she] got home and realized that [her blood pressure] was still high, [she] did her own research and learned more about hypertension and preeclampsia.” Others reported that they still checked their blood pressure after the cycle, and “would have went longer than a week if they had asked me to.”
Discussions
Our results suggest that remote blood pressure monitoring via text message communication engages patients and shows promise as a convenient and effective means of hypertension surveillance in the immediate postpartum period, in accordance to ACOG guidelines. Additionally, we were able to test this monitoring system using inexpensive, rapid-cycle validation techniques. Although these techniques are insufficiently controlled and of inadequate statistical power for definitive results, they were able to provide quick evidence toward a pragmatic and workable solution to an important clinical problem within the specific clinical context of our practice, though the results are likely to generalize to other settings. We found varied compliance based on the different engagement strategies, and although no single cycle proved superior, overall patient participation was good and provides a basis for different texting options in future work. Developing a method that both engages patients and is streamlined for providers is critical to our ability to translate this recommendation into practice. Although we did not specifically test how the system works from a provider’s point of view, the study obstetricians believe that this would help and can be fit within the existing workflows of the practices at most institutions.
This rapid-cycle intervention study provides several additional lessons, as we were able to rapidly implement this on our unit and test several hypotheses related to patient engagement. Most patients found the text messaging system to be a convenient way to communicate with their obstetrician. Even when patients had prenatal care at other institutions and delivered at our hospital without a prior patient/physician relationship (n = 5), we were able to engage them in text messaging. However, there was some evidence of patient drop out over the course of the week, as patients were more likely to text in blood pressure in the first few days of the cycle than the last few days (Figure 2).
Other telemedicine interventions have been studied in maternity care and have had inconsistent results. The Cochrane review on telephone support for women during pregnancy and up to 6 weeks after birth found that interventions were mainly aimed at smoking cessation, breastfeeding continuation, preterm birth, and postpartum depression [19]. To date, none of the randomized trials in pregnancy or the postpartum period have focused on postpartum hypertension. The results of our interventions are encouraging and support the use of text messaging in obstetrical care, particularly in the postpartum period. While text messaging cannot provide all the information that can be obtained in a doctor’s visit, such as physical exam, urine dipsticks, and review of symptoms, it can identify the minority of patients that may need to be seen in the office based on the severity of their blood pressures.
While some cases of postpartum preeclampsia occur in the absence of peripartum disease, most readmitted patients are diagnosed with preeclampsia prior to delivery and readmission is due to worsening or persistence of disease and therefore, potentially preventable. These patients are the primary target of our intervention, as remote hypertension surveillance provides an opportunity to start or adjust medications and minimize both patient inconvenience and hospital cost of a readmission.
However, our feasibility study has some limitations. Despite overall patient satisfaction, acceptability, and compliance with text message monitoring of hypertension, the small sample size and qualitative nature of our cycles merits further pursuit and follow-up studies prior to implementation. Overall, we had only a small number of elevated blood pressures requiring intervention; however, this underscores the need to identify patients most at risk for persistent or delayed hypertension and the importance of developing a method of follow-up that engages all patients. Additionally, as patients were asked to both text in blood pressure values and also present for office visits, and therefore acted as their own control, it is not surprising that more patients were compliant with the simple texting method than standard of care; however, even when comparing texting compliance to historical attendance in our clinic of only 30%, our results remain promising.
While our results are encouraging, we believe it is important to test text messaging surveillance and patient compliance in a larger trial prior to implementing within the broader community. This study provides critical data to support the development of a HIPAA-compliant, automated monitoring system that can provide timely responses to patient texts using a provider derived response to blood pressure values. Future work includes the development of an automated hypertension tool as well as a randomized controlled trial to more rigorously compare office blood pressure visits to remote text message surveillance. If effective, use of text messaging technology may allow for an improved patient partnership and more robust follow-up data, especially in patients with less than optimal compliance, as well as the ability to improve maternal care and decrease morbidity and mortality.
Corresponding author: Adi Hirshberg, MD, Dept. of Maternal-Fetal Medicine, 2 Silverstein, 3400 Spruce St., Philadelphia, PA 19104, adi.hirshberg@uphs.upenn.edu.
Funding/support: Supported by a Penn Medicine Innovation Accelerator grant.
Financial disclosures. None reported.
1. Creanga AA, Berg CJ, Syverson C, et al. Pregnancy-related mortality in the United States, 2006-2010. Obstet Gynecol 2015;125:5–12.
2. Report of the National High Blood Pressure Education Program Working Group on High Blood Pressure in Pregnancy. Am J Obstet Gynecol 2000;183:S1–S22.
3. Muri JH, Crawford N, Jellen BC. Reducing avoidable obstetrical and neonatal readmissions. American Hospital Association. Accessed 20 Sep 2016 at www.aha.org/content/11/PerinatalReadmissionscall1.pdf.
4. Walters BN, Walters T. Hypertension in the puerperium. Lancet 1987;2:330.
5. Sibai BM. Etiology and management of postpartum hypertension-preeclampsia. Am J Obstet Gynecol 2012;206:470–5.
6. Executive summary: Hypertension in pregnancy. American College of Obstetricians and Gynecologists. Obstet Gynecol 2013;122:1122–31.
7. Scalise LF, Stringer M. Follow-up text messages for patients at high risk for postpartum hypertension. J Obstet Gynecol Neonatal Nurs 2015;44:S6.
8. Using health text messages to improve consumer health knowledge, behaviors, and outcomes: an environmental scan. Rockville, MD: U.S. Department of Health and Human Services; 2014.
9. Gurol-Urganci I, de Jongh T, Vodopivec-Jamsek V, et al. Mobile phone messaging reminders for attendance at healthcare appointments. Cochrane Database Syst Rev 2013;5;12:CD007458.
10. Saffari M, Ghanizadeh G, Koenig HG. Health education via mobile text messaging for glycemic control in adults with type 2 diabetes: a systematic review and meta-analysis. Prim Care Diabetes 2014;8:275–85.
11. Tran N, Coffma JM, Sumino K, Cabana MD. Patient reminder systems and asthma medication adherence: a systematic review. J Asthma 2014;51:536–43.
12. Horvath T, Azman H, Kennedy GE, Rutherford GW. Mobile phone text messaging for promoting adherence to antiretroviral therapy in patients with HIV infection. Cochrane Database Syst Rev 2012;3:CD009756.
13. Kannisto KA, Koivunen MF, Valimaki MA. Use of mobile phone text message reminders in health care services: a narrative literature review. J Med Internet Res 2010;16:e222.
14. Pew Research Center. Mobile technology fact sheet. Accessed 17 Dec 2014 at www.pewinternet.org/fact-sheets/mobile-technology-fact-sheet/.
15. Duggan M. Cell phone activities 2013. Pew Research Center’s Internet and American Life Project. Available at www.pewinternet.org/Reports/2013/Cell-Activities.aspx.
16. Langley G, Nolan K, Nolan T, et al. The improvement guide: a practical approach to enhancing organizational performance. San Francisco: Jossey-Bass; 1996.
17. Brown P, Hare D. Rapid cycle improvement: controlling change. J Ark Med Soc 2003;99:320–1.
18. Aikens JE, Trivedi R, Aron DC, Piette JD. Integrating support persons into diabetes telemonitoring to improve self-management and medication adherence. J Gen Intern Med 2015;30:319–26.
19. Lavender T, Richens Y, Milan SJ, et al. Telephone support for women during pregnancy and the first six weeks postpartum. Cochrane Database Syst Rev 2013;7:CD009338.
Musculoskeletal Hand Pain Group Visits: An Adaptive Health Care Model
From Cooper Medical School of Rowan University (Dr. Patel, Dr. Fuller) and Cooper University Hospital (Dr. Kaufman), Camden, NJ.
Abstract
- Objective: To describe an adaptive musculoskeletal hand clinic that offers accessible and economically viable musculoskeletal care for an underserved, urban population.
- Methods: Descriptive report.
- Results: An enhanced access group visit model was developed offering both nonsurgical and surgical care pathways for patients with musculoskeletal disorders of the hand. Both patient education and care were provided in the group environment. Staffing included an orthopedic surgeon, nurse practitioner, medical student, orthopedic technician, and medical assistant. Over a 12-month period, group visit efficiency improved to accommodate an equivalent number of patients as compared to the traditional model. Access (time to appointment) was improved in the group visit. The model allows for the addition of non-physician clinical staff to improve access and limit costs in a manner not feasible with traditional office visits.
- Conclusion: A group visit model may offer a sustainable process to increase patient access to musculoskeletal subspecialty care and accommodate care of greater numbers of patients while maintaining quality. The group model offers flexible staffing, enhanced access, and educational benefit.
Key words: Group medical visit, team-based care, hand pain, access, underserved populations.
Group visits are a relatively new health care delivery model [1–3]. The term is applied to a wide variety of visits designed for groups of patients, rather than individual patient-provider appointments. The group visit format has been used for various disease- or condition-specific populations. Group visits can increase access to care and have been associated with improved clinical outcomes [4].
The Urban Health Institute, a dedicated business unit at Cooper University Health System in Camden, NJ, was established to focus on care of the underserved. The business unit is working to reduce cost of care delivery, increase access, and improve quality through the use of workflow redesign, task shifting, dashboards, and other methods. With a large startup grant from the Nicholson Foundation, the Urban Health Institute launched the Cooper Advanced Care Center to provide the local under-served population with access to a collaborative practice of 23 medical and surgical specialties under one roof. The center incorporates traditional one-on-one provider visits with innovative models of care, including group visits. Multiple partners were required in the group visit design and implementation starting with buy-in from Cooper Health System’s leadership for existing space to be redesigned for the group visit activities.
The Cooper Advanced Care Center, which had high no-show rates of 30% to 40%, and low reimbursement for a primarily Medicaid and self-pay population, initially operated at a financial loss. Meanwhile, most physicians had extended lag time until their next available appointment. In a traditional patient–physician office visit, additional physician time is required to increase access to care. This costly solution is often not financially viable. Group visits were considered as a means of using an interdisciplinary team to increase access while controlling or decreasing the per-visit cost.
Musculoskeletal medicine was identified as an area of need in part due to limited access to care. Patients were waiting more than 2 months to see a musculoskeletal specialist and were being scheduled beyond capacity in our existing traditional weekly hand and knee/sports medicine clinics. Within musculoskeletal medicine, 4 areas of musculoskeletal medicine were considered for group visits: back pain, knee pain, hand pain, and foot and ankle disorders. The decision was made to focus the subspecialty musculoskeletal clinic on disorders of the hand and wrist to provide nonsurgical and surgical care options for atraumatic and traumatic disorders of the hand in a teaching environment at an urban hospital. The purpose of this article is to discuss the design and implementation of a hand pain group visit model to increase access to care without increasing cost.
Setting and Patients
Camden City, New Jersey, is a medically underserved, resource-poor community. The population is 48% African American and 47% Hispanic and nearly 40% of individuals live below the poverty level [5]. The group visit was intentionally set up as a means to provide access to the un- or underinsured. Patients attending the group visits were 33% African American, 33% Hispanic, and 30% Caucasian. Most patients had Medicaid insurance (67%) with the remaining patients covered by commercial insurance (15%), dual Medicare/Medicaid (11%), Medicare (5%), or self pay (2%).
Group Visit Staffing and Structure
In a traditional office visit, used nearly ubiquitously in outpatient medical offices, patients arrive at individual appointment times for a prescribed time encounter with the physician, are registered and roomed by support staff, and are then seen by a clinician for diagnosis and treatment. While assistants and trainees participate in the patient’s care with attending physician supervision, the majority of direct care falls to the physician. Access is coupled to physician availability; increasing access to care requires crowding the schedule with additional patients. We used this model as the benchmark for volume and scheduling against which to compare the group visit.
The group visit staffing was the same as for the traditional visit: hand surgeon, nurse practitioner, orthopedic technician, medical student, and medical assistant. However, each clinical session consists of four 1-hour, consecutive group visits scheduled once a month on a Monday morning. Up to 10 people could be scheduled for each 1-hour group visit. We continued to offer our traditional office visit clinic on the other 3 Mondays in the month.
The hand surgeon begins the group visit with a 10-minute educational session and group discussion held in a meeting room. He reviews common disorders of the hand, including carpal tunnel syndrome, trigger fingers, hand arthritis, cysts, sprains and fractures, how they are treated, and risks and benefits of treatments. Patients sign a confidentiality agreement at check-in. Time is allowed for questions and experiential sharing is encouraged. Expectations are set at the start of the visit to honor each patient’s input to provide a safe environment for asking questions and expressing concerns about their shared health condition to enhance the learning experience [6]. A medical assistant enters the chief complaint using an electronic standardized questionnaire into the EMR along with basic vital signs for each patient either prior to, during, or after the group presentation.
After the group educational session with the surgeon, patients transition to a large, open clinical room with 6 separate workstations, each consisting of a small table with 4 chairs and a laptop computer. Small procedures can be performed on the table (suture removal, dressing changes, injections) and the table is appropriately sized to accommodate a care provider, the patient, and their support person(s). Tables are spaced comfortably such that conversations do not carry much from one to the other. The clinical space has white noise speakers for sound dampening while patients receive individual history, vital signs, physical examination, and review of relevant studies. Patients may see the clinicians in a private exam room if they wish or require.
In a traditional office setting, workflow through the major tasks (check-in, data gathering, diagnosis, treatment) is often linear, as dictated by the configuration of individual patient rooms and the patient’s expectations of a traditional doctor’s visit. In the group visit, major tasks are performed simultaneously by the advance practice providers (nurse practitioners, physician assistants) in conjunction with supervision of the attending physician. The workstations (tables, chairs, laptops) in the open clinical room allows for greater efficiency; providers can easily transition to other tasks from one workstation to another during time that may have been spent waiting for other team members in the more linear, traditional clinic. For example, while waiting for the attending physician’s approval of a diagnosis and treatment plan for one patient, a nurse practitioner may be able to begin assessing and gathering data with a second patient until the physician becomes available.
Scheduling and Access
A primary aim of the group visit pilot was to develop a model of care delivery that allowed scheduling beyond capacity for the traditional office hand clinic. At the inception of the group visit, all patients were offered a visit in either the traditional office or group visit model by our scheduling secretaries based upon availability, with emphasis on scheduling a defined underserved population into the group visit.
In traditional 1:1 appointments, the number of people who can access care is dependent on physician availability. The team-based model uncouples the number of scheduled patients from the physician availability, allowing increased efficiency in the model and/or additional staff to increase the number of patients the group visit can accommodate. Thus, patients were essentially guaranteed an appointment in the next clinic because there was no cap on the number of patients that could be scheduled into the group visit. If the number of patients exceeded the limit of 10 per hour, a non-physician clinician was added to accommodate the patient demand. As our group visit matures, the ability to increase the staffing model enables patients to get care without adding more physician time.
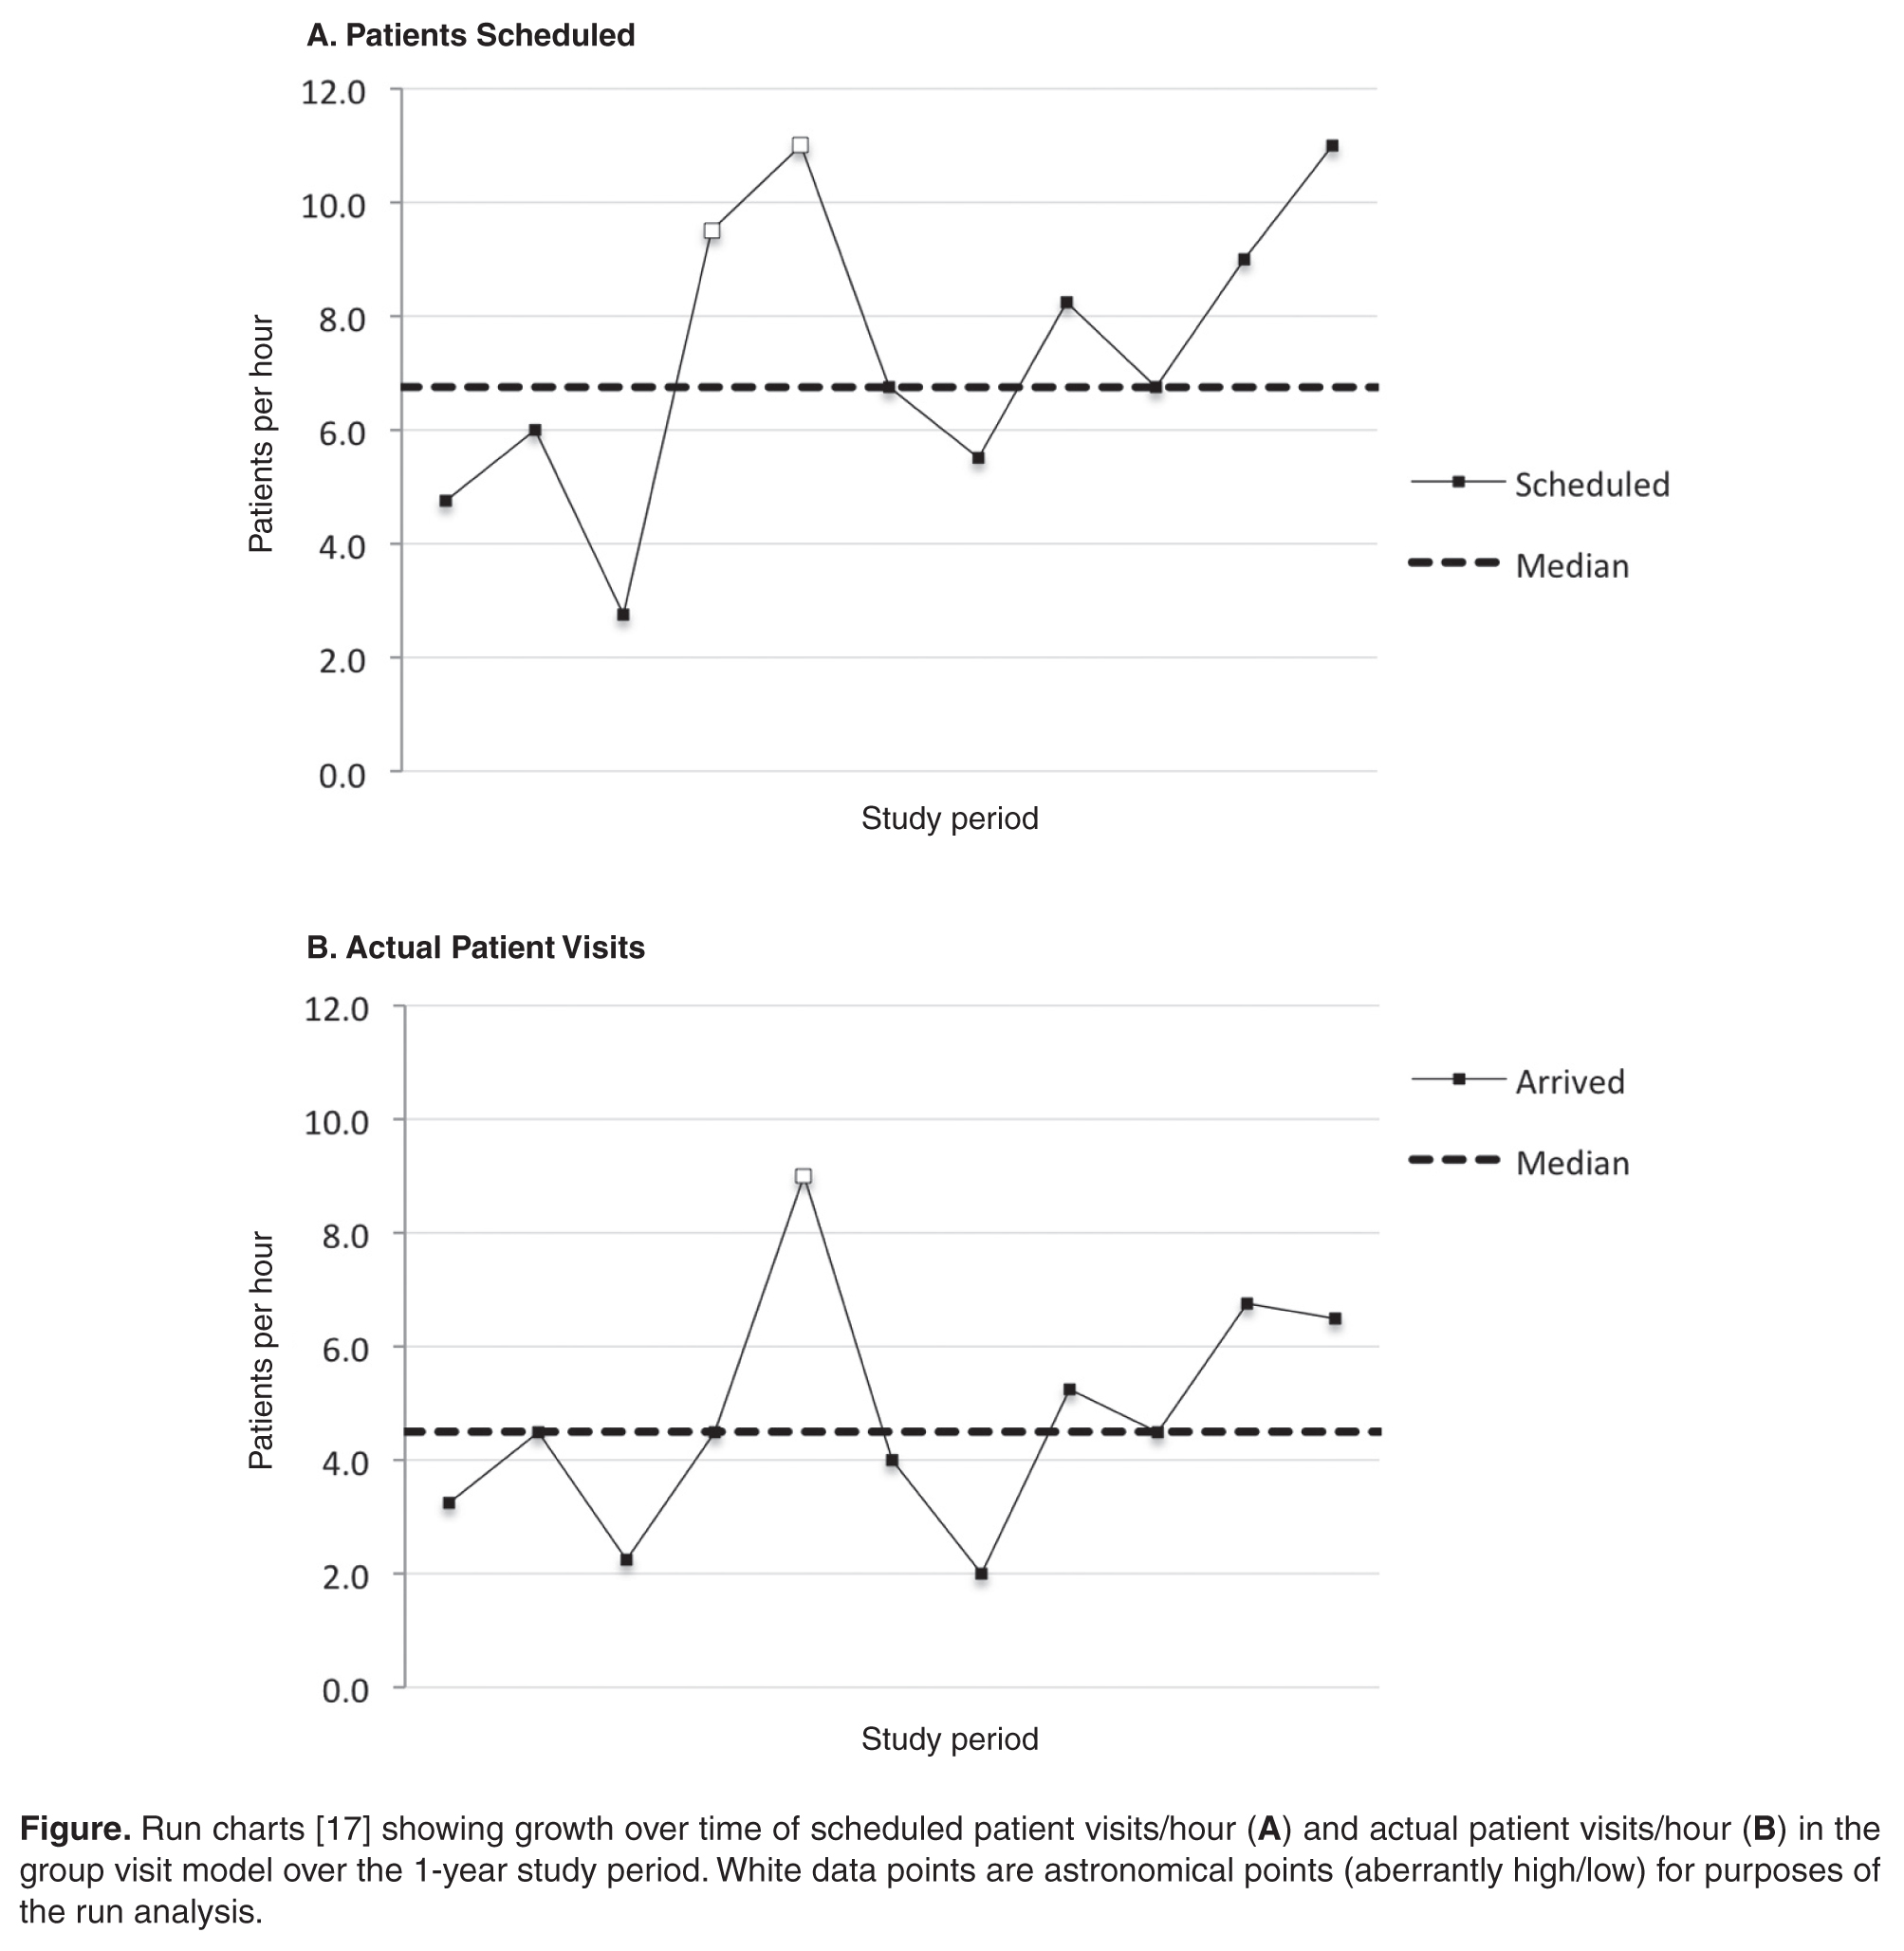
Task Shifting
A central pillar of making the group visit a sustainable model for more accessible care is shifting tasks to non-physician health care workers. Adding specialist time enhances access but drives up the cost of care. Non-physician clinical staff members in subspecialty orthopedic offices with experience diagnosing and treating common conditions are capable of providing the standard of care for those conditions with variable physician oversight [7].
In the group visit, there is a deliberate assignment of patients to clinical staff by the physician based on anticipated level of care required. Given the attending physician’s experience with the most common disorders related to hand pain, it is possible to anticipate the approximate complexity of care required for each patient based on the nature and duration of the presenting complaint. With some degree of clinical supervision by the physician, members of the team operate maximally independently to assist patients. The nurse practitioner can operate largely autonomously in the group visit. The overall goal is to encourage all team members to function at the top of their licenses and abilities. Task shifting in this manner increases the productivity of all members of the team and minimizes redundancy. Despite more autonomy of mid-level providers and support staff in the group visit, there is still direct supervision of care by the attending physician.
The current body of literature in task shifting to non-physician health care workers has mostly concerned low-income countries with marked physician and provider shortages [8]. However, given the increased patient volume already seen with the Affordable Care Act and further expected increases, the health care system is likely to see provider shortages, especially in primary care [9–11]. This will necessitate the adoption of strategies to increase access, maintain quality care, and decrease systemic cost. Task shifting provides one such strategy.
Patient Satisfaction
One concern with shifting clinical duties to non-physician clinical staff is patient satisfaction. An abbreviated interaction with physicians can make patients dissatisfied with medical care independent of eventual clinical outcome [12]. However, it has also been demonstrated in an outpatient hand surgery clinic that quality of time spent with the physician may have a greater impact on satisfaction than quantity of time [13].
Our group visit is structured to allow high physician-patient visibility and interaction. The introductory remarks by the physician engage patients with the physician early in the visit and establish a group and individual rapport. The physician introduces the clinical team and the idea of patients being seen by other clinical staff up front, which establishes comfort for later patient–staff interaction. This is also an important time for patient education, which has been shown as a significant determinant of patient satisfaction in the outpatient setting [14]. The patient education at the beginning of the visit answers questions by one person that another person may not have considered, and generates patient questions to be addressed individually with a clinician. One common example is when a person considering carpal tunnel surgery hears from a person who has recently completed the procedure and can talk about their operative experience.
In the group room, the physician and staff can move between patients quickly and efficiently without waiting for turnover of rooms and resources. The structure of the visit allows staff to dedicate more time to patient care by bypassing the extra time required when patients are roomed individually. The group/communal structure also allows patients to see the staff at work, as compared to time spent waiting alone in an exam room in the traditional office. This enables patients to appreciate the efforts of the clinical staff and avoids giving the impression that the physician is inattentive or cursory in patient interaction.
Medical Education
An important consideration at any academic medical center is education. However, education often introduces redundancies and inefficiency into the medical care visit. The work a trainee does is either extensively overseen or the clinical questions are repeated by a supervising provider. However, it is possible to increase efficiency and utility of trainees in the group visit setting while maintaining educational value.
Given the relatively narrow scope and the nature of conditions encountered in the hand clinic, medical decision making for many patients is limited to a “straightforward” or “low complexity” level. These designations assume a limited number of diagnoses, management options, and amount and complexity of diagnostic workup. Most importantly, risk of complications or morbidity/mortality at these levels is minimal to low. For these conditions, a supervising physician can allow a trainee more independence to practice employing simple treatment and management guidelines and progress to working independently when addressing simpler conditions as the trainee’s experience grows. As independence grows, trainees can build confidence in medical management as well as focus on other core educational competencies once they are comfortable with the evaluation and management of a limited scope of conditions. Conditions such as trigger fingers, hand arthritis, ganglion cysts, and carpal tunnel are those the trainee is likely to encounter in a primary care practice. While there may be a decrease in direct physician teaching, the trainee gains clinical autonomy and experience in educational core competencies such as patient communication, patient education, systems-based practice, procedural skill, cultural competency, and interdisciplinary teamwork [15,16].
Lessons Learned
The success of the group visit required buy-in from hospital and physician leadership, the clinical team, and multiple partners in the hospital system. The hospital administration supported group visits as an integral component of the Urban Health Institute. Buy-in from key hospital leadership ensured resources and dedicated space for the group visit program. Grant support allowed additional programmatic support to acquire the necessary assistance from information services, EMR support, legal, and marketing. Physician buy-in was the most significant piece to the success of an individual group visit. Accepting the movement away from physician autonomy to team-based care is challenging for many providers. Physician willingness to start a high-demand group visit, recognition of the start-up inefficiencies, and working with the administrative and clinical team on program improvement strategies has succeeded in launching a sustaining group visit model.
Conclusion
There is a need for an adaptive and economically viable model of patient care to meet increasing demand, as well as provide care for indigent populations in a way that is more economically sustainable than providing care through the emergency department. The development and implementation of an urban hand group visit at our institution has demonstrated that such a model, based on group visit models more commonly seen in primary care, can be effectively implemented in a subspecialty care setting. This model is capable of increasing patient access to care and effectively handling increased patient volume with room for cost-effective growth in the future, all while maintaining quality of care. We anticipate further subspecialty clinics within hand pain to emerge, such as a group visit dedicated specifically to carpal tunnel syndrome or hand arthritis. This will allow each group to be more focused and will streamline education and mutual support among the patients.
Corresponding author: Steven Kaufman, MD, 3 Cooper Plaza, Suite 211, Camden, NJ 08103, kaufman-steven@cooperhealth.edu.
Funding/support: The Nicholson Foundation.
Financial disclosures: None reported.
1. Gardiner P, Dresner D, Barnett KG, et al. Medical group visits: a feasibility study to manage patients with chronic pain in an underserved urban clinic. Glob Adv Health Med 2014;3:20–6.
2. Remick RA, Remick AK. Do patients really prefer individual outpatient follow-up visits, compared with group medical visits?. Can J Psychiatry 2014;59:50–3.
3. Thompson C, Meeuwisse I, Dahlke R, Drummond N. Group medical visits in primary care for patients with diabetes and low socioeconomic status: users’ perspectives and lessons for practitioners. Can J Diabetes 2014;38:198–204.
4. Eisenstat S, Lipps SA, Carlson K, Ulman K. Putting group visits into practice: a practical overview to preparation, implementation, and maintenance of group visits at Massachusetts General Hospital. Women’s Health Associates, The John D. Stoeckle Center for Primary Care Innovation, Massachusetts General Hospital; January 2012.
5. U.S. Census Bureau. State and city Quickfacts: Camden (city), New Jersey. Accessed 29 Sep 2015 at http://quickfacts.census.gov/qfd/states/34/3410000.html.
6. Slocum YS. A survey of expectations about group therapy among clinical and nonclinical populations. Int J Group Psychother 1987;37:39–54.
7. Newhouse RP, Stanik-hutt J, White KM, et al. Advanced practice nurse outcomes 1990-2008: a systematic review. Nurs Econ 2011;29:230–50.
8. Joshi R, Alim M, Kengne AP, et al. Task shifting for non-communicable disease management in low and middle income countries--a systematic review. PLoS ONE 2014;9:e103754.
9. Hofer AN, Abraham JM, Moscovice I. Expansion of coverage under the Patient Protection and Affordable Care Act and primary care utilization. Milbank Q 2011;89:69–89.
10. Kushnir T, Greenberg D, Madjar N, et al. Is burnout associated with referral rates among primary care physicians in community clinics?. Fam Pract 2014;31:44–50.
11. Calfee RP, Shah CM, Canham CD, et al. The influence of insurance status on access to and utilization of a tertiary hand surgery referral center. J Bone Joint Surg Am 2012;94:2177–84.
12. Lin CT, Albertson GA, Schilling LM, et al. Is patients’ perception of time spent with the physician a determinant of ambulatory patient satisfaction?. Arch Intern Med 2001;161:1437–42.
13. Teunis T, Thornton ER, Jayakumar P, Ring D. Time seeing a hand surgeon is not associated with patient satisfaction. Clin Orthop Relat Res 2014.
14. Murdock A, Griffin B. How is patient education linked to patient satisfaction?. Nursing 2013;43:43–5.
15. Accreditation Council for Graduate Medical Education. Common program requirements. Approved 2014. Available at www.acgme.org/Portals/0/PFAssets/ProgramRequirements/CPRs_07012016.pdf.
16. Liaison Committee on Medical Education. Functions and structure of a medical school: standards for accreditation of medical education programs leading to the M.D. degree. [updated June 2013]. Available at www.lcme.org/publications/functions.pdf.
17. Perla RJ, Provost LP, Murray SK. The run chart: a simple analytical tool for learning from variation in healthcare processes. BMJ Qual Saf 2011;20:46–51.
From Cooper Medical School of Rowan University (Dr. Patel, Dr. Fuller) and Cooper University Hospital (Dr. Kaufman), Camden, NJ.
Abstract
- Objective: To describe an adaptive musculoskeletal hand clinic that offers accessible and economically viable musculoskeletal care for an underserved, urban population.
- Methods: Descriptive report.
- Results: An enhanced access group visit model was developed offering both nonsurgical and surgical care pathways for patients with musculoskeletal disorders of the hand. Both patient education and care were provided in the group environment. Staffing included an orthopedic surgeon, nurse practitioner, medical student, orthopedic technician, and medical assistant. Over a 12-month period, group visit efficiency improved to accommodate an equivalent number of patients as compared to the traditional model. Access (time to appointment) was improved in the group visit. The model allows for the addition of non-physician clinical staff to improve access and limit costs in a manner not feasible with traditional office visits.
- Conclusion: A group visit model may offer a sustainable process to increase patient access to musculoskeletal subspecialty care and accommodate care of greater numbers of patients while maintaining quality. The group model offers flexible staffing, enhanced access, and educational benefit.
Key words: Group medical visit, team-based care, hand pain, access, underserved populations.
Group visits are a relatively new health care delivery model [1–3]. The term is applied to a wide variety of visits designed for groups of patients, rather than individual patient-provider appointments. The group visit format has been used for various disease- or condition-specific populations. Group visits can increase access to care and have been associated with improved clinical outcomes [4].
The Urban Health Institute, a dedicated business unit at Cooper University Health System in Camden, NJ, was established to focus on care of the underserved. The business unit is working to reduce cost of care delivery, increase access, and improve quality through the use of workflow redesign, task shifting, dashboards, and other methods. With a large startup grant from the Nicholson Foundation, the Urban Health Institute launched the Cooper Advanced Care Center to provide the local under-served population with access to a collaborative practice of 23 medical and surgical specialties under one roof. The center incorporates traditional one-on-one provider visits with innovative models of care, including group visits. Multiple partners were required in the group visit design and implementation starting with buy-in from Cooper Health System’s leadership for existing space to be redesigned for the group visit activities.
The Cooper Advanced Care Center, which had high no-show rates of 30% to 40%, and low reimbursement for a primarily Medicaid and self-pay population, initially operated at a financial loss. Meanwhile, most physicians had extended lag time until their next available appointment. In a traditional patient–physician office visit, additional physician time is required to increase access to care. This costly solution is often not financially viable. Group visits were considered as a means of using an interdisciplinary team to increase access while controlling or decreasing the per-visit cost.
Musculoskeletal medicine was identified as an area of need in part due to limited access to care. Patients were waiting more than 2 months to see a musculoskeletal specialist and were being scheduled beyond capacity in our existing traditional weekly hand and knee/sports medicine clinics. Within musculoskeletal medicine, 4 areas of musculoskeletal medicine were considered for group visits: back pain, knee pain, hand pain, and foot and ankle disorders. The decision was made to focus the subspecialty musculoskeletal clinic on disorders of the hand and wrist to provide nonsurgical and surgical care options for atraumatic and traumatic disorders of the hand in a teaching environment at an urban hospital. The purpose of this article is to discuss the design and implementation of a hand pain group visit model to increase access to care without increasing cost.
Setting and Patients
Camden City, New Jersey, is a medically underserved, resource-poor community. The population is 48% African American and 47% Hispanic and nearly 40% of individuals live below the poverty level [5]. The group visit was intentionally set up as a means to provide access to the un- or underinsured. Patients attending the group visits were 33% African American, 33% Hispanic, and 30% Caucasian. Most patients had Medicaid insurance (67%) with the remaining patients covered by commercial insurance (15%), dual Medicare/Medicaid (11%), Medicare (5%), or self pay (2%).
Group Visit Staffing and Structure
In a traditional office visit, used nearly ubiquitously in outpatient medical offices, patients arrive at individual appointment times for a prescribed time encounter with the physician, are registered and roomed by support staff, and are then seen by a clinician for diagnosis and treatment. While assistants and trainees participate in the patient’s care with attending physician supervision, the majority of direct care falls to the physician. Access is coupled to physician availability; increasing access to care requires crowding the schedule with additional patients. We used this model as the benchmark for volume and scheduling against which to compare the group visit.
The group visit staffing was the same as for the traditional visit: hand surgeon, nurse practitioner, orthopedic technician, medical student, and medical assistant. However, each clinical session consists of four 1-hour, consecutive group visits scheduled once a month on a Monday morning. Up to 10 people could be scheduled for each 1-hour group visit. We continued to offer our traditional office visit clinic on the other 3 Mondays in the month.
The hand surgeon begins the group visit with a 10-minute educational session and group discussion held in a meeting room. He reviews common disorders of the hand, including carpal tunnel syndrome, trigger fingers, hand arthritis, cysts, sprains and fractures, how they are treated, and risks and benefits of treatments. Patients sign a confidentiality agreement at check-in. Time is allowed for questions and experiential sharing is encouraged. Expectations are set at the start of the visit to honor each patient’s input to provide a safe environment for asking questions and expressing concerns about their shared health condition to enhance the learning experience [6]. A medical assistant enters the chief complaint using an electronic standardized questionnaire into the EMR along with basic vital signs for each patient either prior to, during, or after the group presentation.
After the group educational session with the surgeon, patients transition to a large, open clinical room with 6 separate workstations, each consisting of a small table with 4 chairs and a laptop computer. Small procedures can be performed on the table (suture removal, dressing changes, injections) and the table is appropriately sized to accommodate a care provider, the patient, and their support person(s). Tables are spaced comfortably such that conversations do not carry much from one to the other. The clinical space has white noise speakers for sound dampening while patients receive individual history, vital signs, physical examination, and review of relevant studies. Patients may see the clinicians in a private exam room if they wish or require.
In a traditional office setting, workflow through the major tasks (check-in, data gathering, diagnosis, treatment) is often linear, as dictated by the configuration of individual patient rooms and the patient’s expectations of a traditional doctor’s visit. In the group visit, major tasks are performed simultaneously by the advance practice providers (nurse practitioners, physician assistants) in conjunction with supervision of the attending physician. The workstations (tables, chairs, laptops) in the open clinical room allows for greater efficiency; providers can easily transition to other tasks from one workstation to another during time that may have been spent waiting for other team members in the more linear, traditional clinic. For example, while waiting for the attending physician’s approval of a diagnosis and treatment plan for one patient, a nurse practitioner may be able to begin assessing and gathering data with a second patient until the physician becomes available.
Scheduling and Access
A primary aim of the group visit pilot was to develop a model of care delivery that allowed scheduling beyond capacity for the traditional office hand clinic. At the inception of the group visit, all patients were offered a visit in either the traditional office or group visit model by our scheduling secretaries based upon availability, with emphasis on scheduling a defined underserved population into the group visit.
In traditional 1:1 appointments, the number of people who can access care is dependent on physician availability. The team-based model uncouples the number of scheduled patients from the physician availability, allowing increased efficiency in the model and/or additional staff to increase the number of patients the group visit can accommodate. Thus, patients were essentially guaranteed an appointment in the next clinic because there was no cap on the number of patients that could be scheduled into the group visit. If the number of patients exceeded the limit of 10 per hour, a non-physician clinician was added to accommodate the patient demand. As our group visit matures, the ability to increase the staffing model enables patients to get care without adding more physician time.
Task Shifting
A central pillar of making the group visit a sustainable model for more accessible care is shifting tasks to non-physician health care workers. Adding specialist time enhances access but drives up the cost of care. Non-physician clinical staff members in subspecialty orthopedic offices with experience diagnosing and treating common conditions are capable of providing the standard of care for those conditions with variable physician oversight [7].
In the group visit, there is a deliberate assignment of patients to clinical staff by the physician based on anticipated level of care required. Given the attending physician’s experience with the most common disorders related to hand pain, it is possible to anticipate the approximate complexity of care required for each patient based on the nature and duration of the presenting complaint. With some degree of clinical supervision by the physician, members of the team operate maximally independently to assist patients. The nurse practitioner can operate largely autonomously in the group visit. The overall goal is to encourage all team members to function at the top of their licenses and abilities. Task shifting in this manner increases the productivity of all members of the team and minimizes redundancy. Despite more autonomy of mid-level providers and support staff in the group visit, there is still direct supervision of care by the attending physician.
The current body of literature in task shifting to non-physician health care workers has mostly concerned low-income countries with marked physician and provider shortages [8]. However, given the increased patient volume already seen with the Affordable Care Act and further expected increases, the health care system is likely to see provider shortages, especially in primary care [9–11]. This will necessitate the adoption of strategies to increase access, maintain quality care, and decrease systemic cost. Task shifting provides one such strategy.
Patient Satisfaction
One concern with shifting clinical duties to non-physician clinical staff is patient satisfaction. An abbreviated interaction with physicians can make patients dissatisfied with medical care independent of eventual clinical outcome [12]. However, it has also been demonstrated in an outpatient hand surgery clinic that quality of time spent with the physician may have a greater impact on satisfaction than quantity of time [13].
Our group visit is structured to allow high physician-patient visibility and interaction. The introductory remarks by the physician engage patients with the physician early in the visit and establish a group and individual rapport. The physician introduces the clinical team and the idea of patients being seen by other clinical staff up front, which establishes comfort for later patient–staff interaction. This is also an important time for patient education, which has been shown as a significant determinant of patient satisfaction in the outpatient setting [14]. The patient education at the beginning of the visit answers questions by one person that another person may not have considered, and generates patient questions to be addressed individually with a clinician. One common example is when a person considering carpal tunnel surgery hears from a person who has recently completed the procedure and can talk about their operative experience.
In the group room, the physician and staff can move between patients quickly and efficiently without waiting for turnover of rooms and resources. The structure of the visit allows staff to dedicate more time to patient care by bypassing the extra time required when patients are roomed individually. The group/communal structure also allows patients to see the staff at work, as compared to time spent waiting alone in an exam room in the traditional office. This enables patients to appreciate the efforts of the clinical staff and avoids giving the impression that the physician is inattentive or cursory in patient interaction.
Medical Education
An important consideration at any academic medical center is education. However, education often introduces redundancies and inefficiency into the medical care visit. The work a trainee does is either extensively overseen or the clinical questions are repeated by a supervising provider. However, it is possible to increase efficiency and utility of trainees in the group visit setting while maintaining educational value.
Given the relatively narrow scope and the nature of conditions encountered in the hand clinic, medical decision making for many patients is limited to a “straightforward” or “low complexity” level. These designations assume a limited number of diagnoses, management options, and amount and complexity of diagnostic workup. Most importantly, risk of complications or morbidity/mortality at these levels is minimal to low. For these conditions, a supervising physician can allow a trainee more independence to practice employing simple treatment and management guidelines and progress to working independently when addressing simpler conditions as the trainee’s experience grows. As independence grows, trainees can build confidence in medical management as well as focus on other core educational competencies once they are comfortable with the evaluation and management of a limited scope of conditions. Conditions such as trigger fingers, hand arthritis, ganglion cysts, and carpal tunnel are those the trainee is likely to encounter in a primary care practice. While there may be a decrease in direct physician teaching, the trainee gains clinical autonomy and experience in educational core competencies such as patient communication, patient education, systems-based practice, procedural skill, cultural competency, and interdisciplinary teamwork [15,16].
Lessons Learned
The success of the group visit required buy-in from hospital and physician leadership, the clinical team, and multiple partners in the hospital system. The hospital administration supported group visits as an integral component of the Urban Health Institute. Buy-in from key hospital leadership ensured resources and dedicated space for the group visit program. Grant support allowed additional programmatic support to acquire the necessary assistance from information services, EMR support, legal, and marketing. Physician buy-in was the most significant piece to the success of an individual group visit. Accepting the movement away from physician autonomy to team-based care is challenging for many providers. Physician willingness to start a high-demand group visit, recognition of the start-up inefficiencies, and working with the administrative and clinical team on program improvement strategies has succeeded in launching a sustaining group visit model.
Conclusion
There is a need for an adaptive and economically viable model of patient care to meet increasing demand, as well as provide care for indigent populations in a way that is more economically sustainable than providing care through the emergency department. The development and implementation of an urban hand group visit at our institution has demonstrated that such a model, based on group visit models more commonly seen in primary care, can be effectively implemented in a subspecialty care setting. This model is capable of increasing patient access to care and effectively handling increased patient volume with room for cost-effective growth in the future, all while maintaining quality of care. We anticipate further subspecialty clinics within hand pain to emerge, such as a group visit dedicated specifically to carpal tunnel syndrome or hand arthritis. This will allow each group to be more focused and will streamline education and mutual support among the patients.
Corresponding author: Steven Kaufman, MD, 3 Cooper Plaza, Suite 211, Camden, NJ 08103, kaufman-steven@cooperhealth.edu.
Funding/support: The Nicholson Foundation.
Financial disclosures: None reported.
1. Gardiner P, Dresner D, Barnett KG, et al. Medical group visits: a feasibility study to manage patients with chronic pain in an underserved urban clinic. Glob Adv Health Med 2014;3:20–6.
2. Remick RA, Remick AK. Do patients really prefer individual outpatient follow-up visits, compared with group medical visits?. Can J Psychiatry 2014;59:50–3.
3. Thompson C, Meeuwisse I, Dahlke R, Drummond N. Group medical visits in primary care for patients with diabetes and low socioeconomic status: users’ perspectives and lessons for practitioners. Can J Diabetes 2014;38:198–204.
4. Eisenstat S, Lipps SA, Carlson K, Ulman K. Putting group visits into practice: a practical overview to preparation, implementation, and maintenance of group visits at Massachusetts General Hospital. Women’s Health Associates, The John D. Stoeckle Center for Primary Care Innovation, Massachusetts General Hospital; January 2012.
5. U.S. Census Bureau. State and city Quickfacts: Camden (city), New Jersey. Accessed 29 Sep 2015 at http://quickfacts.census.gov/qfd/states/34/3410000.html.
6. Slocum YS. A survey of expectations about group therapy among clinical and nonclinical populations. Int J Group Psychother 1987;37:39–54.
7. Newhouse RP, Stanik-hutt J, White KM, et al. Advanced practice nurse outcomes 1990-2008: a systematic review. Nurs Econ 2011;29:230–50.
8. Joshi R, Alim M, Kengne AP, et al. Task shifting for non-communicable disease management in low and middle income countries--a systematic review. PLoS ONE 2014;9:e103754.
9. Hofer AN, Abraham JM, Moscovice I. Expansion of coverage under the Patient Protection and Affordable Care Act and primary care utilization. Milbank Q 2011;89:69–89.
10. Kushnir T, Greenberg D, Madjar N, et al. Is burnout associated with referral rates among primary care physicians in community clinics?. Fam Pract 2014;31:44–50.
11. Calfee RP, Shah CM, Canham CD, et al. The influence of insurance status on access to and utilization of a tertiary hand surgery referral center. J Bone Joint Surg Am 2012;94:2177–84.
12. Lin CT, Albertson GA, Schilling LM, et al. Is patients’ perception of time spent with the physician a determinant of ambulatory patient satisfaction?. Arch Intern Med 2001;161:1437–42.
13. Teunis T, Thornton ER, Jayakumar P, Ring D. Time seeing a hand surgeon is not associated with patient satisfaction. Clin Orthop Relat Res 2014.
14. Murdock A, Griffin B. How is patient education linked to patient satisfaction?. Nursing 2013;43:43–5.
15. Accreditation Council for Graduate Medical Education. Common program requirements. Approved 2014. Available at www.acgme.org/Portals/0/PFAssets/ProgramRequirements/CPRs_07012016.pdf.
16. Liaison Committee on Medical Education. Functions and structure of a medical school: standards for accreditation of medical education programs leading to the M.D. degree. [updated June 2013]. Available at www.lcme.org/publications/functions.pdf.
17. Perla RJ, Provost LP, Murray SK. The run chart: a simple analytical tool for learning from variation in healthcare processes. BMJ Qual Saf 2011;20:46–51.
Preventing Wrong-Patient Electronic Orders in the Emergency Department
From SBH Health System, Bronx, NY.
Abstract
- Objective: To decrease the number of near-miss wrong-patient orders in a computerized physician order entry (CPOE) system.
- Methods: A CPOE alert was built that prompted the ordering clinician to reaffirm the identity of the patient by entering the patient’s initials and year of birth prior to placing an order. We used a retract and reorder tool to measure the frequency of near-miss wrong-patient order errors before and after implementation of the alert.
- Results: The ID reentry function decreased near-miss wrong-patient orders in the ED by 35% during the 8-week pilot period. The system was also successful in helping to decrease the percentage of all CPOE near-miss events by 49%.
- Conclusion: An alert that requires the prescriber to enter the patient’s initials and birth year is effective in decreasing wrong-patient orders in the CPOE system.
Key words: CPOE, near miss, patient safety, medical errors, wrong-patient errors.
Computerized provider order entry (CPOE) systems are commonly used to place orders. CPOE has been shown to reduce errors [1–4]. However, medication errors also can be caused or exacerbated by the CPOE system [5–7]. One type of error that can occur is placing orders on the wrong patient [8]. Wrong-patient CPOE errors can lead to significant morbidity and mortality [8–11]. To reduce wrong-patient CPOE errors in our health system, we developed an alert that required the ordering clinician to verify the identity of the patient. In this paper, we describe our project and outcomes attained.
Methods
Setting
SBH Health System is a not for profit health system located in Bronx, New York. The SBH Health System also has academic affiliations, and AOA and ACGME residency and fellowship programs. St. Barnabas Hospital, SBH Health System’s acute care facility, is a safety net hospital, Level 1 trauma center, primary stroke center, and STEMI receiving center. St. Barnabas Hospital has 422 licensed beds and had a total of 91,476 emergency department visits in 2015. The electronic health record in use at the time of the project was Allscripts 6.1. The Allscripts product, including its CPOE functions, has been in use in the SBH emergency department (ED) since 2011.
Review of Current Process
A team of multidisciplinary stakeholders was assembled comprised of hospital senior leadership, ED leadership, and front-line staff. Representatives from all disciplines involved in the CPOE process were invited, including nursing, pharmacy, radiology, clinical laboratory, and information technology.
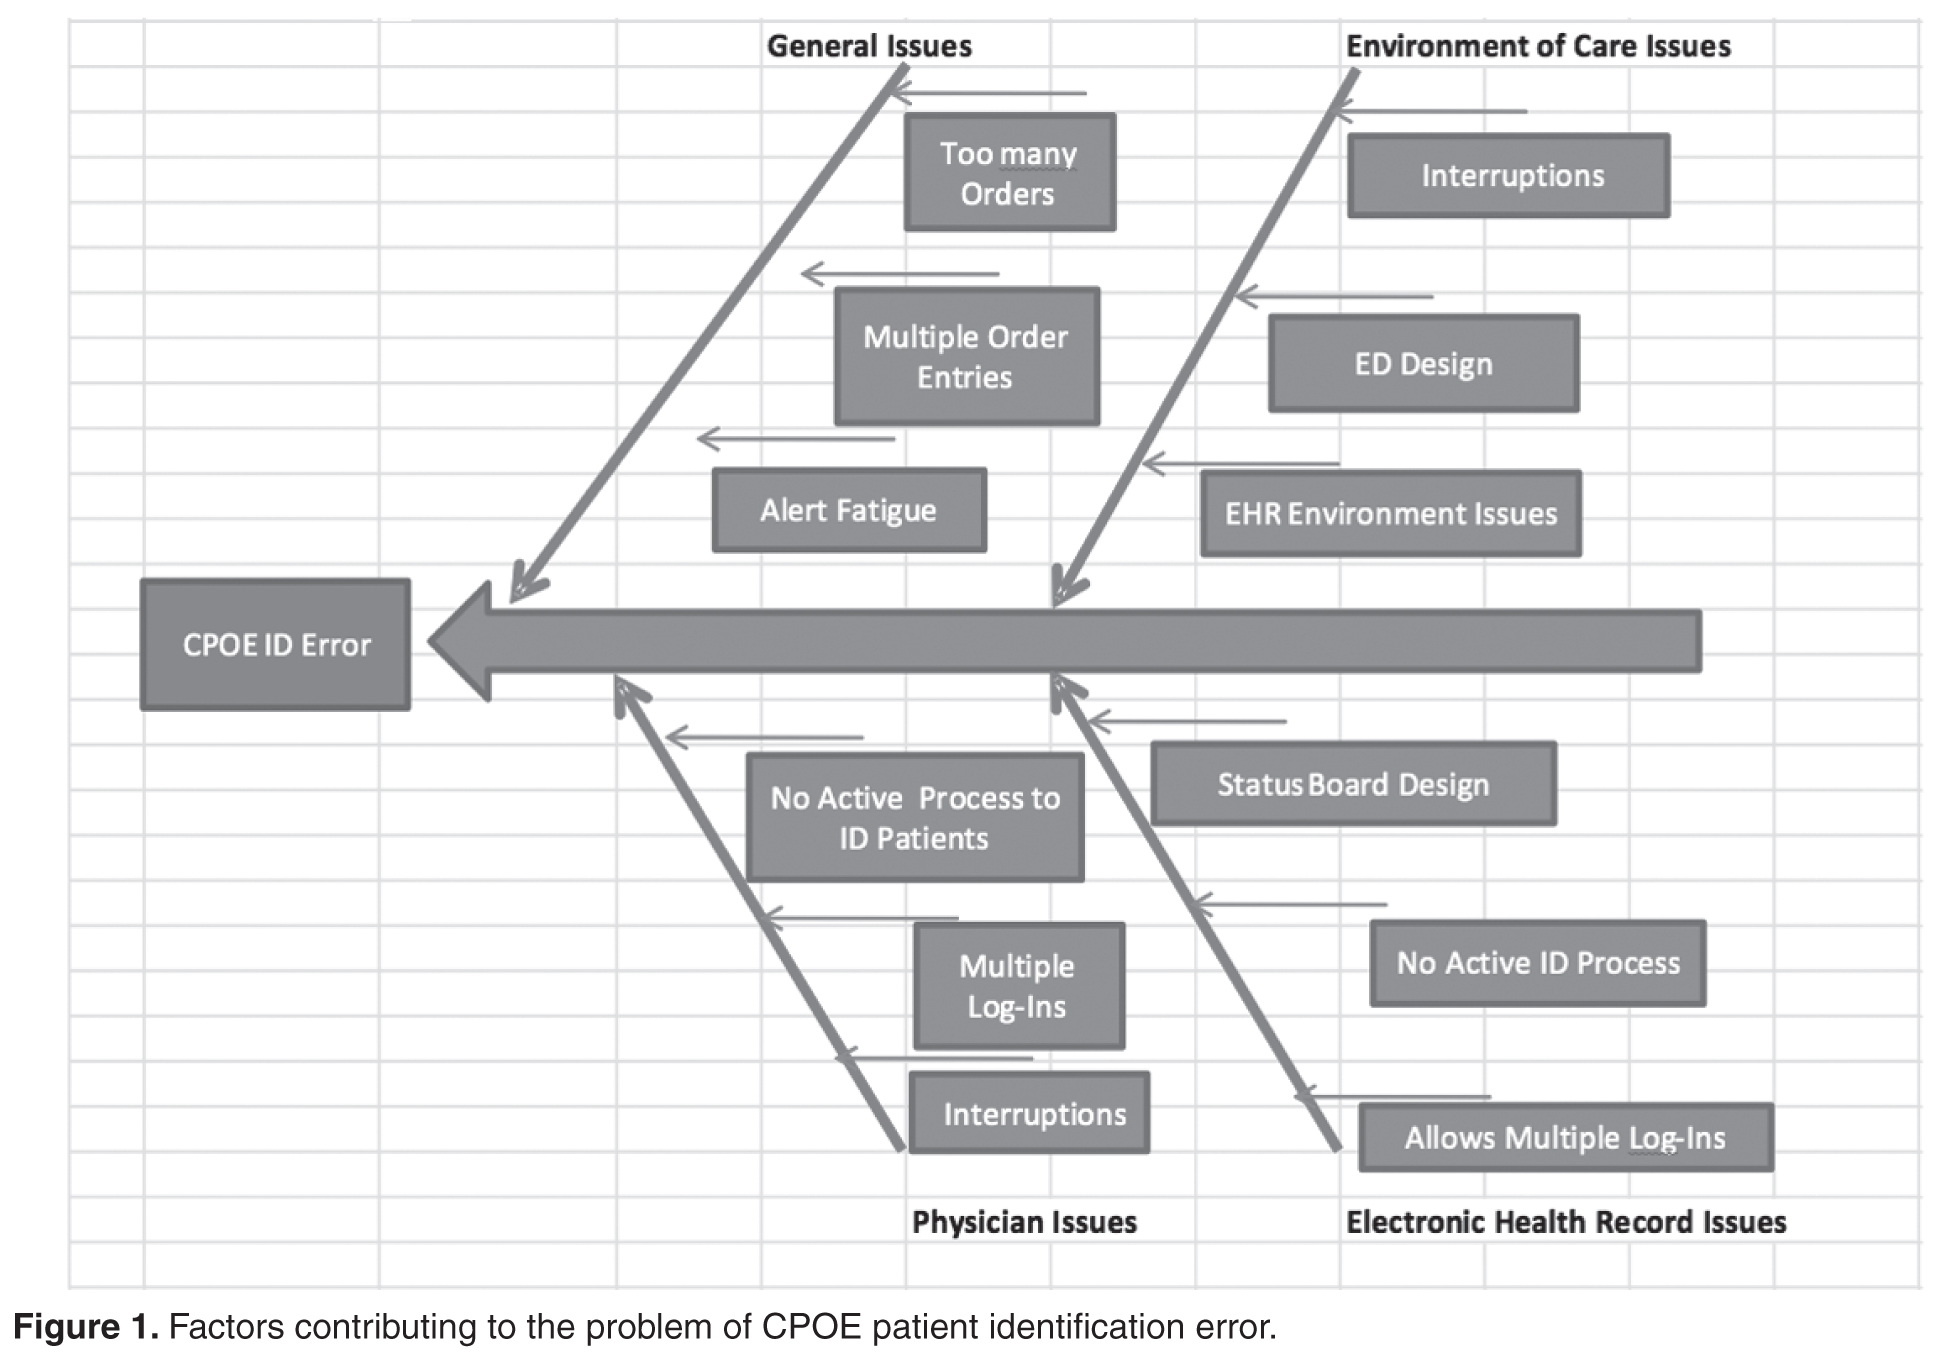
Next, we assessed our current error rate using a “retract and reorder” tool, which flags orders that have been placed for one patient, then erased and added to another patient’s file by the same clinician within a 10-minute time frame [8]. This tool, developed by Adelman et al, picks up near-miss errors, self-caught by the provider before causing harm [8]. Safety research has demonstrated that near-miss errors share the same causal pathway; therefore, measuring and preventing near-miss wrong-patient errors should reduce related errors that reach the patient.
For the period October–December 2014, we tabulated 231 near-miss wrong-patient orders that occured throughout the health system, of which 37% occurred in the ED. This translated to about 1 near-miss event per day in the ED. Given this data, the ED was the location for our quality improvement project.
Intervention
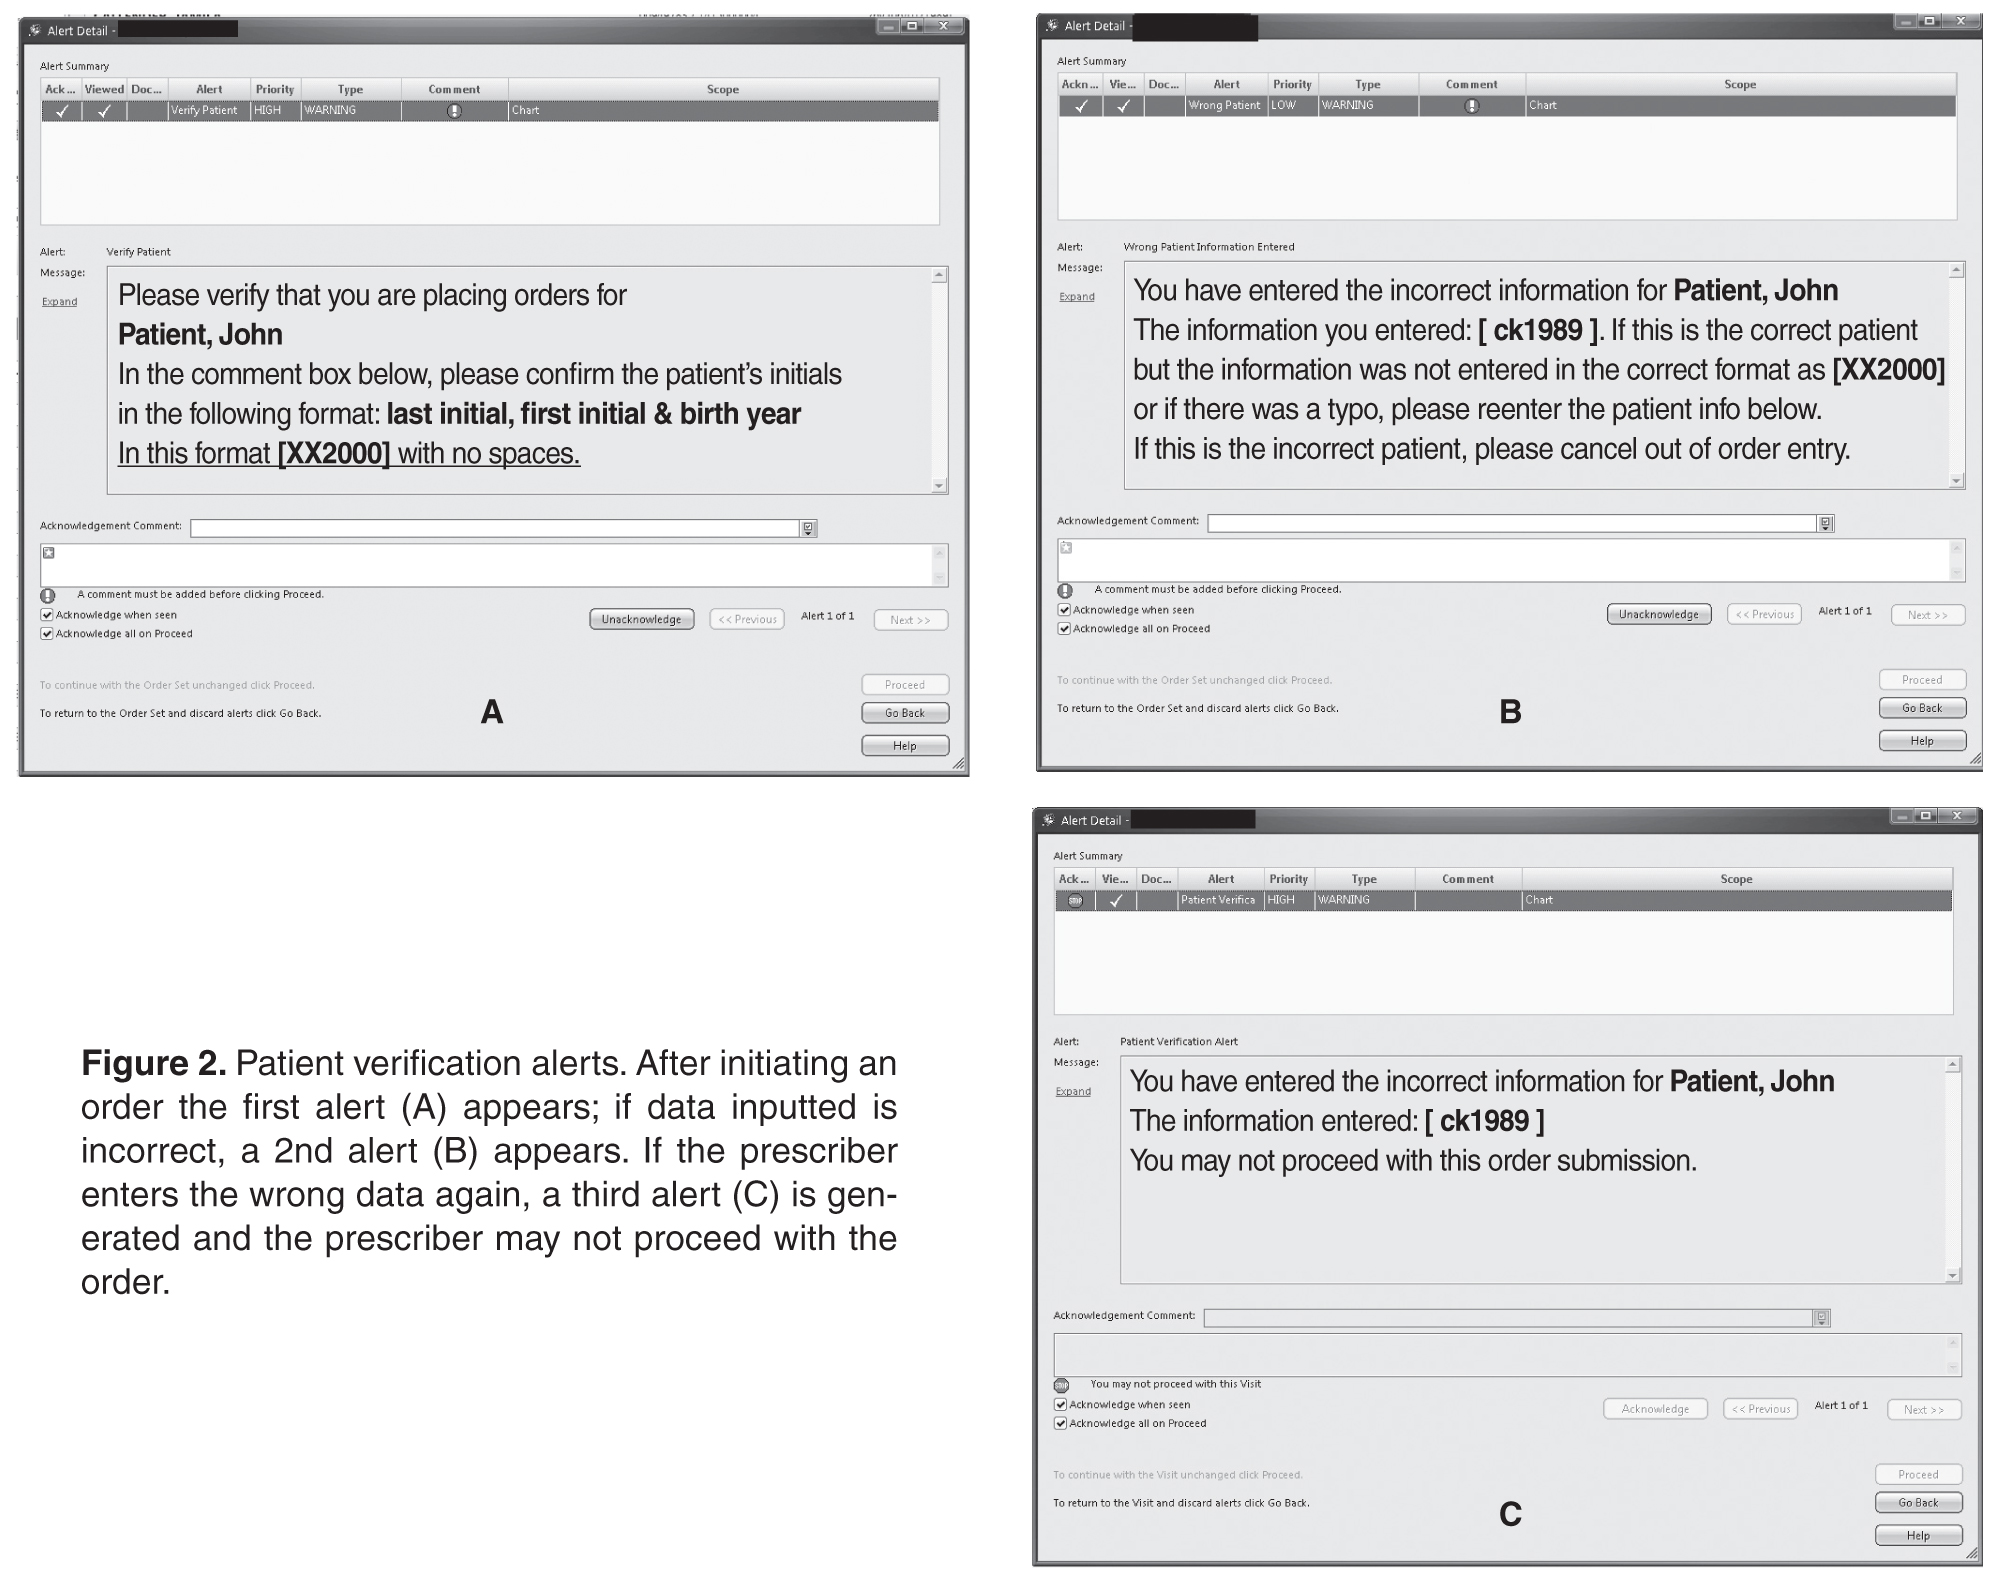
Outcomes
After a beta testing period of 1 week, the system was implemented on 3 November 2015. To assess the effectiveness of the alert system to prevent ordering errors, we used the retract and reorder tool to measure the rate of wrong-patient order entries for the 8-week period November–December 2015 and compared this with the preimplementation rate. Prior to the intervention, the average number of wrong patient order entries in the ED was 6.125 events per week. After implementation, the average number decreased to 4 events per week, a 35% decrease, and the proportion of near-miss ID errors in the ED relative to all such errors within the health system decreased from 37% to 19%.
Discussion
The original aim of the project was to decrease “wrong patient, right order” near-miss events by 30% in 3 months in the ED using an order-based patient ID reentry function. The goal was rapid improvement using a hard-wired EHR process, which is why a 3-month time frame was chosen. During our 8-week project, we surpassed this goal, documenting a 35% decrease in near-miss wrong-patient orders in the ED. This rate was similar to that achieved by Adelman et al [8] and Green et al [10]. Adelman et al found a 41% error reduction, while Green et al found a short-term 30% reduction in CPOE wrong-patient orders utilizing a 2.5-second mandatory delay before continuing the order entry for the purposes of patient verification.
Resident and attending staff conveyed to us anecdotally during both beta testing and implementation that the ID reentry function made them aware of incorrect patient selection even before entering the required initials and birth year. They then cancelled the order session on the wrong patient and chose the correct patient. This is consistent with the findings of Green’s study, which noted that ED practitioners backed out of appropriately 1 in 200 order entry sessions due to wrong patient selection [10].
We also assessed the additional time added to each order entry session. Initially, using observational data, the CPOE ID reentry function added 6.2 seconds to each order entry session. However, providers that were more familiar with the system took an average of 4.0 seconds. While this added time per order entry session does not seem like much of an issue or delay, in a busy 12-hour shift in the ED it could be seen as significant. Adelman reported 6.6 seconds additional time required in for the ID reentry function used in his study [8], while Green’s study was designed using a 2.5-second mandatory delay before users could close the verification dialogue box [10].
The biggest challenges in implementing our project were unforeseen IT issues. The “go-live” date for ICD-10 was the same as the date we were to start the ID reentry requirement. IT personnel were needed to help in the EHR ICD-10 development and support, which delayed our start date. Additionally, other IT issues were identified. For example, the initial implementation of this project was to begin in the ED involving active ED patients only. At the project’s onset, the ID reentry function erroneously became active in all hospital locations. To fix this error, the entire double ID system alert, including the ED location, had to be removed and adjusted.
In addition to the above challenges, the team discovered errors that needed to be addressed during beta testing. For example, some clinicians would enter an order but no alert asking for the identifying data appeared. The order was entered and completed without the use of the double ID. Once discovered, IT was able to identify and correct the error. Beta testing also revealed an error in the system where providers who incorrectly identified a patient were “locking-out” of the CPOE system for that particular patient during the patient’s entire encounter. This issue was also quickly identified and resolved.
Despite the effectiveness of this system in reducing the rate of near-miss wrong-patient orders in the ED, errors still occur. It is possible that providers are entering the patient’s initials and year of birth without carefully verifying the patient’s identity [9].The CPOE double ID system alert is about three-quarters the size of the monitor screen. Thus, the clinician is able to verify the patient’s initials and year of birth using the patient’s header on the screen behind the patient identification alert. If the provider simply types the initials and year of birth on the patient’s header, then an identification error can occur.
More work is needed to decrease CPOE-related patient identification errors. Possible improvements may include single sign-ons and a no-interruption policy when writing orders. During our investigation, it was found that some clinicians would have multiple EHR sign-on sessions open at one computer terminal. These multiple EHR sign-on sessions were sometimes the root cause of a wrong patient error. With multiple sign-on sessions open, clinicians could toggle back and forth between patients on the same computer terminal and mistakenly complete an order on the wrong patient.
No-interruption zones and policies have been proven to be an effective way of decreasing interruptions and enhancing safety during medication preparation [13,14]. Utilization of no-interruption zones for CPOE may also be effective. Potentially, the EHR background color could change when a clinician selects the “enter order” tab within the EHR. The new background color would signify to those around the clinician that he/she is not to be interrupted during that time.
After the success of this initial quality improvement project in the ED, the intensive care unit has been added as a location for the CPOE double identification system. The data and results for this phase of the project are being tabulated and seem promising. In addition, SBH Health System is exploring single sign-on software to both help clinicians provide service and enhance patient safety.
Corresponding author: Daniel Lombardi, DO, 4422 Third Ave., Bronx, NY 10457.
Financial disclosures: None.
1. Bates, DW, Leape L, Cullen DJ, et al. Effect of computerized physician order entry and a team intervention on prevention of serious medication errors. JAMA 1998;280:1311–16.
2. Bates, DW, Teich JM, Lee J, et al. The impact of computerized physician order entry on medication error prevention. J Am Med Inform Assoc 1999;6:313–21.
3. Kaushal R, Shojania KG, Bates DW. Effects of computerized physician order entry and clinical decision support systems on medication safety: a systematic review. Arch Intern Med 2003;163:1409–16.
4. Reckmann, MH, Westbrook JI, Koh Y, et al. Does computeized provider order entry reduce prescribing errors for hospital inpatients? A systematic review. J Am Med Inform Assoc 2009;16:613–23.
5. Koppel R, Metlay JP, Cohen A, et al. Role of computerized physician order entry systems in facilitating medication errors. JAMA 2005;293:1197–203.
6. Broder C. Study: CPOE can increase risk of medication errors. Health IT News. March 9, 2005.
7. Schiff GD, Amato MG, Eguale T, et al. Computerised physician order entry-related medication errors: analysis of reported errors and vulnerability testing of current systems. BMJ Qual Saf 2015;24:264–71.
8. Adelman, JS, Kalkut GE, Schechter CB, et al. Understanding and preventing wrong-patient electronic orders: a randomized controlled trial. JAM Med Inform Assoc 2013;20:305–10.
9. Yang A, Grissinger M. Pennsylvania Patient Safety Authority. Wrong-patient medication errors: an analysis of event reports in Pennsylvania and strategies for prevention. PA Patient Saf Advis 2013 June;10:41–9.
10. Green RA, Hripcsak G, Salmasian H, et al. Intercepting wrong-patient orders in a computerized provider order entry system. Ann Emerg Med 2015;65:679–86.
11. Institute for Safe Medication Practices. Oops, sorry, wrong patient! A patient verification process is needed everywhere, not just at the bedside. 10 Mar 2011. Accessed at www.ismp.org/Newsletters/acutecare/articles/20110310.asp.
12. Anthony K, Wiencek C, Bauer C, et al. No interruptions please: impact of a No Interruption Zone on medication safety in intensive care units. Crit Care Nurse 2010;30:21–9.
13. Institute for Safe Medication Practices. Side tracks on the safety express. interruptions lead to errors and unfinished…wait, what was i doing? 29 Nov 2012. Accessed at www.ismp.org/Newsletters/acutecare/showarticle.aspx?id=37.
From SBH Health System, Bronx, NY.
Abstract
- Objective: To decrease the number of near-miss wrong-patient orders in a computerized physician order entry (CPOE) system.
- Methods: A CPOE alert was built that prompted the ordering clinician to reaffirm the identity of the patient by entering the patient’s initials and year of birth prior to placing an order. We used a retract and reorder tool to measure the frequency of near-miss wrong-patient order errors before and after implementation of the alert.
- Results: The ID reentry function decreased near-miss wrong-patient orders in the ED by 35% during the 8-week pilot period. The system was also successful in helping to decrease the percentage of all CPOE near-miss events by 49%.
- Conclusion: An alert that requires the prescriber to enter the patient’s initials and birth year is effective in decreasing wrong-patient orders in the CPOE system.
Key words: CPOE, near miss, patient safety, medical errors, wrong-patient errors.
Computerized provider order entry (CPOE) systems are commonly used to place orders. CPOE has been shown to reduce errors [1–4]. However, medication errors also can be caused or exacerbated by the CPOE system [5–7]. One type of error that can occur is placing orders on the wrong patient [8]. Wrong-patient CPOE errors can lead to significant morbidity and mortality [8–11]. To reduce wrong-patient CPOE errors in our health system, we developed an alert that required the ordering clinician to verify the identity of the patient. In this paper, we describe our project and outcomes attained.
Methods
Setting
SBH Health System is a not for profit health system located in Bronx, New York. The SBH Health System also has academic affiliations, and AOA and ACGME residency and fellowship programs. St. Barnabas Hospital, SBH Health System’s acute care facility, is a safety net hospital, Level 1 trauma center, primary stroke center, and STEMI receiving center. St. Barnabas Hospital has 422 licensed beds and had a total of 91,476 emergency department visits in 2015. The electronic health record in use at the time of the project was Allscripts 6.1. The Allscripts product, including its CPOE functions, has been in use in the SBH emergency department (ED) since 2011.
Review of Current Process
A team of multidisciplinary stakeholders was assembled comprised of hospital senior leadership, ED leadership, and front-line staff. Representatives from all disciplines involved in the CPOE process were invited, including nursing, pharmacy, radiology, clinical laboratory, and information technology.
Next, we assessed our current error rate using a “retract and reorder” tool, which flags orders that have been placed for one patient, then erased and added to another patient’s file by the same clinician within a 10-minute time frame [8]. This tool, developed by Adelman et al, picks up near-miss errors, self-caught by the provider before causing harm [8]. Safety research has demonstrated that near-miss errors share the same causal pathway; therefore, measuring and preventing near-miss wrong-patient errors should reduce related errors that reach the patient.
For the period October–December 2014, we tabulated 231 near-miss wrong-patient orders that occured throughout the health system, of which 37% occurred in the ED. This translated to about 1 near-miss event per day in the ED. Given this data, the ED was the location for our quality improvement project.
Intervention
Outcomes
After a beta testing period of 1 week, the system was implemented on 3 November 2015. To assess the effectiveness of the alert system to prevent ordering errors, we used the retract and reorder tool to measure the rate of wrong-patient order entries for the 8-week period November–December 2015 and compared this with the preimplementation rate. Prior to the intervention, the average number of wrong patient order entries in the ED was 6.125 events per week. After implementation, the average number decreased to 4 events per week, a 35% decrease, and the proportion of near-miss ID errors in the ED relative to all such errors within the health system decreased from 37% to 19%.
Discussion
The original aim of the project was to decrease “wrong patient, right order” near-miss events by 30% in 3 months in the ED using an order-based patient ID reentry function. The goal was rapid improvement using a hard-wired EHR process, which is why a 3-month time frame was chosen. During our 8-week project, we surpassed this goal, documenting a 35% decrease in near-miss wrong-patient orders in the ED. This rate was similar to that achieved by Adelman et al [8] and Green et al [10]. Adelman et al found a 41% error reduction, while Green et al found a short-term 30% reduction in CPOE wrong-patient orders utilizing a 2.5-second mandatory delay before continuing the order entry for the purposes of patient verification.
Resident and attending staff conveyed to us anecdotally during both beta testing and implementation that the ID reentry function made them aware of incorrect patient selection even before entering the required initials and birth year. They then cancelled the order session on the wrong patient and chose the correct patient. This is consistent with the findings of Green’s study, which noted that ED practitioners backed out of appropriately 1 in 200 order entry sessions due to wrong patient selection [10].
We also assessed the additional time added to each order entry session. Initially, using observational data, the CPOE ID reentry function added 6.2 seconds to each order entry session. However, providers that were more familiar with the system took an average of 4.0 seconds. While this added time per order entry session does not seem like much of an issue or delay, in a busy 12-hour shift in the ED it could be seen as significant. Adelman reported 6.6 seconds additional time required in for the ID reentry function used in his study [8], while Green’s study was designed using a 2.5-second mandatory delay before users could close the verification dialogue box [10].
The biggest challenges in implementing our project were unforeseen IT issues. The “go-live” date for ICD-10 was the same as the date we were to start the ID reentry requirement. IT personnel were needed to help in the EHR ICD-10 development and support, which delayed our start date. Additionally, other IT issues were identified. For example, the initial implementation of this project was to begin in the ED involving active ED patients only. At the project’s onset, the ID reentry function erroneously became active in all hospital locations. To fix this error, the entire double ID system alert, including the ED location, had to be removed and adjusted.
In addition to the above challenges, the team discovered errors that needed to be addressed during beta testing. For example, some clinicians would enter an order but no alert asking for the identifying data appeared. The order was entered and completed without the use of the double ID. Once discovered, IT was able to identify and correct the error. Beta testing also revealed an error in the system where providers who incorrectly identified a patient were “locking-out” of the CPOE system for that particular patient during the patient’s entire encounter. This issue was also quickly identified and resolved.
Despite the effectiveness of this system in reducing the rate of near-miss wrong-patient orders in the ED, errors still occur. It is possible that providers are entering the patient’s initials and year of birth without carefully verifying the patient’s identity [9].The CPOE double ID system alert is about three-quarters the size of the monitor screen. Thus, the clinician is able to verify the patient’s initials and year of birth using the patient’s header on the screen behind the patient identification alert. If the provider simply types the initials and year of birth on the patient’s header, then an identification error can occur.
More work is needed to decrease CPOE-related patient identification errors. Possible improvements may include single sign-ons and a no-interruption policy when writing orders. During our investigation, it was found that some clinicians would have multiple EHR sign-on sessions open at one computer terminal. These multiple EHR sign-on sessions were sometimes the root cause of a wrong patient error. With multiple sign-on sessions open, clinicians could toggle back and forth between patients on the same computer terminal and mistakenly complete an order on the wrong patient.
No-interruption zones and policies have been proven to be an effective way of decreasing interruptions and enhancing safety during medication preparation [13,14]. Utilization of no-interruption zones for CPOE may also be effective. Potentially, the EHR background color could change when a clinician selects the “enter order” tab within the EHR. The new background color would signify to those around the clinician that he/she is not to be interrupted during that time.
After the success of this initial quality improvement project in the ED, the intensive care unit has been added as a location for the CPOE double identification system. The data and results for this phase of the project are being tabulated and seem promising. In addition, SBH Health System is exploring single sign-on software to both help clinicians provide service and enhance patient safety.
Corresponding author: Daniel Lombardi, DO, 4422 Third Ave., Bronx, NY 10457.
Financial disclosures: None.
1. Bates, DW, Leape L, Cullen DJ, et al. Effect of computerized physician order entry and a team intervention on prevention of serious medication errors. JAMA 1998;280:1311–16.
2. Bates, DW, Teich JM, Lee J, et al. The impact of computerized physician order entry on medication error prevention. J Am Med Inform Assoc 1999;6:313–21.
3. Kaushal R, Shojania KG, Bates DW. Effects of computerized physician order entry and clinical decision support systems on medication safety: a systematic review. Arch Intern Med 2003;163:1409–16.
4. Reckmann, MH, Westbrook JI, Koh Y, et al. Does computeized provider order entry reduce prescribing errors for hospital inpatients? A systematic review. J Am Med Inform Assoc 2009;16:613–23.
5. Koppel R, Metlay JP, Cohen A, et al. Role of computerized physician order entry systems in facilitating medication errors. JAMA 2005;293:1197–203.
6. Broder C. Study: CPOE can increase risk of medication errors. Health IT News. March 9, 2005.
7. Schiff GD, Amato MG, Eguale T, et al. Computerised physician order entry-related medication errors: analysis of reported errors and vulnerability testing of current systems. BMJ Qual Saf 2015;24:264–71.
8. Adelman, JS, Kalkut GE, Schechter CB, et al. Understanding and preventing wrong-patient electronic orders: a randomized controlled trial. JAM Med Inform Assoc 2013;20:305–10.
9. Yang A, Grissinger M. Pennsylvania Patient Safety Authority. Wrong-patient medication errors: an analysis of event reports in Pennsylvania and strategies for prevention. PA Patient Saf Advis 2013 June;10:41–9.
10. Green RA, Hripcsak G, Salmasian H, et al. Intercepting wrong-patient orders in a computerized provider order entry system. Ann Emerg Med 2015;65:679–86.
11. Institute for Safe Medication Practices. Oops, sorry, wrong patient! A patient verification process is needed everywhere, not just at the bedside. 10 Mar 2011. Accessed at www.ismp.org/Newsletters/acutecare/articles/20110310.asp.
12. Anthony K, Wiencek C, Bauer C, et al. No interruptions please: impact of a No Interruption Zone on medication safety in intensive care units. Crit Care Nurse 2010;30:21–9.
13. Institute for Safe Medication Practices. Side tracks on the safety express. interruptions lead to errors and unfinished…wait, what was i doing? 29 Nov 2012. Accessed at www.ismp.org/Newsletters/acutecare/showarticle.aspx?id=37.
A Computer-Assisted Process to Reduce Discharge of Emergency Department Patients with Abnormal Vital Signs
From Case Western Reserve University, MetroHealth Medical Center, Cleveland, OH.
Abstract
- Objective: To describe a computer-assisted process for reducing the number of patients discharged from the emergency department with abnormal vital signs.
- Methods: We devised a best practice alert in the Epic electronic medical record that triggers when the clinician attempts to print an after visit summary (discharge paperwork) at the time of discharge from the emergency department.
- Results: We saw no change in the percentage of patients discharged with elevated blood pressures, consistent with national recommendations. Removing that category of patients, we saw a decrease in the percentage of patients discharged with abnormal vital signs, primarily driven by a decrease in the percentage of patients discharged with tachycardia.
- Conclusion: A computer-assisted process can reduce the percentage of patients discharged with abnormal vital signs. Since based on national recommendations ED physicians do not address most elevated blood pressures in the ED, hypertension should not trigger an alert.
Abnormal vital signs in the emergency department (ED) have been associated with adverse outcomes [1,2]. While most patients discharged from the ED do well, some studies have found that the death rate within days to weeks post–ED discharge may be as high as 200 per 100,000 visits, although other studies have found a much lower rate [1]. A study by Sklar et al, although not specifically focused on vital signs at discharge, found that unexpected death within 7 days of ED discharge occurred at a rate of 30 per 100,000 patients. Abnormal vital signs, most commonly tachycardia, were present in 83% of cases [2].
In busy EDs, the combination of patient volume, frequent interruptions, and the intensity of tasks can result in deficiencies in vital sign monitoring [3–5] as well as abnormal vital signs not being recognized by the clinician at the time of patient discharge [6]. The importance of addressing this quality problem has been recognized. Prior efforts to address the problem have included nurses using manual methods to alert the physician to the presence of abnormal vital signs at the time of discharge [7]. Recommendations have been made to use electronic medical record (EMR) functions for prospectively addressing the problem of ED discharge with abnormal vital signs [8]. The utility of the EMR to identify potentially septic patients earlier and reduce mortality from sepsis via an algorithm that incorporated vital signs and other clinical crieria has been demonstrated [9,10]. In addition, automated vital signs advisories have been associated with increased survival on general hospital wards [11].
An adverse event that occurred at our institution prompted us to review this issue for our ED. We designed an EMR-assisted intervention to reduce the rate of patients discharged from the ED with abnormal vital signs.
Methods
Setting
Our ED is a busy, urban, Level 1 trauma center within a teaching facility. It sees over 100,000 patients per year and is segmented into resuscitation, high acuity, moderate acuity, and fast tract areas, in addition to the observation unit. Our organization uses the Epic (Madison, Wisconsin) electronic health record, which we have been using for over a decade.
Discharge Instructions—Old Process
In our ED, providers, attending physicians, residents and advance practice nurses enter and print their own discharge instructions, which are given to nursing staff to review with patients. Prior to the project, nurses were expected to notify a physician if they thought a vital sign was abnormal. Each nurse made independent decisions on what constituted a vital sign abnormality based on the patient’s condition and could communicate that to the provider at their discretion prior to discharge. This process created inconsistencies in care.

Development of Alert
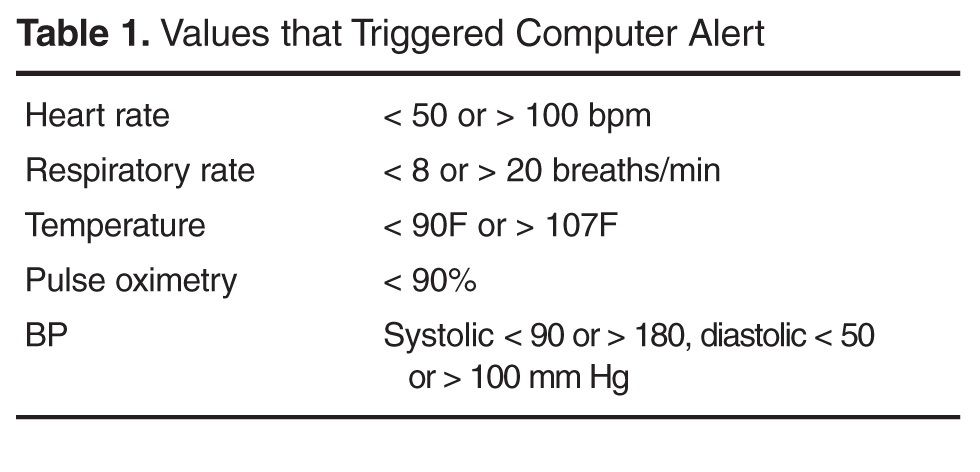
We created an alert that appears within the provider workflow at the time the provider attempts to print discharge instructions. Based on literature review and operational leadership consensus, we set the parameters for abnormal vital signs (Table 1). We chose parameters to identify abnormalities important to 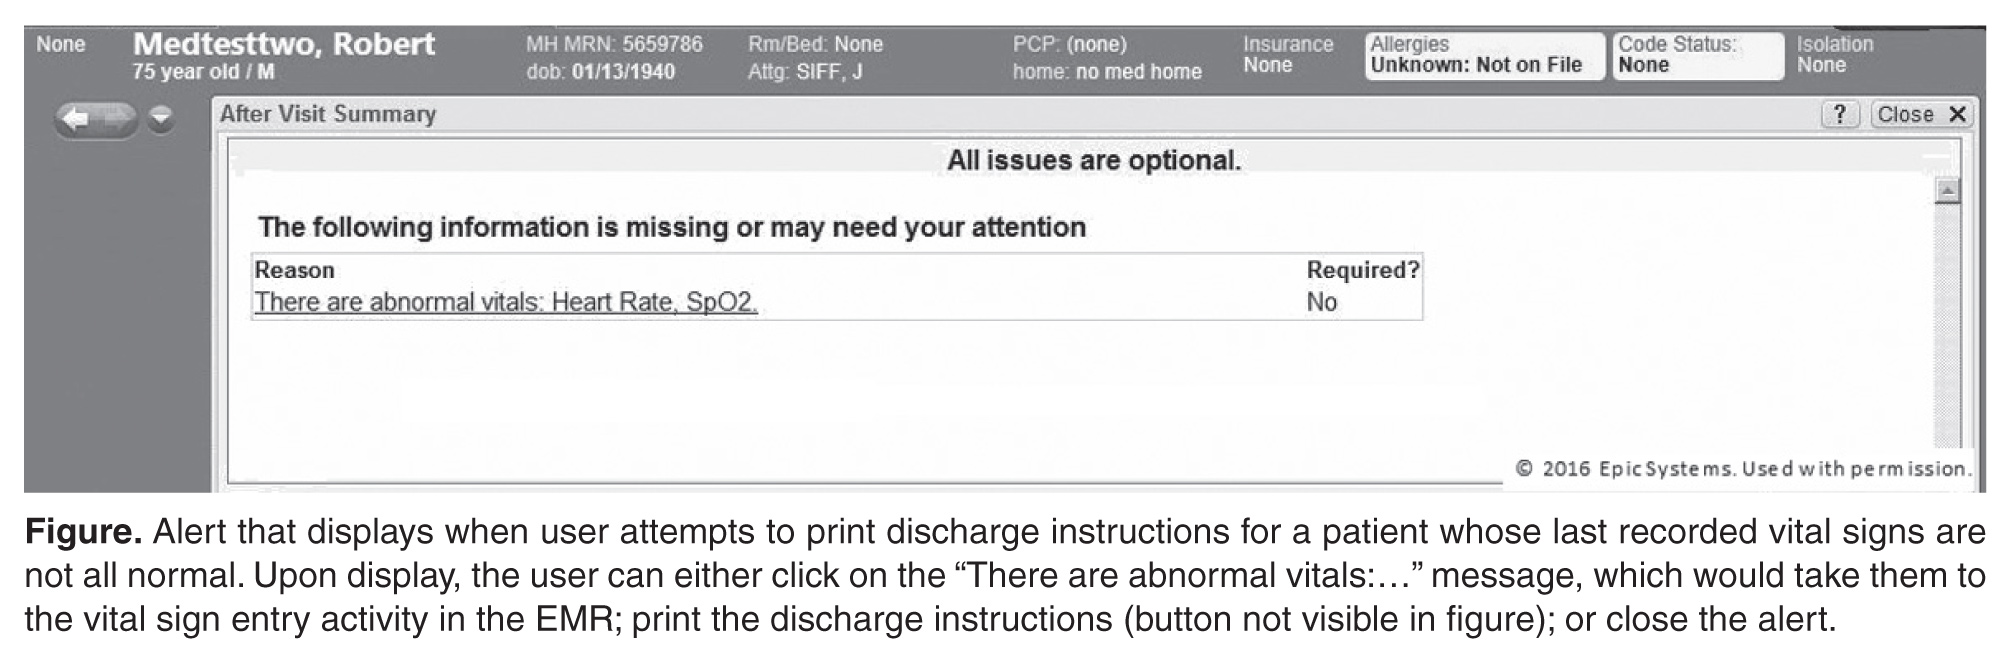
The alert displays when a user attempts to print discharge instructions on a patient whose last recorded vital signs are not all normal. The display informs that there are abnormal vital signs (Figure). Upon display of the alert, the user can click on the message, which would take them to the vital sign entry activity in the EMR, or they can proceed with printing by clicking the print button (not visible in the Figure). The alert is not a forcing function; the user can proceed with printing the discharge instructions without addressing the abnormality that triggered the alert.
Pre-Post Evaluation
We would have liked to have determined how often the abnormal vital signs alert triggered, how it was responded to, and whether the patient was subsequently discharged with normal vital signs; however, our system does not record these events. Instead, we used the system to compare the percentage of adult patients who were discharged with abnormal vital signs for 2 time periods: the period prior to our December 2014 implementation (1 Oct to 1 Dec 2014) and the post implementation period (15 Dec 2014 to 15 Feb 2015). Our presumption was that the use of the alert system would reduce the percentage of patients discharged with abnormal vital signs, including an abnormal pulse oximetry.
To conduct our analysis, we identified adult patients seen during the 2 time periods. We eliminated those patients who died, left without being seen, eloped, were admitted or were transferred to other institutions. This resulted in 3664 patients, with 2179 in the pre-implementation group and 1485 in the post-implementation group. The higher volume in the pre group reflects the early occurrence of influenza season in our area during the study period, along with our generally busier time in late fall compared to winter.
The analysis was performed as a likelihood ratio chi-square analysis using SAS (Cary, NC) software.
Results
The analysis demonstrated that physicians were, by and large, following recommendations consistent with policies of the American College of Emergency Physicians regarding the management of elevated blood pressures, which do not mandate that patients with asymptomatic elevations of blood pressure receive medical intervention in the ED [12]. In our analysis, the percentage of patients discharged with elevated blood pressures actually increased from 7.5% to 9.9% following the intervention. Importantly, however, the percentage of patients discharged with low blood pressures decreased from 6.9% to 5.0% (P < 0.01).Tthe percent of patients discharged with an elevated heart rate, decreased from 58% in the pre alert group to 42% in the post alert group (P < 0.02). 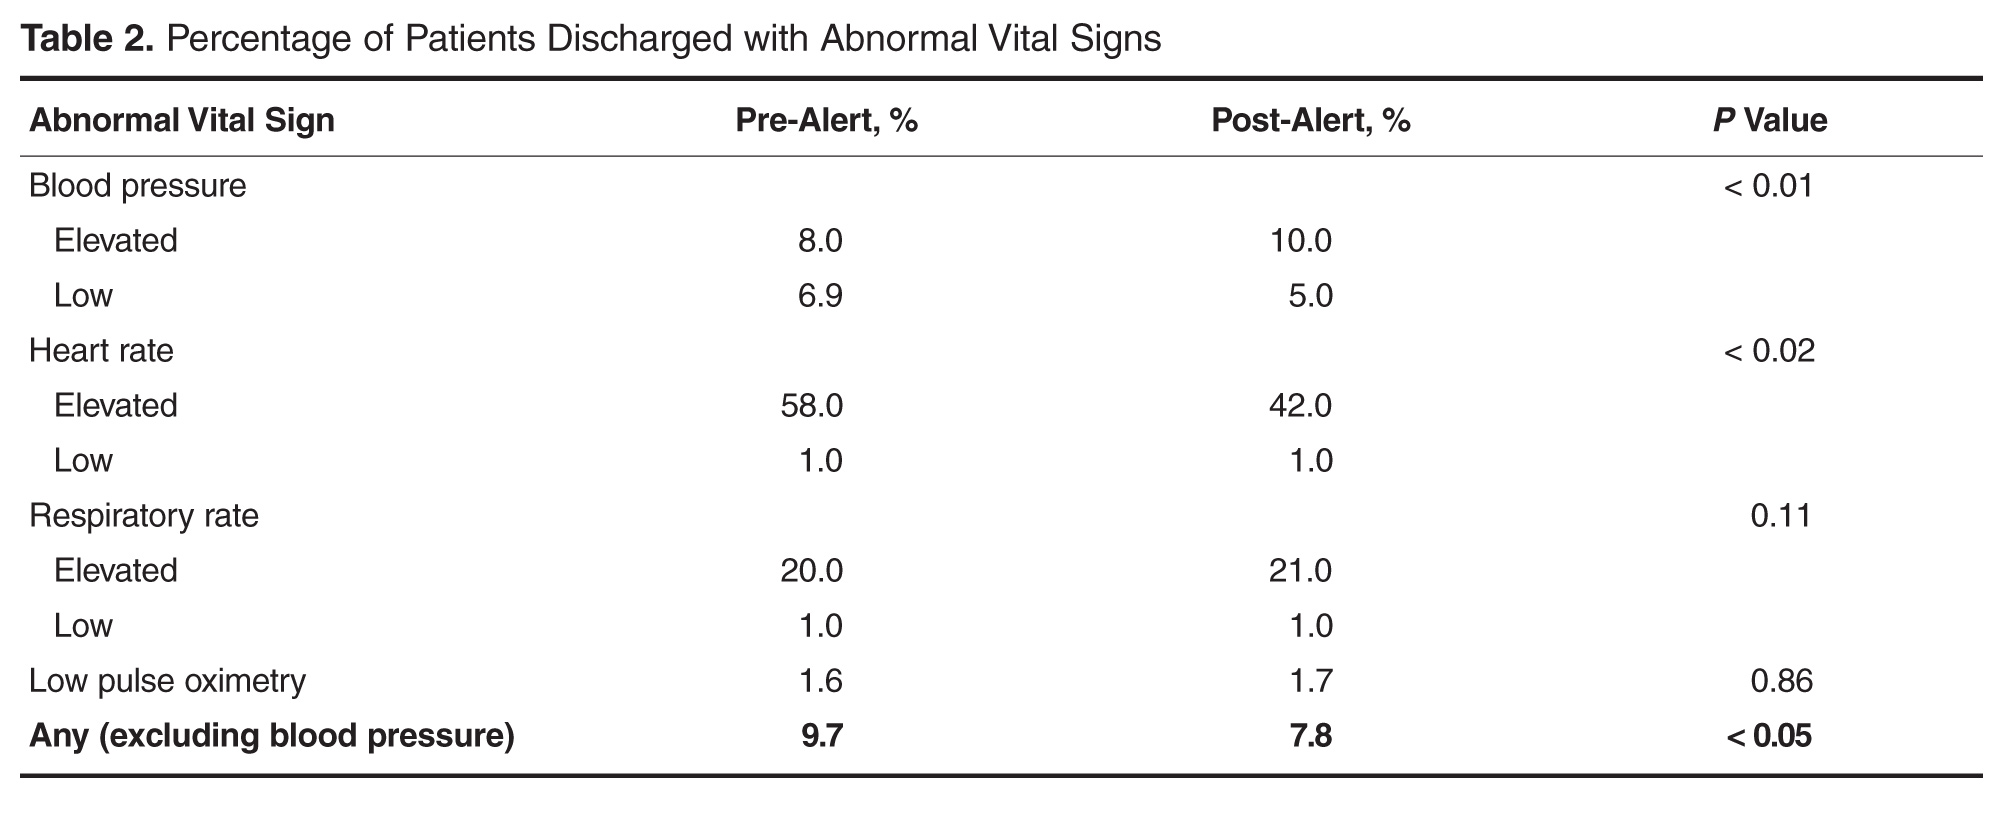
Discussion
In our study, we used features of the EMR prospectively to affect discharge and then used the database functions of the EMR to assess the effectiveness of those efforts. Previous studies that have looked at the incidence of abnormal vital signs at discharge have been manual, retrospective reviews of records. We are not aware of any studies reporting the results of introducing an EMR alert to prospectively identify patients with abnormal vital signs prior to discharge
While we found that this intervention was successful in reducing clinically relevant abnormal vital signs at discharge, we have realized that the elevated blood pressure alert was unnecessary and we have eliminated it from the programming. We will revisit our strategy to determine if further reducing the high blood pressure alerts can lead to greater improvements in reducing the percentage of patients discharged with abnormal vital signs.
Future plans include a review of the re-visit or hospitalization rate for patients discharged with abnormal vital signs. A companion study evaluating a similar approach to the care of children is under consideration. We are also considering including a field in the EMR for the clinician to document why they discharged a patient with abnormal vital signs.
Corresponding author: Jonathan E. Siff, MD 2500 MetroHealth Drive BG3-65 Cleveland, Ohio 44109 jsiff@metrohealth.org.
Financial disclosures: None.
1. Gunnarsdottir OS, Rafnsson V. Death within 8 days after discharge to home from the emergency department. Eur J of Public Health 2008;18:522–6.
2. Sklar DP, Crandall CS, Loeliger E, et al. Unanticipated death after discharge home from the emergency department. Ann Emerg Med 2007;49:735–45.
3. Johnson KD, Winkelman C, Burant CJ, et al. The factors that affect the frequency of vital sign monitoring in the emergency department. J Emerg Nurs 2014;40:27–35.
4. Gravel J, Opatrny L, Gouin S. High rate of missing vital signs data at triage in a paediatric emergency department. Paediatr Child Health 2006;11:211–5.
5. Depinet HE, Iyer SB, Hornung R, et al. The effect of emergency department crowding on reassessment of children with critically abnormal vital signs. Acad Emerg Med 2014;21:1116–20.
6. Hafner JW, Parrish SE, Hubler JR, et al. Repeat assessment of abnormal vital signs and patient re-examination in us emergency department patients. Ann Emerg Med 2006;48(4 Suppl):S66.
7. Domagala SE. Discharge vital signs: an enhancement to ED quality and patient outcomes. J Emerg Nursing 2009;35:138–40.
8. Welch S. Red flags: abnormal vital signs at discharge.Emerg Med News 2011:33;7–8.
9. Nguyen SQ, Mwakalindile E, Booth JS, et al. Automated electronic medical record sepsis detection in the emergency department. PeerJ 2014;2:e343.
10. Narayanan N, Gross AK, Pintens M, et al. Effect of an electronic medical record alert for severe sepsis among ED patients. Am J Emerg Med 2016;34:185–8.
11. Bellomo R, Ackerman M, Bailey M, et al. A controlled trial of electronic automated advisory vital signs monitoring in general hospital wards. Crit Care Med 2012;40:2349–61.
12. Wolf SJ, Lo B, Smith MD, et al. Clinical policy: critical issues in the evaluation and management of adult patients in the emergency department with asymptomatic elevated blood pressure. Ann Emerg Med 2013:62;59–68.
From Case Western Reserve University, MetroHealth Medical Center, Cleveland, OH.
Abstract
- Objective: To describe a computer-assisted process for reducing the number of patients discharged from the emergency department with abnormal vital signs.
- Methods: We devised a best practice alert in the Epic electronic medical record that triggers when the clinician attempts to print an after visit summary (discharge paperwork) at the time of discharge from the emergency department.
- Results: We saw no change in the percentage of patients discharged with elevated blood pressures, consistent with national recommendations. Removing that category of patients, we saw a decrease in the percentage of patients discharged with abnormal vital signs, primarily driven by a decrease in the percentage of patients discharged with tachycardia.
- Conclusion: A computer-assisted process can reduce the percentage of patients discharged with abnormal vital signs. Since based on national recommendations ED physicians do not address most elevated blood pressures in the ED, hypertension should not trigger an alert.
Abnormal vital signs in the emergency department (ED) have been associated with adverse outcomes [1,2]. While most patients discharged from the ED do well, some studies have found that the death rate within days to weeks post–ED discharge may be as high as 200 per 100,000 visits, although other studies have found a much lower rate [1]. A study by Sklar et al, although not specifically focused on vital signs at discharge, found that unexpected death within 7 days of ED discharge occurred at a rate of 30 per 100,000 patients. Abnormal vital signs, most commonly tachycardia, were present in 83% of cases [2].
In busy EDs, the combination of patient volume, frequent interruptions, and the intensity of tasks can result in deficiencies in vital sign monitoring [3–5] as well as abnormal vital signs not being recognized by the clinician at the time of patient discharge [6]. The importance of addressing this quality problem has been recognized. Prior efforts to address the problem have included nurses using manual methods to alert the physician to the presence of abnormal vital signs at the time of discharge [7]. Recommendations have been made to use electronic medical record (EMR) functions for prospectively addressing the problem of ED discharge with abnormal vital signs [8]. The utility of the EMR to identify potentially septic patients earlier and reduce mortality from sepsis via an algorithm that incorporated vital signs and other clinical crieria has been demonstrated [9,10]. In addition, automated vital signs advisories have been associated with increased survival on general hospital wards [11].
An adverse event that occurred at our institution prompted us to review this issue for our ED. We designed an EMR-assisted intervention to reduce the rate of patients discharged from the ED with abnormal vital signs.
Methods
Setting
Our ED is a busy, urban, Level 1 trauma center within a teaching facility. It sees over 100,000 patients per year and is segmented into resuscitation, high acuity, moderate acuity, and fast tract areas, in addition to the observation unit. Our organization uses the Epic (Madison, Wisconsin) electronic health record, which we have been using for over a decade.
Discharge Instructions—Old Process
In our ED, providers, attending physicians, residents and advance practice nurses enter and print their own discharge instructions, which are given to nursing staff to review with patients. Prior to the project, nurses were expected to notify a physician if they thought a vital sign was abnormal. Each nurse made independent decisions on what constituted a vital sign abnormality based on the patient’s condition and could communicate that to the provider at their discretion prior to discharge. This process created inconsistencies in care.
Development of Alert
We created an alert that appears within the provider workflow at the time the provider attempts to print discharge instructions. Based on literature review and operational leadership consensus, we set the parameters for abnormal vital signs (Table 1). We chose parameters to identify abnormalities important to
The alert displays when a user attempts to print discharge instructions on a patient whose last recorded vital signs are not all normal. The display informs that there are abnormal vital signs (Figure). Upon display of the alert, the user can click on the message, which would take them to the vital sign entry activity in the EMR, or they can proceed with printing by clicking the print button (not visible in the Figure). The alert is not a forcing function; the user can proceed with printing the discharge instructions without addressing the abnormality that triggered the alert.
Pre-Post Evaluation
We would have liked to have determined how often the abnormal vital signs alert triggered, how it was responded to, and whether the patient was subsequently discharged with normal vital signs; however, our system does not record these events. Instead, we used the system to compare the percentage of adult patients who were discharged with abnormal vital signs for 2 time periods: the period prior to our December 2014 implementation (1 Oct to 1 Dec 2014) and the post implementation period (15 Dec 2014 to 15 Feb 2015). Our presumption was that the use of the alert system would reduce the percentage of patients discharged with abnormal vital signs, including an abnormal pulse oximetry.
To conduct our analysis, we identified adult patients seen during the 2 time periods. We eliminated those patients who died, left without being seen, eloped, were admitted or were transferred to other institutions. This resulted in 3664 patients, with 2179 in the pre-implementation group and 1485 in the post-implementation group. The higher volume in the pre group reflects the early occurrence of influenza season in our area during the study period, along with our generally busier time in late fall compared to winter.
The analysis was performed as a likelihood ratio chi-square analysis using SAS (Cary, NC) software.
Results
The analysis demonstrated that physicians were, by and large, following recommendations consistent with policies of the American College of Emergency Physicians regarding the management of elevated blood pressures, which do not mandate that patients with asymptomatic elevations of blood pressure receive medical intervention in the ED [12]. In our analysis, the percentage of patients discharged with elevated blood pressures actually increased from 7.5% to 9.9% following the intervention. Importantly, however, the percentage of patients discharged with low blood pressures decreased from 6.9% to 5.0% (P < 0.01).Tthe percent of patients discharged with an elevated heart rate, decreased from 58% in the pre alert group to 42% in the post alert group (P < 0.02).
Discussion
In our study, we used features of the EMR prospectively to affect discharge and then used the database functions of the EMR to assess the effectiveness of those efforts. Previous studies that have looked at the incidence of abnormal vital signs at discharge have been manual, retrospective reviews of records. We are not aware of any studies reporting the results of introducing an EMR alert to prospectively identify patients with abnormal vital signs prior to discharge
While we found that this intervention was successful in reducing clinically relevant abnormal vital signs at discharge, we have realized that the elevated blood pressure alert was unnecessary and we have eliminated it from the programming. We will revisit our strategy to determine if further reducing the high blood pressure alerts can lead to greater improvements in reducing the percentage of patients discharged with abnormal vital signs.
Future plans include a review of the re-visit or hospitalization rate for patients discharged with abnormal vital signs. A companion study evaluating a similar approach to the care of children is under consideration. We are also considering including a field in the EMR for the clinician to document why they discharged a patient with abnormal vital signs.
Corresponding author: Jonathan E. Siff, MD 2500 MetroHealth Drive BG3-65 Cleveland, Ohio 44109 jsiff@metrohealth.org.
Financial disclosures: None.
1. Gunnarsdottir OS, Rafnsson V. Death within 8 days after discharge to home from the emergency department. Eur J of Public Health 2008;18:522–6.
2. Sklar DP, Crandall CS, Loeliger E, et al. Unanticipated death after discharge home from the emergency department. Ann Emerg Med 2007;49:735–45.
3. Johnson KD, Winkelman C, Burant CJ, et al. The factors that affect the frequency of vital sign monitoring in the emergency department. J Emerg Nurs 2014;40:27–35.
4. Gravel J, Opatrny L, Gouin S. High rate of missing vital signs data at triage in a paediatric emergency department. Paediatr Child Health 2006;11:211–5.
5. Depinet HE, Iyer SB, Hornung R, et al. The effect of emergency department crowding on reassessment of children with critically abnormal vital signs. Acad Emerg Med 2014;21:1116–20.
6. Hafner JW, Parrish SE, Hubler JR, et al. Repeat assessment of abnormal vital signs and patient re-examination in us emergency department patients. Ann Emerg Med 2006;48(4 Suppl):S66.
7. Domagala SE. Discharge vital signs: an enhancement to ED quality and patient outcomes. J Emerg Nursing 2009;35:138–40.
8. Welch S. Red flags: abnormal vital signs at discharge.Emerg Med News 2011:33;7–8.
9. Nguyen SQ, Mwakalindile E, Booth JS, et al. Automated electronic medical record sepsis detection in the emergency department. PeerJ 2014;2:e343.
10. Narayanan N, Gross AK, Pintens M, et al. Effect of an electronic medical record alert for severe sepsis among ED patients. Am J Emerg Med 2016;34:185–8.
11. Bellomo R, Ackerman M, Bailey M, et al. A controlled trial of electronic automated advisory vital signs monitoring in general hospital wards. Crit Care Med 2012;40:2349–61.
12. Wolf SJ, Lo B, Smith MD, et al. Clinical policy: critical issues in the evaluation and management of adult patients in the emergency department with asymptomatic elevated blood pressure. Ann Emerg Med 2013:62;59–68.
An Enhanced Recovery Program for Elective Spinal Surgery Patients
From Musgrove Park Hospital, Taunton, England.
Abstract
- Objective: To describe a redesign of the clinical pathway for patients undergoing elective spinal surgery in order to improve quality of care and reduce length of stay.
- Methods: A multidisciplinary team undertook a process-mapping exercise and shadowed patients to analyse problems with the existing clinical pathway. Further ideas were taken from best evidence and other published enhanced recovery programs. Change ideas were tested using Plan-Do-Study-Act cycles. Measures included length of hospital stay, compliance with the pathway, and patient satisfaction.
- Results: The new pathway, the SpinaL Enhanced Recovery Program, is now used by 99% of elective spinal surgery patients with 100% of patients rating their care as good or excellent. Length of stay was reduced by 52%, improving from 5.7 days at the start of the intervention to 2.7 days. The pathway improved reliability of care, with preoperative carbohydrate drinks used in 83% of patients.
- Conclusion: The pathway improved reliability of care in our institution with excellent patient satisfaction and a significant reduction in length of hospital stay.
Enhanced recovery programs (ERPs) have been developed in many surgical specialties to improve patient outcomes and recovery after elective surgery. They involve multiple interventions throughout the patient journey, from preoperative patient education to postoperative mobilization and analgesia schedules. A meta-analysis of 38 trials involving 5099 participants showed ERPs could reduce length of stay and overall complication rates across surgical specialties [1].
There have been few studies of ERP for spinal surgery populations [2]. Most of them have studied selected patients or selected interventions such as analgesia schedules and did not use quality improvement methodology. For example, a small retrospective study compared patients undergoing multilevel spinal fusion surgery before and after introduction of a multimodal analgesia regimen [3]. A review of innovative perioperative and intraoperative treatment algorithms showed that they can influence postoperative recovery and patient outcomes from lumbar spinal surgery [4]. A study from the same group found that patient education and a “fast-track” pathway reduced length of hospital stay and improved patient satisfaction for patients undergoing 1- or 2- level lumbar spinal fusion [5].
At our hospital, a meeting of the clinicians and staff involved in elective spinal surgery was held to discuss the service. Leadership came from a consultant anesthesiologist and a consultant spinal surgeon, who recognized that care was not as efficient as it could be. A multidisciplinary team was formed consisting of 30 members, including surgeons, clinical nurse practitioners, physiotherapists, occupational therapists, and secretarial staff. The team undertook a process-mapping exercise that revealed that patients followed an ill-defined care pathway with variability in administrative processes and clinical care. Patient feedback and reports from both secretarial and community staff revealed that communications from the spinal team could be inconsistent, and patients had unclear expectations of their care and recovery. Lengths of stay for the same procedure could vary by 3 days.
With support from the hospital’s chief executive and medical director, the team embarked on a process to redesign the clinical pathway for patients undergoing elective spinal surgery at our hospital. We developed the SpinaL Enhanced Recovery Program; our primary aims were to to have 95% of patients managed according to the new pathway, to reduce length of stay by 30% without a rise in readmission rates, and to improve patient satisfaction.
Methods
Ethical Issues
This work met criteria for operational improvement activities and as such was exempt from ethics review. The team engaged patients who had undergone spinal surgery to serve as representatives to ensure that the improvements studied were important to them.
Setting and Patients
Our institution is a District General Hospital that serves a population of over 340,000 and has 3 consultant spinal surgeons. They work with 5 anesthesiologists on a regular basis and the patients are cared for by 3 clinical nurse practitioners. The patients are cared for on an elective orthopedic ward with nursing staff, physiotherapists, and occupational therapists who work regularly with spinal surgery patients. The mean age of our spinal surgery patients is 55 years and 55% are female. By age-group, 6.6% are aged 1–16 years, 50.8% aged 17–65 years, and 42.6% over 65 years. We define elective spinal surgery as non-emergency surgery, including discectomy, decompression, fusion and realignment operations to the cervical, thoracic and lumbar spine.
Developing the Pathway
To develop the new pathway, input from the expert team of anesthesiologists and surgeons, other clinicians and staff, as well as patients were sought. Four patients were approached prior to surgery and asked for their thoughts on the existing clinical pathway. They were then shadowed during their journey by clinical staff to see where improvements to their clinical care could be made.
In addition to gathering input from staff and patients, we reviewed the literature for the best available evidence. We found a Cochrane review of 27 trials involving 1976 surgical patients that concluded that preoperative carbohydrate drinks reduced length of stay [6]. Similarly, although laxatives have not been shown to improve length of stay [7], it is known that constipation is exacerbated by opioid analgesia and causes distress [8].
Finally, we examined the ERPs for patients undergoing hip and knee replacement that already existed in our institution. We found they used standardized anesthetic regimens as well as “patient passports,” leaflets given to give patients telling them what to expect during and following joint replacement surgery. They were also implementing methods to help patients set daily aims on the ward.
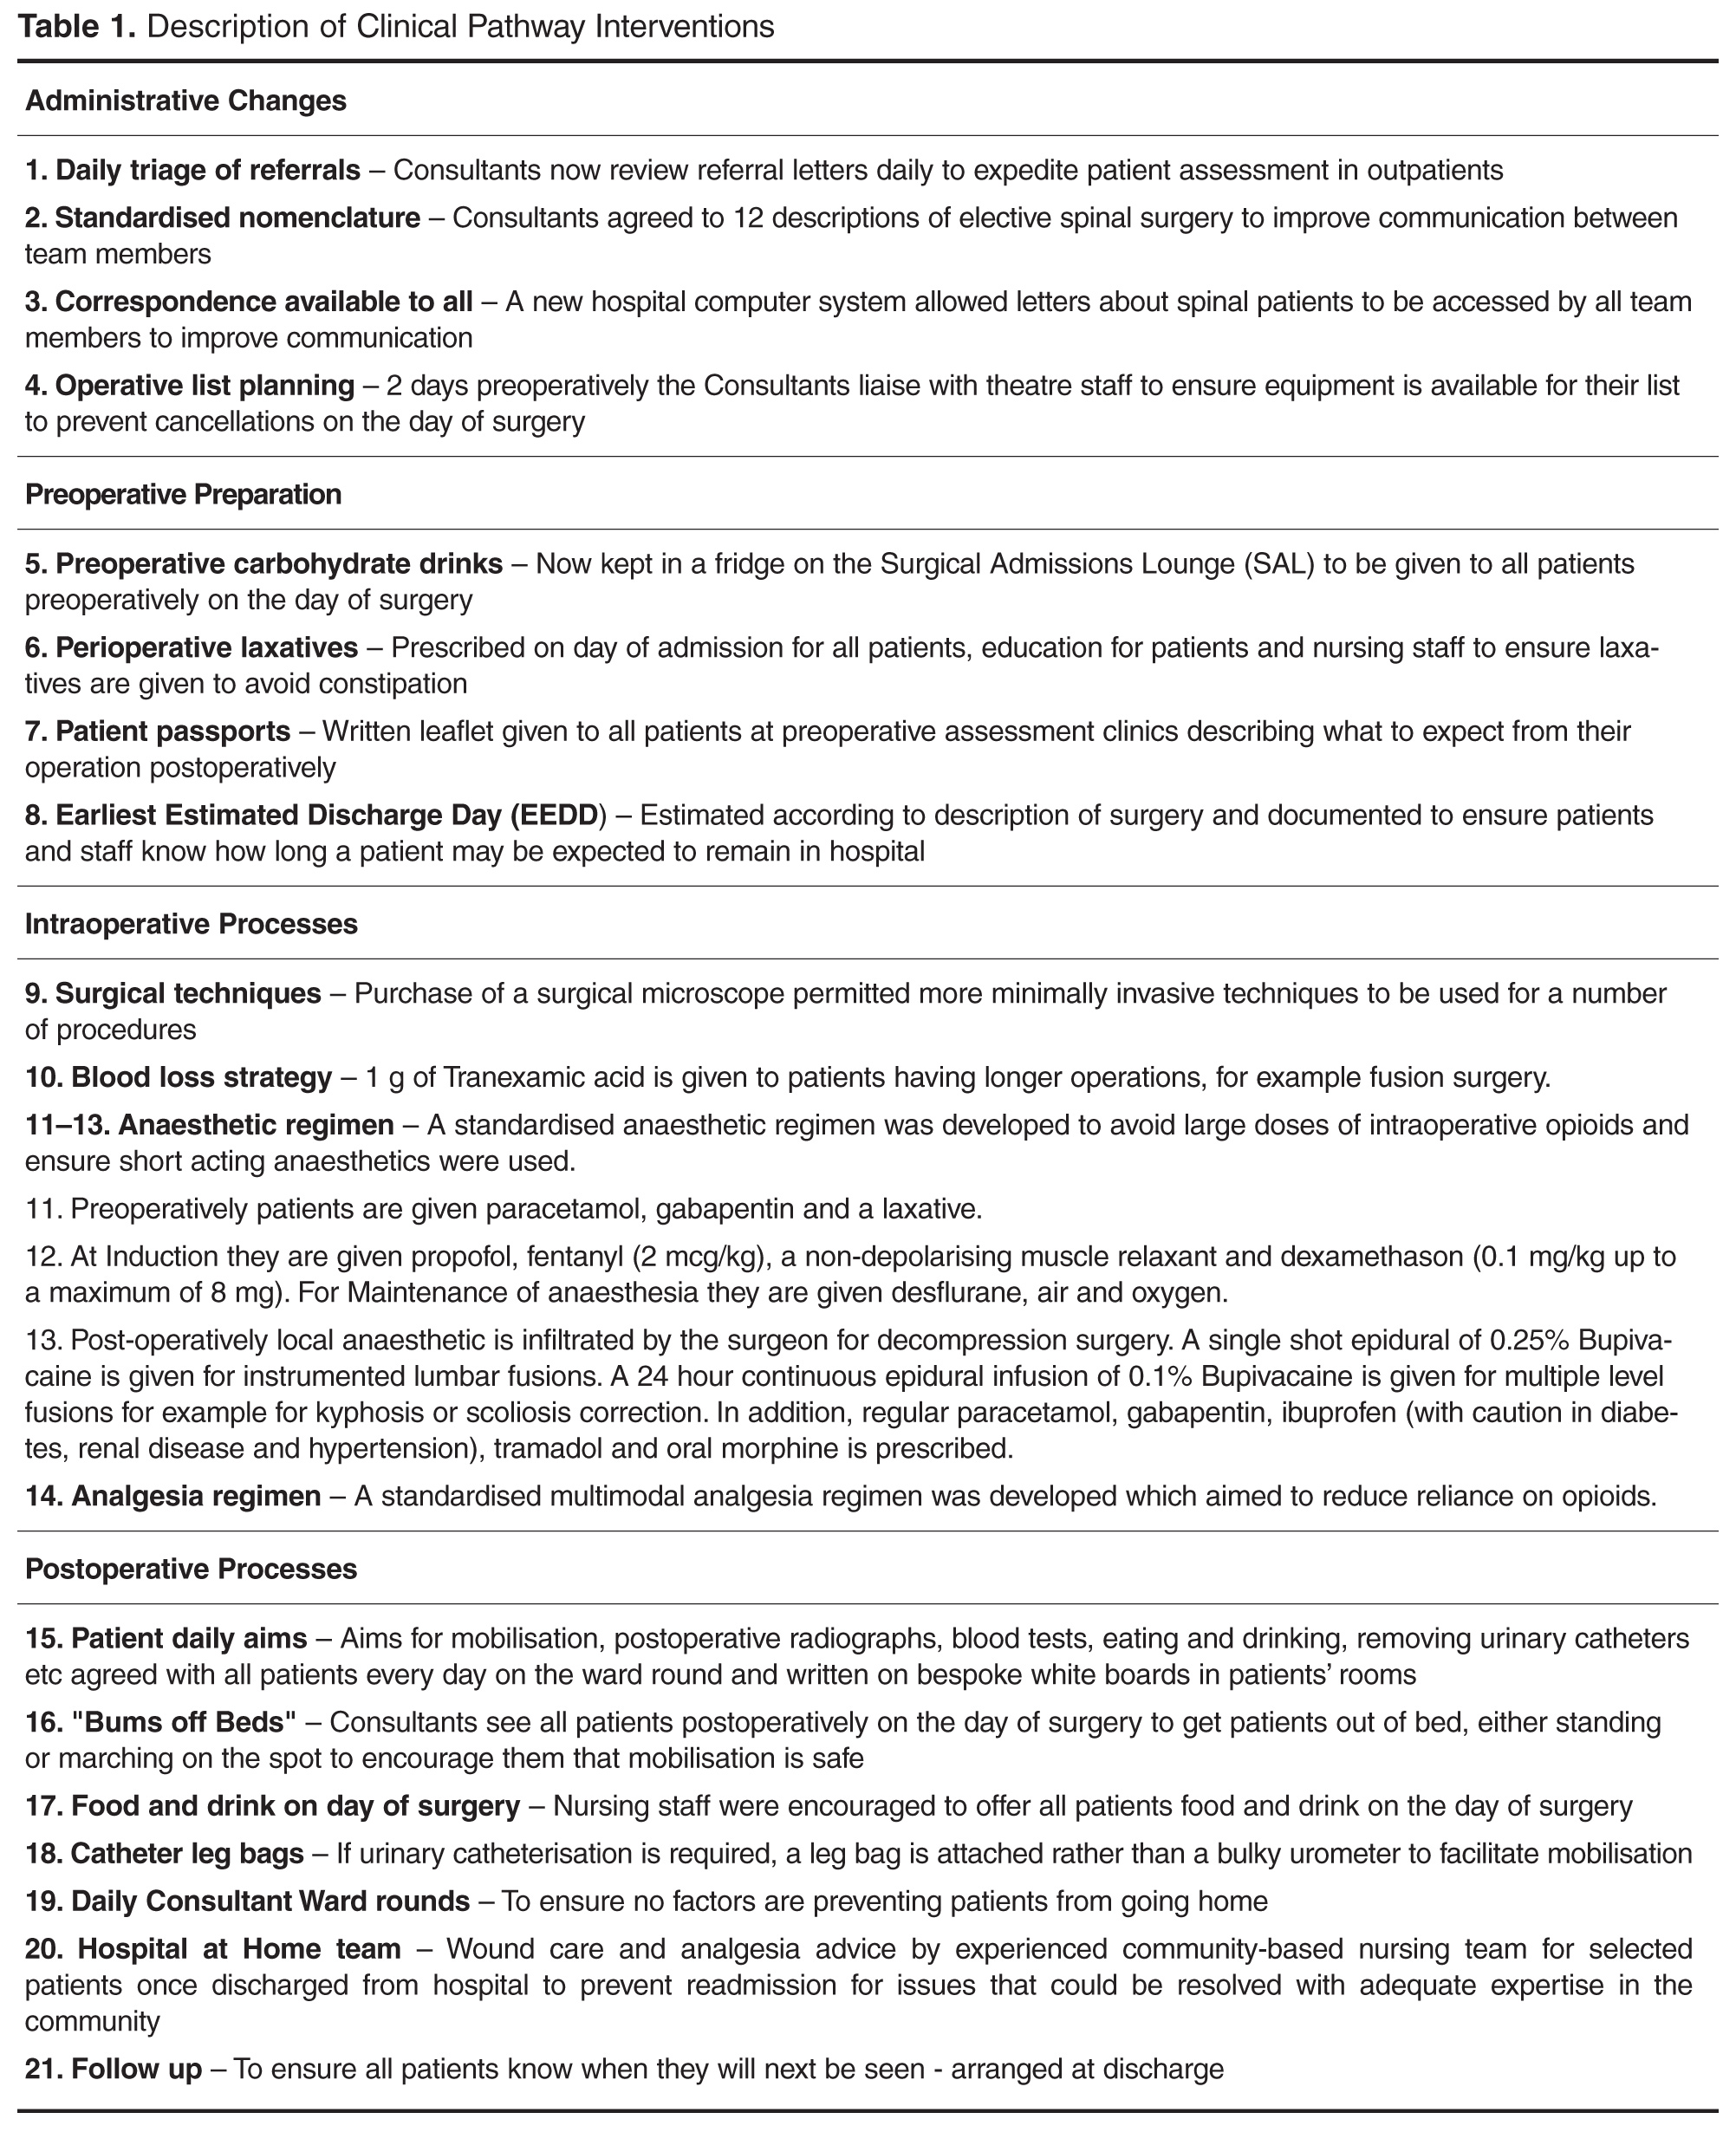
PDSA Cycles
We began PDSA testing in November 2013. Below we describe selected pathway changes that we expected to be challenging because they involved many staff from different groups. Interventions that involved fewer people or a smaller group (eg, a change in anesthetic regimen or surgical technique) were easier to implement.

Standardizing Nomenclature
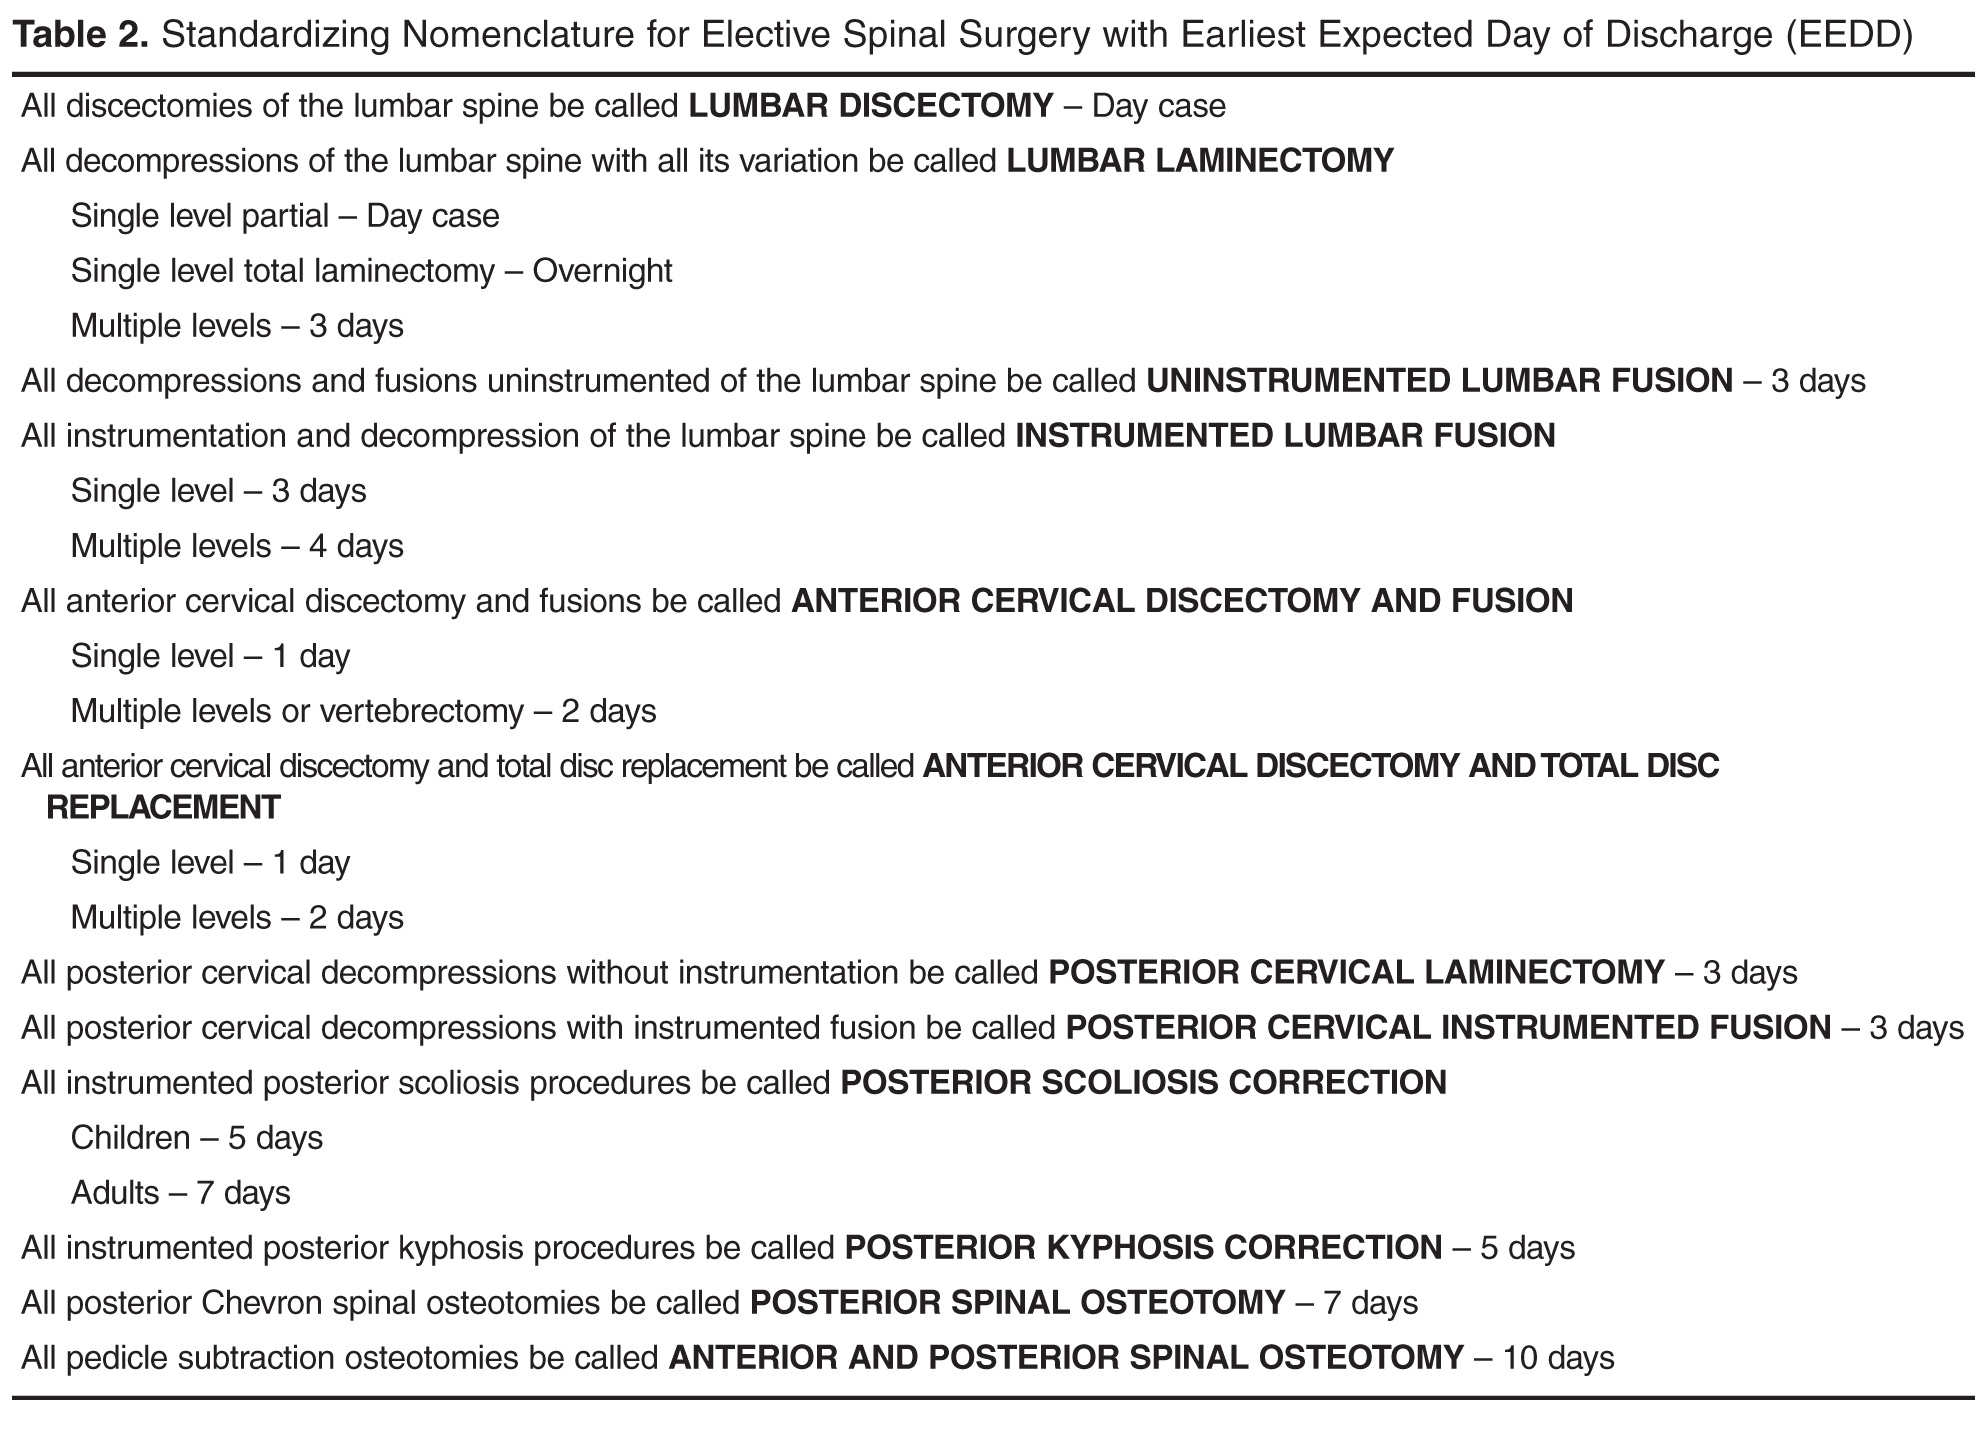
The spinal consultants agreed to 12 descriptions of elective spinal surgery to improve communication between team members (Table 2). They were able to reduce the number of procedure descriptions from 135 to just 12. Theatre staff could determine from the procedure descriptions which equipment was required for the operation and ensure it was available at the time needed. Anesthetic staff felt better able to prepare for their operating lists with a prescription for preoperative, intraoperative, and postoperative analgesia.
They also defined an earliest expected day of discharge (EEDD) (Table 2), which was distributed to all members of the team. This information helped ward nurses and therapists were better able to plan to mobilize patients appropriately postoperatively and ensure consistency in communication of expected length of stay to patients.
Perioperative Laxatives
Laxatives were prescribed initially for one patient and we checked to see if the patient and nursing staff were happy with the change. In the next test cycle all patients on one consultant’s list were prescribed laxatives. To track laxative use, a data collection sheet was attached to the patient's medical records on admission. With improved data collection, laxatives were then prescribed on admission for all elective spinal patients. The process has now become routine, occurring even when key change agents are absent.
Preoperative Carbohydrate Drinks
Preoperative high-calorie drinks were initially prescribed for one surgeon’s patients who were predicted to be staying 2 or more nights in the hospital. The preoperative assessment clinic (POAC) staff were asked to give these patients preoperative carbohydrate drinks at their pre-assessment clinic, and patients would self-administer their carbohydrate drinks preoperatively. However, POAC staff found it too difficult to give drinks to some patients and not to others, so it was decided that all patients should receive a drink. The clinical nurse practitioners note that the drink is given on the data collection sheet. However, it was observed that when team champions did not remind staff to administer the preoperative carbohydrate drinks, they were not given. We then asked the surgical admissions lounge staff if they would give preoperative carbohydrate drinks to patients and they agreed. This worked better than using POAC staff.
Patient Daily Aims
Members of the team felt that setting daily aims with patients would help optimize and prepare them for discharge. A laminated sheet with handwritten aims was trialed with 1 patient. He found it very useful, particularly the aims on diet and mobilization. When tested on all patients for a week, not only did they find it useful but nursing staff felt it improved communication between shifts. With greater staff buy-in and a move into a new purpose-built ward, we used white boards that were affixed to the door to the ensuite bathroom in each single patient room. Aims were discussed on ward rounds with patients by consultants or clinical nurse practitioners, and the goals agreed upon with patients before being written on the white boards. They included goals such as removal of urinary catheters, mobilization independently or with staff, and requirements such as radiographs to check position of instrumentation. Spot-checks on the ward showed good compliance with setting daily aims and high rates of satisfaction from patients.
Hospital at Home
The Hospital at Home team consists of experienced community-based nurses who provide wound care and analgesia advice for selected patients postdischarge to prevent readmission. This team supported early discharge for patients undergoing hip and knee replacements, and when approached they felt they could offer wound care and analgesia advice in the community for spinal surgery patients. This was tested with one patient with a wound who had daily care at home for 8 days following discharge from hospital. A further 2 patients were later cared for by the Hospital at Home team, with a total of 7 bed days saved. It has now become routine for the team to accept spinal patients when they have the capacity.
Outcomes
Working with the IT department and data collection tools attached to the medical records, we collected data on key measures every 2 weeks. Statistical process control charts (Process Improvement Products, Austin, TX) [9,10] were used to analyze the data.
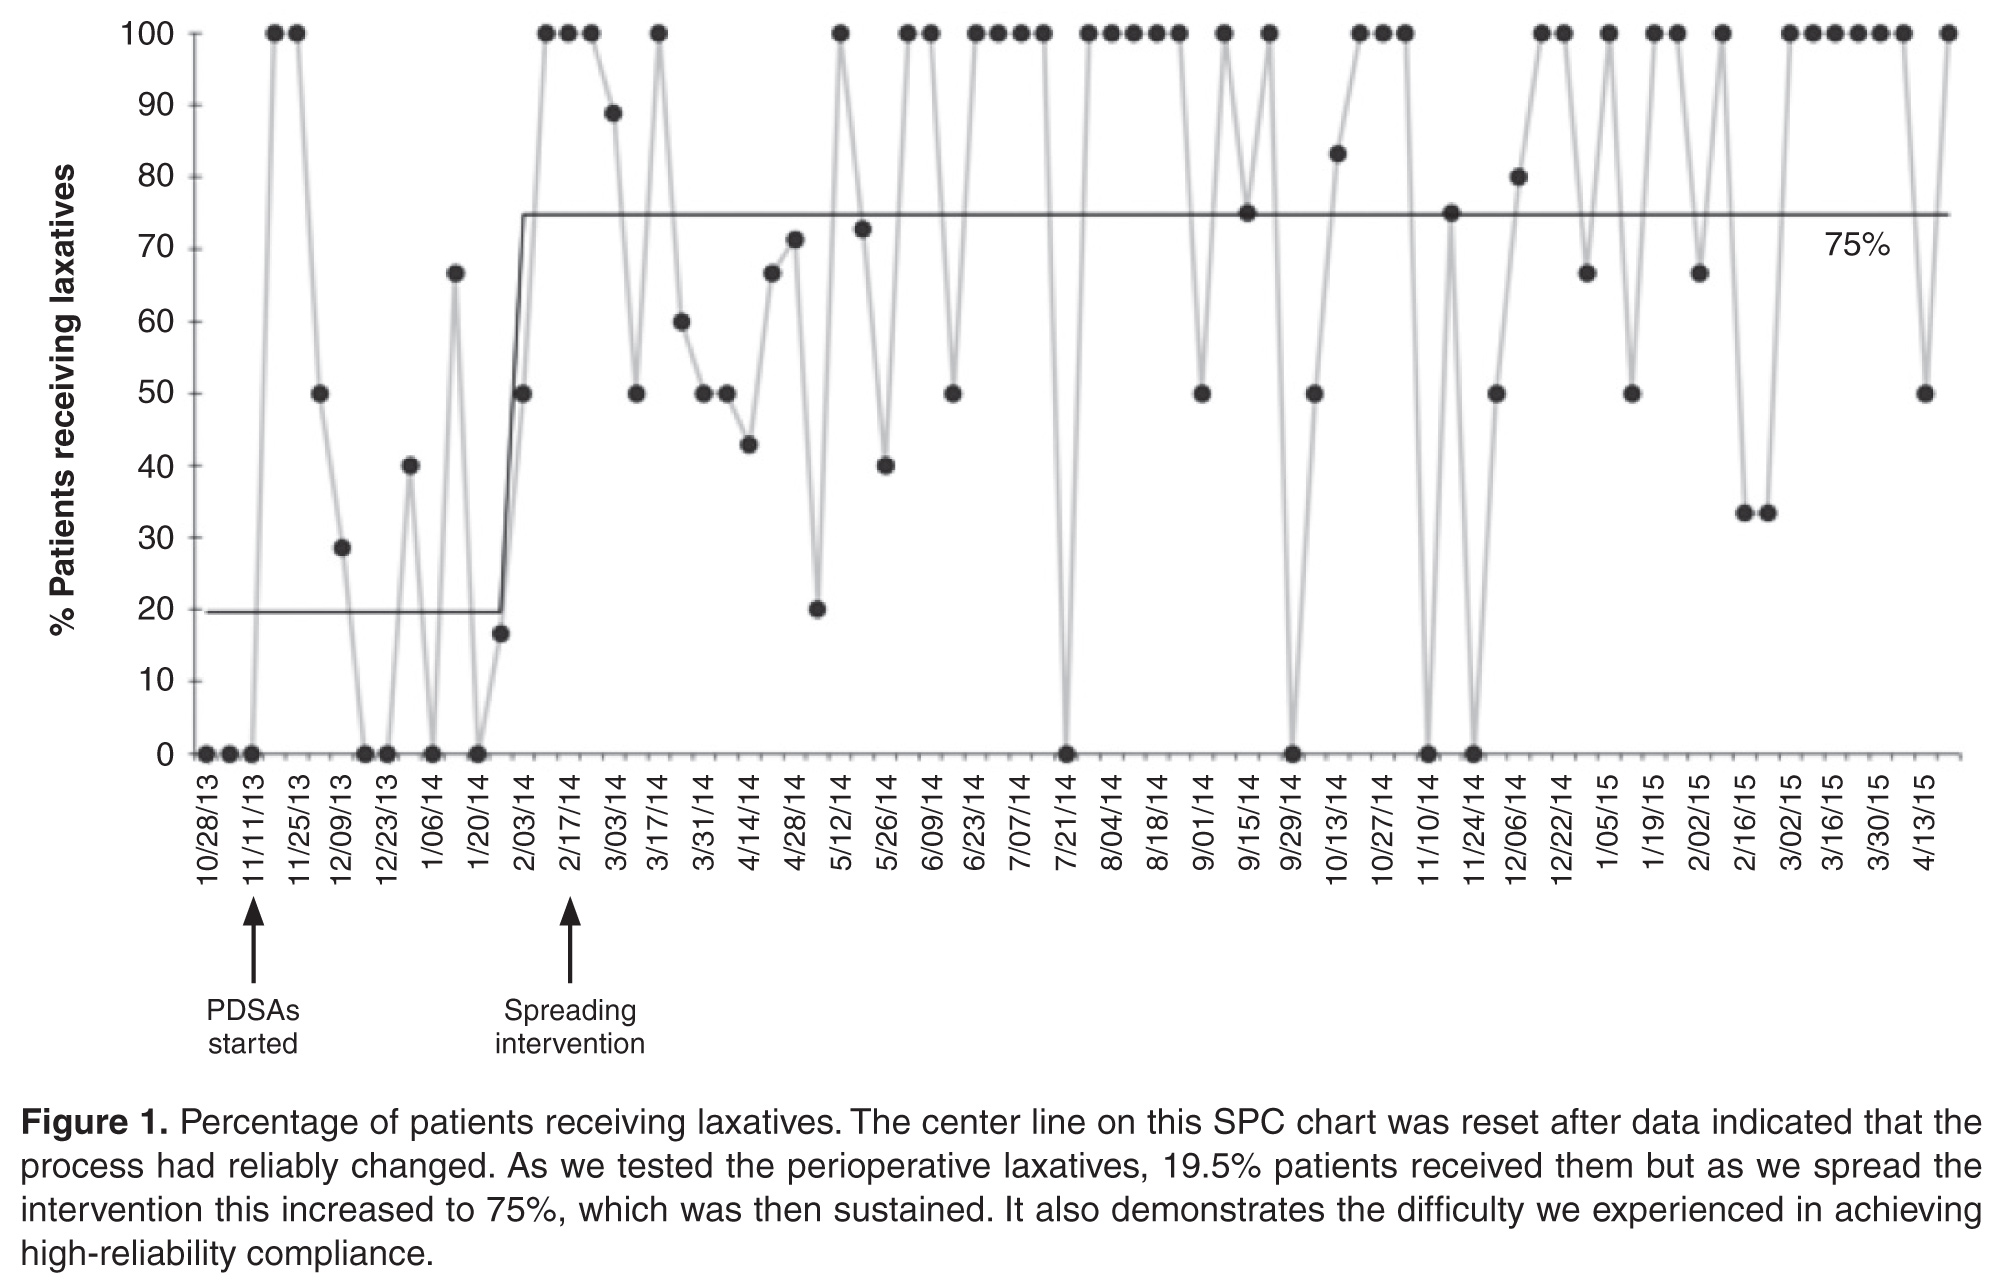
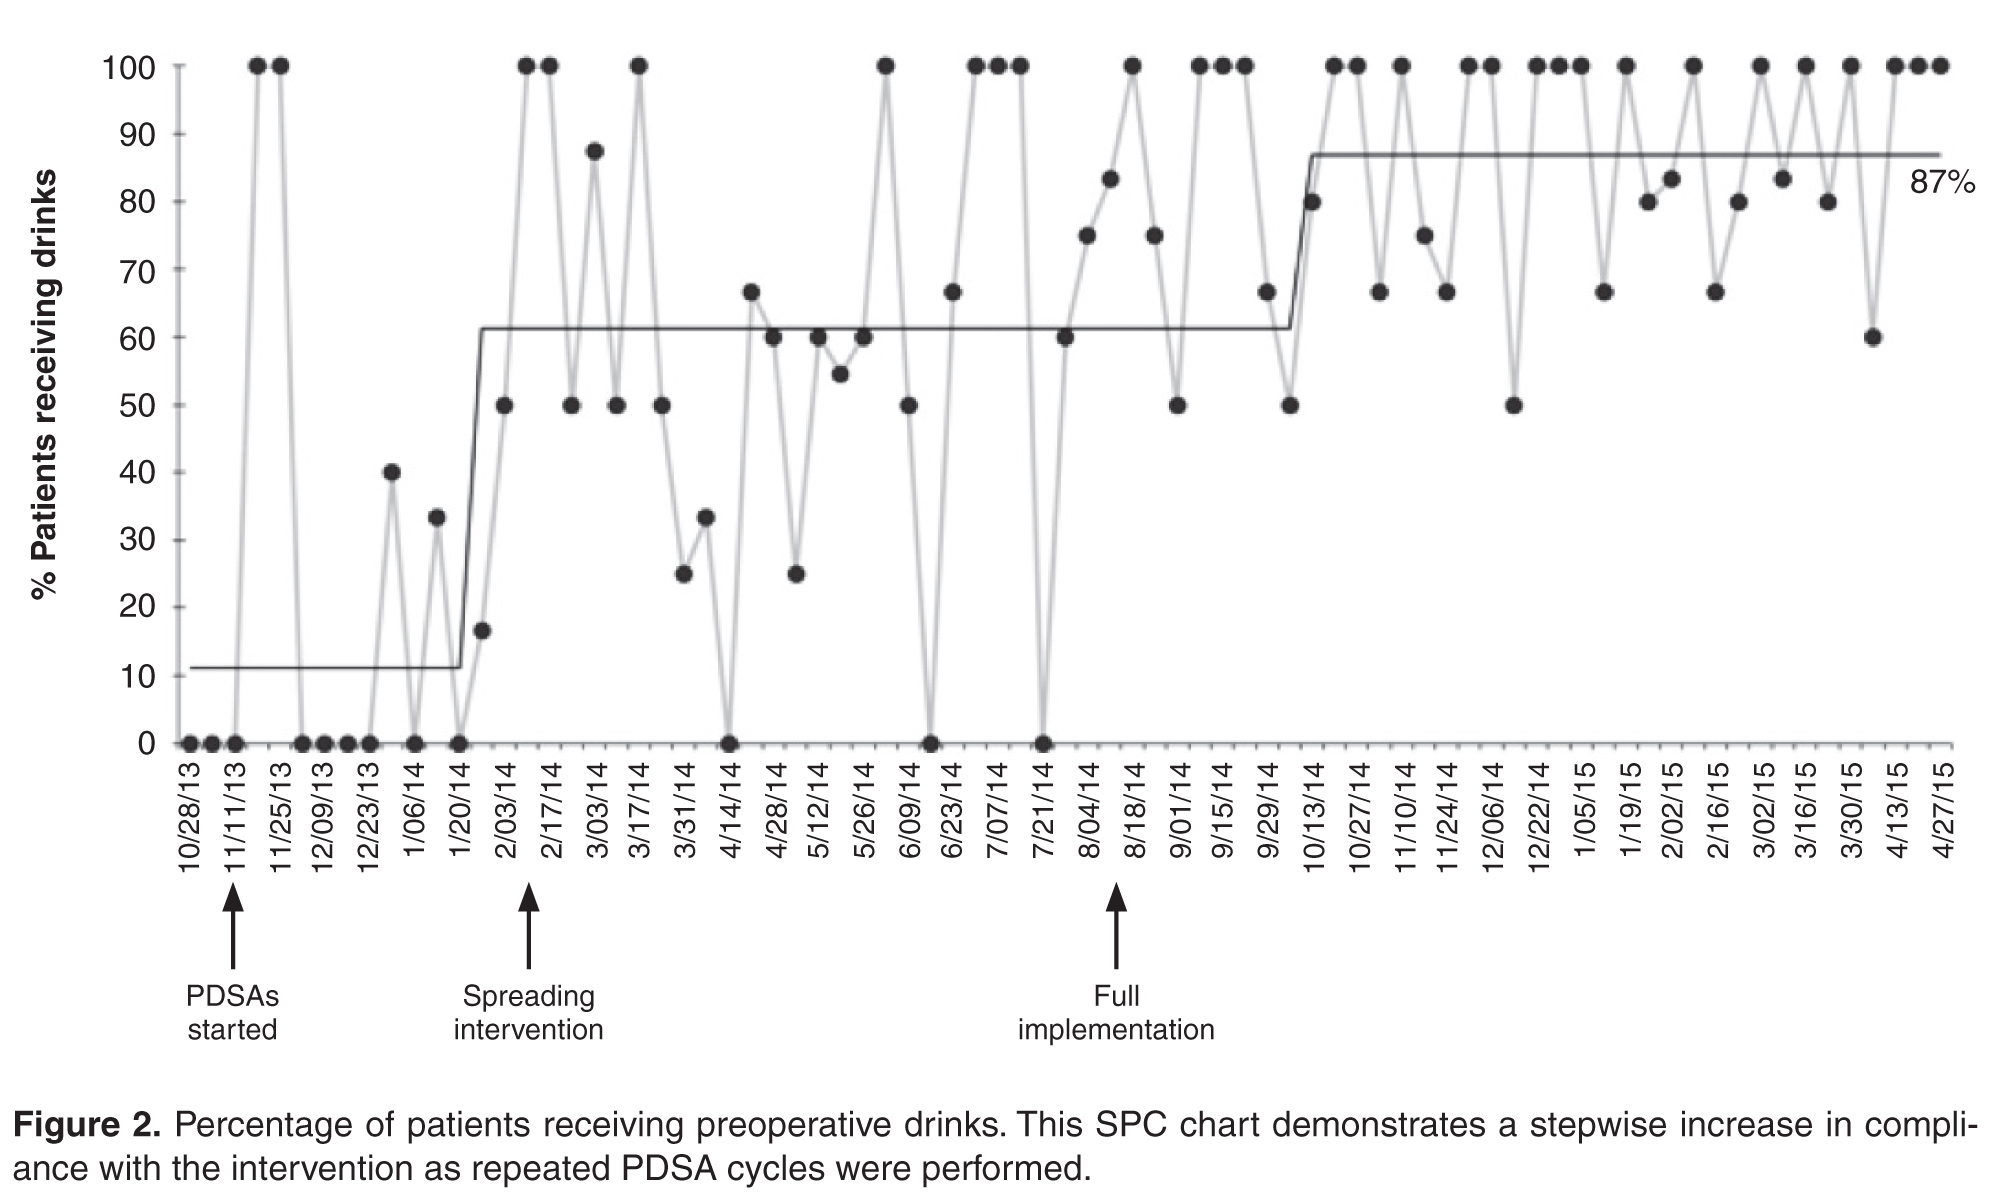
Length of stay was reduced by 52% (Figure 4), improving from an average of 6 days during the baseline period to 2.9 days by April 2015. Readmissions for elective spinal surgery patients did not increase and in fact were reduced from 7% to 3%.
By October 2014, 99% of eligible patients were managed on the new pathway and most patients were receiving key 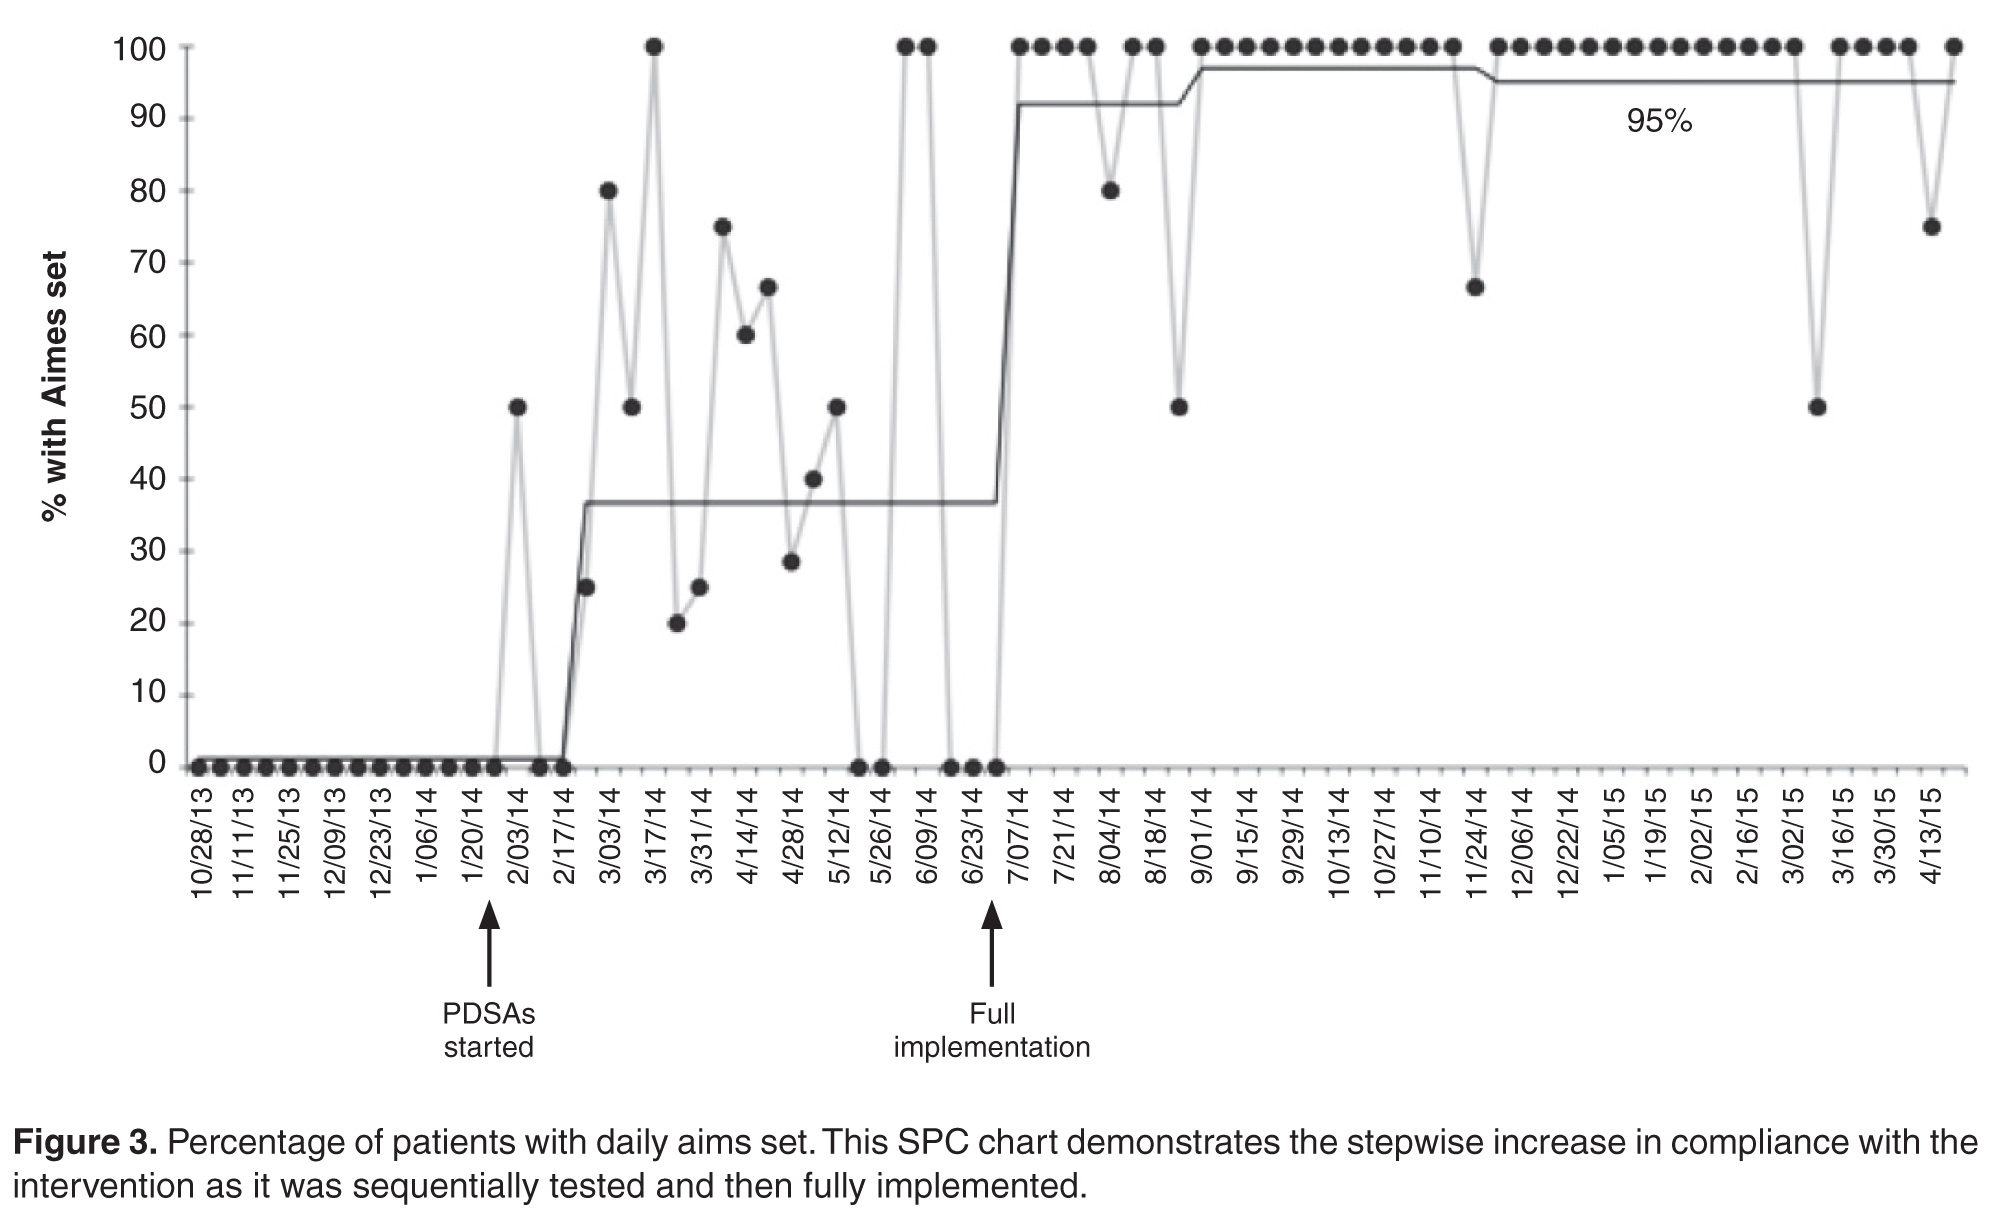
Discussion
The new pathway, the SpinaL Enhanced Recovery Program, improved reliability of care in our institution, with excellent patient satisfaction. It also exceeded its target in reducing length of stay for elective spinal surgery patients 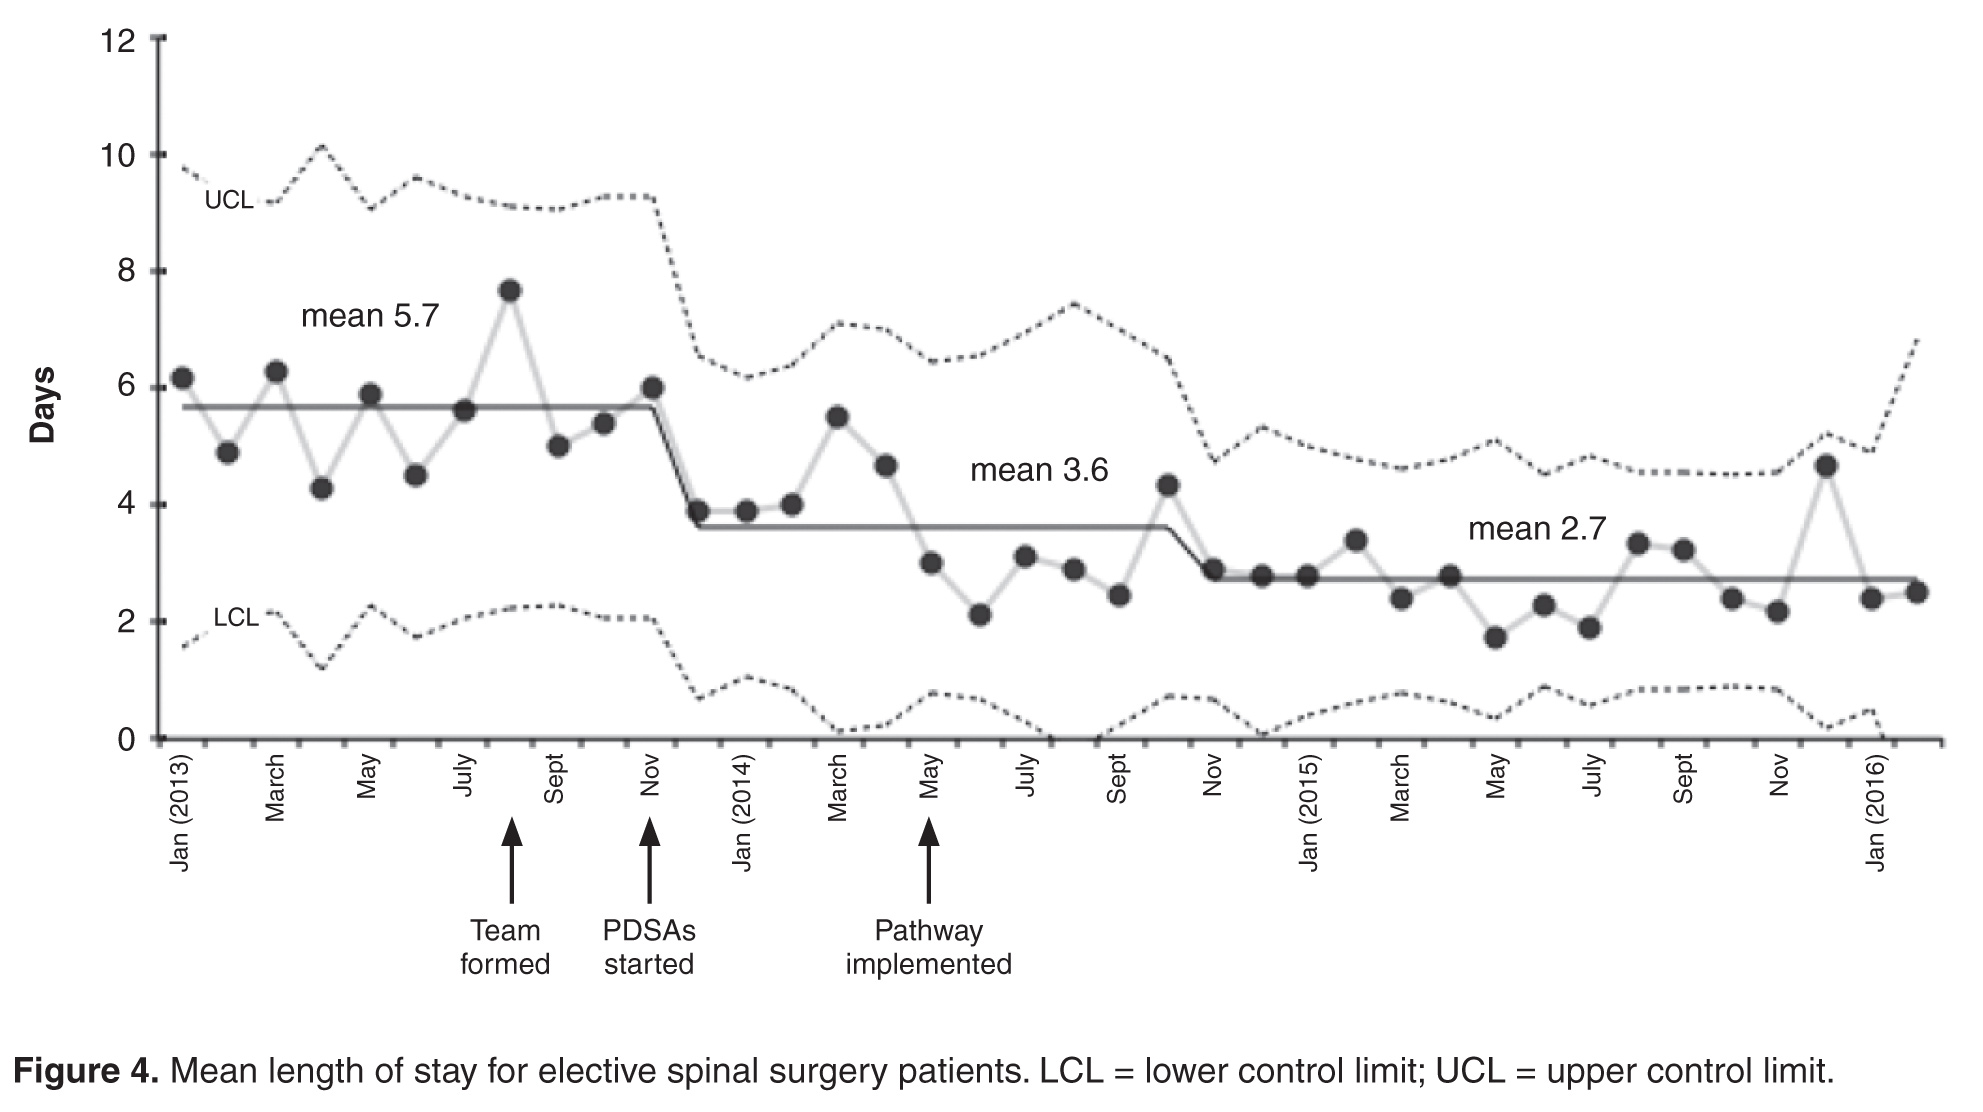
One of the main strengths of this work was the use of small scale testing for each change idea using PDSA cycles, ramping up the idea prior to full implementation. The team could see the impact of changes on a small scale, then make adaptations in the next cycle to increase the likelihood of success.
The development and implementation of the pathway has led to a positive culture change. The spinal team has taken ownership of the pathway and continues to monitor its impact. Seeing the impact of their work on improving the quality of patient care has enhanced the team’s self-efficacy.
The methods used to plan and study our interventions, as well as some of the change ideas themselves, may be helpful for other elective spinal surgical teams. The simple application of the interventions without the improvement process may not have delivered the same outcome. Meeting regularly as a team to discuss ideas and implement new interventions with the guidance of a quality improvement advisor (M.W.) was felt to be the most important factor for success. The team also felt that it was important to collect data by any means possible to monitor interventions and motivate staff before better automated systems were implemented.
The SpinaL Enhanced Recovery Program pathway has now become “business as usual,” and the team plans to incorporate the process and outcome measures onto a monthly performance dashboard to continue to monitor the interventions. Further interventions are planned, including improving preoperative education with a patient pathway video. The team has started to try to stagger admissions for all-day theatre lists, to avoid patients having to wait all day for an afternoon operation. Further improvements in the reliability of care will also potentially allow the team to run controlled studies of single interventions to see how these can impact quality of patient care in a stable process.
Acknowledgments: The authors acknowledge Deborah Ray, Institute for Healthcare Improvement; Sandra Murray, Associates in Healthcare Improvement; Matthew Beebee, Clinical Nurse Practitioner Spinal Surgery; Debbie Vile and Lorraine Sandford, Clinical Nurse Practitioners Spinal Surgery; Sophie Hudson and Sallie Durman, Secretaries; Eleanor Palfreman, Occupational Therapist; Sarah Woodhill, Physiotherapist; Lee Scott, Improvement Nurse; Gervaise Khan-Davis, Directorate Manager; and “SG,” previous patient.
Corresponding author: Dr Julia Blackburn, Musgrove Park Hospital, Taunton, England, TA1 5DA, jlrkblackburn@doctors.org.uk.
Financial disclosures: None.
1. Nicholson A, Lowe MC, Parker J, et al. Systematic review and meta-analysis of enhanced recovery programmes in surgical patients. Br J Surg 2014;101:172–88.
2. Venkata H, Van Dellen J. A perspective on the use of an Enhanced Recovery Programme in open, non-instrumented, ‘day-surgery’ for degenerative lumbar and cervical spinal conditions. J Neurosurg Sci 2016.
3. Mathiesen O, Dahl B, Thomsen B, et al. A comprehensive multimodal pain treatment reduces opioid consumption after multilevel spine surgery. Eur Spine J 2013;22:2089–96.
4. Fleege C, Almajali A, Rauschmann M, et al. Improve of surgical outcome in spinal fusion surgery. Evidence based peri- and intra-operative aspects to reduce complications and earlier recovery. Der Orthopade 2014;43:1070–8.
5. Fleege C, Arabmotlagh M, Almajali A, et al. Pre- and postoperative fast-track treatment concepts in spinal surgery. Patient information and patient cooperation. Der Orthopade 2014;43:1062.
6. Smith MD, McCall J, Plank L, et al. Preoperative carbohydrate treatment for enhancing recovery after elective surgery. Cochrane Database Syst Rev 2014;8:CD009161.
7. Hendry PO, van Dam RM, Bukkems SF, et al. Randomized clinical trial of laxatives and oral nutritional supplements within an enhanced recovery after surgery protocol following liver resection. Br J Surg 2010;97:1198–206.
8. Marciniak CM, Toledo S, Lee J, et al. Lubiprostone vs senna in postoperative orthopedic surgery patients with opioid-induced constipation: a double-blind, active-comparator trial. World J Gastroenterol 2014;20:16323–33.
9. Benneyan J, Lloyd R, Plsek P. Statistical process control as a tool for research and healthcare improvement. Qual Safety Health Care 2003;12:458–64.
10. Portela MC, Pronovost PJ, Woodcock T, et al. How to study improvement interventions: a brief overview of possible study types. BMJ Qual Safety 2015;24:325–36.
From Musgrove Park Hospital, Taunton, England.
Abstract
- Objective: To describe a redesign of the clinical pathway for patients undergoing elective spinal surgery in order to improve quality of care and reduce length of stay.
- Methods: A multidisciplinary team undertook a process-mapping exercise and shadowed patients to analyse problems with the existing clinical pathway. Further ideas were taken from best evidence and other published enhanced recovery programs. Change ideas were tested using Plan-Do-Study-Act cycles. Measures included length of hospital stay, compliance with the pathway, and patient satisfaction.
- Results: The new pathway, the SpinaL Enhanced Recovery Program, is now used by 99% of elective spinal surgery patients with 100% of patients rating their care as good or excellent. Length of stay was reduced by 52%, improving from 5.7 days at the start of the intervention to 2.7 days. The pathway improved reliability of care, with preoperative carbohydrate drinks used in 83% of patients.
- Conclusion: The pathway improved reliability of care in our institution with excellent patient satisfaction and a significant reduction in length of hospital stay.
Enhanced recovery programs (ERPs) have been developed in many surgical specialties to improve patient outcomes and recovery after elective surgery. They involve multiple interventions throughout the patient journey, from preoperative patient education to postoperative mobilization and analgesia schedules. A meta-analysis of 38 trials involving 5099 participants showed ERPs could reduce length of stay and overall complication rates across surgical specialties [1].
There have been few studies of ERP for spinal surgery populations [2]. Most of them have studied selected patients or selected interventions such as analgesia schedules and did not use quality improvement methodology. For example, a small retrospective study compared patients undergoing multilevel spinal fusion surgery before and after introduction of a multimodal analgesia regimen [3]. A review of innovative perioperative and intraoperative treatment algorithms showed that they can influence postoperative recovery and patient outcomes from lumbar spinal surgery [4]. A study from the same group found that patient education and a “fast-track” pathway reduced length of hospital stay and improved patient satisfaction for patients undergoing 1- or 2- level lumbar spinal fusion [5].
At our hospital, a meeting of the clinicians and staff involved in elective spinal surgery was held to discuss the service. Leadership came from a consultant anesthesiologist and a consultant spinal surgeon, who recognized that care was not as efficient as it could be. A multidisciplinary team was formed consisting of 30 members, including surgeons, clinical nurse practitioners, physiotherapists, occupational therapists, and secretarial staff. The team undertook a process-mapping exercise that revealed that patients followed an ill-defined care pathway with variability in administrative processes and clinical care. Patient feedback and reports from both secretarial and community staff revealed that communications from the spinal team could be inconsistent, and patients had unclear expectations of their care and recovery. Lengths of stay for the same procedure could vary by 3 days.
With support from the hospital’s chief executive and medical director, the team embarked on a process to redesign the clinical pathway for patients undergoing elective spinal surgery at our hospital. We developed the SpinaL Enhanced Recovery Program; our primary aims were to to have 95% of patients managed according to the new pathway, to reduce length of stay by 30% without a rise in readmission rates, and to improve patient satisfaction.
Methods
Ethical Issues
This work met criteria for operational improvement activities and as such was exempt from ethics review. The team engaged patients who had undergone spinal surgery to serve as representatives to ensure that the improvements studied were important to them.
Setting and Patients
Our institution is a District General Hospital that serves a population of over 340,000 and has 3 consultant spinal surgeons. They work with 5 anesthesiologists on a regular basis and the patients are cared for by 3 clinical nurse practitioners. The patients are cared for on an elective orthopedic ward with nursing staff, physiotherapists, and occupational therapists who work regularly with spinal surgery patients. The mean age of our spinal surgery patients is 55 years and 55% are female. By age-group, 6.6% are aged 1–16 years, 50.8% aged 17–65 years, and 42.6% over 65 years. We define elective spinal surgery as non-emergency surgery, including discectomy, decompression, fusion and realignment operations to the cervical, thoracic and lumbar spine.
Developing the Pathway
To develop the new pathway, input from the expert team of anesthesiologists and surgeons, other clinicians and staff, as well as patients were sought. Four patients were approached prior to surgery and asked for their thoughts on the existing clinical pathway. They were then shadowed during their journey by clinical staff to see where improvements to their clinical care could be made.
In addition to gathering input from staff and patients, we reviewed the literature for the best available evidence. We found a Cochrane review of 27 trials involving 1976 surgical patients that concluded that preoperative carbohydrate drinks reduced length of stay [6]. Similarly, although laxatives have not been shown to improve length of stay [7], it is known that constipation is exacerbated by opioid analgesia and causes distress [8].
Finally, we examined the ERPs for patients undergoing hip and knee replacement that already existed in our institution. We found they used standardized anesthetic regimens as well as “patient passports,” leaflets given to give patients telling them what to expect during and following joint replacement surgery. They were also implementing methods to help patients set daily aims on the ward.
PDSA Cycles
We began PDSA testing in November 2013. Below we describe selected pathway changes that we expected to be challenging because they involved many staff from different groups. Interventions that involved fewer people or a smaller group (eg, a change in anesthetic regimen or surgical technique) were easier to implement.
Standardizing Nomenclature
The spinal consultants agreed to 12 descriptions of elective spinal surgery to improve communication between team members (Table 2). They were able to reduce the number of procedure descriptions from 135 to just 12. Theatre staff could determine from the procedure descriptions which equipment was required for the operation and ensure it was available at the time needed. Anesthetic staff felt better able to prepare for their operating lists with a prescription for preoperative, intraoperative, and postoperative analgesia.
They also defined an earliest expected day of discharge (EEDD) (Table 2), which was distributed to all members of the team. This information helped ward nurses and therapists were better able to plan to mobilize patients appropriately postoperatively and ensure consistency in communication of expected length of stay to patients.
Perioperative Laxatives
Laxatives were prescribed initially for one patient and we checked to see if the patient and nursing staff were happy with the change. In the next test cycle all patients on one consultant’s list were prescribed laxatives. To track laxative use, a data collection sheet was attached to the patient's medical records on admission. With improved data collection, laxatives were then prescribed on admission for all elective spinal patients. The process has now become routine, occurring even when key change agents are absent.
Preoperative Carbohydrate Drinks
Preoperative high-calorie drinks were initially prescribed for one surgeon’s patients who were predicted to be staying 2 or more nights in the hospital. The preoperative assessment clinic (POAC) staff were asked to give these patients preoperative carbohydrate drinks at their pre-assessment clinic, and patients would self-administer their carbohydrate drinks preoperatively. However, POAC staff found it too difficult to give drinks to some patients and not to others, so it was decided that all patients should receive a drink. The clinical nurse practitioners note that the drink is given on the data collection sheet. However, it was observed that when team champions did not remind staff to administer the preoperative carbohydrate drinks, they were not given. We then asked the surgical admissions lounge staff if they would give preoperative carbohydrate drinks to patients and they agreed. This worked better than using POAC staff.
Patient Daily Aims
Members of the team felt that setting daily aims with patients would help optimize and prepare them for discharge. A laminated sheet with handwritten aims was trialed with 1 patient. He found it very useful, particularly the aims on diet and mobilization. When tested on all patients for a week, not only did they find it useful but nursing staff felt it improved communication between shifts. With greater staff buy-in and a move into a new purpose-built ward, we used white boards that were affixed to the door to the ensuite bathroom in each single patient room. Aims were discussed on ward rounds with patients by consultants or clinical nurse practitioners, and the goals agreed upon with patients before being written on the white boards. They included goals such as removal of urinary catheters, mobilization independently or with staff, and requirements such as radiographs to check position of instrumentation. Spot-checks on the ward showed good compliance with setting daily aims and high rates of satisfaction from patients.
Hospital at Home
The Hospital at Home team consists of experienced community-based nurses who provide wound care and analgesia advice for selected patients postdischarge to prevent readmission. This team supported early discharge for patients undergoing hip and knee replacements, and when approached they felt they could offer wound care and analgesia advice in the community for spinal surgery patients. This was tested with one patient with a wound who had daily care at home for 8 days following discharge from hospital. A further 2 patients were later cared for by the Hospital at Home team, with a total of 7 bed days saved. It has now become routine for the team to accept spinal patients when they have the capacity.
Outcomes
Working with the IT department and data collection tools attached to the medical records, we collected data on key measures every 2 weeks. Statistical process control charts (Process Improvement Products, Austin, TX) [9,10] were used to analyze the data.
Length of stay was reduced by 52% (Figure 4), improving from an average of 6 days during the baseline period to 2.9 days by April 2015. Readmissions for elective spinal surgery patients did not increase and in fact were reduced from 7% to 3%.
By October 2014, 99% of eligible patients were managed on the new pathway and most patients were receiving key
Discussion
The new pathway, the SpinaL Enhanced Recovery Program, improved reliability of care in our institution, with excellent patient satisfaction. It also exceeded its target in reducing length of stay for elective spinal surgery patients
One of the main strengths of this work was the use of small scale testing for each change idea using PDSA cycles, ramping up the idea prior to full implementation. The team could see the impact of changes on a small scale, then make adaptations in the next cycle to increase the likelihood of success.
The development and implementation of the pathway has led to a positive culture change. The spinal team has taken ownership of the pathway and continues to monitor its impact. Seeing the impact of their work on improving the quality of patient care has enhanced the team’s self-efficacy.
The methods used to plan and study our interventions, as well as some of the change ideas themselves, may be helpful for other elective spinal surgical teams. The simple application of the interventions without the improvement process may not have delivered the same outcome. Meeting regularly as a team to discuss ideas and implement new interventions with the guidance of a quality improvement advisor (M.W.) was felt to be the most important factor for success. The team also felt that it was important to collect data by any means possible to monitor interventions and motivate staff before better automated systems were implemented.
The SpinaL Enhanced Recovery Program pathway has now become “business as usual,” and the team plans to incorporate the process and outcome measures onto a monthly performance dashboard to continue to monitor the interventions. Further interventions are planned, including improving preoperative education with a patient pathway video. The team has started to try to stagger admissions for all-day theatre lists, to avoid patients having to wait all day for an afternoon operation. Further improvements in the reliability of care will also potentially allow the team to run controlled studies of single interventions to see how these can impact quality of patient care in a stable process.
Acknowledgments: The authors acknowledge Deborah Ray, Institute for Healthcare Improvement; Sandra Murray, Associates in Healthcare Improvement; Matthew Beebee, Clinical Nurse Practitioner Spinal Surgery; Debbie Vile and Lorraine Sandford, Clinical Nurse Practitioners Spinal Surgery; Sophie Hudson and Sallie Durman, Secretaries; Eleanor Palfreman, Occupational Therapist; Sarah Woodhill, Physiotherapist; Lee Scott, Improvement Nurse; Gervaise Khan-Davis, Directorate Manager; and “SG,” previous patient.
Corresponding author: Dr Julia Blackburn, Musgrove Park Hospital, Taunton, England, TA1 5DA, jlrkblackburn@doctors.org.uk.
Financial disclosures: None.
1. Nicholson A, Lowe MC, Parker J, et al. Systematic review and meta-analysis of enhanced recovery programmes in surgical patients. Br J Surg 2014;101:172–88.
2. Venkata H, Van Dellen J. A perspective on the use of an Enhanced Recovery Programme in open, non-instrumented, ‘day-surgery’ for degenerative lumbar and cervical spinal conditions. J Neurosurg Sci 2016.
3. Mathiesen O, Dahl B, Thomsen B, et al. A comprehensive multimodal pain treatment reduces opioid consumption after multilevel spine surgery. Eur Spine J 2013;22:2089–96.
4. Fleege C, Almajali A, Rauschmann M, et al. Improve of surgical outcome in spinal fusion surgery. Evidence based peri- and intra-operative aspects to reduce complications and earlier recovery. Der Orthopade 2014;43:1070–8.
5. Fleege C, Arabmotlagh M, Almajali A, et al. Pre- and postoperative fast-track treatment concepts in spinal surgery. Patient information and patient cooperation. Der Orthopade 2014;43:1062.
6. Smith MD, McCall J, Plank L, et al. Preoperative carbohydrate treatment for enhancing recovery after elective surgery. Cochrane Database Syst Rev 2014;8:CD009161.
7. Hendry PO, van Dam RM, Bukkems SF, et al. Randomized clinical trial of laxatives and oral nutritional supplements within an enhanced recovery after surgery protocol following liver resection. Br J Surg 2010;97:1198–206.
8. Marciniak CM, Toledo S, Lee J, et al. Lubiprostone vs senna in postoperative orthopedic surgery patients with opioid-induced constipation: a double-blind, active-comparator trial. World J Gastroenterol 2014;20:16323–33.
9. Benneyan J, Lloyd R, Plsek P. Statistical process control as a tool for research and healthcare improvement. Qual Safety Health Care 2003;12:458–64.
10. Portela MC, Pronovost PJ, Woodcock T, et al. How to study improvement interventions: a brief overview of possible study types. BMJ Qual Safety 2015;24:325–36.
A Comparison of Conventional and Expanded Physician Assistant Hospitalist Staffing Models at a Community Hospital
From Physicians Inpatient Care Specialists (MDICS), Hanover, MD (Dr. Capstack, Ms. Vollono), Versant Statistical Solutions, Raleigh, NC (Ms. Segujja), Anne Arundel Medical Center, Annapolis, MD (Dr. Moser [at the time of the study], Dr. Meisenberg), and Johns Hopkins Hospital, Baltimore, MD (Dr. Michtalik).
Abstract
- Objective: To determine whether a higher than conventional physician assistant (PA)–to-physician hospitalist staffing ratio can achieve similar clinical outcomes for inpatients at a community hospital.
- Methods: Retrospective cohort study comparing 2 hospitalist groups at a 384-bed community hospital, one with a high PA-to-physician ratio model (“expanded PA”), with 3 physicians/3 PAs and the PAs rounding on 14 patients a day (35.73% of all visits), and the other with a low PA-to-physician ratio model (“conventional”), with 9 physicians/2 PAs and the PAs rounding on 9 patients a day (5.89% of all visits). For 16,964 adult patients discharged by the hospitalist groups with a medical principal APR-DRG code between January 2012 and June 2013, in-hospital mortality, cost of care, readmissions, length of stay (LOS) and consultant use were analyzed using logistic regression and adjusted for age, insurance status, severity of illness, and risk of mortality.
- Results: No statistically significant differences were found between the 2 groups for in-hospital mortality (odds ratio [OR], 0.89 [95% confidence interval {CI}, 0.66–1.19]; P = 0.42), readmissions (OR, 0.95 [95% CI, 0.87–1.04]; P = 0.27), length of stay (effect size 0.99 days shorter LOS in expanded PA group, 95% CI, 0.97 to 1.01 days; P = 0.34) or consultant use (OR 1.00, 95% CI 0.94–1.07, P = 0.90). Cost of care was less in the expanded PA group (effect size 3.52% less; estimated cost $2644 vs $2724; 95% CI 2.66%–4.39%, P < 0.001).
- Conclusion: An expanded PA hospitalist staffing model at a community hospital provided similar outcomes at a lower cost of care.
Hospitalist program staffing models must optimize efficiency while maintaining clinical outcomes in order to increase value and decrease costs [1]. The cost of hospitalist programs is burdensome, with nearly 94% of groups nationally requiring financial support beyond professional fees [2]. Nationally, for hospitalist groups serving adults, average institutional support is over $156,000 per physician full time equivalent (FTE) (182 twelve-hour clinical shifts per calendar year) [2]. Significant savings could be achieved if less costly physician assistants could be incorporated into clinical teams to provide similar care without sacrificing quality.
Nurse practitioners (NPs) and physician assistants (PAs) have been successfully employed on academic hospitalist services to complement physician staffing [3–10]. They perform admissions, consults, rounding visits and discharges with physician collaboration as permitted by each group’s policies and in accordance with hospital by-laws and state regulations. A median of 0.25 NP and 0.28 PA FTEs per physician FTE are employed by hospitalist groups that incorporate them, though staffing ratios vary widely [2].
Physicians Inpatient Care Specialists (MDICS) devel-oped a staffing model that deploys PAs to see a large proportion of its patients collaboratively with physicians, and with a higher patient census per PA than has been previously reported [2–5]. The group leaders believed that this would yield similar outcomes for patients at a lower cost to the supporting institution than a conventional staffing model which used fewer PAs to render patient care. Prior inpatient studies have demonstrated comparable clinical outcomes when comparing hospitalist PAs and NPs to residents and fellows [4–10], but to our knowledge no data exist directly comparing hospitalist PAs to hospitalist physicians. This study goes beyond prior work by examining the community, non-teaching setting, and directly comparing outcomes from the expanded use of PAs to those of a hospitalist group staffed with a greater proportion of attending physicians at the same hospital during the same time.
Methods
Setting
The study was performed at Anne Arundel Medical Center (AAMC), a 384-bed community hospital in Annapolis, Maryland, that serves a region of over 1 million people. Approximately 26,000 adult patients are discharged annually. During the study, more than 90% of internal medicine service inpatients were cared for by one of 2 hospitalist groups: a hospital-employed group (“conventional” group, Anne Arundel Medical Group) and a contracted hospitalist group (“expanded PA” group, Physicians Inpatient Care Specialists). The conventional group’s providers received a small incentive for Core Measures compliance for patients with stroke, myocardial infarction, congestive heart failure and pneumonia. The expanded PA group received a flat fee for providing hospitalist services and the group’s providers received a small incentive for productivity from their employer. The study was deemed exempt by the AAMC institutional review board.
Staffing Models, Patient Allocation, and Assignment
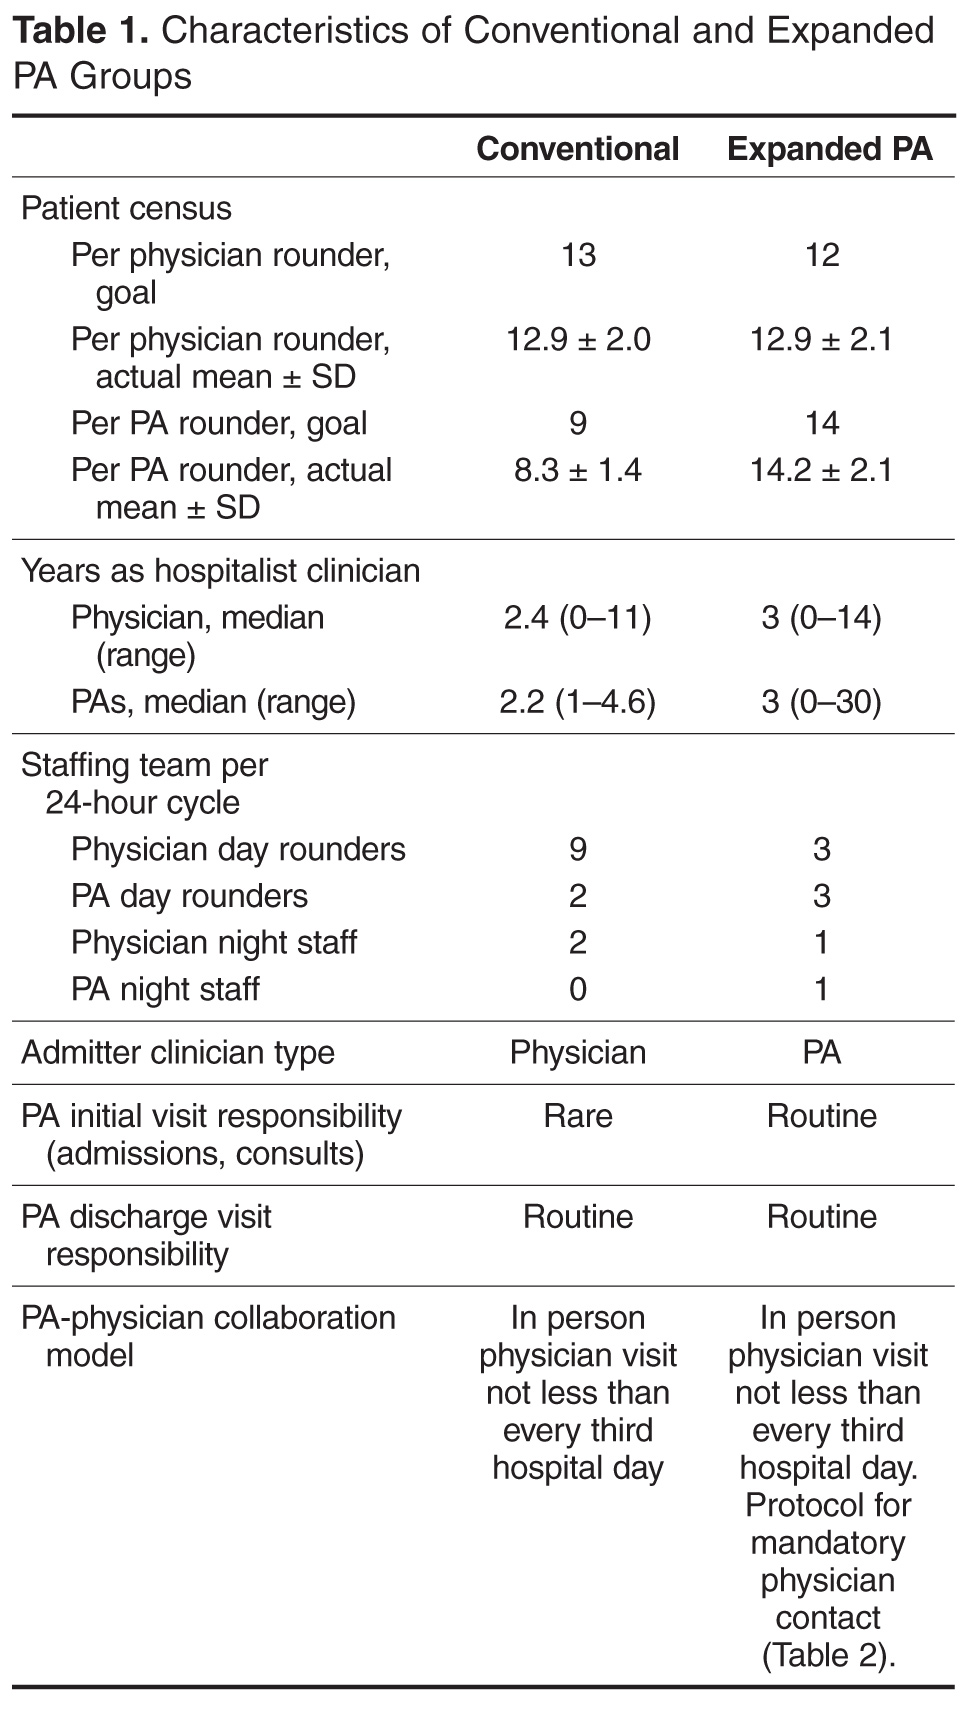
Admitted patients were designated to be admitted to one group or the other on the basis of standing arrangements with the patients’ primary care providers. Consultative referrals could also be made from subspecialists, who had discretion as to which group they wished to use.
Each morning, following sign-out report from the night team, each team of day providers determined which patients would be seen by which of their providers. Patients still on service from the previous day would be seen by the same provider again whenever possible in order to maintain continuity. Each individual provider had their own patients for the day who they rounded on independently and were responsible for. Physician involvement with patients seen primarily by PAs occurred as described below. Physicians in both groups were expected to take primary rounding responsibility for patients who were more acute or more complex based on morning sign-out report; there was no more formal mandate for patient allocation to particular provider type.
Physician-PA Collaboration
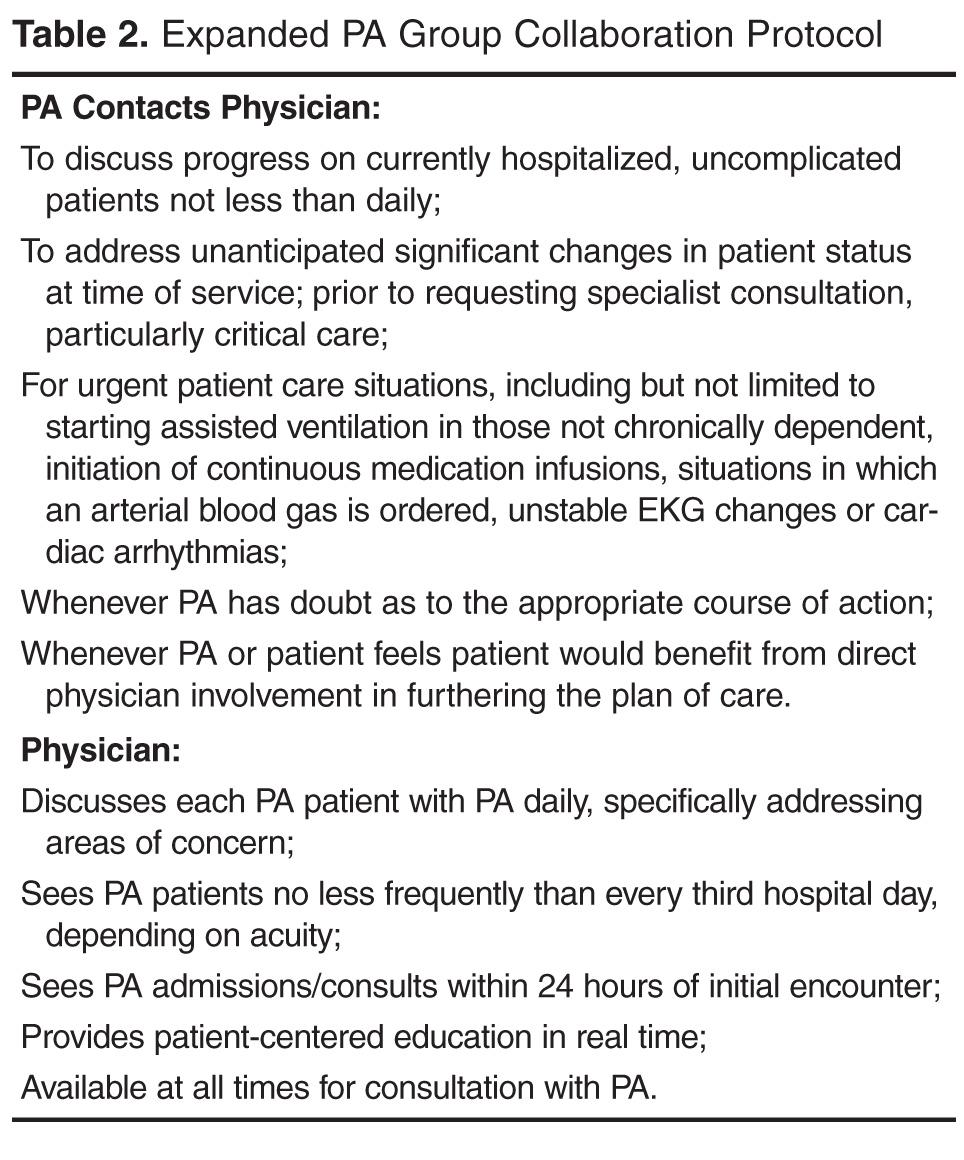
Patients
Patients discharged between 1 January 2012 and 30 June 2013 by the hospitalist groups were identified by searching AAMC’s Crimson Continuuum of Care (The Advisory Board, Washington, DC), a software analytic tool that is integrated with coded clinical data. Adult patient hospitalizations determined by Crimson to have a medical (non-surgical, non-obstetrical) APR-DRG code as the final principal diagnosis were included. Critically ill patients or those appropriate for “step-down unit” care were cared for by the in-house critical care staff; upon transfer out of critical or step-down care, patients were referred back to the admitting hospitalist team. A diagnosis (and its associated hospitalizations) was excluded for referral bias if the diagnosis was the principal diagnosis for at least 1% of a group’s discharges and the percentage of patients with that diagnosis was at least two times greater in one group than the other. Hospitalizations with a diagnosis of “ungroupable” (APR-DRG 956) were also excluded.
Measurements
Demographic, insurance status, cost of care, length of stay (LOS), APR-DRG (All Patient Refined Diagnosis-Related Group) severity of illness (SOI) and risk of mortality (ROM), consultant utilization, 30-day all-cause readmission (“readmission rate”), and mortality information was obtained from administrative data and exported into a single database for statistical analysis. Readmissions, inpatient mortality, and cost of care were the primary outcomes; consultant use and length of stay were secondary outcomes. A hospitalization was considered a readmission if the patient returned to inpatient status at AAMC for any reason within 30 days of a previous inpatient discharge. Inpatient mortality was defined as patient death during hospitalization. The cost of care was measured using the case charges associated with each encounter. Charge capture data from both groups was analyzed to classify visits as “physician-only,” “physician co-visit,” and “PA-only” visits. A co-visit consists of the physician visiting the patient after the PA has already done so on the same day, taking their own history and performing their own physical exam, and writing a brief progress note. These data were compared against the exported administrative data to find matching encounters and associated visits, with only matching visits included in the analysis. If a duplicate charge was entered on the same day for a patient, any conflict was resolved in favor of the physician visit. A total of 49,883 and 28,663 matching charges were identified for the conventional and expanded PA groups.
Statistical Methods
Odds of inpatient mortality were calculated using logistic regression and adjusted for age, insurance status, APR-DRG ROM, and LOS. Odds of readmission were calculated using logistic regression and adjusted for age, LOS, insurance and APR-DRG SOI. Cost of care (effect size) was examined using multiple linear regression and adjusted for age, APR-DRG SOI, insurance status and LOS. This model was fit using the logarithmic transformations of cost of care and LOS to correct deviation from normality. Robust regression using MM estimation was used to estimate group effects due to the existence of outliers and high leverage points. Length of stay (effect size) was assessed using the log-transformed variable and adjusted for APR-DRG SOI, age, insurance status and consultant use. Finally, category logistic regression models were fit to estimate the odds of consultant use in the study groups and adjusted for age, LOS, insurance status and APR-DRG SOI.
Results
Records review identified 17,294 adult patient hospitalizations determined by Crimson to have a medical (non-surgical, non-obstetrical) APR-DRG code as the final principal diagnosis. We excluded 15 expanded PA and 11 conventional hospitalizations that fell under APR-DRG code 956 “ungroupable.” Exclusion for referral bias resulted in the removal of 304 hospitalizations, 207 (3.03%) from the expanded PA group and 97 (0.92%) from the conventional group. These excluded hospitalizations came from 2 APR-DRG codes, urinary stones (code 465) and “other kidney and urinary tract diagnoses” (code 468). This left 6612 hospitalizations in the expanded PA group and 10,352 in the conventional group.
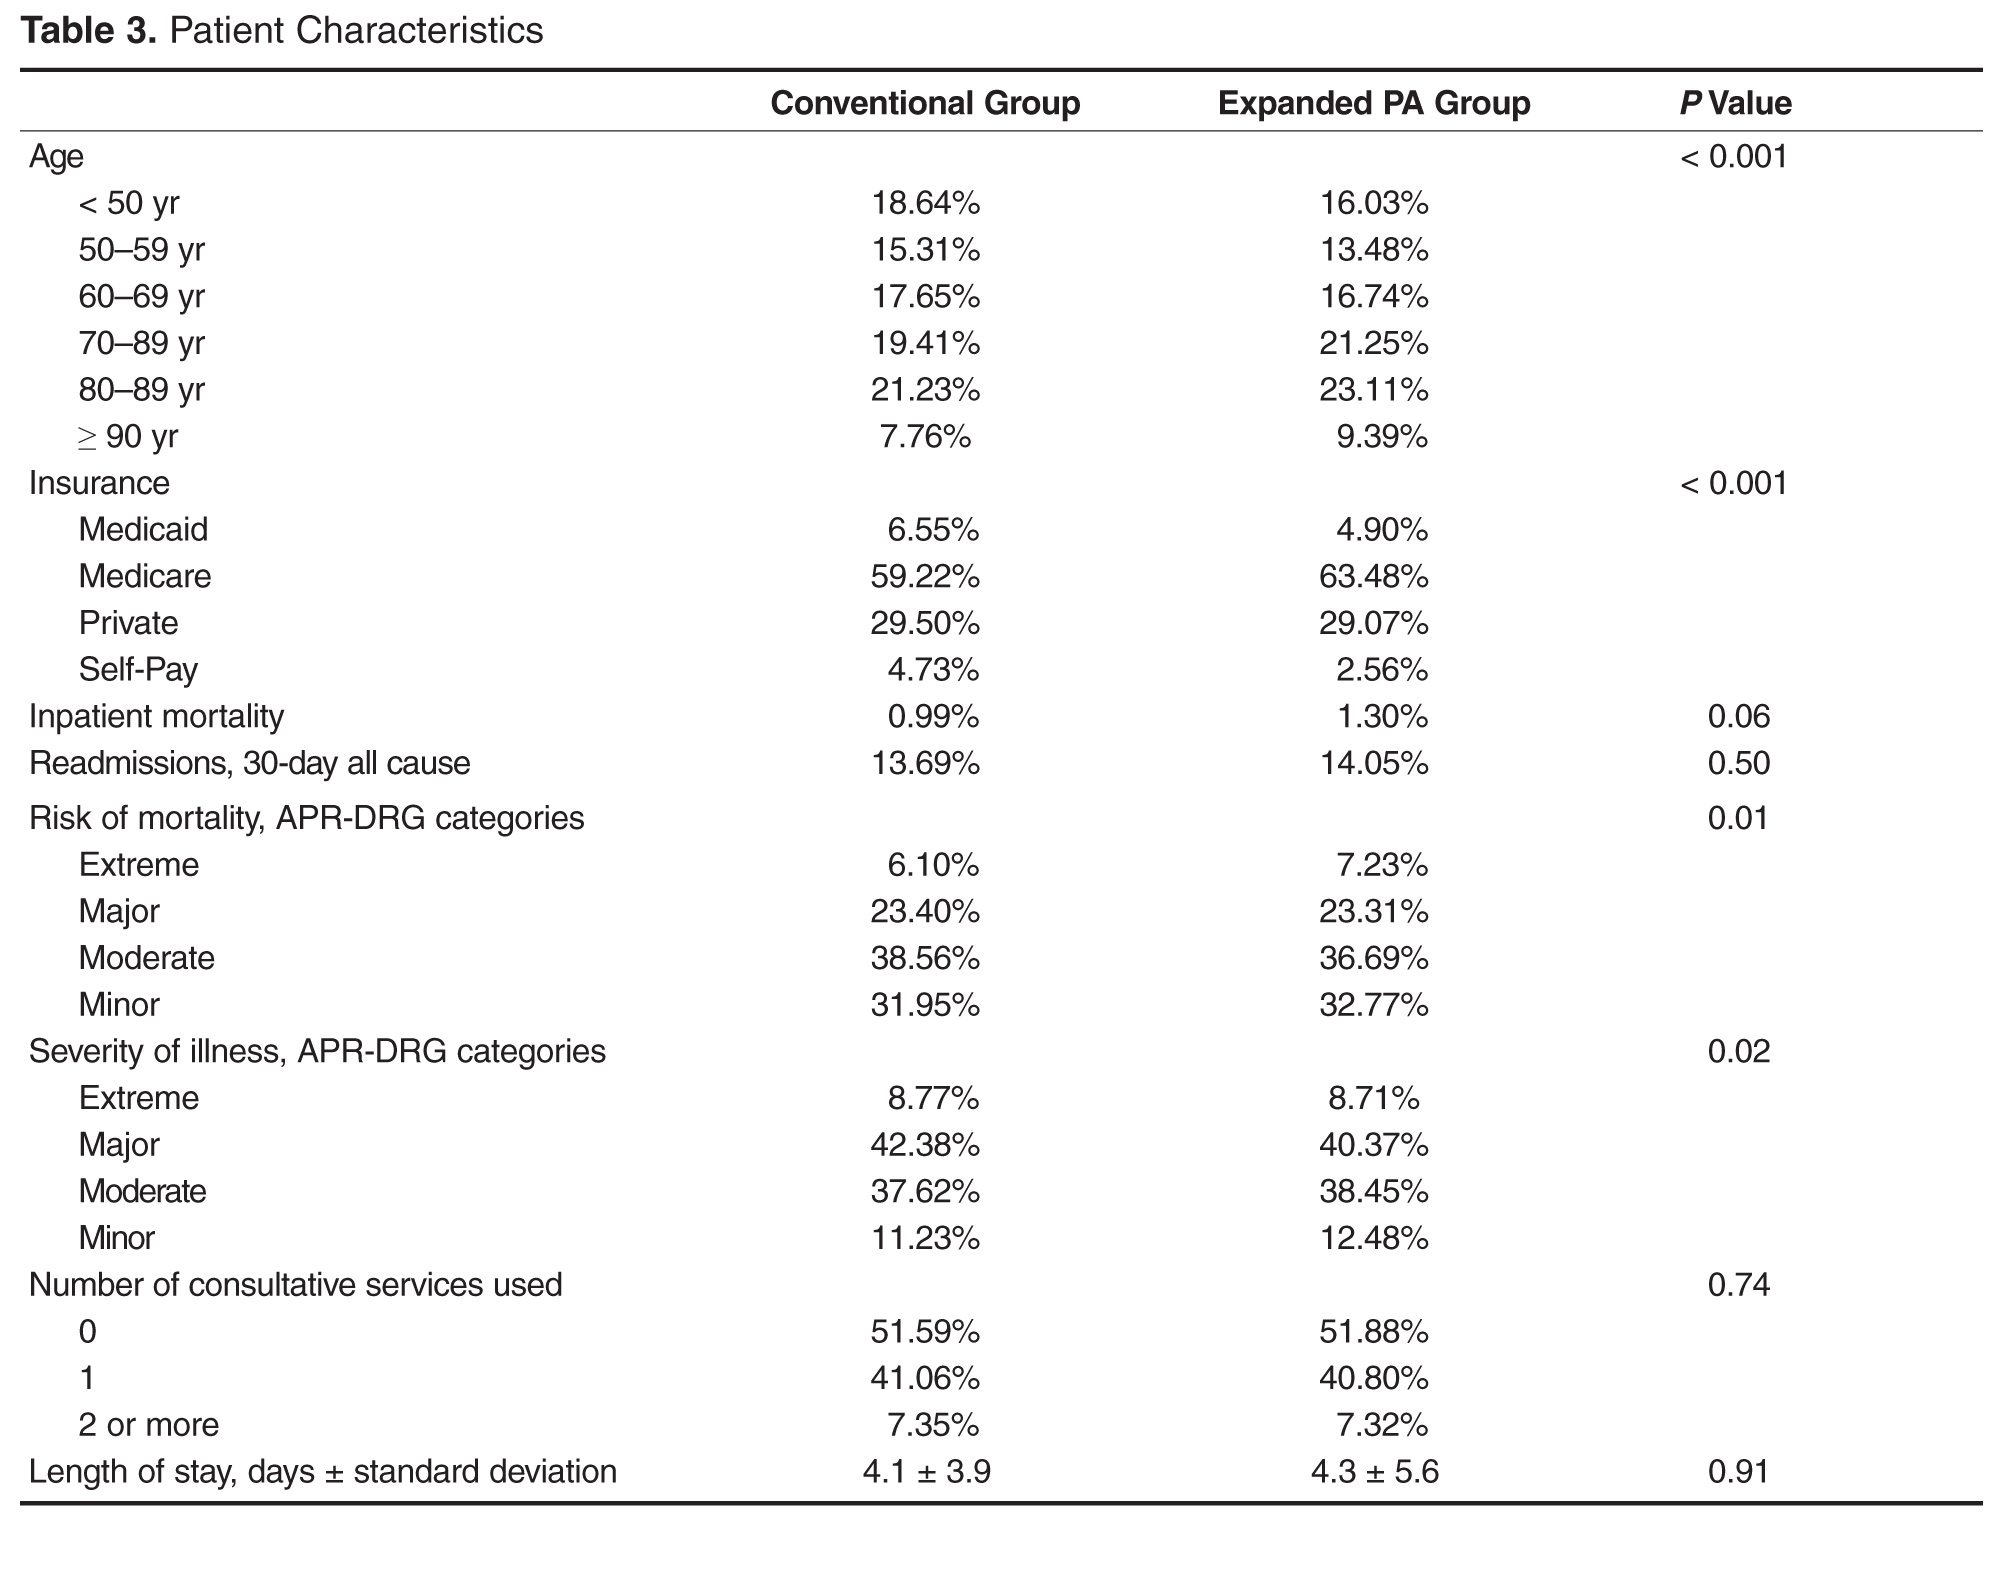
Charge capture data for both groups was used to determine the proportion of encounters rendered by each provider type or combination. In the expanded PA group, 35.73% of visits (10,241 of 28,663) were conducted by a PA, and 64.27% were conducted by a physician or by a PA with a billable physician “co-visit.” In the conventional group, 5.89% of visits (2938 of 49,883) were conducted by a PA, and 94.11% were conducted by a physician only or by a PA with a billable physician “co-visit”.
Readmissions
Overall, 929 of 6612 (14.05%) and 1417 of 10,352 (13.69%) patients were readmitted after being discharged by the expanded PA and conventional groups, respectively. After multivariate analysis, there was no statistically significant difference in odds of readmission between the groups (OR for conventional group, 0.95 [95% CI, 0.87–1.04]; P = 0.27).
Inpatient Mortality
Unadjusted inpatient mortality for the expanded PA group was 1.30% and 0.99% for the conventional group. After multivariate analysis, there was no statistically significant difference in odds of in-hospital mortality between the groups (OR for conventional group, 0.89 [95% CI, 0.66–1.19]; P = 0.42).
Patient Charges
The unadjusted mean patient charge in the expanded PA group was $7822 ± $7755 and in the conventional group mean patient charge was $8307 ± 10,034. Multivariate analysis found significantly lower adjusted patient charges in the expanded PA group relative to the conventional group (3.52% lower in the expanded PA group [95% CI, 2.66%–4.39%, P < 0.001). When comparing a “standard” patient who was between 80–89 and had Medicare insurance and an SOI of “major,” the cost of care was $2644 in the expanded PA group vs $2724 in the conventional group.
Length of Stay
Unadjusted mean length of stay was 4.1 ± 3.9 days and 4.3 ± 5.6 days for the expanded PA and conventional groups, respectively. After multivariate analysis, when comparing the statistical model “standard” patient, there was no significant difference in the length of stay between the 2 groups (effect size, 0.99 days shorter LOS in the expanded PA group [95% CI, 0.97–1.01 days]; P = 0.34)
Consultant Use
Utilization of consultants was also assessed. The expanded PA group used a mean of 0.55 consultants per case, and the conventional group used 0.56. After multivariate adjustment, there was no significant difference in consulting service use between groups (OR 1.00 [95% CI, 0.94–1.07]; P = 0.90).
Discussion
Maximizing value and minimizing health care costs is a national priority. To our knowledge, this is the first study to compare hospitalist PAs in a community, non-teaching practice directly and contemporaneously to peer PAs and attending physicians and examine the impact on outcomes. In our study, a much larger proportion of patient visits were conducted primarily by PAs without a same-day physician visit in the expanded PA group (35.73%, vs 5.89% in the conventional group). There was no statistically significant difference in inpatient mortality, length of stay or readmissions. In addition, costs of care measured as hospital charges to patients were lower in the expanded PA group. Consultants were not used disproportionately by the expanded PA group in order to achieve these results. Our results are consistent with studies that have compared PAs and NPs at academic centers to traditional housestaff teams and which show that services staffed with PAs or NPs that provide direct care to medical inpatients are non-inferior [4–10].
This study’s expanded PA group’s PAs rounded on 14 patients per day, close to the “magic 15” that is considered by many a good compromise for hospitalist physicians between productivity and quality [11,12]. This is substantially more than the 6 to 10 patients PAs have been responsible for in previously reported studies [3,4,6]. As the median salary for a PA hospitalist is $102,960 compared with the median internal medicine physician hospitalist salary of $253,977 [2], using hospitalist PAs in a collaboration model as described herein could result in significant savings for supporting institutions without sacrificing quality.
We recognize several limitations to this study. First, the data were obtained retrospectively from a single center and patient assignment between groups was nonrandomized. The significant differences in the baseline characteristics of patients between the study groups, however, were adjusted for in multivariate analysis, and potential referral bias was addressed through our exclusion criteria. Second, our comparison relied on coding rather than clinical data for diagnosis grouping. However, administrative data is commonly used to determine the primary diagnosis for study patients and the standard for reimbursement. Third, we recognize that there may have been unmeasured confounders that may have affected the outcomes. However, the same resources, including consultants and procedure services, were readily available to both groups and there was no significant difference in consultation rates. Fourth, “cost of care” was measured as overall charges to patients, not cost to the hospital. However, given that all the encounters occurred at the same hospital in the same time frame, the difference should be proportional and equal between groups. Finally, our readmission rates did not account for patients readmitted to other institutions. However, there should not have been a differential effect between the 2 study groups, given the shared patient catchment area and our exclusion for referral bias.
It should also be noted that the expanded PA group used a structured collaboration framework and incorporated a structured education program for its PAs. These components are integral to the expanded PA model, and our results may not be generalizable outside of a similar framework. The expanded PA group’s PAs were carefully selected at the time of hire, specifically educated, and supported through ongoing collaboration to provide efficient and appropriate care at the “top of their licenses”. Not all medical groups will be able to provide this level of support and education, and not all hospitalist PAs will want to and/or be able to reach this level of proficiency. However, successful implementation is entirely achievable for groups that invest the effort. The MDICS education process included 80 hours of didactic sessions spread over several months and is based on the Society of Hospital Medicine Core Competencies [13] as well as 6 months of supervised bedside education with escalating clinical responsibilities under the tutelage of an experienced physician or PA. Year-long academic PA fellowships have also been developed for purposes of similar training at several institutions [14].
Conclusion
Our results show that expanded use of well-educated PAs functioning within a formal collaboration arrangement with physicians provides similar clinical quality to a conventional PA staffing model with no excess patient care costs. The model also allows substantial salary savings to supporting institutions, which is important to hospital and policy stakeholders given the implications for hospitalist group staffing, increasing value, and allocation of precious time and financial resources.
Acknowledgements: The authors wish to thank Kevin Funk, MBA, of MDICS, Clarence Richardson, MBA, of GeBBs Software International, and Heather Channing, Kayla King, and Laura Knox of Anne Arundel Healthcare Enterprise, who provided invaluable help with the data aggregation used for this study.
Corresponding author: Timothy M. Capstack, MD, 7250 Parkway Dr, Suite 500, Hanover, MD 21076, tcapstack@mdics.com.
Financial disclosures: Dr. Capstack has ownership interest in Physicians Inpatient Care Specialists (MDICS). Ms. Segujja received compensation from MDICS for statistical analysis.
1. Michtalik HJ, Pronovost PJ, Marsteller JA, et al. Developing a model for attending physician workload and outcomes. JAMA Intern Med 2013;173:1026–8.
2. Society of Hospital Medicine. State of hospital medicine report. Philadelphia: Society of Hospital Medicine; 2014.
3. Kartha A, Restuccia J, Burgess J, et al. Nurse practitioner and physician assistant scope of practice in 118 acute care hospitals. J Hosp Med 2014;9:615–20.
4. Dhuper S, Choksi S. Replacing an academic internal medicine residency program with a physician assistant--hospitalist model: a comparative analysis study. Am J Med Qual 2008;24:132–9.
5. Morris D, Reilly P, Rohrbach J, et al. The influence of unit-based nurse practitioners on hospital outcomes and readmission rates for patients with trauma. J Trauma Acute Care Surg 2012;73:474–8.
6. Roy C, Liang C, Lund M, et al. Implementation of a physician assistant/hospitalist service in an academic medical center: impact on efficiency and patient outcomes. J Hosp Med 2008;3:361–8.
7. Singh S, Fletcher K, Schapira M, et al. A comparison of outcomes of general medical inpatient care provided by a hospitalist-physician assistant model vs a traditional resident-based model. J Hosp Med 2011;6:122–30.
8. Hoffman L, Tasota F, Zullo T, et al. Outcomes of care managed by an acute care nurse practitioner/attending physician team in an subacute medical intensive care unit. Am J Crit Care 2005;14:121–30.
9. Kapu A, Kleinpell R, Pilon B. Quality and financial impact of adding nurse practitioners to inpatient care teams. J Nurs Adm 2014;44:87–96.
10. Cowan M, Shapiro M, Hays R, et al. The effect of a multidisciplinary hospitalist/physician and advanced practice nurse collaboration on hospital costs. J Nurs Adm 2006;36:79–85.
11. Michtalik HJ, Yeh HC, Pronovost PJ, Brotman DJ. Impact of attending physician workload on patient care: A survey of hospitalists. JAMA Intern Med 2013;173:375–7.
12. Elliott D, Young R, Brice J, et al. Effect of hospitalist workload on the quality and efficiency of care. JAMA Internal Med 2014;174:786–93.
13. McKean S, Budnitz T, Dressler D, et al. How to use the core competencies in hospital medicine: a framework for curriculum development. J Hosp Med 2006; 1 Suppl 1:57–67.
14. Will K, Budavari A, Wilkens J, et al. A hospitalist postgraduate training program for physician assistants. J Hosp Med 2010;5:94–8.
From Physicians Inpatient Care Specialists (MDICS), Hanover, MD (Dr. Capstack, Ms. Vollono), Versant Statistical Solutions, Raleigh, NC (Ms. Segujja), Anne Arundel Medical Center, Annapolis, MD (Dr. Moser [at the time of the study], Dr. Meisenberg), and Johns Hopkins Hospital, Baltimore, MD (Dr. Michtalik).
Abstract
- Objective: To determine whether a higher than conventional physician assistant (PA)–to-physician hospitalist staffing ratio can achieve similar clinical outcomes for inpatients at a community hospital.
- Methods: Retrospective cohort study comparing 2 hospitalist groups at a 384-bed community hospital, one with a high PA-to-physician ratio model (“expanded PA”), with 3 physicians/3 PAs and the PAs rounding on 14 patients a day (35.73% of all visits), and the other with a low PA-to-physician ratio model (“conventional”), with 9 physicians/2 PAs and the PAs rounding on 9 patients a day (5.89% of all visits). For 16,964 adult patients discharged by the hospitalist groups with a medical principal APR-DRG code between January 2012 and June 2013, in-hospital mortality, cost of care, readmissions, length of stay (LOS) and consultant use were analyzed using logistic regression and adjusted for age, insurance status, severity of illness, and risk of mortality.
- Results: No statistically significant differences were found between the 2 groups for in-hospital mortality (odds ratio [OR], 0.89 [95% confidence interval {CI}, 0.66–1.19]; P = 0.42), readmissions (OR, 0.95 [95% CI, 0.87–1.04]; P = 0.27), length of stay (effect size 0.99 days shorter LOS in expanded PA group, 95% CI, 0.97 to 1.01 days; P = 0.34) or consultant use (OR 1.00, 95% CI 0.94–1.07, P = 0.90). Cost of care was less in the expanded PA group (effect size 3.52% less; estimated cost $2644 vs $2724; 95% CI 2.66%–4.39%, P < 0.001).
- Conclusion: An expanded PA hospitalist staffing model at a community hospital provided similar outcomes at a lower cost of care.
Hospitalist program staffing models must optimize efficiency while maintaining clinical outcomes in order to increase value and decrease costs [1]. The cost of hospitalist programs is burdensome, with nearly 94% of groups nationally requiring financial support beyond professional fees [2]. Nationally, for hospitalist groups serving adults, average institutional support is over $156,000 per physician full time equivalent (FTE) (182 twelve-hour clinical shifts per calendar year) [2]. Significant savings could be achieved if less costly physician assistants could be incorporated into clinical teams to provide similar care without sacrificing quality.
Nurse practitioners (NPs) and physician assistants (PAs) have been successfully employed on academic hospitalist services to complement physician staffing [3–10]. They perform admissions, consults, rounding visits and discharges with physician collaboration as permitted by each group’s policies and in accordance with hospital by-laws and state regulations. A median of 0.25 NP and 0.28 PA FTEs per physician FTE are employed by hospitalist groups that incorporate them, though staffing ratios vary widely [2].
Physicians Inpatient Care Specialists (MDICS) devel-oped a staffing model that deploys PAs to see a large proportion of its patients collaboratively with physicians, and with a higher patient census per PA than has been previously reported [2–5]. The group leaders believed that this would yield similar outcomes for patients at a lower cost to the supporting institution than a conventional staffing model which used fewer PAs to render patient care. Prior inpatient studies have demonstrated comparable clinical outcomes when comparing hospitalist PAs and NPs to residents and fellows [4–10], but to our knowledge no data exist directly comparing hospitalist PAs to hospitalist physicians. This study goes beyond prior work by examining the community, non-teaching setting, and directly comparing outcomes from the expanded use of PAs to those of a hospitalist group staffed with a greater proportion of attending physicians at the same hospital during the same time.
Methods
Setting
The study was performed at Anne Arundel Medical Center (AAMC), a 384-bed community hospital in Annapolis, Maryland, that serves a region of over 1 million people. Approximately 26,000 adult patients are discharged annually. During the study, more than 90% of internal medicine service inpatients were cared for by one of 2 hospitalist groups: a hospital-employed group (“conventional” group, Anne Arundel Medical Group) and a contracted hospitalist group (“expanded PA” group, Physicians Inpatient Care Specialists). The conventional group’s providers received a small incentive for Core Measures compliance for patients with stroke, myocardial infarction, congestive heart failure and pneumonia. The expanded PA group received a flat fee for providing hospitalist services and the group’s providers received a small incentive for productivity from their employer. The study was deemed exempt by the AAMC institutional review board.
Staffing Models, Patient Allocation, and Assignment
Admitted patients were designated to be admitted to one group or the other on the basis of standing arrangements with the patients’ primary care providers. Consultative referrals could also be made from subspecialists, who had discretion as to which group they wished to use.
Each morning, following sign-out report from the night team, each team of day providers determined which patients would be seen by which of their providers. Patients still on service from the previous day would be seen by the same provider again whenever possible in order to maintain continuity. Each individual provider had their own patients for the day who they rounded on independently and were responsible for. Physician involvement with patients seen primarily by PAs occurred as described below. Physicians in both groups were expected to take primary rounding responsibility for patients who were more acute or more complex based on morning sign-out report; there was no more formal mandate for patient allocation to particular provider type.
Physician-PA Collaboration
Patients
Patients discharged between 1 January 2012 and 30 June 2013 by the hospitalist groups were identified by searching AAMC’s Crimson Continuuum of Care (The Advisory Board, Washington, DC), a software analytic tool that is integrated with coded clinical data. Adult patient hospitalizations determined by Crimson to have a medical (non-surgical, non-obstetrical) APR-DRG code as the final principal diagnosis were included. Critically ill patients or those appropriate for “step-down unit” care were cared for by the in-house critical care staff; upon transfer out of critical or step-down care, patients were referred back to the admitting hospitalist team. A diagnosis (and its associated hospitalizations) was excluded for referral bias if the diagnosis was the principal diagnosis for at least 1% of a group’s discharges and the percentage of patients with that diagnosis was at least two times greater in one group than the other. Hospitalizations with a diagnosis of “ungroupable” (APR-DRG 956) were also excluded.
Measurements
Demographic, insurance status, cost of care, length of stay (LOS), APR-DRG (All Patient Refined Diagnosis-Related Group) severity of illness (SOI) and risk of mortality (ROM), consultant utilization, 30-day all-cause readmission (“readmission rate”), and mortality information was obtained from administrative data and exported into a single database for statistical analysis. Readmissions, inpatient mortality, and cost of care were the primary outcomes; consultant use and length of stay were secondary outcomes. A hospitalization was considered a readmission if the patient returned to inpatient status at AAMC for any reason within 30 days of a previous inpatient discharge. Inpatient mortality was defined as patient death during hospitalization. The cost of care was measured using the case charges associated with each encounter. Charge capture data from both groups was analyzed to classify visits as “physician-only,” “physician co-visit,” and “PA-only” visits. A co-visit consists of the physician visiting the patient after the PA has already done so on the same day, taking their own history and performing their own physical exam, and writing a brief progress note. These data were compared against the exported administrative data to find matching encounters and associated visits, with only matching visits included in the analysis. If a duplicate charge was entered on the same day for a patient, any conflict was resolved in favor of the physician visit. A total of 49,883 and 28,663 matching charges were identified for the conventional and expanded PA groups.
Statistical Methods
Odds of inpatient mortality were calculated using logistic regression and adjusted for age, insurance status, APR-DRG ROM, and LOS. Odds of readmission were calculated using logistic regression and adjusted for age, LOS, insurance and APR-DRG SOI. Cost of care (effect size) was examined using multiple linear regression and adjusted for age, APR-DRG SOI, insurance status and LOS. This model was fit using the logarithmic transformations of cost of care and LOS to correct deviation from normality. Robust regression using MM estimation was used to estimate group effects due to the existence of outliers and high leverage points. Length of stay (effect size) was assessed using the log-transformed variable and adjusted for APR-DRG SOI, age, insurance status and consultant use. Finally, category logistic regression models were fit to estimate the odds of consultant use in the study groups and adjusted for age, LOS, insurance status and APR-DRG SOI.
Results
Records review identified 17,294 adult patient hospitalizations determined by Crimson to have a medical (non-surgical, non-obstetrical) APR-DRG code as the final principal diagnosis. We excluded 15 expanded PA and 11 conventional hospitalizations that fell under APR-DRG code 956 “ungroupable.” Exclusion for referral bias resulted in the removal of 304 hospitalizations, 207 (3.03%) from the expanded PA group and 97 (0.92%) from the conventional group. These excluded hospitalizations came from 2 APR-DRG codes, urinary stones (code 465) and “other kidney and urinary tract diagnoses” (code 468). This left 6612 hospitalizations in the expanded PA group and 10,352 in the conventional group.
Charge capture data for both groups was used to determine the proportion of encounters rendered by each provider type or combination. In the expanded PA group, 35.73% of visits (10,241 of 28,663) were conducted by a PA, and 64.27% were conducted by a physician or by a PA with a billable physician “co-visit.” In the conventional group, 5.89% of visits (2938 of 49,883) were conducted by a PA, and 94.11% were conducted by a physician only or by a PA with a billable physician “co-visit”.
Readmissions
Overall, 929 of 6612 (14.05%) and 1417 of 10,352 (13.69%) patients were readmitted after being discharged by the expanded PA and conventional groups, respectively. After multivariate analysis, there was no statistically significant difference in odds of readmission between the groups (OR for conventional group, 0.95 [95% CI, 0.87–1.04]; P = 0.27).
Inpatient Mortality
Unadjusted inpatient mortality for the expanded PA group was 1.30% and 0.99% for the conventional group. After multivariate analysis, there was no statistically significant difference in odds of in-hospital mortality between the groups (OR for conventional group, 0.89 [95% CI, 0.66–1.19]; P = 0.42).
Patient Charges
The unadjusted mean patient charge in the expanded PA group was $7822 ± $7755 and in the conventional group mean patient charge was $8307 ± 10,034. Multivariate analysis found significantly lower adjusted patient charges in the expanded PA group relative to the conventional group (3.52% lower in the expanded PA group [95% CI, 2.66%–4.39%, P < 0.001). When comparing a “standard” patient who was between 80–89 and had Medicare insurance and an SOI of “major,” the cost of care was $2644 in the expanded PA group vs $2724 in the conventional group.
Length of Stay
Unadjusted mean length of stay was 4.1 ± 3.9 days and 4.3 ± 5.6 days for the expanded PA and conventional groups, respectively. After multivariate analysis, when comparing the statistical model “standard” patient, there was no significant difference in the length of stay between the 2 groups (effect size, 0.99 days shorter LOS in the expanded PA group [95% CI, 0.97–1.01 days]; P = 0.34)
Consultant Use
Utilization of consultants was also assessed. The expanded PA group used a mean of 0.55 consultants per case, and the conventional group used 0.56. After multivariate adjustment, there was no significant difference in consulting service use between groups (OR 1.00 [95% CI, 0.94–1.07]; P = 0.90).
Discussion
Maximizing value and minimizing health care costs is a national priority. To our knowledge, this is the first study to compare hospitalist PAs in a community, non-teaching practice directly and contemporaneously to peer PAs and attending physicians and examine the impact on outcomes. In our study, a much larger proportion of patient visits were conducted primarily by PAs without a same-day physician visit in the expanded PA group (35.73%, vs 5.89% in the conventional group). There was no statistically significant difference in inpatient mortality, length of stay or readmissions. In addition, costs of care measured as hospital charges to patients were lower in the expanded PA group. Consultants were not used disproportionately by the expanded PA group in order to achieve these results. Our results are consistent with studies that have compared PAs and NPs at academic centers to traditional housestaff teams and which show that services staffed with PAs or NPs that provide direct care to medical inpatients are non-inferior [4–10].
This study’s expanded PA group’s PAs rounded on 14 patients per day, close to the “magic 15” that is considered by many a good compromise for hospitalist physicians between productivity and quality [11,12]. This is substantially more than the 6 to 10 patients PAs have been responsible for in previously reported studies [3,4,6]. As the median salary for a PA hospitalist is $102,960 compared with the median internal medicine physician hospitalist salary of $253,977 [2], using hospitalist PAs in a collaboration model as described herein could result in significant savings for supporting institutions without sacrificing quality.
We recognize several limitations to this study. First, the data were obtained retrospectively from a single center and patient assignment between groups was nonrandomized. The significant differences in the baseline characteristics of patients between the study groups, however, were adjusted for in multivariate analysis, and potential referral bias was addressed through our exclusion criteria. Second, our comparison relied on coding rather than clinical data for diagnosis grouping. However, administrative data is commonly used to determine the primary diagnosis for study patients and the standard for reimbursement. Third, we recognize that there may have been unmeasured confounders that may have affected the outcomes. However, the same resources, including consultants and procedure services, were readily available to both groups and there was no significant difference in consultation rates. Fourth, “cost of care” was measured as overall charges to patients, not cost to the hospital. However, given that all the encounters occurred at the same hospital in the same time frame, the difference should be proportional and equal between groups. Finally, our readmission rates did not account for patients readmitted to other institutions. However, there should not have been a differential effect between the 2 study groups, given the shared patient catchment area and our exclusion for referral bias.
It should also be noted that the expanded PA group used a structured collaboration framework and incorporated a structured education program for its PAs. These components are integral to the expanded PA model, and our results may not be generalizable outside of a similar framework. The expanded PA group’s PAs were carefully selected at the time of hire, specifically educated, and supported through ongoing collaboration to provide efficient and appropriate care at the “top of their licenses”. Not all medical groups will be able to provide this level of support and education, and not all hospitalist PAs will want to and/or be able to reach this level of proficiency. However, successful implementation is entirely achievable for groups that invest the effort. The MDICS education process included 80 hours of didactic sessions spread over several months and is based on the Society of Hospital Medicine Core Competencies [13] as well as 6 months of supervised bedside education with escalating clinical responsibilities under the tutelage of an experienced physician or PA. Year-long academic PA fellowships have also been developed for purposes of similar training at several institutions [14].
Conclusion
Our results show that expanded use of well-educated PAs functioning within a formal collaboration arrangement with physicians provides similar clinical quality to a conventional PA staffing model with no excess patient care costs. The model also allows substantial salary savings to supporting institutions, which is important to hospital and policy stakeholders given the implications for hospitalist group staffing, increasing value, and allocation of precious time and financial resources.
Acknowledgements: The authors wish to thank Kevin Funk, MBA, of MDICS, Clarence Richardson, MBA, of GeBBs Software International, and Heather Channing, Kayla King, and Laura Knox of Anne Arundel Healthcare Enterprise, who provided invaluable help with the data aggregation used for this study.
Corresponding author: Timothy M. Capstack, MD, 7250 Parkway Dr, Suite 500, Hanover, MD 21076, tcapstack@mdics.com.
Financial disclosures: Dr. Capstack has ownership interest in Physicians Inpatient Care Specialists (MDICS). Ms. Segujja received compensation from MDICS for statistical analysis.
1. Michtalik HJ, Pronovost PJ, Marsteller JA, et al. Developing a model for attending physician workload and outcomes. JAMA Intern Med 2013;173:1026–8.
2. Society of Hospital Medicine. State of hospital medicine report. Philadelphia: Society of Hospital Medicine; 2014.
3. Kartha A, Restuccia J, Burgess J, et al. Nurse practitioner and physician assistant scope of practice in 118 acute care hospitals. J Hosp Med 2014;9:615–20.
4. Dhuper S, Choksi S. Replacing an academic internal medicine residency program with a physician assistant--hospitalist model: a comparative analysis study. Am J Med Qual 2008;24:132–9.
5. Morris D, Reilly P, Rohrbach J, et al. The influence of unit-based nurse practitioners on hospital outcomes and readmission rates for patients with trauma. J Trauma Acute Care Surg 2012;73:474–8.
6. Roy C, Liang C, Lund M, et al. Implementation of a physician assistant/hospitalist service in an academic medical center: impact on efficiency and patient outcomes. J Hosp Med 2008;3:361–8.
7. Singh S, Fletcher K, Schapira M, et al. A comparison of outcomes of general medical inpatient care provided by a hospitalist-physician assistant model vs a traditional resident-based model. J Hosp Med 2011;6:122–30.
8. Hoffman L, Tasota F, Zullo T, et al. Outcomes of care managed by an acute care nurse practitioner/attending physician team in an subacute medical intensive care unit. Am J Crit Care 2005;14:121–30.
9. Kapu A, Kleinpell R, Pilon B. Quality and financial impact of adding nurse practitioners to inpatient care teams. J Nurs Adm 2014;44:87–96.
10. Cowan M, Shapiro M, Hays R, et al. The effect of a multidisciplinary hospitalist/physician and advanced practice nurse collaboration on hospital costs. J Nurs Adm 2006;36:79–85.
11. Michtalik HJ, Yeh HC, Pronovost PJ, Brotman DJ. Impact of attending physician workload on patient care: A survey of hospitalists. JAMA Intern Med 2013;173:375–7.
12. Elliott D, Young R, Brice J, et al. Effect of hospitalist workload on the quality and efficiency of care. JAMA Internal Med 2014;174:786–93.
13. McKean S, Budnitz T, Dressler D, et al. How to use the core competencies in hospital medicine: a framework for curriculum development. J Hosp Med 2006; 1 Suppl 1:57–67.
14. Will K, Budavari A, Wilkens J, et al. A hospitalist postgraduate training program for physician assistants. J Hosp Med 2010;5:94–8.
Fertility and Fertility Preservation: Scripts to Support Oncology Nurses in Discussions with Adolescent and Young Adult Patients
From the Moffitt Cancer Center, Tampa, FL (Dr. Vadaparampil, Ms. Bowman, Ms. Sehovic, Dr. Quinn), Memorial Sloan Kettering Cancer Center, New York, NY (Ms. Kelvin), and Edward Via College of Osteopathic Medicine, Auburn, AL (Ms. Murphy).
Abstract
- Objective: To describe a script-based approach to assist oncology nurses in fertility discussions with their adolescent and young adult (AYA) patients.
- Methods: Scripts were developed by a team that included experts in fertility and reproductive health, health education, health communication, and clinical care of AYA patients. Individual scripts for females, males, and survivors were created and accompanied by a flyer and frequently asked questions sheet. The script and supplementary materials were then vetted by oncology nurses who participated in the Educating Nurses about Reproductive Health Issues in Cancer Healthcare (ENRICH) training program.
- Results: The scripts were rated as helpful and socially appropriate with minor concerns noted about awkward wording and medical jargon.
- Conclusion: The updated scripts provide one approach for nurses to become more adept at discussing the topic of infertility and FP with AYA oncology patients and survivors.
In the United States, over 70,000 adolescents and young adults (AYAs) are diagnosed with cancer each year [1,2]. Treatments are available that are associated with improved survival for these cancers. Unfortunately, cancer treatment may significantly impact AYA survivors’ future fertility. Infertility or premature ovarian failure can occur during or after cancer treatment (eg, chemotherapy, radiation) for females, and males may be temporarily or permanently azoospermic [3]. There are a number of established methods of fertility preservation (FP) that are available; these include oocyte and embryo cryopreservation and ovarian transposition for females and sperm banking for males [3]. Experimental options for males include testicular tissue freezing and for females ovarian tissue cryopreservation.
The American Society of Clinical Oncology (ASCO) and the National Comprehensive Cancer Network [4,5] recommend discussing FP with patients of reproductive age, ideally before initiation of treatment. In 2013, ASCO updated guidelines extending the responsibility for discussion and referral for FP beyond the medical oncologist to explicitly include other physician specialties, nurses, and allied health care professionals in the oncology care setting [3]. However, multiple publications, including patient surveys and interviews, physician surveys, and medical record abstraction studies suggest these discussions do not consistently take place. In an analysis of 156 practice groups submitting data as part of ASCO's Quality Oncology Practice Initiative, only ~15%–20% of practices routinely discussed infertility risks and FP options [6]. A recent review of medical charts of patients aged 18–45 treated in 2011 at 1 of 4 large U.S. cancer care institutions found that documentation of discussions for infertility risk was 26%, 24% for FP option discussion, and 13% for fertility specialist referral [7].
Oncology nurses play a key role in patients’ care and, compared to other health care providers, are more likely to have multiple interactions with patients prior to the initiation of treatment [8]. They are often attuned to the medical and psychosocial needs of the patient and family and can advocate for their needs and desires [9]. However, existing research finds few oncology nurses discuss this topic with AYA patients. Studies examining barriers have identified factors that may hinder discussions about infertility and FP with AYA oncology patients. These barriers include lack of knowledge about cancer related infertility and available FP procedures; access to reproductive endocrinologists or sperm banking clinics; time constraints in busy clinics and concerns about delaying treatment; discomforts discussing reproductive health; patient’s ability to afford FP; bias about the suitability of FP for young or unpartnered or LGBT patients or those with a poor prognosis; and personal religious or moral values about the use of assisted reproductive technologies [10–15].
Equipping nurses with content-specific communication may overcome some of the barriers described. A method often used in nursing education and communication interventions is scripting [16–18]. Scripting provides precise key words that ensure consistency in the message, no matter the messenger [19]. This paper reports on the development and refinement of a series of scripts to guide discussions about FP for male and female AYA patients and survivors.
Script Development
In 2003 Studer developed the AIDET (Acknowledge, Introduce, Duration, Explanation, and Thank you) model of communication for health professionals [19]. AIDET is an effective tool in facilitating communication practices among nurses and physicians in adult and pediatric settings [20–24]. The AIDET model was adapted by our team to develop AIDED: Assess, Introduce, Decide, Explain, and Discuss, a script-based approach to assist oncology nurses in fertility discussions with their AYA patients. Our team included experts in fertility and reproductive health, health education, health communication, as well as clinical and psychosocial care of AYA patients.
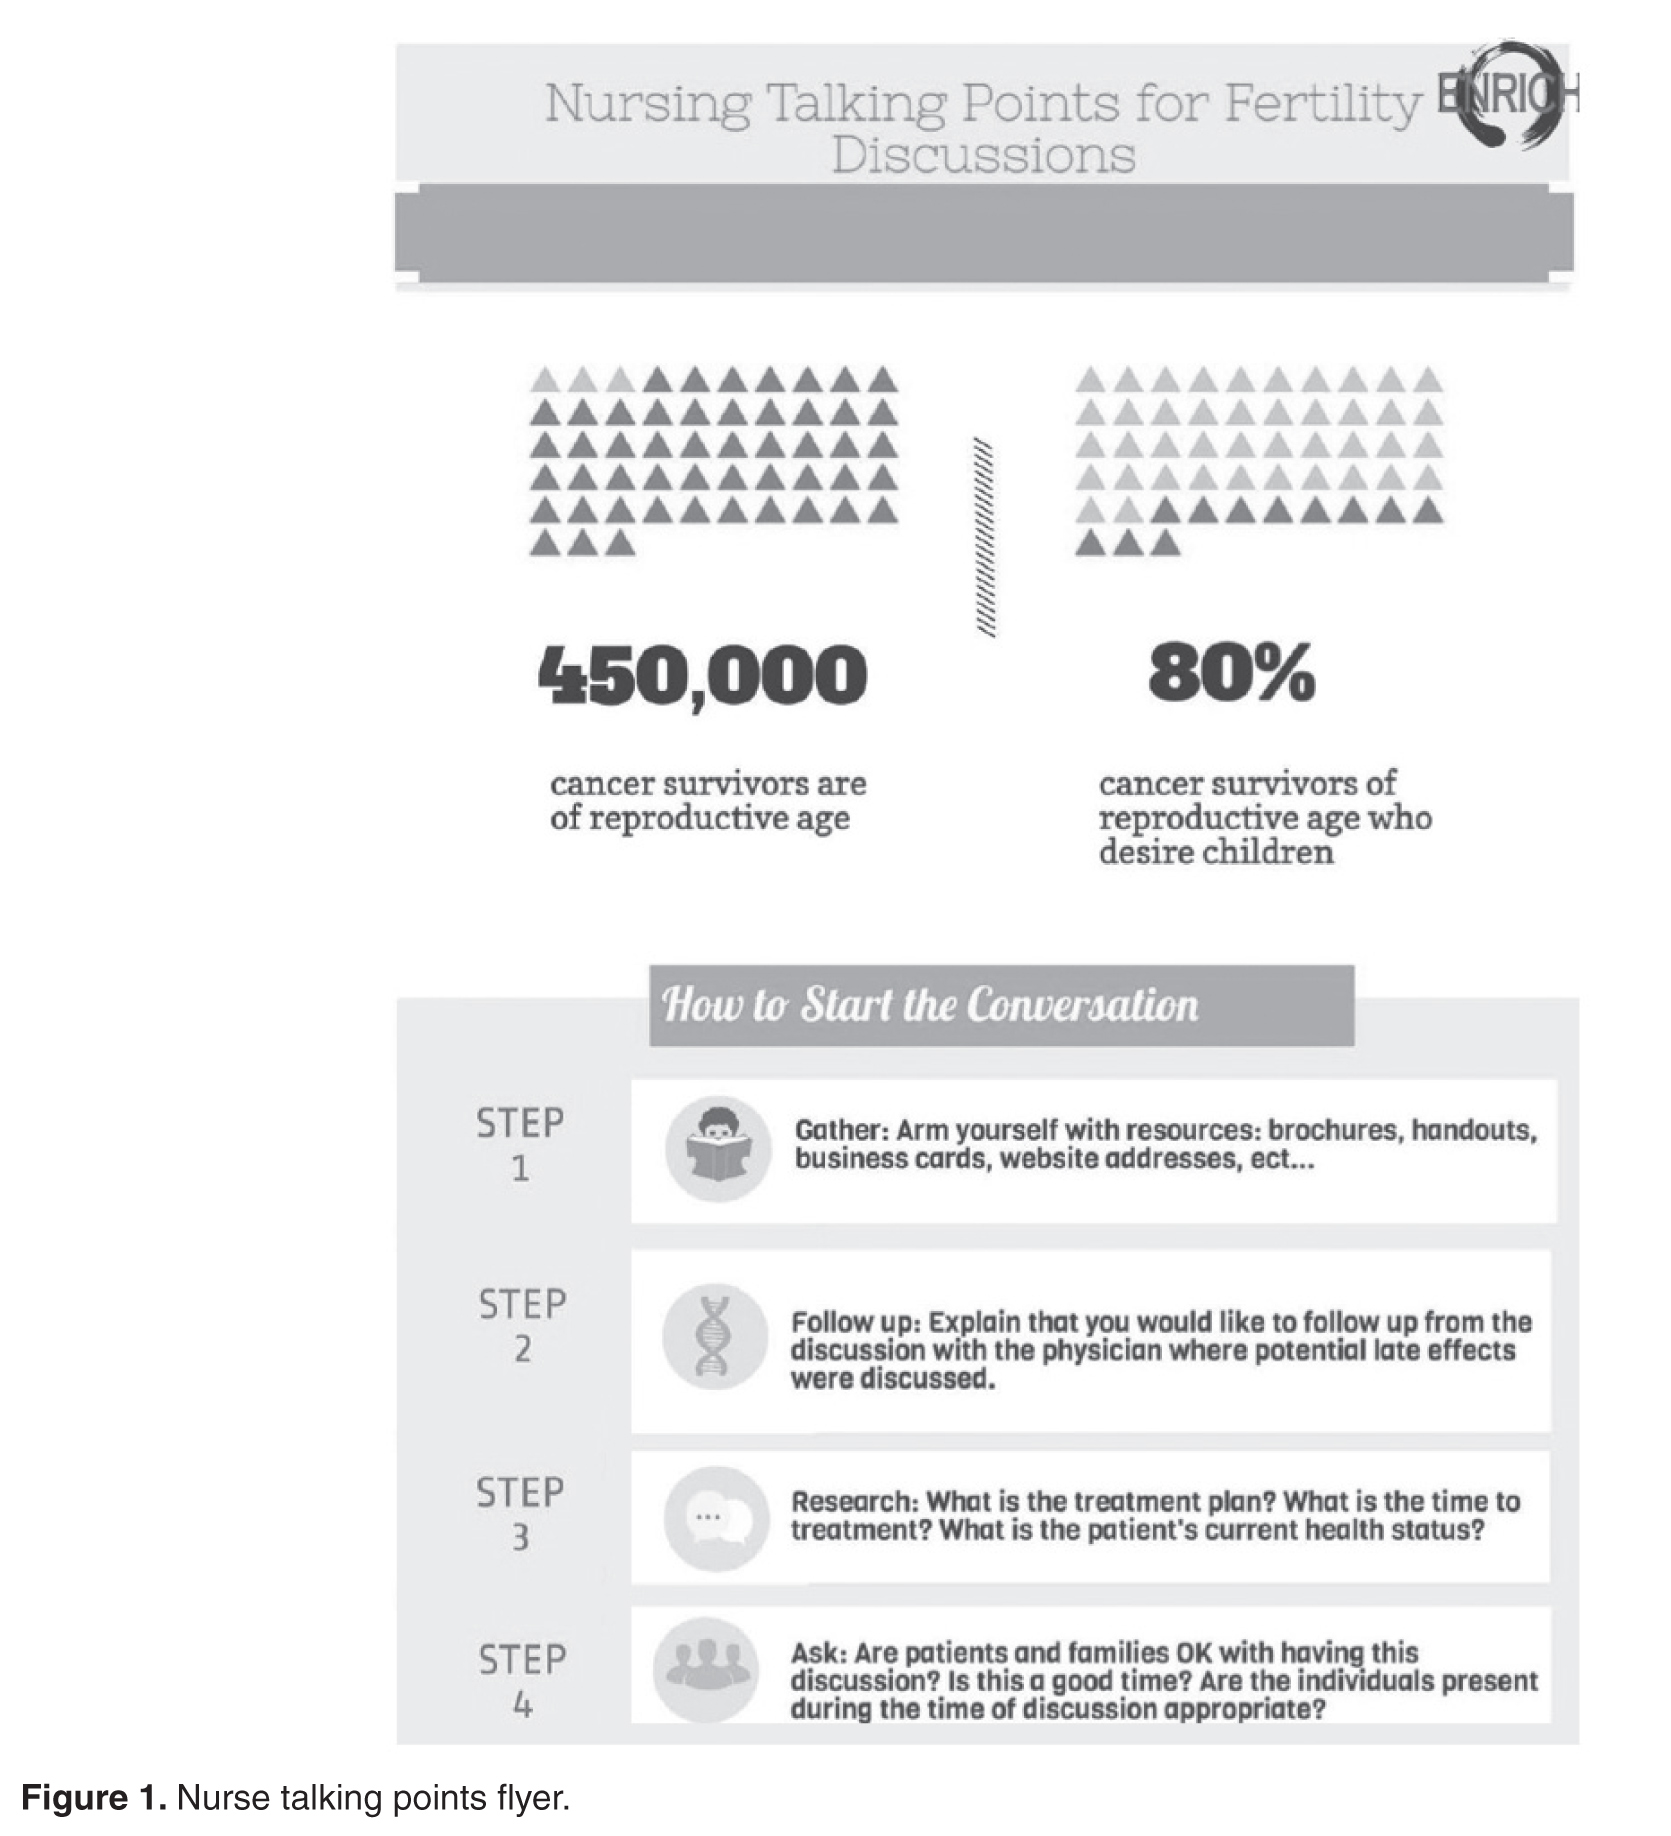
Educating Nurses 
Benefits of Scripts
Communication difficulties may present an obstacle for oncology nurses to address the infertility, FP information, and supportive care needs of AYA cancer patients [15]. While guidelines from leading health and professional organizations support the need to discuss these issues with patients, implementation requires providing practical tools that meet the needs of nurses’ practice setting and patient population [26].
The use of scripts has a long history in the 
Conclusion

These scripts provide one approach for nurses to become more adept at discussing the topic of FP with AYA oncology patients. We will continue to update and refine these scripts and ultimately test their efficacy in improving psychosocial and behavioral outcomes for AYA patients. While scripts are effective, they must be updated to reflect relevant advances in clinical care. In addition, it is important to identify local resources to facilitate discussion and referral for those who seek additional information and or services related to FP. Such resources include psychosocial support, reproductive endocrinologists with expertise in the unique needs of AYA oncology patients, providers who accept pediatric patients (if needed), and financial assistance.
Corresponding author: Susan T. Vadaparampil, PhD, MPH, 12902 Magnolia Dr., MRC CANCONT, Tampa, FL 33612, susan.vadaparampil@moffitt.org.
Funding/support: ENRICH is funded by a National Cancer Institute R25 Training Grant: #5R25CA142519-05.
Financial disclosures: None.
1. Bleyer AOLM, O’Leary M, Barr L, Ries LAG. Cancer epidemiology in older adolescents and young adults 15 to 29 years of age, including SEER incidence and survival: 1975–2000. Bethesda, MD: National Cancer Institute; 2006.
2. Ward E, DeSantis C, Robbins A, et al. Childhood and adolescent cancer statistics, 2014. CA Cancer J Clin 2014;64: 83–103.
3. Loren AW, Mangu PB, Beck LN, et al. Fertility preservation for patients with cancer: American Society of Clinical Oncology clinical practice guideline update. J Clin Oncol 2013;31:2500–10.
4. Lee SJ, Schover LR, Partridge AH, et al. American Society of Clinical Oncology recommendations on fertility preservation in cancer patients. J Clin Oncol 2006;24:2917–31.
5. Coccia P, Altman J, Bhatia S, et al. Adolescent and young adult (AYA) oncology version 1.2012. National Comprehensive Cancer Network; 2012.
6. Neuss MN, Malin JL, Chan S, et al. Measuring the improving quality of outpatient care in medical oncology practices in the United States. J Clin Oncol 2013;31:1471–7.
7. Quinn GP, Block RG, Clayman ML, et al. If you did not document it, it did not happen: rates of documentation of discussion of infertility risk in adolescent and young adult oncology patients’ medical records. J Oncol Pract 2015;11: 137–44.
8. Cope D. Patients’ and physicians’ experinces with sperm banking and infertility issues related to cancer treatment. Clin J Oncol Nurs 2002;6:293–5.
9. Vaartio-Rajalin H, Leino-Kilpi H. Nurses as patient advocates in oncology care: activities based on literature. Clin J Oncol Nurs. 2011;15:526–32.
10. King LM, Quinn GP, Vadaparampil ST, et al. Oncology nurses’ perceptions of barriers to discussion of fertility preservation with patients with cancer. Clin J Oncol Nurs 2008; 12:467–76.
11. Clayton HB, Vadaparampil ST, Quinn GP, et al. Trends in clinical practice and nurses’ attitudes about fertility preservation for pediatric patients with cancer. Oncol Nurs Forum 2008;35:449–55.
12. Vadaparampil ST, Clayton H, Quinn GP, et al. Pediatric oncology nurses’ attitudes related to discussing fertility preservation with pediatric cancer patients and their families. J Pediatr Oncol Nurs 2007;24:255–63.
13. Kotronoulas G, Papadopoulou C, Patiraki E. Nurses’ knowledge, attitudes, and practices regarding provision of sexual health care in patients with cancer: critical review of the evidence. Support Care Cancer 2009;17:479–501.
14. Reebals JF, Brown R, Buckner EB. Nurse practice issues regarding sperm banking in adolescent male cancer patients. J Pediatr Oncol Nurs 2006;23:182–8.
15. Goossens J, Delbaere I, Beeckman D, et al. Communication difficulties and the experience of loneliness in patients with cancer dealing with fertility issues: a qualitative study. Oncol Nurs Forum 2015;42:34–43.
16. Mustard LW. Improving patient satisfaction through the consistent use of scripting by the nursing staff. JONAS Healthc Law Ethics Regul 2003;5:68–72.
17. Kuiper RA. Integration of innovative clinical reasoning pedagogies into a baccalaureate nursing curriculum. Creat Nurs 2013;19:128–39.
18. Handel DA, Fu R, Daya M, et al. The use of scripting at triage and its impact on elopements. Acad Emerg Med 2010; 17:495–500.
19. Studer Q. Hardwiring excellence: purpose, worthwhile work, making a difference. Gulf Breeze, FL: Fire Starter Publishing; 2003.
20. Katona A, Kunkel E, Arfaa J, et al. Methodology for delivering feedback to neurology house staff on communication skills using AIDET (Acknowledge, Introduce, Duration, Explanation, Thank You). Neurology 2014;82(10 Suppl):P1–328.
21. Prestia A , Dyess S. Maximizing caring relationships between nursing assistants and patients: Care partners. J Nurs Admin 2012;42:144–7.
22. Fisher MJ. A brief intervention to improve emotion-focused communication between newly licensed pediatric nurses and parents [dissertation]. Indianapolis: Indiana University; 2012.
23. Baker SJ. Key words: a prescriptive approach to reducing patient anxiety and improving safety. J Emerg Nurs 2011; 37:571–4.
24. Shupe R. Using skills validation and verification techniques to hardwire staff behaviors. J Emerg Nurs 2013;39:364–8.
25. Vadaparampil ST, Hutchins NM, Quinn GP. Reproductive health in the adolescent and young adult cancer patient: an innovative training program for oncology nurses. J Cancer Educ 2013;28:197–208.
26. Shekelle P, Woolf S, Grimshaw JM, et al. Developing clinical practice guidelines: reviewing, reporting, and publishing guidelines; updating guidelines; and the emerging issues of enhancing guideline implementability and accounting for comorbid conditions in guideline development. Implement Sci 2012;7:62.
27. Clayton JM, Adler JL, O’Callaghan A, et al. Intensive communication skills teaching for specialist training in palliative medicine: development and evaluation of an experiential workshop. J Palliat Med 2012;15:585–91.
28. Hymes DH. On communicative competence. In: Pride JB, Holmes J, editors. Sociolinguistics: selected readings. Harmondsworth: Penguin; 1972:269–93.
29. Asnani MR. Patient-physician communication. West Indian Med J 2009;58:357–61.
30. Clark PA. Medical practices’ sensitivity to patients’ needs: Opportunities and practices for improvement. J Ambulat Care Manage 2003;26:110–23.
31. Wanzer MB, Booth-Butterfield M, Gruber K. Perceptions of health care providers’ communication: Relationships between patient-centered communication and satisfaction. Health Care Commun 2004;16:363–84.
From the Moffitt Cancer Center, Tampa, FL (Dr. Vadaparampil, Ms. Bowman, Ms. Sehovic, Dr. Quinn), Memorial Sloan Kettering Cancer Center, New York, NY (Ms. Kelvin), and Edward Via College of Osteopathic Medicine, Auburn, AL (Ms. Murphy).
Abstract
- Objective: To describe a script-based approach to assist oncology nurses in fertility discussions with their adolescent and young adult (AYA) patients.
- Methods: Scripts were developed by a team that included experts in fertility and reproductive health, health education, health communication, and clinical care of AYA patients. Individual scripts for females, males, and survivors were created and accompanied by a flyer and frequently asked questions sheet. The script and supplementary materials were then vetted by oncology nurses who participated in the Educating Nurses about Reproductive Health Issues in Cancer Healthcare (ENRICH) training program.
- Results: The scripts were rated as helpful and socially appropriate with minor concerns noted about awkward wording and medical jargon.
- Conclusion: The updated scripts provide one approach for nurses to become more adept at discussing the topic of infertility and FP with AYA oncology patients and survivors.
In the United States, over 70,000 adolescents and young adults (AYAs) are diagnosed with cancer each year [1,2]. Treatments are available that are associated with improved survival for these cancers. Unfortunately, cancer treatment may significantly impact AYA survivors’ future fertility. Infertility or premature ovarian failure can occur during or after cancer treatment (eg, chemotherapy, radiation) for females, and males may be temporarily or permanently azoospermic [3]. There are a number of established methods of fertility preservation (FP) that are available; these include oocyte and embryo cryopreservation and ovarian transposition for females and sperm banking for males [3]. Experimental options for males include testicular tissue freezing and for females ovarian tissue cryopreservation.
The American Society of Clinical Oncology (ASCO) and the National Comprehensive Cancer Network [4,5] recommend discussing FP with patients of reproductive age, ideally before initiation of treatment. In 2013, ASCO updated guidelines extending the responsibility for discussion and referral for FP beyond the medical oncologist to explicitly include other physician specialties, nurses, and allied health care professionals in the oncology care setting [3]. However, multiple publications, including patient surveys and interviews, physician surveys, and medical record abstraction studies suggest these discussions do not consistently take place. In an analysis of 156 practice groups submitting data as part of ASCO's Quality Oncology Practice Initiative, only ~15%–20% of practices routinely discussed infertility risks and FP options [6]. A recent review of medical charts of patients aged 18–45 treated in 2011 at 1 of 4 large U.S. cancer care institutions found that documentation of discussions for infertility risk was 26%, 24% for FP option discussion, and 13% for fertility specialist referral [7].
Oncology nurses play a key role in patients’ care and, compared to other health care providers, are more likely to have multiple interactions with patients prior to the initiation of treatment [8]. They are often attuned to the medical and psychosocial needs of the patient and family and can advocate for their needs and desires [9]. However, existing research finds few oncology nurses discuss this topic with AYA patients. Studies examining barriers have identified factors that may hinder discussions about infertility and FP with AYA oncology patients. These barriers include lack of knowledge about cancer related infertility and available FP procedures; access to reproductive endocrinologists or sperm banking clinics; time constraints in busy clinics and concerns about delaying treatment; discomforts discussing reproductive health; patient’s ability to afford FP; bias about the suitability of FP for young or unpartnered or LGBT patients or those with a poor prognosis; and personal religious or moral values about the use of assisted reproductive technologies [10–15].
Equipping nurses with content-specific communication may overcome some of the barriers described. A method often used in nursing education and communication interventions is scripting [16–18]. Scripting provides precise key words that ensure consistency in the message, no matter the messenger [19]. This paper reports on the development and refinement of a series of scripts to guide discussions about FP for male and female AYA patients and survivors.
Script Development
In 2003 Studer developed the AIDET (Acknowledge, Introduce, Duration, Explanation, and Thank you) model of communication for health professionals [19]. AIDET is an effective tool in facilitating communication practices among nurses and physicians in adult and pediatric settings [20–24]. The AIDET model was adapted by our team to develop AIDED: Assess, Introduce, Decide, Explain, and Discuss, a script-based approach to assist oncology nurses in fertility discussions with their AYA patients. Our team included experts in fertility and reproductive health, health education, health communication, as well as clinical and psychosocial care of AYA patients.
Educating Nurses
Benefits of Scripts
Communication difficulties may present an obstacle for oncology nurses to address the infertility, FP information, and supportive care needs of AYA cancer patients [15]. While guidelines from leading health and professional organizations support the need to discuss these issues with patients, implementation requires providing practical tools that meet the needs of nurses’ practice setting and patient population [26].
The use of scripts has a long history in the
Conclusion
These scripts provide one approach for nurses to become more adept at discussing the topic of FP with AYA oncology patients. We will continue to update and refine these scripts and ultimately test their efficacy in improving psychosocial and behavioral outcomes for AYA patients. While scripts are effective, they must be updated to reflect relevant advances in clinical care. In addition, it is important to identify local resources to facilitate discussion and referral for those who seek additional information and or services related to FP. Such resources include psychosocial support, reproductive endocrinologists with expertise in the unique needs of AYA oncology patients, providers who accept pediatric patients (if needed), and financial assistance.
Corresponding author: Susan T. Vadaparampil, PhD, MPH, 12902 Magnolia Dr., MRC CANCONT, Tampa, FL 33612, susan.vadaparampil@moffitt.org.
Funding/support: ENRICH is funded by a National Cancer Institute R25 Training Grant: #5R25CA142519-05.
Financial disclosures: None.
1. Bleyer AOLM, O’Leary M, Barr L, Ries LAG. Cancer epidemiology in older adolescents and young adults 15 to 29 years of age, including SEER incidence and survival: 1975–2000. Bethesda, MD: National Cancer Institute; 2006.
2. Ward E, DeSantis C, Robbins A, et al. Childhood and adolescent cancer statistics, 2014. CA Cancer J Clin 2014;64: 83–103.
3. Loren AW, Mangu PB, Beck LN, et al. Fertility preservation for patients with cancer: American Society of Clinical Oncology clinical practice guideline update. J Clin Oncol 2013;31:2500–10.
4. Lee SJ, Schover LR, Partridge AH, et al. American Society of Clinical Oncology recommendations on fertility preservation in cancer patients. J Clin Oncol 2006;24:2917–31.
5. Coccia P, Altman J, Bhatia S, et al. Adolescent and young adult (AYA) oncology version 1.2012. National Comprehensive Cancer Network; 2012.
6. Neuss MN, Malin JL, Chan S, et al. Measuring the improving quality of outpatient care in medical oncology practices in the United States. J Clin Oncol 2013;31:1471–7.
7. Quinn GP, Block RG, Clayman ML, et al. If you did not document it, it did not happen: rates of documentation of discussion of infertility risk in adolescent and young adult oncology patients’ medical records. J Oncol Pract 2015;11: 137–44.
8. Cope D. Patients’ and physicians’ experinces with sperm banking and infertility issues related to cancer treatment. Clin J Oncol Nurs 2002;6:293–5.
9. Vaartio-Rajalin H, Leino-Kilpi H. Nurses as patient advocates in oncology care: activities based on literature. Clin J Oncol Nurs. 2011;15:526–32.
10. King LM, Quinn GP, Vadaparampil ST, et al. Oncology nurses’ perceptions of barriers to discussion of fertility preservation with patients with cancer. Clin J Oncol Nurs 2008; 12:467–76.
11. Clayton HB, Vadaparampil ST, Quinn GP, et al. Trends in clinical practice and nurses’ attitudes about fertility preservation for pediatric patients with cancer. Oncol Nurs Forum 2008;35:449–55.
12. Vadaparampil ST, Clayton H, Quinn GP, et al. Pediatric oncology nurses’ attitudes related to discussing fertility preservation with pediatric cancer patients and their families. J Pediatr Oncol Nurs 2007;24:255–63.
13. Kotronoulas G, Papadopoulou C, Patiraki E. Nurses’ knowledge, attitudes, and practices regarding provision of sexual health care in patients with cancer: critical review of the evidence. Support Care Cancer 2009;17:479–501.
14. Reebals JF, Brown R, Buckner EB. Nurse practice issues regarding sperm banking in adolescent male cancer patients. J Pediatr Oncol Nurs 2006;23:182–8.
15. Goossens J, Delbaere I, Beeckman D, et al. Communication difficulties and the experience of loneliness in patients with cancer dealing with fertility issues: a qualitative study. Oncol Nurs Forum 2015;42:34–43.
16. Mustard LW. Improving patient satisfaction through the consistent use of scripting by the nursing staff. JONAS Healthc Law Ethics Regul 2003;5:68–72.
17. Kuiper RA. Integration of innovative clinical reasoning pedagogies into a baccalaureate nursing curriculum. Creat Nurs 2013;19:128–39.
18. Handel DA, Fu R, Daya M, et al. The use of scripting at triage and its impact on elopements. Acad Emerg Med 2010; 17:495–500.
19. Studer Q. Hardwiring excellence: purpose, worthwhile work, making a difference. Gulf Breeze, FL: Fire Starter Publishing; 2003.
20. Katona A, Kunkel E, Arfaa J, et al. Methodology for delivering feedback to neurology house staff on communication skills using AIDET (Acknowledge, Introduce, Duration, Explanation, Thank You). Neurology 2014;82(10 Suppl):P1–328.
21. Prestia A , Dyess S. Maximizing caring relationships between nursing assistants and patients: Care partners. J Nurs Admin 2012;42:144–7.
22. Fisher MJ. A brief intervention to improve emotion-focused communication between newly licensed pediatric nurses and parents [dissertation]. Indianapolis: Indiana University; 2012.
23. Baker SJ. Key words: a prescriptive approach to reducing patient anxiety and improving safety. J Emerg Nurs 2011; 37:571–4.
24. Shupe R. Using skills validation and verification techniques to hardwire staff behaviors. J Emerg Nurs 2013;39:364–8.
25. Vadaparampil ST, Hutchins NM, Quinn GP. Reproductive health in the adolescent and young adult cancer patient: an innovative training program for oncology nurses. J Cancer Educ 2013;28:197–208.
26. Shekelle P, Woolf S, Grimshaw JM, et al. Developing clinical practice guidelines: reviewing, reporting, and publishing guidelines; updating guidelines; and the emerging issues of enhancing guideline implementability and accounting for comorbid conditions in guideline development. Implement Sci 2012;7:62.
27. Clayton JM, Adler JL, O’Callaghan A, et al. Intensive communication skills teaching for specialist training in palliative medicine: development and evaluation of an experiential workshop. J Palliat Med 2012;15:585–91.
28. Hymes DH. On communicative competence. In: Pride JB, Holmes J, editors. Sociolinguistics: selected readings. Harmondsworth: Penguin; 1972:269–93.
29. Asnani MR. Patient-physician communication. West Indian Med J 2009;58:357–61.
30. Clark PA. Medical practices’ sensitivity to patients’ needs: Opportunities and practices for improvement. J Ambulat Care Manage 2003;26:110–23.
31. Wanzer MB, Booth-Butterfield M, Gruber K. Perceptions of health care providers’ communication: Relationships between patient-centered communication and satisfaction. Health Care Commun 2004;16:363–84.
Promoting Quality Asthma Care in Hospital Emergency Departments: Past, Present, and Future Efforts in Florida
From the Florida State University College of Medicine, Tallahassee, FL.
Abstract
- Objective: To describe efforts to assess, improve, and reinforce asthma management protocols and practices at hospital emergency departments (EDs) in Florida.
- Methods: Description of 4 stages of an evaluation and outreach effort including assessment of current ED asthma care protocols and quality improvement plans; interactive education about asthma management best practices for hospital ED professionals; home visiting asthma management pilot programs for community members; and collaborative learning opportunities for clinicians and health care administrators.
- Results: We describe the evidence basis for each component of the Florida Asthma Program’s strategy, review key lessons learned, and discuss next steps.
- Conclusion: Promoting comprehensive, integrative asthma care within and beyond EDs will remain a top priority for the Florida Asthma Program. Our interdisciplinary team continues to explore additional strategies for creating transformational change in the quality and utilization of emergency care for Floridians of all ages who live with asthma.
Approximately 10% of children and 8% of adults in Florida live with asthma, a costly disease whose care expenses total over $56 billion in the United States each year [1]. Asthma prevalence and care costs continue to rise in Florida and other states [1], and 1.8 million asthma-related emergency department visits occur each year [2]. In 2010, a total of 90,770 emergency department visits occurred in Florida with asthma listed as the primary diagnosis, an increase of 12.7% from 2005 [1]. National standards for asthma care in the emergency department have been developed [3] and improving the quality of emergency department asthma care is a focus for many health care organizations.
In 2012, the Florida Asthma Program partnered with the Florida Hospital Association to review current asthma care activities and policies in emergency departments statewide. Evaluators from Florida State University developed and implemented a survey to assess gaps in emergency department asthma management at Florida hospitals. The survey illuminated strengths and weaknesses in the processes and resources used by hospital emergency departments in responding to asthma symptoms, and 3 follow-up interventions emerged from this assessment effort. In this paper, I discuss our survey findings and follow-up activities.
Assessment of ED Management Practices
The survey instrument had both open- and closed-ended questions and took about 15 minutes to complete. Participants were advised that publicly available document would not identify individuals or hospitals by name and they would receive the final summary report.
Our results suggest inconsistency among sampled Florida hospitals’ adherence to national standards for treatment of asthma in emergency departments. Several hospitals were refining their emergency care protocols to incorporate guideline recommendations. Despite a lack of formal emergency department protocols in some hospitals, adherence to national guidelines for emergency care was robust for patient education and medication prescribing, but weaker for formal care planning and medical follow-up.
Each of our participating hospitals reported using an evidence-based approach that incorporated national asthma care guidelines. However, operationalization and documentation of guidelines-based care varied dramatically across participating hospitals. Some hospitals already had well-developed protocols for emergency department asthma care, including both detailed clinical pathways and more holistic approaches incorporating foundational elements of guidelines-based care. By contrast, others had no formal documentation of their asthma management practices for patients seen in the emergency department.
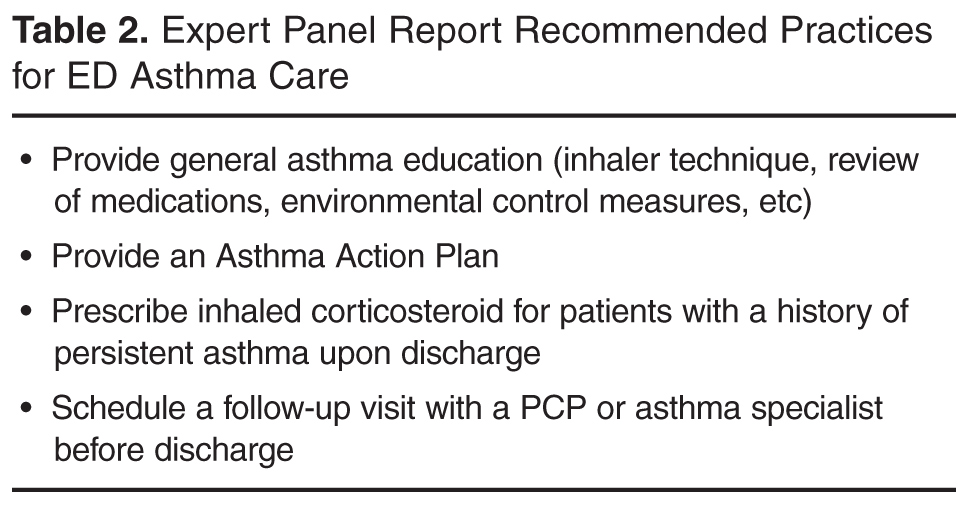
By contrast, we found that utilization of evidence-based supportive services was uniformly high. Specific emergency department asthma care services that appeared to be well developed in Florida were case management, community engagement, and asthma education by certified professionals. We also found that many of the hospitals were in the process of reviewing and documenting their emergency department asthma care practices at the time of our study. Participants noted particular challenges with creating written care plans and dispensing inhaled medications for home use. Following up on the latter issue revealed that Florida state policy on medication use and dispensation in emergency department setting were the main barrier to sending patients with asthma home from the emergency department with needed medications. Consequently, the Florida Asthma Program worked with the state board of pharmacy to implement reforms, which became effective February 2014 [6].
Educational Webinars
Research indicates that quality improvement interventions can improve the outcomes and processes of care for children with asthma [7]. We noted that respondents were often unaware of how other hospitals in the state compared to their own on both national quality measures and strategies for continuous quality improvement. Therefore, promoting dialogue and collaboration became a priority. We developed 2 webinars to allow hospital personnel to learn directly from each other about ways to improve emergency department asthma care. The webinars were open to personnel from any hospital in Florida that wished to attend, not just the hospitals that participated in the initial study.
Florida Asthma Coalition members with clinical expertise partnered with Florida Hospital Association employees and asthma program staff from the Department of Health to design the webinars. Presentations were invited from hospitals that had successfully incorporated EPR-3 guidance into all aspects of their emergency department asthma care and any associated follow-up services. We asked presenters to focus on how their hospitals overcame challenges to successful guideline implementation. During each interactive session, participants had the opportunity to ask questions and receive guidance from presenters and presenters also encouraged hospitals to develop their own internal training webinars and supportive resources for learning, and to share the interventions and materials they created with one another as well as relevant professional organizations.
The webinars were two complementary 90-minute sessions and were delivered in summer 2013. The first webinar, “Optimal Asthma Treatment in the Emergency Department,” focused specifically on best practices for care in emergency departments themselves. It covered EPR-3 recommended activities such as helping families create Asthma Action Plans and demonstrating proper inhaler technique. The second webinar, “Transitioning Asthma Care from the Emergency Department to Prevent Repeat Visits,” focused on strategies for preventing repeat visits with people who have been seen in the emergency department for asthma. It covered activities like creating linkages with primary and specialty care providers skilled in asthma care, and partnering with case management professionals to follow discharged patients over time. Both webinars emphasized strategies for consistently implementing and sustaining adherence to EPR-3 guidelines in emergency departments. Participants attended sessions from their offices or meeting rooms by logging onto the webinar in a browser window and dialing into the conference line. Full recordings of both sessions remain available online at http://floridaasthmacoalition.com/healthcare-providers/recorded-webinars/.
We evaluated the reach and effectiveness of the webinars [8]. Attendance was high, with 137 pre-registrants and many more participating. Over 90% of participants in each session rated the content and discussion as either very good or excellent, and at least 90% indicated that they would recommend the learning modules to their colleagues. Participants expressed strong interest in continuing the activities initiated with the web sessions on a year-round basis, with particular emphasis on partnership building, continuing education, and cooperative action.
Asthma-Friendly Homes Program
Data from our preliminary assessment of asthma management practices in Florida hospitals suggested that an important priority for improving emergency department asthma care is reducing repeat visits. Rates of repeated emergency department utilization for asthma management correlate inversely with both household income and quality of available resources for home self-management. Our team considered developing a home visiting program to bring asthma education programming and self-management tools to children and their families. Rather than trying to build a new program ourselves, we extended our focus on strategic partnership to the Florida department of health’s regional affiliate in Miami-Dade County, who were developing a home visiting intervention to reduce emergency department visits and improve continuity of care for children with asthma [9].
Early planning for the Miami-Dade program included a focus on low-income communities and households, including the homes of children with Latino and/or Haitian heritage. The Asthma-Friendly Homes Program was developed in partnership with Nicklaus Children’s Hospital, with the hospital and the local Department of Health affiliate sharing responsibility for program implementation and management as well as data collection [10]. Small adjustments were made to the overall program strategy as partner agencies began working with Florida Asthma Program managers and evaluators. Now in its second year of implementation, the Asthma-Friendly Homes Program continues to evolve and grow.
Preventing repeat visits to the emergency room in favor of daily self-management at home remains the central emphasis of the program. Its curriculum focuses on empowering children with asthma and their families to self-manage effectively and consistently. By consequence, the Asthma-Friendly Homes Program encourages patients to use emergency department care services only when indicated by signs and symptoms rather than as a primary source of care. To achieve these objectives, the program uses a combination of activities including home visits and regular follow-up by case management.
Delivery of the Asthma-Friendly Homes Program begins with determination of eligibility via medical records review. Data analysts from the regional Miami-Dade branch of department of health collaborate with case managers from Nicklaus Children’s Hospital to identify children who are eligible for participation. Eligibility criteria include 3 or more visits to the emergency room for asthma within the past year, related care costs totaling at least $50,000 in the past year, and residency in 1 of 7 target zip codes that represent low-income communities. When a child is deemed eligible, case managers contact their family to facilitate scheduling of a home environmental assessment by trained specialists from the department of health. During this visit, families receive information about common asthma triggers within their homes, and talk with environmental assessors about possible mitigation strategies that are appropriate for their specific economic and instrumental resources. At the conclusion of this visit, families are asked if they would like to receive an educational intervention to help their child build self-management skills in a supportive environment.
Families that wish to participate in the educational component of Asthma-Friendly Homes are then put in touch with a certified asthma educator employed by Nicklaus Children’s Hospital. Participants can schedule a preliminary visit with their asthma educator themselves, or work with case management at Nicklaus to coordinate intake for the educational program. Visiting asthma educators begin by completing a preliminary demographics, symptoms, and skills assessment with family members. They deliver 3 sessions of education for participating children, each time assessing progress using a standardized questionnaire. Although the evaluation instruments for these sessions are standard, the curriculum used by asthma educators is tailored to the needs of each individual child and their family. The demographics, symptoms, and skills assessment is repeated with family members at the end of the third visit from asthma educators. Finally, case managers follow up with families after 6 months to assess retention of benefits from the program.
Participating children are also tracked in the hospital’s emergency department records to contextualize success with home-based self-management. Like data from the questionnaires, this information gets shared with Florida Asthma Program evaluators. Our team uses these data to understand the effectiveness of the Asthma-Friendly Homes Program itself, as well as its utility for preventing repeated utilization of hospital emergency department services. The program currently has 9 families participating, which is on target for the early stages of our pilot program with Miami. As we evaluate Asthma-Friendly Homes, we hope that this program will become a new standard in evidence-based best practices for keeping children out of the emergency room and healthy at home, both in Florida and across the nation. To disseminate results from this intervention in ways that promote adoption of effective self-management curricula by organizations working with vulnerable populations, we are thus focusing intensively on building networks that facilitate this sharing.
Learning and Action Networks
Building on lessons learned from our evaluation of emergency department asthma care and delivery of interactive webinars, our team proposed a systems-focused approach for implementing and sharing knowledge gained from these activities. As such, the department of health is developing Learning and Action Networks. LANs are mechanisms by which large-scale improvement around a given aim is fostered, studied, adapted, and rapidly spread. LANs are similar to “communities of practice” in that they promote learning among peer practitioners, but differ in that they focus on a specific improvement initiative, in this case delivery of and reimbursement for comprehensive asthma management.
The department of health has so far implemented 2 LANs, one for managed care organizations including those working under Medicaid and Florida KidCare, and one for providers, including federally qualified health centers, community health centers, and rural health centers. In future funding years, LANs will be established for pharmacists, hospitals, and public housing groups to promote coverage for and utilization of comprehensive asthma control services.
LANs are carried out in partnership with the professional organizations and related umbrella organizations serving each sector. A minimum of 3 webinars will be offered each year for each LAN. They will promote active engagement and communication between partners as well as offer opportunities to share successes and troubleshooting tips. Online forums or other means of communication will also be established based on the needs of participants. Topics will be driven by participant interests and will include performance and quality improvement, public health/health care system linkages, use of decision support tools, use of electronic health records for care coordination, and other issues related to the provision and reimbursement for evidence-based, comprehensive asthma control services.
LAN facilitators and members will learn continuously from one another. Members can implement best practices for strategic collaboration learned from facilitators, while facilitators will become familiar with best practices for asthma care that can be disseminated within and beyond Florida.
The LAN for hospitals will cover improving emergency department asthma care. This may include performance and quality improvement strategies, systems-level linkages between public health and clinical care, provider decision support tools, use of electronic health records for care coordination, case management resources for continuous follow-up after discharge, and evidence-based approaches to medication dispensing and monitoring.
Conclusion
Promoting comprehensive, integrative asthma care within and beyond emergency departments will remain a top priority for the Florida Asthma Program. Our interdisciplinary team of program managers and external evaluators continues to explore additional strategies for creating transformational change in the quality and utilization of emergency care for Floridians of all ages who live with asthma.
Acknowledgements: I thank Ms. Kim Streit and other members of the Florida Hospital Association for their outstanding assistance in conceptualizing and implementing this evaluation project. I thank Ms. Julie Dudley for developing content for the collaborative learning webinars described herein, as well as proposing and operationalizing Florida’s Learning and Action Networks for asthma care. I thank Ms. Jamie Forrest for facilitating delivery and evaluation of the hospital learning webinars. I thank Dr. Brittny Wells for helping to develop the Learning and Action Networks initiative in conjunction with other programs, and facilitating continued collaboration with hospitals. I thank Dr. Asit Sarkar for coordinating the Asthma Friendly Homes Program in Miami-Dade, and for helping to bring this program to other Florida communities. I thank Dr. Henry Carretta for his partnership in conducting the preliminary evaluation survey, and for his assistance with planning evaluation of hospital care quality improvement activities for the current project cycle.
Corresponding author: Alexandra C.H. Nowakowski, PhD, MPH, FSU College of Medicine, Regional Campus – Orlando,50 E. Colonial Drive, Suite 200, Orlando, FL 32801.
Funding/support: Evaluation of the Florida Asthma Program’s preliminary work with hospitals was supported by Cooperative Agreement Number 5U59EH000523-03 from the Centers for Disease Control and Prevention (CDC). Current program development and evaluation efforts in this domain are supported by CDC Cooperative Agreement Number 2U59EH000523. Contents of this manuscript are solely the responsibility of the author and do not necessarily represent the official views of the CDC.
Financial disclosures: None.
1. Forrest J, Dudley J. Burden of Asthma in Florida. Florida Department of Health, Division of Community Health Promotion, Bureau of Chronic Disease Prevention, Florida Asthma Program. Accessed 22 Oct 2015 at www.floridaasthmacoalition.org.
2. National Hospital Ambulatory Medical Care Survey: 2011 Emergency department summary tables. Accessed 22 Oct 2015 at www.cdc.gov/nchs/data/ahcd/nhamcs_emergency/2011ed_web_tables.pdf.
3. National Heart, Lung, and Blood Institute. Expert Panel Report 3: Guidelines for the Diagnosis and Management of Asthma. NHLBI website. 2007. Accessed 22 Oct 2015 at www.nhlbi.nih.gov/files/docs/guidelines/asthgdln.pdf.
4. Florida Hospital Association. Facts & Stats. FHA website. 2012. Accessed 22 Oct 2015 at www.fha.org/reports-and-resources/facts-and-stats.aspx.
5. Nowakowski AC, Carretta HJ, Dudley JK, et al. Evaluating emergency department asthma management practices in Florida hospitals. J Public Health Manag Pract 2016;22:E8–E13.
6. State of Florida. The 2015 Florida Statutes, Chapter 465 – Pharmacy. Accessed 22 Oct 2015 at www.leg.state.fl.us/Statutes/index.cfm?App_mode=Display_Statute&URL=0400-0499/
0465/0465.html.
7. Bravata DM, Gienger AL, Holty JE, et al. Quality improvement strategies for children with asthma: a systematic review. Arch Pediatr Adolesc Med 2009;163:572–81.
8. Nowakowski ACH, Carretta HJ, Smith TR, et al. Improving asthma management in hospital emergency departments with interactive webinars. Florida Public Health Rev 2015;12:31–3.
9. Moore E. Introduction to the asthma home-visit collaborative project. Florida Department of Health in Miami-Dade County EPI monthly report 2015;16(8).
10. Florida Asthma Coalition. Asthma-Friendly Homes Project. Accessed 22 Oct 2015 at www.floridaasthmacoalition.com/healthcare-providers/asthma-friendly-home-project/.
From the Florida State University College of Medicine, Tallahassee, FL.
Abstract
- Objective: To describe efforts to assess, improve, and reinforce asthma management protocols and practices at hospital emergency departments (EDs) in Florida.
- Methods: Description of 4 stages of an evaluation and outreach effort including assessment of current ED asthma care protocols and quality improvement plans; interactive education about asthma management best practices for hospital ED professionals; home visiting asthma management pilot programs for community members; and collaborative learning opportunities for clinicians and health care administrators.
- Results: We describe the evidence basis for each component of the Florida Asthma Program’s strategy, review key lessons learned, and discuss next steps.
- Conclusion: Promoting comprehensive, integrative asthma care within and beyond EDs will remain a top priority for the Florida Asthma Program. Our interdisciplinary team continues to explore additional strategies for creating transformational change in the quality and utilization of emergency care for Floridians of all ages who live with asthma.
Approximately 10% of children and 8% of adults in Florida live with asthma, a costly disease whose care expenses total over $56 billion in the United States each year [1]. Asthma prevalence and care costs continue to rise in Florida and other states [1], and 1.8 million asthma-related emergency department visits occur each year [2]. In 2010, a total of 90,770 emergency department visits occurred in Florida with asthma listed as the primary diagnosis, an increase of 12.7% from 2005 [1]. National standards for asthma care in the emergency department have been developed [3] and improving the quality of emergency department asthma care is a focus for many health care organizations.
In 2012, the Florida Asthma Program partnered with the Florida Hospital Association to review current asthma care activities and policies in emergency departments statewide. Evaluators from Florida State University developed and implemented a survey to assess gaps in emergency department asthma management at Florida hospitals. The survey illuminated strengths and weaknesses in the processes and resources used by hospital emergency departments in responding to asthma symptoms, and 3 follow-up interventions emerged from this assessment effort. In this paper, I discuss our survey findings and follow-up activities.
Assessment of ED Management Practices
The survey instrument had both open- and closed-ended questions and took about 15 minutes to complete. Participants were advised that publicly available document would not identify individuals or hospitals by name and they would receive the final summary report.
Our results suggest inconsistency among sampled Florida hospitals’ adherence to national standards for treatment of asthma in emergency departments. Several hospitals were refining their emergency care protocols to incorporate guideline recommendations. Despite a lack of formal emergency department protocols in some hospitals, adherence to national guidelines for emergency care was robust for patient education and medication prescribing, but weaker for formal care planning and medical follow-up.
Each of our participating hospitals reported using an evidence-based approach that incorporated national asthma care guidelines. However, operationalization and documentation of guidelines-based care varied dramatically across participating hospitals. Some hospitals already had well-developed protocols for emergency department asthma care, including both detailed clinical pathways and more holistic approaches incorporating foundational elements of guidelines-based care. By contrast, others had no formal documentation of their asthma management practices for patients seen in the emergency department.
By contrast, we found that utilization of evidence-based supportive services was uniformly high. Specific emergency department asthma care services that appeared to be well developed in Florida were case management, community engagement, and asthma education by certified professionals. We also found that many of the hospitals were in the process of reviewing and documenting their emergency department asthma care practices at the time of our study. Participants noted particular challenges with creating written care plans and dispensing inhaled medications for home use. Following up on the latter issue revealed that Florida state policy on medication use and dispensation in emergency department setting were the main barrier to sending patients with asthma home from the emergency department with needed medications. Consequently, the Florida Asthma Program worked with the state board of pharmacy to implement reforms, which became effective February 2014 [6].
Educational Webinars
Research indicates that quality improvement interventions can improve the outcomes and processes of care for children with asthma [7]. We noted that respondents were often unaware of how other hospitals in the state compared to their own on both national quality measures and strategies for continuous quality improvement. Therefore, promoting dialogue and collaboration became a priority. We developed 2 webinars to allow hospital personnel to learn directly from each other about ways to improve emergency department asthma care. The webinars were open to personnel from any hospital in Florida that wished to attend, not just the hospitals that participated in the initial study.
Florida Asthma Coalition members with clinical expertise partnered with Florida Hospital Association employees and asthma program staff from the Department of Health to design the webinars. Presentations were invited from hospitals that had successfully incorporated EPR-3 guidance into all aspects of their emergency department asthma care and any associated follow-up services. We asked presenters to focus on how their hospitals overcame challenges to successful guideline implementation. During each interactive session, participants had the opportunity to ask questions and receive guidance from presenters and presenters also encouraged hospitals to develop their own internal training webinars and supportive resources for learning, and to share the interventions and materials they created with one another as well as relevant professional organizations.
The webinars were two complementary 90-minute sessions and were delivered in summer 2013. The first webinar, “Optimal Asthma Treatment in the Emergency Department,” focused specifically on best practices for care in emergency departments themselves. It covered EPR-3 recommended activities such as helping families create Asthma Action Plans and demonstrating proper inhaler technique. The second webinar, “Transitioning Asthma Care from the Emergency Department to Prevent Repeat Visits,” focused on strategies for preventing repeat visits with people who have been seen in the emergency department for asthma. It covered activities like creating linkages with primary and specialty care providers skilled in asthma care, and partnering with case management professionals to follow discharged patients over time. Both webinars emphasized strategies for consistently implementing and sustaining adherence to EPR-3 guidelines in emergency departments. Participants attended sessions from their offices or meeting rooms by logging onto the webinar in a browser window and dialing into the conference line. Full recordings of both sessions remain available online at http://floridaasthmacoalition.com/healthcare-providers/recorded-webinars/.
We evaluated the reach and effectiveness of the webinars [8]. Attendance was high, with 137 pre-registrants and many more participating. Over 90% of participants in each session rated the content and discussion as either very good or excellent, and at least 90% indicated that they would recommend the learning modules to their colleagues. Participants expressed strong interest in continuing the activities initiated with the web sessions on a year-round basis, with particular emphasis on partnership building, continuing education, and cooperative action.
Asthma-Friendly Homes Program
Data from our preliminary assessment of asthma management practices in Florida hospitals suggested that an important priority for improving emergency department asthma care is reducing repeat visits. Rates of repeated emergency department utilization for asthma management correlate inversely with both household income and quality of available resources for home self-management. Our team considered developing a home visiting program to bring asthma education programming and self-management tools to children and their families. Rather than trying to build a new program ourselves, we extended our focus on strategic partnership to the Florida department of health’s regional affiliate in Miami-Dade County, who were developing a home visiting intervention to reduce emergency department visits and improve continuity of care for children with asthma [9].
Early planning for the Miami-Dade program included a focus on low-income communities and households, including the homes of children with Latino and/or Haitian heritage. The Asthma-Friendly Homes Program was developed in partnership with Nicklaus Children’s Hospital, with the hospital and the local Department of Health affiliate sharing responsibility for program implementation and management as well as data collection [10]. Small adjustments were made to the overall program strategy as partner agencies began working with Florida Asthma Program managers and evaluators. Now in its second year of implementation, the Asthma-Friendly Homes Program continues to evolve and grow.
Preventing repeat visits to the emergency room in favor of daily self-management at home remains the central emphasis of the program. Its curriculum focuses on empowering children with asthma and their families to self-manage effectively and consistently. By consequence, the Asthma-Friendly Homes Program encourages patients to use emergency department care services only when indicated by signs and symptoms rather than as a primary source of care. To achieve these objectives, the program uses a combination of activities including home visits and regular follow-up by case management.
Delivery of the Asthma-Friendly Homes Program begins with determination of eligibility via medical records review. Data analysts from the regional Miami-Dade branch of department of health collaborate with case managers from Nicklaus Children’s Hospital to identify children who are eligible for participation. Eligibility criteria include 3 or more visits to the emergency room for asthma within the past year, related care costs totaling at least $50,000 in the past year, and residency in 1 of 7 target zip codes that represent low-income communities. When a child is deemed eligible, case managers contact their family to facilitate scheduling of a home environmental assessment by trained specialists from the department of health. During this visit, families receive information about common asthma triggers within their homes, and talk with environmental assessors about possible mitigation strategies that are appropriate for their specific economic and instrumental resources. At the conclusion of this visit, families are asked if they would like to receive an educational intervention to help their child build self-management skills in a supportive environment.
Families that wish to participate in the educational component of Asthma-Friendly Homes are then put in touch with a certified asthma educator employed by Nicklaus Children’s Hospital. Participants can schedule a preliminary visit with their asthma educator themselves, or work with case management at Nicklaus to coordinate intake for the educational program. Visiting asthma educators begin by completing a preliminary demographics, symptoms, and skills assessment with family members. They deliver 3 sessions of education for participating children, each time assessing progress using a standardized questionnaire. Although the evaluation instruments for these sessions are standard, the curriculum used by asthma educators is tailored to the needs of each individual child and their family. The demographics, symptoms, and skills assessment is repeated with family members at the end of the third visit from asthma educators. Finally, case managers follow up with families after 6 months to assess retention of benefits from the program.
Participating children are also tracked in the hospital’s emergency department records to contextualize success with home-based self-management. Like data from the questionnaires, this information gets shared with Florida Asthma Program evaluators. Our team uses these data to understand the effectiveness of the Asthma-Friendly Homes Program itself, as well as its utility for preventing repeated utilization of hospital emergency department services. The program currently has 9 families participating, which is on target for the early stages of our pilot program with Miami. As we evaluate Asthma-Friendly Homes, we hope that this program will become a new standard in evidence-based best practices for keeping children out of the emergency room and healthy at home, both in Florida and across the nation. To disseminate results from this intervention in ways that promote adoption of effective self-management curricula by organizations working with vulnerable populations, we are thus focusing intensively on building networks that facilitate this sharing.
Learning and Action Networks
Building on lessons learned from our evaluation of emergency department asthma care and delivery of interactive webinars, our team proposed a systems-focused approach for implementing and sharing knowledge gained from these activities. As such, the department of health is developing Learning and Action Networks. LANs are mechanisms by which large-scale improvement around a given aim is fostered, studied, adapted, and rapidly spread. LANs are similar to “communities of practice” in that they promote learning among peer practitioners, but differ in that they focus on a specific improvement initiative, in this case delivery of and reimbursement for comprehensive asthma management.
The department of health has so far implemented 2 LANs, one for managed care organizations including those working under Medicaid and Florida KidCare, and one for providers, including federally qualified health centers, community health centers, and rural health centers. In future funding years, LANs will be established for pharmacists, hospitals, and public housing groups to promote coverage for and utilization of comprehensive asthma control services.
LANs are carried out in partnership with the professional organizations and related umbrella organizations serving each sector. A minimum of 3 webinars will be offered each year for each LAN. They will promote active engagement and communication between partners as well as offer opportunities to share successes and troubleshooting tips. Online forums or other means of communication will also be established based on the needs of participants. Topics will be driven by participant interests and will include performance and quality improvement, public health/health care system linkages, use of decision support tools, use of electronic health records for care coordination, and other issues related to the provision and reimbursement for evidence-based, comprehensive asthma control services.
LAN facilitators and members will learn continuously from one another. Members can implement best practices for strategic collaboration learned from facilitators, while facilitators will become familiar with best practices for asthma care that can be disseminated within and beyond Florida.
The LAN for hospitals will cover improving emergency department asthma care. This may include performance and quality improvement strategies, systems-level linkages between public health and clinical care, provider decision support tools, use of electronic health records for care coordination, case management resources for continuous follow-up after discharge, and evidence-based approaches to medication dispensing and monitoring.
Conclusion
Promoting comprehensive, integrative asthma care within and beyond emergency departments will remain a top priority for the Florida Asthma Program. Our interdisciplinary team of program managers and external evaluators continues to explore additional strategies for creating transformational change in the quality and utilization of emergency care for Floridians of all ages who live with asthma.
Acknowledgements: I thank Ms. Kim Streit and other members of the Florida Hospital Association for their outstanding assistance in conceptualizing and implementing this evaluation project. I thank Ms. Julie Dudley for developing content for the collaborative learning webinars described herein, as well as proposing and operationalizing Florida’s Learning and Action Networks for asthma care. I thank Ms. Jamie Forrest for facilitating delivery and evaluation of the hospital learning webinars. I thank Dr. Brittny Wells for helping to develop the Learning and Action Networks initiative in conjunction with other programs, and facilitating continued collaboration with hospitals. I thank Dr. Asit Sarkar for coordinating the Asthma Friendly Homes Program in Miami-Dade, and for helping to bring this program to other Florida communities. I thank Dr. Henry Carretta for his partnership in conducting the preliminary evaluation survey, and for his assistance with planning evaluation of hospital care quality improvement activities for the current project cycle.
Corresponding author: Alexandra C.H. Nowakowski, PhD, MPH, FSU College of Medicine, Regional Campus – Orlando,50 E. Colonial Drive, Suite 200, Orlando, FL 32801.
Funding/support: Evaluation of the Florida Asthma Program’s preliminary work with hospitals was supported by Cooperative Agreement Number 5U59EH000523-03 from the Centers for Disease Control and Prevention (CDC). Current program development and evaluation efforts in this domain are supported by CDC Cooperative Agreement Number 2U59EH000523. Contents of this manuscript are solely the responsibility of the author and do not necessarily represent the official views of the CDC.
Financial disclosures: None.
1. Forrest J, Dudley J. Burden of Asthma in Florida. Florida Department of Health, Division of Community Health Promotion, Bureau of Chronic Disease Prevention, Florida Asthma Program. Accessed 22 Oct 2015 at www.floridaasthmacoalition.org.
2. National Hospital Ambulatory Medical Care Survey: 2011 Emergency department summary tables. Accessed 22 Oct 2015 at www.cdc.gov/nchs/data/ahcd/nhamcs_emergency/2011ed_web_tables.pdf.
3. National Heart, Lung, and Blood Institute. Expert Panel Report 3: Guidelines for the Diagnosis and Management of Asthma. NHLBI website. 2007. Accessed 22 Oct 2015 at www.nhlbi.nih.gov/files/docs/guidelines/asthgdln.pdf.
4. Florida Hospital Association. Facts & Stats. FHA website. 2012. Accessed 22 Oct 2015 at www.fha.org/reports-and-resources/facts-and-stats.aspx.
5. Nowakowski AC, Carretta HJ, Dudley JK, et al. Evaluating emergency department asthma management practices in Florida hospitals. J Public Health Manag Pract 2016;22:E8–E13.
6. State of Florida. The 2015 Florida Statutes, Chapter 465 – Pharmacy. Accessed 22 Oct 2015 at www.leg.state.fl.us/Statutes/index.cfm?App_mode=Display_Statute&URL=0400-0499/
0465/0465.html.
7. Bravata DM, Gienger AL, Holty JE, et al. Quality improvement strategies for children with asthma: a systematic review. Arch Pediatr Adolesc Med 2009;163:572–81.
8. Nowakowski ACH, Carretta HJ, Smith TR, et al. Improving asthma management in hospital emergency departments with interactive webinars. Florida Public Health Rev 2015;12:31–3.
9. Moore E. Introduction to the asthma home-visit collaborative project. Florida Department of Health in Miami-Dade County EPI monthly report 2015;16(8).
10. Florida Asthma Coalition. Asthma-Friendly Homes Project. Accessed 22 Oct 2015 at www.floridaasthmacoalition.com/healthcare-providers/asthma-friendly-home-project/.
Follow-up of Abnormal Metanephrine and Catecholamine Testing: Chasing Missed Neuroendocrine Tumors
From the Department of Medicine, Tufts Medical Center, Boston, MA.
Abstract
- Objective: To measure the frequency of missed pheochromocytoma test results and identify factors related to the risk of failed follow-up.
- Methods: We performed a retrospective review of the medical record to identify patients with abnormal urine or serum metanephrine or catecholamine test results over a 3-year period. We then searched the electronic medical record for documentation that the responsible physician was aware of the test results. We surveyed the physicians in cases where there were abnormal results and no documented follow-up to assess their awareness of the results and any follow-up actions they may have taken.
- Results: During the 3-year look-back period, 451 send-out tests for 332 patients were ordered for serum metanephrines, serum catecholamines, or urine catecholamines and/or metanephrines. Fifty-five tests affecting 46 patients returned with either moderately (n = 41) or critically elevated values (n = 5). Fifteen of these patients were inpatients when the tests were ordered, and 31 were outpatients. In 15 of 46 abnormal cases, there was no documentation in the electronic medical record that the responsible physician was aware of the result. Of the 15 cases without documentation, 6 of the responsible physicians in such cases were aware of the results.
- Conclusion: One-third of patients with abnormal lab testing for pheochromocytoma did not have clearly documented follow-up in the electronic medical record, and the majority of physicians in such cases were not aware of the results. Changes to the processes at health care institutions and reference laboratories are needed to improve follow-up of send-out lab results.
Delayed or missed follow-up of laboratory tests is a major source of medical harm [1–5]. Testing performed in both the inpatient and outpatient settings is susceptible to lost follow-up, in part because medical testing is a complex process that is vulnerable to multiple process-of-care failures [1,5–7]. In previous studies, the rate of missed follow-up of abnormal medical test results has ranged from 1% to 75% [6]. Laboratory test follow-up is a particularly challenging problem as patients transition between care settings [8,9]. In a study of 86 patients at one academic medical center, Moore and colleagues found that over a 1-year period, 41% of patients who had laboratory tests pending at the time of discharge had no documented follow-up for at least one of those tests [9]. More recently, Roy and colleagues reported that nearly half of 2644 patients discharged from general medicine hospitalist services at 2 academic tertiary care centers had pending laboratory or radiographic results. Nine percent of the pending results were potentially actionable, and a follow-up survey from the study revealed that 61% of physicians were unaware of pending results [10]. Similar findings have been reported in ambulatory care [5,8,11].
Among the universe of laboratory tests, tests performed at reference laboratories outside of the hospital or clinic where care is rendered (ie, “send-out” tests) are particularly susceptible to lost follow-up [12,13]. Because many of these tests are expensive and infrequently ordered, it is most feasible and economical for hospitals and clinics to transport these samples to regional or national laboratories for specialized testing [14,15]. Examples include the serotonin release assay, certain rheumatologic studies, cancer genetics, and advanced endocrine testing. Send-out testing poses several potential risks including accidental ordering of the wrong test, processing or transportation delays, failure of the outside laboratory to receive the specimen, failures of results reporting by the reference laboratory, incorrect result entry into the electronic medical record upon receipt, failure of the clinician to receive or note the result, or failure of clinician to interpret or act on the result [12,13,15]. Although previous studies have identified risk factors associated with missed abnormal test results [1], none to our knowledge have assessed the particular risks associated with samples processed at reference laboratories.
A critical event at our hospital involved a young woman who presented with respiratory failure attributed to a community-acquired pneumonia and systolic congestive heart failure that was thought to be related to her acute illness. Serum and urine metanephrines were ordered in the intensive care unit given the possibility that heart failure in a young patient could be attributed to an occult neuroendocrine tumor. The patient improved clinically and was discharged. Because the discharging service was unaware that the metanephrine tests had been ordered and were being processed at a national reference laboratory, they did not follow up on the test result or include it as pending in the discharge summary. Fortunately, the patient’s primary care physician discovered that the metanephrine levels were elevated and referred the patient for endocrine evaluation and definitive treatment.
Given the risk represented by pending send-out tests raised by this episode, we performed a retrospective study to identify other cases of missed abnormal send-out tests for metanephrines and catecholamines for in- and outpatients over the previous 3 years. We also sought to identify factors that increased the risk of failed follow-up.
Methods
Subjects and Setting
We studied adult in- and outpatients who received care at a 415-bed Boston-based academic medical center.
Project Design and Data Collection
We performed a retrospective record review of a cohort of patients with abnormal send-out laboratory tests for metanephrines and catecholamines. We collected laboratory reports of all results of urine and serum metanephrine and catecholamine tests performed from 1 January 2012 through 31 December 2014. All tests were performed at and reported by Quest Diagnostics in Chantilly, Virginia. The relevant tests were identified using a query of the online Quest Diagnostics system to extract all laboratory results for serum metanephrines, serum catecholamines, urine metanephrines, and urine catecholamines that resulted during this period. Reports were PDF files that were printed and reviewed manually. (Of note, providers typically view lab results directly in the electronic medical record. Reports were extracted from the Quest Diagnostics system for study purposes only.)
We used the reference ranges supplied by the laboratory to sort results into: normal levels, moderately elevated levels (1 to 4 times the upper limit of normal), and critically elevated levels (greater than 4 times the upper limit of normal). A physician (RZ) then reviewed the electronic medical record of each patient with moderately or critically elevated results for evidence that the responsible physician was aware of the results and had documented a follow-up plan. Documentation of physician awareness and follow-up was ascertained by notation and interpretation of the test result in either a discharge summary from the index admission or in an outpatient clinic note. The responsible physician was defined as the ordering physician for tests ordered in ambulatory care and the attending physician at time of discharge for inpatients. In cases where no documentation was identified in the medical record, the responsible physicians received an email questionnaire that asked (1) if they were aware of the abnormal result, (2) if aware of the result, did they notify the primary care physician or referring physician, and (3) if they were aware of any further follow-up or intervention.
Analysis
We stratified the cases into those with normal and abnormal labs values, and then further by those that did and did not have documentation of results and follow-up in the medical record. We then further stratified cases into those in which the responsible physician was aware and those in which they were unaware. If unaware, the patient was contacted directly by the risk management department, primarily for patient safety purposes. If we were unable to contact the patient, the patient’s listed primary care physician was contacted directly. We then performed qualitative analysis of the cases with abnormal results and no documented follow-up, with the goal of identifying common themes.
Results
During the 3-year look-back period, 451 send-out tests for 332 patients were ordered for serum metanephrines, serum catecholamines, urine catecholamines, or metanephrines. Fifty-five tests affecting 46 patients returned with either moderately or critically elevated values, while 396 results affecting 286 patients returned within the reference range. Five patients had critically elevated values and 41 patients had moderately elevated values. Fifteen were inpatients when the tests were ordered and 31 were outpatients.
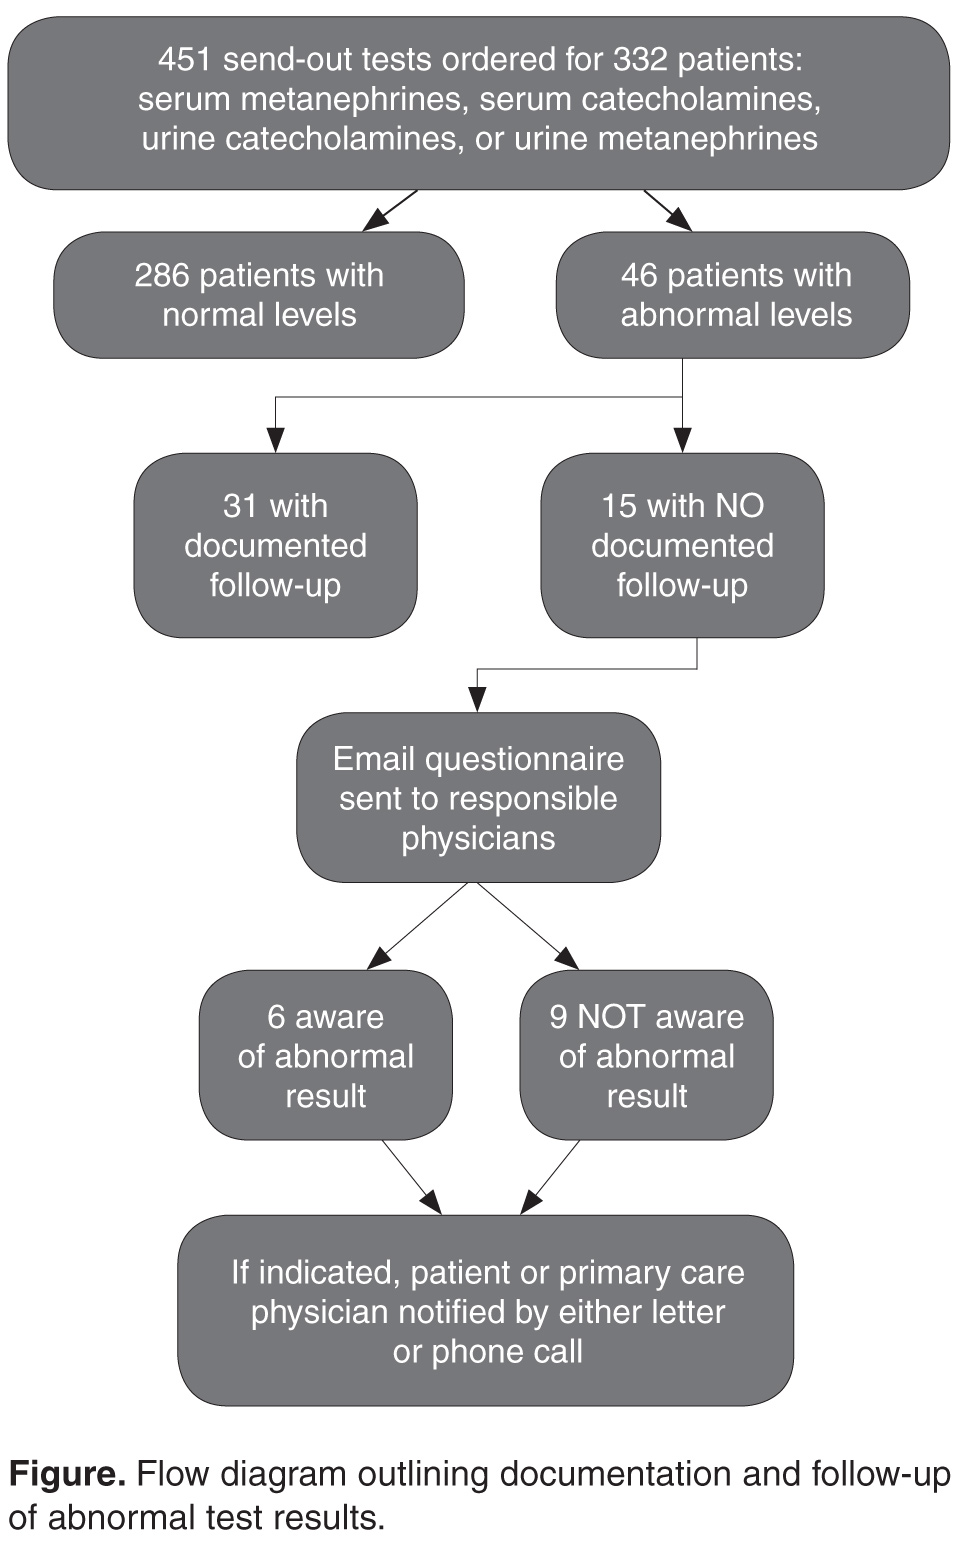
In the survey of the responsible physicians in the 15 cases with no follow-up, all 15 physicians responded. Six were aware of the abnormal result and 9 were not (Figure). Five of the 6 cases in which the physician was aware were outpatients. Eight of the 9 cases in which the physician was not aware were inpatients. In 4 of 15 abnormal cases with no follow-up, the patient was seen at a follow-up appointment but the lab results were not addressed. In 3 of 15 abnormal cases with no follow-up, the patient did not return for a planned follow-up appointment. In 3 of 15 abnormal cases with no follow-up, the physician was aware and addressed the results, but did not document that the results were addressed (all 3 were outpatient cases). In 3 of 15 abnormal cases with no follow-up, lab results for inpatients were pending at time of discharge and there was no documentation of pending results in the designated space for this in the discharge summary. In 2 of 15 abnormal cases with no follow-up, the patient was followed by a primary care physician outside of our institution. In 7 cases, the patient had multiple subspecialists involved in their care. All undocumented abnormal levels were addressed by our institution, either by contacting the patient or primary care physician, or by determining that the abnormality was not clinically relevant.
Discussion
We identified cases in which patients had abnormal results on tests used to diagnose neuroendocrine tumors such as pheochromocytoma over a 3-year period and sought evidence that a responsible clinician had followed up on the abnormal results. In one-third of abnormal test results, we found no documentation in the medical record that the responsible clinician was aware of the result or had communicated it to another clinician or the patient. This occurred most often in cases in which metanephrine and/or catecholamine levels were pending at the time of hospital discharge, and when a patient who was discharged from the hospital or seen in clinic did not return for a scheduled follow-up appointment. When we followed up with the responsible physician, only 6 in 15 were aware of the abnormal results and had either concluded that they were not clinically significant or had addressed the issue without completing documentation.
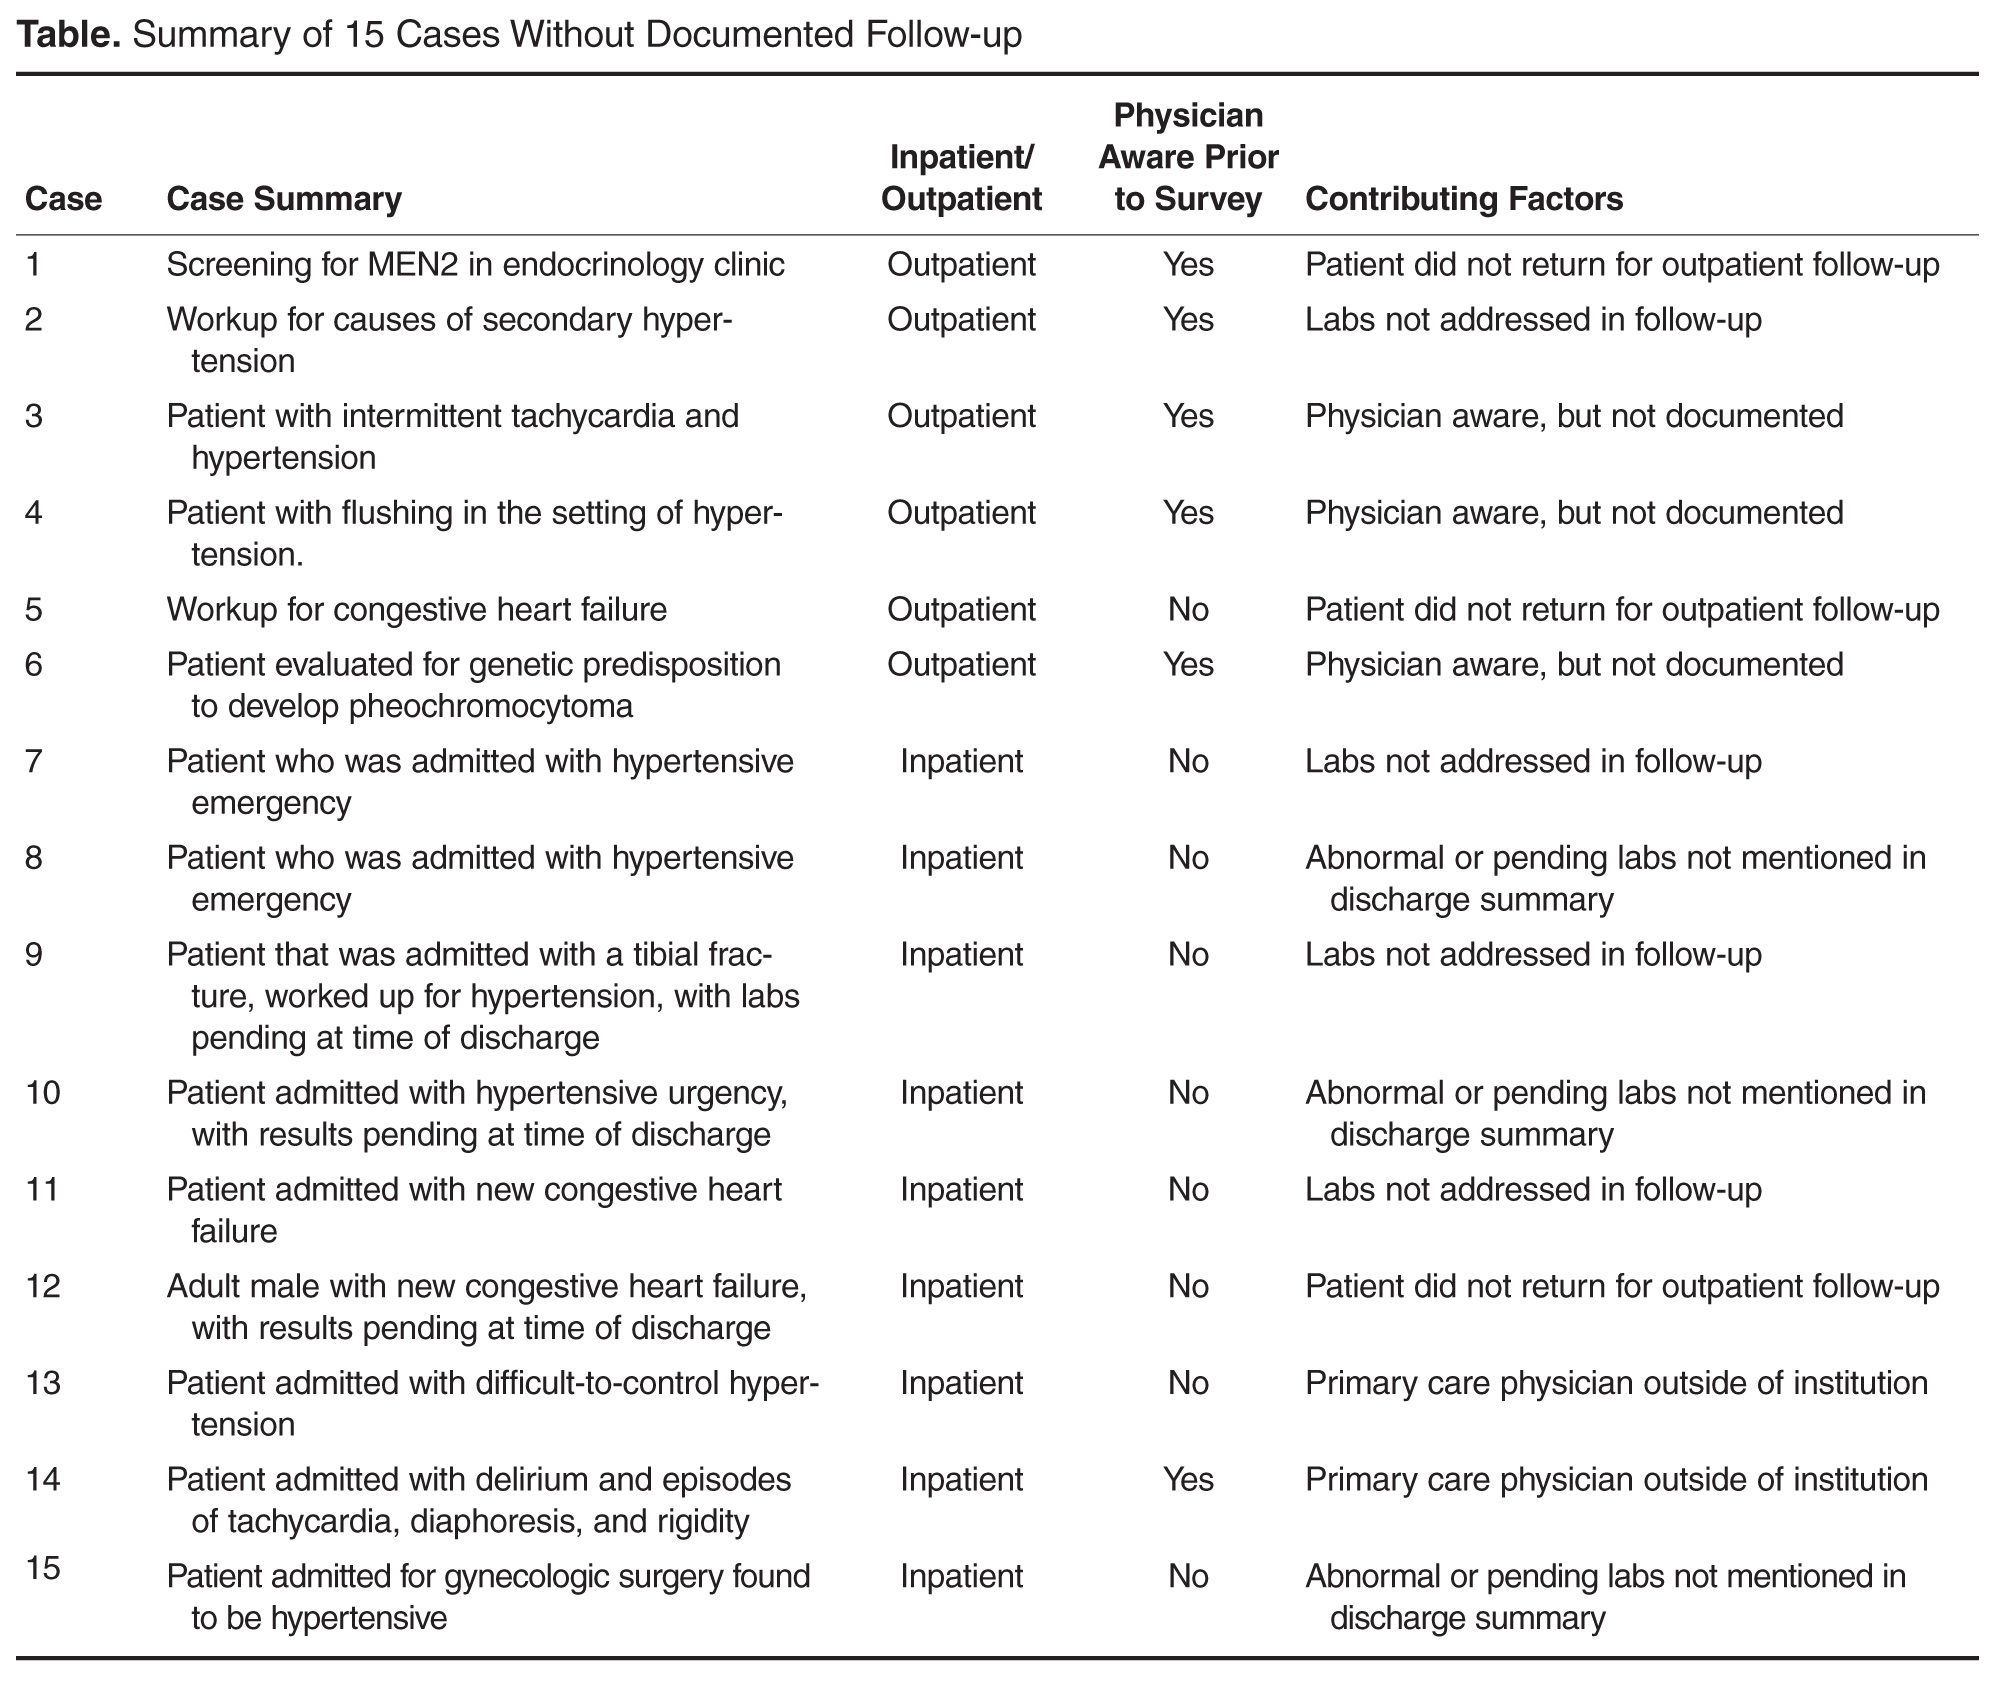
Previous research has identified vulnerabilities in the follow-up of send-out test results that exceed the challenges with tests performed in-house. These include that send-out tests inherently have more steps and require more manual processes [8], and that these tests are more prone to delay, misinterpretation, and poor documentation. Reference laboratories usually provide non-structured reporting of results, often in the form of paper or PDF files. This can make it difficult for receiving hospitals or clinics to incorporate information into the electronic medical record or to build clinical reminders or alerts for ordering clinicians. Additionally, these data elements are often cryptic in that they provide reference values without necessarily setting parameters for abnormalities. This is a case in point with metanephrine and catecholamine testing, as the results are often variable and poorly reproducible and difficult for clinicians to interpret. There are different cutoffs for moderately elevated and critically elevated values, and how to proceed with patients with moderately elevated values is not clear and may require the expertise of subspecialists. Our study confirmed several issues surrounding vulnerabilities of send-out lab testing.
As a single-institution project with a small cohort of subjects, the generalizability of this project may be limited. However, some process-of-care vulnerabilities noted here are similar to those reported in previous research studies [8]. In addition, hospitals and clinics send specimens to a limited number of regional and national reference laboratories. The challenges that our clinicians encountered in managing these results are likely to be challenges in many other organizations. Also, while our study was limited to tests done to evaluate for pheochromocytoma, our findings are likely applicable to other reference laboratory tests.
Send-out labs continue to represent a major source of lost follow-up and potential patient harm. Creating systems with effective and timely alerts for providers will be useful in preventing missed follow-up. Our study found a lack of clear guidelines designating responsibility for pending lab results, which has been found across institutions in previous studies [8]. Since we conducted this project, our institution has reminded clinicians that discharging attendings are responsible for pending lab results at time of discharge and has developed an automated electronic method for delivering these results. Similar policy interventions at other institutions have shown promise [16]. We hope this will minimize the number of lab results, including those of send-out labs, which are not acted upon in a timely manner. However, other issues, including data interface with the electronic medical record and patients with abnormal results being lost to follow-up, remain barriers for our institution to address.
There are several immediate steps that could be taken by health care organizations and reference labs to reduce patient harm as a result of send-out labs that are not followed up. First, health care organizations can develop better integration between electronic records and lab processing for send-out labs, as well as more electronic alerts. This may help to notify ordering physicians after patients have been discharged and the case may not be front of mind. Reference labs should create robust electronic systems to transmit results as electronic data elements so that health care organizations can easily incorporate results into their electronic medical records, and develop notification systems that flag out-of-bound values. Secure online lab results for send-outs may shorten the delay in reporting. Additionally, creating clear policies establishing the responsible provider is crucial, as has been found by previous research by Singh and others [11,15].
In conclusion, send-out labs are vulnerable to lost follow-up. It is crucial for clinicians to be aware of all send-out lab results and to document their interpretation of abnormal results. Developing policies and systems to facilitate timely follow-up will help to reduce potential patient harm related to send-out labs.
Corresponding author: Richard Zamore, MD, MPH, Tufts Medical Center, 800 Washington St., Boston, MA 02111, rzamore@tuftsmedicalcenter.org.
Financial disclosures: None.
1. Callen J, Georgiou A, Li J, Westbrook JI, et al. The safety implications of missed test results for hospitalised patients: a systematic review. BMJ Qual Saf 2011;20:194–9.
2. Wahls TL, Cram PM. The frequency of missed test results and associated treatment delays in a highly computerized health system. BMC Fam Pract 2007;8:32.
3. Bates DW, Leape LL. Doing better with critical test results. Jt Comm J Qual Patient Saf 2005;31:66–7.
4. Schiff GD, Kim S, Krosnjar N, et al. Missed hypothyroidism diagnosis uncovered by linking laboratory and pharmacy data. Arch Intern Med 2005;165:574.
5. Singh H, Thomas EJ, Sittig DF, et al. Notification of abnormal lab test results in an electronic medical record: do any safety concerns remain? Am J Med 2010;123:238–44.
6. Hickner J, Graham DG, Elder NC, et al. Testing process errors and their harms and consequences reported from family medicine practices: a study of the American Academy of Family Physicians National Research Network. Qual Saf Health Care 2008;17:194–200.
7. Casalino LP, Dunham D, Chin MH, et al. Frequency of failure to inform patients of clinically significant outpatient test results. Arch Intern Med 2009;169:1123–9.
8. Callen JL, Westbrook JI, Georgiou A, et al. Failure to follow-up test results for ambulatory patients: a systematic review. J Gen Intern Med 2012;27:1334–48.
9. Moore C, Wisnivesky J, Williams S, et al. Medical errors related to discontinuity of care from an inpatient to an outpatient setting. J Gen Intern Med 2003;18:646–51.
10. Roy CL, Poon EG, Karson AS, et al. Patient safety concerns arising from test results that return after hospital discharge. Ann Intern Med 2005;143:121–8.
11. Singh H, Wilson L, Reis B, et al. Ten strategies to improve management of abnormal test result alerts in the electronic health record. J Patient Saf 2010;6:121–3.
12. Dickerson JA, Cole B, Astion ML. Ten ways to improve the quality of send-out testing. Clin Lab News 2012;38:12–3.
13. Cole B, Dickerson JA, Graber ML, et al. A prospective tool for risk assessment of sendout testing. Clin Chim Acta 2014;434:1–5.
14. MacMillan D, Lewandrowski E, Lewandrowski K. An analysis of reference laboratory (send out) testing: an 8-year experience in a large academic medical center. Clin Leadersh Manag Rev 2004;18:216–9.
15. Krasowski MD, Chudzik D, Dolezal A, et al. Promoting improved utilization of laboratory testing through changes in an electronic medical record: experience at an academic medical center. BMC Med Inform Decis Mak 2015;15:11.
16. Singh H, Arora HS, Vij MS, et al. Communication outcomes of critical imaging results in a computerized notification system. J Am Med Inform Assoc 2007;14:459–66.
From the Department of Medicine, Tufts Medical Center, Boston, MA.
Abstract
- Objective: To measure the frequency of missed pheochromocytoma test results and identify factors related to the risk of failed follow-up.
- Methods: We performed a retrospective review of the medical record to identify patients with abnormal urine or serum metanephrine or catecholamine test results over a 3-year period. We then searched the electronic medical record for documentation that the responsible physician was aware of the test results. We surveyed the physicians in cases where there were abnormal results and no documented follow-up to assess their awareness of the results and any follow-up actions they may have taken.
- Results: During the 3-year look-back period, 451 send-out tests for 332 patients were ordered for serum metanephrines, serum catecholamines, or urine catecholamines and/or metanephrines. Fifty-five tests affecting 46 patients returned with either moderately (n = 41) or critically elevated values (n = 5). Fifteen of these patients were inpatients when the tests were ordered, and 31 were outpatients. In 15 of 46 abnormal cases, there was no documentation in the electronic medical record that the responsible physician was aware of the result. Of the 15 cases without documentation, 6 of the responsible physicians in such cases were aware of the results.
- Conclusion: One-third of patients with abnormal lab testing for pheochromocytoma did not have clearly documented follow-up in the electronic medical record, and the majority of physicians in such cases were not aware of the results. Changes to the processes at health care institutions and reference laboratories are needed to improve follow-up of send-out lab results.
Delayed or missed follow-up of laboratory tests is a major source of medical harm [1–5]. Testing performed in both the inpatient and outpatient settings is susceptible to lost follow-up, in part because medical testing is a complex process that is vulnerable to multiple process-of-care failures [1,5–7]. In previous studies, the rate of missed follow-up of abnormal medical test results has ranged from 1% to 75% [6]. Laboratory test follow-up is a particularly challenging problem as patients transition between care settings [8,9]. In a study of 86 patients at one academic medical center, Moore and colleagues found that over a 1-year period, 41% of patients who had laboratory tests pending at the time of discharge had no documented follow-up for at least one of those tests [9]. More recently, Roy and colleagues reported that nearly half of 2644 patients discharged from general medicine hospitalist services at 2 academic tertiary care centers had pending laboratory or radiographic results. Nine percent of the pending results were potentially actionable, and a follow-up survey from the study revealed that 61% of physicians were unaware of pending results [10]. Similar findings have been reported in ambulatory care [5,8,11].
Among the universe of laboratory tests, tests performed at reference laboratories outside of the hospital or clinic where care is rendered (ie, “send-out” tests) are particularly susceptible to lost follow-up [12,13]. Because many of these tests are expensive and infrequently ordered, it is most feasible and economical for hospitals and clinics to transport these samples to regional or national laboratories for specialized testing [14,15]. Examples include the serotonin release assay, certain rheumatologic studies, cancer genetics, and advanced endocrine testing. Send-out testing poses several potential risks including accidental ordering of the wrong test, processing or transportation delays, failure of the outside laboratory to receive the specimen, failures of results reporting by the reference laboratory, incorrect result entry into the electronic medical record upon receipt, failure of the clinician to receive or note the result, or failure of clinician to interpret or act on the result [12,13,15]. Although previous studies have identified risk factors associated with missed abnormal test results [1], none to our knowledge have assessed the particular risks associated with samples processed at reference laboratories.
A critical event at our hospital involved a young woman who presented with respiratory failure attributed to a community-acquired pneumonia and systolic congestive heart failure that was thought to be related to her acute illness. Serum and urine metanephrines were ordered in the intensive care unit given the possibility that heart failure in a young patient could be attributed to an occult neuroendocrine tumor. The patient improved clinically and was discharged. Because the discharging service was unaware that the metanephrine tests had been ordered and were being processed at a national reference laboratory, they did not follow up on the test result or include it as pending in the discharge summary. Fortunately, the patient’s primary care physician discovered that the metanephrine levels were elevated and referred the patient for endocrine evaluation and definitive treatment.
Given the risk represented by pending send-out tests raised by this episode, we performed a retrospective study to identify other cases of missed abnormal send-out tests for metanephrines and catecholamines for in- and outpatients over the previous 3 years. We also sought to identify factors that increased the risk of failed follow-up.
Methods
Subjects and Setting
We studied adult in- and outpatients who received care at a 415-bed Boston-based academic medical center.
Project Design and Data Collection
We performed a retrospective record review of a cohort of patients with abnormal send-out laboratory tests for metanephrines and catecholamines. We collected laboratory reports of all results of urine and serum metanephrine and catecholamine tests performed from 1 January 2012 through 31 December 2014. All tests were performed at and reported by Quest Diagnostics in Chantilly, Virginia. The relevant tests were identified using a query of the online Quest Diagnostics system to extract all laboratory results for serum metanephrines, serum catecholamines, urine metanephrines, and urine catecholamines that resulted during this period. Reports were PDF files that were printed and reviewed manually. (Of note, providers typically view lab results directly in the electronic medical record. Reports were extracted from the Quest Diagnostics system for study purposes only.)
We used the reference ranges supplied by the laboratory to sort results into: normal levels, moderately elevated levels (1 to 4 times the upper limit of normal), and critically elevated levels (greater than 4 times the upper limit of normal). A physician (RZ) then reviewed the electronic medical record of each patient with moderately or critically elevated results for evidence that the responsible physician was aware of the results and had documented a follow-up plan. Documentation of physician awareness and follow-up was ascertained by notation and interpretation of the test result in either a discharge summary from the index admission or in an outpatient clinic note. The responsible physician was defined as the ordering physician for tests ordered in ambulatory care and the attending physician at time of discharge for inpatients. In cases where no documentation was identified in the medical record, the responsible physicians received an email questionnaire that asked (1) if they were aware of the abnormal result, (2) if aware of the result, did they notify the primary care physician or referring physician, and (3) if they were aware of any further follow-up or intervention.
Analysis
We stratified the cases into those with normal and abnormal labs values, and then further by those that did and did not have documentation of results and follow-up in the medical record. We then further stratified cases into those in which the responsible physician was aware and those in which they were unaware. If unaware, the patient was contacted directly by the risk management department, primarily for patient safety purposes. If we were unable to contact the patient, the patient’s listed primary care physician was contacted directly. We then performed qualitative analysis of the cases with abnormal results and no documented follow-up, with the goal of identifying common themes.
Results
During the 3-year look-back period, 451 send-out tests for 332 patients were ordered for serum metanephrines, serum catecholamines, urine catecholamines, or metanephrines. Fifty-five tests affecting 46 patients returned with either moderately or critically elevated values, while 396 results affecting 286 patients returned within the reference range. Five patients had critically elevated values and 41 patients had moderately elevated values. Fifteen were inpatients when the tests were ordered and 31 were outpatients.
In the survey of the responsible physicians in the 15 cases with no follow-up, all 15 physicians responded. Six were aware of the abnormal result and 9 were not (Figure). Five of the 6 cases in which the physician was aware were outpatients. Eight of the 9 cases in which the physician was not aware were inpatients. In 4 of 15 abnormal cases with no follow-up, the patient was seen at a follow-up appointment but the lab results were not addressed. In 3 of 15 abnormal cases with no follow-up, the patient did not return for a planned follow-up appointment. In 3 of 15 abnormal cases with no follow-up, the physician was aware and addressed the results, but did not document that the results were addressed (all 3 were outpatient cases). In 3 of 15 abnormal cases with no follow-up, lab results for inpatients were pending at time of discharge and there was no documentation of pending results in the designated space for this in the discharge summary. In 2 of 15 abnormal cases with no follow-up, the patient was followed by a primary care physician outside of our institution. In 7 cases, the patient had multiple subspecialists involved in their care. All undocumented abnormal levels were addressed by our institution, either by contacting the patient or primary care physician, or by determining that the abnormality was not clinically relevant.
Discussion
We identified cases in which patients had abnormal results on tests used to diagnose neuroendocrine tumors such as pheochromocytoma over a 3-year period and sought evidence that a responsible clinician had followed up on the abnormal results. In one-third of abnormal test results, we found no documentation in the medical record that the responsible clinician was aware of the result or had communicated it to another clinician or the patient. This occurred most often in cases in which metanephrine and/or catecholamine levels were pending at the time of hospital discharge, and when a patient who was discharged from the hospital or seen in clinic did not return for a scheduled follow-up appointment. When we followed up with the responsible physician, only 6 in 15 were aware of the abnormal results and had either concluded that they were not clinically significant or had addressed the issue without completing documentation.
Previous research has identified vulnerabilities in the follow-up of send-out test results that exceed the challenges with tests performed in-house. These include that send-out tests inherently have more steps and require more manual processes [8], and that these tests are more prone to delay, misinterpretation, and poor documentation. Reference laboratories usually provide non-structured reporting of results, often in the form of paper or PDF files. This can make it difficult for receiving hospitals or clinics to incorporate information into the electronic medical record or to build clinical reminders or alerts for ordering clinicians. Additionally, these data elements are often cryptic in that they provide reference values without necessarily setting parameters for abnormalities. This is a case in point with metanephrine and catecholamine testing, as the results are often variable and poorly reproducible and difficult for clinicians to interpret. There are different cutoffs for moderately elevated and critically elevated values, and how to proceed with patients with moderately elevated values is not clear and may require the expertise of subspecialists. Our study confirmed several issues surrounding vulnerabilities of send-out lab testing.
As a single-institution project with a small cohort of subjects, the generalizability of this project may be limited. However, some process-of-care vulnerabilities noted here are similar to those reported in previous research studies [8]. In addition, hospitals and clinics send specimens to a limited number of regional and national reference laboratories. The challenges that our clinicians encountered in managing these results are likely to be challenges in many other organizations. Also, while our study was limited to tests done to evaluate for pheochromocytoma, our findings are likely applicable to other reference laboratory tests.
Send-out labs continue to represent a major source of lost follow-up and potential patient harm. Creating systems with effective and timely alerts for providers will be useful in preventing missed follow-up. Our study found a lack of clear guidelines designating responsibility for pending lab results, which has been found across institutions in previous studies [8]. Since we conducted this project, our institution has reminded clinicians that discharging attendings are responsible for pending lab results at time of discharge and has developed an automated electronic method for delivering these results. Similar policy interventions at other institutions have shown promise [16]. We hope this will minimize the number of lab results, including those of send-out labs, which are not acted upon in a timely manner. However, other issues, including data interface with the electronic medical record and patients with abnormal results being lost to follow-up, remain barriers for our institution to address.
There are several immediate steps that could be taken by health care organizations and reference labs to reduce patient harm as a result of send-out labs that are not followed up. First, health care organizations can develop better integration between electronic records and lab processing for send-out labs, as well as more electronic alerts. This may help to notify ordering physicians after patients have been discharged and the case may not be front of mind. Reference labs should create robust electronic systems to transmit results as electronic data elements so that health care organizations can easily incorporate results into their electronic medical records, and develop notification systems that flag out-of-bound values. Secure online lab results for send-outs may shorten the delay in reporting. Additionally, creating clear policies establishing the responsible provider is crucial, as has been found by previous research by Singh and others [11,15].
In conclusion, send-out labs are vulnerable to lost follow-up. It is crucial for clinicians to be aware of all send-out lab results and to document their interpretation of abnormal results. Developing policies and systems to facilitate timely follow-up will help to reduce potential patient harm related to send-out labs.
Corresponding author: Richard Zamore, MD, MPH, Tufts Medical Center, 800 Washington St., Boston, MA 02111, rzamore@tuftsmedicalcenter.org.
Financial disclosures: None.
1. Callen J, Georgiou A, Li J, Westbrook JI, et al. The safety implications of missed test results for hospitalised patients: a systematic review. BMJ Qual Saf 2011;20:194–9.
2. Wahls TL, Cram PM. The frequency of missed test results and associated treatment delays in a highly computerized health system. BMC Fam Pract 2007;8:32.
3. Bates DW, Leape LL. Doing better with critical test results. Jt Comm J Qual Patient Saf 2005;31:66–7.
4. Schiff GD, Kim S, Krosnjar N, et al. Missed hypothyroidism diagnosis uncovered by linking laboratory and pharmacy data. Arch Intern Med 2005;165:574.
5. Singh H, Thomas EJ, Sittig DF, et al. Notification of abnormal lab test results in an electronic medical record: do any safety concerns remain? Am J Med 2010;123:238–44.
6. Hickner J, Graham DG, Elder NC, et al. Testing process errors and their harms and consequences reported from family medicine practices: a study of the American Academy of Family Physicians National Research Network. Qual Saf Health Care 2008;17:194–200.
7. Casalino LP, Dunham D, Chin MH, et al. Frequency of failure to inform patients of clinically significant outpatient test results. Arch Intern Med 2009;169:1123–9.
8. Callen JL, Westbrook JI, Georgiou A, et al. Failure to follow-up test results for ambulatory patients: a systematic review. J Gen Intern Med 2012;27:1334–48.
9. Moore C, Wisnivesky J, Williams S, et al. Medical errors related to discontinuity of care from an inpatient to an outpatient setting. J Gen Intern Med 2003;18:646–51.
10. Roy CL, Poon EG, Karson AS, et al. Patient safety concerns arising from test results that return after hospital discharge. Ann Intern Med 2005;143:121–8.
11. Singh H, Wilson L, Reis B, et al. Ten strategies to improve management of abnormal test result alerts in the electronic health record. J Patient Saf 2010;6:121–3.
12. Dickerson JA, Cole B, Astion ML. Ten ways to improve the quality of send-out testing. Clin Lab News 2012;38:12–3.
13. Cole B, Dickerson JA, Graber ML, et al. A prospective tool for risk assessment of sendout testing. Clin Chim Acta 2014;434:1–5.
14. MacMillan D, Lewandrowski E, Lewandrowski K. An analysis of reference laboratory (send out) testing: an 8-year experience in a large academic medical center. Clin Leadersh Manag Rev 2004;18:216–9.
15. Krasowski MD, Chudzik D, Dolezal A, et al. Promoting improved utilization of laboratory testing through changes in an electronic medical record: experience at an academic medical center. BMC Med Inform Decis Mak 2015;15:11.
16. Singh H, Arora HS, Vij MS, et al. Communication outcomes of critical imaging results in a computerized notification system. J Am Med Inform Assoc 2007;14:459–66.
Engaging Patients as Partners in Practice Improvement: A Survey of Community Health Centers
From the Department of Family and Community Medicine, University of California San Francisco, San Francisco, CA (Ms. Willard-Grace, Dr. Sharma, Dr. Potter) and the California Primary Care Association, Sacramento, CA (Ms. Parker).
Abstract
- Objective: To explore how community health centers engage patients in practice improvement and factors associated with patient involvement on clinic-level strategies, policies, and programs.
- Methods: Cross-sectional web-based survey of community health centers in California, Arizona, Nevada, and Hawaii (n = 97).
- Results: The most common mechanisms used by community health centers to obtain patient feedback were surveys (94%; 91/97) and advisory councils (69%; 67/97). Patient-centered medical home recognition and dedicated funding for patient engagement activities were not associated with reported patient influence on the clinic’s strategic goals, policies, or programs. When other factors were controlled for in multivariable modeling, leadership support (β = 0.31, 95% confidence interval [CI] 0.10–0.53) and having a formal strategy to identify and engage patients as advisors (β = 0.17, 95% CI 0.02–0.31) were positively associated with patient influence on strategic goals. Having a formal strategy to identify and engage patients also was associated with patient impact on polices and programss (β = 0.17, 95% CI 0.01–0.34). The clinic process of setting aside time to discuss patient feedback appeared to be a mechanism by which formal patient engagement strategies resulted in patients having an impact on practice improvement activities (β = 0.35, 95% CI 0.17–0.54 for influence on strategic goals and β = 0.44, 95% CI 0.23–0.65 for influence on policies and programs).
- Conclusion: These findings may provide guidance for primary care practices that wish to engage patients in practice improvement. The relatively simple steps of developing a formal strategy to identify and engage patients and setting aside time in meetings to discuss patient feedback appear to be important prerequisites for success in these activities.
Patient engagement is becoming an increasingly prominent concept within primary care redesign. Called the “next blockbuster drug of the century” and the “holy grail” of health care [1,2], patient engagement has become a key goal for funders such as the Patient-Centered Outcomes Research Institute [3] and accrediting agencies such as the National Committee for Quality Assurance (NCQA).
Patient engagement has been defined as patients working in active partnership at various levels across the health care system to improve health and health care [1]. It can be conceptualized as occurring at 3 levels: at the level of direct care (eg, a clinical encounter), at the level of organizational design and governance, and at the level of policy making [1]. For example, engagement at the level of direct care might involve a patient working with her care team to identify a treatment option that matches her values and preferences. At the level of the health care organization, a patient might provide feedback through a survey or serve on a patient advisory council to improve clinic operations. Patients engaged at the level of policy making might share their opinions with their elected representatives or sit on a national committee. Although research has examined engagement at the direct care level, for example, in studies of shared decision making, there is a paucity of research addressing the impact of patient engagement on clinic-level organizational redesign and practice improvement [4,5].
Relatively few studies describe what primary care practice teams are currently doing at the basic level of soliciting and acting on patient input on the way that their care is delivered. A survey of 112 NCQA-certified patient-centered medical home (PCMH) practices found that 78% conducted patient surveys, 63% gathered qualitative input through focus groups or other feedback, 52% provided a suggestion box, and 32% included patients on advisory councils or teams [6]. Fewer than one-third of PCMH-certified practices were engaging patients or families in more intensive roles as ongoing advisors on practice design or practice improvement [6]. Randomized controlled trials have shown that patient involvement in developing informational materials results in more readable and relevant information [7]. Patient and family involvement in identifying organizational priorities within clinical practice settings resulted in greater alignment with the chronic care model and the PCMH when compared with control groups and resulted in greater agreement between patients and health care professionals [4]. Moreover, a number of innovative health care organizations credit their success in transformation to their patient partnerships [8–10].
Within this context, current practices at community health centers (CHCs) are of particular interest. CHCs are not-for-profit organizations that deliver primary and preventive care to more than 22 million people in the United States [11]. A large proportion of their patients are poor and live in medically underserved communities. More than one-third (37.5%) of CHC patients are uninsured and 38.5% are on Medicaid [12]. Perhaps because of their commitment to caring for medically vulnerable populations that have often had difficulty obtaining needed medical services, some CHCs have been on the forefront of patient engagement [8]. In addition, many CHCs are federally qualified health care centers, which are mandated to engage members of their communities within their governing boards [13]. However, relatively little is known about how CHCs are engaging patients as practice improvement partners or the perceived impact of this engagement on CHC strategic goals, policies, and programs. This study explores these factors and examines the organizational characteristics and processes associated with patients having an impact on practice improvement activities.
Methods
We conducted a cross-sectional, web-based survey of primary care clinician and staff leaders at CHCs in July–August 2014 to assess current strategies, attitudes, facilitators, and barriers toward engaging patients in practice improvement efforts. The study protocol was developed jointly by the San Francisco Bay Area Collaborative Research Network (SFBayCRN), the University of California San Francisco Center for Excellence in Primary Care (CEPC), and the Western Clinicians Network (WCN). The protocol was reviewed by the University of California San Francisco Committee on Human Research and determined to be exempt research (study number 14-13662).
Survey Participants
Participants in the web-based survey were members of the WCN, a peer-led, volunteer, membership-based association of medical leaders of community health centers in California, Arizona, Nevada, and Hawaii. An invitation and link to a web-based survey was sent by email to members working at WCN CHC, who received up to 3 reminders to complete the survey. We allowed one response per CHC surveyed; in cases where more than one CHC leader was a member of WCN, we requested that the person most familiar with patient engagement activities respond to the survey. In the event of multiple respondents from an organization, incomplete responses were dropped and one complete response was randomly selected to represent the organization. Participants in the survey were entered into a drawing for ten $50 gift cards and one iPad.
Conceptual Model
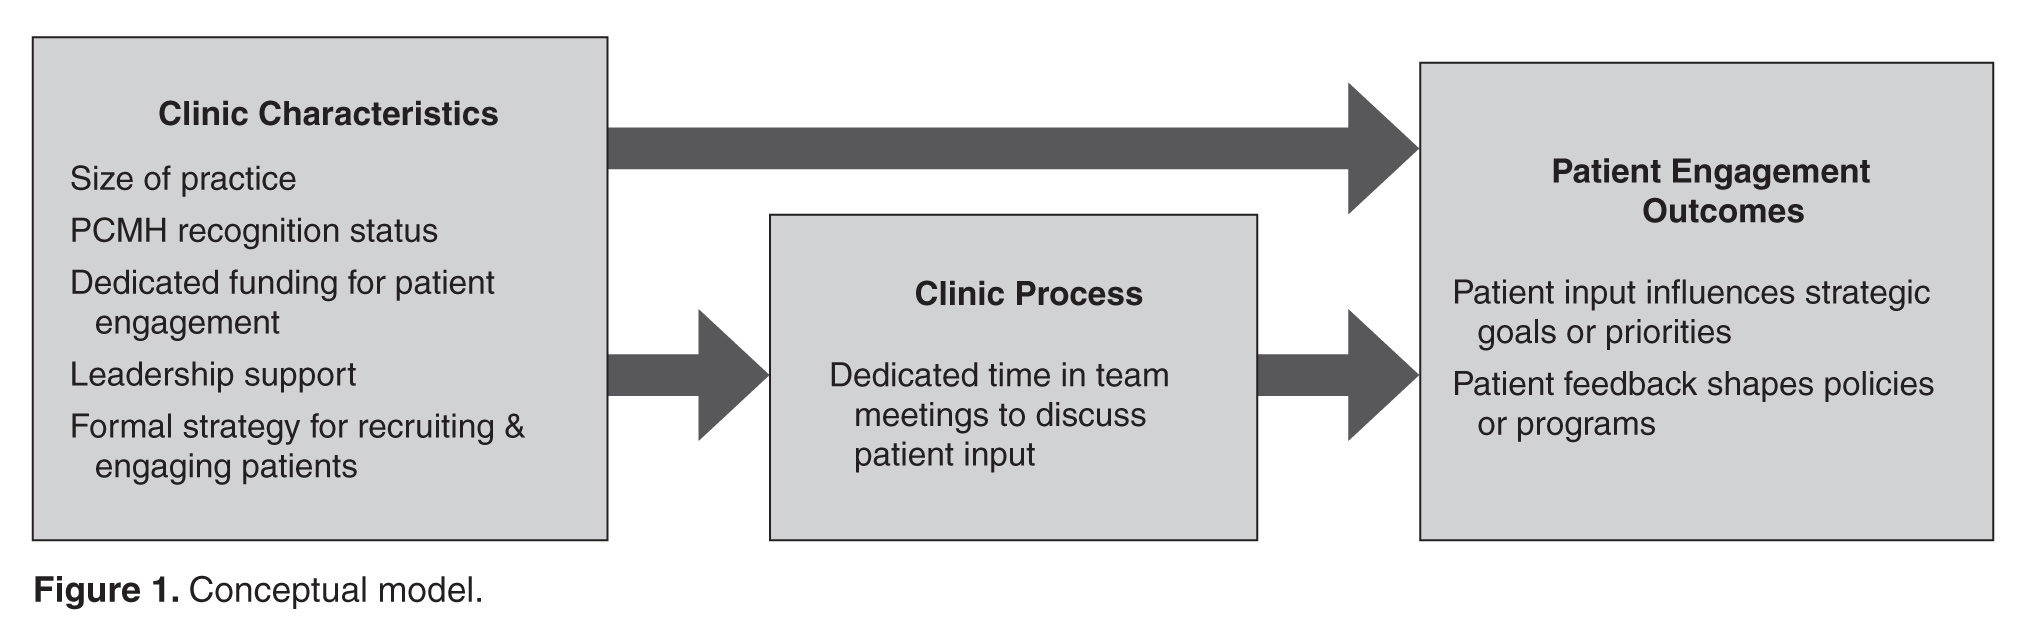
Measures
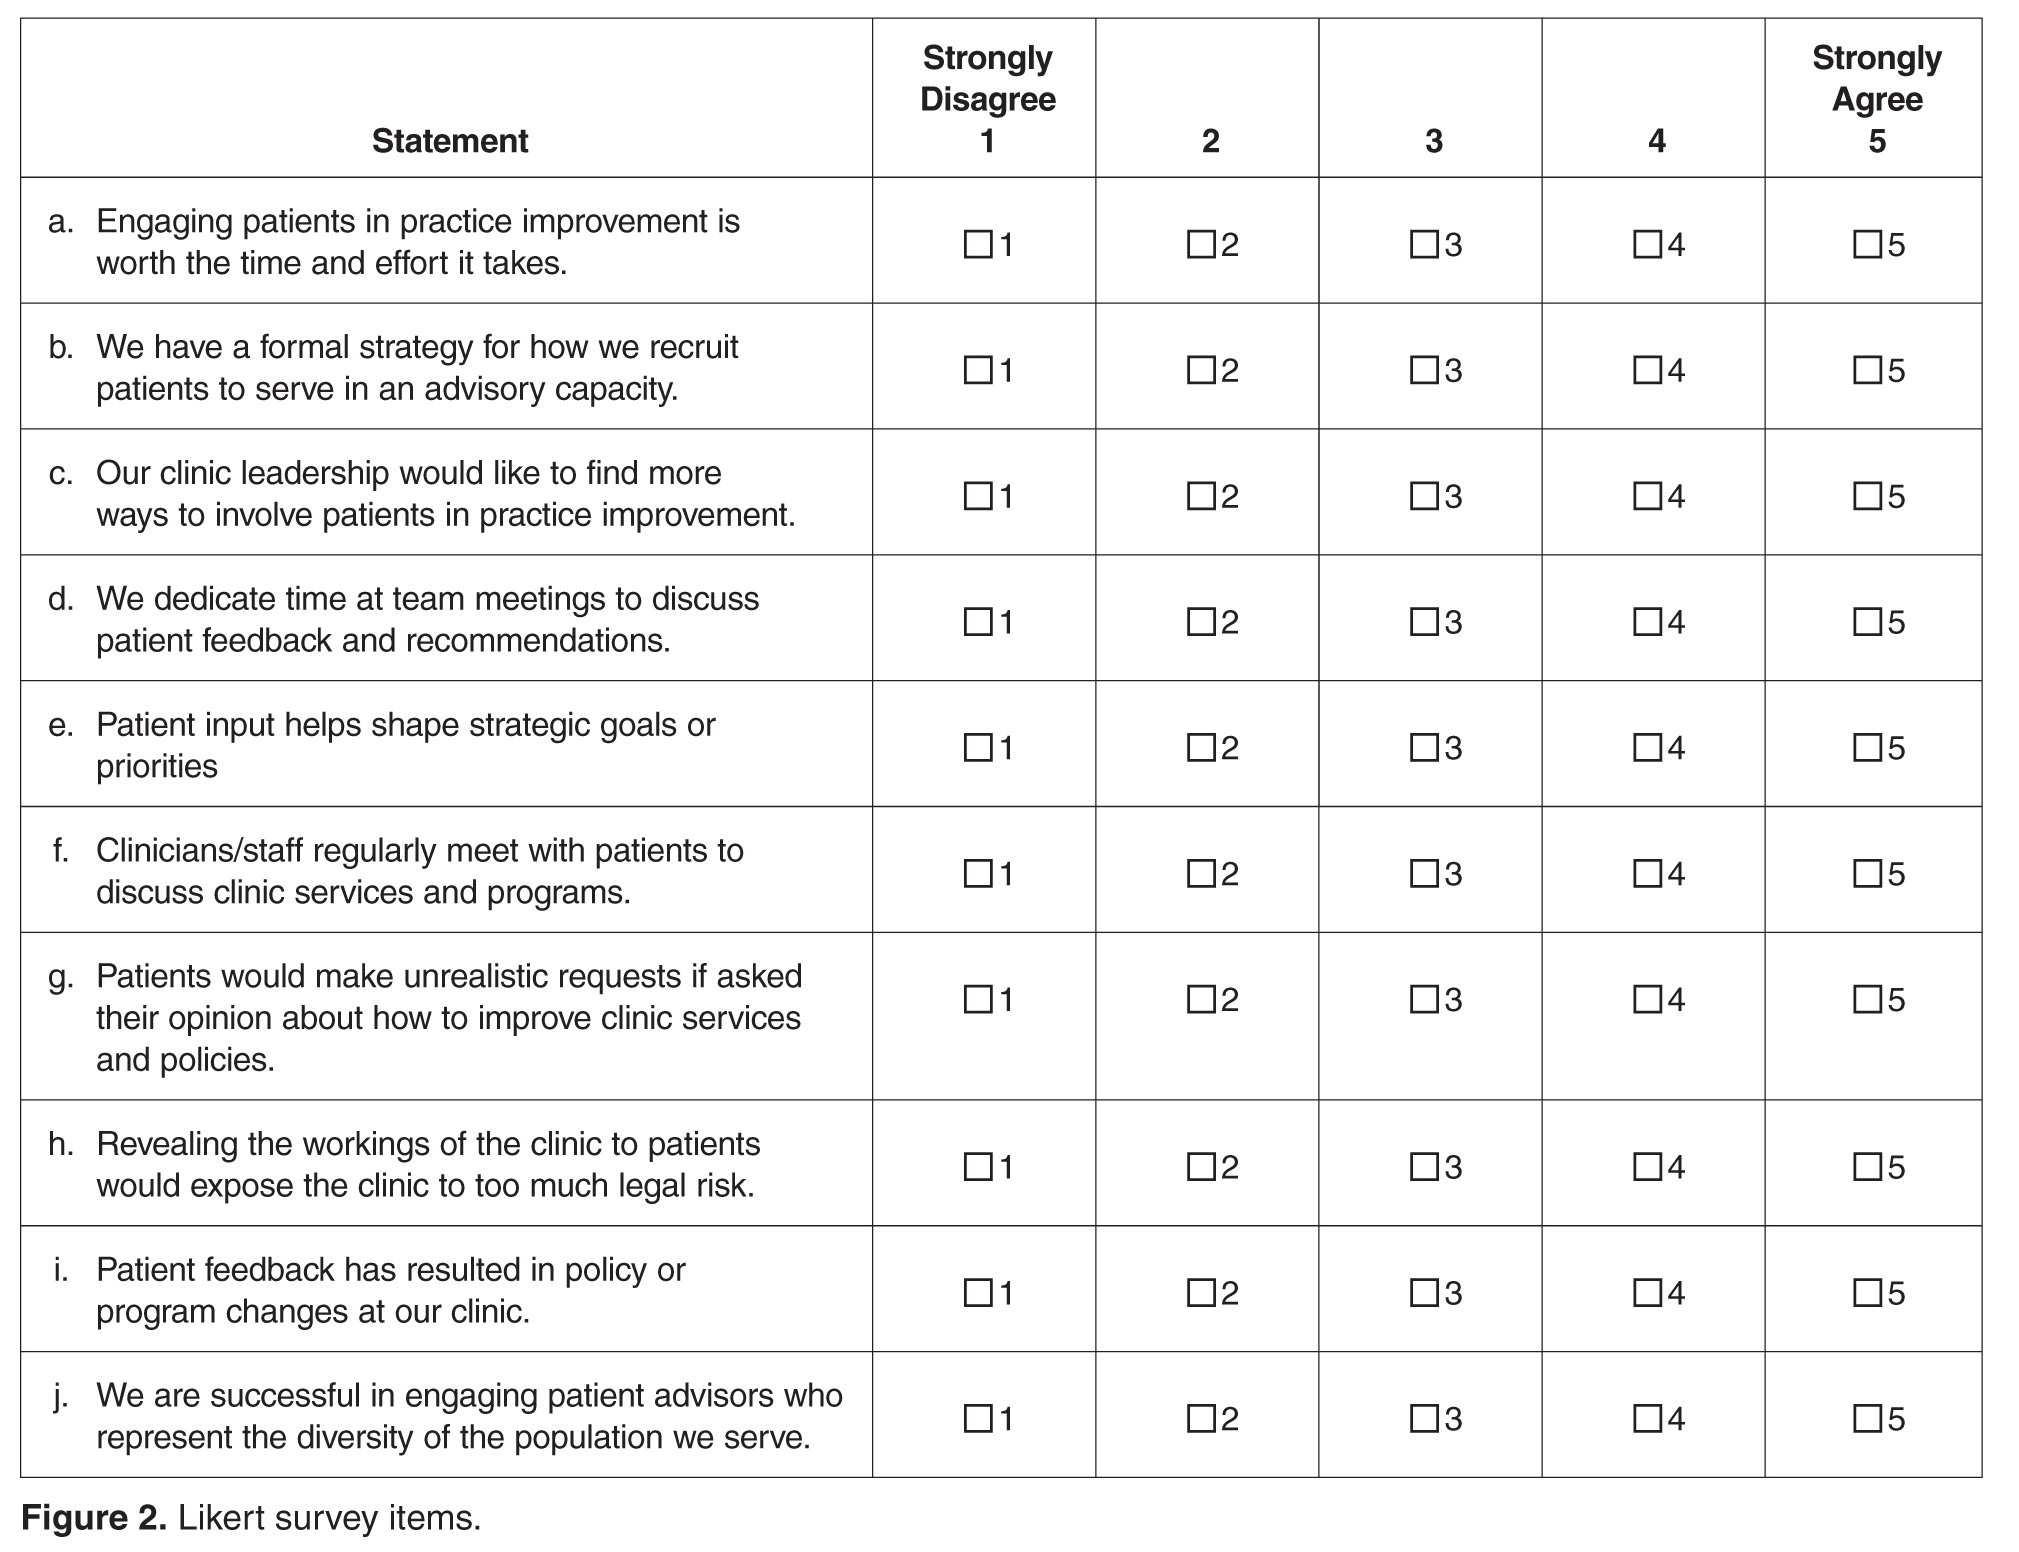
The primary outcomes of interest were respondents’ perception of patient impact on strategic priorities, policies, and programs. These outcomes were measured by 2 items: “Patient input helps shape strategic goals or priorities” and “Patient feedback has resulted in policy or program changes at our clinic.” Responses were measured on a 5-item Likert scale (1 = Strongly Disagree to 5 = Strongly Agree). Leadership support was measured using a single item that stated, “Our clinic leadership would like to find more ways to involve patients in practice improvement.” Having a formal strategy was measured using a single item that stated, “We have a formal strategy for how we recruit patients to serve in an advisory capacity.” Clinic processes included having dedicated time in meetings to discuss patient input, as measured by the item, “We dedicate time at team meetings to discuss patient feedback and recommendations.”
In addition to the 10 Likert-type items that captured attitudes, beliefs, and practices, we also asked participants to endorse strategies they used to obtain feedback and suggestions from patients (checklist of options including advisory councils, surveys, suggestion box, etc.). In addition, we assessed practice characteristics such as PCMH recognition status (not applying; in process of applying; received recognition), size of practice (< 5; 5–10; > 10 FTE clinicians), and having dedicated funding such as grant support to pay for patient engagement activities (yes; no).
Data Analysis
Data was analyzed in Stata version 13.0 (College Station, TX). Means and frequencies were used to characterize the sample. Stepwise multivariate modeling was used to identify factors associated with patient engagement outcomes. Organizational characteristics (size of the practice, PCMH recognition status, dedicated funding, leadership support, and having a formal strategy) were included as potential independent variables in Step 1 of the model for each of the 2 hypothesized patient engagement outcomes. Because we theorized that it might be a factor associated with the outcomes that was in turn influenced by clinic characteristics, the process of allocating dedicated time in team meetings to discuss and consider actions to take in response to patient feedback was included as a predictor in Step 2 of each model. Survey items that were not answered were treated as missing data (not imputed). We tested for multiple collinearity using variance influence factors.
Results
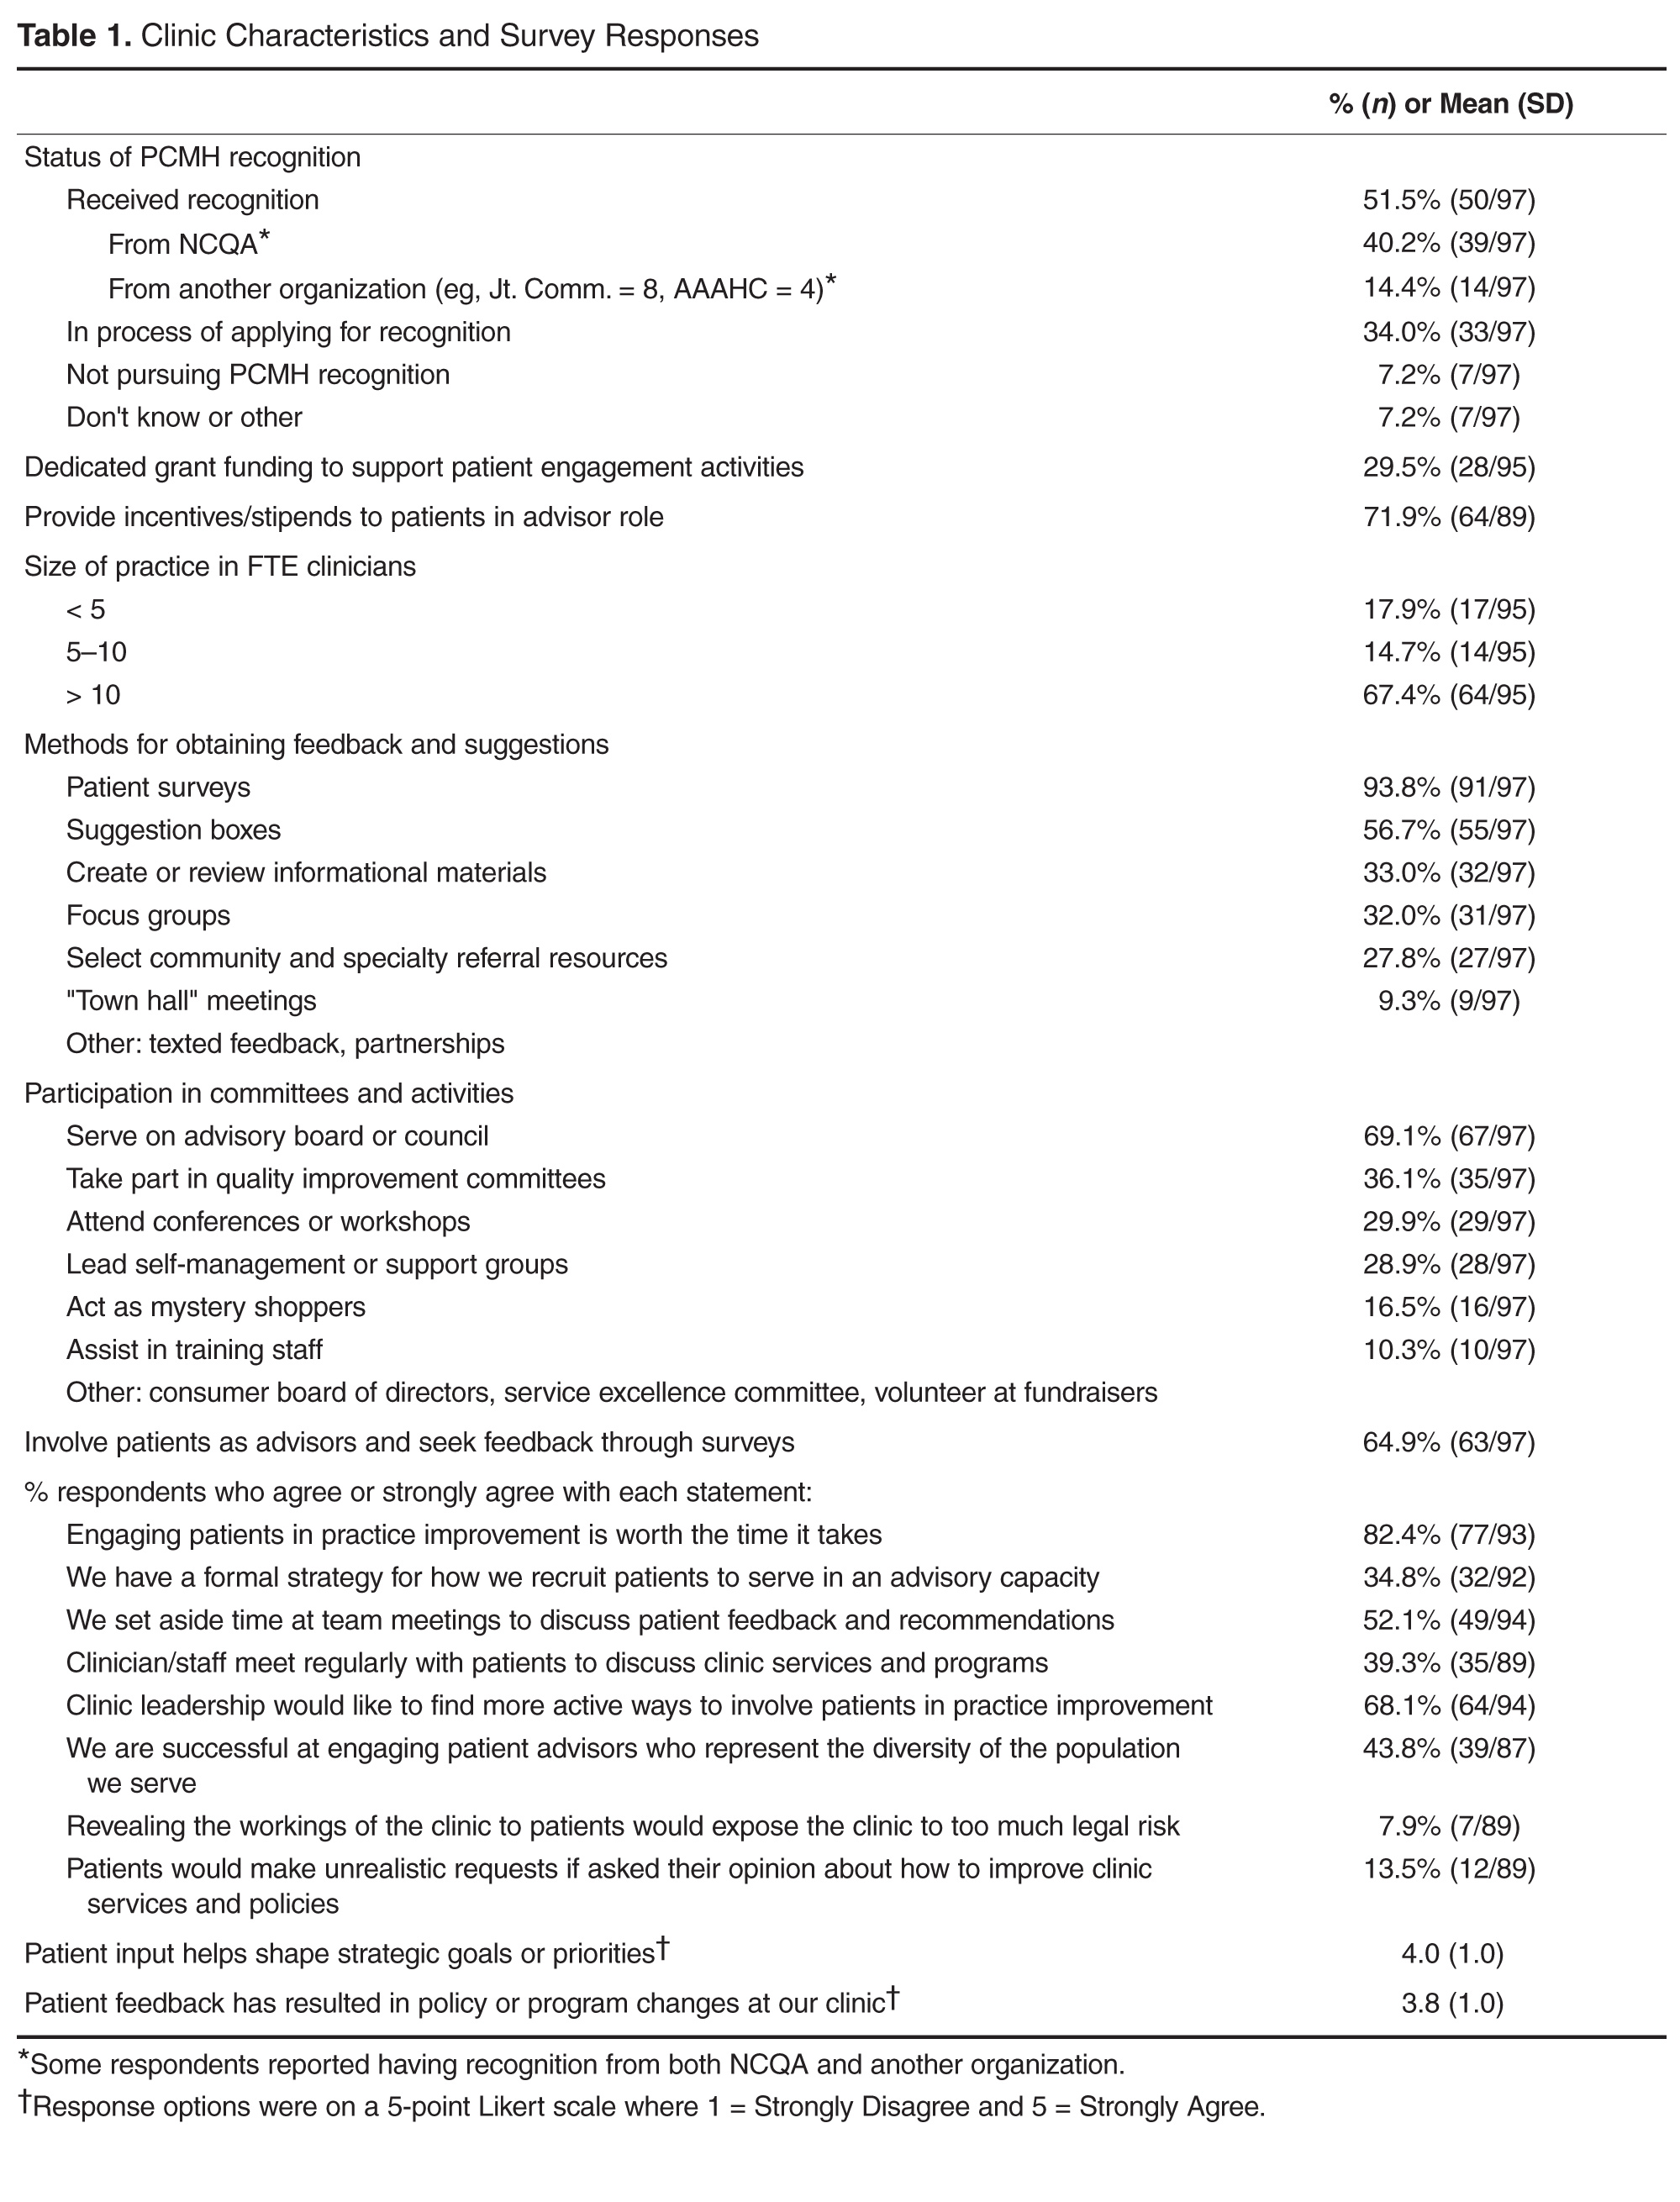
The most common mechanisms for receiving patient feedback were surveys (94% of respondents; 91/97) and suggestion boxes (57%; 55/97; Table 1). A third of respondents reported soliciting patient feedback on information materials (33%; 32/97), and almost a third involved patients in selecting referral resources (28%; 27/97). As for ongoing participation, 69% (67/97) of respondents reported involving patients on advisory boards or councils, and 36% (35/97) invited patients to take part in quality improvement committees. Other common activities included inviting patients to conferences or workshops (30%; 29/97) and asking patients to lead self-management or support groups (29%; 28/97).
Most respondents (82%; 77/93) agreed or strongly agreed that patient engagement was worth the time it required. About a third (35%; 32/92) reported having a formal strategy for recruiting and engaging patients in an advisory capacity. About half (52%; 49/94) reported setting aside time in team meetings to discuss patient feedback, although fewer (39%; 35/89) reported that their front line staff met regularly with patients to discuss clinic services and programs. Two-thirds of respondents (68%; 64/94) reported that their leadership would like to find more active ways to involve patients in practice improvement. Less than half (44%; 39/89) felt that they were successful at engaging patient advisors who represented the diversity of the population served. When considering downsides of patient engagement, few agreed that revealing the workings of the clinics to patients would expose the clinic to too much risk (8%; 7/89) or that patients would make unrealistic requests if asked their opinions (14%; 12/89).
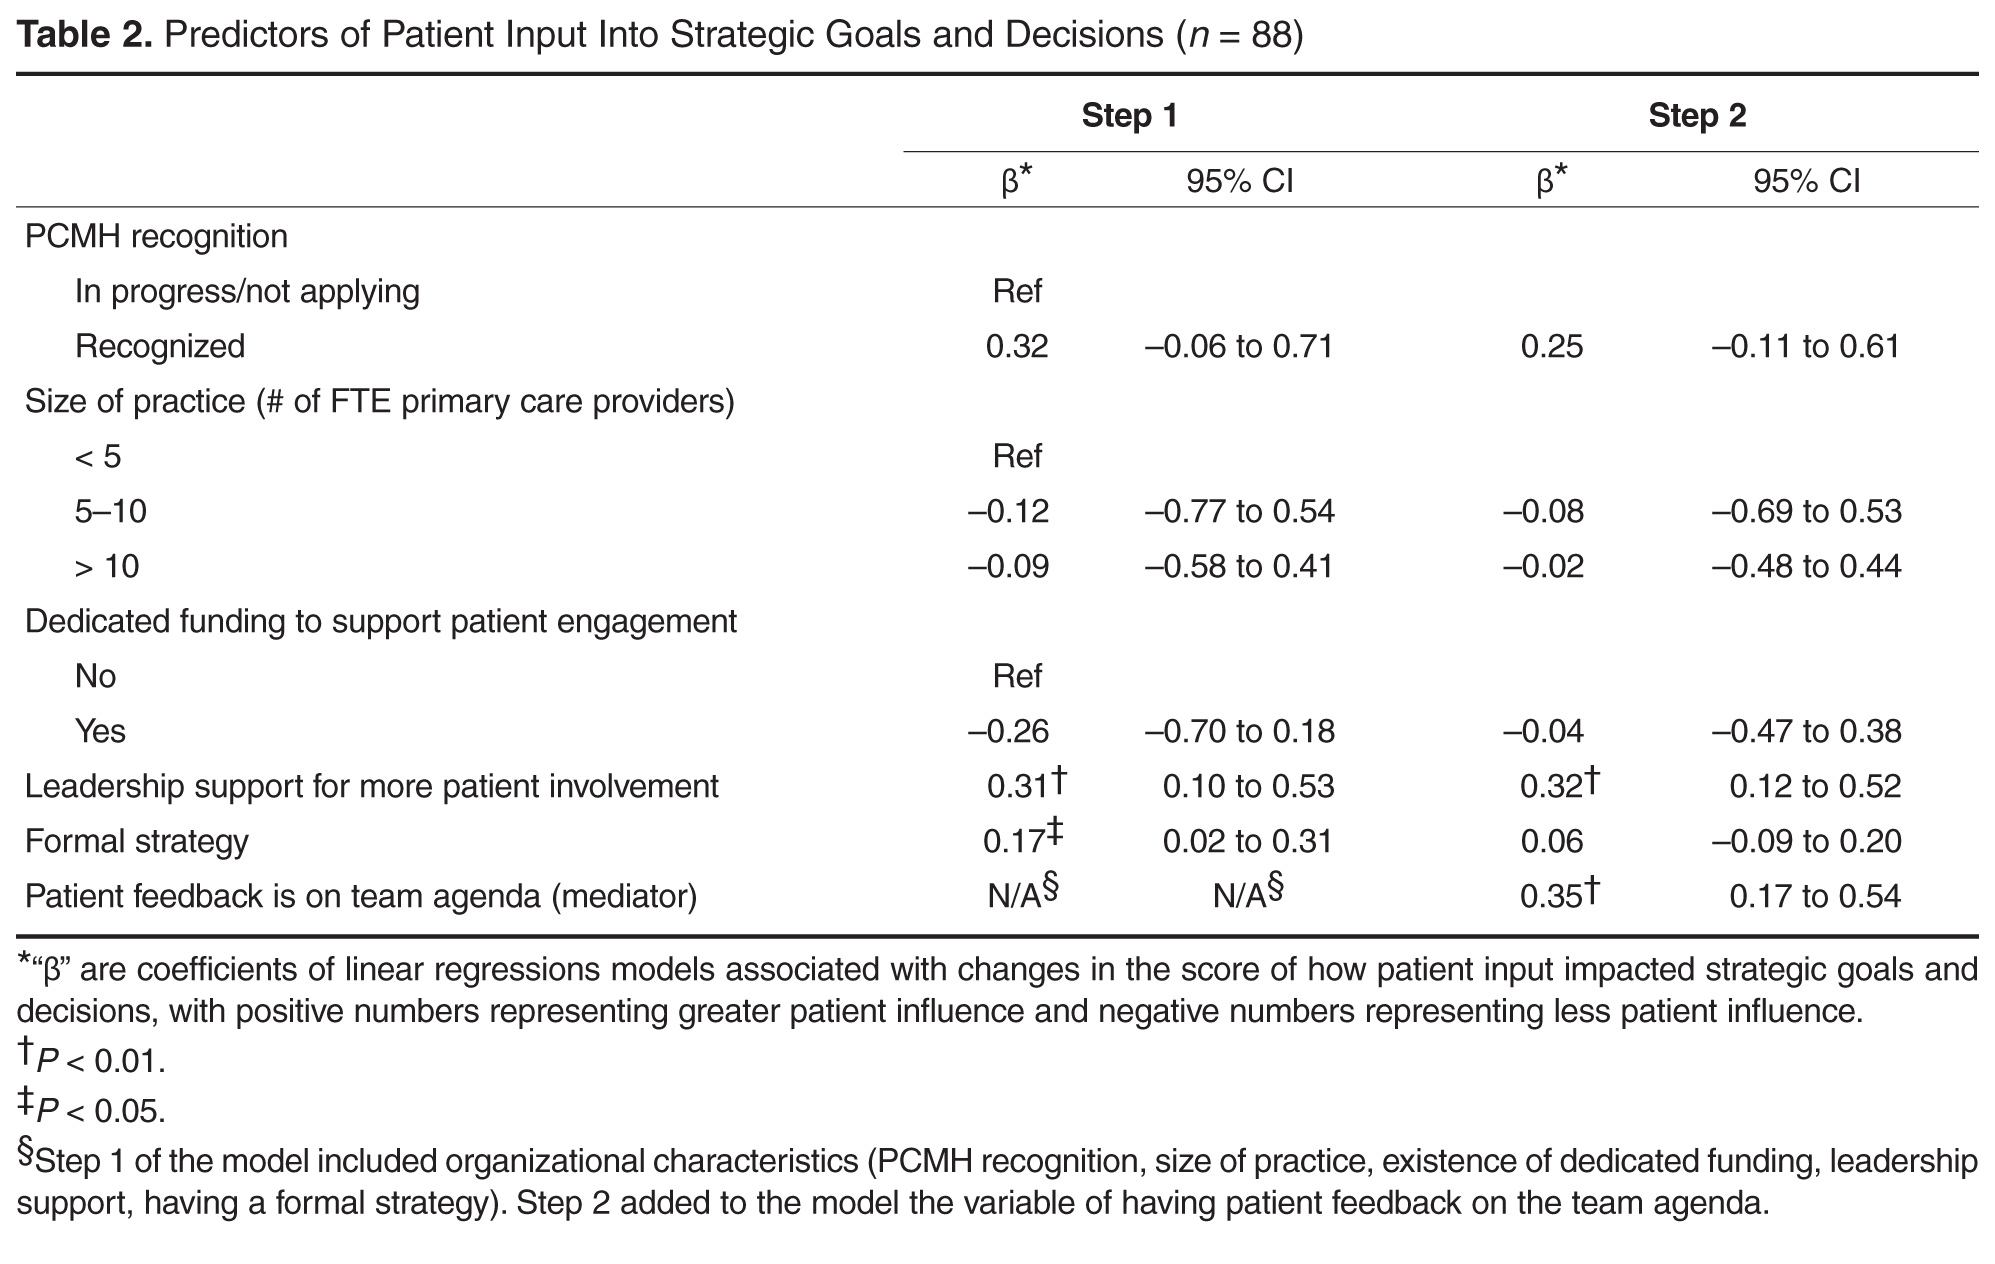
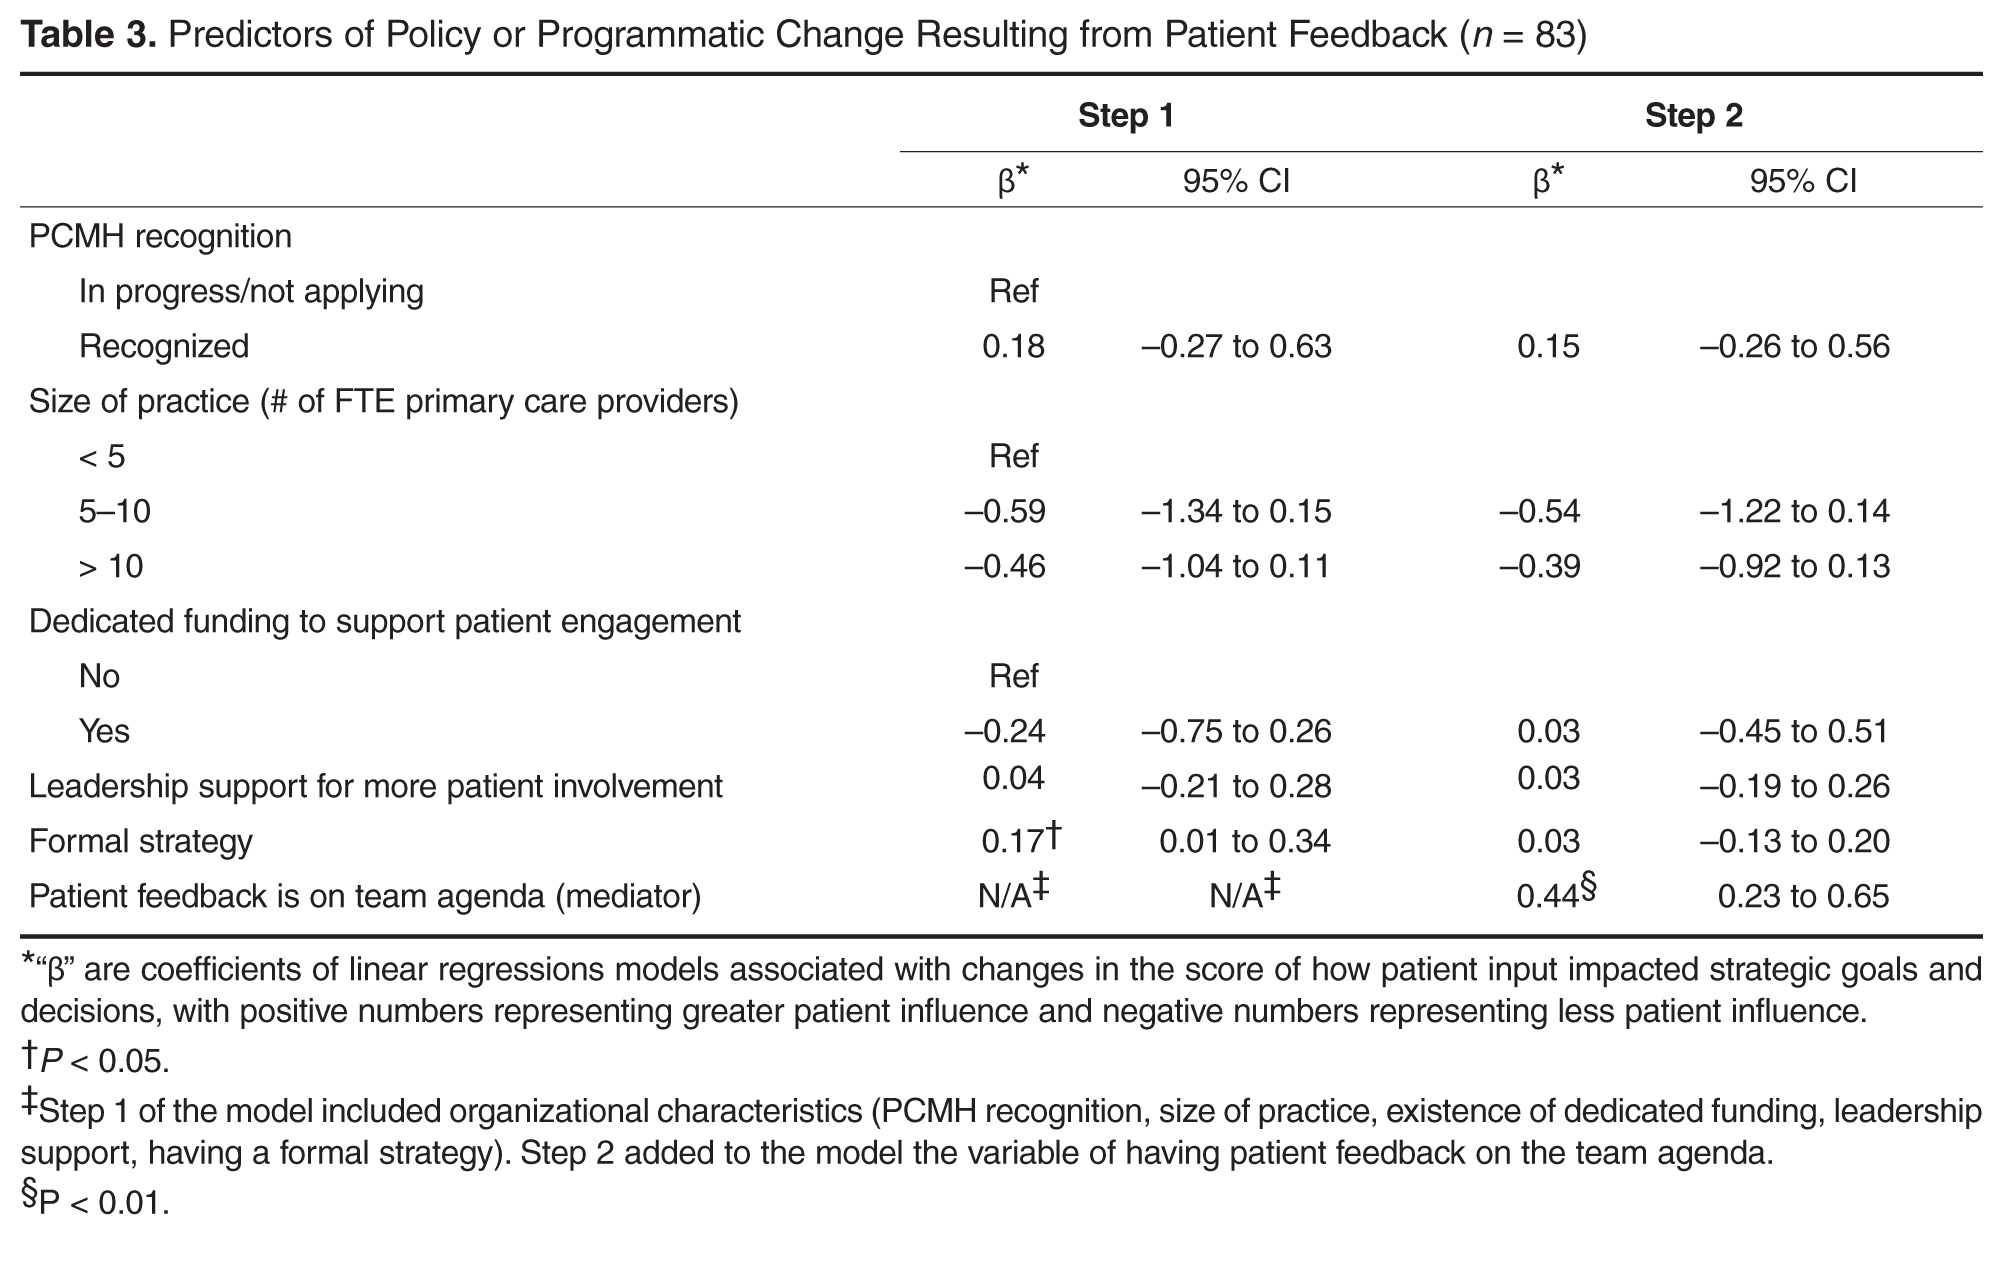
Discussion
Among the CHCs surveyed, we found that having a formal strategy for recruiting and engaging patients in practice improvement efforts was associated with patient input shaping strategic goals, programs, and policies. Devoting time in staff team meetings to discuss feedback from patients, such as that received through advisory councils or patient surveys, appeared to be the mechanism by which having a formal strategy for engaging patients influenced the outcomes. Leadership support for patient engagement was also associated with patient input in strategic goals. In contrast, anticipated predictors such as PCMH recognition status, the size of a practice, and having dedicated funding for patient engagement were not associated with these outcomes.
This is the first study known to the authors that examines factors associated with patient engagement outcomes such as patient involvement in clinic-level strategies, policies, and programs. The finding that having a formal process for recruiting and engaging patients and devoting time in team meetings to discuss patient input are significantly associated with patient engagement outcomes is encouraging, because it suggests relatively practical and straightforward actions for primary care leaders interested in engaging patients productively in practice improvement.
The level of patient engagement reported by these respondents is higher than that reported by some other studies. For example, 65% of respondents in this study reported conducting patient surveys and involving patients in ongoing roles as patient advisors, compared to 29% in a 2013 study by Han and colleagues for 112 practices that had received PCMH recognition [6]. This could be partially explained by the fact that many CHCs are federally qualified health centers, which are mandated to have consumer members on their board of directors, and in many cases patient board members may be invited to participate actively in practice improvement. In this study, it is also interesting to note that more than 80% of respondents agreed with the statement that “engaging patients in practice improvement is worth the time and effort it takes,” suggesting that this is a group that valued and prioritized patient engagement.
A lack of time or resources to support patient engagement has been reported as a barrier to effective engagement [15], so it was surprising that having dedicated funding to support patient engagement was not associated with the study outcomes. Only 30% of CHC leaders reported having dedicated funding for patient engagement, while over 80% reported soliciting patient input through longitudinal, bidirectional activities such as committees or advisory councils. While financial support for this vital work is likely important to catalyze and sustain patient engagement at the practice level, it would appear many of the practices surveyed in this study are engaging their patients as partners in practice transformation despite a lack of dedicated resources.
The lack of association that we found between PCMH recognition status and patient influence on strategies, programs, and policies is corroborated by work by Han and colleagues [6], in which they found that the level of PCMH status was not associated with the degree of patient engagement in practice improvement and that only 32% of practices were engaging patients in ongoing roles as advisors.
Devoting time in team meetings to discussing patient feedback seemed to be the mechanism through with having a formal strategy for patient engagement predicted outcomes. Although it may seem self-evident that taking time to discuss patient input could make it more likely to affect clinic practices, we have observed through regular interaction with dozens of health centers that many have comment boxes set up but have no mechanism for systematically reviewing that feedback and considering it as a team. This is also borne out by our survey finding that fewer than 60% of sites that report conducting surveys or having suggestion boxes agree that they set aside time in team meetings to discuss the feedback gleaned from these sources. Thus, the results of this survey suggest that there are simple decisions and structures that may help to turn input from patients into clinic actions.
This study has several limitations. Causation cannot be inferred from this cross-sectional study; additional research is required to understand if helping clinics develop formal strategies for patient recruitment or set aside time in meetings to discuss patient feedback would lead to greater influence of patients on strategic goals, policies, and programs. Data were self-reported by a single person from each CHC, and although members of WCN typically represent clinic leaders who are actively engaged in PCMH-related activities, it is not clear if respondents were aware of the full range of patient engagement strategies used at their clinical site. Front-line clinicians and staff could provide a different perspective on patient engagement. There was no external validation of survey instrument statements regarding the impact of patient input on strategic goals, policies, or programs. The number of respondents (n = 97) is limited, but it is comparable to that in other existing studies [6]. The response rate for this survey was 21%, and respondents may have differed from non-respondents in important ways. When respondents of this study are compared to national samples reporting to the Uniform Data System, the proportion of CHCs with PCMH recognition is lower in our sample (52% versus 65%) [16]. The high level of patient engagement reported by CHC leaders in this study compared to other studies suggests that highly engaged practices may have been more likely to respond than those with lower levels of engagement with their patients. There may have been differences in how patient engagement and advisory roles were interpreted by respondents.
Conclusion
CHC leaders who reported a formal strategy for engaging patients in practice improvement and dedicated time to discuss patient input during team meetings were more likely to report patient input on policies, programs, and strategic goals. Developing a formal strategy to engage patients and establishing protected time on team agendas to discuss patient feedback may be practical ways to promote greater patient engagement in primary care transformation.
Acknowledgements: The authors wish to thank the leadership of Western Clinicians Network. A special thanks to Dr. Carl Heard, Dr. Mike Witte, Dr. Eric Henley, Dr. Kevin Grumbach, Dr. David Thom, Dr. Quynh Bui, Lucia Angel, and Dr. Thomas Bodenheimer for their feedback on survey and manuscript development. Valuable input on the survey questions were also received from the UCSF Lakeshore Family Medicine Center Patient Advisory Council, the San Francisco General Hospital Patient Advisory Council, and the Malden Family Health Center Patient Advisory Council. Finally, thanks to the community health centers who shared their time and experiences through our survey.
Corresponding author: Rachel Willard-Grace, MPH, Department of Family & Community Medicine, UCSF, 1001 Potrero Hill, Ward 83, Building 80, 3rd Fl, San Francisco, CA 94110, rachel.willard@ucsf.edu.
Funding/support: Internal departmental funding covered the direct costs of conducting this research. This project was also supported in part by the National Center for Advancing Translational Sciences, National Institutes of Health, through UCSF-CTSI Grant Number UL1 TR000004 which supported Dr. Potter’s time. Dr. Sharma received support from the UCSF primary care research fellowship funded by NRSA grant T32 HP19025. Contents of this manuscript are solely the responsibility of the authors and do not necessarily represent the official views of the NIH.
1. Carman KL, Dardess P, Maurer M, et al. Patient and family engagement: a framework for understanding the elements and developing interventions and policies. Health Aff (Millwood) 2013;32:223–31.
2. Dentzer S. Rx for the ‘blockbuster drug’ of patient engagement. Health Aff (Millwood) 2013;32:202.
3. Fleurence R, Selby JV, Odom-Walker K, et al. How the Patient-Centered Outcomes Research Institute is engaging patients and others in shaping its research agenda. Health Aff (Millwood) 2013;32:393–400.
4. Boivin A, Lehoux P, Lacombe R, et al. Involving patients in setting priorities for healthcare improvement: a cluster randomized trial. Implement Sci 2014;9(24).
5. Peikes D, Genevro J, Scholle SH, Torda P. The patient-centered medical home: strategies to put patients at the center of primary care. AHRQ Publication No. 11-0029. Rockville, MD: Agency for Healthcare Research and Quality; 2007.
6. Han E, Hudson Scholle S, Morton S, et al. Survey shows that fewer than a third of patient-centered medical home practices engage patients in quality improvement. Health Aff (Millwood) 2013;32:368–75.
7. Nilsen ES, Myrhaug HT, Johnasen M, et al. Methods of consumer involvement in developing healthcare policy and research, clinical practice guidelines, and patient information material. Cochrane Database Syst Review 2006;19(3):CD004563.
8. Gottlieb K, Sylvester I, Eby D. Transforming your practice: what matters most. Fam Pract Manage 2008:32–8.
9. Institute for Patient- and Family-Centered Care. Profiles of change: MCGHealth, 2012. Available at www.ipfcc.org/profiles/prof-mcg.html.
10. Sharma AE, Angel L, Bui Q. Patient advisory councils: giving patients a seat at the table. Fam Pract Manage 2015;22:22–7.
11. National Association of Community Health Centers. Website. Accessed 23 Dec 2014 at www.nachc.com/.
12. Neuhausen K, Grumbach K, Bazemore A, Phillips RL. Integrating community health centers into organized delivery systems can improve access to subspecialty care. Health Aff (Millwood) 2012;31:1708–16.
13. National Association of Community Health Centers. Health center program governing board workbook. July 2015. Accessed 31 May 2016 at www.aachc.org/wp-content/uploads/2014/01/Governance-Workbook-8-18.pdf.
14. Baron RM, Kenny DA. The moderator-mediator variable distinction in social psychological research: conceptual, strategic, and statistical considerations. J Pers Soc Psych 1986;51:1173–82.
15. Roseman D, Osborne-Stafsnes J, Helwig AC, et al. Early lessons from four ‘aligning forces for quality’ communities bolster the case for patient-centered care. Health Aff (Millwood) 2013;32:232–41.
16. National Association of Community Health Centers. United States health center fact sheet. 2014. Accessed 27 May 2016 at www.nachc.com/client//US16.pdf.
From the Department of Family and Community Medicine, University of California San Francisco, San Francisco, CA (Ms. Willard-Grace, Dr. Sharma, Dr. Potter) and the California Primary Care Association, Sacramento, CA (Ms. Parker).
Abstract
- Objective: To explore how community health centers engage patients in practice improvement and factors associated with patient involvement on clinic-level strategies, policies, and programs.
- Methods: Cross-sectional web-based survey of community health centers in California, Arizona, Nevada, and Hawaii (n = 97).
- Results: The most common mechanisms used by community health centers to obtain patient feedback were surveys (94%; 91/97) and advisory councils (69%; 67/97). Patient-centered medical home recognition and dedicated funding for patient engagement activities were not associated with reported patient influence on the clinic’s strategic goals, policies, or programs. When other factors were controlled for in multivariable modeling, leadership support (β = 0.31, 95% confidence interval [CI] 0.10–0.53) and having a formal strategy to identify and engage patients as advisors (β = 0.17, 95% CI 0.02–0.31) were positively associated with patient influence on strategic goals. Having a formal strategy to identify and engage patients also was associated with patient impact on polices and programss (β = 0.17, 95% CI 0.01–0.34). The clinic process of setting aside time to discuss patient feedback appeared to be a mechanism by which formal patient engagement strategies resulted in patients having an impact on practice improvement activities (β = 0.35, 95% CI 0.17–0.54 for influence on strategic goals and β = 0.44, 95% CI 0.23–0.65 for influence on policies and programs).
- Conclusion: These findings may provide guidance for primary care practices that wish to engage patients in practice improvement. The relatively simple steps of developing a formal strategy to identify and engage patients and setting aside time in meetings to discuss patient feedback appear to be important prerequisites for success in these activities.
Patient engagement is becoming an increasingly prominent concept within primary care redesign. Called the “next blockbuster drug of the century” and the “holy grail” of health care [1,2], patient engagement has become a key goal for funders such as the Patient-Centered Outcomes Research Institute [3] and accrediting agencies such as the National Committee for Quality Assurance (NCQA).
Patient engagement has been defined as patients working in active partnership at various levels across the health care system to improve health and health care [1]. It can be conceptualized as occurring at 3 levels: at the level of direct care (eg, a clinical encounter), at the level of organizational design and governance, and at the level of policy making [1]. For example, engagement at the level of direct care might involve a patient working with her care team to identify a treatment option that matches her values and preferences. At the level of the health care organization, a patient might provide feedback through a survey or serve on a patient advisory council to improve clinic operations. Patients engaged at the level of policy making might share their opinions with their elected representatives or sit on a national committee. Although research has examined engagement at the direct care level, for example, in studies of shared decision making, there is a paucity of research addressing the impact of patient engagement on clinic-level organizational redesign and practice improvement [4,5].
Relatively few studies describe what primary care practice teams are currently doing at the basic level of soliciting and acting on patient input on the way that their care is delivered. A survey of 112 NCQA-certified patient-centered medical home (PCMH) practices found that 78% conducted patient surveys, 63% gathered qualitative input through focus groups or other feedback, 52% provided a suggestion box, and 32% included patients on advisory councils or teams [6]. Fewer than one-third of PCMH-certified practices were engaging patients or families in more intensive roles as ongoing advisors on practice design or practice improvement [6]. Randomized controlled trials have shown that patient involvement in developing informational materials results in more readable and relevant information [7]. Patient and family involvement in identifying organizational priorities within clinical practice settings resulted in greater alignment with the chronic care model and the PCMH when compared with control groups and resulted in greater agreement between patients and health care professionals [4]. Moreover, a number of innovative health care organizations credit their success in transformation to their patient partnerships [8–10].
Within this context, current practices at community health centers (CHCs) are of particular interest. CHCs are not-for-profit organizations that deliver primary and preventive care to more than 22 million people in the United States [11]. A large proportion of their patients are poor and live in medically underserved communities. More than one-third (37.5%) of CHC patients are uninsured and 38.5% are on Medicaid [12]. Perhaps because of their commitment to caring for medically vulnerable populations that have often had difficulty obtaining needed medical services, some CHCs have been on the forefront of patient engagement [8]. In addition, many CHCs are federally qualified health care centers, which are mandated to engage members of their communities within their governing boards [13]. However, relatively little is known about how CHCs are engaging patients as practice improvement partners or the perceived impact of this engagement on CHC strategic goals, policies, and programs. This study explores these factors and examines the organizational characteristics and processes associated with patients having an impact on practice improvement activities.
Methods
We conducted a cross-sectional, web-based survey of primary care clinician and staff leaders at CHCs in July–August 2014 to assess current strategies, attitudes, facilitators, and barriers toward engaging patients in practice improvement efforts. The study protocol was developed jointly by the San Francisco Bay Area Collaborative Research Network (SFBayCRN), the University of California San Francisco Center for Excellence in Primary Care (CEPC), and the Western Clinicians Network (WCN). The protocol was reviewed by the University of California San Francisco Committee on Human Research and determined to be exempt research (study number 14-13662).
Survey Participants
Participants in the web-based survey were members of the WCN, a peer-led, volunteer, membership-based association of medical leaders of community health centers in California, Arizona, Nevada, and Hawaii. An invitation and link to a web-based survey was sent by email to members working at WCN CHC, who received up to 3 reminders to complete the survey. We allowed one response per CHC surveyed; in cases where more than one CHC leader was a member of WCN, we requested that the person most familiar with patient engagement activities respond to the survey. In the event of multiple respondents from an organization, incomplete responses were dropped and one complete response was randomly selected to represent the organization. Participants in the survey were entered into a drawing for ten $50 gift cards and one iPad.
Conceptual Model
Measures
The primary outcomes of interest were respondents’ perception of patient impact on strategic priorities, policies, and programs. These outcomes were measured by 2 items: “Patient input helps shape strategic goals or priorities” and “Patient feedback has resulted in policy or program changes at our clinic.” Responses were measured on a 5-item Likert scale (1 = Strongly Disagree to 5 = Strongly Agree). Leadership support was measured using a single item that stated, “Our clinic leadership would like to find more ways to involve patients in practice improvement.” Having a formal strategy was measured using a single item that stated, “We have a formal strategy for how we recruit patients to serve in an advisory capacity.” Clinic processes included having dedicated time in meetings to discuss patient input, as measured by the item, “We dedicate time at team meetings to discuss patient feedback and recommendations.”
In addition to the 10 Likert-type items that captured attitudes, beliefs, and practices, we also asked participants to endorse strategies they used to obtain feedback and suggestions from patients (checklist of options including advisory councils, surveys, suggestion box, etc.). In addition, we assessed practice characteristics such as PCMH recognition status (not applying; in process of applying; received recognition), size of practice (< 5; 5–10; > 10 FTE clinicians), and having dedicated funding such as grant support to pay for patient engagement activities (yes; no).
Data Analysis
Data was analyzed in Stata version 13.0 (College Station, TX). Means and frequencies were used to characterize the sample. Stepwise multivariate modeling was used to identify factors associated with patient engagement outcomes. Organizational characteristics (size of the practice, PCMH recognition status, dedicated funding, leadership support, and having a formal strategy) were included as potential independent variables in Step 1 of the model for each of the 2 hypothesized patient engagement outcomes. Because we theorized that it might be a factor associated with the outcomes that was in turn influenced by clinic characteristics, the process of allocating dedicated time in team meetings to discuss and consider actions to take in response to patient feedback was included as a predictor in Step 2 of each model. Survey items that were not answered were treated as missing data (not imputed). We tested for multiple collinearity using variance influence factors.
Results
The most common mechanisms for receiving patient feedback were surveys (94% of respondents; 91/97) and suggestion boxes (57%; 55/97; Table 1). A third of respondents reported soliciting patient feedback on information materials (33%; 32/97), and almost a third involved patients in selecting referral resources (28%; 27/97). As for ongoing participation, 69% (67/97) of respondents reported involving patients on advisory boards or councils, and 36% (35/97) invited patients to take part in quality improvement committees. Other common activities included inviting patients to conferences or workshops (30%; 29/97) and asking patients to lead self-management or support groups (29%; 28/97).
Most respondents (82%; 77/93) agreed or strongly agreed that patient engagement was worth the time it required. About a third (35%; 32/92) reported having a formal strategy for recruiting and engaging patients in an advisory capacity. About half (52%; 49/94) reported setting aside time in team meetings to discuss patient feedback, although fewer (39%; 35/89) reported that their front line staff met regularly with patients to discuss clinic services and programs. Two-thirds of respondents (68%; 64/94) reported that their leadership would like to find more active ways to involve patients in practice improvement. Less than half (44%; 39/89) felt that they were successful at engaging patient advisors who represented the diversity of the population served. When considering downsides of patient engagement, few agreed that revealing the workings of the clinics to patients would expose the clinic to too much risk (8%; 7/89) or that patients would make unrealistic requests if asked their opinions (14%; 12/89).
Discussion
Among the CHCs surveyed, we found that having a formal strategy for recruiting and engaging patients in practice improvement efforts was associated with patient input shaping strategic goals, programs, and policies. Devoting time in staff team meetings to discuss feedback from patients, such as that received through advisory councils or patient surveys, appeared to be the mechanism by which having a formal strategy for engaging patients influenced the outcomes. Leadership support for patient engagement was also associated with patient input in strategic goals. In contrast, anticipated predictors such as PCMH recognition status, the size of a practice, and having dedicated funding for patient engagement were not associated with these outcomes.
This is the first study known to the authors that examines factors associated with patient engagement outcomes such as patient involvement in clinic-level strategies, policies, and programs. The finding that having a formal process for recruiting and engaging patients and devoting time in team meetings to discuss patient input are significantly associated with patient engagement outcomes is encouraging, because it suggests relatively practical and straightforward actions for primary care leaders interested in engaging patients productively in practice improvement.
The level of patient engagement reported by these respondents is higher than that reported by some other studies. For example, 65% of respondents in this study reported conducting patient surveys and involving patients in ongoing roles as patient advisors, compared to 29% in a 2013 study by Han and colleagues for 112 practices that had received PCMH recognition [6]. This could be partially explained by the fact that many CHCs are federally qualified health centers, which are mandated to have consumer members on their board of directors, and in many cases patient board members may be invited to participate actively in practice improvement. In this study, it is also interesting to note that more than 80% of respondents agreed with the statement that “engaging patients in practice improvement is worth the time and effort it takes,” suggesting that this is a group that valued and prioritized patient engagement.
A lack of time or resources to support patient engagement has been reported as a barrier to effective engagement [15], so it was surprising that having dedicated funding to support patient engagement was not associated with the study outcomes. Only 30% of CHC leaders reported having dedicated funding for patient engagement, while over 80% reported soliciting patient input through longitudinal, bidirectional activities such as committees or advisory councils. While financial support for this vital work is likely important to catalyze and sustain patient engagement at the practice level, it would appear many of the practices surveyed in this study are engaging their patients as partners in practice transformation despite a lack of dedicated resources.
The lack of association that we found between PCMH recognition status and patient influence on strategies, programs, and policies is corroborated by work by Han and colleagues [6], in which they found that the level of PCMH status was not associated with the degree of patient engagement in practice improvement and that only 32% of practices were engaging patients in ongoing roles as advisors.
Devoting time in team meetings to discussing patient feedback seemed to be the mechanism through with having a formal strategy for patient engagement predicted outcomes. Although it may seem self-evident that taking time to discuss patient input could make it more likely to affect clinic practices, we have observed through regular interaction with dozens of health centers that many have comment boxes set up but have no mechanism for systematically reviewing that feedback and considering it as a team. This is also borne out by our survey finding that fewer than 60% of sites that report conducting surveys or having suggestion boxes agree that they set aside time in team meetings to discuss the feedback gleaned from these sources. Thus, the results of this survey suggest that there are simple decisions and structures that may help to turn input from patients into clinic actions.
This study has several limitations. Causation cannot be inferred from this cross-sectional study; additional research is required to understand if helping clinics develop formal strategies for patient recruitment or set aside time in meetings to discuss patient feedback would lead to greater influence of patients on strategic goals, policies, and programs. Data were self-reported by a single person from each CHC, and although members of WCN typically represent clinic leaders who are actively engaged in PCMH-related activities, it is not clear if respondents were aware of the full range of patient engagement strategies used at their clinical site. Front-line clinicians and staff could provide a different perspective on patient engagement. There was no external validation of survey instrument statements regarding the impact of patient input on strategic goals, policies, or programs. The number of respondents (n = 97) is limited, but it is comparable to that in other existing studies [6]. The response rate for this survey was 21%, and respondents may have differed from non-respondents in important ways. When respondents of this study are compared to national samples reporting to the Uniform Data System, the proportion of CHCs with PCMH recognition is lower in our sample (52% versus 65%) [16]. The high level of patient engagement reported by CHC leaders in this study compared to other studies suggests that highly engaged practices may have been more likely to respond than those with lower levels of engagement with their patients. There may have been differences in how patient engagement and advisory roles were interpreted by respondents.
Conclusion
CHC leaders who reported a formal strategy for engaging patients in practice improvement and dedicated time to discuss patient input during team meetings were more likely to report patient input on policies, programs, and strategic goals. Developing a formal strategy to engage patients and establishing protected time on team agendas to discuss patient feedback may be practical ways to promote greater patient engagement in primary care transformation.
Acknowledgements: The authors wish to thank the leadership of Western Clinicians Network. A special thanks to Dr. Carl Heard, Dr. Mike Witte, Dr. Eric Henley, Dr. Kevin Grumbach, Dr. David Thom, Dr. Quynh Bui, Lucia Angel, and Dr. Thomas Bodenheimer for their feedback on survey and manuscript development. Valuable input on the survey questions were also received from the UCSF Lakeshore Family Medicine Center Patient Advisory Council, the San Francisco General Hospital Patient Advisory Council, and the Malden Family Health Center Patient Advisory Council. Finally, thanks to the community health centers who shared their time and experiences through our survey.
Corresponding author: Rachel Willard-Grace, MPH, Department of Family & Community Medicine, UCSF, 1001 Potrero Hill, Ward 83, Building 80, 3rd Fl, San Francisco, CA 94110, rachel.willard@ucsf.edu.
Funding/support: Internal departmental funding covered the direct costs of conducting this research. This project was also supported in part by the National Center for Advancing Translational Sciences, National Institutes of Health, through UCSF-CTSI Grant Number UL1 TR000004 which supported Dr. Potter’s time. Dr. Sharma received support from the UCSF primary care research fellowship funded by NRSA grant T32 HP19025. Contents of this manuscript are solely the responsibility of the authors and do not necessarily represent the official views of the NIH.
1. Carman KL, Dardess P, Maurer M, et al. Patient and family engagement: a framework for understanding the elements and developing interventions and policies. Health Aff (Millwood) 2013;32:223–31.
2. Dentzer S. Rx for the ‘blockbuster drug’ of patient engagement. Health Aff (Millwood) 2013;32:202.
3. Fleurence R, Selby JV, Odom-Walker K, et al. How the Patient-Centered Outcomes Research Institute is engaging patients and others in shaping its research agenda. Health Aff (Millwood) 2013;32:393–400.
4. Boivin A, Lehoux P, Lacombe R, et al. Involving patients in setting priorities for healthcare improvement: a cluster randomized trial. Implement Sci 2014;9(24).
5. Peikes D, Genevro J, Scholle SH, Torda P. The patient-centered medical home: strategies to put patients at the center of primary care. AHRQ Publication No. 11-0029. Rockville, MD: Agency for Healthcare Research and Quality; 2007.
6. Han E, Hudson Scholle S, Morton S, et al. Survey shows that fewer than a third of patient-centered medical home practices engage patients in quality improvement. Health Aff (Millwood) 2013;32:368–75.
7. Nilsen ES, Myrhaug HT, Johnasen M, et al. Methods of consumer involvement in developing healthcare policy and research, clinical practice guidelines, and patient information material. Cochrane Database Syst Review 2006;19(3):CD004563.
8. Gottlieb K, Sylvester I, Eby D. Transforming your practice: what matters most. Fam Pract Manage 2008:32–8.
9. Institute for Patient- and Family-Centered Care. Profiles of change: MCGHealth, 2012. Available at www.ipfcc.org/profiles/prof-mcg.html.
10. Sharma AE, Angel L, Bui Q. Patient advisory councils: giving patients a seat at the table. Fam Pract Manage 2015;22:22–7.
11. National Association of Community Health Centers. Website. Accessed 23 Dec 2014 at www.nachc.com/.
12. Neuhausen K, Grumbach K, Bazemore A, Phillips RL. Integrating community health centers into organized delivery systems can improve access to subspecialty care. Health Aff (Millwood) 2012;31:1708–16.
13. National Association of Community Health Centers. Health center program governing board workbook. July 2015. Accessed 31 May 2016 at www.aachc.org/wp-content/uploads/2014/01/Governance-Workbook-8-18.pdf.
14. Baron RM, Kenny DA. The moderator-mediator variable distinction in social psychological research: conceptual, strategic, and statistical considerations. J Pers Soc Psych 1986;51:1173–82.
15. Roseman D, Osborne-Stafsnes J, Helwig AC, et al. Early lessons from four ‘aligning forces for quality’ communities bolster the case for patient-centered care. Health Aff (Millwood) 2013;32:232–41.
16. National Association of Community Health Centers. United States health center fact sheet. 2014. Accessed 27 May 2016 at www.nachc.com/client//US16.pdf.