User login
Strategies for caring for the well cancer survivor
Cancer survivors represent a rapidly increasing population. In 1971, there were 3 million cancer survivors; this number increased to 15.5 million in 2016 and will reach 20 million by 2026.1TABLE 11 shows the percentage of survivors by type of cancer. Cancer survivors tend to be older,* comprising nearly 1 of every 5 people older than 65 years.2

The Institute of Medicine (IOM) identified 3 key characteristics of cancer survivors3:
- Trajectories of survivorship are variable; many cancer patients have periods of relative health between episodes of their disease.
- Survivors require careful cancer monitoring; in addition to the risk that their primary cancer will recur, they have an elevated risk for another, second cancer.
- Both cancer and its treatments increase the risk of other medical and psychiatric problems.
Family physicians (FPs) have optimal skills for navigating the chronic risks and health concerns of the well cancer survivor. This article reviews the primary care management of the functional cancer survivor, focusing on the management of chronic conditions and preventive care.
Survivorship follows any of 6 paths
Cancer survivorship is increasing in importance as treatment has steadily reduced mortality. Six trajectories of cancer survivors have been identified1:
- living cancer-free after treatment with minimal effects
- living cancer-free but suffering serious treatment complications
- Suffering late recurrence
- Developing a second cancer
- Living with intermittent cancer recurrences
- Living with cancer continuously.
Only patients in the last 2 groups are likely to be managed primarily by oncologists.
Survivors look to their FPs for ongoing care
Cancer survivors routinely see their primary care physician after initial treatment. A study of 30,000 Canadian breast cancer survivors demonstrated that follow-up care was limited to an oncologist in only 2%; 84% saw a primary care provider and an oncologist; and 14% saw a primary care provider only.4 A study of colorectal cancer survivors showed that primary care visits increased in each of the 5 years after diagnosis, during which time oncology visits decreased steadily5; in that study, primary care physicians delivered more preventive care than oncologists did.5 Similar to what is done in other chronic conditions, the various effects of cancer are best managed as a whole.
The IOM recommends that cancer survivor care comprise 4 elements2:
- coordination between oncologist and primary care physician
- surveillance for recurrence or spread of existing cancer
- screening for new cancer
- intervention for the effects of cancer and treatment.
Continue to: The following discussion summarizes...
The following discussion summarizes evidence and recommendations for each element of the IOM recommendations for survivor care.
Implementing the 4 elements of cancer survivor care
1. Coordinate care through a unified survivorship care plan
The IOM has noted that the needs of cancer survivors are rarely met2; communication between oncology and primary care is often deficient during transition of care. The IOM has recommended that oncologists provide a survivorship care plan that details the cancer (ie, tumor characteristics), the type of treatment (ie, enrollment in a clinical trial; medical, surgical, or radiation), support services, and follow-up recommendations for the primary care provider. (Examples of elements of a survivorship care plan can be found at www.mskcc.org/hcp-education-training/survivorship/survivorship-care-plan6 and http://sma.org/southern-medical-journal/article/cancer-survivors-history-physical/7).
Regrettably, survivorship care plans have been rarely and poorly employed. Studies show that fewer than one-half of oncologists provide a plan, and that when they do, the plan often lacks recommended information.8,9 Survivorship care plans may soon become common practice, however; the Commission on Cancer of the American College of Surgeons has required their use in all certified cancer centers since 2015.10
2. Provide surveillance of existing cancer

Cancer follow-up is challenging after the initial treatment phase. Although there are many conflicting guidelines for surveillance after cancer, guidelines of the National Comprehensive Cancer Network (NCCN) (summarized in TABLE 211 for the 10 most common cancers in survivors) are the ones generally accepted.12,13

Although individual surveillance recommendations are based on limited evidence, studies confirm the importance of surveillance. A systematic review showed that surveillance mammography after breast cancer reduces breast cancer mortality by 36%.14 A study showed that bladder cancer recurrence diagnosed by surveillance instead of by symptoms led to a 35% increase in 5-year survival.15

Continue to: Yet adherence to cancer surveillance...
Yet adherence to cancer surveillance recommendations is poor. A study of patients with colon cancer demonstrated that only 12% met all recommended surveillance guidelines.16 A study of patients with bladder cancer after radical cystectomy showed that only 9% met recommended surveillance more than 2 years after diagnosis.17 Those dismal statistics may be the result of provider oversight—not patient reluctance.
In the colon cancer study, for example, compliance with follow-up colonoscopy was 80% but compliance with carcinoembryonic antigen testing was only 22%.16 In the bladder cancer study, follow-up urine cytology was obtained in only 23% of patients, although 75% completed recommended imaging.17
Although surveillance remains the oncologist’s responsibility, visits to the FP provide an opportunity to review surveillance and order needed laboratory testing and other studies, including imaging.
3. Screen for new cancers
The risk of a second cancer is elevated for cancer survivors compared with the risk of a primary cancer in the healthy general population; some survivors have a lifetime risk of a second cancer as high as 36%.18 Risk varies by cancer type (TABLE 319). Some of this variation is due to the impact of smoking: Smoking-related cancers have the highest risk of second malignancy.19 Genetic predisposition to malignant transformation is also theorized to contribute to increased risk. Second malignancies are dangerous; 55% of patients die of the second cancer compared with only 13% of their initial cancer.19

Studies show that cancer survivors display varying adherence with recommended screening for second cancers. In a study of Latina cancer survivors, depressive symptoms were associated with lower screening compliance.20 A study of survivors of hematologic cancer showed a low rate of cancer screening and high fear of cancer recurrence—suggesting avoidance due to fear.21 Other studies, however, show similar or increased compliance with screening in cancer survivors.22,23 A meta-analysis of 19 studies determined that, overall, cancer survivors receive 25% to 38% more recommended screening than the general population.24
Continue to: Few guidelines exist to guide FPs...
Few guidelines exist to guide FPs in adjusting screening for the cancer survivor. For women who received radiation therapy for a tumor in the chest, for example, the recommendation offered by several groups is to start breast cancer screening 8 to 10 years after treatment or by 30 years of age, and to consider combining magnetic resonance imaging and mammography.25 Recommendations for breast cancer screening do not account for a history of other gynecologic cancers unless genetic markers are present.25 On the other hand, the impact of a history of cancer on the risk of prostate cancer and on screening decisions has not been studied,26 and cervical cancer screening guidelines, which recommend that screening continue after 65 years of age for patients who are immunocompromised, do not address a history of other cancer.27
4. Manage the effects of both the cancer and the treatment
Medical issues faced by cancer survivors are familiar to FPs, but there are some specific recommendations regarding evaluation and treatment that stand in contrast to what would be considered for a healthy, or non-cancer, patient. For example, each chemotherapeutic agent has characteristic adverse effects; TABLE 47 lists the principal adverse effects of common agents and recommendations for testing when these problems develop. Common long-term problems in cancer survivors include fatigue, chronic pain, cognitive dysfunction, psychiatric illness, and cardiovascular disease. Although these symptoms and manifestations are common, the physician must be careful: New or changing symptoms could signal the spread or recurrence of disease. Fear of recurrence can lead patients to exaggerate or minimize symptoms.

Fatigue is the most common symptom seen in cancer survivors during treatment and following remission.28 More than 40% of cancer survivors report significant fatigue.29 Although fatigue is concerning for cancer recurrence, other causes are common in cancer survivors. Both depression and anxiety commonly present with worsened fatigue.30 Sleep disturbances are common, even without a psychiatric diagnosis.31 Effects of treatment, including nausea, anemia, heart failure, and medication adverse effects can cause or worsen fatigue. Pain is associated with fatigue, but to a lesser extent than are depression, anxiety, and nausea.32

Pharmacotherapy of cancer-related fatigue is challenging. Psychostimulants have been most studied. A recent systematic review shows that methylphenidate produces mild or moderate improvement in fatigue, whereas modafanil has minimal effectiveness.33 Antidepressants have not been shown to relieve fatigue.33
A recent meta-analysis showed that nonpharmaceutical treatments for cancer-related fatigue are more effective than pharmacotherapy. In this review, both exercise and pharmacotherapy had a mild-to-moderate effect on fatigue.35 Exercise is best studied in this regard, and has shown the most consistent results.31
Continue to: Chronic pain
Chronic pain. Pain is common in cancer survivors: As many as 40% experience pain for years after initial therapy.36 Treatment of some cancers—eg, thoracotomy (80%), amputation (50%-80%), neck dissection (52%), and surgical management of breast cancer (63%)—increase the likelihood of chronic pain.37 Reports of pain in cancer survivors that should be considered red flags that might signal recurrence of cancer include new or worsening pain; pain worse at night or when recumbent; new neurologic symptoms; and general symptoms of systemic illness37 (TABLE 537).

Management of pain is best approached by its cause, with neurologic, rheumatologic (including myofascial pain and arthralgia), lymphatic, and genital causes most common.37 Across all types of pain, complete relief is unlikely; functional goals provide a more effective target.
For neuropathic cancer pain, duloxetine is the only medication with evidence of benefit; anticonvulsant and topical medications are recommended on the basis of the findings of studies of noncancer pain.38 There are few data on the value of treatments for cancer-related rheumatologic and lymphatic pain, although exercise has shown benefit in both types.38 For dyspareunia and sexual dysfunction (common after gynecologic and nongynecologic cancers), vaginal lubricants and pelvic-floor physiotherapy have shown benefit.39 There is significant overlap in psychiatric comorbidities, sleep, and pain, and addressing all of a patient’s problems can reduce pain and improve function.40
Opioids are often prescribed for pain in cancer survivors. Cancer survivors have a higher rate of opioid prescribing compared with that of non-cancer patients, even 10 years after diagnosis.41 Guidelines of the Centers for Disease Control and Prevention for using opioids to manage chronic pain specifically exclude cancer patients.42 Regrettably, there is no evidence that opioids have long-term efficacy in chronic pain; in fact, evidence is accumulating that chronic opioid therapy exacerbates chronic pain.43
Cognitive dysfunction is present in 17% to 75% of cancer survivors as memory disturbance, psychological disorder, sleep dysfunction, or impairment of executive functioning.44 Cognitive deficits appear to be secondary to both cancer and treatment modalities45; as many as one-third of patients have cognitive dysfunction prior to receiving chemotherapy.46
Continue to: Chemotherapies that are more likely...
Chemotherapies that are more likely to cause cognitive symptoms include methotrexate, 5-fluorouracil, cyclophosphamide, and hormone antagonists.47 More powerful regimens and repetitive chemotherapy regimens tend to cause more cognitive effects.47
Cognitive training interventions show evidence of likely benefit,44,48 leading to recommendations for self-treatment strategies, such as written lists, wordplay, crossword puzzles, jigsaw puzzles, playing a musical instrument, and new hobbies. Small studies suggest a benefit from cognitive behavioral therapy.44,49 A study of breast cancer survivors showed that yoga led to improvement in patient-reported cognitive dysfunction.50 Physical exercise yields cognitive benefit in healthy older adults and is supported by limited evidence in cancer survivors.51
There is no effective pharmacotherapy for cancer- and cancer chemotherapy-related cognitive dysfunction unless a treatable underlying cause is found.44 Symptoms tend to subside with time after completion of chemotherapy, which might be reassuring to patients and families.45
Psychiatric problems. The most common psychiatric issues in cancer survivors are anxiety and depression; the prevalence of anxiety is nearly double that of depression.52 Anxiety often presents as fear of a recurrence of cancer or a feeling of lack of control over present or future circumstances.53 Screening for anxiety and depression is recommended at each visit, using standardized screening questionnaires.54
A small study suggests that psychiatric treatment reduces the risk of early mortality.55 Small studies also suggest that mindfulness-based therapy and cognitive behavioral therapy delivered by telehealth offer benefit.56 A meta-analysis shows that exercise interventions improve depression and anxiety in breast cancer patients.57
Continue to: There are few studies of pharmacotherapy...
There are few studies of pharmacotherapy of anxiety or depression in cancer survivors56; it is known that cancer survivors are nearly twice as likely as the general population to be taking medical therapy for anxiety and depression.58 A Cochrane systematic review of 7 small studies showed uncertain improvement in depressive symptoms in patients with cancer from antidepressant medication; however, an earlier systematic review did show benefit.59,60
In a trial of patients without depression who were being treated for head and neck cancer, escitalopram, 20 mg/d, reduced the risk of subsequent depression compared with placebo.61 A study of 420 breast cancer survivors showed that 300 mg/d and 900 mg/d dosages of gabapentin were both superior to placebo, and nearly equivalent to each other, at reducing anxiety scores.62 In both studies, however, the evidence is nonetheless insufficient to make specific recommendations about these medications.
Cardiac risk
Among chemotherapeutic agents, anthracyclines, such as doxorubicin, cause the most rapid and striking myocyte damage. This damage is dose-dependent and nearly irreversible, with 98% of injury occurring within the first year of chemotherapy.64 More than one half of cancer patients taking an anthracycline have cardiac dysfunction on imaging; 5% will be in overt heart failure 10 to 20 years, or longer, after chemotherapy.63 Following monitoring at 1 year post-therapy, regular cardiac imaging is not recommended in the absence of symptoms.62
Because other cardiotoxic chemotherapeutic agents cause partially reversible damage, imaging is not recommended in the absence of symptoms in patients taking those agents.64
Continue to: Radiation therapy to the chest leads...
Radiation therapy to the chest leads to many cardiac complications, including cardiomyopathy, valvular disease, pericardial disease, and arrhythmias. Development of cardiomyopathy can be delayed 20 to 30 years after radiation; screening echocardiography is therefore recommended every 5 to 10 years after radiation therapy.65 Recent adjustments to the dosages and delivery of radiation therapy should reduce cardiac damage, but will require decades to validate.63
For patients at risk of cardiovascular disease prior to treatment of cancer, there is evidence to support preventive treatment with angiotensin II-receptor antagonists, beta-blockers, and statins to prevent cardiomyopathy.63 Treatment of diagnosed cardiomyopathy and heart failure follows standard guidelines, with significant emphasis on aerobic exercise and smoking cessation.63
Cancer survivorship care: Your critical role
Cancer survivors constitute a large population who frequent the practices of primary care physicians. Primary care visits provide an opportunity to monitor key elements of survivorship, including surveillance of the current cancer and screening for second cancers. Similar to what is seen with diabetes and coronary artery disease, cancer increases cardiac risk, which requires preventive care and chronic management. FPs are well placed to treat common issues in cancer survivors—issues that mirror concerns seen in the general population.
CORRESPONDENCE
Michael J. Arnold, MD, CDR, USN, Uniformed Services University of the Health Sciences, 4301 Jones Bridge Road, Bethesda, MD 20814; michael.arnold@usuhs.edu.
ACKNOWLEDGEMENT
Kristian Sanchack, MD, and James Higgins, DO, assisted with the editing of the manuscript.
1. American Cancer Society. Cancer Treatment & Survivorship Facts & Figures 2016-2017. Atlanta, GA: American Cancer Society; 2016. www.cancer.org/research/cancer-facts-statistics/survivor-facts-figures.html. Accessed July 25, 2018.
2. Survivorship. NCCN Guidelines (version 1.2017). Fort Washington, PA: National Comprehensive Cancer Network; 2017. www.nccn.org/professionals/physician_gls/default.aspx#supportive. Accessed July 26, 2018.
3. Kendall C, Decker KM, Groome PA, et al. Use of physician services during the survivorship phase: a multi-province study of women diagnosed with breast cancer. Curr Oncolog. 2017;24:81-89.
4. Snyder CF, Earle CC, Herbert RJ, et al. Preventive care for colorectal cancer survivors: a 5-year longitudinal study. J Clin Oncol. 2008;26:1073-1079.
5. Hewitt M, Greenfield S, Stovall E (eds); Institute of Medicine and National Research Council. From Cancer Patient to Cancer Survivor: Lost in Transition. Washington DC: The National Academies Press; 2006. www.nap.edu/read/11468/chapter/1. Accessed July 25, 2018.
6. Survivorship care plan. New York, NY: Memorial Sloan Kettering Cancer Center. www.mskcc.org/hcp-education-training/survivorship/survivorship-care-plan. Accessed August 11, 2018.
7. Fuentes AC, Lambird JE, George TJ, et al. Cancer survivor’s history and physical. South Med J. 2017;110:37-44. http://sma.org/southern-medical-journal/article/cancer-survivors-history-physical/. Accessed July 26, 2018.
8. Salz T, Oeffinger KC, McCabe MS, et al. Survivorship care plans in research and practice. CA Cancer J Clin. 2012;62:101-117.
9. Birken SA, Mayer DK, Weiner BJ. Survivorship care plans: prevalence and barriers to use. J Cancer Educ. 2013;28:290-296.
10. American College of Surgeons Commission on Cancer. Cancer program standards 2012: Ensuring patient-centered care. V1.2.1. www.facs.org/~/media/files/quality%20programs/cancer/coc/programstandards2012.ashx. Accessed July 25, 2018.
11. NCCN guidelines for treatment of cancer by site. NCCN Guidelines (version 1.2018). Fort Washington, PA: National Comprehensive Cancer Network; 2018. www.nccn.org/professionals/physician_gls/default.aspx#site. Accessed July 25, 2018.
12. Spronka I, Korevaar JC, Burgers JS, et al. Review of guidance on recurrence risk management for general practitioners in breast cancer, colorectal cancer and melanoma guidelines. Family Pract. 2017;34:154-160.
13. Merkow RP, Korenstein D, Yeahia R, et al. Quality of cancer surveillance clinical practice guidelines: specificity and consistency of recommendations. JAMA Intern Med. 2017;177:701-709.
14. Muradali D, Kennedy EB, Eisen A, et al. Breast screening for survivors of breast cancer: a systematic review. Prev Med. 2017;103:70-75.
15. Giannarini G, Kessler TM, Thoeny HC, et al. Do patients benefit from routine follow-up to detect recurrences after radical cystectomy and ileal orthotopic bladder substitution? Eur Urol. 2010;58:486-494.
16. Sisler JJ, Seo B, Katz A, et al. Concordance with ASCO guidelines for surveillance after colorectal cancer treatment: a population-based analysis. J Oncol Pract. 2012;8:e69-e79.
17. Ehdaie B. Atoria CL, Lowrance WT, et al. Adherence to surveillance guidelines after radical cystectomy: a population-based analysis. Urol Oncol. 2014;32:779-784.
18. Travis LB, Fosså SD, Schonfeld SJ, et al. Second cancers among 40,576 testicular cancer patients: focus on long-term survivors. J Natl Cancer Inst. 2005;97:1354-1365.
19. Donin N, Filson C, Drakaki A, et al. Risk of second primary malignancies among cancer survivors in the United States, 1992 through 2008. Cancer. 2016;122:3075-3086.
20. Holder AE, Ramirez AG, Gallion K. Depressive symptoms in Latina breast cancer survivors: a barrier to cancer screening. Health Psycholog. 2014;33:242-248.
21. Dyer G, Larsen SR, Gilroy N, et al. Adherence to cancer screening guidelines in Australian survivors of allogenic blood and marrow transplantation (BMT). Cancer Med. 2016;5:1702-1716.
22. Mandelzweig L, Chetrit A, Amitai T, et al. Primary prevention and screening practices among long-term breast cancer survivors. Cancer Causes Control. 2017;28:657-666.
23. Bishop MM, Lee SJ, Beaumont JL, et al. The preventive health behaviors of long-term survivors of cancer and hematopoietic stem cell transplantation compared with matched controls. Biol Blood Marrow Transplant. 2010;16:207-214.
24. Uhlig A, Mei J, Baik I, et al. Screening utilization among cancer survivors: a meta-analysis. J Public Health (Oxf). 2018;40:129-137.
25. Hilal T, Rudy DW. Radiation-induced breast cancer: the question of early breast cancer screening in Hodgkin’s lymphoma survivors. Oxf Med Case Reports. 2016;2016:17-18.
26. Lin K, Croswell JM, Koenig H, et al. Prostate-specific antigen-based screening for prostate cancer: an evidence update for the U.S. Preventive Services Task Force [Internet]. Evidence Syntheses No. 90. AHRQ Publication No. 12-05160-EF-1. Rockville, MD: Agency for Healthcare Research and Quality (US); October 2011. www.ncbi.nlm.nih.gov/pubmedhealth/PMH0032900/. Accessed July 25, 2018.
27. US Preventive Services Task Force. Screening for cervical cancer: U.S. Preventive Services Task Force recommendation statement. JAMA. 2018;320:674-686.
28. Hofman M, Ryan JL, Figueroa-Moseley CD, et al. Cancer-related fatigue: the scale of the problem. Oncologist. 2007;12 Suppl 1:4-10.
29. Jung JY, Lee JM, Kim MS, et al. Comparison of fatigue, depression, and anxiety as factors affecting posttreatment health-related quality of life in lung cancer survivors. Psychooncology. 2018;27:465-470.
30. Bower JE. Cancer-related fatigue--mechanisms, risk factors, and treatment. Nat Rev Clin Oncol. 2014;11:597-609.
31. Medysky ME, Temesi J, Culos-Reed SN, et al. Exercise, sleep and cancer-related fatigue: are they related? Neurophysiol Clin. 2017;47:111-122.
32. Oh HS, Sea WS. Systematic review and meta-analysis of the correlates of cancer-related fatigue. Worldviews Evid Based Nurs. 2011;8:191-201.
33. Qu D, Zhang Z, Yu X, et al. Psychotropic drugs for the management of cancer-related fatigue: a systematic review and meta-analysis. Eur J Cancer Care (Engl). 2016;25:970-979.
34. Escalante CP, Manzullo EF. Cancer-related fatigue: the approach and treatment. J Gen Intern Med. 2009;24(suppl 2):S412-S416.
35. Mustian KM, Alfano CM, Heckler C, et al. Comparison of pharmaceutical, psychological, and exercise treatments for cancer-related fatigue: a meta-analysis. JAMA Oncol. 2017;3:961-968.
36. Glare PA, Davies PS, Finlay E, et al. Pain in cancer survivors. J Clin Oncol. 2014;32:1739-1747.
37. Davies PS. Chronic pain management in the cancer survivor: tips for primary care providers. Nurse Pract. 2013;39:28-38.
38. Boland EG, Ahmedzai SH. Persistent pain in cancer survivors. Curr Opin Support Palliat Care. 2017;11:181-190.
39. Sears CS, Robinson JW, Walker LM. A comprehensive review of sexual health concerns after cancer treatment and the biopsychosocial treatment options available to female patients. Eur J Cancer Care (Engl). 2017;27:e12738.
40. Schou Bredal I, Smeby NA, Ottesen S, et al. Chronic pain in breast cancer survivors: comparison of psychological, surgical, and medical characteristics between survivors with and without pain. J Pain Symptom Manage. 2014;48:852-862.
41. Sutradhar R, Lokku A, Barbera L. Cancer survivorship and opioid prescribing rates: a population-based matched cohort study among individuals with and without a history of cancer. Cancer. 2017;123:4286-4293.
42. Dowell D, Haegerich TM, Chou R. CDC guideline for prescribing opioids for chronic pain - United States, 2016. MMWR Recomm Rep. 2016;65:1-49.
43. Davis MP, Mehta Z. Opioids and chronic pain: where is the balance? Curr Oncol Rep. 2016;18:71.
44. Von Ah D. Cognitive changes associated with cancer and cancer treatment: state of the science. Clin J Oncol Nurs. 2015;19:47-56.
45. Moore HC. An overview of chemotherapy-related cognitive dysfunction, or ‘chemobrain’. Oncology (Williston Park). 2014;28:797-804.
46. Asher A. Cognitive dysfunction among cancer survivors. Am J Phys Med Rehabil. 2011;90(suppl):S16-S26.
47. Joly F, Rigal O, Noal S, et al. Cognitive dysfunction and cancer: which consequences in terms of disease management? Psychooncology. 2011;20:1251-1258.
48. Attention, thinking or memory problems. American Society of Clinical Oncology Cancer.Net. April 2018. www.cancer.net/navigating-cancer-care/side-effects/attention-thinking-or-memory-problems. Accessed July 25, 2018.
49. Kucherer S, Ferguson RJ. Cognitive behavioral therapy for cancer-related cognitive dysfunction. Curr Opin Support Palliat Care. 2017;11:46-51.
50. Derry HM, Jaremka LM, Bennet JM, et al. Yoga and self-reported cognitive problems in breast cancer survivors: a randomized controlled trial. Psychooncology. 2015;24:958-966.
51. Treanor CJ, McMenamin UC, O’Neill RF, et al. Non-pharmacological interventions for cognitive impairment due to systemic cancer treatment. Cochrane Database Syst Rev. 2016 Aug 16;(8):CD011325.
52. Mitchell AJ, Ferguson DW, Gill J, et al. Depression and anxiety in long-term cancer survivors compared with spouses and healthy controls: a systematic review and meta-analysis. Lancet Oncol. 2013;14:721-732.
53. Inhestern L, Beierlein V, Bultmann JC, et al. Anxiety and depression in working-age cancer survivors: a register-based study. BMC Cancer. 2017;17:347.
54. Partridge AH, Jacobsen PB, Andersen BL. Challenges to standardizing the care for adult cancer survivors: highlighting ASCO’s fatigue and anxiety and depression guidelines. Am Soc Clin Oncol Educ Book. 2015:188-194.
55. Andersen BL, Yang HC, Farrar WB, et al. Psychologic intervention improves survival for breast cancer patients: a randomized clinical trial. Cancer. 2008;113:3450-3458.
56. Yi JC, Syrjala KL. Anxiety and depression in cancer survivors. Med Clin N Am. 2017;101:1099-1113.
57. Zhu G, Zhang X, Wang Y, et al. Effects of exercise intervention in breast cancer survivors: a meta-analysis of 33 randomized controlled trials. Onco Targets Ther. 2016;9:2153-2168.
58. Hawkins NA, Soman A, Lunsford N, et al. Use of medications for treating anxiety and depression in cancer survivors in the United States. J Clin Oncol. 2017;35:78-85.
59. Ostuzzi G, Matcham F, Dauchy S, et al. Antidepressants for the treatment of depression in people with cancer. Cochrane Database Syst Rev. 2015 June 1;(6):CD011006.
60. Laoutidis ZG, Mathiak K. Antidepressants in the treatment of depression/depressive symptoms in cancer patients: a systematic review and meta-analysis. BMC Psychiatry. 2013;13:140.
61. Lydiatt WM, Bessette D, Schmid KK, et al. Prevention of depression with escitalopram in patients undergoing treatment for head and neck cancer: randomized, double-blind, placebo-controlled clinical trial. JAMA Otolaryngol Head Neck Surg. 2013;139:678-686.
62. Lavigne JE, Heckler C, Mathews JL, et al. A randomized, controlled, double-blinded clinical trial of gabapentin 300 versus 900 mg versus placebo for anxiety symptoms in breast cancer survivors. Breast Cancer Res Treat. 2012;136:479-486.
63. Okwuosa TM, Anzevino S, Rao R. Cardiovascular disease in cancer survivors. Postgrad Med J. 2017;93:82-90.
64. Plana, JC, Galderisi M, Barac A, et al. Expert consensus for multimodality imaging evaluation of adult patients during and after cancer therapy: a report from the American Society of Echocardiography and the European Association of Cardiovascular Imaging. J Am Soc Echocardiogr. 2014;27:911-939.
65. Lancellotti, P, Nkomo VT, Badano LP, et al. Expert consensus for multi-modality imaging evaluation of cardiovascular complications of radiotherapy in adults: a report from the European Association of Cardiovascular Imaging and the American Society of Echocardiography. J Am Soc Echocardiogr. 2013;26:1013-1032.
Cancer survivors represent a rapidly increasing population. In 1971, there were 3 million cancer survivors; this number increased to 15.5 million in 2016 and will reach 20 million by 2026.1TABLE 11 shows the percentage of survivors by type of cancer. Cancer survivors tend to be older,* comprising nearly 1 of every 5 people older than 65 years.2
The Institute of Medicine (IOM) identified 3 key characteristics of cancer survivors3:
- Trajectories of survivorship are variable; many cancer patients have periods of relative health between episodes of their disease.
- Survivors require careful cancer monitoring; in addition to the risk that their primary cancer will recur, they have an elevated risk for another, second cancer.
- Both cancer and its treatments increase the risk of other medical and psychiatric problems.
Family physicians (FPs) have optimal skills for navigating the chronic risks and health concerns of the well cancer survivor. This article reviews the primary care management of the functional cancer survivor, focusing on the management of chronic conditions and preventive care.
Survivorship follows any of 6 paths
Cancer survivorship is increasing in importance as treatment has steadily reduced mortality. Six trajectories of cancer survivors have been identified1:
- living cancer-free after treatment with minimal effects
- living cancer-free but suffering serious treatment complications
- Suffering late recurrence
- Developing a second cancer
- Living with intermittent cancer recurrences
- Living with cancer continuously.
Only patients in the last 2 groups are likely to be managed primarily by oncologists.
Survivors look to their FPs for ongoing care
Cancer survivors routinely see their primary care physician after initial treatment. A study of 30,000 Canadian breast cancer survivors demonstrated that follow-up care was limited to an oncologist in only 2%; 84% saw a primary care provider and an oncologist; and 14% saw a primary care provider only.4 A study of colorectal cancer survivors showed that primary care visits increased in each of the 5 years after diagnosis, during which time oncology visits decreased steadily5; in that study, primary care physicians delivered more preventive care than oncologists did.5 Similar to what is done in other chronic conditions, the various effects of cancer are best managed as a whole.
The IOM recommends that cancer survivor care comprise 4 elements2:
- coordination between oncologist and primary care physician
- surveillance for recurrence or spread of existing cancer
- screening for new cancer
- intervention for the effects of cancer and treatment.
Continue to: The following discussion summarizes...
The following discussion summarizes evidence and recommendations for each element of the IOM recommendations for survivor care.
Implementing the 4 elements of cancer survivor care
1. Coordinate care through a unified survivorship care plan
The IOM has noted that the needs of cancer survivors are rarely met2; communication between oncology and primary care is often deficient during transition of care. The IOM has recommended that oncologists provide a survivorship care plan that details the cancer (ie, tumor characteristics), the type of treatment (ie, enrollment in a clinical trial; medical, surgical, or radiation), support services, and follow-up recommendations for the primary care provider. (Examples of elements of a survivorship care plan can be found at www.mskcc.org/hcp-education-training/survivorship/survivorship-care-plan6 and http://sma.org/southern-medical-journal/article/cancer-survivors-history-physical/7).
Regrettably, survivorship care plans have been rarely and poorly employed. Studies show that fewer than one-half of oncologists provide a plan, and that when they do, the plan often lacks recommended information.8,9 Survivorship care plans may soon become common practice, however; the Commission on Cancer of the American College of Surgeons has required their use in all certified cancer centers since 2015.10
2. Provide surveillance of existing cancer
Cancer follow-up is challenging after the initial treatment phase. Although there are many conflicting guidelines for surveillance after cancer, guidelines of the National Comprehensive Cancer Network (NCCN) (summarized in TABLE 211 for the 10 most common cancers in survivors) are the ones generally accepted.12,13
Although individual surveillance recommendations are based on limited evidence, studies confirm the importance of surveillance. A systematic review showed that surveillance mammography after breast cancer reduces breast cancer mortality by 36%.14 A study showed that bladder cancer recurrence diagnosed by surveillance instead of by symptoms led to a 35% increase in 5-year survival.15
Continue to: Yet adherence to cancer surveillance...
Yet adherence to cancer surveillance recommendations is poor. A study of patients with colon cancer demonstrated that only 12% met all recommended surveillance guidelines.16 A study of patients with bladder cancer after radical cystectomy showed that only 9% met recommended surveillance more than 2 years after diagnosis.17 Those dismal statistics may be the result of provider oversight—not patient reluctance.
In the colon cancer study, for example, compliance with follow-up colonoscopy was 80% but compliance with carcinoembryonic antigen testing was only 22%.16 In the bladder cancer study, follow-up urine cytology was obtained in only 23% of patients, although 75% completed recommended imaging.17
Although surveillance remains the oncologist’s responsibility, visits to the FP provide an opportunity to review surveillance and order needed laboratory testing and other studies, including imaging.
3. Screen for new cancers
The risk of a second cancer is elevated for cancer survivors compared with the risk of a primary cancer in the healthy general population; some survivors have a lifetime risk of a second cancer as high as 36%.18 Risk varies by cancer type (TABLE 319). Some of this variation is due to the impact of smoking: Smoking-related cancers have the highest risk of second malignancy.19 Genetic predisposition to malignant transformation is also theorized to contribute to increased risk. Second malignancies are dangerous; 55% of patients die of the second cancer compared with only 13% of their initial cancer.19
Studies show that cancer survivors display varying adherence with recommended screening for second cancers. In a study of Latina cancer survivors, depressive symptoms were associated with lower screening compliance.20 A study of survivors of hematologic cancer showed a low rate of cancer screening and high fear of cancer recurrence—suggesting avoidance due to fear.21 Other studies, however, show similar or increased compliance with screening in cancer survivors.22,23 A meta-analysis of 19 studies determined that, overall, cancer survivors receive 25% to 38% more recommended screening than the general population.24
Continue to: Few guidelines exist to guide FPs...
Few guidelines exist to guide FPs in adjusting screening for the cancer survivor. For women who received radiation therapy for a tumor in the chest, for example, the recommendation offered by several groups is to start breast cancer screening 8 to 10 years after treatment or by 30 years of age, and to consider combining magnetic resonance imaging and mammography.25 Recommendations for breast cancer screening do not account for a history of other gynecologic cancers unless genetic markers are present.25 On the other hand, the impact of a history of cancer on the risk of prostate cancer and on screening decisions has not been studied,26 and cervical cancer screening guidelines, which recommend that screening continue after 65 years of age for patients who are immunocompromised, do not address a history of other cancer.27
4. Manage the effects of both the cancer and the treatment
Medical issues faced by cancer survivors are familiar to FPs, but there are some specific recommendations regarding evaluation and treatment that stand in contrast to what would be considered for a healthy, or non-cancer, patient. For example, each chemotherapeutic agent has characteristic adverse effects; TABLE 47 lists the principal adverse effects of common agents and recommendations for testing when these problems develop. Common long-term problems in cancer survivors include fatigue, chronic pain, cognitive dysfunction, psychiatric illness, and cardiovascular disease. Although these symptoms and manifestations are common, the physician must be careful: New or changing symptoms could signal the spread or recurrence of disease. Fear of recurrence can lead patients to exaggerate or minimize symptoms.
Fatigue is the most common symptom seen in cancer survivors during treatment and following remission.28 More than 40% of cancer survivors report significant fatigue.29 Although fatigue is concerning for cancer recurrence, other causes are common in cancer survivors. Both depression and anxiety commonly present with worsened fatigue.30 Sleep disturbances are common, even without a psychiatric diagnosis.31 Effects of treatment, including nausea, anemia, heart failure, and medication adverse effects can cause or worsen fatigue. Pain is associated with fatigue, but to a lesser extent than are depression, anxiety, and nausea.32
Pharmacotherapy of cancer-related fatigue is challenging. Psychostimulants have been most studied. A recent systematic review shows that methylphenidate produces mild or moderate improvement in fatigue, whereas modafanil has minimal effectiveness.33 Antidepressants have not been shown to relieve fatigue.33
A recent meta-analysis showed that nonpharmaceutical treatments for cancer-related fatigue are more effective than pharmacotherapy. In this review, both exercise and pharmacotherapy had a mild-to-moderate effect on fatigue.35 Exercise is best studied in this regard, and has shown the most consistent results.31
Continue to: Chronic pain
Chronic pain. Pain is common in cancer survivors: As many as 40% experience pain for years after initial therapy.36 Treatment of some cancers—eg, thoracotomy (80%), amputation (50%-80%), neck dissection (52%), and surgical management of breast cancer (63%)—increase the likelihood of chronic pain.37 Reports of pain in cancer survivors that should be considered red flags that might signal recurrence of cancer include new or worsening pain; pain worse at night or when recumbent; new neurologic symptoms; and general symptoms of systemic illness37 (TABLE 537).
Management of pain is best approached by its cause, with neurologic, rheumatologic (including myofascial pain and arthralgia), lymphatic, and genital causes most common.37 Across all types of pain, complete relief is unlikely; functional goals provide a more effective target.
For neuropathic cancer pain, duloxetine is the only medication with evidence of benefit; anticonvulsant and topical medications are recommended on the basis of the findings of studies of noncancer pain.38 There are few data on the value of treatments for cancer-related rheumatologic and lymphatic pain, although exercise has shown benefit in both types.38 For dyspareunia and sexual dysfunction (common after gynecologic and nongynecologic cancers), vaginal lubricants and pelvic-floor physiotherapy have shown benefit.39 There is significant overlap in psychiatric comorbidities, sleep, and pain, and addressing all of a patient’s problems can reduce pain and improve function.40
Opioids are often prescribed for pain in cancer survivors. Cancer survivors have a higher rate of opioid prescribing compared with that of non-cancer patients, even 10 years after diagnosis.41 Guidelines of the Centers for Disease Control and Prevention for using opioids to manage chronic pain specifically exclude cancer patients.42 Regrettably, there is no evidence that opioids have long-term efficacy in chronic pain; in fact, evidence is accumulating that chronic opioid therapy exacerbates chronic pain.43
Cognitive dysfunction is present in 17% to 75% of cancer survivors as memory disturbance, psychological disorder, sleep dysfunction, or impairment of executive functioning.44 Cognitive deficits appear to be secondary to both cancer and treatment modalities45; as many as one-third of patients have cognitive dysfunction prior to receiving chemotherapy.46
Continue to: Chemotherapies that are more likely...
Chemotherapies that are more likely to cause cognitive symptoms include methotrexate, 5-fluorouracil, cyclophosphamide, and hormone antagonists.47 More powerful regimens and repetitive chemotherapy regimens tend to cause more cognitive effects.47
Cognitive training interventions show evidence of likely benefit,44,48 leading to recommendations for self-treatment strategies, such as written lists, wordplay, crossword puzzles, jigsaw puzzles, playing a musical instrument, and new hobbies. Small studies suggest a benefit from cognitive behavioral therapy.44,49 A study of breast cancer survivors showed that yoga led to improvement in patient-reported cognitive dysfunction.50 Physical exercise yields cognitive benefit in healthy older adults and is supported by limited evidence in cancer survivors.51
There is no effective pharmacotherapy for cancer- and cancer chemotherapy-related cognitive dysfunction unless a treatable underlying cause is found.44 Symptoms tend to subside with time after completion of chemotherapy, which might be reassuring to patients and families.45
Psychiatric problems. The most common psychiatric issues in cancer survivors are anxiety and depression; the prevalence of anxiety is nearly double that of depression.52 Anxiety often presents as fear of a recurrence of cancer or a feeling of lack of control over present or future circumstances.53 Screening for anxiety and depression is recommended at each visit, using standardized screening questionnaires.54
A small study suggests that psychiatric treatment reduces the risk of early mortality.55 Small studies also suggest that mindfulness-based therapy and cognitive behavioral therapy delivered by telehealth offer benefit.56 A meta-analysis shows that exercise interventions improve depression and anxiety in breast cancer patients.57
Continue to: There are few studies of pharmacotherapy...
There are few studies of pharmacotherapy of anxiety or depression in cancer survivors56; it is known that cancer survivors are nearly twice as likely as the general population to be taking medical therapy for anxiety and depression.58 A Cochrane systematic review of 7 small studies showed uncertain improvement in depressive symptoms in patients with cancer from antidepressant medication; however, an earlier systematic review did show benefit.59,60
In a trial of patients without depression who were being treated for head and neck cancer, escitalopram, 20 mg/d, reduced the risk of subsequent depression compared with placebo.61 A study of 420 breast cancer survivors showed that 300 mg/d and 900 mg/d dosages of gabapentin were both superior to placebo, and nearly equivalent to each other, at reducing anxiety scores.62 In both studies, however, the evidence is nonetheless insufficient to make specific recommendations about these medications.
Cardiac risk
Among chemotherapeutic agents, anthracyclines, such as doxorubicin, cause the most rapid and striking myocyte damage. This damage is dose-dependent and nearly irreversible, with 98% of injury occurring within the first year of chemotherapy.64 More than one half of cancer patients taking an anthracycline have cardiac dysfunction on imaging; 5% will be in overt heart failure 10 to 20 years, or longer, after chemotherapy.63 Following monitoring at 1 year post-therapy, regular cardiac imaging is not recommended in the absence of symptoms.62
Because other cardiotoxic chemotherapeutic agents cause partially reversible damage, imaging is not recommended in the absence of symptoms in patients taking those agents.64
Continue to: Radiation therapy to the chest leads...
Radiation therapy to the chest leads to many cardiac complications, including cardiomyopathy, valvular disease, pericardial disease, and arrhythmias. Development of cardiomyopathy can be delayed 20 to 30 years after radiation; screening echocardiography is therefore recommended every 5 to 10 years after radiation therapy.65 Recent adjustments to the dosages and delivery of radiation therapy should reduce cardiac damage, but will require decades to validate.63
For patients at risk of cardiovascular disease prior to treatment of cancer, there is evidence to support preventive treatment with angiotensin II-receptor antagonists, beta-blockers, and statins to prevent cardiomyopathy.63 Treatment of diagnosed cardiomyopathy and heart failure follows standard guidelines, with significant emphasis on aerobic exercise and smoking cessation.63
Cancer survivorship care: Your critical role
Cancer survivors constitute a large population who frequent the practices of primary care physicians. Primary care visits provide an opportunity to monitor key elements of survivorship, including surveillance of the current cancer and screening for second cancers. Similar to what is seen with diabetes and coronary artery disease, cancer increases cardiac risk, which requires preventive care and chronic management. FPs are well placed to treat common issues in cancer survivors—issues that mirror concerns seen in the general population.
CORRESPONDENCE
Michael J. Arnold, MD, CDR, USN, Uniformed Services University of the Health Sciences, 4301 Jones Bridge Road, Bethesda, MD 20814; michael.arnold@usuhs.edu.
ACKNOWLEDGEMENT
Kristian Sanchack, MD, and James Higgins, DO, assisted with the editing of the manuscript.
1. American Cancer Society. Cancer Treatment & Survivorship Facts & Figures 2016-2017. Atlanta, GA: American Cancer Society; 2016. www.cancer.org/research/cancer-facts-statistics/survivor-facts-figures.html. Accessed July 25, 2018.
2. Survivorship. NCCN Guidelines (version 1.2017). Fort Washington, PA: National Comprehensive Cancer Network; 2017. www.nccn.org/professionals/physician_gls/default.aspx#supportive. Accessed July 26, 2018.
3. Kendall C, Decker KM, Groome PA, et al. Use of physician services during the survivorship phase: a multi-province study of women diagnosed with breast cancer. Curr Oncolog. 2017;24:81-89.
4. Snyder CF, Earle CC, Herbert RJ, et al. Preventive care for colorectal cancer survivors: a 5-year longitudinal study. J Clin Oncol. 2008;26:1073-1079.
5. Hewitt M, Greenfield S, Stovall E (eds); Institute of Medicine and National Research Council. From Cancer Patient to Cancer Survivor: Lost in Transition. Washington DC: The National Academies Press; 2006. www.nap.edu/read/11468/chapter/1. Accessed July 25, 2018.
6. Survivorship care plan. New York, NY: Memorial Sloan Kettering Cancer Center. www.mskcc.org/hcp-education-training/survivorship/survivorship-care-plan. Accessed August 11, 2018.
7. Fuentes AC, Lambird JE, George TJ, et al. Cancer survivor’s history and physical. South Med J. 2017;110:37-44. http://sma.org/southern-medical-journal/article/cancer-survivors-history-physical/. Accessed July 26, 2018.
8. Salz T, Oeffinger KC, McCabe MS, et al. Survivorship care plans in research and practice. CA Cancer J Clin. 2012;62:101-117.
9. Birken SA, Mayer DK, Weiner BJ. Survivorship care plans: prevalence and barriers to use. J Cancer Educ. 2013;28:290-296.
10. American College of Surgeons Commission on Cancer. Cancer program standards 2012: Ensuring patient-centered care. V1.2.1. www.facs.org/~/media/files/quality%20programs/cancer/coc/programstandards2012.ashx. Accessed July 25, 2018.
11. NCCN guidelines for treatment of cancer by site. NCCN Guidelines (version 1.2018). Fort Washington, PA: National Comprehensive Cancer Network; 2018. www.nccn.org/professionals/physician_gls/default.aspx#site. Accessed July 25, 2018.
12. Spronka I, Korevaar JC, Burgers JS, et al. Review of guidance on recurrence risk management for general practitioners in breast cancer, colorectal cancer and melanoma guidelines. Family Pract. 2017;34:154-160.
13. Merkow RP, Korenstein D, Yeahia R, et al. Quality of cancer surveillance clinical practice guidelines: specificity and consistency of recommendations. JAMA Intern Med. 2017;177:701-709.
14. Muradali D, Kennedy EB, Eisen A, et al. Breast screening for survivors of breast cancer: a systematic review. Prev Med. 2017;103:70-75.
15. Giannarini G, Kessler TM, Thoeny HC, et al. Do patients benefit from routine follow-up to detect recurrences after radical cystectomy and ileal orthotopic bladder substitution? Eur Urol. 2010;58:486-494.
16. Sisler JJ, Seo B, Katz A, et al. Concordance with ASCO guidelines for surveillance after colorectal cancer treatment: a population-based analysis. J Oncol Pract. 2012;8:e69-e79.
17. Ehdaie B. Atoria CL, Lowrance WT, et al. Adherence to surveillance guidelines after radical cystectomy: a population-based analysis. Urol Oncol. 2014;32:779-784.
18. Travis LB, Fosså SD, Schonfeld SJ, et al. Second cancers among 40,576 testicular cancer patients: focus on long-term survivors. J Natl Cancer Inst. 2005;97:1354-1365.
19. Donin N, Filson C, Drakaki A, et al. Risk of second primary malignancies among cancer survivors in the United States, 1992 through 2008. Cancer. 2016;122:3075-3086.
20. Holder AE, Ramirez AG, Gallion K. Depressive symptoms in Latina breast cancer survivors: a barrier to cancer screening. Health Psycholog. 2014;33:242-248.
21. Dyer G, Larsen SR, Gilroy N, et al. Adherence to cancer screening guidelines in Australian survivors of allogenic blood and marrow transplantation (BMT). Cancer Med. 2016;5:1702-1716.
22. Mandelzweig L, Chetrit A, Amitai T, et al. Primary prevention and screening practices among long-term breast cancer survivors. Cancer Causes Control. 2017;28:657-666.
23. Bishop MM, Lee SJ, Beaumont JL, et al. The preventive health behaviors of long-term survivors of cancer and hematopoietic stem cell transplantation compared with matched controls. Biol Blood Marrow Transplant. 2010;16:207-214.
24. Uhlig A, Mei J, Baik I, et al. Screening utilization among cancer survivors: a meta-analysis. J Public Health (Oxf). 2018;40:129-137.
25. Hilal T, Rudy DW. Radiation-induced breast cancer: the question of early breast cancer screening in Hodgkin’s lymphoma survivors. Oxf Med Case Reports. 2016;2016:17-18.
26. Lin K, Croswell JM, Koenig H, et al. Prostate-specific antigen-based screening for prostate cancer: an evidence update for the U.S. Preventive Services Task Force [Internet]. Evidence Syntheses No. 90. AHRQ Publication No. 12-05160-EF-1. Rockville, MD: Agency for Healthcare Research and Quality (US); October 2011. www.ncbi.nlm.nih.gov/pubmedhealth/PMH0032900/. Accessed July 25, 2018.
27. US Preventive Services Task Force. Screening for cervical cancer: U.S. Preventive Services Task Force recommendation statement. JAMA. 2018;320:674-686.
28. Hofman M, Ryan JL, Figueroa-Moseley CD, et al. Cancer-related fatigue: the scale of the problem. Oncologist. 2007;12 Suppl 1:4-10.
29. Jung JY, Lee JM, Kim MS, et al. Comparison of fatigue, depression, and anxiety as factors affecting posttreatment health-related quality of life in lung cancer survivors. Psychooncology. 2018;27:465-470.
30. Bower JE. Cancer-related fatigue--mechanisms, risk factors, and treatment. Nat Rev Clin Oncol. 2014;11:597-609.
31. Medysky ME, Temesi J, Culos-Reed SN, et al. Exercise, sleep and cancer-related fatigue: are they related? Neurophysiol Clin. 2017;47:111-122.
32. Oh HS, Sea WS. Systematic review and meta-analysis of the correlates of cancer-related fatigue. Worldviews Evid Based Nurs. 2011;8:191-201.
33. Qu D, Zhang Z, Yu X, et al. Psychotropic drugs for the management of cancer-related fatigue: a systematic review and meta-analysis. Eur J Cancer Care (Engl). 2016;25:970-979.
34. Escalante CP, Manzullo EF. Cancer-related fatigue: the approach and treatment. J Gen Intern Med. 2009;24(suppl 2):S412-S416.
35. Mustian KM, Alfano CM, Heckler C, et al. Comparison of pharmaceutical, psychological, and exercise treatments for cancer-related fatigue: a meta-analysis. JAMA Oncol. 2017;3:961-968.
36. Glare PA, Davies PS, Finlay E, et al. Pain in cancer survivors. J Clin Oncol. 2014;32:1739-1747.
37. Davies PS. Chronic pain management in the cancer survivor: tips for primary care providers. Nurse Pract. 2013;39:28-38.
38. Boland EG, Ahmedzai SH. Persistent pain in cancer survivors. Curr Opin Support Palliat Care. 2017;11:181-190.
39. Sears CS, Robinson JW, Walker LM. A comprehensive review of sexual health concerns after cancer treatment and the biopsychosocial treatment options available to female patients. Eur J Cancer Care (Engl). 2017;27:e12738.
40. Schou Bredal I, Smeby NA, Ottesen S, et al. Chronic pain in breast cancer survivors: comparison of psychological, surgical, and medical characteristics between survivors with and without pain. J Pain Symptom Manage. 2014;48:852-862.
41. Sutradhar R, Lokku A, Barbera L. Cancer survivorship and opioid prescribing rates: a population-based matched cohort study among individuals with and without a history of cancer. Cancer. 2017;123:4286-4293.
42. Dowell D, Haegerich TM, Chou R. CDC guideline for prescribing opioids for chronic pain - United States, 2016. MMWR Recomm Rep. 2016;65:1-49.
43. Davis MP, Mehta Z. Opioids and chronic pain: where is the balance? Curr Oncol Rep. 2016;18:71.
44. Von Ah D. Cognitive changes associated with cancer and cancer treatment: state of the science. Clin J Oncol Nurs. 2015;19:47-56.
45. Moore HC. An overview of chemotherapy-related cognitive dysfunction, or ‘chemobrain’. Oncology (Williston Park). 2014;28:797-804.
46. Asher A. Cognitive dysfunction among cancer survivors. Am J Phys Med Rehabil. 2011;90(suppl):S16-S26.
47. Joly F, Rigal O, Noal S, et al. Cognitive dysfunction and cancer: which consequences in terms of disease management? Psychooncology. 2011;20:1251-1258.
48. Attention, thinking or memory problems. American Society of Clinical Oncology Cancer.Net. April 2018. www.cancer.net/navigating-cancer-care/side-effects/attention-thinking-or-memory-problems. Accessed July 25, 2018.
49. Kucherer S, Ferguson RJ. Cognitive behavioral therapy for cancer-related cognitive dysfunction. Curr Opin Support Palliat Care. 2017;11:46-51.
50. Derry HM, Jaremka LM, Bennet JM, et al. Yoga and self-reported cognitive problems in breast cancer survivors: a randomized controlled trial. Psychooncology. 2015;24:958-966.
51. Treanor CJ, McMenamin UC, O’Neill RF, et al. Non-pharmacological interventions for cognitive impairment due to systemic cancer treatment. Cochrane Database Syst Rev. 2016 Aug 16;(8):CD011325.
52. Mitchell AJ, Ferguson DW, Gill J, et al. Depression and anxiety in long-term cancer survivors compared with spouses and healthy controls: a systematic review and meta-analysis. Lancet Oncol. 2013;14:721-732.
53. Inhestern L, Beierlein V, Bultmann JC, et al. Anxiety and depression in working-age cancer survivors: a register-based study. BMC Cancer. 2017;17:347.
54. Partridge AH, Jacobsen PB, Andersen BL. Challenges to standardizing the care for adult cancer survivors: highlighting ASCO’s fatigue and anxiety and depression guidelines. Am Soc Clin Oncol Educ Book. 2015:188-194.
55. Andersen BL, Yang HC, Farrar WB, et al. Psychologic intervention improves survival for breast cancer patients: a randomized clinical trial. Cancer. 2008;113:3450-3458.
56. Yi JC, Syrjala KL. Anxiety and depression in cancer survivors. Med Clin N Am. 2017;101:1099-1113.
57. Zhu G, Zhang X, Wang Y, et al. Effects of exercise intervention in breast cancer survivors: a meta-analysis of 33 randomized controlled trials. Onco Targets Ther. 2016;9:2153-2168.
58. Hawkins NA, Soman A, Lunsford N, et al. Use of medications for treating anxiety and depression in cancer survivors in the United States. J Clin Oncol. 2017;35:78-85.
59. Ostuzzi G, Matcham F, Dauchy S, et al. Antidepressants for the treatment of depression in people with cancer. Cochrane Database Syst Rev. 2015 June 1;(6):CD011006.
60. Laoutidis ZG, Mathiak K. Antidepressants in the treatment of depression/depressive symptoms in cancer patients: a systematic review and meta-analysis. BMC Psychiatry. 2013;13:140.
61. Lydiatt WM, Bessette D, Schmid KK, et al. Prevention of depression with escitalopram in patients undergoing treatment for head and neck cancer: randomized, double-blind, placebo-controlled clinical trial. JAMA Otolaryngol Head Neck Surg. 2013;139:678-686.
62. Lavigne JE, Heckler C, Mathews JL, et al. A randomized, controlled, double-blinded clinical trial of gabapentin 300 versus 900 mg versus placebo for anxiety symptoms in breast cancer survivors. Breast Cancer Res Treat. 2012;136:479-486.
63. Okwuosa TM, Anzevino S, Rao R. Cardiovascular disease in cancer survivors. Postgrad Med J. 2017;93:82-90.
64. Plana, JC, Galderisi M, Barac A, et al. Expert consensus for multimodality imaging evaluation of adult patients during and after cancer therapy: a report from the American Society of Echocardiography and the European Association of Cardiovascular Imaging. J Am Soc Echocardiogr. 2014;27:911-939.
65. Lancellotti, P, Nkomo VT, Badano LP, et al. Expert consensus for multi-modality imaging evaluation of cardiovascular complications of radiotherapy in adults: a report from the European Association of Cardiovascular Imaging and the American Society of Echocardiography. J Am Soc Echocardiogr. 2013;26:1013-1032.
PRACTICE RECOMMENDATIONS
› Provide normal age-related cancer screening for cancer survivors because of their high risk of a second cancer. B
› Strongly encourage lifestyle changes for cancer survivors, especially smoking cessation. B
› Recommend exercise, which alleviates pain, depression, anxiety, and (more effectively than any other intervention) fatigue, for cancer survivors. B
› Remain vigilant for the development in cancer survivors of cardiovascular disease, including heart failure, which can appear long after therapy. B
Strength of recommendation (SOR)
A Good-quality patient-oriented evidence
B Inconsistent or limited-quality patient-oriented evidence
C Consensus, usual practice, opinion, disease-oriented evidence, case series
*Cancer survivor care in the pediatric patients, including application of a survivorship care plan (also discussed later in this article), is reviewed in “Partnering to optimize care of childhood cancer survivors,” The Journal of Family Practice, April 2017.

Sustainability of Ambulatory Safety Event Reporting Improvement After Intervention Discontinuation
From Novant Health and Novant Health Medical Group, Winston-Salem, NC (Dr. C
Abstract
- Objective: An educational intervention stressing anonymous, voluntary safety event reporting together with monthly regular audit and feedback led to significantly increased reporting of safety events in a nonacademic, community practice setting during a 15-month intervention period. We assessed whether these increased reporting rates would be sustained during the 30-month period after the intervention was discontinued.
- Methods: We reviewed all patient safety events reported in our ambulatory clinics for the period 2012–2016, and selected 6 clinics that comprised the intervention collaborative and 18 specialty- and size-matched clinics (1:3 match) that comprised the comparator group. To test the changes in safety event reporting (SER) rates between the intervention and postintervention periods for the intervention collaborative, interrupted time series analysis with a control group was performed.
- Results: The SER rate peaked in the first month following the start of the intervention. Following discontinuation of regular auditing and feedback, reporting rates declined abruptly and reverted to baseline by 16 months post intervention.
- Conclusion: It is likely that sustaining enhanced reporting rates requires ongoing audit and feedback to maintain a focus on event reporting.
Keywords: patient safety; safety event reporting; voluntary reporting system; risk management; ambulatory clinic.
We have previously shown that patient safety reporting rates for a 6-practice collaborative group in our non-academic community clinics increased 10-fold after we implemented an improvement initiative consisting of an initial education session followed by provision of monthly audit and written and in-person feedback [1]. The intervention was implemented for 15 months, and after discontinuation of the intervention we have continued to monitor reporting rates. Our objective was to assess whether the increased reporting rates observed in this collaborative during the intervention period would be sustained for 30 months following the intervention.
Methods
This study’s methods have been described in detail previously [1]. For this improvement initiative, we reviewed all patient safety events reported in our ambulatory clinics for the period 2012–2016. We identified 6 clinics, the intervention collaborative, in family medicine (n = 3), pediatrics (n = 2), and general surgery (n = 1), and 18 specialty- and size-matched clinics (1:3 match), the comparator group [1]. For the intervention collaborative only, we provided an initial 1-hour educational session on safety events with a listing of all safety event types, along with a 1-page reporting form for voluntary, anonymous submission, with use of the term “safety event” rather than “ error,” to support a nonpunitive culture. After the educational session, we provided monthly audit and written and in-person feedback with peer comparison data by clinic. Monthly audit and feedback continued throughout the intervention and was discontinued postintervention. For event reporting, in our inpatient and outpatient facilities we used VIncident (Verge Solutions, Mt. Pleasant, SC) for the period 2012–2015 and RL6: Risk (RL Solutions, Toronto, ON) for 2016.
The baseline period was 15 months (January 2012–March 2013), the intervention period was 15 months (April 2013–June 2014), and the postintervention period was 30 months (July 2014–December 2016). All 24 clinics were monitored for the 60-month period.
To test the changes in the rate of safety event reporting (SER) between the pre-intervention and postintervention periods and between the intervention and the postintervention periods, interrupted time series (ITS) analysis with a control group was performed using PROC AUTOREG in SAS Enterprise Guide 6.1 (SAS Institute Inc., Cary, NC). Because SER rates are reported monthly, ITS analysis was used to control for autocorrelation, nonstationary variance, seasonality, and trends [2,3].
Results
The SER rate was assessed monthly, so the number of SER rates for each group (intervention and comparator) was 15 during the pre-intervention and intervention periods, respectively, and 30 during the postintervention period. During the pre-intervention period, the intervention collaborative’s baseline median rate of safety events reported was 1.5 per 10,000 patient encounters (Figure). Also, for the intervention collaborative, the pre-intervention baseline mean (standard deviation, SD) SER rate (per 10,000 patient encounters by month) was 1.3 (1.2), the intervention mean SER rate was 12.0 (7.3), and the postintervention rate was 3.2 (1.8). Based on the ITS analysis, there was a significant change in the SER rate between the intervention and postintervention periods for the intervention collaborative (P = 0.01).
.")
The SER rate peaked in the first month following the start of the intervention. After discontinuation of feedback, reporting rates declined abruptly and reverted to baseline by 16 months post intervention (Figure). The postintervention SER rate was also significantly higher than the pre-intervention rate (P = 0.001).
For the comparator clinics, no significant change in SER rates occurred for the 3 time periods.
Discussion
In this initiative with a 5-year reporting window, we had previously shown that with education and prospective audit and feedback, we could achieve a 10-fold increase in patient SER rates among a multi-practice collaborative while the intervention was maintained [1]. Even though there was a modest but significant increase in the SER rate in the postintervention period for the 6-clinic intervention collaborative compared to baseline, the substantial gains seen during the course of the intervention were not maintained when monthly audit and feedback ceased and monitoring continued for 30 months.
Limitations of this study include possible selection bias resulting from including clinics felt likely to participate rather than identifying clinics in a random fashion. In addition, we did not attempt to determine the specific reasons for the decrease in reporting among these clinics.
The few studies of ambulatory SER do not adequately address the effect of intervention cessation, but researchers who implemented other ambulatory quality improvement efforts have reported that gains often deteriorate or revert to baseline without consistent, ongoing feedback [4]. Likewise, in hospital-based residency programs, a multifaceted approach that includes feedback can increase SER rates, but it is uncertain if the success of this approach can be maintained long-term without continuing feedback of some type [5–7].
There are likely many factors influencing SER in ambulatory clinics, many of which are also applicable in the hospital setting. These include ease of reporting, knowing what events to report, confidentiality of reporting, and the belief that reporting makes a difference in enhancing patient safety [8]. A strong culture of safety in ambulatory clinics may lead to enhanced voluntary SER [9], and a nonpunitive, team-based approach has been advocated to promote reporting and improve ambulatory safety [10]. Historically, our ambulatory medical group clinics have had a strong culture of safety and, with patient safety coaches present in all of our clinics, we have supported a nonpunitive, team-based approach to SER [11].
In our intervention, we made reporting safety events easy, reporters knew which events to report, events could be reported anonymously, and reporters were rewarded, at least with data feedback, for reporting. The only factor known to have changed was discontinuation of monthly feedback. Which factors are most important could not be determined by our work, but we strongly suspect that sustaining enhanced reporting rates requires ongoing audit and feedback to maintain a focus on event reporting.
Corresponding author: Herbert Clegg, MD, 108 Providence Road, Charlotte NC, 28207, hwclegg@novanthealth.org.
Financial disclosures: None.
1. Clegg HW, Cardwell T, West AM, Ferrell F. Improved safety event reporting in outpatient, nonacademic practices with an anonymous, nonpunitive approach. J Clin Outcomes Manag 2015;22:66–72.
2. Newland JG, Stach LM, De Lurgio SA, et al. Impact of a prospective-audit-with-feedback antimicrobial stewardship program at a children’s hospital. J Pediatric Infect Dis Soc 2012; 1:179–86.
3. Penfold RB, Zhang F. Use of interrupted time series analysis in evaluating health care quality improvements. Acad Pediatr 2013;13 (6 Suppl):S38–44.
4. Gerber JS, Prasad PA, Fiks AG, et al. Durability of benefits of an outpatient antimicrobial stewardship intervention after discontinuation of audit and feedback. JAMA 2014;312:2569–70.
5. Steen S, Jaeger C, Price L, Griffen D. Increasing patient safety event reporting in an emergency medicine residency. BMJ Qual Improv Rep 2017;6(1).
6. Fox M, Bump G, Butler G, et al. Making residents part of the safety culture: improving error reporting and reducing harms. J Patient Saf 2017. [Epub ahead of print]
7. Dunbar AE 3rd, Cupit M, Vath RJ, et al. An improvement approach to integrate teaching teams in the reporting of safety events. Pediatrics 2017;139:e20153807.
8. Institute of Medicine. To err is human: Building a safer health system. National Academies. www.nationalacademies.org/hmd/~/media/Files/Report%20Files/1999/To-Err-is-Human/To%20Err%20is%20Human%201999%20%20report%20brief.pdf Published November 1999. Accessed August 22, 2018.
9. Miller N, Bhowmik S, Ezinwa M, et al. The relationship between safety culture and voluntary event reporting in a large regional ambulatory care group. J Patient Saf 2017. [Epub ahead of print]
10. Neuspiel DR, Stubbs EH. Patient safety in ambulatory care. Pediatr Clin North Am 2012;59:1341–54.
11. West AM, Cardwell T, Clegg HW. Improving patient safety culture through patient safety coaches in the ambulatory setting. Presented at: Institute for Healthcare Improvement Annual Summit on Improving Patient Care in the Office Practice and the Community; March 2015; Dallas, Texas.
From Novant Health and Novant Health Medical Group, Winston-Salem, NC (Dr. C
Abstract
- Objective: An educational intervention stressing anonymous, voluntary safety event reporting together with monthly regular audit and feedback led to significantly increased reporting of safety events in a nonacademic, community practice setting during a 15-month intervention period. We assessed whether these increased reporting rates would be sustained during the 30-month period after the intervention was discontinued.
- Methods: We reviewed all patient safety events reported in our ambulatory clinics for the period 2012–2016, and selected 6 clinics that comprised the intervention collaborative and 18 specialty- and size-matched clinics (1:3 match) that comprised the comparator group. To test the changes in safety event reporting (SER) rates between the intervention and postintervention periods for the intervention collaborative, interrupted time series analysis with a control group was performed.
- Results: The SER rate peaked in the first month following the start of the intervention. Following discontinuation of regular auditing and feedback, reporting rates declined abruptly and reverted to baseline by 16 months post intervention.
- Conclusion: It is likely that sustaining enhanced reporting rates requires ongoing audit and feedback to maintain a focus on event reporting.
Keywords: patient safety; safety event reporting; voluntary reporting system; risk management; ambulatory clinic.
We have previously shown that patient safety reporting rates for a 6-practice collaborative group in our non-academic community clinics increased 10-fold after we implemented an improvement initiative consisting of an initial education session followed by provision of monthly audit and written and in-person feedback [1]. The intervention was implemented for 15 months, and after discontinuation of the intervention we have continued to monitor reporting rates. Our objective was to assess whether the increased reporting rates observed in this collaborative during the intervention period would be sustained for 30 months following the intervention.
Methods
This study’s methods have been described in detail previously [1]. For this improvement initiative, we reviewed all patient safety events reported in our ambulatory clinics for the period 2012–2016. We identified 6 clinics, the intervention collaborative, in family medicine (n = 3), pediatrics (n = 2), and general surgery (n = 1), and 18 specialty- and size-matched clinics (1:3 match), the comparator group [1]. For the intervention collaborative only, we provided an initial 1-hour educational session on safety events with a listing of all safety event types, along with a 1-page reporting form for voluntary, anonymous submission, with use of the term “safety event” rather than “ error,” to support a nonpunitive culture. After the educational session, we provided monthly audit and written and in-person feedback with peer comparison data by clinic. Monthly audit and feedback continued throughout the intervention and was discontinued postintervention. For event reporting, in our inpatient and outpatient facilities we used VIncident (Verge Solutions, Mt. Pleasant, SC) for the period 2012–2015 and RL6: Risk (RL Solutions, Toronto, ON) for 2016.
The baseline period was 15 months (January 2012–March 2013), the intervention period was 15 months (April 2013–June 2014), and the postintervention period was 30 months (July 2014–December 2016). All 24 clinics were monitored for the 60-month period.
To test the changes in the rate of safety event reporting (SER) between the pre-intervention and postintervention periods and between the intervention and the postintervention periods, interrupted time series (ITS) analysis with a control group was performed using PROC AUTOREG in SAS Enterprise Guide 6.1 (SAS Institute Inc., Cary, NC). Because SER rates are reported monthly, ITS analysis was used to control for autocorrelation, nonstationary variance, seasonality, and trends [2,3].
Results
The SER rate was assessed monthly, so the number of SER rates for each group (intervention and comparator) was 15 during the pre-intervention and intervention periods, respectively, and 30 during the postintervention period. During the pre-intervention period, the intervention collaborative’s baseline median rate of safety events reported was 1.5 per 10,000 patient encounters (Figure). Also, for the intervention collaborative, the pre-intervention baseline mean (standard deviation, SD) SER rate (per 10,000 patient encounters by month) was 1.3 (1.2), the intervention mean SER rate was 12.0 (7.3), and the postintervention rate was 3.2 (1.8). Based on the ITS analysis, there was a significant change in the SER rate between the intervention and postintervention periods for the intervention collaborative (P = 0.01).
The SER rate peaked in the first month following the start of the intervention. After discontinuation of feedback, reporting rates declined abruptly and reverted to baseline by 16 months post intervention (Figure). The postintervention SER rate was also significantly higher than the pre-intervention rate (P = 0.001).
For the comparator clinics, no significant change in SER rates occurred for the 3 time periods.
Discussion
In this initiative with a 5-year reporting window, we had previously shown that with education and prospective audit and feedback, we could achieve a 10-fold increase in patient SER rates among a multi-practice collaborative while the intervention was maintained [1]. Even though there was a modest but significant increase in the SER rate in the postintervention period for the 6-clinic intervention collaborative compared to baseline, the substantial gains seen during the course of the intervention were not maintained when monthly audit and feedback ceased and monitoring continued for 30 months.
Limitations of this study include possible selection bias resulting from including clinics felt likely to participate rather than identifying clinics in a random fashion. In addition, we did not attempt to determine the specific reasons for the decrease in reporting among these clinics.
The few studies of ambulatory SER do not adequately address the effect of intervention cessation, but researchers who implemented other ambulatory quality improvement efforts have reported that gains often deteriorate or revert to baseline without consistent, ongoing feedback [4]. Likewise, in hospital-based residency programs, a multifaceted approach that includes feedback can increase SER rates, but it is uncertain if the success of this approach can be maintained long-term without continuing feedback of some type [5–7].
There are likely many factors influencing SER in ambulatory clinics, many of which are also applicable in the hospital setting. These include ease of reporting, knowing what events to report, confidentiality of reporting, and the belief that reporting makes a difference in enhancing patient safety [8]. A strong culture of safety in ambulatory clinics may lead to enhanced voluntary SER [9], and a nonpunitive, team-based approach has been advocated to promote reporting and improve ambulatory safety [10]. Historically, our ambulatory medical group clinics have had a strong culture of safety and, with patient safety coaches present in all of our clinics, we have supported a nonpunitive, team-based approach to SER [11].
In our intervention, we made reporting safety events easy, reporters knew which events to report, events could be reported anonymously, and reporters were rewarded, at least with data feedback, for reporting. The only factor known to have changed was discontinuation of monthly feedback. Which factors are most important could not be determined by our work, but we strongly suspect that sustaining enhanced reporting rates requires ongoing audit and feedback to maintain a focus on event reporting.
Corresponding author: Herbert Clegg, MD, 108 Providence Road, Charlotte NC, 28207, hwclegg@novanthealth.org.
Financial disclosures: None.
1. Clegg HW, Cardwell T, West AM, Ferrell F. Improved safety event reporting in outpatient, nonacademic practices with an anonymous, nonpunitive approach. J Clin Outcomes Manag 2015;22:66–72.
2. Newland JG, Stach LM, De Lurgio SA, et al. Impact of a prospective-audit-with-feedback antimicrobial stewardship program at a children’s hospital. J Pediatric Infect Dis Soc 2012; 1:179–86.
3. Penfold RB, Zhang F. Use of interrupted time series analysis in evaluating health care quality improvements. Acad Pediatr 2013;13 (6 Suppl):S38–44.
4. Gerber JS, Prasad PA, Fiks AG, et al. Durability of benefits of an outpatient antimicrobial stewardship intervention after discontinuation of audit and feedback. JAMA 2014;312:2569–70.
5. Steen S, Jaeger C, Price L, Griffen D. Increasing patient safety event reporting in an emergency medicine residency. BMJ Qual Improv Rep 2017;6(1).
6. Fox M, Bump G, Butler G, et al. Making residents part of the safety culture: improving error reporting and reducing harms. J Patient Saf 2017. [Epub ahead of print]
7. Dunbar AE 3rd, Cupit M, Vath RJ, et al. An improvement approach to integrate teaching teams in the reporting of safety events. Pediatrics 2017;139:e20153807.
8. Institute of Medicine. To err is human: Building a safer health system. National Academies. www.nationalacademies.org/hmd/~/media/Files/Report%20Files/1999/To-Err-is-Human/To%20Err%20is%20Human%201999%20%20report%20brief.pdf Published November 1999. Accessed August 22, 2018.
9. Miller N, Bhowmik S, Ezinwa M, et al. The relationship between safety culture and voluntary event reporting in a large regional ambulatory care group. J Patient Saf 2017. [Epub ahead of print]
10. Neuspiel DR, Stubbs EH. Patient safety in ambulatory care. Pediatr Clin North Am 2012;59:1341–54.
11. West AM, Cardwell T, Clegg HW. Improving patient safety culture through patient safety coaches in the ambulatory setting. Presented at: Institute for Healthcare Improvement Annual Summit on Improving Patient Care in the Office Practice and the Community; March 2015; Dallas, Texas.
Self-management intervention for epilepsy achieves health improvements
Self-management of epilepsy using a group-format, remote intervention improved mood, quality of life, and health functioning in high-risk individuals in a randomized, controlled trial.

In the 6-month trial, 120 individuals with epilepsy who had experienced at least one epilepsy-related health event in the previous 6 months were randomized either to a wait-list control group or a novel self‐management intervention.
The eight-session intervention, known as SMART, focused on modifiable factors that can be addressed with self-management, such as stress, substance abuse, routine, nutrition, and social support. It was delivered remotely over 8-10 weeks, either by telephone or online, after an initial in-person session.
“SMART combines the portability and low cost of a Web‐based intervention with the personally salient components of behavior modeling obtained by interacting with individuals who have ‘walked the walk’ in living with epilepsy,” Martha Sajatovic, MD, of Case Western Reserve University, Cleveland, and her coauthors wrote about their study published in Epilepsia.
Over the 6-month follow-up period, researchers found that individuals randomized to the intervention had a mean of 10.16 fewer negative health events, compared with a mean of 1.93 fewer events in the control group (P = .04).
When the authors looked at subcategories of negative health event counts – such as past 3-day seizure count or past 6‐month ED and hospitalization count – the differences were not significant. There was also no difference in seizure severity.
However, the study also showed significant improvements in participants’ self-rated depressive symptom severity, observer-rated depressive symptom severity, quality of life, and health functioning – both physical and mental – compared with controls. Intervention participants also reported significant improvements on the Epilepsy Self-Efficacy and Epilepsy Self-Management scales.
The majority of participants (94.2%) said the intervention was useful and that it covered the most important issues for them. A total of 92.3% believed the benefits of the SMART intervention were worth the hassle of taking part.
“SMART’s strengths are its foundation based on participatory research methods and an evidence‐based intervention, its use of peer educators facilitating empowerment and training, multimode delivery using traditional group format and telehealth approaches to eliminate barriers to care, and efficacy even in people who have long‐standing epilepsy,” the authors wrote.
“It is possible that SMART, which uses people with epilepsy as guides to help others learn to cope with the challenges of living with this common chronic neurologic condition, may help to alleviate some of the factors that prevent people with epilepsy from optimizing their quality of life.”
The study was supported by the Centers for Disease Control and Prevention. Three authors declared research grants, consultancies, royalties, or speaking positions with the private sector.
SOURCE: Sajatovic M et al. Epilepsia. 2018 Aug 10. doi: 10.1111/epi.14527.
Self-management of epilepsy using a group-format, remote intervention improved mood, quality of life, and health functioning in high-risk individuals in a randomized, controlled trial.
In the 6-month trial, 120 individuals with epilepsy who had experienced at least one epilepsy-related health event in the previous 6 months were randomized either to a wait-list control group or a novel self‐management intervention.
The eight-session intervention, known as SMART, focused on modifiable factors that can be addressed with self-management, such as stress, substance abuse, routine, nutrition, and social support. It was delivered remotely over 8-10 weeks, either by telephone or online, after an initial in-person session.
“SMART combines the portability and low cost of a Web‐based intervention with the personally salient components of behavior modeling obtained by interacting with individuals who have ‘walked the walk’ in living with epilepsy,” Martha Sajatovic, MD, of Case Western Reserve University, Cleveland, and her coauthors wrote about their study published in Epilepsia.
Over the 6-month follow-up period, researchers found that individuals randomized to the intervention had a mean of 10.16 fewer negative health events, compared with a mean of 1.93 fewer events in the control group (P = .04).
When the authors looked at subcategories of negative health event counts – such as past 3-day seizure count or past 6‐month ED and hospitalization count – the differences were not significant. There was also no difference in seizure severity.
However, the study also showed significant improvements in participants’ self-rated depressive symptom severity, observer-rated depressive symptom severity, quality of life, and health functioning – both physical and mental – compared with controls. Intervention participants also reported significant improvements on the Epilepsy Self-Efficacy and Epilepsy Self-Management scales.
The majority of participants (94.2%) said the intervention was useful and that it covered the most important issues for them. A total of 92.3% believed the benefits of the SMART intervention were worth the hassle of taking part.
“SMART’s strengths are its foundation based on participatory research methods and an evidence‐based intervention, its use of peer educators facilitating empowerment and training, multimode delivery using traditional group format and telehealth approaches to eliminate barriers to care, and efficacy even in people who have long‐standing epilepsy,” the authors wrote.
“It is possible that SMART, which uses people with epilepsy as guides to help others learn to cope with the challenges of living with this common chronic neurologic condition, may help to alleviate some of the factors that prevent people with epilepsy from optimizing their quality of life.”
The study was supported by the Centers for Disease Control and Prevention. Three authors declared research grants, consultancies, royalties, or speaking positions with the private sector.
SOURCE: Sajatovic M et al. Epilepsia. 2018 Aug 10. doi: 10.1111/epi.14527.
FROM EPILEPSIA
Key clinical point:
Major finding: A remote, self-management intervention for epilepsy was associated with significantly fewer negative health events, compared with being in a wait-list control group.
Study details: A randomized, controlled trial in 120 individuals with epilepsy.
Disclosures: The study was supported by the Centers for Disease Control and Prevention. Three authors declared research grants, consultancies, royalties, or speaking positions with the private sector.
Source: Sajatovic M et al. Epilepsia. 2018 Aug 10. doi: 10.1111/epi.14527.
Open AAA and peripheral bypass surgery patients among the highest users of post-acute care
in Medicare spending, according to the findings of a study that used data from the National Inpatient Sample (NIS) and the Veterans Affairs health system (VA) regarding surgical patients.

PAC, including skilled nursing facilities and inpatient rehabilitation, accounts for 73% of regional variation in Medicare spending, and studies on hospital variation in this area have typically focused on nonsurgical patients or been limited to Medicare data. However, a high degree of variation also appears to hold for surgical patients, according to the authors of this large database study of more than 4 million patients who had aortic aneurysm repair, peripheral vascular bypass, colorectal surgery, hepatectomy, pancreatectomy, or coronary bypass.
“We found that there is significant variation in use of PAC and rates of home discharge following complex cardiac, abdominal, and vascular surgery,” Courtney J. Balentine, MD, of the University of Alabama at Birmingham and his colleagues wrote in their report in the Journal of Surgical Research.
To explore hospital variation in post-surgery PAC, they evaluated 3,487,365 patients from the NIS (39% were aged 70 years or older, and 60% were men) and 60,666 from the VA (32% were aged 70 years or older, and 98% were men) who had surgery during 2008-2011.
Within the NIS, 631,199 patients (18%) were discharged to PAC facilities, and among the 60,666 veterans, 4744 (7.8%) were discharged to PAC facilities. In addition, hospital rates of discharge to PAC facilities varied from 1% to 36% for VA hospitals and from 1% to 59% for non-VA hospitals, according to the researchers. They found that some VA hospitals were four times more likely to discharge patients to PAC facilities than would be expected from their patients’ characteristics, while others were 90% more likely to send patients home than would be expected, according to Dr. Balentine and his colleagues.
Procedure-specific rates of discharge to PAC facilities from VA hospitals ranged from 2% following endovascular aneurysm repair to 10% after pancreatectomy and peripheral vascular bypass. Among the NIS hospitals, in contrast, rates of discharge to PAC facilities ranged from 6% following hepatectomy to as high as 44% following open aneurysm repair.
“These data could be used to characterize practices that promote more effective recovery from surgery and minimize the need for PAC,” the authors wrote. “Given that skilled nursing facilities and inpatient rehabilitation cost [$5,000]-$24,000 more than treatment at home, even minor reductions in the need for PAC facilities could result in substantial cost savings,” they stated.
“Our findings suggest that there is considerable room for improvement in the use of PAC after surgery and that we still have a long way to go in terms of using PAC to help patients recover and regain their independence,” the researchers concluded.
The authors reported that they had no conflicts of interest.
SOURCE: Balentine CJ et al. J Surg Res. 2018 Oct;230:61-70.
in Medicare spending, according to the findings of a study that used data from the National Inpatient Sample (NIS) and the Veterans Affairs health system (VA) regarding surgical patients.
PAC, including skilled nursing facilities and inpatient rehabilitation, accounts for 73% of regional variation in Medicare spending, and studies on hospital variation in this area have typically focused on nonsurgical patients or been limited to Medicare data. However, a high degree of variation also appears to hold for surgical patients, according to the authors of this large database study of more than 4 million patients who had aortic aneurysm repair, peripheral vascular bypass, colorectal surgery, hepatectomy, pancreatectomy, or coronary bypass.
“We found that there is significant variation in use of PAC and rates of home discharge following complex cardiac, abdominal, and vascular surgery,” Courtney J. Balentine, MD, of the University of Alabama at Birmingham and his colleagues wrote in their report in the Journal of Surgical Research.
To explore hospital variation in post-surgery PAC, they evaluated 3,487,365 patients from the NIS (39% were aged 70 years or older, and 60% were men) and 60,666 from the VA (32% were aged 70 years or older, and 98% were men) who had surgery during 2008-2011.
Within the NIS, 631,199 patients (18%) were discharged to PAC facilities, and among the 60,666 veterans, 4744 (7.8%) were discharged to PAC facilities. In addition, hospital rates of discharge to PAC facilities varied from 1% to 36% for VA hospitals and from 1% to 59% for non-VA hospitals, according to the researchers. They found that some VA hospitals were four times more likely to discharge patients to PAC facilities than would be expected from their patients’ characteristics, while others were 90% more likely to send patients home than would be expected, according to Dr. Balentine and his colleagues.
Procedure-specific rates of discharge to PAC facilities from VA hospitals ranged from 2% following endovascular aneurysm repair to 10% after pancreatectomy and peripheral vascular bypass. Among the NIS hospitals, in contrast, rates of discharge to PAC facilities ranged from 6% following hepatectomy to as high as 44% following open aneurysm repair.
“These data could be used to characterize practices that promote more effective recovery from surgery and minimize the need for PAC,” the authors wrote. “Given that skilled nursing facilities and inpatient rehabilitation cost [$5,000]-$24,000 more than treatment at home, even minor reductions in the need for PAC facilities could result in substantial cost savings,” they stated.
“Our findings suggest that there is considerable room for improvement in the use of PAC after surgery and that we still have a long way to go in terms of using PAC to help patients recover and regain their independence,” the researchers concluded.
The authors reported that they had no conflicts of interest.
SOURCE: Balentine CJ et al. J Surg Res. 2018 Oct;230:61-70.
FROM THE JOURNAL OF SURGICAL RESEARCH
Key clinical point: The wide disparity among hospitals in their rates of postsurgery discharge to post-acute care (PAC) could be an area of focus for cost containment in Medicare spending.
Major finding: Rates of discharge to PAC facilities varied from 1% to 36% for VA hospitals and from 1% to 59% for non-VA hospitals.
Study details: A database analysis of 3,487,365 National Inpatient Sample patients and 60,666 VA patients who had surgery during 2008-2011.
Disclosures: The authors reported that they had no conflicts of interest.
Source: Balentine CJ et al. J Surg Res. 2018 Oct;230:61-70.
TEAM approach reduced wait time, improved “face” time
ABSTRACT
Purpose In 2013-14, 2 clinics in the Watertown Regional Medical Center (WRMC; in southern Wisconsin) launched a new delivery model, “TEAM (Together Each person Achieves More) Primary Care,” as part of a quality improvement project to enhance the delivery experience for the patient, physician, and medical assistant (MA). New work flows, roles, and responsibilities were designed to reduce cycle time, increase patient time with physicians and staff, and reduce patient wait times.
Methods The new model increased the ratio of MAs to physicians from a baseline MA:MD ratio of 1:1 to 3:2, and trained MAs to assume expanded roles during exam-room entry and discharge, including assisting with documentation during the patient visit. A process engineer timed patient visits. The process engineer and a human resources associate conducted surveys to assess the level of satisfaction for patients, physicians, and MAs.
Results Cycle time decreased by a mean of 6 minutes, from 44 to 38 minutes per patient; time with staff increased a mean of 2 minutes, from 24 to 26 minutes per patient; and waiting time decreased from 9 to 2 minutes per patient. Qualitative interviews with patients, physicians, and MAs identified a high level of satisfaction with the new model.
Conclusion The higher staffing ratios and expanded roles for MAs in the new model improved workflow, increased the face time between patients and their physician and MA, and decreased patient wait times. The TEAM model also appeared to improve patient, physician, and MA satisfaction. We faced many challenges while implementing the new model, which could be further evaluated during wide adoption.
In recent years, we observed that our physicians, nurses, and medical assistants (MAs) appeared to be spending more time on administrative and clerical tasks—including tasks in the exam room with the patient—and less time engaged in direct patient care.1,2 We recognized these factors contribute to burnout and threaten staff retention and anticipated that a new model would improve physician time spent in direct patient care, decrease the demands of administrative tasks, and increase patient, physician, and MA satisfaction.3-6 Burnout, known to affect more than half of US physicians, has a negative impact on quality of care and patient safety and satisfaction.7-11 Improving workflow has been shown to reduce burnout.12
Watertown Regional Medical Center (WRMC) is a small, financially stable integrated delivery system in rural southern Wisconsin, composed of a 90-bed hospital, 10 primary care clinics (7 owned and 3 affiliated), and 24 employed physicians in 9 specialties. Two clinics within WRMC launched a new delivery model, “TEAM (Together Each person Achieves More) Primary Care,” to improve the delivery experience for the entire team, defined as the patient, physician, and MA. New workflows, roles, and responsibilities were designed to reduce cycle time (the total amount of time patients spent in the clinic from check-in to check-out), increase the total time a patient spent with staff (physician and MA or in point-of-care testing and radiology), and reduce the total time a patient spent waiting.13
We describe here WRMC’s experience in developing and implementing workflow improvements as a means of reducing burnout and improving satisfaction.
Continue to: METHODS
METHODS
We selected 2 WRMC sites for TEAM re-engineering based on their experience with quality-improvement projects and perceived likelihood of success with a new transformation initiative. In early 2013, WRMC charged one physician (JM), 2 MAs, the clinic scheduler, and the clinic administrator with designing the details of the model including evaluation metrics. WRMC provided a .5 FTE process engineer (MS) to assist with the design and implementation of the model at no extra expense to the clinics. The model was implemented in late 2013 and into 2014 after regular TEAM planning meetings and observational visits to non-WRMC sites identified as examples of best practices in improving outpatient primary care patient satisfaction: Bellin Health (Green Bay, Wis); ThedaCare (Appleton, Wis); the University of Utah (Salt Lake City); and the University of Wisconsin Health Yahara Clinic (Madison, Wis).
TEAM model
The TEAM model—so named to create top-of-mind awareness of its benefits—increased the MA:MD ratio, maintained consistent team composition so that physician/MA teams learned to work together and become more efficient, and added new MA responsibilities. We trained MAs to assist with documentation in the exam room to ensure that physician time was spent in face-to-face direct patient care.14-20 In these ways, we sought not only to increase patient satisfaction but also to enhance our own “joy in practice,” defined primarily by a high level of work-life satisfaction, a low level of burnout, and a feeling that the medical practice is fulfilling.21
In our traditional model, an MA retrieved the patient from the waiting room, conducted initial assessment in the exam room, and then left the patient to wait for the physician to enter. Once the physician entered and conducted the exam, the patient would be left alone again to wait for the MA to return. In our revised model (TABLE 1), we assigned one MA to each patient from arrival to discharge. After greeting the patient in the waiting room, the MA conducted an initial patient interview in the exam room, then remained in the room with the physician to document the visit. After the physician exited the exam room, the MA completed follow-up orders and provided the patient with a visit summary.

To facilitate consistency throughout the day, we designed a workflow similar to those created in lean models originally designed to increase efficiency in the manufacturing industry (TABLE 2). Visual and electronic cues triggered each step of the process and coordinated the movement of MAs and MDs. Cues included the conventional flag system outside each exam room, an electronic messaging system within the electronic health record (EHR) to indicate when a patient was ready to be seen, and a whiteboard in an area visible to all team members on which we wrote lab and radiology requests.

We experimented with the MA:MD ratio to identify the most effective and efficient team composition. On alternating weeks, we assigned one MA to one MD, 2 MAs to one MD, or 3 MAs to 2 MDs. Additionally, with the 2:1 MA:MD ratio, we varied the visit length in 2 tests; one spanning 30 minutes and the other 20 minutes. The MDs and MAs were seated at side-by-side workstations to make communication easier. We developed protocols and checklists that allowed MAs to enter health maintenance orders and conduct point-of-care testing before the physician entered the room. Such details included immunization management, strep screens, urine analyses, diabetic foot exams, extremity x-ray films, and mammogram and colonoscopy referrals.

Continue to: To prepare MAs...
To prepare MAs, we obtained special permission for team documentation from our Chief Information Officer and developed associated policies and procedures. A physician assistant (PA) trained each MA, introducing the structure and content of subjective, objective, assessment, and plan (SOAP) notes. Training was continuous, as PAs provided feedback when MAs began team documentation. The MAs documented visits using templates, free form, and quick text. We measured visit cycle-time, face time with staff, and patient waiting times. A process engineer with a stopwatch observed and timed the flow (but did not enter the exam room). We also conducted patient interviews immediately post-visit and administered anonymous questionnaires to clinic staff at different phases of the model. Physicians and MAs met weekly to evaluate the design.
We used qualitative interviews of patients, physicians, and MAs to identify the level of satisfaction with the new model. During the first week of implementation, a nurse and our process engineer conducted brief in-person surveys with approximately 20 post-visit patients. Patients, chosen by convenience, were asked if the visit addressed their concerns, whether they left with a thorough understanding of next steps, and if their wait time was acceptable. Twice during the implementation phase, a human resources associate distributed 9-item anonymous questionnaires to staff members during scheduled department meetings.
RESULTS
Times per activity with different MA:MD ratios and visit lengths are shown in TABLE 3. After 6 months, cycle time decreased by a mean of 6 minutes, from 44 to 38 minutes per patient; time with staff increased by a mean of 2 minutes, from 24 to 26 minutes per patient; and wait time decreased by a mean of 7 minutes, from 9 to 2 minutes per patient. We concluded the MA:MD ratio of 3:2 was most efficient because the 2:1 model left MAs with excess non-patient time.

Our delivery model received consistently positive comments from patients. Many expressed gratitude for the extra set of ears and eyes guiding them through the process. One recalled the “old days” when a nurse joined the doctor in the exam room. Another appreciated that both the MA and physician could answer follow-up questions over the phone.
Employee satisfaction
Surveys to assess satisfaction were distributed to all employees whether they were involved in the new model or not. Sixteen employees responded to the pre-implementation questionnaire and 18 responded to the post-implementation one distributed 7 months later. The questionnaires showed an increase in employee satisfaction scores from 3.70 to 3.89 on a 5-point Likert scale, with 5 ranking highest. “I am learning from [Dr. Milford] and understanding things more fully,” wrote one respondent. Another said, “Dr. Milford and his clinical support staff are less stressed.” Individual observations such as, “I can leave sooner with less work left to do,” and “All documentation is done before [the] patient leaves,” reflect the reduction in time that patient records remained open or incomplete. Some physicians reported a reduction in at-home or after-hours work, from about 2 to 4 hours per day to approximately one hour per day.
Continue to: Additional outcomes
Additional outcomes
The TEAM model allowed us to more easily integrate new initiatives into our practice and meet quality metrics by placing needed components within our workflow and checklist. For example, achieving Stage II Meaningful Use measures required that we print and furnish patients with a visit summary and a reminder to access our portal; something we easily incorporated into the MAs’ expanded responsibilities. We also met specific predetermined quality metrics that were part of a payment-withhold program. During the study period, we achieved scores at the 90th percentile and earned back our total withhold.
Finally, more of our patients completed advanced care planning discussions than the other 7 sites in our Honoring Choices Wisconsin cohort. This was achieved not only by integrating the process into our checklist, but because the MAs observed the MD-led patient conversations which they then emulated, presenting the advanced care planning information to patients before or after MD time with the patient.
Errors and defects in care
With ongoing provider guidance and reinforcement, MAs became integral members of the primary care team. They were empowered through protocols to manage and order health maintenance testing and provide needed immunizations. They also began to identify potentially overlooked aspects of care. For example, MAs prompted physicians to retake vital signs, adjust medications, order labs, discuss previous lab results, and pursue specialty referrals or follow-up care.
Billing
Although we tracked billing, the TEAM model was not designed to influence revenue. We noted no significant change in level of evaluation and management billed regardless of staffing ratio. While our panel size increased as we implemented the new process, this change could have been due to normal variation. We do see opportunity to affect future billing by having coders train MAs, which could enhance documentation and increase revenue.
DISCUSSION
The TEAM Primary Care model reduced the time our patients sat unattended, increased our opportunities to meaningfully interact with them, and seemed to reduce our administrative load. By identifying and implementing ways to work as a more cohesive, interconnected unit, we began to address our work as a team rather than as individuals. After implementing the model, we noted several instances where the MAs caught potential errors in care, although we did not consistently track or measure changes in the rate of these occurrences.
Continue to: Achieving these results also came with...
Achieving these results also came with challenges. Investing in and maintaining a new model opened our eyes to unforeseen inconsistencies in our staff profile and to the cost and administrative support needed for implementation. Moreover, our entire team (patients, MAs, and physicians) had to undergo a major cultural shift to adopt a new model.
Personnel variation
We discovered that implementing and sustaining organization change is highly dependent on constancy in human resources. When one team member was on vacation, sick, or leaving the practice, the process tended to fall apart. Hiring replacements and training employees well enough to fill in at a moment’s notice proved difficult. Bringing new employees into this process was also labor intensive. Despite team members being very engaged in change, these staffing inconsistencies caused significant stress and necessitated pauses in the implementation of the new model (reflected in the timeline of our measures). Larger organizational buy-in and support would allow us to hire and train a larger pool of MAs in anticipation of these fluctuations.
Cost
Our small, rural family practice took advantage of WRMC’s Primary Care Transformation project and the half-time process engineer and additional MA they provided. We question whether this model could be implemented without such support. While a process engineer might not prove necessary, expertise in process improvement is vital to help design and measure workflow and to identify opportunities for improvement.
Cultural change
Adopting a new model required asking every member of the team (patient, MA, and physician) to accommodate change and tolerate disruption. We anticipated patients might resist having an additional person in the room. All patients were informed of our new model at the beginning of the visit and told they could opt out. While we did not document patient resistance, JM recalled only 2 patients who expressed a desire not to have the MA present because of personal and sensitive issues. It’s possible some patients did not feel comfortable opting out. But many patients expressed gratitude for having an extra set of ears and eyes to guide them through the visit.
It was more challenging to support MAs as they stepped out of their comfort zone to assist with documentation. It took time for MAs to grow accustomed to the protocols and checklists essential to our workflow. Without protocols, any point-of-care testing that could have been completed at the beginning of the appointment had to be done at the end. This disrupted our workflow and increased patient wait times.
Continue to: We correctly predicted MAs would have...
We correctly predicted MAs would have difficulty documenting the assessment, plan, and medical decision making. We discovered that MAs more easily categorized and articulated information when we reframed the assessment and plan in first-person and placed it under “Patient instructions.” For this to occur, physicians had to learn to accurately articulate their thought process and instructions to the patient.
When training was provided, as previously described, MAs grasped the subjective section quickly. Surprisingly, they had most difficulty understanding terminology within the objective section. In the future, we would avert this problem by working closely with the human resource department. We believe there should be a newly defined position and additional training for MAs in these roles, since duties such as patient-coaching and documentation assistance may warrant separate certification.
Limitations
Our findings should be interpreted in light of several limitations. Implementing the new model was carried out in a single organization. The patients who were selected and agreed to be interviewed may have differed from the patient population as a whole. We did not measure some important outcomes, such as cost effectiveness and patient morbidity. We did not analyze the data to determine whether the apparent improvements in wait time and cycle time were statistically significant. In addition, measurement of any adverse effects was beyond the scope of this study.
Looking forward
The traditional model of physicians working individually with minimal support staff is no longer viable. To echo our co-author (CAS)’s recent statements on physician dissatisfaction, “The days of hero medicine, with the doctor doing it all, belong in the past.”21 The new model appeared to alleviate some administrative burdens and increase physician time with patients. Pressures to achieve quality measures and growing administrative tasks have altered the role and responsibilities of each member of the team.
Any sustainable system must address the larger crisis of physician dissatisfaction.7,22 We cannot focus on a single perspective—patient, physician, or MA—at the expense of the system as a whole. If the health care system is to resolve the epidemic of burnout and physician dissatisfaction, new approaches to patient care must be imagined and realized. Although we faced many challenges in implementing and evaluating the TEAM model, attempts to overcome these challenges appear justified because of our overall favorable impression of it. Innovations like the TEAM Primary Care model may help us improve the well-being of not just our patients but also our health professionals and the health care industry as a whole.
CORRESPONDENCE
James Milford, MD, Three Oaks Health, S.C., 480 Village Walk Lane, Suite F, Johnson Creek, WI 53038; jam@threeoakshealthcare.com.
SUPPORT
Although the Watertown Regional Medical Center has provided general funding for its Primary Care Transformation project, no dollars were specifically earmarked for the TEAM Primary Care process. Support for editorial services in preparing this article was provided by Dr. James Milford.
PRIOR PRESENTATIONS
Co-author Michael R. Strasser, MPA, presented this project at the 2015 i-PrACTISE conference in Madison, Wis, April 12-14, 2015. http://www.fammed.wisc.edu/i-practise/. The proceedings were not published or recorded.
ACKNOWLEDGMENT
We thank Annalynn Skipper and Masarah Van Eyck for their valuable edits.
1. Sinsky C, Colligan L, Li L, et al. Allocation of physician time in ambulatory practice: a time and motion study in 4 specialties. Ann Intern Med. 2016;165:753-760.
2. McDonald CJ, Callaghan FM, Weissman A, et al. Use of internist’s free time by ambulatory care electronic medical record systems. JAMA Intern Med. 2014;174:1860-1863.
3. Shanafelt TD, Dyrbye LN, Sinsky C, et al. Relationship between clerical burden and characteristics of the electronic environment with physician burnout and professional satisfaction. Mayo Clin Proc. 2016;91:836-848.
4. Friedberg MW, Chen PG, Van Busum KR, et al. Factors affecting physician professional satisfaction and their implications for patient care, health systems, and health policy. Available at: http://www.rand.org/pubs/research_reports/RR439.html#key-findings. Accessed October 25, 2016.
5. Babbott S, Manwell LB, Brown R, et al. Electronic medical records and physician stress in primary care: results from the MEMO study. J Am Med Inform Assoc. 2014;21:e100-e106.
6. Institute of Medicine. Crossing the Quality Chasm: A New Health System for the 21st Century. Washington, DC: National Academy Press. 2001.
7. Shanafelt TD, Hasan O, Dyrbye LN, et al. Changes in burnout and satisfaction with work-life balance in physicians and the general US working population between 2011 and 2014. Mayo Clinic Proc. 2015;90:1600-1613.
8. DeMatteo MR, Sherbourne CD, Hays RD, et al. Physicians’ characteristics influence patients’ adherence to medical treatment: Results from the Medical Outcomes Study. Health Psychol. 1993;12:93-102.
9. Shanafelt TD, Bradley KA, Wipf JE, et al. Burnout and self-reported patient care in an internal medicine residency program. Ann Intern Med. 2002;136:358-367.
10. Shanafelt TD, Balch CM, Bechamps G, et al. Burnout and medical errors among American surgeons. Ann Surg. 2010;251:995-1000.
11. Haas JS, Cook EF, Puopolo AL, et al. Is the professional satisfaction of general internists associated with patient satisfaction? J Gen Intern Med. 2000;15:122-128.
12. Linzer M, Poplau S, Grossman E, et al. A cluster randomized trial of interventions to improve work conditions and clinician burnout in primary care: results from the Healthy Work Place (HWP) Study. J Gen Intern Med. 2015;30:1105-1011.
13. Ferrer RL, Mody-Bailey P, Jaén CR, et al. A medical assistant-based program to promote healthy behaviors in primary care. Ann Fam Med. 2009;7:504-512.
14. Sinsky CA, Williard-Grace R, Schutzbank AM, et al. In search of joy in practice: a report of 23 high-functioning primary care practices. Ann Fam Med. 2013;11:272-278.
15. Reuben DB, Knudsen J, Senelick W, et al. The effect of a physician partner program on physician efficiency and patient satisfaction. JAMA Intern Med. 2014;174:1190-1193.
16. Hopkins K, Sinsky CA. Team-based care: saving time and improving efficiency. Fam Pract Manag. 2014;21:23-29.
17. Yan C, Rose S, Rothberg MB, et al. Physician, scribe, and patient perspectives on clinical scribes in primary care. J Gen Intern Med. 2016;31:990-995.
18. Misra-Hebert AD, Rabovsky A, Yan C, et al. A team-based model of primary care delivery and physician-patient interaction. Am J Med. 2015;128:1025-1028.
19. Anderson RJ. Optimizing the role of nursing staff to enhance physician productivity: one physician’s journey. Fam Pract Manag. 2013;20:18-22.
20. Anderson P, Halley MD. A new approach to making your doctor-nurse team more productive. Fam Pract Manag. 2008:15:35-40.
21. Sinsky CA. Dissatisfaction among Wisconsin physicians is part of a serious national trend. Wis Med J. 2015;114:132-133.
22. Bodenheimer T, Sinsky C. From triple to quadruple aim: care of the patient requires care of the provider. Ann Fam Med. 2014;12:573-576.
ABSTRACT
Purpose In 2013-14, 2 clinics in the Watertown Regional Medical Center (WRMC; in southern Wisconsin) launched a new delivery model, “TEAM (Together Each person Achieves More) Primary Care,” as part of a quality improvement project to enhance the delivery experience for the patient, physician, and medical assistant (MA). New work flows, roles, and responsibilities were designed to reduce cycle time, increase patient time with physicians and staff, and reduce patient wait times.
Methods The new model increased the ratio of MAs to physicians from a baseline MA:MD ratio of 1:1 to 3:2, and trained MAs to assume expanded roles during exam-room entry and discharge, including assisting with documentation during the patient visit. A process engineer timed patient visits. The process engineer and a human resources associate conducted surveys to assess the level of satisfaction for patients, physicians, and MAs.
Results Cycle time decreased by a mean of 6 minutes, from 44 to 38 minutes per patient; time with staff increased a mean of 2 minutes, from 24 to 26 minutes per patient; and waiting time decreased from 9 to 2 minutes per patient. Qualitative interviews with patients, physicians, and MAs identified a high level of satisfaction with the new model.
Conclusion The higher staffing ratios and expanded roles for MAs in the new model improved workflow, increased the face time between patients and their physician and MA, and decreased patient wait times. The TEAM model also appeared to improve patient, physician, and MA satisfaction. We faced many challenges while implementing the new model, which could be further evaluated during wide adoption.
In recent years, we observed that our physicians, nurses, and medical assistants (MAs) appeared to be spending more time on administrative and clerical tasks—including tasks in the exam room with the patient—and less time engaged in direct patient care.1,2 We recognized these factors contribute to burnout and threaten staff retention and anticipated that a new model would improve physician time spent in direct patient care, decrease the demands of administrative tasks, and increase patient, physician, and MA satisfaction.3-6 Burnout, known to affect more than half of US physicians, has a negative impact on quality of care and patient safety and satisfaction.7-11 Improving workflow has been shown to reduce burnout.12
Watertown Regional Medical Center (WRMC) is a small, financially stable integrated delivery system in rural southern Wisconsin, composed of a 90-bed hospital, 10 primary care clinics (7 owned and 3 affiliated), and 24 employed physicians in 9 specialties. Two clinics within WRMC launched a new delivery model, “TEAM (Together Each person Achieves More) Primary Care,” to improve the delivery experience for the entire team, defined as the patient, physician, and MA. New workflows, roles, and responsibilities were designed to reduce cycle time (the total amount of time patients spent in the clinic from check-in to check-out), increase the total time a patient spent with staff (physician and MA or in point-of-care testing and radiology), and reduce the total time a patient spent waiting.13
We describe here WRMC’s experience in developing and implementing workflow improvements as a means of reducing burnout and improving satisfaction.
Continue to: METHODS
METHODS
We selected 2 WRMC sites for TEAM re-engineering based on their experience with quality-improvement projects and perceived likelihood of success with a new transformation initiative. In early 2013, WRMC charged one physician (JM), 2 MAs, the clinic scheduler, and the clinic administrator with designing the details of the model including evaluation metrics. WRMC provided a .5 FTE process engineer (MS) to assist with the design and implementation of the model at no extra expense to the clinics. The model was implemented in late 2013 and into 2014 after regular TEAM planning meetings and observational visits to non-WRMC sites identified as examples of best practices in improving outpatient primary care patient satisfaction: Bellin Health (Green Bay, Wis); ThedaCare (Appleton, Wis); the University of Utah (Salt Lake City); and the University of Wisconsin Health Yahara Clinic (Madison, Wis).
TEAM model
The TEAM model—so named to create top-of-mind awareness of its benefits—increased the MA:MD ratio, maintained consistent team composition so that physician/MA teams learned to work together and become more efficient, and added new MA responsibilities. We trained MAs to assist with documentation in the exam room to ensure that physician time was spent in face-to-face direct patient care.14-20 In these ways, we sought not only to increase patient satisfaction but also to enhance our own “joy in practice,” defined primarily by a high level of work-life satisfaction, a low level of burnout, and a feeling that the medical practice is fulfilling.21
In our traditional model, an MA retrieved the patient from the waiting room, conducted initial assessment in the exam room, and then left the patient to wait for the physician to enter. Once the physician entered and conducted the exam, the patient would be left alone again to wait for the MA to return. In our revised model (TABLE 1), we assigned one MA to each patient from arrival to discharge. After greeting the patient in the waiting room, the MA conducted an initial patient interview in the exam room, then remained in the room with the physician to document the visit. After the physician exited the exam room, the MA completed follow-up orders and provided the patient with a visit summary.
To facilitate consistency throughout the day, we designed a workflow similar to those created in lean models originally designed to increase efficiency in the manufacturing industry (TABLE 2). Visual and electronic cues triggered each step of the process and coordinated the movement of MAs and MDs. Cues included the conventional flag system outside each exam room, an electronic messaging system within the electronic health record (EHR) to indicate when a patient was ready to be seen, and a whiteboard in an area visible to all team members on which we wrote lab and radiology requests.
We experimented with the MA:MD ratio to identify the most effective and efficient team composition. On alternating weeks, we assigned one MA to one MD, 2 MAs to one MD, or 3 MAs to 2 MDs. Additionally, with the 2:1 MA:MD ratio, we varied the visit length in 2 tests; one spanning 30 minutes and the other 20 minutes. The MDs and MAs were seated at side-by-side workstations to make communication easier. We developed protocols and checklists that allowed MAs to enter health maintenance orders and conduct point-of-care testing before the physician entered the room. Such details included immunization management, strep screens, urine analyses, diabetic foot exams, extremity x-ray films, and mammogram and colonoscopy referrals.
Continue to: To prepare MAs...
To prepare MAs, we obtained special permission for team documentation from our Chief Information Officer and developed associated policies and procedures. A physician assistant (PA) trained each MA, introducing the structure and content of subjective, objective, assessment, and plan (SOAP) notes. Training was continuous, as PAs provided feedback when MAs began team documentation. The MAs documented visits using templates, free form, and quick text. We measured visit cycle-time, face time with staff, and patient waiting times. A process engineer with a stopwatch observed and timed the flow (but did not enter the exam room). We also conducted patient interviews immediately post-visit and administered anonymous questionnaires to clinic staff at different phases of the model. Physicians and MAs met weekly to evaluate the design.
We used qualitative interviews of patients, physicians, and MAs to identify the level of satisfaction with the new model. During the first week of implementation, a nurse and our process engineer conducted brief in-person surveys with approximately 20 post-visit patients. Patients, chosen by convenience, were asked if the visit addressed their concerns, whether they left with a thorough understanding of next steps, and if their wait time was acceptable. Twice during the implementation phase, a human resources associate distributed 9-item anonymous questionnaires to staff members during scheduled department meetings.
RESULTS
Times per activity with different MA:MD ratios and visit lengths are shown in TABLE 3. After 6 months, cycle time decreased by a mean of 6 minutes, from 44 to 38 minutes per patient; time with staff increased by a mean of 2 minutes, from 24 to 26 minutes per patient; and wait time decreased by a mean of 7 minutes, from 9 to 2 minutes per patient. We concluded the MA:MD ratio of 3:2 was most efficient because the 2:1 model left MAs with excess non-patient time.
Our delivery model received consistently positive comments from patients. Many expressed gratitude for the extra set of ears and eyes guiding them through the process. One recalled the “old days” when a nurse joined the doctor in the exam room. Another appreciated that both the MA and physician could answer follow-up questions over the phone.
Employee satisfaction
Surveys to assess satisfaction were distributed to all employees whether they were involved in the new model or not. Sixteen employees responded to the pre-implementation questionnaire and 18 responded to the post-implementation one distributed 7 months later. The questionnaires showed an increase in employee satisfaction scores from 3.70 to 3.89 on a 5-point Likert scale, with 5 ranking highest. “I am learning from [Dr. Milford] and understanding things more fully,” wrote one respondent. Another said, “Dr. Milford and his clinical support staff are less stressed.” Individual observations such as, “I can leave sooner with less work left to do,” and “All documentation is done before [the] patient leaves,” reflect the reduction in time that patient records remained open or incomplete. Some physicians reported a reduction in at-home or after-hours work, from about 2 to 4 hours per day to approximately one hour per day.
Continue to: Additional outcomes
Additional outcomes
The TEAM model allowed us to more easily integrate new initiatives into our practice and meet quality metrics by placing needed components within our workflow and checklist. For example, achieving Stage II Meaningful Use measures required that we print and furnish patients with a visit summary and a reminder to access our portal; something we easily incorporated into the MAs’ expanded responsibilities. We also met specific predetermined quality metrics that were part of a payment-withhold program. During the study period, we achieved scores at the 90th percentile and earned back our total withhold.
Finally, more of our patients completed advanced care planning discussions than the other 7 sites in our Honoring Choices Wisconsin cohort. This was achieved not only by integrating the process into our checklist, but because the MAs observed the MD-led patient conversations which they then emulated, presenting the advanced care planning information to patients before or after MD time with the patient.
Errors and defects in care
With ongoing provider guidance and reinforcement, MAs became integral members of the primary care team. They were empowered through protocols to manage and order health maintenance testing and provide needed immunizations. They also began to identify potentially overlooked aspects of care. For example, MAs prompted physicians to retake vital signs, adjust medications, order labs, discuss previous lab results, and pursue specialty referrals or follow-up care.
Billing
Although we tracked billing, the TEAM model was not designed to influence revenue. We noted no significant change in level of evaluation and management billed regardless of staffing ratio. While our panel size increased as we implemented the new process, this change could have been due to normal variation. We do see opportunity to affect future billing by having coders train MAs, which could enhance documentation and increase revenue.
DISCUSSION
The TEAM Primary Care model reduced the time our patients sat unattended, increased our opportunities to meaningfully interact with them, and seemed to reduce our administrative load. By identifying and implementing ways to work as a more cohesive, interconnected unit, we began to address our work as a team rather than as individuals. After implementing the model, we noted several instances where the MAs caught potential errors in care, although we did not consistently track or measure changes in the rate of these occurrences.
Continue to: Achieving these results also came with...
Achieving these results also came with challenges. Investing in and maintaining a new model opened our eyes to unforeseen inconsistencies in our staff profile and to the cost and administrative support needed for implementation. Moreover, our entire team (patients, MAs, and physicians) had to undergo a major cultural shift to adopt a new model.
Personnel variation
We discovered that implementing and sustaining organization change is highly dependent on constancy in human resources. When one team member was on vacation, sick, or leaving the practice, the process tended to fall apart. Hiring replacements and training employees well enough to fill in at a moment’s notice proved difficult. Bringing new employees into this process was also labor intensive. Despite team members being very engaged in change, these staffing inconsistencies caused significant stress and necessitated pauses in the implementation of the new model (reflected in the timeline of our measures). Larger organizational buy-in and support would allow us to hire and train a larger pool of MAs in anticipation of these fluctuations.
Cost
Our small, rural family practice took advantage of WRMC’s Primary Care Transformation project and the half-time process engineer and additional MA they provided. We question whether this model could be implemented without such support. While a process engineer might not prove necessary, expertise in process improvement is vital to help design and measure workflow and to identify opportunities for improvement.
Cultural change
Adopting a new model required asking every member of the team (patient, MA, and physician) to accommodate change and tolerate disruption. We anticipated patients might resist having an additional person in the room. All patients were informed of our new model at the beginning of the visit and told they could opt out. While we did not document patient resistance, JM recalled only 2 patients who expressed a desire not to have the MA present because of personal and sensitive issues. It’s possible some patients did not feel comfortable opting out. But many patients expressed gratitude for having an extra set of ears and eyes to guide them through the visit.
It was more challenging to support MAs as they stepped out of their comfort zone to assist with documentation. It took time for MAs to grow accustomed to the protocols and checklists essential to our workflow. Without protocols, any point-of-care testing that could have been completed at the beginning of the appointment had to be done at the end. This disrupted our workflow and increased patient wait times.
Continue to: We correctly predicted MAs would have...
We correctly predicted MAs would have difficulty documenting the assessment, plan, and medical decision making. We discovered that MAs more easily categorized and articulated information when we reframed the assessment and plan in first-person and placed it under “Patient instructions.” For this to occur, physicians had to learn to accurately articulate their thought process and instructions to the patient.
When training was provided, as previously described, MAs grasped the subjective section quickly. Surprisingly, they had most difficulty understanding terminology within the objective section. In the future, we would avert this problem by working closely with the human resource department. We believe there should be a newly defined position and additional training for MAs in these roles, since duties such as patient-coaching and documentation assistance may warrant separate certification.
Limitations
Our findings should be interpreted in light of several limitations. Implementing the new model was carried out in a single organization. The patients who were selected and agreed to be interviewed may have differed from the patient population as a whole. We did not measure some important outcomes, such as cost effectiveness and patient morbidity. We did not analyze the data to determine whether the apparent improvements in wait time and cycle time were statistically significant. In addition, measurement of any adverse effects was beyond the scope of this study.
Looking forward
The traditional model of physicians working individually with minimal support staff is no longer viable. To echo our co-author (CAS)’s recent statements on physician dissatisfaction, “The days of hero medicine, with the doctor doing it all, belong in the past.”21 The new model appeared to alleviate some administrative burdens and increase physician time with patients. Pressures to achieve quality measures and growing administrative tasks have altered the role and responsibilities of each member of the team.
Any sustainable system must address the larger crisis of physician dissatisfaction.7,22 We cannot focus on a single perspective—patient, physician, or MA—at the expense of the system as a whole. If the health care system is to resolve the epidemic of burnout and physician dissatisfaction, new approaches to patient care must be imagined and realized. Although we faced many challenges in implementing and evaluating the TEAM model, attempts to overcome these challenges appear justified because of our overall favorable impression of it. Innovations like the TEAM Primary Care model may help us improve the well-being of not just our patients but also our health professionals and the health care industry as a whole.
CORRESPONDENCE
James Milford, MD, Three Oaks Health, S.C., 480 Village Walk Lane, Suite F, Johnson Creek, WI 53038; jam@threeoakshealthcare.com.
SUPPORT
Although the Watertown Regional Medical Center has provided general funding for its Primary Care Transformation project, no dollars were specifically earmarked for the TEAM Primary Care process. Support for editorial services in preparing this article was provided by Dr. James Milford.
PRIOR PRESENTATIONS
Co-author Michael R. Strasser, MPA, presented this project at the 2015 i-PrACTISE conference in Madison, Wis, April 12-14, 2015. http://www.fammed.wisc.edu/i-practise/. The proceedings were not published or recorded.
ACKNOWLEDGMENT
We thank Annalynn Skipper and Masarah Van Eyck for their valuable edits.
1. Sinsky C, Colligan L, Li L, et al. Allocation of physician time in ambulatory practice: a time and motion study in 4 specialties. Ann Intern Med. 2016;165:753-760.
2. McDonald CJ, Callaghan FM, Weissman A, et al. Use of internist’s free time by ambulatory care electronic medical record systems. JAMA Intern Med. 2014;174:1860-1863.
3. Shanafelt TD, Dyrbye LN, Sinsky C, et al. Relationship between clerical burden and characteristics of the electronic environment with physician burnout and professional satisfaction. Mayo Clin Proc. 2016;91:836-848.
4. Friedberg MW, Chen PG, Van Busum KR, et al. Factors affecting physician professional satisfaction and their implications for patient care, health systems, and health policy. Available at: http://www.rand.org/pubs/research_reports/RR439.html#key-findings. Accessed October 25, 2016.
5. Babbott S, Manwell LB, Brown R, et al. Electronic medical records and physician stress in primary care: results from the MEMO study. J Am Med Inform Assoc. 2014;21:e100-e106.
6. Institute of Medicine. Crossing the Quality Chasm: A New Health System for the 21st Century. Washington, DC: National Academy Press. 2001.
7. Shanafelt TD, Hasan O, Dyrbye LN, et al. Changes in burnout and satisfaction with work-life balance in physicians and the general US working population between 2011 and 2014. Mayo Clinic Proc. 2015;90:1600-1613.
8. DeMatteo MR, Sherbourne CD, Hays RD, et al. Physicians’ characteristics influence patients’ adherence to medical treatment: Results from the Medical Outcomes Study. Health Psychol. 1993;12:93-102.
9. Shanafelt TD, Bradley KA, Wipf JE, et al. Burnout and self-reported patient care in an internal medicine residency program. Ann Intern Med. 2002;136:358-367.
10. Shanafelt TD, Balch CM, Bechamps G, et al. Burnout and medical errors among American surgeons. Ann Surg. 2010;251:995-1000.
11. Haas JS, Cook EF, Puopolo AL, et al. Is the professional satisfaction of general internists associated with patient satisfaction? J Gen Intern Med. 2000;15:122-128.
12. Linzer M, Poplau S, Grossman E, et al. A cluster randomized trial of interventions to improve work conditions and clinician burnout in primary care: results from the Healthy Work Place (HWP) Study. J Gen Intern Med. 2015;30:1105-1011.
13. Ferrer RL, Mody-Bailey P, Jaén CR, et al. A medical assistant-based program to promote healthy behaviors in primary care. Ann Fam Med. 2009;7:504-512.
14. Sinsky CA, Williard-Grace R, Schutzbank AM, et al. In search of joy in practice: a report of 23 high-functioning primary care practices. Ann Fam Med. 2013;11:272-278.
15. Reuben DB, Knudsen J, Senelick W, et al. The effect of a physician partner program on physician efficiency and patient satisfaction. JAMA Intern Med. 2014;174:1190-1193.
16. Hopkins K, Sinsky CA. Team-based care: saving time and improving efficiency. Fam Pract Manag. 2014;21:23-29.
17. Yan C, Rose S, Rothberg MB, et al. Physician, scribe, and patient perspectives on clinical scribes in primary care. J Gen Intern Med. 2016;31:990-995.
18. Misra-Hebert AD, Rabovsky A, Yan C, et al. A team-based model of primary care delivery and physician-patient interaction. Am J Med. 2015;128:1025-1028.
19. Anderson RJ. Optimizing the role of nursing staff to enhance physician productivity: one physician’s journey. Fam Pract Manag. 2013;20:18-22.
20. Anderson P, Halley MD. A new approach to making your doctor-nurse team more productive. Fam Pract Manag. 2008:15:35-40.
21. Sinsky CA. Dissatisfaction among Wisconsin physicians is part of a serious national trend. Wis Med J. 2015;114:132-133.
22. Bodenheimer T, Sinsky C. From triple to quadruple aim: care of the patient requires care of the provider. Ann Fam Med. 2014;12:573-576.

Multidisciplinary Diabetes Care in a Safety Net Clinic: Lessons Learned from a Quality Improvement Initiative
From the Department of Family and Community Medicine, McGovern Medical School at the University of Texas Health Science Center, Houston, TX (Dr. Zare, Ms Klawans, Dr. Moreno), Department of Family Medicine and Community Medicine, Baylor College of Medicine, Houston, TX (Dr. Mejia de Grubb, Dr. Juneja, Dr. Zoorob), Department of Psychiatry, McGovern Medical School at the University of Texas Health Science Center, Houston, TX (Dr. Suchting), andHarris Health System, Houston TX (Ms. Mathis).
Abstract
- Objective: To describe a pilot project to improve care for patients with uncontrolled diabetes in a safety net clinic.
- Methods: One of 3 clinical teams was designated the intervention team. Changes implemented by the intervention team included patient referral to a dietician and/or clinical pharmacist, provision of patient education, and assignment of a case manager. We compared outcomes of patients in the intervention group (n = 71), vs those receiving care from the other 2 teams (usual care) (n = 188).
- Results: HbA1c significantly decreased over time for patients in the intervention group as well as the usual care group. Within the intervention group, visits to clinical pharmacist (P = 0.034) and education (P = 0.004) predicted significantly greater decreases in HbA1c over time.
- Conclusions: Diffusion of treatment may account for the overall HbA1c reduction regardless of treatment group. Results support the need for further pragmatic research to weigh the impact of unblinded designs, outcome measurement, and real-world behaviors on evidence-based interventions.
Key words: diabetes; safety net; multidisciplinary diabetes care; primary care; diffusion of treatment.
The prevalence of type 2 diabetes in the United States is significantly higher among Hispanics and African Americans than in the general population (13% vs. 9.3%) [1]. Similarly, diabetes is highly prevalent among the uninsured, and many patients delay or forgo treatment due to cost [2]. Subsequently, the rates of comorbidities, including stroke, hypertension, and CVD, are elevated in these groups [3].
Association between elevated HbA1c and morbidity and mortality is well-documented, and an HbA1c reduction of just 1% has been shown to reduce mortality and improve quality of life [4]. Uncontrolled diabetes also results in increased medical costs. Reducing HbA1c from 9.0 to 7.5 reduces annual expenditures by as much as 73% [5].
Metropolitan Houston and Harris County, Texas, has one of the largest uninsured metro populations in the United States (over 3.6 million) [6]. Harris Health System serves this uninsured population and is the fourth largest safety net health system in the nation. Approximately 40,000 patients with diabetes receive care within the health system, and 34% of them have an HbA1c value greater than 9.
Developing novel, cost-efficient treatment and management models is crucial when providing care for patients with uncontrolled diabetes. However, the study of implementation strategies to successfully integrate evidence-based interventions in primary care using pragmatic approaches that aim to determine the effectiveness of interventions in “the real world” remain a challenge [7,8]. To address this issue, a quality improvement project was instituted at one of the system’s health centers to improve the care of patients with uncontrolled diabetes (known HbA1c above 9).
Methods
Setting
The pilot project was conducted from 1 Oct 2015 to 31 Dec 2015 in a primary care community health center within Harris Health System in Houston, Texas. This pilot was the first step of an institutional effort to introduce a multidisciplinary model of care across all clinics [9]. Our health center has 6 family medicine providers and 1 advanced practice nurse practitioner, organized into 3 pods with 2 physicians each. We randomly selected 1 pod (team) and designated it the intervention group.
The Standards for Quality Improvement Reporting Excellence guidelines [10] were followed and institutional review board approval was obtained.
Intervention
Practice changes introduced in the intervention team were assignment of a case manager to all patients, referral to a dietician and clinical pharmacist as needed, and patient education sessions. The team’s nurse assumed the role of case manager. The case manager was responsible for reviewing a patient checklist based on the America Diabetes Association guideline for comprehensive diabetes medical evaluation at initial and follow-up visits. Referrals were based on ADA guideline recommendations. Onsite brief patient education was provided to all patients. In addition, patients were enrolled in a “Diabetes 101” class, which follows an evidence-based curriculum that includes participation in at least 2 monthly sessions. Patients were asked to return to the clinic for a follow-up visit after 3 months in order to monitor medication compliance, re-evaluate their care plan, and measure HbA1c The usual care group patients were managed based on the current Standards of Medical Care in Diabetes [11]. The usual care group included patients from the same clinic under the care of providers in the teams that were not included in the multidisciplinary intervention.
Analysis
Data abstracted from de-identified patient records included HbA1c values, interventions received, and sociodemographic data. Generalized linear mixed modeling (GLMM) was used to examine changes in patient HbA1c levels over time [12]. All models included a random intercept to account for correlated observations within patient. All analyses were performed using Proc GLIMMIX in SAS v. 9.3 [13].
Results
A total 271 patients with HbA1c above 9 were included in the analysis: 71 in the intervention group and 188 in the usual care group. The intervention group was further differentiated by month of enrollment: October (n = 37), November (n = 27), and December (n = 9). Mean patient age in the overall sample was 51.6 years. 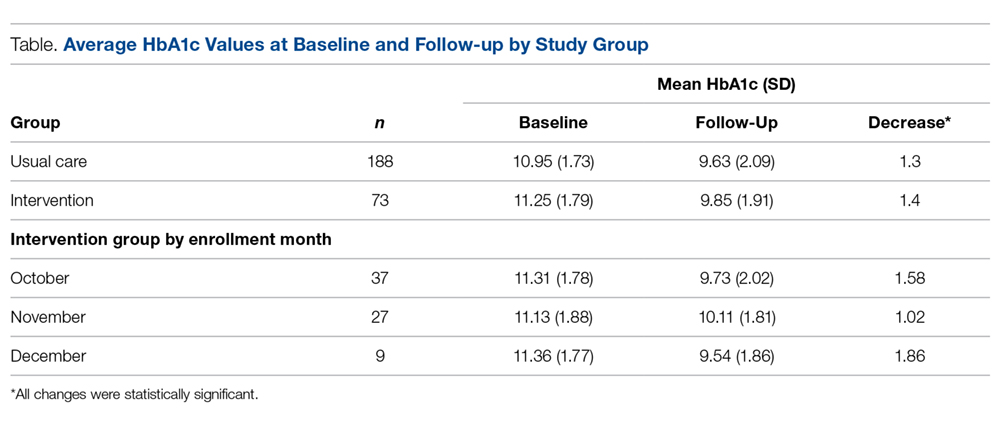
In the intervention group, most patients received patient education 56% (n = 40), almost half had a clinical pharmacy visit, but only 17% (n = 12) received a dietitian consultation. Overall, there was a 1.4% decrease in HbA1c in the intervention group, compared to a 1.3% HbA1c decrease in the usual care group.
GLMM was used to examine differences in HbA1c levels according to month of intervention enrollment (October vs. November vs. December) in the intervention group over time. Figure 1 shows predicted HbA1c values over time with trend lines fit for each of the three subgroups. 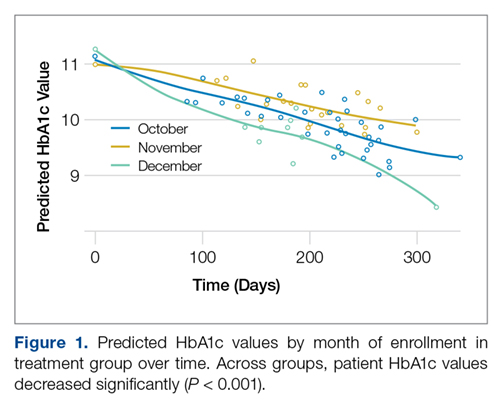
Preliminary analysis showed that potential contamination (diffusion of the treatment) would be likely to attenuate differences in the outcomes between the intervention and usual care conditions. Further analysis by subgroups were conducted to describe the intervention potential “spillover” to the usual care group participants not intended to receive the intervention. GLMM also examined differences in HbA1c levels between the intervention and usual care groups over time. The interaction between each treatment group and time was not statistically significant (F(2,268) = 1.34, P = 0.26), indicating that changes in HbA1c over time were not related to treatment group. A statistically reliable main effect for time (F(1,268) = 44.33, P < 0.001) indicated that in all groups, HbA1c values significantly decreased over time.
Follow-up analyses utilized GLMM to examine differences in HbA1c levels among patients in both groups who received at least one of the interventions (visiting a dietician, clinical pharmacist, education session, and clinical case manager). The interaction between intervention and time was not statistically significant for visiting the dietician, receiving education, or being assigned a case manager. The interaction between time and visiting a clinical pharmacist was statistically significant (F(1,204)= 7.78, P = 0.01) such that patients visiting the clinical pharmacist had lower HbA1c values over time relative to those that did not (Figure 2). 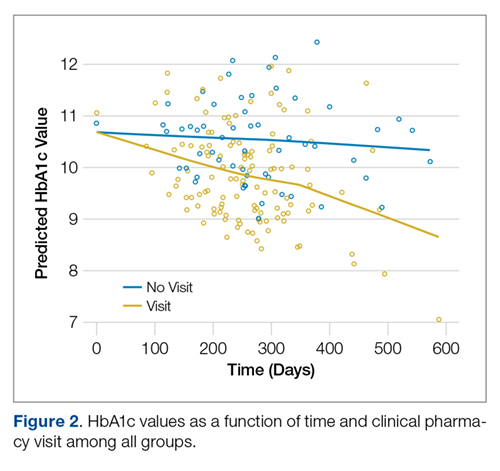
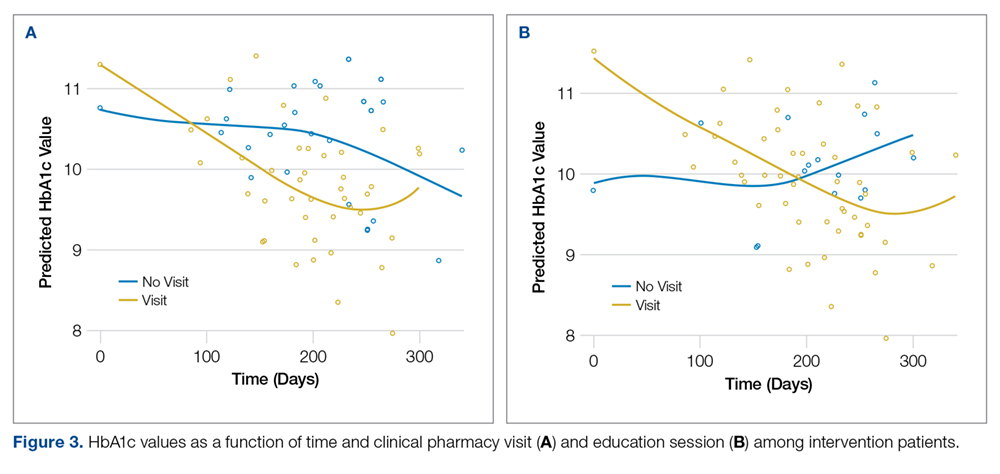
Discussion
HbA1c decreased significantly among intervention patients with uncontrolled diabetes over a 3-month period, regardless of which month they entered the study. However, there was no significant difference in HbA1c reduction between patients who received all 4 multidisciplinary interventions, one intervention, or those who received usual care. Patients in the intervention who attended clinical pharmacist visits had significantly greater HbA1c reduction than patients who did not, as did patients who attended a diabetes education session by a patient educator.
Diffusion of treatment may account for the overall HbA1c reduction regardless of treatment group. Diffusion refers to the unintended spread of a treatment effect when participants receive some or all treatments from an intervention to which they were not assigned, making outcomes descriptions of all study groups more challenging [14]. During the implementation period, other physicians and nurses in the clinic were aware of the multidisciplinary care model being piloted, and may have taken the initiative to connect their patients with clinical pharmacists, dieticians, certified diabetes educators, and clinical case managers. Pragmatic interventions are intended to maintain the internal validity of randomized control trials, yet they are meant to be implemented as close as possible to real-world settings in order to help patients, clinicians, and payers making informed health care decisions [8]. In this regard, participants in the control group could be exposed to the intervention through staff contact between the assigned groups implementing some of the intervention under study. In that case, the diffusion of treatment would be likely to attenuate differences in the outcomes between treatment and control groups [15].
This study has several limitations. We studied a small sample of patients that reflected the primary care population in one clinic in a safety net system with minority, underserved, and high-risk patients. Although attempts were made to keep the intervention limited to the intervention pod, diffusion of treatment might have impacted the internal validity of this intervention.
In summary, our results support the need for further systematic research work to weigh the impact of unblinded designs, simplified recruitment and outcome measurement, and real-world behaviors (such as noncompliance, cross over, and dropout) on evidence-based and multidisciplinary clinical interventions.
Acknowledgements: The authors would like to thank Krystal Gamarra, MSW, LCSW, and Hope Galvan, MS, RN, CVRN-BC, CDE for assistance with project implementation and data collection throughout this process.
Corresponding author: Maria C. Mejia de Grubb, MD, MPH, 3751 Kirby Dr, Suite 600, Houston, TX 77098, mcgrubb@bcm.edu.
Financial disclosures: None.
1. Centers for Disease Control and Prevention. National Diabetes Statistics Report: Estimates of diabetes and its burden in the United States, 2014. Atlanta, GA: U.S. Department of Health and Human Services; 2014. Accessed at www.cdc.gov/diabetes/pubs/statsreport14/national-diabetes-report-web.pdf.
2. Casagrande SS, Cowie CC. Health insurance coverage among people with and without diabetes in the US adult population. Diabetes Care 2012;35:2243–9.
3. American Diabetes Association. Statistics about diabetes. Arlington, VA; 2017.
4. Eeg-Olofsson K, Eliasson B, Zethelius B, et al. HbA1c reduction and risk of cardiovascular diseases in type 2 diabetes: an observational study from the Swedish NDR. Diabetes 2012.
5. Baxter M, Hudson R, Mahon J, et al. Estimating the impact of better management of glycaemic control in adults with type 1 and type 2 diabetes on the number of clinical complications and the associated financial benefit. Diabet Med 2016;33:1575–81.
6. Harris County Healthcare Alliance. The State of Health in Houston/Harris County 2015-2016. Accessed 17 Mar 2015 at http://houstonstateofhealth.org/soh_doc/.
7. Chalkidou K, Tunis S, Whicher D, et al. The role for pragmatic randomized controlled trials (pRCTs) in comparative effectiveness research. Clin Trials (London, England) 2012;9:436–46.
8. Tricoci P, Allen JM, Kramer JM, et al. Scientific evidence underlying the ACC/AHA clinical practice guidelines. JAMA 2009;301:831–41.
9. Wagner EH, Austin BT, Von Korff M. Organizing care for patients with chronic illness. Milbank Qty 1996:511–44.
10. Ogrinc G, Davies L, Goodman D, et al. SQUIRE 2.0 (Standards for QUality Improvement Reporting Excellence): revised publication guidelines from a detailed consensus process. BMJ Qual Safety 2016;25:986–92.
11. Standards of Medical Care in Diabetes—2015 Abridged for Primary Care Providers. American Diabetes Association. Clin Diabetes 2015;33:97–111.
12. Gelman A, Hill J. Data analysis using regression and multilevelhierarchical models. New York: Cambridge University Press; 2007.
13. SAS Institute I. Base SAS Procedures Guide: Statistical procedures. In: SAS Institute I, editor. Cary, NC; 2011.
14. Shadish WR, Cook TD, Campbell DT. Experimental and quasi-experimental designs for general causal inference. Boston: Houghton Mifflin; 2002.
15. Kane R. Understanding health care outcomes research. 2nd ed. In: Learning JB, editor. Burlington, MA: Jones and Bartlett; 2006: 44–6.
From the Department of Family and Community Medicine, McGovern Medical School at the University of Texas Health Science Center, Houston, TX (Dr. Zare, Ms Klawans, Dr. Moreno), Department of Family Medicine and Community Medicine, Baylor College of Medicine, Houston, TX (Dr. Mejia de Grubb, Dr. Juneja, Dr. Zoorob), Department of Psychiatry, McGovern Medical School at the University of Texas Health Science Center, Houston, TX (Dr. Suchting), andHarris Health System, Houston TX (Ms. Mathis).
Abstract
- Objective: To describe a pilot project to improve care for patients with uncontrolled diabetes in a safety net clinic.
- Methods: One of 3 clinical teams was designated the intervention team. Changes implemented by the intervention team included patient referral to a dietician and/or clinical pharmacist, provision of patient education, and assignment of a case manager. We compared outcomes of patients in the intervention group (n = 71), vs those receiving care from the other 2 teams (usual care) (n = 188).
- Results: HbA1c significantly decreased over time for patients in the intervention group as well as the usual care group. Within the intervention group, visits to clinical pharmacist (P = 0.034) and education (P = 0.004) predicted significantly greater decreases in HbA1c over time.
- Conclusions: Diffusion of treatment may account for the overall HbA1c reduction regardless of treatment group. Results support the need for further pragmatic research to weigh the impact of unblinded designs, outcome measurement, and real-world behaviors on evidence-based interventions.
Key words: diabetes; safety net; multidisciplinary diabetes care; primary care; diffusion of treatment.
The prevalence of type 2 diabetes in the United States is significantly higher among Hispanics and African Americans than in the general population (13% vs. 9.3%) [1]. Similarly, diabetes is highly prevalent among the uninsured, and many patients delay or forgo treatment due to cost [2]. Subsequently, the rates of comorbidities, including stroke, hypertension, and CVD, are elevated in these groups [3].
Association between elevated HbA1c and morbidity and mortality is well-documented, and an HbA1c reduction of just 1% has been shown to reduce mortality and improve quality of life [4]. Uncontrolled diabetes also results in increased medical costs. Reducing HbA1c from 9.0 to 7.5 reduces annual expenditures by as much as 73% [5].
Metropolitan Houston and Harris County, Texas, has one of the largest uninsured metro populations in the United States (over 3.6 million) [6]. Harris Health System serves this uninsured population and is the fourth largest safety net health system in the nation. Approximately 40,000 patients with diabetes receive care within the health system, and 34% of them have an HbA1c value greater than 9.
Developing novel, cost-efficient treatment and management models is crucial when providing care for patients with uncontrolled diabetes. However, the study of implementation strategies to successfully integrate evidence-based interventions in primary care using pragmatic approaches that aim to determine the effectiveness of interventions in “the real world” remain a challenge [7,8]. To address this issue, a quality improvement project was instituted at one of the system’s health centers to improve the care of patients with uncontrolled diabetes (known HbA1c above 9).
Methods
Setting
The pilot project was conducted from 1 Oct 2015 to 31 Dec 2015 in a primary care community health center within Harris Health System in Houston, Texas. This pilot was the first step of an institutional effort to introduce a multidisciplinary model of care across all clinics [9]. Our health center has 6 family medicine providers and 1 advanced practice nurse practitioner, organized into 3 pods with 2 physicians each. We randomly selected 1 pod (team) and designated it the intervention group.
The Standards for Quality Improvement Reporting Excellence guidelines [10] were followed and institutional review board approval was obtained.
Intervention
Practice changes introduced in the intervention team were assignment of a case manager to all patients, referral to a dietician and clinical pharmacist as needed, and patient education sessions. The team’s nurse assumed the role of case manager. The case manager was responsible for reviewing a patient checklist based on the America Diabetes Association guideline for comprehensive diabetes medical evaluation at initial and follow-up visits. Referrals were based on ADA guideline recommendations. Onsite brief patient education was provided to all patients. In addition, patients were enrolled in a “Diabetes 101” class, which follows an evidence-based curriculum that includes participation in at least 2 monthly sessions. Patients were asked to return to the clinic for a follow-up visit after 3 months in order to monitor medication compliance, re-evaluate their care plan, and measure HbA1c The usual care group patients were managed based on the current Standards of Medical Care in Diabetes [11]. The usual care group included patients from the same clinic under the care of providers in the teams that were not included in the multidisciplinary intervention.
Analysis
Data abstracted from de-identified patient records included HbA1c values, interventions received, and sociodemographic data. Generalized linear mixed modeling (GLMM) was used to examine changes in patient HbA1c levels over time [12]. All models included a random intercept to account for correlated observations within patient. All analyses were performed using Proc GLIMMIX in SAS v. 9.3 [13].
Results
A total 271 patients with HbA1c above 9 were included in the analysis: 71 in the intervention group and 188 in the usual care group. The intervention group was further differentiated by month of enrollment: October (n = 37), November (n = 27), and December (n = 9). Mean patient age in the overall sample was 51.6 years.
In the intervention group, most patients received patient education 56% (n = 40), almost half had a clinical pharmacy visit, but only 17% (n = 12) received a dietitian consultation. Overall, there was a 1.4% decrease in HbA1c in the intervention group, compared to a 1.3% HbA1c decrease in the usual care group.
GLMM was used to examine differences in HbA1c levels according to month of intervention enrollment (October vs. November vs. December) in the intervention group over time. Figure 1 shows predicted HbA1c values over time with trend lines fit for each of the three subgroups.
Preliminary analysis showed that potential contamination (diffusion of the treatment) would be likely to attenuate differences in the outcomes between the intervention and usual care conditions. Further analysis by subgroups were conducted to describe the intervention potential “spillover” to the usual care group participants not intended to receive the intervention. GLMM also examined differences in HbA1c levels between the intervention and usual care groups over time. The interaction between each treatment group and time was not statistically significant (F(2,268) = 1.34, P = 0.26), indicating that changes in HbA1c over time were not related to treatment group. A statistically reliable main effect for time (F(1,268) = 44.33, P < 0.001) indicated that in all groups, HbA1c values significantly decreased over time.
Follow-up analyses utilized GLMM to examine differences in HbA1c levels among patients in both groups who received at least one of the interventions (visiting a dietician, clinical pharmacist, education session, and clinical case manager). The interaction between intervention and time was not statistically significant for visiting the dietician, receiving education, or being assigned a case manager. The interaction between time and visiting a clinical pharmacist was statistically significant (F(1,204)= 7.78, P = 0.01) such that patients visiting the clinical pharmacist had lower HbA1c values over time relative to those that did not (Figure 2).
Discussion
HbA1c decreased significantly among intervention patients with uncontrolled diabetes over a 3-month period, regardless of which month they entered the study. However, there was no significant difference in HbA1c reduction between patients who received all 4 multidisciplinary interventions, one intervention, or those who received usual care. Patients in the intervention who attended clinical pharmacist visits had significantly greater HbA1c reduction than patients who did not, as did patients who attended a diabetes education session by a patient educator.
Diffusion of treatment may account for the overall HbA1c reduction regardless of treatment group. Diffusion refers to the unintended spread of a treatment effect when participants receive some or all treatments from an intervention to which they were not assigned, making outcomes descriptions of all study groups more challenging [14]. During the implementation period, other physicians and nurses in the clinic were aware of the multidisciplinary care model being piloted, and may have taken the initiative to connect their patients with clinical pharmacists, dieticians, certified diabetes educators, and clinical case managers. Pragmatic interventions are intended to maintain the internal validity of randomized control trials, yet they are meant to be implemented as close as possible to real-world settings in order to help patients, clinicians, and payers making informed health care decisions [8]. In this regard, participants in the control group could be exposed to the intervention through staff contact between the assigned groups implementing some of the intervention under study. In that case, the diffusion of treatment would be likely to attenuate differences in the outcomes between treatment and control groups [15].
This study has several limitations. We studied a small sample of patients that reflected the primary care population in one clinic in a safety net system with minority, underserved, and high-risk patients. Although attempts were made to keep the intervention limited to the intervention pod, diffusion of treatment might have impacted the internal validity of this intervention.
In summary, our results support the need for further systematic research work to weigh the impact of unblinded designs, simplified recruitment and outcome measurement, and real-world behaviors (such as noncompliance, cross over, and dropout) on evidence-based and multidisciplinary clinical interventions.
Acknowledgements: The authors would like to thank Krystal Gamarra, MSW, LCSW, and Hope Galvan, MS, RN, CVRN-BC, CDE for assistance with project implementation and data collection throughout this process.
Corresponding author: Maria C. Mejia de Grubb, MD, MPH, 3751 Kirby Dr, Suite 600, Houston, TX 77098, mcgrubb@bcm.edu.
Financial disclosures: None.
1. Centers for Disease Control and Prevention. National Diabetes Statistics Report: Estimates of diabetes and its burden in the United States, 2014. Atlanta, GA: U.S. Department of Health and Human Services; 2014. Accessed at www.cdc.gov/diabetes/pubs/statsreport14/national-diabetes-report-web.pdf.
2. Casagrande SS, Cowie CC. Health insurance coverage among people with and without diabetes in the US adult population. Diabetes Care 2012;35:2243–9.
3. American Diabetes Association. Statistics about diabetes. Arlington, VA; 2017.
4. Eeg-Olofsson K, Eliasson B, Zethelius B, et al. HbA1c reduction and risk of cardiovascular diseases in type 2 diabetes: an observational study from the Swedish NDR. Diabetes 2012.
5. Baxter M, Hudson R, Mahon J, et al. Estimating the impact of better management of glycaemic control in adults with type 1 and type 2 diabetes on the number of clinical complications and the associated financial benefit. Diabet Med 2016;33:1575–81.
6. Harris County Healthcare Alliance. The State of Health in Houston/Harris County 2015-2016. Accessed 17 Mar 2015 at http://houstonstateofhealth.org/soh_doc/.
7. Chalkidou K, Tunis S, Whicher D, et al. The role for pragmatic randomized controlled trials (pRCTs) in comparative effectiveness research. Clin Trials (London, England) 2012;9:436–46.
8. Tricoci P, Allen JM, Kramer JM, et al. Scientific evidence underlying the ACC/AHA clinical practice guidelines. JAMA 2009;301:831–41.
9. Wagner EH, Austin BT, Von Korff M. Organizing care for patients with chronic illness. Milbank Qty 1996:511–44.
10. Ogrinc G, Davies L, Goodman D, et al. SQUIRE 2.0 (Standards for QUality Improvement Reporting Excellence): revised publication guidelines from a detailed consensus process. BMJ Qual Safety 2016;25:986–92.
11. Standards of Medical Care in Diabetes—2015 Abridged for Primary Care Providers. American Diabetes Association. Clin Diabetes 2015;33:97–111.
12. Gelman A, Hill J. Data analysis using regression and multilevelhierarchical models. New York: Cambridge University Press; 2007.
13. SAS Institute I. Base SAS Procedures Guide: Statistical procedures. In: SAS Institute I, editor. Cary, NC; 2011.
14. Shadish WR, Cook TD, Campbell DT. Experimental and quasi-experimental designs for general causal inference. Boston: Houghton Mifflin; 2002.
15. Kane R. Understanding health care outcomes research. 2nd ed. In: Learning JB, editor. Burlington, MA: Jones and Bartlett; 2006: 44–6.
Integrating survivorship care planning in radiation oncology workflow
In January 2016 there were an estimated 15.5 million people in the United States who were living with a cancer diagnosis, representing 4.8% of the population. That number is expected to increase to 20.3 million by 2026.1 The 5-year relative survival rate for all cancers diagnosed during 2005 to 2011 was 69%.2 As more individuals with a cancer diagnosis now live longer, cancer survivorship is receiving increased attention. A report from the Institute of Medicine3 identified the essential components of survivorship care, including the provision of a survivorship care plan (SCP) containing specific diagnosis, treatment, and follow-up information (Table 1). To maintain accreditation in their respective organizations, the American College of Surgeons’ Commission on Cancer and the National Accreditation Program for Breast Centers (NAPBC) have included standards on providing treatment summaries and SCPs in person to those patients who have completed cancer treatments given with curative intent.4,5
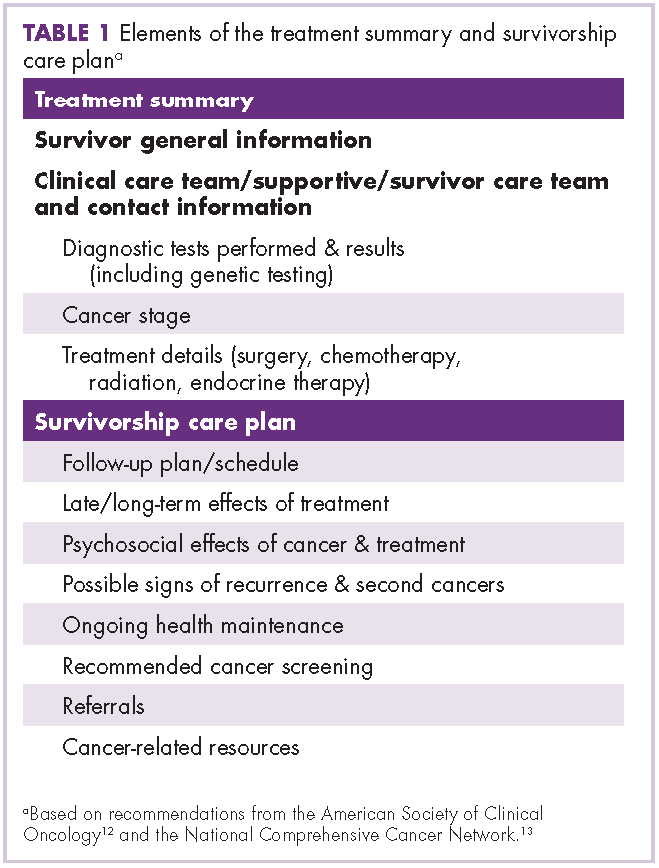
SCPs are personalized documents presented to cancer patients at the end of treatment that summarize key aspects of cancer treatment and recommend appropriate ongoing medical care and self-management. The purpose of the SCP is both to educate cancer survivors and to create a portable document that can be shared with primary care providers to facilitate coordinated care.6 There are multiple barriers to SCP implementation, which may include the time required to create an SCP, inadequate reimbursement for the time spent creating and delivering the plan, a lack of risk-stratified guidelines for coordinated care, and the incomplete automation of diagnosis and treatment summarization by the electronic health record (EHR).7
Survivorship care in radiation oncology
The American College of Radiology includes the recommendation for regular, ongoing follow-up in the standards for accreditation for radiation oncology practice.8 Radiation oncology practices often provide the initial follow-up appointment about a month after the prescribed radiation treatment has been completed. The twofold purpose of this appointment is to assess the response to treatment and to evaluate acute treatment-related effects.9 The appointment may include a skin evaluation, assessment for any acute treatment effects, informal counseling on maintaining a healthy lifestyle, and recommendations for posttreatment care and follow-up. The appointment may also be an opportune time for delivering the SCP because radiation therapy is often the final treatment modality in active therapy for breast cancer patients.
A review of the literature yields scant data on the incorporation of SCPs into a radiation oncology practice. A 2014 survey of members of the American Society of Radiation Oncology10for a response percentage of 14.7%. Almost all providers follow their patients after treatment (97% (n = 574 respondents/3987 total membership, 14.4% response rate) showed that although most radiation oncologists provide long-term follow-up care to their patients after treatment completion (97%), fewer than half of those surveyed indicated that they delivered SCPs for curative-intent patients (40%), and even fewer delivered for palliative-intent patients (19%). Standards for the American Society for Radiation Oncology’s Accreditation Program for Excellence11 outline content for end-of-treatment documentation. Typically, the documentation includes a detailed treatment summary prepared by the treating radiation oncologist. This treatment summary includes the patient’s diagnosis, the area treated, radiation doses received, number of fractions delivered, therapy start date, therapy completion date, and overall tolerance of treatment in a clinical summary. The treatment summary is communicated to other providers involved in the patient’s care to promote care coordination, but it is not typically provided to patients.
Development of University of Wisconsin survivorship care planning
As an important component of maintaining NAPBC accreditation, the University of Wisconsin (UW) Health Breast Center began the process of formalizing and optimizing SCPs for breast cancer survivors who are followed at the center. Multidisciplinary input from surgical, medical, and radiation oncology was obtained. Representatives from those disciplines met regularly to reach consensus on the treatment summary and SCP content. The following 3 documents were created for use during a transition visit at the end of treatment: the written individualized SCP to be provided to the survivor and his/her primary care providers, a general survivorship patient education booklet, and a patient questionnaire to identify survivors’ concerns and additional resources that may be beneficial.
Treatment summary
Working in collaboration with IT specialists, we enabled out-of-the-box functionality within our EHR. This cancer-specific functionality provides a central and standard location within each survivor’s problem list to systematically document information regarding cancer diagnosis, stage, and treatment associated with a specific cancer diagnosis. Each treating provider (surgeon, medical oncologist, radiation oncologist, genetic counselor, etc) is responsible for entering and updating the relevant components within the treatment summary (ie, the surgeon enters and maintains the surgical details, the medical oncologist does likewise for chemotherapy and other medical therapies, etc). Information is updated and current, creating a dynamic documentation of diagnosis and treatment that can be used in clinic notes, patient after-visit summaries, and SCPs.
Survivorship care plan
This same EHR functionality is leveraged to generate, populate, and maintain the individualized SCP for each breast cancer survivor. The Treatment Summary section of the SCP can be quickly prepared within the EHR by autopopulating data previously entered by treating providers. Content and language for SCP templates in breast, colorectal, prostate, and gynecologic cancers are in use at the time of publication. The templates are developed as a collaborative effort between oncology subspecialists, with input from the UW Health survivor and family advocacy councils.
Each template contains a Treatment Summary section and an SCP section. The Treatment Summary section includes survivor general information, diagnosis and treatment information, and the clinical and supportive/survivor care team names and contact information. The SCP section includes follow-up recommendations, signs of recurrence and/or symptoms to report, healthy lifestyle and maintenance, chronic or late effects of specific treatment if applicable (eg, surgery, chemotherapy by drug, radiation therapy, and endocrine therapy), and general resources for common psychosocial concerns (Table 1).12,13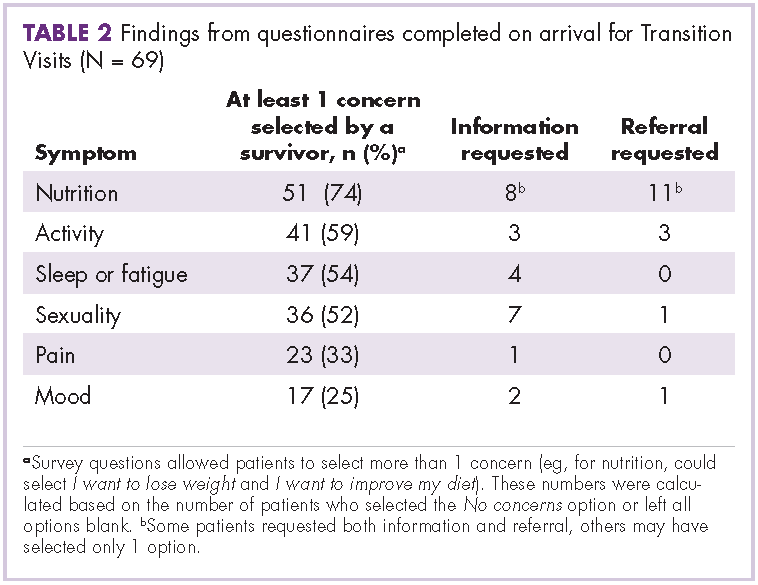
Each SCP is visible to the entire health care team, including other specialists and primary care, as long as they have access to UW Health’s EHR.14 The result is a readily accessible, comprehensive document that is individualized for each survivor, residing in a standard location with standardized format and content to facilitate review and use.15
General survivorship patient education booklet
Many cancer survivors request additional information about their posttreatment concerns. The “UW Health Facts for You: Cancer Survivorship, Carbone Cancer Center” booklet was developed by a multidisciplinary team including oncologists, advanced practice providers (APPs), navigators, social workers, program leadership, cancer survivors, and caregivers. The guide includes detailed information for the cancer survivor on topics including nutrition, exercise, sleep, tobacco cessation, sexual health, and spirituality. Common concerns and symptom management are addressed as well as a comprehensive list of community resources. The booklet can be found at http://www.uwhealth.org/healthfacts/cancer/7834.
Survivorship questionnaire
Breast cancer survivors often have multiple concerns as they transition from active treatment to the survivorship phase of their cancer journey. Specific concerns may vary slightly form one survivor to another. Guided by recommendations for the American Society of Clinical Oncology and the National Comprehensive Cancer Network, we developed a 10-question, 2-page questionnaire to identify those concerns with input from members of the Breast Cancer Steering Committee. Members of the committee include surgical, medical, and radiation oncologists, AAPs, radiologists, pathologists, program leadership, and nurses, along with breast cancer survivors. Elements in the questionnaire include nutrition, activity, mood, sleep, sexual health, employment/insurance, pain/swelling, desires regarding pregnancy or prevention, memory/concentration, smoking, alcohol, genetic testing/counseling, and assistance with establishing care with a primary care provider. By completing the questionnaire, breast cancer survivors identify specific concerns within each category and are able to request additional information about those concerns and/or a referral to appropriate resources. They may also select the I need nothing further option if the concern is present but already being addressed.
SCP delivery and the transition visit
The next task in implementation of the care process for survivors encompassed the development of clinical workflows and processes to provide the document to the breast cancer survivor at the completion of treatment. In a study of breast cancer survivors, it was found that the preferred format for survivorship care planning is generally an in-person consultation at completion of treatment with an oncology professional.16 The best time for distribution of the written SCP is, however, unclear. Intuitively, it seems optimal to distribute SCPs around the time of completion of active treatment. However, for SCP delivery to be feasible and sustainable, delivery must be integrated into existing clinical care-delivery processes, and content must be streamlined and focused to meet the needs of their intended recipients without becoming overly burdensome to prepare and deliver.17
Ultimately, and after significant multidisciplinary discussion, it was determined that Stage 0-III breast cancer patients would have a visit focusing on symptoms and transitioning to surveillance follow-up (Transition Visit) as they completed active curative-intent cancer treatment. During this Transition Visit, the SCP document would be provided and reviewed with survivors. The Transition Visit for breast cancer survivors would be conducted by an APP following the completion of their final stage of active, primary treatment (surgery, chemotherapy, and/or radiation therapy). Additional long-term adjuvant therapy for breast cancer survivors (ie, trastuzumab, endocrine therapy) would continue as indicated during and after delivery of the SCP.
The radiation oncology clinic was chosen as a venue for these Transition Visits for breast cancer survivors whose treatment included radiotherapy. Despite little historical experience with delivery of SCPs in radiation oncology clinics, this was a logical choice given that radiotherapy is usually the final phase of active treatment for these breast cancer survivors, and a follow-up visit about a month after completing radiotherapy is already part of standard practice. Collaborating with the multidisciplinary UW Health Breast Center, we therefore integrated the formal breast survivorship care planning process and provision of the SCP into the current radiation oncology workflow. About 40% of the roughly 600 breast cancer patients treated by surgical and/or medical oncology at our institution annually also receive radiation therapy at our site. For the remaining 60% of breast cancer survivors who do not receive radiation therapy or who completed radiotherapy at an outside facility, the SCP is provided by an APP within the UW Health Breast Center.
UW radiation oncology survivorship transition visit
The overall workflow of our Transition Visit is depicted in the Figure. Toward the end of the breast cancer survivor’s radiation treatments, the radiation oncologist instructs the schedulers to arrange the 1-month, post-radiation Transition Visit with the APP and informs the survivor about the nature of the appointment. The Transition Visit is scheduled as a 60-minute appointment. Before the survivor’s arrival, an APP generates the written SCP. The activity includes completing the Treatment Summary, or verifying the accuracy of a prepopulated Treatment Summary, and individualizing the SCP section for the patient based on treatment received and follow-up recommendations using drop-down functionality. As the SCP is printed for review with the survivor, it is simultaneously sent to the survivor’s primary care provider. This is accomplished by using EHR functionality to route the document internally to UW primary care providers or automatically faxing the document to external primary care providers. Each SCP is also marked as complete within the EHR for the purposes of documenting compliance with this activity for later data analysis.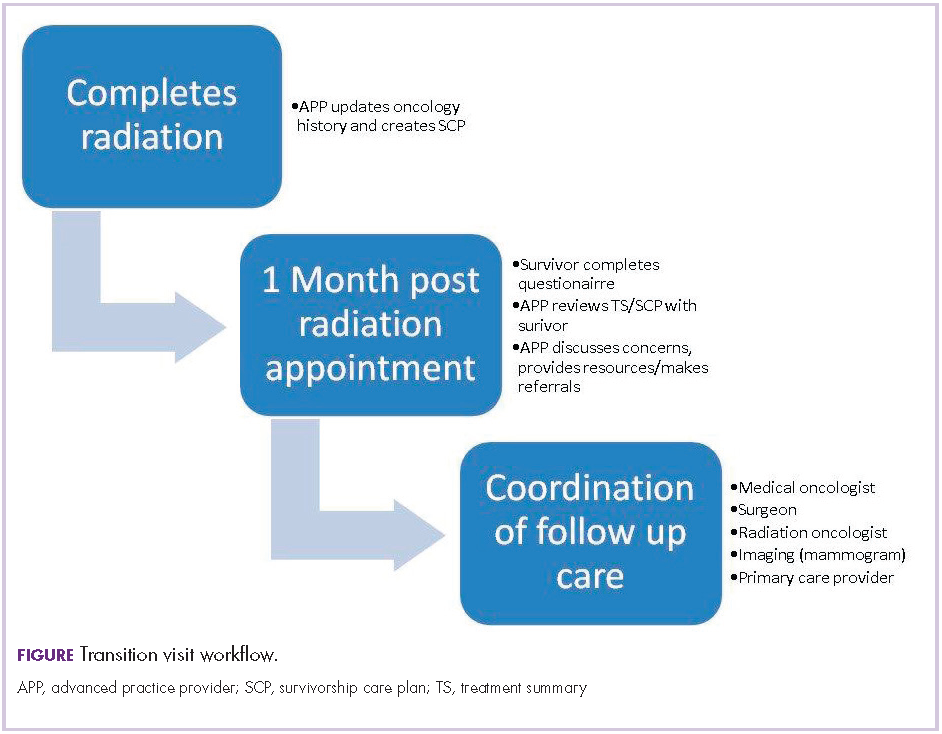
On arrival for the appointment, each breast cancer survivor completes the survivorship questionnaire. During the Transition Visit, the questionnaire is reviewed with the survivor and additional information is provided. Referral options are discussed if indicated with desired referrals made by the APP. The survivor is interviewed and examined for any persistent side effects of treatment. Next, the Treatment Summary and SCP are reviewed with the survivor, emphasizing the follow-up plan, signs or symptoms of breast cancer recurrence, and chronic or late treatment-related toxicities. Ample opportunity is provided for the survivor to ask questions and voice concerns.
Follow-up appointments with members of the patient’s care team (ie, medical, surgical, or radiation oncology) as well as necessary breast imaging (ie, mammogram, MRI) are coordinated and scheduled before the survivor leaves the department. A survey of oncologists (medical, surgical, radiation) identified specific cancer-related components of survivorship care that oncologists felt most responsible for as well as opportunities to improve the quality and efficiency of care provided by oncologists.18 At our institution, the breast surgical, medical, and radiation oncologists all generally participate in follow-up care through at least 1 year following completion of active, primary treatment.
Outcomes, quality improvement opportunities, and continued challenges with the process
There is presently a lack of long-term outcome data about the impact of SCPs. As mandates for the provision of SCPs are made, research focusing on whether SCPs result in improved health behaviors and outcomes, reduced burden in care transitions from the oncology setting, and increased cost-effectiveness will be needed.19 The long-term effects of SCPs on psychological, oncologic, and resource outcomes should be evaluated,20 as well as the impact on health behaviors, such as smoking cessation or participation in rehabilitation programs.21
Following the implementation of our Transition Visits in 2015, we conducted a quality improvement review. This review included summation of 69 recent breast cancer questionnaires from Transition Visits with our APPs (Table 2 and Table 3). The most common concerns raised by our breast cancer survivors include desire for weight loss, improving diet, and increasing physical activity. Of note, concerns did not often translate into a desire for more information or referrals.22 Survivors were generally satisfied with the timing of the Transition Visits and generally indicated that the visits were helpful, with self-reported improvements in their understanding of planned follow-up. A Canadian group evaluating breast and head and neck cancer survivors has suggested that SCPs could produce long-term improvements in healthy lifestyle behaviors; however, further research is needed to determine the extent to which SCPs might improve follow-up care over the long term.23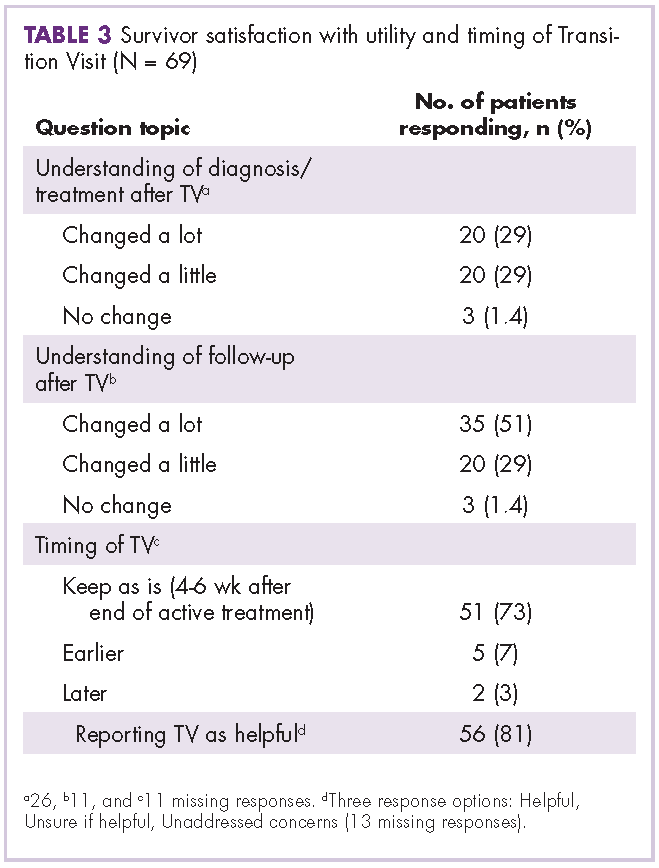
Finally, although efforts to date have been focused on the breast cancer survivor at the completion of treatment, long-term survivors may also benefit from receiving the SCP. A study by the American Cancer Society found that long-term cancer survivors had unmet informational needs, particularly with regard to screening, long-term cancer and treatment effects, and healthy lifestyle behaviors.24 Identifying and subsequently delivering an SCP to eligible long-term survivors is a challenging prospect, which depends on further refinement of EHR-based tracking of the date of diagnosis, cancer stage, and end-of-treatment date.
Summary and recommendations
Survivorship care has been efficiently integrated into our 1-month post-radiation follow-up appointment for breast cancer survivors. By using current resources in the radiation oncology department, the process has provided an effective way to deliver the SCP to breast cancer survivors. Future plans include implementing the process for all patients receiving curative-intent radiation for additional solid tumor survivors. Quality improvement projects will be developed to assess survivor satisfaction and the impact on health behaviors.
Acknowledgments
The authors thank Amy Heath, MS, RTT, for editorial and manuscript preparation assistance.
1. Statistics. National Cancer Institute, Division of Cancer Control & Population Sciences website. http:///cancercontrol.cancer.gov/ocs/statistics/statistics.html. Updated October 17, 2016. Accessed March 6, 2018.
2. Cancer facts & figures 2016. American Cancer Society website. https://www.cancer.org/research/cancer-facts-statistics/all-cancer-facts-figures/cancer-facts-figures-2016.html. Published 2016. Accessed February 27, 2018.
3. Hewitt M, Greenfield S, Stovall E, eds. From cancer patient to cancer survivor: lost in transition. Washington, DC: National Academies Press; 2006.
4. Knutson A, McNamara E. Cancer program standards: ensuring patient-centered care. American College of Surgeons website. https://www.facs.org/quality-programs/cancer/coc/standards. Published August 2016. Accessed March 6, 2018.
5. National Accreditation Program for Breast Centers. NAPBC standards manual. American College of Surgeons website. https://www.facs.org/~/media/files/quality%20programs/napbc/2014%20napbc%20standards%20manual.ashx. Published 2014. Accessed March 6, 2018.
6. Salz T, McCabe MS, Onstad EE, et al. Survivorship care plans: is there buy-in from community oncology providers? Cancer. 2014;120(5):722-730.
7. Mayer DK, Nekhlyudov L, Snyder CF, Merrill JK, Wollins DS, Shulman LN. American Society of Clinical Oncology clinical expert statement on cancer survivorship care planning. J Oncol Pract. 2014;10(6):345-351.
8. Dobelbower RR, Cotter G, Schilling PJ, Parsai EI, Carroll JM. Radiation oncology practice accreditation. Rays. 2001;26(3):191-198.
9. Hartford AC, Conway PD, Desai NB, et al. ACR-ASTRO practice parameter for communication: radiation oncology. The American College of Radiology website. http://www.acr.org/-/media/ACR/Files/Practice-Parameters/RadOnc.pdf. Updated 2014. Accessed March 6, 2018.
10. Koontz BF, Benda R, De Los Santos J, et al. US radiation oncology practice patterns for posttreatment survivor care. Pract Radiat Oncol. 2016;6(1):50-56.
11. American Society of Therapeutic Radiation Oncologists. APEx program standards. ASTRO website. http://www.astro.org/uploadedFiles/_MAIN_SITE/Daily_Practice/Accreditation/Content_Pieces/ProgramStandards.pdf. Published February 1, 2016. Accessed March 6, 2018.
12. Clinical practice survivorship guidelines and adaptations. American Society of Clinical Oncology website. http://www.asco.org/practice-guidelines/cancer-care-initiatives/prevention-survivorship. Published 2013. Accessed March 6, 2018.
13. National Comprehensive Cancer Network. Supportive care guidelines. NCNN website. http://www.nccn.org/professionals/physician_gls/f_guidelines.asp#supportive. Updated February 16, 2018. Accessed March 6, 2018.
14. Donohue S, Sesto ME, Hahn DL, et al. Evaluating primary care providers’ views on survivorship care plans generated by an electronic health record system. J Oncol Pract. 2015;11(3):e329-e335.
15. Tevaarwerk AJ, Wisinski KB, Buhr KA, et al. Leveraging electronic health record systems to create and provide electronic cancer survivorship care plans: a pilot study. J Oncol Pract. 2014;10(3):e150-e159.
16. Smith SL, Singh-Carlson S, Downie L, Payeur N, Wai ES. Survivors of breast cancer: patient perspectives on survivorship care planning. J Cancer Surviv. 2011;5(4):337-344.
17. Stricker CT, O’Brien M. Implementing the commission on cancer standards for survivorship care plans. Clin J Oncol Nurs. 2014;18(suppl 1):15-22.
18. Neuman HB, Steffens NM, Jacobson N, et al. Oncologists’ perspectives of their roles and responsibilities during multi-disciplinary breast cancer follow-up. Ann Surg Oncol. 2016;23(3):708-714.
19. Palmer SC, Stricker CT, Panzer SL, et al. Outcomes and satisfaction after delivery of a breast cancer survivorship care plan: Results of a multicenter trial. J Oncol Pract. 2015;11(2):e222-e229.
20. Brennan ME, Gormally JF, Butow P, Boyle FM, Spillane AJ. Survivorship care plans in cancer: a systematic review of care plan outcomes. Br J Cancer. 2014;111(10):1899-1908.
21. Chen RC, Hoffman KE, Sher DJ, et al. Development of a standard survivorship care plan template for radiation oncologists. Pract Radiat Oncol. 2016;6(1):57-65.
22. Seaborne LA, Huenerberg KJ, Bohler A, et al. Developing electronic health record based program to deliver survivorship care plans and visits at the UW breast center. Poster presented at American Society of Clinical Oncology Survivorship Symposium; January 15-16, 2016; San Francisco CA.
23. Collie K, McCormick J, Waller A, et al. Qualitative evaluation of care plans for Canadian breast and head-and-neck cancer survivors. Curr Oncol. 2014;21(1):18-28.
24. Playdon M, Ferrucci LM, McCorkle R, et al. Health information needs and preferences in relation to survivorship care plans of long-term cancer survivors in the American Cancer Society’s study of cancer survivors-I. J Cancer Surviv. 2016;10(4):674-685.
In January 2016 there were an estimated 15.5 million people in the United States who were living with a cancer diagnosis, representing 4.8% of the population. That number is expected to increase to 20.3 million by 2026.1 The 5-year relative survival rate for all cancers diagnosed during 2005 to 2011 was 69%.2 As more individuals with a cancer diagnosis now live longer, cancer survivorship is receiving increased attention. A report from the Institute of Medicine3 identified the essential components of survivorship care, including the provision of a survivorship care plan (SCP) containing specific diagnosis, treatment, and follow-up information (Table 1). To maintain accreditation in their respective organizations, the American College of Surgeons’ Commission on Cancer and the National Accreditation Program for Breast Centers (NAPBC) have included standards on providing treatment summaries and SCPs in person to those patients who have completed cancer treatments given with curative intent.4,5
SCPs are personalized documents presented to cancer patients at the end of treatment that summarize key aspects of cancer treatment and recommend appropriate ongoing medical care and self-management. The purpose of the SCP is both to educate cancer survivors and to create a portable document that can be shared with primary care providers to facilitate coordinated care.6 There are multiple barriers to SCP implementation, which may include the time required to create an SCP, inadequate reimbursement for the time spent creating and delivering the plan, a lack of risk-stratified guidelines for coordinated care, and the incomplete automation of diagnosis and treatment summarization by the electronic health record (EHR).7
Survivorship care in radiation oncology
The American College of Radiology includes the recommendation for regular, ongoing follow-up in the standards for accreditation for radiation oncology practice.8 Radiation oncology practices often provide the initial follow-up appointment about a month after the prescribed radiation treatment has been completed. The twofold purpose of this appointment is to assess the response to treatment and to evaluate acute treatment-related effects.9 The appointment may include a skin evaluation, assessment for any acute treatment effects, informal counseling on maintaining a healthy lifestyle, and recommendations for posttreatment care and follow-up. The appointment may also be an opportune time for delivering the SCP because radiation therapy is often the final treatment modality in active therapy for breast cancer patients.
A review of the literature yields scant data on the incorporation of SCPs into a radiation oncology practice. A 2014 survey of members of the American Society of Radiation Oncology10for a response percentage of 14.7%. Almost all providers follow their patients after treatment (97% (n = 574 respondents/3987 total membership, 14.4% response rate) showed that although most radiation oncologists provide long-term follow-up care to their patients after treatment completion (97%), fewer than half of those surveyed indicated that they delivered SCPs for curative-intent patients (40%), and even fewer delivered for palliative-intent patients (19%). Standards for the American Society for Radiation Oncology’s Accreditation Program for Excellence11 outline content for end-of-treatment documentation. Typically, the documentation includes a detailed treatment summary prepared by the treating radiation oncologist. This treatment summary includes the patient’s diagnosis, the area treated, radiation doses received, number of fractions delivered, therapy start date, therapy completion date, and overall tolerance of treatment in a clinical summary. The treatment summary is communicated to other providers involved in the patient’s care to promote care coordination, but it is not typically provided to patients.
Development of University of Wisconsin survivorship care planning
As an important component of maintaining NAPBC accreditation, the University of Wisconsin (UW) Health Breast Center began the process of formalizing and optimizing SCPs for breast cancer survivors who are followed at the center. Multidisciplinary input from surgical, medical, and radiation oncology was obtained. Representatives from those disciplines met regularly to reach consensus on the treatment summary and SCP content. The following 3 documents were created for use during a transition visit at the end of treatment: the written individualized SCP to be provided to the survivor and his/her primary care providers, a general survivorship patient education booklet, and a patient questionnaire to identify survivors’ concerns and additional resources that may be beneficial.
Treatment summary
Working in collaboration with IT specialists, we enabled out-of-the-box functionality within our EHR. This cancer-specific functionality provides a central and standard location within each survivor’s problem list to systematically document information regarding cancer diagnosis, stage, and treatment associated with a specific cancer diagnosis. Each treating provider (surgeon, medical oncologist, radiation oncologist, genetic counselor, etc) is responsible for entering and updating the relevant components within the treatment summary (ie, the surgeon enters and maintains the surgical details, the medical oncologist does likewise for chemotherapy and other medical therapies, etc). Information is updated and current, creating a dynamic documentation of diagnosis and treatment that can be used in clinic notes, patient after-visit summaries, and SCPs.
Survivorship care plan
This same EHR functionality is leveraged to generate, populate, and maintain the individualized SCP for each breast cancer survivor. The Treatment Summary section of the SCP can be quickly prepared within the EHR by autopopulating data previously entered by treating providers. Content and language for SCP templates in breast, colorectal, prostate, and gynecologic cancers are in use at the time of publication. The templates are developed as a collaborative effort between oncology subspecialists, with input from the UW Health survivor and family advocacy councils.
Each template contains a Treatment Summary section and an SCP section. The Treatment Summary section includes survivor general information, diagnosis and treatment information, and the clinical and supportive/survivor care team names and contact information. The SCP section includes follow-up recommendations, signs of recurrence and/or symptoms to report, healthy lifestyle and maintenance, chronic or late effects of specific treatment if applicable (eg, surgery, chemotherapy by drug, radiation therapy, and endocrine therapy), and general resources for common psychosocial concerns (Table 1).12,13
Each SCP is visible to the entire health care team, including other specialists and primary care, as long as they have access to UW Health’s EHR.14 The result is a readily accessible, comprehensive document that is individualized for each survivor, residing in a standard location with standardized format and content to facilitate review and use.15
General survivorship patient education booklet
Many cancer survivors request additional information about their posttreatment concerns. The “UW Health Facts for You: Cancer Survivorship, Carbone Cancer Center” booklet was developed by a multidisciplinary team including oncologists, advanced practice providers (APPs), navigators, social workers, program leadership, cancer survivors, and caregivers. The guide includes detailed information for the cancer survivor on topics including nutrition, exercise, sleep, tobacco cessation, sexual health, and spirituality. Common concerns and symptom management are addressed as well as a comprehensive list of community resources. The booklet can be found at http://www.uwhealth.org/healthfacts/cancer/7834.
Survivorship questionnaire
Breast cancer survivors often have multiple concerns as they transition from active treatment to the survivorship phase of their cancer journey. Specific concerns may vary slightly form one survivor to another. Guided by recommendations for the American Society of Clinical Oncology and the National Comprehensive Cancer Network, we developed a 10-question, 2-page questionnaire to identify those concerns with input from members of the Breast Cancer Steering Committee. Members of the committee include surgical, medical, and radiation oncologists, AAPs, radiologists, pathologists, program leadership, and nurses, along with breast cancer survivors. Elements in the questionnaire include nutrition, activity, mood, sleep, sexual health, employment/insurance, pain/swelling, desires regarding pregnancy or prevention, memory/concentration, smoking, alcohol, genetic testing/counseling, and assistance with establishing care with a primary care provider. By completing the questionnaire, breast cancer survivors identify specific concerns within each category and are able to request additional information about those concerns and/or a referral to appropriate resources. They may also select the I need nothing further option if the concern is present but already being addressed.
SCP delivery and the transition visit
The next task in implementation of the care process for survivors encompassed the development of clinical workflows and processes to provide the document to the breast cancer survivor at the completion of treatment. In a study of breast cancer survivors, it was found that the preferred format for survivorship care planning is generally an in-person consultation at completion of treatment with an oncology professional.16 The best time for distribution of the written SCP is, however, unclear. Intuitively, it seems optimal to distribute SCPs around the time of completion of active treatment. However, for SCP delivery to be feasible and sustainable, delivery must be integrated into existing clinical care-delivery processes, and content must be streamlined and focused to meet the needs of their intended recipients without becoming overly burdensome to prepare and deliver.17
Ultimately, and after significant multidisciplinary discussion, it was determined that Stage 0-III breast cancer patients would have a visit focusing on symptoms and transitioning to surveillance follow-up (Transition Visit) as they completed active curative-intent cancer treatment. During this Transition Visit, the SCP document would be provided and reviewed with survivors. The Transition Visit for breast cancer survivors would be conducted by an APP following the completion of their final stage of active, primary treatment (surgery, chemotherapy, and/or radiation therapy). Additional long-term adjuvant therapy for breast cancer survivors (ie, trastuzumab, endocrine therapy) would continue as indicated during and after delivery of the SCP.
The radiation oncology clinic was chosen as a venue for these Transition Visits for breast cancer survivors whose treatment included radiotherapy. Despite little historical experience with delivery of SCPs in radiation oncology clinics, this was a logical choice given that radiotherapy is usually the final phase of active treatment for these breast cancer survivors, and a follow-up visit about a month after completing radiotherapy is already part of standard practice. Collaborating with the multidisciplinary UW Health Breast Center, we therefore integrated the formal breast survivorship care planning process and provision of the SCP into the current radiation oncology workflow. About 40% of the roughly 600 breast cancer patients treated by surgical and/or medical oncology at our institution annually also receive radiation therapy at our site. For the remaining 60% of breast cancer survivors who do not receive radiation therapy or who completed radiotherapy at an outside facility, the SCP is provided by an APP within the UW Health Breast Center.
UW radiation oncology survivorship transition visit
The overall workflow of our Transition Visit is depicted in the Figure. Toward the end of the breast cancer survivor’s radiation treatments, the radiation oncologist instructs the schedulers to arrange the 1-month, post-radiation Transition Visit with the APP and informs the survivor about the nature of the appointment. The Transition Visit is scheduled as a 60-minute appointment. Before the survivor’s arrival, an APP generates the written SCP. The activity includes completing the Treatment Summary, or verifying the accuracy of a prepopulated Treatment Summary, and individualizing the SCP section for the patient based on treatment received and follow-up recommendations using drop-down functionality. As the SCP is printed for review with the survivor, it is simultaneously sent to the survivor’s primary care provider. This is accomplished by using EHR functionality to route the document internally to UW primary care providers or automatically faxing the document to external primary care providers. Each SCP is also marked as complete within the EHR for the purposes of documenting compliance with this activity for later data analysis.
On arrival for the appointment, each breast cancer survivor completes the survivorship questionnaire. During the Transition Visit, the questionnaire is reviewed with the survivor and additional information is provided. Referral options are discussed if indicated with desired referrals made by the APP. The survivor is interviewed and examined for any persistent side effects of treatment. Next, the Treatment Summary and SCP are reviewed with the survivor, emphasizing the follow-up plan, signs or symptoms of breast cancer recurrence, and chronic or late treatment-related toxicities. Ample opportunity is provided for the survivor to ask questions and voice concerns.
Follow-up appointments with members of the patient’s care team (ie, medical, surgical, or radiation oncology) as well as necessary breast imaging (ie, mammogram, MRI) are coordinated and scheduled before the survivor leaves the department. A survey of oncologists (medical, surgical, radiation) identified specific cancer-related components of survivorship care that oncologists felt most responsible for as well as opportunities to improve the quality and efficiency of care provided by oncologists.18 At our institution, the breast surgical, medical, and radiation oncologists all generally participate in follow-up care through at least 1 year following completion of active, primary treatment.
Outcomes, quality improvement opportunities, and continued challenges with the process
There is presently a lack of long-term outcome data about the impact of SCPs. As mandates for the provision of SCPs are made, research focusing on whether SCPs result in improved health behaviors and outcomes, reduced burden in care transitions from the oncology setting, and increased cost-effectiveness will be needed.19 The long-term effects of SCPs on psychological, oncologic, and resource outcomes should be evaluated,20 as well as the impact on health behaviors, such as smoking cessation or participation in rehabilitation programs.21
Following the implementation of our Transition Visits in 2015, we conducted a quality improvement review. This review included summation of 69 recent breast cancer questionnaires from Transition Visits with our APPs (Table 2 and Table 3). The most common concerns raised by our breast cancer survivors include desire for weight loss, improving diet, and increasing physical activity. Of note, concerns did not often translate into a desire for more information or referrals.22 Survivors were generally satisfied with the timing of the Transition Visits and generally indicated that the visits were helpful, with self-reported improvements in their understanding of planned follow-up. A Canadian group evaluating breast and head and neck cancer survivors has suggested that SCPs could produce long-term improvements in healthy lifestyle behaviors; however, further research is needed to determine the extent to which SCPs might improve follow-up care over the long term.23
Finally, although efforts to date have been focused on the breast cancer survivor at the completion of treatment, long-term survivors may also benefit from receiving the SCP. A study by the American Cancer Society found that long-term cancer survivors had unmet informational needs, particularly with regard to screening, long-term cancer and treatment effects, and healthy lifestyle behaviors.24 Identifying and subsequently delivering an SCP to eligible long-term survivors is a challenging prospect, which depends on further refinement of EHR-based tracking of the date of diagnosis, cancer stage, and end-of-treatment date.
Summary and recommendations
Survivorship care has been efficiently integrated into our 1-month post-radiation follow-up appointment for breast cancer survivors. By using current resources in the radiation oncology department, the process has provided an effective way to deliver the SCP to breast cancer survivors. Future plans include implementing the process for all patients receiving curative-intent radiation for additional solid tumor survivors. Quality improvement projects will be developed to assess survivor satisfaction and the impact on health behaviors.
Acknowledgments
The authors thank Amy Heath, MS, RTT, for editorial and manuscript preparation assistance.
1. Statistics. National Cancer Institute, Division of Cancer Control & Population Sciences website. http:///cancercontrol.cancer.gov/ocs/statistics/statistics.html. Updated October 17, 2016. Accessed March 6, 2018.
2. Cancer facts & figures 2016. American Cancer Society website. https://www.cancer.org/research/cancer-facts-statistics/all-cancer-facts-figures/cancer-facts-figures-2016.html. Published 2016. Accessed February 27, 2018.
3. Hewitt M, Greenfield S, Stovall E, eds. From cancer patient to cancer survivor: lost in transition. Washington, DC: National Academies Press; 2006.
4. Knutson A, McNamara E. Cancer program standards: ensuring patient-centered care. American College of Surgeons website. https://www.facs.org/quality-programs/cancer/coc/standards. Published August 2016. Accessed March 6, 2018.
5. National Accreditation Program for Breast Centers. NAPBC standards manual. American College of Surgeons website. https://www.facs.org/~/media/files/quality%20programs/napbc/2014%20napbc%20standards%20manual.ashx. Published 2014. Accessed March 6, 2018.
6. Salz T, McCabe MS, Onstad EE, et al. Survivorship care plans: is there buy-in from community oncology providers? Cancer. 2014;120(5):722-730.
7. Mayer DK, Nekhlyudov L, Snyder CF, Merrill JK, Wollins DS, Shulman LN. American Society of Clinical Oncology clinical expert statement on cancer survivorship care planning. J Oncol Pract. 2014;10(6):345-351.
8. Dobelbower RR, Cotter G, Schilling PJ, Parsai EI, Carroll JM. Radiation oncology practice accreditation. Rays. 2001;26(3):191-198.
9. Hartford AC, Conway PD, Desai NB, et al. ACR-ASTRO practice parameter for communication: radiation oncology. The American College of Radiology website. http://www.acr.org/-/media/ACR/Files/Practice-Parameters/RadOnc.pdf. Updated 2014. Accessed March 6, 2018.
10. Koontz BF, Benda R, De Los Santos J, et al. US radiation oncology practice patterns for posttreatment survivor care. Pract Radiat Oncol. 2016;6(1):50-56.
11. American Society of Therapeutic Radiation Oncologists. APEx program standards. ASTRO website. http://www.astro.org/uploadedFiles/_MAIN_SITE/Daily_Practice/Accreditation/Content_Pieces/ProgramStandards.pdf. Published February 1, 2016. Accessed March 6, 2018.
12. Clinical practice survivorship guidelines and adaptations. American Society of Clinical Oncology website. http://www.asco.org/practice-guidelines/cancer-care-initiatives/prevention-survivorship. Published 2013. Accessed March 6, 2018.
13. National Comprehensive Cancer Network. Supportive care guidelines. NCNN website. http://www.nccn.org/professionals/physician_gls/f_guidelines.asp#supportive. Updated February 16, 2018. Accessed March 6, 2018.
14. Donohue S, Sesto ME, Hahn DL, et al. Evaluating primary care providers’ views on survivorship care plans generated by an electronic health record system. J Oncol Pract. 2015;11(3):e329-e335.
15. Tevaarwerk AJ, Wisinski KB, Buhr KA, et al. Leveraging electronic health record systems to create and provide electronic cancer survivorship care plans: a pilot study. J Oncol Pract. 2014;10(3):e150-e159.
16. Smith SL, Singh-Carlson S, Downie L, Payeur N, Wai ES. Survivors of breast cancer: patient perspectives on survivorship care planning. J Cancer Surviv. 2011;5(4):337-344.
17. Stricker CT, O’Brien M. Implementing the commission on cancer standards for survivorship care plans. Clin J Oncol Nurs. 2014;18(suppl 1):15-22.
18. Neuman HB, Steffens NM, Jacobson N, et al. Oncologists’ perspectives of their roles and responsibilities during multi-disciplinary breast cancer follow-up. Ann Surg Oncol. 2016;23(3):708-714.
19. Palmer SC, Stricker CT, Panzer SL, et al. Outcomes and satisfaction after delivery of a breast cancer survivorship care plan: Results of a multicenter trial. J Oncol Pract. 2015;11(2):e222-e229.
20. Brennan ME, Gormally JF, Butow P, Boyle FM, Spillane AJ. Survivorship care plans in cancer: a systematic review of care plan outcomes. Br J Cancer. 2014;111(10):1899-1908.
21. Chen RC, Hoffman KE, Sher DJ, et al. Development of a standard survivorship care plan template for radiation oncologists. Pract Radiat Oncol. 2016;6(1):57-65.
22. Seaborne LA, Huenerberg KJ, Bohler A, et al. Developing electronic health record based program to deliver survivorship care plans and visits at the UW breast center. Poster presented at American Society of Clinical Oncology Survivorship Symposium; January 15-16, 2016; San Francisco CA.
23. Collie K, McCormick J, Waller A, et al. Qualitative evaluation of care plans for Canadian breast and head-and-neck cancer survivors. Curr Oncol. 2014;21(1):18-28.
24. Playdon M, Ferrucci LM, McCorkle R, et al. Health information needs and preferences in relation to survivorship care plans of long-term cancer survivors in the American Cancer Society’s study of cancer survivors-I. J Cancer Surviv. 2016;10(4):674-685.
Implementation of Attention-Deficit/Hyperactivity Disorder Guidelines in an Urban Pediatric Primary Care Clinic
From the Children’s National Health System, Washington, DC (Dr. Manget, Dr. Kelley, Dr. White) and the Duke University School of Nursing, Durham, NC (Dr. Blood-Siegfried).
Abstract
- Background: Approximately 11% of children in the United States ages 4 to 17 have received the diagnosis of attention-deficit hyperactive disorder (ADHD). There are disproportionately higher rates of the diagnosis and fewer child psychiatrists available in underserved areas. The American Academy of Pediatrics (AAP) strongly encourages improved mental health competencies among primary care providers to combat this shortage.
- Objective: To improve primary care providers’ knowledge and confidence with the management of ADHD and institute an evidence-based process for assessing patients presenting with behavior concerns suggestive of ADHD.
- Methods: Three in-person educational sessions were conducted for primary care providers by a child psychiatrist to increase providers’ knowledge and confidence in the evaluation and management of ADHD. A Behavior Management Plan was also adopted for use in the clinic. Providers were encouraged to use the plan during patient visits for behavior concerns indicative of ADHD. Pre- and post-test surveys were given to providers to assess change in comfort level with managing ADHD. Patient charts were reviewed to determine how often the Behavior Management Plan was utilized.
- Results: We did not find significant changes in provider comfort in managing ADHD according to the survey results, although providers reported that the educational sessions and handouts were useful. Behavior Management Plans were utilized during 13 of 25 (52%) eligible visits.
- Conclusions: Behavior Management Plans were introduced in just over half of relevant visits. Further exploration about barriers to use of the plan and its utility to patients and families should be pursued in the future. Additionally, ongoing opportunities for continuing education and collaboration with psychiatry should continue to be sought.
Keywords: attention-deficit hyperactive disorder; ADHD; AAP clinical guidelines; underserved populations; disadvantaged communities.
The importance of the mental health of a child cannot be underestimated. Untreated symptoms of attention deficit/hyperactivity disorder (ADHD) can significantly interfere with school and social functioning [1]. Children with ADHD often have comorbid conditions such as anxiety, low self-esteem and learning disabilities. It is vital to screen and treat for ADHD and comorbidities early and comprehensively [2].
There are disproportionately higher rates of children diagnosed with ADHD living in underserved areas compared to other geographical regions [3]. The historically underserved Southeast region of Washington D.C. which encompasses Wards 7 and 8 is home to nearly 40% of the district’s children and has the highest rates of children with an ADHD diagnosis in D.C.; however, the majority of child psychiatrists are located in the Northwest regions [4]. In 2009, nearly 8% of children in Washington D.C. were reported to have a diagnosis of ADHD [1].
Due to the overwhelming demand and limited availability of child psychiatrists, it is important that primary care providers become better equipped to diagnose, treat, and manage non-complex cases of ADHD. Specific education about ADHD diagnosis and management along with implementation of standardized center-based processes may help primary care providers feel more comfortable caring for these patients and ensure that all patients presenting with behavior concerns are adequately assessed and treated.
The American Academy of Pediatrics (AAP) recommends that primary care providers expand their mental health competencies because pediatric primary care providers in the medical home will be the first point of access in most cases [5]. In 2011, the AAP Subcommittee on ADHD and Steering Committee on Quality Improvement and Management released clinical practice guidelines for diagnosis, evaluation, and treatment of ADHD [6]. These guidelines, which recommend that providers should initiate ADHD assessments for children ages 6 to 12 that present with behavioral and/or academic problems, have been incorporated into “Caring for Children with ADHD: A Resource Toolkit for Clinicians” by the AAP in partnership with the National Institute on Children’s Health Quality (NICHQ) and North Carolina’s Center for Child Health.
Our clinic has two on-site psychiatrists who provide evaluation and treatment of mental health problems in children identified by primary care providers for a combined total of 1.5 days each week. The current wait for psychiatric evaluation at our clinic is 2 to 3 months, which leaves the primary care providers to care for many children with behavior concerns who require more immediate intervention at the time of their presentation. Our clinic providers revealed that they felt there were deficits in the management of behavior concerns and initiating treatment for patients diagnosed with ADHD in the clinic. Providers expressed an interest in refreshing and enhancing their knowledge related to managing patients with ADHD.
To address this issue, we initiated a quality improvement project with several facets: provide ADHD education to primary care providers through use of educational sessions from our on-site psychiatrists, standardize the process of managing patients that present with behavior concerns to the primary care provider in the medical home, and develop a comprehensive and individualized patient management plan based on the “Caring for Children with ADHD” toolkit for clinicians.
Methods
Setting
This project took place in a federally qualified health center located in the Southeast quadrant of Washington, D.C. that serves patients up to 23 years of age. The clinic has 6 primary care medical providers (5 physicians and 1 nurse practitioner) employed in a part-time to full-time capacity. Additionally, 2 child psychiatrists provide services on-site during one full day and one half-day session on a weekly basis. Approximately 98% of patients at the clinic are classified as African American and close to 95% of patients are insured by Medicaid. Approximately 9% of patients in our clinic had a medical diagnosis of ADHD as of 2015.
Patients who presented to the clinic in April and May 2017 who had an existing diagnosis of ADHD and those with documentation of a new behavior concern in the assessment and treatment plan were studied. Eligible visit types were annual well-child checks, new consults for behavior, and follow-up appointments specifically for behavior.
This was a project undertaken as a quality improvement initiative at the hosting facility and did not constitute human subjects research. As such, it was not under the oversight of the institutional review board.
Intervention
Provider Education. Three in-person sessions were held at the clinic during April–May 2017 to provide education on the assessment and treatment of patients with ADHD and discuss challenges that have arisen when providing care for such patients. The sessions focused on diagnosing ADHD and teasing out comorbidities; initiating and titrating medications safely; educational rights; and strategies for managing behavior and community resources.
Current providers as well as medical residents and student trainees of the clinic were invited to attend the educational sessions. Each session followed a “lunch and learn” format where one of the clinic psychiatrists presented the information during the clinic lunch hour then related a discussion where participants asked questions. The information provided was derived from the Diagnostic and Statistical Manual of Mental Disorders (DSM–5) and the AAP/NICHQ Toolkit [5]. Educational handouts were disseminated during the provider sessions and emailed to all providers afterwards.
Behavior Management Plan. In March we introduced the providers to the Behavior Management Plan (Figure), 

Providers were encouraged to initiate the Behavior Management Plan for patients that presented without an existing diagnosis for evaluation of their behavior concerns. The plan could also be used for patients that had previously been diagnosed with ADHD if changes were being made to their treatment plan or as a summary of their established treatment details. Instructions on the use of the plan were given to all clinic primary care providers through email communication as well as in the first in-person educational session. It was stressed to providers that formulating individual patient goals and the inclusion of a specific follow-up time were the most important aspects of the plan.
Assessment and Measurements
We assessed provider comfort in their ADHD evaluation and management skills before and after the intervention using a 5–point Likert scale questionnaire with 0 indicating “not comfortable at all” and 5 corresponding to “very comfortable.” The questionnaire was administered via a paper survey for the initial screening and an electronic survey at the conclusion of the intervention.
Patient charts were reviewed in July 2017 to determine how often the Behavior Management Plan was utilized. Provider documentation in the electronic medical record indicating that the Plan was given during the patient visit was considered utilization of the plan. We also examined documentation of dissemination/return of Vanderbilt ADHD assessment scales, referrals to psychiatry or counseling, and the initiation or refill of an ADHD medication during the encounter for all patients that were seen for behavior concerns. Patient data were obtained from manual chart review of the electronic medical record, eClinicalWorks.
Analysis
SPSS Statistics (Version 24) was used to conduct analyses. Independent sample t tests were employed to measure items related to the provider educational sessions. Mean provider responses for each item were reviewed from descriptive statistics. A chi-square cross tabulation was used to compare the percentage of patients receiving a Behavior Management Plan that adhered to follow-up visits versus a similar sample of patients that presented in 2016 before the introduction of the Behavior Management Plan. In addition, a chi-square cross tabulation was utilized to compare adherence to follow-up visits in those that received the Management Plan to that of eligible patients that presented during the same time period but did not receive the Plan. Additional chi-square tests were run to see if there was any difference in 2017 follow-up rates based on individual provider or visit type .
Results
Provider Questionnaire
Six providers responded to the pre-intervention questionnaire and five to the post-intervention questionnaire. The specific questions and their results are listed in Table 1. 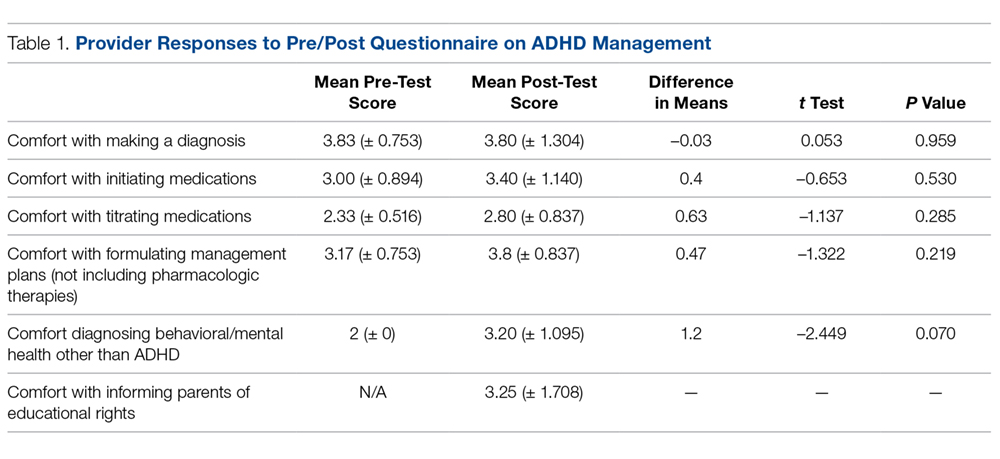
Patient Management
Between April and May 2017, 61 eligible patients presented to the clinic. Details of the breakdown of patient visit type are displayed in Table 2. 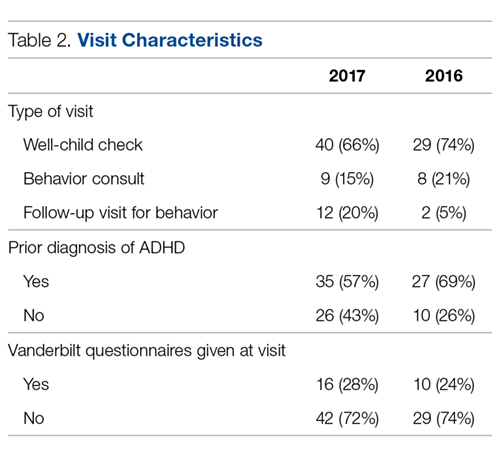
Follow-up Rates
Notation of a specific time frame for follow-up by a primary care provider was found in 24 of 61 (39%) relevant patient charts (Table 3). 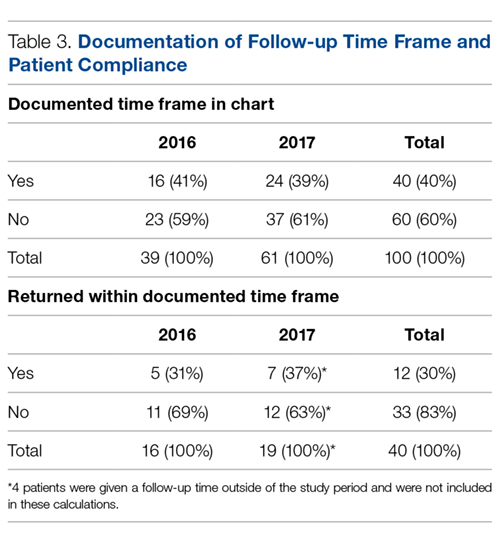
Further cross-tabulations were completed to assess if there were better follow-up rates for patients that received a Behavior Management Plan. The difference between the 2 groups was not significant (P = 0.99). There were no significant differences found in follow-up rates based on the provider for the visit (P = 0.51) or the type of patient visit (well child examination vs. behavior consult) (P = 0.65).
Discussion
This project aimed to improve provider confidence in the assessment and treatment of ADHD and improve ADHD management by providers at our clinic. We did not find significant changes in confidence according to the survey results. However, provider feedback indicated that, as a result of the educational sessions, they had a deeper appreciation for the presence of psychiatric comorbidities and the role they play in deciding appropriate treatment. They also reported that they more fully understood the need to refer to child psychiatry for evaluation and management when comorbidities are present instead of attempting to independently provide ADHD medication.
We hoped to see the Behavior Management Plan used for patients with new behavior concerns during the evaluation for ADHD. During the intervention period, it was used in half of eligible clinic visits of patients without a prior diagnosis of ADHD. Future investigation should be directed at receiving specific input on the utility of the Behavior Management Plan from providers and families. The Management Plan contains important reminders and treatment information; however, if the plan is not perceived as effective or useful, taking the time needed to complete it may be seen as an additional cumbersome step in the already overloaded clinic visits.
The use of the Behavior Management Plan was not found to make a statistically significant difference in follow-up rates. Attendance at follow-up appointments for ADHD patients is not an area that has been greatly studied. In a recent analysis of ADHD treatment quality in Medicaid-enrolled children, African American families were less likely to have adequate follow-up compared to Caucasian counterparts during the initiation or continuation and management phases of treatment. The review of specific follow-through rates showed that African Americans were 22% more likely to discontinue medication therapy and 13% more likely to disengage from treatment. The authors propose that future efforts focus on improving accessibility of behavioral therapy to combat the discontinuation rates and disparities in this area [8]. Another study that looked at a prospective cohort of ADHD patients found suboptimal attendance at appointments with a median of 1 visit every 6 months [9]. Further exploration of the challenges with attendance at follow-up appointments is warranted to help determine best practices for ADHD management in disadvantaged communities. More information is needed on the specific barriers to care in this subgroup at our clinic. However, data from this project related to adherence to follow-up appointments can be used to guide future studies.
Use of a Behavior Management Plan was not found to influence the return of completed teacher Vanderbilt scales by families. The rates of return of these assessment forms continue to be very low. Without input from teachers and schools, it is difficult to properly diagnose, treat and evaluate the treatment of patients. Feedback from all sources is essential for both medication management and construction of interventions for behavioral challenges at school. The development of partnerships with a child’s school may be useful in helping patients return for the treatment of behavior concerns at their initial stages. Before children are expelled multiple times due to their behavior, schools should strongly encourage parents to notify their healthcare provider of behavior concerns for evaluation.
In an ideal system, school-based nurses, guidance counselors or social workers could provide some case management and outreach to families of children with known behavior concerns to ensure they are attending appointments as recommended by their treatment plan and explore barriers to doing so. Social workers can provide direct mental health care services and make referrals to community agencies. However, the caseload for school-based providers is currently quite high and many children slip through the cracks until their behavior escalates to a dangerous and/or very disruptive level. School-based personnel in several districts are now required to split their time in multiple schools. Dang et al describe the piloting of a school-based framework for early identification and assessment of children suspected to have ADHD. The framework, called ADHD Identification and Management in Schools (AIMS), encourages school nurses to gather all parent and teacher assessment materials prior to the initial visit to their primary care providers thus reducing the number of visits needed and leading to faster diagnosis and treatment [10].
Clinic-based case managers solely dedicated to this population would also be useful. These case managers could provide management as described above and also potentially sit-in on clinic visits for behavior concerns so that they are fully aware of the instructions given by the provider. This would also give them the information needed so that they are able to complete forms such as the Behavior Management Plan, which would be helpful in relieving some provider time. Geltman et al trialed a workflow intervention with electronic Vanderbilt scales and an electronic registry managed by a care coordination team of a physician, nurse and medical assistant. This allowed patient calls to the families by the nurse or medical assistant to remind them of necessary follow-up and monthly meetings with the care coordination team. Those in the intervention group with the care coordination team were twice as likely to return the Vanderbilt questionnaires. During the intervention period, the rates of follow-up visits remained the same; however, when the intervention was further adopted and expanded to other sites, follow-up attendance improved to over 90% [11].
Limitations
Limitations of this project include the short time period in which it was conducted as well as the size of the study sample. Provider work schedules also caused some challenges with arranging the lunch and learn educational sessions and completing independent review of materials on the subject. This project focused on a primarily African American, predominately Medicaid population. Within urban and/or underserved populations, there may be other demographic distributions thus limiting the generalizability of these findings.
Summary
In summary, this project attempted to improve provider confidence in management of ADHD and standardize assessment practices of one urban pediatric clinic. At the project’s conclusion there were subjective improvements in provider confidence. Ongoing opportunities for continuing education on management of mental health diagnoses for primary care providers should persevere. This project also highlights the persistent problem of patient follow-up for behavior concerns. Further exploration of challenges with attendance at follow-up appointments including collaboration with community and academic resources is needed to help determine best practices for ADHD management in disadvantaged communities.
Corresponding author: Jaytoya C. Manget, DNP, MSPH, FNP, jmanget@childrensnational.org.
Financial disclosures: None.
1. Visser SN, Danielson ML, Bitsko RH, et al. Trends in the parent-report of health care provider-diagnosed and medicated attention-deficit/hyperactivity disorder: United States, 2003-2011. J Am Acad Child Adol Psychiatry 2014;53:34–46.
2. Charach A, Dashti B, Carson P, et al. Attention deficit hyperactivity disorder: effectiveness of treatment in at-risk preschoolers; long-term effectiveness in all ages; and variability in prevalence, diagnosis, and treatment [Internet]. Rockville (MD): Agency for Healthcare Research and Quality; 2011.
3. John M. Eisenberg Center for Clinical Decisions and Communications Science. Attention deficit hyperactivity disorder in children and adolescents. 2012 Jun 26. Comparative Effectiveness Review Summary Guides for Clinicians [Internet]. Rockville (MD): Agency for Healthcare Research and Quality; 2007-2012.
4. Wotring JR, O’Grady KA, Anthony BJ, et al. Behavioral health for children, youth and families in the District of Columbia: A review of prevalence, service utilization, barriers, and recommendations. Washington, DC: Georgetown University Center for Child and Human Development, National Technical Assistance Center for Children’s Mental Health; 2014.
5. American Academy of Pediatrics. Caring for children with ADHD: a resource toolkit for clinicians. [CD-ROM] Elk Grove Village, IL: American Academy of Pediatrics; 2011.
6. American Academy of Pediatrics, Subcommittee on Attention-Deficit/Hyperactive Disorder, Steering Committee on Quality Improvement and Management. ADHD: clinical practice guideline for the diagnosis, evaluation, and treatment of attention-deficit/hyperactivity disorder in children and adolescents. Pediatrics 2011;128:1007–22.
7. American Academy of Pediatrics and National Institute for Children’s Healthcare Quality. NICQH Vanderbilt Assessment Scales: Used for diagnosing ADHD. Elk Grove Village, IL: American Academy of Pediatrics; 2002.
8. Cummings JR, Ji X, Allen L, et al. Racial and ethnic differences in ADHD treatment quality among Medicaid-enrolled youth. Pediatrics 2017;139(6).
9. Gardner W, Kelleher KJ, Pajer K, Campo, JV. Follow-up care of children identified with ADHD by primary care clinicians: A prospective cohort study. J Pediatrics 2004;145:767–71.
10. Dang MT, Warrington D, Tung T, et al. A school-based approach to early identification and management of students with ADHD. J Sch Nurs 2007:2–12.
11. Geltman PL, Fried LE, Arsenault LN, et al. A planned care approach and patient registry to improve adherence to clinical guidelines for the diagnosis and management of attention-deficit/hyperactivity disorder. Acad Pediatrics 2015;15:289–96.
From the Children’s National Health System, Washington, DC (Dr. Manget, Dr. Kelley, Dr. White) and the Duke University School of Nursing, Durham, NC (Dr. Blood-Siegfried).
Abstract
- Background: Approximately 11% of children in the United States ages 4 to 17 have received the diagnosis of attention-deficit hyperactive disorder (ADHD). There are disproportionately higher rates of the diagnosis and fewer child psychiatrists available in underserved areas. The American Academy of Pediatrics (AAP) strongly encourages improved mental health competencies among primary care providers to combat this shortage.
- Objective: To improve primary care providers’ knowledge and confidence with the management of ADHD and institute an evidence-based process for assessing patients presenting with behavior concerns suggestive of ADHD.
- Methods: Three in-person educational sessions were conducted for primary care providers by a child psychiatrist to increase providers’ knowledge and confidence in the evaluation and management of ADHD. A Behavior Management Plan was also adopted for use in the clinic. Providers were encouraged to use the plan during patient visits for behavior concerns indicative of ADHD. Pre- and post-test surveys were given to providers to assess change in comfort level with managing ADHD. Patient charts were reviewed to determine how often the Behavior Management Plan was utilized.
- Results: We did not find significant changes in provider comfort in managing ADHD according to the survey results, although providers reported that the educational sessions and handouts were useful. Behavior Management Plans were utilized during 13 of 25 (52%) eligible visits.
- Conclusions: Behavior Management Plans were introduced in just over half of relevant visits. Further exploration about barriers to use of the plan and its utility to patients and families should be pursued in the future. Additionally, ongoing opportunities for continuing education and collaboration with psychiatry should continue to be sought.
Keywords: attention-deficit hyperactive disorder; ADHD; AAP clinical guidelines; underserved populations; disadvantaged communities.
The importance of the mental health of a child cannot be underestimated. Untreated symptoms of attention deficit/hyperactivity disorder (ADHD) can significantly interfere with school and social functioning [1]. Children with ADHD often have comorbid conditions such as anxiety, low self-esteem and learning disabilities. It is vital to screen and treat for ADHD and comorbidities early and comprehensively [2].
There are disproportionately higher rates of children diagnosed with ADHD living in underserved areas compared to other geographical regions [3]. The historically underserved Southeast region of Washington D.C. which encompasses Wards 7 and 8 is home to nearly 40% of the district’s children and has the highest rates of children with an ADHD diagnosis in D.C.; however, the majority of child psychiatrists are located in the Northwest regions [4]. In 2009, nearly 8% of children in Washington D.C. were reported to have a diagnosis of ADHD [1].
Due to the overwhelming demand and limited availability of child psychiatrists, it is important that primary care providers become better equipped to diagnose, treat, and manage non-complex cases of ADHD. Specific education about ADHD diagnosis and management along with implementation of standardized center-based processes may help primary care providers feel more comfortable caring for these patients and ensure that all patients presenting with behavior concerns are adequately assessed and treated.
The American Academy of Pediatrics (AAP) recommends that primary care providers expand their mental health competencies because pediatric primary care providers in the medical home will be the first point of access in most cases [5]. In 2011, the AAP Subcommittee on ADHD and Steering Committee on Quality Improvement and Management released clinical practice guidelines for diagnosis, evaluation, and treatment of ADHD [6]. These guidelines, which recommend that providers should initiate ADHD assessments for children ages 6 to 12 that present with behavioral and/or academic problems, have been incorporated into “Caring for Children with ADHD: A Resource Toolkit for Clinicians” by the AAP in partnership with the National Institute on Children’s Health Quality (NICHQ) and North Carolina’s Center for Child Health.
Our clinic has two on-site psychiatrists who provide evaluation and treatment of mental health problems in children identified by primary care providers for a combined total of 1.5 days each week. The current wait for psychiatric evaluation at our clinic is 2 to 3 months, which leaves the primary care providers to care for many children with behavior concerns who require more immediate intervention at the time of their presentation. Our clinic providers revealed that they felt there were deficits in the management of behavior concerns and initiating treatment for patients diagnosed with ADHD in the clinic. Providers expressed an interest in refreshing and enhancing their knowledge related to managing patients with ADHD.
To address this issue, we initiated a quality improvement project with several facets: provide ADHD education to primary care providers through use of educational sessions from our on-site psychiatrists, standardize the process of managing patients that present with behavior concerns to the primary care provider in the medical home, and develop a comprehensive and individualized patient management plan based on the “Caring for Children with ADHD” toolkit for clinicians.
Methods
Setting
This project took place in a federally qualified health center located in the Southeast quadrant of Washington, D.C. that serves patients up to 23 years of age. The clinic has 6 primary care medical providers (5 physicians and 1 nurse practitioner) employed in a part-time to full-time capacity. Additionally, 2 child psychiatrists provide services on-site during one full day and one half-day session on a weekly basis. Approximately 98% of patients at the clinic are classified as African American and close to 95% of patients are insured by Medicaid. Approximately 9% of patients in our clinic had a medical diagnosis of ADHD as of 2015.
Patients who presented to the clinic in April and May 2017 who had an existing diagnosis of ADHD and those with documentation of a new behavior concern in the assessment and treatment plan were studied. Eligible visit types were annual well-child checks, new consults for behavior, and follow-up appointments specifically for behavior.
This was a project undertaken as a quality improvement initiative at the hosting facility and did not constitute human subjects research. As such, it was not under the oversight of the institutional review board.
Intervention
Provider Education. Three in-person sessions were held at the clinic during April–May 2017 to provide education on the assessment and treatment of patients with ADHD and discuss challenges that have arisen when providing care for such patients. The sessions focused on diagnosing ADHD and teasing out comorbidities; initiating and titrating medications safely; educational rights; and strategies for managing behavior and community resources.
Current providers as well as medical residents and student trainees of the clinic were invited to attend the educational sessions. Each session followed a “lunch and learn” format where one of the clinic psychiatrists presented the information during the clinic lunch hour then related a discussion where participants asked questions. The information provided was derived from the Diagnostic and Statistical Manual of Mental Disorders (DSM–5) and the AAP/NICHQ Toolkit [5]. Educational handouts were disseminated during the provider sessions and emailed to all providers afterwards.
Behavior Management Plan. In March we introduced the providers to the Behavior Management Plan (Figure),
Providers were encouraged to initiate the Behavior Management Plan for patients that presented without an existing diagnosis for evaluation of their behavior concerns. The plan could also be used for patients that had previously been diagnosed with ADHD if changes were being made to their treatment plan or as a summary of their established treatment details. Instructions on the use of the plan were given to all clinic primary care providers through email communication as well as in the first in-person educational session. It was stressed to providers that formulating individual patient goals and the inclusion of a specific follow-up time were the most important aspects of the plan.
Assessment and Measurements
We assessed provider comfort in their ADHD evaluation and management skills before and after the intervention using a 5–point Likert scale questionnaire with 0 indicating “not comfortable at all” and 5 corresponding to “very comfortable.” The questionnaire was administered via a paper survey for the initial screening and an electronic survey at the conclusion of the intervention.
Patient charts were reviewed in July 2017 to determine how often the Behavior Management Plan was utilized. Provider documentation in the electronic medical record indicating that the Plan was given during the patient visit was considered utilization of the plan. We also examined documentation of dissemination/return of Vanderbilt ADHD assessment scales, referrals to psychiatry or counseling, and the initiation or refill of an ADHD medication during the encounter for all patients that were seen for behavior concerns. Patient data were obtained from manual chart review of the electronic medical record, eClinicalWorks.
Analysis
SPSS Statistics (Version 24) was used to conduct analyses. Independent sample t tests were employed to measure items related to the provider educational sessions. Mean provider responses for each item were reviewed from descriptive statistics. A chi-square cross tabulation was used to compare the percentage of patients receiving a Behavior Management Plan that adhered to follow-up visits versus a similar sample of patients that presented in 2016 before the introduction of the Behavior Management Plan. In addition, a chi-square cross tabulation was utilized to compare adherence to follow-up visits in those that received the Management Plan to that of eligible patients that presented during the same time period but did not receive the Plan. Additional chi-square tests were run to see if there was any difference in 2017 follow-up rates based on individual provider or visit type .
Results
Provider Questionnaire
Six providers responded to the pre-intervention questionnaire and five to the post-intervention questionnaire. The specific questions and their results are listed in Table 1.
Patient Management
Between April and May 2017, 61 eligible patients presented to the clinic. Details of the breakdown of patient visit type are displayed in Table 2.
Follow-up Rates
Notation of a specific time frame for follow-up by a primary care provider was found in 24 of 61 (39%) relevant patient charts (Table 3).
Further cross-tabulations were completed to assess if there were better follow-up rates for patients that received a Behavior Management Plan. The difference between the 2 groups was not significant (P = 0.99). There were no significant differences found in follow-up rates based on the provider for the visit (P = 0.51) or the type of patient visit (well child examination vs. behavior consult) (P = 0.65).
Discussion
This project aimed to improve provider confidence in the assessment and treatment of ADHD and improve ADHD management by providers at our clinic. We did not find significant changes in confidence according to the survey results. However, provider feedback indicated that, as a result of the educational sessions, they had a deeper appreciation for the presence of psychiatric comorbidities and the role they play in deciding appropriate treatment. They also reported that they more fully understood the need to refer to child psychiatry for evaluation and management when comorbidities are present instead of attempting to independently provide ADHD medication.
We hoped to see the Behavior Management Plan used for patients with new behavior concerns during the evaluation for ADHD. During the intervention period, it was used in half of eligible clinic visits of patients without a prior diagnosis of ADHD. Future investigation should be directed at receiving specific input on the utility of the Behavior Management Plan from providers and families. The Management Plan contains important reminders and treatment information; however, if the plan is not perceived as effective or useful, taking the time needed to complete it may be seen as an additional cumbersome step in the already overloaded clinic visits.
The use of the Behavior Management Plan was not found to make a statistically significant difference in follow-up rates. Attendance at follow-up appointments for ADHD patients is not an area that has been greatly studied. In a recent analysis of ADHD treatment quality in Medicaid-enrolled children, African American families were less likely to have adequate follow-up compared to Caucasian counterparts during the initiation or continuation and management phases of treatment. The review of specific follow-through rates showed that African Americans were 22% more likely to discontinue medication therapy and 13% more likely to disengage from treatment. The authors propose that future efforts focus on improving accessibility of behavioral therapy to combat the discontinuation rates and disparities in this area [8]. Another study that looked at a prospective cohort of ADHD patients found suboptimal attendance at appointments with a median of 1 visit every 6 months [9]. Further exploration of the challenges with attendance at follow-up appointments is warranted to help determine best practices for ADHD management in disadvantaged communities. More information is needed on the specific barriers to care in this subgroup at our clinic. However, data from this project related to adherence to follow-up appointments can be used to guide future studies.
Use of a Behavior Management Plan was not found to influence the return of completed teacher Vanderbilt scales by families. The rates of return of these assessment forms continue to be very low. Without input from teachers and schools, it is difficult to properly diagnose, treat and evaluate the treatment of patients. Feedback from all sources is essential for both medication management and construction of interventions for behavioral challenges at school. The development of partnerships with a child’s school may be useful in helping patients return for the treatment of behavior concerns at their initial stages. Before children are expelled multiple times due to their behavior, schools should strongly encourage parents to notify their healthcare provider of behavior concerns for evaluation.
In an ideal system, school-based nurses, guidance counselors or social workers could provide some case management and outreach to families of children with known behavior concerns to ensure they are attending appointments as recommended by their treatment plan and explore barriers to doing so. Social workers can provide direct mental health care services and make referrals to community agencies. However, the caseload for school-based providers is currently quite high and many children slip through the cracks until their behavior escalates to a dangerous and/or very disruptive level. School-based personnel in several districts are now required to split their time in multiple schools. Dang et al describe the piloting of a school-based framework for early identification and assessment of children suspected to have ADHD. The framework, called ADHD Identification and Management in Schools (AIMS), encourages school nurses to gather all parent and teacher assessment materials prior to the initial visit to their primary care providers thus reducing the number of visits needed and leading to faster diagnosis and treatment [10].
Clinic-based case managers solely dedicated to this population would also be useful. These case managers could provide management as described above and also potentially sit-in on clinic visits for behavior concerns so that they are fully aware of the instructions given by the provider. This would also give them the information needed so that they are able to complete forms such as the Behavior Management Plan, which would be helpful in relieving some provider time. Geltman et al trialed a workflow intervention with electronic Vanderbilt scales and an electronic registry managed by a care coordination team of a physician, nurse and medical assistant. This allowed patient calls to the families by the nurse or medical assistant to remind them of necessary follow-up and monthly meetings with the care coordination team. Those in the intervention group with the care coordination team were twice as likely to return the Vanderbilt questionnaires. During the intervention period, the rates of follow-up visits remained the same; however, when the intervention was further adopted and expanded to other sites, follow-up attendance improved to over 90% [11].
Limitations
Limitations of this project include the short time period in which it was conducted as well as the size of the study sample. Provider work schedules also caused some challenges with arranging the lunch and learn educational sessions and completing independent review of materials on the subject. This project focused on a primarily African American, predominately Medicaid population. Within urban and/or underserved populations, there may be other demographic distributions thus limiting the generalizability of these findings.
Summary
In summary, this project attempted to improve provider confidence in management of ADHD and standardize assessment practices of one urban pediatric clinic. At the project’s conclusion there were subjective improvements in provider confidence. Ongoing opportunities for continuing education on management of mental health diagnoses for primary care providers should persevere. This project also highlights the persistent problem of patient follow-up for behavior concerns. Further exploration of challenges with attendance at follow-up appointments including collaboration with community and academic resources is needed to help determine best practices for ADHD management in disadvantaged communities.
Corresponding author: Jaytoya C. Manget, DNP, MSPH, FNP, jmanget@childrensnational.org.
Financial disclosures: None.
1. Visser SN, Danielson ML, Bitsko RH, et al. Trends in the parent-report of health care provider-diagnosed and medicated attention-deficit/hyperactivity disorder: United States, 2003-2011. J Am Acad Child Adol Psychiatry 2014;53:34–46.
2. Charach A, Dashti B, Carson P, et al. Attention deficit hyperactivity disorder: effectiveness of treatment in at-risk preschoolers; long-term effectiveness in all ages; and variability in prevalence, diagnosis, and treatment [Internet]. Rockville (MD): Agency for Healthcare Research and Quality; 2011.
3. John M. Eisenberg Center for Clinical Decisions and Communications Science. Attention deficit hyperactivity disorder in children and adolescents. 2012 Jun 26. Comparative Effectiveness Review Summary Guides for Clinicians [Internet]. Rockville (MD): Agency for Healthcare Research and Quality; 2007-2012.
4. Wotring JR, O’Grady KA, Anthony BJ, et al. Behavioral health for children, youth and families in the District of Columbia: A review of prevalence, service utilization, barriers, and recommendations. Washington, DC: Georgetown University Center for Child and Human Development, National Technical Assistance Center for Children’s Mental Health; 2014.
5. American Academy of Pediatrics. Caring for children with ADHD: a resource toolkit for clinicians. [CD-ROM] Elk Grove Village, IL: American Academy of Pediatrics; 2011.
6. American Academy of Pediatrics, Subcommittee on Attention-Deficit/Hyperactive Disorder, Steering Committee on Quality Improvement and Management. ADHD: clinical practice guideline for the diagnosis, evaluation, and treatment of attention-deficit/hyperactivity disorder in children and adolescents. Pediatrics 2011;128:1007–22.
7. American Academy of Pediatrics and National Institute for Children’s Healthcare Quality. NICQH Vanderbilt Assessment Scales: Used for diagnosing ADHD. Elk Grove Village, IL: American Academy of Pediatrics; 2002.
8. Cummings JR, Ji X, Allen L, et al. Racial and ethnic differences in ADHD treatment quality among Medicaid-enrolled youth. Pediatrics 2017;139(6).
9. Gardner W, Kelleher KJ, Pajer K, Campo, JV. Follow-up care of children identified with ADHD by primary care clinicians: A prospective cohort study. J Pediatrics 2004;145:767–71.
10. Dang MT, Warrington D, Tung T, et al. A school-based approach to early identification and management of students with ADHD. J Sch Nurs 2007:2–12.
11. Geltman PL, Fried LE, Arsenault LN, et al. A planned care approach and patient registry to improve adherence to clinical guidelines for the diagnosis and management of attention-deficit/hyperactivity disorder. Acad Pediatrics 2015;15:289–96.
Reducing Deep Joint Infection in Hip Hemiarthroplasty—A Quality Improvement Project
From the Department of Trauma and Orthopaedics, Royal Victoria Hospital, Belfast, N. Ireland.
Abstract
- Objective: To improve the deep wound infection rate in patients undergoing hip hemiarthroplasty in our regional trauma center.
- Methods: We conducted a retrospective audit of patients who had undergone hip hemiarthroplasty between January 2013 and July 2014 and found that in 750 hip hemiarthroplasties performed, 20 (2.7%) developed a deep infection, a figure in excess of the literature standard. In line with international consensus recommendations, 4 changes to our perioperative practice were implemented: standardized draping of the affected extremity, improved skin preparation using a 2% chlorhexidine gluconate solution, change of incision drapes to iodophor-impregnated adhesive film drapes, and the use of interactive wound dressing. We conducted staff education to highlight the impact of deep wound infection, introduce the changes, and underscore the importance of strict adherence to intraoperative sterility.
- Results: One year after introducing the changes, we audited the period April 2015 to March 2016, during which time 457 hip hemiarthoplasties were performed. Five (1.1%) deep infections were identified.
- Conclusion: Improvement in the perioperative care of our hip hemiarthroplasty patients has resulted in a reduced risk of the development of deep wound infection. This improvement was maintained in a third audit period, with continued implementation of these changes in practice.
Keywords: deep infection; hip hemiarthroplasty; quality improvement; proximal femoral fracture; risk reduction strategies.
Deep wound infection following hip hemiarthroplasty is a catastrophic outcome for the patient, resulting in a prolonged stay in hospital, a poor outcome and increased costs. There is limited evidence in the literature reporting early deep infection rates specific to hip hemiarthroplasty. A number of studies describe the incidence of deep infection in proximal femur fractures treated by arthroplasty and fixation [1], with only a single study reporting on solely hip hemiarthroplasty [2]. The reported incidence of early deep infection following hip hemiarthroplasty specifically varies from 1.6% [1] to 4.9% [2,3]. These figures are primarily provided by retrospective, descriptive studies, with variable lengths of follow-up.
Early deep infection occurs more frequently in hip hemiarthroplasty for trauma than elective total hip arthroplasty. This is thought to be due to several factors including the advanced age of hip hemiarthroplasty patients and their comorbid status, in addition to the shorter time frame in which to medically optimize trauma patients, including less opportunity to address nutritional elements known to impact recovery.
A number of prognostic factors have been identified as increasing the chance of developing a deep periprosthetic infection following hip hemiarthroplasty. Although these are debated they include cognitive impairment, high body mass index, development of wound hematoma post-operatively and increased operating time [8].
Many of the measures taken to reduce the risk of deep infection in arthroplasty have a limited evidence base, with a significant amount of practice based on expert opinion [10]. This is due to the difficulty in designing robust randomized controlled trials with sufficient numbers to identify significant trends. It is generally accepted that parenteral antibiotic prophylaxis [4] and antibiotic-loaded cement reduce the incidence of infection [5]. Increased theatre traffic has long been accepted as increasing bacterial counts in theatre [6]. Sterile skin preparation and draping with impermeable drapes and an iodophor-impregnated adhesive skin drape have been shown to reduce bacterial contamination and recolonization rates in vitro [4], although this has not resulted in a clinical reduction in deep periprosthetic joint infections. Other practices such as the use of laminar flow theatres are less well evidenced [7].
Following concerns regarding a perceived spike in infection rates in our hip hemiarthroplasty patients, the senior author, who is the training liaison officer for trauma and orthopedics in the hospital, convened a meeting with the first 2 authors regarding how best to investigate this potential issue. It was decided that an audit of practice should be conducted, as well as a literature review to assess acceptable infection rates within the literature and any potential areas for improvement.
Setting
The Royal Victoria Hospital in Belfast is one of the UK’s largest dedicated trauma units, treating over 900 proximal femur fractures per year. Of these, approximately 500 are displaced intracapsular neck of femur fractures requiring hip hemiarthroplasty. Patients are managed on dedicated trauma wards, and in accordance with British Orthopaedic Association guidelines there is a focus on multidisciplinary rehabilitation including a fully integrated orthogeriatric service [8]. We routinely use a modular Exeter trauma stem (Stryker, Kalamazoo MI) prosthesis with gentamycin-loaded cement and an antibiotic prophylaxis regimen of flucloxacillin and gentamicin prior to incision, followed by 2 further doses of flucloxacillin over 24 hours. A preoperative checklist is conducted to ensure that antibiotics are administered prior to skin incision and that there are no concerns regarding equipment sterility. Four trauma theatres are run each weekday, prioritizing medically optimized proximal femoral fracture patients.
Quality Improvement Project
Pre-intervention Audit
A retrospective audit was carried out via interrogation of the Fracture Outcome Research Database (FORD) between January 2013 and July 2014. This is a prospectively collected database of demographic data and outcome measurements that is managed by a dedicated team employed by the institution. This ensures accurate documentation of hospital admissions for trauma, operations conducted, and outcomes, such as discharge destination and further procedures.
The search terms used were wound washout, irrigation and debridement, first stage revision, girdlestone, and excision arthroplasty. Exclusion criteria included washouts for septic arthritis of a native hip joint, open injuries, and repeated washouts on the same patient. Data were collected including demographics, comorbidities, surgeon level, ward, theatre and causative organism by reviewing the electronic and written records.
725 patients were identified who met the inclusion criteria and underwent a hip hemiarthroplasty. Of these, 20 had undergone a washout procedure for deep infection, a rate of 2.7%. There were 14 females, nine males, 12 were right hips, 8 left, with a mean age of 81 years (range, 66–92). The mean American Society of Anesthetists (ASA) score was 3.2 (range, 2–4). Fourteen infections were identified within 4 weeks postoperatively, 6 within 8 weeks. Nineteen out of 20 of the causative organisms isolated were sensitive to the standard prophylactic antibiotic regimen. There was no association identified with a particular theatre, presence of laminar flow, ward, or grade of operating surgeon.
Changes to Perioperative Practice
We met on 2 further occasions to discuss the findings of the literature review and strategy for improvement prior to institution of changes.
We reviewed the National Institute for Clinical Excellence (NICE) Clinical Guideline [9] and the “International Consensus on Periprosthetic Joint Infection” [10] to compare our perioperative practice to national and international recommendations. We identified that we were compliant with a large majority of recommended practices, for example using antibiotic prophylaxis, laminar flow theatres, and sterile disposable drapes. We defined an acceptable infection rate to be 1.6% following a comprehensive literature review [1–3].
Four potential changes to our perioperative practice were chosen based on our review of the clinical guidelines and consensus document. These were chosen due to the strong expert opinion that they commanded within the consensus document and their relative ease and speed of implementation.
- Standardized draping of the affected extremity using stockinette isolation and windowed drape towards patient’s upper body.
- Use of a chlorhexidine gluconate (2% [w/v] in 70% [v/v] isopropyl alcohol) preoperative skin solution in theatre as a preliminary antiseptic skin preparation prior to formal preparation with povidone-iodine. Darouiche et al [11] demonstrated that preoperative cleansing of the patient’s skin with chlorhexidine-alcohol is superior to cleansing with povidone-iodine for preventing surgical site infection. Subsequent studies have suggested that concurrent application of the 2 antiseptic agents confer a further potential benefit by reducing the number of viable colony forming organisms and, subsequently, deep surgical site infection [12,13].
- Change from non-impregnated adhesive incision drapes to Ioban (3M, St Paul, MN) (other manufacturers available) iodophor-impregnated adhesive incision drapes. Experimental studies have demonstrated a lower rate of skin recolonization with bacteria following the use of impregnated drapes compared to non-impregnated drapes [14,15] although this has not been correlated to rates of deep infection.
- Change from simple absorbent dressings to interactive wound dressings (Aquacel and Duoderm; ConvaTec Ltd., Flintshire, UK) (alternative manufacturers available). There is evidence to show that Aquacel and Duoderm dressings were associated with reduced rates of skin blistering and infection in elective arthroplasty [16].
We also felt that staff education would be important for implementing change. We presented the results of the initial audit at departmental and regional quality improvement meetings, demonstrating the need for change in practice. Following the literature search and decision to implement 4 changes, medical staff were re-educated at the departmental audit meeting on the rationale behind the changes being made. Via liaison with the nurse lead of trauma theatres, nursing and auxiliary staff underwent education sessions. These were small group sessions, with visual aids, designed to fit in to staff breaks to reduce disruption of their work. Groups consisted of 4 to 6 people per session. They were led by the authors and focused on highlighting the reasoning behind the changes in practices and answering any questions that staff had. During these sessions, a revision of good theatre etiquette was conducted. This included reinforcing basic theatre principles, for example, reducing theatre traffic, ensuring correct theatre dress and head coverings are worn at all times, highlighting the need to regularly wash hands and wear gloves when required, and to respect the sterile areas and instruments appropriately.
Results
A re-audit of hip hemiarthroplasties was conducted after a 12-month interval to allow proposed changes to become routine practice. Re-audit was undertaken retrospectively from April 2015 to March 2016 using the same methods and search strategy as before. 457 (male 43.3%, female 56.7%) hip hemiarthroplasty procedures were carried out in this time period with 5 deep infections occurring, a rate of 1.1%, demonstrating a statistically significant reduction in periprosthetic joint infection rate (P = 0.03, chi square test). There were 3 males and 4 females, with a mean age of 79 years (range 57–91), and mean ASA of 3.1 (range, 2–4). Two were right hips, 3 were left hips. Four infections occurred within 4 weeks and one at day 50. The overall mortality rate for those patients who developed deep periprosthetic infection within our study time frame was 28%.
Findings were presented at the regional audit meeting. This highlighted the positive impact of the changes to practice and stimulated discussion on further improvements to practice that could be instituted. Prior to implementation of any further changes to practice a re-audit was conducted over a further 12-month period. This demonstrated maintenance of an infection rate below the literature standard of 1.6% and a continued reduction in the initial audit rate of 2.7%
Lessons and Limitations
This quality improvement project demonstrates how simple changes can deliver large benefits to both patients and the health system. There is considerable variability in worldwide orthopedic practice, due in part to the limited evidence base for some perioperative infection precautions. This was the first attempt in Northern Ireland to quantify the effect of some of these precautions and to contribute to the evidence in support of their implementation. We acknowledge that the numbers involved in our project are small, and the effect size is likely to be overestimated. Factors contributing to this include the Hawthorne effect, improved staff awareness of postoperative infection, and that patients who either died or were treated conservatively did not undergo a washout procedure and therefore would not have been identified.
Institutional change is challenging. We selected the changes to practice that we felt would likely provide the largest benefit, with minimal cultural resistance. All materials (eg, Ioban drapes and Chloraprep skin solution) were already stocked in theatre suite and therefore did not have to undergo procurement procedures. Junior medical staff were instructed on strict standardised draping technique, as agreed by revision arthroplasty surgeons working within the unit.
We would advocate that theatre staff at every level are involved in this process from the outset in order to maximise the overall benefit. It is important that medical, nursing, and auxiliary staff are involved in decision making and implementation to facilitate uptake of new practices. All staff were re-educated on the impact of deep infections in these patients and the importance of perioperative practice in minimising these. Whenever resistance was met we addressed with open discussion and answering all questions to ensure staff understanding and acceptance.
Conclusion
Deep joint infection represents a significant cause of morbidity and mortality in the elderly population and a financial burden on the health service. The implementation of these simple perioperative interventions has achieved a significantly reduced rate of infection in a regional trauma center. Our interventions have been straightforward to implement, cost-effective and, most importantly, have demonstrated a significant, tangible benefit to our patients.
Corresponding author: Mr. Brendan Gallagher, Department of Trauma and Orthopedics, Royal Victoria Hospital, 274 Grosvenor Road, Belfast, N. Ireland, BT12 6BA, brendan.gallagher@belfasttrust.hscni.net .
Financial disclosures: None.
1. Duckworth AD, Phillips S-A, Stone O, et al. Deep infection after hip fracture surgery: predictors of early mortality. Injury 2012;43:1182–6.
2. de Jong L, Klem TMAL, Kuijper TM, Roukema GR. Factors affecting the rate of surgical site infection in patients after hemiarthroplasty of the hip following a fracture of the neck of the femur. Bone Joint J 2017;99-B:1088–94
3. Ridgeway S, Wilson J, Charlet A, et al. Infection of the surgical site after arthroplasty of the hip. J Bone Joint Surg [Br] 2005;87–B(6):844–50.
4. Matar WY, Jafari SM, Restrepo C, et al. Preventing Infection in Total Joint Arthroplasty. J Bone Joint Surg [Am] 2010;92(Suppl 2):36–46.
5. Parvizi J, Saleh KJ, Ragland PS, et al. Efficacy of antibiotic-impregnated cement in total hip replacement. Acta Orthop 2008;79:335–41.
6. Ritter MA, Eitzen H, French ML, Hart JB. The operating room environment as affected by people and the surgical face mask. Clin Orthop Rel Res 1975;:147–50.
7. Hooper GJ, Rothwell a G, Frampton C, Wyatt MC. Does the use of laminar flow and space suits reduce early deep infection after total hip and knee replacement?: the ten-year results of the New Zealand Joint Registry. J Bone Joint Surg [Br] 2011;93:85–90.
8. British Orthopaedic Association. British Orthopaedic Association standards for trauma. 2012. Available at www.boa.ac.uk/wpcontent/uploads/2014/12/BOAST-1.pdf.
9. NICE. Hip fracture: management | 1-Guidance | Guidance and guidelines | NICE. Health Technol Assess (Rockv). NICE; 2014. Available at www.nice.org.uk/guidance/cg124/chapter/1-guidance.
10. Parvizi J, Gehrke T. International consensus on periprosthetic joint infection. J Bone Joint Surg [Am] 2014;96:441.
11. Darouiche RO, Wall Jr MJ, Itani KMF, et al. Chlorhexidine–alcohol versus povidone–iodine for surgical-site antisepsis. N Engl J Med 2010;362:18–26.
12. Anderson MJ, Horn ME, Lin YC et al. Efficacy of concurrent application of chlorhexidine gluconate and povidone iodine against six nosocomial pathogens. Am J Infect Control 2010;38:826–31.
13. Patrick S, McDowell A, Lee A et al. Antisepsis of the skin before spinal surgery with povidone iodine-alcohol followed by chlorhexidine gluconate-alcohol versus povidone iodine-alcohol applied twice for the prevention of contamination of the wound by bacteria. Bone Joint J 2017;99-B:1354–65.
14. Johnston DH, Fairclough JA, Brown EM, Morris R. Rate of bacterial recolonization of the skin after preparation: four methods compared. Br J Surg 1987;74:64.
15. Dewan PA, Van Rij AM, Robinson RG, et al. The use of an iodophor-impregnated plastic incise drape in abdominal surgery--a controlled clinical trial. Aust N Z J Surg 1987;57:859–63.
16. Clarke JV, Deakin AH, Dillon JM, et al. A prospective clinical audit of a new dressing design for lower limb arthroplasty wounds. J Wound Care 2009;18:5–8, 10–11.
From the Department of Trauma and Orthopaedics, Royal Victoria Hospital, Belfast, N. Ireland.
Abstract
- Objective: To improve the deep wound infection rate in patients undergoing hip hemiarthroplasty in our regional trauma center.
- Methods: We conducted a retrospective audit of patients who had undergone hip hemiarthroplasty between January 2013 and July 2014 and found that in 750 hip hemiarthroplasties performed, 20 (2.7%) developed a deep infection, a figure in excess of the literature standard. In line with international consensus recommendations, 4 changes to our perioperative practice were implemented: standardized draping of the affected extremity, improved skin preparation using a 2% chlorhexidine gluconate solution, change of incision drapes to iodophor-impregnated adhesive film drapes, and the use of interactive wound dressing. We conducted staff education to highlight the impact of deep wound infection, introduce the changes, and underscore the importance of strict adherence to intraoperative sterility.
- Results: One year after introducing the changes, we audited the period April 2015 to March 2016, during which time 457 hip hemiarthoplasties were performed. Five (1.1%) deep infections were identified.
- Conclusion: Improvement in the perioperative care of our hip hemiarthroplasty patients has resulted in a reduced risk of the development of deep wound infection. This improvement was maintained in a third audit period, with continued implementation of these changes in practice.
Keywords: deep infection; hip hemiarthroplasty; quality improvement; proximal femoral fracture; risk reduction strategies.
Deep wound infection following hip hemiarthroplasty is a catastrophic outcome for the patient, resulting in a prolonged stay in hospital, a poor outcome and increased costs. There is limited evidence in the literature reporting early deep infection rates specific to hip hemiarthroplasty. A number of studies describe the incidence of deep infection in proximal femur fractures treated by arthroplasty and fixation [1], with only a single study reporting on solely hip hemiarthroplasty [2]. The reported incidence of early deep infection following hip hemiarthroplasty specifically varies from 1.6% [1] to 4.9% [2,3]. These figures are primarily provided by retrospective, descriptive studies, with variable lengths of follow-up.
Early deep infection occurs more frequently in hip hemiarthroplasty for trauma than elective total hip arthroplasty. This is thought to be due to several factors including the advanced age of hip hemiarthroplasty patients and their comorbid status, in addition to the shorter time frame in which to medically optimize trauma patients, including less opportunity to address nutritional elements known to impact recovery.
A number of prognostic factors have been identified as increasing the chance of developing a deep periprosthetic infection following hip hemiarthroplasty. Although these are debated they include cognitive impairment, high body mass index, development of wound hematoma post-operatively and increased operating time [8].
Many of the measures taken to reduce the risk of deep infection in arthroplasty have a limited evidence base, with a significant amount of practice based on expert opinion [10]. This is due to the difficulty in designing robust randomized controlled trials with sufficient numbers to identify significant trends. It is generally accepted that parenteral antibiotic prophylaxis [4] and antibiotic-loaded cement reduce the incidence of infection [5]. Increased theatre traffic has long been accepted as increasing bacterial counts in theatre [6]. Sterile skin preparation and draping with impermeable drapes and an iodophor-impregnated adhesive skin drape have been shown to reduce bacterial contamination and recolonization rates in vitro [4], although this has not resulted in a clinical reduction in deep periprosthetic joint infections. Other practices such as the use of laminar flow theatres are less well evidenced [7].
Following concerns regarding a perceived spike in infection rates in our hip hemiarthroplasty patients, the senior author, who is the training liaison officer for trauma and orthopedics in the hospital, convened a meeting with the first 2 authors regarding how best to investigate this potential issue. It was decided that an audit of practice should be conducted, as well as a literature review to assess acceptable infection rates within the literature and any potential areas for improvement.
Setting
The Royal Victoria Hospital in Belfast is one of the UK’s largest dedicated trauma units, treating over 900 proximal femur fractures per year. Of these, approximately 500 are displaced intracapsular neck of femur fractures requiring hip hemiarthroplasty. Patients are managed on dedicated trauma wards, and in accordance with British Orthopaedic Association guidelines there is a focus on multidisciplinary rehabilitation including a fully integrated orthogeriatric service [8]. We routinely use a modular Exeter trauma stem (Stryker, Kalamazoo MI) prosthesis with gentamycin-loaded cement and an antibiotic prophylaxis regimen of flucloxacillin and gentamicin prior to incision, followed by 2 further doses of flucloxacillin over 24 hours. A preoperative checklist is conducted to ensure that antibiotics are administered prior to skin incision and that there are no concerns regarding equipment sterility. Four trauma theatres are run each weekday, prioritizing medically optimized proximal femoral fracture patients.
Quality Improvement Project
Pre-intervention Audit
A retrospective audit was carried out via interrogation of the Fracture Outcome Research Database (FORD) between January 2013 and July 2014. This is a prospectively collected database of demographic data and outcome measurements that is managed by a dedicated team employed by the institution. This ensures accurate documentation of hospital admissions for trauma, operations conducted, and outcomes, such as discharge destination and further procedures.
The search terms used were wound washout, irrigation and debridement, first stage revision, girdlestone, and excision arthroplasty. Exclusion criteria included washouts for septic arthritis of a native hip joint, open injuries, and repeated washouts on the same patient. Data were collected including demographics, comorbidities, surgeon level, ward, theatre and causative organism by reviewing the electronic and written records.
725 patients were identified who met the inclusion criteria and underwent a hip hemiarthroplasty. Of these, 20 had undergone a washout procedure for deep infection, a rate of 2.7%. There were 14 females, nine males, 12 were right hips, 8 left, with a mean age of 81 years (range, 66–92). The mean American Society of Anesthetists (ASA) score was 3.2 (range, 2–4). Fourteen infections were identified within 4 weeks postoperatively, 6 within 8 weeks. Nineteen out of 20 of the causative organisms isolated were sensitive to the standard prophylactic antibiotic regimen. There was no association identified with a particular theatre, presence of laminar flow, ward, or grade of operating surgeon.
Changes to Perioperative Practice
We met on 2 further occasions to discuss the findings of the literature review and strategy for improvement prior to institution of changes.
We reviewed the National Institute for Clinical Excellence (NICE) Clinical Guideline [9] and the “International Consensus on Periprosthetic Joint Infection” [10] to compare our perioperative practice to national and international recommendations. We identified that we were compliant with a large majority of recommended practices, for example using antibiotic prophylaxis, laminar flow theatres, and sterile disposable drapes. We defined an acceptable infection rate to be 1.6% following a comprehensive literature review [1–3].
Four potential changes to our perioperative practice were chosen based on our review of the clinical guidelines and consensus document. These were chosen due to the strong expert opinion that they commanded within the consensus document and their relative ease and speed of implementation.
- Standardized draping of the affected extremity using stockinette isolation and windowed drape towards patient’s upper body.
- Use of a chlorhexidine gluconate (2% [w/v] in 70% [v/v] isopropyl alcohol) preoperative skin solution in theatre as a preliminary antiseptic skin preparation prior to formal preparation with povidone-iodine. Darouiche et al [11] demonstrated that preoperative cleansing of the patient’s skin with chlorhexidine-alcohol is superior to cleansing with povidone-iodine for preventing surgical site infection. Subsequent studies have suggested that concurrent application of the 2 antiseptic agents confer a further potential benefit by reducing the number of viable colony forming organisms and, subsequently, deep surgical site infection [12,13].
- Change from non-impregnated adhesive incision drapes to Ioban (3M, St Paul, MN) (other manufacturers available) iodophor-impregnated adhesive incision drapes. Experimental studies have demonstrated a lower rate of skin recolonization with bacteria following the use of impregnated drapes compared to non-impregnated drapes [14,15] although this has not been correlated to rates of deep infection.
- Change from simple absorbent dressings to interactive wound dressings (Aquacel and Duoderm; ConvaTec Ltd., Flintshire, UK) (alternative manufacturers available). There is evidence to show that Aquacel and Duoderm dressings were associated with reduced rates of skin blistering and infection in elective arthroplasty [16].
We also felt that staff education would be important for implementing change. We presented the results of the initial audit at departmental and regional quality improvement meetings, demonstrating the need for change in practice. Following the literature search and decision to implement 4 changes, medical staff were re-educated at the departmental audit meeting on the rationale behind the changes being made. Via liaison with the nurse lead of trauma theatres, nursing and auxiliary staff underwent education sessions. These were small group sessions, with visual aids, designed to fit in to staff breaks to reduce disruption of their work. Groups consisted of 4 to 6 people per session. They were led by the authors and focused on highlighting the reasoning behind the changes in practices and answering any questions that staff had. During these sessions, a revision of good theatre etiquette was conducted. This included reinforcing basic theatre principles, for example, reducing theatre traffic, ensuring correct theatre dress and head coverings are worn at all times, highlighting the need to regularly wash hands and wear gloves when required, and to respect the sterile areas and instruments appropriately.
Results
A re-audit of hip hemiarthroplasties was conducted after a 12-month interval to allow proposed changes to become routine practice. Re-audit was undertaken retrospectively from April 2015 to March 2016 using the same methods and search strategy as before. 457 (male 43.3%, female 56.7%) hip hemiarthroplasty procedures were carried out in this time period with 5 deep infections occurring, a rate of 1.1%, demonstrating a statistically significant reduction in periprosthetic joint infection rate (P = 0.03, chi square test). There were 3 males and 4 females, with a mean age of 79 years (range 57–91), and mean ASA of 3.1 (range, 2–4). Two were right hips, 3 were left hips. Four infections occurred within 4 weeks and one at day 50. The overall mortality rate for those patients who developed deep periprosthetic infection within our study time frame was 28%.
Findings were presented at the regional audit meeting. This highlighted the positive impact of the changes to practice and stimulated discussion on further improvements to practice that could be instituted. Prior to implementation of any further changes to practice a re-audit was conducted over a further 12-month period. This demonstrated maintenance of an infection rate below the literature standard of 1.6% and a continued reduction in the initial audit rate of 2.7%
Lessons and Limitations
This quality improvement project demonstrates how simple changes can deliver large benefits to both patients and the health system. There is considerable variability in worldwide orthopedic practice, due in part to the limited evidence base for some perioperative infection precautions. This was the first attempt in Northern Ireland to quantify the effect of some of these precautions and to contribute to the evidence in support of their implementation. We acknowledge that the numbers involved in our project are small, and the effect size is likely to be overestimated. Factors contributing to this include the Hawthorne effect, improved staff awareness of postoperative infection, and that patients who either died or were treated conservatively did not undergo a washout procedure and therefore would not have been identified.
Institutional change is challenging. We selected the changes to practice that we felt would likely provide the largest benefit, with minimal cultural resistance. All materials (eg, Ioban drapes and Chloraprep skin solution) were already stocked in theatre suite and therefore did not have to undergo procurement procedures. Junior medical staff were instructed on strict standardised draping technique, as agreed by revision arthroplasty surgeons working within the unit.
We would advocate that theatre staff at every level are involved in this process from the outset in order to maximise the overall benefit. It is important that medical, nursing, and auxiliary staff are involved in decision making and implementation to facilitate uptake of new practices. All staff were re-educated on the impact of deep infections in these patients and the importance of perioperative practice in minimising these. Whenever resistance was met we addressed with open discussion and answering all questions to ensure staff understanding and acceptance.
Conclusion
Deep joint infection represents a significant cause of morbidity and mortality in the elderly population and a financial burden on the health service. The implementation of these simple perioperative interventions has achieved a significantly reduced rate of infection in a regional trauma center. Our interventions have been straightforward to implement, cost-effective and, most importantly, have demonstrated a significant, tangible benefit to our patients.
Corresponding author: Mr. Brendan Gallagher, Department of Trauma and Orthopedics, Royal Victoria Hospital, 274 Grosvenor Road, Belfast, N. Ireland, BT12 6BA, brendan.gallagher@belfasttrust.hscni.net .
Financial disclosures: None.
1. Duckworth AD, Phillips S-A, Stone O, et al. Deep infection after hip fracture surgery: predictors of early mortality. Injury 2012;43:1182–6.
2. de Jong L, Klem TMAL, Kuijper TM, Roukema GR. Factors affecting the rate of surgical site infection in patients after hemiarthroplasty of the hip following a fracture of the neck of the femur. Bone Joint J 2017;99-B:1088–94
3. Ridgeway S, Wilson J, Charlet A, et al. Infection of the surgical site after arthroplasty of the hip. J Bone Joint Surg [Br] 2005;87–B(6):844–50.
4. Matar WY, Jafari SM, Restrepo C, et al. Preventing Infection in Total Joint Arthroplasty. J Bone Joint Surg [Am] 2010;92(Suppl 2):36–46.
5. Parvizi J, Saleh KJ, Ragland PS, et al. Efficacy of antibiotic-impregnated cement in total hip replacement. Acta Orthop 2008;79:335–41.
6. Ritter MA, Eitzen H, French ML, Hart JB. The operating room environment as affected by people and the surgical face mask. Clin Orthop Rel Res 1975;:147–50.
7. Hooper GJ, Rothwell a G, Frampton C, Wyatt MC. Does the use of laminar flow and space suits reduce early deep infection after total hip and knee replacement?: the ten-year results of the New Zealand Joint Registry. J Bone Joint Surg [Br] 2011;93:85–90.
8. British Orthopaedic Association. British Orthopaedic Association standards for trauma. 2012. Available at www.boa.ac.uk/wpcontent/uploads/2014/12/BOAST-1.pdf.
9. NICE. Hip fracture: management | 1-Guidance | Guidance and guidelines | NICE. Health Technol Assess (Rockv). NICE; 2014. Available at www.nice.org.uk/guidance/cg124/chapter/1-guidance.
10. Parvizi J, Gehrke T. International consensus on periprosthetic joint infection. J Bone Joint Surg [Am] 2014;96:441.
11. Darouiche RO, Wall Jr MJ, Itani KMF, et al. Chlorhexidine–alcohol versus povidone–iodine for surgical-site antisepsis. N Engl J Med 2010;362:18–26.
12. Anderson MJ, Horn ME, Lin YC et al. Efficacy of concurrent application of chlorhexidine gluconate and povidone iodine against six nosocomial pathogens. Am J Infect Control 2010;38:826–31.
13. Patrick S, McDowell A, Lee A et al. Antisepsis of the skin before spinal surgery with povidone iodine-alcohol followed by chlorhexidine gluconate-alcohol versus povidone iodine-alcohol applied twice for the prevention of contamination of the wound by bacteria. Bone Joint J 2017;99-B:1354–65.
14. Johnston DH, Fairclough JA, Brown EM, Morris R. Rate of bacterial recolonization of the skin after preparation: four methods compared. Br J Surg 1987;74:64.
15. Dewan PA, Van Rij AM, Robinson RG, et al. The use of an iodophor-impregnated plastic incise drape in abdominal surgery--a controlled clinical trial. Aust N Z J Surg 1987;57:859–63.
16. Clarke JV, Deakin AH, Dillon JM, et al. A prospective clinical audit of a new dressing design for lower limb arthroplasty wounds. J Wound Care 2009;18:5–8, 10–11.