User login
A Concise Tool for Measuring Care Coordination from the Provider’s Perspective in the Hospital Setting
Care Coordination has been defined as “…the deliberate organization of patient care activities between two or more participants (including the patient) involved in a patient’s care to facilitate the appropriate delivery of healthcare services.”1 The Institute of Medicine identified care coordination as a key strategy to improve the American healthcare system,2 and evidence has been building that well-coordinated care improves patient outcomes and reduces healthcare costs associated with chronic conditions.3-5 In 2012, Johns Hopkins Medicine was awarded a Healthcare Innovation Award by the Centers for Medicare & Medicaid Services to improve coordination of care across the continuum of care for adult patients admitted to Johns Hopkins Hospital (JHH) and Johns Hopkins Bayview Medical Center (JHBMC), and for high-risk low-income Medicare and Medicaid beneficiaries receiving ambulatory care in targeted zip codes. The purpose of this project, known as the Johns Hopkins Community Health Partnership (J-CHiP), was to improve health and healthcare and to reduce healthcare costs. The acute care component of the program consisted of a bundle of interventions focused on improving coordination of care for all patients, including a “bridge to home” discharge process, as they transitioned back to the community from inpatient admission. The bundle included the following: early screening for discharge planning to predict needed postdischarge services; discussion in daily multidisciplinary rounds about goals and priorities of the hospitalization and potential postdischarge needs; patient and family self-care management; education enhanced medication management, including the option of “medications in hand” at the time of discharge; postdischarge telephone follow-up by nurses; and, for patients identified as high-risk, a “transition guide” (a nurse who works with the patient via home visits and by phone to optimize compliance with care for 30 days postdischarge).6 While the primary endpoints of the J-CHiP program were to improve clinical outcomes and reduce healthcare costs, we were also interested in the impact of the program on care coordination processes in the acute care setting. This created the need for an instrument to measure healthcare professionals’ views of care coordination in their immediate work environments.
We began our search for existing measures by reviewing the Coordination Measures Atlas published in 2014.7 Although this report evaluates over 80 different measures of care coordination, most of them focus on the perspective of the patient and/or family members, on specific conditions, and on primary care or outpatient settings.7,8 We were unable to identify an existing measure from the provider perspective, designed for the inpatient setting, that was both brief but comprehensive enough to cover a range of care coordination domains.8
Consequently, our first aim was to develop a brief, comprehensive tool to measure care coordination from the perspective of hospital inpatient staff that could be used to compare different units or types of providers, or to conduct longitudinal assessment. The second aim was to conduct a preliminary evaluation of the tool in our healthcare setting, including to assess its psychometric properties, to describe provider perceptions of care coordination after the implementation of J-CHiP, and to explore potential differences among departments, types of professionals, and between the 2 hospitals.
METHODS
Development of the Care Coordination Questionnaire
The survey was developed in collaboration with leaders of the J-CHiP Acute Care Team. We met at the outset and on multiple subsequent occasions to align survey domains with the main components of the J-CHiP acute care intervention and to assure that the survey would be relevant and understandable to a variety of multidisciplinary professionals, including physicians, nurses, social workers, physical therapists, and other health professionals. Care was taken to avoid redundancy with existing evaluation efforts and to minimize respondent burden. This process helped to ensure the content validity of the items, the usefulness of the results, and the future usability of the tool.
We modeled the Care Coordination Questionnaire (CCQ) after the Safety Attitudes Questionnaire (SAQ),9 a widely used survey that is deployed approximately annually at JHH and JHBMC. While the SAQ focuses on healthcare provider attitudes about issues relevant to patient safety (often referred to as safety climate or safety culture), this new tool was designed to focus on healthcare professionals’ attitudes about care coordination. Similar to the way that the SAQ “elicits a snapshot of the safety climate through surveys of frontline worker perceptions,” we sought to elicit a picture of our care coordination climate through a survey of frontline hospital staff.
The CCQ was built upon the domains and approaches to care coordination described in the Agency for Healthcare Research and Quality Care Coordination Atlas.3 This report identifies 9 mechanisms for achieving care coordination, including the following: Establish Accountability or Negotiate Responsibility; Communicate; Facilitate Transitions; Assess Needs and Goals; Create a Proactive Plan of Care; Monitor, Follow Up, and Respond to Change; Support Self-Management Goals; Link to Community Resources; and Align Resources with Patient and Population Needs; as well as 5 broad approaches commonly used to improve the delivery of healthcare, including Teamwork Focused on Coordination, Healthcare Home, Care Management, Medication Management, and Health IT-Enabled Coordination.7 We generated at least 1 item to represent 8 of the 9 domains, as well as the broad approach described as Teamwork Focused on Coordination. After developing an initial set of items, we sought input from 3 senior leaders of the J-CHiP Acute Care Team to determine if the items covered the care coordination domains of interest, and to provide feedback on content validity. To test the interpretability of survey items and consistency across professional groups, we sent an initial version of the survey questions to at least 1 person from each of the following professional groups: hospitalist, social worker, case manager, clinical pharmacist, and nurse. We asked them to review all of our survey questions and to provide us with feedback on all aspects of the questions, such as whether they believed the questions were relevant and understandable to the members of their professional discipline, the appropriateness of the wording of the questions, and other comments. Modifications were made to the content and wording of the questions based on the feedback received. The final draft of the questionnaire was reviewed by the leadership team of the J-CHiP Acute Care Team to ensure its usefulness in providing actionable information.
The resulting 12-item questionnaire used a 5-point Likert response scale ranging from 1 = “disagree strongly” to 5 = “agree strongly,” and an additional option of “not applicable (N/A).” To help assess construct validity, a global question was added at the end of the questionnaire asking, “Overall, how would you rate the care coordination at the hospital of your primary work setting?” The response was measured on a 10-point Likert-type scale ranging from 1 = “totally uncoordinated care” to 10 = “perfectly coordinated care” (see Appendix). In addition, the questionnaire requested information about the respondents’ gender, position, and their primary unit, department, and hospital affiliation.
Data Collection Procedures
An invitation to complete an anonymous questionnaire was sent to the following inpatient care professionals: all nursing staff working on care coordination units in the departments of medicine, surgery, and neurology/neurosurgery, as well as physicians, pharmacists, acute care therapists (eg, occupational and physical therapists), and other frontline staff. All healthcare staff fitting these criteria was sent an e-mail with a request to fill out the survey online using QualtricsTM (Qualtrics Labs Inc., Provo, UT), as well as multiple follow-up reminders. The participants worked either at the JHH (a 1194-bed tertiary academic medical center in Baltimore, MD) or the JHBMC (a 440-bed academic community hospital located nearby). Data were collected from October 2015 through January 2016.
Analysis
Means and standard deviations were calculated by treating the responses as continuous variables. We tried 3 different methods to handle missing data: (1) without imputation, (2) imputing the mean value of each item, and (3) substituting a neutral score. Because all 3 methods produced very similar results, we treated the N/A responses as missing values without imputation for simplicity of analysis. We used STATA 13.1 (Stata Corporation, College Station, Texas) to analyze the data.
To identify subscales, we performed exploratory factor analysis on responses to the 12 specific items. Promax rotation was selected based on the simple structure. Subscale scores for each respondent were generated by computing the mean of responses to the items in the subscale. Internal consistency reliability of the subscales was estimated using Cronbach’s alpha. We calculated Pearson correlation coefficients for the items in each subscale, and examined Cronbach’s alpha deleting each item in turn. For each of the subscales identified and the global scale, we calculated the mean, standard deviation, median and interquartile range. Although distributions of scores tended to be non-normal, this was done to increase interpretability. We also calculated percent scoring at the ceiling (highest possible score).
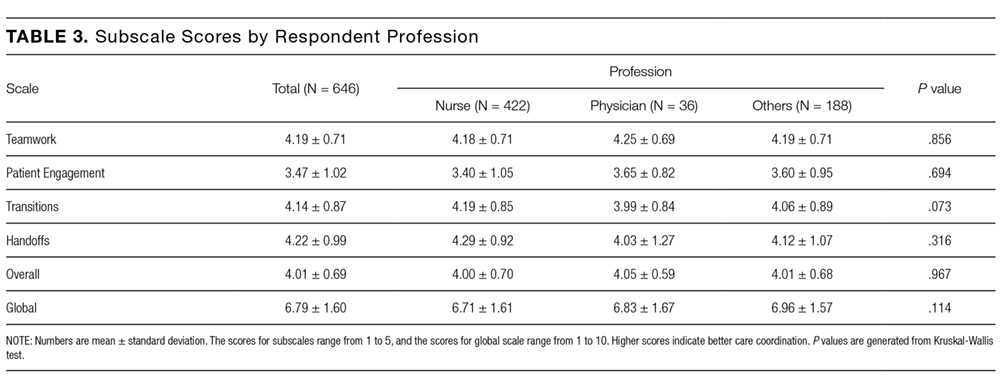
We analyzed the data with 3 research questions in mind: Was there a difference in perceptions of care coordination between (1) staff affiliated with the 2 different hospitals, (2) staff affiliated with different clinical departments, or (3) staff with different professional roles? For comparisons based on hospital and department, and type of professional, nonparametric tests (Wilcoxon rank-sum and Kruskal-Wallis test) were used with a level of statistical significance set at 0.05. The comparison between hospitals and departments was made only among nurses to minimize the confounding effect of different distribution of professionals. We tested the distribution of “years in specialty” between hospitals and departments for this comparison using Pearson’s χ2 test. The difference was not statistically significant (P = 0.167 for hospitals, and P = 0.518 for departments), so we assumed that the potential confounding effect of this variable was negligible in this analysis. The comparison of scores within each professional group used the Friedman test. Pearson’s χ2 test was used to compare the baseline characteristics between 2 hospitals.
RESULTS
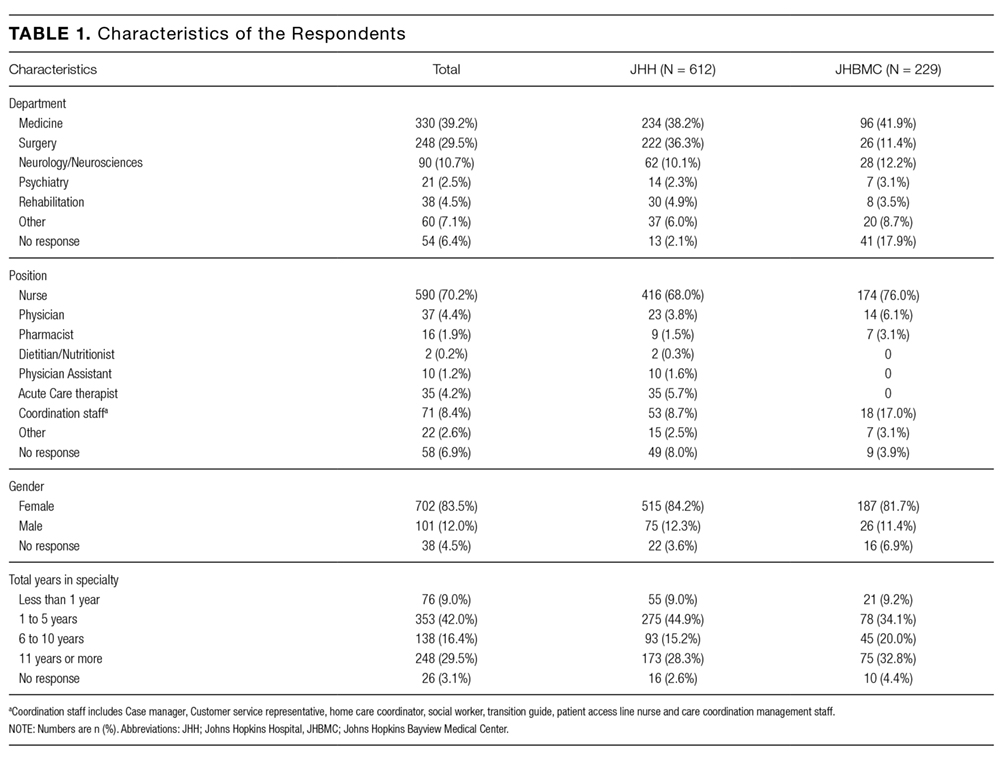
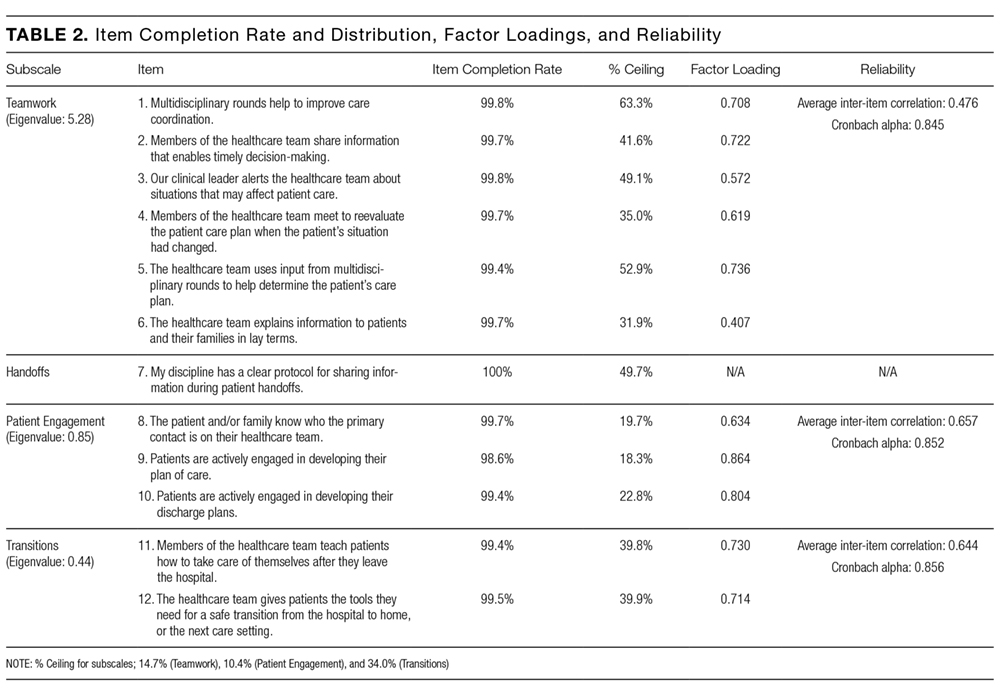
Among the 1486 acute care professionals asked to participate in the survey, 841 completed the questionnaire (response rate 56.6%). Table 1 shows the characteristics of the participants from each hospital. Table 2 summarizes the item response rates, proportion scoring at the ceiling, and weighting from the factor analysis. All items had completion rates of 99.2% or higher, with N/A responses ranging from 0% (item 2) to 3.1% (item 7). The percent scoring at the ceiling was 1.7% for the global item and ranged from 18.3% up to 63.3% for other individual items.

We also examined differences in perceptions of care coordination among nursing units to illustrate the tool’s ability to detect variation in Patient Engagement subscale scores for JHH nurses (see Appendix).
DISCUSSION
This study resulted in one of the first measurement tools to succinctly measure multiple aspects of care coordination in the hospital from the perspective of healthcare professionals. Given the hectic work environment of healthcare professionals, and the increasing emphasis on collecting data for evaluation and improvement, it is important to minimize respondent burden. This effort was catalyzed by a multifaceted initiative to redesign acute care delivery and promote seamless transitions of care, supported by the Center for Medicare & Medicaid Innovation. In initial testing, this questionnaire has evidence for reliability and validity. It was encouraging to find that the preliminary psychometric performance of the measure was very similar in 2 different settings of a tertiary academic hospital and a community hospital.
Our analysis of the survey data explored potential differences between the 2 hospitals, among different types of healthcare professionals and across different departments. Although we expected differences, we had no specific hypotheses about what those differences might be, and, in fact, did not observe any substantial differences. This could be taken to indicate that the intervention was uniformly and successfully implemented in both hospitals, and engaged various professionals in different departments. The ability to detect differences in care coordination at the nursing unit level could also prove to be beneficial for more precisely targeting where process improvement is needed. Further data collection and analyses should be conducted to more systematically compare units and to help identify those where practice is most advanced and those where improvements may be needed. It would also be informative to link differences in care coordination scores with patient outcomes. In addition, differences identified on specific domains between professional groups could be helpful to identify where greater efforts are needed to improve interdisciplinary practice. Sampling strategies stratified by provider type would need to be targeted to make this kind of analysis informative.
The consistently lower scores observed for patient engagement, from the perspective of care professionals in all groups, suggest that this is an area where improvement is needed. These findings are consistent with published reports on the common failure by hospitals to include patients as a member of their own care team. In addition to measuring care processes from the perspective of frontline healthcare workers, future evaluations within the healthcare system would also benefit from including data collected from the perspective of the patient and family.
This study had some limitations. First, there may be more than 4 domains of care coordination that are important and can be measured in the acute care setting from provider perspective. However, the addition of more domains should be balanced against practicality and respondent burden. It may be possible to further clarify priority domains in hospital settings as opposed to the primary care setting. Future research should be directed to find these areas and to develop a more comprehensive, yet still concise measurement instrument. Second, the tool was developed to measure the impact of a large-scale intervention, and to fit into the specific context of 2 hospitals. Therefore, it should be tested in different settings of hospital care to see how it performs. However, virtually all hospitals in the United States today are adapting to changes in both financing and healthcare delivery. A tool such as the one described in this paper could be helpful to many organizations. Third, the scoring system for the overall scale score is not weighted and therefore reflects teamwork more than other components of care coordination, which are represented by fewer items. In general, we believe that use of the subscale scores may be more informative. Alternative scoring systems might also be proposed, including item weighting based on factor scores.
For the purposes of evaluation in this specific instance, we only collected data at a single point in time, after the intervention had been deployed. Thus, we were not able to evaluate the effectiveness of the J-CHiP intervention. We also did not intend to focus too much on the differences between units, given the limited number of respondents from individual units. It would be useful to collect more data at future time points, both to test the responsiveness of the scales and to evaluate the impact of future interventions at both the hospital and unit level.
The preliminary data from this study have generated insights about gaps in current practice, such as in engaging patients in the inpatient care process. It has also increased awareness by hospital leaders about the need to achieve high reliability in the adoption of new procedures and interdisciplinary practice. This tool might be used to find areas in need of improvement, to evaluate the effect of initiatives to improve care coordination, to monitor the change over time in the perception of care coordination among healthcare professionals, and to develop better intervention strategies for coordination activities in acute care settings. Additional research is needed to provide further evidence for the reliability and validity of this measure in diverse settings.
Disclosure
The project described was supported by Grant Number 1C1CMS331053-01-00 from the US Department of Health and Human Services, Centers for Medicare & Medicaid Services. The contents of this publication are solely the responsibility of the authors and do not necessarily represent the official views of the US Department of Health and Human Services or any of its agencies. The research presented was conducted by the awardee. Results may or may not be consistent with or confirmed by the findings of the independent evaluation contractor.
The authors have no other disclosures.
1. McDonald KM, Sundaram V, Bravata DM, et al. Closing the Quality Gap: A Critical Analysis of Quality Improvement Strategies (Vol. 7: Care Coordination). Technical Reviews, No. 9.7. Rockville (MD): Agency for Healthcare Research and Quality (US); 2007. PubMed
2. Adams K, Corrigan J. Priority areas for national action: transforming health care quality. Washington, DC: National Academies Press; 2003. PubMed
3. Renders CM, Valk GD, Griffin S, Wagner EH, Eijk JT, Assendelft WJ. Interventions to improve the management of diabetes mellitus in primary care, outpatient and community settings. Cochrane Database Syst Rev. 2001(1):CD001481. PubMed
4. McAlister FA, Lawson FM, Teo KK, Armstrong PW. A systematic review of randomized trials of disease management programs in heart failure. Am J Med. 2001;110(5):378-384. PubMed
5. Bruce ML, Raue PJ, Reilly CF, et al. Clinical effectiveness of integrating depression care management into medicare home health: the Depression CAREPATH Randomized trial. JAMA Intern Med. 2015;175(1):55-64. PubMed
6. Berkowitz SA, Brown P, Brotman DJ, et al. Case Study: Johns Hopkins Community Health Partnership: A model for transformation. Healthc (Amst). 2016;4(4):264-270. PubMed
7. McDonald. KM, Schultz. E, Albin. L, et al. Care Coordination Measures Atlas Version 4. Rockville, MD: Agency for Healthcare Research and Quality; 2014.
8 Schultz EM, Pineda N, Lonhart J, Davies SM, McDonald KM. A systematic review of the care coordination measurement landscape. BMC Health Serv Res. 2013;13:119. PubMed
9. Sexton JB, Helmreich RL, Neilands TB, et al. The Safety Attitudes Questionnaire: psychometric properties, benchmarking data, and emerging research. BMC Health Serv Res. 2006;6:44. PubMed
Care Coordination has been defined as “…the deliberate organization of patient care activities between two or more participants (including the patient) involved in a patient’s care to facilitate the appropriate delivery of healthcare services.”1 The Institute of Medicine identified care coordination as a key strategy to improve the American healthcare system,2 and evidence has been building that well-coordinated care improves patient outcomes and reduces healthcare costs associated with chronic conditions.3-5 In 2012, Johns Hopkins Medicine was awarded a Healthcare Innovation Award by the Centers for Medicare & Medicaid Services to improve coordination of care across the continuum of care for adult patients admitted to Johns Hopkins Hospital (JHH) and Johns Hopkins Bayview Medical Center (JHBMC), and for high-risk low-income Medicare and Medicaid beneficiaries receiving ambulatory care in targeted zip codes. The purpose of this project, known as the Johns Hopkins Community Health Partnership (J-CHiP), was to improve health and healthcare and to reduce healthcare costs. The acute care component of the program consisted of a bundle of interventions focused on improving coordination of care for all patients, including a “bridge to home” discharge process, as they transitioned back to the community from inpatient admission. The bundle included the following: early screening for discharge planning to predict needed postdischarge services; discussion in daily multidisciplinary rounds about goals and priorities of the hospitalization and potential postdischarge needs; patient and family self-care management; education enhanced medication management, including the option of “medications in hand” at the time of discharge; postdischarge telephone follow-up by nurses; and, for patients identified as high-risk, a “transition guide” (a nurse who works with the patient via home visits and by phone to optimize compliance with care for 30 days postdischarge).6 While the primary endpoints of the J-CHiP program were to improve clinical outcomes and reduce healthcare costs, we were also interested in the impact of the program on care coordination processes in the acute care setting. This created the need for an instrument to measure healthcare professionals’ views of care coordination in their immediate work environments.
We began our search for existing measures by reviewing the Coordination Measures Atlas published in 2014.7 Although this report evaluates over 80 different measures of care coordination, most of them focus on the perspective of the patient and/or family members, on specific conditions, and on primary care or outpatient settings.7,8 We were unable to identify an existing measure from the provider perspective, designed for the inpatient setting, that was both brief but comprehensive enough to cover a range of care coordination domains.8
Consequently, our first aim was to develop a brief, comprehensive tool to measure care coordination from the perspective of hospital inpatient staff that could be used to compare different units or types of providers, or to conduct longitudinal assessment. The second aim was to conduct a preliminary evaluation of the tool in our healthcare setting, including to assess its psychometric properties, to describe provider perceptions of care coordination after the implementation of J-CHiP, and to explore potential differences among departments, types of professionals, and between the 2 hospitals.
METHODS
Development of the Care Coordination Questionnaire
The survey was developed in collaboration with leaders of the J-CHiP Acute Care Team. We met at the outset and on multiple subsequent occasions to align survey domains with the main components of the J-CHiP acute care intervention and to assure that the survey would be relevant and understandable to a variety of multidisciplinary professionals, including physicians, nurses, social workers, physical therapists, and other health professionals. Care was taken to avoid redundancy with existing evaluation efforts and to minimize respondent burden. This process helped to ensure the content validity of the items, the usefulness of the results, and the future usability of the tool.
We modeled the Care Coordination Questionnaire (CCQ) after the Safety Attitudes Questionnaire (SAQ),9 a widely used survey that is deployed approximately annually at JHH and JHBMC. While the SAQ focuses on healthcare provider attitudes about issues relevant to patient safety (often referred to as safety climate or safety culture), this new tool was designed to focus on healthcare professionals’ attitudes about care coordination. Similar to the way that the SAQ “elicits a snapshot of the safety climate through surveys of frontline worker perceptions,” we sought to elicit a picture of our care coordination climate through a survey of frontline hospital staff.
The CCQ was built upon the domains and approaches to care coordination described in the Agency for Healthcare Research and Quality Care Coordination Atlas.3 This report identifies 9 mechanisms for achieving care coordination, including the following: Establish Accountability or Negotiate Responsibility; Communicate; Facilitate Transitions; Assess Needs and Goals; Create a Proactive Plan of Care; Monitor, Follow Up, and Respond to Change; Support Self-Management Goals; Link to Community Resources; and Align Resources with Patient and Population Needs; as well as 5 broad approaches commonly used to improve the delivery of healthcare, including Teamwork Focused on Coordination, Healthcare Home, Care Management, Medication Management, and Health IT-Enabled Coordination.7 We generated at least 1 item to represent 8 of the 9 domains, as well as the broad approach described as Teamwork Focused on Coordination. After developing an initial set of items, we sought input from 3 senior leaders of the J-CHiP Acute Care Team to determine if the items covered the care coordination domains of interest, and to provide feedback on content validity. To test the interpretability of survey items and consistency across professional groups, we sent an initial version of the survey questions to at least 1 person from each of the following professional groups: hospitalist, social worker, case manager, clinical pharmacist, and nurse. We asked them to review all of our survey questions and to provide us with feedback on all aspects of the questions, such as whether they believed the questions were relevant and understandable to the members of their professional discipline, the appropriateness of the wording of the questions, and other comments. Modifications were made to the content and wording of the questions based on the feedback received. The final draft of the questionnaire was reviewed by the leadership team of the J-CHiP Acute Care Team to ensure its usefulness in providing actionable information.
The resulting 12-item questionnaire used a 5-point Likert response scale ranging from 1 = “disagree strongly” to 5 = “agree strongly,” and an additional option of “not applicable (N/A).” To help assess construct validity, a global question was added at the end of the questionnaire asking, “Overall, how would you rate the care coordination at the hospital of your primary work setting?” The response was measured on a 10-point Likert-type scale ranging from 1 = “totally uncoordinated care” to 10 = “perfectly coordinated care” (see Appendix). In addition, the questionnaire requested information about the respondents’ gender, position, and their primary unit, department, and hospital affiliation.
Data Collection Procedures
An invitation to complete an anonymous questionnaire was sent to the following inpatient care professionals: all nursing staff working on care coordination units in the departments of medicine, surgery, and neurology/neurosurgery, as well as physicians, pharmacists, acute care therapists (eg, occupational and physical therapists), and other frontline staff. All healthcare staff fitting these criteria was sent an e-mail with a request to fill out the survey online using QualtricsTM (Qualtrics Labs Inc., Provo, UT), as well as multiple follow-up reminders. The participants worked either at the JHH (a 1194-bed tertiary academic medical center in Baltimore, MD) or the JHBMC (a 440-bed academic community hospital located nearby). Data were collected from October 2015 through January 2016.
Analysis
Means and standard deviations were calculated by treating the responses as continuous variables. We tried 3 different methods to handle missing data: (1) without imputation, (2) imputing the mean value of each item, and (3) substituting a neutral score. Because all 3 methods produced very similar results, we treated the N/A responses as missing values without imputation for simplicity of analysis. We used STATA 13.1 (Stata Corporation, College Station, Texas) to analyze the data.
To identify subscales, we performed exploratory factor analysis on responses to the 12 specific items. Promax rotation was selected based on the simple structure. Subscale scores for each respondent were generated by computing the mean of responses to the items in the subscale. Internal consistency reliability of the subscales was estimated using Cronbach’s alpha. We calculated Pearson correlation coefficients for the items in each subscale, and examined Cronbach’s alpha deleting each item in turn. For each of the subscales identified and the global scale, we calculated the mean, standard deviation, median and interquartile range. Although distributions of scores tended to be non-normal, this was done to increase interpretability. We also calculated percent scoring at the ceiling (highest possible score).
We analyzed the data with 3 research questions in mind: Was there a difference in perceptions of care coordination between (1) staff affiliated with the 2 different hospitals, (2) staff affiliated with different clinical departments, or (3) staff with different professional roles? For comparisons based on hospital and department, and type of professional, nonparametric tests (Wilcoxon rank-sum and Kruskal-Wallis test) were used with a level of statistical significance set at 0.05. The comparison between hospitals and departments was made only among nurses to minimize the confounding effect of different distribution of professionals. We tested the distribution of “years in specialty” between hospitals and departments for this comparison using Pearson’s χ2 test. The difference was not statistically significant (P = 0.167 for hospitals, and P = 0.518 for departments), so we assumed that the potential confounding effect of this variable was negligible in this analysis. The comparison of scores within each professional group used the Friedman test. Pearson’s χ2 test was used to compare the baseline characteristics between 2 hospitals.
RESULTS
Among the 1486 acute care professionals asked to participate in the survey, 841 completed the questionnaire (response rate 56.6%). Table 1 shows the characteristics of the participants from each hospital. Table 2 summarizes the item response rates, proportion scoring at the ceiling, and weighting from the factor analysis. All items had completion rates of 99.2% or higher, with N/A responses ranging from 0% (item 2) to 3.1% (item 7). The percent scoring at the ceiling was 1.7% for the global item and ranged from 18.3% up to 63.3% for other individual items.
We also examined differences in perceptions of care coordination among nursing units to illustrate the tool’s ability to detect variation in Patient Engagement subscale scores for JHH nurses (see Appendix).
DISCUSSION
This study resulted in one of the first measurement tools to succinctly measure multiple aspects of care coordination in the hospital from the perspective of healthcare professionals. Given the hectic work environment of healthcare professionals, and the increasing emphasis on collecting data for evaluation and improvement, it is important to minimize respondent burden. This effort was catalyzed by a multifaceted initiative to redesign acute care delivery and promote seamless transitions of care, supported by the Center for Medicare & Medicaid Innovation. In initial testing, this questionnaire has evidence for reliability and validity. It was encouraging to find that the preliminary psychometric performance of the measure was very similar in 2 different settings of a tertiary academic hospital and a community hospital.
Our analysis of the survey data explored potential differences between the 2 hospitals, among different types of healthcare professionals and across different departments. Although we expected differences, we had no specific hypotheses about what those differences might be, and, in fact, did not observe any substantial differences. This could be taken to indicate that the intervention was uniformly and successfully implemented in both hospitals, and engaged various professionals in different departments. The ability to detect differences in care coordination at the nursing unit level could also prove to be beneficial for more precisely targeting where process improvement is needed. Further data collection and analyses should be conducted to more systematically compare units and to help identify those where practice is most advanced and those where improvements may be needed. It would also be informative to link differences in care coordination scores with patient outcomes. In addition, differences identified on specific domains between professional groups could be helpful to identify where greater efforts are needed to improve interdisciplinary practice. Sampling strategies stratified by provider type would need to be targeted to make this kind of analysis informative.
The consistently lower scores observed for patient engagement, from the perspective of care professionals in all groups, suggest that this is an area where improvement is needed. These findings are consistent with published reports on the common failure by hospitals to include patients as a member of their own care team. In addition to measuring care processes from the perspective of frontline healthcare workers, future evaluations within the healthcare system would also benefit from including data collected from the perspective of the patient and family.
This study had some limitations. First, there may be more than 4 domains of care coordination that are important and can be measured in the acute care setting from provider perspective. However, the addition of more domains should be balanced against practicality and respondent burden. It may be possible to further clarify priority domains in hospital settings as opposed to the primary care setting. Future research should be directed to find these areas and to develop a more comprehensive, yet still concise measurement instrument. Second, the tool was developed to measure the impact of a large-scale intervention, and to fit into the specific context of 2 hospitals. Therefore, it should be tested in different settings of hospital care to see how it performs. However, virtually all hospitals in the United States today are adapting to changes in both financing and healthcare delivery. A tool such as the one described in this paper could be helpful to many organizations. Third, the scoring system for the overall scale score is not weighted and therefore reflects teamwork more than other components of care coordination, which are represented by fewer items. In general, we believe that use of the subscale scores may be more informative. Alternative scoring systems might also be proposed, including item weighting based on factor scores.
For the purposes of evaluation in this specific instance, we only collected data at a single point in time, after the intervention had been deployed. Thus, we were not able to evaluate the effectiveness of the J-CHiP intervention. We also did not intend to focus too much on the differences between units, given the limited number of respondents from individual units. It would be useful to collect more data at future time points, both to test the responsiveness of the scales and to evaluate the impact of future interventions at both the hospital and unit level.
The preliminary data from this study have generated insights about gaps in current practice, such as in engaging patients in the inpatient care process. It has also increased awareness by hospital leaders about the need to achieve high reliability in the adoption of new procedures and interdisciplinary practice. This tool might be used to find areas in need of improvement, to evaluate the effect of initiatives to improve care coordination, to monitor the change over time in the perception of care coordination among healthcare professionals, and to develop better intervention strategies for coordination activities in acute care settings. Additional research is needed to provide further evidence for the reliability and validity of this measure in diverse settings.
Disclosure
The project described was supported by Grant Number 1C1CMS331053-01-00 from the US Department of Health and Human Services, Centers for Medicare & Medicaid Services. The contents of this publication are solely the responsibility of the authors and do not necessarily represent the official views of the US Department of Health and Human Services or any of its agencies. The research presented was conducted by the awardee. Results may or may not be consistent with or confirmed by the findings of the independent evaluation contractor.
The authors have no other disclosures.
1. McDonald KM, Sundaram V, Bravata DM, et al. Closing the Quality Gap: A Critical Analysis of Quality Improvement Strategies (Vol. 7: Care Coordination). Technical Reviews, No. 9.7. Rockville (MD): Agency for Healthcare Research and Quality (US); 2007. PubMed
2. Adams K, Corrigan J. Priority areas for national action: transforming health care quality. Washington, DC: National Academies Press; 2003. PubMed
3. Renders CM, Valk GD, Griffin S, Wagner EH, Eijk JT, Assendelft WJ. Interventions to improve the management of diabetes mellitus in primary care, outpatient and community settings. Cochrane Database Syst Rev. 2001(1):CD001481. PubMed
4. McAlister FA, Lawson FM, Teo KK, Armstrong PW. A systematic review of randomized trials of disease management programs in heart failure. Am J Med. 2001;110(5):378-384. PubMed
5. Bruce ML, Raue PJ, Reilly CF, et al. Clinical effectiveness of integrating depression care management into medicare home health: the Depression CAREPATH Randomized trial. JAMA Intern Med. 2015;175(1):55-64. PubMed
6. Berkowitz SA, Brown P, Brotman DJ, et al. Case Study: Johns Hopkins Community Health Partnership: A model for transformation. Healthc (Amst). 2016;4(4):264-270. PubMed
7. McDonald. KM, Schultz. E, Albin. L, et al. Care Coordination Measures Atlas Version 4. Rockville, MD: Agency for Healthcare Research and Quality; 2014.
8 Schultz EM, Pineda N, Lonhart J, Davies SM, McDonald KM. A systematic review of the care coordination measurement landscape. BMC Health Serv Res. 2013;13:119. PubMed
9. Sexton JB, Helmreich RL, Neilands TB, et al. The Safety Attitudes Questionnaire: psychometric properties, benchmarking data, and emerging research. BMC Health Serv Res. 2006;6:44. PubMed
© 2017 Society of Hospital Medicine
Hospital Renovation Patient Satisfaction
Hospitals are expensive and complex facilities to build and renovate. It is estimated $200 billion is being spent in the United States during this decade on hospital construction and renovation, and further expenditures in this area are expected.[1] Aging hospital infrastructure, competition, and health system expansion have motivated institutions to invest in renovation and new hospital building construction.[2, 3, 4, 5, 6, 7] There is a trend toward patient‐centered design in new hospital construction. Features of this trend include same‐handed design (ie, rooms on a unit have all beds oriented in the same direction and do not share headwalls); use of sound absorbent materials to reduced ambient noise[7, 8, 9]; rooms with improved view and increased natural lighting to reduce anxiety, decrease delirium, and increase sense of wellbeing[10, 11, 12]; incorporation of natural elements like gardens, water features, and art[12, 13, 14, 15, 16, 17, 18]; single‐patient rooms to reduce transmission of infection and enhance privacy and visitor comfort[7, 19, 20]; presence of comfortable waiting rooms and visitor accommodations to enhance comfort and family participation[21, 22, 23]; and hotel‐like amenities such as on‐demand entertainment and room service menus.[24, 25]
There is a belief among some hospital leaders that patients are generally unable to distinguish their positive experience with a pleasing healthcare environment from their positive experience with care, and thus improving facilities will lead to improved satisfaction across the board.[26, 27] In a controlled study of hospitalized patients, appealing rooms were associated with increased satisfaction with services including housekeeping and food service staff, meals, as well as physicians and overall satisfaction.[26] A 2012 survey of hospital leadership found that expanding and renovating facilities was considered a top priority in improving patient satisfaction, with 82% of the respondents stating that this was important.[27]
Despite these attitudes, the impact of patient‐centered design on patient satisfaction is not well understood. Studies have shown that renovations and hospital construction that incorporates noise reduction strategies, positive distraction, patient and caregiver control, attractive waiting rooms, improved patient room appearance, private rooms, and large windows result in improved satisfaction with nursing, noise level, unit environment and cleanliness, perceived wait time, discharge preparedness, and overall care. [7, 19, 20, 23, 28] However, these studies were limited by small sample size, inclusion of a narrow group of patients (eg, ambulatory, obstetric, geriatric rehabilitation, intensive care unit), and concurrent use of interventions other than design improvement (eg, nurse and patient education). Many of these studies did not use the ubiquitous Hospital Consumer Assessment of Healthcare Providers and Systems (HCAHPS) and Press Ganey patient satisfaction surveys.
We sought to determine the changes in patient satisfaction that occurred during a natural experiment, in which clinical units (comprising stable nursing, physician, and unit teams) were relocated from an historic clinical building to a new clinical building that featured patient‐centered design, using HCAHPS and Press Ganey surveys and a large study population. We hypothesized that new building features would positively impact both facility related (eg, noise level), nonfacility related (eg, physician and housekeeping service related), and overall satisfaction.
METHODS
This was a retrospective analysis of prospectively collected Press Ganey and HCAPHS patient satisfaction survey data for a single academic tertiary care hospital.[29] The research project was reviewed and approved by the institutional review board.
Participants
All patients discharged from 12 clinical units that relocated to the new clinical building and returned patient satisfaction surveys served as study patients. The moved units included the coronary care unit, cardiac step down unit, medical intensive care unit, neuro critical care unit, surgical intensive care unit, orthopedic unit, neurology unit, neurosurgery unit, obstetrics units, gynecology unit, urology unit, cardiothoracic surgery unit, and the transplant surgery and renal transplant unit. Patients on clinical units that did not move served as concurrent controls.
Exposure
Patients admitted to the new clinical building experienced several patient‐centered design features. These features included easy access to healing gardens with a water feature, soaring lobbies, a collection of more than 500 works of art, well‐decorated and light‐filled patient rooms with sleeping accommodations for family members, sound‐absorbing features in patient care corridors ranging from acoustical ceiling tiles to a quiet nurse‐call system, and an interactive television network with Internet, movies, and games. All patients during the baseline period and control patients during the study period were located in typical patient rooms with standard hospital amenities. No other major patient satisfaction interventions were initiated during the pre‐ or postperiod in either arm of the study; ongoing patient satisfaction efforts (such as unit‐based customer care representatives) were deployed broadly and not restricted to the new clinical building. Clinical teams comprised of physicians, nurses, and ancillary staff did not change significantly after the move.
Time Periods
The move to new clinical building occurred on May 1, 2012. After allowing for a 15‐day washout period, the postmove period included Press Ganey and HCAHPS surveys returned for discharges that occurred during a 7.5‐month period between May 15, 2102 and December 31, 2012. Baseline data included Press Ganey and HCAHPS surveys returned for discharges in the preceding 12 months (May 1, 2011 to April 30, 2012). Sensitivity analysis using only 7.5 months of baseline data did not reveal any significant difference when compared with 12‐month baseline data, and we report only data from the 12‐month baseline period.
Instruments
Press Ganey and HCAHPS patient satisfaction surveys were sent via mail in the same envelope. Fifty percent of the discharged patients were randomized to receive the surveys. The Press Ganey survey contained 33 items covering across several subdomains including room, meal, nursing, physician, ancillary staff, visitor, discharge, and overall satisfaction. The HCAHPS survey contained 29 Centers for Medicare and Medicaid Services (CMS)‐mandated items, of which 21 are related to patient satisfaction. The development and testing and methods for administration and reporting of the HCAHPS survey have been previously described.[30, 31] Press Ganey patient satisfaction survey results have been reported in the literature.[32, 33]
Outcome Variables
Press Ganey and HCAHPS patient satisfaction survey responses were the primary outcome variables of the study. The survey items were categorized as facility related (eg, noise level), nonfacility related (eg, physician and nursing staff satisfaction), and overall satisfaction related.
Covariates
Age, sex, length of stay (LOS), insurance type, and all‐payer refined diagnosis‐related groupassociated illness complexity were included as covariates.
Statistical Analysis
Percent top‐box scores were calculated for each survey item as the percent of patients who responded very good for a given item on Press Ganey survey items and always or definitely yes or 9 or 10 on HCAHPS survey items. CMS utilizes percent top‐box scores to calculate payments under the Value Based Purchasing (VBP) program and to report the results publicly. Numerous studies have also reported percent top‐box scores for HCAHPS survey results.[31, 32, 33, 34]
Odds ratios of premove versus postmove percentage of top‐box scores, adjusted for age, sex, LOS, complexity of illness, and insurance type were determined using logistic regression for the units that moved. Similar scores were calculated for unmoved units to detect secular trends. To determine whether the differences between the moved and unmoved units were significant, we introduced the interaction term (moved vs unmoved unit status) (pre‐ vs postmove time period) into the logistic regression models and examined the adjusted P value for this term. All statistical analysis was performed using SAS Institute Inc.'s (Cary, NC) JMP Pro 10.0.0.
RESULTS
The study included 1648 respondents in the moved units in the baseline period (ie, units designated to move to a new clinical building) and 1373 respondents in the postmove period. There were 1593 respondents in the control group during the baseline period and 1049 respondents in the postmove period. For the units that moved, survey response rates were 28.5% prior to the move and 28.3% after the move. For the units that did not move, survey response rates were 20.9% prior to the move and 22.7% after the move. A majority of survey respondents on the nursing units that moved were white, male, and had private insurance (Table 1). There were no significant differences between respondents across these characteristics between the pre‐ and postmove periods. Mean age and LOS were also similar. For these units, there were 70.5% private rooms prior to the move and 100% after the move. For the unmoved units, 58.9% of the rooms were private in the baseline period and 72.7% were private in the study period. Similar to the units that moved, characteristics of the respondents on the unmoved units also did not differ significantly in the postmove period.
| Patient demographics | Moved Units (N=3,021) | Unmoved Units (N=2,642) | ||||
|---|---|---|---|---|---|---|
| Pre | Post | P Value | Pre | Post | P Value | |
| ||||||
| White | 75.3% | 78.2% | 0.07 | 66.7% | 68.5% | 0.31 |
| Mean age, y | 57.3 | 57.4 | 0.84 | 57.3 | 57.1 | 0.81 |
| Male | 54.3% | 53.0% | 0.48 | 40.5% | 42.3% | 0.23 |
| Self‐reported health | ||||||
| Excellent or very good | 54.7% | 51.2% | 0.04 | 38.7% | 39.5% | 0.11 |
| Good | 27.8% | 32.0% | 29.3% | 32.2% | ||
| Fair or poor | 17.5% | 16.9% | 32.0% | 28.3% | ||
| Self‐reported language | ||||||
| English | 96.0% | 97.2% | 0.06 | 96.8% | 97.1% | 0.63 |
| Other | 4.0% | 2.8% | 3.2% | 2.9% | ||
| Self‐reported education | ||||||
| Less than high school | 5.8% | 5.0% | 0.24 | 10.8% | 10.4% | 0.24 |
| High school grad | 46.4% | 44.2% | 48.6% | 45.5% | ||
| College grad or more | 47.7% | 50.7% | 40.7% | 44.7% | ||
| Insurance type | ||||||
| Medicaid | 6.7% | 5.5% | 0.11 | 10.8% | 9.0% | 0.32 |
| Medicare | 32.0% | 35.5% | 36.0% | 36.1% | ||
| Private insurance | 55.6% | 52.8% | 48.0% | 50.3% | ||
| Mean APRDRG complexity* | 2.1 | 2.1 | 0.09 | 2.3 | 2.3 | 0.14 |
| Mean LOS | 4.7 | 5.0 | 0.12 | 4.9 | 5.0 | 0.77 |
| Service | ||||||
| Medicine | 15.4% | 16.2% | 0.51 | 40.0% | 34.5% | 0.10 |
| Surgery | 50.7% | 45.7% | 40.1% | 44.1% | ||
| Neurosciences | 20.3% | 24.1% | 6.0% | 6.0% | ||
| Obstetrics/gynecology | 7.5% | 8.2% | 5.7% | 5.6% | ||
The move was associated with significant improvements in facility‐related satisfaction (Tables 2 and 3). The most prominent increases in satisfaction were with pleasantness of dcor (33.6% vs 66.2%), noise level (39.9% vs 59.3%), and visitor accommodation and comfort (50.0% vs 70.3 %). There was improvement in satisfaction related to cleanliness of the room (49.0% vs 68.6 %), but no significant increase in satisfaction with courtesy of the person cleaning the room (59.8% vs 67.7%) when compared with units that did move.
| Satisfaction Domain | Moved Units | Unmoved Units | P Value of the Difference in Odds Ratio Between Moved and Unmoved Units | |||||
|---|---|---|---|---|---|---|---|---|
| % Top Box | Adjusted Odds Ratio* (95% CI) | % Top Box | Adjusted Odds Ratio* (95% CI) | |||||
| Pre | Post | Pre | Post | |||||
| ||||||||
| FACILITY RELATED | ||||||||
| Hospital environment | ||||||||
| Cleanliness of the room and bathroom | 61.0 | 70.8 | 1.62 (1.40‐1.90) | 64.0 | 69.2 | 1.24 (1.03‐1.48) | 0.03 | |
| Quietness of the room | 51.3 | 65.4 | 1.89 (1.63‐2.19) | 58.6 | 60.3 | 1.08 (0.90‐1.28) | <0.0001 | |
| NONFACILITY RELATED | ||||||||
| Nursing communication | ||||||||
| Nurses treated with courtesy/respect | 84.0 | 86.7 | 1.28 (1.05‐1.57) | 83.6 | 87.1 | 1.29 (1.02‐1.64) | 0.92 | |
| Nurses listened | 73.1 | 76.4 | 1.21 (1.03‐1.43) | 74.2 | 75.5 | 1.05 (0.86‐1.27) | 0.26 | |
| Nurses explained | 75.0 | 76.6 | 1.10 (0.94‐1.30) | 76.0 | 76.2 | 1.00 (0.82‐1.21) | 0.43 | |
| Physician communication | ||||||||
| Doctors treated with courtesy/respect | 89.5 | 90.5 | 1.13 (0.89‐1.42) | 84.9 | 87.3 | 1.20 (0.94‐1.53) | 0.77 | |
| Doctors listened | 81.4 | 81.0 | 0.93 (0.83‐1.19) | 77.7 | 77.1 | 0.94 (0.77‐1.15) | 0.68 | |
| Doctors explained | 79.2 | 79.0 | 1.00(0.84‐1.19) | 75.7 | 74.4 | 0.92 (0.76‐1.12) | 0.49 | |
| Other | ||||||||
| Help toileting as soon as you wanted | 61.8 | 63.7 | 1.08 (0.89‐1.32) | 62.3 | 60.6 | 0.92 (0.71‐1.18) | 0.31 | |
| Pain well controlled | 63.2 | 63.8 | 1.06 (0.90‐1.25) | 62.0 | 62.6 | 0.99 (0.81‐1.20) | 060 | |
| Staff do everything to help with pain | 77.7 | 80.1 | 1.19 (0.99‐1.44) | 76.8 | 75.7 | 0.90 (0.75‐1.13) | 0.07 | |
| Staff describe medicine side effects | 47.0 | 47.6 | 1.05 (0.89‐1.24) | 49.2 | 47.1 | 0.91 (0.74‐1.11) | 0.32 | |
| Tell you what new medicine was for | 76.4 | 76.4 | 1.02 (0.84‐1.25) | 77.1 | 78.8 | 1.09(0.85‐1.39) | 0.65 | |
| Overall | ||||||||
| Rate hospital (010) | 75.0 | 83.3 | 1.71 (1.44‐2.05) | 75.7 | 77.6 | 1.06 (0.87‐1.29) | 0.006 | |
| Recommend hospital | 82.5 | 87.1 | 1.43 (1.18‐1.76) | 81.4 | 82.0 | 0.98 (0.79‐1.22) | 0.03 | |
| Satisfaction Domain | Moved Unit | Unmoved Unit | P Value of the Difference in Odds Ratio Between Moved and Unmoved Units | ||||
|---|---|---|---|---|---|---|---|
| % Top Box | Adjusted Odds Ratio* (95% CI) | % Top Box | Adjusted Odds Ratio* (95% CI) | ||||
| Pre | Post | Pre | Post | ||||
| |||||||
| FACILITY RELATED | |||||||
| Room | |||||||
| Pleasantness of room dcor | 33.6 | 64.8 | 3.77 (3.24‐4.38) | 41.6 | 47.0 | 1.21 (1.02‐1.44) | <0.0001 |
| Room cleanliness | 49.0 | 68.6 | 2.35 (2.02‐2.73) | 51.6 | 59.1 | 1.32 (1.12‐1.58) | <0.0001 |
| Room temperature | 43.1 | 54.9 | 1.64 (1.43‐1.90) | 45.0 | 48.8 | 1.14 (0.96‐1.36) | 0.002 |
| Noise level in and around the room | 40.2 | 59.2 | 2.23 (1.92‐2.58) | 45.5 | 47.6 | 1.07 (0.90‐1.22) | <0.0001 |
| Visitor related | |||||||
| Accommodations and comfort of visitors | 50.0 | 70.3 | 2.44 (2.10‐2.83) | 55.3 | 59.1 | 1.14 (0.96‐1.35) | <0.0001 |
| NONFACILITY RELATED | |||||||
| Food | |||||||
| Temperature of the food | 31.1 | 33.6 | 1.15 (0.99‐1.34) | 34.0 | 38.9 | 1.23 (1.02‐1.47) | 0.51 |
| Quality of the food | 25.8 | 27.1 | 1.10 (0.93‐1.30) | 30.2 | 36.2 | 1.32 (1.10‐1.59) | 0.12 |
| Courtesy of the person who served food | 63.9 | 62.3 | 0.93 (0.80‐1.10) | 66.0 | 61.4 | 0.82 (0.69‐0.98) | 0.26 |
| Nursing | |||||||
| Friendliness/courtesy of the nurses | 76.3 | 82.8 | 1.49 (1.26‐1.79) | 77.7 | 80.1 | 1.10 (0.90‐1.37) | 0.04 |
| Promptness of response to call | 60.1 | 62.6 | 1.14 (0.98‐1.33) | 59.2 | 62.0 | 1.10 (0.91‐1.31) | 0.80 |
| Nurses' attitude toward requests | 71.0 | 75.8 | 1.30 (1.11‐1.54) | 70.5 | 72.4 | 1.06 (0.88‐1.28) | 0.13 |
| Attention to special/personal needs | 66.7 | 72.2 | 1.32 (1.13‐1.54) | 67.8 | 70.3 | 1.09 (0.91‐1.31) | 0.16 |
| Nurses kept you informed | 64.3 | 72.2 | 1.46 (1.25‐1.70) | 65.8 | 69.8 | 1.17 (0.98‐1.41) | 0.88 |
| Skill of the nurses | 75.3 | 79.5 | 1.28 (1.08‐1.52) | 74.3 | 78.6 | 1.23 (1.01‐1.51) | 0.89 |
| Ancillary staff | |||||||
| Courtesy of the person cleaning the room | 59.8 | 67.7 | 1.41 (1.21‐1.65) | 61.2 | 66.5 | 1.24 (1.03‐1.49) | 0.28 |
| Courtesy of the person who took blood | 66.5 | 68.1 | 1.10 (0.94‐1.28) | 63.2 | 63.1 | 0.96 (0.76‐1.08) | 0.34 |
| Courtesy of the person who started the IV | 70.0 | 71.7 | 1.09 (0.93‐1.28) | 66.6 | 69.3 | 1.11 (0.92‐1.33) | 0.88 |
| Visitor related | |||||||
| Staff attitude toward visitors | 68.1 | 79.4 | 1.84 (1.56‐2.18) | 70.3 | 72.2 | 1.06 (0.87‐1.28) | <0.0001 |
| Physician | |||||||
| Time physician spent with you | 55.0 | 58.9 | 1.20 (1.04‐1.39) | 53.2 | 55.9 | 1.10 (0.92‐1.30) | 0.46 |
| Physician concern questions/worries | 67.2 | 70.7 | 1.20 (1.03‐1.40) | 64.3 | 66.1 | 1.05 (0.88‐1.26) | 0.31 |
| Physician kept you informed | 65.3 | 67.5 | 1.12 (0.96‐1.30) | 61.6 | 63.2 | 1.05 (0.88‐1.25) | 0.58 |
| Friendliness/courtesy of physician | 76.3 | 78.1 | 1.11 (0.93‐1.31) | 71.0 | 73.3 | 1.08 (0.90‐1.31) | 0.89 |
| Skill of physician | 85.4 | 88.5 | 1.35 (1.09‐1.68) | 78.0 | 81.0 | 1.15 (0.93‐1.43) | 0.34 |
| Discharge | |||||||
| Extent felt ready for discharge | 62.0 | 66.7 | 1.23 (1.07‐1.44) | 59.2 | 62.3 | 1.10 (0.92‐1.30) | 0.35 |
| Speed of discharge process | 50.7 | 54.2 | 1.16 (1.01‐1.33) | 47.8 | 50.0 | 1.07 (0.90‐1.27) | 0.49 |
| Instructions for care at home | 66.4 | 71.1 | 1.25 (1.06‐1.46) | 64.0 | 67.7 | 1.16 (0.97‐1.39) | 0.54 |
| Staff concern for your privacy | 65.3 | 71.8 | 1.37 (1.17‐0.85) | 63.6 | 66.2 | 1.10 (0.91‐1.31) | 0.07 |
| Miscellaneous | |||||||
| How well your pain was controlled | 64.2 | 66.5 | 1.14 (0.97‐1.32) | 60.2 | 62.6 | 1.07 (0.89‐1.28) | 0.66 |
| Staff addressed emotional needs | 60.0 | 63.4 | 1.19 (1.02‐1.38) | 55.1 | 60.2 | 1.20 (1.01‐1.42) | 0.90 |
| Response to concerns/complaints | 61.1 | 64.5 | 1.19 (1.02‐1.38) | 57.2 | 60.1 | 1.10 (0.92‐1.31) | 0.57 |
| Overall | |||||||
| Staff worked together to care for you | 72.6 | 77.2 | 1.29 (1.10‐1.52) | 70.3 | 73.2 | 1.13 (0.93‐1.37) | 0.30 |
| Likelihood of recommending hospital | 79.1 | 84.3 | 1.44 (1.20‐1.74) | 76.3 | 79.2 | 1.14 (0.93‐1.39) | 0.10 |
| Overall rating of care given | 76.8 | 83.0 | 1.50 (1.25‐1.80) | 74.7 | 77.2 | 1.10 (0.90‐1.34) | 0.03 |
With regard to nonfacility‐related satisfaction, there were statistically higher scores in several nursing, physician, and discharge‐related satisfaction domains after the move. However, these changes were not associated with the move to the new clinical building as they were not significantly different from improvements on the unmoved units. Among nonfacility‐related items, only staff attitude toward visitors showed significant improvement (68.1% vs 79.4%). There was a significant improvement in hospital rating (75.0% vs 83.3% in the moved units and 75.7% vs 77.6% in the unmoved units). However, the other 3 measures of overall satisfaction did not show significant improvement associated with the move to the new clinical building when compared to the concurrent controls.
DISCUSSION
Contrary to our hypothesis and a belief held by many, we found that patients appeared able to distinguish their experience with hospital environment from their experience with providers and other services. Improvement in hospital facilities with incorporation of patient‐centered features was associated with improvements that were largely limited to increases in satisfaction with quietness, cleanliness, temperature, and dcor of the room along with visitor‐related satisfaction. Notably, there was no significant improvement in satisfaction related to physicians, nurses, housekeeping, and other service staff. There was improvement in satisfaction with staff attitude toward visitors, but this can be attributed to availability of visitor‐friendly facilities. There was a significant improvement in 1 of the 4 measures of overall satisfaction. Our findings also support the construct validity of HCAHPS and Press Ganey patient satisfaction surveys.
Ours is one of the largest studies on patient satisfaction related to patient‐centered design features in the inpatient acute care setting. Swan et al. also studied patients in an acute inpatient setting and compared satisfaction related to appealing versus typical hospital rooms. Patients were matched for case mix, insurance, gender, types of medical services received and LOS, and were served by the same set of physicians and similar food service and housekeeping staff.[26] Unlike our study, they found improved satisfaction related to physicians, housekeeping staff, food service staff, meals, and overall satisfaction. However, the study had some limitations. In particular, the study sample was self‐selected because the patients in this group were required to pay an extra daily fee to utilize the appealing room. Additionally, there were only 177 patients across the 2 groups, and the actual differences in satisfaction scores were small. Our sample was larger and patients in the study group were admitted to units in the new clinical buildings by the same criteria as they were admitted to the historic building prior to the move, and there were no significant differences in baseline characteristics between the comparison groups.
Jansen et al. also found broad improvements in patient satisfaction in a study of over 309 maternity unit patients in a new construction, all private‐room maternity unit with more appealing design elements and comfort features for visitors.[7] Improved satisfaction was noted with the physical environment, nursing care, assistance with feeding, respect for privacy, and discharge planning. However, it is difficult to extrapolate the results of this study to other settings, as maternity unit patients constitute a unique patient demographic with unique care needs. Additionally, when compared with patients in the control group, the patients in the study group were cared for by nurses who had a lower workload and who were not assigned other patients with more complex needs. Because nursing availability may be expected to impact satisfaction with clinical domains, the impact of private and appealing room may very well have been limited to improved satisfaction with the physical environment.
Despite the widespread belief among healthcare leadership that facility renovation or expansion is a vital strategy for improving patient satisfaction, our study shows that this may not be a dominant factor.[27] In fact, the Planetree model showed that improvement in satisfaction related to physical environment and nursing care was associated with implementation of both patient‐centered design features as well as with utilization of nurses that were trained to provide personalized care, educate patients, and involve patients and family.[28] It is more likely that provider‐level interventions will have a greater impact on provider level and overall satisfaction. This idea is supported by a recent JD Powers study suggesting that facilities represent only 19% of overall satisfaction in the inpatient setting.[35]
Although our study focused on patient‐centered design features, several renovation and construction projects have also focused on design features that improve patient safety and provider satisfaction, workflow, efficiency, productivity, stress, and time spent in direct care.[9] Interventions in these areas may lead to improvement in patient outcomes and perhaps lead to improvement in patient satisfaction; however, this relationship has not been well established at present.
In an era of cost containment, healthcare administrators are faced with high‐priced interventions, competing needs, limited resources, low profit margins, and often unclear evidence on cost‐effectiveness and return on investment of healthcare design features. Benefits are related to competitive advantage, higher reputation, patient retention, decreased malpractice costs, and increased Medicare payments through VBP programs that incentivize improved performance on quality metrics and patient satisfaction surveys. Our study supports the idea that a significant improvement in patient satisfaction related to creature comforts can be achieved with investment in patient‐centered design features. However, our findings also suggest that institutions should perform an individualized cost‐benefit analysis related to improvements in this narrow area of patient satisfaction. In our study, incorporation of patient‐centered design features resulted in improvement on 2 VBP HCAHPS measures, and its contribution toward total performance score under the VBP program would be limited.
Strengths of our study include the use of concurrent controls and our ability to capitalize on a natural experiment in which care teams remained constant before and after a move to a new clinical building. However, our study has some limitations. It was conducted at a single tertiary care academic center that predominantly serves an inner city population and referral patients seeking specialized care. Drivers of patient satisfaction may be different in community hospitals, and a different relationship may be observed between patient‐centered design and domains of patient satisfaction in this setting. Further studies in different hospital settings are needed to confirm our findings. Additionally, we were limited by the low response rate of the surveys. However, this is a widespread problem with all patient satisfaction research utilizing voluntary surveys, and our response rates are consistent with those previously reported.[34, 36, 37, 38] Furthermore, low response rates have not impeded the implementation of pay‐for‐performance programs on a national scale using HCHAPS.
In conclusion, our study suggests that hospitals should not use outdated facilities as an excuse for achievement of suboptimal satisfaction scores. Patients respond positively to creature comforts, pleasing surroundings, and visitor‐friendly facilities but can distinguish these positive experiences from experiences in other patient satisfaction domains. In our study, the move to a higher‐amenity building had only a modest impact on overall patient satisfaction, perhaps because clinical care is the primary driver of this outcome. Contrary to belief held by some hospital leaders, major strides in overall satisfaction across the board and other subdomains of satisfaction likely require intervention in areas other than facility renovation and expansion.
Disclosures
Zishan Siddiqui, MD, was supported by the Osler Center of Clinical Excellence Faculty Scholarship Grant. Funds from Johns Hopkins Hospitalist Scholars Program supported the research project. The authors have no conflict of interests to disclose.
- , . Create a blueprint for successful hospital construction. Nurs Manage. 2006;37(6):39–44.
- Walter Reed National Military Medical Center website. Facts at a glance. Available at: http://www.wrnmmc.capmed.mil/About%20Us/SitePages/Facts.aspx. Accessed June 19, 2013.
- . Keys to collaboration. Healthcare Design website. Available at: http://www.healthcaredesignmagazine.com/building‐ideas/keys‐collaboration. Accessed June 19, 2013.
- . A tale of 4 hospitals. Healthcare Design website. Available at: http://www.healthcaredesignmagazine.com/building‐ideas/tale‐4‐hospitals. Accessed June 19, 2013.
- . Gateway to the east. Healthcare Design website. Available at: http://www.healthcaredesignmagazine.com/building‐ideas/gateway‐east. Accessed June 19, 2013.
- . Lessons learned. Healthcare Design website. Available at: http://www.healthcaredesignmagazine.com/building‐ideas/lessons‐learned. Accessed June 19, 2013.
- , , , , . Single room maternity care and client satisfaction. Birth. 2000;27(4):235–243.
- , , , . Same‐handed and mirrored unit configurations: is there a difference in patient and nurse outcomes? J Nurs Adm. 2011;41(6):273–279.
- , . The Pebble Projects: coordinated evidence‐based case studies. Build Res Inform. 2008;36(2):129–145.
- , , . Effects of exposure to nature and abstract pictures on patients recovering from open heart surgery. J Soc Psychophysiol Res. 1993;30:7.
- , , , . Postoperative delirium. Curr Drug Targets. 2005;6(7):807–814.
- . Stimulus deprivation in windowless rooms. Anaesthesia. 1977;32(7):598–602.
- , , , . Post‐occupancy evaluation of healing gardens in a pediatric cancer center. Landsc Urban Plan. 2005;73(2):167–183.
- . Healing gardens in hospitals. Interdiscip Des Res J. 2007;1(1):1–27.
- , . Restorative gardens. BMJ. 1993;306(6885):1080–1081.
- . Effects of interior design on wellness: theory and recent scientific research. J Health Care Inter Des. 1991;3:97–109.
- , . Sunny hospital rooms expedite recovery from severe and refractory depressions. J Affect Disord. 1996;40(1‐2):49–51.
- . Art in hospital spaces: the role of hospitals in an aestheticised society. Int J Cult Policy. 2007;13(1):85–101.
- , , . Renovation of a semiprivate patient room. Bowman Center Geriatric Rehabilitation Unit. Nurs Clin North Am 1995;30(1):97–115.
- , , , et al. (2013). Effect of intensive care environment on family and patient satisfaction: a before‐after study. Intensive Care Med. 2013;39(9):1626–1634.
- , , , , . Outcomes of environmental appraisal of different hospital waiting areas. Environ Behav. 2003;35(6):842–869.
- . Redesigning the neurocritical care unit to enhance family participation and improve outcomes. Cleve Clin J Med. 2009;76(suppl 2):S70–S74.
- , . The ecology of the patient visit: physical attractiveness, waiting times, and perceived quality of care. J Ambul Care Manage. 2008;31(2):128–141.
- . Patient satisfaction and the new consumer. Hosp Health Netw. 2006;80(57):59–62.
- . Patient satisfaction. Hospitals embrace hotel‐like amenities. Hosp Health Netw. 2007;81(11):24–26.
- , , . Do appealing hospital rooms increase patient evaluations of physicians, nurses, and hospital services? Health Care Manage Rev. 2003;28(3):254–264.
- . Patient experience and HCAHPS: little consensus on a top priority. Health Leaders Media website. Available at http://www.healthleadersmedia.com/intelligence/detail.cfm?content_id=28289334(2):125–133.
- Centers for Medicare 67:27–37.
- Hospital Consumer Assessment of Healthcare Providers and Systems. Summary analysis. http://www.hcahpsonline.org/SummaryAnalyses.aspx. Accessed October 1, 2014.
- Centers for Medicare 44(2 pt 1):501–518.
- J.D. Power and Associates. Patient satisfaction influenced more by hospital staff than by the hospital facilities. Available at: http://www.jdpower.com/press‐releases/2012‐national‐patient‐experience‐study#sthash.gSv6wAdc.dpuf. Accessed December 10, 2013.
- , , , , . Racial and ethnic differences in a patient survey: patients' values, ratings, and reports regarding physician primary care performance in a large health maintenance organization. Med Care. 2000;38(3): 300–310.
- , , , . Patient experience in safety‐net hospitals implications for improving care and Value‐Based Purchasing patient experience in safety‐net hospitals. Arch Intern Med. 2012;172(16):1204–1210.
- , , , . Comparison of Hospital Consumer Assessment of Healthcare Providers and Systems patient satisfaction scores for specialty hospitals and general medical hospitals: confounding effect of survey response rate. J Hosp Med. 2014;9(9):590–593.
Hospitals are expensive and complex facilities to build and renovate. It is estimated $200 billion is being spent in the United States during this decade on hospital construction and renovation, and further expenditures in this area are expected.[1] Aging hospital infrastructure, competition, and health system expansion have motivated institutions to invest in renovation and new hospital building construction.[2, 3, 4, 5, 6, 7] There is a trend toward patient‐centered design in new hospital construction. Features of this trend include same‐handed design (ie, rooms on a unit have all beds oriented in the same direction and do not share headwalls); use of sound absorbent materials to reduced ambient noise[7, 8, 9]; rooms with improved view and increased natural lighting to reduce anxiety, decrease delirium, and increase sense of wellbeing[10, 11, 12]; incorporation of natural elements like gardens, water features, and art[12, 13, 14, 15, 16, 17, 18]; single‐patient rooms to reduce transmission of infection and enhance privacy and visitor comfort[7, 19, 20]; presence of comfortable waiting rooms and visitor accommodations to enhance comfort and family participation[21, 22, 23]; and hotel‐like amenities such as on‐demand entertainment and room service menus.[24, 25]
There is a belief among some hospital leaders that patients are generally unable to distinguish their positive experience with a pleasing healthcare environment from their positive experience with care, and thus improving facilities will lead to improved satisfaction across the board.[26, 27] In a controlled study of hospitalized patients, appealing rooms were associated with increased satisfaction with services including housekeeping and food service staff, meals, as well as physicians and overall satisfaction.[26] A 2012 survey of hospital leadership found that expanding and renovating facilities was considered a top priority in improving patient satisfaction, with 82% of the respondents stating that this was important.[27]
Despite these attitudes, the impact of patient‐centered design on patient satisfaction is not well understood. Studies have shown that renovations and hospital construction that incorporates noise reduction strategies, positive distraction, patient and caregiver control, attractive waiting rooms, improved patient room appearance, private rooms, and large windows result in improved satisfaction with nursing, noise level, unit environment and cleanliness, perceived wait time, discharge preparedness, and overall care. [7, 19, 20, 23, 28] However, these studies were limited by small sample size, inclusion of a narrow group of patients (eg, ambulatory, obstetric, geriatric rehabilitation, intensive care unit), and concurrent use of interventions other than design improvement (eg, nurse and patient education). Many of these studies did not use the ubiquitous Hospital Consumer Assessment of Healthcare Providers and Systems (HCAHPS) and Press Ganey patient satisfaction surveys.
We sought to determine the changes in patient satisfaction that occurred during a natural experiment, in which clinical units (comprising stable nursing, physician, and unit teams) were relocated from an historic clinical building to a new clinical building that featured patient‐centered design, using HCAHPS and Press Ganey surveys and a large study population. We hypothesized that new building features would positively impact both facility related (eg, noise level), nonfacility related (eg, physician and housekeeping service related), and overall satisfaction.
METHODS
This was a retrospective analysis of prospectively collected Press Ganey and HCAPHS patient satisfaction survey data for a single academic tertiary care hospital.[29] The research project was reviewed and approved by the institutional review board.
Participants
All patients discharged from 12 clinical units that relocated to the new clinical building and returned patient satisfaction surveys served as study patients. The moved units included the coronary care unit, cardiac step down unit, medical intensive care unit, neuro critical care unit, surgical intensive care unit, orthopedic unit, neurology unit, neurosurgery unit, obstetrics units, gynecology unit, urology unit, cardiothoracic surgery unit, and the transplant surgery and renal transplant unit. Patients on clinical units that did not move served as concurrent controls.
Exposure
Patients admitted to the new clinical building experienced several patient‐centered design features. These features included easy access to healing gardens with a water feature, soaring lobbies, a collection of more than 500 works of art, well‐decorated and light‐filled patient rooms with sleeping accommodations for family members, sound‐absorbing features in patient care corridors ranging from acoustical ceiling tiles to a quiet nurse‐call system, and an interactive television network with Internet, movies, and games. All patients during the baseline period and control patients during the study period were located in typical patient rooms with standard hospital amenities. No other major patient satisfaction interventions were initiated during the pre‐ or postperiod in either arm of the study; ongoing patient satisfaction efforts (such as unit‐based customer care representatives) were deployed broadly and not restricted to the new clinical building. Clinical teams comprised of physicians, nurses, and ancillary staff did not change significantly after the move.
Time Periods
The move to new clinical building occurred on May 1, 2012. After allowing for a 15‐day washout period, the postmove period included Press Ganey and HCAHPS surveys returned for discharges that occurred during a 7.5‐month period between May 15, 2102 and December 31, 2012. Baseline data included Press Ganey and HCAHPS surveys returned for discharges in the preceding 12 months (May 1, 2011 to April 30, 2012). Sensitivity analysis using only 7.5 months of baseline data did not reveal any significant difference when compared with 12‐month baseline data, and we report only data from the 12‐month baseline period.
Instruments
Press Ganey and HCAHPS patient satisfaction surveys were sent via mail in the same envelope. Fifty percent of the discharged patients were randomized to receive the surveys. The Press Ganey survey contained 33 items covering across several subdomains including room, meal, nursing, physician, ancillary staff, visitor, discharge, and overall satisfaction. The HCAHPS survey contained 29 Centers for Medicare and Medicaid Services (CMS)‐mandated items, of which 21 are related to patient satisfaction. The development and testing and methods for administration and reporting of the HCAHPS survey have been previously described.[30, 31] Press Ganey patient satisfaction survey results have been reported in the literature.[32, 33]
Outcome Variables
Press Ganey and HCAHPS patient satisfaction survey responses were the primary outcome variables of the study. The survey items were categorized as facility related (eg, noise level), nonfacility related (eg, physician and nursing staff satisfaction), and overall satisfaction related.
Covariates
Age, sex, length of stay (LOS), insurance type, and all‐payer refined diagnosis‐related groupassociated illness complexity were included as covariates.
Statistical Analysis
Percent top‐box scores were calculated for each survey item as the percent of patients who responded very good for a given item on Press Ganey survey items and always or definitely yes or 9 or 10 on HCAHPS survey items. CMS utilizes percent top‐box scores to calculate payments under the Value Based Purchasing (VBP) program and to report the results publicly. Numerous studies have also reported percent top‐box scores for HCAHPS survey results.[31, 32, 33, 34]
Odds ratios of premove versus postmove percentage of top‐box scores, adjusted for age, sex, LOS, complexity of illness, and insurance type were determined using logistic regression for the units that moved. Similar scores were calculated for unmoved units to detect secular trends. To determine whether the differences between the moved and unmoved units were significant, we introduced the interaction term (moved vs unmoved unit status) (pre‐ vs postmove time period) into the logistic regression models and examined the adjusted P value for this term. All statistical analysis was performed using SAS Institute Inc.'s (Cary, NC) JMP Pro 10.0.0.
RESULTS
The study included 1648 respondents in the moved units in the baseline period (ie, units designated to move to a new clinical building) and 1373 respondents in the postmove period. There were 1593 respondents in the control group during the baseline period and 1049 respondents in the postmove period. For the units that moved, survey response rates were 28.5% prior to the move and 28.3% after the move. For the units that did not move, survey response rates were 20.9% prior to the move and 22.7% after the move. A majority of survey respondents on the nursing units that moved were white, male, and had private insurance (Table 1). There were no significant differences between respondents across these characteristics between the pre‐ and postmove periods. Mean age and LOS were also similar. For these units, there were 70.5% private rooms prior to the move and 100% after the move. For the unmoved units, 58.9% of the rooms were private in the baseline period and 72.7% were private in the study period. Similar to the units that moved, characteristics of the respondents on the unmoved units also did not differ significantly in the postmove period.
| Patient demographics | Moved Units (N=3,021) | Unmoved Units (N=2,642) | ||||
|---|---|---|---|---|---|---|
| Pre | Post | P Value | Pre | Post | P Value | |
| ||||||
| White | 75.3% | 78.2% | 0.07 | 66.7% | 68.5% | 0.31 |
| Mean age, y | 57.3 | 57.4 | 0.84 | 57.3 | 57.1 | 0.81 |
| Male | 54.3% | 53.0% | 0.48 | 40.5% | 42.3% | 0.23 |
| Self‐reported health | ||||||
| Excellent or very good | 54.7% | 51.2% | 0.04 | 38.7% | 39.5% | 0.11 |
| Good | 27.8% | 32.0% | 29.3% | 32.2% | ||
| Fair or poor | 17.5% | 16.9% | 32.0% | 28.3% | ||
| Self‐reported language | ||||||
| English | 96.0% | 97.2% | 0.06 | 96.8% | 97.1% | 0.63 |
| Other | 4.0% | 2.8% | 3.2% | 2.9% | ||
| Self‐reported education | ||||||
| Less than high school | 5.8% | 5.0% | 0.24 | 10.8% | 10.4% | 0.24 |
| High school grad | 46.4% | 44.2% | 48.6% | 45.5% | ||
| College grad or more | 47.7% | 50.7% | 40.7% | 44.7% | ||
| Insurance type | ||||||
| Medicaid | 6.7% | 5.5% | 0.11 | 10.8% | 9.0% | 0.32 |
| Medicare | 32.0% | 35.5% | 36.0% | 36.1% | ||
| Private insurance | 55.6% | 52.8% | 48.0% | 50.3% | ||
| Mean APRDRG complexity* | 2.1 | 2.1 | 0.09 | 2.3 | 2.3 | 0.14 |
| Mean LOS | 4.7 | 5.0 | 0.12 | 4.9 | 5.0 | 0.77 |
| Service | ||||||
| Medicine | 15.4% | 16.2% | 0.51 | 40.0% | 34.5% | 0.10 |
| Surgery | 50.7% | 45.7% | 40.1% | 44.1% | ||
| Neurosciences | 20.3% | 24.1% | 6.0% | 6.0% | ||
| Obstetrics/gynecology | 7.5% | 8.2% | 5.7% | 5.6% | ||
The move was associated with significant improvements in facility‐related satisfaction (Tables 2 and 3). The most prominent increases in satisfaction were with pleasantness of dcor (33.6% vs 66.2%), noise level (39.9% vs 59.3%), and visitor accommodation and comfort (50.0% vs 70.3 %). There was improvement in satisfaction related to cleanliness of the room (49.0% vs 68.6 %), but no significant increase in satisfaction with courtesy of the person cleaning the room (59.8% vs 67.7%) when compared with units that did move.
| Satisfaction Domain | Moved Units | Unmoved Units | P Value of the Difference in Odds Ratio Between Moved and Unmoved Units | |||||
|---|---|---|---|---|---|---|---|---|
| % Top Box | Adjusted Odds Ratio* (95% CI) | % Top Box | Adjusted Odds Ratio* (95% CI) | |||||
| Pre | Post | Pre | Post | |||||
| ||||||||
| FACILITY RELATED | ||||||||
| Hospital environment | ||||||||
| Cleanliness of the room and bathroom | 61.0 | 70.8 | 1.62 (1.40‐1.90) | 64.0 | 69.2 | 1.24 (1.03‐1.48) | 0.03 | |
| Quietness of the room | 51.3 | 65.4 | 1.89 (1.63‐2.19) | 58.6 | 60.3 | 1.08 (0.90‐1.28) | <0.0001 | |
| NONFACILITY RELATED | ||||||||
| Nursing communication | ||||||||
| Nurses treated with courtesy/respect | 84.0 | 86.7 | 1.28 (1.05‐1.57) | 83.6 | 87.1 | 1.29 (1.02‐1.64) | 0.92 | |
| Nurses listened | 73.1 | 76.4 | 1.21 (1.03‐1.43) | 74.2 | 75.5 | 1.05 (0.86‐1.27) | 0.26 | |
| Nurses explained | 75.0 | 76.6 | 1.10 (0.94‐1.30) | 76.0 | 76.2 | 1.00 (0.82‐1.21) | 0.43 | |
| Physician communication | ||||||||
| Doctors treated with courtesy/respect | 89.5 | 90.5 | 1.13 (0.89‐1.42) | 84.9 | 87.3 | 1.20 (0.94‐1.53) | 0.77 | |
| Doctors listened | 81.4 | 81.0 | 0.93 (0.83‐1.19) | 77.7 | 77.1 | 0.94 (0.77‐1.15) | 0.68 | |
| Doctors explained | 79.2 | 79.0 | 1.00(0.84‐1.19) | 75.7 | 74.4 | 0.92 (0.76‐1.12) | 0.49 | |
| Other | ||||||||
| Help toileting as soon as you wanted | 61.8 | 63.7 | 1.08 (0.89‐1.32) | 62.3 | 60.6 | 0.92 (0.71‐1.18) | 0.31 | |
| Pain well controlled | 63.2 | 63.8 | 1.06 (0.90‐1.25) | 62.0 | 62.6 | 0.99 (0.81‐1.20) | 060 | |
| Staff do everything to help with pain | 77.7 | 80.1 | 1.19 (0.99‐1.44) | 76.8 | 75.7 | 0.90 (0.75‐1.13) | 0.07 | |
| Staff describe medicine side effects | 47.0 | 47.6 | 1.05 (0.89‐1.24) | 49.2 | 47.1 | 0.91 (0.74‐1.11) | 0.32 | |
| Tell you what new medicine was for | 76.4 | 76.4 | 1.02 (0.84‐1.25) | 77.1 | 78.8 | 1.09(0.85‐1.39) | 0.65 | |
| Overall | ||||||||
| Rate hospital (010) | 75.0 | 83.3 | 1.71 (1.44‐2.05) | 75.7 | 77.6 | 1.06 (0.87‐1.29) | 0.006 | |
| Recommend hospital | 82.5 | 87.1 | 1.43 (1.18‐1.76) | 81.4 | 82.0 | 0.98 (0.79‐1.22) | 0.03 | |
| Satisfaction Domain | Moved Unit | Unmoved Unit | P Value of the Difference in Odds Ratio Between Moved and Unmoved Units | ||||
|---|---|---|---|---|---|---|---|
| % Top Box | Adjusted Odds Ratio* (95% CI) | % Top Box | Adjusted Odds Ratio* (95% CI) | ||||
| Pre | Post | Pre | Post | ||||
| |||||||
| FACILITY RELATED | |||||||
| Room | |||||||
| Pleasantness of room dcor | 33.6 | 64.8 | 3.77 (3.24‐4.38) | 41.6 | 47.0 | 1.21 (1.02‐1.44) | <0.0001 |
| Room cleanliness | 49.0 | 68.6 | 2.35 (2.02‐2.73) | 51.6 | 59.1 | 1.32 (1.12‐1.58) | <0.0001 |
| Room temperature | 43.1 | 54.9 | 1.64 (1.43‐1.90) | 45.0 | 48.8 | 1.14 (0.96‐1.36) | 0.002 |
| Noise level in and around the room | 40.2 | 59.2 | 2.23 (1.92‐2.58) | 45.5 | 47.6 | 1.07 (0.90‐1.22) | <0.0001 |
| Visitor related | |||||||
| Accommodations and comfort of visitors | 50.0 | 70.3 | 2.44 (2.10‐2.83) | 55.3 | 59.1 | 1.14 (0.96‐1.35) | <0.0001 |
| NONFACILITY RELATED | |||||||
| Food | |||||||
| Temperature of the food | 31.1 | 33.6 | 1.15 (0.99‐1.34) | 34.0 | 38.9 | 1.23 (1.02‐1.47) | 0.51 |
| Quality of the food | 25.8 | 27.1 | 1.10 (0.93‐1.30) | 30.2 | 36.2 | 1.32 (1.10‐1.59) | 0.12 |
| Courtesy of the person who served food | 63.9 | 62.3 | 0.93 (0.80‐1.10) | 66.0 | 61.4 | 0.82 (0.69‐0.98) | 0.26 |
| Nursing | |||||||
| Friendliness/courtesy of the nurses | 76.3 | 82.8 | 1.49 (1.26‐1.79) | 77.7 | 80.1 | 1.10 (0.90‐1.37) | 0.04 |
| Promptness of response to call | 60.1 | 62.6 | 1.14 (0.98‐1.33) | 59.2 | 62.0 | 1.10 (0.91‐1.31) | 0.80 |
| Nurses' attitude toward requests | 71.0 | 75.8 | 1.30 (1.11‐1.54) | 70.5 | 72.4 | 1.06 (0.88‐1.28) | 0.13 |
| Attention to special/personal needs | 66.7 | 72.2 | 1.32 (1.13‐1.54) | 67.8 | 70.3 | 1.09 (0.91‐1.31) | 0.16 |
| Nurses kept you informed | 64.3 | 72.2 | 1.46 (1.25‐1.70) | 65.8 | 69.8 | 1.17 (0.98‐1.41) | 0.88 |
| Skill of the nurses | 75.3 | 79.5 | 1.28 (1.08‐1.52) | 74.3 | 78.6 | 1.23 (1.01‐1.51) | 0.89 |
| Ancillary staff | |||||||
| Courtesy of the person cleaning the room | 59.8 | 67.7 | 1.41 (1.21‐1.65) | 61.2 | 66.5 | 1.24 (1.03‐1.49) | 0.28 |
| Courtesy of the person who took blood | 66.5 | 68.1 | 1.10 (0.94‐1.28) | 63.2 | 63.1 | 0.96 (0.76‐1.08) | 0.34 |
| Courtesy of the person who started the IV | 70.0 | 71.7 | 1.09 (0.93‐1.28) | 66.6 | 69.3 | 1.11 (0.92‐1.33) | 0.88 |
| Visitor related | |||||||
| Staff attitude toward visitors | 68.1 | 79.4 | 1.84 (1.56‐2.18) | 70.3 | 72.2 | 1.06 (0.87‐1.28) | <0.0001 |
| Physician | |||||||
| Time physician spent with you | 55.0 | 58.9 | 1.20 (1.04‐1.39) | 53.2 | 55.9 | 1.10 (0.92‐1.30) | 0.46 |
| Physician concern questions/worries | 67.2 | 70.7 | 1.20 (1.03‐1.40) | 64.3 | 66.1 | 1.05 (0.88‐1.26) | 0.31 |
| Physician kept you informed | 65.3 | 67.5 | 1.12 (0.96‐1.30) | 61.6 | 63.2 | 1.05 (0.88‐1.25) | 0.58 |
| Friendliness/courtesy of physician | 76.3 | 78.1 | 1.11 (0.93‐1.31) | 71.0 | 73.3 | 1.08 (0.90‐1.31) | 0.89 |
| Skill of physician | 85.4 | 88.5 | 1.35 (1.09‐1.68) | 78.0 | 81.0 | 1.15 (0.93‐1.43) | 0.34 |
| Discharge | |||||||
| Extent felt ready for discharge | 62.0 | 66.7 | 1.23 (1.07‐1.44) | 59.2 | 62.3 | 1.10 (0.92‐1.30) | 0.35 |
| Speed of discharge process | 50.7 | 54.2 | 1.16 (1.01‐1.33) | 47.8 | 50.0 | 1.07 (0.90‐1.27) | 0.49 |
| Instructions for care at home | 66.4 | 71.1 | 1.25 (1.06‐1.46) | 64.0 | 67.7 | 1.16 (0.97‐1.39) | 0.54 |
| Staff concern for your privacy | 65.3 | 71.8 | 1.37 (1.17‐0.85) | 63.6 | 66.2 | 1.10 (0.91‐1.31) | 0.07 |
| Miscellaneous | |||||||
| How well your pain was controlled | 64.2 | 66.5 | 1.14 (0.97‐1.32) | 60.2 | 62.6 | 1.07 (0.89‐1.28) | 0.66 |
| Staff addressed emotional needs | 60.0 | 63.4 | 1.19 (1.02‐1.38) | 55.1 | 60.2 | 1.20 (1.01‐1.42) | 0.90 |
| Response to concerns/complaints | 61.1 | 64.5 | 1.19 (1.02‐1.38) | 57.2 | 60.1 | 1.10 (0.92‐1.31) | 0.57 |
| Overall | |||||||
| Staff worked together to care for you | 72.6 | 77.2 | 1.29 (1.10‐1.52) | 70.3 | 73.2 | 1.13 (0.93‐1.37) | 0.30 |
| Likelihood of recommending hospital | 79.1 | 84.3 | 1.44 (1.20‐1.74) | 76.3 | 79.2 | 1.14 (0.93‐1.39) | 0.10 |
| Overall rating of care given | 76.8 | 83.0 | 1.50 (1.25‐1.80) | 74.7 | 77.2 | 1.10 (0.90‐1.34) | 0.03 |
With regard to nonfacility‐related satisfaction, there were statistically higher scores in several nursing, physician, and discharge‐related satisfaction domains after the move. However, these changes were not associated with the move to the new clinical building as they were not significantly different from improvements on the unmoved units. Among nonfacility‐related items, only staff attitude toward visitors showed significant improvement (68.1% vs 79.4%). There was a significant improvement in hospital rating (75.0% vs 83.3% in the moved units and 75.7% vs 77.6% in the unmoved units). However, the other 3 measures of overall satisfaction did not show significant improvement associated with the move to the new clinical building when compared to the concurrent controls.
DISCUSSION
Contrary to our hypothesis and a belief held by many, we found that patients appeared able to distinguish their experience with hospital environment from their experience with providers and other services. Improvement in hospital facilities with incorporation of patient‐centered features was associated with improvements that were largely limited to increases in satisfaction with quietness, cleanliness, temperature, and dcor of the room along with visitor‐related satisfaction. Notably, there was no significant improvement in satisfaction related to physicians, nurses, housekeeping, and other service staff. There was improvement in satisfaction with staff attitude toward visitors, but this can be attributed to availability of visitor‐friendly facilities. There was a significant improvement in 1 of the 4 measures of overall satisfaction. Our findings also support the construct validity of HCAHPS and Press Ganey patient satisfaction surveys.
Ours is one of the largest studies on patient satisfaction related to patient‐centered design features in the inpatient acute care setting. Swan et al. also studied patients in an acute inpatient setting and compared satisfaction related to appealing versus typical hospital rooms. Patients were matched for case mix, insurance, gender, types of medical services received and LOS, and were served by the same set of physicians and similar food service and housekeeping staff.[26] Unlike our study, they found improved satisfaction related to physicians, housekeeping staff, food service staff, meals, and overall satisfaction. However, the study had some limitations. In particular, the study sample was self‐selected because the patients in this group were required to pay an extra daily fee to utilize the appealing room. Additionally, there were only 177 patients across the 2 groups, and the actual differences in satisfaction scores were small. Our sample was larger and patients in the study group were admitted to units in the new clinical buildings by the same criteria as they were admitted to the historic building prior to the move, and there were no significant differences in baseline characteristics between the comparison groups.
Jansen et al. also found broad improvements in patient satisfaction in a study of over 309 maternity unit patients in a new construction, all private‐room maternity unit with more appealing design elements and comfort features for visitors.[7] Improved satisfaction was noted with the physical environment, nursing care, assistance with feeding, respect for privacy, and discharge planning. However, it is difficult to extrapolate the results of this study to other settings, as maternity unit patients constitute a unique patient demographic with unique care needs. Additionally, when compared with patients in the control group, the patients in the study group were cared for by nurses who had a lower workload and who were not assigned other patients with more complex needs. Because nursing availability may be expected to impact satisfaction with clinical domains, the impact of private and appealing room may very well have been limited to improved satisfaction with the physical environment.
Despite the widespread belief among healthcare leadership that facility renovation or expansion is a vital strategy for improving patient satisfaction, our study shows that this may not be a dominant factor.[27] In fact, the Planetree model showed that improvement in satisfaction related to physical environment and nursing care was associated with implementation of both patient‐centered design features as well as with utilization of nurses that were trained to provide personalized care, educate patients, and involve patients and family.[28] It is more likely that provider‐level interventions will have a greater impact on provider level and overall satisfaction. This idea is supported by a recent JD Powers study suggesting that facilities represent only 19% of overall satisfaction in the inpatient setting.[35]
Although our study focused on patient‐centered design features, several renovation and construction projects have also focused on design features that improve patient safety and provider satisfaction, workflow, efficiency, productivity, stress, and time spent in direct care.[9] Interventions in these areas may lead to improvement in patient outcomes and perhaps lead to improvement in patient satisfaction; however, this relationship has not been well established at present.
In an era of cost containment, healthcare administrators are faced with high‐priced interventions, competing needs, limited resources, low profit margins, and often unclear evidence on cost‐effectiveness and return on investment of healthcare design features. Benefits are related to competitive advantage, higher reputation, patient retention, decreased malpractice costs, and increased Medicare payments through VBP programs that incentivize improved performance on quality metrics and patient satisfaction surveys. Our study supports the idea that a significant improvement in patient satisfaction related to creature comforts can be achieved with investment in patient‐centered design features. However, our findings also suggest that institutions should perform an individualized cost‐benefit analysis related to improvements in this narrow area of patient satisfaction. In our study, incorporation of patient‐centered design features resulted in improvement on 2 VBP HCAHPS measures, and its contribution toward total performance score under the VBP program would be limited.
Strengths of our study include the use of concurrent controls and our ability to capitalize on a natural experiment in which care teams remained constant before and after a move to a new clinical building. However, our study has some limitations. It was conducted at a single tertiary care academic center that predominantly serves an inner city population and referral patients seeking specialized care. Drivers of patient satisfaction may be different in community hospitals, and a different relationship may be observed between patient‐centered design and domains of patient satisfaction in this setting. Further studies in different hospital settings are needed to confirm our findings. Additionally, we were limited by the low response rate of the surveys. However, this is a widespread problem with all patient satisfaction research utilizing voluntary surveys, and our response rates are consistent with those previously reported.[34, 36, 37, 38] Furthermore, low response rates have not impeded the implementation of pay‐for‐performance programs on a national scale using HCHAPS.
In conclusion, our study suggests that hospitals should not use outdated facilities as an excuse for achievement of suboptimal satisfaction scores. Patients respond positively to creature comforts, pleasing surroundings, and visitor‐friendly facilities but can distinguish these positive experiences from experiences in other patient satisfaction domains. In our study, the move to a higher‐amenity building had only a modest impact on overall patient satisfaction, perhaps because clinical care is the primary driver of this outcome. Contrary to belief held by some hospital leaders, major strides in overall satisfaction across the board and other subdomains of satisfaction likely require intervention in areas other than facility renovation and expansion.
Disclosures
Zishan Siddiqui, MD, was supported by the Osler Center of Clinical Excellence Faculty Scholarship Grant. Funds from Johns Hopkins Hospitalist Scholars Program supported the research project. The authors have no conflict of interests to disclose.
- , . Create a blueprint for successful hospital construction. Nurs Manage. 2006;37(6):39–44.
- Walter Reed National Military Medical Center website. Facts at a glance. Available at: http://www.wrnmmc.capmed.mil/About%20Us/SitePages/Facts.aspx. Accessed June 19, 2013.
- . Keys to collaboration. Healthcare Design website. Available at: http://www.healthcaredesignmagazine.com/building‐ideas/keys‐collaboration. Accessed June 19, 2013.
- . A tale of 4 hospitals. Healthcare Design website. Available at: http://www.healthcaredesignmagazine.com/building‐ideas/tale‐4‐hospitals. Accessed June 19, 2013.
- . Gateway to the east. Healthcare Design website. Available at: http://www.healthcaredesignmagazine.com/building‐ideas/gateway‐east. Accessed June 19, 2013.
- . Lessons learned. Healthcare Design website. Available at: http://www.healthcaredesignmagazine.com/building‐ideas/lessons‐learned. Accessed June 19, 2013.
- , , , , . Single room maternity care and client satisfaction. Birth. 2000;27(4):235–243.
- , , , . Same‐handed and mirrored unit configurations: is there a difference in patient and nurse outcomes? J Nurs Adm. 2011;41(6):273–279.
- , . The Pebble Projects: coordinated evidence‐based case studies. Build Res Inform. 2008;36(2):129–145.
- , , . Effects of exposure to nature and abstract pictures on patients recovering from open heart surgery. J Soc Psychophysiol Res. 1993;30:7.
- , , , . Postoperative delirium. Curr Drug Targets. 2005;6(7):807–814.
- . Stimulus deprivation in windowless rooms. Anaesthesia. 1977;32(7):598–602.
- , , , . Post‐occupancy evaluation of healing gardens in a pediatric cancer center. Landsc Urban Plan. 2005;73(2):167–183.
- . Healing gardens in hospitals. Interdiscip Des Res J. 2007;1(1):1–27.
- , . Restorative gardens. BMJ. 1993;306(6885):1080–1081.
- . Effects of interior design on wellness: theory and recent scientific research. J Health Care Inter Des. 1991;3:97–109.
- , . Sunny hospital rooms expedite recovery from severe and refractory depressions. J Affect Disord. 1996;40(1‐2):49–51.
- . Art in hospital spaces: the role of hospitals in an aestheticised society. Int J Cult Policy. 2007;13(1):85–101.
- , , . Renovation of a semiprivate patient room. Bowman Center Geriatric Rehabilitation Unit. Nurs Clin North Am 1995;30(1):97–115.
- , , , et al. (2013). Effect of intensive care environment on family and patient satisfaction: a before‐after study. Intensive Care Med. 2013;39(9):1626–1634.
- , , , , . Outcomes of environmental appraisal of different hospital waiting areas. Environ Behav. 2003;35(6):842–869.
- . Redesigning the neurocritical care unit to enhance family participation and improve outcomes. Cleve Clin J Med. 2009;76(suppl 2):S70–S74.
- , . The ecology of the patient visit: physical attractiveness, waiting times, and perceived quality of care. J Ambul Care Manage. 2008;31(2):128–141.
- . Patient satisfaction and the new consumer. Hosp Health Netw. 2006;80(57):59–62.
- . Patient satisfaction. Hospitals embrace hotel‐like amenities. Hosp Health Netw. 2007;81(11):24–26.
- , , . Do appealing hospital rooms increase patient evaluations of physicians, nurses, and hospital services? Health Care Manage Rev. 2003;28(3):254–264.
- . Patient experience and HCAHPS: little consensus on a top priority. Health Leaders Media website. Available at http://www.healthleadersmedia.com/intelligence/detail.cfm?content_id=28289334(2):125–133.
- Centers for Medicare 67:27–37.
- Hospital Consumer Assessment of Healthcare Providers and Systems. Summary analysis. http://www.hcahpsonline.org/SummaryAnalyses.aspx. Accessed October 1, 2014.
- Centers for Medicare 44(2 pt 1):501–518.
- J.D. Power and Associates. Patient satisfaction influenced more by hospital staff than by the hospital facilities. Available at: http://www.jdpower.com/press‐releases/2012‐national‐patient‐experience‐study#sthash.gSv6wAdc.dpuf. Accessed December 10, 2013.
- , , , , . Racial and ethnic differences in a patient survey: patients' values, ratings, and reports regarding physician primary care performance in a large health maintenance organization. Med Care. 2000;38(3): 300–310.
- , , , . Patient experience in safety‐net hospitals implications for improving care and Value‐Based Purchasing patient experience in safety‐net hospitals. Arch Intern Med. 2012;172(16):1204–1210.
- , , , . Comparison of Hospital Consumer Assessment of Healthcare Providers and Systems patient satisfaction scores for specialty hospitals and general medical hospitals: confounding effect of survey response rate. J Hosp Med. 2014;9(9):590–593.
© 2014 Society of Hospital Medicine
HCAHPS Patient Satisfaction Scores
Patient satisfaction surveys are widely used to empower patients to voice their concerns and point out areas of deficiency or excellence in the patient‐physician partnership and in the delivery of healthcare services.[1] In 2002, the Centers for Medicare and Medicaid Service (CMS) led an initiative to develop the Hospital Consumer Assessment of Healthcare Providers and Systems (HCAHPS) survey questionnaire.[2] This survey is sent to a randomly selected subset of patients after hospital discharge. The HCAHPS instrument assesses patient ratings of physician communication, nursing communication, pain control, responsiveness, room cleanliness and quietness, discharge process, and overall satisfaction. Over 4500 acute‐care facilities routinely use this survey.[3] HCAHPS scores are publicly reported, and patients can utilize these scores to compare hospitals and make informed choices about where to get care. At an institutional level, scores are used as a tool to identify and improve deficiencies in care delivery. Additionally, HCAHPS survey data results have been analyzed in numerous research studies.[4, 5, 6]
Specialty hospitals are a subset of acute‐care hospitals that provide a narrower set of services than general medical hospitals (GMHs), predominantly in a few specialty areas such as cardiac disease and surgical fields. Many specialty hospitals advertise high rates of patient satisfaction.[7, 8, 9, 10, 11] However, specialty hospitals differ from GMHs in significant ways. Patients at specialty hospitals may be less severely ill[10, 12] and may have more generous insurance coverage.[13] Many specialty hospitals do not have an emergency department (ED), and their outcomes may reflect care of relatively stable patients.[14] A significant number of the specialty hospitals are physician‐owned, which may provide an opportunity for physicians to deliver more patient‐focused healthcare.[14] It is also thought that specialty hospitals can provide high‐quality care by designing their facilities and service structure entirely to meet the needs of a narrow set of medical conditions.
HCAHPS survey results provide an opportunity to compare satisfaction scores among various types of hospitals. We analyzed national HCAHPS data to compare satisfaction scores of specialty hospitals and GMHs and identify factors that may be responsible for this difference.
METHODS
This was a cross‐sectional analysis of national HCAHPS survey data. The methods for administration and reporting of the HCAHPS survey have been described.[15] HCAHPS patient satisfaction data and hospital characteristics, such as location, presence of an ED, and for‐profit status, were obtained from Hospital Compare database. Teaching hospital status was identified using the CMS 2013 Open Payment teaching hospital listing.[16]
For this study, we defined specialty hospitals as acute‐care hospitals that predominantly provide care in a medical or surgical specialty and do not provide care to general medical patients. Based on this definition, specialty hospitals include cardiac hospitals, orthopedic and spine hospitals, oncology hospitals, and hospitals providing multispecialty surgical and procedure‐based services. Children's hospitals, long‐term acute‐care hospitals, and psychiatry hospitals were excluded.
Specialty hospitals were identified using hospital name searches in the HCAHPS database, the American Hospital Association 2013 Annual Survey, the Physician Hospital Association hospitals directory, and through contact with experts. The specialty hospital status of hospitals was further confirmed by checking hospital websites or by directly contacting the hospital.
We analyzed 3‐year HCAHPS patient satisfaction data that included the reporting period from July 2007 to June 2010. HCAHPS data are reported for 12‐month periods at a time. Hospital information, such as address, presence of an ED, and for‐profit status were obtained from the CMS Hospital Compare 2010 dataset. Teaching hospital status was identified using the CMS 2013 Open Payment teaching hospital listing.[16] For the purpose of this study, scores on the HCAHPS survey item definitely recommend the hospital was considered to represent overall satisfaction for the hospital. This is consistent with use of this measure in other sectors in the service industry.[17, 18] Other survey items were considered subdomains of satisfaction. For each hospital, the simple mean of satisfaction scores for overall satisfaction and each of the subdomains for the three 12‐month periods was calculated. Data were summarized using frequencies and meanstandard deviation. The primary dependent variable was overall satisfaction. The main independent variables were specialty hospital status (yes or no), teaching hospital status (yes or no), for‐profit status (yes or no), and the presence of an ED (yes or no). Multiple linear regression analysis was used to adjust for the above‐noted independent variables. A P value<0.05 was considered significant. All analyses were performed on Stata 10.1 IC (StataCorp, College Station, TX).
RESULTS
We identified 188 specialty hospitals and 4638 GMHs within the HCAHPS dataset. Fewer specialty hospitals had emergency care services when compared with GMHs (53.2% for specialty hospitals vs 93.6% for GMHs, P<0.0001), and 47.9% of all specialty hospitals were in states that do not require a Certificate of Need, whereas only 25% of all GMHs were present in these states. For example, Texas, which has 7.2% of all GMHs across the nation, has 24.7% of all specialty hospitals. As compared to GMHs, a majority of specialty hospitals were for profit (14.5% vs 66.9%).
In unadjusted analyses, specialty hospitals had significantly higher patient satisfaction scores compared with GMHs. Overall satisfaction, as measured by the proportion of patients that will definitely recommend that hospital, was 18.8% higher for specialty hospitals than GMHs (86.6% vs 67.8%, P<0.0001). This was also true for subdomains of satisfaction including physician communication, nursing communication, and cleanliness (Table 1).
| Satisfaction Domains | GMH, Mean, n=4,638* | Specialty Hospital, Mean, n=188* | Unadjusted Mean Difference in Satisfaction (95% CI) | Mean Difference in Satisfaction Adjusted for Survey Response Rate (95% CI) | Mean Difference in Satisfaction for Full Adjusted Model (95% CI) |
|---|---|---|---|---|---|
| |||||
| Nurses always communicated well | 75.0% | 84.4% | 9.4% (8.310.5) | 4.0% (2.9‐5.0) | 5.0% (3.8‐6.2) |
| Doctors always communicated well | 80.0% | 86.5% | 6.5% (5.67.6) | 3.8% (2.8‐4.8) | 4.1% (3.05.2) |
| Pain always well controlled | 68.7% | 77.1% | 8.6% (7.79.6) | 4.5% (3.5‐4.5) | 4.6% (3.5‐5.6) |
| Always received help as soon as they wanted | 62.9% | 78.6% | 15.7% (14.117.4) | 7.8% (6.19.4) | 8.0% (6.39.7) |
| Room and bathroom always clean | 70.1% | 81.1% | 11.0% (9.612.4) | 5.5% (4.06.9) | 6.2% (4.7‐7.8) |
| Staff always explained about the medicines | 59.4% | 69.8% | 10.4 (9.211.5) | 5.8% (4.7‐6.9) | 6.5% (5.37.8) |
| Yes, were given information about what to do during recovery at home | 80.9% | 87.1% | 6.2% (5.57.0) | 1.4% (0.7‐2.1) | 2.0% (1.13.0) |
| Overall satisfaction (yes, patients would definitely recommend the hospital) | 67.8% | 86.6% | 18.8%(17.020.6) | 8.5% (6.910.2) | 8.6% (6.710.5) |
| Survey response rate | 32.2% | 49.6% | 17.4% (16.018.9) | ||
We next examined the effect of survey response rate. The survey response rate for specialty hospitals was on average 17.4 percentage points higher than that of GMHs (49.6% vs 32.2%, P<0.0001). When adjusted for survey response rate, the difference in overall satisfaction for specialty hospitals was reduced to 8.6% (6.7%10.5%, P<0.0001). Similarly, the differences in score for subdomains of satisfaction were more modest when adjusted for higher survey response rate. In the multiple regression models, specialty hospital status, survey response rate, for‐profit status, and the presence of an ED were independently associated with higher overall satisfaction, whereas teaching hospital status was not associated with overall satisfaction. Addition of for‐profit status and presence of an ED in the regression model did not change our results. Further, the satisfaction subdomain scores for specialty hospitals remained significantly higher than for GMHs in the regression models (Table 1).
DISCUSSION
In this national study, we found that specialty hospitals had significantly higher overall satisfaction scores on the HCAHPS satisfaction survey. Similarly, significantly higher satisfaction was noted across all the satisfaction subdomains. We found that a large proportion of the difference between specialty hospitals and GMHs in overall satisfaction and subdomains of satisfaction could be explained by a higher survey response rate in specialty hospitals. After adjusting for survey response rate, the differences were comparatively modest, although remained statistically significant. Adjustment for additional confounding variables did not change our results.
Studies have shown that specialty hospitals, when compared to GMHs, may treat more patients in their area of specialization, care for fewer sick and Medicaid patients, have greater physician ownership, and are less likely to have ED services.[11, 12, 13, 14] Two small studies comparing specialty hospitals to GMHs suggest that higher satisfaction with specialty hospitals was attributable to the presence of private rooms, quiet environment, accommodation for family members, and accessible, attentive, and well‐trained nursing staff.[10, 11] Although our analysis did not account for various other hospital and patient characteristics, we expect that these factors likely play a significant role in the observed differences in patient satisfaction.
Survey response rate can be an important determinant of the validity of survey results, and a response rate >70% is often considered desirable.[19, 20] However, the mean survey response rate for the HCAHPS survey was only 32.8% for all hospitals during the survey period. In the outpatient setting, a higher survey response rate has been shown to be associated with higher satisfaction rates.[21] In the hospital setting, a randomized study of a HCAHPS survey for 45 hospitals found that patient mix explained the nonresponse bias. However, this study did not examine the roles of severity of illness or insurance status, which may account for the differences in satisfaction seen between specialty hospitals and GMHs.[22] In contrast, we found that in the hospital setting, higher survey response rate was associated with higher patient satisfaction scores.
Our study has some limitations. First, it was not possible to determine from the dataset whether higher response rate is a result of differences in the patient population characteristics between specialty hospitals and GMHs or it represents the association between higher satisfaction and higher response rate noted by other investigators. Although we used various resources to identify all specialty hospitals, we may have missed some or misclassified others due to lack of a standardized definition.[10, 12, 13] However, the total number of specialty hospitals and their distribution across various states in the current study are consistent with previous studies, supporting our belief that few, if any, hospitals were misclassified.[13]
In summary, we found significant difference in satisfaction rates reported on HCAHPS in a national study of patients attending specialty hospitals versus GMHs. However, the observed differences in satisfaction scores were sensitive to differences in survey response rates among hospitals. Teaching hospital status, for‐profit status, and the presence of an ED did not appear to further explain the differences. Additional studies incorporating other hospital and patient characteristics are needed to fully understand factors associated with differences in the observed patient satisfaction between specialty hospitals and GMHs. Additionally, strategies to increase survey HCAHPS response rates should be a priority.
- About Picker Institute. Available at: http://pickerinstitute.org/about. Accessed September 24, 2012.
- HCAHPS Hospital Survey. Centers for Medicare 45(4):1024–1040.
- , . Consumers' use of HCAHPS ratings and word‐of‐mouth in hospital choice. Health Serv Res. 2010;45(6 pt 1):1602–1613.
- , , . Improving patient satisfaction in hospital care settings. Health Serv Manage Res. 2011;24(4):163–169.
- Live the life you want. Arkansas Surgical Hospital website. Available at: http://www.arksurgicalhospital.com/ash. Accessed September 24, 2012.
- Patient satisfaction—top 60 hospitals. Hoag Orthopedic Institute website. Available at: http://orthopedichospital.com/2012/06/patient‐satisfaction‐top‐60‐hospital. Accessed September 24, 2012.
- Northwest Specialty Hospital website. Available at: http://www.northwestspecialtyhospital.com/our‐services. Accessed September 24, 2012.
- , , , et al. Specialty versus community hospitals: referrals, quality, and community benefits. Health Affairs. 2006;25(1):106–118.
- Study of Physician‐Owned Specialty Hospitals Required in Section 507(c)(2) of the Medicare Prescription Drug, Improvement, and Modernization Act of 2003, May 2005. Available at: http://www.cms.gov/Medicare/Fraud‐and‐Abuse/PhysicianSelfReferral/Downloads/RTC‐StudyofPhysOwnedSpecHosp.pdf. Accessed June 16, 2014.
- Specialty Hospitals: Information on National Market Share, Physician Ownership and Patients Served. GAO: 03–683R. Washington, DC: General Accounting Office; 2003:1–20. Available at: http://www.gao.gov/new.items/d03683r.pdf. Accessed September 24, 2012.
- , , , . Insurance status of patients admitted to specialty cardiac and competing general hospitals: are accusations of cherry picking justified? Med Care. 2008;46:467–475.
- Specialty Hospitals: Geographic Location, Services Provided and Financial Performance: GAO‐04–167. Washington, DC: General Accounting Office; 2003:1–41. Available at: http://www.gao.gov/new.items/d04167.pdf. Accessed September 24, 2012.
- Centers for Medicare 9(4):5–17.
- , , . The relationship between customer satisfaction and loyalty: cross‐industry differences. Total Qual Manage. 2000;11(4‐6):509–514.
- , . Survey response rate levels and trends in organizational research. Hum Relat. 2008;61:1139–1160.
- , . Survey, cohort and case‐control studies. In: Design of Studies for Medical Research. Hoboken, NJ: John Wiley 2005:118–120.
- , , , , . A demonstration of the impact of response bias on the results of patient satisfaction surveys. Health Serv Res. 2002;37(5):1403–1417.
- , , , et al. Effects of survey mode, patient mix and nonresponse on CAHPS hospital survey scores. Health Serv Res. 2009;44:501–518.
Patient satisfaction surveys are widely used to empower patients to voice their concerns and point out areas of deficiency or excellence in the patient‐physician partnership and in the delivery of healthcare services.[1] In 2002, the Centers for Medicare and Medicaid Service (CMS) led an initiative to develop the Hospital Consumer Assessment of Healthcare Providers and Systems (HCAHPS) survey questionnaire.[2] This survey is sent to a randomly selected subset of patients after hospital discharge. The HCAHPS instrument assesses patient ratings of physician communication, nursing communication, pain control, responsiveness, room cleanliness and quietness, discharge process, and overall satisfaction. Over 4500 acute‐care facilities routinely use this survey.[3] HCAHPS scores are publicly reported, and patients can utilize these scores to compare hospitals and make informed choices about where to get care. At an institutional level, scores are used as a tool to identify and improve deficiencies in care delivery. Additionally, HCAHPS survey data results have been analyzed in numerous research studies.[4, 5, 6]
Specialty hospitals are a subset of acute‐care hospitals that provide a narrower set of services than general medical hospitals (GMHs), predominantly in a few specialty areas such as cardiac disease and surgical fields. Many specialty hospitals advertise high rates of patient satisfaction.[7, 8, 9, 10, 11] However, specialty hospitals differ from GMHs in significant ways. Patients at specialty hospitals may be less severely ill[10, 12] and may have more generous insurance coverage.[13] Many specialty hospitals do not have an emergency department (ED), and their outcomes may reflect care of relatively stable patients.[14] A significant number of the specialty hospitals are physician‐owned, which may provide an opportunity for physicians to deliver more patient‐focused healthcare.[14] It is also thought that specialty hospitals can provide high‐quality care by designing their facilities and service structure entirely to meet the needs of a narrow set of medical conditions.
HCAHPS survey results provide an opportunity to compare satisfaction scores among various types of hospitals. We analyzed national HCAHPS data to compare satisfaction scores of specialty hospitals and GMHs and identify factors that may be responsible for this difference.
METHODS
This was a cross‐sectional analysis of national HCAHPS survey data. The methods for administration and reporting of the HCAHPS survey have been described.[15] HCAHPS patient satisfaction data and hospital characteristics, such as location, presence of an ED, and for‐profit status, were obtained from Hospital Compare database. Teaching hospital status was identified using the CMS 2013 Open Payment teaching hospital listing.[16]
For this study, we defined specialty hospitals as acute‐care hospitals that predominantly provide care in a medical or surgical specialty and do not provide care to general medical patients. Based on this definition, specialty hospitals include cardiac hospitals, orthopedic and spine hospitals, oncology hospitals, and hospitals providing multispecialty surgical and procedure‐based services. Children's hospitals, long‐term acute‐care hospitals, and psychiatry hospitals were excluded.
Specialty hospitals were identified using hospital name searches in the HCAHPS database, the American Hospital Association 2013 Annual Survey, the Physician Hospital Association hospitals directory, and through contact with experts. The specialty hospital status of hospitals was further confirmed by checking hospital websites or by directly contacting the hospital.
We analyzed 3‐year HCAHPS patient satisfaction data that included the reporting period from July 2007 to June 2010. HCAHPS data are reported for 12‐month periods at a time. Hospital information, such as address, presence of an ED, and for‐profit status were obtained from the CMS Hospital Compare 2010 dataset. Teaching hospital status was identified using the CMS 2013 Open Payment teaching hospital listing.[16] For the purpose of this study, scores on the HCAHPS survey item definitely recommend the hospital was considered to represent overall satisfaction for the hospital. This is consistent with use of this measure in other sectors in the service industry.[17, 18] Other survey items were considered subdomains of satisfaction. For each hospital, the simple mean of satisfaction scores for overall satisfaction and each of the subdomains for the three 12‐month periods was calculated. Data were summarized using frequencies and meanstandard deviation. The primary dependent variable was overall satisfaction. The main independent variables were specialty hospital status (yes or no), teaching hospital status (yes or no), for‐profit status (yes or no), and the presence of an ED (yes or no). Multiple linear regression analysis was used to adjust for the above‐noted independent variables. A P value<0.05 was considered significant. All analyses were performed on Stata 10.1 IC (StataCorp, College Station, TX).
RESULTS
We identified 188 specialty hospitals and 4638 GMHs within the HCAHPS dataset. Fewer specialty hospitals had emergency care services when compared with GMHs (53.2% for specialty hospitals vs 93.6% for GMHs, P<0.0001), and 47.9% of all specialty hospitals were in states that do not require a Certificate of Need, whereas only 25% of all GMHs were present in these states. For example, Texas, which has 7.2% of all GMHs across the nation, has 24.7% of all specialty hospitals. As compared to GMHs, a majority of specialty hospitals were for profit (14.5% vs 66.9%).
In unadjusted analyses, specialty hospitals had significantly higher patient satisfaction scores compared with GMHs. Overall satisfaction, as measured by the proportion of patients that will definitely recommend that hospital, was 18.8% higher for specialty hospitals than GMHs (86.6% vs 67.8%, P<0.0001). This was also true for subdomains of satisfaction including physician communication, nursing communication, and cleanliness (Table 1).
| Satisfaction Domains | GMH, Mean, n=4,638* | Specialty Hospital, Mean, n=188* | Unadjusted Mean Difference in Satisfaction (95% CI) | Mean Difference in Satisfaction Adjusted for Survey Response Rate (95% CI) | Mean Difference in Satisfaction for Full Adjusted Model (95% CI) |
|---|---|---|---|---|---|
| |||||
| Nurses always communicated well | 75.0% | 84.4% | 9.4% (8.310.5) | 4.0% (2.9‐5.0) | 5.0% (3.8‐6.2) |
| Doctors always communicated well | 80.0% | 86.5% | 6.5% (5.67.6) | 3.8% (2.8‐4.8) | 4.1% (3.05.2) |
| Pain always well controlled | 68.7% | 77.1% | 8.6% (7.79.6) | 4.5% (3.5‐4.5) | 4.6% (3.5‐5.6) |
| Always received help as soon as they wanted | 62.9% | 78.6% | 15.7% (14.117.4) | 7.8% (6.19.4) | 8.0% (6.39.7) |
| Room and bathroom always clean | 70.1% | 81.1% | 11.0% (9.612.4) | 5.5% (4.06.9) | 6.2% (4.7‐7.8) |
| Staff always explained about the medicines | 59.4% | 69.8% | 10.4 (9.211.5) | 5.8% (4.7‐6.9) | 6.5% (5.37.8) |
| Yes, were given information about what to do during recovery at home | 80.9% | 87.1% | 6.2% (5.57.0) | 1.4% (0.7‐2.1) | 2.0% (1.13.0) |
| Overall satisfaction (yes, patients would definitely recommend the hospital) | 67.8% | 86.6% | 18.8%(17.020.6) | 8.5% (6.910.2) | 8.6% (6.710.5) |
| Survey response rate | 32.2% | 49.6% | 17.4% (16.018.9) | ||
We next examined the effect of survey response rate. The survey response rate for specialty hospitals was on average 17.4 percentage points higher than that of GMHs (49.6% vs 32.2%, P<0.0001). When adjusted for survey response rate, the difference in overall satisfaction for specialty hospitals was reduced to 8.6% (6.7%10.5%, P<0.0001). Similarly, the differences in score for subdomains of satisfaction were more modest when adjusted for higher survey response rate. In the multiple regression models, specialty hospital status, survey response rate, for‐profit status, and the presence of an ED were independently associated with higher overall satisfaction, whereas teaching hospital status was not associated with overall satisfaction. Addition of for‐profit status and presence of an ED in the regression model did not change our results. Further, the satisfaction subdomain scores for specialty hospitals remained significantly higher than for GMHs in the regression models (Table 1).
DISCUSSION
In this national study, we found that specialty hospitals had significantly higher overall satisfaction scores on the HCAHPS satisfaction survey. Similarly, significantly higher satisfaction was noted across all the satisfaction subdomains. We found that a large proportion of the difference between specialty hospitals and GMHs in overall satisfaction and subdomains of satisfaction could be explained by a higher survey response rate in specialty hospitals. After adjusting for survey response rate, the differences were comparatively modest, although remained statistically significant. Adjustment for additional confounding variables did not change our results.
Studies have shown that specialty hospitals, when compared to GMHs, may treat more patients in their area of specialization, care for fewer sick and Medicaid patients, have greater physician ownership, and are less likely to have ED services.[11, 12, 13, 14] Two small studies comparing specialty hospitals to GMHs suggest that higher satisfaction with specialty hospitals was attributable to the presence of private rooms, quiet environment, accommodation for family members, and accessible, attentive, and well‐trained nursing staff.[10, 11] Although our analysis did not account for various other hospital and patient characteristics, we expect that these factors likely play a significant role in the observed differences in patient satisfaction.
Survey response rate can be an important determinant of the validity of survey results, and a response rate >70% is often considered desirable.[19, 20] However, the mean survey response rate for the HCAHPS survey was only 32.8% for all hospitals during the survey period. In the outpatient setting, a higher survey response rate has been shown to be associated with higher satisfaction rates.[21] In the hospital setting, a randomized study of a HCAHPS survey for 45 hospitals found that patient mix explained the nonresponse bias. However, this study did not examine the roles of severity of illness or insurance status, which may account for the differences in satisfaction seen between specialty hospitals and GMHs.[22] In contrast, we found that in the hospital setting, higher survey response rate was associated with higher patient satisfaction scores.
Our study has some limitations. First, it was not possible to determine from the dataset whether higher response rate is a result of differences in the patient population characteristics between specialty hospitals and GMHs or it represents the association between higher satisfaction and higher response rate noted by other investigators. Although we used various resources to identify all specialty hospitals, we may have missed some or misclassified others due to lack of a standardized definition.[10, 12, 13] However, the total number of specialty hospitals and their distribution across various states in the current study are consistent with previous studies, supporting our belief that few, if any, hospitals were misclassified.[13]
In summary, we found significant difference in satisfaction rates reported on HCAHPS in a national study of patients attending specialty hospitals versus GMHs. However, the observed differences in satisfaction scores were sensitive to differences in survey response rates among hospitals. Teaching hospital status, for‐profit status, and the presence of an ED did not appear to further explain the differences. Additional studies incorporating other hospital and patient characteristics are needed to fully understand factors associated with differences in the observed patient satisfaction between specialty hospitals and GMHs. Additionally, strategies to increase survey HCAHPS response rates should be a priority.
- About Picker Institute. Available at: http://pickerinstitute.org/about. Accessed September 24, 2012.
- HCAHPS Hospital Survey. Centers for Medicare 45(4):1024–1040.
- , . Consumers' use of HCAHPS ratings and word‐of‐mouth in hospital choice. Health Serv Res. 2010;45(6 pt 1):1602–1613.
- , , . Improving patient satisfaction in hospital care settings. Health Serv Manage Res. 2011;24(4):163–169.
- Live the life you want. Arkansas Surgical Hospital website. Available at: http://www.arksurgicalhospital.com/ash. Accessed September 24, 2012.
- Patient satisfaction—top 60 hospitals. Hoag Orthopedic Institute website. Available at: http://orthopedichospital.com/2012/06/patient‐satisfaction‐top‐60‐hospital. Accessed September 24, 2012.
- Northwest Specialty Hospital website. Available at: http://www.northwestspecialtyhospital.com/our‐services. Accessed September 24, 2012.
- , , , et al. Specialty versus community hospitals: referrals, quality, and community benefits. Health Affairs. 2006;25(1):106–118.
- Study of Physician‐Owned Specialty Hospitals Required in Section 507(c)(2) of the Medicare Prescription Drug, Improvement, and Modernization Act of 2003, May 2005. Available at: http://www.cms.gov/Medicare/Fraud‐and‐Abuse/PhysicianSelfReferral/Downloads/RTC‐StudyofPhysOwnedSpecHosp.pdf. Accessed June 16, 2014.
- Specialty Hospitals: Information on National Market Share, Physician Ownership and Patients Served. GAO: 03–683R. Washington, DC: General Accounting Office; 2003:1–20. Available at: http://www.gao.gov/new.items/d03683r.pdf. Accessed September 24, 2012.
- , , , . Insurance status of patients admitted to specialty cardiac and competing general hospitals: are accusations of cherry picking justified? Med Care. 2008;46:467–475.
- Specialty Hospitals: Geographic Location, Services Provided and Financial Performance: GAO‐04–167. Washington, DC: General Accounting Office; 2003:1–41. Available at: http://www.gao.gov/new.items/d04167.pdf. Accessed September 24, 2012.
- Centers for Medicare 9(4):5–17.
- , , . The relationship between customer satisfaction and loyalty: cross‐industry differences. Total Qual Manage. 2000;11(4‐6):509–514.
- , . Survey response rate levels and trends in organizational research. Hum Relat. 2008;61:1139–1160.
- , . Survey, cohort and case‐control studies. In: Design of Studies for Medical Research. Hoboken, NJ: John Wiley 2005:118–120.
- , , , , . A demonstration of the impact of response bias on the results of patient satisfaction surveys. Health Serv Res. 2002;37(5):1403–1417.
- , , , et al. Effects of survey mode, patient mix and nonresponse on CAHPS hospital survey scores. Health Serv Res. 2009;44:501–518.
Outcomes after 2011 Residency Reform
The Accreditation Council for Graduate Medical Education (ACGME) Common Program Requirements implemented in July 2011 increased supervision requirements and limited continuous work hours for first‐year residents.[1] Similar to the 2003 mandates, these requirements were introduced to improve patient safety and education at academic medical centers.[2] Work‐hour reforms have been associated with decreased resident burnout and improved sleep.[3, 4, 5] However, national observational studies and systematic reviews of the impact of the 2003 reforms on patient safety and quality of care have been varied in terms of outcome.[6, 7, 8, 9, 10] Small studies of the 2011 recommendations have shown increased sleep duration and decreased burnout, but also an increased number of handoffs and increased resident concerns about making a serious medical error.[11, 12, 13, 14] Although national surveys of residents and program directors have not indicated improvements in education or quality of life, 1 observational study did show improvement in clinical exposure and conference attendance.[15, 16, 17, 18] The impact of the 2011 reforms on patient safety remains unclear.[19, 20]
The objective of this study was to evaluate the association between implementation of the 2011 residency work‐hour mandates and patient safety outcomes at a large academic medical center.
METHODS
Study Design
This observational study used a quasi‐experimental difference‐in‐differences approach to evaluate whether residency work‐hour changes were associated with patient safety outcomes among general medicine inpatients. We compared safety outcomes among adult patients discharged from resident general medical services (referred to as resident) to safety outcomes among patients discharged by the hospitalist general medical service (referred to as hospitalist) before and after the 2011 residency work‐hour reforms at a large academic medical center. Differences in outcomes for the resident group were compared to differences observed in the hospitalist group, with adjustment for relevant demographic and case mix factors.[21] We used the hospitalist service as a control group, because ACGME changes applied only to resident services. The strength of this design is that it controls for secular trends that are correlated with patient safety, impacting both residents and hospitalists similarly.[9]
Approval for this study and a Health Insurance Portability and Accountability Act waiver were granted by the Johns Hopkins University School of Medicine institutional review board. We retrospectively examined administrative data on all patient discharges from the general medicine services at Johns Hopkins Hospital between July 1, 2008 and June 30, 2012 that were identified as pertaining to resident or hospitalist services.
Patient Allocation and Physician Scheduling
Patient admission to the resident or hospitalist service was decided by a number of factors. To maintain continuity of care, patients were preferentially admitted to the same service as for prior admissions. New patients were admitted to a service based on bed availability, nurse staffing, patient gender, isolation precautions, and cardiac monitor availability.
The inpatient resident services were staffed prior to July 2011 using a traditional 30‐hour overnight call system. Following July 2011, the inpatient resident services were staffed using a modified overnight call system, in which interns took overnight calls from 8 pm until 12 pm the following day, once every 5 nights with supervision by upper‐level residents. These interns rotated through daytime admitting and coverage roles on the intervening days. The hospitalist service was organized into a 3‐physician rotation of day shift, evening shift, and overnight shift.
Data and Outcomes
Twenty‐nine percent of patients in the sample were admitted more than once during the study period, and patients were generally admitted to the same resident team during each admission. Patients with multiple admissions were counted multiple times in the model. We categorized admissions as prereform (July 1, 2008June 30, 2011) and postreform (July 1, 2011June 30, 2012). Outcomes evaluated included hospital length of stay, 30‐day readmission, intensive care unit stay (ICU) stay, inpatient mortality, and number of Maryland Hospital Acquired Conditions (MHACs). ICU stay pertained to any ICU admission including initial admission and transfer from the inpatient floor. MHACs are a set of inpatient performance indicators derived from a list of 64 inpatient Potentially Preventable Complications developed by 3M Health Information Systems.[22] MHACs are used by the Maryland Health Services Cost Review Commission to link hospital payment to performance for costly, preventable, and clinically relevant complications. MHACs were coded in our analysis as a dichotomous variable. Independent variables included patient age at admission, race, gender, and case mix index. Case mix index (CMI) is a numeric score that measures resource utilization for a specific patient population. CMI is a weighted value assigned to patients based on resource utilization and All Patient Refined Diagnostic Related Group and was included as an indicator of patient illness severity and risk of mortality.[23] Data were obtained from administrative records from the case mix research team at Johns Hopkins Medicine.
To account for transitional differences that may have coincided with the opening of a new hospital wing in late April 2012, we conducted a sensitivity analysis, in which we excluded from analysis any visits that took place in May 2012 to June 2012.
Data Analysis
Based on historical studies, we calculated that a sample size of at least 3600 discharges would allow us to detect a difference of 5% between the pre‐ and postreform period assuming baseline 20% occurrence of dichotomous outcomes (=0.05; =0.2; r=4).[21]
The primary unit of analysis was the hospital discharge. Similar to Horwitz et al., we analyzed data using a difference‐in‐differences estimation strategy.[21] We used multivariable linear regression for length of stay measured as a continuous variable, and multivariable logistic regression for inpatient mortality, 30‐day readmission, MHACs coded as a dichotomous variable, and ICU stay coded as a dichotomous variable.[9] The difference‐in‐differences estimation was used to determine whether the postreform period relative to prereform period was associated with differences in outcomes comparing resident and hospitalist services. In the regression models, the independent variables of interest included an indicator variable for whether a patient was treated on a resident service, an indicator variable for whether a patient was discharged in the postreform period, and the interaction of these 2 variables (resident*postreform). The interaction term can be interpreted as a differential change over time comparing resident and hospitalist services. In all models, we adjusted for patient age, gender, race, and case mix index.
To determine whether prereform trends were similar among the resident and hospitalist services, we performed a test of controls as described by Volpp and colleagues.[6] Interaction terms for resident service and prereform years 2010 and 2011 were added to the model. A Wald test was then used to test for improved model fit, which would indicate differential trends among resident and hospitalist services during the prereform period. Where such trends were found, postreform results were compared only to 2011 rather than the 2009 to 2011 prereform period.[6]
To account for correlation within patients who had multiple discharges, we used a clustering approach and estimated robust variances.[24] From the regression model results, we calculated predicted probabilities adjusted for relevant covariates and prepost differences, and used linear probability models to estimate percentage‐point differences in outcomes, comparing residents and hospitalists in the pre‐ and postreform periods.[25] All analyses were performed using Stata/IC version 11 (StataCorp, College Station, TX).
RESULTS
In the 3 years before the 2011 residency work‐hour reforms were implemented (prereform), there were a total of 15,688 discharges for 8983 patients to the resident services and 4622 discharges for 3649 patients to the hospitalist services. In the year following implementation of residency work‐hour changes (postreform), there were 5253 discharges for 3805 patients to the resident services and 1767 discharges for 1454 patients to the hospitalist service. Table 1 shows the characteristics of patients discharged from the resident and hospitalist services in the pre‐ and postreform periods. Patients discharged from the resident services were more likely to be older, male, African American, and have a higher CMI.
| Resident Services | Hospitalist Service | ||||||||
|---|---|---|---|---|---|---|---|---|---|
| 2009 | 2010 | 2011 | 2012 | 2009 | 2010 | 2011 | 2012 | P Valuea | |
| |||||||||
| Discharges, n | 5345 | 5299 | 5044 | 5253 | 1366 | 1492 | 1764 | 1767 | |
| Unique patients, n | 3082 | 2968 | 2933 | 3805 | 1106 | 1180 | 1363 | 1454 | |
| Age, y, mean (SD) | 55.1 (17.7) | 55.7 (17.4) | 56.4 (17.9) | 56.7 (17.1) | 55.9 (17.9) | 56.2 (18.4) | 55.5 (18.8) | 54 (18.7) | 0.02 |
| Sex male, n (%) | 1503 (48.8) | 1397 (47.1) | 1432 (48.8) | 1837 (48.3) | 520 (47) | 550 (46.6) | 613 (45) | 654 (45) | <0.01 |
| Race | |||||||||
| African American, n (%) | 2072 (67.2) | 1922 (64.8) | 1820 (62.1) | 2507 (65.9) | 500 (45.2) | 592 (50.2) | 652 (47.8) | 747 (51.4) | <0.01 |
| White, n (%) | 897 (29.1) | 892 (30.1) | 957 (32.6) | 1118 (29.4) | 534 (48.3) | 527 (44.7) | 621 (45.6) | 619 (42.6) | |
| Asian, n (%) | 19 (.6%) | 35 (1.2) | 28 (1) | 32 (.8) | 11 (1) | 7 (.6) | 25 (1.8) | 12 (.8) | |
| Other, n (%) | 94 (3.1) | 119 (4) | 128 (4.4) | 148 (3.9) | 61 (5.5) | 54 (4.6) | 65 (4.8) | 76 (5.2) | |
| Case mix index, mean (SD) | 1.2 (1) | 1.1 (0.9) | 1.1 (0.9) | 1.1 (1.2) | 1.2 (1) | 1.1 (1) | 1.1 (1) | 1 (0.7) | <0.01 |
Differences in Outcomes Among Resident and Hospitalist Services Pre‐ and Postreform
Table 2 shows unadjusted results. Patients discharged from the resident services in the postreform period as compared to the prereform period had a higher likelihood of an ICU stay (5.9% vs 4.5%, P<0.01), and lower likelihood of 30‐day readmission (17.1% vs 20.1%, P<0.01). Patients discharged from the hospitalist service in the postreform period as compared to the prereform period had a significantly shorter mean length of stay (4.51 vs 4.88 days, P=0.03)
| Resident Services | Hospitalist Service | |||||
|---|---|---|---|---|---|---|
| Outcome | Prereforma | Postreform | P Value | Prereforma | Postreform | P Value |
| ||||||
| Length of stay (mean) | 4.55 (5.39) | 4.50 (5.47) | 0.61 | 4.88 (5.36) | 4.51 (4.64) | 0.03 |
| Any ICU stay (%) | 225 (4.5%) | 310 (5.9%) | <0.01 | 82 (4.7%) | 83 (4.7%) | 0.95 |
| Any MHACs (%) | 560 (3.6%) | 180 (3.4%) | 0.62 | 210 (4.5%) | 64 (3.6%) | 0.09 |
| Readmit in 30 days (%) | 3155 (20.1%) | 900 (17.1%) | <0.01 | 852 (18.4%) | 296 (16.8%) | 0.11 |
| Inpatient mortality (%) | 71 (0.5%) | 28 (0.5%) | 0.48 | 18 (0.4%) | 7 (0.4%) | 0.97 |
Table 3 presents the results of regression analyses examining correlates of patient safety outcomes, adjusted for age, gender, race, and CMI. As the test of controls indicated differential prereform trends for ICU admission and length of stay, the prereform period was limited to 2011 for these outcomes. After adjustment for covariates, the probability of an ICU stay remained greater, and the 30‐day readmission rate was lower among patients discharged from resident services in the postreform period than the prereform period. Among patients discharged from the hospitalist services, there were no significant differences in length of stay, readmissions, ICU admissions, MHACs, or inpatient mortality comparing the pre‐ and postreform periods.
| Resident Services | Hospitalist Service | Difference in Differences | |||||
|---|---|---|---|---|---|---|---|
| Outcome | Prereforma | Postreform | Difference | Prereform | Postreform | Difference | (ResidentHospitalist) |
| |||||||
| ICU stay | 4.5% (4.0% to 5.1%) | 5.7% (5.1% to 6.3%) | 1.4% (0.5% to 2.2%) | 4.4% (3.5% to 5.3%) | 5.3% (4.3% to 6.3%) | 1.1% (0.2 to 2.4%) | 0.3% (1.1% to 1.8%) |
| Inpatient mortality | 0.5% (0.4% to 0.6%) | 0.5% (0.3% to 0.7%) | 0 (0.2% to 0.2%) | 0.3% (0.2% to 0.6%) | 0.5% (0.1% to 0.8%) | 0.1% (0.3% to 0.5%) | 0.1% (0.5% to 0.3%) |
| MHACs | 3.6% (3.3% to 3.9%) | 3.3% (2.9% to 3.7%) | 0.4% (0.9 to 0.2%) | 4.5% (3.9% to 5.1%) | 4.1% (3.2% to 5.1%) | 0.3% (1.4% to 0.7%) | 0.2% (1.0% to 1.3%) |
| Readmit 30 days | 20.1% (19.1% to 21.1%) | 17.2% (15.9% to 18.5%) | 2.8% (4.3% to 1.3%) | 18.4% (16.5% to 20.2%) | 16.6% (14.7% to 18.5%) | 1.7% (4.1% to 0.8%) | 1.8% (0.2% to 3.7%) |
| Length of stay | 4.6 (4.4 to 4.7) | 4.4 (4.3 to 4.6) | 0.1 (0.3 to 0.1) | 4.9 (4.6 to 5.1) | 4.7 (4.5 to 5.0) | 0.1 (0.4 to 0.2) | 0.01 (0.37 to 0.34) |
Differences in Outcomes Comparing Resident and Hospitalist Services Pre‐ and Postreform
Comparing pre‐ and postreform periods in the resident and hospitalist services, there were no significant differences in ICU admission, length of stay, MHACs, 30‐day readmissions, or inpatient mortality. In the sensitivity analysis, in which we excluded all discharges in May 2012 to June 2012, results were not significantly different for any of the outcomes examined.
DISCUSSION
Using difference‐in‐differences estimation, we evaluated whether the implementation of the 2011 residency work‐hour mandate was associated with differences in patient safety outcomes including length of stay, 30‐day readmission, inpatient mortality, MHACs, and ICU admissions comparing resident and hospitalist services at a large academic medical center. Adjusting for patient age, race, gender, and clinical complexity, we found no significant changes in any of the patient safety outcomes indicators in the postreform period comparing resident to hospitalist services.
Our quasiexperimental study design allowed us to gauge differences in patient safety outcomes, while reducing bias due to unmeasured confounders that might impact patient safety indicators.[9] We were able to examine all discharges from the resident and hospitalist general medicine services during the academic years 2009 to 2012, while adjusting for age, race, gender, and clinical complexity. Though ICU admission was higher and readmission rates were lower on the resident services post‐2011, we did not observe a significant difference in ICU admission or 30‐day readmission rates in the postreform period comparing patients discharged from the resident and hospitalist services and all patients in the prereform period.
Our neutral findings differ from some other single‐institution evaluations of reduced resident work hours, several of which have shown improved quality of life, education, and patient safety indicators.[18, 21, 26, 27, 28] It is unclear why improvements in patient safety were not identified in the current study. The 2011 reforms were more broad‐based than some of the preliminary studies of reduced work hours, and therefore additional variables may be at play. For instance, challenges related to decreased work hours, including the increased number of handoffs in care and work compression, may require specific interventions to produce sustained improvements in patient safety.[3, 14, 29, 30]
Improving patient safety requires more than changing resident work hours. Blum et al. recommended enhanced funding to increase supervision, decrease resident caseload, and incentivize achievement of quality indicators to achieve the goal of improved patient safety within work‐hour reform.[31] Schumacher et al. proposed a focus on supervision, professionalism, safe transitions of care, and optimizing workloads as a means to improve patient safety and education within the new residency training paradigm.[29]
Limitations of this study include limited follow‐up time after implementation of the work‐hour reforms. It may take more time to optimize systems of care to see benefits in patient safety indicators. This was a single‐institution study of a limited number of outcomes in a single department, which limits generalizability and may reflect local experience rather than broader trends. The call schedule on the resident service in this study differs from programs that have adopted night float schedules. [27] This may have had an effect on patient care outcomes.[32] In an attempt to conduct a timely study of inpatient safety indicators following the 2011 changes, our study was not powered to detect small changes in low‐frequency outcomes such as mortality; longer‐term studies at multiple institutions will be needed to answer these key questions. We limited the prereform period where our test of controls indicated differential prereform trends, which reduced power.
As this was an observational study rather than an experiment, there may have been both measured and unmeasured differences in patient characteristics and comorbidity between the intervention and control group. For example, CMI was lower on the hospitalist service than the resident services. Demographics varied somewhat between services; male and African American patients were more likely to be discharged from resident services than hospitalist services for unknown reasons. Although we adjusted for demographics and CMI in our model, there may be residual confounding. Limitations in data collection did not allow us to separate patients initially admitted to the ICU from patients transferred to the ICU from the inpatient floors. We attempted to overcome this limitation through use of a difference‐in‐differences model to account for secular trends, but factors other than residency work hours may have impacted the resident and hospitalist services differentially. For example, hospital quality‐improvement programs or provider‐level factors may have differentially impacted the resident versus hospitalist services during the study period.
Work‐hour limitations for residents were established to improve residency education and patient safety. As noted by the Institute of Medicine, improving patient safety will require significant investment by program directors, hospitals, and the public to keep resident caseloads manageable, ensure adequate supervision of first‐year residents, train residents on safe handoffs in care, and conduct ongoing evaluations of patient safety and any unintended consequences of the regulations.[33] In the first year after implementation of the 2011 work‐hour reforms, we found no change in ICU admission, inpatient mortality, 30‐day readmission rates, length of stay, or MHACs compared with patients treated by hospitalists. Studies of the long‐term impact of residency work‐hour reform are necessary to determine whether changes in work hours have been associated with improvement in resident education and patient safety.
Disclosure: Nothing to report.
- Accreditation Council for Graduate Medical Education. Common program requirements effective: July 1, 2011. Available at: http://www.acgme.org/acgmeweb/Portals/0/PFAssets/ProgramResources/Common_Program_Requirements_07012011[1].pdf. Accessed February 10, 2014.
- , , . The new recommendations on duty hours from the ACGME Task Force. N Engl J Med. 2010;363:e3.
- , , , , . Interns' compliance with Accreditation Council for Graduate Medical Education work‐hour limits. JAMA. 2006;296(9):1063–1070.
- , , , , , . Effects of work hour reduction on residents' lives: a systematic review. JAMA. 2005;294(9):1088–1100.
- , , , et al. Effects of the ACGME duty hour limits on sleep, work hours, and safety. Pediatrics. 2008;122(2):250–258.
- , , . Teaching hospital five‐year mortality trends in the wake of duty hour reforms. J Gen Intern Med. 2013;28(8):1048–1055.
- , , , . Duty hour limits and patient care and resident outcomes: can high‐quality studies offer insight into complex relationships? Ann Rev Med. 2013;64:467–483.
- , , . Patient safety, resident education and resident well‐being following implementation of the 2003 ACGME duty hour rules. J Gen Intern Med. 2011;26(8):907–919.
- , , , et al. Mortality among hospitalized Medicare beneficiaries in the first 2 years following ACGME resident duty hour reform. JAMA. 2007;298(9):975–983.
- , , , et al. Effects of resident duty hour reform on surgical and procedural patient safety indicators among hospitalized Veterans Health Administration and Medicare patients. Med Care. 2009;47(7):723–731.
- , , , et al. Pilot trial of IOM duty hour recommendations in neurology residency programs. Neurology. 2011;77(9):883–887.
- , , , et al. Effect of 16‐hour duty periods of patient care and resident education. Mayo Clin Proc. 2011;86:192–196.
- , , , et al. Effects of the 2011 duty hour reforms on interns and their patients: a prospective longitudinal cohort study. JAMA Intern Med. 2013;173(8):657–662.
- , , , et al. Effect of the 2011 vs 2003 duty hour regulation—compliant models on sleep duration, trainee education, and continuity of patient care among internal medicine house staff. JAMA Intern Med. 2013;173(8):649–655.
- , , . Residents' response to duty‐hour regulations—a follow‐up national survey. N Engl J Med. 2012;366:e35.
- , , , . Surgical residents' perceptions of 2011 Accreditation Council for Graduate Medical Education duty hour regulations. JAMA Surg. 2013;148(5):427–433.
- , , . The 2011 duty hour requirements—a survey of residency program directors. N Engl J Med. 2013;368:694–697.
- , , , et al. The effect of reducing maximum shift lengths to 16 hours on internal medicine interns' educational opportunities. Acad Med. 2013;88(4):512–518.
- , . Residency work‐hours reform. A cost analysis including preventable adverse events. J Gen Intern Med. 2005;20(10):873–878.
- , , , , . Cost implications of reduced work hours and workloads for resident physicians. N Engl J Med. 2009;360:2202–2215.
- , , , . Changes in outcomes for internal medicine inpatients after work‐hour regulations. Ann Intern Med. 2007;147:97–103.
- .Maryland Health Services Cost Review Commission. Complications: Maryland Hospital Acquired Conditions. Available at: http://www.hscrc.state.md.us/init_qi_MHAC.cfm. Accessed May 23, 2013.
- , , , et al. What are APR‐DRGs? An introduction to severity of illness and risk of mortality adjustment methodology. 3M Health Information Systems. Available at: http://solutions.3m.com/3MContentRetrievalAPI/BlobServlet?locale=it_IT44(4):1049–1060.
- , , , , . Impact of the 2008 US Preventive Services Task Force Recommendation to discontinue prostate cancer screening among male Medicare beneficiaries. Arch Intern Med. 2012;172(20):1601–1603.
- , , , et al. Effect of reducing interns' work hour on serious medical errors in intensive care units. N Engl J Med. 2004;351(18):1838–1848.
- , , . Effects of reducing or eliminating resident work shifts over 16 hours: a systematic review. Sleep. 2010;33(8):1043–1053.
- , , , et al. Impact of duty hours restrictions on quality of care and clinical outcomes. Am J Med. 2007;120(11):968–974.
- , , , , , . Beyond counting hours: the importance of supervision, professionalism, transitions in care, and workload in residency training. Acad Med. 2012;87(7):883–888.
- , , , , , . One possible future for resident hours: interns' perspective on a one‐month trial of the Institute of Medicine recommended duty hour limits. J Grad Med Educ. 2009;1(2):185–187.
- , , , , . Implementing the 2009 Institute of Medicine recommendations on resident physician work hours, supervision, and safety. Nature Sci Sleep. 2001;3:47–85.
- , . Night float teaching and learning: perceptions of residents and faculty. J Grad Med Educ. 2010;2(2):236–241.
- Institute of Medicine. Resident duty hours: enhancing sleep, supervision, and safety. Report brief. Washington, DC: National Academies; 2008. Available at: http://www.iom.edu/∼/media/Files/Report Files/2008/Resident‐Duty‐Hours/residency hours revised for web.pdf. Accessed May 23, 2013.
The Accreditation Council for Graduate Medical Education (ACGME) Common Program Requirements implemented in July 2011 increased supervision requirements and limited continuous work hours for first‐year residents.[1] Similar to the 2003 mandates, these requirements were introduced to improve patient safety and education at academic medical centers.[2] Work‐hour reforms have been associated with decreased resident burnout and improved sleep.[3, 4, 5] However, national observational studies and systematic reviews of the impact of the 2003 reforms on patient safety and quality of care have been varied in terms of outcome.[6, 7, 8, 9, 10] Small studies of the 2011 recommendations have shown increased sleep duration and decreased burnout, but also an increased number of handoffs and increased resident concerns about making a serious medical error.[11, 12, 13, 14] Although national surveys of residents and program directors have not indicated improvements in education or quality of life, 1 observational study did show improvement in clinical exposure and conference attendance.[15, 16, 17, 18] The impact of the 2011 reforms on patient safety remains unclear.[19, 20]
The objective of this study was to evaluate the association between implementation of the 2011 residency work‐hour mandates and patient safety outcomes at a large academic medical center.
METHODS
Study Design
This observational study used a quasi‐experimental difference‐in‐differences approach to evaluate whether residency work‐hour changes were associated with patient safety outcomes among general medicine inpatients. We compared safety outcomes among adult patients discharged from resident general medical services (referred to as resident) to safety outcomes among patients discharged by the hospitalist general medical service (referred to as hospitalist) before and after the 2011 residency work‐hour reforms at a large academic medical center. Differences in outcomes for the resident group were compared to differences observed in the hospitalist group, with adjustment for relevant demographic and case mix factors.[21] We used the hospitalist service as a control group, because ACGME changes applied only to resident services. The strength of this design is that it controls for secular trends that are correlated with patient safety, impacting both residents and hospitalists similarly.[9]
Approval for this study and a Health Insurance Portability and Accountability Act waiver were granted by the Johns Hopkins University School of Medicine institutional review board. We retrospectively examined administrative data on all patient discharges from the general medicine services at Johns Hopkins Hospital between July 1, 2008 and June 30, 2012 that were identified as pertaining to resident or hospitalist services.
Patient Allocation and Physician Scheduling
Patient admission to the resident or hospitalist service was decided by a number of factors. To maintain continuity of care, patients were preferentially admitted to the same service as for prior admissions. New patients were admitted to a service based on bed availability, nurse staffing, patient gender, isolation precautions, and cardiac monitor availability.
The inpatient resident services were staffed prior to July 2011 using a traditional 30‐hour overnight call system. Following July 2011, the inpatient resident services were staffed using a modified overnight call system, in which interns took overnight calls from 8 pm until 12 pm the following day, once every 5 nights with supervision by upper‐level residents. These interns rotated through daytime admitting and coverage roles on the intervening days. The hospitalist service was organized into a 3‐physician rotation of day shift, evening shift, and overnight shift.
Data and Outcomes
Twenty‐nine percent of patients in the sample were admitted more than once during the study period, and patients were generally admitted to the same resident team during each admission. Patients with multiple admissions were counted multiple times in the model. We categorized admissions as prereform (July 1, 2008June 30, 2011) and postreform (July 1, 2011June 30, 2012). Outcomes evaluated included hospital length of stay, 30‐day readmission, intensive care unit stay (ICU) stay, inpatient mortality, and number of Maryland Hospital Acquired Conditions (MHACs). ICU stay pertained to any ICU admission including initial admission and transfer from the inpatient floor. MHACs are a set of inpatient performance indicators derived from a list of 64 inpatient Potentially Preventable Complications developed by 3M Health Information Systems.[22] MHACs are used by the Maryland Health Services Cost Review Commission to link hospital payment to performance for costly, preventable, and clinically relevant complications. MHACs were coded in our analysis as a dichotomous variable. Independent variables included patient age at admission, race, gender, and case mix index. Case mix index (CMI) is a numeric score that measures resource utilization for a specific patient population. CMI is a weighted value assigned to patients based on resource utilization and All Patient Refined Diagnostic Related Group and was included as an indicator of patient illness severity and risk of mortality.[23] Data were obtained from administrative records from the case mix research team at Johns Hopkins Medicine.
To account for transitional differences that may have coincided with the opening of a new hospital wing in late April 2012, we conducted a sensitivity analysis, in which we excluded from analysis any visits that took place in May 2012 to June 2012.
Data Analysis
Based on historical studies, we calculated that a sample size of at least 3600 discharges would allow us to detect a difference of 5% between the pre‐ and postreform period assuming baseline 20% occurrence of dichotomous outcomes (=0.05; =0.2; r=4).[21]
The primary unit of analysis was the hospital discharge. Similar to Horwitz et al., we analyzed data using a difference‐in‐differences estimation strategy.[21] We used multivariable linear regression for length of stay measured as a continuous variable, and multivariable logistic regression for inpatient mortality, 30‐day readmission, MHACs coded as a dichotomous variable, and ICU stay coded as a dichotomous variable.[9] The difference‐in‐differences estimation was used to determine whether the postreform period relative to prereform period was associated with differences in outcomes comparing resident and hospitalist services. In the regression models, the independent variables of interest included an indicator variable for whether a patient was treated on a resident service, an indicator variable for whether a patient was discharged in the postreform period, and the interaction of these 2 variables (resident*postreform). The interaction term can be interpreted as a differential change over time comparing resident and hospitalist services. In all models, we adjusted for patient age, gender, race, and case mix index.
To determine whether prereform trends were similar among the resident and hospitalist services, we performed a test of controls as described by Volpp and colleagues.[6] Interaction terms for resident service and prereform years 2010 and 2011 were added to the model. A Wald test was then used to test for improved model fit, which would indicate differential trends among resident and hospitalist services during the prereform period. Where such trends were found, postreform results were compared only to 2011 rather than the 2009 to 2011 prereform period.[6]
To account for correlation within patients who had multiple discharges, we used a clustering approach and estimated robust variances.[24] From the regression model results, we calculated predicted probabilities adjusted for relevant covariates and prepost differences, and used linear probability models to estimate percentage‐point differences in outcomes, comparing residents and hospitalists in the pre‐ and postreform periods.[25] All analyses were performed using Stata/IC version 11 (StataCorp, College Station, TX).
RESULTS
In the 3 years before the 2011 residency work‐hour reforms were implemented (prereform), there were a total of 15,688 discharges for 8983 patients to the resident services and 4622 discharges for 3649 patients to the hospitalist services. In the year following implementation of residency work‐hour changes (postreform), there were 5253 discharges for 3805 patients to the resident services and 1767 discharges for 1454 patients to the hospitalist service. Table 1 shows the characteristics of patients discharged from the resident and hospitalist services in the pre‐ and postreform periods. Patients discharged from the resident services were more likely to be older, male, African American, and have a higher CMI.
| Resident Services | Hospitalist Service | ||||||||
|---|---|---|---|---|---|---|---|---|---|
| 2009 | 2010 | 2011 | 2012 | 2009 | 2010 | 2011 | 2012 | P Valuea | |
| |||||||||
| Discharges, n | 5345 | 5299 | 5044 | 5253 | 1366 | 1492 | 1764 | 1767 | |
| Unique patients, n | 3082 | 2968 | 2933 | 3805 | 1106 | 1180 | 1363 | 1454 | |
| Age, y, mean (SD) | 55.1 (17.7) | 55.7 (17.4) | 56.4 (17.9) | 56.7 (17.1) | 55.9 (17.9) | 56.2 (18.4) | 55.5 (18.8) | 54 (18.7) | 0.02 |
| Sex male, n (%) | 1503 (48.8) | 1397 (47.1) | 1432 (48.8) | 1837 (48.3) | 520 (47) | 550 (46.6) | 613 (45) | 654 (45) | <0.01 |
| Race | |||||||||
| African American, n (%) | 2072 (67.2) | 1922 (64.8) | 1820 (62.1) | 2507 (65.9) | 500 (45.2) | 592 (50.2) | 652 (47.8) | 747 (51.4) | <0.01 |
| White, n (%) | 897 (29.1) | 892 (30.1) | 957 (32.6) | 1118 (29.4) | 534 (48.3) | 527 (44.7) | 621 (45.6) | 619 (42.6) | |
| Asian, n (%) | 19 (.6%) | 35 (1.2) | 28 (1) | 32 (.8) | 11 (1) | 7 (.6) | 25 (1.8) | 12 (.8) | |
| Other, n (%) | 94 (3.1) | 119 (4) | 128 (4.4) | 148 (3.9) | 61 (5.5) | 54 (4.6) | 65 (4.8) | 76 (5.2) | |
| Case mix index, mean (SD) | 1.2 (1) | 1.1 (0.9) | 1.1 (0.9) | 1.1 (1.2) | 1.2 (1) | 1.1 (1) | 1.1 (1) | 1 (0.7) | <0.01 |
Differences in Outcomes Among Resident and Hospitalist Services Pre‐ and Postreform
Table 2 shows unadjusted results. Patients discharged from the resident services in the postreform period as compared to the prereform period had a higher likelihood of an ICU stay (5.9% vs 4.5%, P<0.01), and lower likelihood of 30‐day readmission (17.1% vs 20.1%, P<0.01). Patients discharged from the hospitalist service in the postreform period as compared to the prereform period had a significantly shorter mean length of stay (4.51 vs 4.88 days, P=0.03)
| Resident Services | Hospitalist Service | |||||
|---|---|---|---|---|---|---|
| Outcome | Prereforma | Postreform | P Value | Prereforma | Postreform | P Value |
| ||||||
| Length of stay (mean) | 4.55 (5.39) | 4.50 (5.47) | 0.61 | 4.88 (5.36) | 4.51 (4.64) | 0.03 |
| Any ICU stay (%) | 225 (4.5%) | 310 (5.9%) | <0.01 | 82 (4.7%) | 83 (4.7%) | 0.95 |
| Any MHACs (%) | 560 (3.6%) | 180 (3.4%) | 0.62 | 210 (4.5%) | 64 (3.6%) | 0.09 |
| Readmit in 30 days (%) | 3155 (20.1%) | 900 (17.1%) | <0.01 | 852 (18.4%) | 296 (16.8%) | 0.11 |
| Inpatient mortality (%) | 71 (0.5%) | 28 (0.5%) | 0.48 | 18 (0.4%) | 7 (0.4%) | 0.97 |
Table 3 presents the results of regression analyses examining correlates of patient safety outcomes, adjusted for age, gender, race, and CMI. As the test of controls indicated differential prereform trends for ICU admission and length of stay, the prereform period was limited to 2011 for these outcomes. After adjustment for covariates, the probability of an ICU stay remained greater, and the 30‐day readmission rate was lower among patients discharged from resident services in the postreform period than the prereform period. Among patients discharged from the hospitalist services, there were no significant differences in length of stay, readmissions, ICU admissions, MHACs, or inpatient mortality comparing the pre‐ and postreform periods.
| Resident Services | Hospitalist Service | Difference in Differences | |||||
|---|---|---|---|---|---|---|---|
| Outcome | Prereforma | Postreform | Difference | Prereform | Postreform | Difference | (ResidentHospitalist) |
| |||||||
| ICU stay | 4.5% (4.0% to 5.1%) | 5.7% (5.1% to 6.3%) | 1.4% (0.5% to 2.2%) | 4.4% (3.5% to 5.3%) | 5.3% (4.3% to 6.3%) | 1.1% (0.2 to 2.4%) | 0.3% (1.1% to 1.8%) |
| Inpatient mortality | 0.5% (0.4% to 0.6%) | 0.5% (0.3% to 0.7%) | 0 (0.2% to 0.2%) | 0.3% (0.2% to 0.6%) | 0.5% (0.1% to 0.8%) | 0.1% (0.3% to 0.5%) | 0.1% (0.5% to 0.3%) |
| MHACs | 3.6% (3.3% to 3.9%) | 3.3% (2.9% to 3.7%) | 0.4% (0.9 to 0.2%) | 4.5% (3.9% to 5.1%) | 4.1% (3.2% to 5.1%) | 0.3% (1.4% to 0.7%) | 0.2% (1.0% to 1.3%) |
| Readmit 30 days | 20.1% (19.1% to 21.1%) | 17.2% (15.9% to 18.5%) | 2.8% (4.3% to 1.3%) | 18.4% (16.5% to 20.2%) | 16.6% (14.7% to 18.5%) | 1.7% (4.1% to 0.8%) | 1.8% (0.2% to 3.7%) |
| Length of stay | 4.6 (4.4 to 4.7) | 4.4 (4.3 to 4.6) | 0.1 (0.3 to 0.1) | 4.9 (4.6 to 5.1) | 4.7 (4.5 to 5.0) | 0.1 (0.4 to 0.2) | 0.01 (0.37 to 0.34) |
Differences in Outcomes Comparing Resident and Hospitalist Services Pre‐ and Postreform
Comparing pre‐ and postreform periods in the resident and hospitalist services, there were no significant differences in ICU admission, length of stay, MHACs, 30‐day readmissions, or inpatient mortality. In the sensitivity analysis, in which we excluded all discharges in May 2012 to June 2012, results were not significantly different for any of the outcomes examined.
DISCUSSION
Using difference‐in‐differences estimation, we evaluated whether the implementation of the 2011 residency work‐hour mandate was associated with differences in patient safety outcomes including length of stay, 30‐day readmission, inpatient mortality, MHACs, and ICU admissions comparing resident and hospitalist services at a large academic medical center. Adjusting for patient age, race, gender, and clinical complexity, we found no significant changes in any of the patient safety outcomes indicators in the postreform period comparing resident to hospitalist services.
Our quasiexperimental study design allowed us to gauge differences in patient safety outcomes, while reducing bias due to unmeasured confounders that might impact patient safety indicators.[9] We were able to examine all discharges from the resident and hospitalist general medicine services during the academic years 2009 to 2012, while adjusting for age, race, gender, and clinical complexity. Though ICU admission was higher and readmission rates were lower on the resident services post‐2011, we did not observe a significant difference in ICU admission or 30‐day readmission rates in the postreform period comparing patients discharged from the resident and hospitalist services and all patients in the prereform period.
Our neutral findings differ from some other single‐institution evaluations of reduced resident work hours, several of which have shown improved quality of life, education, and patient safety indicators.[18, 21, 26, 27, 28] It is unclear why improvements in patient safety were not identified in the current study. The 2011 reforms were more broad‐based than some of the preliminary studies of reduced work hours, and therefore additional variables may be at play. For instance, challenges related to decreased work hours, including the increased number of handoffs in care and work compression, may require specific interventions to produce sustained improvements in patient safety.[3, 14, 29, 30]
Improving patient safety requires more than changing resident work hours. Blum et al. recommended enhanced funding to increase supervision, decrease resident caseload, and incentivize achievement of quality indicators to achieve the goal of improved patient safety within work‐hour reform.[31] Schumacher et al. proposed a focus on supervision, professionalism, safe transitions of care, and optimizing workloads as a means to improve patient safety and education within the new residency training paradigm.[29]
Limitations of this study include limited follow‐up time after implementation of the work‐hour reforms. It may take more time to optimize systems of care to see benefits in patient safety indicators. This was a single‐institution study of a limited number of outcomes in a single department, which limits generalizability and may reflect local experience rather than broader trends. The call schedule on the resident service in this study differs from programs that have adopted night float schedules. [27] This may have had an effect on patient care outcomes.[32] In an attempt to conduct a timely study of inpatient safety indicators following the 2011 changes, our study was not powered to detect small changes in low‐frequency outcomes such as mortality; longer‐term studies at multiple institutions will be needed to answer these key questions. We limited the prereform period where our test of controls indicated differential prereform trends, which reduced power.
As this was an observational study rather than an experiment, there may have been both measured and unmeasured differences in patient characteristics and comorbidity between the intervention and control group. For example, CMI was lower on the hospitalist service than the resident services. Demographics varied somewhat between services; male and African American patients were more likely to be discharged from resident services than hospitalist services for unknown reasons. Although we adjusted for demographics and CMI in our model, there may be residual confounding. Limitations in data collection did not allow us to separate patients initially admitted to the ICU from patients transferred to the ICU from the inpatient floors. We attempted to overcome this limitation through use of a difference‐in‐differences model to account for secular trends, but factors other than residency work hours may have impacted the resident and hospitalist services differentially. For example, hospital quality‐improvement programs or provider‐level factors may have differentially impacted the resident versus hospitalist services during the study period.
Work‐hour limitations for residents were established to improve residency education and patient safety. As noted by the Institute of Medicine, improving patient safety will require significant investment by program directors, hospitals, and the public to keep resident caseloads manageable, ensure adequate supervision of first‐year residents, train residents on safe handoffs in care, and conduct ongoing evaluations of patient safety and any unintended consequences of the regulations.[33] In the first year after implementation of the 2011 work‐hour reforms, we found no change in ICU admission, inpatient mortality, 30‐day readmission rates, length of stay, or MHACs compared with patients treated by hospitalists. Studies of the long‐term impact of residency work‐hour reform are necessary to determine whether changes in work hours have been associated with improvement in resident education and patient safety.
Disclosure: Nothing to report.
- Accreditation Council for Graduate Medical Education. Common program requirements effective: July 1, 2011. Available at: http://www.acgme.org/acgmeweb/Portals/0/PFAssets/ProgramResources/Common_Program_Requirements_07012011[1].pdf. Accessed February 10, 2014.
- , , . The new recommendations on duty hours from the ACGME Task Force. N Engl J Med. 2010;363:e3.
- , , , , . Interns' compliance with Accreditation Council for Graduate Medical Education work‐hour limits. JAMA. 2006;296(9):1063–1070.
- , , , , , . Effects of work hour reduction on residents' lives: a systematic review. JAMA. 2005;294(9):1088–1100.
- , , , et al. Effects of the ACGME duty hour limits on sleep, work hours, and safety. Pediatrics. 2008;122(2):250–258.
- , , . Teaching hospital five‐year mortality trends in the wake of duty hour reforms. J Gen Intern Med. 2013;28(8):1048–1055.
- , , , . Duty hour limits and patient care and resident outcomes: can high‐quality studies offer insight into complex relationships? Ann Rev Med. 2013;64:467–483.
- , , . Patient safety, resident education and resident well‐being following implementation of the 2003 ACGME duty hour rules. J Gen Intern Med. 2011;26(8):907–919.
- , , , et al. Mortality among hospitalized Medicare beneficiaries in the first 2 years following ACGME resident duty hour reform. JAMA. 2007;298(9):975–983.
- , , , et al. Effects of resident duty hour reform on surgical and procedural patient safety indicators among hospitalized Veterans Health Administration and Medicare patients. Med Care. 2009;47(7):723–731.
- , , , et al. Pilot trial of IOM duty hour recommendations in neurology residency programs. Neurology. 2011;77(9):883–887.
- , , , et al. Effect of 16‐hour duty periods of patient care and resident education. Mayo Clin Proc. 2011;86:192–196.
- , , , et al. Effects of the 2011 duty hour reforms on interns and their patients: a prospective longitudinal cohort study. JAMA Intern Med. 2013;173(8):657–662.
- , , , et al. Effect of the 2011 vs 2003 duty hour regulation—compliant models on sleep duration, trainee education, and continuity of patient care among internal medicine house staff. JAMA Intern Med. 2013;173(8):649–655.
- , , . Residents' response to duty‐hour regulations—a follow‐up national survey. N Engl J Med. 2012;366:e35.
- , , , . Surgical residents' perceptions of 2011 Accreditation Council for Graduate Medical Education duty hour regulations. JAMA Surg. 2013;148(5):427–433.
- , , . The 2011 duty hour requirements—a survey of residency program directors. N Engl J Med. 2013;368:694–697.
- , , , et al. The effect of reducing maximum shift lengths to 16 hours on internal medicine interns' educational opportunities. Acad Med. 2013;88(4):512–518.
- , . Residency work‐hours reform. A cost analysis including preventable adverse events. J Gen Intern Med. 2005;20(10):873–878.
- , , , , . Cost implications of reduced work hours and workloads for resident physicians. N Engl J Med. 2009;360:2202–2215.
- , , , . Changes in outcomes for internal medicine inpatients after work‐hour regulations. Ann Intern Med. 2007;147:97–103.
- .Maryland Health Services Cost Review Commission. Complications: Maryland Hospital Acquired Conditions. Available at: http://www.hscrc.state.md.us/init_qi_MHAC.cfm. Accessed May 23, 2013.
- , , , et al. What are APR‐DRGs? An introduction to severity of illness and risk of mortality adjustment methodology. 3M Health Information Systems. Available at: http://solutions.3m.com/3MContentRetrievalAPI/BlobServlet?locale=it_IT44(4):1049–1060.
- , , , , . Impact of the 2008 US Preventive Services Task Force Recommendation to discontinue prostate cancer screening among male Medicare beneficiaries. Arch Intern Med. 2012;172(20):1601–1603.
- , , , et al. Effect of reducing interns' work hour on serious medical errors in intensive care units. N Engl J Med. 2004;351(18):1838–1848.
- , , . Effects of reducing or eliminating resident work shifts over 16 hours: a systematic review. Sleep. 2010;33(8):1043–1053.
- , , , et al. Impact of duty hours restrictions on quality of care and clinical outcomes. Am J Med. 2007;120(11):968–974.
- , , , , , . Beyond counting hours: the importance of supervision, professionalism, transitions in care, and workload in residency training. Acad Med. 2012;87(7):883–888.
- , , , , , . One possible future for resident hours: interns' perspective on a one‐month trial of the Institute of Medicine recommended duty hour limits. J Grad Med Educ. 2009;1(2):185–187.
- , , , , . Implementing the 2009 Institute of Medicine recommendations on resident physician work hours, supervision, and safety. Nature Sci Sleep. 2001;3:47–85.
- , . Night float teaching and learning: perceptions of residents and faculty. J Grad Med Educ. 2010;2(2):236–241.
- Institute of Medicine. Resident duty hours: enhancing sleep, supervision, and safety. Report brief. Washington, DC: National Academies; 2008. Available at: http://www.iom.edu/∼/media/Files/Report Files/2008/Resident‐Duty‐Hours/residency hours revised for web.pdf. Accessed May 23, 2013.
© 2014 Society of Hospital Medicine
Etiquette‐Based Medicine Among Interns
Patient‐centered communication may impact several aspects of the patientdoctor relationship including patient disclosure of illness‐related information, patient satisfaction, anxiety, and compliance with medical recommendations.[1, 2, 3, 4] Etiquette‐based medicine, a term coined by Kahn, involves simple patient‐centered communication strategies that convey professionalism and respect to patients.[5] Studies have confirmed that patients prefer physicians who practice etiquette‐based medicine behaviors, including sitting down and introducing one's self.[6, 7, 8, 9] Performance of etiquette‐based medicine is associated with higher Press Ganey patient satisfaction scores. However, these easy‐to‐practice behaviors may not be modeled commonly in the inpatient setting.[10] We sought to understand whether etiquette‐based communication behaviors are practiced by trainees on inpatient medicine rotations.
METHODS
Design
This was a prospective study incorporating direct observation of intern interactions with patients during January 2012 at 2 internal medicine residency programs in Baltimore Maryland, Johns Hopkins Hospital (JHH) and the University of Maryland Medical Center (UMMC). We then surveyed participants from JHH in June 2012 to assess perceptions of their practice of etiquette‐based communication.
Participants and Setting
We observed a convenience sample of 29 internal medicine interns from the 2 institutions. We sought to observe interns over an equal number of hours at both sites and to sample shifts in proportion to the amount of time interns spend on each of these shifts. All interns who were asked to participate in the study agreed and comprised a total of 27% of the 108 interns in the 2 programs. The institutional review board at Johns Hopkins School of Medicine approved the study; the University of Maryland institutional review board deemed it not human subjects research. All observed interns provided informed consent to be observed during 1 to 4 inpatient shifts.
Observers
Twenty‐two undergraduate university students served as the observers for the study and were trained to collect data with the iPod Touch (Apple, Cupertino, CA) without interrupting patient care. We then tested the observers to ensure 85% concordance rate with the researchers in mock observation. Four hours of quality assurance were completed at both institutions during the study. Congruence between observer and research team member was >85% for each hour of observation.
Observation
Observers recorded intern activities on the iPod Touch spreadsheet application. The application allowed for real‐time data entry and direct export of results. The primary dependent variables for this study were 5 behaviors that were assessed each time an intern went into a patient's room. The 5 observed behaviors included (1) introducing one's self, (2) introducing one's role on the medical team, (3) touching the patient, (4) sitting down, and (5) asking the patient at least 1 open‐ended question. These behaviors were chosen for observation because they are central to Kahn's framework of etiquette‐based medicine, applicable to each inpatient encounter, and readily observed by trained nonmedical observers. These behaviors are defined in Table 1. Use of open‐ended questions was observed as a more general form of Kahn's recommendation to ask how the patient is feeling. Interns were not aware of which behaviors were being evaluated.
| Behavior | Definition |
|---|---|
| Introduced self | Providing a name |
| Introduced role | Uses term doctor, resident, intern, or medical team |
| Sat down | Sitting on the bed, in a chair, or crouching if no chair was available during at least part of the encounter |
| Touched the patient | Any form of physical contact that occurred at least once during the encounter including shaking a patient's hand, touching a patient on the shoulder, or performing any part of the physical exam |
| Asked open‐ended question | Asked the patient any question that required more than a yes/no answer |
Each time an observed intern entered a patient room, the observer recorded whether or not each of the 5 behaviors was performed, coded as a dichotomous variable. Although data collection was anonymous, observers recorded the team, hospital site, gender of the intern, and whether the intern was admitting new patients during the shift.
Survey
Following the observational portion of the study, participants at JHH completed a cross‐sectional, anonymous survey that asked them to estimate how frequently they currently performed each of the behaviors observed in this study. Response options included the following categories: <20%, 20% to 40%, 40% to 60%, 60% to 80%, or 80% to 100%.
Data Analysis
We determined the percent of patient visits during which each behavior was performed. Data were analyzed using Student t and [2] tests evaluating differences by hospital, intern gender, type of shift, and time of day. To account for correlation within subjects and observers, we performed multilevel logistic regression analysis adjusted for clustering at the intern and observer levels. For the survey analysis, the mean of the response category was used as the basis for comparison. All quantitative analyses were performed in Excel 2010 (Microsoft Corp., Redmond, WA) and Stata/IC version 11 (StataCorp, College Station, TX).
RESULTS
A total of 732 inpatient encounters were observed during 118 intern shifts. Interns were observed for a mean of 25 patient encounters each (range, 361; standard deviation [SD] 17). Overall, interns introduced themselves 40% of the time and stated their role 37% of the time (Table 2). Interns touched patients on 65% of visits, sat down with patients during 9% of visits, and asked open‐ended questions on 75% of visits. Interns performed all 5 of the behaviors during 4% of the total encounters. The percentage of the 5 behaviors performed by each intern during all observed visits ranged from 24% to 100%, with a mean of 51% (SD 17%) per intern.
| Total Encounters, N (%) | Introduced Self (%) | Introduced Role (%) | Touched Patient (%) | Sat Down (%) | Open‐Ended Question (%) | |
|---|---|---|---|---|---|---|
| ||||||
| Overall | 732 | 40 | 37 | 65 | 9 | 75 |
| JHH | 373 (51) | 35ab | 29ab | 62a | 10 | 70a |
| UMMC | 359 (49) | 45 | 44 | 69 | 8 | 81 |
| Male | 284 (39) | 39 | 35 | 64 | 9 | 74 |
| Female | 448 (61) | 41 | 38 | 67 | 10 | 76 |
| Day shift | 551 (75) | 37a | 34a | 65 | 9 | 77 |
| Night shift | 181 (25) | 48 | 45 | 67 | 12 | 71 |
| Admitting shift | 377 (52) | 46a | 42a | 63 | 10 | 75 |
| Nonadmitting shift | 355 (48) | 34 | 30 | 69 | 9 | 76 |
During night shifts as compared to day shifts, interns were more likely to introduce themselves (48% vs 37%, P=0.01) and their role (45% vs 34%, P<0.01). During shifts in which they admitted patients as compared to coverage shifts, interns were more likely to introduce themselves (46% vs 34%, P<0.01) and their role (42% vs 30%, P<0.01). Interns at UMMC as compared to JHH interns were more likely to introduce themselves (45% vs 35%, P<0.01) and describe their role to patients (44% vs 29%, P<0.01). Interns at UMMC were also more likely to ask open‐ended questions (81% vs 70%, P<0.01) and to touch patients (69% vs 62%, P=0.04). Performance of these behaviors did not vary significantly by gender, time of day, or shift. After adjustment for clustering at the observer and intern levels, differences by institution persisted in the rate of introducing oneself and one's role.
We performed a sensitivity analysis examining the first patient encounters of the day, and found that interns were somewhat more likely to introduce themselves (50% vs 40%, P=0.03) but were not significantly more likely to introduce their role, sit down, ask open‐ended questions, or touch the patient.
Nine of the 10 interns at JHH who participated in the study completed the survey (response rate=90%). Interns estimated introducing themselves and their role and sitting with patients significantly more frequently than was observed (80% vs 40%, P<0.01; 80% vs 37%, P<0.01; and 58% vs 9%, P<0.01, respectively) (Figure 1).

DISCUSSION
The interns we observed in 2 urban academic internal medicine residency programs did not routinely practice etiquette‐based communication. Interns surveyed tended to overestimate their performance of these behaviors. These behaviors are simple to perform and are each associated with improved patient experiences of hospital care. Tackett et al. recently demonstrated that interns are not alone. Hospitalist physicians do not universally practice etiquette‐based medicine, even though these behaviors correlate with patient satisfaction scores.[10]
Introducing oneself to patients may improve patient satisfaction and acceptance of trainee involvement in care.[6] However, only 10% of hospitalized patients in 1 study correctly identified a physician on their inpatient team, demonstrating the need for introductions during each and every inpatient encounter.[11] The interns we observed introduced themselves to patients in only 40% of encounters. During admitting shifts, when the first encounter with a patient likely took place, interns introduced themselves during 46% of encounters.
A comforting touch has been shown to reduce anxiety levels among patients and improve compliance with treatment regimens, but the interns did not touch patients in one‐third of visits, including during admitting shifts. Sixty‐six percent of patients consider a physician's touch comforting, and 58% believe it to be healing.[8]
A randomized trial found that most patients preferred a sitting physician, and believed that practitioners who sat were more compassionate and spent more time with them.[9] Unfortunately, interns sat down with patients in fewer than 10% of encounters.
We do not know why interns do not engage in these simple behaviors, but it is not surprising given that their role models, including hospitalist physicians, do not practice them universally.[10] Personality differences, medical school experiences, and hospital factors such as patient volume and complexity may explain variability in performance.
Importantly, we know that habits learned in residency tend to be retained when physicians enter independent practice.[12] If we want attending physicians to practice etiquette‐based communication, then it must be role modeled, taught, and evaluated during residency by clinical educators and hospitalist physicians. The gap between intern perceptions and actual practice of these behaviors provides a window of opportunity for education and feedback in bedside communication. Attending physicians rate communication skills as 1 of the top values they seek to pass on to house officers.[13] Curricula on communication skills improve physician attitudes and beliefs about the importance of good communication as well as long‐term performance of communication skills.[14]
Our study had several limitations. First, all 732 patient encounters were assessed, regardless of whether the intern had seen the patient previously. This differed slightly from Kahn's assertion that these behaviors be performed at least on the first encounter with the patient. We believe that the need for common courtesy does not diminish after the first visit, and although certain behaviors may not be indicated on 100% of visits, our sensitivity analysis indicated performance of these behaviors was not likely even on the first visit of the day.
Second, our observations were limited to medicine interns at 2 programs in Baltimore during a single month, limiting generalizability. A convenience sample of interns was chosen for recruitment based on rotation on a general medicine rotation during the study month. We observed interns over the course of several shifts and throughout various positions in the call cycle.
Third, in any observational study, the Hawthorne effect is a potential limitation. We attempted to limit this bias by collecting information anonymously and not indicating to the interns which aspects of the patient encounter were being recorded.
Fourth, we defined the behaviors broadly in an attempt to measure the outcomes conservatively and maximize inter‐rater reliability. For instance, we did not differentiate in data collection between comforting touch and physical examination. Because chairs may not be readily available in all patient rooms, we included sitting on the patient's bed or crouching next to the bed as sitting with the patient. Use of open‐ended questions was observed as a more general form of Kahn's recommendation to ask how the patient is feeling.
Fifth, our poststudy survey was conducted 6 months after the observations were performed, used an ordinal rather than continuous response scale, and was limited to only 1 of the 2 programs and 9 of the 29 participants. Given this small sample size, generalizability of the results is limited. Additionally, intern practice of etiquette‐based communication may have improved between the observations and survey that took place 6 months later.
As hospital admissions are a time of vulnerability for patients, physicians can take a basic etiquette‐based communication approach to comfort patients and help them feel more secure. We found that even though interns believed they were practicing Kahn's recommended etiquette‐based communication, only a minority actually were. Curricula on communication styles or environmental changes, such as providing chairs in patient rooms or photographs identifying members of the medical team, may encourage performance of these behaviors.[15]
Acknowledgments
The authors acknowledge Dr. Lisa Cooper, MD, MPH, and Dr. Mary Catherine Beach, MD, MPH, who provided tremendous help in editing. The authors also thank Kevin Wang, whose assistance with observer hiring, training, and management was essential.
Disclosures: The Osler Center for Clinical Excellence at Johns Hopkins and the Johns Hopkins Hospitalist Scholars Fund provided stipends for our observers as well as transportation and logistical costs of the study. The authors report no conflicts of interest.
- , , . Physician‐patient communication in the primary care office: a systematic review. J Am Board Fam Pract. 2002;15:25–38.
- , . Physicians' nonverbal rapport building and patients' talk about the subjective component of illness. Hum Commun Res. 2001;27:299–311.
- , , , , . Can 40 seconds of compassion reduce patient anxiety? J Clin Oncol. 1999;17:371–379.
- , , , . House staff nonverbal communication skills and patient satisfaction. J Gen Intern Med. 2003;18:170–174.
- . Etiquette‐based medicine. N Engl J Med. 2008;358:1988–1989.
- , , . Patient satisfaction associated with correct identification of physician's photographs. Mayo Clin Proc. 2001;76:604–608.
- . Effective physician‐patient communication and health outcomes: a review. CMAJ. 1995;152:1423–1433.
- , , , . Patients' attitudes to comforting touch in family practice. Can Fam Physician. 2000;46:2411–2416.
- , , , et al. Impact of physician sitting versus standing during inpatient oncology consultations: patients' preference and perception of compassion and duration. A randomized controlled trial. J Pain Symptom Manage. 2005;29:489–497.
- , , , , . Appraising the practice of etiquette‐based medicine in the inpatient setting. J Gen Intern Med. 2013;28(7):908–913.
- , , , , , . Ability of hospitalized patients to identify their in‐hospital physicians. Arch Intern Med. 2009;169:199–201.
- , , . The content of internal medicine residency training and its relevance to the practice of medicine. J Gen Intern Med. 1989;4:304–308.
- , . Which values to attending physicians try to pass on to house officers? Med Educ. 2001;35:941–945.
- , , , , , . Relationship of resident characteristics, attitudes, prior training, and clinical knowledge to communication skills performance. Med Educ. 2006;40:18–25.
- , , , . PHACES (Photographs of academic clinicians and their educational status): a tool to improve delivery of family‐centered care. Acad Pediatr. 2010;10:138–145.
Patient‐centered communication may impact several aspects of the patientdoctor relationship including patient disclosure of illness‐related information, patient satisfaction, anxiety, and compliance with medical recommendations.[1, 2, 3, 4] Etiquette‐based medicine, a term coined by Kahn, involves simple patient‐centered communication strategies that convey professionalism and respect to patients.[5] Studies have confirmed that patients prefer physicians who practice etiquette‐based medicine behaviors, including sitting down and introducing one's self.[6, 7, 8, 9] Performance of etiquette‐based medicine is associated with higher Press Ganey patient satisfaction scores. However, these easy‐to‐practice behaviors may not be modeled commonly in the inpatient setting.[10] We sought to understand whether etiquette‐based communication behaviors are practiced by trainees on inpatient medicine rotations.
METHODS
Design
This was a prospective study incorporating direct observation of intern interactions with patients during January 2012 at 2 internal medicine residency programs in Baltimore Maryland, Johns Hopkins Hospital (JHH) and the University of Maryland Medical Center (UMMC). We then surveyed participants from JHH in June 2012 to assess perceptions of their practice of etiquette‐based communication.
Participants and Setting
We observed a convenience sample of 29 internal medicine interns from the 2 institutions. We sought to observe interns over an equal number of hours at both sites and to sample shifts in proportion to the amount of time interns spend on each of these shifts. All interns who were asked to participate in the study agreed and comprised a total of 27% of the 108 interns in the 2 programs. The institutional review board at Johns Hopkins School of Medicine approved the study; the University of Maryland institutional review board deemed it not human subjects research. All observed interns provided informed consent to be observed during 1 to 4 inpatient shifts.
Observers
Twenty‐two undergraduate university students served as the observers for the study and were trained to collect data with the iPod Touch (Apple, Cupertino, CA) without interrupting patient care. We then tested the observers to ensure 85% concordance rate with the researchers in mock observation. Four hours of quality assurance were completed at both institutions during the study. Congruence between observer and research team member was >85% for each hour of observation.
Observation
Observers recorded intern activities on the iPod Touch spreadsheet application. The application allowed for real‐time data entry and direct export of results. The primary dependent variables for this study were 5 behaviors that were assessed each time an intern went into a patient's room. The 5 observed behaviors included (1) introducing one's self, (2) introducing one's role on the medical team, (3) touching the patient, (4) sitting down, and (5) asking the patient at least 1 open‐ended question. These behaviors were chosen for observation because they are central to Kahn's framework of etiquette‐based medicine, applicable to each inpatient encounter, and readily observed by trained nonmedical observers. These behaviors are defined in Table 1. Use of open‐ended questions was observed as a more general form of Kahn's recommendation to ask how the patient is feeling. Interns were not aware of which behaviors were being evaluated.
| Behavior | Definition |
|---|---|
| Introduced self | Providing a name |
| Introduced role | Uses term doctor, resident, intern, or medical team |
| Sat down | Sitting on the bed, in a chair, or crouching if no chair was available during at least part of the encounter |
| Touched the patient | Any form of physical contact that occurred at least once during the encounter including shaking a patient's hand, touching a patient on the shoulder, or performing any part of the physical exam |
| Asked open‐ended question | Asked the patient any question that required more than a yes/no answer |
Each time an observed intern entered a patient room, the observer recorded whether or not each of the 5 behaviors was performed, coded as a dichotomous variable. Although data collection was anonymous, observers recorded the team, hospital site, gender of the intern, and whether the intern was admitting new patients during the shift.
Survey
Following the observational portion of the study, participants at JHH completed a cross‐sectional, anonymous survey that asked them to estimate how frequently they currently performed each of the behaviors observed in this study. Response options included the following categories: <20%, 20% to 40%, 40% to 60%, 60% to 80%, or 80% to 100%.
Data Analysis
We determined the percent of patient visits during which each behavior was performed. Data were analyzed using Student t and [2] tests evaluating differences by hospital, intern gender, type of shift, and time of day. To account for correlation within subjects and observers, we performed multilevel logistic regression analysis adjusted for clustering at the intern and observer levels. For the survey analysis, the mean of the response category was used as the basis for comparison. All quantitative analyses were performed in Excel 2010 (Microsoft Corp., Redmond, WA) and Stata/IC version 11 (StataCorp, College Station, TX).
RESULTS
A total of 732 inpatient encounters were observed during 118 intern shifts. Interns were observed for a mean of 25 patient encounters each (range, 361; standard deviation [SD] 17). Overall, interns introduced themselves 40% of the time and stated their role 37% of the time (Table 2). Interns touched patients on 65% of visits, sat down with patients during 9% of visits, and asked open‐ended questions on 75% of visits. Interns performed all 5 of the behaviors during 4% of the total encounters. The percentage of the 5 behaviors performed by each intern during all observed visits ranged from 24% to 100%, with a mean of 51% (SD 17%) per intern.
| Total Encounters, N (%) | Introduced Self (%) | Introduced Role (%) | Touched Patient (%) | Sat Down (%) | Open‐Ended Question (%) | |
|---|---|---|---|---|---|---|
| ||||||
| Overall | 732 | 40 | 37 | 65 | 9 | 75 |
| JHH | 373 (51) | 35ab | 29ab | 62a | 10 | 70a |
| UMMC | 359 (49) | 45 | 44 | 69 | 8 | 81 |
| Male | 284 (39) | 39 | 35 | 64 | 9 | 74 |
| Female | 448 (61) | 41 | 38 | 67 | 10 | 76 |
| Day shift | 551 (75) | 37a | 34a | 65 | 9 | 77 |
| Night shift | 181 (25) | 48 | 45 | 67 | 12 | 71 |
| Admitting shift | 377 (52) | 46a | 42a | 63 | 10 | 75 |
| Nonadmitting shift | 355 (48) | 34 | 30 | 69 | 9 | 76 |
During night shifts as compared to day shifts, interns were more likely to introduce themselves (48% vs 37%, P=0.01) and their role (45% vs 34%, P<0.01). During shifts in which they admitted patients as compared to coverage shifts, interns were more likely to introduce themselves (46% vs 34%, P<0.01) and their role (42% vs 30%, P<0.01). Interns at UMMC as compared to JHH interns were more likely to introduce themselves (45% vs 35%, P<0.01) and describe their role to patients (44% vs 29%, P<0.01). Interns at UMMC were also more likely to ask open‐ended questions (81% vs 70%, P<0.01) and to touch patients (69% vs 62%, P=0.04). Performance of these behaviors did not vary significantly by gender, time of day, or shift. After adjustment for clustering at the observer and intern levels, differences by institution persisted in the rate of introducing oneself and one's role.
We performed a sensitivity analysis examining the first patient encounters of the day, and found that interns were somewhat more likely to introduce themselves (50% vs 40%, P=0.03) but were not significantly more likely to introduce their role, sit down, ask open‐ended questions, or touch the patient.
Nine of the 10 interns at JHH who participated in the study completed the survey (response rate=90%). Interns estimated introducing themselves and their role and sitting with patients significantly more frequently than was observed (80% vs 40%, P<0.01; 80% vs 37%, P<0.01; and 58% vs 9%, P<0.01, respectively) (Figure 1).
DISCUSSION
The interns we observed in 2 urban academic internal medicine residency programs did not routinely practice etiquette‐based communication. Interns surveyed tended to overestimate their performance of these behaviors. These behaviors are simple to perform and are each associated with improved patient experiences of hospital care. Tackett et al. recently demonstrated that interns are not alone. Hospitalist physicians do not universally practice etiquette‐based medicine, even though these behaviors correlate with patient satisfaction scores.[10]
Introducing oneself to patients may improve patient satisfaction and acceptance of trainee involvement in care.[6] However, only 10% of hospitalized patients in 1 study correctly identified a physician on their inpatient team, demonstrating the need for introductions during each and every inpatient encounter.[11] The interns we observed introduced themselves to patients in only 40% of encounters. During admitting shifts, when the first encounter with a patient likely took place, interns introduced themselves during 46% of encounters.
A comforting touch has been shown to reduce anxiety levels among patients and improve compliance with treatment regimens, but the interns did not touch patients in one‐third of visits, including during admitting shifts. Sixty‐six percent of patients consider a physician's touch comforting, and 58% believe it to be healing.[8]
A randomized trial found that most patients preferred a sitting physician, and believed that practitioners who sat were more compassionate and spent more time with them.[9] Unfortunately, interns sat down with patients in fewer than 10% of encounters.
We do not know why interns do not engage in these simple behaviors, but it is not surprising given that their role models, including hospitalist physicians, do not practice them universally.[10] Personality differences, medical school experiences, and hospital factors such as patient volume and complexity may explain variability in performance.
Importantly, we know that habits learned in residency tend to be retained when physicians enter independent practice.[12] If we want attending physicians to practice etiquette‐based communication, then it must be role modeled, taught, and evaluated during residency by clinical educators and hospitalist physicians. The gap between intern perceptions and actual practice of these behaviors provides a window of opportunity for education and feedback in bedside communication. Attending physicians rate communication skills as 1 of the top values they seek to pass on to house officers.[13] Curricula on communication skills improve physician attitudes and beliefs about the importance of good communication as well as long‐term performance of communication skills.[14]
Our study had several limitations. First, all 732 patient encounters were assessed, regardless of whether the intern had seen the patient previously. This differed slightly from Kahn's assertion that these behaviors be performed at least on the first encounter with the patient. We believe that the need for common courtesy does not diminish after the first visit, and although certain behaviors may not be indicated on 100% of visits, our sensitivity analysis indicated performance of these behaviors was not likely even on the first visit of the day.
Second, our observations were limited to medicine interns at 2 programs in Baltimore during a single month, limiting generalizability. A convenience sample of interns was chosen for recruitment based on rotation on a general medicine rotation during the study month. We observed interns over the course of several shifts and throughout various positions in the call cycle.
Third, in any observational study, the Hawthorne effect is a potential limitation. We attempted to limit this bias by collecting information anonymously and not indicating to the interns which aspects of the patient encounter were being recorded.
Fourth, we defined the behaviors broadly in an attempt to measure the outcomes conservatively and maximize inter‐rater reliability. For instance, we did not differentiate in data collection between comforting touch and physical examination. Because chairs may not be readily available in all patient rooms, we included sitting on the patient's bed or crouching next to the bed as sitting with the patient. Use of open‐ended questions was observed as a more general form of Kahn's recommendation to ask how the patient is feeling.
Fifth, our poststudy survey was conducted 6 months after the observations were performed, used an ordinal rather than continuous response scale, and was limited to only 1 of the 2 programs and 9 of the 29 participants. Given this small sample size, generalizability of the results is limited. Additionally, intern practice of etiquette‐based communication may have improved between the observations and survey that took place 6 months later.
As hospital admissions are a time of vulnerability for patients, physicians can take a basic etiquette‐based communication approach to comfort patients and help them feel more secure. We found that even though interns believed they were practicing Kahn's recommended etiquette‐based communication, only a minority actually were. Curricula on communication styles or environmental changes, such as providing chairs in patient rooms or photographs identifying members of the medical team, may encourage performance of these behaviors.[15]
Acknowledgments
The authors acknowledge Dr. Lisa Cooper, MD, MPH, and Dr. Mary Catherine Beach, MD, MPH, who provided tremendous help in editing. The authors also thank Kevin Wang, whose assistance with observer hiring, training, and management was essential.
Disclosures: The Osler Center for Clinical Excellence at Johns Hopkins and the Johns Hopkins Hospitalist Scholars Fund provided stipends for our observers as well as transportation and logistical costs of the study. The authors report no conflicts of interest.
- , , . Physician‐patient communication in the primary care office: a systematic review. J Am Board Fam Pract. 2002;15:25–38.
- , . Physicians' nonverbal rapport building and patients' talk about the subjective component of illness. Hum Commun Res. 2001;27:299–311.
- , , , , . Can 40 seconds of compassion reduce patient anxiety? J Clin Oncol. 1999;17:371–379.
- , , , . House staff nonverbal communication skills and patient satisfaction. J Gen Intern Med. 2003;18:170–174.
- . Etiquette‐based medicine. N Engl J Med. 2008;358:1988–1989.
- , , . Patient satisfaction associated with correct identification of physician's photographs. Mayo Clin Proc. 2001;76:604–608.
- . Effective physician‐patient communication and health outcomes: a review. CMAJ. 1995;152:1423–1433.
- , , , . Patients' attitudes to comforting touch in family practice. Can Fam Physician. 2000;46:2411–2416.
- , , , et al. Impact of physician sitting versus standing during inpatient oncology consultations: patients' preference and perception of compassion and duration. A randomized controlled trial. J Pain Symptom Manage. 2005;29:489–497.
- , , , , . Appraising the practice of etiquette‐based medicine in the inpatient setting. J Gen Intern Med. 2013;28(7):908–913.
- , , , , , . Ability of hospitalized patients to identify their in‐hospital physicians. Arch Intern Med. 2009;169:199–201.
- , , . The content of internal medicine residency training and its relevance to the practice of medicine. J Gen Intern Med. 1989;4:304–308.
- , . Which values to attending physicians try to pass on to house officers? Med Educ. 2001;35:941–945.
- , , , , , . Relationship of resident characteristics, attitudes, prior training, and clinical knowledge to communication skills performance. Med Educ. 2006;40:18–25.
- , , , . PHACES (Photographs of academic clinicians and their educational status): a tool to improve delivery of family‐centered care. Acad Pediatr. 2010;10:138–145.