User login
A Resident-Led Intervention to Increase Initiation of Buprenorphine Maintenance for Hospitalized Patients With Opioid Use Disorder
Nearly 48,000 Americans died from overdoses involving opioids in 2018, continuing a national crisis that has led to 446,000 deaths since 1999.1 Annually, opioids are responsible for more than 500,000 admissions, approximately 1% of all hospitalizations, costing the United States nearly $15 billion.2,3 Among hospitalized patients, chronic opioid use is associated with increased mortality, severe infectious complications, and higher rates of readmission.4 Opioid use disorder (OUD) is a chronic, relapsing medical condition with biopsychosocial origins and significant morbidity and mortality.5 Opioid agonist therapy (OAT) with buprenorphine or methadone maintenance, the evidence-based standard of treatment, reduces the mortality rate by half, decreases overdoses and hospital readmissions, and improves retention in care.6-10
OAT maintenance refers to using buprenorphine or methadone for long-term treatment of OUD rather than for acute treatment of opioid withdrawal. Despite evidence supporting OAT maintenance, clinicians start medications for only 11% to 15% of hospitalized patients with OUD, depending on practice contexts.11,12 Three significant barriers—stigma, insufficient clinician education, and restrictive regulations—prevent clinicians from starting OAT.13 Clinicians who do not have the Drug Enforcement Administration (DEA)–issued DATA-2000 waiver (X-waiver) for outpatient prescribing can order buprenorphine for admitted patients but cannot prescribe it at discharge.14 In hospitals where they exist, addiction medicine consult services offer primary teams guidance on pharmacotherapy, leading to reduced hospital readmissions and increased engagement in outpatient addiction treatment.15-17 However, in most hospitals around the country, such specialty services do not exist.18 In some hospitals without addiction medicine consult services, hospitalists with expertise in OUD have started assisting primary teams in starting OAT, but to our knowledge, no prior studies have described the impact of these interventions on patients or clinician experience with OAT.19
This quality improvement project aimed to increase the rate at which internal medicine resident teams at Johns Hopkins Hospital (JHH) in Baltimore, Maryland, started hospitalized patients with OUD on buprenorphine maintenance. We hypothesized that resident education and measures to increase the availability of X-waivered physicians would increase the rate of initiating buprenorphine maintenance. We additionally hypothesized that these interventions would increase knowledge about and comfort with buprenorphine across the residency. This represents the first study to examine the effects of clinician education and a team of X-waivered residents and hospitalists who assist in starting buprenorphine maintenance in a hospital without an addiction medicine consult service.
METHODS
Setting
This study took place from July 2018 to June 2019 at JHH, a large, academic, urban hospital in Baltimore. Prior to the intervention, internal medicine residents at JHH commonly used short courses of buprenorphine to treat withdrawal, but they did not have access to hospital-specific resources to assist with starting maintenance OAT. During the study period, JHH had a Substance Use Disorders team staffed by peer recovery specialists that could be consulted by hospitalists and residents to provide psychosocial support and link admitted patients to treatment after discharge. There were no providers on the team to guide pharmacotherapy or to write discharge buprenorphine prescriptions. The Osler Medical Residency Training Program at JHH has 140 internal medicine residents and 16 combined medicine-pediatrics residents. All residents receive 1 hour of formal education about opioid use disorder annually. In addition, 28 of those 156 residents, those in the Urban Health Primary Care track, spend 1 month on an Addiction Medicine rotation in which they complete the 8-hour training required to receive the X-waiver. Those residents are encouraged to apply for the X-waiver once they obtain a medical license subsidized by a Health Resources & Services Administration (HRSA) grant. Four internal medicine attending physicians on teaching services and one resident had X-waivers prior to the intervention.
Intervention
In November 2018, we administered a survey to residents to identify barriers to starting buprenorphine maintenance and to measure knowledge and confidence with using buprenorphine for OUD (Appendix Figure 1 and Figure 2). We focused on buprenorphine because providers at JHH were familiar with this medication and because Baltimore has widespread access to buprenorphine, with more than 490 local buprenorphine providers.20 Five residents piloted the survey and provided feedback. We then administered the survey to all internal medicine and medicine-pediatrics residents. Based on the results, we developed a targeted educational conference and also created the Buprenorphine Bridge Team (BBT).
In January 2019, we presented the educational conference for residents devoted to the use of buprenorphine for OUD and introduced the BBT. The conference started with a patient testimonial and included peer recovery specialists, pharmacists, nurses, and social workers. We summarized the evidence for buprenorphine and offered a practical guide to start treatment in a one-page protocol. This protocol included guidance on selecting patients, shared decision-making around OUD treatment, avoiding precipitated withdrawal, dosing buprenorphine, and establishing follow-up (Appendix Figure 3). We asked for input on this protocol from nursing leadership, social work teams, and peer recovery specialists. Dosing was adapted from the Guidelines from the American Society of Addiction Medicine, with expert input from physicians from the Addiction Medicine Consult service at Johns Hopkins Bayview Medical Center, also in Baltimore.5 We instructed residents to obtain discharge buprenorphine prescriptions from an X-waivered physician on their team or from the newly established BBT. We asked resident teams to set up a postdischarge appointment for patients with an X-waivered provider, either in a community practice or at the JHH After Care Clinic, a transitional care clinic for discharged patients.21
The BBT is a resident-led group of X-waivered JHH residents and hospitalists who volunteer to write discharge buprenorphine prescriptions for patients. The BBT serves to ensure primary teams have access to an X-waivered prescriber. It is not a consult service. We asked primary teams to contact the BBT after initiating buprenorphine and after securing a follow-up appointment. In response to each request, a member of the BBT reviews the patient chart, confirms the follow-up plan, writes a prescription for buprenorphine along with intranasal naloxone, and leaves a brief note. During the 6-month postintervention period, the team consisted of three residents and three hospitalist attendings. Each week, two members (residents or attendings) staffed the team Monday to Friday, 8
In May 2019, 5 months after the education session and implementation of the BBT, we administered a follow-up survey.
Outcomes
As a secondary outcome, we measured engagement in OUD treatment after discharge by calculating the proportion of patients started on buprenorphine who filled a buprenorphine prescription within 30 days after discharge. We chose 30 days based on the National Committee for Quality Assurance’s Healthcare Effectiveness Data and Information Set (HEDIS) measure for engagement of treatment for alcohol and other drugs.23 We obtained the data from the Chesapeake Regional Information System for our Patients (CRISP) Prescription Drug Monitoring Program, which monitors all prescriptions for controlled substances dispensed in Maryland and five neighboring states. As a balancing measure, we counted patients newly started on methadone maintenance for OUD before and after the intervention. Additional secondary process outcomes included frequency of BBT requests, the volume of buprenorphine prescriptions written by the team, and time required to complete a BBT request.
Clinician-level outcomes, measured with electronically administered pre- and postintervention surveys to residents, included knowledge about and comfort with buprenorphine. Of the 16 questions in the pre- and postimplementation surveys, we analyzed the 6 questions concerning knowledge and comfort that remained identical in the pre- and postintervention surveys and used 5-point Likert scale responses. As an incentive, we randomly distributed three $50 gift cards to survey completers.
Analysis
We used an interrupted time series analysis to evaluate the association between the intervention bundle and a change in the rate that medical teams started patients with OUD on buprenorphine maintenance. This approach allowed us to control for preintervention trends. To evaluate the impact of our interventions, our pre- and postintervention periods include the same residents during the 2018-2019 academic year. Both periods consisted of twelve 2-week intervals (preintervention: July 26, 2019, to January 9, 2019; postintervention: January 10, 2019, to June 26, 2019).
To evaluate for changes in engagement in OUD treatment after discharge, we used two-sample t tests. To evaluate for changes in resident-reported comfort and knowledge with initiating buprenorphine maintenance, we used Wilcoxon rank sum tests for survey data and Wilcoxon signed rank tests for paired data. All analyses employed two-sided P values with statistical significance evaluated at the .05 alpha level. We analyzed data using R version 3.6.3 (Foundation for Statistical Computing). The Institutional Review Board at JHH reviewed and approved the study protocol as a quality improvement project (IRB00193365).

Before the intervention, 13 of the 30 patients (40%) newly started on buprenorphine maintenance during their admission filled a follow-up buprenorphine prescription within 30 days of discharge. After the intervention, 31 of 64 patients (46%) filled a buprenorphine prescription within 30 days (P = .612). Two patients were started on methadone maintenance, one prior to and one after the intervention.
During the 6-month postintervention period, the BBT received 75 requests and wrote 70 prescriptions for buprenorphine. The median time required to complete a BBT request was 15 minutes (minimum, 5 minutes; maximum, 60 minutes).
Of 156 internal medicine and medicine-pediatrics residents, 89 residents (57%) completed the baseline survey and 66 residents (42%) completed the follow-up survey. Forty residents completed both surveys. After the intervention, residents were significantly more likely to feel comfortable dosing buprenorphine (P < .0001) and counseling patients about its use (P = .0237) and were more likely to report ease of establishing follow-up (P < .0001). Self-reported knowledge about preventing precipitated withdrawal increased significantly (P = .0191), as did knowledge about the effectiveness of buprenorphine (P = .0003) independent of formal drug counseling (P = .0066) (Table). Paired survey data also found statistically significant results for all questions except those about preventing precipitated withdrawal and efficacy. For the latter, respondents who completed both surveys were more knowledgeable before the intervention than the overall group that completed the baseline survey (Appendix Table).

This study shows how a resident-led quality improvement project comprising clinician education and implementation of a novel BBT was associated with an increased rate of starting buprenorphine maintenance in hospitalized patients with OUD and improved resident knowledge about and comfort with buprenorphine. To our knowledge, this is the first study demonstrating how education and a team of X-waivered generalists can help primary teams initiate and discharge patients on buprenorphine maintenance in a hospital without an addiction medicine consult service.
Prior to the intervention, resident internal medicine teams at JHH started 10% of hospitalized patients with OUD on buprenorphine maintenance, consistent with prior studies showing rates of 11% to 15% for initiating OAT for hospitalized patients.11,12 After the intervention, the rate of initiating buprenorphine maintenance more than doubled, rising to 24% of eligible patients. Resident internal medicine teams at JHH started buprenorphine maintenance for 37 more patients over the 24-week postintervention period than would have been predicted prior to the intervention, or an additional three patients every 2 weeks.
Between 40% and 46% of hospitalized patients newly started on buprenorphine maintenance filled an outpatient buprenorphine prescription within 30 days of discharge. We are not aware of comparative data for 30-day follow-up for hospitalized patients newly started on buprenorphine maintenance. Data from other contexts show 5% to 10% of veterans were engaged in addiction treatment 30 days after initiation from inpatient or outpatient encounters. An analysis of an academic medical center in Oregon found engagement with an addiction medicine consult service increased after hospital engagement for patients with any substance use disorder from 23% to 39% using the 34-day HEDIS measure for engagement.17,24,25
The BBT required approximately 15 minutes per request and wrote an average of three prescriptions per week, demonstrating the feasibility of this approach and the high demand for this service. One strength of our approach is that residents gained experience starting buprenorphine independently using the aforementioned protocol instead of deferring to a full consult service. It is likely that this resident engagement in initiating longitudinal OUD care contributed to the success of this initiative, as did existing resident familiarity with using buprenorphine for opioid withdrawal.
This approach to resident education—promoting direct, first-person experience with medications in a clinical context—aligns with recommendations from a recent review about substance use disorder education for health professionals.26 Our interventions increased resident knowledge and comfort with buprenorphine, consistent with prior studies showing increased resident confidence in management of substance use disorders after curricular innovations.24,25
A few contextual features were essential for this project’s viability. Maryland allows American medical graduates to obtain a medical license after 1 year of postgraduate training. This allowed three residents to obtain X-waivers. These residents had access to HRSA funding to subsidize the expenses of applying for state licensure and DEA registration. BBT members volunteered their time while working on other services. Last, we were able to take advantage of buprenorphine-providing clinics in Baltimore, including the JHH After Care Clinic, to accept patients for follow-up appointments after discharge.
Limitations
The BBT required motivated clinicians willing to volunteer for additional clinical responsibilities during inpatient rotations and supportive faculty and residency leadership. Attending physicians, nurse practitioners, or physician assistants could staff a similar BBT in hospitals without residents or in hospitals where residents cannot obtain DEA registration. Crucially, other hospitals may not have access to practices with X-waivered physicians for outpatient follow-up. A recent study found X-waivered primary care physicians were less likely to be affiliated with hospital health systems. Other studies have shown limitations in access to buprenorphine at the county level based on geography and racial/ethnic segregation.27-29
Most patients hospitalized with OUD did not have ICD-10 codes associated with OUD. We addressed this by assuming patients had OUD if buprenorphine or methadone was ordered during their hospitalization, even if the medication was never administered. This may have overcounted patients prescribed these medications for indications other than OUD, and it may have undercounted patients with OUD for whom buprenorphine or methadone were never considered. The opioid withdrawal order set at JHH automatically offers an option to use buprenorphine to treat withdrawal. Patients with OUD for whom buprenorphine or methadone were never ordered likely did not experience withdrawal or were in withdrawal so mild that it escaped the attention of the team, which limits the generalizability of our intervention.
We identified several limitations to the internal validity of our study. First, we used a before-and-after study design without a control group. We could not ethically withhold access to evidence-based, mortality-reducing medications from patients. Without a control group, we cannot rule out the possibility that underlying temporal trends made residents more likely to start buprenorphine maintenance independent of our intervention. We attempted to control for unmeasured confounders by using an interrupted time series analysis to control for preintervention trends, comparing the same group of residents before and after our interventions, and selecting an intervention period during which residents were given only educational sessions and materials provided by our team. Our results may be biased by clustered data because certain residents may have been more likely to initiate buprenorphine, but these effects are likely marginal because resident schedules are balanced between outpatient and inpatient rotations during each 6-month period.
Finally, this project focused on buprenorphine, not on other medications for OUD, including methadone or naltrexone, or nonpharmacologic treatments for OUD.
Sustainability and Next Steps
Since the start of the BBT in January 2019, five additional PGY-2 residents obtained their medical licenses and X-waivers. These residents, with the support of two attending hospitalists, led the BBT and coordinated education sessions that were incorporated into the curriculum during the 2019-2020 academic year. These educational sessions will continue indefinitely. In 2020, JHH started an Addiction Medicine Consult Service staffed by physicians, NPs, and a pharmacist. The BBT continues to operate in conjunction with this service.
We found substantial variability in the rate of buprenorphine maintenance initiation despite our interventions. This is an area for future improvement. In a free-response prompt in our follow-up survey, residents requested additional education sessions and an order set to assist with initiation of buprenorphine. To address these gaps, three educational sessions were added, one of which included education on starting methadone maintenance therapy. We also added a new order set for starting buprenorphine maintenance. We hypothesize that these interventions will improve consistency.
In order for a similar program to be disseminated to other institutions, educational initiatives and a team of dedicated X-waivered prescribers are key. Materials to assist with this process are available in the Appendix.
CONCLUSION
This study shows how a resident-led intervention comprising clinician education and a team of X-waivered generalists was associated with improved treatment of OUD for hospitalized patients. We encourage residents and all clinicians at other hospitals without addiction medicine consult services to design, implement, and study similar interventions that directly increase the use of buprenorphine or methadone maintenance to treat OUD.
Preliminary results from this project were presented at the AMERSA National Conference on November 7, 2019.
1. Wilson N, Kariisa M, Seth P, Iv HS, Davis NL. Drug and opioid-involved overdose deaths – United States, 2017–2018. MMWR Morb Mortal Wkly Rep. 2020;69(11):290-297. http://dx.doi.org/10.15585/mmwr.mm6911a4
2. Berk J, Rogers KM, Wilson DJ, Thakrar A, Feldman L. Missed opportunities for treatment of opioid use disorder in the hospital setting: updating an outdated policy. J Hosp Med. 2020;15(10):619-621. https://doi.org/10.12788/jhm.3352
3. Ronan MV, Herzig SJ. Hospitalizations related to opioid abuse/dependence and associated serious infections increased sharply, 2002–12. Health Aff (Millwood). 2016;35(5):832-837. https://doi.org/10.1377/hlthaff.2015.1424
4. Mosher HJ, Jiang L, Vaughan Sarrazin MS, Cram P, Kaboli PJ, Vander Weg MW. Prevalence and characteristics of hospitalized adults on chronic opioid therapy. J Hosp Med. 2014;9(2):82-87. https://doi.org/10.1002/jhm.2113
5. Crotty K, Freedman KI, Kampman KM. Executive summary of the focused update of the ASAM national practice guideline for the treatment of opioid use disorder. J Addict Med. 2020;14(2):99-112. https://doi.org/10.1097/adm.0000000000000635
6. Leshner AI, Mancher M, eds. Medications for Opioid Use Disorder Save Lives. The National Academies Press; 2019. https://www.nap.edu/catalog/25310
7. Sordo L, Barrio G, Bravo MJ, et al. Mortality risk during and after opioid substitution treatment: systematic review and meta-analysis of cohort studies. BMJ. 2017;357: j1550. https://doi.org/10.1136/bmj.j1550
8. Larochelle MR, Bernson D, Land T, et al. Medication for opioid use disorder after nonfatal opioid overdose and association with mortality. Ann Intern Med. 2018;169(3):137-145. https://dx.doi.org/10.7326%2FM17-3107
9. Schuckit MA. Treatment of opioid-use disorders. N Engl J Med. 2016;375(4):357-368. https://doi.org/10.1056/nejmra1604339
10. Moreno JL, Wakeman SE, Duprey MS, Roberts RJ, Jacobson JS, Devlin JW. Predictors for 30-day and 90-day hospital readmission among patients with opioid use disorder. J Addict Med. 2019;13(4):306-313. https://doi.org/10.1097/adm.0000000000000499
11. Rosenthal ES, Karchmer AW, Theisen-Toupal J, Castillo RA, Rowley CF. Suboptimal addiction interventions for patients hospitalized with injection drug use-associated infective endocarditis. Am J Med. 2016;129(5):481-485. https://doi.org/10.1016/j.amjmed.2015.09.024
12. Priest KC, Lovejoy TI, Englander H, Shull S, McCarty D. Opioid agonist therapy during hospitalization within the Veterans Health Administration: a pragmatic retrospective cohort analysis. J Gen Intern Med. 2020;35(8):2365-2374. https://doi.org/10.1007/s11606-020-05815-0
13. Madras BK, Ahmad NJ, Wen J, Sharfstein J; Prevention, Treatment, and Recovery Working Group of the Action Collaborative on Countering the U.S. Opioid Epidemic. Improving access to evidence-based medical treatment for opioid use disorder: strategies to address key barriers within the treatment system. NAM Perspectives. April 27, 2020. https://doi.org/10.31478/202004b
14. Fiscella K, Wakeman SE, Beletsky L. Buprenorphine deregulation and mainstreaming treatment for opioid use disorder: x the X Waiver. JAMA Psychiatry. 2019;76(3):229-230. https://doi.org/10.1001/jamapsychiatry.2018.3685
15. Priest KC, McCarty D. Role of the hospital in the 21st century opioid overdose epidemic: the addiction medicine consult service. J Addict Med. 2019;13(2):104-112. https://doi.org/10.1097/adm.0000000000000496
16. Weimer M, Morford K, Donroe J. Treatment of opioid use disorder in the acute hospital setting: a critical review of the literature (2014–2019). Curr Addict Rep. 2019;6(4):339-354.
17. Englander H, Dobbertin K, Lind BK, et al. Inpatient addiction medicine consultation and post-hospital substance use disorder treatment engagement: a propensity-matched analysis. J Gen Intern Med. 2019;34(12):2796-2803. https://doi.org/10.1007/s11606-019-05251-9
18. Englander H, Priest KC, Snyder H, Martin M, Calcaterra S, Gregg J. A call to action: hospitalists’ role in addressing substance use disorder. J Hosp Med. 2019;14(3):E1-E4. https://doi.org/10.12788/jhm.3311
19. Bottner R, Moriates C, Tirado C. The role of hospitalists in treating opioid use disorder. J Addict Med. 2020;14(2):178. https://doi.org/10.1097/adm.0000000000000545
20. Behavioral health treatment services locator. Substance Abuse and Mental Health Services Administration. Accessed May 14, 2020. https://findtreatment.samhsa.gov/
21. Groesbeck K, Whiteman LN, Stewart RW. Reducing readmission rates by improving transitional care. South Med J. 2015;108(12):758-760. https://doi.org/10.14423/smj.0000000000000376
22. Heslin KC, Owens PL, Karaca Z, Barrett ML, Moore BJ, Elixhauser A. Trends in opioid-related inpatient stays shifted after the US transitioned to ICD-10-CM diagnosis coding in 2015 Med Care. 2017;55(11):918-923. https://doi.org/10.1097/mlr.0000000000000805
23. Initiation and engagement of alcohol and other drug abuse or dependence treatment (IET). NCQA. Accessed April 20, 2020. https://www.ncqa.org/hedis/measures/initiation-and-engagement-of-alcohol-and-other-drug-abuse-or-dependence-treatment/
24. Wyse JJ, Robbins JL, McGinnis KA, et al. Predictors of timely opioid agonist treatment initiation among veterans with and without HIV. Drug Alcohol Depend. 2019;198:70-75. https://doi.org/10.1016/j.drugalcdep.2019.01.038
25. Harris AHS, Humphreys K, Finney JW. Veterans Affairs facility performance on Washington Circle indicators and casemix-adjusted effectiveness. J Subst Abuse Treat. 2007;33(4):333-339. https://doi.org/10.1016/j.jsat.2006.12.015
26. Muzyk A, Smothers ZPW, Andolsek KM, et al. Interprofessional substance use disorder education in health professions education programs: a scoping review. Acad Med. 2020;95(3):470-480. https://doi.org/10.1097/acm.0000000000003053
27. Saloner B, Lin L, Simon K. Geographic location of buprenorphine-waivered physicians and integration with health systems. J Subst Abuse Treat. 2020;115:108034. https://doi.org/10.1016/j.jsat.2020.108034
28. Jones CW, Christman Z, Smith CM, et al. Comparison between buprenorphine provider availability and opioid deaths among US counties. J Subst Abuse Treat. 2018;93:19-25. https://doi.org/10.1016/j.jsat.2018.07.008
29. Goedel WC, Shapiro A, Cerdá M, Tsai JW, Hadland SE, Marshall BDL. Association of racial/ethnic segregation with treatment capacity for opioid use disorder in counties in the United States. JAMA Netw Open. 2020;3(4):e203711. https://doi.org/10.1001/jamanetworkopen.2020.3711
Nearly 48,000 Americans died from overdoses involving opioids in 2018, continuing a national crisis that has led to 446,000 deaths since 1999.1 Annually, opioids are responsible for more than 500,000 admissions, approximately 1% of all hospitalizations, costing the United States nearly $15 billion.2,3 Among hospitalized patients, chronic opioid use is associated with increased mortality, severe infectious complications, and higher rates of readmission.4 Opioid use disorder (OUD) is a chronic, relapsing medical condition with biopsychosocial origins and significant morbidity and mortality.5 Opioid agonist therapy (OAT) with buprenorphine or methadone maintenance, the evidence-based standard of treatment, reduces the mortality rate by half, decreases overdoses and hospital readmissions, and improves retention in care.6-10
OAT maintenance refers to using buprenorphine or methadone for long-term treatment of OUD rather than for acute treatment of opioid withdrawal. Despite evidence supporting OAT maintenance, clinicians start medications for only 11% to 15% of hospitalized patients with OUD, depending on practice contexts.11,12 Three significant barriers—stigma, insufficient clinician education, and restrictive regulations—prevent clinicians from starting OAT.13 Clinicians who do not have the Drug Enforcement Administration (DEA)–issued DATA-2000 waiver (X-waiver) for outpatient prescribing can order buprenorphine for admitted patients but cannot prescribe it at discharge.14 In hospitals where they exist, addiction medicine consult services offer primary teams guidance on pharmacotherapy, leading to reduced hospital readmissions and increased engagement in outpatient addiction treatment.15-17 However, in most hospitals around the country, such specialty services do not exist.18 In some hospitals without addiction medicine consult services, hospitalists with expertise in OUD have started assisting primary teams in starting OAT, but to our knowledge, no prior studies have described the impact of these interventions on patients or clinician experience with OAT.19
This quality improvement project aimed to increase the rate at which internal medicine resident teams at Johns Hopkins Hospital (JHH) in Baltimore, Maryland, started hospitalized patients with OUD on buprenorphine maintenance. We hypothesized that resident education and measures to increase the availability of X-waivered physicians would increase the rate of initiating buprenorphine maintenance. We additionally hypothesized that these interventions would increase knowledge about and comfort with buprenorphine across the residency. This represents the first study to examine the effects of clinician education and a team of X-waivered residents and hospitalists who assist in starting buprenorphine maintenance in a hospital without an addiction medicine consult service.
METHODS
Setting
This study took place from July 2018 to June 2019 at JHH, a large, academic, urban hospital in Baltimore. Prior to the intervention, internal medicine residents at JHH commonly used short courses of buprenorphine to treat withdrawal, but they did not have access to hospital-specific resources to assist with starting maintenance OAT. During the study period, JHH had a Substance Use Disorders team staffed by peer recovery specialists that could be consulted by hospitalists and residents to provide psychosocial support and link admitted patients to treatment after discharge. There were no providers on the team to guide pharmacotherapy or to write discharge buprenorphine prescriptions. The Osler Medical Residency Training Program at JHH has 140 internal medicine residents and 16 combined medicine-pediatrics residents. All residents receive 1 hour of formal education about opioid use disorder annually. In addition, 28 of those 156 residents, those in the Urban Health Primary Care track, spend 1 month on an Addiction Medicine rotation in which they complete the 8-hour training required to receive the X-waiver. Those residents are encouraged to apply for the X-waiver once they obtain a medical license subsidized by a Health Resources & Services Administration (HRSA) grant. Four internal medicine attending physicians on teaching services and one resident had X-waivers prior to the intervention.
Intervention
In November 2018, we administered a survey to residents to identify barriers to starting buprenorphine maintenance and to measure knowledge and confidence with using buprenorphine for OUD (Appendix Figure 1 and Figure 2). We focused on buprenorphine because providers at JHH were familiar with this medication and because Baltimore has widespread access to buprenorphine, with more than 490 local buprenorphine providers.20 Five residents piloted the survey and provided feedback. We then administered the survey to all internal medicine and medicine-pediatrics residents. Based on the results, we developed a targeted educational conference and also created the Buprenorphine Bridge Team (BBT).
In January 2019, we presented the educational conference for residents devoted to the use of buprenorphine for OUD and introduced the BBT. The conference started with a patient testimonial and included peer recovery specialists, pharmacists, nurses, and social workers. We summarized the evidence for buprenorphine and offered a practical guide to start treatment in a one-page protocol. This protocol included guidance on selecting patients, shared decision-making around OUD treatment, avoiding precipitated withdrawal, dosing buprenorphine, and establishing follow-up (Appendix Figure 3). We asked for input on this protocol from nursing leadership, social work teams, and peer recovery specialists. Dosing was adapted from the Guidelines from the American Society of Addiction Medicine, with expert input from physicians from the Addiction Medicine Consult service at Johns Hopkins Bayview Medical Center, also in Baltimore.5 We instructed residents to obtain discharge buprenorphine prescriptions from an X-waivered physician on their team or from the newly established BBT. We asked resident teams to set up a postdischarge appointment for patients with an X-waivered provider, either in a community practice or at the JHH After Care Clinic, a transitional care clinic for discharged patients.21
The BBT is a resident-led group of X-waivered JHH residents and hospitalists who volunteer to write discharge buprenorphine prescriptions for patients. The BBT serves to ensure primary teams have access to an X-waivered prescriber. It is not a consult service. We asked primary teams to contact the BBT after initiating buprenorphine and after securing a follow-up appointment. In response to each request, a member of the BBT reviews the patient chart, confirms the follow-up plan, writes a prescription for buprenorphine along with intranasal naloxone, and leaves a brief note. During the 6-month postintervention period, the team consisted of three residents and three hospitalist attendings. Each week, two members (residents or attendings) staffed the team Monday to Friday, 8
In May 2019, 5 months after the education session and implementation of the BBT, we administered a follow-up survey.
Outcomes
As a secondary outcome, we measured engagement in OUD treatment after discharge by calculating the proportion of patients started on buprenorphine who filled a buprenorphine prescription within 30 days after discharge. We chose 30 days based on the National Committee for Quality Assurance’s Healthcare Effectiveness Data and Information Set (HEDIS) measure for engagement of treatment for alcohol and other drugs.23 We obtained the data from the Chesapeake Regional Information System for our Patients (CRISP) Prescription Drug Monitoring Program, which monitors all prescriptions for controlled substances dispensed in Maryland and five neighboring states. As a balancing measure, we counted patients newly started on methadone maintenance for OUD before and after the intervention. Additional secondary process outcomes included frequency of BBT requests, the volume of buprenorphine prescriptions written by the team, and time required to complete a BBT request.
Clinician-level outcomes, measured with electronically administered pre- and postintervention surveys to residents, included knowledge about and comfort with buprenorphine. Of the 16 questions in the pre- and postimplementation surveys, we analyzed the 6 questions concerning knowledge and comfort that remained identical in the pre- and postintervention surveys and used 5-point Likert scale responses. As an incentive, we randomly distributed three $50 gift cards to survey completers.
Analysis
We used an interrupted time series analysis to evaluate the association between the intervention bundle and a change in the rate that medical teams started patients with OUD on buprenorphine maintenance. This approach allowed us to control for preintervention trends. To evaluate the impact of our interventions, our pre- and postintervention periods include the same residents during the 2018-2019 academic year. Both periods consisted of twelve 2-week intervals (preintervention: July 26, 2019, to January 9, 2019; postintervention: January 10, 2019, to June 26, 2019).
To evaluate for changes in engagement in OUD treatment after discharge, we used two-sample t tests. To evaluate for changes in resident-reported comfort and knowledge with initiating buprenorphine maintenance, we used Wilcoxon rank sum tests for survey data and Wilcoxon signed rank tests for paired data. All analyses employed two-sided P values with statistical significance evaluated at the .05 alpha level. We analyzed data using R version 3.6.3 (Foundation for Statistical Computing). The Institutional Review Board at JHH reviewed and approved the study protocol as a quality improvement project (IRB00193365).
Before the intervention, 13 of the 30 patients (40%) newly started on buprenorphine maintenance during their admission filled a follow-up buprenorphine prescription within 30 days of discharge. After the intervention, 31 of 64 patients (46%) filled a buprenorphine prescription within 30 days (P = .612). Two patients were started on methadone maintenance, one prior to and one after the intervention.
During the 6-month postintervention period, the BBT received 75 requests and wrote 70 prescriptions for buprenorphine. The median time required to complete a BBT request was 15 minutes (minimum, 5 minutes; maximum, 60 minutes).
Of 156 internal medicine and medicine-pediatrics residents, 89 residents (57%) completed the baseline survey and 66 residents (42%) completed the follow-up survey. Forty residents completed both surveys. After the intervention, residents were significantly more likely to feel comfortable dosing buprenorphine (P < .0001) and counseling patients about its use (P = .0237) and were more likely to report ease of establishing follow-up (P < .0001). Self-reported knowledge about preventing precipitated withdrawal increased significantly (P = .0191), as did knowledge about the effectiveness of buprenorphine (P = .0003) independent of formal drug counseling (P = .0066) (Table). Paired survey data also found statistically significant results for all questions except those about preventing precipitated withdrawal and efficacy. For the latter, respondents who completed both surveys were more knowledgeable before the intervention than the overall group that completed the baseline survey (Appendix Table).
This study shows how a resident-led quality improvement project comprising clinician education and implementation of a novel BBT was associated with an increased rate of starting buprenorphine maintenance in hospitalized patients with OUD and improved resident knowledge about and comfort with buprenorphine. To our knowledge, this is the first study demonstrating how education and a team of X-waivered generalists can help primary teams initiate and discharge patients on buprenorphine maintenance in a hospital without an addiction medicine consult service.
Prior to the intervention, resident internal medicine teams at JHH started 10% of hospitalized patients with OUD on buprenorphine maintenance, consistent with prior studies showing rates of 11% to 15% for initiating OAT for hospitalized patients.11,12 After the intervention, the rate of initiating buprenorphine maintenance more than doubled, rising to 24% of eligible patients. Resident internal medicine teams at JHH started buprenorphine maintenance for 37 more patients over the 24-week postintervention period than would have been predicted prior to the intervention, or an additional three patients every 2 weeks.
Between 40% and 46% of hospitalized patients newly started on buprenorphine maintenance filled an outpatient buprenorphine prescription within 30 days of discharge. We are not aware of comparative data for 30-day follow-up for hospitalized patients newly started on buprenorphine maintenance. Data from other contexts show 5% to 10% of veterans were engaged in addiction treatment 30 days after initiation from inpatient or outpatient encounters. An analysis of an academic medical center in Oregon found engagement with an addiction medicine consult service increased after hospital engagement for patients with any substance use disorder from 23% to 39% using the 34-day HEDIS measure for engagement.17,24,25
The BBT required approximately 15 minutes per request and wrote an average of three prescriptions per week, demonstrating the feasibility of this approach and the high demand for this service. One strength of our approach is that residents gained experience starting buprenorphine independently using the aforementioned protocol instead of deferring to a full consult service. It is likely that this resident engagement in initiating longitudinal OUD care contributed to the success of this initiative, as did existing resident familiarity with using buprenorphine for opioid withdrawal.
This approach to resident education—promoting direct, first-person experience with medications in a clinical context—aligns with recommendations from a recent review about substance use disorder education for health professionals.26 Our interventions increased resident knowledge and comfort with buprenorphine, consistent with prior studies showing increased resident confidence in management of substance use disorders after curricular innovations.24,25
A few contextual features were essential for this project’s viability. Maryland allows American medical graduates to obtain a medical license after 1 year of postgraduate training. This allowed three residents to obtain X-waivers. These residents had access to HRSA funding to subsidize the expenses of applying for state licensure and DEA registration. BBT members volunteered their time while working on other services. Last, we were able to take advantage of buprenorphine-providing clinics in Baltimore, including the JHH After Care Clinic, to accept patients for follow-up appointments after discharge.
Limitations
The BBT required motivated clinicians willing to volunteer for additional clinical responsibilities during inpatient rotations and supportive faculty and residency leadership. Attending physicians, nurse practitioners, or physician assistants could staff a similar BBT in hospitals without residents or in hospitals where residents cannot obtain DEA registration. Crucially, other hospitals may not have access to practices with X-waivered physicians for outpatient follow-up. A recent study found X-waivered primary care physicians were less likely to be affiliated with hospital health systems. Other studies have shown limitations in access to buprenorphine at the county level based on geography and racial/ethnic segregation.27-29
Most patients hospitalized with OUD did not have ICD-10 codes associated with OUD. We addressed this by assuming patients had OUD if buprenorphine or methadone was ordered during their hospitalization, even if the medication was never administered. This may have overcounted patients prescribed these medications for indications other than OUD, and it may have undercounted patients with OUD for whom buprenorphine or methadone were never considered. The opioid withdrawal order set at JHH automatically offers an option to use buprenorphine to treat withdrawal. Patients with OUD for whom buprenorphine or methadone were never ordered likely did not experience withdrawal or were in withdrawal so mild that it escaped the attention of the team, which limits the generalizability of our intervention.
We identified several limitations to the internal validity of our study. First, we used a before-and-after study design without a control group. We could not ethically withhold access to evidence-based, mortality-reducing medications from patients. Without a control group, we cannot rule out the possibility that underlying temporal trends made residents more likely to start buprenorphine maintenance independent of our intervention. We attempted to control for unmeasured confounders by using an interrupted time series analysis to control for preintervention trends, comparing the same group of residents before and after our interventions, and selecting an intervention period during which residents were given only educational sessions and materials provided by our team. Our results may be biased by clustered data because certain residents may have been more likely to initiate buprenorphine, but these effects are likely marginal because resident schedules are balanced between outpatient and inpatient rotations during each 6-month period.
Finally, this project focused on buprenorphine, not on other medications for OUD, including methadone or naltrexone, or nonpharmacologic treatments for OUD.
Sustainability and Next Steps
Since the start of the BBT in January 2019, five additional PGY-2 residents obtained their medical licenses and X-waivers. These residents, with the support of two attending hospitalists, led the BBT and coordinated education sessions that were incorporated into the curriculum during the 2019-2020 academic year. These educational sessions will continue indefinitely. In 2020, JHH started an Addiction Medicine Consult Service staffed by physicians, NPs, and a pharmacist. The BBT continues to operate in conjunction with this service.
We found substantial variability in the rate of buprenorphine maintenance initiation despite our interventions. This is an area for future improvement. In a free-response prompt in our follow-up survey, residents requested additional education sessions and an order set to assist with initiation of buprenorphine. To address these gaps, three educational sessions were added, one of which included education on starting methadone maintenance therapy. We also added a new order set for starting buprenorphine maintenance. We hypothesize that these interventions will improve consistency.
In order for a similar program to be disseminated to other institutions, educational initiatives and a team of dedicated X-waivered prescribers are key. Materials to assist with this process are available in the Appendix.
CONCLUSION
This study shows how a resident-led intervention comprising clinician education and a team of X-waivered generalists was associated with improved treatment of OUD for hospitalized patients. We encourage residents and all clinicians at other hospitals without addiction medicine consult services to design, implement, and study similar interventions that directly increase the use of buprenorphine or methadone maintenance to treat OUD.
Preliminary results from this project were presented at the AMERSA National Conference on November 7, 2019.
1. Wilson N, Kariisa M, Seth P, Iv HS, Davis NL. Drug and opioid-involved overdose deaths – United States, 2017–2018. MMWR Morb Mortal Wkly Rep. 2020;69(11):290-297. http://dx.doi.org/10.15585/mmwr.mm6911a4
2. Berk J, Rogers KM, Wilson DJ, Thakrar A, Feldman L. Missed opportunities for treatment of opioid use disorder in the hospital setting: updating an outdated policy. J Hosp Med. 2020;15(10):619-621. https://doi.org/10.12788/jhm.3352
3. Ronan MV, Herzig SJ. Hospitalizations related to opioid abuse/dependence and associated serious infections increased sharply, 2002–12. Health Aff (Millwood). 2016;35(5):832-837. https://doi.org/10.1377/hlthaff.2015.1424
4. Mosher HJ, Jiang L, Vaughan Sarrazin MS, Cram P, Kaboli PJ, Vander Weg MW. Prevalence and characteristics of hospitalized adults on chronic opioid therapy. J Hosp Med. 2014;9(2):82-87. https://doi.org/10.1002/jhm.2113
5. Crotty K, Freedman KI, Kampman KM. Executive summary of the focused update of the ASAM national practice guideline for the treatment of opioid use disorder. J Addict Med. 2020;14(2):99-112. https://doi.org/10.1097/adm.0000000000000635
6. Leshner AI, Mancher M, eds. Medications for Opioid Use Disorder Save Lives. The National Academies Press; 2019. https://www.nap.edu/catalog/25310
7. Sordo L, Barrio G, Bravo MJ, et al. Mortality risk during and after opioid substitution treatment: systematic review and meta-analysis of cohort studies. BMJ. 2017;357: j1550. https://doi.org/10.1136/bmj.j1550
8. Larochelle MR, Bernson D, Land T, et al. Medication for opioid use disorder after nonfatal opioid overdose and association with mortality. Ann Intern Med. 2018;169(3):137-145. https://dx.doi.org/10.7326%2FM17-3107
9. Schuckit MA. Treatment of opioid-use disorders. N Engl J Med. 2016;375(4):357-368. https://doi.org/10.1056/nejmra1604339
10. Moreno JL, Wakeman SE, Duprey MS, Roberts RJ, Jacobson JS, Devlin JW. Predictors for 30-day and 90-day hospital readmission among patients with opioid use disorder. J Addict Med. 2019;13(4):306-313. https://doi.org/10.1097/adm.0000000000000499
11. Rosenthal ES, Karchmer AW, Theisen-Toupal J, Castillo RA, Rowley CF. Suboptimal addiction interventions for patients hospitalized with injection drug use-associated infective endocarditis. Am J Med. 2016;129(5):481-485. https://doi.org/10.1016/j.amjmed.2015.09.024
12. Priest KC, Lovejoy TI, Englander H, Shull S, McCarty D. Opioid agonist therapy during hospitalization within the Veterans Health Administration: a pragmatic retrospective cohort analysis. J Gen Intern Med. 2020;35(8):2365-2374. https://doi.org/10.1007/s11606-020-05815-0
13. Madras BK, Ahmad NJ, Wen J, Sharfstein J; Prevention, Treatment, and Recovery Working Group of the Action Collaborative on Countering the U.S. Opioid Epidemic. Improving access to evidence-based medical treatment for opioid use disorder: strategies to address key barriers within the treatment system. NAM Perspectives. April 27, 2020. https://doi.org/10.31478/202004b
14. Fiscella K, Wakeman SE, Beletsky L. Buprenorphine deregulation and mainstreaming treatment for opioid use disorder: x the X Waiver. JAMA Psychiatry. 2019;76(3):229-230. https://doi.org/10.1001/jamapsychiatry.2018.3685
15. Priest KC, McCarty D. Role of the hospital in the 21st century opioid overdose epidemic: the addiction medicine consult service. J Addict Med. 2019;13(2):104-112. https://doi.org/10.1097/adm.0000000000000496
16. Weimer M, Morford K, Donroe J. Treatment of opioid use disorder in the acute hospital setting: a critical review of the literature (2014–2019). Curr Addict Rep. 2019;6(4):339-354.
17. Englander H, Dobbertin K, Lind BK, et al. Inpatient addiction medicine consultation and post-hospital substance use disorder treatment engagement: a propensity-matched analysis. J Gen Intern Med. 2019;34(12):2796-2803. https://doi.org/10.1007/s11606-019-05251-9
18. Englander H, Priest KC, Snyder H, Martin M, Calcaterra S, Gregg J. A call to action: hospitalists’ role in addressing substance use disorder. J Hosp Med. 2019;14(3):E1-E4. https://doi.org/10.12788/jhm.3311
19. Bottner R, Moriates C, Tirado C. The role of hospitalists in treating opioid use disorder. J Addict Med. 2020;14(2):178. https://doi.org/10.1097/adm.0000000000000545
20. Behavioral health treatment services locator. Substance Abuse and Mental Health Services Administration. Accessed May 14, 2020. https://findtreatment.samhsa.gov/
21. Groesbeck K, Whiteman LN, Stewart RW. Reducing readmission rates by improving transitional care. South Med J. 2015;108(12):758-760. https://doi.org/10.14423/smj.0000000000000376
22. Heslin KC, Owens PL, Karaca Z, Barrett ML, Moore BJ, Elixhauser A. Trends in opioid-related inpatient stays shifted after the US transitioned to ICD-10-CM diagnosis coding in 2015 Med Care. 2017;55(11):918-923. https://doi.org/10.1097/mlr.0000000000000805
23. Initiation and engagement of alcohol and other drug abuse or dependence treatment (IET). NCQA. Accessed April 20, 2020. https://www.ncqa.org/hedis/measures/initiation-and-engagement-of-alcohol-and-other-drug-abuse-or-dependence-treatment/
24. Wyse JJ, Robbins JL, McGinnis KA, et al. Predictors of timely opioid agonist treatment initiation among veterans with and without HIV. Drug Alcohol Depend. 2019;198:70-75. https://doi.org/10.1016/j.drugalcdep.2019.01.038
25. Harris AHS, Humphreys K, Finney JW. Veterans Affairs facility performance on Washington Circle indicators and casemix-adjusted effectiveness. J Subst Abuse Treat. 2007;33(4):333-339. https://doi.org/10.1016/j.jsat.2006.12.015
26. Muzyk A, Smothers ZPW, Andolsek KM, et al. Interprofessional substance use disorder education in health professions education programs: a scoping review. Acad Med. 2020;95(3):470-480. https://doi.org/10.1097/acm.0000000000003053
27. Saloner B, Lin L, Simon K. Geographic location of buprenorphine-waivered physicians and integration with health systems. J Subst Abuse Treat. 2020;115:108034. https://doi.org/10.1016/j.jsat.2020.108034
28. Jones CW, Christman Z, Smith CM, et al. Comparison between buprenorphine provider availability and opioid deaths among US counties. J Subst Abuse Treat. 2018;93:19-25. https://doi.org/10.1016/j.jsat.2018.07.008
29. Goedel WC, Shapiro A, Cerdá M, Tsai JW, Hadland SE, Marshall BDL. Association of racial/ethnic segregation with treatment capacity for opioid use disorder in counties in the United States. JAMA Netw Open. 2020;3(4):e203711. https://doi.org/10.1001/jamanetworkopen.2020.3711
© 2021 Society of Hospital Medicine
Missed Opportunities for Treatment of Opioid Use Disorder in the Hospital Setting: Updating an Outdated Policy
THE PROBLEM AND THE ROLE OF THE HOSPITALIST
Opioid use disorder (OUD) is a common, underrecognized, undertreated, and deadly medical condition. Although the focus of addressing the opioid epidemic has been centered in the outpatient setting, hospitalists play an important—and often underutilized—role in identifying OUD, initiating treatment, and assisting with linkage to longitudinal care after discharge.
Over the past 20 years, the annual rate of hospital discharges documenting OUD has quadrupled.1 During 2010-2016, the annual discharge rate for heroin overdoses increased by 23%.1 Although the total number of hospitalizations in the United States remained stable from 2002 to 2012, the number of admissions for opioid abuse or dependence increased from 301,707 to 520,275. More than 500,000 hospital admissions per year (1% of total nationwide hospitalizations) are now due primarily to OUD.2
Injection opioid use increases the risk of endocarditis, osteomyelitis, septic arthritis, and epidural abscesses, conditions that often prolong hospitalizations and frequently lead to readmissions. Admissions for OUD-related infections are rising at a startling rate. Between 2002 and 2012, the number of admissions for infections associated with OUDs had increased from 3,421 to 6,535.2 In addition to providing the opportunity to diagnose OUD, hospitalizations offer an ideal time to engage patients in OUD treatment and linkage to outpatient care.
Although we uniformly offer patients antibiotic treatment for acute infection, hospitalists should consistently incorporate treatment of OUD to address the root cause of these admissions. As infection is but one sequelae of the underlying disease of addiction, treating without medications for OUD (MOUD) would be akin to treating a diabetic foot ulcer with antibiotics and not providing medications to improve glycemic control. Omitting such addiction treatment can contribute to treatment failure and worse health outcomes. Among patients with endocarditis and an associated valve repair, those who continue injection drug use have a 10 times higher risk of death or reoperation between 90 and 180 days after repair than those not engaged in drug use.3
Despite data demonstrating the significant benefit and the minimal harm of MOUD, significant gaps remain in providing MOUD and linking patients from the hospital to community care.1,4 Hospital encounters are missed opportunities to provide life-saving MOUD treatment; the majority of patients with OUD do not receive evidence-based treatment while inpatient.5 Rosenthal et al. found that of 102 patients admitted with injection drug use-associated infective endocarditis from 2004 to 2014, only 8% received MOUD, and approximately half had a documentation of substance use treatment in their discharge worksheet.4 In Massachusetts, among individuals who experienced a nonfatal opioid overdose and had interaction with healthcare services, only 26% were on MOUD one year later.6 Based on our experience, a substantial proportion of patients with OUD do not seek or have access to medical care, acute care settings offer a critical opportunity to engage them in treatment for their addiction.
WHY SHOULD HOSPITALISTS INITIATE BUPRENORPHINE?
First, buprenorphine effectively treats withdrawal symptoms. Buprenorphine and methadone are superior to other medications in treating symptoms of withdrawal.7 If withdrawal symptoms are treated, patients are less likely to leave against medical advice8 and are more likely to complete treatment.
Second, MOUD is the standard of care for treating OUD.9 Medications include the full agonist methadone, the partial agonist buprenorphine, and the long-acting antagonist naltrexone. Although all these drugs are effective and legal to initiate for inpatients,6 this perspective focuses on buprenorphine in an effort to draw attention to associated policy barriers. Buprenorphine is the only MOUD that can be offered as office-based therapy by providers in the outpatient setting. Meta-analyses show that MOUD is associated with lower rates of mortality, illicit opioid use, HIV transmission, and violent crime and arrest.9
Third, MOUD treatment, rather than just referral, leads to higher long-term treatment success.10 When initiating buprenorphine in the hospital, treatment retention rates at one month were double that of referral alone. Six months after discharge, patients were five times more likely to remain engaged in treatment compared with those who received a detoxification protocol only.
Fourth, buprenorphine is not only effective, but it is also safe and has low risks of misuse. Because buprenorphine is a partial agonist, it has both a ceiling effect on respiratory depression (decreasing potential lethality) and on euphoria (decreasing the likelihood of misuse). Among individuals who took nonprescribed buprenorphine on the street, less than 7% reported taking it for any attempt at euphoria. Instead, people with OUD most often use nonprescribed or diverted buprenorphine to treat withdrawal symptoms.11
Fifth, buprenorphine treatment is associated with fewer hospital readmissions.12
Finally, initiating OUD treatment is feasible in the hospital setting. Any hospitalist can legally prescribe buprenorphine to treat opioid withdrawal for hospitalized patients admitted for medical or surgical reasons. A waiver is necessary only for prescribing at the time of hospital discharge for use in non-inpatient settings of care.
A POLICY BARRIER: THE X WAIVER
The United States Congress passed the Drug Addiction Treatment Act (DATA) of 2000, which codified the X waiver, in response to the growing opioid crisis. Only those providers with the DATA X waiver can write buprenorphine prescriptions to be filled in an outpatient pharmacy. To obtain an X waiver, physicians must complete an 8-hour course, whereas physician assistants and nurse practitioners must complete a 24-hour course. This training far exceeds any required training to prescribe opioids for pain.
Unfortunately, the X waiver requirement obstructs hospitalists from initiating buprenorphine in the inpatient setting in the following ways: (1) hospitalists often choose not to initiate chronic buprenorphine treatment if they lack the X waiver that would allow them to write the discharge prescription and/or (2) they are unable to identify a waivered provider in the community to continue the prescription. Unfortunately, only 6% of all medical practitioners are waivered to prescribe buprenorphine; greater than 40% of US counties are “buprenorphine deserts,” with no providers waivered to prescribe buprenorphine.13
To address the opioid crisis, we must rethink our current policies. The Department of Health and Human Services should eliminate the X waiver and allow any licensed physician, nurse practitioner, or physician assistant to prescribe buprenorphine.14 Recent American Medical Association Opioid Task Force recommendations have called to “remove… inappropriate administrative burdens or barriers that delay or deny care for FDA-approved medications used as part of medication-assisted treatment for OUD.”15 Legislation to remove the X wavier has been proposed in the United States.16
The removal of a buprenorphine waiver requirement has had success in other settings. The French deregulation of buprenorphine was associated with a reduction in opioid overdose deaths by 79%. Similar success in the United States would save an estimated 30,000 lives yearly.14 Removing the X waiver is an important step in empowering hospitalists to initiate MOUD for individuals in the hospital setting. Moreover, it opens the door to more outpatient primary care providers serving as community linkages for long-term addiction care.
NOT A PANACEA
Without the X waiver, the associated OUD training will no longer be required. This could have unintended consequences. For example, if hospitalists order buprenorphine while opioids remain active, precipitated withdrawal may ensue. Crucially, the current literature does not indicate that the required X waiver training improves knowledge, patient care, or outcomes.17 Nevertheless, MOUD and addiction training may help reduce knowledge gaps and empower providers to engage in productive conversations surrounding addiction. This highlights the crucial role of physician organizations, such as the Society of Hospital Medicine, in educating hospitalists about MOUD. (This organization, among others, has developed robust MOUD training.18)
It is also important to acknowledge that the waiver is only one obstacle. Other barriers have been identified in initiating buprenorphine, including access to treatment after discharge, access to social work support, and lack of EMR order sets, among others.19 Professional societies, hospitals, and hospitalists need to help address these barriers through ancillary support staff, quality improvement initiatives, and improved inpatient treatment of withdrawal with MOUD. This can be done successfully; one study found that 82% of hospitalized patients who engaged in a new transitional opioid program subsequently presented to outpatient opioid treatment.20 Novel interventions must be part of a hospital-wide approach to optimizing improved longitudinal treatment for patients suffering from addiction.
CONCLUSION
Hospitalization is an ideal opportunity for clinicians to diagnose and treat OUD in a population that often has not sought, or has fallen out of, addiction treatment. Hospitalists can and should initiate buprenorphine in appropriate inpatients and plan for their transition to chronic care. Eliminating the waiver in combination with designing innovative educational opportunities and systems approaches to provide better linkages to outpatient OUD treatment is needed to combat the opioid crisis. To enable more hospitalists to successfully initiate long-term buprenorphine therapy—and to enable more outpatient providers to continue prescriptions—we must eliminate the X waiver.
Disclosures
Dr. Wilson received honorarium from the American Society of Addiction Medicine for teaching and creating
1. Peterson C, Xu L, Florence C, Mack KA. Opioid-related US hospital discharges by type, 1993–2016. J Subst Abuse Treat. 2019;103:9-13. https://doi.org/10.1016/j.jsat.2019.05.003.
2. Ronan MV, Herzig SJ. Hospitalizations related to opioid abuse/dependence and associated serious infections increased sharply, 2002-12. Health Aff. 2016;35(5):832-837. https://doi.org/10.1377/hlthaff.2015.1424.
3. Shrestha NK, Jue J, Hussain ST, et al. Injection drug use and outcomes after surgical intervention for infective endocarditis. Ann Thorac Surg. 2015;100(3):875-882. https://doi.org/10.1016/j.athoracsur.2015.03.019.
4. Rosenthal ES, Karchmer AW, Theisen-Toupal J, Castillo RA, Rowley CF. Suboptimal addiction interventions for patients hospitalized with injection drug use-associated infective endocarditis. Am J Med. 2016;129(5):481-485. https://doi.org/10.1016/j.amjmed.2015.09.024.
5. Winetsky D, Weinrieb RM, Perrone J. Expanding treatment opportunities for hospitalized patients with opioid use disorders. J Hosp Med. 2017;13(1):62-64. https://doi.org/10.12788/jhm.2861.
6. Larochelle MR, Bernson D, Land T, et al. Medication for opioid use disorder after nonfatal opioid overdose and association with mortality: a cohort study. Ann Intern Med. 2018;169(3):137-145. https://doi.org/10.7326/M17-3107.
7. Gowing L, Ali R, White JM, Mbewe D. Buprenorphine for managing opioid withdrawal. Cochrane Database Syst Rev. 2017;(2):CD002025. https://doi.org/10.1002/14651858.CD002025.pub5.
8. Ti L, Ti L. Leaving the hospital against medical advice among people who use illicit drugs: a systematic review. Am J Public Health. 2015;105(12):e53-e59. https://doi.org/10.2105/AJPH.2015.302885.
9. Schuckit MA. Treatment of opioid-use disorders. N Engl J Med. 2016;375(4):357-368. https://doi.org/10.1056/NEJMra1604339.
10. Liebschutz JM, Crooks D, Herman D, et al. Buprenorphine treatment for hospitalized, opioid-dependent patients. JAMA Intern Med. 2014;174(8):1369. https://doi.org/10.1001/jamainternmed.2014.2556.
11. Cicero TJ, Ellis MS, Surratt HL, Kurtz SP. Factors contributing to the rise of buprenorphine misuse: 2008-2013. Drug Alcohol Depend. 2014;142:98-104. https://doi.org/10.1016/j.drugalcdep.2014.06.005.
12. Moreno JL, Wakeman SE, Duprey MS, Roberts RJ, Jacobson JS, Devlin JW. Predictors for 30-day and 90-day hospital readmission among patients with opioid use disorder. J Addict Med. 2019;13(4):306-313. https://doi.org/10.1097/ADM.0000000000000499.
13. Andrilla CHA, Moore TE, Patterson DG, Larson EH. Geographic distribution of providers with a dea waiver to prescribe buprenorphine for the treatment of opioid use disorder: a 5-year update. J Rural Heal. 2019;35(1):108-112. https://doi.org/10.1111/jrh.12307.
14. Fiscella K, Wakeman SE, Beletsky L. Buprenorphine deregulation and mainstreaming treatment for opioid use disorder: x the x waiver. JAMA Psychiatry. 2019;76(3):229-230. https://doi.org/10.1001/jamapsychiatry.2018.3685.
15. American Medical Association Opioid Task Force. AMA Opioid Task Force recommendations offer roadmap to policymakers | American Medical Association. https://www.ama-assn.org/press-center/press-releases/ama-opioid-task-force-recommendations-offer-roadmap-policymakers. Accessed June 14, 2019.
16. Tonko P. H.R.2482: Mainstreaming Addiction Treatment Act of 2019. House Of Representatives (116th Congress); 2019. https://www.congress.gov/bill/116th-congress/house-bill/2482. Accessed July 10, 2019.
17. Frank JW, Wakeman SE, Gordon AJ. No end to the crisis without an end to the waiver. Subst Abus. 2018;39(3):263-265. https://doi.org/10.1080/08897077.2018.1543382
18. Society of Hospital Medicine. Clinical Topics: Opioid Safety. https://www.hospitalmedicine.org/clinical-topics/opioid-safety/. Accessed October 24, 2019.
19. Lowenstein M, Kilaru A, Perrone J, et al. Barriers and facilitators for emergency department initiation of buprenorphine: a physician survey. Am J Emerg Med. 2019;37(9):1787-1790. https://doi.org/10.1016/j.ajem.2019.02.025.
20. Shanahan CW, Beers D, Alford DP, Brigandi E, Samet JH. A transitional opioid program to engage hospitalized drug users. J Gen Intern Med. 2010;25(8):803-808. https://doi.org/10.1007/s11606-010-1311-3.
THE PROBLEM AND THE ROLE OF THE HOSPITALIST
Opioid use disorder (OUD) is a common, underrecognized, undertreated, and deadly medical condition. Although the focus of addressing the opioid epidemic has been centered in the outpatient setting, hospitalists play an important—and often underutilized—role in identifying OUD, initiating treatment, and assisting with linkage to longitudinal care after discharge.
Over the past 20 years, the annual rate of hospital discharges documenting OUD has quadrupled.1 During 2010-2016, the annual discharge rate for heroin overdoses increased by 23%.1 Although the total number of hospitalizations in the United States remained stable from 2002 to 2012, the number of admissions for opioid abuse or dependence increased from 301,707 to 520,275. More than 500,000 hospital admissions per year (1% of total nationwide hospitalizations) are now due primarily to OUD.2
Injection opioid use increases the risk of endocarditis, osteomyelitis, septic arthritis, and epidural abscesses, conditions that often prolong hospitalizations and frequently lead to readmissions. Admissions for OUD-related infections are rising at a startling rate. Between 2002 and 2012, the number of admissions for infections associated with OUDs had increased from 3,421 to 6,535.2 In addition to providing the opportunity to diagnose OUD, hospitalizations offer an ideal time to engage patients in OUD treatment and linkage to outpatient care.
Although we uniformly offer patients antibiotic treatment for acute infection, hospitalists should consistently incorporate treatment of OUD to address the root cause of these admissions. As infection is but one sequelae of the underlying disease of addiction, treating without medications for OUD (MOUD) would be akin to treating a diabetic foot ulcer with antibiotics and not providing medications to improve glycemic control. Omitting such addiction treatment can contribute to treatment failure and worse health outcomes. Among patients with endocarditis and an associated valve repair, those who continue injection drug use have a 10 times higher risk of death or reoperation between 90 and 180 days after repair than those not engaged in drug use.3
Despite data demonstrating the significant benefit and the minimal harm of MOUD, significant gaps remain in providing MOUD and linking patients from the hospital to community care.1,4 Hospital encounters are missed opportunities to provide life-saving MOUD treatment; the majority of patients with OUD do not receive evidence-based treatment while inpatient.5 Rosenthal et al. found that of 102 patients admitted with injection drug use-associated infective endocarditis from 2004 to 2014, only 8% received MOUD, and approximately half had a documentation of substance use treatment in their discharge worksheet.4 In Massachusetts, among individuals who experienced a nonfatal opioid overdose and had interaction with healthcare services, only 26% were on MOUD one year later.6 Based on our experience, a substantial proportion of patients with OUD do not seek or have access to medical care, acute care settings offer a critical opportunity to engage them in treatment for their addiction.
WHY SHOULD HOSPITALISTS INITIATE BUPRENORPHINE?
First, buprenorphine effectively treats withdrawal symptoms. Buprenorphine and methadone are superior to other medications in treating symptoms of withdrawal.7 If withdrawal symptoms are treated, patients are less likely to leave against medical advice8 and are more likely to complete treatment.
Second, MOUD is the standard of care for treating OUD.9 Medications include the full agonist methadone, the partial agonist buprenorphine, and the long-acting antagonist naltrexone. Although all these drugs are effective and legal to initiate for inpatients,6 this perspective focuses on buprenorphine in an effort to draw attention to associated policy barriers. Buprenorphine is the only MOUD that can be offered as office-based therapy by providers in the outpatient setting. Meta-analyses show that MOUD is associated with lower rates of mortality, illicit opioid use, HIV transmission, and violent crime and arrest.9
Third, MOUD treatment, rather than just referral, leads to higher long-term treatment success.10 When initiating buprenorphine in the hospital, treatment retention rates at one month were double that of referral alone. Six months after discharge, patients were five times more likely to remain engaged in treatment compared with those who received a detoxification protocol only.
Fourth, buprenorphine is not only effective, but it is also safe and has low risks of misuse. Because buprenorphine is a partial agonist, it has both a ceiling effect on respiratory depression (decreasing potential lethality) and on euphoria (decreasing the likelihood of misuse). Among individuals who took nonprescribed buprenorphine on the street, less than 7% reported taking it for any attempt at euphoria. Instead, people with OUD most often use nonprescribed or diverted buprenorphine to treat withdrawal symptoms.11
Fifth, buprenorphine treatment is associated with fewer hospital readmissions.12
Finally, initiating OUD treatment is feasible in the hospital setting. Any hospitalist can legally prescribe buprenorphine to treat opioid withdrawal for hospitalized patients admitted for medical or surgical reasons. A waiver is necessary only for prescribing at the time of hospital discharge for use in non-inpatient settings of care.
A POLICY BARRIER: THE X WAIVER
The United States Congress passed the Drug Addiction Treatment Act (DATA) of 2000, which codified the X waiver, in response to the growing opioid crisis. Only those providers with the DATA X waiver can write buprenorphine prescriptions to be filled in an outpatient pharmacy. To obtain an X waiver, physicians must complete an 8-hour course, whereas physician assistants and nurse practitioners must complete a 24-hour course. This training far exceeds any required training to prescribe opioids for pain.
Unfortunately, the X waiver requirement obstructs hospitalists from initiating buprenorphine in the inpatient setting in the following ways: (1) hospitalists often choose not to initiate chronic buprenorphine treatment if they lack the X waiver that would allow them to write the discharge prescription and/or (2) they are unable to identify a waivered provider in the community to continue the prescription. Unfortunately, only 6% of all medical practitioners are waivered to prescribe buprenorphine; greater than 40% of US counties are “buprenorphine deserts,” with no providers waivered to prescribe buprenorphine.13
To address the opioid crisis, we must rethink our current policies. The Department of Health and Human Services should eliminate the X waiver and allow any licensed physician, nurse practitioner, or physician assistant to prescribe buprenorphine.14 Recent American Medical Association Opioid Task Force recommendations have called to “remove… inappropriate administrative burdens or barriers that delay or deny care for FDA-approved medications used as part of medication-assisted treatment for OUD.”15 Legislation to remove the X wavier has been proposed in the United States.16
The removal of a buprenorphine waiver requirement has had success in other settings. The French deregulation of buprenorphine was associated with a reduction in opioid overdose deaths by 79%. Similar success in the United States would save an estimated 30,000 lives yearly.14 Removing the X waiver is an important step in empowering hospitalists to initiate MOUD for individuals in the hospital setting. Moreover, it opens the door to more outpatient primary care providers serving as community linkages for long-term addiction care.
NOT A PANACEA
Without the X waiver, the associated OUD training will no longer be required. This could have unintended consequences. For example, if hospitalists order buprenorphine while opioids remain active, precipitated withdrawal may ensue. Crucially, the current literature does not indicate that the required X waiver training improves knowledge, patient care, or outcomes.17 Nevertheless, MOUD and addiction training may help reduce knowledge gaps and empower providers to engage in productive conversations surrounding addiction. This highlights the crucial role of physician organizations, such as the Society of Hospital Medicine, in educating hospitalists about MOUD. (This organization, among others, has developed robust MOUD training.18)
It is also important to acknowledge that the waiver is only one obstacle. Other barriers have been identified in initiating buprenorphine, including access to treatment after discharge, access to social work support, and lack of EMR order sets, among others.19 Professional societies, hospitals, and hospitalists need to help address these barriers through ancillary support staff, quality improvement initiatives, and improved inpatient treatment of withdrawal with MOUD. This can be done successfully; one study found that 82% of hospitalized patients who engaged in a new transitional opioid program subsequently presented to outpatient opioid treatment.20 Novel interventions must be part of a hospital-wide approach to optimizing improved longitudinal treatment for patients suffering from addiction.
CONCLUSION
Hospitalization is an ideal opportunity for clinicians to diagnose and treat OUD in a population that often has not sought, or has fallen out of, addiction treatment. Hospitalists can and should initiate buprenorphine in appropriate inpatients and plan for their transition to chronic care. Eliminating the waiver in combination with designing innovative educational opportunities and systems approaches to provide better linkages to outpatient OUD treatment is needed to combat the opioid crisis. To enable more hospitalists to successfully initiate long-term buprenorphine therapy—and to enable more outpatient providers to continue prescriptions—we must eliminate the X waiver.
Disclosures
Dr. Wilson received honorarium from the American Society of Addiction Medicine for teaching and creating
1. Peterson C, Xu L, Florence C, Mack KA. Opioid-related US hospital discharges by type, 1993–2016. J Subst Abuse Treat. 2019;103:9-13. https://doi.org/10.1016/j.jsat.2019.05.003.
2. Ronan MV, Herzig SJ. Hospitalizations related to opioid abuse/dependence and associated serious infections increased sharply, 2002-12. Health Aff. 2016;35(5):832-837. https://doi.org/10.1377/hlthaff.2015.1424.
3. Shrestha NK, Jue J, Hussain ST, et al. Injection drug use and outcomes after surgical intervention for infective endocarditis. Ann Thorac Surg. 2015;100(3):875-882. https://doi.org/10.1016/j.athoracsur.2015.03.019.
4. Rosenthal ES, Karchmer AW, Theisen-Toupal J, Castillo RA, Rowley CF. Suboptimal addiction interventions for patients hospitalized with injection drug use-associated infective endocarditis. Am J Med. 2016;129(5):481-485. https://doi.org/10.1016/j.amjmed.2015.09.024.
5. Winetsky D, Weinrieb RM, Perrone J. Expanding treatment opportunities for hospitalized patients with opioid use disorders. J Hosp Med. 2017;13(1):62-64. https://doi.org/10.12788/jhm.2861.
6. Larochelle MR, Bernson D, Land T, et al. Medication for opioid use disorder after nonfatal opioid overdose and association with mortality: a cohort study. Ann Intern Med. 2018;169(3):137-145. https://doi.org/10.7326/M17-3107.
7. Gowing L, Ali R, White JM, Mbewe D. Buprenorphine for managing opioid withdrawal. Cochrane Database Syst Rev. 2017;(2):CD002025. https://doi.org/10.1002/14651858.CD002025.pub5.
8. Ti L, Ti L. Leaving the hospital against medical advice among people who use illicit drugs: a systematic review. Am J Public Health. 2015;105(12):e53-e59. https://doi.org/10.2105/AJPH.2015.302885.
9. Schuckit MA. Treatment of opioid-use disorders. N Engl J Med. 2016;375(4):357-368. https://doi.org/10.1056/NEJMra1604339.
10. Liebschutz JM, Crooks D, Herman D, et al. Buprenorphine treatment for hospitalized, opioid-dependent patients. JAMA Intern Med. 2014;174(8):1369. https://doi.org/10.1001/jamainternmed.2014.2556.
11. Cicero TJ, Ellis MS, Surratt HL, Kurtz SP. Factors contributing to the rise of buprenorphine misuse: 2008-2013. Drug Alcohol Depend. 2014;142:98-104. https://doi.org/10.1016/j.drugalcdep.2014.06.005.
12. Moreno JL, Wakeman SE, Duprey MS, Roberts RJ, Jacobson JS, Devlin JW. Predictors for 30-day and 90-day hospital readmission among patients with opioid use disorder. J Addict Med. 2019;13(4):306-313. https://doi.org/10.1097/ADM.0000000000000499.
13. Andrilla CHA, Moore TE, Patterson DG, Larson EH. Geographic distribution of providers with a dea waiver to prescribe buprenorphine for the treatment of opioid use disorder: a 5-year update. J Rural Heal. 2019;35(1):108-112. https://doi.org/10.1111/jrh.12307.
14. Fiscella K, Wakeman SE, Beletsky L. Buprenorphine deregulation and mainstreaming treatment for opioid use disorder: x the x waiver. JAMA Psychiatry. 2019;76(3):229-230. https://doi.org/10.1001/jamapsychiatry.2018.3685.
15. American Medical Association Opioid Task Force. AMA Opioid Task Force recommendations offer roadmap to policymakers | American Medical Association. https://www.ama-assn.org/press-center/press-releases/ama-opioid-task-force-recommendations-offer-roadmap-policymakers. Accessed June 14, 2019.
16. Tonko P. H.R.2482: Mainstreaming Addiction Treatment Act of 2019. House Of Representatives (116th Congress); 2019. https://www.congress.gov/bill/116th-congress/house-bill/2482. Accessed July 10, 2019.
17. Frank JW, Wakeman SE, Gordon AJ. No end to the crisis without an end to the waiver. Subst Abus. 2018;39(3):263-265. https://doi.org/10.1080/08897077.2018.1543382
18. Society of Hospital Medicine. Clinical Topics: Opioid Safety. https://www.hospitalmedicine.org/clinical-topics/opioid-safety/. Accessed October 24, 2019.
19. Lowenstein M, Kilaru A, Perrone J, et al. Barriers and facilitators for emergency department initiation of buprenorphine: a physician survey. Am J Emerg Med. 2019;37(9):1787-1790. https://doi.org/10.1016/j.ajem.2019.02.025.
20. Shanahan CW, Beers D, Alford DP, Brigandi E, Samet JH. A transitional opioid program to engage hospitalized drug users. J Gen Intern Med. 2010;25(8):803-808. https://doi.org/10.1007/s11606-010-1311-3.
© 2019 Society of Hospital Medicine
The Use of Clinical Decision Support in Reducing Diagnosis of and Treatment of Asymptomatic Bacteriuria
Reducing the treatment of asymptomatic bacteriuria (ASB), or isolation of bacteria from a urine specimen in a patient without urinary tract infection (UTI) symptoms, is a key goal of antibiotic stewardship programs.1 Treatment of ASB has been associated with the emergence of resistant organisms and subsequent UTI risk among women with recurrent UTI.2,3 The Infectious Diseases Society of America and the American Board of Internal Medicine Foundation’s Choosing Wisely campaign recommend against treating ASB, with the exception of pregnant patients and urogenital surgical patients.1,4
Obtaining urinalyses and urine cultures (UC) in asymptomatic patients may contribute to the unnecessary treatment of ASB. In a study of hospitalized patients, 62% received urinalysis testing, even though 82% of these patients did not have UTI symptoms.5 Of the patients found to have ASB, 30% were given antibiotics.5 Therefore, interventions aimed at reducing urine testing may reduce ASB treatment.
Electronic passive clinical decision support (CDS) alerts and electronic education may be effective interventions to reduce urine testing.6 While CDS tools are recommended in antibiotic stewardship guidelines,7 they have led to only modest improvements in appropriate antibiotic prescribing and are typically bundled with time-intensive educational interventions.8 Furthermore, most in-hospital interventions to decrease ASB treatment have focused on intensive care units (ICUs).9 We hypothesized that CDS and electronic education would decrease (1) urinalysis and UC ordering and (2) antibiotic orders for urinalyses and UCs in hospitalized adult patients.
METHODS
Population
We conducted a prospective time series analysis (preintervention: September 2014 to June 2015; postintervention: September 2015 to June 2016) at a large tertiary medical center. All hospitalized patients ≥18 years old were eligible except those admitted to services requiring specialized ASB management (eg, leukemia and lymphoma, solid organ transplant, and obstetrics).1 The study was declared quality improvement by the Johns Hopkins Institutional Review Board.
Intervention
In August 2015, we implemented a multifaceted intervention that included provider education and passive electronic CDS (supplementary Appendix 1 and supplementary Appendix 2). Materials were disseminated through hospital-wide computer workstation screensavers and a 1-page e-mailed newsletter to department of medicine clinicians. The CDS tool included simple informational messages recommending against urine testing without symptoms and against treating ASB; these messages accompanied electronic health record (EHR; Allscripts Sunrise Clinical Manager, Chicago, IL) orders for urinalysis, UC, and antibiotics commonly used within our institution to treat UTI (cefazolin, cephalexin, ceftriaxone, trimethoprim-sulfamethoxazole, nitrofurantoin, and ciprofloxacin). The information was displayed automatically when orders for these tests and antibiotics were selected; provider acknowledgment was not required to proceed.
Data Collection
The services within our hospital are geographically located. We collected orders for urinalysis, UC, and the associated antibiotics for all units except those housing patients excluded from our study. As the CDS tool appeared only in the inpatient EHR, only postadmission orders were included, excluding emergency department orders. For admissions with multiple urinalyses, urinalysis orders placed ≥72 hours apart were eligible. Only antibiotics ordered for ≥24 hours were included, excluding on-call and 1-time antibiotic orders.
Our approach to data collection attempted to model a clinician’s decision-making pathway from (1) ordering a urinalysis, to (2) ordering a UC in response to a urinalysis result, to (3) ordering antibiotics in response to a urinalysis or UC result. We focused on order placement rather than results to prioritize avoiding testing in asymptomatic patients, as our institution does not require positive urinalyses for UC testing (reflex testing). Urinalyses resulted within 1 to 2 hours, allowing for clinicians to quickly order UCs after urinalysis result review. Urinalysis and UC orders per monthly admissions were defined as (1) urinalyses, (2) UCs, (3) simultaneous urinalysis and UC (within 1 hour of each other), and (4) UCs ordered 1 to 24 hours after urinalysis. We also analyzed the following antibiotic orders per monthly admissions: (1) simultaneous urinalysis and antibiotic orders, (2) antibiotics ordered 1 to 24 hours after urinalysis order, and (3) antibiotics ordered within 24 hours of the UC result.
Outcome Measures
All outcome measures were calculated as the change over time per total monthly admissions in the preintervention and postintervention periods. In addition to symptoms, urinalysis is a critical, measurable early step in determining the presence of ASB. Therefore, the primary outcome measure was the postintervention change in monthly urinalysis orders, and the secondary outcome measure was the postintervention change in monthly UC orders. Additional outcome measures included monthly postintervention changes in (1) UC ordered 1 to 24 hours after urinalyses, (2) urinalyses and antibiotics ordered simultaneously, (3) antibiotic orders within 1 to 24 hours of urinalyses, and (4) antibiotics ordered within 24 hours of UC result.
Statistical Analysis
Statistical analyses were performed by using Stata (version 14.2; StataCorp LLC, College Station, TX). An interrupted time series analysis was performed to compare the change in orders per 100 monthly admissions in preintervention and postintervention periods. To do this, we created 2 separate segmented linear regression models for each dependent variable, pre- and postintervention. Normality was assumed because of large numbers. Rate differences per 100 monthly admissions are also calculated as the total number of orders divided by the total number of admissions in postintervention and preintervention periods with Mantel-Haenszel estimators. Differences were considered statistically significant at P ≤ .05.
RESULTS
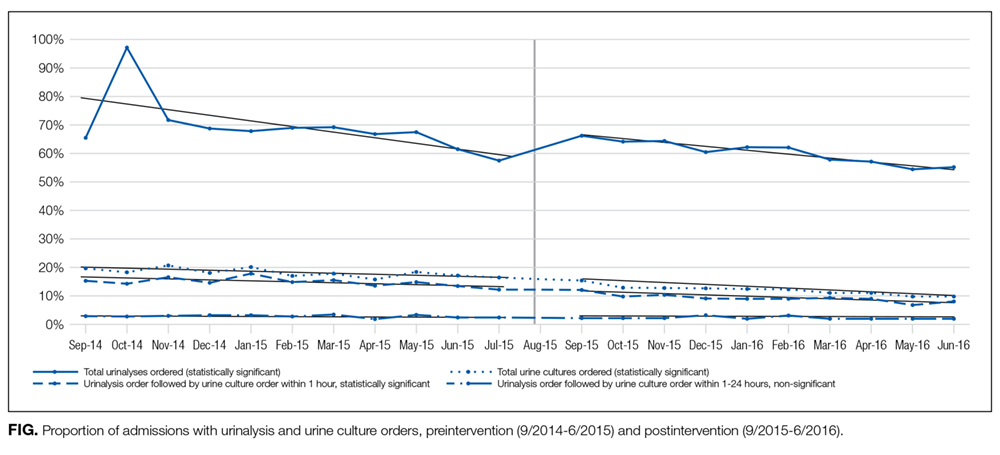
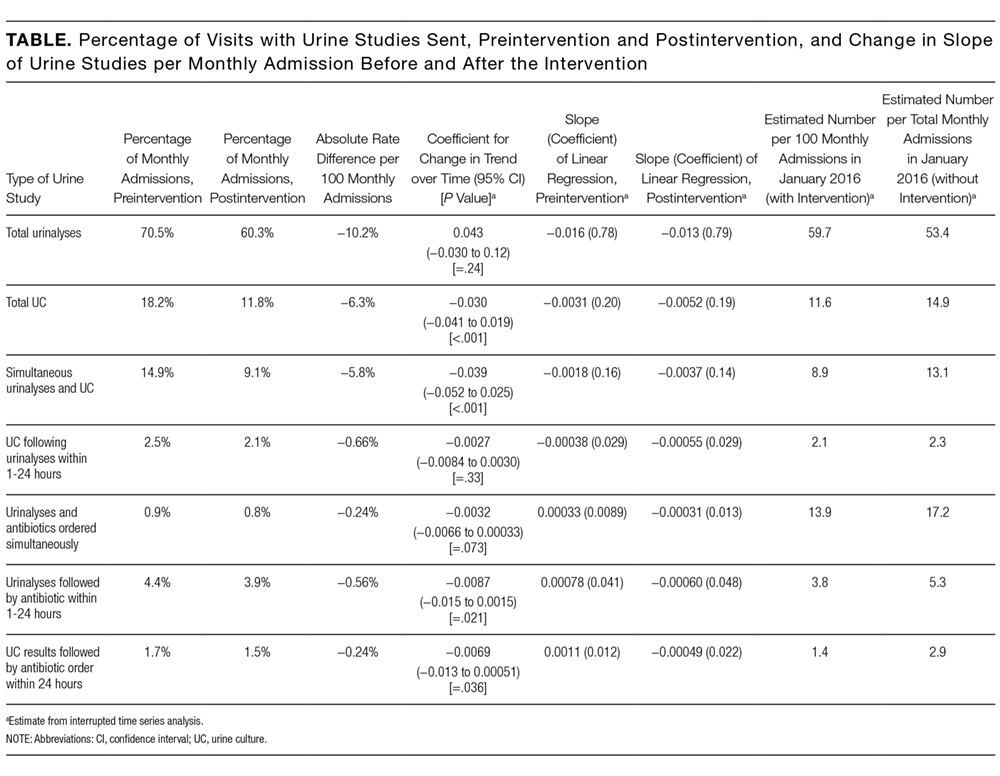
DISCUSSION
A multifaceted but simple bundle of CDS and provider education reduced UC testing but not urinalyses in a large tertiary care hospital. The bundle also reduced antibiotic ordering in response to urinalyses as well as antibiotic ordering in response to UC results.
Other in-hospital CDS tools to decrease ASB treatment have focused only on ICUs.9,10 Our intervention was evaluated hospital-wide and included urinalyses and UCs. Our intervention was clinician directed and not laboratory directed, such as a positive urinalysis reflexing to a UC. Simultaneous urinalysis and UC testing may lead to ASB treatment, as clinicians treat the positive UC and ignore the negative urinalysis.11,12 Therefore, we focused on UCs being sent in response to urinalyses.
We chose to focus on laboratory testing data instead of administrative diagnoses for UTI. The sensitivity of administrative data to determine similar conditions such as catheter-associated UTIs is low (0%).13
Our single-center study may not be generalizable to other settings. We did not include emergency department patients, as this location used a different EHR. In addition, given the 600,000 yearly hospital admissions, it was impractical to assess the appropriateness of each antibiotic-based documentation of symptoms. Instead of focusing on symptoms of ASB or UTI diagnoses, we focused on ordering urinalysis, UC, and antibiotics. In investigating the antibiotics most frequently used to treat UTI in our hospital, we may have both missed some patients who were treated with other antibiotics for ASB (eg, 4th generation cephalosporins, penicillins, carbapenems, etc) and captured patients receiving antibiotics for indications other than UTI (eg, pneumonia). In our focus on overall ordering practices across a hospital, we did not capture data on bladder catheterization status or the predominant organism seen in UC. At the time of the intervention, the laboratory did not have the resources for urinalysis testing reflexing to UC. However, our intervention did not prevent ordering simultaneous urinalysis and UC in symptomatic patients in general or urosepsis in particular. With only 12 total time points, the interrupted time series analysis may have been underpowered.14 We also do not know if the intervention’s effect would decay over time.
Although the intervention took very little staff time and resources, alert fatigue was a risk.15 We attempted to mitigate this alert fatigue by making the CDS passive (in the form of a brief informational message) with no provider action required. In conversations with providers in our institution, there has been dissatisfaction with alerts requiring action, as these are thought to be overly intrusive. We are also not clear on which element of the intervention bundle (ie, the CDS or the educational intervention) may have had more of an impact, as the elements of the intervention bundle were rolled out simultaneously. It is possible and even probable that both elements are needed to raise awareness of the problem. Also, as our EHR required all interventions to be rolled out hospital-wide simultaneously, we were unable to randomize certain floors or providers to the CDS portion of the intervention bundle. Other analyses including the type of hospital unit were beyond the scope of this brief report.
Our intervention bundle was associated with reduced UC orders and reduced antibiotics ordered after urinalyses. If a provider does not know there is bacteriuria, then the provider will not be tempted to order antibiotics. This easily implementable bundle may play an important role as an antimicrobial stewardship strategy for ASB.
Acknowledgments
The authors acknowledge the support of Erin Fanning, BS, and Angel Florentin, BS, in providing data for analysis. SCK received funding from the Johns Hopkins Institute for Clinical and Translational Research (ICTR), which is funded in part by grant number KL2TR001077 from the National Center for Advancing Translational Sciences (NCATS), a component of the National Institutes of Health (NIH), and the NIH Roadmap for Medical Research. These contents are solely the responsibility of the authors and do not necessarily represent the official view of the Johns Hopkins ICTR, NCATS, or NIH. We also acknowledge support from the Centers for Disease Control and Prevention’s Prevention Epicenter Program Q8377 (collaborative agreement U54 CK000447 to SEC). SEC has received support for consulting from Novartis and Theravance, and her institution has received a grant from Pfizer Grants for Learning and Change/The Joint Commission. This work was supported by the NIH T32 HL116275 to NC. The content is solely the responsibility of the authors and does not necessarily represent the official views of the NIH.
Disclosure
No conflicts of interest have been reported by any author.
1. Nicolle LE, Bradley S, Colgan R, et al. Infectious Diseases Society of America guidelines for the diagnosis and treatment of asymptomatic bacteriuria in adults. Clin Infect Dis. 2005;40(5):643-654. PubMed
2. Cai T, Mazzoli S, Mondaini N, et al. The role of asymptomatic bacteriuria in young women with recurrent urinary tract infections: to treat or not to treat? Clin Infect Dis. 2012;55(6):771-777. PubMed
3. Cai T, Nesi G, Mazzoli S, et al. Asymptomatic bacteriuria treatment is associated with a higher prevalence of antibiotic resistant strains in women with urinary tract infections. Clin Infect Dis. 2015;61(11):1655-1661. PubMed
4. Infectious Diseases Society of America. Choosing Wisely: Five Things Physicians and Patients Should Question. 2015. http://www.choosingwisely.org/societies/infectious-diseases-society-of-america/. Accessed on September 11, 2016.
5. Yin P, Kiss A, Leis JA. Urinalysis Orders Among Patients Admitted to the General Medicine Service. JAMA Intern Med. 2015;175(10):1711-1713. PubMed
6. McGregor JC, Weekes E, Forrest GN, et al. Impact of a computerized clinical decision support system on reducing inappropriate antimicrobial use: a randomized controlled trial. J Am Med Inform Assoc. 2006;13(4):378-384. PubMed
7. Barlam TF, Cosgrove SE, Abbo LM, et al. Implementing an Antibiotic Stewardship Program: Guidelines by the Infectious Diseases Society of America and the Society for Healthcare Epidemiology of America. Clin Infect Dis. 2016;62(10):e51-e77. PubMed
8. Gonzales R, Anderer T, McCulloch CE, et al. A cluster randomized trial of decision support strategies for reducing antibiotic use in acute bronchitis. JAMA Intern Med. 2013;173(4):267-273. PubMed
9. Sarg M, Waldrop GE, Beier MA, et al. Impact of Changes in Urine Culture Ordering Practice on Antimicrobial Utilization in Intensive Care Units at an Academic Medical Center. Infect Control Hosp Epidemiol. 2016;37(4):448-454. PubMed
10. Mehrotra A, Linder JA. Tipping the Balance Toward Fewer Antibiotics. JAMA Intern Med. 2016;176(11):1649-1650. PubMed
11. Leis JA, Gold WL, Daneman N, Shojania K, McGeer A. Downstream impact of urine cultures ordered without indication at two acute care teaching hospitals. Infect Control Hosp Epidemiol. 2013;34(10):1113-1114. PubMed
12. Stagg A, Lutz H, Kirpalaney S, et al. Impact of two-step urine culture ordering in the emergency department: a time series analysis. BMJ Qual Saf. 2017. doi:10.1136/bmjqs-2016-006250. PubMed
13. Cass AL, Kelly JW, Probst JC, Addy CL, McKeown RE. Identification of device-associated infections utilizing administrative data. Am J Infect Control. 2013;41(12):1195-1199. PubMed
14. Zhang F, Wagner AK, Ross-Degnan D. Simulation-based power calculation for designing interrupted time series analyses of health policy interventions. J Clin Epidemiol. 2011;64(11):1252-1261. PubMed
15. Embi PJ, Leonard AC. Evaluating alert fatigue over time to EHR-based clinical trial alerts: findings from a randomized controlled study. J Am Med Inform Assoc. 2012;19(e1):e145-e148. PubMed
Reducing the treatment of asymptomatic bacteriuria (ASB), or isolation of bacteria from a urine specimen in a patient without urinary tract infection (UTI) symptoms, is a key goal of antibiotic stewardship programs.1 Treatment of ASB has been associated with the emergence of resistant organisms and subsequent UTI risk among women with recurrent UTI.2,3 The Infectious Diseases Society of America and the American Board of Internal Medicine Foundation’s Choosing Wisely campaign recommend against treating ASB, with the exception of pregnant patients and urogenital surgical patients.1,4
Obtaining urinalyses and urine cultures (UC) in asymptomatic patients may contribute to the unnecessary treatment of ASB. In a study of hospitalized patients, 62% received urinalysis testing, even though 82% of these patients did not have UTI symptoms.5 Of the patients found to have ASB, 30% were given antibiotics.5 Therefore, interventions aimed at reducing urine testing may reduce ASB treatment.
Electronic passive clinical decision support (CDS) alerts and electronic education may be effective interventions to reduce urine testing.6 While CDS tools are recommended in antibiotic stewardship guidelines,7 they have led to only modest improvements in appropriate antibiotic prescribing and are typically bundled with time-intensive educational interventions.8 Furthermore, most in-hospital interventions to decrease ASB treatment have focused on intensive care units (ICUs).9 We hypothesized that CDS and electronic education would decrease (1) urinalysis and UC ordering and (2) antibiotic orders for urinalyses and UCs in hospitalized adult patients.
METHODS
Population
We conducted a prospective time series analysis (preintervention: September 2014 to June 2015; postintervention: September 2015 to June 2016) at a large tertiary medical center. All hospitalized patients ≥18 years old were eligible except those admitted to services requiring specialized ASB management (eg, leukemia and lymphoma, solid organ transplant, and obstetrics).1 The study was declared quality improvement by the Johns Hopkins Institutional Review Board.
Intervention
In August 2015, we implemented a multifaceted intervention that included provider education and passive electronic CDS (supplementary Appendix 1 and supplementary Appendix 2). Materials were disseminated through hospital-wide computer workstation screensavers and a 1-page e-mailed newsletter to department of medicine clinicians. The CDS tool included simple informational messages recommending against urine testing without symptoms and against treating ASB; these messages accompanied electronic health record (EHR; Allscripts Sunrise Clinical Manager, Chicago, IL) orders for urinalysis, UC, and antibiotics commonly used within our institution to treat UTI (cefazolin, cephalexin, ceftriaxone, trimethoprim-sulfamethoxazole, nitrofurantoin, and ciprofloxacin). The information was displayed automatically when orders for these tests and antibiotics were selected; provider acknowledgment was not required to proceed.
Data Collection
The services within our hospital are geographically located. We collected orders for urinalysis, UC, and the associated antibiotics for all units except those housing patients excluded from our study. As the CDS tool appeared only in the inpatient EHR, only postadmission orders were included, excluding emergency department orders. For admissions with multiple urinalyses, urinalysis orders placed ≥72 hours apart were eligible. Only antibiotics ordered for ≥24 hours were included, excluding on-call and 1-time antibiotic orders.
Our approach to data collection attempted to model a clinician’s decision-making pathway from (1) ordering a urinalysis, to (2) ordering a UC in response to a urinalysis result, to (3) ordering antibiotics in response to a urinalysis or UC result. We focused on order placement rather than results to prioritize avoiding testing in asymptomatic patients, as our institution does not require positive urinalyses for UC testing (reflex testing). Urinalyses resulted within 1 to 2 hours, allowing for clinicians to quickly order UCs after urinalysis result review. Urinalysis and UC orders per monthly admissions were defined as (1) urinalyses, (2) UCs, (3) simultaneous urinalysis and UC (within 1 hour of each other), and (4) UCs ordered 1 to 24 hours after urinalysis. We also analyzed the following antibiotic orders per monthly admissions: (1) simultaneous urinalysis and antibiotic orders, (2) antibiotics ordered 1 to 24 hours after urinalysis order, and (3) antibiotics ordered within 24 hours of the UC result.
Outcome Measures
All outcome measures were calculated as the change over time per total monthly admissions in the preintervention and postintervention periods. In addition to symptoms, urinalysis is a critical, measurable early step in determining the presence of ASB. Therefore, the primary outcome measure was the postintervention change in monthly urinalysis orders, and the secondary outcome measure was the postintervention change in monthly UC orders. Additional outcome measures included monthly postintervention changes in (1) UC ordered 1 to 24 hours after urinalyses, (2) urinalyses and antibiotics ordered simultaneously, (3) antibiotic orders within 1 to 24 hours of urinalyses, and (4) antibiotics ordered within 24 hours of UC result.
Statistical Analysis
Statistical analyses were performed by using Stata (version 14.2; StataCorp LLC, College Station, TX). An interrupted time series analysis was performed to compare the change in orders per 100 monthly admissions in preintervention and postintervention periods. To do this, we created 2 separate segmented linear regression models for each dependent variable, pre- and postintervention. Normality was assumed because of large numbers. Rate differences per 100 monthly admissions are also calculated as the total number of orders divided by the total number of admissions in postintervention and preintervention periods with Mantel-Haenszel estimators. Differences were considered statistically significant at P ≤ .05.
RESULTS
DISCUSSION
A multifaceted but simple bundle of CDS and provider education reduced UC testing but not urinalyses in a large tertiary care hospital. The bundle also reduced antibiotic ordering in response to urinalyses as well as antibiotic ordering in response to UC results.
Other in-hospital CDS tools to decrease ASB treatment have focused only on ICUs.9,10 Our intervention was evaluated hospital-wide and included urinalyses and UCs. Our intervention was clinician directed and not laboratory directed, such as a positive urinalysis reflexing to a UC. Simultaneous urinalysis and UC testing may lead to ASB treatment, as clinicians treat the positive UC and ignore the negative urinalysis.11,12 Therefore, we focused on UCs being sent in response to urinalyses.
We chose to focus on laboratory testing data instead of administrative diagnoses for UTI. The sensitivity of administrative data to determine similar conditions such as catheter-associated UTIs is low (0%).13
Our single-center study may not be generalizable to other settings. We did not include emergency department patients, as this location used a different EHR. In addition, given the 600,000 yearly hospital admissions, it was impractical to assess the appropriateness of each antibiotic-based documentation of symptoms. Instead of focusing on symptoms of ASB or UTI diagnoses, we focused on ordering urinalysis, UC, and antibiotics. In investigating the antibiotics most frequently used to treat UTI in our hospital, we may have both missed some patients who were treated with other antibiotics for ASB (eg, 4th generation cephalosporins, penicillins, carbapenems, etc) and captured patients receiving antibiotics for indications other than UTI (eg, pneumonia). In our focus on overall ordering practices across a hospital, we did not capture data on bladder catheterization status or the predominant organism seen in UC. At the time of the intervention, the laboratory did not have the resources for urinalysis testing reflexing to UC. However, our intervention did not prevent ordering simultaneous urinalysis and UC in symptomatic patients in general or urosepsis in particular. With only 12 total time points, the interrupted time series analysis may have been underpowered.14 We also do not know if the intervention’s effect would decay over time.
Although the intervention took very little staff time and resources, alert fatigue was a risk.15 We attempted to mitigate this alert fatigue by making the CDS passive (in the form of a brief informational message) with no provider action required. In conversations with providers in our institution, there has been dissatisfaction with alerts requiring action, as these are thought to be overly intrusive. We are also not clear on which element of the intervention bundle (ie, the CDS or the educational intervention) may have had more of an impact, as the elements of the intervention bundle were rolled out simultaneously. It is possible and even probable that both elements are needed to raise awareness of the problem. Also, as our EHR required all interventions to be rolled out hospital-wide simultaneously, we were unable to randomize certain floors or providers to the CDS portion of the intervention bundle. Other analyses including the type of hospital unit were beyond the scope of this brief report.
Our intervention bundle was associated with reduced UC orders and reduced antibiotics ordered after urinalyses. If a provider does not know there is bacteriuria, then the provider will not be tempted to order antibiotics. This easily implementable bundle may play an important role as an antimicrobial stewardship strategy for ASB.
Acknowledgments
The authors acknowledge the support of Erin Fanning, BS, and Angel Florentin, BS, in providing data for analysis. SCK received funding from the Johns Hopkins Institute for Clinical and Translational Research (ICTR), which is funded in part by grant number KL2TR001077 from the National Center for Advancing Translational Sciences (NCATS), a component of the National Institutes of Health (NIH), and the NIH Roadmap for Medical Research. These contents are solely the responsibility of the authors and do not necessarily represent the official view of the Johns Hopkins ICTR, NCATS, or NIH. We also acknowledge support from the Centers for Disease Control and Prevention’s Prevention Epicenter Program Q8377 (collaborative agreement U54 CK000447 to SEC). SEC has received support for consulting from Novartis and Theravance, and her institution has received a grant from Pfizer Grants for Learning and Change/The Joint Commission. This work was supported by the NIH T32 HL116275 to NC. The content is solely the responsibility of the authors and does not necessarily represent the official views of the NIH.
Disclosure
No conflicts of interest have been reported by any author.
1. Nicolle LE, Bradley S, Colgan R, et al. Infectious Diseases Society of America guidelines for the diagnosis and treatment of asymptomatic bacteriuria in adults. Clin Infect Dis. 2005;40(5):643-654. PubMed
2. Cai T, Mazzoli S, Mondaini N, et al. The role of asymptomatic bacteriuria in young women with recurrent urinary tract infections: to treat or not to treat? Clin Infect Dis. 2012;55(6):771-777. PubMed
3. Cai T, Nesi G, Mazzoli S, et al. Asymptomatic bacteriuria treatment is associated with a higher prevalence of antibiotic resistant strains in women with urinary tract infections. Clin Infect Dis. 2015;61(11):1655-1661. PubMed
4. Infectious Diseases Society of America. Choosing Wisely: Five Things Physicians and Patients Should Question. 2015. http://www.choosingwisely.org/societies/infectious-diseases-society-of-america/. Accessed on September 11, 2016.
5. Yin P, Kiss A, Leis JA. Urinalysis Orders Among Patients Admitted to the General Medicine Service. JAMA Intern Med. 2015;175(10):1711-1713. PubMed
6. McGregor JC, Weekes E, Forrest GN, et al. Impact of a computerized clinical decision support system on reducing inappropriate antimicrobial use: a randomized controlled trial. J Am Med Inform Assoc. 2006;13(4):378-384. PubMed
7. Barlam TF, Cosgrove SE, Abbo LM, et al. Implementing an Antibiotic Stewardship Program: Guidelines by the Infectious Diseases Society of America and the Society for Healthcare Epidemiology of America. Clin Infect Dis. 2016;62(10):e51-e77. PubMed
8. Gonzales R, Anderer T, McCulloch CE, et al. A cluster randomized trial of decision support strategies for reducing antibiotic use in acute bronchitis. JAMA Intern Med. 2013;173(4):267-273. PubMed
9. Sarg M, Waldrop GE, Beier MA, et al. Impact of Changes in Urine Culture Ordering Practice on Antimicrobial Utilization in Intensive Care Units at an Academic Medical Center. Infect Control Hosp Epidemiol. 2016;37(4):448-454. PubMed
10. Mehrotra A, Linder JA. Tipping the Balance Toward Fewer Antibiotics. JAMA Intern Med. 2016;176(11):1649-1650. PubMed
11. Leis JA, Gold WL, Daneman N, Shojania K, McGeer A. Downstream impact of urine cultures ordered without indication at two acute care teaching hospitals. Infect Control Hosp Epidemiol. 2013;34(10):1113-1114. PubMed
12. Stagg A, Lutz H, Kirpalaney S, et al. Impact of two-step urine culture ordering in the emergency department: a time series analysis. BMJ Qual Saf. 2017. doi:10.1136/bmjqs-2016-006250. PubMed
13. Cass AL, Kelly JW, Probst JC, Addy CL, McKeown RE. Identification of device-associated infections utilizing administrative data. Am J Infect Control. 2013;41(12):1195-1199. PubMed
14. Zhang F, Wagner AK, Ross-Degnan D. Simulation-based power calculation for designing interrupted time series analyses of health policy interventions. J Clin Epidemiol. 2011;64(11):1252-1261. PubMed
15. Embi PJ, Leonard AC. Evaluating alert fatigue over time to EHR-based clinical trial alerts: findings from a randomized controlled study. J Am Med Inform Assoc. 2012;19(e1):e145-e148. PubMed
© 2017 Society of Hospital Medicine
Urine eosinophils for acute interstitial nephritis
The “Things We Do for No Reason” series reviews practices which have become common parts of hospital care but which may provide little value to our patients. Practices reviewed in the TWDFNR series do not represent “black and white” conclusions or clinical practice standards, but are meant as a starting place for research and active discussions among hospitalists and patients. We invite you to be part of that discussion. https://www.choosingwisely.org/

Acute interstitial nephritis (AIN) is an important cause of acute kidney injury (AKI) in the hospital setting. However, the diagnosis of AIN is challenging because of its nonspecific clinical manifestations and the invasiveness of kidney biopsy, the gold standard for diagnosis. Urine eosinophils (UEs) emerged several decades ago as a noninvasive alternative for diagnosing AIN. Initial studies found UEs had a significant diagnostic value, but these studies had small sample sizes, and the diagnosis of AIN was made on clinical grounds only, without biopsy confirmation. In this article, we review the literature on the diagnostic value of UEs in the diagnosis of AIN.
CASE REPORT
A 62-year-old woman with type 2 diabetes mellitus, systemic hypertension, coronary artery disease, and obesity is admitted for AKI found on routine laboratory testing. She has been taking amoxicillin and doxycycline for left leg cellulitis the past 5 days, but improvement has been minimal. On admission, blood pressure is 120/74 mm Hg, and heart rate is 89 beats per minute. Serum creatinine level is increased, from 0.7 mg/dL at baseline to 3.6 mg/dL on admission. Complete urinalysis reveals 1+ protein and presence of white blood cells and isormorphic red blood cells. No casts or crystals are seen. Given the possibility of AIN, UE testing is ordered. UEs are positive at 25%. Does this result significantly increase the patient’s posttest probability of having AIN?
WHY YOU MIGHT THINK ORDERING URINE EOSINOPHILS IN THE EVALUATION OF AIN IS HELPFUL
AKI occurs in more than 1 in 5 hospitalizations and is associated with a more than 4-fold increased likelihood of in-hospital mortality at 21 days.1 AIN is an important cause of AKI and has been found in 6% to 30% of AKI patients who had biopsies performed.2-4 AIN is characterized by infiltration of inflammatory cells in the kidney interstitium and is more commonly caused by drugs, especially beta-lactam antibiotics, and less commonly by autoimmune or systemic diseases and infections. As the signs and symptoms of AIN are nonspecific, and the gold-standard test is renal biopsy, diagnosticians have sought a noninvasive test, such as UEs.
In 1978, Galpin et al.5 found that UEs comprised 10% to 60% of urine white blood cells in 9 of 9 patients with methicillin-induced interstitial nephritis; 6 of the 9 had biopsy-proven AIN. In 1980, Linton et al.6 found UEs in 6 of 9 patients with drug-induced AIN; 8 of the 9 had biopsy-proven AIN. In 1986, Nolan et al.7 reported that, compared with Wright stain, Hansel stain was more sensitive in visualizing UEs; they did not use biopsy for confirmation. Wright-stain detection of UEs is limited by the variable staining characteristics of “eosinophilic” granules in body fluids other than blood. With Hansel stain, UEs are readily identified by their brilliant red-pink granules. These 3 small studies helped make UEs the go-to noninvasive test for assessing for AIN.8
WHY THERE IS LITTLE REASON TO ORDER URINE EOSINOPHILS IN PATIENTS WITH SUSPICION FOR AIN
While initial studies indicated UEs might be diagnostically helpful, subsequent studies did not. In 1985, Corwin et al.9 used Wright stain and found UEs in 65 of 470 adults with AKI. Only 9 (14%) of the 65 had a diagnosis of AIN, which was made mostly on clinical grounds. These findings showed that UEs were produced by other renal or urinary tract abnormalities, such as urinary tract infections, acute tubular necrosis, and glomerulonephritis. In a second study, Corwin et al.10 found that Hansel stain (vs Wright stain) improved the sensitivity of UEs for AIN diagnosis, from 25% to 62.5%. Sensitivity was improved at the expense of specificity, as Hansel stain was positive in other diagnoses as well. The AIN diagnosis was not confirmed by kidney biopsy in the large majority of patients in this study. Lack of confirmation by biopsy, the gold-standard diagnostic test, was a methodologic flaw of this study and others.
Sutton11 reviewed data from 10 studies and found AIN could not be reliably excluded in the absence of UEs (only 19 of 32 biopsy-confirmed AIN cases had UEs present). In addition, Ruffing et al.12 used Hansel stain and concluded that the positive predictive value of UEs was inadequate in diagnosing AIN. Only 6 of their 15 patients with AIN had positive UEs. Urine eosinophils were also present in patients with other diagnoses (glomerulonephritis, chronic kidney disease, acute pyelonephritis, prerenal azotemia). Like many other investigators, Ruffing et al. made the AIN diagnosis on clinical grounds in the large majority of cases.
Muriithi et al.13 reported similarly negative results in their retrospective AKI study involving 566 Mayo Clinic patients and spanning almost 2 decades. The study included patients who underwent both Hansel-stain UE testing and kidney biopsy within a week of each other. Only 28 (30%) of 91 biopsy-proven AIN cases were positive for UEs. Using the 1% cutoff for a positive UE test yielded only 30.8% sensitivity and 68.2% specificity. Using the 5% cutoff increased specificity to 91.2%, at the expense of sensitivity (19.2%); positive predictive value improved to only 30%, and negative predictive value remained relatively unchanged, at 85.6%. In short, Muriithi et al. found that UE testing had no utility in AIN diagnosis.
In summary, initial studies, such as those by Corwin et al,9,10 supported the conclusion that UEs are useful in AIN diagnosis but had questionable validity owing to methodologic issues, including small sample size and lack of biopsy confirmation of AIN. On the other hand, more recent studies, such as the one conducted by Muriithi et al.,13 had larger sample sizes and biopsy-proven diagnoses and confirmed the poor diagnostic value of UEs in AIN.
The poor sensitivity and specificity of UE tests can have important consequences. A false positive test may cause the clinician to incorrectly diagnose the patient with AIN and prompt the clinician to remove medications that may be vitally important. The clinician may also consider treating the patient with steroids empirically. A false negative test may inappropriately reassure the clinician that the patient does not have AIN and does not need cessation of the culprit drug. This may also lead the clinician to forego a necessary kidney biopsy.
WHAT YOU SHOULD DO INSTEAD
A history of recent exposure to a classic offending drug (eg, beta-lactam, proton pump inhibitor, nonsteroidal anti-inflammatory drug) in combination with the classic triad of fever, rash, and peripheral eosinophilia suggests an AIN diagnosis. However, less than 5% to 10% of patients present with this triad.14,15 Regardless of the triad’s presence, if other causes of AKI have been excluded, stopping a potential offending agent and monitoring for improvement are recommended. If a culprit drug cannot be safely discontinued, renal biopsy may be necessary for confirmation of the diagnosis. Moreover, if kidney function continues to deteriorate, a nephrology consultation may be warranted for guidance on the risks and benefits of performing a kidney biopsy to confirm the diagnosis and/or the use of corticosteroids.
RECOMMENDATIONS
- Urine eosinophils should not be used in the diagnosis of AIN.
- The clinical diagnosis of drug-associated AIN should be based on excluding other possible likely etiologies of AKI and confirming the history of drug exposure. This is reinforced when kidney function improves upon discontinuation of offending agent.
- Kidney biopsy is the gold standard for AIN and should be performed if the clinical picture is unclear or the renal function is not improving upon discontinuation of offending agent.

CONCLUSION
Since the mid-1980s, studies have found that UEs are too insensitive and nonspecific to confirm or exclude the diagnosis of AIN in patients with AKI (Table). UEs are seen in other AKI etiologies, such as pyelonephritis, acute tubular necrosis, atheroembolic renal disease, and glomerulonephritis. Current evidence-based medicine does not support use of UEs as a biomarker for AIN. False-positive and false-negative results confuse the overall picture and result either in discontinuation of important medications and unnecessary steroid treatment or in delayed removal of a culprit medication.16
Our case’s positive UE test does not affect the posttest probability that our patient has AIN. Presence of a culprit drug and absence of clinical data suggesting an alternative diagnosis would lead most clinicians to change antibiotic therapy and observe for improvement in renal function.
Disclosure
Nothing to report.
Do you think this is a low-value practice? Is this truly a “Thing We Do for No Reason?” Share what you do in your practice and join in the conversation online by retweeting it on Twitter (#TWDFNR) and Liking It on Facebook. We invite you to propose ideas for other “Things We Do for No Reason” topics by emailing TWDFNR@hospitalmedicine.org.
1. Wang HE, Muntner P, Chertow GM, Warnock DG. Acute kidney injury and mortality in hospitalized patients. Am J Nephrol. 2012;35(4):349-355.
2. Farrington K, Levison DA, Greenwood RN, Cattell WR, Baker LR. Renal biopsy in patients with unexplained renal impairment and normal kidney size. Q J Med. 1989;70(263):221-233.
3. Michel DM, Kelly CJ. Acute interstitial nephritis. J Am Soc Nephrol. 1998;9(3):506-515.
4. Neilson EG. Pathogenesis and therapy of interstitial nephritis. Kidney Int. 1989;35(5):1257-1270.
5. Galpin JE, Shinaberger JH, Stanley TM, et al. Acute interstitial nephritis due to methicillin. Am J Med. 1978;65(5):756-765.
6. Linton AL, Clark WF, Driedger AA, Turnbull DI, Lindsay RM. Acute interstitial nephritis due to drugs: review of the literature with a report of nine cases. Ann Intern Med. 1980;93(5):735-741.
7. Nolan CR 3rd, Anger MS, Kelleher SP. Eosinophiluria—a new method of detection and definition of the clinical spectrum. N Engl J Med. 1986;315(24):1516-1519.
8. Perazella MA, Bomback AS. Urinary eosinophils in AIN: farewell to an old biomarker? Clin J Am Soc Nephrol. 2013;8(11):1841-1843.
9. Corwin HL, Korbet SM, Schwartz MM. Clinical correlates of eosinophiluria. Arch Intern Med. 1985;145(6):1097-1099.
10. Corwin HL, Bray RA, Haber MH. The detection and interpretation of urinary eosinophils. Arch Pathol Lab Med. 1989;113(11):1256-1258.
11. Sutton JM. Urinary eosinophils. Arch Intern Med. 1986;146(11):2243-2244.
12. Ruffing KA, Hoppes P, Blend D, Cugino A, Jarjoura D, Whittier FC. Eosinophils in urine revisited. Clin Nephrol. 1994;41(3):163-166.
13. Muriithi AK, Nasr SH, Leung N. Utility of urine eosinophils in the diagnosis of acute interstitial nephritis. Clin J Am Soc Nephrol. 2013;8(11):1857-1862.
14. Clarkson MR, Giblin L, O’Connell FP, et al. Acute interstitial nephritis: clinical features and response to corticosteroid therapy. Nephrol Dial Transplant. 2004;19(11):2778-2783.
15. Rossert J. Drug-induced acute interstitial nephritis. Kidney Int. 2001;60(2):804-817.
16. Fletcher A. Eosinophiluria and acute interstitial nephritis. N Engl J Med. 2008;358(16):1760-1761.
The “Things We Do for No Reason” series reviews practices which have become common parts of hospital care but which may provide little value to our patients. Practices reviewed in the TWDFNR series do not represent “black and white” conclusions or clinical practice standards, but are meant as a starting place for research and active discussions among hospitalists and patients. We invite you to be part of that discussion. https://www.choosingwisely.org/
Acute interstitial nephritis (AIN) is an important cause of acute kidney injury (AKI) in the hospital setting. However, the diagnosis of AIN is challenging because of its nonspecific clinical manifestations and the invasiveness of kidney biopsy, the gold standard for diagnosis. Urine eosinophils (UEs) emerged several decades ago as a noninvasive alternative for diagnosing AIN. Initial studies found UEs had a significant diagnostic value, but these studies had small sample sizes, and the diagnosis of AIN was made on clinical grounds only, without biopsy confirmation. In this article, we review the literature on the diagnostic value of UEs in the diagnosis of AIN.
CASE REPORT
A 62-year-old woman with type 2 diabetes mellitus, systemic hypertension, coronary artery disease, and obesity is admitted for AKI found on routine laboratory testing. She has been taking amoxicillin and doxycycline for left leg cellulitis the past 5 days, but improvement has been minimal. On admission, blood pressure is 120/74 mm Hg, and heart rate is 89 beats per minute. Serum creatinine level is increased, from 0.7 mg/dL at baseline to 3.6 mg/dL on admission. Complete urinalysis reveals 1+ protein and presence of white blood cells and isormorphic red blood cells. No casts or crystals are seen. Given the possibility of AIN, UE testing is ordered. UEs are positive at 25%. Does this result significantly increase the patient’s posttest probability of having AIN?
WHY YOU MIGHT THINK ORDERING URINE EOSINOPHILS IN THE EVALUATION OF AIN IS HELPFUL
AKI occurs in more than 1 in 5 hospitalizations and is associated with a more than 4-fold increased likelihood of in-hospital mortality at 21 days.1 AIN is an important cause of AKI and has been found in 6% to 30% of AKI patients who had biopsies performed.2-4 AIN is characterized by infiltration of inflammatory cells in the kidney interstitium and is more commonly caused by drugs, especially beta-lactam antibiotics, and less commonly by autoimmune or systemic diseases and infections. As the signs and symptoms of AIN are nonspecific, and the gold-standard test is renal biopsy, diagnosticians have sought a noninvasive test, such as UEs.
In 1978, Galpin et al.5 found that UEs comprised 10% to 60% of urine white blood cells in 9 of 9 patients with methicillin-induced interstitial nephritis; 6 of the 9 had biopsy-proven AIN. In 1980, Linton et al.6 found UEs in 6 of 9 patients with drug-induced AIN; 8 of the 9 had biopsy-proven AIN. In 1986, Nolan et al.7 reported that, compared with Wright stain, Hansel stain was more sensitive in visualizing UEs; they did not use biopsy for confirmation. Wright-stain detection of UEs is limited by the variable staining characteristics of “eosinophilic” granules in body fluids other than blood. With Hansel stain, UEs are readily identified by their brilliant red-pink granules. These 3 small studies helped make UEs the go-to noninvasive test for assessing for AIN.8
WHY THERE IS LITTLE REASON TO ORDER URINE EOSINOPHILS IN PATIENTS WITH SUSPICION FOR AIN
While initial studies indicated UEs might be diagnostically helpful, subsequent studies did not. In 1985, Corwin et al.9 used Wright stain and found UEs in 65 of 470 adults with AKI. Only 9 (14%) of the 65 had a diagnosis of AIN, which was made mostly on clinical grounds. These findings showed that UEs were produced by other renal or urinary tract abnormalities, such as urinary tract infections, acute tubular necrosis, and glomerulonephritis. In a second study, Corwin et al.10 found that Hansel stain (vs Wright stain) improved the sensitivity of UEs for AIN diagnosis, from 25% to 62.5%. Sensitivity was improved at the expense of specificity, as Hansel stain was positive in other diagnoses as well. The AIN diagnosis was not confirmed by kidney biopsy in the large majority of patients in this study. Lack of confirmation by biopsy, the gold-standard diagnostic test, was a methodologic flaw of this study and others.
Sutton11 reviewed data from 10 studies and found AIN could not be reliably excluded in the absence of UEs (only 19 of 32 biopsy-confirmed AIN cases had UEs present). In addition, Ruffing et al.12 used Hansel stain and concluded that the positive predictive value of UEs was inadequate in diagnosing AIN. Only 6 of their 15 patients with AIN had positive UEs. Urine eosinophils were also present in patients with other diagnoses (glomerulonephritis, chronic kidney disease, acute pyelonephritis, prerenal azotemia). Like many other investigators, Ruffing et al. made the AIN diagnosis on clinical grounds in the large majority of cases.
Muriithi et al.13 reported similarly negative results in their retrospective AKI study involving 566 Mayo Clinic patients and spanning almost 2 decades. The study included patients who underwent both Hansel-stain UE testing and kidney biopsy within a week of each other. Only 28 (30%) of 91 biopsy-proven AIN cases were positive for UEs. Using the 1% cutoff for a positive UE test yielded only 30.8% sensitivity and 68.2% specificity. Using the 5% cutoff increased specificity to 91.2%, at the expense of sensitivity (19.2%); positive predictive value improved to only 30%, and negative predictive value remained relatively unchanged, at 85.6%. In short, Muriithi et al. found that UE testing had no utility in AIN diagnosis.
In summary, initial studies, such as those by Corwin et al,9,10 supported the conclusion that UEs are useful in AIN diagnosis but had questionable validity owing to methodologic issues, including small sample size and lack of biopsy confirmation of AIN. On the other hand, more recent studies, such as the one conducted by Muriithi et al.,13 had larger sample sizes and biopsy-proven diagnoses and confirmed the poor diagnostic value of UEs in AIN.
The poor sensitivity and specificity of UE tests can have important consequences. A false positive test may cause the clinician to incorrectly diagnose the patient with AIN and prompt the clinician to remove medications that may be vitally important. The clinician may also consider treating the patient with steroids empirically. A false negative test may inappropriately reassure the clinician that the patient does not have AIN and does not need cessation of the culprit drug. This may also lead the clinician to forego a necessary kidney biopsy.
WHAT YOU SHOULD DO INSTEAD
A history of recent exposure to a classic offending drug (eg, beta-lactam, proton pump inhibitor, nonsteroidal anti-inflammatory drug) in combination with the classic triad of fever, rash, and peripheral eosinophilia suggests an AIN diagnosis. However, less than 5% to 10% of patients present with this triad.14,15 Regardless of the triad’s presence, if other causes of AKI have been excluded, stopping a potential offending agent and monitoring for improvement are recommended. If a culprit drug cannot be safely discontinued, renal biopsy may be necessary for confirmation of the diagnosis. Moreover, if kidney function continues to deteriorate, a nephrology consultation may be warranted for guidance on the risks and benefits of performing a kidney biopsy to confirm the diagnosis and/or the use of corticosteroids.
RECOMMENDATIONS
- Urine eosinophils should not be used in the diagnosis of AIN.
- The clinical diagnosis of drug-associated AIN should be based on excluding other possible likely etiologies of AKI and confirming the history of drug exposure. This is reinforced when kidney function improves upon discontinuation of offending agent.
- Kidney biopsy is the gold standard for AIN and should be performed if the clinical picture is unclear or the renal function is not improving upon discontinuation of offending agent.
CONCLUSION
Since the mid-1980s, studies have found that UEs are too insensitive and nonspecific to confirm or exclude the diagnosis of AIN in patients with AKI (Table). UEs are seen in other AKI etiologies, such as pyelonephritis, acute tubular necrosis, atheroembolic renal disease, and glomerulonephritis. Current evidence-based medicine does not support use of UEs as a biomarker for AIN. False-positive and false-negative results confuse the overall picture and result either in discontinuation of important medications and unnecessary steroid treatment or in delayed removal of a culprit medication.16
Our case’s positive UE test does not affect the posttest probability that our patient has AIN. Presence of a culprit drug and absence of clinical data suggesting an alternative diagnosis would lead most clinicians to change antibiotic therapy and observe for improvement in renal function.
Disclosure
Nothing to report.
Do you think this is a low-value practice? Is this truly a “Thing We Do for No Reason?” Share what you do in your practice and join in the conversation online by retweeting it on Twitter (#TWDFNR) and Liking It on Facebook. We invite you to propose ideas for other “Things We Do for No Reason” topics by emailing TWDFNR@hospitalmedicine.org.
1. Wang HE, Muntner P, Chertow GM, Warnock DG. Acute kidney injury and mortality in hospitalized patients. Am J Nephrol. 2012;35(4):349-355.
2. Farrington K, Levison DA, Greenwood RN, Cattell WR, Baker LR. Renal biopsy in patients with unexplained renal impairment and normal kidney size. Q J Med. 1989;70(263):221-233.
3. Michel DM, Kelly CJ. Acute interstitial nephritis. J Am Soc Nephrol. 1998;9(3):506-515.
4. Neilson EG. Pathogenesis and therapy of interstitial nephritis. Kidney Int. 1989;35(5):1257-1270.
5. Galpin JE, Shinaberger JH, Stanley TM, et al. Acute interstitial nephritis due to methicillin. Am J Med. 1978;65(5):756-765.
6. Linton AL, Clark WF, Driedger AA, Turnbull DI, Lindsay RM. Acute interstitial nephritis due to drugs: review of the literature with a report of nine cases. Ann Intern Med. 1980;93(5):735-741.
7. Nolan CR 3rd, Anger MS, Kelleher SP. Eosinophiluria—a new method of detection and definition of the clinical spectrum. N Engl J Med. 1986;315(24):1516-1519.
8. Perazella MA, Bomback AS. Urinary eosinophils in AIN: farewell to an old biomarker? Clin J Am Soc Nephrol. 2013;8(11):1841-1843.
9. Corwin HL, Korbet SM, Schwartz MM. Clinical correlates of eosinophiluria. Arch Intern Med. 1985;145(6):1097-1099.
10. Corwin HL, Bray RA, Haber MH. The detection and interpretation of urinary eosinophils. Arch Pathol Lab Med. 1989;113(11):1256-1258.
11. Sutton JM. Urinary eosinophils. Arch Intern Med. 1986;146(11):2243-2244.
12. Ruffing KA, Hoppes P, Blend D, Cugino A, Jarjoura D, Whittier FC. Eosinophils in urine revisited. Clin Nephrol. 1994;41(3):163-166.
13. Muriithi AK, Nasr SH, Leung N. Utility of urine eosinophils in the diagnosis of acute interstitial nephritis. Clin J Am Soc Nephrol. 2013;8(11):1857-1862.
14. Clarkson MR, Giblin L, O’Connell FP, et al. Acute interstitial nephritis: clinical features and response to corticosteroid therapy. Nephrol Dial Transplant. 2004;19(11):2778-2783.
15. Rossert J. Drug-induced acute interstitial nephritis. Kidney Int. 2001;60(2):804-817.
16. Fletcher A. Eosinophiluria and acute interstitial nephritis. N Engl J Med. 2008;358(16):1760-1761.
© 2017 Society of Hospital Medicine
Letter to the Editor/
We certainly agree with Dr. LaBrin that there are a minority of inpatients and outpatients who might benefit from nebulizer therapy. In our review article,[1] we attempted not to make a sweeping generalization, even if we did not explicitly mention some chronic obstructive pulmonary disease patients with suboptimal peak inspiratory flow rate (PIFR) or those with neuromuscular disease as populations where nebulizer therapy may be preferred. Our recommendation included this statement: Inpatient use of nebulizers may be more appropriate than metered‐dose inhalers (MDIs) for patients with dementia or altered mental status, as well as those in extreme distress resulting in an inability to coordinate inhaler usage. Very low health literacy may be an additional barrier to appropriate MDI teaching and usage.[1] Our list was not all‐inclusive, and patients with suboptimal PIFR or with neuromuscular disease are good additions to this recommendation.
As for proper MDI technique, it is unclear whether MDI teaching will result in long‐term mastery of the skill.[2] The only way to master a skill is to practice it. Thus, by prescribing MDIs and training patients on their proper usage during every admission, we will provide medically appropriate patients with many opportunities to practice the skill and reinforce effective techniques.
- , . Nebulized bronchodilators instead of metered‐dose inhalers for obstructive pulmonary symptoms. J Hosp Med. 2015;10(10):691–693.
- , , , et al. Misuse of respiratory inhalers in hospitalized patients with asthma or COPD. J Gen Intern Med. 2011;26(6):635–642.
We certainly agree with Dr. LaBrin that there are a minority of inpatients and outpatients who might benefit from nebulizer therapy. In our review article,[1] we attempted not to make a sweeping generalization, even if we did not explicitly mention some chronic obstructive pulmonary disease patients with suboptimal peak inspiratory flow rate (PIFR) or those with neuromuscular disease as populations where nebulizer therapy may be preferred. Our recommendation included this statement: Inpatient use of nebulizers may be more appropriate than metered‐dose inhalers (MDIs) for patients with dementia or altered mental status, as well as those in extreme distress resulting in an inability to coordinate inhaler usage. Very low health literacy may be an additional barrier to appropriate MDI teaching and usage.[1] Our list was not all‐inclusive, and patients with suboptimal PIFR or with neuromuscular disease are good additions to this recommendation.
As for proper MDI technique, it is unclear whether MDI teaching will result in long‐term mastery of the skill.[2] The only way to master a skill is to practice it. Thus, by prescribing MDIs and training patients on their proper usage during every admission, we will provide medically appropriate patients with many opportunities to practice the skill and reinforce effective techniques.
- , . Nebulized bronchodilators instead of metered‐dose inhalers for obstructive pulmonary symptoms. J Hosp Med. 2015;10(10):691–693.
- , , , et al. Misuse of respiratory inhalers in hospitalized patients with asthma or COPD. J Gen Intern Med. 2011;26(6):635–642.
- , . Nebulized bronchodilators instead of metered‐dose inhalers for obstructive pulmonary symptoms. J Hosp Med. 2015;10(10):691–693.
- , , , et al. Misuse of respiratory inhalers in hospitalized patients with asthma or COPD. J Gen Intern Med. 2011;26(6):635–642.
CK‐MB for Chest Pain and Suspected ACS
The Things We Do for No Reason (TWDFNR) series reviews practices which have become common parts of hospital care but which may provide little value to our patients. Practices reviewed in the TWDFNR series do not represent black and white conclusions or clinical practice standards, but are meant as a starting place for research and active discussions among hospitalists and patients. We invite you to be part of that discussion. https://www.choosingwisely.org/
CASE PRESENTATION
A 45‐year‐old man with medically controlled hypertension and a 40‐pack‐year smoking history presents to the emergency room complaining of intermittent chest pain for several days. He first noticed a sharp, knifelike sensation in the center of his chest when he reached for a glass in his kitchen a few days ago. The pain lasted for 30 seconds and resolved spontaneously. Since this time, he has had 2 subsequent episodes unrelated to exertion or rest. His physical exam is unremarkable, except for a body mass index of 29. An initial electrocardiogram shows no ischemic changes and no evidence of prior myocardial infarction.
He is currently chest‐painfree and admitted to the inpatient telemetry floor. Is ordering serial sets of creatine kinase (CK), creatine kinase‐myocardial band (CK‐MB), and troponin the most high‐value method to evaluate him for acute coronary syndrome (ACS)?
WHY YOU MIGHT THINK CK‐MB TESTING IS HELPFUL
CK‐MB has been used for 4 decades in the diagnostic evaluation of patients with chest pain and suspected ACS. Despite the advent of a more sensitive and specific test for myocardial injurythe cardiac troponinnearly 3 decades ago, 75% of US clinical pathology laboratories perform both CK‐MB and troponin assays, suggesting that many US physicians continue to order both tests in evaluating patients with chest pain.[1] There are several clinical scenarios in which physicians generally regard CK‐MB testing as useful in addition to troponin. These scenarios include CK‐MB testing (1) for the diagnosis of ACS in special patient populations, like those with acute or chronic renal disease, who are thought to have chronically elevated troponins as a function of their renal disease and not myocardial disease; (2) for additional prognostic information in the setting of a minimally elevated troponin; (3) for the detection of reinfarction, in which troponin is thought to be inferior to CK‐MB; and (4) for estimation of infarct size.
WHY CK‐MB TESTING ADDS NO ADDITIONAL VALUE TO TROPONIN TESTING IN DIAGNOSIS OF ACS
Is CK‐MB More Accurate Than Troponin in the Diagnosis of ACS?
Numerous studies have established that CK‐MB is not as specific as troponin for detecting myocardial injury and will result in more false‐positive tests.[2, 3] CK‐MB can be elevated in the setting of acute muscle injury (in 60% of patients), as well as chronic muscle disease (in 80% of patients). In contrast, troponin (I or T), a protein exclusively found in cardiac myocytes, is only elevated due to myocardial injury and is therefore more specific for ACS than CK‐MB.[2] In a study of patients with both skeletal muscle injury and suspected ACS, the respective specificities of troponin and CK‐MB were 94% and 63%, respectively.[3] In special patient populations, like those with chronic renal disease, both troponin and CK‐MB can be elevated in the absence of ACS; the mechanism for cardiac enzyme elevation is unclear. Importantly, there is no evidence to support the incremental value of CK‐MB over troponin alone in this population.[4, 5] Despite chronic troponin and CK‐MB elevations in some patients with chronic renal failure, it is still possible for these patients to have acute changes from baseline that represent myocardial injury. In these patients, cardiac biomarker results must be considered in the context of other clinical features (ie, the patient history, physical exam, and electrocardiogram findings) in making or excluding the diagnosis of ACS.
Does CK‐MB Diagnose ACS More Rapidly Than Troponin?
In patients with myocardial injury, both troponin and CK‐MB typically are detectable in the bloodstream within 2 to 4 hours of symptom onset and peak within 12 to 18 hours; neither has been established as a more rapid biomarker for the detection of myocardial infarction.[6] Furthermore, a systemic review of point‐of‐care cardiac enzyme testing reported that troponin and CK‐MB had similar positive and negative predictive values for diagnosing acute myocardial infarction (AMI) within the first 6 hours of symptom onset.[7]
Does CK‐MB Add Prognostic Information in Addition to Troponin in Patients With ACS?
If CK‐MB adds additional prognostic information in patients with suspected ACS and normal troponin values, then we should continue using it. Based on several large registries of patients with chest pain and/or ACS, approximately 8% to 28% of patients have discordant CK‐MB and troponin values, where 1 value is normal while the other value is abnormal. Several studies have examined whether an abnormal CK‐MB, in the setting of a normal troponin, offers additional prognostic information in comparison with normal values of both biomarkers.
In the CRUSADE (Can Rapid risk stratification of Unstable angina patients Suppress ADverse outcomes with Early implementation of the American College of Cardiology/American Heart Association guidelines) registry, a cohort of 29,357 patients with ACS was retrospectively divided into 4 groups: (1) patients with abnormal CK‐MB (CK‐MB+) and troponin (Tn+) values (ie, double‐positive group); (2) patients with normal CK‐MB (CK‐MB) and troponin (Tn) values (ie, double‐negative group); (3) patients with CK‐MB+/Tn; and (4) patients with CK‐MB/Tn+ values. Among the 4 groups, the rate of in‐hospital mortality was not significantly different between CK‐MB+/Tn (group 3) and patients with double‐negative (ie, normal) values. However, the presence of an abnormal troponin, regardless of CK‐MB status, was associated with an increased risk of in‐hospital death. The authors concluded that in clinical practice, there is little advantage of simultaneous CK‐MB and cTn testing for risk stratification in patients with high‐risk ACS presentations.[8]
In addition to the CRUSADE registry, 2 smaller registries, involving different patient populations, have reported similar results. An analysis of the Global Registry of Acute Coronary Events (GRACE) registry of 10,719 patients with ACS reported no difference between CK‐MB+/Tn patients and double‐negative patients with respect to in‐hospital mortality, as well as 6‐month mortality.[9] In the Internet Tracking Registry of Acute Coronary Syndromes (ITRACS) registry, 8769 patients presenting to emergency rooms with chest pain were analyzed. A minority (18.4%) were ultimately diagnosed with ACS. The authors found that an abnormal troponin, irrespective of CK‐MB status, was associated with an increased in‐hospital mortality rate. In‐hospital death rates were similar between CK‐MB+/Tn and double‐negative patients.[10]
In summary, troponin offers important prognostic information regardless of the CK‐MB result.
Is CK‐MB More Accurate for Diagnosing Reinfarction (Repeat Infarction in Patients With Recent Acute Myocardial Infarction)?
Whereas CK‐MB typically returns to normal within 2 to 3 days, troponin can be elevated for up to 5 to 14 days. Consequently, some have argued that CK‐MB may be more accurate in detecting reinfarction. In the only study to date comparing CK‐MB and troponin patterns in 9 patients with reinfarction, the rise and fall of both biomarkers were similar. Furthermore, those patients with persistently elevated troponin values from baseline (after the initial infarction) experienced a significant rise in troponin with reinfarction.[11]
Is CK‐MB More Accurate for Estimating Infarct Size?
Some have argued that a peak CK‐MB value is more accurate than a peak troponin value for estimating infarct size. However, 2 comparative studies have reported that troponin is as good as and possibly superior to CK‐MB for estimating infarct size. In a study of 65 patients with AMI, a single troponin T measurement obtained 72 hours after coronary care unit admission significantly correlated with peak CK‐MB in estimating infarct size (r=0.76, P<0.001), using single‐photon emission computed tomography imaging as the gold standard.[12] In a similar study of 37 patients with AMI, a single troponin T value had a significantly higher correlation with infarct size than serial and peak CK‐MB. Unlike CK‐MB, the ability of troponin T to predict infarct size was independent of coronary reperfusion.[13]
What do Guidelines and Thought Leaders Say About Using CK‐MB?
The most recent Third Universal Definition of Myocardial Infarction states that troponin is the preferred (cardiac) biomarker‐overall and for each specific category of MI, and that CK‐MB should be considered an alternative if troponin is not available.[14] Several national guidelines endorse troponin as the primary cardiac biomarker for diagnosis of ACS.[15, 16, 17] Finally, several groups have called for the elimination of CK‐MB. In 2008, 2 experts in the field of cardiovascular laboratory medicine argued that CK‐MB test adds little to no incremental information but does add cost andconfusion. Their institution, the Mayo Clinic, removed CK‐MB from their cardiac biomarker panel without any discernible negative effects on clinical care.[6] In a more recent publication, a group of authors from the departments of pathology and laboratory medicine of 7 major US academic medical centers identified CK‐MB as part of a top 10 list of antiquated tests that no longer provide value.[18]
WHAT YOU SHOULD DO INSTEAD: ORDER TROPONIN ALONE
In all cases where a patient presents with chest pain and/or symptoms concerning for ACS, we recommend that troponin be ordered alone. CK‐MB is no longer necessary as an additional test. As healthcare providers, we aim to provide the highest healthcare valuedefined as clinical benefit divided by cost. Routine ordering of CK‐MB offers essentially no benefit but does come at a significant cost. Each CK‐MB costs roughly $40 to $50 a test. If CK‐MB is used in approximately 2 million patients annually diagnosed with ACS and a proportion of the 17 million patients annually evaluated for chest pain, the potential cost, without clear benefit, is substantial.[19]
RECOMMENDATIONS
- In patients suspected of having ACS, troponin should be measured in lieu of CK‐MB and serial CK testing to evaluate for myocardial injury.
- CK‐MB tests should not be ordered routinely for patients suspected of having ACS. Hospitals should remove CK‐MB from pathology lab catalogs or require specific permission to order it.
CONCLUSION
Because CK‐MB, as compared to troponin, is detectable in the bloodstream in a similar timeframe, adds no additional prognostic information, estimates infarct size no differently, and appears to diagnose reinfarction no differently (Table 1), the authors believe that CK‐MB should no longer be ordered for patients with suspected ACS, unless ordering troponin is not an option. Ordering CK‐MB and serial CK for the evaluation of ACS is a Thing We Do for No Reason.
| Test Characteristic | CK‐MB | Troponin |
|---|---|---|
| ||
| Sensitivity | Lower than troponin | Higher than CK‐MB |
| Specificity | 60% to 70% | >94% |
| Diagnostic accuracy in patients with chronic renal failure | Equivalent | Equivalent |
| Rapidity of diagnosis | 24 hours | 2‐4 hours |
| Estimation of infarct size | Equivalent or possibly inferior to troponin | Equivalent or possibly superior to CK‐MB |
| Diagnosis of reinfarction | Equivalent | Equivalent |
Disclosures
Nothing to report.
Do you think this is a low‐value practice? Is this truly a Thing We Do for No Reason? Share what you do in your practice and join in the conversation online by retweeting it on Twitter (#TWDFNR) and Liking It on Facebook. We invite you to propose ideas for other Things We Do for No Reason topics by emailing
- , Creatine kinase‐MB: the journey to obsolescence. Am J Clin Pathol. 2014;141:415–419.
- , , , et al. Diagnostic efficiency of troponin T measurements in acute myocardial infarction. Circulation. 1991;83:902–912.
- , , , et al. Cardiac troponin I: a marker with high specificity for cardiac injury. Circulation. 1993:88:101–106.
- , Cardiac troponin I in patients with chronic kidney disease stage 3 to 5 in conditions other than acute coronary syndrome. Clin Lab. 2014;60(2):281–290.
- , , , , Unmasking artifactual increases in creatine kinase isoenzymes in patients with renal failure. J Clin Lab Med. 1984;104:193–202.
- , Requiem for a heavyweight: the demise of creatine kinase‐MB. Circulation. 2008;118(21):2200–2206.
- , , , , Int J Cardiol. 2013;168(6):5355–5362.
- , , , et al. Frequency and clinical implications of discordant creatine kinase‐MB and troponin measurements in acute coronary syndromes. J Am Coll Cardiol. 2006;47(2):312–318.
- , , , et al.; GRACE Investigators. The diagnostic and prognostic impact of the redefinition of acute myocardial infarction: lessons from the Global Registry of Acute Coronary Events (GRACE). Am Heart J. 2006;151(3):654–660.
- , , , et al.; EMCREG‐i*trACS Investigators. Discordant cardiac biomarkers: frequency and outcomes in emergency department patients with chest pain. Ann Emerg Med. 2006:48(6):660–665.
- , Cardiac troponin and creatine kinase MB monitoring during in‐hospital myocardial reinfarction. Clin Chem. 2005;51:460–463.
- , , , , , Single‐point cardiac troponin T at coronary care unit discharge after myocardial infarction correlates with infarct size and ejection fraction. Clin Chem. 2002;48:1432–1436
- , , , , , Troponin T concentrations 72 hours after myocardial infarction as a serological estimate of infarct size. Heart. 2002;87:520–524.
- , , , et al. Third universal definition of myocardial infarction. Circulation. 2012;126(16):2020–2035.
- , , , et al. Institute for Clinical Systems Improvement. Diagnosis and Treatment of Chest Pain and Acute Coronary Syndrome (ACS). Available at: http://bit.ly.ACS1112. Updated November 2012.
- , , , et al. 2012 ACCF/AHA focused update incorporated into the ACCF/AHA 2007 guidelines for the management of patients with unstable angina/non‐ST‐elevation myocardial infarction. J Am Coll Cardiol. 2013;61(23):e179–e347.
- American College of Emergency Physicians; Society for Cardiovascular Angiography and Interventions, , , , et al. 2013 ACCF/AHA guideline for the management of ST‐elevation myocardial infarction. J Am Coll Cardiol. 2013;61(4):e78–e140.
- , , , , , Antiquated tests within the clinical pathology laboratory. Am J Manag Care. 2010;16(9):e220–e227.
- , , , , Reducing excess cardiac biomarker testing at an academic medical center. J Gen Intern Med. 2014;29(11):1468–1474.
The Things We Do for No Reason (TWDFNR) series reviews practices which have become common parts of hospital care but which may provide little value to our patients. Practices reviewed in the TWDFNR series do not represent black and white conclusions or clinical practice standards, but are meant as a starting place for research and active discussions among hospitalists and patients. We invite you to be part of that discussion. https://www.choosingwisely.org/
CASE PRESENTATION
A 45‐year‐old man with medically controlled hypertension and a 40‐pack‐year smoking history presents to the emergency room complaining of intermittent chest pain for several days. He first noticed a sharp, knifelike sensation in the center of his chest when he reached for a glass in his kitchen a few days ago. The pain lasted for 30 seconds and resolved spontaneously. Since this time, he has had 2 subsequent episodes unrelated to exertion or rest. His physical exam is unremarkable, except for a body mass index of 29. An initial electrocardiogram shows no ischemic changes and no evidence of prior myocardial infarction.
He is currently chest‐painfree and admitted to the inpatient telemetry floor. Is ordering serial sets of creatine kinase (CK), creatine kinase‐myocardial band (CK‐MB), and troponin the most high‐value method to evaluate him for acute coronary syndrome (ACS)?
WHY YOU MIGHT THINK CK‐MB TESTING IS HELPFUL
CK‐MB has been used for 4 decades in the diagnostic evaluation of patients with chest pain and suspected ACS. Despite the advent of a more sensitive and specific test for myocardial injurythe cardiac troponinnearly 3 decades ago, 75% of US clinical pathology laboratories perform both CK‐MB and troponin assays, suggesting that many US physicians continue to order both tests in evaluating patients with chest pain.[1] There are several clinical scenarios in which physicians generally regard CK‐MB testing as useful in addition to troponin. These scenarios include CK‐MB testing (1) for the diagnosis of ACS in special patient populations, like those with acute or chronic renal disease, who are thought to have chronically elevated troponins as a function of their renal disease and not myocardial disease; (2) for additional prognostic information in the setting of a minimally elevated troponin; (3) for the detection of reinfarction, in which troponin is thought to be inferior to CK‐MB; and (4) for estimation of infarct size.
WHY CK‐MB TESTING ADDS NO ADDITIONAL VALUE TO TROPONIN TESTING IN DIAGNOSIS OF ACS
Is CK‐MB More Accurate Than Troponin in the Diagnosis of ACS?
Numerous studies have established that CK‐MB is not as specific as troponin for detecting myocardial injury and will result in more false‐positive tests.[2, 3] CK‐MB can be elevated in the setting of acute muscle injury (in 60% of patients), as well as chronic muscle disease (in 80% of patients). In contrast, troponin (I or T), a protein exclusively found in cardiac myocytes, is only elevated due to myocardial injury and is therefore more specific for ACS than CK‐MB.[2] In a study of patients with both skeletal muscle injury and suspected ACS, the respective specificities of troponin and CK‐MB were 94% and 63%, respectively.[3] In special patient populations, like those with chronic renal disease, both troponin and CK‐MB can be elevated in the absence of ACS; the mechanism for cardiac enzyme elevation is unclear. Importantly, there is no evidence to support the incremental value of CK‐MB over troponin alone in this population.[4, 5] Despite chronic troponin and CK‐MB elevations in some patients with chronic renal failure, it is still possible for these patients to have acute changes from baseline that represent myocardial injury. In these patients, cardiac biomarker results must be considered in the context of other clinical features (ie, the patient history, physical exam, and electrocardiogram findings) in making or excluding the diagnosis of ACS.
Does CK‐MB Diagnose ACS More Rapidly Than Troponin?
In patients with myocardial injury, both troponin and CK‐MB typically are detectable in the bloodstream within 2 to 4 hours of symptom onset and peak within 12 to 18 hours; neither has been established as a more rapid biomarker for the detection of myocardial infarction.[6] Furthermore, a systemic review of point‐of‐care cardiac enzyme testing reported that troponin and CK‐MB had similar positive and negative predictive values for diagnosing acute myocardial infarction (AMI) within the first 6 hours of symptom onset.[7]
Does CK‐MB Add Prognostic Information in Addition to Troponin in Patients With ACS?
If CK‐MB adds additional prognostic information in patients with suspected ACS and normal troponin values, then we should continue using it. Based on several large registries of patients with chest pain and/or ACS, approximately 8% to 28% of patients have discordant CK‐MB and troponin values, where 1 value is normal while the other value is abnormal. Several studies have examined whether an abnormal CK‐MB, in the setting of a normal troponin, offers additional prognostic information in comparison with normal values of both biomarkers.
In the CRUSADE (Can Rapid risk stratification of Unstable angina patients Suppress ADverse outcomes with Early implementation of the American College of Cardiology/American Heart Association guidelines) registry, a cohort of 29,357 patients with ACS was retrospectively divided into 4 groups: (1) patients with abnormal CK‐MB (CK‐MB+) and troponin (Tn+) values (ie, double‐positive group); (2) patients with normal CK‐MB (CK‐MB) and troponin (Tn) values (ie, double‐negative group); (3) patients with CK‐MB+/Tn; and (4) patients with CK‐MB/Tn+ values. Among the 4 groups, the rate of in‐hospital mortality was not significantly different between CK‐MB+/Tn (group 3) and patients with double‐negative (ie, normal) values. However, the presence of an abnormal troponin, regardless of CK‐MB status, was associated with an increased risk of in‐hospital death. The authors concluded that in clinical practice, there is little advantage of simultaneous CK‐MB and cTn testing for risk stratification in patients with high‐risk ACS presentations.[8]
In addition to the CRUSADE registry, 2 smaller registries, involving different patient populations, have reported similar results. An analysis of the Global Registry of Acute Coronary Events (GRACE) registry of 10,719 patients with ACS reported no difference between CK‐MB+/Tn patients and double‐negative patients with respect to in‐hospital mortality, as well as 6‐month mortality.[9] In the Internet Tracking Registry of Acute Coronary Syndromes (ITRACS) registry, 8769 patients presenting to emergency rooms with chest pain were analyzed. A minority (18.4%) were ultimately diagnosed with ACS. The authors found that an abnormal troponin, irrespective of CK‐MB status, was associated with an increased in‐hospital mortality rate. In‐hospital death rates were similar between CK‐MB+/Tn and double‐negative patients.[10]
In summary, troponin offers important prognostic information regardless of the CK‐MB result.
Is CK‐MB More Accurate for Diagnosing Reinfarction (Repeat Infarction in Patients With Recent Acute Myocardial Infarction)?
Whereas CK‐MB typically returns to normal within 2 to 3 days, troponin can be elevated for up to 5 to 14 days. Consequently, some have argued that CK‐MB may be more accurate in detecting reinfarction. In the only study to date comparing CK‐MB and troponin patterns in 9 patients with reinfarction, the rise and fall of both biomarkers were similar. Furthermore, those patients with persistently elevated troponin values from baseline (after the initial infarction) experienced a significant rise in troponin with reinfarction.[11]
Is CK‐MB More Accurate for Estimating Infarct Size?
Some have argued that a peak CK‐MB value is more accurate than a peak troponin value for estimating infarct size. However, 2 comparative studies have reported that troponin is as good as and possibly superior to CK‐MB for estimating infarct size. In a study of 65 patients with AMI, a single troponin T measurement obtained 72 hours after coronary care unit admission significantly correlated with peak CK‐MB in estimating infarct size (r=0.76, P<0.001), using single‐photon emission computed tomography imaging as the gold standard.[12] In a similar study of 37 patients with AMI, a single troponin T value had a significantly higher correlation with infarct size than serial and peak CK‐MB. Unlike CK‐MB, the ability of troponin T to predict infarct size was independent of coronary reperfusion.[13]
What do Guidelines and Thought Leaders Say About Using CK‐MB?
The most recent Third Universal Definition of Myocardial Infarction states that troponin is the preferred (cardiac) biomarker‐overall and for each specific category of MI, and that CK‐MB should be considered an alternative if troponin is not available.[14] Several national guidelines endorse troponin as the primary cardiac biomarker for diagnosis of ACS.[15, 16, 17] Finally, several groups have called for the elimination of CK‐MB. In 2008, 2 experts in the field of cardiovascular laboratory medicine argued that CK‐MB test adds little to no incremental information but does add cost andconfusion. Their institution, the Mayo Clinic, removed CK‐MB from their cardiac biomarker panel without any discernible negative effects on clinical care.[6] In a more recent publication, a group of authors from the departments of pathology and laboratory medicine of 7 major US academic medical centers identified CK‐MB as part of a top 10 list of antiquated tests that no longer provide value.[18]
WHAT YOU SHOULD DO INSTEAD: ORDER TROPONIN ALONE
In all cases where a patient presents with chest pain and/or symptoms concerning for ACS, we recommend that troponin be ordered alone. CK‐MB is no longer necessary as an additional test. As healthcare providers, we aim to provide the highest healthcare valuedefined as clinical benefit divided by cost. Routine ordering of CK‐MB offers essentially no benefit but does come at a significant cost. Each CK‐MB costs roughly $40 to $50 a test. If CK‐MB is used in approximately 2 million patients annually diagnosed with ACS and a proportion of the 17 million patients annually evaluated for chest pain, the potential cost, without clear benefit, is substantial.[19]
RECOMMENDATIONS
- In patients suspected of having ACS, troponin should be measured in lieu of CK‐MB and serial CK testing to evaluate for myocardial injury.
- CK‐MB tests should not be ordered routinely for patients suspected of having ACS. Hospitals should remove CK‐MB from pathology lab catalogs or require specific permission to order it.
CONCLUSION
Because CK‐MB, as compared to troponin, is detectable in the bloodstream in a similar timeframe, adds no additional prognostic information, estimates infarct size no differently, and appears to diagnose reinfarction no differently (Table 1), the authors believe that CK‐MB should no longer be ordered for patients with suspected ACS, unless ordering troponin is not an option. Ordering CK‐MB and serial CK for the evaluation of ACS is a Thing We Do for No Reason.
| Test Characteristic | CK‐MB | Troponin |
|---|---|---|
| ||
| Sensitivity | Lower than troponin | Higher than CK‐MB |
| Specificity | 60% to 70% | >94% |
| Diagnostic accuracy in patients with chronic renal failure | Equivalent | Equivalent |
| Rapidity of diagnosis | 24 hours | 2‐4 hours |
| Estimation of infarct size | Equivalent or possibly inferior to troponin | Equivalent or possibly superior to CK‐MB |
| Diagnosis of reinfarction | Equivalent | Equivalent |
Disclosures
Nothing to report.
Do you think this is a low‐value practice? Is this truly a Thing We Do for No Reason? Share what you do in your practice and join in the conversation online by retweeting it on Twitter (#TWDFNR) and Liking It on Facebook. We invite you to propose ideas for other Things We Do for No Reason topics by emailing
- , Creatine kinase‐MB: the journey to obsolescence. Am J Clin Pathol. 2014;141:415–419.
- , , , et al. Diagnostic efficiency of troponin T measurements in acute myocardial infarction. Circulation. 1991;83:902–912.
- , , , et al. Cardiac troponin I: a marker with high specificity for cardiac injury. Circulation. 1993:88:101–106.
- , Cardiac troponin I in patients with chronic kidney disease stage 3 to 5 in conditions other than acute coronary syndrome. Clin Lab. 2014;60(2):281–290.
- , , , , Unmasking artifactual increases in creatine kinase isoenzymes in patients with renal failure. J Clin Lab Med. 1984;104:193–202.
- , Requiem for a heavyweight: the demise of creatine kinase‐MB. Circulation. 2008;118(21):2200–2206.
- , , , , Int J Cardiol. 2013;168(6):5355–5362.
- , , , et al. Frequency and clinical implications of discordant creatine kinase‐MB and troponin measurements in acute coronary syndromes. J Am Coll Cardiol. 2006;47(2):312–318.
- , , , et al.; GRACE Investigators. The diagnostic and prognostic impact of the redefinition of acute myocardial infarction: lessons from the Global Registry of Acute Coronary Events (GRACE). Am Heart J. 2006;151(3):654–660.
- , , , et al.; EMCREG‐i*trACS Investigators. Discordant cardiac biomarkers: frequency and outcomes in emergency department patients with chest pain. Ann Emerg Med. 2006:48(6):660–665.
- , Cardiac troponin and creatine kinase MB monitoring during in‐hospital myocardial reinfarction. Clin Chem. 2005;51:460–463.
- , , , , , Single‐point cardiac troponin T at coronary care unit discharge after myocardial infarction correlates with infarct size and ejection fraction. Clin Chem. 2002;48:1432–1436
- , , , , , Troponin T concentrations 72 hours after myocardial infarction as a serological estimate of infarct size. Heart. 2002;87:520–524.
- , , , et al. Third universal definition of myocardial infarction. Circulation. 2012;126(16):2020–2035.
- , , , et al. Institute for Clinical Systems Improvement. Diagnosis and Treatment of Chest Pain and Acute Coronary Syndrome (ACS). Available at: http://bit.ly.ACS1112. Updated November 2012.
- , , , et al. 2012 ACCF/AHA focused update incorporated into the ACCF/AHA 2007 guidelines for the management of patients with unstable angina/non‐ST‐elevation myocardial infarction. J Am Coll Cardiol. 2013;61(23):e179–e347.
- American College of Emergency Physicians; Society for Cardiovascular Angiography and Interventions, , , , et al. 2013 ACCF/AHA guideline for the management of ST‐elevation myocardial infarction. J Am Coll Cardiol. 2013;61(4):e78–e140.
- , , , , , Antiquated tests within the clinical pathology laboratory. Am J Manag Care. 2010;16(9):e220–e227.
- , , , , Reducing excess cardiac biomarker testing at an academic medical center. J Gen Intern Med. 2014;29(11):1468–1474.
© 2015 Society of Hospital Medicine
Nebulized Bronchodilator Instead of MDI
The Things We Do for No Reason (TWDFNR) series reviews practices which have become common parts of hospital care but which may provide little value to our patients. Practices reviewed in the TWDFNR series do not represent black and white conclusions or clinical practice standards, but are meant as a starting place for research and active discussions among hospitalists and patients. We invite you to be part of that discussion. https://www.choosingwisely.org/

CASE PRESENTATION
A 54‐year‐old woman presented to the emergency department (ED) with shortness of breath. She reported that her primary care physician diagnosed her with chronic obstructive pulmonary disease (COPD). Her physician had prescribed her an albuterol inhaler to use as needed for shortness of breath. Over the past few weeks she had been trying to use the inhaler, but she noted that it did not seem to help her increasing wheezing, coughing, and sputum production. In the ED, she received continuous albuterol treatments via nebulizer, Solu‐Medrol 125 mg intravenously, antibiotics, and a chest x‐ray. She was admitted to the hospital medicine service for COPD exacerbation and started on nebulized bronchodilator treatments every 4 hours. By the fourth day of her hospital stay, she was discharged to home with an albuterol inhaler, oral prednisone, oral doxycycline, and a follow‐up appointment. Dedicated patient education regarding proper inhaler administration did not occur during hospitalization.
WHY YOU MIGHT THINK NEBULIZED TREATMENTS IN INPATIENTS ARE HELPFUL
Inhaled bronchodilators are a mainstay of therapy for acute obstructive pulmonary diseases, including COPD and asthma exacerbations.[1, 2] Inhaled bronchodilators may be delivered by metered‐dose inhalers (MDIs) or via wet nebulizers powered by compressed air or oxygen. Current practice patterns in EDs and hospital wards tend to favor the use of nebulizers due to many apparent advantages of these devices.[3] For instance, nebulizers do not require any special inhalation technique and can be effectively used by patients at any age.[3, 4] There is also a common perception that nebulizers are more effective, possibly stemming from the assumption that hospitalized patients have already failed their outpatient MDI therapy and an almost mystical belief in the healing power of mist. Moreover, many clinicians have been trained to routinely use nebulizer therapies and may lack sufficient knowledge or comfort about the relative efficacy and equivalence dosing of MDI therapies.
WHY NEBULIZERS ARE NOT BETTER THAN MDIs FOR PATIENTS HOSPITALIZED WITH OBSTRUCTIVE PULMONARY SYMPTOMS
Decades of research support that MDIs are effective, efficient, and less costly (depending on circumstances) than nebulizers for the routine treatment of obstructive pulmonary exacerbations.[3, 4, 5, 6, 7, 8, 9, 10, 11] The clinical effectiveness of MDIs has been shown in studies across populations of adults with acute COPD symptoms,[3, 4, 7, 8] as well as children and adults with asthma exacerbations.[3, 4, 5, 6, 9, 10] A 2005 joint report by the American College of Chest Physicians (ACCP) and the American College of Asthma, Allergy and Immunology (ACAAI), concluded none of the pooled meta‐analyses showed a significant difference between devices in any efficacy outcome in any patient group for each of the clinical settings.[4] Many different outcomes have been investigated, including forced expiratory volumes (FEV), peak flows, symptoms and specific symptom scores, and physical findings.[4]
Compared to MDIs, there are a number of drawbacks to the use of nebulizers: nebulizers are more expensive to buy and maintain, are less portable, and take longer to set up, use, and clean following each use.[12] In addition, nebulizers have been associated with greater increases in heart rate and tremors compared to MDIs, suggesting nebulizers lead to higher systemically absorbed ‐agonist doses.[4]
Of note, nearly all of the clinical effectiveness studies administered MDIs with a valved holding chamber or spacer, facilitating the delivery of drug to the airways.[3, 4] Although valved holding chambers are commonly referred to as a spacer, a true spacer does not have a valve and is rarely used today.[12]
THE EVIDENCE EXAMINING NEBULIZERS VERSUS MDIs IN PATIENTS WITH ASTHMA OR COPD EXACERBATIONS
A 2013 Cochrane review sought to establish the relative efficacy of MDIs with holding chambers versus nebulizers for children and adults who presented to a community setting or emergency department with acute asthma.[6] The review included a total of 1897 children and 729 adults in 39 randomized controlled trials. The authors judged the overall evidence to be of moderate quality. Children with acute asthma treated with MDIs in the ED had shorter lengths of stay in the ED (70 minutes vs 103 minutes), similar peak flow and FEV measurements, lower heart rates, and less tremor compared to children treated with nebulizers.[5, 6] There were no significant differences found between devices for the treatment of adult patients with asthma.[6]
In a separate double‐blind, randomized, placebo‐controlled study evaluating albuterol administered by nebulizer versus MDI with spacer for children <2 years old presenting to an ED with wheezing, the use of MDIs with a spacer and facemask was equally efficacious and may have led to fewer hospital admissions.[10]
Mandelberg et al. performed a double‐blind, randomized, placebo‐controlled trial for unselected adult patients presenting to an ED with obstructive pulmonary symptoms.[8] Patients received either 2 puffs of a placebo MDI with a spacer along with nebulized salbutamol 0.5 mL in 1.5 mL saline solution (n=25), or a salbutamol MDI along with a nebulized placebo saline solution (n=25). Treatments were repeated every 15 minutes up to 3 times, unless side effects occurred. Spirometric measurements were performed following each treatment. No differences were seen between the groups at any point during the study period. The authors concluded, Even in the setting of the unselected group of patient referrals to the [Department of Emergency Medicine] for episodes of severe airflow limitation, the clinical and objective bronchodilator responses to the administration of salbutamol are independent of the method of delivery: MDI with large spacer or aerosol nebulization.[8]
There are surprisingly few studies examining the use of nebulizers versus MDIs in the inpatient setting for both children and adults. Dolovich et al. reviewed 6 studies that included 253 total patients and reported no significant differences in pulmonary function between devices.[4] Based on these findings, the ACCP/ACAAI group recommended both nebulizers and MDIs with spacers/holding chambers are appropriate for use in the inpatient setting. Quality of evidence: good.[4]
WHY USE MDIs FOR INPATIENTS
If MDI and nebulizer treatments are equally effective, why change current practice? The use of MDIs, rather than nebulizers, in hospitals could lead to fewer side effects such as tachycardia, arrhythmias, and tremors. MDIs are also more portable and do not require specialized set‐up. Furthermore, MDI administrations during hospitalization may provide a golden opportunity to have respiratory therapists, pharmacists, or other health professionals spend time teaching patients proper inhaler usage, rather than providing time‐consuming nebulizer treatments.[13] In a recent study, approximately 86% of hospitalized patients with asthma or COPD could not demonstrate appropriate use of an MDI. However, 100% of patients were able to achieve mastery following a short teach‐back session.[14] It is conceivable that transitioning patients to MDIs earlier during hospitalization and providing them with education regarding proper MDI administration could instill confidence in their use of inhalers and result in downstream effects such as shorter lengths of stay, less frequent hospital readmissions, or improved quality of life.
MDI use may result in cost savings in certain settings, although the relative costs of nebulizer versus MDI treatments depends on many institution‐specific factors. Such factors include the institutional policies on who delivers the nebulizer or the MDI and how they are compensated and staffed. For example in the Nebs No More After 24 program initiated at the University of California, San Francisco, the vast majority of the realized cost savings are due to the reduction in respiratory therapist time spent delivering MDIs, which reflects the local policies and compensation structure.[13] Previous inpatient interventions to convert from nebulizers to MDIs also showed cost savings resulting from decreased labor needs.[15] In some hospitals, nurses deliver nebulizer treatments, whereas in others only respiratory therapists are allowed to provide nebulizers. Moreover, whether the MDI can go home with the patient upon discharge depends on whether the hospital has a dispensing pharmacy or not. Formal economic evaluations specific to the local institution are necessary.
WHAT WE SHOULD DO INSTEAD: ENCOURAGE THE USE OF MDIs FOR INPATIENTS
For effective inpatient MDI treatments, MDI technique must be good. Thus, it is vital to enlist the right people to provide proper MDI teaching and supervision. Respiratory therapists are generally trained for this task, and may be complemented by appropriately trained physicians, nurses, or pharmacists. Many institutions have successfully implemented respiratory therapist‐driven protocols for the administration of MDIs, which has led to measurable improvements in the utilization of appropriate respiratory care resources.[15, 16] At University of California, San Francisco, this was accomplished by recruiting respiratory therapists and nurses to help support the transition of patients from nebulizers to MDIs and to provide bedside teaching on proper MDI usage. The institution then launched a Nebs No More After 24 campaign that sought to transition patients from nebulizers to MDIs within 24 hours of hospitalization. This campaign included an educational program for physicians, prepared facilitator guides to assist attending physicians with teaching about the new initiative, publicity efforts including pens and strategically placed posters, and regular feedback regarding nebulizer utilization on the pilot ward. Although the evidence suggests that patients can be started on MDIs immediately upon presentation to the ED, the UCSF campaign focused on transitioning patients within 24 hours so to alleviate concerns about transitions in care between the ED and the medical ward, as well as between overnight and day teams. MDIs are only as or more effective than nebulizers if the correct administration technique is employed. The 24‐hour transition period allows for MDI teaching and transition during regular daytime hours.
Inpatient use of nebulizers may be more appropriate than MDIs for patients with dementia or altered mental status, as well as those in extreme distress resulting in an inability to coordinate inhaler usage. Very low health literacy may be an additional barrier to appropriate MDI teaching and usage.
RECOMMENDATIONS
In patients with obstructive pulmonary symptoms, transition patients from nebulizers to MDIs early in their hospital course, unless the patient is unable to use an inhaler due to altered mental status, dementia, or other circumstances. Ensure that patients are instructed and supervised on proper MDI technique. Enlisting respiratory therapists and appropriately trained staff (pharmacists, nurses, physicians) is key to the successful use of MDIs. Frequency and dosage of MDIs used should be comparable to that of nebulized treatments. Although studies have used a relatively wide range of albuterol MDI dosing, prior programs have determined a dose of albuterol 4 puffs via MDI as being equivalent to the standard albuterol 2.5 mg nebulizer dosage.[17, 18] Some studies have advocated for using a range of 2 to 10 puffs albuterol MDI, with the actual dose based on clinical response.[17] One study in children with mild acute asthma found that 2 puffs of albuterol by MDI was just as effective as higher doses delivered by MDI (610 puffs) or by nebulizer.[19]
CONCLUSION
MDIs with holding chambers are clinically equivalent to nebulizer therapy for the treatment of both children and adults with obstructive pulmonary symptoms, as long as MDI technique and MDI dosing is adequate. This is based on good data in the ED setting but fewer studies in adult inpatients. There are a number of advantages to the use of inpatient MDIs over nebulizers; MDIs are more portable, often less expensive to use, may result in fewer side effects, and will hopefully improve outpatient MDI technique. The delivery of MDIs during hospitalization should be accompanied with patient education regarding proper administration technique.
Disclosure
Nothing to report.
Do you think this is a low‐value practice? Is this truly a Thing We Do for No Reason? Share what you do in your practice and join in the conversation online by retweeting it on Twitter (#TWDFNR) and Liking It on Facebook. We invite you to propose ideas for other Things We Do for No Reason topics by emailing TWDFNR@hospitalmedicine.org
- Global Initiative for Chronic Obstructive Lung Disease (GOLD). Global strategy for the diagnosis, management, and prevention of COPD. Available at: http://www.goldcopd.org/guidelines‐global‐strategy‐for‐diagnosis‐management.html. Updated January 2015. Accessed September 25, 2014.
- National Heart Lung and Blood Institute. National Asthma Education and Prevention Program. Expert panel report 3: guidelines for the diagnosis and management of asthma. Available at: http://www.nhlbi.nih.gov/guidelines/asthma/asthgdln.htm. Published 2007. Updated April 2012. Accessed September 25, 2014.
- , , , Bronchodilator delivery in acute airflow obstruction. A meta‐analysis. Arch Intern Med. 1997;157(15):1736–1744.
- , , , et al. Device selection and outcomes of aerosol therapy: Evidence‐based guidelines: American College of Chest Physicians/American College of Asthma, Allergy, and Immunology. Chest. 2005;127(1):335–371.
- , Beta‐agonists through metered‐dose inhaler with valved holding chamber versus nebulizer for acute exacerbation of wheezing or asthma in children under 5 years of age: a systematic review with meta‐analysis. J Pediatr. 2004;145(2):172–177.
- , , Holding chambers (spacers) versus nebulisers for beta‐agonist treatment of acute asthma. Cochrane Database Syst Rev. 2013;9:CD000052.
- , , , , Nebulizer vs spacer for bronchodilator delivery in patients hospitalized for acute exacerbations of COPD. Chest. 1989;96(6):1241–1246.
- , , , Nebulized wet aerosol treatment in emergency department—is it essential? Comparison with large spacer device for metered‐dose inhaler. Chest. 1997;112(6):1501–1505.
- , , , , , Randomized controlled trial of salbutamol aerosol therapy via metered dose inhaler‐spacer vs. jet nebulizer in young children with wheezing. Pediatr Pulmonol. 2005;39(5):466–472.
- , , , Nebulizers vs metered‐dose inhalers with spacers for bronchodilator therapy to treat wheezing in children aged 2 to 24 months in a pediatric emergency department. Arch Pediatr Adolesc Med. 2003;157(1):76–80.
- , , , A review and economic evaluation of bronchodilator delivery methods in hospitalized patients. Arch Intern Med. 1996;156(18):2113–2118.
- , Asthma medication delivery: mists and myths. Paediatr Respir Rev. 2013;14(2):112–118.
- , , , , “Nebs no more after 24”: a pilot program to improve the use of appropriate respiratory therapies. JAMA Intern Med. 2013;173(17):1647–1648.
- , , , et al. Misuse of respiratory inhalers in hospitalized patients with asthma or COPD. J Gen Intern Med. 2011;26(6):635–642.
- , , A model for conversion from small volume nebulizer to metered dose inhaler aerosol therapy. Chest. 1992;101(3):634–637.
- , , Physician‐ordered aerosol therapy versus respiratory therapist‐driven aerosol protocol: the effect on resource utilization. Respir Care. 2013;58(3):431–437.
- , , , Automatic replacement of albuterol nebulizer therapy by metered‐dose inhaler and valved holding chamber. Am J Health Syst Pharm. 2005;62(10):1053–1061.
- , , , , The conversion to metered‐dose inhaler with valved holding chamber to administer inhaled albuterol: a pediatric hospital experience. Respir Care. 2008;53(3):338–345.
- , , , , , Comparison of albuterol delivered by a metered dose inhaler with spacer versus a nebulizer in children with mild acute asthma. J Pediatr. 1999;135(1):22–27.
The Things We Do for No Reason (TWDFNR) series reviews practices which have become common parts of hospital care but which may provide little value to our patients. Practices reviewed in the TWDFNR series do not represent black and white conclusions or clinical practice standards, but are meant as a starting place for research and active discussions among hospitalists and patients. We invite you to be part of that discussion. https://www.choosingwisely.org/
CASE PRESENTATION
A 54‐year‐old woman presented to the emergency department (ED) with shortness of breath. She reported that her primary care physician diagnosed her with chronic obstructive pulmonary disease (COPD). Her physician had prescribed her an albuterol inhaler to use as needed for shortness of breath. Over the past few weeks she had been trying to use the inhaler, but she noted that it did not seem to help her increasing wheezing, coughing, and sputum production. In the ED, she received continuous albuterol treatments via nebulizer, Solu‐Medrol 125 mg intravenously, antibiotics, and a chest x‐ray. She was admitted to the hospital medicine service for COPD exacerbation and started on nebulized bronchodilator treatments every 4 hours. By the fourth day of her hospital stay, she was discharged to home with an albuterol inhaler, oral prednisone, oral doxycycline, and a follow‐up appointment. Dedicated patient education regarding proper inhaler administration did not occur during hospitalization.
WHY YOU MIGHT THINK NEBULIZED TREATMENTS IN INPATIENTS ARE HELPFUL
Inhaled bronchodilators are a mainstay of therapy for acute obstructive pulmonary diseases, including COPD and asthma exacerbations.[1, 2] Inhaled bronchodilators may be delivered by metered‐dose inhalers (MDIs) or via wet nebulizers powered by compressed air or oxygen. Current practice patterns in EDs and hospital wards tend to favor the use of nebulizers due to many apparent advantages of these devices.[3] For instance, nebulizers do not require any special inhalation technique and can be effectively used by patients at any age.[3, 4] There is also a common perception that nebulizers are more effective, possibly stemming from the assumption that hospitalized patients have already failed their outpatient MDI therapy and an almost mystical belief in the healing power of mist. Moreover, many clinicians have been trained to routinely use nebulizer therapies and may lack sufficient knowledge or comfort about the relative efficacy and equivalence dosing of MDI therapies.
WHY NEBULIZERS ARE NOT BETTER THAN MDIs FOR PATIENTS HOSPITALIZED WITH OBSTRUCTIVE PULMONARY SYMPTOMS
Decades of research support that MDIs are effective, efficient, and less costly (depending on circumstances) than nebulizers for the routine treatment of obstructive pulmonary exacerbations.[3, 4, 5, 6, 7, 8, 9, 10, 11] The clinical effectiveness of MDIs has been shown in studies across populations of adults with acute COPD symptoms,[3, 4, 7, 8] as well as children and adults with asthma exacerbations.[3, 4, 5, 6, 9, 10] A 2005 joint report by the American College of Chest Physicians (ACCP) and the American College of Asthma, Allergy and Immunology (ACAAI), concluded none of the pooled meta‐analyses showed a significant difference between devices in any efficacy outcome in any patient group for each of the clinical settings.[4] Many different outcomes have been investigated, including forced expiratory volumes (FEV), peak flows, symptoms and specific symptom scores, and physical findings.[4]
Compared to MDIs, there are a number of drawbacks to the use of nebulizers: nebulizers are more expensive to buy and maintain, are less portable, and take longer to set up, use, and clean following each use.[12] In addition, nebulizers have been associated with greater increases in heart rate and tremors compared to MDIs, suggesting nebulizers lead to higher systemically absorbed ‐agonist doses.[4]
Of note, nearly all of the clinical effectiveness studies administered MDIs with a valved holding chamber or spacer, facilitating the delivery of drug to the airways.[3, 4] Although valved holding chambers are commonly referred to as a spacer, a true spacer does not have a valve and is rarely used today.[12]
THE EVIDENCE EXAMINING NEBULIZERS VERSUS MDIs IN PATIENTS WITH ASTHMA OR COPD EXACERBATIONS
A 2013 Cochrane review sought to establish the relative efficacy of MDIs with holding chambers versus nebulizers for children and adults who presented to a community setting or emergency department with acute asthma.[6] The review included a total of 1897 children and 729 adults in 39 randomized controlled trials. The authors judged the overall evidence to be of moderate quality. Children with acute asthma treated with MDIs in the ED had shorter lengths of stay in the ED (70 minutes vs 103 minutes), similar peak flow and FEV measurements, lower heart rates, and less tremor compared to children treated with nebulizers.[5, 6] There were no significant differences found between devices for the treatment of adult patients with asthma.[6]
In a separate double‐blind, randomized, placebo‐controlled study evaluating albuterol administered by nebulizer versus MDI with spacer for children <2 years old presenting to an ED with wheezing, the use of MDIs with a spacer and facemask was equally efficacious and may have led to fewer hospital admissions.[10]
Mandelberg et al. performed a double‐blind, randomized, placebo‐controlled trial for unselected adult patients presenting to an ED with obstructive pulmonary symptoms.[8] Patients received either 2 puffs of a placebo MDI with a spacer along with nebulized salbutamol 0.5 mL in 1.5 mL saline solution (n=25), or a salbutamol MDI along with a nebulized placebo saline solution (n=25). Treatments were repeated every 15 minutes up to 3 times, unless side effects occurred. Spirometric measurements were performed following each treatment. No differences were seen between the groups at any point during the study period. The authors concluded, Even in the setting of the unselected group of patient referrals to the [Department of Emergency Medicine] for episodes of severe airflow limitation, the clinical and objective bronchodilator responses to the administration of salbutamol are independent of the method of delivery: MDI with large spacer or aerosol nebulization.[8]
There are surprisingly few studies examining the use of nebulizers versus MDIs in the inpatient setting for both children and adults. Dolovich et al. reviewed 6 studies that included 253 total patients and reported no significant differences in pulmonary function between devices.[4] Based on these findings, the ACCP/ACAAI group recommended both nebulizers and MDIs with spacers/holding chambers are appropriate for use in the inpatient setting. Quality of evidence: good.[4]
WHY USE MDIs FOR INPATIENTS
If MDI and nebulizer treatments are equally effective, why change current practice? The use of MDIs, rather than nebulizers, in hospitals could lead to fewer side effects such as tachycardia, arrhythmias, and tremors. MDIs are also more portable and do not require specialized set‐up. Furthermore, MDI administrations during hospitalization may provide a golden opportunity to have respiratory therapists, pharmacists, or other health professionals spend time teaching patients proper inhaler usage, rather than providing time‐consuming nebulizer treatments.[13] In a recent study, approximately 86% of hospitalized patients with asthma or COPD could not demonstrate appropriate use of an MDI. However, 100% of patients were able to achieve mastery following a short teach‐back session.[14] It is conceivable that transitioning patients to MDIs earlier during hospitalization and providing them with education regarding proper MDI administration could instill confidence in their use of inhalers and result in downstream effects such as shorter lengths of stay, less frequent hospital readmissions, or improved quality of life.
MDI use may result in cost savings in certain settings, although the relative costs of nebulizer versus MDI treatments depends on many institution‐specific factors. Such factors include the institutional policies on who delivers the nebulizer or the MDI and how they are compensated and staffed. For example in the Nebs No More After 24 program initiated at the University of California, San Francisco, the vast majority of the realized cost savings are due to the reduction in respiratory therapist time spent delivering MDIs, which reflects the local policies and compensation structure.[13] Previous inpatient interventions to convert from nebulizers to MDIs also showed cost savings resulting from decreased labor needs.[15] In some hospitals, nurses deliver nebulizer treatments, whereas in others only respiratory therapists are allowed to provide nebulizers. Moreover, whether the MDI can go home with the patient upon discharge depends on whether the hospital has a dispensing pharmacy or not. Formal economic evaluations specific to the local institution are necessary.
WHAT WE SHOULD DO INSTEAD: ENCOURAGE THE USE OF MDIs FOR INPATIENTS
For effective inpatient MDI treatments, MDI technique must be good. Thus, it is vital to enlist the right people to provide proper MDI teaching and supervision. Respiratory therapists are generally trained for this task, and may be complemented by appropriately trained physicians, nurses, or pharmacists. Many institutions have successfully implemented respiratory therapist‐driven protocols for the administration of MDIs, which has led to measurable improvements in the utilization of appropriate respiratory care resources.[15, 16] At University of California, San Francisco, this was accomplished by recruiting respiratory therapists and nurses to help support the transition of patients from nebulizers to MDIs and to provide bedside teaching on proper MDI usage. The institution then launched a Nebs No More After 24 campaign that sought to transition patients from nebulizers to MDIs within 24 hours of hospitalization. This campaign included an educational program for physicians, prepared facilitator guides to assist attending physicians with teaching about the new initiative, publicity efforts including pens and strategically placed posters, and regular feedback regarding nebulizer utilization on the pilot ward. Although the evidence suggests that patients can be started on MDIs immediately upon presentation to the ED, the UCSF campaign focused on transitioning patients within 24 hours so to alleviate concerns about transitions in care between the ED and the medical ward, as well as between overnight and day teams. MDIs are only as or more effective than nebulizers if the correct administration technique is employed. The 24‐hour transition period allows for MDI teaching and transition during regular daytime hours.
Inpatient use of nebulizers may be more appropriate than MDIs for patients with dementia or altered mental status, as well as those in extreme distress resulting in an inability to coordinate inhaler usage. Very low health literacy may be an additional barrier to appropriate MDI teaching and usage.
RECOMMENDATIONS
In patients with obstructive pulmonary symptoms, transition patients from nebulizers to MDIs early in their hospital course, unless the patient is unable to use an inhaler due to altered mental status, dementia, or other circumstances. Ensure that patients are instructed and supervised on proper MDI technique. Enlisting respiratory therapists and appropriately trained staff (pharmacists, nurses, physicians) is key to the successful use of MDIs. Frequency and dosage of MDIs used should be comparable to that of nebulized treatments. Although studies have used a relatively wide range of albuterol MDI dosing, prior programs have determined a dose of albuterol 4 puffs via MDI as being equivalent to the standard albuterol 2.5 mg nebulizer dosage.[17, 18] Some studies have advocated for using a range of 2 to 10 puffs albuterol MDI, with the actual dose based on clinical response.[17] One study in children with mild acute asthma found that 2 puffs of albuterol by MDI was just as effective as higher doses delivered by MDI (610 puffs) or by nebulizer.[19]
CONCLUSION
MDIs with holding chambers are clinically equivalent to nebulizer therapy for the treatment of both children and adults with obstructive pulmonary symptoms, as long as MDI technique and MDI dosing is adequate. This is based on good data in the ED setting but fewer studies in adult inpatients. There are a number of advantages to the use of inpatient MDIs over nebulizers; MDIs are more portable, often less expensive to use, may result in fewer side effects, and will hopefully improve outpatient MDI technique. The delivery of MDIs during hospitalization should be accompanied with patient education regarding proper administration technique.
Disclosure
Nothing to report.
Do you think this is a low‐value practice? Is this truly a Thing We Do for No Reason? Share what you do in your practice and join in the conversation online by retweeting it on Twitter (#TWDFNR) and Liking It on Facebook. We invite you to propose ideas for other Things We Do for No Reason topics by emailing TWDFNR@hospitalmedicine.org
- Global Initiative for Chronic Obstructive Lung Disease (GOLD). Global strategy for the diagnosis, management, and prevention of COPD. Available at: http://www.goldcopd.org/guidelines‐global‐strategy‐for‐diagnosis‐management.html. Updated January 2015. Accessed September 25, 2014.
- National Heart Lung and Blood Institute. National Asthma Education and Prevention Program. Expert panel report 3: guidelines for the diagnosis and management of asthma. Available at: http://www.nhlbi.nih.gov/guidelines/asthma/asthgdln.htm. Published 2007. Updated April 2012. Accessed September 25, 2014.
- , , , Bronchodilator delivery in acute airflow obstruction. A meta‐analysis. Arch Intern Med. 1997;157(15):1736–1744.
- , , , et al. Device selection and outcomes of aerosol therapy: Evidence‐based guidelines: American College of Chest Physicians/American College of Asthma, Allergy, and Immunology. Chest. 2005;127(1):335–371.
- , Beta‐agonists through metered‐dose inhaler with valved holding chamber versus nebulizer for acute exacerbation of wheezing or asthma in children under 5 years of age: a systematic review with meta‐analysis. J Pediatr. 2004;145(2):172–177.
- , , Holding chambers (spacers) versus nebulisers for beta‐agonist treatment of acute asthma. Cochrane Database Syst Rev. 2013;9:CD000052.
- , , , , Nebulizer vs spacer for bronchodilator delivery in patients hospitalized for acute exacerbations of COPD. Chest. 1989;96(6):1241–1246.
- , , , Nebulized wet aerosol treatment in emergency department—is it essential? Comparison with large spacer device for metered‐dose inhaler. Chest. 1997;112(6):1501–1505.
- , , , , , Randomized controlled trial of salbutamol aerosol therapy via metered dose inhaler‐spacer vs. jet nebulizer in young children with wheezing. Pediatr Pulmonol. 2005;39(5):466–472.
- , , , Nebulizers vs metered‐dose inhalers with spacers for bronchodilator therapy to treat wheezing in children aged 2 to 24 months in a pediatric emergency department. Arch Pediatr Adolesc Med. 2003;157(1):76–80.
- , , , A review and economic evaluation of bronchodilator delivery methods in hospitalized patients. Arch Intern Med. 1996;156(18):2113–2118.
- , Asthma medication delivery: mists and myths. Paediatr Respir Rev. 2013;14(2):112–118.
- , , , , “Nebs no more after 24”: a pilot program to improve the use of appropriate respiratory therapies. JAMA Intern Med. 2013;173(17):1647–1648.
- , , , et al. Misuse of respiratory inhalers in hospitalized patients with asthma or COPD. J Gen Intern Med. 2011;26(6):635–642.
- , , A model for conversion from small volume nebulizer to metered dose inhaler aerosol therapy. Chest. 1992;101(3):634–637.
- , , Physician‐ordered aerosol therapy versus respiratory therapist‐driven aerosol protocol: the effect on resource utilization. Respir Care. 2013;58(3):431–437.
- , , , Automatic replacement of albuterol nebulizer therapy by metered‐dose inhaler and valved holding chamber. Am J Health Syst Pharm. 2005;62(10):1053–1061.
- , , , , The conversion to metered‐dose inhaler with valved holding chamber to administer inhaled albuterol: a pediatric hospital experience. Respir Care. 2008;53(3):338–345.
- , , , , , Comparison of albuterol delivered by a metered dose inhaler with spacer versus a nebulizer in children with mild acute asthma. J Pediatr. 1999;135(1):22–27.
© 2015 Society of Hospital Medicine
Outcomes after 2011 Residency Reform
The Accreditation Council for Graduate Medical Education (ACGME) Common Program Requirements implemented in July 2011 increased supervision requirements and limited continuous work hours for first‐year residents.[1] Similar to the 2003 mandates, these requirements were introduced to improve patient safety and education at academic medical centers.[2] Work‐hour reforms have been associated with decreased resident burnout and improved sleep.[3, 4, 5] However, national observational studies and systematic reviews of the impact of the 2003 reforms on patient safety and quality of care have been varied in terms of outcome.[6, 7, 8, 9, 10] Small studies of the 2011 recommendations have shown increased sleep duration and decreased burnout, but also an increased number of handoffs and increased resident concerns about making a serious medical error.[11, 12, 13, 14] Although national surveys of residents and program directors have not indicated improvements in education or quality of life, 1 observational study did show improvement in clinical exposure and conference attendance.[15, 16, 17, 18] The impact of the 2011 reforms on patient safety remains unclear.[19, 20]
The objective of this study was to evaluate the association between implementation of the 2011 residency work‐hour mandates and patient safety outcomes at a large academic medical center.
METHODS
Study Design
This observational study used a quasi‐experimental difference‐in‐differences approach to evaluate whether residency work‐hour changes were associated with patient safety outcomes among general medicine inpatients. We compared safety outcomes among adult patients discharged from resident general medical services (referred to as resident) to safety outcomes among patients discharged by the hospitalist general medical service (referred to as hospitalist) before and after the 2011 residency work‐hour reforms at a large academic medical center. Differences in outcomes for the resident group were compared to differences observed in the hospitalist group, with adjustment for relevant demographic and case mix factors.[21] We used the hospitalist service as a control group, because ACGME changes applied only to resident services. The strength of this design is that it controls for secular trends that are correlated with patient safety, impacting both residents and hospitalists similarly.[9]
Approval for this study and a Health Insurance Portability and Accountability Act waiver were granted by the Johns Hopkins University School of Medicine institutional review board. We retrospectively examined administrative data on all patient discharges from the general medicine services at Johns Hopkins Hospital between July 1, 2008 and June 30, 2012 that were identified as pertaining to resident or hospitalist services.
Patient Allocation and Physician Scheduling
Patient admission to the resident or hospitalist service was decided by a number of factors. To maintain continuity of care, patients were preferentially admitted to the same service as for prior admissions. New patients were admitted to a service based on bed availability, nurse staffing, patient gender, isolation precautions, and cardiac monitor availability.
The inpatient resident services were staffed prior to July 2011 using a traditional 30‐hour overnight call system. Following July 2011, the inpatient resident services were staffed using a modified overnight call system, in which interns took overnight calls from 8 pm until 12 pm the following day, once every 5 nights with supervision by upper‐level residents. These interns rotated through daytime admitting and coverage roles on the intervening days. The hospitalist service was organized into a 3‐physician rotation of day shift, evening shift, and overnight shift.
Data and Outcomes
Twenty‐nine percent of patients in the sample were admitted more than once during the study period, and patients were generally admitted to the same resident team during each admission. Patients with multiple admissions were counted multiple times in the model. We categorized admissions as prereform (July 1, 2008June 30, 2011) and postreform (July 1, 2011June 30, 2012). Outcomes evaluated included hospital length of stay, 30‐day readmission, intensive care unit stay (ICU) stay, inpatient mortality, and number of Maryland Hospital Acquired Conditions (MHACs). ICU stay pertained to any ICU admission including initial admission and transfer from the inpatient floor. MHACs are a set of inpatient performance indicators derived from a list of 64 inpatient Potentially Preventable Complications developed by 3M Health Information Systems.[22] MHACs are used by the Maryland Health Services Cost Review Commission to link hospital payment to performance for costly, preventable, and clinically relevant complications. MHACs were coded in our analysis as a dichotomous variable. Independent variables included patient age at admission, race, gender, and case mix index. Case mix index (CMI) is a numeric score that measures resource utilization for a specific patient population. CMI is a weighted value assigned to patients based on resource utilization and All Patient Refined Diagnostic Related Group and was included as an indicator of patient illness severity and risk of mortality.[23] Data were obtained from administrative records from the case mix research team at Johns Hopkins Medicine.
To account for transitional differences that may have coincided with the opening of a new hospital wing in late April 2012, we conducted a sensitivity analysis, in which we excluded from analysis any visits that took place in May 2012 to June 2012.
Data Analysis
Based on historical studies, we calculated that a sample size of at least 3600 discharges would allow us to detect a difference of 5% between the pre‐ and postreform period assuming baseline 20% occurrence of dichotomous outcomes (=0.05; =0.2; r=4).[21]
The primary unit of analysis was the hospital discharge. Similar to Horwitz et al., we analyzed data using a difference‐in‐differences estimation strategy.[21] We used multivariable linear regression for length of stay measured as a continuous variable, and multivariable logistic regression for inpatient mortality, 30‐day readmission, MHACs coded as a dichotomous variable, and ICU stay coded as a dichotomous variable.[9] The difference‐in‐differences estimation was used to determine whether the postreform period relative to prereform period was associated with differences in outcomes comparing resident and hospitalist services. In the regression models, the independent variables of interest included an indicator variable for whether a patient was treated on a resident service, an indicator variable for whether a patient was discharged in the postreform period, and the interaction of these 2 variables (resident*postreform). The interaction term can be interpreted as a differential change over time comparing resident and hospitalist services. In all models, we adjusted for patient age, gender, race, and case mix index.
To determine whether prereform trends were similar among the resident and hospitalist services, we performed a test of controls as described by Volpp and colleagues.[6] Interaction terms for resident service and prereform years 2010 and 2011 were added to the model. A Wald test was then used to test for improved model fit, which would indicate differential trends among resident and hospitalist services during the prereform period. Where such trends were found, postreform results were compared only to 2011 rather than the 2009 to 2011 prereform period.[6]
To account for correlation within patients who had multiple discharges, we used a clustering approach and estimated robust variances.[24] From the regression model results, we calculated predicted probabilities adjusted for relevant covariates and prepost differences, and used linear probability models to estimate percentage‐point differences in outcomes, comparing residents and hospitalists in the pre‐ and postreform periods.[25] All analyses were performed using Stata/IC version 11 (StataCorp, College Station, TX).
RESULTS
In the 3 years before the 2011 residency work‐hour reforms were implemented (prereform), there were a total of 15,688 discharges for 8983 patients to the resident services and 4622 discharges for 3649 patients to the hospitalist services. In the year following implementation of residency work‐hour changes (postreform), there were 5253 discharges for 3805 patients to the resident services and 1767 discharges for 1454 patients to the hospitalist service. Table 1 shows the characteristics of patients discharged from the resident and hospitalist services in the pre‐ and postreform periods. Patients discharged from the resident services were more likely to be older, male, African American, and have a higher CMI.
| Resident Services | Hospitalist Service | ||||||||
|---|---|---|---|---|---|---|---|---|---|
| 2009 | 2010 | 2011 | 2012 | 2009 | 2010 | 2011 | 2012 | P Valuea | |
| |||||||||
| Discharges, n | 5345 | 5299 | 5044 | 5253 | 1366 | 1492 | 1764 | 1767 | |
| Unique patients, n | 3082 | 2968 | 2933 | 3805 | 1106 | 1180 | 1363 | 1454 | |
| Age, y, mean (SD) | 55.1 (17.7) | 55.7 (17.4) | 56.4 (17.9) | 56.7 (17.1) | 55.9 (17.9) | 56.2 (18.4) | 55.5 (18.8) | 54 (18.7) | 0.02 |
| Sex male, n (%) | 1503 (48.8) | 1397 (47.1) | 1432 (48.8) | 1837 (48.3) | 520 (47) | 550 (46.6) | 613 (45) | 654 (45) | <0.01 |
| Race | |||||||||
| African American, n (%) | 2072 (67.2) | 1922 (64.8) | 1820 (62.1) | 2507 (65.9) | 500 (45.2) | 592 (50.2) | 652 (47.8) | 747 (51.4) | <0.01 |
| White, n (%) | 897 (29.1) | 892 (30.1) | 957 (32.6) | 1118 (29.4) | 534 (48.3) | 527 (44.7) | 621 (45.6) | 619 (42.6) | |
| Asian, n (%) | 19 (.6%) | 35 (1.2) | 28 (1) | 32 (.8) | 11 (1) | 7 (.6) | 25 (1.8) | 12 (.8) | |
| Other, n (%) | 94 (3.1) | 119 (4) | 128 (4.4) | 148 (3.9) | 61 (5.5) | 54 (4.6) | 65 (4.8) | 76 (5.2) | |
| Case mix index, mean (SD) | 1.2 (1) | 1.1 (0.9) | 1.1 (0.9) | 1.1 (1.2) | 1.2 (1) | 1.1 (1) | 1.1 (1) | 1 (0.7) | <0.01 |
Differences in Outcomes Among Resident and Hospitalist Services Pre‐ and Postreform
Table 2 shows unadjusted results. Patients discharged from the resident services in the postreform period as compared to the prereform period had a higher likelihood of an ICU stay (5.9% vs 4.5%, P<0.01), and lower likelihood of 30‐day readmission (17.1% vs 20.1%, P<0.01). Patients discharged from the hospitalist service in the postreform period as compared to the prereform period had a significantly shorter mean length of stay (4.51 vs 4.88 days, P=0.03)
| Resident Services | Hospitalist Service | |||||
|---|---|---|---|---|---|---|
| Outcome | Prereforma | Postreform | P Value | Prereforma | Postreform | P Value |
| ||||||
| Length of stay (mean) | 4.55 (5.39) | 4.50 (5.47) | 0.61 | 4.88 (5.36) | 4.51 (4.64) | 0.03 |
| Any ICU stay (%) | 225 (4.5%) | 310 (5.9%) | <0.01 | 82 (4.7%) | 83 (4.7%) | 0.95 |
| Any MHACs (%) | 560 (3.6%) | 180 (3.4%) | 0.62 | 210 (4.5%) | 64 (3.6%) | 0.09 |
| Readmit in 30 days (%) | 3155 (20.1%) | 900 (17.1%) | <0.01 | 852 (18.4%) | 296 (16.8%) | 0.11 |
| Inpatient mortality (%) | 71 (0.5%) | 28 (0.5%) | 0.48 | 18 (0.4%) | 7 (0.4%) | 0.97 |
Table 3 presents the results of regression analyses examining correlates of patient safety outcomes, adjusted for age, gender, race, and CMI. As the test of controls indicated differential prereform trends for ICU admission and length of stay, the prereform period was limited to 2011 for these outcomes. After adjustment for covariates, the probability of an ICU stay remained greater, and the 30‐day readmission rate was lower among patients discharged from resident services in the postreform period than the prereform period. Among patients discharged from the hospitalist services, there were no significant differences in length of stay, readmissions, ICU admissions, MHACs, or inpatient mortality comparing the pre‐ and postreform periods.
| Resident Services | Hospitalist Service | Difference in Differences | |||||
|---|---|---|---|---|---|---|---|
| Outcome | Prereforma | Postreform | Difference | Prereform | Postreform | Difference | (ResidentHospitalist) |
| |||||||
| ICU stay | 4.5% (4.0% to 5.1%) | 5.7% (5.1% to 6.3%) | 1.4% (0.5% to 2.2%) | 4.4% (3.5% to 5.3%) | 5.3% (4.3% to 6.3%) | 1.1% (0.2 to 2.4%) | 0.3% (1.1% to 1.8%) |
| Inpatient mortality | 0.5% (0.4% to 0.6%) | 0.5% (0.3% to 0.7%) | 0 (0.2% to 0.2%) | 0.3% (0.2% to 0.6%) | 0.5% (0.1% to 0.8%) | 0.1% (0.3% to 0.5%) | 0.1% (0.5% to 0.3%) |
| MHACs | 3.6% (3.3% to 3.9%) | 3.3% (2.9% to 3.7%) | 0.4% (0.9 to 0.2%) | 4.5% (3.9% to 5.1%) | 4.1% (3.2% to 5.1%) | 0.3% (1.4% to 0.7%) | 0.2% (1.0% to 1.3%) |
| Readmit 30 days | 20.1% (19.1% to 21.1%) | 17.2% (15.9% to 18.5%) | 2.8% (4.3% to 1.3%) | 18.4% (16.5% to 20.2%) | 16.6% (14.7% to 18.5%) | 1.7% (4.1% to 0.8%) | 1.8% (0.2% to 3.7%) |
| Length of stay | 4.6 (4.4 to 4.7) | 4.4 (4.3 to 4.6) | 0.1 (0.3 to 0.1) | 4.9 (4.6 to 5.1) | 4.7 (4.5 to 5.0) | 0.1 (0.4 to 0.2) | 0.01 (0.37 to 0.34) |
Differences in Outcomes Comparing Resident and Hospitalist Services Pre‐ and Postreform
Comparing pre‐ and postreform periods in the resident and hospitalist services, there were no significant differences in ICU admission, length of stay, MHACs, 30‐day readmissions, or inpatient mortality. In the sensitivity analysis, in which we excluded all discharges in May 2012 to June 2012, results were not significantly different for any of the outcomes examined.
DISCUSSION
Using difference‐in‐differences estimation, we evaluated whether the implementation of the 2011 residency work‐hour mandate was associated with differences in patient safety outcomes including length of stay, 30‐day readmission, inpatient mortality, MHACs, and ICU admissions comparing resident and hospitalist services at a large academic medical center. Adjusting for patient age, race, gender, and clinical complexity, we found no significant changes in any of the patient safety outcomes indicators in the postreform period comparing resident to hospitalist services.
Our quasiexperimental study design allowed us to gauge differences in patient safety outcomes, while reducing bias due to unmeasured confounders that might impact patient safety indicators.[9] We were able to examine all discharges from the resident and hospitalist general medicine services during the academic years 2009 to 2012, while adjusting for age, race, gender, and clinical complexity. Though ICU admission was higher and readmission rates were lower on the resident services post‐2011, we did not observe a significant difference in ICU admission or 30‐day readmission rates in the postreform period comparing patients discharged from the resident and hospitalist services and all patients in the prereform period.
Our neutral findings differ from some other single‐institution evaluations of reduced resident work hours, several of which have shown improved quality of life, education, and patient safety indicators.[18, 21, 26, 27, 28] It is unclear why improvements in patient safety were not identified in the current study. The 2011 reforms were more broad‐based than some of the preliminary studies of reduced work hours, and therefore additional variables may be at play. For instance, challenges related to decreased work hours, including the increased number of handoffs in care and work compression, may require specific interventions to produce sustained improvements in patient safety.[3, 14, 29, 30]
Improving patient safety requires more than changing resident work hours. Blum et al. recommended enhanced funding to increase supervision, decrease resident caseload, and incentivize achievement of quality indicators to achieve the goal of improved patient safety within work‐hour reform.[31] Schumacher et al. proposed a focus on supervision, professionalism, safe transitions of care, and optimizing workloads as a means to improve patient safety and education within the new residency training paradigm.[29]
Limitations of this study include limited follow‐up time after implementation of the work‐hour reforms. It may take more time to optimize systems of care to see benefits in patient safety indicators. This was a single‐institution study of a limited number of outcomes in a single department, which limits generalizability and may reflect local experience rather than broader trends. The call schedule on the resident service in this study differs from programs that have adopted night float schedules. [27] This may have had an effect on patient care outcomes.[32] In an attempt to conduct a timely study of inpatient safety indicators following the 2011 changes, our study was not powered to detect small changes in low‐frequency outcomes such as mortality; longer‐term studies at multiple institutions will be needed to answer these key questions. We limited the prereform period where our test of controls indicated differential prereform trends, which reduced power.
As this was an observational study rather than an experiment, there may have been both measured and unmeasured differences in patient characteristics and comorbidity between the intervention and control group. For example, CMI was lower on the hospitalist service than the resident services. Demographics varied somewhat between services; male and African American patients were more likely to be discharged from resident services than hospitalist services for unknown reasons. Although we adjusted for demographics and CMI in our model, there may be residual confounding. Limitations in data collection did not allow us to separate patients initially admitted to the ICU from patients transferred to the ICU from the inpatient floors. We attempted to overcome this limitation through use of a difference‐in‐differences model to account for secular trends, but factors other than residency work hours may have impacted the resident and hospitalist services differentially. For example, hospital quality‐improvement programs or provider‐level factors may have differentially impacted the resident versus hospitalist services during the study period.
Work‐hour limitations for residents were established to improve residency education and patient safety. As noted by the Institute of Medicine, improving patient safety will require significant investment by program directors, hospitals, and the public to keep resident caseloads manageable, ensure adequate supervision of first‐year residents, train residents on safe handoffs in care, and conduct ongoing evaluations of patient safety and any unintended consequences of the regulations.[33] In the first year after implementation of the 2011 work‐hour reforms, we found no change in ICU admission, inpatient mortality, 30‐day readmission rates, length of stay, or MHACs compared with patients treated by hospitalists. Studies of the long‐term impact of residency work‐hour reform are necessary to determine whether changes in work hours have been associated with improvement in resident education and patient safety.
Disclosure: Nothing to report.
- Accreditation Council for Graduate Medical Education. Common program requirements effective: July 1, 2011. Available at: http://www.acgme.org/acgmeweb/Portals/0/PFAssets/ProgramResources/Common_Program_Requirements_07012011[1].pdf. Accessed February 10, 2014.
- , , . The new recommendations on duty hours from the ACGME Task Force. N Engl J Med. 2010;363:e3.
- , , , , . Interns' compliance with Accreditation Council for Graduate Medical Education work‐hour limits. JAMA. 2006;296(9):1063–1070.
- , , , , , . Effects of work hour reduction on residents' lives: a systematic review. JAMA. 2005;294(9):1088–1100.
- , , , et al. Effects of the ACGME duty hour limits on sleep, work hours, and safety. Pediatrics. 2008;122(2):250–258.
- , , . Teaching hospital five‐year mortality trends in the wake of duty hour reforms. J Gen Intern Med. 2013;28(8):1048–1055.
- , , , . Duty hour limits and patient care and resident outcomes: can high‐quality studies offer insight into complex relationships? Ann Rev Med. 2013;64:467–483.
- , , . Patient safety, resident education and resident well‐being following implementation of the 2003 ACGME duty hour rules. J Gen Intern Med. 2011;26(8):907–919.
- , , , et al. Mortality among hospitalized Medicare beneficiaries in the first 2 years following ACGME resident duty hour reform. JAMA. 2007;298(9):975–983.
- , , , et al. Effects of resident duty hour reform on surgical and procedural patient safety indicators among hospitalized Veterans Health Administration and Medicare patients. Med Care. 2009;47(7):723–731.
- , , , et al. Pilot trial of IOM duty hour recommendations in neurology residency programs. Neurology. 2011;77(9):883–887.
- , , , et al. Effect of 16‐hour duty periods of patient care and resident education. Mayo Clin Proc. 2011;86:192–196.
- , , , et al. Effects of the 2011 duty hour reforms on interns and their patients: a prospective longitudinal cohort study. JAMA Intern Med. 2013;173(8):657–662.
- , , , et al. Effect of the 2011 vs 2003 duty hour regulation—compliant models on sleep duration, trainee education, and continuity of patient care among internal medicine house staff. JAMA Intern Med. 2013;173(8):649–655.
- , , . Residents' response to duty‐hour regulations—a follow‐up national survey. N Engl J Med. 2012;366:e35.
- , , , . Surgical residents' perceptions of 2011 Accreditation Council for Graduate Medical Education duty hour regulations. JAMA Surg. 2013;148(5):427–433.
- , , . The 2011 duty hour requirements—a survey of residency program directors. N Engl J Med. 2013;368:694–697.
- , , , et al. The effect of reducing maximum shift lengths to 16 hours on internal medicine interns' educational opportunities. Acad Med. 2013;88(4):512–518.
- , . Residency work‐hours reform. A cost analysis including preventable adverse events. J Gen Intern Med. 2005;20(10):873–878.
- , , , , . Cost implications of reduced work hours and workloads for resident physicians. N Engl J Med. 2009;360:2202–2215.
- , , , . Changes in outcomes for internal medicine inpatients after work‐hour regulations. Ann Intern Med. 2007;147:97–103.
- .Maryland Health Services Cost Review Commission. Complications: Maryland Hospital Acquired Conditions. Available at: http://www.hscrc.state.md.us/init_qi_MHAC.cfm. Accessed May 23, 2013.
- , , , et al. What are APR‐DRGs? An introduction to severity of illness and risk of mortality adjustment methodology. 3M Health Information Systems. Available at: http://solutions.3m.com/3MContentRetrievalAPI/BlobServlet?locale=it_IT44(4):1049–1060.
- , , , , . Impact of the 2008 US Preventive Services Task Force Recommendation to discontinue prostate cancer screening among male Medicare beneficiaries. Arch Intern Med. 2012;172(20):1601–1603.
- , , , et al. Effect of reducing interns' work hour on serious medical errors in intensive care units. N Engl J Med. 2004;351(18):1838–1848.
- , , . Effects of reducing or eliminating resident work shifts over 16 hours: a systematic review. Sleep. 2010;33(8):1043–1053.
- , , , et al. Impact of duty hours restrictions on quality of care and clinical outcomes. Am J Med. 2007;120(11):968–974.
- , , , , , . Beyond counting hours: the importance of supervision, professionalism, transitions in care, and workload in residency training. Acad Med. 2012;87(7):883–888.
- , , , , , . One possible future for resident hours: interns' perspective on a one‐month trial of the Institute of Medicine recommended duty hour limits. J Grad Med Educ. 2009;1(2):185–187.
- , , , , . Implementing the 2009 Institute of Medicine recommendations on resident physician work hours, supervision, and safety. Nature Sci Sleep. 2001;3:47–85.
- , . Night float teaching and learning: perceptions of residents and faculty. J Grad Med Educ. 2010;2(2):236–241.
- Institute of Medicine. Resident duty hours: enhancing sleep, supervision, and safety. Report brief. Washington, DC: National Academies; 2008. Available at: http://www.iom.edu/∼/media/Files/Report Files/2008/Resident‐Duty‐Hours/residency hours revised for web.pdf. Accessed May 23, 2013.
The Accreditation Council for Graduate Medical Education (ACGME) Common Program Requirements implemented in July 2011 increased supervision requirements and limited continuous work hours for first‐year residents.[1] Similar to the 2003 mandates, these requirements were introduced to improve patient safety and education at academic medical centers.[2] Work‐hour reforms have been associated with decreased resident burnout and improved sleep.[3, 4, 5] However, national observational studies and systematic reviews of the impact of the 2003 reforms on patient safety and quality of care have been varied in terms of outcome.[6, 7, 8, 9, 10] Small studies of the 2011 recommendations have shown increased sleep duration and decreased burnout, but also an increased number of handoffs and increased resident concerns about making a serious medical error.[11, 12, 13, 14] Although national surveys of residents and program directors have not indicated improvements in education or quality of life, 1 observational study did show improvement in clinical exposure and conference attendance.[15, 16, 17, 18] The impact of the 2011 reforms on patient safety remains unclear.[19, 20]
The objective of this study was to evaluate the association between implementation of the 2011 residency work‐hour mandates and patient safety outcomes at a large academic medical center.
METHODS
Study Design
This observational study used a quasi‐experimental difference‐in‐differences approach to evaluate whether residency work‐hour changes were associated with patient safety outcomes among general medicine inpatients. We compared safety outcomes among adult patients discharged from resident general medical services (referred to as resident) to safety outcomes among patients discharged by the hospitalist general medical service (referred to as hospitalist) before and after the 2011 residency work‐hour reforms at a large academic medical center. Differences in outcomes for the resident group were compared to differences observed in the hospitalist group, with adjustment for relevant demographic and case mix factors.[21] We used the hospitalist service as a control group, because ACGME changes applied only to resident services. The strength of this design is that it controls for secular trends that are correlated with patient safety, impacting both residents and hospitalists similarly.[9]
Approval for this study and a Health Insurance Portability and Accountability Act waiver were granted by the Johns Hopkins University School of Medicine institutional review board. We retrospectively examined administrative data on all patient discharges from the general medicine services at Johns Hopkins Hospital between July 1, 2008 and June 30, 2012 that were identified as pertaining to resident or hospitalist services.
Patient Allocation and Physician Scheduling
Patient admission to the resident or hospitalist service was decided by a number of factors. To maintain continuity of care, patients were preferentially admitted to the same service as for prior admissions. New patients were admitted to a service based on bed availability, nurse staffing, patient gender, isolation precautions, and cardiac monitor availability.
The inpatient resident services were staffed prior to July 2011 using a traditional 30‐hour overnight call system. Following July 2011, the inpatient resident services were staffed using a modified overnight call system, in which interns took overnight calls from 8 pm until 12 pm the following day, once every 5 nights with supervision by upper‐level residents. These interns rotated through daytime admitting and coverage roles on the intervening days. The hospitalist service was organized into a 3‐physician rotation of day shift, evening shift, and overnight shift.
Data and Outcomes
Twenty‐nine percent of patients in the sample were admitted more than once during the study period, and patients were generally admitted to the same resident team during each admission. Patients with multiple admissions were counted multiple times in the model. We categorized admissions as prereform (July 1, 2008June 30, 2011) and postreform (July 1, 2011June 30, 2012). Outcomes evaluated included hospital length of stay, 30‐day readmission, intensive care unit stay (ICU) stay, inpatient mortality, and number of Maryland Hospital Acquired Conditions (MHACs). ICU stay pertained to any ICU admission including initial admission and transfer from the inpatient floor. MHACs are a set of inpatient performance indicators derived from a list of 64 inpatient Potentially Preventable Complications developed by 3M Health Information Systems.[22] MHACs are used by the Maryland Health Services Cost Review Commission to link hospital payment to performance for costly, preventable, and clinically relevant complications. MHACs were coded in our analysis as a dichotomous variable. Independent variables included patient age at admission, race, gender, and case mix index. Case mix index (CMI) is a numeric score that measures resource utilization for a specific patient population. CMI is a weighted value assigned to patients based on resource utilization and All Patient Refined Diagnostic Related Group and was included as an indicator of patient illness severity and risk of mortality.[23] Data were obtained from administrative records from the case mix research team at Johns Hopkins Medicine.
To account for transitional differences that may have coincided with the opening of a new hospital wing in late April 2012, we conducted a sensitivity analysis, in which we excluded from analysis any visits that took place in May 2012 to June 2012.
Data Analysis
Based on historical studies, we calculated that a sample size of at least 3600 discharges would allow us to detect a difference of 5% between the pre‐ and postreform period assuming baseline 20% occurrence of dichotomous outcomes (=0.05; =0.2; r=4).[21]
The primary unit of analysis was the hospital discharge. Similar to Horwitz et al., we analyzed data using a difference‐in‐differences estimation strategy.[21] We used multivariable linear regression for length of stay measured as a continuous variable, and multivariable logistic regression for inpatient mortality, 30‐day readmission, MHACs coded as a dichotomous variable, and ICU stay coded as a dichotomous variable.[9] The difference‐in‐differences estimation was used to determine whether the postreform period relative to prereform period was associated with differences in outcomes comparing resident and hospitalist services. In the regression models, the independent variables of interest included an indicator variable for whether a patient was treated on a resident service, an indicator variable for whether a patient was discharged in the postreform period, and the interaction of these 2 variables (resident*postreform). The interaction term can be interpreted as a differential change over time comparing resident and hospitalist services. In all models, we adjusted for patient age, gender, race, and case mix index.
To determine whether prereform trends were similar among the resident and hospitalist services, we performed a test of controls as described by Volpp and colleagues.[6] Interaction terms for resident service and prereform years 2010 and 2011 were added to the model. A Wald test was then used to test for improved model fit, which would indicate differential trends among resident and hospitalist services during the prereform period. Where such trends were found, postreform results were compared only to 2011 rather than the 2009 to 2011 prereform period.[6]
To account for correlation within patients who had multiple discharges, we used a clustering approach and estimated robust variances.[24] From the regression model results, we calculated predicted probabilities adjusted for relevant covariates and prepost differences, and used linear probability models to estimate percentage‐point differences in outcomes, comparing residents and hospitalists in the pre‐ and postreform periods.[25] All analyses were performed using Stata/IC version 11 (StataCorp, College Station, TX).
RESULTS
In the 3 years before the 2011 residency work‐hour reforms were implemented (prereform), there were a total of 15,688 discharges for 8983 patients to the resident services and 4622 discharges for 3649 patients to the hospitalist services. In the year following implementation of residency work‐hour changes (postreform), there were 5253 discharges for 3805 patients to the resident services and 1767 discharges for 1454 patients to the hospitalist service. Table 1 shows the characteristics of patients discharged from the resident and hospitalist services in the pre‐ and postreform periods. Patients discharged from the resident services were more likely to be older, male, African American, and have a higher CMI.
| Resident Services | Hospitalist Service | ||||||||
|---|---|---|---|---|---|---|---|---|---|
| 2009 | 2010 | 2011 | 2012 | 2009 | 2010 | 2011 | 2012 | P Valuea | |
| |||||||||
| Discharges, n | 5345 | 5299 | 5044 | 5253 | 1366 | 1492 | 1764 | 1767 | |
| Unique patients, n | 3082 | 2968 | 2933 | 3805 | 1106 | 1180 | 1363 | 1454 | |
| Age, y, mean (SD) | 55.1 (17.7) | 55.7 (17.4) | 56.4 (17.9) | 56.7 (17.1) | 55.9 (17.9) | 56.2 (18.4) | 55.5 (18.8) | 54 (18.7) | 0.02 |
| Sex male, n (%) | 1503 (48.8) | 1397 (47.1) | 1432 (48.8) | 1837 (48.3) | 520 (47) | 550 (46.6) | 613 (45) | 654 (45) | <0.01 |
| Race | |||||||||
| African American, n (%) | 2072 (67.2) | 1922 (64.8) | 1820 (62.1) | 2507 (65.9) | 500 (45.2) | 592 (50.2) | 652 (47.8) | 747 (51.4) | <0.01 |
| White, n (%) | 897 (29.1) | 892 (30.1) | 957 (32.6) | 1118 (29.4) | 534 (48.3) | 527 (44.7) | 621 (45.6) | 619 (42.6) | |
| Asian, n (%) | 19 (.6%) | 35 (1.2) | 28 (1) | 32 (.8) | 11 (1) | 7 (.6) | 25 (1.8) | 12 (.8) | |
| Other, n (%) | 94 (3.1) | 119 (4) | 128 (4.4) | 148 (3.9) | 61 (5.5) | 54 (4.6) | 65 (4.8) | 76 (5.2) | |
| Case mix index, mean (SD) | 1.2 (1) | 1.1 (0.9) | 1.1 (0.9) | 1.1 (1.2) | 1.2 (1) | 1.1 (1) | 1.1 (1) | 1 (0.7) | <0.01 |
Differences in Outcomes Among Resident and Hospitalist Services Pre‐ and Postreform
Table 2 shows unadjusted results. Patients discharged from the resident services in the postreform period as compared to the prereform period had a higher likelihood of an ICU stay (5.9% vs 4.5%, P<0.01), and lower likelihood of 30‐day readmission (17.1% vs 20.1%, P<0.01). Patients discharged from the hospitalist service in the postreform period as compared to the prereform period had a significantly shorter mean length of stay (4.51 vs 4.88 days, P=0.03)
| Resident Services | Hospitalist Service | |||||
|---|---|---|---|---|---|---|
| Outcome | Prereforma | Postreform | P Value | Prereforma | Postreform | P Value |
| ||||||
| Length of stay (mean) | 4.55 (5.39) | 4.50 (5.47) | 0.61 | 4.88 (5.36) | 4.51 (4.64) | 0.03 |
| Any ICU stay (%) | 225 (4.5%) | 310 (5.9%) | <0.01 | 82 (4.7%) | 83 (4.7%) | 0.95 |
| Any MHACs (%) | 560 (3.6%) | 180 (3.4%) | 0.62 | 210 (4.5%) | 64 (3.6%) | 0.09 |
| Readmit in 30 days (%) | 3155 (20.1%) | 900 (17.1%) | <0.01 | 852 (18.4%) | 296 (16.8%) | 0.11 |
| Inpatient mortality (%) | 71 (0.5%) | 28 (0.5%) | 0.48 | 18 (0.4%) | 7 (0.4%) | 0.97 |
Table 3 presents the results of regression analyses examining correlates of patient safety outcomes, adjusted for age, gender, race, and CMI. As the test of controls indicated differential prereform trends for ICU admission and length of stay, the prereform period was limited to 2011 for these outcomes. After adjustment for covariates, the probability of an ICU stay remained greater, and the 30‐day readmission rate was lower among patients discharged from resident services in the postreform period than the prereform period. Among patients discharged from the hospitalist services, there were no significant differences in length of stay, readmissions, ICU admissions, MHACs, or inpatient mortality comparing the pre‐ and postreform periods.
| Resident Services | Hospitalist Service | Difference in Differences | |||||
|---|---|---|---|---|---|---|---|
| Outcome | Prereforma | Postreform | Difference | Prereform | Postreform | Difference | (ResidentHospitalist) |
| |||||||
| ICU stay | 4.5% (4.0% to 5.1%) | 5.7% (5.1% to 6.3%) | 1.4% (0.5% to 2.2%) | 4.4% (3.5% to 5.3%) | 5.3% (4.3% to 6.3%) | 1.1% (0.2 to 2.4%) | 0.3% (1.1% to 1.8%) |
| Inpatient mortality | 0.5% (0.4% to 0.6%) | 0.5% (0.3% to 0.7%) | 0 (0.2% to 0.2%) | 0.3% (0.2% to 0.6%) | 0.5% (0.1% to 0.8%) | 0.1% (0.3% to 0.5%) | 0.1% (0.5% to 0.3%) |
| MHACs | 3.6% (3.3% to 3.9%) | 3.3% (2.9% to 3.7%) | 0.4% (0.9 to 0.2%) | 4.5% (3.9% to 5.1%) | 4.1% (3.2% to 5.1%) | 0.3% (1.4% to 0.7%) | 0.2% (1.0% to 1.3%) |
| Readmit 30 days | 20.1% (19.1% to 21.1%) | 17.2% (15.9% to 18.5%) | 2.8% (4.3% to 1.3%) | 18.4% (16.5% to 20.2%) | 16.6% (14.7% to 18.5%) | 1.7% (4.1% to 0.8%) | 1.8% (0.2% to 3.7%) |
| Length of stay | 4.6 (4.4 to 4.7) | 4.4 (4.3 to 4.6) | 0.1 (0.3 to 0.1) | 4.9 (4.6 to 5.1) | 4.7 (4.5 to 5.0) | 0.1 (0.4 to 0.2) | 0.01 (0.37 to 0.34) |
Differences in Outcomes Comparing Resident and Hospitalist Services Pre‐ and Postreform
Comparing pre‐ and postreform periods in the resident and hospitalist services, there were no significant differences in ICU admission, length of stay, MHACs, 30‐day readmissions, or inpatient mortality. In the sensitivity analysis, in which we excluded all discharges in May 2012 to June 2012, results were not significantly different for any of the outcomes examined.
DISCUSSION
Using difference‐in‐differences estimation, we evaluated whether the implementation of the 2011 residency work‐hour mandate was associated with differences in patient safety outcomes including length of stay, 30‐day readmission, inpatient mortality, MHACs, and ICU admissions comparing resident and hospitalist services at a large academic medical center. Adjusting for patient age, race, gender, and clinical complexity, we found no significant changes in any of the patient safety outcomes indicators in the postreform period comparing resident to hospitalist services.
Our quasiexperimental study design allowed us to gauge differences in patient safety outcomes, while reducing bias due to unmeasured confounders that might impact patient safety indicators.[9] We were able to examine all discharges from the resident and hospitalist general medicine services during the academic years 2009 to 2012, while adjusting for age, race, gender, and clinical complexity. Though ICU admission was higher and readmission rates were lower on the resident services post‐2011, we did not observe a significant difference in ICU admission or 30‐day readmission rates in the postreform period comparing patients discharged from the resident and hospitalist services and all patients in the prereform period.
Our neutral findings differ from some other single‐institution evaluations of reduced resident work hours, several of which have shown improved quality of life, education, and patient safety indicators.[18, 21, 26, 27, 28] It is unclear why improvements in patient safety were not identified in the current study. The 2011 reforms were more broad‐based than some of the preliminary studies of reduced work hours, and therefore additional variables may be at play. For instance, challenges related to decreased work hours, including the increased number of handoffs in care and work compression, may require specific interventions to produce sustained improvements in patient safety.[3, 14, 29, 30]
Improving patient safety requires more than changing resident work hours. Blum et al. recommended enhanced funding to increase supervision, decrease resident caseload, and incentivize achievement of quality indicators to achieve the goal of improved patient safety within work‐hour reform.[31] Schumacher et al. proposed a focus on supervision, professionalism, safe transitions of care, and optimizing workloads as a means to improve patient safety and education within the new residency training paradigm.[29]
Limitations of this study include limited follow‐up time after implementation of the work‐hour reforms. It may take more time to optimize systems of care to see benefits in patient safety indicators. This was a single‐institution study of a limited number of outcomes in a single department, which limits generalizability and may reflect local experience rather than broader trends. The call schedule on the resident service in this study differs from programs that have adopted night float schedules. [27] This may have had an effect on patient care outcomes.[32] In an attempt to conduct a timely study of inpatient safety indicators following the 2011 changes, our study was not powered to detect small changes in low‐frequency outcomes such as mortality; longer‐term studies at multiple institutions will be needed to answer these key questions. We limited the prereform period where our test of controls indicated differential prereform trends, which reduced power.
As this was an observational study rather than an experiment, there may have been both measured and unmeasured differences in patient characteristics and comorbidity between the intervention and control group. For example, CMI was lower on the hospitalist service than the resident services. Demographics varied somewhat between services; male and African American patients were more likely to be discharged from resident services than hospitalist services for unknown reasons. Although we adjusted for demographics and CMI in our model, there may be residual confounding. Limitations in data collection did not allow us to separate patients initially admitted to the ICU from patients transferred to the ICU from the inpatient floors. We attempted to overcome this limitation through use of a difference‐in‐differences model to account for secular trends, but factors other than residency work hours may have impacted the resident and hospitalist services differentially. For example, hospital quality‐improvement programs or provider‐level factors may have differentially impacted the resident versus hospitalist services during the study period.
Work‐hour limitations for residents were established to improve residency education and patient safety. As noted by the Institute of Medicine, improving patient safety will require significant investment by program directors, hospitals, and the public to keep resident caseloads manageable, ensure adequate supervision of first‐year residents, train residents on safe handoffs in care, and conduct ongoing evaluations of patient safety and any unintended consequences of the regulations.[33] In the first year after implementation of the 2011 work‐hour reforms, we found no change in ICU admission, inpatient mortality, 30‐day readmission rates, length of stay, or MHACs compared with patients treated by hospitalists. Studies of the long‐term impact of residency work‐hour reform are necessary to determine whether changes in work hours have been associated with improvement in resident education and patient safety.
Disclosure: Nothing to report.
- Accreditation Council for Graduate Medical Education. Common program requirements effective: July 1, 2011. Available at: http://www.acgme.org/acgmeweb/Portals/0/PFAssets/ProgramResources/Common_Program_Requirements_07012011[1].pdf. Accessed February 10, 2014.
- , , . The new recommendations on duty hours from the ACGME Task Force. N Engl J Med. 2010;363:e3.
- , , , , . Interns' compliance with Accreditation Council for Graduate Medical Education work‐hour limits. JAMA. 2006;296(9):1063–1070.
- , , , , , . Effects of work hour reduction on residents' lives: a systematic review. JAMA. 2005;294(9):1088–1100.
- , , , et al. Effects of the ACGME duty hour limits on sleep, work hours, and safety. Pediatrics. 2008;122(2):250–258.
- , , . Teaching hospital five‐year mortality trends in the wake of duty hour reforms. J Gen Intern Med. 2013;28(8):1048–1055.
- , , , . Duty hour limits and patient care and resident outcomes: can high‐quality studies offer insight into complex relationships? Ann Rev Med. 2013;64:467–483.
- , , . Patient safety, resident education and resident well‐being following implementation of the 2003 ACGME duty hour rules. J Gen Intern Med. 2011;26(8):907–919.
- , , , et al. Mortality among hospitalized Medicare beneficiaries in the first 2 years following ACGME resident duty hour reform. JAMA. 2007;298(9):975–983.
- , , , et al. Effects of resident duty hour reform on surgical and procedural patient safety indicators among hospitalized Veterans Health Administration and Medicare patients. Med Care. 2009;47(7):723–731.
- , , , et al. Pilot trial of IOM duty hour recommendations in neurology residency programs. Neurology. 2011;77(9):883–887.
- , , , et al. Effect of 16‐hour duty periods of patient care and resident education. Mayo Clin Proc. 2011;86:192–196.
- , , , et al. Effects of the 2011 duty hour reforms on interns and their patients: a prospective longitudinal cohort study. JAMA Intern Med. 2013;173(8):657–662.
- , , , et al. Effect of the 2011 vs 2003 duty hour regulation—compliant models on sleep duration, trainee education, and continuity of patient care among internal medicine house staff. JAMA Intern Med. 2013;173(8):649–655.
- , , . Residents' response to duty‐hour regulations—a follow‐up national survey. N Engl J Med. 2012;366:e35.
- , , , . Surgical residents' perceptions of 2011 Accreditation Council for Graduate Medical Education duty hour regulations. JAMA Surg. 2013;148(5):427–433.
- , , . The 2011 duty hour requirements—a survey of residency program directors. N Engl J Med. 2013;368:694–697.
- , , , et al. The effect of reducing maximum shift lengths to 16 hours on internal medicine interns' educational opportunities. Acad Med. 2013;88(4):512–518.
- , . Residency work‐hours reform. A cost analysis including preventable adverse events. J Gen Intern Med. 2005;20(10):873–878.
- , , , , . Cost implications of reduced work hours and workloads for resident physicians. N Engl J Med. 2009;360:2202–2215.
- , , , . Changes in outcomes for internal medicine inpatients after work‐hour regulations. Ann Intern Med. 2007;147:97–103.
- .Maryland Health Services Cost Review Commission. Complications: Maryland Hospital Acquired Conditions. Available at: http://www.hscrc.state.md.us/init_qi_MHAC.cfm. Accessed May 23, 2013.
- , , , et al. What are APR‐DRGs? An introduction to severity of illness and risk of mortality adjustment methodology. 3M Health Information Systems. Available at: http://solutions.3m.com/3MContentRetrievalAPI/BlobServlet?locale=it_IT44(4):1049–1060.
- , , , , . Impact of the 2008 US Preventive Services Task Force Recommendation to discontinue prostate cancer screening among male Medicare beneficiaries. Arch Intern Med. 2012;172(20):1601–1603.
- , , , et al. Effect of reducing interns' work hour on serious medical errors in intensive care units. N Engl J Med. 2004;351(18):1838–1848.
- , , . Effects of reducing or eliminating resident work shifts over 16 hours: a systematic review. Sleep. 2010;33(8):1043–1053.
- , , , et al. Impact of duty hours restrictions on quality of care and clinical outcomes. Am J Med. 2007;120(11):968–974.
- , , , , , . Beyond counting hours: the importance of supervision, professionalism, transitions in care, and workload in residency training. Acad Med. 2012;87(7):883–888.
- , , , , , . One possible future for resident hours: interns' perspective on a one‐month trial of the Institute of Medicine recommended duty hour limits. J Grad Med Educ. 2009;1(2):185–187.
- , , , , . Implementing the 2009 Institute of Medicine recommendations on resident physician work hours, supervision, and safety. Nature Sci Sleep. 2001;3:47–85.
- , . Night float teaching and learning: perceptions of residents and faculty. J Grad Med Educ. 2010;2(2):236–241.
- Institute of Medicine. Resident duty hours: enhancing sleep, supervision, and safety. Report brief. Washington, DC: National Academies; 2008. Available at: http://www.iom.edu/∼/media/Files/Report Files/2008/Resident‐Duty‐Hours/residency hours revised for web.pdf. Accessed May 23, 2013.
© 2014 Society of Hospital Medicine
Etiquette‐Based Medicine Among Interns
Patient‐centered communication may impact several aspects of the patientdoctor relationship including patient disclosure of illness‐related information, patient satisfaction, anxiety, and compliance with medical recommendations.[1, 2, 3, 4] Etiquette‐based medicine, a term coined by Kahn, involves simple patient‐centered communication strategies that convey professionalism and respect to patients.[5] Studies have confirmed that patients prefer physicians who practice etiquette‐based medicine behaviors, including sitting down and introducing one's self.[6, 7, 8, 9] Performance of etiquette‐based medicine is associated with higher Press Ganey patient satisfaction scores. However, these easy‐to‐practice behaviors may not be modeled commonly in the inpatient setting.[10] We sought to understand whether etiquette‐based communication behaviors are practiced by trainees on inpatient medicine rotations.
METHODS
Design
This was a prospective study incorporating direct observation of intern interactions with patients during January 2012 at 2 internal medicine residency programs in Baltimore Maryland, Johns Hopkins Hospital (JHH) and the University of Maryland Medical Center (UMMC). We then surveyed participants from JHH in June 2012 to assess perceptions of their practice of etiquette‐based communication.
Participants and Setting
We observed a convenience sample of 29 internal medicine interns from the 2 institutions. We sought to observe interns over an equal number of hours at both sites and to sample shifts in proportion to the amount of time interns spend on each of these shifts. All interns who were asked to participate in the study agreed and comprised a total of 27% of the 108 interns in the 2 programs. The institutional review board at Johns Hopkins School of Medicine approved the study; the University of Maryland institutional review board deemed it not human subjects research. All observed interns provided informed consent to be observed during 1 to 4 inpatient shifts.
Observers
Twenty‐two undergraduate university students served as the observers for the study and were trained to collect data with the iPod Touch (Apple, Cupertino, CA) without interrupting patient care. We then tested the observers to ensure 85% concordance rate with the researchers in mock observation. Four hours of quality assurance were completed at both institutions during the study. Congruence between observer and research team member was >85% for each hour of observation.
Observation
Observers recorded intern activities on the iPod Touch spreadsheet application. The application allowed for real‐time data entry and direct export of results. The primary dependent variables for this study were 5 behaviors that were assessed each time an intern went into a patient's room. The 5 observed behaviors included (1) introducing one's self, (2) introducing one's role on the medical team, (3) touching the patient, (4) sitting down, and (5) asking the patient at least 1 open‐ended question. These behaviors were chosen for observation because they are central to Kahn's framework of etiquette‐based medicine, applicable to each inpatient encounter, and readily observed by trained nonmedical observers. These behaviors are defined in Table 1. Use of open‐ended questions was observed as a more general form of Kahn's recommendation to ask how the patient is feeling. Interns were not aware of which behaviors were being evaluated.
| Behavior | Definition |
|---|---|
| Introduced self | Providing a name |
| Introduced role | Uses term doctor, resident, intern, or medical team |
| Sat down | Sitting on the bed, in a chair, or crouching if no chair was available during at least part of the encounter |
| Touched the patient | Any form of physical contact that occurred at least once during the encounter including shaking a patient's hand, touching a patient on the shoulder, or performing any part of the physical exam |
| Asked open‐ended question | Asked the patient any question that required more than a yes/no answer |
Each time an observed intern entered a patient room, the observer recorded whether or not each of the 5 behaviors was performed, coded as a dichotomous variable. Although data collection was anonymous, observers recorded the team, hospital site, gender of the intern, and whether the intern was admitting new patients during the shift.
Survey
Following the observational portion of the study, participants at JHH completed a cross‐sectional, anonymous survey that asked them to estimate how frequently they currently performed each of the behaviors observed in this study. Response options included the following categories: <20%, 20% to 40%, 40% to 60%, 60% to 80%, or 80% to 100%.
Data Analysis
We determined the percent of patient visits during which each behavior was performed. Data were analyzed using Student t and [2] tests evaluating differences by hospital, intern gender, type of shift, and time of day. To account for correlation within subjects and observers, we performed multilevel logistic regression analysis adjusted for clustering at the intern and observer levels. For the survey analysis, the mean of the response category was used as the basis for comparison. All quantitative analyses were performed in Excel 2010 (Microsoft Corp., Redmond, WA) and Stata/IC version 11 (StataCorp, College Station, TX).
RESULTS
A total of 732 inpatient encounters were observed during 118 intern shifts. Interns were observed for a mean of 25 patient encounters each (range, 361; standard deviation [SD] 17). Overall, interns introduced themselves 40% of the time and stated their role 37% of the time (Table 2). Interns touched patients on 65% of visits, sat down with patients during 9% of visits, and asked open‐ended questions on 75% of visits. Interns performed all 5 of the behaviors during 4% of the total encounters. The percentage of the 5 behaviors performed by each intern during all observed visits ranged from 24% to 100%, with a mean of 51% (SD 17%) per intern.
| Total Encounters, N (%) | Introduced Self (%) | Introduced Role (%) | Touched Patient (%) | Sat Down (%) | Open‐Ended Question (%) | |
|---|---|---|---|---|---|---|
| ||||||
| Overall | 732 | 40 | 37 | 65 | 9 | 75 |
| JHH | 373 (51) | 35ab | 29ab | 62a | 10 | 70a |
| UMMC | 359 (49) | 45 | 44 | 69 | 8 | 81 |
| Male | 284 (39) | 39 | 35 | 64 | 9 | 74 |
| Female | 448 (61) | 41 | 38 | 67 | 10 | 76 |
| Day shift | 551 (75) | 37a | 34a | 65 | 9 | 77 |
| Night shift | 181 (25) | 48 | 45 | 67 | 12 | 71 |
| Admitting shift | 377 (52) | 46a | 42a | 63 | 10 | 75 |
| Nonadmitting shift | 355 (48) | 34 | 30 | 69 | 9 | 76 |
During night shifts as compared to day shifts, interns were more likely to introduce themselves (48% vs 37%, P=0.01) and their role (45% vs 34%, P<0.01). During shifts in which they admitted patients as compared to coverage shifts, interns were more likely to introduce themselves (46% vs 34%, P<0.01) and their role (42% vs 30%, P<0.01). Interns at UMMC as compared to JHH interns were more likely to introduce themselves (45% vs 35%, P<0.01) and describe their role to patients (44% vs 29%, P<0.01). Interns at UMMC were also more likely to ask open‐ended questions (81% vs 70%, P<0.01) and to touch patients (69% vs 62%, P=0.04). Performance of these behaviors did not vary significantly by gender, time of day, or shift. After adjustment for clustering at the observer and intern levels, differences by institution persisted in the rate of introducing oneself and one's role.
We performed a sensitivity analysis examining the first patient encounters of the day, and found that interns were somewhat more likely to introduce themselves (50% vs 40%, P=0.03) but were not significantly more likely to introduce their role, sit down, ask open‐ended questions, or touch the patient.
Nine of the 10 interns at JHH who participated in the study completed the survey (response rate=90%). Interns estimated introducing themselves and their role and sitting with patients significantly more frequently than was observed (80% vs 40%, P<0.01; 80% vs 37%, P<0.01; and 58% vs 9%, P<0.01, respectively) (Figure 1).

DISCUSSION
The interns we observed in 2 urban academic internal medicine residency programs did not routinely practice etiquette‐based communication. Interns surveyed tended to overestimate their performance of these behaviors. These behaviors are simple to perform and are each associated with improved patient experiences of hospital care. Tackett et al. recently demonstrated that interns are not alone. Hospitalist physicians do not universally practice etiquette‐based medicine, even though these behaviors correlate with patient satisfaction scores.[10]
Introducing oneself to patients may improve patient satisfaction and acceptance of trainee involvement in care.[6] However, only 10% of hospitalized patients in 1 study correctly identified a physician on their inpatient team, demonstrating the need for introductions during each and every inpatient encounter.[11] The interns we observed introduced themselves to patients in only 40% of encounters. During admitting shifts, when the first encounter with a patient likely took place, interns introduced themselves during 46% of encounters.
A comforting touch has been shown to reduce anxiety levels among patients and improve compliance with treatment regimens, but the interns did not touch patients in one‐third of visits, including during admitting shifts. Sixty‐six percent of patients consider a physician's touch comforting, and 58% believe it to be healing.[8]
A randomized trial found that most patients preferred a sitting physician, and believed that practitioners who sat were more compassionate and spent more time with them.[9] Unfortunately, interns sat down with patients in fewer than 10% of encounters.
We do not know why interns do not engage in these simple behaviors, but it is not surprising given that their role models, including hospitalist physicians, do not practice them universally.[10] Personality differences, medical school experiences, and hospital factors such as patient volume and complexity may explain variability in performance.
Importantly, we know that habits learned in residency tend to be retained when physicians enter independent practice.[12] If we want attending physicians to practice etiquette‐based communication, then it must be role modeled, taught, and evaluated during residency by clinical educators and hospitalist physicians. The gap between intern perceptions and actual practice of these behaviors provides a window of opportunity for education and feedback in bedside communication. Attending physicians rate communication skills as 1 of the top values they seek to pass on to house officers.[13] Curricula on communication skills improve physician attitudes and beliefs about the importance of good communication as well as long‐term performance of communication skills.[14]
Our study had several limitations. First, all 732 patient encounters were assessed, regardless of whether the intern had seen the patient previously. This differed slightly from Kahn's assertion that these behaviors be performed at least on the first encounter with the patient. We believe that the need for common courtesy does not diminish after the first visit, and although certain behaviors may not be indicated on 100% of visits, our sensitivity analysis indicated performance of these behaviors was not likely even on the first visit of the day.
Second, our observations were limited to medicine interns at 2 programs in Baltimore during a single month, limiting generalizability. A convenience sample of interns was chosen for recruitment based on rotation on a general medicine rotation during the study month. We observed interns over the course of several shifts and throughout various positions in the call cycle.
Third, in any observational study, the Hawthorne effect is a potential limitation. We attempted to limit this bias by collecting information anonymously and not indicating to the interns which aspects of the patient encounter were being recorded.
Fourth, we defined the behaviors broadly in an attempt to measure the outcomes conservatively and maximize inter‐rater reliability. For instance, we did not differentiate in data collection between comforting touch and physical examination. Because chairs may not be readily available in all patient rooms, we included sitting on the patient's bed or crouching next to the bed as sitting with the patient. Use of open‐ended questions was observed as a more general form of Kahn's recommendation to ask how the patient is feeling.
Fifth, our poststudy survey was conducted 6 months after the observations were performed, used an ordinal rather than continuous response scale, and was limited to only 1 of the 2 programs and 9 of the 29 participants. Given this small sample size, generalizability of the results is limited. Additionally, intern practice of etiquette‐based communication may have improved between the observations and survey that took place 6 months later.
As hospital admissions are a time of vulnerability for patients, physicians can take a basic etiquette‐based communication approach to comfort patients and help them feel more secure. We found that even though interns believed they were practicing Kahn's recommended etiquette‐based communication, only a minority actually were. Curricula on communication styles or environmental changes, such as providing chairs in patient rooms or photographs identifying members of the medical team, may encourage performance of these behaviors.[15]
Acknowledgments
The authors acknowledge Dr. Lisa Cooper, MD, MPH, and Dr. Mary Catherine Beach, MD, MPH, who provided tremendous help in editing. The authors also thank Kevin Wang, whose assistance with observer hiring, training, and management was essential.
Disclosures: The Osler Center for Clinical Excellence at Johns Hopkins and the Johns Hopkins Hospitalist Scholars Fund provided stipends for our observers as well as transportation and logistical costs of the study. The authors report no conflicts of interest.
- , , . Physician‐patient communication in the primary care office: a systematic review. J Am Board Fam Pract. 2002;15:25–38.
- , . Physicians' nonverbal rapport building and patients' talk about the subjective component of illness. Hum Commun Res. 2001;27:299–311.
- , , , , . Can 40 seconds of compassion reduce patient anxiety? J Clin Oncol. 1999;17:371–379.
- , , , . House staff nonverbal communication skills and patient satisfaction. J Gen Intern Med. 2003;18:170–174.
- . Etiquette‐based medicine. N Engl J Med. 2008;358:1988–1989.
- , , . Patient satisfaction associated with correct identification of physician's photographs. Mayo Clin Proc. 2001;76:604–608.
- . Effective physician‐patient communication and health outcomes: a review. CMAJ. 1995;152:1423–1433.
- , , , . Patients' attitudes to comforting touch in family practice. Can Fam Physician. 2000;46:2411–2416.
- , , , et al. Impact of physician sitting versus standing during inpatient oncology consultations: patients' preference and perception of compassion and duration. A randomized controlled trial. J Pain Symptom Manage. 2005;29:489–497.
- , , , , . Appraising the practice of etiquette‐based medicine in the inpatient setting. J Gen Intern Med. 2013;28(7):908–913.
- , , , , , . Ability of hospitalized patients to identify their in‐hospital physicians. Arch Intern Med. 2009;169:199–201.
- , , . The content of internal medicine residency training and its relevance to the practice of medicine. J Gen Intern Med. 1989;4:304–308.
- , . Which values to attending physicians try to pass on to house officers? Med Educ. 2001;35:941–945.
- , , , , , . Relationship of resident characteristics, attitudes, prior training, and clinical knowledge to communication skills performance. Med Educ. 2006;40:18–25.
- , , , . PHACES (Photographs of academic clinicians and their educational status): a tool to improve delivery of family‐centered care. Acad Pediatr. 2010;10:138–145.
Patient‐centered communication may impact several aspects of the patientdoctor relationship including patient disclosure of illness‐related information, patient satisfaction, anxiety, and compliance with medical recommendations.[1, 2, 3, 4] Etiquette‐based medicine, a term coined by Kahn, involves simple patient‐centered communication strategies that convey professionalism and respect to patients.[5] Studies have confirmed that patients prefer physicians who practice etiquette‐based medicine behaviors, including sitting down and introducing one's self.[6, 7, 8, 9] Performance of etiquette‐based medicine is associated with higher Press Ganey patient satisfaction scores. However, these easy‐to‐practice behaviors may not be modeled commonly in the inpatient setting.[10] We sought to understand whether etiquette‐based communication behaviors are practiced by trainees on inpatient medicine rotations.
METHODS
Design
This was a prospective study incorporating direct observation of intern interactions with patients during January 2012 at 2 internal medicine residency programs in Baltimore Maryland, Johns Hopkins Hospital (JHH) and the University of Maryland Medical Center (UMMC). We then surveyed participants from JHH in June 2012 to assess perceptions of their practice of etiquette‐based communication.
Participants and Setting
We observed a convenience sample of 29 internal medicine interns from the 2 institutions. We sought to observe interns over an equal number of hours at both sites and to sample shifts in proportion to the amount of time interns spend on each of these shifts. All interns who were asked to participate in the study agreed and comprised a total of 27% of the 108 interns in the 2 programs. The institutional review board at Johns Hopkins School of Medicine approved the study; the University of Maryland institutional review board deemed it not human subjects research. All observed interns provided informed consent to be observed during 1 to 4 inpatient shifts.
Observers
Twenty‐two undergraduate university students served as the observers for the study and were trained to collect data with the iPod Touch (Apple, Cupertino, CA) without interrupting patient care. We then tested the observers to ensure 85% concordance rate with the researchers in mock observation. Four hours of quality assurance were completed at both institutions during the study. Congruence between observer and research team member was >85% for each hour of observation.
Observation
Observers recorded intern activities on the iPod Touch spreadsheet application. The application allowed for real‐time data entry and direct export of results. The primary dependent variables for this study were 5 behaviors that were assessed each time an intern went into a patient's room. The 5 observed behaviors included (1) introducing one's self, (2) introducing one's role on the medical team, (3) touching the patient, (4) sitting down, and (5) asking the patient at least 1 open‐ended question. These behaviors were chosen for observation because they are central to Kahn's framework of etiquette‐based medicine, applicable to each inpatient encounter, and readily observed by trained nonmedical observers. These behaviors are defined in Table 1. Use of open‐ended questions was observed as a more general form of Kahn's recommendation to ask how the patient is feeling. Interns were not aware of which behaviors were being evaluated.
| Behavior | Definition |
|---|---|
| Introduced self | Providing a name |
| Introduced role | Uses term doctor, resident, intern, or medical team |
| Sat down | Sitting on the bed, in a chair, or crouching if no chair was available during at least part of the encounter |
| Touched the patient | Any form of physical contact that occurred at least once during the encounter including shaking a patient's hand, touching a patient on the shoulder, or performing any part of the physical exam |
| Asked open‐ended question | Asked the patient any question that required more than a yes/no answer |
Each time an observed intern entered a patient room, the observer recorded whether or not each of the 5 behaviors was performed, coded as a dichotomous variable. Although data collection was anonymous, observers recorded the team, hospital site, gender of the intern, and whether the intern was admitting new patients during the shift.
Survey
Following the observational portion of the study, participants at JHH completed a cross‐sectional, anonymous survey that asked them to estimate how frequently they currently performed each of the behaviors observed in this study. Response options included the following categories: <20%, 20% to 40%, 40% to 60%, 60% to 80%, or 80% to 100%.
Data Analysis
We determined the percent of patient visits during which each behavior was performed. Data were analyzed using Student t and [2] tests evaluating differences by hospital, intern gender, type of shift, and time of day. To account for correlation within subjects and observers, we performed multilevel logistic regression analysis adjusted for clustering at the intern and observer levels. For the survey analysis, the mean of the response category was used as the basis for comparison. All quantitative analyses were performed in Excel 2010 (Microsoft Corp., Redmond, WA) and Stata/IC version 11 (StataCorp, College Station, TX).
RESULTS
A total of 732 inpatient encounters were observed during 118 intern shifts. Interns were observed for a mean of 25 patient encounters each (range, 361; standard deviation [SD] 17). Overall, interns introduced themselves 40% of the time and stated their role 37% of the time (Table 2). Interns touched patients on 65% of visits, sat down with patients during 9% of visits, and asked open‐ended questions on 75% of visits. Interns performed all 5 of the behaviors during 4% of the total encounters. The percentage of the 5 behaviors performed by each intern during all observed visits ranged from 24% to 100%, with a mean of 51% (SD 17%) per intern.
| Total Encounters, N (%) | Introduced Self (%) | Introduced Role (%) | Touched Patient (%) | Sat Down (%) | Open‐Ended Question (%) | |
|---|---|---|---|---|---|---|
| ||||||
| Overall | 732 | 40 | 37 | 65 | 9 | 75 |
| JHH | 373 (51) | 35ab | 29ab | 62a | 10 | 70a |
| UMMC | 359 (49) | 45 | 44 | 69 | 8 | 81 |
| Male | 284 (39) | 39 | 35 | 64 | 9 | 74 |
| Female | 448 (61) | 41 | 38 | 67 | 10 | 76 |
| Day shift | 551 (75) | 37a | 34a | 65 | 9 | 77 |
| Night shift | 181 (25) | 48 | 45 | 67 | 12 | 71 |
| Admitting shift | 377 (52) | 46a | 42a | 63 | 10 | 75 |
| Nonadmitting shift | 355 (48) | 34 | 30 | 69 | 9 | 76 |
During night shifts as compared to day shifts, interns were more likely to introduce themselves (48% vs 37%, P=0.01) and their role (45% vs 34%, P<0.01). During shifts in which they admitted patients as compared to coverage shifts, interns were more likely to introduce themselves (46% vs 34%, P<0.01) and their role (42% vs 30%, P<0.01). Interns at UMMC as compared to JHH interns were more likely to introduce themselves (45% vs 35%, P<0.01) and describe their role to patients (44% vs 29%, P<0.01). Interns at UMMC were also more likely to ask open‐ended questions (81% vs 70%, P<0.01) and to touch patients (69% vs 62%, P=0.04). Performance of these behaviors did not vary significantly by gender, time of day, or shift. After adjustment for clustering at the observer and intern levels, differences by institution persisted in the rate of introducing oneself and one's role.
We performed a sensitivity analysis examining the first patient encounters of the day, and found that interns were somewhat more likely to introduce themselves (50% vs 40%, P=0.03) but were not significantly more likely to introduce their role, sit down, ask open‐ended questions, or touch the patient.
Nine of the 10 interns at JHH who participated in the study completed the survey (response rate=90%). Interns estimated introducing themselves and their role and sitting with patients significantly more frequently than was observed (80% vs 40%, P<0.01; 80% vs 37%, P<0.01; and 58% vs 9%, P<0.01, respectively) (Figure 1).
DISCUSSION
The interns we observed in 2 urban academic internal medicine residency programs did not routinely practice etiquette‐based communication. Interns surveyed tended to overestimate their performance of these behaviors. These behaviors are simple to perform and are each associated with improved patient experiences of hospital care. Tackett et al. recently demonstrated that interns are not alone. Hospitalist physicians do not universally practice etiquette‐based medicine, even though these behaviors correlate with patient satisfaction scores.[10]
Introducing oneself to patients may improve patient satisfaction and acceptance of trainee involvement in care.[6] However, only 10% of hospitalized patients in 1 study correctly identified a physician on their inpatient team, demonstrating the need for introductions during each and every inpatient encounter.[11] The interns we observed introduced themselves to patients in only 40% of encounters. During admitting shifts, when the first encounter with a patient likely took place, interns introduced themselves during 46% of encounters.
A comforting touch has been shown to reduce anxiety levels among patients and improve compliance with treatment regimens, but the interns did not touch patients in one‐third of visits, including during admitting shifts. Sixty‐six percent of patients consider a physician's touch comforting, and 58% believe it to be healing.[8]
A randomized trial found that most patients preferred a sitting physician, and believed that practitioners who sat were more compassionate and spent more time with them.[9] Unfortunately, interns sat down with patients in fewer than 10% of encounters.
We do not know why interns do not engage in these simple behaviors, but it is not surprising given that their role models, including hospitalist physicians, do not practice them universally.[10] Personality differences, medical school experiences, and hospital factors such as patient volume and complexity may explain variability in performance.
Importantly, we know that habits learned in residency tend to be retained when physicians enter independent practice.[12] If we want attending physicians to practice etiquette‐based communication, then it must be role modeled, taught, and evaluated during residency by clinical educators and hospitalist physicians. The gap between intern perceptions and actual practice of these behaviors provides a window of opportunity for education and feedback in bedside communication. Attending physicians rate communication skills as 1 of the top values they seek to pass on to house officers.[13] Curricula on communication skills improve physician attitudes and beliefs about the importance of good communication as well as long‐term performance of communication skills.[14]
Our study had several limitations. First, all 732 patient encounters were assessed, regardless of whether the intern had seen the patient previously. This differed slightly from Kahn's assertion that these behaviors be performed at least on the first encounter with the patient. We believe that the need for common courtesy does not diminish after the first visit, and although certain behaviors may not be indicated on 100% of visits, our sensitivity analysis indicated performance of these behaviors was not likely even on the first visit of the day.
Second, our observations were limited to medicine interns at 2 programs in Baltimore during a single month, limiting generalizability. A convenience sample of interns was chosen for recruitment based on rotation on a general medicine rotation during the study month. We observed interns over the course of several shifts and throughout various positions in the call cycle.
Third, in any observational study, the Hawthorne effect is a potential limitation. We attempted to limit this bias by collecting information anonymously and not indicating to the interns which aspects of the patient encounter were being recorded.
Fourth, we defined the behaviors broadly in an attempt to measure the outcomes conservatively and maximize inter‐rater reliability. For instance, we did not differentiate in data collection between comforting touch and physical examination. Because chairs may not be readily available in all patient rooms, we included sitting on the patient's bed or crouching next to the bed as sitting with the patient. Use of open‐ended questions was observed as a more general form of Kahn's recommendation to ask how the patient is feeling.
Fifth, our poststudy survey was conducted 6 months after the observations were performed, used an ordinal rather than continuous response scale, and was limited to only 1 of the 2 programs and 9 of the 29 participants. Given this small sample size, generalizability of the results is limited. Additionally, intern practice of etiquette‐based communication may have improved between the observations and survey that took place 6 months later.
As hospital admissions are a time of vulnerability for patients, physicians can take a basic etiquette‐based communication approach to comfort patients and help them feel more secure. We found that even though interns believed they were practicing Kahn's recommended etiquette‐based communication, only a minority actually were. Curricula on communication styles or environmental changes, such as providing chairs in patient rooms or photographs identifying members of the medical team, may encourage performance of these behaviors.[15]
Acknowledgments
The authors acknowledge Dr. Lisa Cooper, MD, MPH, and Dr. Mary Catherine Beach, MD, MPH, who provided tremendous help in editing. The authors also thank Kevin Wang, whose assistance with observer hiring, training, and management was essential.
Disclosures: The Osler Center for Clinical Excellence at Johns Hopkins and the Johns Hopkins Hospitalist Scholars Fund provided stipends for our observers as well as transportation and logistical costs of the study. The authors report no conflicts of interest.
- , , . Physician‐patient communication in the primary care office: a systematic review. J Am Board Fam Pract. 2002;15:25–38.
- , . Physicians' nonverbal rapport building and patients' talk about the subjective component of illness. Hum Commun Res. 2001;27:299–311.
- , , , , . Can 40 seconds of compassion reduce patient anxiety? J Clin Oncol. 1999;17:371–379.
- , , , . House staff nonverbal communication skills and patient satisfaction. J Gen Intern Med. 2003;18:170–174.
- . Etiquette‐based medicine. N Engl J Med. 2008;358:1988–1989.
- , , . Patient satisfaction associated with correct identification of physician's photographs. Mayo Clin Proc. 2001;76:604–608.
- . Effective physician‐patient communication and health outcomes: a review. CMAJ. 1995;152:1423–1433.
- , , , . Patients' attitudes to comforting touch in family practice. Can Fam Physician. 2000;46:2411–2416.
- , , , et al. Impact of physician sitting versus standing during inpatient oncology consultations: patients' preference and perception of compassion and duration. A randomized controlled trial. J Pain Symptom Manage. 2005;29:489–497.
- , , , , . Appraising the practice of etiquette‐based medicine in the inpatient setting. J Gen Intern Med. 2013;28(7):908–913.
- , , , , , . Ability of hospitalized patients to identify their in‐hospital physicians. Arch Intern Med. 2009;169:199–201.
- , , . The content of internal medicine residency training and its relevance to the practice of medicine. J Gen Intern Med. 1989;4:304–308.
- , . Which values to attending physicians try to pass on to house officers? Med Educ. 2001;35:941–945.
- , , , , , . Relationship of resident characteristics, attitudes, prior training, and clinical knowledge to communication skills performance. Med Educ. 2006;40:18–25.
- , , , . PHACES (Photographs of academic clinicians and their educational status): a tool to improve delivery of family‐centered care. Acad Pediatr. 2010;10:138–145.