User login
Improving Veteran Access to Treatment for Hepatitis C Virus Infection (FULL)
In the U.S., 2.7 to 3.9 million people are chronically infected with the hepatitis C virus (HCV).1 Survey data suggest that HCV infection is more prevalent in patients enrolled in the VA health care system than it is in civilian health care systems.2 Studies have shown that Vietnam veterans, veterans with mental health and substance abuse disorders, and veterans without stable housing are more likely to be infected with HCV.3 Data from the VA HCV Clinical Case Registry (CCR) for 2015 showed that 174,842 veterans with chronic HCV infection receieved care within the VHA, which makes the VA the single largest HCV care provider in the nation.4
The VA is dedicated to providing treatment to veterans with HCV infection. For fiscal year (FY) 2016, the VA allocated $1 billion to HCV care,and in February 2016 it began offering treatment to all veterans with HCV, regardless of degree of fibrosis or severity of underlying liver disease.3,5 Each VAMC was tasked with improving veterans’ access to HCV treatment.
In an effort to engage patients in HCV care, the multidisciplinary HCV team at the Richard L. Roudebush VAMC (RLRVAMC) in Indianapolis, Indiana, launched a 2-phase improvement process in 2016. The goal in phase 1 was to increase patient access to HCV clinics, and the goal in phase 2 was to recruit patients for direct-acting antiviral (DAA) therapy for HCV. These efforts were designed to increase screening, identification, and linkage to care for HCV and to expand clinic access for the treatment and cure of all identified veterans who pursued treatment.
Patients with HCV infection, referred from primary care clinics, initially were evaluated by HCV clinic providers (hepatologists, infectious disease specialists, gastroenterology fellows, or nurse practitioners) for eligibility to receive DAA therapy for HCV. Eligible patients then were referred to a pharmacist-run HCV clinic, which had been established at RLRVAMC in 2011. At the start of FY 2016, the clinic, staffed by 3 pharmacists, operated 5 half-days per week and accommodated up to 35 weekly patient appointments.
In this clinic, patients received initial education and medication reconciliation for potential drug interactions with DAAs. Once the HCV treatment was initiated, patients were evaluated in the clinic every 2 weeks for medication refills and assessment for tolerability, adherence, and laboratory abnormalities until end of treatment (8-24 weeks, depending on HCV genotype, experiences with prior HCV treatment, and presence/absence of cirrhosis). Twelve weeks after completion of treatment, viral load was obtained to determine sustained virologic response (SVR12).
Methods
Phase 1: Improve Clinic Access
During FY 2016, methods for expanding clinic access to accommodate a large influx of treatment-eligible patients were reviewed and implemented.
In the first intervention, unneeded follow-up visits were eliminated to make room for additional new patient appointments. In general, patients treated with ribavirin require close monitoring, given the risk for anemia.6 With the release of newer DAAs, however, more patients became eligible for treatment with ribavirin-free regimens.7 As a result, follow-up appointments for these patients were extended to 4-week intervals instead of every 2 weeks. A patient with a history of nonadherence to medication use or clinic visits was still maintained on a 2-week schedule of follow-up for close monitoring.
In the second intervention, opportunities for switching those who completed treatment from face-to-face clinic visits to telephone were identified. These patients historically were seen in clinic for a brief interview and for a blood test used to determine end-of-treatment viral load. Improving access for new patients in the clinic involved moving more existing patients from in-clinic visits to telephone. At the end of the treatment plan, existing patients received an order for laboratory tests that included viral load. When all laboratory results were ready, patients were contacted by telephone. Recruiting a registered nurse to the treatment team who assisted with telephone visits further improved clinic efficiency.
The third intervention was inspired by successful results at other VA sites and launched a group treatment clinic for patients who were starting ribavirin-free DAA regimens.7 Group visits were run by 2 pharmacists and accommodated up to 10 veterans. Patients underwent testing for HCV genotype and viral load before the initial group visit. At check-in, patients received a short questionnaire and consent form for group participation. The questionnaire reviewed patient history of drug and alcohol use and potential barriers to medication adherence. Patients also were encouraged to write down any questions they had about the treatment. During the initial group visit, pharmacists provided general education about the medications, potential adverse effects, treatment expectations, and the monitoring plan. Follow-up visits were conducted in a group setting as well.
Phase 2: Increase Recruitment
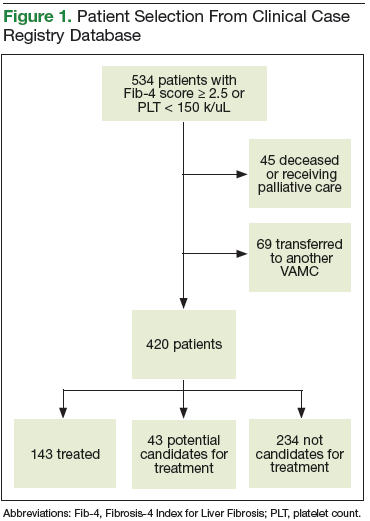
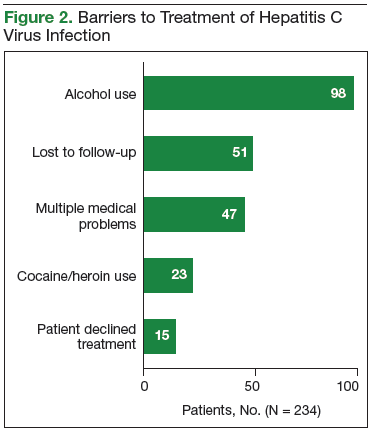
The records of 534 patients with advanced liver disease (F3-F4 fibrosis on the Fibrosis-4 Index for Liver Fibrosis) and HCV infection were identified in the CCR database for the period August 2015 to December 2015 (Figure 1).8 Patients were excluded if they were deceased, were receiving palliative care (n = 45), or if they had transferred their care to another VA facility (n = 69). Of the 420 patients in the study reviewed, 234 (56%) had not previously been referred to an HCV clinic or been started on treatment because of a variety of social issues, including active substance use (Figure 2).
Many of the patients were difficult to engage because the clinic could not effectively assist them in achieving sobriety and lacked support personnel who could address their complex social issues. Given the availability of all-oral HCV treatments, the VA Public Health Department issued guidance allowing all HCV-infected patients to receive DAA treatment regardless of ongoing drug or alcohol use disorders.9 Substance use was not to be considered a contraindication to therapy. It was suggested that health care providers determine these patients’ treatment eligibility on a case-by-case basis. An official VA memorandum supporting this initiative was released in September 2016.10
Interventions
In an effort to engage all HCV-infected patients, the CCR review was expanded to include patients without advanced liver disease. All patients were contacted by mail. Any patient registered for secure messaging through MyHealtheVet also received a secure message. Patients were informed about the newly approved DAA therapies and were connected directly with specialized HCV clinic schedulers at RLRVAMC. Patients who responded were scheduled for a group education class facilitated by 2 members of the HCV treatment team.
Unlike patients in the group treatment clinic, patients in the education class had not completed the necessary workup for treatment initiation. In the class, patients received education on new HCV treatments and were linked to social work care if needed to streamline the referral process. All baseline laboratory test results also were obtained.
Another intervention implemented to recruit patients in this difficult-to-treat population was the addition of a social worker to the treatment team. Beginning in late June 2016, high-risk patients were referred to the social worker by HCV providers or pharmacists. For each referred patient, the social worker performed a psychosocial assessment to identify potential barriers to successful treatment and then connected the patient with either VA or community resources for support.
The social worker linked patients to mental health or substance use-related services, empowered them to access transportation resources for clinic appointments, orchestrated assistance with medication adherence from a home health nurse, and reached out to patients in person or by telephone to address specific needs that might limit their ability to attend appointments. The social worker also provided harm reduction planning and goal setting support to help patients with substance use disorders achieve sobriety or reduce substance use while on HCV treatment. All efforts were made to ensure that patients adhered to their clinic visits and medication use. In addition, during social work assessment, factors such as housing concerns, travel barriers, and loss and grief were identified and promptly addressed.
Results
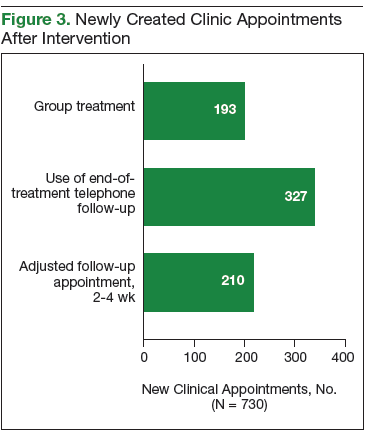
After the phase 1 intervention, 730 additional appointments were added in FY 2016 (Figure 3). As a result, 409 patients with HCV infection were started on treatment in FY 2016 compared with 192 in FY 2015. More important, the rapid increase in capacity and treatment initiation did not sacrifice the quality of care provided. Ninety-eight percent of patients who started treatment in FY 2016 successfully completed their treatment course. The overall SVR12 rate was 96% for all genotype 1 patients treated with ledipasvir/sofosbuvir, ombitasvir/paritaprevir/ritonavir plus dasabuvir, or elbasvir/grazoprevir with or without ribavirin. In addition, the SVR12 rate was 82% for genotype 2 patients (almost all cirrhotic) treated with sofosbuvir plus ribavirin and 93% for genotype 3 patients treated with daclatasvir, sofosbuvir, and ribavirin.
Phase 2: Increase Recruitment
The expanded CCR review identified 234 patients with advanced liver disease and 546 patients without advanced disease. As this was a rolling review, 58 patients were linked to care before being contacted. Of the 722 patients in the cohort, 528 were contacted by mail and 194 both by mail and by MyHealtheVet messaging. One hundred forty-one patients responded: 129 by mail and 12 by MyHealtheVet messaging (eFigure 1). 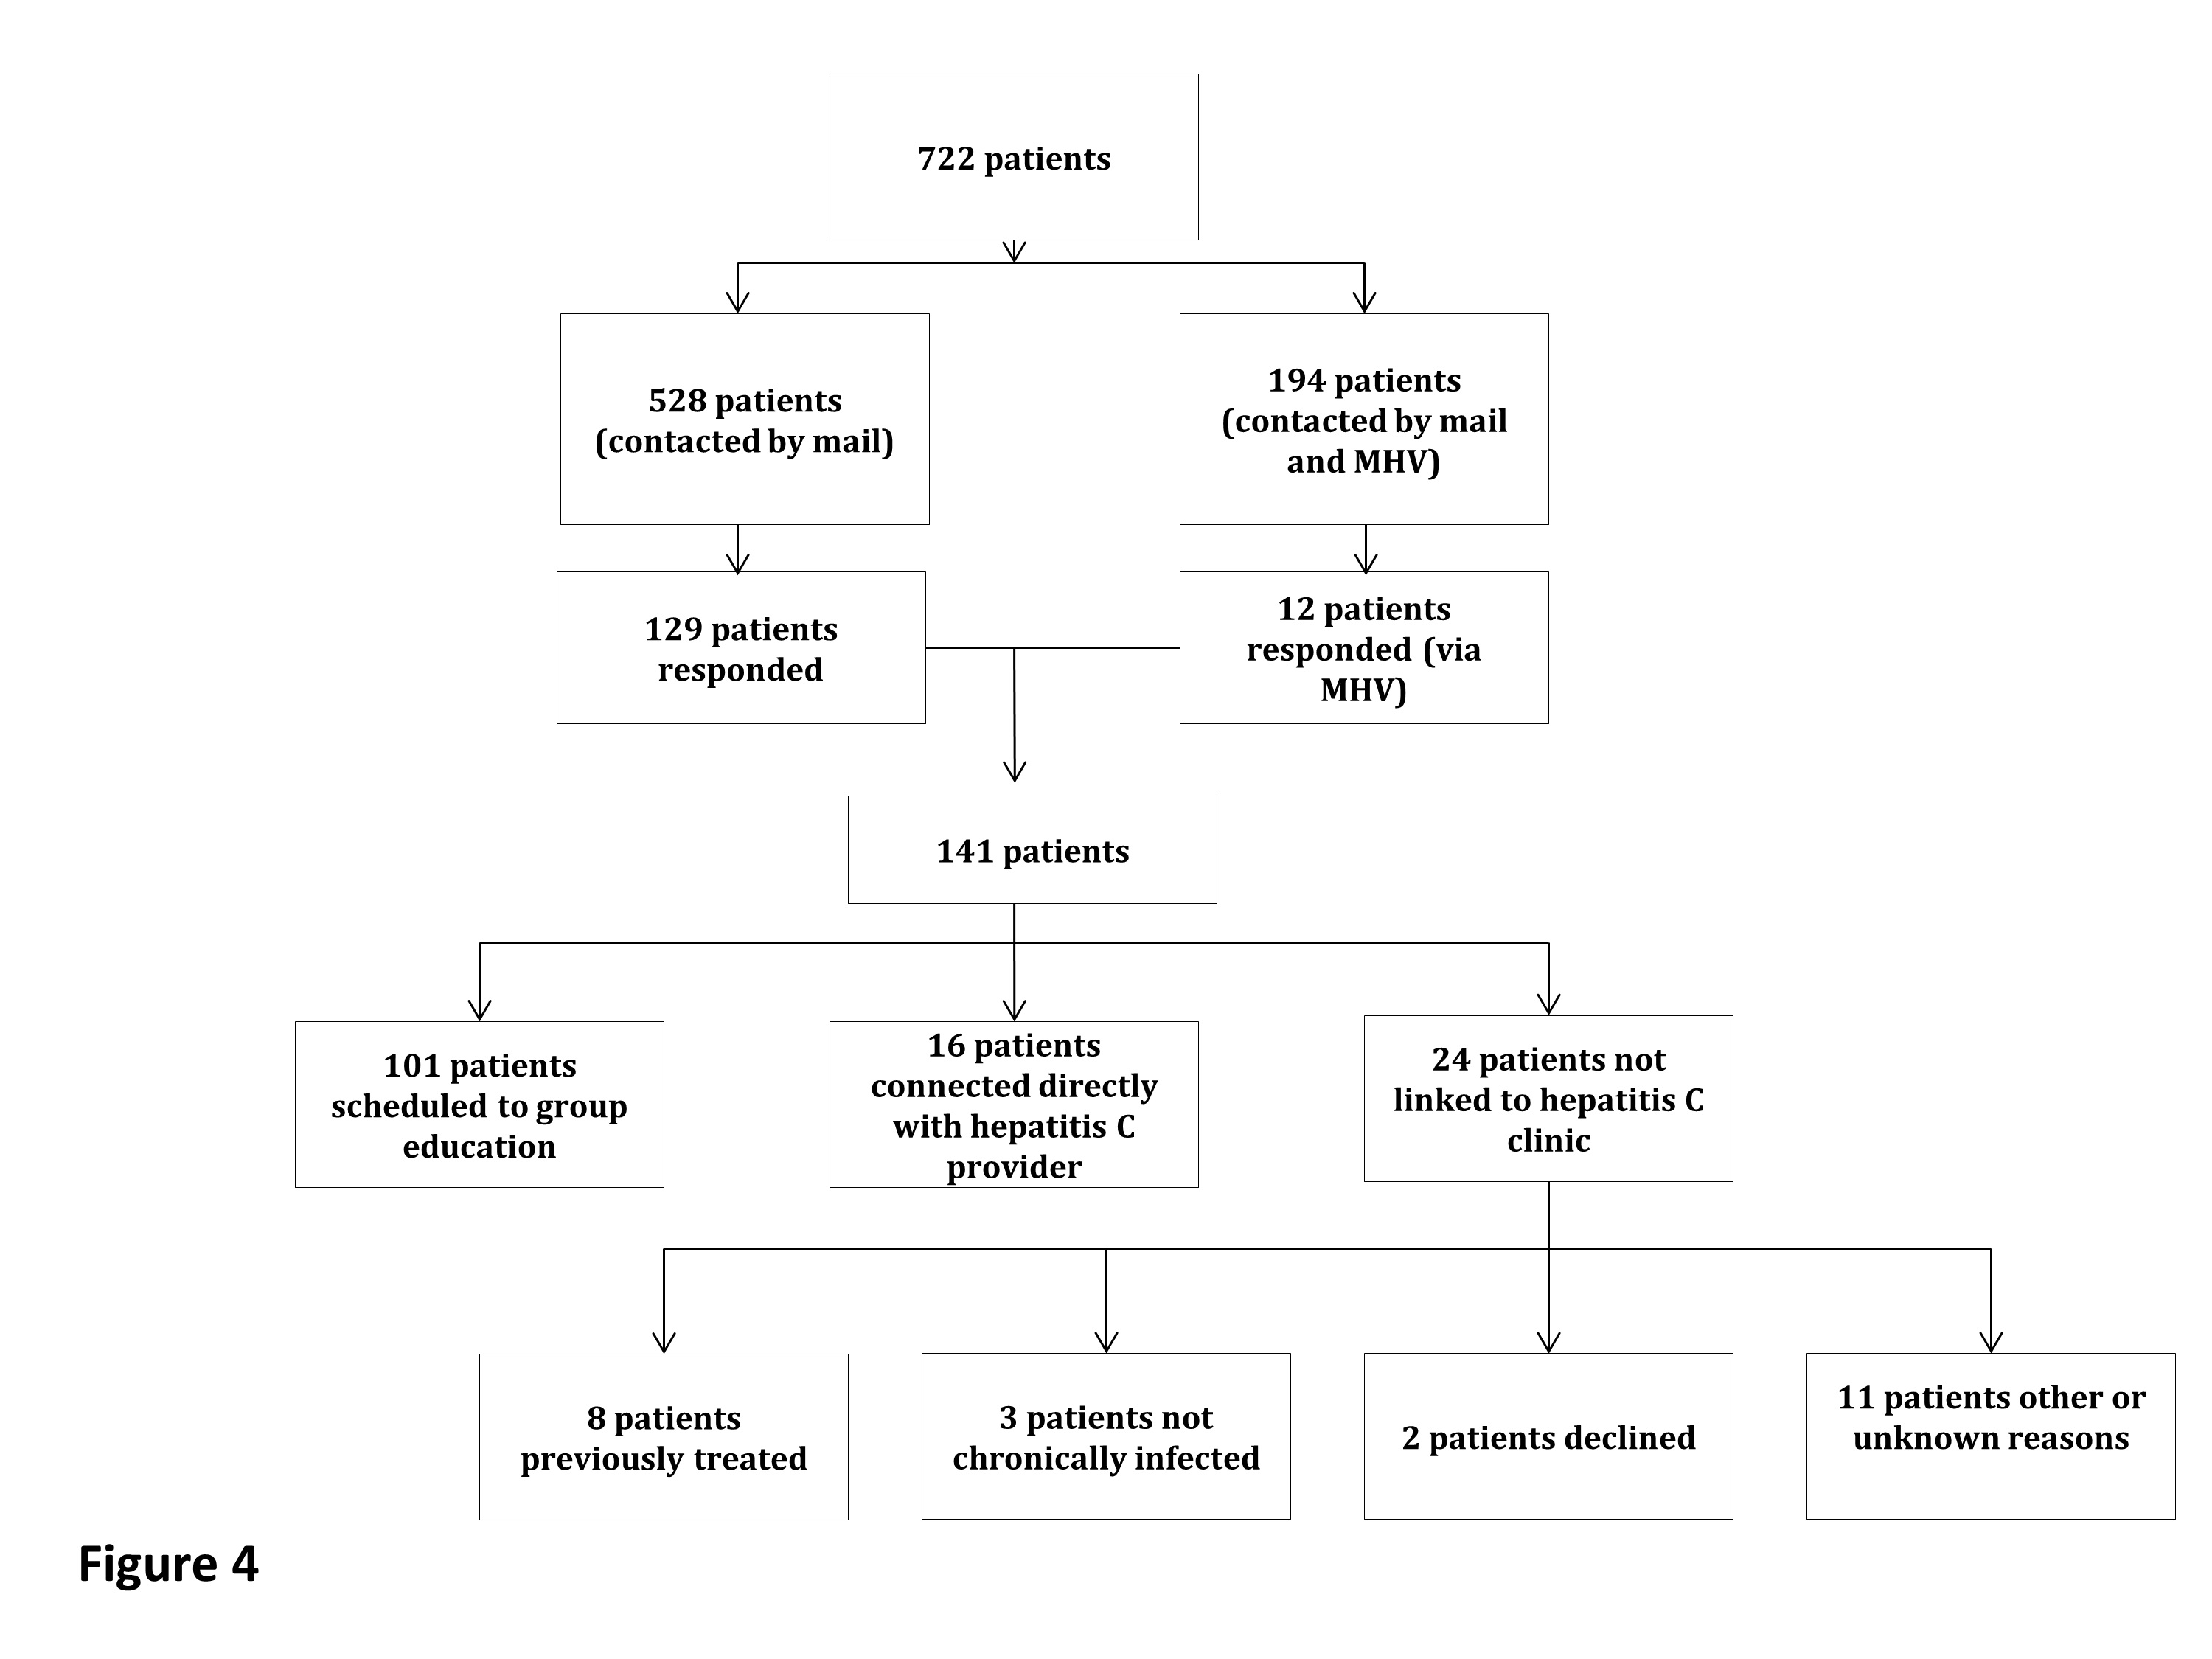
Of the 101 patients scheduled for group education, 43 attended education in FY 2016 (eFigure 2).
In June 2016, a social worker was added to the treatment team in an effort to improve recruitment in this difficult to treat population (Figure 2). Between June 2016 and end of FY 2016, 48 patients were referred to the social worker for evaluation. The primary reasons for referral were ongoing substance/alcohol use or high risk for relapse (n = 22); appointment adherence barriers, including problems with transportation (n = 16); underlying mental health disorders (n = 4); barriers to medication adherence (n = 3); and unstable housing (n = 3). Of these 48 patients, 31 received a single social worker intervention to connect with resources; the other 17 were recommended for intensive case management for ongoing support during preparation for HCV treatment and during therapy. As a result of social work involvement, 31 out of 48 referred patients were successfully started on treatment in FY 2016.
Discussion
The VA continues focusing its efforts and resources on treating HCV infection in FY 2017. To further expand outreach, RLRVAMC is working on several additional process improvements. One reason for the lower than expected number of patients who did not see a provider after attending the group education class is that these patients were difficult to reach for scheduling. A medical support assistant is now attending these classes; immediately after a class ends and before leaving the facility, this assistant schedules patients for appointments with HCV providers. The team social worker continues to help prepare patients for treatment and targets interventions for patients early in their HCV workup so that resources are allocated before treatment initiation. In the first 2 months of FY 2017, about 10 more patients who were referred to the social worker for assessment and support started treatment.
Outreach letter responses identified almost 600 potential candidates for treatment. Pharmacists telephoned these patients in another effort to connect them with VA services. Interested patients were scheduled for a group education visit. Also, pharmacists reached out to all primary care clinics and community-based outpatient clinics connected with the facility to provide education on VA policies regarding HCV treatment eligibility and to encourage providers to refer all patients with HCV infection to the HCV clinic. This education was provided at primary care team meetings, and providers not in attendance receive individual outreach by pharmacists. Primary care providers also received a pocket card that summarized recommendations for HCV screening and referrals. These efforts and initiatives are expected to increase veterans’ access to care for HCV infection within the catchment area.
Conclusion
Treatment team interventions in FY 2016 significantly increased veterans’ access to RLRVAMC HCV care. The number of patients who started treatment more than doubled since the previous year. Many of these patients had complex social issues or treatment barriers but successfully started therapy with the help of additional support staff.
Click here to read the digital edition.
1. Centers for Disease Control and Prevention. Hepatitis C FAQs for health professionals. https://www.cdc.gov/hepatitis/hcv/hcvfaq.htm. Updated January 27, 2017. Accessed May 9, 2017.
2. U.S. Department of Veterans Affairs. Epidemiology of hepatitis C. http://www.hepatitis.va.gov/provider/reviews/epidemiology.asp. Updated August 26, 2016. Accessed May 9, 2017.
3. U.S. Department of Veterans Affairs, Office of Research and Development. VA research on hepatitis C. http://www.research.va.gov/topics/hep-c.cfm. Updated October 14, 2016. Accessed May 9, 2017.
4. U.S. Department of Veterans Affairs. HIV, hepatitis, and public health pathogens programs annual stakeholders report: 2015. https://www.hepatitis.va.gov/pdf/stakeholders-report-2015.pdf. Published May 2015. Accessed May 10, 2017.
5. Lynch TG, McCarthy MF; US Department of Veterans Affairs. Hepatitis C virus (HCV) funding and prioritization status update [memorandum]. http://www.hepatitis.va.gov/pdf/choice-prioritization-update.pdf. Published February 24, 2016. Accessed May 9, 2017.
6. Fried MW. Side effects of therapy of hepatitis C and their management. Hepatology. 2002;36(5 suppl 1):S237-S244.
7. AASLD/IDSA HCV Guidance Panel. Hepatitis C guidance: AASLD-IDSA recommendations for testing, managing, and treating adults infected with hepatitis C virus. Hepatology. 2015;62(3):932-954.
8. Vallet-Pichard A, Mallet V, Nalpas B, et al. Fib-4: an inexpensive and accurate marker of fibrosis in HCV infection. Comparison with liver biopsy and fibrotest. Hepatology. 2007;46(1):32-36.
9. U.S. Department of Veterans Affairs National Hepatitis C Resource Center Program and National Viral Hepatitis Program the HIV, Hepatitis, and Related Conditions Program in the Office of Specialty Care Services. Chronic hepatitis C virus (HCV) infection: treatment considerations. https://www.hepatitis.va.gov/pdf/treatment-considerations-2017-03-08.pdf. Updated March 8, 2017. Accessed May 9, 2017.
10. Lynch TG; U.S. Department of Veterans Affairs. Evaluation and treatment of veterans with hepatitis C (HCV) and co-occurring substance use or mental health concerns [memorandum]. http://www.hepatitis.va.gov/pdf/memo-HCV-and -mental-health.pdf. Published September 9, 2016. Accessed May 9, 2017.
In the U.S., 2.7 to 3.9 million people are chronically infected with the hepatitis C virus (HCV).1 Survey data suggest that HCV infection is more prevalent in patients enrolled in the VA health care system than it is in civilian health care systems.2 Studies have shown that Vietnam veterans, veterans with mental health and substance abuse disorders, and veterans without stable housing are more likely to be infected with HCV.3 Data from the VA HCV Clinical Case Registry (CCR) for 2015 showed that 174,842 veterans with chronic HCV infection receieved care within the VHA, which makes the VA the single largest HCV care provider in the nation.4
The VA is dedicated to providing treatment to veterans with HCV infection. For fiscal year (FY) 2016, the VA allocated $1 billion to HCV care,and in February 2016 it began offering treatment to all veterans with HCV, regardless of degree of fibrosis or severity of underlying liver disease.3,5 Each VAMC was tasked with improving veterans’ access to HCV treatment.
In an effort to engage patients in HCV care, the multidisciplinary HCV team at the Richard L. Roudebush VAMC (RLRVAMC) in Indianapolis, Indiana, launched a 2-phase improvement process in 2016. The goal in phase 1 was to increase patient access to HCV clinics, and the goal in phase 2 was to recruit patients for direct-acting antiviral (DAA) therapy for HCV. These efforts were designed to increase screening, identification, and linkage to care for HCV and to expand clinic access for the treatment and cure of all identified veterans who pursued treatment.
Patients with HCV infection, referred from primary care clinics, initially were evaluated by HCV clinic providers (hepatologists, infectious disease specialists, gastroenterology fellows, or nurse practitioners) for eligibility to receive DAA therapy for HCV. Eligible patients then were referred to a pharmacist-run HCV clinic, which had been established at RLRVAMC in 2011. At the start of FY 2016, the clinic, staffed by 3 pharmacists, operated 5 half-days per week and accommodated up to 35 weekly patient appointments.
In this clinic, patients received initial education and medication reconciliation for potential drug interactions with DAAs. Once the HCV treatment was initiated, patients were evaluated in the clinic every 2 weeks for medication refills and assessment for tolerability, adherence, and laboratory abnormalities until end of treatment (8-24 weeks, depending on HCV genotype, experiences with prior HCV treatment, and presence/absence of cirrhosis). Twelve weeks after completion of treatment, viral load was obtained to determine sustained virologic response (SVR12).
Methods
Phase 1: Improve Clinic Access
During FY 2016, methods for expanding clinic access to accommodate a large influx of treatment-eligible patients were reviewed and implemented.
In the first intervention, unneeded follow-up visits were eliminated to make room for additional new patient appointments. In general, patients treated with ribavirin require close monitoring, given the risk for anemia.6 With the release of newer DAAs, however, more patients became eligible for treatment with ribavirin-free regimens.7 As a result, follow-up appointments for these patients were extended to 4-week intervals instead of every 2 weeks. A patient with a history of nonadherence to medication use or clinic visits was still maintained on a 2-week schedule of follow-up for close monitoring.
In the second intervention, opportunities for switching those who completed treatment from face-to-face clinic visits to telephone were identified. These patients historically were seen in clinic for a brief interview and for a blood test used to determine end-of-treatment viral load. Improving access for new patients in the clinic involved moving more existing patients from in-clinic visits to telephone. At the end of the treatment plan, existing patients received an order for laboratory tests that included viral load. When all laboratory results were ready, patients were contacted by telephone. Recruiting a registered nurse to the treatment team who assisted with telephone visits further improved clinic efficiency.
The third intervention was inspired by successful results at other VA sites and launched a group treatment clinic for patients who were starting ribavirin-free DAA regimens.7 Group visits were run by 2 pharmacists and accommodated up to 10 veterans. Patients underwent testing for HCV genotype and viral load before the initial group visit. At check-in, patients received a short questionnaire and consent form for group participation. The questionnaire reviewed patient history of drug and alcohol use and potential barriers to medication adherence. Patients also were encouraged to write down any questions they had about the treatment. During the initial group visit, pharmacists provided general education about the medications, potential adverse effects, treatment expectations, and the monitoring plan. Follow-up visits were conducted in a group setting as well.
Phase 2: Increase Recruitment
The records of 534 patients with advanced liver disease (F3-F4 fibrosis on the Fibrosis-4 Index for Liver Fibrosis) and HCV infection were identified in the CCR database for the period August 2015 to December 2015 (Figure 1).8 Patients were excluded if they were deceased, were receiving palliative care (n = 45), or if they had transferred their care to another VA facility (n = 69). Of the 420 patients in the study reviewed, 234 (56%) had not previously been referred to an HCV clinic or been started on treatment because of a variety of social issues, including active substance use (Figure 2).
Many of the patients were difficult to engage because the clinic could not effectively assist them in achieving sobriety and lacked support personnel who could address their complex social issues. Given the availability of all-oral HCV treatments, the VA Public Health Department issued guidance allowing all HCV-infected patients to receive DAA treatment regardless of ongoing drug or alcohol use disorders.9 Substance use was not to be considered a contraindication to therapy. It was suggested that health care providers determine these patients’ treatment eligibility on a case-by-case basis. An official VA memorandum supporting this initiative was released in September 2016.10
Interventions
In an effort to engage all HCV-infected patients, the CCR review was expanded to include patients without advanced liver disease. All patients were contacted by mail. Any patient registered for secure messaging through MyHealtheVet also received a secure message. Patients were informed about the newly approved DAA therapies and were connected directly with specialized HCV clinic schedulers at RLRVAMC. Patients who responded were scheduled for a group education class facilitated by 2 members of the HCV treatment team.
Unlike patients in the group treatment clinic, patients in the education class had not completed the necessary workup for treatment initiation. In the class, patients received education on new HCV treatments and were linked to social work care if needed to streamline the referral process. All baseline laboratory test results also were obtained.
Another intervention implemented to recruit patients in this difficult-to-treat population was the addition of a social worker to the treatment team. Beginning in late June 2016, high-risk patients were referred to the social worker by HCV providers or pharmacists. For each referred patient, the social worker performed a psychosocial assessment to identify potential barriers to successful treatment and then connected the patient with either VA or community resources for support.
The social worker linked patients to mental health or substance use-related services, empowered them to access transportation resources for clinic appointments, orchestrated assistance with medication adherence from a home health nurse, and reached out to patients in person or by telephone to address specific needs that might limit their ability to attend appointments. The social worker also provided harm reduction planning and goal setting support to help patients with substance use disorders achieve sobriety or reduce substance use while on HCV treatment. All efforts were made to ensure that patients adhered to their clinic visits and medication use. In addition, during social work assessment, factors such as housing concerns, travel barriers, and loss and grief were identified and promptly addressed.
Results
After the phase 1 intervention, 730 additional appointments were added in FY 2016 (Figure 3). As a result, 409 patients with HCV infection were started on treatment in FY 2016 compared with 192 in FY 2015. More important, the rapid increase in capacity and treatment initiation did not sacrifice the quality of care provided. Ninety-eight percent of patients who started treatment in FY 2016 successfully completed their treatment course. The overall SVR12 rate was 96% for all genotype 1 patients treated with ledipasvir/sofosbuvir, ombitasvir/paritaprevir/ritonavir plus dasabuvir, or elbasvir/grazoprevir with or without ribavirin. In addition, the SVR12 rate was 82% for genotype 2 patients (almost all cirrhotic) treated with sofosbuvir plus ribavirin and 93% for genotype 3 patients treated with daclatasvir, sofosbuvir, and ribavirin.
Phase 2: Increase Recruitment
The expanded CCR review identified 234 patients with advanced liver disease and 546 patients without advanced disease. As this was a rolling review, 58 patients were linked to care before being contacted. Of the 722 patients in the cohort, 528 were contacted by mail and 194 both by mail and by MyHealtheVet messaging. One hundred forty-one patients responded: 129 by mail and 12 by MyHealtheVet messaging (eFigure 1).
Of the 101 patients scheduled for group education, 43 attended education in FY 2016 (eFigure 2).
In June 2016, a social worker was added to the treatment team in an effort to improve recruitment in this difficult to treat population (Figure 2). Between June 2016 and end of FY 2016, 48 patients were referred to the social worker for evaluation. The primary reasons for referral were ongoing substance/alcohol use or high risk for relapse (n = 22); appointment adherence barriers, including problems with transportation (n = 16); underlying mental health disorders (n = 4); barriers to medication adherence (n = 3); and unstable housing (n = 3). Of these 48 patients, 31 received a single social worker intervention to connect with resources; the other 17 were recommended for intensive case management for ongoing support during preparation for HCV treatment and during therapy. As a result of social work involvement, 31 out of 48 referred patients were successfully started on treatment in FY 2016.
Discussion
The VA continues focusing its efforts and resources on treating HCV infection in FY 2017. To further expand outreach, RLRVAMC is working on several additional process improvements. One reason for the lower than expected number of patients who did not see a provider after attending the group education class is that these patients were difficult to reach for scheduling. A medical support assistant is now attending these classes; immediately after a class ends and before leaving the facility, this assistant schedules patients for appointments with HCV providers. The team social worker continues to help prepare patients for treatment and targets interventions for patients early in their HCV workup so that resources are allocated before treatment initiation. In the first 2 months of FY 2017, about 10 more patients who were referred to the social worker for assessment and support started treatment.
Outreach letter responses identified almost 600 potential candidates for treatment. Pharmacists telephoned these patients in another effort to connect them with VA services. Interested patients were scheduled for a group education visit. Also, pharmacists reached out to all primary care clinics and community-based outpatient clinics connected with the facility to provide education on VA policies regarding HCV treatment eligibility and to encourage providers to refer all patients with HCV infection to the HCV clinic. This education was provided at primary care team meetings, and providers not in attendance receive individual outreach by pharmacists. Primary care providers also received a pocket card that summarized recommendations for HCV screening and referrals. These efforts and initiatives are expected to increase veterans’ access to care for HCV infection within the catchment area.
Conclusion
Treatment team interventions in FY 2016 significantly increased veterans’ access to RLRVAMC HCV care. The number of patients who started treatment more than doubled since the previous year. Many of these patients had complex social issues or treatment barriers but successfully started therapy with the help of additional support staff.
Click here to read the digital edition.
1. Centers for Disease Control and Prevention. Hepatitis C FAQs for health professionals. https://www.cdc.gov/hepatitis/hcv/hcvfaq.htm. Updated January 27, 2017. Accessed May 9, 2017.
2. U.S. Department of Veterans Affairs. Epidemiology of hepatitis C. http://www.hepatitis.va.gov/provider/reviews/epidemiology.asp. Updated August 26, 2016. Accessed May 9, 2017.
3. U.S. Department of Veterans Affairs, Office of Research and Development. VA research on hepatitis C. http://www.research.va.gov/topics/hep-c.cfm. Updated October 14, 2016. Accessed May 9, 2017.
4. U.S. Department of Veterans Affairs. HIV, hepatitis, and public health pathogens programs annual stakeholders report: 2015. https://www.hepatitis.va.gov/pdf/stakeholders-report-2015.pdf. Published May 2015. Accessed May 10, 2017.
5. Lynch TG, McCarthy MF; US Department of Veterans Affairs. Hepatitis C virus (HCV) funding and prioritization status update [memorandum]. http://www.hepatitis.va.gov/pdf/choice-prioritization-update.pdf. Published February 24, 2016. Accessed May 9, 2017.
6. Fried MW. Side effects of therapy of hepatitis C and their management. Hepatology. 2002;36(5 suppl 1):S237-S244.
7. AASLD/IDSA HCV Guidance Panel. Hepatitis C guidance: AASLD-IDSA recommendations for testing, managing, and treating adults infected with hepatitis C virus. Hepatology. 2015;62(3):932-954.
8. Vallet-Pichard A, Mallet V, Nalpas B, et al. Fib-4: an inexpensive and accurate marker of fibrosis in HCV infection. Comparison with liver biopsy and fibrotest. Hepatology. 2007;46(1):32-36.
9. U.S. Department of Veterans Affairs National Hepatitis C Resource Center Program and National Viral Hepatitis Program the HIV, Hepatitis, and Related Conditions Program in the Office of Specialty Care Services. Chronic hepatitis C virus (HCV) infection: treatment considerations. https://www.hepatitis.va.gov/pdf/treatment-considerations-2017-03-08.pdf. Updated March 8, 2017. Accessed May 9, 2017.
10. Lynch TG; U.S. Department of Veterans Affairs. Evaluation and treatment of veterans with hepatitis C (HCV) and co-occurring substance use or mental health concerns [memorandum]. http://www.hepatitis.va.gov/pdf/memo-HCV-and -mental-health.pdf. Published September 9, 2016. Accessed May 9, 2017.
Incidence and Management of Asymptomatic Hypertensive Urgency at a VA Emergency Department
Hypertension affects more than 65 million individuals in the U.S., accounting for nearly 30% of the adult population.1 Less than 50% of those with hypertension are taking appropriate pharmacotherapy.2 Hypertension contributes to cardiovascular events, including cerebrovascular accident, transient ischemic attack, hypertensive retinopathy, renal failure, myocardial infarction, and heart failure.1 Chronic hypertension mainly is an asymptomatic condition, earning the nickname “the silent killer.”2 An acute, symptomatic elevation in blood pressure (BP) often is referred to as hypertensive emergency. Symptoms of end-organ damage can include headache, blurry vision, chest pain, shortness of breath, altered mental status, epistaxis, and oliguria.2 Although rare, hypertensive emergencies should be treated immediately. The Seventh Report of the Joint National Committee (JNC 7), and the more recent JNC 8, have published guidelines on managing chronic hypertension.3,4 However, neither report provides guidance on hypertensive emergency or the appropriate actions in cases of extremely elevated BP in an asymptomatic patient.3,4
Acute hypertensive episodes—often referred to as hypertensive crises—are responsible for nearly 8 million hospitalizations each year and 20 million visits to the emergency department (ED).5,6 Most of these visits are same-day “treat-and-release” events.5 There is no universally accepted BP value associated with a hypertensive crisis, but most resources state that a BP ≥ 180/110 mm Hg requires attention.2,7 Without other symptoms, elevated BP is not an emergency, yet ED referral for acute management is common.7
Three terms fall under the umbrella of hypertensive crises: hypertensive emergency, hypertensive urgency, and asymptomatic hypertension (AH).2 In a 2007 article, the American College of Chest Physicians defined hypertensive emergency as BP ≥ 180/110 mm Hg with evidence of end-organ damage.2 Symptoms are almost always present in true hypertensive emergencies, and immediate medical intervention is required to halt further organ damage. In the same article, hypertensive urgency is defined as BP ≥ 180/110 mm Hg without end-organ damage.2 The definition of hypertensive urgency could be further refined to include the presence of cardiovascular and renal risk factors, although this additional point is not consistent across the literature. Asymptomatic hypertension is similar to hypertensive urgency; however, there is an absence of signs or symptoms of end-organ damage.2 There is ambiguity in the literature concerning managing hypertensive urgency and AH, but both share a basic tenet: Immediate BP reduction is not essential. Gradual dosage adjustment(s) of oral medications, preferably by a primary care provider (PCP), and follow-up within 7 days are recommended.7
Limited evidence exists to guide ED providers in managing AH. Long-term outcomes and guidelines intended for the primary care setting should not be extrapolated to acute management in the ED. With limited treatment guidelines, providers might be more likely to refer patients with AH to the ED for evaluation. In 2013, the American College of Emergency Physicians (ACEP) created a clinical policy concerning AH in the ED. The ACEP concluded that screening for target organ injury and medical intervention in the ED does not reduce rates of adverse events (AEs) and could lead to overtreatment and acute hypoperfusion.7 More recently, Patel and colleagues published findings on hypertensive urgency in the ambulatory care setting, which similarly found that referral to the ED was associated with increased use of health care resources and no change in short-term major AEs.8 The ACEP recommends that patients presenting with AH be referred to primary care clinics where long-term monitoring and medication adjustments can be achieved more cost-effectively.7
The objective of this retrospective evaluation was to assess the incidence and management of AH within a VA ED. The authors aimed to provide insight into how these patients are managed and discuss alternatives to ED use.
Methods
This retrospective observational study was conducted within the North Florida/South Georgia Veterans Health System (NFSGVHS), which provides patient care at 2 medical centers in Gainesville and Lake City, Florida, as well as 11 outpatient clinics located throughout North Florida and South Georgia. The NFSGVHS serves rural and urban veteran populations. Study approval was granted by the NFSGVHS Institutional Review Board and Research and Development Committee.
Inclusion/Exclusion Criteria
Adult patients who were ordered at least 1 antihypertensive medication in the ED from July 1, 2011 to July 1, 2014, in addition to being asymptomatic with BP ≥ 180/110 mm Hg at ED triage were included. Based on clinical experience, the authors estimated that 3 years would provide a sample size of more than 100 patients. Patients were excluded if they presented with any acute symptoms or were hospitalized for further management.
Data Collection
Baseline demographics were collected for all participants. During the ED encounter, pre- and postintervention vital signs were recorded and prespecified laboratory data obtained. Interrater reliability was accounted for by performing random reviews of previously collected data to ensure consistency during the chart review process. Renal end-organ damage was defined using Acute Kidney Injury Network criteria, a serum creatinine 50% above baseline, or an absolute increase in baseline serum creatinine by 0.3 mg/dL.9 Additional laboratory markers of organ damage included cardiac troponin levels. Urinalysis results also were assessed to determine the presence of hematuria or proteinuria. Patient-reported nonadherence with medications was determined by reviewing ED provider and/or nurse documentation notes for the index ED encounter.
Investigators documented the route (IV or oral) and antihypertensive(s) medication selected for each patient. Adverse effects and any changes to patients’ outpatient medication regimens were noted. Investigators also assessed days to next medical contact after ED discharge to determine whether follow-up occurred according to the recommended standard of 7 days.9 Days to next medical contact was defined as any contact—in person or by telephone—that was documented in the electronic health record after the index ED visit.
Statistical Analysis
Descriptive statistics, including mean, median, and standard deviation, were used to analyze data.
Results
A total of 1,052 patients presented with BP ≥ 180/110 mm Hg and for whom antihypertensive medication was ordered but not necessarily given in the ED. Of the total, 724 patients were excluded because of hospital admission for other primary diagnoses; however, 6 of these patients were admitted for hypertensive urgency. The final analysis included 132 patients who presented with the primary condition of elevated BP without any accompanying symptoms. Among these patients, 2 had repeat ED visits for AH during the specified time frame. 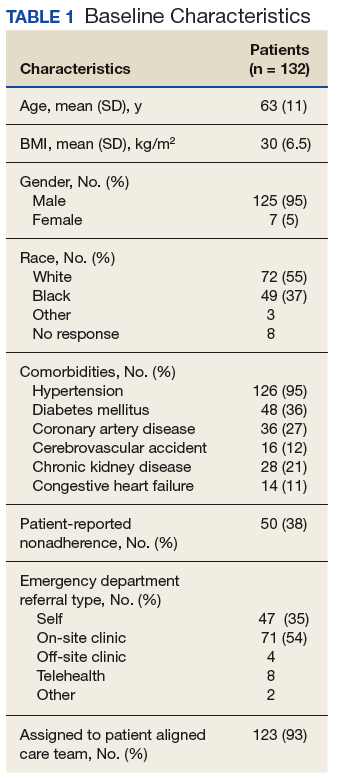
Most patients were male with an average age of 63 years and documented history of hypertension. Nearly all patients had established primary care within the NFSGVHS. The most common comorbidity was diabetes mellitus (36%), followed by coronary artery disease (27%) and chronic kidney disease (CKD) (21%) (Table 1). About one-third of patients presented to the ED on their own volition, and slightly more than half were referred to the ED by primary care or specialty clinics. 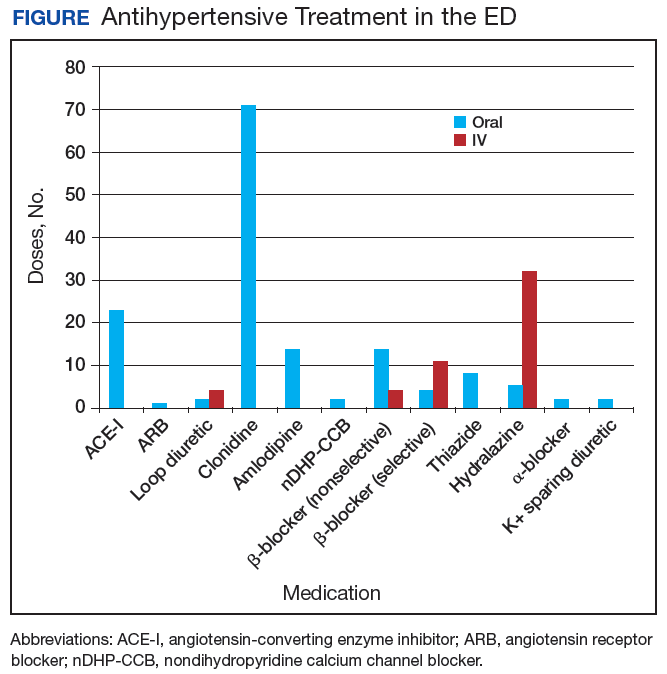
In the ED, 130 patients received BP treatment (Table 2). Medication was ordered for 2 patients who did not receive treatment. In total, 12 different medication classes were used for treating patients with AH in the ED (Figure). 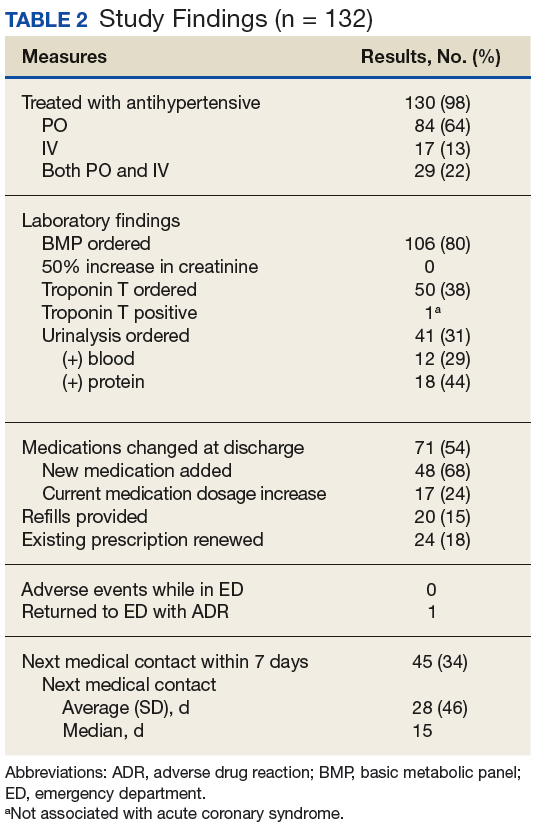
Treatment in the ED resulted in an average BP and heart rate reduction of 27/20 mm Hg and 5 beats per minute, respectively. About 80% of patients had a basic metabolic panel drawn, and there were no instances of acute kidney injury. Of the patients in the study 38% had cardiac enzymes collected, and only 1 patient had a positive result, which was determined to be unrelated to acute coronary syndrome. Forty-one (31%) of patients had a urinalysis; 12 has positive results for hematuria, and 18 revealed proteinuria. Of note, the 6 patients who were hospitalized for hypertensive urgency had neither symptoms at presentation to the ED nor laboratory findings indicating end-organ damage. The reason these patients were admitted is unclear.
At discharge, ED providers made changes to 54% of patients’ outpatient antihypertensive regimens. These changes included adding a new medication (68%), increasing the dosage of an existing medication (24%), or multiple changes (8%). Refills were provided for 18% of prescriptions. Follow-up within 7 days from ED discharge was recorded for 34% of patients. One patient received follow-up outside the NFSGVHS and was not included in this analysis.
Discussion
The aim of this retrospective study was to determine the incidence of AH in a VA ED and describe how these patients were managed. Overall, the rate of patients presenting to the ED with AH during the study period was about 1 patient every 8 days or 45 patients per year. By comparison, more than 30,000 patients are seen at the NFSGVHS ED annually. Although AH seems to be an uncommon occurrence, study findings raise questions about the value of managing the condition in the ED.
This study found several management strategies as well as noteworthy trends. For example, laboratory tests were not ordered routinely for all patients, suggesting that some ED providers question their use for AH. There were no patients with acute elevations in serum creatinine that indicated acute kidney injury, and although hematuria and proteinuria were common findings, neither were specific for acute injury. However, there were findings typical of chronic hypertension, and urinalysis may provide little benefit when testing for acute kidney injury. Only 1 patient showed elevated cardiac enzymes, which was determined to be a result of CKD.
Although not included in the final analysis, the 6 patients who were hospitalized for hypertensive urgency were similar in that they had neither symptoms at presentation to the ED nor laboratory findings indicating end-organ damage. Collectively, these findings support existing literature that questions the utility of laboratory testing of patients with AH in the ED.10
Patients also were treated with a variety of antihypertensive agents in the ED. One explanation might be outpatient nonadherence with medications. In patients with AH, it is common to provide doses of chronic medications that the patient might have missed and should be taking on a regular basis. Therefore, assessing adherence with current medications before modifying chronic therapy is an important initial step when managing AH.
Although oral agents primarily were used, IV antihypertensives were administered to about one-third of patients. Preference for IV administration in the ED might be related to its ability to lower BP quickly. The practice of obtaining IV access for medication in a patient with AH is costly, unnecessary, and potentially harmful.7 The authors theorize that this practice is performed, in many cases, as an attempt to expedite ED discharge after an acceptable BP reading is documented.
Rapid reductions in BP can precipitate hypoperfusion inadvertently and are more likely to occur with IV agents than with oral ones. Therefore, the safety, convenience, and cost savings associated with oral administration make it the preferred route for managing AH. 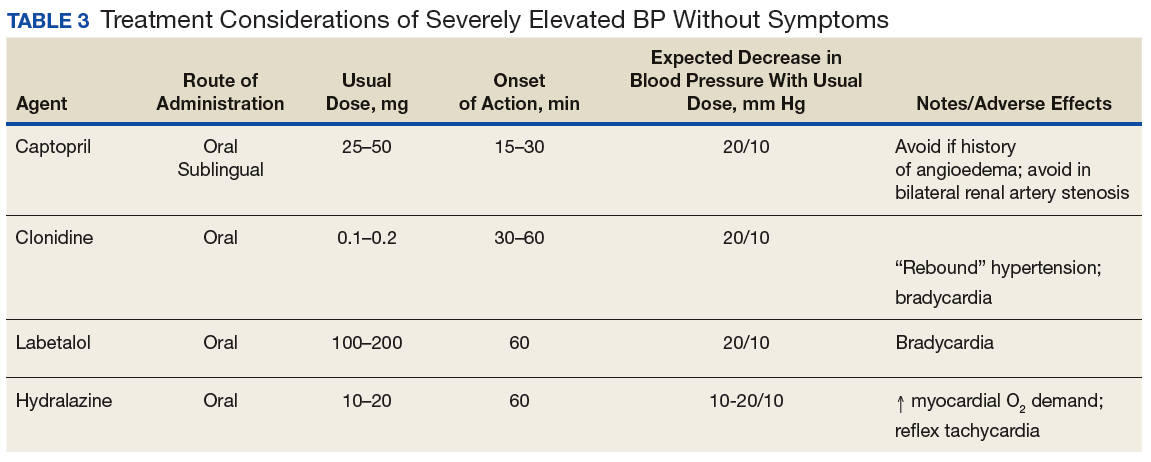
Best Practices
Primary care clinics are best suited to manage AH because medication adjustments and long-term monitoring are easier to perform and at substantially lower costs when compared with that of the ED. Rather than immediately referring a patient to the ED, clinicians should consider factors that could elevate BP, such as medication nonadherence, anxiety, acute pain, recent tobacco or caffeine use, or white coat syndrome. Staff should be well educated on proper BP measurement and instructed to repeat the reading for confirmation. Before measuring BP, allow the patient to sit quietly for 5 minutes with the feet flat on the floor and arm supported.3 Ideally, the measurement used should be the average of 3 BP readings on an automated device.11 If BP readings are high, staff should ask the patient about medication adherence and missed medication(s) should be administered.
It also is reasonable to have the patient rest quietly for up to 30 minutes because rest has been shown to reduce BP in some patients.12 The drawback to the prolonged rest strategy is the potential to cause delays in care for other patients. However, it is important to remember that wait times in the ED often are measured in hours, which causes frustration for patients referred to the ED for AH management. Before completing the office visit, the provider should recheck BP using proper technique and confirm that the patient has antihypertensive medication(s) in his/her possession; a follow-up appointment should be scheduled for no later than 1 week.
Primary care providers might be concerned about taking on additional liability and could favor ED referral, but legislation makes it difficult for EDs to defer nonemergent issues to primary care clinics. The Emergency Medical Treatment and Labor Act states that hospitals are prohibited from denying a patient care during an emergency.13 Despite evidence that AH is not an emergency, many patients continue to be referred to the ED. One-third of patients presented to the ED on their own volition and more than one-half were referred by health care personnel. This strongly suggests that both patients and health care personnel consider AH an emergency medical condition requiring immediate attention. However, patients with AH rarely are found to have any acute end-organ damage; therefore, acute treatment and extensive laboratory or diagnostic testing in the ED provides little, if any, benefit.10 The authors believe the ACEP clinical policy should be adopted into mainstream practice to help reduce health care costs and preserve ED resources for patients with true emergencies.
Another pervasive issue that could contribute to inappropriate AH referrals to the ED is the shortage of PCPs and limited same-day appointments for nonemergent conditions. In a 2017 survey, the average wait time for a PCP appointment ranged between 12 and 109 days, depending on the metropolitan area. The national average wait time conducted by this survey was 29.3 days.14 When primary care appointments are unavailable, triage staff could recommend that patients seek care in the ED. Additionally, patients might choose to seek ED care rather than wait for the next available PCP appointment. Clinic proximity to an ED could influence referral rates. In other words, medical centers or health systems with primary care clinics and ED services under one roof could experience more frequent ED referrals.
A promising strategy to help overcome the challenges of addressing AH and avoiding ED referrals is increasing patient access to and use of qualified, nonphysician providers, such as clinical pharmacists and nurse practitioners. Large health systems such as the VA and Kaiser Permanente have employed clinical pharmacist providers to reduce follow-up times for patients in primary care settings.15 Furthermore, there is substantial evidence that supports the cost-effectiveness and clinical success of pharmacist-driven hypertension clinics.16-18 Nurse-driven efforts to improve hypertension control have been successfully implemented in health systems.19 Both clinical pharmacist and nurse-managed hypertension clinics are effective solutions to manage patients with AH who might otherwise use costly ED services.For example, the average cost of a single ED visit is $740 to $3,437.20 In comparison, a 2010 report from the Agency for Healthcare Research and Quality showed the average annual cost of managing hypertension in ambulatory care clinics was $442 per adult, a cost considerably lower than that of the ED.21
Limitations
The retrospective and observational design of this study are inherent limitations. This study was not designed to evaluate cardiovascular outcomes after ED encounters. The sample size could have been larger if patients with BP < 180/110 mm Hg at ED triage were included; however, the 180/110 mm Hg threshold was chosen because it was the most widely agreed on BP value in the literature. This study did not capture patients who presented with AH and did not receive any acute treatment in the ED.Prescribing patterns based on provider training (eg, emergency medicine, family medicine, or internal medicine) were not tracked and might have accounted for differences in selection of diagnostic tests, laboratory ordering, and route of drug administration preference.
A small subset of patients reported positive pain scores at triage but did not describe acute pain. Pain scores are highly subjective, and few primary literature sources link chronic pain with increased BP.22,23 Nevertheless, patients who reported acute pain and elevated BP were excluded in order to identify truly asymptomatic patients. VA hospitals are unique health systems and data obtained from this study might not be applicable to other public or private facilities. Last, the study did not take into account patients’ psychosocial circumstances that might have fostered a disproportionate reliance on the ED for health care.
Conclusion
Asymptomatic patients with elevated BP are treated in the ED despite no evidence supporting improved outcomes after acute BP lowering in this population. Follow-up after ED encounters for AH did not occur consistently within guideline-recommended 7 days, a trend that also occurs in non-VA systems.8 Clinics and health care systems could establish policies to prevent or minimize management of AH in the ED. Ideally, AH should be managed in a clinic setting by a PCP, but growing clinician workload might lead to increasing wait times and difficultly obtaining same-day appointments. Nurse-led clinics and clinical pharmacists operating under a scope of practice and working closely with a PCP are a cost-effective solution to ensure timely treatment and appropriate follow-up of patients with uncontrolled hypertension.
Acknowledgments
This material is the result of work supported with resources and the use of facilities at the North Florida South Georgia Veterans Health System in Gainesville, Florida.
1. Nwankwo T, Yoon SS, Burt V, Gu Q. Hypertension among adults in the United States: National Health and Nutrition Examination Survey, 2011-2012. NCHS Data Brief. 2013;(133):
1-8.
2. Marik PE, Varon J. Hypertensive crises: challenges and management. Chest. 2007;131(6):1949-1962.
3. Chobanian AV, Bakris GL, Black HR, et al; Joint National Committee on Prevention, Detection, Evaluation, and Treatment of High Blood Pressure. National Heart, Lung, and Blood Institute; National High Blood Pressure Education Program Coordinating Committee. Seventh report of the joint national committee on prevention, detection, evaluation, and treatment of high blood pressure. Hypertension. 2003;42(6):1206-1252.
4. James, PA, Oparil, S, Carter, BL, et al. 2014 Evidence-based guideline for the management of high blood pressure in adults report from the panel members appointed to the Eighth Joint National Committee (JNC 8). JAMA. 2014;311(5):507-520.
5. American Heart Association. High blood pressure ER visits jumped 25 percent in 2006-11. http://newsroom.heart.org/news/high-blood-pressure-er-visits-jumped-25-percent-in-2006-11. Published September 9, 2014. Accessed January 19, 2018.
6. Owens P, Mutter R. Statistical brief #100: emergency department visits for adults in community hospitals. Agency for Healthcare Research and Quality. http://www.hcup-us.ahrq.gov/reports/statbriefs/sb100.pdf. Published November 2010. Accessed January 19, 2018.
7. Wolf SJ, Lo B, Shih RD, Smith MD, Fesmire FM; American College of Emergency Physicians Clinical Policies Committee. Clinical policy: critical issues in the evaluation and management of adult patients in the emergency department with asymptomatic elevated blood pressure. Ann Emerg Med. 2013;62(1):59-68.
8. Patel KK, Young L, Howell EH, et al. Characteristics and outcomes of patients presenting with hypertensive urgency in the office setting. JAMA Intern Med. 2016;176(7):981-988.
9. Acute Kidney Injury Network. AKIN studies. http://www.akinet.org/akinstudies.php. Updated 2017. Accessed January 19, 2018.
10. Karras DJ, Kruus LK, Cienki JJ, et al. Utility of routine testing for patients with asymptomatic severe blood pressure elevation in the emergency department. Ann Emerg Med. 2008;51(3):231-239.
11. The SPRINT Research Group. A Randomized trial of Intensive versus standard blood pressure control. N Engl J Med. 2015;373:2103-2116.
12. Grassi D, O’Flaherty M, Pellizzari M, et al; Group of Investigators of the REHASE Program. Hypertensive urgencies in the emergency department: evaluating blood pressure response to rest and to antihypertensive drugs with different profiles. J Clin Hypertens (Greenwich). 2008;10(9):662-667.
13. Canters for Medicare & Medicaid Services. Emergency medical treatment & labor act (EMTALA). https://www.cms.gov/Regulations-and-Guidance/Legislation/EMTALA/index.html. Updated March 26, 2012. Accessed January 19, 2018.
14. Merritt Hawkins. 2017 Survey of physician appointment wait times and Medicare and Medicaid acceptance rates. https://www.merritthawkins.com/uploadedFiles/Merritt-Hawkins/Pdf/mha2017waittimesurveyPDF.pdf. Published 2017. Accessed January 19, 2018.
15. Galewitz P. VA treats patients’ impatience with clinical pharmacists. USA Today. http://www.usatoday.com/story/news/2016/10/24/kaiser-va-treats-patients-impatience-clinical-pharmacists/92479132/. Published October 24, 2016. Accessed January 19, 2018.
16. Carter BL, Ardery G, Dawson JD, et al. Physician and pharmacist collaboration to improve blood pressure control. Arch Intern Med. 2009;169(21):1996-2002.
17. Borenstein JE, Graber G, Saltiel E, et al. Physician-pharmacist comanagement of hypertension: a randomized comparative trial. Pharmacotherapy. 2003;23(2):209-216.
18. Okamoto MP, Nakahiro RK. Pharmacoeconomic evaluation of a pharmacist-managed hypertension clinic. Pharmacotherapy. 2001;21(11):1337-1344.
19. Brown VM. Managing patients with hypertension in nurse-led clinics. Nursing. 2017;47(4):16-19.
20. Caldwell N, Srebotnjak T, Wang T, Hsia R. “How Much Will I Get Charged for This?” Patient charges for top ten diagnoses in the emergency department. PLoS ONE. 2013;8(2): e55491.
21. Davis KE. Expenditures for hypertension among adults age 18 and older, 2010: estimates for the U.S. civilian noninstitutionalized population. Agency for Healthcare Research and Quality. https://meps.ahrq.gov/data_files/publications/st404/stat404.shtml. Published April 2013. Accessed January 19, 2018.
22. Marco CA, Plewa MC, Buderer N, et al. Self-reported pain scores in the emergency department: lack of association with vital signs. Acad Emerg Med. 2006;13(9):974-979.
23. Wood D, Goodnight S, Haig AJ, Nasari T. Body mass index, but not blood pressure is related to the level of pain in persons with chronic pain. J Back Musculoskelet Rehabil. 2011;24(2):
111-115.
Hypertension affects more than 65 million individuals in the U.S., accounting for nearly 30% of the adult population.1 Less than 50% of those with hypertension are taking appropriate pharmacotherapy.2 Hypertension contributes to cardiovascular events, including cerebrovascular accident, transient ischemic attack, hypertensive retinopathy, renal failure, myocardial infarction, and heart failure.1 Chronic hypertension mainly is an asymptomatic condition, earning the nickname “the silent killer.”2 An acute, symptomatic elevation in blood pressure (BP) often is referred to as hypertensive emergency. Symptoms of end-organ damage can include headache, blurry vision, chest pain, shortness of breath, altered mental status, epistaxis, and oliguria.2 Although rare, hypertensive emergencies should be treated immediately. The Seventh Report of the Joint National Committee (JNC 7), and the more recent JNC 8, have published guidelines on managing chronic hypertension.3,4 However, neither report provides guidance on hypertensive emergency or the appropriate actions in cases of extremely elevated BP in an asymptomatic patient.3,4
Acute hypertensive episodes—often referred to as hypertensive crises—are responsible for nearly 8 million hospitalizations each year and 20 million visits to the emergency department (ED).5,6 Most of these visits are same-day “treat-and-release” events.5 There is no universally accepted BP value associated with a hypertensive crisis, but most resources state that a BP ≥ 180/110 mm Hg requires attention.2,7 Without other symptoms, elevated BP is not an emergency, yet ED referral for acute management is common.7
Three terms fall under the umbrella of hypertensive crises: hypertensive emergency, hypertensive urgency, and asymptomatic hypertension (AH).2 In a 2007 article, the American College of Chest Physicians defined hypertensive emergency as BP ≥ 180/110 mm Hg with evidence of end-organ damage.2 Symptoms are almost always present in true hypertensive emergencies, and immediate medical intervention is required to halt further organ damage. In the same article, hypertensive urgency is defined as BP ≥ 180/110 mm Hg without end-organ damage.2 The definition of hypertensive urgency could be further refined to include the presence of cardiovascular and renal risk factors, although this additional point is not consistent across the literature. Asymptomatic hypertension is similar to hypertensive urgency; however, there is an absence of signs or symptoms of end-organ damage.2 There is ambiguity in the literature concerning managing hypertensive urgency and AH, but both share a basic tenet: Immediate BP reduction is not essential. Gradual dosage adjustment(s) of oral medications, preferably by a primary care provider (PCP), and follow-up within 7 days are recommended.7
Limited evidence exists to guide ED providers in managing AH. Long-term outcomes and guidelines intended for the primary care setting should not be extrapolated to acute management in the ED. With limited treatment guidelines, providers might be more likely to refer patients with AH to the ED for evaluation. In 2013, the American College of Emergency Physicians (ACEP) created a clinical policy concerning AH in the ED. The ACEP concluded that screening for target organ injury and medical intervention in the ED does not reduce rates of adverse events (AEs) and could lead to overtreatment and acute hypoperfusion.7 More recently, Patel and colleagues published findings on hypertensive urgency in the ambulatory care setting, which similarly found that referral to the ED was associated with increased use of health care resources and no change in short-term major AEs.8 The ACEP recommends that patients presenting with AH be referred to primary care clinics where long-term monitoring and medication adjustments can be achieved more cost-effectively.7
The objective of this retrospective evaluation was to assess the incidence and management of AH within a VA ED. The authors aimed to provide insight into how these patients are managed and discuss alternatives to ED use.
Methods
This retrospective observational study was conducted within the North Florida/South Georgia Veterans Health System (NFSGVHS), which provides patient care at 2 medical centers in Gainesville and Lake City, Florida, as well as 11 outpatient clinics located throughout North Florida and South Georgia. The NFSGVHS serves rural and urban veteran populations. Study approval was granted by the NFSGVHS Institutional Review Board and Research and Development Committee.
Inclusion/Exclusion Criteria
Adult patients who were ordered at least 1 antihypertensive medication in the ED from July 1, 2011 to July 1, 2014, in addition to being asymptomatic with BP ≥ 180/110 mm Hg at ED triage were included. Based on clinical experience, the authors estimated that 3 years would provide a sample size of more than 100 patients. Patients were excluded if they presented with any acute symptoms or were hospitalized for further management.
Data Collection
Baseline demographics were collected for all participants. During the ED encounter, pre- and postintervention vital signs were recorded and prespecified laboratory data obtained. Interrater reliability was accounted for by performing random reviews of previously collected data to ensure consistency during the chart review process. Renal end-organ damage was defined using Acute Kidney Injury Network criteria, a serum creatinine 50% above baseline, or an absolute increase in baseline serum creatinine by 0.3 mg/dL.9 Additional laboratory markers of organ damage included cardiac troponin levels. Urinalysis results also were assessed to determine the presence of hematuria or proteinuria. Patient-reported nonadherence with medications was determined by reviewing ED provider and/or nurse documentation notes for the index ED encounter.
Investigators documented the route (IV or oral) and antihypertensive(s) medication selected for each patient. Adverse effects and any changes to patients’ outpatient medication regimens were noted. Investigators also assessed days to next medical contact after ED discharge to determine whether follow-up occurred according to the recommended standard of 7 days.9 Days to next medical contact was defined as any contact—in person or by telephone—that was documented in the electronic health record after the index ED visit.
Statistical Analysis
Descriptive statistics, including mean, median, and standard deviation, were used to analyze data.
Results
A total of 1,052 patients presented with BP ≥ 180/110 mm Hg and for whom antihypertensive medication was ordered but not necessarily given in the ED. Of the total, 724 patients were excluded because of hospital admission for other primary diagnoses; however, 6 of these patients were admitted for hypertensive urgency. The final analysis included 132 patients who presented with the primary condition of elevated BP without any accompanying symptoms. Among these patients, 2 had repeat ED visits for AH during the specified time frame.
Most patients were male with an average age of 63 years and documented history of hypertension. Nearly all patients had established primary care within the NFSGVHS. The most common comorbidity was diabetes mellitus (36%), followed by coronary artery disease (27%) and chronic kidney disease (CKD) (21%) (Table 1). About one-third of patients presented to the ED on their own volition, and slightly more than half were referred to the ED by primary care or specialty clinics.
In the ED, 130 patients received BP treatment (Table 2). Medication was ordered for 2 patients who did not receive treatment. In total, 12 different medication classes were used for treating patients with AH in the ED (Figure).
Treatment in the ED resulted in an average BP and heart rate reduction of 27/20 mm Hg and 5 beats per minute, respectively. About 80% of patients had a basic metabolic panel drawn, and there were no instances of acute kidney injury. Of the patients in the study 38% had cardiac enzymes collected, and only 1 patient had a positive result, which was determined to be unrelated to acute coronary syndrome. Forty-one (31%) of patients had a urinalysis; 12 has positive results for hematuria, and 18 revealed proteinuria. Of note, the 6 patients who were hospitalized for hypertensive urgency had neither symptoms at presentation to the ED nor laboratory findings indicating end-organ damage. The reason these patients were admitted is unclear.
At discharge, ED providers made changes to 54% of patients’ outpatient antihypertensive regimens. These changes included adding a new medication (68%), increasing the dosage of an existing medication (24%), or multiple changes (8%). Refills were provided for 18% of prescriptions. Follow-up within 7 days from ED discharge was recorded for 34% of patients. One patient received follow-up outside the NFSGVHS and was not included in this analysis.
Discussion
The aim of this retrospective study was to determine the incidence of AH in a VA ED and describe how these patients were managed. Overall, the rate of patients presenting to the ED with AH during the study period was about 1 patient every 8 days or 45 patients per year. By comparison, more than 30,000 patients are seen at the NFSGVHS ED annually. Although AH seems to be an uncommon occurrence, study findings raise questions about the value of managing the condition in the ED.
This study found several management strategies as well as noteworthy trends. For example, laboratory tests were not ordered routinely for all patients, suggesting that some ED providers question their use for AH. There were no patients with acute elevations in serum creatinine that indicated acute kidney injury, and although hematuria and proteinuria were common findings, neither were specific for acute injury. However, there were findings typical of chronic hypertension, and urinalysis may provide little benefit when testing for acute kidney injury. Only 1 patient showed elevated cardiac enzymes, which was determined to be a result of CKD.
Although not included in the final analysis, the 6 patients who were hospitalized for hypertensive urgency were similar in that they had neither symptoms at presentation to the ED nor laboratory findings indicating end-organ damage. Collectively, these findings support existing literature that questions the utility of laboratory testing of patients with AH in the ED.10
Patients also were treated with a variety of antihypertensive agents in the ED. One explanation might be outpatient nonadherence with medications. In patients with AH, it is common to provide doses of chronic medications that the patient might have missed and should be taking on a regular basis. Therefore, assessing adherence with current medications before modifying chronic therapy is an important initial step when managing AH.
Although oral agents primarily were used, IV antihypertensives were administered to about one-third of patients. Preference for IV administration in the ED might be related to its ability to lower BP quickly. The practice of obtaining IV access for medication in a patient with AH is costly, unnecessary, and potentially harmful.7 The authors theorize that this practice is performed, in many cases, as an attempt to expedite ED discharge after an acceptable BP reading is documented.
Rapid reductions in BP can precipitate hypoperfusion inadvertently and are more likely to occur with IV agents than with oral ones. Therefore, the safety, convenience, and cost savings associated with oral administration make it the preferred route for managing AH.
Best Practices
Primary care clinics are best suited to manage AH because medication adjustments and long-term monitoring are easier to perform and at substantially lower costs when compared with that of the ED. Rather than immediately referring a patient to the ED, clinicians should consider factors that could elevate BP, such as medication nonadherence, anxiety, acute pain, recent tobacco or caffeine use, or white coat syndrome. Staff should be well educated on proper BP measurement and instructed to repeat the reading for confirmation. Before measuring BP, allow the patient to sit quietly for 5 minutes with the feet flat on the floor and arm supported.3 Ideally, the measurement used should be the average of 3 BP readings on an automated device.11 If BP readings are high, staff should ask the patient about medication adherence and missed medication(s) should be administered.
It also is reasonable to have the patient rest quietly for up to 30 minutes because rest has been shown to reduce BP in some patients.12 The drawback to the prolonged rest strategy is the potential to cause delays in care for other patients. However, it is important to remember that wait times in the ED often are measured in hours, which causes frustration for patients referred to the ED for AH management. Before completing the office visit, the provider should recheck BP using proper technique and confirm that the patient has antihypertensive medication(s) in his/her possession; a follow-up appointment should be scheduled for no later than 1 week.
Primary care providers might be concerned about taking on additional liability and could favor ED referral, but legislation makes it difficult for EDs to defer nonemergent issues to primary care clinics. The Emergency Medical Treatment and Labor Act states that hospitals are prohibited from denying a patient care during an emergency.13 Despite evidence that AH is not an emergency, many patients continue to be referred to the ED. One-third of patients presented to the ED on their own volition and more than one-half were referred by health care personnel. This strongly suggests that both patients and health care personnel consider AH an emergency medical condition requiring immediate attention. However, patients with AH rarely are found to have any acute end-organ damage; therefore, acute treatment and extensive laboratory or diagnostic testing in the ED provides little, if any, benefit.10 The authors believe the ACEP clinical policy should be adopted into mainstream practice to help reduce health care costs and preserve ED resources for patients with true emergencies.
Another pervasive issue that could contribute to inappropriate AH referrals to the ED is the shortage of PCPs and limited same-day appointments for nonemergent conditions. In a 2017 survey, the average wait time for a PCP appointment ranged between 12 and 109 days, depending on the metropolitan area. The national average wait time conducted by this survey was 29.3 days.14 When primary care appointments are unavailable, triage staff could recommend that patients seek care in the ED. Additionally, patients might choose to seek ED care rather than wait for the next available PCP appointment. Clinic proximity to an ED could influence referral rates. In other words, medical centers or health systems with primary care clinics and ED services under one roof could experience more frequent ED referrals.
A promising strategy to help overcome the challenges of addressing AH and avoiding ED referrals is increasing patient access to and use of qualified, nonphysician providers, such as clinical pharmacists and nurse practitioners. Large health systems such as the VA and Kaiser Permanente have employed clinical pharmacist providers to reduce follow-up times for patients in primary care settings.15 Furthermore, there is substantial evidence that supports the cost-effectiveness and clinical success of pharmacist-driven hypertension clinics.16-18 Nurse-driven efforts to improve hypertension control have been successfully implemented in health systems.19 Both clinical pharmacist and nurse-managed hypertension clinics are effective solutions to manage patients with AH who might otherwise use costly ED services.For example, the average cost of a single ED visit is $740 to $3,437.20 In comparison, a 2010 report from the Agency for Healthcare Research and Quality showed the average annual cost of managing hypertension in ambulatory care clinics was $442 per adult, a cost considerably lower than that of the ED.21
Limitations
The retrospective and observational design of this study are inherent limitations. This study was not designed to evaluate cardiovascular outcomes after ED encounters. The sample size could have been larger if patients with BP < 180/110 mm Hg at ED triage were included; however, the 180/110 mm Hg threshold was chosen because it was the most widely agreed on BP value in the literature. This study did not capture patients who presented with AH and did not receive any acute treatment in the ED.Prescribing patterns based on provider training (eg, emergency medicine, family medicine, or internal medicine) were not tracked and might have accounted for differences in selection of diagnostic tests, laboratory ordering, and route of drug administration preference.
A small subset of patients reported positive pain scores at triage but did not describe acute pain. Pain scores are highly subjective, and few primary literature sources link chronic pain with increased BP.22,23 Nevertheless, patients who reported acute pain and elevated BP were excluded in order to identify truly asymptomatic patients. VA hospitals are unique health systems and data obtained from this study might not be applicable to other public or private facilities. Last, the study did not take into account patients’ psychosocial circumstances that might have fostered a disproportionate reliance on the ED for health care.
Conclusion
Asymptomatic patients with elevated BP are treated in the ED despite no evidence supporting improved outcomes after acute BP lowering in this population. Follow-up after ED encounters for AH did not occur consistently within guideline-recommended 7 days, a trend that also occurs in non-VA systems.8 Clinics and health care systems could establish policies to prevent or minimize management of AH in the ED. Ideally, AH should be managed in a clinic setting by a PCP, but growing clinician workload might lead to increasing wait times and difficultly obtaining same-day appointments. Nurse-led clinics and clinical pharmacists operating under a scope of practice and working closely with a PCP are a cost-effective solution to ensure timely treatment and appropriate follow-up of patients with uncontrolled hypertension.
Acknowledgments
This material is the result of work supported with resources and the use of facilities at the North Florida South Georgia Veterans Health System in Gainesville, Florida.
1. Nwankwo T, Yoon SS, Burt V, Gu Q. Hypertension among adults in the United States: National Health and Nutrition Examination Survey, 2011-2012. NCHS Data Brief. 2013;(133):
1-8.
2. Marik PE, Varon J. Hypertensive crises: challenges and management. Chest. 2007;131(6):1949-1962.
3. Chobanian AV, Bakris GL, Black HR, et al; Joint National Committee on Prevention, Detection, Evaluation, and Treatment of High Blood Pressure. National Heart, Lung, and Blood Institute; National High Blood Pressure Education Program Coordinating Committee. Seventh report of the joint national committee on prevention, detection, evaluation, and treatment of high blood pressure. Hypertension. 2003;42(6):1206-1252.
4. James, PA, Oparil, S, Carter, BL, et al. 2014 Evidence-based guideline for the management of high blood pressure in adults report from the panel members appointed to the Eighth Joint National Committee (JNC 8). JAMA. 2014;311(5):507-520.
5. American Heart Association. High blood pressure ER visits jumped 25 percent in 2006-11. http://newsroom.heart.org/news/high-blood-pressure-er-visits-jumped-25-percent-in-2006-11. Published September 9, 2014. Accessed January 19, 2018.
6. Owens P, Mutter R. Statistical brief #100: emergency department visits for adults in community hospitals. Agency for Healthcare Research and Quality. http://www.hcup-us.ahrq.gov/reports/statbriefs/sb100.pdf. Published November 2010. Accessed January 19, 2018.
7. Wolf SJ, Lo B, Shih RD, Smith MD, Fesmire FM; American College of Emergency Physicians Clinical Policies Committee. Clinical policy: critical issues in the evaluation and management of adult patients in the emergency department with asymptomatic elevated blood pressure. Ann Emerg Med. 2013;62(1):59-68.
8. Patel KK, Young L, Howell EH, et al. Characteristics and outcomes of patients presenting with hypertensive urgency in the office setting. JAMA Intern Med. 2016;176(7):981-988.
9. Acute Kidney Injury Network. AKIN studies. http://www.akinet.org/akinstudies.php. Updated 2017. Accessed January 19, 2018.
10. Karras DJ, Kruus LK, Cienki JJ, et al. Utility of routine testing for patients with asymptomatic severe blood pressure elevation in the emergency department. Ann Emerg Med. 2008;51(3):231-239.
11. The SPRINT Research Group. A Randomized trial of Intensive versus standard blood pressure control. N Engl J Med. 2015;373:2103-2116.
12. Grassi D, O’Flaherty M, Pellizzari M, et al; Group of Investigators of the REHASE Program. Hypertensive urgencies in the emergency department: evaluating blood pressure response to rest and to antihypertensive drugs with different profiles. J Clin Hypertens (Greenwich). 2008;10(9):662-667.
13. Canters for Medicare & Medicaid Services. Emergency medical treatment & labor act (EMTALA). https://www.cms.gov/Regulations-and-Guidance/Legislation/EMTALA/index.html. Updated March 26, 2012. Accessed January 19, 2018.
14. Merritt Hawkins. 2017 Survey of physician appointment wait times and Medicare and Medicaid acceptance rates. https://www.merritthawkins.com/uploadedFiles/Merritt-Hawkins/Pdf/mha2017waittimesurveyPDF.pdf. Published 2017. Accessed January 19, 2018.
15. Galewitz P. VA treats patients’ impatience with clinical pharmacists. USA Today. http://www.usatoday.com/story/news/2016/10/24/kaiser-va-treats-patients-impatience-clinical-pharmacists/92479132/. Published October 24, 2016. Accessed January 19, 2018.
16. Carter BL, Ardery G, Dawson JD, et al. Physician and pharmacist collaboration to improve blood pressure control. Arch Intern Med. 2009;169(21):1996-2002.
17. Borenstein JE, Graber G, Saltiel E, et al. Physician-pharmacist comanagement of hypertension: a randomized comparative trial. Pharmacotherapy. 2003;23(2):209-216.
18. Okamoto MP, Nakahiro RK. Pharmacoeconomic evaluation of a pharmacist-managed hypertension clinic. Pharmacotherapy. 2001;21(11):1337-1344.
19. Brown VM. Managing patients with hypertension in nurse-led clinics. Nursing. 2017;47(4):16-19.
20. Caldwell N, Srebotnjak T, Wang T, Hsia R. “How Much Will I Get Charged for This?” Patient charges for top ten diagnoses in the emergency department. PLoS ONE. 2013;8(2): e55491.
21. Davis KE. Expenditures for hypertension among adults age 18 and older, 2010: estimates for the U.S. civilian noninstitutionalized population. Agency for Healthcare Research and Quality. https://meps.ahrq.gov/data_files/publications/st404/stat404.shtml. Published April 2013. Accessed January 19, 2018.
22. Marco CA, Plewa MC, Buderer N, et al. Self-reported pain scores in the emergency department: lack of association with vital signs. Acad Emerg Med. 2006;13(9):974-979.
23. Wood D, Goodnight S, Haig AJ, Nasari T. Body mass index, but not blood pressure is related to the level of pain in persons with chronic pain. J Back Musculoskelet Rehabil. 2011;24(2):
111-115.
Hospitalization Risk With Benzodiazepine and Opioid Use in Veterans With Posttraumatic Stress Disorder (FULL)
Posttraumatic stress disorder (PTSD) is a mental health condition that may develop in response to a traumatic event, such as that experienced by a soldier during active combat duty. In 2009, more than 495,000 veterans within the VA health care system were treated for PTSD—nearly triple the number a decade earlier.1 Core symptoms of PTSD include alterations in arousal and reactivity, avoidant behaviors, negative alterations in mood and cognition, and intrusive thoughts and nightmares. All of the symptoms can be debilitating. First-line pharmacotherapy options that target these core symptoms include selective serotonin reuptake inhibitors (SSRIs) and serotonin norepinephrine reuptake inhibitors (SNRIs).2
The anxiolytic and sedative effects of benzodiazepines may provide quick relief from many of the secondary symptoms of PTSD, including sleep disturbances, irritability, and panic attacks. However, benzodiazepines potentially interfere with the extinction of conditioned fear—a goal integral to certain types of psychotherapy, such as exposure therapy.3,4 In addition, the systematic review and meta-analysis by Guina and colleagues revealed that benzodiazepines are ineffective in the treatment of PTSD.5 The majority of the evaluated studies that used PTSD-specific measures (eg, Clinician-Administered PTSD Scale [CAPS]) found increased PTSD severity and worse prognosis with use of these medications.5 In 2010, the VA and the DoD released a joint guideline for PTSD management.2 According to the guideline, benzodiazepines cause harm when used in PTSD and are relatively contraindicated in combat veterans because of the higher incidence of comorbid substance use disorders (SUDs) in these veterans relative to the general population.2,6
Opioid use also has been linked to poor functional and clinical outcomes in veterans with PTSD. Among patients being treated for opioid use disorder, those with PTSD were less likely to endorse employment as a main source of income and had a higher incidence of recent attempted suicide.7 In a large retrospective cohort study, Operation Iraqi Freedom and Operation Enduring Freedom veterans with PTSD who were prescribed opioids were more likely to present to the emergency department (ED) and to be hospitalized for overdoses and injuries.8
Despite the risks of benzodiazepine and opioid use in this patient population, these medications are still often prescribed to veterans with PTSD for symptomatic relief. In fiscal year 2009, across the VHA system 37% of veterans diagnosed with PTSD were prescribed a benzodiazepine, 69% of the time by a mental health provider.9 Among Iraq and Afghanistan veterans, those with PTSD were significantly more likely to be prescribed an opioid for diagnosed pain—relative to those with a mental health disorder other than PTSD and those without a mental health disorder.8 Thus, there seems to be a disconnect between guideline recommendations and current practice.
The authors conducted a study to assess the potential risk of hospitalization for veterans with PTSD prescribed first-line pharmacotherapy and those also prescribed concurrent benzodiazepine and/or opioid therapy since the release of the PTSD guideline in 2010.2
Methods
In this retrospective cohort study, conducted at the Southern Arizona VA Health Care System (SAVAHCS), the authors analyzed electronic medical record data from November 1, 2009 to August 1, 2015. Study inclusion criteria were veteran, aged 18 to 89 years, diagnosis of PTSD (International Classification of Diseases, Ninth Revision, Clinical Modification code 309.81), and SSRI or SNRI newly prescribed between November 1, 2010 and August 1, 2013.
Any veteran prescribed at least one 30-day or longer supply of any benzodiazepine or opioid within 1 year before the SSRI/SNRI initial prescription date was excluded from the study. Also excluded was any patient treated for PTSD at a facility outside SAVAHCS or whose 2-year evaluation period extended past August 1, 2015.
Study Groups
An outpatient prescription was determined to be the initial SSRI/SNRI prescription for a patient who received less than a 30-day cumulative supply of any SSRI or SNRI within 1 year before that prescription date. Citalopram, desvenlafaxine, duloxetine, escitalopram, fluoxetine, fluvoxamine, levomilnacipran, milnacipran, paroxetine, sertraline, venlafaxine, vilazodone, and vortioxetine were the prespecified SSRI/SNRIs included in the study.
Patients who received at least 1 outpatient prescription for any benzodiazepine (minimum 30-day supply) within 1 year after the initial SSRI/SNRI prescription date were determined to be on concurrent SSRI/SNRI and benzodiazepine therapy. Alprazolam, chlordiazepoxide, clonazepam, clorazepate, diazepam, estazolam, flurazepam, lorazepam, oxazepam, temazepam, and triazolam were the prespecified benzodiazepines included in the study.
Patients who received at least 1 outpatient prescription for any opioid (minimum 30-day supply) within 1 year after the initial SSRI/SNRI prescription date were determined to be on concurrent SSRI/SNRI and opioid therapy. Codeine, fentanyl, hydrocodone, hydromorphone, levorphanol, meperidine, methadone, morphine, oxymorphone, pentazocine, propoxyphene, and tramadol were the prespecified opioids included in this study.
Patients who received at least 1 outpatient prescription for any benzodiazepine and any opioid (minimum 30-day supply) within 1 year after the initial SSRI/SNRI prescription date were determined to be on concurrent SSRI/SNRI, benzodiazepine, and opioid therapy.
The index date was defined as the first date of prescription overlap. If there was no benzodiazepine or opioid prescription within 1 year after the initial SSRI/SNRI prescription date, the patient was categorized as being on SSRI/SNRI monotherapy, and the index date was the date of the initial SSRI/SNRI prescription. For each patient, hospitalization data from the 2-year period after the index date were evaluated.
Outcomes and Data Collection
For evaluation of the primary outcome (2-year overall hospitalization risk), the number of unique mental health and medical/surgical hospitalizations was identified by the number of discharge summaries documented in the patient chart during the evaluation period. Time to first hospitalization was recorded for the survival data analysis. Secondary outcomes were mental health hospitalization risk, medical/surgical hospitalization risk, and all-cause mortality within 2 years.
Demographic data that were collected included age, sex, comorbid mental health disorders, comorbid SUDs, and concomitant use of psychotropic medications at index date (baseline). Select comorbid mental health disorders (anxiety, schizophrenia, depression, bipolar disorder) and substance use disorders (alcohol, opioid, illicit drug) also were identified. Data on insomnia and pain comorbidities (headaches or migraines; neuropathy; head, neck, back, arthritis, or joint pain) were collected, as these comorbidities could be indications for prescribing benzodiazepines and opioids. Concomitant baseline use of classes of psychotropic medications (antipsychotics, non-SSRI/SNRI antidepressants, mood stabilizers, anxiolytics, nonbenzodiazepine sedatives/hypnotics) also were documented. Last, hospitalizations within 6 months before the initial SSRI/SNRI prescription date were noted.
Statistical Analysis
Descriptive statistics were used to analyze all baseline demographic data. Continuous measures were evaluated with 1-way analyses of variance and post hoc Bonferroni-corrected pairwise comparisons, and categorical measures with contingency tables and χ2 tests or Fisher exact tests. When the overall χ2 test was significant across all 4 study groups, post hoc comparisons were performed between the SSRI/SNRI monotherapy group and each other group with Bonferroni adjusted for 3 comparisons.
Unadjusted and adjusted Weibull proportional hazard regression models were used to estimate hospitalization risk within 2 years after the index date for the different study groups with the SSRI/SNRI monotherapy group as the referent. Robust standard errors were used to estimate hazard ratios (HRs) and 95% confidence intervals (CIs). The Weibull model (and not the Cox model) was used because it does not assume hazard remains constant over time, which is appropriate in this instance, as the risk of an adverse event (AE) may be higher when first starting a medication or combination of medications relative to when doses are stabilized. Models were adjusted for age, sex, baseline mental health disorders, and baseline psychotropic medications. As earlier hospitalizations showed evidence of effect modification when this covariate was tested, hazard analyses were limited to patients not previously hospitalized.
The effect size of differences in hospitalization risk meeting statistical significance was assessed by estimating the number needed to harm (NNH) and 95% CIs (not shown) to observe 1 additional hospitalization in each medication group relative to the SSRI/SNRI monotherapy group over a 90-day period. A 95% CI for NNH that did not include 0 indicated the NNH was significant at the .05 level.10 All-cause mortality was evaluated with the Fisher exact test with post hoc Bonferroni-corrected comparisons as appropriate.
Results
Of 1,703 patients screened, 613 met all study inclusion criteria (Figure 1). 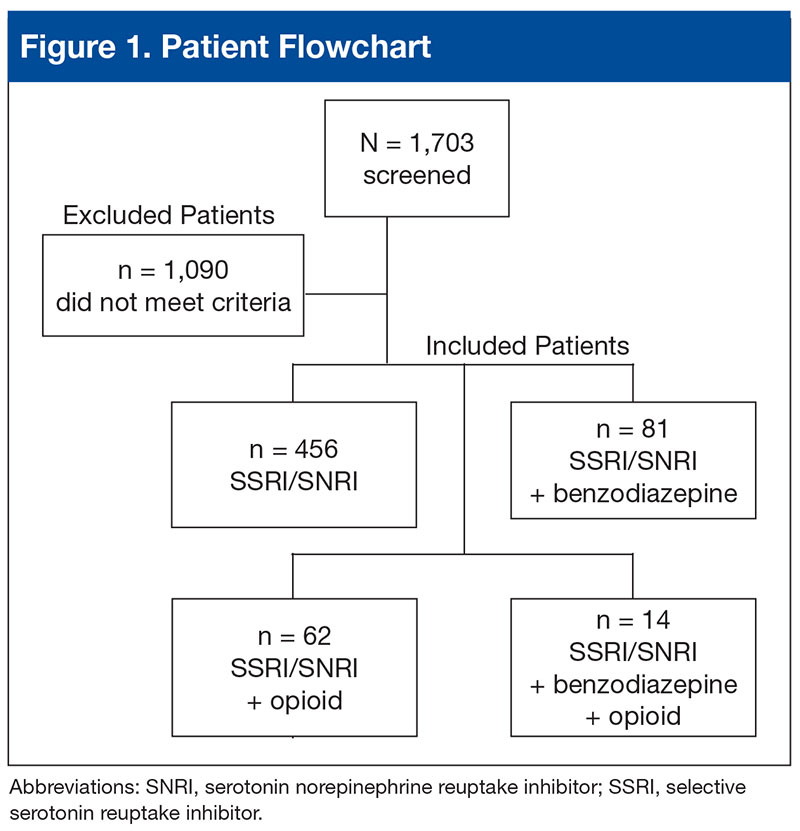
Baseline characteristics revealed no significant differences between groups in age or comorbid depression, schizophrenia, or SUDs (Table 1). 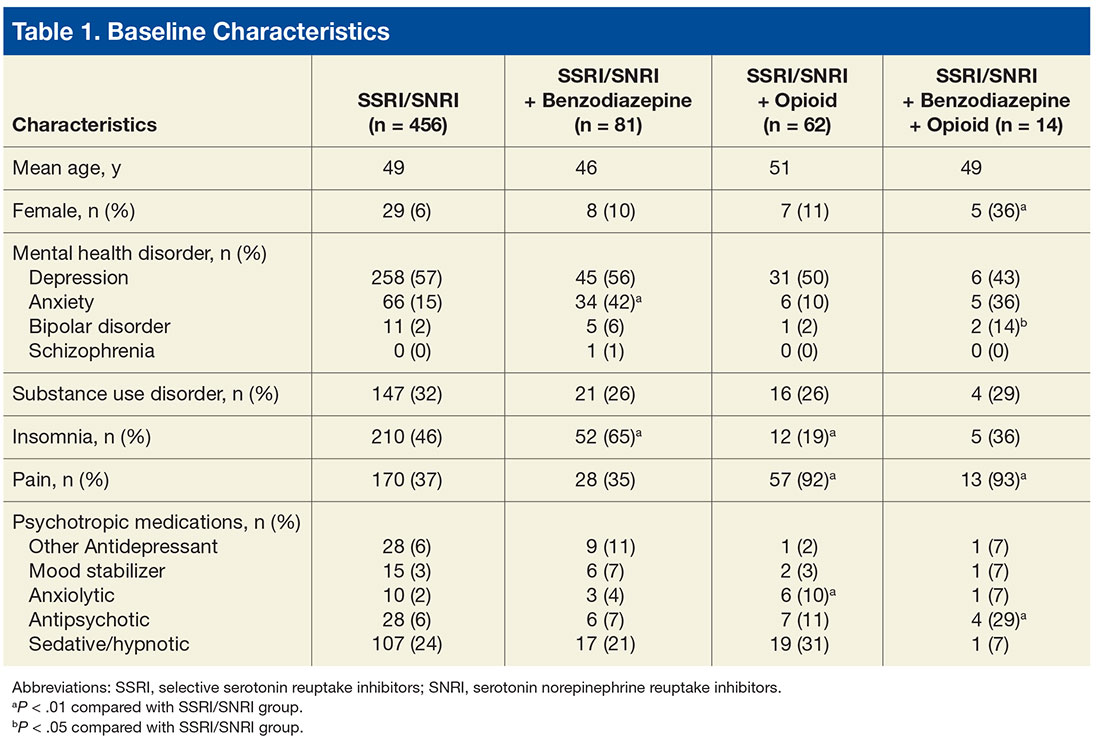
With the SSRI/SNRI monotherapy group as the referent, all concurrent therapy groups were at significantly increased risk for overall hospitalization within 2 years after the index date (Tables 2 & 3, Figure 2). 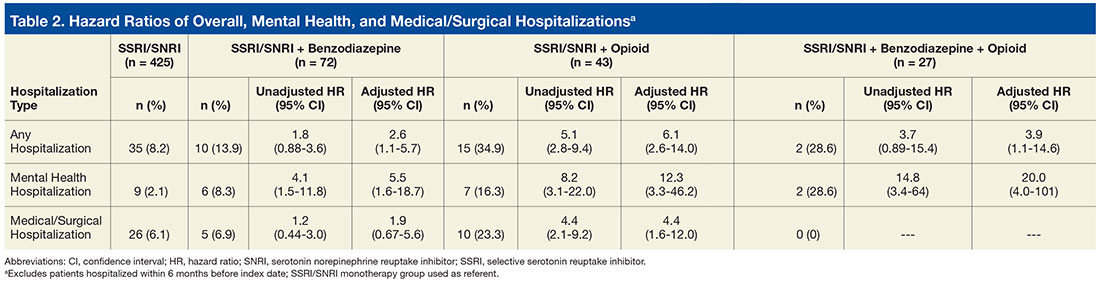
Risk for mental health hospitalization was significantly increased in all concurrent therapy groups relative to the referent group. 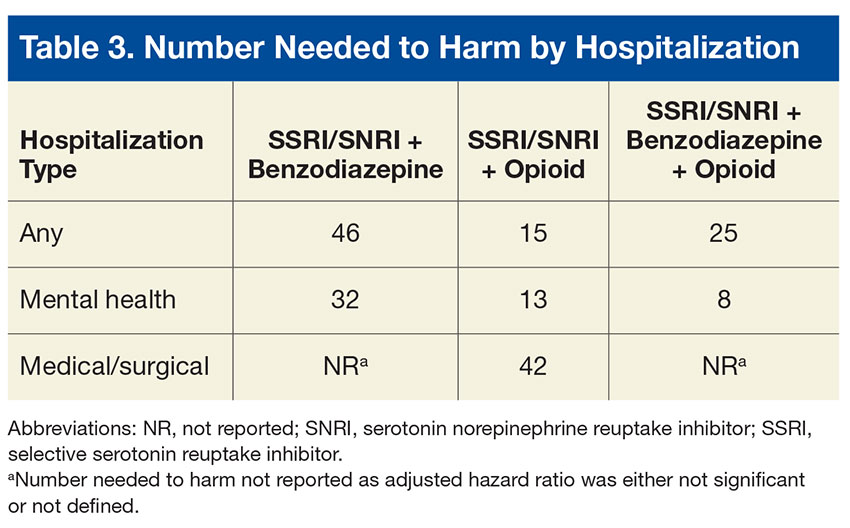
Although the risk for medical/surgical hospitalization was not significantly increased in the SSRI/SNRI and benzodiazepine therapy group (AHR, 1.9; 95% CI, 0.67-5.6), a significant difference was found in the SSRI/SNRI and opioid therapy group (AHR, 4.4; 95% CI, 1.6-12.0; NNH, 42). 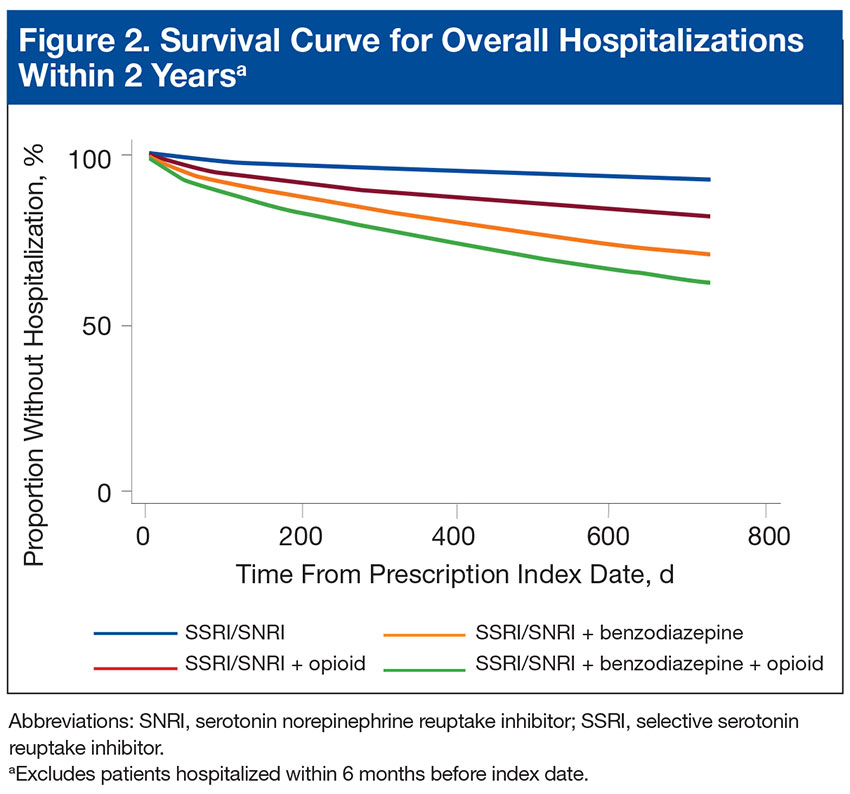
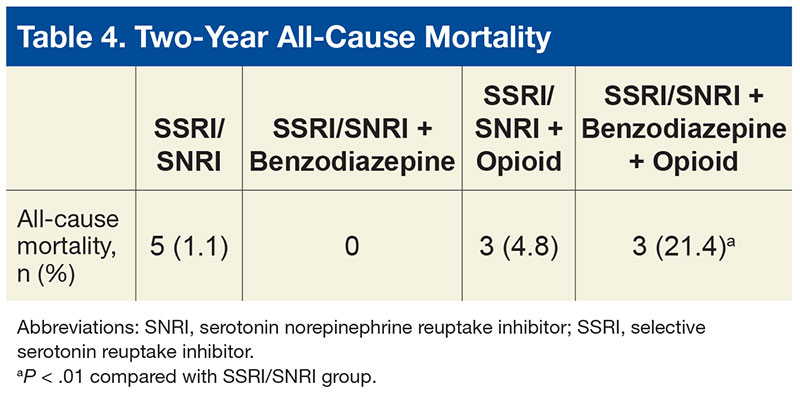
Discussion
In 2013, Hawkins and colleagues evaluated hospitalization risk in veterans treated for PTSD within the Northwest VISN 20 between 2004 and 2010.11 Compared with patients treated with only an SSRI or SNRI, those treated with 1 of those medications and a benzodiazepine were at significantly higher risk for overall hospitalization (AHR, 1.79; 95% CI, 1.38-2.32; P < .001) and mental health hospitalization (AHR, 1.87; 95% CI, 1.37-2.53; P < .001). Furthermore, those prescribed a benzodiazepine and an opioid along with an SSRI or SNRI were at higher risk for overall hospitalization (AHR, 2.98; 95% CI, 2.22-4.00; P < .001), mental health hospitalization (AHR, 2.00; 95% CI, 1.35-2.98; P < .01), medical/surgical hospitalization (AHR, 4.86; 95% CI, 3.30-7.14; P < .001), and ED visits (AHR, 2.01; 95% CI, 1.53-2.65; P < .001).
Findings from the present study, which covered a period after the newest PTSD guideline was released,support findings reported by Hawkins and colleagues in their retrospective cohort study covering an earlier period.2,11 In the present study, compared with the monotherapy group, the SSRI/SNRI and benzodiazepine therapy group and the SSRI/SNRI, benzodiazepine, and opioid therapy group were at higher risk for both overall hospitalization and mental health hospitalization within 2 years. However, in a subset of PTSD patients prescribed opioids along with first-line pharmacotherapy, this study found that overall, mental health, and medical/surgical hospitalizations were significantly increased as well. Furthermore, this study found 2-year mortality was significantly higher for the SSRI/SNRI, benzodiazepine, and opioid therapy group than for the SSRI/SNRI monotherapy group.
Adjusted hazard ratios were higher in the present study than those in the study by Hawkins and colleagues,but CIs were wider as well.11 These differences may be attributable to the relatively smaller sample size of the present study and may explain why the HR was higher for the SSRI/SNRI and opioid therapy group than for the SSRI/SNRI, benzodiazepine, and opioid therapy group.
Nevertheless, these results support the growing body of evidence establishing the many risks for AEs when benzodiazepines and opioids are prescribed in the setting of PTSD. Unfortunately, it seems that, against clear guideline recommendations and literature findings, these medications still are being prescribed to this vulnerable, high-risk population.
In the last few months of 2013, the VA health care system launched 2 important medication safety initiatives. The Psychotropic Drug Safety Initiative (PDSI) was established as a quality improvement initiative for evidence-based provision of psychotropic medications. One PDSI metric in particular focused on reducing the proportion of veterans with PTSD being treated with benzodiazepines. The Opioid Safety Initiative (OSI) came as a response to a dramatic increase in the number of fatal overdoses related to prescription opioids—an increase linked to an unprecedented jump in opioid use for nonmalignant pain. As the present study’s inclusion cutoff date of August 1, 2013, preceded the debut of both PDSI and OSI, the benzodiazepine and opioid prescription rates reported here might be higher than those currently being found under the 2 initiatives.
Limitations
This study had several limitations that might affect the interpretation or generalizability of findings. Requiring at least a 30-day supply for prescription eligibility was an attempt to focus on chronic use of medications rather than on, for example, onetime supplies of opioids for dental procedures. However, prescription fill history was not assessed. Therefore, patients could have been included in certain study groups even if their SSRI, SNRI, benzodiazepine, or opioid prescription was not refilled. Furthermore, only VA medical records were used; non-VA prescriptions were not captured.
In addition, this study was limited to patients who at bare minimum were prescribed an SSRI or an SNRI. Some patients may have been prescribed a benzodiazepine and/or an opioid but were not on appropriate first-line pharmacotherapy for PTSD. These patients were excluded from the study, and their relative hospitalization risk went unexplored. Therefore, the magnitude of the issue at hand might have been underestimated.
Although psychotherapy is a first-line treatment option for PTSD, the study did not assess the potential impact of psychotherapy on outcomes or the groups’ relative proportions of patients undergoing psychotherapy. It is unknown whether the groups were equivalent at baseline in regards to psychotherapy participation rates.
This study did not characterize the specific reasons for hospitalization beyond whether it was for a mental health or a medical/surgical issue; thus, no distinction was made between hospitalizations for an elective procedure and hospitalizations for a drug overdose or an injury. Investigators could characterize admission diagnoses to better assess whether hospitalizations are truly associated with study medications or whether patients are being hospitalized for unrelated reasons. In addition, they could elucidate the true nature of hospitalization risk associated with SSRI/SNRI, benzodiazepine, and opioid use by comparing admission diagnoses made before and after initiation of these pharmacologic therapies.
This study also could not assess outcomes for patients who presented to the ED but were not admitted. If the hospital’s floor and ED beds were at full capacity, some patients might have been transferred to an outside facility. However, this scenario is not common at SAVAHCS, where the study was conducted.
Although some comorbid conditions were noted, the study did not evaluate whether its patients had a compelling indication for benzodiazepines in particular. Opioid use is very limited to the treatment of pain, and the majority of the patients on opioid therapy in this study had a diagnosed pain syndrome.
Because of the study’s sample size and power limitations, patients were eligible to be included in a concurrent therapy group if a benzodiazepine, an opioid, or both were added no later than 1 year after SSRI/SNRI initiation. This gap of up to 1 year might have introduced some variability in exposure to risk from earlier prescribed medications. However, sensitivity analyses were performed with multiple constructed Weibull models of time to hospitalization based on subsets with varying overlapping medication gaps. Analyses revealed relatively stable HRs, suggesting that potential bias did not occur.
Future Directions
Investigators could explore the higher all-cause mortality rates in the SSRI/SNRI, benzodiazepine, and opioid therapy group, as this study did not assess cause of death in these patients. Whether any patients died of reasons directly attributable to benzodiazepines or opioids is unknown.
That SSRIs and SNRIs are the only established first-line pharmacologic treatment options for PTSD symptoms partly accounts for the widespread use of benzodiazepines in this population. For that reason, beyond characterizing the many risks associated with using benzodiazepines to manage these symptoms, there is a huge need to research the viability of other pharmacologic agents in treating PTSD. This is especially important given the slower onset to efficacy of the SSRIs and SNRIs; per estimates, only up to 60% of patients respond to SSRIs, and 20% to 30% achieve full remission of PTSD.12 Furthermore, these rates likely are even lower for combat veterans than those for the general population. Several trials discussed in a 2009 guideline review of the treatment of patients with acute stress disorder and PTSD have called into question the efficacy of SSRIs for combat-related PTSD.13 In these randomized, controlled trials, change in PTSD symptom severity as measured with CAPS was not significantly reduced with SSRIs compared with placebo.
A systematic review revealed that, of the nonantidepressants used as adjuncts in treating patients who do not achieve remission with SSRIs, the atypical antipsychotic risperidone may have the strongest supporting evidence.12 However, the present study found high rates of antipsychotic use in the SSRI/SNRI, benzodiazepine, and opioid therapy group, which also had the highest all-cause mortality rate. The safety of risperidone as an alternative treatment needs further evaluation.
Some prospective studies have suggested that the α1 blockers doxazosin and prazosin, the latter of which is commonly used for PTSD nightmares, also may improve PTSD symptoms as assessed by CAPS.14,15 Although these results are promising, the trials to date have been conducted with relatively small sample sizes.
With more veterans being treated for PTSD within the VA health care system, the central treatment goal remains: Adequately address the symptoms of PTSD while minimizing the harm caused by medications. Prescribers should limit benzodiazepine and opioid use in this population and consider safer nonpharmacologic and pharmacologic treatment options when possible.
Conclusion
Combat veterans with PTSD who are prescribed benzodiazepines and/or opioids in addition to first-line pharmacotherapy are at significantly increased risk for overall and mental health hospitalization.
Click here to read the digital edition.
1. Bernardy NC, Lund BC, Alexander B, Jenkyn AB, Schnurr PP, Friedman MJ. Gender differences in prescribing among veterans diagnosed with posttraumatic stress disorder. J Gen Intern Med. 2013;28(suppl 2):S542-S548.
2. Management of Post-Traumatic Stress Working Group, Department of Veterans Affairs, Department of Defense. VA/DoD Clinical Practice Guideline for Management of Post-Traumatic Stress. http://www.healthquality.va.gov/PTSD-full-2010c .pdf. Published October 2010. Accessed July 12, 2015.
3. Marks IM, Swinson RP, Baso˘glu M, et al. Alprazolam and exposure alone and combined in panic disorder with agoraphobia. A controlled study in London and Toronto. Br J Psychiatry. 1993;162:776-787.
4. Wilhelm FH, Roth WT. Acute and delayed effects of alprazolam on flight phobics during exposure. Behav Res Ther. 1997;35(9):831-841.
5. Guina J, Rossetter SR, DeRhodes BJ, Nahhas RW, Welton RS. Benzodiazepines for PTSD: a systematic review and meta-analysis. J Psychiatr Pract. 2015;21(4):281-303.
6. Pietrzak RH, Goldstein RB, Southwick SM, Grant BF. Prevalence and Axis I comorbidity of full and partial posttraumatic stress disorder in the United States: results from wave 2 of the National Epidemiologic Survey on Alcohol and Related Conditions. J Anxiety Disord. 2011;25(3):456-465.
7. Mills KL, Teesson M, Ross J, Darke S, Shanahan M. The costs and outcomes of treatment for opioid dependence associated with posttraumatic stress disorder. Psychiatr Serv. 2005;56(8):940-945.
8. Seal KH, Shi Y, Cohen G, et al. Association of mental health disorders with prescription opioids and high-risk opioid use in US veterans of Iraq and Afghanistan. JAMA. 2012;307(9):940-947.
9. Abrams TE, Lund BC, Bernardy NC, Friedman MJ. Aligning clinical practice to PTSD treatment guidelines: medication prescribing by provider type. Psychiatr Serv. 2013;64(2):142-148.
10. Altman DG, Andersen PK. Calculating the number needed to treat for trials where the outcome is time to an event. BMJ. 1999;319(7223):1492-1495.
11. Hawkins EJ, Malte CA, Grossbard J, Saxon AJ, Imel ZE, Kivlahan DR. Comparative safety of benzodiazepines and opioids among Veterans Affairs patients with posttraumatic stress disorder. J Addict Med. 2013;7(5):354-362.
12. Berger W, Mendlowicz MV, Marques-Portella C, et al. Pharmacologic alternatives to antidepressants in posttraumatic stress disorder: a systematic review. Prog Neuropsychopharmacol Biol Psychiatry. 2009;33(2):169-180.
13. Benedek DM, Friedman MJ, Zatzick D, Ursano RJ. Guideline watch (March 2009): practice guideline for the treatment of patients with acute stress disorder and posttraumatic stress disorder. Focus. 2009;7(2):204-213.
14. Raskind MA, Peterson K, Williams T, et al. A trial of prazosin for combat trauma PTSD with nightmares in active-duty soldiers returned from Iraq and Afghanistan. Am J Psychiatry. 2013;170(9):1003-1010.
15. Rodgman C, Verrico CD, Holst M, et al. Doxazosin XL reduces symptoms of posttraumatic stress disorder in veterans with PTSD: a pilot clinical trial. J Clin Psychiatry. 2016;77(5):e561-e565.
Posttraumatic stress disorder (PTSD) is a mental health condition that may develop in response to a traumatic event, such as that experienced by a soldier during active combat duty. In 2009, more than 495,000 veterans within the VA health care system were treated for PTSD—nearly triple the number a decade earlier.1 Core symptoms of PTSD include alterations in arousal and reactivity, avoidant behaviors, negative alterations in mood and cognition, and intrusive thoughts and nightmares. All of the symptoms can be debilitating. First-line pharmacotherapy options that target these core symptoms include selective serotonin reuptake inhibitors (SSRIs) and serotonin norepinephrine reuptake inhibitors (SNRIs).2
The anxiolytic and sedative effects of benzodiazepines may provide quick relief from many of the secondary symptoms of PTSD, including sleep disturbances, irritability, and panic attacks. However, benzodiazepines potentially interfere with the extinction of conditioned fear—a goal integral to certain types of psychotherapy, such as exposure therapy.3,4 In addition, the systematic review and meta-analysis by Guina and colleagues revealed that benzodiazepines are ineffective in the treatment of PTSD.5 The majority of the evaluated studies that used PTSD-specific measures (eg, Clinician-Administered PTSD Scale [CAPS]) found increased PTSD severity and worse prognosis with use of these medications.5 In 2010, the VA and the DoD released a joint guideline for PTSD management.2 According to the guideline, benzodiazepines cause harm when used in PTSD and are relatively contraindicated in combat veterans because of the higher incidence of comorbid substance use disorders (SUDs) in these veterans relative to the general population.2,6
Opioid use also has been linked to poor functional and clinical outcomes in veterans with PTSD. Among patients being treated for opioid use disorder, those with PTSD were less likely to endorse employment as a main source of income and had a higher incidence of recent attempted suicide.7 In a large retrospective cohort study, Operation Iraqi Freedom and Operation Enduring Freedom veterans with PTSD who were prescribed opioids were more likely to present to the emergency department (ED) and to be hospitalized for overdoses and injuries.8
Despite the risks of benzodiazepine and opioid use in this patient population, these medications are still often prescribed to veterans with PTSD for symptomatic relief. In fiscal year 2009, across the VHA system 37% of veterans diagnosed with PTSD were prescribed a benzodiazepine, 69% of the time by a mental health provider.9 Among Iraq and Afghanistan veterans, those with PTSD were significantly more likely to be prescribed an opioid for diagnosed pain—relative to those with a mental health disorder other than PTSD and those without a mental health disorder.8 Thus, there seems to be a disconnect between guideline recommendations and current practice.
The authors conducted a study to assess the potential risk of hospitalization for veterans with PTSD prescribed first-line pharmacotherapy and those also prescribed concurrent benzodiazepine and/or opioid therapy since the release of the PTSD guideline in 2010.2
Methods
In this retrospective cohort study, conducted at the Southern Arizona VA Health Care System (SAVAHCS), the authors analyzed electronic medical record data from November 1, 2009 to August 1, 2015. Study inclusion criteria were veteran, aged 18 to 89 years, diagnosis of PTSD (International Classification of Diseases, Ninth Revision, Clinical Modification code 309.81), and SSRI or SNRI newly prescribed between November 1, 2010 and August 1, 2013.
Any veteran prescribed at least one 30-day or longer supply of any benzodiazepine or opioid within 1 year before the SSRI/SNRI initial prescription date was excluded from the study. Also excluded was any patient treated for PTSD at a facility outside SAVAHCS or whose 2-year evaluation period extended past August 1, 2015.
Study Groups
An outpatient prescription was determined to be the initial SSRI/SNRI prescription for a patient who received less than a 30-day cumulative supply of any SSRI or SNRI within 1 year before that prescription date. Citalopram, desvenlafaxine, duloxetine, escitalopram, fluoxetine, fluvoxamine, levomilnacipran, milnacipran, paroxetine, sertraline, venlafaxine, vilazodone, and vortioxetine were the prespecified SSRI/SNRIs included in the study.
Patients who received at least 1 outpatient prescription for any benzodiazepine (minimum 30-day supply) within 1 year after the initial SSRI/SNRI prescription date were determined to be on concurrent SSRI/SNRI and benzodiazepine therapy. Alprazolam, chlordiazepoxide, clonazepam, clorazepate, diazepam, estazolam, flurazepam, lorazepam, oxazepam, temazepam, and triazolam were the prespecified benzodiazepines included in the study.
Patients who received at least 1 outpatient prescription for any opioid (minimum 30-day supply) within 1 year after the initial SSRI/SNRI prescription date were determined to be on concurrent SSRI/SNRI and opioid therapy. Codeine, fentanyl, hydrocodone, hydromorphone, levorphanol, meperidine, methadone, morphine, oxymorphone, pentazocine, propoxyphene, and tramadol were the prespecified opioids included in this study.
Patients who received at least 1 outpatient prescription for any benzodiazepine and any opioid (minimum 30-day supply) within 1 year after the initial SSRI/SNRI prescription date were determined to be on concurrent SSRI/SNRI, benzodiazepine, and opioid therapy.
The index date was defined as the first date of prescription overlap. If there was no benzodiazepine or opioid prescription within 1 year after the initial SSRI/SNRI prescription date, the patient was categorized as being on SSRI/SNRI monotherapy, and the index date was the date of the initial SSRI/SNRI prescription. For each patient, hospitalization data from the 2-year period after the index date were evaluated.
Outcomes and Data Collection
For evaluation of the primary outcome (2-year overall hospitalization risk), the number of unique mental health and medical/surgical hospitalizations was identified by the number of discharge summaries documented in the patient chart during the evaluation period. Time to first hospitalization was recorded for the survival data analysis. Secondary outcomes were mental health hospitalization risk, medical/surgical hospitalization risk, and all-cause mortality within 2 years.
Demographic data that were collected included age, sex, comorbid mental health disorders, comorbid SUDs, and concomitant use of psychotropic medications at index date (baseline). Select comorbid mental health disorders (anxiety, schizophrenia, depression, bipolar disorder) and substance use disorders (alcohol, opioid, illicit drug) also were identified. Data on insomnia and pain comorbidities (headaches or migraines; neuropathy; head, neck, back, arthritis, or joint pain) were collected, as these comorbidities could be indications for prescribing benzodiazepines and opioids. Concomitant baseline use of classes of psychotropic medications (antipsychotics, non-SSRI/SNRI antidepressants, mood stabilizers, anxiolytics, nonbenzodiazepine sedatives/hypnotics) also were documented. Last, hospitalizations within 6 months before the initial SSRI/SNRI prescription date were noted.
Statistical Analysis
Descriptive statistics were used to analyze all baseline demographic data. Continuous measures were evaluated with 1-way analyses of variance and post hoc Bonferroni-corrected pairwise comparisons, and categorical measures with contingency tables and χ2 tests or Fisher exact tests. When the overall χ2 test was significant across all 4 study groups, post hoc comparisons were performed between the SSRI/SNRI monotherapy group and each other group with Bonferroni adjusted for 3 comparisons.
Unadjusted and adjusted Weibull proportional hazard regression models were used to estimate hospitalization risk within 2 years after the index date for the different study groups with the SSRI/SNRI monotherapy group as the referent. Robust standard errors were used to estimate hazard ratios (HRs) and 95% confidence intervals (CIs). The Weibull model (and not the Cox model) was used because it does not assume hazard remains constant over time, which is appropriate in this instance, as the risk of an adverse event (AE) may be higher when first starting a medication or combination of medications relative to when doses are stabilized. Models were adjusted for age, sex, baseline mental health disorders, and baseline psychotropic medications. As earlier hospitalizations showed evidence of effect modification when this covariate was tested, hazard analyses were limited to patients not previously hospitalized.
The effect size of differences in hospitalization risk meeting statistical significance was assessed by estimating the number needed to harm (NNH) and 95% CIs (not shown) to observe 1 additional hospitalization in each medication group relative to the SSRI/SNRI monotherapy group over a 90-day period. A 95% CI for NNH that did not include 0 indicated the NNH was significant at the .05 level.10 All-cause mortality was evaluated with the Fisher exact test with post hoc Bonferroni-corrected comparisons as appropriate.
Results
Of 1,703 patients screened, 613 met all study inclusion criteria (Figure 1).
Baseline characteristics revealed no significant differences between groups in age or comorbid depression, schizophrenia, or SUDs (Table 1).
With the SSRI/SNRI monotherapy group as the referent, all concurrent therapy groups were at significantly increased risk for overall hospitalization within 2 years after the index date (Tables 2 & 3, Figure 2).
Risk for mental health hospitalization was significantly increased in all concurrent therapy groups relative to the referent group.
Although the risk for medical/surgical hospitalization was not significantly increased in the SSRI/SNRI and benzodiazepine therapy group (AHR, 1.9; 95% CI, 0.67-5.6), a significant difference was found in the SSRI/SNRI and opioid therapy group (AHR, 4.4; 95% CI, 1.6-12.0; NNH, 42).
Discussion
In 2013, Hawkins and colleagues evaluated hospitalization risk in veterans treated for PTSD within the Northwest VISN 20 between 2004 and 2010.11 Compared with patients treated with only an SSRI or SNRI, those treated with 1 of those medications and a benzodiazepine were at significantly higher risk for overall hospitalization (AHR, 1.79; 95% CI, 1.38-2.32; P < .001) and mental health hospitalization (AHR, 1.87; 95% CI, 1.37-2.53; P < .001). Furthermore, those prescribed a benzodiazepine and an opioid along with an SSRI or SNRI were at higher risk for overall hospitalization (AHR, 2.98; 95% CI, 2.22-4.00; P < .001), mental health hospitalization (AHR, 2.00; 95% CI, 1.35-2.98; P < .01), medical/surgical hospitalization (AHR, 4.86; 95% CI, 3.30-7.14; P < .001), and ED visits (AHR, 2.01; 95% CI, 1.53-2.65; P < .001).
Findings from the present study, which covered a period after the newest PTSD guideline was released,support findings reported by Hawkins and colleagues in their retrospective cohort study covering an earlier period.2,11 In the present study, compared with the monotherapy group, the SSRI/SNRI and benzodiazepine therapy group and the SSRI/SNRI, benzodiazepine, and opioid therapy group were at higher risk for both overall hospitalization and mental health hospitalization within 2 years. However, in a subset of PTSD patients prescribed opioids along with first-line pharmacotherapy, this study found that overall, mental health, and medical/surgical hospitalizations were significantly increased as well. Furthermore, this study found 2-year mortality was significantly higher for the SSRI/SNRI, benzodiazepine, and opioid therapy group than for the SSRI/SNRI monotherapy group.
Adjusted hazard ratios were higher in the present study than those in the study by Hawkins and colleagues,but CIs were wider as well.11 These differences may be attributable to the relatively smaller sample size of the present study and may explain why the HR was higher for the SSRI/SNRI and opioid therapy group than for the SSRI/SNRI, benzodiazepine, and opioid therapy group.
Nevertheless, these results support the growing body of evidence establishing the many risks for AEs when benzodiazepines and opioids are prescribed in the setting of PTSD. Unfortunately, it seems that, against clear guideline recommendations and literature findings, these medications still are being prescribed to this vulnerable, high-risk population.
In the last few months of 2013, the VA health care system launched 2 important medication safety initiatives. The Psychotropic Drug Safety Initiative (PDSI) was established as a quality improvement initiative for evidence-based provision of psychotropic medications. One PDSI metric in particular focused on reducing the proportion of veterans with PTSD being treated with benzodiazepines. The Opioid Safety Initiative (OSI) came as a response to a dramatic increase in the number of fatal overdoses related to prescription opioids—an increase linked to an unprecedented jump in opioid use for nonmalignant pain. As the present study’s inclusion cutoff date of August 1, 2013, preceded the debut of both PDSI and OSI, the benzodiazepine and opioid prescription rates reported here might be higher than those currently being found under the 2 initiatives.
Limitations
This study had several limitations that might affect the interpretation or generalizability of findings. Requiring at least a 30-day supply for prescription eligibility was an attempt to focus on chronic use of medications rather than on, for example, onetime supplies of opioids for dental procedures. However, prescription fill history was not assessed. Therefore, patients could have been included in certain study groups even if their SSRI, SNRI, benzodiazepine, or opioid prescription was not refilled. Furthermore, only VA medical records were used; non-VA prescriptions were not captured.
In addition, this study was limited to patients who at bare minimum were prescribed an SSRI or an SNRI. Some patients may have been prescribed a benzodiazepine and/or an opioid but were not on appropriate first-line pharmacotherapy for PTSD. These patients were excluded from the study, and their relative hospitalization risk went unexplored. Therefore, the magnitude of the issue at hand might have been underestimated.
Although psychotherapy is a first-line treatment option for PTSD, the study did not assess the potential impact of psychotherapy on outcomes or the groups’ relative proportions of patients undergoing psychotherapy. It is unknown whether the groups were equivalent at baseline in regards to psychotherapy participation rates.
This study did not characterize the specific reasons for hospitalization beyond whether it was for a mental health or a medical/surgical issue; thus, no distinction was made between hospitalizations for an elective procedure and hospitalizations for a drug overdose or an injury. Investigators could characterize admission diagnoses to better assess whether hospitalizations are truly associated with study medications or whether patients are being hospitalized for unrelated reasons. In addition, they could elucidate the true nature of hospitalization risk associated with SSRI/SNRI, benzodiazepine, and opioid use by comparing admission diagnoses made before and after initiation of these pharmacologic therapies.
This study also could not assess outcomes for patients who presented to the ED but were not admitted. If the hospital’s floor and ED beds were at full capacity, some patients might have been transferred to an outside facility. However, this scenario is not common at SAVAHCS, where the study was conducted.
Although some comorbid conditions were noted, the study did not evaluate whether its patients had a compelling indication for benzodiazepines in particular. Opioid use is very limited to the treatment of pain, and the majority of the patients on opioid therapy in this study had a diagnosed pain syndrome.
Because of the study’s sample size and power limitations, patients were eligible to be included in a concurrent therapy group if a benzodiazepine, an opioid, or both were added no later than 1 year after SSRI/SNRI initiation. This gap of up to 1 year might have introduced some variability in exposure to risk from earlier prescribed medications. However, sensitivity analyses were performed with multiple constructed Weibull models of time to hospitalization based on subsets with varying overlapping medication gaps. Analyses revealed relatively stable HRs, suggesting that potential bias did not occur.
Future Directions
Investigators could explore the higher all-cause mortality rates in the SSRI/SNRI, benzodiazepine, and opioid therapy group, as this study did not assess cause of death in these patients. Whether any patients died of reasons directly attributable to benzodiazepines or opioids is unknown.
That SSRIs and SNRIs are the only established first-line pharmacologic treatment options for PTSD symptoms partly accounts for the widespread use of benzodiazepines in this population. For that reason, beyond characterizing the many risks associated with using benzodiazepines to manage these symptoms, there is a huge need to research the viability of other pharmacologic agents in treating PTSD. This is especially important given the slower onset to efficacy of the SSRIs and SNRIs; per estimates, only up to 60% of patients respond to SSRIs, and 20% to 30% achieve full remission of PTSD.12 Furthermore, these rates likely are even lower for combat veterans than those for the general population. Several trials discussed in a 2009 guideline review of the treatment of patients with acute stress disorder and PTSD have called into question the efficacy of SSRIs for combat-related PTSD.13 In these randomized, controlled trials, change in PTSD symptom severity as measured with CAPS was not significantly reduced with SSRIs compared with placebo.
A systematic review revealed that, of the nonantidepressants used as adjuncts in treating patients who do not achieve remission with SSRIs, the atypical antipsychotic risperidone may have the strongest supporting evidence.12 However, the present study found high rates of antipsychotic use in the SSRI/SNRI, benzodiazepine, and opioid therapy group, which also had the highest all-cause mortality rate. The safety of risperidone as an alternative treatment needs further evaluation.
Some prospective studies have suggested that the α1 blockers doxazosin and prazosin, the latter of which is commonly used for PTSD nightmares, also may improve PTSD symptoms as assessed by CAPS.14,15 Although these results are promising, the trials to date have been conducted with relatively small sample sizes.
With more veterans being treated for PTSD within the VA health care system, the central treatment goal remains: Adequately address the symptoms of PTSD while minimizing the harm caused by medications. Prescribers should limit benzodiazepine and opioid use in this population and consider safer nonpharmacologic and pharmacologic treatment options when possible.
Conclusion
Combat veterans with PTSD who are prescribed benzodiazepines and/or opioids in addition to first-line pharmacotherapy are at significantly increased risk for overall and mental health hospitalization.
Click here to read the digital edition.
1. Bernardy NC, Lund BC, Alexander B, Jenkyn AB, Schnurr PP, Friedman MJ. Gender differences in prescribing among veterans diagnosed with posttraumatic stress disorder. J Gen Intern Med. 2013;28(suppl 2):S542-S548.
2. Management of Post-Traumatic Stress Working Group, Department of Veterans Affairs, Department of Defense. VA/DoD Clinical Practice Guideline for Management of Post-Traumatic Stress. http://www.healthquality.va.gov/PTSD-full-2010c .pdf. Published October 2010. Accessed July 12, 2015.
3. Marks IM, Swinson RP, Baso˘glu M, et al. Alprazolam and exposure alone and combined in panic disorder with agoraphobia. A controlled study in London and Toronto. Br J Psychiatry. 1993;162:776-787.
4. Wilhelm FH, Roth WT. Acute and delayed effects of alprazolam on flight phobics during exposure. Behav Res Ther. 1997;35(9):831-841.
5. Guina J, Rossetter SR, DeRhodes BJ, Nahhas RW, Welton RS. Benzodiazepines for PTSD: a systematic review and meta-analysis. J Psychiatr Pract. 2015;21(4):281-303.
6. Pietrzak RH, Goldstein RB, Southwick SM, Grant BF. Prevalence and Axis I comorbidity of full and partial posttraumatic stress disorder in the United States: results from wave 2 of the National Epidemiologic Survey on Alcohol and Related Conditions. J Anxiety Disord. 2011;25(3):456-465.
7. Mills KL, Teesson M, Ross J, Darke S, Shanahan M. The costs and outcomes of treatment for opioid dependence associated with posttraumatic stress disorder. Psychiatr Serv. 2005;56(8):940-945.
8. Seal KH, Shi Y, Cohen G, et al. Association of mental health disorders with prescription opioids and high-risk opioid use in US veterans of Iraq and Afghanistan. JAMA. 2012;307(9):940-947.
9. Abrams TE, Lund BC, Bernardy NC, Friedman MJ. Aligning clinical practice to PTSD treatment guidelines: medication prescribing by provider type. Psychiatr Serv. 2013;64(2):142-148.
10. Altman DG, Andersen PK. Calculating the number needed to treat for trials where the outcome is time to an event. BMJ. 1999;319(7223):1492-1495.
11. Hawkins EJ, Malte CA, Grossbard J, Saxon AJ, Imel ZE, Kivlahan DR. Comparative safety of benzodiazepines and opioids among Veterans Affairs patients with posttraumatic stress disorder. J Addict Med. 2013;7(5):354-362.
12. Berger W, Mendlowicz MV, Marques-Portella C, et al. Pharmacologic alternatives to antidepressants in posttraumatic stress disorder: a systematic review. Prog Neuropsychopharmacol Biol Psychiatry. 2009;33(2):169-180.
13. Benedek DM, Friedman MJ, Zatzick D, Ursano RJ. Guideline watch (March 2009): practice guideline for the treatment of patients with acute stress disorder and posttraumatic stress disorder. Focus. 2009;7(2):204-213.
14. Raskind MA, Peterson K, Williams T, et al. A trial of prazosin for combat trauma PTSD with nightmares in active-duty soldiers returned from Iraq and Afghanistan. Am J Psychiatry. 2013;170(9):1003-1010.
15. Rodgman C, Verrico CD, Holst M, et al. Doxazosin XL reduces symptoms of posttraumatic stress disorder in veterans with PTSD: a pilot clinical trial. J Clin Psychiatry. 2016;77(5):e561-e565.
The Role of Procalcitonin in the Management of Infectious Diseases
Procalcitonin (PCT) is a precursor to the hormone calcitonin and is a serum biomarker of interest in infectious diseases. Many studies have analyzed its utility and role in assisting clinical decision making, especially in conditions that result in inflammation due to a bacterial infection. A systemic inflammatory response from a bacterial infection begins with the release of endotoxins/exotoxins and a response from immune system mediators that release cytokines, such as interleukin-1β and tumor necrosis factor-α. These cytokines contribute to the development of a fever, the release of stress hormones, such as cortisone and epinephrine, and interleukin-6, which stimulates acute phase reactants, such as C-reactive protein (CRP) and PCT.1,2
C-reactive protein and white blood cell count (WBC) are commonly used clinically as biomarkers that assist in the recognition of the infectious process and may be indicators of disease prognosis, but both lack specificity for bacterial infections. Consequentially, using CRP and WBC as clinical decision aids may result in unnecessary antibiotic therapy, which may result in an increase in drug-related adverse events and antibiotic resistance. A major distinction of PCT is that it has greater specificity than does CRP, because it tends to be elevated primarily as a result of inflammation due to bacterial infections. Procalcitonin can be used to distinguish bacterial from viral infections because its up-regulation is attenuated by interferon-gamma, a cytokine released in response to viral infections.2 Thus, PCT may be a more effective clinical marker for optimizing the diagnosis, monitoring, and treatment in patients with systemic bacterial infections.
Procalcitonin as a Marker
A study evaluating infectious markers compared the use of PCT, lactate, and CRP as diagnostic tools in patients with septic shock. The results of this study indicated that PCT was the only marker significantly elevated in patients with septic shock that was also normal in patients not in septic shock (14 µg/mL vs 1 µg/mL, P = .0003).3 This and other studies led the FDA to approve PCT use in 2005 as an aid to clinical decision making in the assessment of critically ill patients with sepsis.4 Overall, the literature supports the use of PCT as a diagnostic tool in infections requiring antimicrobial therapy within appropriate clinical settings.
Strong evidence exists confirming PCT’s role as an aid to clinical decision making in bronchitis, chronic obstructive pulmonary disease exacerbations, pneumonia, and severe sepsis/shock management.2 Procalcitonin’s kinetic profile makes it a good monitoring tool, because its levels promptly increase within 3 to 6 hours of infection, peak at 12 to 48 hours, and rapidly decline during recovery. Additionally, its levels closely parallel the extent and severity of present inflammation, making it a useful prognostic marker of disease progression and response to antibiotic therapy.2,4,5
Related: Mass Transit for Viruses
Christ-Crain and colleagues studied the outcome of PCT-guided antibiotic algorithms for patients with lower respiratory tract infections (RTIs) presenting to the emergency department. A serum PCT level of 0.25 to 0.5 µg/L suggested a likely bacterial infection, and physicians were advised to initiate antimicrobial therapy. Serum levels above 0.5 µg/L were suggestive of a bacterial infection, and initiation of antimicrobial therapy was strongly recommended. The results showed that PCT-guided algorithms significantly reduced the number of antibiotic-treated patients (n = 99 [83%] vs n = 55 [44%]; P < .0001), reduced the duration of antibiotic treatment (12.8 days vs 10.9 days; P = .03), and decreased the antibiotic cost per patient ($202.5 vs $96.3; P < .0001) compared with the standard group (n = 119) without a significant difference in mortality.6
Sepsis/septic shock is another area in which PCT has been studied. Use of a PCT-guided algorithm in critically ill patients with suspected or documented severe sepsis or septic shock to guide discontinuation of antimicrobial therapy resulted in reduced duration of antibiotic therapy (10 days vs 6 days; P = .003) in the PCT group (n = 31) compared with the standard of care group (n = 37) while maintaining similar mortality and infection recurrence rates between the 2 groups. The PCT algorithm in this study recommended discontinuing antimicrobial therapy when PCT levels had decreased by > 90% from identification of sepsis/septic shock but not prior to 3 or 5 days of therapy, depending on the baseline PCT level.7
Systematic reviews of multiple trials have confirmed these representative results. Using a PCT algorithm to withhold or de-escalate antibiotics in patients with suspected bacterial infection leads to a significant reduction in antimicrobial utilization without adversely affecting patient outcome.8
Related: Health Care Use Among Iraq and Afghanistan Veterans With Infectious Diseases
Procalcitonin levels should be rechecked 48 to 72 hours after beginning antimicrobial therapy in clinically stable patients with RTIs in order to reevaluate patient need for continued therapy. In patients whose antibiotics are withheld due to low PCT levels, it is recommended to obtain a repeat level 12 to 48 hours after the decision if clinical improvement is not seen.6,9-12 Literature suggests that it is reasonable to check PCT levels every 48 to 72 hours in patients with sepsis for considering discontinuation of antibiotic therapy as well as in patients who are not clinically improving and may need to broaden antibiotic therapy.7,12
Limitations of the use of PCT as a clinical biomarker include its inability to be used in immunocompromised patients. In addition, PCT levels are increased in severe, noninfectious inflammatory conditions, such as inhalation injury, pulmonary aspiration, severe burns, pancreatitis, heat stroke, mesenteric infarction, trauma, surgery, and pneumonitis.12 The presence of low-grade inflammation from a bacterial infection can lead to slightly elevated PCT levels that are difficult to quantify due to the low sensitivity of current PCT assays.13
The level of PCT up-regulation may depend on the infecting pathogen. One study showed that PCT was highly elevated in patients with pneumococcal community-acquired pneumonia (CAP), and another study demonstrated that PCT levels did not increase in CAP due to atypical organisms.14,15 Thus, atypical antimicrobial coverage should be continued per current guidelines in patients in whom there is high suspicion of atypical organism-involvement in CAP.
Related: The Importance of an Antimicrobial Stewardship Program
Conclusion
Many studies have analyzed the use of PCT as a biomarker for infectious disease diagnosis, monitoring, and treatment. Current evidence supports its use in RTIs and sepsis, although it may be useful in other conditions as well, such as bacteremia and postoperative infections.2 Due to its limitations and controversy, PCT should not be used as a sole marker but as an adjunct to a patient’s clinical presentation, overall clinical picture, and other biomarkers.
Additional Note
An earlier version of this article appeared in the Pharmacy Related Newsletter: The Capsule, of the William S. Middleton Memorial Veterans Hospital.
Author disclosures
The authors report no actual or potential conflicts of interest with regard to this article.
Disclaimer
The opinions expressed herein are those of the authors and do not necessarily reflect those of Federal Practitioner, Frontline Medical Communications Inc., the U.S. Government, or any of its agencies. This article may discuss unlabeled or investigational use of certain drugs. Please review the complete prescribing information for specific drugs or drug combinations—including indications, contraindications, warnings, and adverse effects—before administering pharmacologic therapy to patients.
Pharmacist Management of Adult Asthma at an Indian Health Service Facility
According to the Centers for Disease Control and Prevention, asthma prevalence in the U.S. increased between 2001 and 2010 and is now at its highest level. In 2010, about 25.7 million people had asthma: 18.7 million adults (8%) and 7 million children (9%). Despite well-known treatment options, asthma continues to be poorly controlled. In 2009 there were 1.6 million emergency department (ED) visits, 497,300 hospitalizations, and 3,404 deaths related to asthma. Additionally, in 2008 the disease affected attendance at school and work with 10.5 million and 14.2 million missed school days and workdays, respectively.1-5
The American Indian and Alaska Native (AIAN) populations have not escaped the realities of asthma. According to a 2010 report of the National Center for Health Statistics, AIAN populations also have a high prevalence of asthma at 14.2%. This percentage is much higher than that of the general population.1
Over the past decade, pharmacists have expanded their roles from educators to clinicians with prescriptive authority in various settings. The greatest success has been seen with anticoagulation clinics, both clinically and financially.6-10 Pharmacists have also demonstrated positive outcomes when involved in cardiovascular clinics.11-13
Additionally, pharmacists have been involved with asthma clinics as both educators and prescribers with favorable results clinically and economically.14-16 A study from Taiwan done by Chan and Wang indicated that pharmacist asthma interventions in an outpatient setting improved the quality of care, reduced cost, and relieved stress on general medical resources.17 Another study indicated that education by a community pharmacist can improve asthma control in a self-managed program.18
In 2007, an asthma medication use evaluation (MUE) was completed at the Northern Navajo Medical Center (NNMC) in Shiprock, New Mexico. The results of the MUE concluded that asthma statistics for the local population differed from that of the national data (Table 1). Overall, the Navajo population served by the NNMC had a lower incidence of asthma but a higher rate of hospital admissions and ED visits.
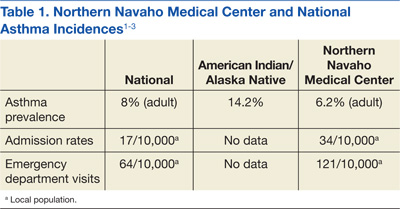
One of the primary focus points for the MUE was short-acting beta agonist (SABA) refills. According to national guidelines, using a SABA 2 or more times per week (not for exercise-induced bronchospasms) would indicate a patient was not well controlled.19 This use equates to 2 refills of SABA per year. The MUE found that 51% of patients had ≥ 3 refills per year, and 38% of patients had 4 or more refills per year. Based on asthma prevalence and SABA history, it was determined that a specialty clinic could have a positive impact on asthma care.
This study addresses how a specialized adult asthma clinic managed by pharmacists with physician oversight can improve asthma outcomes. Since January 2010, the NNMC has had a program in place and has experienced a concurrent substantial drop in asthma-related ED visits and admissions, an improved level of control, and a decreased cost burden to the facility.
Methods
A retrospective chart review was completed on all patients currently enrolled in the clinic. The Resource and Patient Management System Visit General Retrieval (RPMS VGEN), Electronic Health Record, and the asthma clinic database were used to evaluate patients. The evaluation period began January 1, 2010, and ended December 31, 2011.
Performance improvement inclusion criteria for clinic patients were based on active status in the clinic. Active patients were defined as patients with at least 2 clinic visits and a clinic visit within 3 months of an ED visit or admission. The 3-month cutoff was chosen based on several criteria. First, most patients referred to the clinic were categorized as either not well controlled (NWC) or very poorly controlled (VPC) and required at least a 2- to 4-week follow-up based on guidelines. Second, patients who were categorized as well controlled (WC) were scheduled for clinic visits every 3 months for regular follow-up.
Using all ICD-9 codes for asthma, RPMS VGEN was used to find the number of ED visits and admissions that occurred with asthma as the primary diagnosis from both clinic and nonclinic patients. The inclusion criteria were then applied to the clinic patients, and those not meeting these criteria were returned to the nonclinic pool of patients.
Cost analysis was evaluated based on the results of a random selection of 20 patients from 2009 and 2010 ED and hospital visits at the NNMC. These numbers were averaged to determine ED and admission costs. Length of admission stay was determined from a RPMS VGEN search for each clinic and nonclinic patient admission.
Determination of the level of control was based on the 2007 national asthma guidelines. The guidelines state that the level of control can be determined by either asthma symptoms or by peak flow evaluation.19 Because of the language barrier that sometimes arises with the treated population, the use of symptom-based evaluation has been observationally superior to providing peak flow meters for home use. At each visit, patients were interviewed using tables from the asthma guidelines. Table 2 is an abbreviated portion of the guidelines representing the assessment tool used by the clinic. The level of control was determined by selecting the column with the highest severity of impairment.19
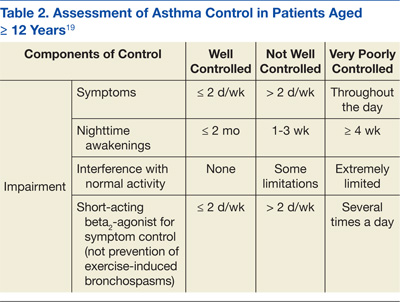
All patients seen at the clinic were tracked in a database, and their current level of control was documented at each visit. To determine the level of control, the database was reviewed, and those patients with > 1 visit were included in the analysis. The levels of control from the first visit to the most recent visit were compared.
Patient surveys were completed at each visit. These surveys included questions to assist the pharmacy provider in classifying the level of control, patient satisfaction with asthma care, and patient perception of asthma control. Approval from the Navajo Area Institutional Review Board was obtained for data publication. Odds ratios were used to determine the impact of the clinic, using a 95% confidence interval.
Results
For the review period, 2,997 patients were coded as having some form of asthma, resulting in 12,739 asthma visits within the medical center.
ED Visits and Hospital Admissions
Of these 2,997 patients, 301 visited the ED between 2010 and 2011 with 22 being active asthma clinic patients. These 22 active clinic patients accounted for 31 ED visits. The remaining 279 patients had 428 visits with a total of 459 ED visits from clinic and nonclinic patients. Sixty patients were hospitalized for asthma with 7 of them active asthma clinic patients. The 7 clinic patients admitted accounted for 8 admissions. There is a statistical significance in total ED visits and admissions as well as for individual patients (Table 3).
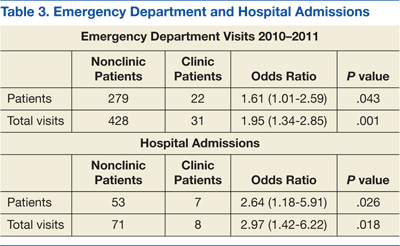
To determine the clinic impact, a 2-year analysis of patient pre- and postclinic enrollment was done. Search criteria for RPMS VGEN were identical to the study period search except for dates. Those patients enrolled in the clinic during the study period (2010-2011) were evaluated for the 2 years before the clinic startup (2008-2009). The results indicated a decrease in both ED visits and hospital admissions related to asthma for clinic patients (Table 4).
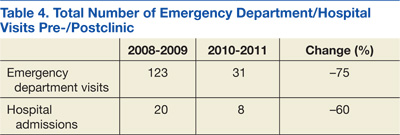
Cost Data and Length of Stay
Emergency department and hospital admissions costs were determined from an earlier performance improvement review of the clinic. The median cost of an ED visit was $373 with a range from $228 to $910. The cost range represented the severity of the asthma exacerbation being treated. This cost range was similar to published data that reported a cost range from $234 to $400 with an average of $339 per visit.20,21 Hospital costs (including ED visit) per day ranged from $528 to $2,470 with a median of $1,199 per day. Table 5 shows the calculated actual annual cost savings for patients pre- and postenrollment. The cost difference between clinic and nonclinic patients from 2010 to 2011 was calculated to be $111,000 annually (data not shown). The median length of the hospital stay for clinic and nonclinic patients was 2 days (range, 1-10 and 1-7 days, respectively). The national average was 4.3 days.
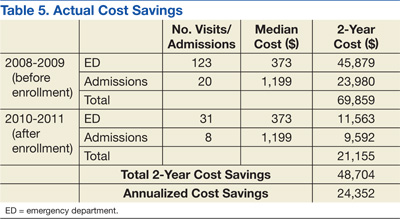
From 2008 to 2009, there were 123 ED visits and 20 hospital admissions related to asthma of patients who would later be enrolled in the asthma clinic study. From 2010 to 2011 there were 31 ED visits and 8 hospital asthma admissions
(Table 4). These data were used to determine the potential cost savings for the clinic (Table 5). Based on current reductions, the potential annual cost savings was $85,405 if all adult asthma patients were seen in the pharmacy managed clinic (Table 6).
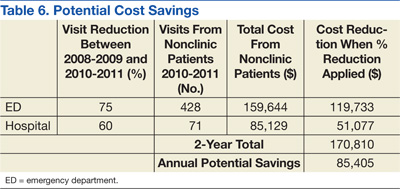
Level of Control
A total of 66 patients had 3 or more visits to the asthma clinic. Of these patients, 30% had no change in control, 60% showed some measure of improvement, and 11% had a decrease in control based on the national guidelines (Table 7).
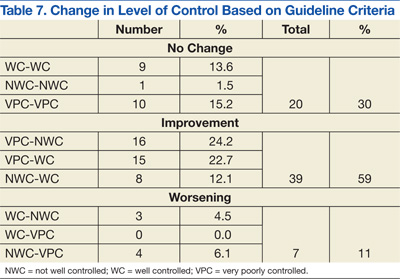
Patient Perception
At each visit, the patient’s current perception of asthma control, satisfaction with control, and clinic grade related to asthma care was determined. Of the 66 patients with 3 or more visits, a large portion of the questionnaires were missing when the data were collected. Table 8 shows the results of the data for patients with 3 more visits and 2 completed forms from different visits. These data points may not have been from the first or most recent visits.
From earliest to most recent visit, patient perception of asthma control compared with clinical guidelines improved moderately. Sixteen patients had a clinical improvement from VPC to NWC with 13 (81%) believing their symptoms were now WC.
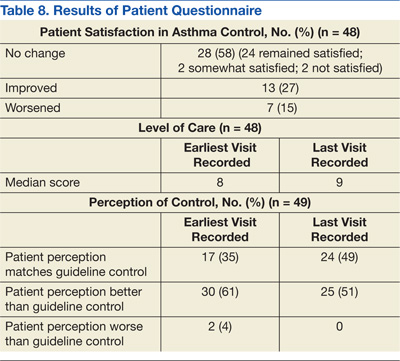
Discussion
The results of this performance improvement evaluation are encouraging. However, not all positive data may be directly attributed to the asthma clinic. The statistical analysis for this study does not seek to remove confounding variables. Without removing potential confounding variables, questions remain about the accuracy of the outcome. However, combining the statistical data in Table 3 and the 2-year comparative data in Table 4, strong evidence exists that a positive impact from the clinic had occurred even in the presence of potential confounding variables.
The financial impact of asthma was evident with the 2010 to 2011 cost for ED visits and hospital admissions at $265,928. Asthma clinic patients made up only 8% ($21,155) of this cost and yielded an annual cost savings of $24,352. Obviously, the 8% was a direct result of the number of nonclinic vs clinic patients. However, the cost savings of $24,352 was independent of patient numbers and was calculated directly from patients pre- and postenrollment. The potential savings if all current nonclinic patients were enrolled in the clinic was $85,405 annually.
The savings was only direct cost and did not include indirect costs related to asthma, such as lost work/school days, impact on employer productivity, and so forth. This was calculated after applying the 75% and 60% reduction in ED and hospital costs. As more patients are enrolled in the clinic, the potential cost could become an actual cost savings, based on the assumption that the 75% and 60% reduction stays constant (Figure). Over 1 year, the actual savings of the clinic makes up for 31% of the current ED visits from nonclinic patients. With the addition of the potential savings, the clinic could almost negate the money that is currently spent on asthma care.

Clinic data indicated a positive impact on level of control. Of those patients with 3 or more visits to the asthma clinic, 59% had some form of improvement. Fifteen of those patients (23%) had the biggest improvement: from VPC to WC. While any form of improvement is beneficial, a jump of this magnitude in so many patients is extremely encouraging. Thirty percent of the patients had no change in level of control. Of these, 14% were WC, so it would be hoped that no change would occur. Eleven patients remained at suboptimal control. The most concerning control data were those patients who lost control of their asthma during the 2-year period.
Chronic nonadherence from a select number of clinic patients seemed to be a major problem. Thirty-one ED visits were from 22 patients, and the 8 admissions were from 7 patients. Of the 22 ED patients, 82% had poor adherence to asthma medications. The hospital data were similar with 6 out of the total 7 (86%) clinic patients reporting poor medication adherence. Additionally, the majority of patients with a decrease in level of control since enrolling in the clinic had a history of poor medication adherence (4 of 7 patients).
In rating the level of asthma care, patients indicated they received the same level of care after enrollment as they did before enrollment. Most of the care given before the clinic was by primary care providers (PCPs), the ED, and urgent care providers. Since the patients rated the level of care equal, it would suggest that pharmacists were providing the same level of care as were these providers, at least from a patient standpoint. Overall, patients were satisfied with their level of control. Most patients were satisfied at enrollment and did not have a change of opinion throughout the study period, and a large number showed increased satisfaction. The patients who showed a decrease in satisfaction of asthma control were those patients who also had no improvement in actual control. Most of these patients stayed at the VPC level. About half these same patients had a history of noncompliance.
There is significant concern regarding those patients who continue to believe they are better controlled than what the guidelines indicate. Sixteen patients moved from VPC to NWC per the guidelines. Thirteen of these patients now believe that their asthma is WC. This belief places the patients at risk for a severe asthma exacerbation. Patients who believe they are WC may be less likely to self-medicate with albuterol or seek medical help during the initial stages of an exacerbation. These patients will need further education to bring their personal perceptions and actual asthma control together.
Conclusions
Based on clinical results it seems that the NNMC Adult Asthma Clinic has made a positive impact on asthma care. Additionally, significant reduction in the financial burden to the facility is achievable. The results, both clinically and statistically significant, indicate the impact a specialty clinic can provide. Specialty clinics, pharmacy or otherwise, have a history of providing positive outcomes.
As previously noted, no confounding variables were included in the data analysis, which could bias the results, even though data for the same time frame from separate years will reduce some errors. However, there will always be a difference in pollen counts, outbreaks (ie, influenza), temperature changes, and so forth. Such variables should be reduced but not removed completely, based on this performance improvement design. If any of these variables were significantly different, it could alter the results, so a potential weakness is present in this study.
Probably the most important mechanism for the success of the clinic is education. Each visit is set at 30-minute appointments (1 hour for new patients), allowing for a significant amount of time that can be spent on education topics, including pathophysiology, trigger avoidances, and medication use. Patients are asked to bring their medications to the clinic and demonstrate inhaler technique at every visit. Patients who do not bring their inhalers to the clinic will have them filled at the clinic and given to them for demonstration. This type of show-and-tell education allows clinic providers to correct improper inhaler technique immediately. Having patients actually use their medication seems to influence the patient’s inhaler mechanics to a greater extent than does demonstration with a placebo.
In the eyes of the clinic provider, it is important for patients to understand the basic pathophysiology of the disease. The better understanding patients have of a disease, the better they can take part in the treatment. Since the clinic actively engages patients in education topics, it brings patients into an active role in the treatment. As mentioned, the inhaler technique seems to be the most effective first step. However, as patients gain trust in clinic providers due to significant improvement in symptoms secondary to inhaler technique, this trust leads to a dialogue about pathophysiology and triggers.
Another key component in the clinic success is the nature of the clinic itself. Providers in the clinic focus on only 1 disease and the guidelines to treat that disease. Therefore, providers in the clinic are trained to be extremely familiar with the treatment of asthma. This is not to imply that a patient’s PCP or usual care provider is unfamiliar with the guidelines. It simply means that specialty care involves an extra time commitment to a specific disease. Each clinic provider must attain a high level of asthma knowledge before consideration as a full-time provider. Pharmacists are encouraged to sit for the Certified Asthma Educators examination, Board Certified Pharmacotherapy Specialist examination, and/or obtain the Indian Health Service National Clinical Pharmacy Specialist certification.
Although the clinic has moved in the right direction, there are still several patients who have not had any improvement since being referred to the clinic. These patients have refractory asthma (ie, step 6) and are not able to be treated at this facility, continued poor medication adherence, or do not have asthma at all. These patients will be flagged and will be evaluated on a case-by-case basis.
In conclusion, the clinic has begun to achieve what it was intended to do: improve asthma control, reduce patient burden on ED staff, and decrease financial burden to the facility. Additionally, there is improvement in the satisfaction of the asthma care and a trend toward the patients’ perception of asthma control agreeing with medical guidelines. These findings further support the use of pharmacists in the role as provider for the management of chronic diseases.
Acknowledgements
Shail Mehta, MD, is an internal medicine provider at the NNMC. He attended the University of Pittsburgh School of Medicine in Pennsylvania and completed a residency in internal medicine at the University of Michigan in Ann Arbor. Dr. Mehta is certified with the American Board of Internal Medicine.
Erica Markovitz, MD, is an internal medicine provider at the NNMC. She attended the University of Miami School of Medicine in Florida and completed a residency at the University of Michigan. Dr. Markovitz is certified with the American Board of Internal Medicine and the American Board of Pediatrics.
Thad Koppenhafer, PharmD, is the director of pharmacy at the NNMC and the area pharmacy consultant for the Navajo Area of the IHS. He is a member of the American Society of Health-Systems Pharmacists.
CAPT Mark Strong, PharmD, MT (ASCP) is a senior supervisory pharmacist with the U.S. Public Health Commissioned Corps and is assigned to the IHS. He is currently the chief of outpatient pharmacy services at the NNMC.
CDR Clint Krestel, PharmD, is the assistant chief of pharmacy responsible for Inpatient Pharmacy Services. His professional memberships currently include the American College of Clinical Pharmacy, the American Society of Health-System Pharmacists, and the Commissioned Officers Association.
Author disclosures
The author reports no actual or potential conflicts of interest with regard to this article.
Disclaimer
The opinions expressed herein are those of the author and do not necessarily reflect those of Federal Practitioner, Frontline Medical Communications Inc., the U.S. Government, or any of its agencies. This article may discuss unlabeled or investigational use of certain drugs. Please review complete prescribing information for specific drugs or drug combinations—including indications, contraindications, warnings, and adverse effects—before administering pharmacologic therapy to patients.
1. Moorman JE, Akinbami LJ, Bailey CM, et al. National surveillance of asthma: United States, 2001-2010. Centers for Disease Control and Prevention Website. National Center for Health Statistics. http://www.cdc.gov/nchs/data/series/sr_03/sr03_035.pdf. Accessed March 10, 2014. Vital Health Stat. 2012;3(35):1-67.
2. National Asthma Control Program. Asthma’s impact on the nation. Data from the CDC National Asthma Control Program. Centers for Disease Control and Prevention Website. http://www.cdc.gov/asthma/impacts_nation/asthmafactsheet.pdf. Accessed March 10, 2014.
3. Schappert AM, Rechtsteiner EA. Ambulatory medical care utilization estimates for 2007. National Center for Health Statistics. Centers for Disease Control and Prevention Website. http://www.cdc.gov/nchs/data/series/sr_13/sr13_169.pdf. Accessed March 10, 2014. Vital Health Stat. 2011;13(169):1-38.
4. Kochanek KD, Xu J, Murphy SL, Miniño AM, Kung H-C. Deaths: Final data for 2009. Centers for Disease Control and Prevention Website. National Center for Health Statistics. http://www.cdc.gov/nchs/data/nvsr/nvsr60/nvsr60_03.pdf. Accessed March 10, 2014. Natl Vital Statistics Rep. 2011;60(3):1-117.
5. Barnes PM, Adams PF, Powell-Griner E. Health characteristics of the American Indian or Alaska Native adult population: United States, 2004-2008. Centers for Disease Control and Prevention Website. National Center for Health Statistics. http://www.cdc.gov/nchs/data/nhsr/nhsr020.pdf. Accessed March 10, 2014. Natl Health Stat Report. 2010;20:1-23.
6. Garwood CL, Dumo P, Baringhaus SN, Laban KM. Quality of anticoagulation care in patients discharged from a pharmacist-managed anticoagulation clinic after stabilization of warfarin therapy. Pharmacotherapy. 2008;28(1):20-26.
7. Gray DR, Garabedian-Ruffalo SM, Chretien SD. Cost-justification of a clinical pharmacist-managed anticoagulation clinic. Ann Pharmacother. 2007;41(3):496-501.
8. Ernst ME, Brandt KB. Evaluation of 4 years of clinical pharmacist anticoagulation case management in a rural, private physician office. J Am Pharm Assoc. 2003;43(5):630-636.
9. Poon IO, Lal L, Brown EN, Braun UK. The impact of pharmacist-managed oral anticoagulation therapy in older veterans. J Clin Pharm Ther. 2007;32(1):21-29.
10. Dager WE, Branch JM, King JH, et al. Optimization of inpatient warfarin therapy: Impact of daily consultation by a pharmacist-managed anticoagulation service. Ann Pharmacother. 2000;34(5):567-572.
11. Morello CM, Zadvorny EB, Cording MA, Suemoto RT, Skog J, Harari A. Development and clinical outcomes of pharmacist-managed diabetes care clinics. Am J Health Syst Pharm. 2006;63(14):1325-1331.
12. Lowey A, Moore S, Norris C, Wright D, Silcock J, Hammond P. The cost-effectiveness of pharmacist-led treatment of cardiac risk in patients with type 2 diabetes. Pharm World Sci. 2007;29(5):541-545.
13. Erhun WO, Agbani EO, Bolaji EE. Positive benefits of a pharmacist-managed hypertension clinic in Nigeria. Public Health. 2005;119(9):792-798.
14. Hatoum HT, Witte KW, Hutchinson RA. Patient care contributions of clinical pharmacists in four ambulatory care clinics. Hosp Pharm. 1992;27(3):203-206, 208-209.
15. Pauley TR, Magee MJ, Cury JD. Pharmacist-managed, physician-directed asthma management program reduces emergency department visits. Ann Pharmacother. 1995;29(1):5-9.
16. Nack JA. Homecare management of the asthma patient. U.S. Pharmacist. 1998;23(7). http://legacy.uspharmacist.com/oldformat.asp?url=newlook/file/Home/ACF2FEE.cfm&pub_id=8&article_id=127. Accessed March 10, 2014.
17. Chan AL, Wang HY. Pharmacoeconomic assessment of clinical pharmacist interventions for patients with moderate to severe asthma in outpatient clinics: Experience in Taiwan. Clin Drug Investig. 2004;24(10):603-609.
18. Barbanel D, Eldridge S, Griffiths C. Can a self-management programme delivered by a community pharmacist improve asthma control? A randomised trial. Thorax. 2003;58(10):851-854.
19. U.S. Department of Health and Human Services, National Institutes of Health, National Heart Lung and Blood Institute. National Asthma Education and Prevention Program, Expert Panel 3. Guidelines for the Diagnosis and Management of Asthma. Summary Report 2007. Bethesda, MD: National Institutes of Health; 2007. NIH publication Number 0805846.
20. Stanford R, McLaughlin T, Okamoto LJ. The cost of asthma in the emergency department and hospital. Am J Respir Crit Care Med. 1999;160(1):211-215.
21. Williams RM. The cost of visits to emergency departments. N Engl J Med. 1996;334(10):642-646.
According to the Centers for Disease Control and Prevention, asthma prevalence in the U.S. increased between 2001 and 2010 and is now at its highest level. In 2010, about 25.7 million people had asthma: 18.7 million adults (8%) and 7 million children (9%). Despite well-known treatment options, asthma continues to be poorly controlled. In 2009 there were 1.6 million emergency department (ED) visits, 497,300 hospitalizations, and 3,404 deaths related to asthma. Additionally, in 2008 the disease affected attendance at school and work with 10.5 million and 14.2 million missed school days and workdays, respectively.1-5
The American Indian and Alaska Native (AIAN) populations have not escaped the realities of asthma. According to a 2010 report of the National Center for Health Statistics, AIAN populations also have a high prevalence of asthma at 14.2%. This percentage is much higher than that of the general population.1
Over the past decade, pharmacists have expanded their roles from educators to clinicians with prescriptive authority in various settings. The greatest success has been seen with anticoagulation clinics, both clinically and financially.6-10 Pharmacists have also demonstrated positive outcomes when involved in cardiovascular clinics.11-13
Additionally, pharmacists have been involved with asthma clinics as both educators and prescribers with favorable results clinically and economically.14-16 A study from Taiwan done by Chan and Wang indicated that pharmacist asthma interventions in an outpatient setting improved the quality of care, reduced cost, and relieved stress on general medical resources.17 Another study indicated that education by a community pharmacist can improve asthma control in a self-managed program.18
In 2007, an asthma medication use evaluation (MUE) was completed at the Northern Navajo Medical Center (NNMC) in Shiprock, New Mexico. The results of the MUE concluded that asthma statistics for the local population differed from that of the national data (Table 1). Overall, the Navajo population served by the NNMC had a lower incidence of asthma but a higher rate of hospital admissions and ED visits.
One of the primary focus points for the MUE was short-acting beta agonist (SABA) refills. According to national guidelines, using a SABA 2 or more times per week (not for exercise-induced bronchospasms) would indicate a patient was not well controlled.19 This use equates to 2 refills of SABA per year. The MUE found that 51% of patients had ≥ 3 refills per year, and 38% of patients had 4 or more refills per year. Based on asthma prevalence and SABA history, it was determined that a specialty clinic could have a positive impact on asthma care.
This study addresses how a specialized adult asthma clinic managed by pharmacists with physician oversight can improve asthma outcomes. Since January 2010, the NNMC has had a program in place and has experienced a concurrent substantial drop in asthma-related ED visits and admissions, an improved level of control, and a decreased cost burden to the facility.
Methods
A retrospective chart review was completed on all patients currently enrolled in the clinic. The Resource and Patient Management System Visit General Retrieval (RPMS VGEN), Electronic Health Record, and the asthma clinic database were used to evaluate patients. The evaluation period began January 1, 2010, and ended December 31, 2011.
Performance improvement inclusion criteria for clinic patients were based on active status in the clinic. Active patients were defined as patients with at least 2 clinic visits and a clinic visit within 3 months of an ED visit or admission. The 3-month cutoff was chosen based on several criteria. First, most patients referred to the clinic were categorized as either not well controlled (NWC) or very poorly controlled (VPC) and required at least a 2- to 4-week follow-up based on guidelines. Second, patients who were categorized as well controlled (WC) were scheduled for clinic visits every 3 months for regular follow-up.
Using all ICD-9 codes for asthma, RPMS VGEN was used to find the number of ED visits and admissions that occurred with asthma as the primary diagnosis from both clinic and nonclinic patients. The inclusion criteria were then applied to the clinic patients, and those not meeting these criteria were returned to the nonclinic pool of patients.
Cost analysis was evaluated based on the results of a random selection of 20 patients from 2009 and 2010 ED and hospital visits at the NNMC. These numbers were averaged to determine ED and admission costs. Length of admission stay was determined from a RPMS VGEN search for each clinic and nonclinic patient admission.
Determination of the level of control was based on the 2007 national asthma guidelines. The guidelines state that the level of control can be determined by either asthma symptoms or by peak flow evaluation.19 Because of the language barrier that sometimes arises with the treated population, the use of symptom-based evaluation has been observationally superior to providing peak flow meters for home use. At each visit, patients were interviewed using tables from the asthma guidelines. Table 2 is an abbreviated portion of the guidelines representing the assessment tool used by the clinic. The level of control was determined by selecting the column with the highest severity of impairment.19
All patients seen at the clinic were tracked in a database, and their current level of control was documented at each visit. To determine the level of control, the database was reviewed, and those patients with > 1 visit were included in the analysis. The levels of control from the first visit to the most recent visit were compared.
Patient surveys were completed at each visit. These surveys included questions to assist the pharmacy provider in classifying the level of control, patient satisfaction with asthma care, and patient perception of asthma control. Approval from the Navajo Area Institutional Review Board was obtained for data publication. Odds ratios were used to determine the impact of the clinic, using a 95% confidence interval.
Results
For the review period, 2,997 patients were coded as having some form of asthma, resulting in 12,739 asthma visits within the medical center.
ED Visits and Hospital Admissions
Of these 2,997 patients, 301 visited the ED between 2010 and 2011 with 22 being active asthma clinic patients. These 22 active clinic patients accounted for 31 ED visits. The remaining 279 patients had 428 visits with a total of 459 ED visits from clinic and nonclinic patients. Sixty patients were hospitalized for asthma with 7 of them active asthma clinic patients. The 7 clinic patients admitted accounted for 8 admissions. There is a statistical significance in total ED visits and admissions as well as for individual patients (Table 3).
To determine the clinic impact, a 2-year analysis of patient pre- and postclinic enrollment was done. Search criteria for RPMS VGEN were identical to the study period search except for dates. Those patients enrolled in the clinic during the study period (2010-2011) were evaluated for the 2 years before the clinic startup (2008-2009). The results indicated a decrease in both ED visits and hospital admissions related to asthma for clinic patients (Table 4).
Cost Data and Length of Stay
Emergency department and hospital admissions costs were determined from an earlier performance improvement review of the clinic. The median cost of an ED visit was $373 with a range from $228 to $910. The cost range represented the severity of the asthma exacerbation being treated. This cost range was similar to published data that reported a cost range from $234 to $400 with an average of $339 per visit.20,21 Hospital costs (including ED visit) per day ranged from $528 to $2,470 with a median of $1,199 per day. Table 5 shows the calculated actual annual cost savings for patients pre- and postenrollment. The cost difference between clinic and nonclinic patients from 2010 to 2011 was calculated to be $111,000 annually (data not shown). The median length of the hospital stay for clinic and nonclinic patients was 2 days (range, 1-10 and 1-7 days, respectively). The national average was 4.3 days.
From 2008 to 2009, there were 123 ED visits and 20 hospital admissions related to asthma of patients who would later be enrolled in the asthma clinic study. From 2010 to 2011 there were 31 ED visits and 8 hospital asthma admissions
(Table 4). These data were used to determine the potential cost savings for the clinic (Table 5). Based on current reductions, the potential annual cost savings was $85,405 if all adult asthma patients were seen in the pharmacy managed clinic (Table 6).
Level of Control
A total of 66 patients had 3 or more visits to the asthma clinic. Of these patients, 30% had no change in control, 60% showed some measure of improvement, and 11% had a decrease in control based on the national guidelines (Table 7).
Patient Perception
At each visit, the patient’s current perception of asthma control, satisfaction with control, and clinic grade related to asthma care was determined. Of the 66 patients with 3 or more visits, a large portion of the questionnaires were missing when the data were collected. Table 8 shows the results of the data for patients with 3 more visits and 2 completed forms from different visits. These data points may not have been from the first or most recent visits.
From earliest to most recent visit, patient perception of asthma control compared with clinical guidelines improved moderately. Sixteen patients had a clinical improvement from VPC to NWC with 13 (81%) believing their symptoms were now WC.
Discussion
The results of this performance improvement evaluation are encouraging. However, not all positive data may be directly attributed to the asthma clinic. The statistical analysis for this study does not seek to remove confounding variables. Without removing potential confounding variables, questions remain about the accuracy of the outcome. However, combining the statistical data in Table 3 and the 2-year comparative data in Table 4, strong evidence exists that a positive impact from the clinic had occurred even in the presence of potential confounding variables.
The financial impact of asthma was evident with the 2010 to 2011 cost for ED visits and hospital admissions at $265,928. Asthma clinic patients made up only 8% ($21,155) of this cost and yielded an annual cost savings of $24,352. Obviously, the 8% was a direct result of the number of nonclinic vs clinic patients. However, the cost savings of $24,352 was independent of patient numbers and was calculated directly from patients pre- and postenrollment. The potential savings if all current nonclinic patients were enrolled in the clinic was $85,405 annually.
The savings was only direct cost and did not include indirect costs related to asthma, such as lost work/school days, impact on employer productivity, and so forth. This was calculated after applying the 75% and 60% reduction in ED and hospital costs. As more patients are enrolled in the clinic, the potential cost could become an actual cost savings, based on the assumption that the 75% and 60% reduction stays constant (Figure). Over 1 year, the actual savings of the clinic makes up for 31% of the current ED visits from nonclinic patients. With the addition of the potential savings, the clinic could almost negate the money that is currently spent on asthma care.
Clinic data indicated a positive impact on level of control. Of those patients with 3 or more visits to the asthma clinic, 59% had some form of improvement. Fifteen of those patients (23%) had the biggest improvement: from VPC to WC. While any form of improvement is beneficial, a jump of this magnitude in so many patients is extremely encouraging. Thirty percent of the patients had no change in level of control. Of these, 14% were WC, so it would be hoped that no change would occur. Eleven patients remained at suboptimal control. The most concerning control data were those patients who lost control of their asthma during the 2-year period.
Chronic nonadherence from a select number of clinic patients seemed to be a major problem. Thirty-one ED visits were from 22 patients, and the 8 admissions were from 7 patients. Of the 22 ED patients, 82% had poor adherence to asthma medications. The hospital data were similar with 6 out of the total 7 (86%) clinic patients reporting poor medication adherence. Additionally, the majority of patients with a decrease in level of control since enrolling in the clinic had a history of poor medication adherence (4 of 7 patients).
In rating the level of asthma care, patients indicated they received the same level of care after enrollment as they did before enrollment. Most of the care given before the clinic was by primary care providers (PCPs), the ED, and urgent care providers. Since the patients rated the level of care equal, it would suggest that pharmacists were providing the same level of care as were these providers, at least from a patient standpoint. Overall, patients were satisfied with their level of control. Most patients were satisfied at enrollment and did not have a change of opinion throughout the study period, and a large number showed increased satisfaction. The patients who showed a decrease in satisfaction of asthma control were those patients who also had no improvement in actual control. Most of these patients stayed at the VPC level. About half these same patients had a history of noncompliance.
There is significant concern regarding those patients who continue to believe they are better controlled than what the guidelines indicate. Sixteen patients moved from VPC to NWC per the guidelines. Thirteen of these patients now believe that their asthma is WC. This belief places the patients at risk for a severe asthma exacerbation. Patients who believe they are WC may be less likely to self-medicate with albuterol or seek medical help during the initial stages of an exacerbation. These patients will need further education to bring their personal perceptions and actual asthma control together.
Conclusions
Based on clinical results it seems that the NNMC Adult Asthma Clinic has made a positive impact on asthma care. Additionally, significant reduction in the financial burden to the facility is achievable. The results, both clinically and statistically significant, indicate the impact a specialty clinic can provide. Specialty clinics, pharmacy or otherwise, have a history of providing positive outcomes.
As previously noted, no confounding variables were included in the data analysis, which could bias the results, even though data for the same time frame from separate years will reduce some errors. However, there will always be a difference in pollen counts, outbreaks (ie, influenza), temperature changes, and so forth. Such variables should be reduced but not removed completely, based on this performance improvement design. If any of these variables were significantly different, it could alter the results, so a potential weakness is present in this study.
Probably the most important mechanism for the success of the clinic is education. Each visit is set at 30-minute appointments (1 hour for new patients), allowing for a significant amount of time that can be spent on education topics, including pathophysiology, trigger avoidances, and medication use. Patients are asked to bring their medications to the clinic and demonstrate inhaler technique at every visit. Patients who do not bring their inhalers to the clinic will have them filled at the clinic and given to them for demonstration. This type of show-and-tell education allows clinic providers to correct improper inhaler technique immediately. Having patients actually use their medication seems to influence the patient’s inhaler mechanics to a greater extent than does demonstration with a placebo.
In the eyes of the clinic provider, it is important for patients to understand the basic pathophysiology of the disease. The better understanding patients have of a disease, the better they can take part in the treatment. Since the clinic actively engages patients in education topics, it brings patients into an active role in the treatment. As mentioned, the inhaler technique seems to be the most effective first step. However, as patients gain trust in clinic providers due to significant improvement in symptoms secondary to inhaler technique, this trust leads to a dialogue about pathophysiology and triggers.
Another key component in the clinic success is the nature of the clinic itself. Providers in the clinic focus on only 1 disease and the guidelines to treat that disease. Therefore, providers in the clinic are trained to be extremely familiar with the treatment of asthma. This is not to imply that a patient’s PCP or usual care provider is unfamiliar with the guidelines. It simply means that specialty care involves an extra time commitment to a specific disease. Each clinic provider must attain a high level of asthma knowledge before consideration as a full-time provider. Pharmacists are encouraged to sit for the Certified Asthma Educators examination, Board Certified Pharmacotherapy Specialist examination, and/or obtain the Indian Health Service National Clinical Pharmacy Specialist certification.
Although the clinic has moved in the right direction, there are still several patients who have not had any improvement since being referred to the clinic. These patients have refractory asthma (ie, step 6) and are not able to be treated at this facility, continued poor medication adherence, or do not have asthma at all. These patients will be flagged and will be evaluated on a case-by-case basis.
In conclusion, the clinic has begun to achieve what it was intended to do: improve asthma control, reduce patient burden on ED staff, and decrease financial burden to the facility. Additionally, there is improvement in the satisfaction of the asthma care and a trend toward the patients’ perception of asthma control agreeing with medical guidelines. These findings further support the use of pharmacists in the role as provider for the management of chronic diseases.
Acknowledgements
Shail Mehta, MD, is an internal medicine provider at the NNMC. He attended the University of Pittsburgh School of Medicine in Pennsylvania and completed a residency in internal medicine at the University of Michigan in Ann Arbor. Dr. Mehta is certified with the American Board of Internal Medicine.
Erica Markovitz, MD, is an internal medicine provider at the NNMC. She attended the University of Miami School of Medicine in Florida and completed a residency at the University of Michigan. Dr. Markovitz is certified with the American Board of Internal Medicine and the American Board of Pediatrics.
Thad Koppenhafer, PharmD, is the director of pharmacy at the NNMC and the area pharmacy consultant for the Navajo Area of the IHS. He is a member of the American Society of Health-Systems Pharmacists.
CAPT Mark Strong, PharmD, MT (ASCP) is a senior supervisory pharmacist with the U.S. Public Health Commissioned Corps and is assigned to the IHS. He is currently the chief of outpatient pharmacy services at the NNMC.
CDR Clint Krestel, PharmD, is the assistant chief of pharmacy responsible for Inpatient Pharmacy Services. His professional memberships currently include the American College of Clinical Pharmacy, the American Society of Health-System Pharmacists, and the Commissioned Officers Association.
Author disclosures
The author reports no actual or potential conflicts of interest with regard to this article.
Disclaimer
The opinions expressed herein are those of the author and do not necessarily reflect those of Federal Practitioner, Frontline Medical Communications Inc., the U.S. Government, or any of its agencies. This article may discuss unlabeled or investigational use of certain drugs. Please review complete prescribing information for specific drugs or drug combinations—including indications, contraindications, warnings, and adverse effects—before administering pharmacologic therapy to patients.
1. Moorman JE, Akinbami LJ, Bailey CM, et al. National surveillance of asthma: United States, 2001-2010. Centers for Disease Control and Prevention Website. National Center for Health Statistics. http://www.cdc.gov/nchs/data/series/sr_03/sr03_035.pdf. Accessed March 10, 2014. Vital Health Stat. 2012;3(35):1-67.
2. National Asthma Control Program. Asthma’s impact on the nation. Data from the CDC National Asthma Control Program. Centers for Disease Control and Prevention Website. http://www.cdc.gov/asthma/impacts_nation/asthmafactsheet.pdf. Accessed March 10, 2014.
3. Schappert AM, Rechtsteiner EA. Ambulatory medical care utilization estimates for 2007. National Center for Health Statistics. Centers for Disease Control and Prevention Website. http://www.cdc.gov/nchs/data/series/sr_13/sr13_169.pdf. Accessed March 10, 2014. Vital Health Stat. 2011;13(169):1-38.
4. Kochanek KD, Xu J, Murphy SL, Miniño AM, Kung H-C. Deaths: Final data for 2009. Centers for Disease Control and Prevention Website. National Center for Health Statistics. http://www.cdc.gov/nchs/data/nvsr/nvsr60/nvsr60_03.pdf. Accessed March 10, 2014. Natl Vital Statistics Rep. 2011;60(3):1-117.
5. Barnes PM, Adams PF, Powell-Griner E. Health characteristics of the American Indian or Alaska Native adult population: United States, 2004-2008. Centers for Disease Control and Prevention Website. National Center for Health Statistics. http://www.cdc.gov/nchs/data/nhsr/nhsr020.pdf. Accessed March 10, 2014. Natl Health Stat Report. 2010;20:1-23.
6. Garwood CL, Dumo P, Baringhaus SN, Laban KM. Quality of anticoagulation care in patients discharged from a pharmacist-managed anticoagulation clinic after stabilization of warfarin therapy. Pharmacotherapy. 2008;28(1):20-26.
7. Gray DR, Garabedian-Ruffalo SM, Chretien SD. Cost-justification of a clinical pharmacist-managed anticoagulation clinic. Ann Pharmacother. 2007;41(3):496-501.
8. Ernst ME, Brandt KB. Evaluation of 4 years of clinical pharmacist anticoagulation case management in a rural, private physician office. J Am Pharm Assoc. 2003;43(5):630-636.
9. Poon IO, Lal L, Brown EN, Braun UK. The impact of pharmacist-managed oral anticoagulation therapy in older veterans. J Clin Pharm Ther. 2007;32(1):21-29.
10. Dager WE, Branch JM, King JH, et al. Optimization of inpatient warfarin therapy: Impact of daily consultation by a pharmacist-managed anticoagulation service. Ann Pharmacother. 2000;34(5):567-572.
11. Morello CM, Zadvorny EB, Cording MA, Suemoto RT, Skog J, Harari A. Development and clinical outcomes of pharmacist-managed diabetes care clinics. Am J Health Syst Pharm. 2006;63(14):1325-1331.
12. Lowey A, Moore S, Norris C, Wright D, Silcock J, Hammond P. The cost-effectiveness of pharmacist-led treatment of cardiac risk in patients with type 2 diabetes. Pharm World Sci. 2007;29(5):541-545.
13. Erhun WO, Agbani EO, Bolaji EE. Positive benefits of a pharmacist-managed hypertension clinic in Nigeria. Public Health. 2005;119(9):792-798.
14. Hatoum HT, Witte KW, Hutchinson RA. Patient care contributions of clinical pharmacists in four ambulatory care clinics. Hosp Pharm. 1992;27(3):203-206, 208-209.
15. Pauley TR, Magee MJ, Cury JD. Pharmacist-managed, physician-directed asthma management program reduces emergency department visits. Ann Pharmacother. 1995;29(1):5-9.
16. Nack JA. Homecare management of the asthma patient. U.S. Pharmacist. 1998;23(7). http://legacy.uspharmacist.com/oldformat.asp?url=newlook/file/Home/ACF2FEE.cfm&pub_id=8&article_id=127. Accessed March 10, 2014.
17. Chan AL, Wang HY. Pharmacoeconomic assessment of clinical pharmacist interventions for patients with moderate to severe asthma in outpatient clinics: Experience in Taiwan. Clin Drug Investig. 2004;24(10):603-609.
18. Barbanel D, Eldridge S, Griffiths C. Can a self-management programme delivered by a community pharmacist improve asthma control? A randomised trial. Thorax. 2003;58(10):851-854.
19. U.S. Department of Health and Human Services, National Institutes of Health, National Heart Lung and Blood Institute. National Asthma Education and Prevention Program, Expert Panel 3. Guidelines for the Diagnosis and Management of Asthma. Summary Report 2007. Bethesda, MD: National Institutes of Health; 2007. NIH publication Number 0805846.
20. Stanford R, McLaughlin T, Okamoto LJ. The cost of asthma in the emergency department and hospital. Am J Respir Crit Care Med. 1999;160(1):211-215.
21. Williams RM. The cost of visits to emergency departments. N Engl J Med. 1996;334(10):642-646.