User login
Implementation of a Protocol for Management of Febrile Neutropenia in the Emergency Department at Veteran Health Indiana
Febrile neutropenia (FN) is a life-threatening oncologic emergency requiring timely evaluation and treatment. Chemotherapy-induced neutropenia is a major risk for life-threatening infection, and fever may be the only sign.1,2 Unrecognized fever can progress to sepsis and may result in increased morbidity and mortality. FN is defined as the presence of fever with a single temperature of ≥ 38.3 °C or a sustained temperature > 38 °C sustained over 1 hour with an absolute neutrophil count (ANC) of < 500 cells/mm3 or < 1000 cells/mm3 and expected to decrease to < 500 within 48 hours.2,3 It is critical to quickly identify these patients on presentation to the emergency department (ED) and take appropriate steps to initiate treatment as soon as possible. To streamline care, the American Society of Clinical Oncology (ASCO) recommends that laboratory assessments be initiated within 15 minutes of triage and empiric antibiotic therapy be administered within 1 hour.2
In alignment with the Infectious Disease Society of America (IDSA) guidelines, the National Comprehensive Cancer Network (NCCN) highlights the importance of the initial assessment of fever and neutropenia and presents available treatment options for both inpatient and outpatient management of FN.1 Once patients are identified, the appropriate laboratory tests and physical assessments should be initiated immediately. These tests include a complete blood count with differential, complete metabolic panel (CMP), and blood cultures from 2 separate IV sites.1-3 The guidelines offer additional suggestions for cultures and radiographic assessments that may be completed based on clinical presentation.
Several available studies provide insight into methods of protocol creation and possible barriers to timely management. Previous research showed that an FN protocol for pediatric oncology patients aimed at antibiotic administration within 1 hour showed significant improvement from 35.0% to 55.4% of patients being treated on time.3,4 Prescribers became more comfortable in using the protocol, and timing improved as the study progressed. Barriers noted were inconsistent ED triage, rotating ED staff, and limited understanding of the protocol.3 Yoshida and colleagues worked with the same population. Over the course of 1 year, 60% of patients were receiving antibiotics within 1 hour. The mean time decreased from 83 to 65 minutes, which the study investigators noted would continue to decrease with increased protocol comfort and use.5 Mattison and colleagues used nursing staff to identify patients with FN and begin antibiotic treatment. On triage, nurses took note of a temperature of > 38 °C or a sepsislike clinical picture that initiated their antibiotic proforma.4,6 This resulted in 48.1% of patients receiving antibiotics within 15 minutes and 63.3% overall within 30 minutes of arrival.5 Other barriers to consider are ED crowding and the admission of higher acuity patients, which may delay the treatment of patients with FN.
The US Department of Veterans Affairs (VA) Richard L. Roudebush VA Medical Center (RLRVAMC) in Indianapolis, Indiana is a level 1A facility serving about 62,000 veterans annually and more than 13,000 unique veterans visiting the ED. RLRVAMC ED staff rotate often so the creation of a process will facilitate appropriate treatment as quickly as possible. The purpose of this protocol was to improve the mean time from triage to administration of antibiotics for patients with FN presenting to the ED.
Implementation
To quantify the perceived delay in antibiotic prescribing, a pre- and postprotocol retrospective chart review of patients who presented with FN to the RLRVAMC ED was conducted. Patients were identified through the electronic health record (EHR) based on 3 criteria: recorded/reported fever as defined above, ANC < 1000 cells/mm3, and administration of cancer treatment (IV and oral) within 4 weeks. The data collected in the postimplementation phase were identical to the pre-implementation phase. This included timing of blood cultures, choice/appropriateness of antibiotics based on guidelines, and length of admission. The pre-implementation period started on August 1, 2018, and ended on August 1, 2019, to allow for an adequate pre-implementation sample size. The protocol was then implemented on October 1, 2019, and data collection for the postimplementation phase began on October 1,2019, and ended on October 1, 2020.
The protocol was accompanied by EHR order sets initiated by both nurses and health care practitioners (HCPs), including physicians, nurse practitioners, and physician assistants. The nursing order set consisted of vitals and appropriate laboratory monitoring, and the practitioner order set housed medication orders and additional clinical monitoring for more patient-specific scenarios. On identification of at-risk patients, the nursing staff could initiate the neutropenic fever protocol without consulting an HCP. The patient was then assigned a higher acuity rank, and the HCP was tasked with seeing the patient immediately. In conjunction with a complete physical assessment, the HCP ordered appropriate antibiotics through the designated order set to streamline antibiotic selection. Antibiotic options included cefepime or piperacillin-tazobactam, and vancomycin when clinically indicated. Alternatives for patients allergic to penicillin also were available. The protocol intended to streamline workup and antibiotic selection but was not designed as a substitute for solid clinical decision making and complete assessment on behalf of the HCP; therefore, additional workup may have been necessary and documented in the EHR.
Findings
This patient population comprised 17 patients pre-implementation and 12 patients postimplementation, most of whom had solid tumor malignancies (88.2% and 83.3%, respectively) receiving platinum, taxane, or antimetabolite-based chemotherapy. In the pre-implementation group, most patients (70.5%) coming through the ED were treated with palliative intent. Only 25% of these received any prophylactic granulocyte-colony stimulating factor (G-CSF) based on risk for FN. The mean time from triage to the first dose of antibiotics decreased from 3.3 hours before protocol implementation to 2.3 hours after. Only 6% in the pre-implementation group compared with 17% in the postimplementation group received the first dose of antibiotics within the recommended 1-hour interval from triage. The most common antibiotics administered were cefepime and vancomycin. Eleven patients in each group (65% and 92%, respectively) were admitted to the inpatient service for further care, with 10 and 8 patients, respectively, experiencing a hospitalization > 72 hours. Of note, 41% of patients died pre-implementation vs 17% postimplementation.
Interpretation
The goal of this protocol was to optimize ED care of patients presenting with FN to better align with guideline-recommended time lines and antibiotics. The mean time from triage to administration of antibiotics decreased by 1.0 hour from the pre- to postimplementation phase, similar to the study by Mattison and colleagues.3 When removing an outlier from the postimplementation group, the mean time from triage to first dose further decreased to 1.8 hours. The percentage of patients receiving antibiotics within 1 hour of triage nearly tripled from 6% to 17%. Additionally, the percentage of patients empirically treated with appropriate antibiotics consistent with NCCN/ASCO/IDSA guidelines increased from 65% to 83%. Although goals for the optimization of care have not yet been reached, this protocol is the first step in the right direction.
Limitations
Several limitations and concerns arise when implementing a new protocol or workflow process. Overall, these limitations may contribute to delays, such as the willingness of team members to use an unfamiliar protocol or issues locating a new protocol. The nursing staff is challenged to triage patients quickly, which may add to an already busy environment. Frequent physician turnover may require more frequent education sessions. Also, a lag time between implementation and using the protocol may result in decreased protocol use during the designated postimplementation data collection phase.
On review, ED staff were excited to find a protocol that streamlined decision making and increased awareness for patients at risk. The COVID-19 pandemic may have been a confounder for the postimplementation phase. Data may have been skewed as some patients might have elected to stay at home to avoid potential COVID-19 exposure in the ED. Additionally, increased ED use by patients with COVID-19 may have resulted in longer wait times for an available bed, thereby minimizing the impact of the protocol on time from triage to administration of antibiotics. COVID-19 may also have contributed to postimplementation mortality. Of note, barcode medication administration (BCMA) was implemented in the ED in May 2019, which may account for undocumented delays in antibiotic administration as staff may have been unfamiliar with BCMA workflow.
Due to the retrospective nature of a chart review, the data rely on the timely input and accuracy of documented information. Data after the patient’s ED encounter (except inpatient hospitalization and deaths during the implementation period) were not collected due to the scope of the program being limited to the ED only. Last, this protocol was implemented at a single site, and the generalizability to implement the same protocol at other VA medical centers may be limited. After reaching out to other VA sites and several non-VA facilities, we were unable to find a site with a similar protocol or program emphasizing the importance of timely care, although there may have been established laboratory test and medication order sets within the EHR.
Future Direction
The newly established FN order sets will continue to streamline clinical decision making and antibiotic selection in this population. In our study, we learned that most patients coming through the ED were being treated with palliative intent. As a result, these patients also may have a higher risk for complications like FN. We hope to further analyze the impact on this group and consider the role of empiric dose reduction or increased G-CSF support to minimize FN.
More than half of the patients who were admitted to the inpatient service, remained in extended care for > 72 hours. Inpatient recovery time may cause delays in future cancer treatment cycles, dose reductions, and contribute to an overall decline in performance status. Six patients in the pre-implementation phase and 1 in the postimplementation phase were eligible for outpatient management per independent Multinational Association of Supportive Care in Cancer assessment. To increase comfort, a future goal would be to create an outpatient treatment order set on discharge from the ED to help identify and outline treatment options for low-risk patients. In addition to the ED, training staff in clinics with a similar protocol may enhance the identification of patients with FN. This may require a tailored protocol for this location using health technicians in taking vital signs before the HCP visit.
This protocol helped establish “code sepsis.” Code sepsis alerts are broadcast to alert pertinent members of the health care team to provide immediate medical attention to the veteran. Pharmacy can expedite the compounding of antibiotics and record review while radiology prioritizes the portable X-ray for quick and efficient imaging. The nursing team comes ready to administer antibiotics once cultures are drawn. The HCP's attention is focused on the physical examination to determine any additional steps/care that need to be accomplished. At our site, we plan to continue HCP, nursing, and other team member education on this oncologic emergency and the availability of a streamlined protocol. We would like to re-assess the data with a long team study now that the protocol has been in place for 3 years. We hope to continue to provide strong patient care with enhanced adherence to guidelines for patients with FN presenting to RLRVAMC.
Conclusions
Early identification and timely empiric antibiotic therapy are critical to improving outcomes for patients presenting to the ED with FN. The neutropenic fever protocol reduced time to antibiotics by about 1 hour with a higher percentage of patients receiving them in < 1 hour. Additional optimization of the order sets along with increased protocol comfort and staff education will help further reduce the time to antibiotic administration in alignment with guideline recommendations.
1. National Comprehensive Cancer Network. Prevention and Treatment of Cancer-Related Infections (Version 3.2022) Updated October 28, 2022. Accessed February 16, 2023. https://www.nccn.org/professionals/physician_gls/pdf/infections.pdf
2. Taplitz RA, Kennedy EB, Bow EJ, et al. Outpatient Management of Fever and Neutropenia in Adults Treated for Malignancy: American Society of Clinical Oncology and Infectious Diseases Society of America Clinical Practice Guideline Update. J Clin Oncol. 2018;36(14):1443-1453. doi:10.1200/JCO.2017.77.6211
3. Lyman GH, Rolston KV. How we treat febrile neutropenia in patients receiving cancer chemotherapy. J Oncol Pract. 2010;6(3):149-152. doi:10.1200/JOP.091092
4. Cohen C, King A, Lin CP, Friedman GK, Monroe K, Kutny M. Protocol for reducing time to antibiotics in pediatric patients presenting to an emergency department with fever and neutropenia: efficacy and barriers. Pediatr Emerg Care. 2016;32(11):739-745. doi:10.1097/PEC.0000000000000362
5. Yoshida H, Leger KJ, Xu M, et al. Improving time to antibiotics for pediatric oncology patients with suspected infections: an emergency department-based quality improvement intervention. Pediatr Emerg Care. 2018;34(1):47-52. doi:10.1097/PEC.0000000000001367 6. Mattison G, Bilney M, Haji-Michael P, Cooksley T. A nurse-led protocol improves the time to first dose intravenous antibiotics in septic patients post chemotherapy. Support Care Cancer. 2016;24(12):5001-5005. doi:10.1007/s00520-016-3362-4
Febrile neutropenia (FN) is a life-threatening oncologic emergency requiring timely evaluation and treatment. Chemotherapy-induced neutropenia is a major risk for life-threatening infection, and fever may be the only sign.1,2 Unrecognized fever can progress to sepsis and may result in increased morbidity and mortality. FN is defined as the presence of fever with a single temperature of ≥ 38.3 °C or a sustained temperature > 38 °C sustained over 1 hour with an absolute neutrophil count (ANC) of < 500 cells/mm3 or < 1000 cells/mm3 and expected to decrease to < 500 within 48 hours.2,3 It is critical to quickly identify these patients on presentation to the emergency department (ED) and take appropriate steps to initiate treatment as soon as possible. To streamline care, the American Society of Clinical Oncology (ASCO) recommends that laboratory assessments be initiated within 15 minutes of triage and empiric antibiotic therapy be administered within 1 hour.2
In alignment with the Infectious Disease Society of America (IDSA) guidelines, the National Comprehensive Cancer Network (NCCN) highlights the importance of the initial assessment of fever and neutropenia and presents available treatment options for both inpatient and outpatient management of FN.1 Once patients are identified, the appropriate laboratory tests and physical assessments should be initiated immediately. These tests include a complete blood count with differential, complete metabolic panel (CMP), and blood cultures from 2 separate IV sites.1-3 The guidelines offer additional suggestions for cultures and radiographic assessments that may be completed based on clinical presentation.
Several available studies provide insight into methods of protocol creation and possible barriers to timely management. Previous research showed that an FN protocol for pediatric oncology patients aimed at antibiotic administration within 1 hour showed significant improvement from 35.0% to 55.4% of patients being treated on time.3,4 Prescribers became more comfortable in using the protocol, and timing improved as the study progressed. Barriers noted were inconsistent ED triage, rotating ED staff, and limited understanding of the protocol.3 Yoshida and colleagues worked with the same population. Over the course of 1 year, 60% of patients were receiving antibiotics within 1 hour. The mean time decreased from 83 to 65 minutes, which the study investigators noted would continue to decrease with increased protocol comfort and use.5 Mattison and colleagues used nursing staff to identify patients with FN and begin antibiotic treatment. On triage, nurses took note of a temperature of > 38 °C or a sepsislike clinical picture that initiated their antibiotic proforma.4,6 This resulted in 48.1% of patients receiving antibiotics within 15 minutes and 63.3% overall within 30 minutes of arrival.5 Other barriers to consider are ED crowding and the admission of higher acuity patients, which may delay the treatment of patients with FN.
The US Department of Veterans Affairs (VA) Richard L. Roudebush VA Medical Center (RLRVAMC) in Indianapolis, Indiana is a level 1A facility serving about 62,000 veterans annually and more than 13,000 unique veterans visiting the ED. RLRVAMC ED staff rotate often so the creation of a process will facilitate appropriate treatment as quickly as possible. The purpose of this protocol was to improve the mean time from triage to administration of antibiotics for patients with FN presenting to the ED.
Implementation
To quantify the perceived delay in antibiotic prescribing, a pre- and postprotocol retrospective chart review of patients who presented with FN to the RLRVAMC ED was conducted. Patients were identified through the electronic health record (EHR) based on 3 criteria: recorded/reported fever as defined above, ANC < 1000 cells/mm3, and administration of cancer treatment (IV and oral) within 4 weeks. The data collected in the postimplementation phase were identical to the pre-implementation phase. This included timing of blood cultures, choice/appropriateness of antibiotics based on guidelines, and length of admission. The pre-implementation period started on August 1, 2018, and ended on August 1, 2019, to allow for an adequate pre-implementation sample size. The protocol was then implemented on October 1, 2019, and data collection for the postimplementation phase began on October 1,2019, and ended on October 1, 2020.
The protocol was accompanied by EHR order sets initiated by both nurses and health care practitioners (HCPs), including physicians, nurse practitioners, and physician assistants. The nursing order set consisted of vitals and appropriate laboratory monitoring, and the practitioner order set housed medication orders and additional clinical monitoring for more patient-specific scenarios. On identification of at-risk patients, the nursing staff could initiate the neutropenic fever protocol without consulting an HCP. The patient was then assigned a higher acuity rank, and the HCP was tasked with seeing the patient immediately. In conjunction with a complete physical assessment, the HCP ordered appropriate antibiotics through the designated order set to streamline antibiotic selection. Antibiotic options included cefepime or piperacillin-tazobactam, and vancomycin when clinically indicated. Alternatives for patients allergic to penicillin also were available. The protocol intended to streamline workup and antibiotic selection but was not designed as a substitute for solid clinical decision making and complete assessment on behalf of the HCP; therefore, additional workup may have been necessary and documented in the EHR.
Findings
This patient population comprised 17 patients pre-implementation and 12 patients postimplementation, most of whom had solid tumor malignancies (88.2% and 83.3%, respectively) receiving platinum, taxane, or antimetabolite-based chemotherapy. In the pre-implementation group, most patients (70.5%) coming through the ED were treated with palliative intent. Only 25% of these received any prophylactic granulocyte-colony stimulating factor (G-CSF) based on risk for FN. The mean time from triage to the first dose of antibiotics decreased from 3.3 hours before protocol implementation to 2.3 hours after. Only 6% in the pre-implementation group compared with 17% in the postimplementation group received the first dose of antibiotics within the recommended 1-hour interval from triage. The most common antibiotics administered were cefepime and vancomycin. Eleven patients in each group (65% and 92%, respectively) were admitted to the inpatient service for further care, with 10 and 8 patients, respectively, experiencing a hospitalization > 72 hours. Of note, 41% of patients died pre-implementation vs 17% postimplementation.
Interpretation
The goal of this protocol was to optimize ED care of patients presenting with FN to better align with guideline-recommended time lines and antibiotics. The mean time from triage to administration of antibiotics decreased by 1.0 hour from the pre- to postimplementation phase, similar to the study by Mattison and colleagues.3 When removing an outlier from the postimplementation group, the mean time from triage to first dose further decreased to 1.8 hours. The percentage of patients receiving antibiotics within 1 hour of triage nearly tripled from 6% to 17%. Additionally, the percentage of patients empirically treated with appropriate antibiotics consistent with NCCN/ASCO/IDSA guidelines increased from 65% to 83%. Although goals for the optimization of care have not yet been reached, this protocol is the first step in the right direction.
Limitations
Several limitations and concerns arise when implementing a new protocol or workflow process. Overall, these limitations may contribute to delays, such as the willingness of team members to use an unfamiliar protocol or issues locating a new protocol. The nursing staff is challenged to triage patients quickly, which may add to an already busy environment. Frequent physician turnover may require more frequent education sessions. Also, a lag time between implementation and using the protocol may result in decreased protocol use during the designated postimplementation data collection phase.
On review, ED staff were excited to find a protocol that streamlined decision making and increased awareness for patients at risk. The COVID-19 pandemic may have been a confounder for the postimplementation phase. Data may have been skewed as some patients might have elected to stay at home to avoid potential COVID-19 exposure in the ED. Additionally, increased ED use by patients with COVID-19 may have resulted in longer wait times for an available bed, thereby minimizing the impact of the protocol on time from triage to administration of antibiotics. COVID-19 may also have contributed to postimplementation mortality. Of note, barcode medication administration (BCMA) was implemented in the ED in May 2019, which may account for undocumented delays in antibiotic administration as staff may have been unfamiliar with BCMA workflow.
Due to the retrospective nature of a chart review, the data rely on the timely input and accuracy of documented information. Data after the patient’s ED encounter (except inpatient hospitalization and deaths during the implementation period) were not collected due to the scope of the program being limited to the ED only. Last, this protocol was implemented at a single site, and the generalizability to implement the same protocol at other VA medical centers may be limited. After reaching out to other VA sites and several non-VA facilities, we were unable to find a site with a similar protocol or program emphasizing the importance of timely care, although there may have been established laboratory test and medication order sets within the EHR.
Future Direction
The newly established FN order sets will continue to streamline clinical decision making and antibiotic selection in this population. In our study, we learned that most patients coming through the ED were being treated with palliative intent. As a result, these patients also may have a higher risk for complications like FN. We hope to further analyze the impact on this group and consider the role of empiric dose reduction or increased G-CSF support to minimize FN.
More than half of the patients who were admitted to the inpatient service, remained in extended care for > 72 hours. Inpatient recovery time may cause delays in future cancer treatment cycles, dose reductions, and contribute to an overall decline in performance status. Six patients in the pre-implementation phase and 1 in the postimplementation phase were eligible for outpatient management per independent Multinational Association of Supportive Care in Cancer assessment. To increase comfort, a future goal would be to create an outpatient treatment order set on discharge from the ED to help identify and outline treatment options for low-risk patients. In addition to the ED, training staff in clinics with a similar protocol may enhance the identification of patients with FN. This may require a tailored protocol for this location using health technicians in taking vital signs before the HCP visit.
This protocol helped establish “code sepsis.” Code sepsis alerts are broadcast to alert pertinent members of the health care team to provide immediate medical attention to the veteran. Pharmacy can expedite the compounding of antibiotics and record review while radiology prioritizes the portable X-ray for quick and efficient imaging. The nursing team comes ready to administer antibiotics once cultures are drawn. The HCP's attention is focused on the physical examination to determine any additional steps/care that need to be accomplished. At our site, we plan to continue HCP, nursing, and other team member education on this oncologic emergency and the availability of a streamlined protocol. We would like to re-assess the data with a long team study now that the protocol has been in place for 3 years. We hope to continue to provide strong patient care with enhanced adherence to guidelines for patients with FN presenting to RLRVAMC.
Conclusions
Early identification and timely empiric antibiotic therapy are critical to improving outcomes for patients presenting to the ED with FN. The neutropenic fever protocol reduced time to antibiotics by about 1 hour with a higher percentage of patients receiving them in < 1 hour. Additional optimization of the order sets along with increased protocol comfort and staff education will help further reduce the time to antibiotic administration in alignment with guideline recommendations.
1. National Comprehensive Cancer Network. Prevention and Treatment of Cancer-Related Infections (Version 3.2022) Updated October 28, 2022. Accessed February 16, 2023. https://www.nccn.org/professionals/physician_gls/pdf/infections.pdf
2. Taplitz RA, Kennedy EB, Bow EJ, et al. Outpatient Management of Fever and Neutropenia in Adults Treated for Malignancy: American Society of Clinical Oncology and Infectious Diseases Society of America Clinical Practice Guideline Update. J Clin Oncol. 2018;36(14):1443-1453. doi:10.1200/JCO.2017.77.6211
3. Lyman GH, Rolston KV. How we treat febrile neutropenia in patients receiving cancer chemotherapy. J Oncol Pract. 2010;6(3):149-152. doi:10.1200/JOP.091092
4. Cohen C, King A, Lin CP, Friedman GK, Monroe K, Kutny M. Protocol for reducing time to antibiotics in pediatric patients presenting to an emergency department with fever and neutropenia: efficacy and barriers. Pediatr Emerg Care. 2016;32(11):739-745. doi:10.1097/PEC.0000000000000362
5. Yoshida H, Leger KJ, Xu M, et al. Improving time to antibiotics for pediatric oncology patients with suspected infections: an emergency department-based quality improvement intervention. Pediatr Emerg Care. 2018;34(1):47-52. doi:10.1097/PEC.0000000000001367 6. Mattison G, Bilney M, Haji-Michael P, Cooksley T. A nurse-led protocol improves the time to first dose intravenous antibiotics in septic patients post chemotherapy. Support Care Cancer. 2016;24(12):5001-5005. doi:10.1007/s00520-016-3362-4
Precision medicine: A new approach to AML, other blood cancers
The emergence of precision medicine has ushered in a groundbreaking era for the treatment of myeloid malignancies, with the ability to integrate individual molecular data into patient care.
Over the past decade, insights from research focusing on the mutations driving the malignant transformation of myeloid cells have provided the basis for the development of novel targeted therapies.1 With the recent U.S. Food and Drug Administration approval of several novel therapies for different acute myeloid leukemia (AML) indications, the current treatment landscape for AML is evolving rapidly.2
In addition, there has been substantial progress in the development of novel therapeutic strategies for other myeloid neoplasms, with numerous molecularly based therapies in early clinical trials in myeloproliferative neoplasms (MPNs) and myelodysplastic syndromes (MDSs). These advancements have been translated into optimized algorithms for diagnosis, prognostication, and treatment.
AML: Historical perspective
AML comprises a heterogeneous group of blood cell malignancies that require different treatment approaches and confer different prognoses.2 These include acute promyelocytic leukemia (APL) and core binding factor (CBF) AML, both of which have high rates of remission and prolonged survival. The remaining non-APL, non-CBF types can be divided by their cytogenetic-molecular profiles, as well as fitness for intensive chemotherapy. AML can also arise secondary to other myeloid neoplasms, especially after exposure to hypomethylating agents (HMAs), chemotherapy, or irradiation as prior treatment for the primary malignancy.
Historically, anthracycline- and cytarabine-based chemotherapy with or without allogeneic hematopoietic stem-cell transplant (allo-HSCT) was the standard of care in AML treatment with curative intent.1 In the palliative setting, low-dose cytarabine or HMAs were also treatment options. Despite 5 decades of clinical use of these options, researchers have continued to evaluate different dosing schedules of cytosine arabinoside (cytarabine or ara-C) and daunorubicin – the first two agents approved for the treatment of AML – during induction and consolidation treatment phases.
However, recent discoveries have led to the clinical development of targeted agents directed at isocitrate dehydrogenase (IDH), FMS-like tyrosine kinase 3 (FLT3), and BCL2.2 These developments, and the highly anticipated combinations arising from them, continue to challenge traditional treatment approaches, raising the question of whether intensive chemotherapy should remain the optimal standard of care.
Novel therapeutics in AML
Since 2017, several new therapies have been approved for the treatment of AML, including gemtuzumab ozogamicin, two FLT3 inhibitors (gilteritinib and midostaurin), two IDH inhibitors (ivosidenib and enasidenib), a BCL2 inhibitor (venetoclax), an oral HMA agent (azacitidine), a hedgehog inhibitor (glasdegib), and a liposomal formulation of CPX351. In addition, oral decitabine/cedazuridine may be used as an alternative oral HMA in AML, but it is currently the only FDA-approved treatment for chronic myelomonocytic leukemia (CMML) and MDS.2 Because AML subsets are very heterogeneous, an open question remains about how to best integrate these new agents into frontline and salvage combination regimens.
Acute promyelocytic leukemia
APL composes 5%-10% of AML and is characterized by the cytogenetic translocation between chromosomes 15 and 17, which leads to the PML-RAR alpha fusion oncogene and its encoded oncoprotein.2 Two therapies, all-trans retinoic acid (ATRA) and arsenic trioxide, when administered in combination with chemotherapy during induction, have been shown to improve outcomes in APL. At present, the combination of idarubicin and ATRA is the standard-of-care treatment for APL. In addition, patients with high-risk disease have been shown to benefit from the addition of gemtuzumab ozogamicin or anthracyclines.
Core binding factor AML
CBF AML includes patients with the cytogenetic-molecular subsets of inversion 16. Chemotherapy combined with gemtuzumab ozogamicin results in cure rates of 75% or higher and an estimated 5-year survival of 75%. Fludarabine, high-dose cytarabine, and gemtuzumab ozogamicin during induction and consolidation, and an alternative treatment modality (for example, allo-HSCT), for persistent minimal residual disease (MRD) in patients who achieve complete response (CR) is a commonly used regimen. Patients who cannot tolerate this regimen or who have persistent MRD may be treated with an HMA (for instance, decitabine or azacitidine) in combination with venetoclax and gemtuzumab ozogamicin, with the treatment duration adjusted according to MRD status or for 12 months or longer.
Mutations, such as N/KRAS (30%-50%), KIT (25%-30%), and FLT3 (15%-20%), also occur in CBF AML. Targeted agents may also be considered in some cases (for example, dasatinib or avapritinib for KIT mutations; FLT3 inhibitors for FLT3 mutations).
Intensive chemotherapy in younger/fit AML

Several AML regimens have demonstrated better outcomes than the conventional “3 + 7 regimen” (3 days of daunorubicin plus 7 days of cytarabine). Recently, the treatment paradigm has shifted from intensive chemotherapy alone to multidrug combination regimens, including regimens that incorporate targeted therapies, such as FLT3 inhibitors in FLT3-mutated AML, and venetoclax and/or IDH inhibitors as indicated. In addition, the recent FDA approval of oral azacitidine as maintenance therapy for patients in first CR (CR duration, 4 months or less; patients unable to complete the curative intensive chemotherapy) may allow for expanded combination regimens.
Older/unfit patients with AML: Low-intensity therapy
Prior to 2000, the majority of older/unfit patients with AML were offered supportive/palliative treatment. Today, the HMAs azacitidine and decitabine are the most commonly used drugs for the treatment of older/unfit AML. Recently, the FDA approved an oral formulation of decitabine plus oral cedazuridine for the treatment of CMML and MDS. This could provide an opportunity to investigate and develop an effective oral therapy regimen for older/unfit AML, such as oral decitabine/cedazuridine in combination with venetoclax, which may ease administration and improve quality of life for patients in CR post induction in the community setting.
Other studies have shown benefit for combining an HMA with venetoclax in patients with TP53-mutated AML. In addition, triplet regimens may also improve outcomes, with combinations such as HMA plus FLT3 inhibitor (for instance, midostaurin or gilteritinib) with or without venetoclax now being investigated. However, the potential increased risk of myelosuppression also needs to be considered with use of triplet regimens. The results of these and other combinatorial trials are greatly anticipated.
Two oral IDH inhibitors, ivosidenib (IDH1 inhibitor) and enasidenib (IDH2 inhibitor) were recently FDA approved as monotherapy for the treatment of IDH-mutated AML. Combination regimens of IDH inhibitors with chemotherapy are currently being investigated in patients with IDH-mutated AML and appear promising based on preliminary data demonstrating improved response rates and event-free survival.
Other FDA-approved therapies in AML
CPX-351 is a nanoscale liposome with a fixed 5:1 molar ratio of cytarabine and daunorubicin. Results from a phase 3 trial showed that CPX-351 resulted in higher response rates and longer survival compared with 3 + 7 chemotherapy in patients with secondary AML, a subgroup of patients with a very poor prognosis. Additional studies are ongoing, combining CPX-351 with gemtuzumab ozogamicin, venetoclax, and other targeted agents.
Results from a phase 2 trial led to the FDA approval of the hedgehog inhibitor glasdegib when given with low-dose cytarabine. The combination improved survival compared with low-dose cytarabine alone in older/unfit AML and high-risk MDS. However, because of poor survival relative to venetoclax-based combinations, glasdegib is not widely used in clinical practice; other trials exploring combinations with azacitidine and with intensive chemotherapy are ongoing.
Expert perspectives: Future of AML therapy
Amir T. Fathi, MD, associate professor of medicine at Harvard Medical School, Boston, and Farhad Ravandi, MD, professor of medicine at the University of Texas MD Anderson Cancer Center, Houston, are coauthors of a recent review that summarized the current treatment landscape in AML, including areas of evolving research.1
“In the next several years, I am hopeful there will be a series of regulatory approvals of novel, effective agents for myeloid malignancies,” Dr. Fathi explained. “Even if approvals are not as numerous as we’ve seen in AML, any additional effective options would be very welcome.”
Dr. Ravandi also noted that increased understanding of the biology underlying myeloid neoplasms has helped to develop novel therapies.
“As we’ve increased our understanding of the biology of these blood cancers, particularly the mechanisms of leukemogenesis and neoplastic change, we’ve been able to develop more effective therapies in AML,” Dr. Ravandi said.
“In the future, we are likely to see a similar trend in other myeloid neoplasms, such as MDSs and MPNs, as we better understand their underlying pathogenesis,” he further explained.
They both acknowledged that the future treatment paradigm in AML will focus on maximizing the potential of new drug approvals, largely through the development of new combination regimens; however, this could be limited by timely validation and regulatory concerns as the disease has become increasingly segmented into smaller subgroups, each with access to a variety of potentially effective therapies.
Dr. Fathi reported consulting/advisory services for Agios, BMS/Celgene, Astellas, and a variety of other pharmaceutical and biotechnology companies. He also reported receiving research support from Agios, BMS/Celgene, and AbbVie. Dr. Ravandi reported no conflicts of interest.
References
1. Westermann J and Bullinger L. Cancer Biol. 2021 April;S1044-579X(21)00084-5.
2. Kantarjian HM et al. Clin Lymphoma Myeloma Leuk. 2021 Sept;21(9):580-97.
The emergence of precision medicine has ushered in a groundbreaking era for the treatment of myeloid malignancies, with the ability to integrate individual molecular data into patient care.
Over the past decade, insights from research focusing on the mutations driving the malignant transformation of myeloid cells have provided the basis for the development of novel targeted therapies.1 With the recent U.S. Food and Drug Administration approval of several novel therapies for different acute myeloid leukemia (AML) indications, the current treatment landscape for AML is evolving rapidly.2
In addition, there has been substantial progress in the development of novel therapeutic strategies for other myeloid neoplasms, with numerous molecularly based therapies in early clinical trials in myeloproliferative neoplasms (MPNs) and myelodysplastic syndromes (MDSs). These advancements have been translated into optimized algorithms for diagnosis, prognostication, and treatment.
AML: Historical perspective
AML comprises a heterogeneous group of blood cell malignancies that require different treatment approaches and confer different prognoses.2 These include acute promyelocytic leukemia (APL) and core binding factor (CBF) AML, both of which have high rates of remission and prolonged survival. The remaining non-APL, non-CBF types can be divided by their cytogenetic-molecular profiles, as well as fitness for intensive chemotherapy. AML can also arise secondary to other myeloid neoplasms, especially after exposure to hypomethylating agents (HMAs), chemotherapy, or irradiation as prior treatment for the primary malignancy.
Historically, anthracycline- and cytarabine-based chemotherapy with or without allogeneic hematopoietic stem-cell transplant (allo-HSCT) was the standard of care in AML treatment with curative intent.1 In the palliative setting, low-dose cytarabine or HMAs were also treatment options. Despite 5 decades of clinical use of these options, researchers have continued to evaluate different dosing schedules of cytosine arabinoside (cytarabine or ara-C) and daunorubicin – the first two agents approved for the treatment of AML – during induction and consolidation treatment phases.
However, recent discoveries have led to the clinical development of targeted agents directed at isocitrate dehydrogenase (IDH), FMS-like tyrosine kinase 3 (FLT3), and BCL2.2 These developments, and the highly anticipated combinations arising from them, continue to challenge traditional treatment approaches, raising the question of whether intensive chemotherapy should remain the optimal standard of care.
Novel therapeutics in AML
Since 2017, several new therapies have been approved for the treatment of AML, including gemtuzumab ozogamicin, two FLT3 inhibitors (gilteritinib and midostaurin), two IDH inhibitors (ivosidenib and enasidenib), a BCL2 inhibitor (venetoclax), an oral HMA agent (azacitidine), a hedgehog inhibitor (glasdegib), and a liposomal formulation of CPX351. In addition, oral decitabine/cedazuridine may be used as an alternative oral HMA in AML, but it is currently the only FDA-approved treatment for chronic myelomonocytic leukemia (CMML) and MDS.2 Because AML subsets are very heterogeneous, an open question remains about how to best integrate these new agents into frontline and salvage combination regimens.
Acute promyelocytic leukemia
APL composes 5%-10% of AML and is characterized by the cytogenetic translocation between chromosomes 15 and 17, which leads to the PML-RAR alpha fusion oncogene and its encoded oncoprotein.2 Two therapies, all-trans retinoic acid (ATRA) and arsenic trioxide, when administered in combination with chemotherapy during induction, have been shown to improve outcomes in APL. At present, the combination of idarubicin and ATRA is the standard-of-care treatment for APL. In addition, patients with high-risk disease have been shown to benefit from the addition of gemtuzumab ozogamicin or anthracyclines.
Core binding factor AML
CBF AML includes patients with the cytogenetic-molecular subsets of inversion 16. Chemotherapy combined with gemtuzumab ozogamicin results in cure rates of 75% or higher and an estimated 5-year survival of 75%. Fludarabine, high-dose cytarabine, and gemtuzumab ozogamicin during induction and consolidation, and an alternative treatment modality (for example, allo-HSCT), for persistent minimal residual disease (MRD) in patients who achieve complete response (CR) is a commonly used regimen. Patients who cannot tolerate this regimen or who have persistent MRD may be treated with an HMA (for instance, decitabine or azacitidine) in combination with venetoclax and gemtuzumab ozogamicin, with the treatment duration adjusted according to MRD status or for 12 months or longer.
Mutations, such as N/KRAS (30%-50%), KIT (25%-30%), and FLT3 (15%-20%), also occur in CBF AML. Targeted agents may also be considered in some cases (for example, dasatinib or avapritinib for KIT mutations; FLT3 inhibitors for FLT3 mutations).
Intensive chemotherapy in younger/fit AML
Several AML regimens have demonstrated better outcomes than the conventional “3 + 7 regimen” (3 days of daunorubicin plus 7 days of cytarabine). Recently, the treatment paradigm has shifted from intensive chemotherapy alone to multidrug combination regimens, including regimens that incorporate targeted therapies, such as FLT3 inhibitors in FLT3-mutated AML, and venetoclax and/or IDH inhibitors as indicated. In addition, the recent FDA approval of oral azacitidine as maintenance therapy for patients in first CR (CR duration, 4 months or less; patients unable to complete the curative intensive chemotherapy) may allow for expanded combination regimens.
Older/unfit patients with AML: Low-intensity therapy
Prior to 2000, the majority of older/unfit patients with AML were offered supportive/palliative treatment. Today, the HMAs azacitidine and decitabine are the most commonly used drugs for the treatment of older/unfit AML. Recently, the FDA approved an oral formulation of decitabine plus oral cedazuridine for the treatment of CMML and MDS. This could provide an opportunity to investigate and develop an effective oral therapy regimen for older/unfit AML, such as oral decitabine/cedazuridine in combination with venetoclax, which may ease administration and improve quality of life for patients in CR post induction in the community setting.
Other studies have shown benefit for combining an HMA with venetoclax in patients with TP53-mutated AML. In addition, triplet regimens may also improve outcomes, with combinations such as HMA plus FLT3 inhibitor (for instance, midostaurin or gilteritinib) with or without venetoclax now being investigated. However, the potential increased risk of myelosuppression also needs to be considered with use of triplet regimens. The results of these and other combinatorial trials are greatly anticipated.
Two oral IDH inhibitors, ivosidenib (IDH1 inhibitor) and enasidenib (IDH2 inhibitor) were recently FDA approved as monotherapy for the treatment of IDH-mutated AML. Combination regimens of IDH inhibitors with chemotherapy are currently being investigated in patients with IDH-mutated AML and appear promising based on preliminary data demonstrating improved response rates and event-free survival.
Other FDA-approved therapies in AML
CPX-351 is a nanoscale liposome with a fixed 5:1 molar ratio of cytarabine and daunorubicin. Results from a phase 3 trial showed that CPX-351 resulted in higher response rates and longer survival compared with 3 + 7 chemotherapy in patients with secondary AML, a subgroup of patients with a very poor prognosis. Additional studies are ongoing, combining CPX-351 with gemtuzumab ozogamicin, venetoclax, and other targeted agents.
Results from a phase 2 trial led to the FDA approval of the hedgehog inhibitor glasdegib when given with low-dose cytarabine. The combination improved survival compared with low-dose cytarabine alone in older/unfit AML and high-risk MDS. However, because of poor survival relative to venetoclax-based combinations, glasdegib is not widely used in clinical practice; other trials exploring combinations with azacitidine and with intensive chemotherapy are ongoing.
Expert perspectives: Future of AML therapy
Amir T. Fathi, MD, associate professor of medicine at Harvard Medical School, Boston, and Farhad Ravandi, MD, professor of medicine at the University of Texas MD Anderson Cancer Center, Houston, are coauthors of a recent review that summarized the current treatment landscape in AML, including areas of evolving research.1
“In the next several years, I am hopeful there will be a series of regulatory approvals of novel, effective agents for myeloid malignancies,” Dr. Fathi explained. “Even if approvals are not as numerous as we’ve seen in AML, any additional effective options would be very welcome.”
Dr. Ravandi also noted that increased understanding of the biology underlying myeloid neoplasms has helped to develop novel therapies.
“As we’ve increased our understanding of the biology of these blood cancers, particularly the mechanisms of leukemogenesis and neoplastic change, we’ve been able to develop more effective therapies in AML,” Dr. Ravandi said.
“In the future, we are likely to see a similar trend in other myeloid neoplasms, such as MDSs and MPNs, as we better understand their underlying pathogenesis,” he further explained.
They both acknowledged that the future treatment paradigm in AML will focus on maximizing the potential of new drug approvals, largely through the development of new combination regimens; however, this could be limited by timely validation and regulatory concerns as the disease has become increasingly segmented into smaller subgroups, each with access to a variety of potentially effective therapies.
Dr. Fathi reported consulting/advisory services for Agios, BMS/Celgene, Astellas, and a variety of other pharmaceutical and biotechnology companies. He also reported receiving research support from Agios, BMS/Celgene, and AbbVie. Dr. Ravandi reported no conflicts of interest.
References
1. Westermann J and Bullinger L. Cancer Biol. 2021 April;S1044-579X(21)00084-5.
2. Kantarjian HM et al. Clin Lymphoma Myeloma Leuk. 2021 Sept;21(9):580-97.

Improving Veteran Access to Treatment for Hepatitis C Virus Infection (FULL)
In the U.S., 2.7 to 3.9 million people are chronically infected with the hepatitis C virus (HCV).1 Survey data suggest that HCV infection is more prevalent in patients enrolled in the VA health care system than it is in civilian health care systems.2 Studies have shown that Vietnam veterans, veterans with mental health and substance abuse disorders, and veterans without stable housing are more likely to be infected with HCV.3 Data from the VA HCV Clinical Case Registry (CCR) for 2015 showed that 174,842 veterans with chronic HCV infection receieved care within the VHA, which makes the VA the single largest HCV care provider in the nation.4
The VA is dedicated to providing treatment to veterans with HCV infection. For fiscal year (FY) 2016, the VA allocated $1 billion to HCV care,and in February 2016 it began offering treatment to all veterans with HCV, regardless of degree of fibrosis or severity of underlying liver disease.3,5 Each VAMC was tasked with improving veterans’ access to HCV treatment.
In an effort to engage patients in HCV care, the multidisciplinary HCV team at the Richard L. Roudebush VAMC (RLRVAMC) in Indianapolis, Indiana, launched a 2-phase improvement process in 2016. The goal in phase 1 was to increase patient access to HCV clinics, and the goal in phase 2 was to recruit patients for direct-acting antiviral (DAA) therapy for HCV. These efforts were designed to increase screening, identification, and linkage to care for HCV and to expand clinic access for the treatment and cure of all identified veterans who pursued treatment.
Patients with HCV infection, referred from primary care clinics, initially were evaluated by HCV clinic providers (hepatologists, infectious disease specialists, gastroenterology fellows, or nurse practitioners) for eligibility to receive DAA therapy for HCV. Eligible patients then were referred to a pharmacist-run HCV clinic, which had been established at RLRVAMC in 2011. At the start of FY 2016, the clinic, staffed by 3 pharmacists, operated 5 half-days per week and accommodated up to 35 weekly patient appointments.
In this clinic, patients received initial education and medication reconciliation for potential drug interactions with DAAs. Once the HCV treatment was initiated, patients were evaluated in the clinic every 2 weeks for medication refills and assessment for tolerability, adherence, and laboratory abnormalities until end of treatment (8-24 weeks, depending on HCV genotype, experiences with prior HCV treatment, and presence/absence of cirrhosis). Twelve weeks after completion of treatment, viral load was obtained to determine sustained virologic response (SVR12).
Methods
Phase 1: Improve Clinic Access
During FY 2016, methods for expanding clinic access to accommodate a large influx of treatment-eligible patients were reviewed and implemented.
In the first intervention, unneeded follow-up visits were eliminated to make room for additional new patient appointments. In general, patients treated with ribavirin require close monitoring, given the risk for anemia.6 With the release of newer DAAs, however, more patients became eligible for treatment with ribavirin-free regimens.7 As a result, follow-up appointments for these patients were extended to 4-week intervals instead of every 2 weeks. A patient with a history of nonadherence to medication use or clinic visits was still maintained on a 2-week schedule of follow-up for close monitoring.
In the second intervention, opportunities for switching those who completed treatment from face-to-face clinic visits to telephone were identified. These patients historically were seen in clinic for a brief interview and for a blood test used to determine end-of-treatment viral load. Improving access for new patients in the clinic involved moving more existing patients from in-clinic visits to telephone. At the end of the treatment plan, existing patients received an order for laboratory tests that included viral load. When all laboratory results were ready, patients were contacted by telephone. Recruiting a registered nurse to the treatment team who assisted with telephone visits further improved clinic efficiency.
The third intervention was inspired by successful results at other VA sites and launched a group treatment clinic for patients who were starting ribavirin-free DAA regimens.7 Group visits were run by 2 pharmacists and accommodated up to 10 veterans. Patients underwent testing for HCV genotype and viral load before the initial group visit. At check-in, patients received a short questionnaire and consent form for group participation. The questionnaire reviewed patient history of drug and alcohol use and potential barriers to medication adherence. Patients also were encouraged to write down any questions they had about the treatment. During the initial group visit, pharmacists provided general education about the medications, potential adverse effects, treatment expectations, and the monitoring plan. Follow-up visits were conducted in a group setting as well.
Phase 2: Increase Recruitment
The records of 534 patients with advanced liver disease (F3-F4 fibrosis on the Fibrosis-4 Index for Liver Fibrosis) and HCV infection were identified in the CCR database for the period August 2015 to December 2015 (Figure 1).8 Patients were excluded if they were deceased, were receiving palliative care (n = 45), or if they had transferred their care to another VA facility (n = 69). Of the 420 patients in the study reviewed, 234 (56%) had not previously been referred to an HCV clinic or been started on treatment because of a variety of social issues, including active substance use (Figure 2).
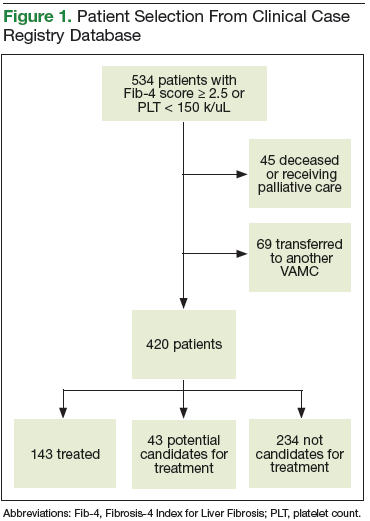
Many of the patients were difficult to engage because the clinic could not effectively assist them in achieving sobriety and lacked support personnel who could address their complex social issues. Given the availability of all-oral HCV treatments, the VA Public Health Department issued guidance allowing all HCV-infected patients to receive DAA treatment regardless of ongoing drug or alcohol use disorders.9 Substance use was not to be considered a contraindication to therapy. It was suggested that health care providers determine these patients’ treatment eligibility on a case-by-case basis. An official VA memorandum supporting this initiative was released in September 2016.10
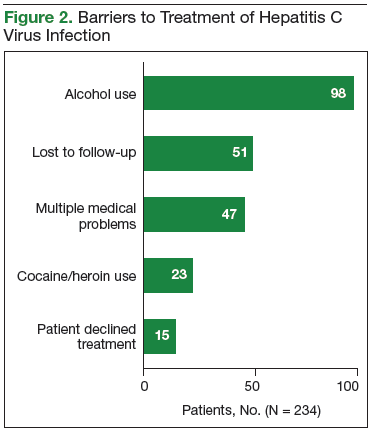
Interventions
In an effort to engage all HCV-infected patients, the CCR review was expanded to include patients without advanced liver disease. All patients were contacted by mail. Any patient registered for secure messaging through MyHealtheVet also received a secure message. Patients were informed about the newly approved DAA therapies and were connected directly with specialized HCV clinic schedulers at RLRVAMC. Patients who responded were scheduled for a group education class facilitated by 2 members of the HCV treatment team.
Unlike patients in the group treatment clinic, patients in the education class had not completed the necessary workup for treatment initiation. In the class, patients received education on new HCV treatments and were linked to social work care if needed to streamline the referral process. All baseline laboratory test results also were obtained.
Another intervention implemented to recruit patients in this difficult-to-treat population was the addition of a social worker to the treatment team. Beginning in late June 2016, high-risk patients were referred to the social worker by HCV providers or pharmacists. For each referred patient, the social worker performed a psychosocial assessment to identify potential barriers to successful treatment and then connected the patient with either VA or community resources for support.
The social worker linked patients to mental health or substance use-related services, empowered them to access transportation resources for clinic appointments, orchestrated assistance with medication adherence from a home health nurse, and reached out to patients in person or by telephone to address specific needs that might limit their ability to attend appointments. The social worker also provided harm reduction planning and goal setting support to help patients with substance use disorders achieve sobriety or reduce substance use while on HCV treatment. All efforts were made to ensure that patients adhered to their clinic visits and medication use. In addition, during social work assessment, factors such as housing concerns, travel barriers, and loss and grief were identified and promptly addressed.
Results
After the phase 1 intervention, 730 additional appointments were added in FY 2016 (Figure 3). As a result, 409 patients with HCV infection were started on treatment in FY 2016 compared with 192 in FY 2015. More important, the rapid increase in capacity and treatment initiation did not sacrifice the quality of care provided. Ninety-eight percent of patients who started treatment in FY 2016 successfully completed their treatment course. The overall SVR12 rate was 96% for all genotype 1 patients treated with ledipasvir/sofosbuvir, ombitasvir/paritaprevir/ritonavir plus dasabuvir, or elbasvir/grazoprevir with or without ribavirin. In addition, the SVR12 rate was 82% for genotype 2 patients (almost all cirrhotic) treated with sofosbuvir plus ribavirin and 93% for genotype 3 patients treated with daclatasvir, sofosbuvir, and ribavirin.
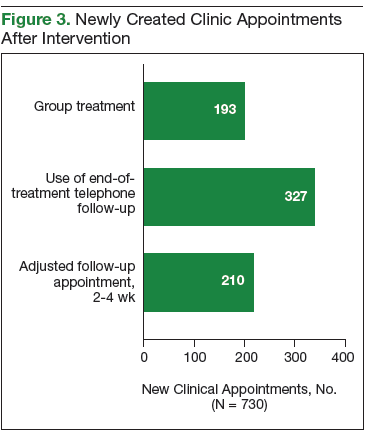
Phase 2: Increase Recruitment
The expanded CCR review identified 234 patients with advanced liver disease and 546 patients without advanced disease. As this was a rolling review, 58 patients were linked to care before being contacted. Of the 722 patients in the cohort, 528 were contacted by mail and 194 both by mail and by MyHealtheVet messaging. One hundred forty-one patients responded: 129 by mail and 12 by MyHealtheVet messaging (eFigure 1). 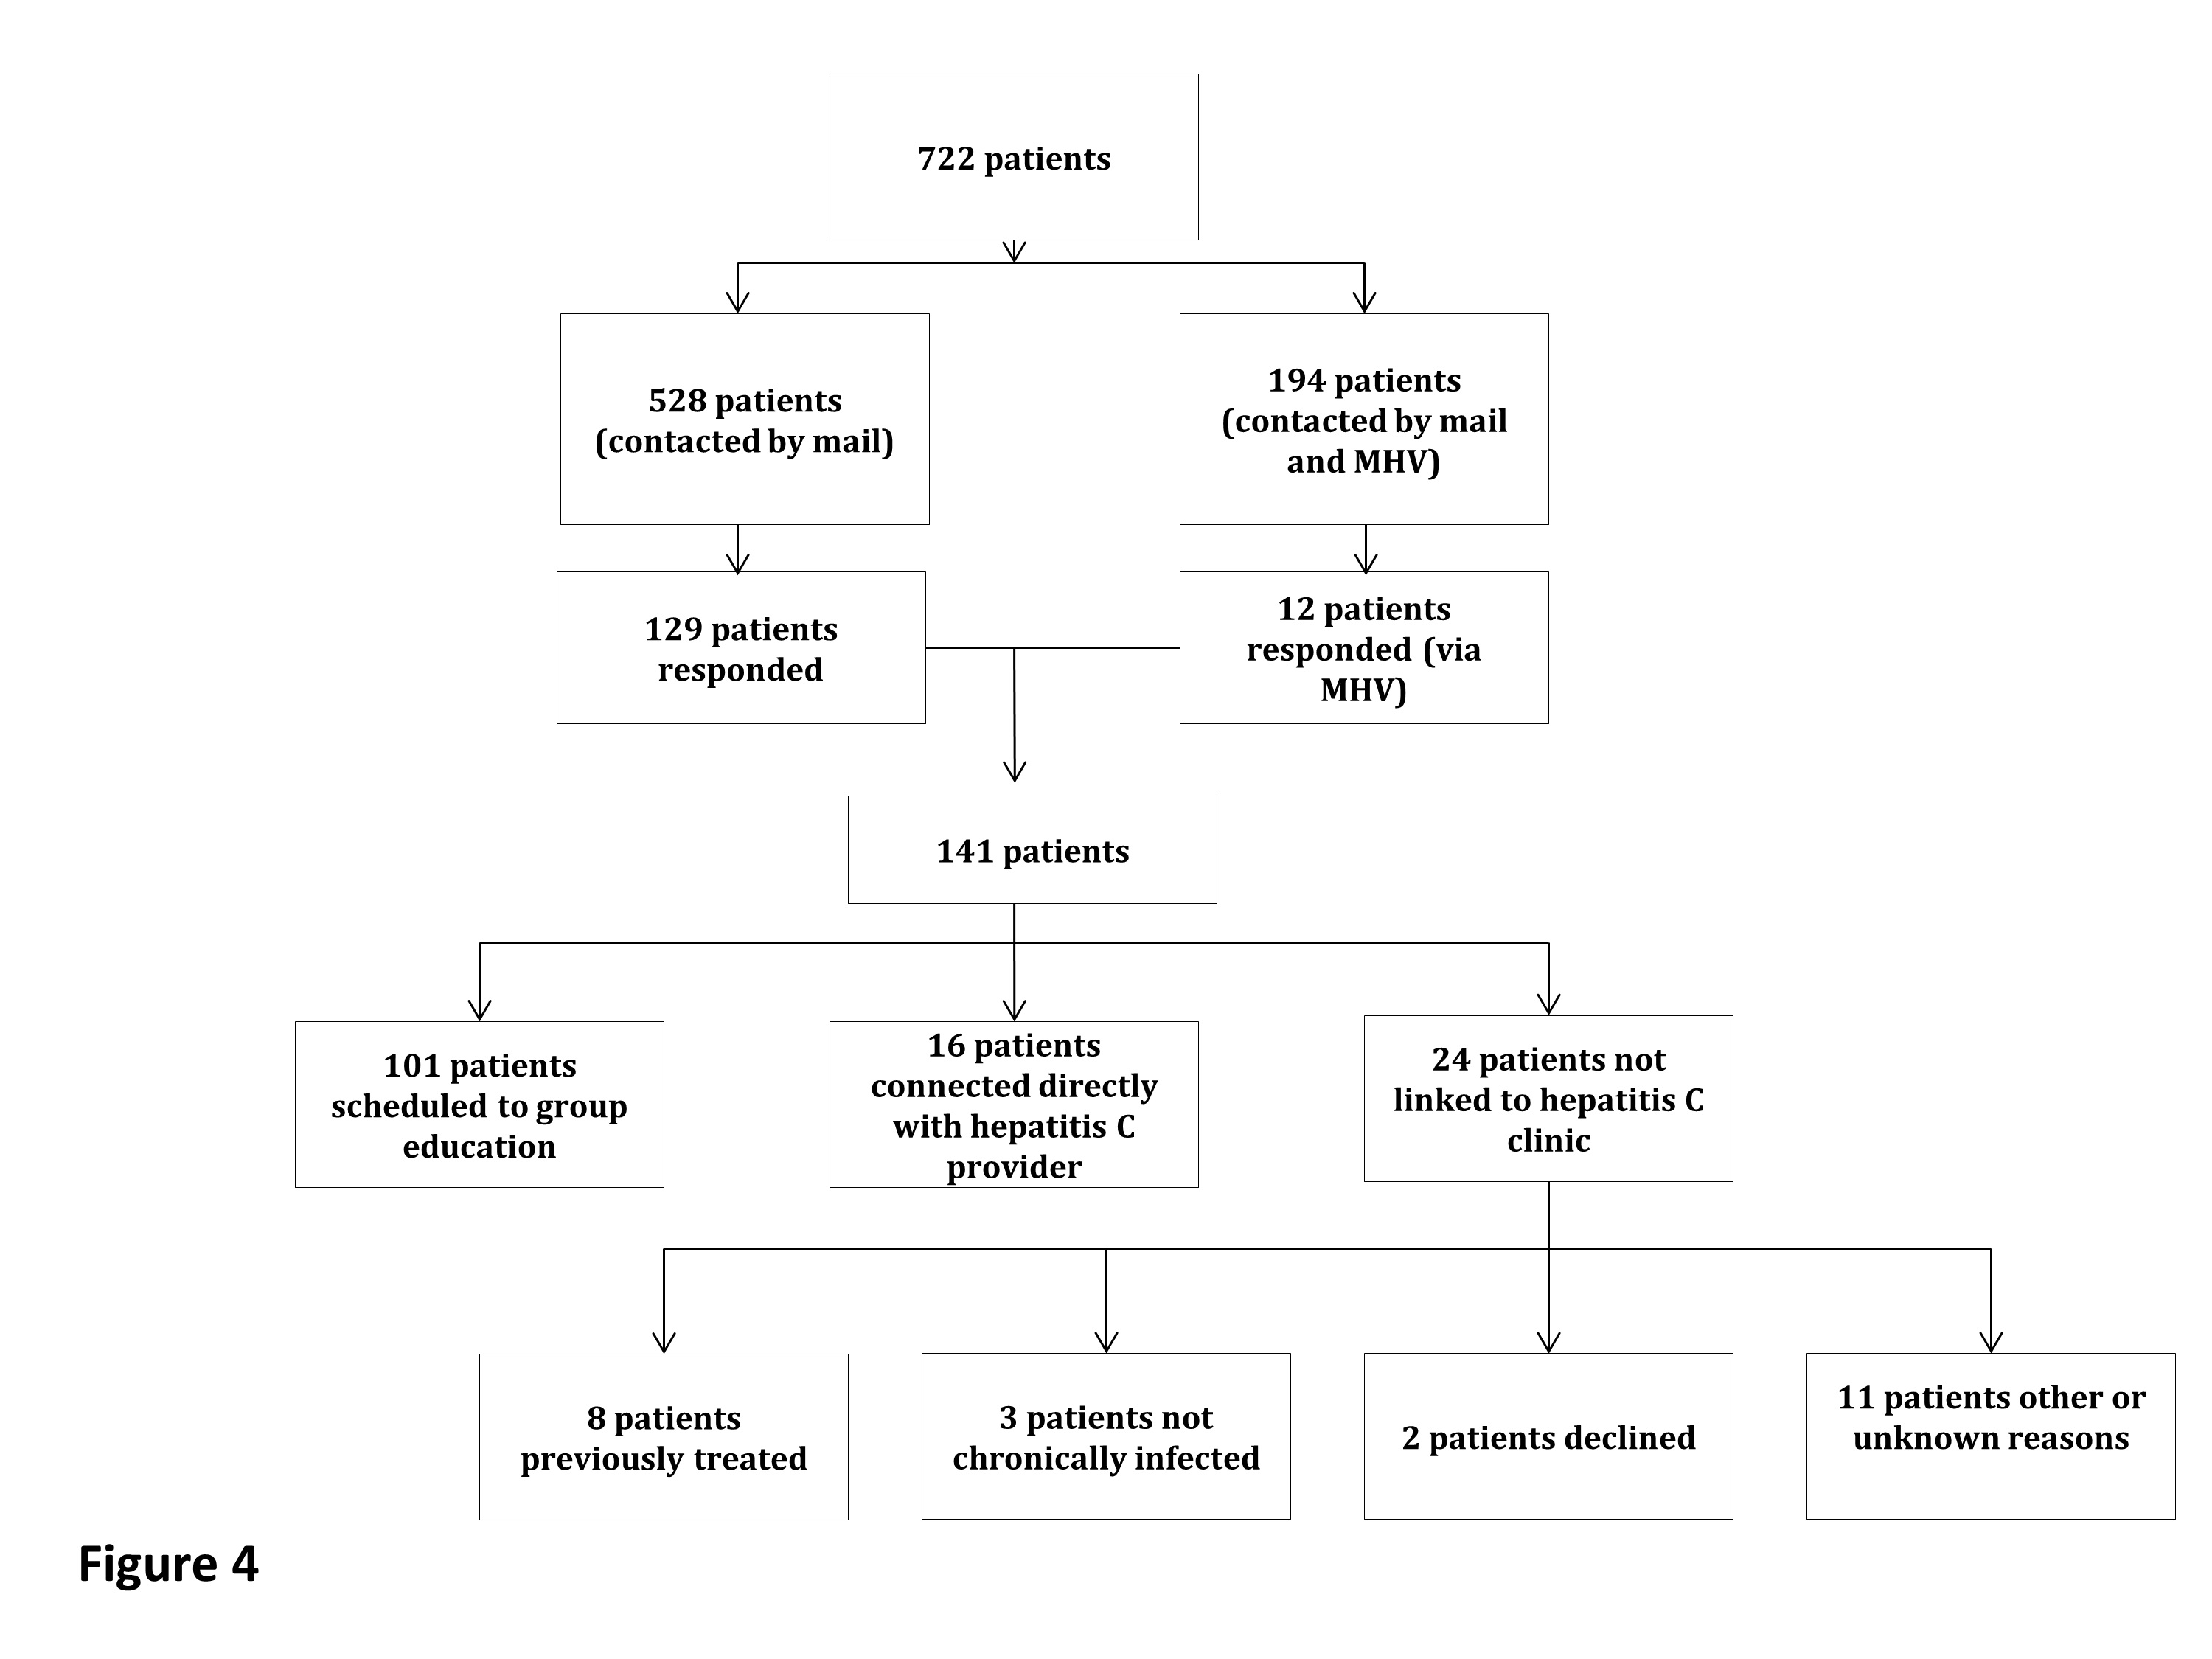
Of the 101 patients scheduled for group education, 43 attended education in FY 2016 (eFigure 2).
In June 2016, a social worker was added to the treatment team in an effort to improve recruitment in this difficult to treat population (Figure 2). Between June 2016 and end of FY 2016, 48 patients were referred to the social worker for evaluation. The primary reasons for referral were ongoing substance/alcohol use or high risk for relapse (n = 22); appointment adherence barriers, including problems with transportation (n = 16); underlying mental health disorders (n = 4); barriers to medication adherence (n = 3); and unstable housing (n = 3). Of these 48 patients, 31 received a single social worker intervention to connect with resources; the other 17 were recommended for intensive case management for ongoing support during preparation for HCV treatment and during therapy. As a result of social work involvement, 31 out of 48 referred patients were successfully started on treatment in FY 2016.
Discussion
The VA continues focusing its efforts and resources on treating HCV infection in FY 2017. To further expand outreach, RLRVAMC is working on several additional process improvements. One reason for the lower than expected number of patients who did not see a provider after attending the group education class is that these patients were difficult to reach for scheduling. A medical support assistant is now attending these classes; immediately after a class ends and before leaving the facility, this assistant schedules patients for appointments with HCV providers. The team social worker continues to help prepare patients for treatment and targets interventions for patients early in their HCV workup so that resources are allocated before treatment initiation. In the first 2 months of FY 2017, about 10 more patients who were referred to the social worker for assessment and support started treatment.
Outreach letter responses identified almost 600 potential candidates for treatment. Pharmacists telephoned these patients in another effort to connect them with VA services. Interested patients were scheduled for a group education visit. Also, pharmacists reached out to all primary care clinics and community-based outpatient clinics connected with the facility to provide education on VA policies regarding HCV treatment eligibility and to encourage providers to refer all patients with HCV infection to the HCV clinic. This education was provided at primary care team meetings, and providers not in attendance receive individual outreach by pharmacists. Primary care providers also received a pocket card that summarized recommendations for HCV screening and referrals. These efforts and initiatives are expected to increase veterans’ access to care for HCV infection within the catchment area.
Conclusion
Treatment team interventions in FY 2016 significantly increased veterans’ access to RLRVAMC HCV care. The number of patients who started treatment more than doubled since the previous year. Many of these patients had complex social issues or treatment barriers but successfully started therapy with the help of additional support staff.
Click here to read the digital edition.
1. Centers for Disease Control and Prevention. Hepatitis C FAQs for health professionals. https://www.cdc.gov/hepatitis/hcv/hcvfaq.htm. Updated January 27, 2017. Accessed May 9, 2017.
2. U.S. Department of Veterans Affairs. Epidemiology of hepatitis C. http://www.hepatitis.va.gov/provider/reviews/epidemiology.asp. Updated August 26, 2016. Accessed May 9, 2017.
3. U.S. Department of Veterans Affairs, Office of Research and Development. VA research on hepatitis C. http://www.research.va.gov/topics/hep-c.cfm. Updated October 14, 2016. Accessed May 9, 2017.
4. U.S. Department of Veterans Affairs. HIV, hepatitis, and public health pathogens programs annual stakeholders report: 2015. https://www.hepatitis.va.gov/pdf/stakeholders-report-2015.pdf. Published May 2015. Accessed May 10, 2017.
5. Lynch TG, McCarthy MF; US Department of Veterans Affairs. Hepatitis C virus (HCV) funding and prioritization status update [memorandum]. http://www.hepatitis.va.gov/pdf/choice-prioritization-update.pdf. Published February 24, 2016. Accessed May 9, 2017.
6. Fried MW. Side effects of therapy of hepatitis C and their management. Hepatology. 2002;36(5 suppl 1):S237-S244.
7. AASLD/IDSA HCV Guidance Panel. Hepatitis C guidance: AASLD-IDSA recommendations for testing, managing, and treating adults infected with hepatitis C virus. Hepatology. 2015;62(3):932-954.
8. Vallet-Pichard A, Mallet V, Nalpas B, et al. Fib-4: an inexpensive and accurate marker of fibrosis in HCV infection. Comparison with liver biopsy and fibrotest. Hepatology. 2007;46(1):32-36.
9. U.S. Department of Veterans Affairs National Hepatitis C Resource Center Program and National Viral Hepatitis Program the HIV, Hepatitis, and Related Conditions Program in the Office of Specialty Care Services. Chronic hepatitis C virus (HCV) infection: treatment considerations. https://www.hepatitis.va.gov/pdf/treatment-considerations-2017-03-08.pdf. Updated March 8, 2017. Accessed May 9, 2017.
10. Lynch TG; U.S. Department of Veterans Affairs. Evaluation and treatment of veterans with hepatitis C (HCV) and co-occurring substance use or mental health concerns [memorandum]. http://www.hepatitis.va.gov/pdf/memo-HCV-and -mental-health.pdf. Published September 9, 2016. Accessed May 9, 2017.
In the U.S., 2.7 to 3.9 million people are chronically infected with the hepatitis C virus (HCV).1 Survey data suggest that HCV infection is more prevalent in patients enrolled in the VA health care system than it is in civilian health care systems.2 Studies have shown that Vietnam veterans, veterans with mental health and substance abuse disorders, and veterans without stable housing are more likely to be infected with HCV.3 Data from the VA HCV Clinical Case Registry (CCR) for 2015 showed that 174,842 veterans with chronic HCV infection receieved care within the VHA, which makes the VA the single largest HCV care provider in the nation.4
The VA is dedicated to providing treatment to veterans with HCV infection. For fiscal year (FY) 2016, the VA allocated $1 billion to HCV care,and in February 2016 it began offering treatment to all veterans with HCV, regardless of degree of fibrosis or severity of underlying liver disease.3,5 Each VAMC was tasked with improving veterans’ access to HCV treatment.
In an effort to engage patients in HCV care, the multidisciplinary HCV team at the Richard L. Roudebush VAMC (RLRVAMC) in Indianapolis, Indiana, launched a 2-phase improvement process in 2016. The goal in phase 1 was to increase patient access to HCV clinics, and the goal in phase 2 was to recruit patients for direct-acting antiviral (DAA) therapy for HCV. These efforts were designed to increase screening, identification, and linkage to care for HCV and to expand clinic access for the treatment and cure of all identified veterans who pursued treatment.
Patients with HCV infection, referred from primary care clinics, initially were evaluated by HCV clinic providers (hepatologists, infectious disease specialists, gastroenterology fellows, or nurse practitioners) for eligibility to receive DAA therapy for HCV. Eligible patients then were referred to a pharmacist-run HCV clinic, which had been established at RLRVAMC in 2011. At the start of FY 2016, the clinic, staffed by 3 pharmacists, operated 5 half-days per week and accommodated up to 35 weekly patient appointments.
In this clinic, patients received initial education and medication reconciliation for potential drug interactions with DAAs. Once the HCV treatment was initiated, patients were evaluated in the clinic every 2 weeks for medication refills and assessment for tolerability, adherence, and laboratory abnormalities until end of treatment (8-24 weeks, depending on HCV genotype, experiences with prior HCV treatment, and presence/absence of cirrhosis). Twelve weeks after completion of treatment, viral load was obtained to determine sustained virologic response (SVR12).
Methods
Phase 1: Improve Clinic Access
During FY 2016, methods for expanding clinic access to accommodate a large influx of treatment-eligible patients were reviewed and implemented.
In the first intervention, unneeded follow-up visits were eliminated to make room for additional new patient appointments. In general, patients treated with ribavirin require close monitoring, given the risk for anemia.6 With the release of newer DAAs, however, more patients became eligible for treatment with ribavirin-free regimens.7 As a result, follow-up appointments for these patients were extended to 4-week intervals instead of every 2 weeks. A patient with a history of nonadherence to medication use or clinic visits was still maintained on a 2-week schedule of follow-up for close monitoring.
In the second intervention, opportunities for switching those who completed treatment from face-to-face clinic visits to telephone were identified. These patients historically were seen in clinic for a brief interview and for a blood test used to determine end-of-treatment viral load. Improving access for new patients in the clinic involved moving more existing patients from in-clinic visits to telephone. At the end of the treatment plan, existing patients received an order for laboratory tests that included viral load. When all laboratory results were ready, patients were contacted by telephone. Recruiting a registered nurse to the treatment team who assisted with telephone visits further improved clinic efficiency.
The third intervention was inspired by successful results at other VA sites and launched a group treatment clinic for patients who were starting ribavirin-free DAA regimens.7 Group visits were run by 2 pharmacists and accommodated up to 10 veterans. Patients underwent testing for HCV genotype and viral load before the initial group visit. At check-in, patients received a short questionnaire and consent form for group participation. The questionnaire reviewed patient history of drug and alcohol use and potential barriers to medication adherence. Patients also were encouraged to write down any questions they had about the treatment. During the initial group visit, pharmacists provided general education about the medications, potential adverse effects, treatment expectations, and the monitoring plan. Follow-up visits were conducted in a group setting as well.
Phase 2: Increase Recruitment
The records of 534 patients with advanced liver disease (F3-F4 fibrosis on the Fibrosis-4 Index for Liver Fibrosis) and HCV infection were identified in the CCR database for the period August 2015 to December 2015 (Figure 1).8 Patients were excluded if they were deceased, were receiving palliative care (n = 45), or if they had transferred their care to another VA facility (n = 69). Of the 420 patients in the study reviewed, 234 (56%) had not previously been referred to an HCV clinic or been started on treatment because of a variety of social issues, including active substance use (Figure 2).
Many of the patients were difficult to engage because the clinic could not effectively assist them in achieving sobriety and lacked support personnel who could address their complex social issues. Given the availability of all-oral HCV treatments, the VA Public Health Department issued guidance allowing all HCV-infected patients to receive DAA treatment regardless of ongoing drug or alcohol use disorders.9 Substance use was not to be considered a contraindication to therapy. It was suggested that health care providers determine these patients’ treatment eligibility on a case-by-case basis. An official VA memorandum supporting this initiative was released in September 2016.10
Interventions
In an effort to engage all HCV-infected patients, the CCR review was expanded to include patients without advanced liver disease. All patients were contacted by mail. Any patient registered for secure messaging through MyHealtheVet also received a secure message. Patients were informed about the newly approved DAA therapies and were connected directly with specialized HCV clinic schedulers at RLRVAMC. Patients who responded were scheduled for a group education class facilitated by 2 members of the HCV treatment team.
Unlike patients in the group treatment clinic, patients in the education class had not completed the necessary workup for treatment initiation. In the class, patients received education on new HCV treatments and were linked to social work care if needed to streamline the referral process. All baseline laboratory test results also were obtained.
Another intervention implemented to recruit patients in this difficult-to-treat population was the addition of a social worker to the treatment team. Beginning in late June 2016, high-risk patients were referred to the social worker by HCV providers or pharmacists. For each referred patient, the social worker performed a psychosocial assessment to identify potential barriers to successful treatment and then connected the patient with either VA or community resources for support.
The social worker linked patients to mental health or substance use-related services, empowered them to access transportation resources for clinic appointments, orchestrated assistance with medication adherence from a home health nurse, and reached out to patients in person or by telephone to address specific needs that might limit their ability to attend appointments. The social worker also provided harm reduction planning and goal setting support to help patients with substance use disorders achieve sobriety or reduce substance use while on HCV treatment. All efforts were made to ensure that patients adhered to their clinic visits and medication use. In addition, during social work assessment, factors such as housing concerns, travel barriers, and loss and grief were identified and promptly addressed.
Results
After the phase 1 intervention, 730 additional appointments were added in FY 2016 (Figure 3). As a result, 409 patients with HCV infection were started on treatment in FY 2016 compared with 192 in FY 2015. More important, the rapid increase in capacity and treatment initiation did not sacrifice the quality of care provided. Ninety-eight percent of patients who started treatment in FY 2016 successfully completed their treatment course. The overall SVR12 rate was 96% for all genotype 1 patients treated with ledipasvir/sofosbuvir, ombitasvir/paritaprevir/ritonavir plus dasabuvir, or elbasvir/grazoprevir with or without ribavirin. In addition, the SVR12 rate was 82% for genotype 2 patients (almost all cirrhotic) treated with sofosbuvir plus ribavirin and 93% for genotype 3 patients treated with daclatasvir, sofosbuvir, and ribavirin.
Phase 2: Increase Recruitment
The expanded CCR review identified 234 patients with advanced liver disease and 546 patients without advanced disease. As this was a rolling review, 58 patients were linked to care before being contacted. Of the 722 patients in the cohort, 528 were contacted by mail and 194 both by mail and by MyHealtheVet messaging. One hundred forty-one patients responded: 129 by mail and 12 by MyHealtheVet messaging (eFigure 1).
Of the 101 patients scheduled for group education, 43 attended education in FY 2016 (eFigure 2).
In June 2016, a social worker was added to the treatment team in an effort to improve recruitment in this difficult to treat population (Figure 2). Between June 2016 and end of FY 2016, 48 patients were referred to the social worker for evaluation. The primary reasons for referral were ongoing substance/alcohol use or high risk for relapse (n = 22); appointment adherence barriers, including problems with transportation (n = 16); underlying mental health disorders (n = 4); barriers to medication adherence (n = 3); and unstable housing (n = 3). Of these 48 patients, 31 received a single social worker intervention to connect with resources; the other 17 were recommended for intensive case management for ongoing support during preparation for HCV treatment and during therapy. As a result of social work involvement, 31 out of 48 referred patients were successfully started on treatment in FY 2016.
Discussion
The VA continues focusing its efforts and resources on treating HCV infection in FY 2017. To further expand outreach, RLRVAMC is working on several additional process improvements. One reason for the lower than expected number of patients who did not see a provider after attending the group education class is that these patients were difficult to reach for scheduling. A medical support assistant is now attending these classes; immediately after a class ends and before leaving the facility, this assistant schedules patients for appointments with HCV providers. The team social worker continues to help prepare patients for treatment and targets interventions for patients early in their HCV workup so that resources are allocated before treatment initiation. In the first 2 months of FY 2017, about 10 more patients who were referred to the social worker for assessment and support started treatment.
Outreach letter responses identified almost 600 potential candidates for treatment. Pharmacists telephoned these patients in another effort to connect them with VA services. Interested patients were scheduled for a group education visit. Also, pharmacists reached out to all primary care clinics and community-based outpatient clinics connected with the facility to provide education on VA policies regarding HCV treatment eligibility and to encourage providers to refer all patients with HCV infection to the HCV clinic. This education was provided at primary care team meetings, and providers not in attendance receive individual outreach by pharmacists. Primary care providers also received a pocket card that summarized recommendations for HCV screening and referrals. These efforts and initiatives are expected to increase veterans’ access to care for HCV infection within the catchment area.
Conclusion
Treatment team interventions in FY 2016 significantly increased veterans’ access to RLRVAMC HCV care. The number of patients who started treatment more than doubled since the previous year. Many of these patients had complex social issues or treatment barriers but successfully started therapy with the help of additional support staff.
Click here to read the digital edition.
1. Centers for Disease Control and Prevention. Hepatitis C FAQs for health professionals. https://www.cdc.gov/hepatitis/hcv/hcvfaq.htm. Updated January 27, 2017. Accessed May 9, 2017.
2. U.S. Department of Veterans Affairs. Epidemiology of hepatitis C. http://www.hepatitis.va.gov/provider/reviews/epidemiology.asp. Updated August 26, 2016. Accessed May 9, 2017.
3. U.S. Department of Veterans Affairs, Office of Research and Development. VA research on hepatitis C. http://www.research.va.gov/topics/hep-c.cfm. Updated October 14, 2016. Accessed May 9, 2017.
4. U.S. Department of Veterans Affairs. HIV, hepatitis, and public health pathogens programs annual stakeholders report: 2015. https://www.hepatitis.va.gov/pdf/stakeholders-report-2015.pdf. Published May 2015. Accessed May 10, 2017.
5. Lynch TG, McCarthy MF; US Department of Veterans Affairs. Hepatitis C virus (HCV) funding and prioritization status update [memorandum]. http://www.hepatitis.va.gov/pdf/choice-prioritization-update.pdf. Published February 24, 2016. Accessed May 9, 2017.
6. Fried MW. Side effects of therapy of hepatitis C and their management. Hepatology. 2002;36(5 suppl 1):S237-S244.
7. AASLD/IDSA HCV Guidance Panel. Hepatitis C guidance: AASLD-IDSA recommendations for testing, managing, and treating adults infected with hepatitis C virus. Hepatology. 2015;62(3):932-954.
8. Vallet-Pichard A, Mallet V, Nalpas B, et al. Fib-4: an inexpensive and accurate marker of fibrosis in HCV infection. Comparison with liver biopsy and fibrotest. Hepatology. 2007;46(1):32-36.
9. U.S. Department of Veterans Affairs National Hepatitis C Resource Center Program and National Viral Hepatitis Program the HIV, Hepatitis, and Related Conditions Program in the Office of Specialty Care Services. Chronic hepatitis C virus (HCV) infection: treatment considerations. https://www.hepatitis.va.gov/pdf/treatment-considerations-2017-03-08.pdf. Updated March 8, 2017. Accessed May 9, 2017.
10. Lynch TG; U.S. Department of Veterans Affairs. Evaluation and treatment of veterans with hepatitis C (HCV) and co-occurring substance use or mental health concerns [memorandum]. http://www.hepatitis.va.gov/pdf/memo-HCV-and -mental-health.pdf. Published September 9, 2016. Accessed May 9, 2017.
Treatment and Management of Patients With Prostate Cancer (FULL)
PSA Screening
William J. Aronson, MD. I’m very encouraged that the U.S. Preventive Services Task Force (USPSTF) has recently drafted revised guidelines for screening men for prostate cancer in which they now are proposing a C grade for prostate specific antigen (PSA) screening in men aged < 70 years. In this age group they now propose an informed discussion with the patient regarding the pros and cons of screening (shared decision making). The USPSTF recommended against PSA screening in men aged ≥ 75 years in 2008 (D grade), and they recommended against PSA screening in all men in 2012 (D grade). Previously the USPSTF put a great deal of emphasis on the PLCO (Prostate, Lung, Colorectal, and Ovarian Screening Trial). In that trial, there was no difference in prostate cancer mortality between the study groups, but, it appears that up to 90% of men in the control group received PSA screening, therefore, invalidating the studies findings.
I still have serious concerns about giving a D grade for men aged > 70 years. Dr. Jim Hu from Cornell University recently published a study in JAMA Oncology and reported that men aged > 74 years now have twice the rate (12%) of presenting with metastatic disease at the time of diagnosis compared with men aged > 74 years prior to the 2008 USPSTF recommendations. In my view, otherwise healthy men with a good life expectancy, even if they’re aged > 70 years, should still have an informed discussion with their physician about getting PSA screening.
Julie N. Graff, MD. I completely agree with Dr. Aronson, and I would add that our veterans are a special group of patients who have risk factors that aren’t seen in the general population. For example, Agent Orange exposure, and I think the VA has not necessarily embraced those recommendations. I’d also add that people are living longer, and most of the men who die of prostate cancer are over the age of 80 years. We need to consider each patient individually and his life expectancy. It’s okay to diagnose someone with prostate cancer, and it’s important to have a conversation about how likely that cancer is to shorten his life and not just turn a blind eye to it.
Nicholas G. Nickols, MD, PhD. I don’t think there’s really anything clinically meaningful about PSA screening that can be gleaned from the PLCO trial. However, there was another trial that looked at PSA screening, the ERSPC (European Randomized Study of Screening for Prostate Cancer) trial, and had less contamination in the nonscreened arm and actually did ultimately show a 27% reduction in prostate cancer mortality in the screened men. We also know that local treatment in men with high-risk prostate cancer actually improves survival. By not screening, men with high-risk disease are going to miss out on potentially curative therapy.
Dr. Aronson. I think other endpoints are crucial to consider beyond just survival. Once patients have metastatic disease that can markedly impact their quality of life. Also, patients who are starting androgen deprivation therapy (ADT) have very significant issues with quality of life as well. I believe these other endpoints should also be considered by the USPSTF.
Jenna M. Houranieh, PharmD, BCOP. The American Cancer Society, ASCO (American Society of Clinical Oncology), NCCN (National Comprehensive Cancer Network), and the American Urological Association all had a different view on screening compared with the USPSTF that I think go more in line with some of the ways that we practice, because they take into consideration life expectancy, patients’ risks, and the age of screening as well.

Active Surveillance
Dr. Aronson. Active surveillance is now a wellestablished, reasonable approach to managing patients with low-risk prostate cancer. When we talk about the various treatment options, we always include a discussion of active surveillance and watchful waiting. Certainly, patients who have a Gleason score of 3+3, a low PSA (< 10) and low volume disease are ideal candidates for active surveillance. There is no established protocol for active surveillance, though there are a number of large series that report specific ways to go about doing it. The key issue for patients is to deemphasize the importance of the PSA, which is a very poor tool for monitoring progression of prostate cancer in men on active surveillance, and to focus on periodically obtaining prostate biopsies.
For patients with prostate cancer who have multiple medical problems and limited life expectancy, there is no reason to do biopsies on a regular basis. Watchful waiting would be more appropriate for these patients. One key issue, which is challenging right now, is that probably the best way to do active surveillance is with the more sophisticated biopsy technology that is now available. That includes both fusing magnetic resonance imaging (MRI) of the prostate into the ultrasound unit we are using to perform transrectal prostate biopsies. The more advanced biopsy units also provide the ability to perform same-site biopsies. There are specific coordinates at each site where a biopsy is performed so that we can go back to that same site on subsequent biopsies. Due to cost issues, these advanced biopsy units are not yet being used at a high frequency.
Dr. Nickols. The large ProtecT trial in the UK randomized men diagnosed with prostate cancer out of a PSA screening cohort to an active surveillance arm, a radical prostatectomy arm, and a radical radiation arm, and has a median of 10 years’ followup. Importantly, the endpoints of overall survival and prostate cancer specific survival were actually the same for all 3 arms, and were quite high. A little more than half of the patients who were on surveillance ended up getting delayed radical therapy of some kind within 10 years.
There was, however, a difference in metastasis-free survival and clinical progression, which were both higher in the active surveillance arm as compared to the treatment arms. Progression to metastatic disease was more than twice as high in the active surveillance arm than the other 2. Most of the patients who had progressed on the active surveillance arm were Gleason 7, and probably were not ideal candidates for active surveillance by today’s standards and would not normally be recommended active surveillance.
Androgen Deprivation Therapies
Dr. Houranieh. Androgen deprivation therapy plays a large role in prostate cancer management and is used in several areas of prostate cancer care. Androgen deprivation therapy can given be before, during or after radiation or alone in the metastatic setting. It's also continued along with chemotherapy in the more advanced stages. It's use is generally guided by our urologists and the duration of therapy is determined by the risk and stage of the cancer. It can be used for as little as a few months for lower risk, early stage disease or for a few years for higher risk disease. It can also be continued indefinitely for metastatic disease. Androgen deprivation therapy is a combination of 2 types of therapies, injectable LHRH (luteinizing hormone-releasing hormone) agonists and oral antiandrogens.
A number of products are available. The most commonly used LHRH agonist, at least at the Lexington VAMC in Kentucky, is leuprolide, which comes either in an intramuscular or subcutaneous formulation and can be given at different frequencies either monthly, every 3 months, or every 6 months.
There are also a number of antiandrogens available on the market. The most commonly used one is bicalutamide. It is generally the best tolerated and given once daily, as opposed to the other 2, which are either given twice or 3 times daily.
Dr. Nickols. We typically add ADT to radiation for patients with high-risk prostate cancer, defined as any of the following: A PSA ≥ 20, clinical T3 or higher disease, or Gleason score of ≥ 8. The addition of ADT to radiation in high-risk patients improves overall survival, prostate cancer survival, and biochemical recurrence-free survival. The backbone of this hormone therapy is usually a GnRH analogue like leuprolide.
The data are extensive, including many large phase 3 randomized trials of patients with highrisk prostate cancer treated with radiation plus or minus androgen suppression. Many of these trials were led by the big cooperative trial groups: the Radiation Therapy Oncology Group (RTOG), the European Organisation for Research and Treatment of Cancer (EORTC), and others. Looking
at all of the data, the answer to the general question of whether hormone therapy is beneficial is yes. The unknown question is what is the optimal duration for this concurrent and adjuvant hormone therapy. The optimal duration is probably somewhere between 1 and 3 years. That’s a large range, and clearly preferences of the patient and the comorbidities play a role in the decision of duration. The radiation doses were considerably lower than what is considered standard of care at this time in the trials that have established the use of concurrent and adjuvant hormone therapy with radiation, which needs to be taken in context.
For patients with localized intermediate-risk prostate cancer, a shorter course of hormone therapy is reasonable. The RTOG 9408 and DFCI 95096 trials showed that a 4- to 6-month course of ADT with RT in mostly intermediate-risk patients was better than RT alone. However, studies looking at the different comorbidities present in these patients showed that patients with less comorbidity actually benefit more from the addition of hormone therapy, which needs to be taken into account.
The benefit to the intermediate-risk patients is probably driven by the patients with unfavorable intermediate-risk disease, for example, with the primary Gleason 4 patterns, such as Gleason 4+3 patients rather than Gleason 3+4, patients with higher volume of prostate cancer, patients with multiple intermediate-risk features, etc. For the truly favorable intermediate-risk patients, low-volume disease, low PSA, and Gleason 3+4 pattern, the added value of concurrent ADT may be small.
The mechanism of why ADT may contribute to radiation efficacy may be explained by direct radio-sensitization: the transcription factor androgen receptor activates expression of many genes involved in DNA repair. Interfere with that, and you sensitize to radiation.
Dr. Graff. Of note, we don’t use ADT as the primary treatment for localized prostate cancer. This is for use in combination with radiation, in people with positive lymph nodes after surgery and in people with incurable prostate cancer.
Dr. Nickols. The question of whether or not to treat patients with localized high-risk prostate cancer with hormone therapy alone has been answered: The SPCG-7 and NCIC CTG PR3/MRC PR07 trials proved that adding radiation to long-term ADT improved survival in these patients.
The DFCI 95096 trial also showed that patients with a high level of comorbidities benefitted the least from concurrent hormone therapy; cardiovascular risks from the hormone therapy can offset the anticancer effect in these patients.
Analyses of the large randomized trials of radiation with or without hormones looking at the question of whether or not there was increased cardiovascular mortality in the patients that had hormone therapy did not show more cardiovascular mortality. Importantly, those trials were not enriched for patients with comorbidities that would set them up for this risk. One needs to weigh the benefits of adding hormones to radiation against the risks on a patient-to-patient basis.
Dr. Aronson. Another scenario where we used ADT is for patients whose cancer progressed after primary therapy; for example, when radical prostatectomy and RT are not successful for a patient. We see patients on a regular basis with a rising PSA after primary therapy. Our main goal is to avoid giving ADT to these patients as long as possible and only use it when it is clearly indicated.
The best measure that we typically use is the PSA doubling time. If the PSA doubling time, for example, is > 1 year, than we feel more confident in holding off on starting ADT and instead just monitoring the PSA. Adverse effects (AEs) of ADT are dramatic. We know that patients can get significant fatigue, gain weight, lose muscle mass, have an increased risk of diabetes mellitus, get hot flashes, and develop impotence and loss of libido. And now there are emerging data on an increased risk of Alzheimer disease. We use ADT but only when clearly indicated.
When I start patients on ADT, in addition to explaining the AEs, I also strongly suggest that, if their health allows, they walk at a brisk rate for at least 30 minutes daily and get on a regular weight training or a resistance training program to try to maintain muscle mass. They need to watch their diet more carefully because they are at increased risk for weight gain. And if they also can do balancing exercises, that would also be ideal. Typically, we also start patients on calcium and vitamin D as there is a risk for bone loss and osteoporosis, and we monitor their bone density.
Dr. Nickols. There’s another role for ADT. In patients who have a PSA recurrence after surgery, RT directed to the prostate bed and/or pelvic nodes is a potential curative therapy. There’s now some emerging evidence that analogous to the definitive radiation setting, the addition of hormone therapy to salvage radiation may be of value.
There were 2 recent trials published. The RTOG-9601 trial showed a benefit to the addition of bicalutamide for patients who had rising PSA after a surgery and were randomized to radiation that was directed to the prostate bed plus or minus 2 years of bicalutamide. The second trial, GETUG-AFU 16, was similar except that in this case the hormone therapy used was 6 months of the GnRH analogue leuprolide. The RTOG-9601 trial had positive outcomes in multiple endpoints, including survival. The GETUG trial is not as mature but had a biochemical improvement.
I don’t think the interpretation of this should be to use hormones with salvage radiation all the time. Importantly, in the RTOG 9601 trial, the patients that had the greatest benefit to the addition of concurrent hormone therapy were those that had a PSA of higher than 0.5 or 0.7. Most patients who get salvage radiation now get it at a much lower PSA, so we probably don’t want to overinterpret that data. And, of course, we have to wait for the GETUG-AFU data to mature more to see if there’s any hard clinical endpoints met
there. Notably, the incidence of gynecomastia in the bicalutamide arm of RTOG 9601 was near 70%. I discuss the addition of hormones with my patients who are getting salvage radiation and usually recommend it to the ones who have the high-risk features, those who would have gotten the concurrent hormones in the definitive setting, those with a PSA greater than 0.5 at the time of salvage, and those with a rapid PSA doubling time.
Dr. Houranieh. Androgen deprivation therapy includes use of LHRH agonists, like leuprolide and antiandrogens like bicalutamide. Some of the short-term AEs from androgen deprivation that we counsel patients on are things like tumor flare, hot flashes, erectile dysfunction, and injection site reactions. Some of the more long-term complications that we touch upon are osteoporosis, obesity, insulin resistance, increased risk of diabetes mellitus and cardiovascular events. We counsel patients on these adverse reactions and do our best with monitoring and prevention.
Dr. Nickols. The ProtecT trial also had some valuable patient-reported outcomes that were very carefully tracked. It confirmed what we already believe. The patients that had primary RT had the greatest negative impact on bowel function and on urinary irritative and obstructive symptoms. The patients who had surgery had the greatest negative impact on sexual function and on urinary incontinence. Obviously, active surveillance had the benefit of avoiding or postponing AEs of local therapy.
You can break up RT for localized disease, into 2 general approaches. The first is external beam radiation. This can be delivered as intensity-modulated radiotherapy (IMRT), which is the most common approach right now, typically stretched over more than 2 months of daily treatments. In addition, there is a newer technique called stereotactic body radiation therapy (SBRT), which has been applied to localized prostate cancer now for more than a decade. It’s efficacy was demonstrated first in low-risk patients as normally is the case. It has the advantage of convenience; it is just 5 treatment days total, which can be accomplished in a couple of weeks. And its convenient for patients who are commuting some distance. That’s really important for veterans, as radiotherapy is not available at all VAs.
At the West LA VAMC, we offer SBRT as a standard treatment for men with low and favorable intermediate risk prostate cancer. In addition, we offer it in the context of a clinical trial for patients with unfavorable intermediate- and high-risk prostate cancer.
The other type of radiation therapy is brachytherapy in which the radiation is temporarily or permanently inserted into the target, the prostate. It is a good stand-alone option for men with low- or intermediate-risk prostate cancer. It has the advantage of being relatively fast in that it is done in a day, although it is more invasive than IMRT or SBRT, and certain anatomic features of the prostate and the patient’s baseline urinary function can limit its appropriateness in some patients.
There are some recent data of interest for the combination of brachytherapy and externalbeam radiation therapy (EBRT). The recently reported ASCENDE-RT trial randomized mostly high-risk patients to either EBRT with 1 year of androgen suppression or EBRT with a boost of brachytherapy to the prostate and 1 year of ADT.
The arm that got the brachytherapy boost actually had half the biochemical recurrence of the EBRT alone but had double the rate of grade 2 acute genitourinary toxicity and triple the rate of grade 3. Metastasis-free survival and other hard clinical endpoints will need longer follow-up, but the biochemical control was quite high: It was about 80% at 10 years out.
Dr. Aronson. For surgical approaches, many VAs now have the da Vinci robot system (Sunnyvale, CA). When we look at the key results, which examine cancer care and AEs, such as incontinence and impotence, there actually is no clear advantage over the open procedure that we previously used. That being said, with the robotic surgery, because we do it laparoscopically, there’s significantly less blood loss. The magnification is such that it is much easier to do the surgery. It’s also much easier on the surgeon’s body, given that you’re in an anatomically, ergonomically good position, and patients go home much sooner, typically on postoperative day 1 or postoperative day 2 with less morbidity following the procedure and a much quicker recovery.
Precision Medicine
Dr. Graff. Prostate cancer may not be cured, even after the best attempts at surgery or radiation. The medical oncologist is probably most utilized with people with incurable prostate cancer. Once it’s incurable, it develops tumors in the bones and lymph nodes most commonly, and we call it metastatic prostate cancer.
Right now we use mostly a once-size-fits-all approach. Everyone initially gets some form of castration therapy, usually medical castration with LHRH agonists. However, prostate cancer invariably becomes resistant to those maneuvers. We call that castration-resistant prostate cancer. That opens the door to 6 other treatments that can prolong survival in prostate cancer. Two of the treatments are hormonal (enzalutamide and abiraterone), 2 are chemotherapy (docetaxel and cabazitaxel), 1 is IV radiation with radium-223, and 1 is an immunotherapy (sipuleucel-T).
At this point, there’s not a lot of guidance about what to use when except that each of these therapies has unique AEs, so we may not use one of the therapies because it causes a lot of fatigue or it could cause seizures, for example, in a patient at risk for those. Sometimes the therapies are inappropriate. For example, with radium, you wouldn’t give it to a patient with a tumor in the liver.
We don’t have readily available companion diagnostics to help us narrow the selection. In 2015, there was an article in Cell that looked at men with metastatic castration-resistant prostate cancer. The tumors were biopsied and analyzed, and we found some surprising things, including certain mutations called DNA repair defects that could make them susceptible to a drug already approved in ovarian cancer, such as olaparib and rucaparib.
A subsequent study in the New England Journal of Medicine looked at patients with advanced prostate cancer whose cancers have these DNA repair defects. Those cancers were susceptible to the PARP (poly ADP ribose polymerase) inhibitor olaparib. That’s an example of where looking and sequencing a tumor could lead to a treatment selection. The PARP inhibitors are not yet approved in prostate cancer, but the Prostate Cancer Foundation is interested in supporting research that could help deliver appropriate therapies to veterans in particular whose cancers have certain markers.
So, we are biopsying patients’ tumors, looking at the mutations in their germline DNA, and matching patients to treatments and vice versa. The DNA repair defects is the one that’s probably under most active evaluation right now. Another example of a biomarker is the AR-V7, which is a mutation in the androgen receptor that renders the cancer resistant to enzalutamide and abiraterone.
Also, I have a study of pembrolizumab which is a PD-1 inhibitor, and I’ve seen some very good responses to that therapy. And we’re not yet sure how to identify prospectively those patients who are likely to respond.
Use of Imaging
Dr. Nickols. The sensitivity of technetium-99m bone scans and CT (computed tomography) scans is not good enough. Many patients that we classify as M0, but with clear evidence of disease with a rising PSA, will be more accurately classified as M1 when the imaging allows this to be the case.
I think prostate-specific membrane antigen positron emission tomography (PET), which is not approved at this time, is going to be of value. A lot of data are coming out of Europe and in the recurrence setting show that PET imaging can detect metastatic sites at PSA values as low as 0.2 with the per lesion sensitivity around 80% and a specificity upward of 97%. This is clearly far and away much better than anything we have now.
There’s going to be a whole cohort of patients that we literally can’t see now, patients with essentially minimally metastatic disease, and they will be revealed when the imaging gets there. And the question is what to do for these patients. Treating patients with a heavy metastatic disease burden is much different from treating patients who may have just one or a few areas of disease outside of their prostate. And we need new strategies for these patients. We are now looking at new treatment regimens for patients with limited metastatic disease burden. I think this is going to be important going forward.
It’s also worth asking: What is the role of local therapy in patients with advanced prostate cancer, patients with metastatic disease? If you look at the patients who were in a lot of the old trials, for example, the NCIC trial, that was adding radiation to hormone therapy for high-risk patients, about 25% of patients in that trial had a PSA > 50. That’s a lot. Many of those patients probably had occult metastases. And there are trials now looking at the role of local therapy in metastatic patients.
Another area of interest is precision oncology, which Dr. Graff touched on, is starting to play a big role in the metastatic setting, but what about the local setting? There are now genomic classifiers available to help with risk assessments, but we don’t yet have much in the way of predictive tools that help guide specific therapies in the localized setting. We know that patients, for example, who have germline BRCA1 or 2 mutations have a worse outcome, period, after local therapy; and right now it may play some into treatment decisions, but we don’t have tailored therapy yet in the localized setting at the molecular level. And I think this is something that we need to start looking at.
Dr. Aronson. The VA is a very rich environment for performing clinical research as well as translational research (bench to bedside). And for example, at the West Los Angeles VAMC, I think one of the key steps that we have taken, moving forward is now our urology, radiation oncology, and hematology-oncology research groups have now merged together. This allows us to not only combine our administrative resources but to really improve the ability for us to perform highquality research in our veterans. And so that’s a model which I think other VAs might consider pursuing, depending upon their circumstances.
Author Disclosures
Dr. Graff has received research support from Sanofi, Astellas, Merck, Janssen, and Bristol Myers Squibb; an honorarium from Astellas; travel support from Clovis and Sanofi; and has consulted for Bayer and Dendreon. No other authors report actual or potential conflicts of interest with regard to this article.
Disclaimer
The opinions expressed herein are those of the authors and do not necessarily reflect those of Federal Practitioner, Frontline Medical Communications Inc., the U.S. Government, or any of its agencies. This article may discuss unlabeled or investigational use of certain drugs. Please review the complete prescribing information for specific drugs or drug combinations—including indications, contraindications, warnings, and adverse effects—before administering pharmacologic therapy to patients.
Click here to read the digital edition.
PSA Screening
William J. Aronson, MD. I’m very encouraged that the U.S. Preventive Services Task Force (USPSTF) has recently drafted revised guidelines for screening men for prostate cancer in which they now are proposing a C grade for prostate specific antigen (PSA) screening in men aged < 70 years. In this age group they now propose an informed discussion with the patient regarding the pros and cons of screening (shared decision making). The USPSTF recommended against PSA screening in men aged ≥ 75 years in 2008 (D grade), and they recommended against PSA screening in all men in 2012 (D grade). Previously the USPSTF put a great deal of emphasis on the PLCO (Prostate, Lung, Colorectal, and Ovarian Screening Trial). In that trial, there was no difference in prostate cancer mortality between the study groups, but, it appears that up to 90% of men in the control group received PSA screening, therefore, invalidating the studies findings.
I still have serious concerns about giving a D grade for men aged > 70 years. Dr. Jim Hu from Cornell University recently published a study in JAMA Oncology and reported that men aged > 74 years now have twice the rate (12%) of presenting with metastatic disease at the time of diagnosis compared with men aged > 74 years prior to the 2008 USPSTF recommendations. In my view, otherwise healthy men with a good life expectancy, even if they’re aged > 70 years, should still have an informed discussion with their physician about getting PSA screening.
Julie N. Graff, MD. I completely agree with Dr. Aronson, and I would add that our veterans are a special group of patients who have risk factors that aren’t seen in the general population. For example, Agent Orange exposure, and I think the VA has not necessarily embraced those recommendations. I’d also add that people are living longer, and most of the men who die of prostate cancer are over the age of 80 years. We need to consider each patient individually and his life expectancy. It’s okay to diagnose someone with prostate cancer, and it’s important to have a conversation about how likely that cancer is to shorten his life and not just turn a blind eye to it.
Nicholas G. Nickols, MD, PhD. I don’t think there’s really anything clinically meaningful about PSA screening that can be gleaned from the PLCO trial. However, there was another trial that looked at PSA screening, the ERSPC (European Randomized Study of Screening for Prostate Cancer) trial, and had less contamination in the nonscreened arm and actually did ultimately show a 27% reduction in prostate cancer mortality in the screened men. We also know that local treatment in men with high-risk prostate cancer actually improves survival. By not screening, men with high-risk disease are going to miss out on potentially curative therapy.
Dr. Aronson. I think other endpoints are crucial to consider beyond just survival. Once patients have metastatic disease that can markedly impact their quality of life. Also, patients who are starting androgen deprivation therapy (ADT) have very significant issues with quality of life as well. I believe these other endpoints should also be considered by the USPSTF.
Jenna M. Houranieh, PharmD, BCOP. The American Cancer Society, ASCO (American Society of Clinical Oncology), NCCN (National Comprehensive Cancer Network), and the American Urological Association all had a different view on screening compared with the USPSTF that I think go more in line with some of the ways that we practice, because they take into consideration life expectancy, patients’ risks, and the age of screening as well.
Active Surveillance
Dr. Aronson. Active surveillance is now a wellestablished, reasonable approach to managing patients with low-risk prostate cancer. When we talk about the various treatment options, we always include a discussion of active surveillance and watchful waiting. Certainly, patients who have a Gleason score of 3+3, a low PSA (< 10) and low volume disease are ideal candidates for active surveillance. There is no established protocol for active surveillance, though there are a number of large series that report specific ways to go about doing it. The key issue for patients is to deemphasize the importance of the PSA, which is a very poor tool for monitoring progression of prostate cancer in men on active surveillance, and to focus on periodically obtaining prostate biopsies.
For patients with prostate cancer who have multiple medical problems and limited life expectancy, there is no reason to do biopsies on a regular basis. Watchful waiting would be more appropriate for these patients. One key issue, which is challenging right now, is that probably the best way to do active surveillance is with the more sophisticated biopsy technology that is now available. That includes both fusing magnetic resonance imaging (MRI) of the prostate into the ultrasound unit we are using to perform transrectal prostate biopsies. The more advanced biopsy units also provide the ability to perform same-site biopsies. There are specific coordinates at each site where a biopsy is performed so that we can go back to that same site on subsequent biopsies. Due to cost issues, these advanced biopsy units are not yet being used at a high frequency.
Dr. Nickols. The large ProtecT trial in the UK randomized men diagnosed with prostate cancer out of a PSA screening cohort to an active surveillance arm, a radical prostatectomy arm, and a radical radiation arm, and has a median of 10 years’ followup. Importantly, the endpoints of overall survival and prostate cancer specific survival were actually the same for all 3 arms, and were quite high. A little more than half of the patients who were on surveillance ended up getting delayed radical therapy of some kind within 10 years.
There was, however, a difference in metastasis-free survival and clinical progression, which were both higher in the active surveillance arm as compared to the treatment arms. Progression to metastatic disease was more than twice as high in the active surveillance arm than the other 2. Most of the patients who had progressed on the active surveillance arm were Gleason 7, and probably were not ideal candidates for active surveillance by today’s standards and would not normally be recommended active surveillance.
Androgen Deprivation Therapies
Dr. Houranieh. Androgen deprivation therapy plays a large role in prostate cancer management and is used in several areas of prostate cancer care. Androgen deprivation therapy can given be before, during or after radiation or alone in the metastatic setting. It's also continued along with chemotherapy in the more advanced stages. It's use is generally guided by our urologists and the duration of therapy is determined by the risk and stage of the cancer. It can be used for as little as a few months for lower risk, early stage disease or for a few years for higher risk disease. It can also be continued indefinitely for metastatic disease. Androgen deprivation therapy is a combination of 2 types of therapies, injectable LHRH (luteinizing hormone-releasing hormone) agonists and oral antiandrogens.
A number of products are available. The most commonly used LHRH agonist, at least at the Lexington VAMC in Kentucky, is leuprolide, which comes either in an intramuscular or subcutaneous formulation and can be given at different frequencies either monthly, every 3 months, or every 6 months.
There are also a number of antiandrogens available on the market. The most commonly used one is bicalutamide. It is generally the best tolerated and given once daily, as opposed to the other 2, which are either given twice or 3 times daily.
Dr. Nickols. We typically add ADT to radiation for patients with high-risk prostate cancer, defined as any of the following: A PSA ≥ 20, clinical T3 or higher disease, or Gleason score of ≥ 8. The addition of ADT to radiation in high-risk patients improves overall survival, prostate cancer survival, and biochemical recurrence-free survival. The backbone of this hormone therapy is usually a GnRH analogue like leuprolide.
The data are extensive, including many large phase 3 randomized trials of patients with highrisk prostate cancer treated with radiation plus or minus androgen suppression. Many of these trials were led by the big cooperative trial groups: the Radiation Therapy Oncology Group (RTOG), the European Organisation for Research and Treatment of Cancer (EORTC), and others. Looking
at all of the data, the answer to the general question of whether hormone therapy is beneficial is yes. The unknown question is what is the optimal duration for this concurrent and adjuvant hormone therapy. The optimal duration is probably somewhere between 1 and 3 years. That’s a large range, and clearly preferences of the patient and the comorbidities play a role in the decision of duration. The radiation doses were considerably lower than what is considered standard of care at this time in the trials that have established the use of concurrent and adjuvant hormone therapy with radiation, which needs to be taken in context.
For patients with localized intermediate-risk prostate cancer, a shorter course of hormone therapy is reasonable. The RTOG 9408 and DFCI 95096 trials showed that a 4- to 6-month course of ADT with RT in mostly intermediate-risk patients was better than RT alone. However, studies looking at the different comorbidities present in these patients showed that patients with less comorbidity actually benefit more from the addition of hormone therapy, which needs to be taken into account.
The benefit to the intermediate-risk patients is probably driven by the patients with unfavorable intermediate-risk disease, for example, with the primary Gleason 4 patterns, such as Gleason 4+3 patients rather than Gleason 3+4, patients with higher volume of prostate cancer, patients with multiple intermediate-risk features, etc. For the truly favorable intermediate-risk patients, low-volume disease, low PSA, and Gleason 3+4 pattern, the added value of concurrent ADT may be small.
The mechanism of why ADT may contribute to radiation efficacy may be explained by direct radio-sensitization: the transcription factor androgen receptor activates expression of many genes involved in DNA repair. Interfere with that, and you sensitize to radiation.
Dr. Graff. Of note, we don’t use ADT as the primary treatment for localized prostate cancer. This is for use in combination with radiation, in people with positive lymph nodes after surgery and in people with incurable prostate cancer.
Dr. Nickols. The question of whether or not to treat patients with localized high-risk prostate cancer with hormone therapy alone has been answered: The SPCG-7 and NCIC CTG PR3/MRC PR07 trials proved that adding radiation to long-term ADT improved survival in these patients.
The DFCI 95096 trial also showed that patients with a high level of comorbidities benefitted the least from concurrent hormone therapy; cardiovascular risks from the hormone therapy can offset the anticancer effect in these patients.
Analyses of the large randomized trials of radiation with or without hormones looking at the question of whether or not there was increased cardiovascular mortality in the patients that had hormone therapy did not show more cardiovascular mortality. Importantly, those trials were not enriched for patients with comorbidities that would set them up for this risk. One needs to weigh the benefits of adding hormones to radiation against the risks on a patient-to-patient basis.
Dr. Aronson. Another scenario where we used ADT is for patients whose cancer progressed after primary therapy; for example, when radical prostatectomy and RT are not successful for a patient. We see patients on a regular basis with a rising PSA after primary therapy. Our main goal is to avoid giving ADT to these patients as long as possible and only use it when it is clearly indicated.
The best measure that we typically use is the PSA doubling time. If the PSA doubling time, for example, is > 1 year, than we feel more confident in holding off on starting ADT and instead just monitoring the PSA. Adverse effects (AEs) of ADT are dramatic. We know that patients can get significant fatigue, gain weight, lose muscle mass, have an increased risk of diabetes mellitus, get hot flashes, and develop impotence and loss of libido. And now there are emerging data on an increased risk of Alzheimer disease. We use ADT but only when clearly indicated.
When I start patients on ADT, in addition to explaining the AEs, I also strongly suggest that, if their health allows, they walk at a brisk rate for at least 30 minutes daily and get on a regular weight training or a resistance training program to try to maintain muscle mass. They need to watch their diet more carefully because they are at increased risk for weight gain. And if they also can do balancing exercises, that would also be ideal. Typically, we also start patients on calcium and vitamin D as there is a risk for bone loss and osteoporosis, and we monitor their bone density.
Dr. Nickols. There’s another role for ADT. In patients who have a PSA recurrence after surgery, RT directed to the prostate bed and/or pelvic nodes is a potential curative therapy. There’s now some emerging evidence that analogous to the definitive radiation setting, the addition of hormone therapy to salvage radiation may be of value.
There were 2 recent trials published. The RTOG-9601 trial showed a benefit to the addition of bicalutamide for patients who had rising PSA after a surgery and were randomized to radiation that was directed to the prostate bed plus or minus 2 years of bicalutamide. The second trial, GETUG-AFU 16, was similar except that in this case the hormone therapy used was 6 months of the GnRH analogue leuprolide. The RTOG-9601 trial had positive outcomes in multiple endpoints, including survival. The GETUG trial is not as mature but had a biochemical improvement.
I don’t think the interpretation of this should be to use hormones with salvage radiation all the time. Importantly, in the RTOG 9601 trial, the patients that had the greatest benefit to the addition of concurrent hormone therapy were those that had a PSA of higher than 0.5 or 0.7. Most patients who get salvage radiation now get it at a much lower PSA, so we probably don’t want to overinterpret that data. And, of course, we have to wait for the GETUG-AFU data to mature more to see if there’s any hard clinical endpoints met
there. Notably, the incidence of gynecomastia in the bicalutamide arm of RTOG 9601 was near 70%. I discuss the addition of hormones with my patients who are getting salvage radiation and usually recommend it to the ones who have the high-risk features, those who would have gotten the concurrent hormones in the definitive setting, those with a PSA greater than 0.5 at the time of salvage, and those with a rapid PSA doubling time.
Dr. Houranieh. Androgen deprivation therapy includes use of LHRH agonists, like leuprolide and antiandrogens like bicalutamide. Some of the short-term AEs from androgen deprivation that we counsel patients on are things like tumor flare, hot flashes, erectile dysfunction, and injection site reactions. Some of the more long-term complications that we touch upon are osteoporosis, obesity, insulin resistance, increased risk of diabetes mellitus and cardiovascular events. We counsel patients on these adverse reactions and do our best with monitoring and prevention.
Dr. Nickols. The ProtecT trial also had some valuable patient-reported outcomes that were very carefully tracked. It confirmed what we already believe. The patients that had primary RT had the greatest negative impact on bowel function and on urinary irritative and obstructive symptoms. The patients who had surgery had the greatest negative impact on sexual function and on urinary incontinence. Obviously, active surveillance had the benefit of avoiding or postponing AEs of local therapy.
You can break up RT for localized disease, into 2 general approaches. The first is external beam radiation. This can be delivered as intensity-modulated radiotherapy (IMRT), which is the most common approach right now, typically stretched over more than 2 months of daily treatments. In addition, there is a newer technique called stereotactic body radiation therapy (SBRT), which has been applied to localized prostate cancer now for more than a decade. It’s efficacy was demonstrated first in low-risk patients as normally is the case. It has the advantage of convenience; it is just 5 treatment days total, which can be accomplished in a couple of weeks. And its convenient for patients who are commuting some distance. That’s really important for veterans, as radiotherapy is not available at all VAs.
At the West LA VAMC, we offer SBRT as a standard treatment for men with low and favorable intermediate risk prostate cancer. In addition, we offer it in the context of a clinical trial for patients with unfavorable intermediate- and high-risk prostate cancer.
The other type of radiation therapy is brachytherapy in which the radiation is temporarily or permanently inserted into the target, the prostate. It is a good stand-alone option for men with low- or intermediate-risk prostate cancer. It has the advantage of being relatively fast in that it is done in a day, although it is more invasive than IMRT or SBRT, and certain anatomic features of the prostate and the patient’s baseline urinary function can limit its appropriateness in some patients.
There are some recent data of interest for the combination of brachytherapy and externalbeam radiation therapy (EBRT). The recently reported ASCENDE-RT trial randomized mostly high-risk patients to either EBRT with 1 year of androgen suppression or EBRT with a boost of brachytherapy to the prostate and 1 year of ADT.
The arm that got the brachytherapy boost actually had half the biochemical recurrence of the EBRT alone but had double the rate of grade 2 acute genitourinary toxicity and triple the rate of grade 3. Metastasis-free survival and other hard clinical endpoints will need longer follow-up, but the biochemical control was quite high: It was about 80% at 10 years out.
Dr. Aronson. For surgical approaches, many VAs now have the da Vinci robot system (Sunnyvale, CA). When we look at the key results, which examine cancer care and AEs, such as incontinence and impotence, there actually is no clear advantage over the open procedure that we previously used. That being said, with the robotic surgery, because we do it laparoscopically, there’s significantly less blood loss. The magnification is such that it is much easier to do the surgery. It’s also much easier on the surgeon’s body, given that you’re in an anatomically, ergonomically good position, and patients go home much sooner, typically on postoperative day 1 or postoperative day 2 with less morbidity following the procedure and a much quicker recovery.
Precision Medicine
Dr. Graff. Prostate cancer may not be cured, even after the best attempts at surgery or radiation. The medical oncologist is probably most utilized with people with incurable prostate cancer. Once it’s incurable, it develops tumors in the bones and lymph nodes most commonly, and we call it metastatic prostate cancer.
Right now we use mostly a once-size-fits-all approach. Everyone initially gets some form of castration therapy, usually medical castration with LHRH agonists. However, prostate cancer invariably becomes resistant to those maneuvers. We call that castration-resistant prostate cancer. That opens the door to 6 other treatments that can prolong survival in prostate cancer. Two of the treatments are hormonal (enzalutamide and abiraterone), 2 are chemotherapy (docetaxel and cabazitaxel), 1 is IV radiation with radium-223, and 1 is an immunotherapy (sipuleucel-T).
At this point, there’s not a lot of guidance about what to use when except that each of these therapies has unique AEs, so we may not use one of the therapies because it causes a lot of fatigue or it could cause seizures, for example, in a patient at risk for those. Sometimes the therapies are inappropriate. For example, with radium, you wouldn’t give it to a patient with a tumor in the liver.
We don’t have readily available companion diagnostics to help us narrow the selection. In 2015, there was an article in Cell that looked at men with metastatic castration-resistant prostate cancer. The tumors were biopsied and analyzed, and we found some surprising things, including certain mutations called DNA repair defects that could make them susceptible to a drug already approved in ovarian cancer, such as olaparib and rucaparib.
A subsequent study in the New England Journal of Medicine looked at patients with advanced prostate cancer whose cancers have these DNA repair defects. Those cancers were susceptible to the PARP (poly ADP ribose polymerase) inhibitor olaparib. That’s an example of where looking and sequencing a tumor could lead to a treatment selection. The PARP inhibitors are not yet approved in prostate cancer, but the Prostate Cancer Foundation is interested in supporting research that could help deliver appropriate therapies to veterans in particular whose cancers have certain markers.
So, we are biopsying patients’ tumors, looking at the mutations in their germline DNA, and matching patients to treatments and vice versa. The DNA repair defects is the one that’s probably under most active evaluation right now. Another example of a biomarker is the AR-V7, which is a mutation in the androgen receptor that renders the cancer resistant to enzalutamide and abiraterone.
Also, I have a study of pembrolizumab which is a PD-1 inhibitor, and I’ve seen some very good responses to that therapy. And we’re not yet sure how to identify prospectively those patients who are likely to respond.
Use of Imaging
Dr. Nickols. The sensitivity of technetium-99m bone scans and CT (computed tomography) scans is not good enough. Many patients that we classify as M0, but with clear evidence of disease with a rising PSA, will be more accurately classified as M1 when the imaging allows this to be the case.
I think prostate-specific membrane antigen positron emission tomography (PET), which is not approved at this time, is going to be of value. A lot of data are coming out of Europe and in the recurrence setting show that PET imaging can detect metastatic sites at PSA values as low as 0.2 with the per lesion sensitivity around 80% and a specificity upward of 97%. This is clearly far and away much better than anything we have now.
There’s going to be a whole cohort of patients that we literally can’t see now, patients with essentially minimally metastatic disease, and they will be revealed when the imaging gets there. And the question is what to do for these patients. Treating patients with a heavy metastatic disease burden is much different from treating patients who may have just one or a few areas of disease outside of their prostate. And we need new strategies for these patients. We are now looking at new treatment regimens for patients with limited metastatic disease burden. I think this is going to be important going forward.
It’s also worth asking: What is the role of local therapy in patients with advanced prostate cancer, patients with metastatic disease? If you look at the patients who were in a lot of the old trials, for example, the NCIC trial, that was adding radiation to hormone therapy for high-risk patients, about 25% of patients in that trial had a PSA > 50. That’s a lot. Many of those patients probably had occult metastases. And there are trials now looking at the role of local therapy in metastatic patients.
Another area of interest is precision oncology, which Dr. Graff touched on, is starting to play a big role in the metastatic setting, but what about the local setting? There are now genomic classifiers available to help with risk assessments, but we don’t yet have much in the way of predictive tools that help guide specific therapies in the localized setting. We know that patients, for example, who have germline BRCA1 or 2 mutations have a worse outcome, period, after local therapy; and right now it may play some into treatment decisions, but we don’t have tailored therapy yet in the localized setting at the molecular level. And I think this is something that we need to start looking at.
Dr. Aronson. The VA is a very rich environment for performing clinical research as well as translational research (bench to bedside). And for example, at the West Los Angeles VAMC, I think one of the key steps that we have taken, moving forward is now our urology, radiation oncology, and hematology-oncology research groups have now merged together. This allows us to not only combine our administrative resources but to really improve the ability for us to perform highquality research in our veterans. And so that’s a model which I think other VAs might consider pursuing, depending upon their circumstances.
Author Disclosures
Dr. Graff has received research support from Sanofi, Astellas, Merck, Janssen, and Bristol Myers Squibb; an honorarium from Astellas; travel support from Clovis and Sanofi; and has consulted for Bayer and Dendreon. No other authors report actual or potential conflicts of interest with regard to this article.
Disclaimer
The opinions expressed herein are those of the authors and do not necessarily reflect those of Federal Practitioner, Frontline Medical Communications Inc., the U.S. Government, or any of its agencies. This article may discuss unlabeled or investigational use of certain drugs. Please review the complete prescribing information for specific drugs or drug combinations—including indications, contraindications, warnings, and adverse effects—before administering pharmacologic therapy to patients.
Click here to read the digital edition.
Incidence and Management of Asymptomatic Hypertensive Urgency at a VA Emergency Department
Hypertension affects more than 65 million individuals in the U.S., accounting for nearly 30% of the adult population.1 Less than 50% of those with hypertension are taking appropriate pharmacotherapy.2 Hypertension contributes to cardiovascular events, including cerebrovascular accident, transient ischemic attack, hypertensive retinopathy, renal failure, myocardial infarction, and heart failure.1 Chronic hypertension mainly is an asymptomatic condition, earning the nickname “the silent killer.”2 An acute, symptomatic elevation in blood pressure (BP) often is referred to as hypertensive emergency. Symptoms of end-organ damage can include headache, blurry vision, chest pain, shortness of breath, altered mental status, epistaxis, and oliguria.2 Although rare, hypertensive emergencies should be treated immediately. The Seventh Report of the Joint National Committee (JNC 7), and the more recent JNC 8, have published guidelines on managing chronic hypertension.3,4 However, neither report provides guidance on hypertensive emergency or the appropriate actions in cases of extremely elevated BP in an asymptomatic patient.3,4
Acute hypertensive episodes—often referred to as hypertensive crises—are responsible for nearly 8 million hospitalizations each year and 20 million visits to the emergency department (ED).5,6 Most of these visits are same-day “treat-and-release” events.5 There is no universally accepted BP value associated with a hypertensive crisis, but most resources state that a BP ≥ 180/110 mm Hg requires attention.2,7 Without other symptoms, elevated BP is not an emergency, yet ED referral for acute management is common.7
Three terms fall under the umbrella of hypertensive crises: hypertensive emergency, hypertensive urgency, and asymptomatic hypertension (AH).2 In a 2007 article, the American College of Chest Physicians defined hypertensive emergency as BP ≥ 180/110 mm Hg with evidence of end-organ damage.2 Symptoms are almost always present in true hypertensive emergencies, and immediate medical intervention is required to halt further organ damage. In the same article, hypertensive urgency is defined as BP ≥ 180/110 mm Hg without end-organ damage.2 The definition of hypertensive urgency could be further refined to include the presence of cardiovascular and renal risk factors, although this additional point is not consistent across the literature. Asymptomatic hypertension is similar to hypertensive urgency; however, there is an absence of signs or symptoms of end-organ damage.2 There is ambiguity in the literature concerning managing hypertensive urgency and AH, but both share a basic tenet: Immediate BP reduction is not essential. Gradual dosage adjustment(s) of oral medications, preferably by a primary care provider (PCP), and follow-up within 7 days are recommended.7
Limited evidence exists to guide ED providers in managing AH. Long-term outcomes and guidelines intended for the primary care setting should not be extrapolated to acute management in the ED. With limited treatment guidelines, providers might be more likely to refer patients with AH to the ED for evaluation. In 2013, the American College of Emergency Physicians (ACEP) created a clinical policy concerning AH in the ED. The ACEP concluded that screening for target organ injury and medical intervention in the ED does not reduce rates of adverse events (AEs) and could lead to overtreatment and acute hypoperfusion.7 More recently, Patel and colleagues published findings on hypertensive urgency in the ambulatory care setting, which similarly found that referral to the ED was associated with increased use of health care resources and no change in short-term major AEs.8 The ACEP recommends that patients presenting with AH be referred to primary care clinics where long-term monitoring and medication adjustments can be achieved more cost-effectively.7
The objective of this retrospective evaluation was to assess the incidence and management of AH within a VA ED. The authors aimed to provide insight into how these patients are managed and discuss alternatives to ED use.
Methods
This retrospective observational study was conducted within the North Florida/South Georgia Veterans Health System (NFSGVHS), which provides patient care at 2 medical centers in Gainesville and Lake City, Florida, as well as 11 outpatient clinics located throughout North Florida and South Georgia. The NFSGVHS serves rural and urban veteran populations. Study approval was granted by the NFSGVHS Institutional Review Board and Research and Development Committee.
Inclusion/Exclusion Criteria
Adult patients who were ordered at least 1 antihypertensive medication in the ED from July 1, 2011 to July 1, 2014, in addition to being asymptomatic with BP ≥ 180/110 mm Hg at ED triage were included. Based on clinical experience, the authors estimated that 3 years would provide a sample size of more than 100 patients. Patients were excluded if they presented with any acute symptoms or were hospitalized for further management.
Data Collection
Baseline demographics were collected for all participants. During the ED encounter, pre- and postintervention vital signs were recorded and prespecified laboratory data obtained. Interrater reliability was accounted for by performing random reviews of previously collected data to ensure consistency during the chart review process. Renal end-organ damage was defined using Acute Kidney Injury Network criteria, a serum creatinine 50% above baseline, or an absolute increase in baseline serum creatinine by 0.3 mg/dL.9 Additional laboratory markers of organ damage included cardiac troponin levels. Urinalysis results also were assessed to determine the presence of hematuria or proteinuria. Patient-reported nonadherence with medications was determined by reviewing ED provider and/or nurse documentation notes for the index ED encounter.
Investigators documented the route (IV or oral) and antihypertensive(s) medication selected for each patient. Adverse effects and any changes to patients’ outpatient medication regimens were noted. Investigators also assessed days to next medical contact after ED discharge to determine whether follow-up occurred according to the recommended standard of 7 days.9 Days to next medical contact was defined as any contact—in person or by telephone—that was documented in the electronic health record after the index ED visit.
Statistical Analysis
Descriptive statistics, including mean, median, and standard deviation, were used to analyze data.
Results
A total of 1,052 patients presented with BP ≥ 180/110 mm Hg and for whom antihypertensive medication was ordered but not necessarily given in the ED. Of the total, 724 patients were excluded because of hospital admission for other primary diagnoses; however, 6 of these patients were admitted for hypertensive urgency. The final analysis included 132 patients who presented with the primary condition of elevated BP without any accompanying symptoms. Among these patients, 2 had repeat ED visits for AH during the specified time frame. 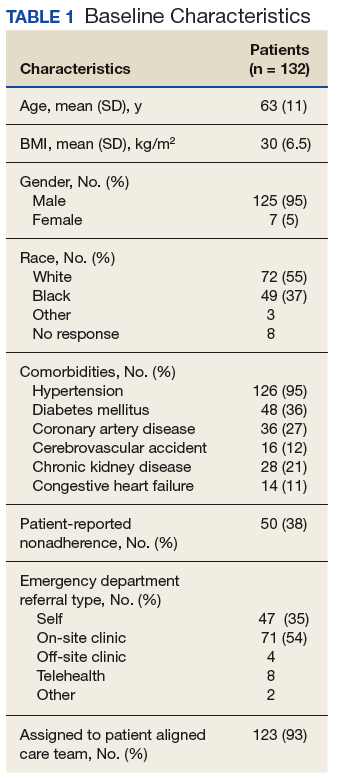
Most patients were male with an average age of 63 years and documented history of hypertension. Nearly all patients had established primary care within the NFSGVHS. The most common comorbidity was diabetes mellitus (36%), followed by coronary artery disease (27%) and chronic kidney disease (CKD) (21%) (Table 1). About one-third of patients presented to the ED on their own volition, and slightly more than half were referred to the ED by primary care or specialty clinics. 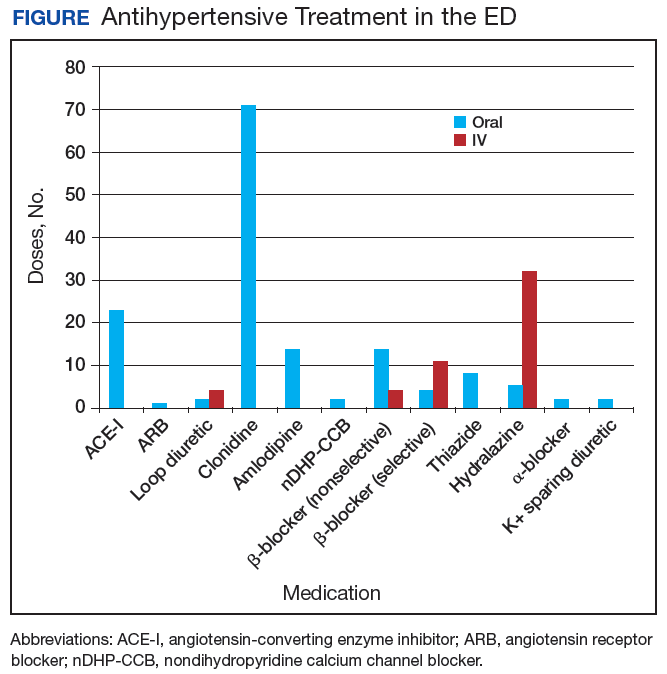
In the ED, 130 patients received BP treatment (Table 2). Medication was ordered for 2 patients who did not receive treatment. In total, 12 different medication classes were used for treating patients with AH in the ED (Figure). 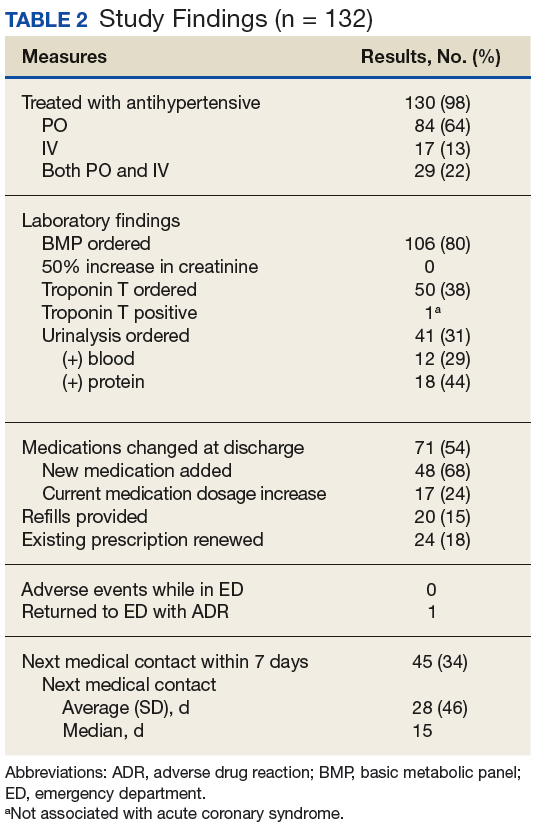
Treatment in the ED resulted in an average BP and heart rate reduction of 27/20 mm Hg and 5 beats per minute, respectively. About 80% of patients had a basic metabolic panel drawn, and there were no instances of acute kidney injury. Of the patients in the study 38% had cardiac enzymes collected, and only 1 patient had a positive result, which was determined to be unrelated to acute coronary syndrome. Forty-one (31%) of patients had a urinalysis; 12 has positive results for hematuria, and 18 revealed proteinuria. Of note, the 6 patients who were hospitalized for hypertensive urgency had neither symptoms at presentation to the ED nor laboratory findings indicating end-organ damage. The reason these patients were admitted is unclear.
At discharge, ED providers made changes to 54% of patients’ outpatient antihypertensive regimens. These changes included adding a new medication (68%), increasing the dosage of an existing medication (24%), or multiple changes (8%). Refills were provided for 18% of prescriptions. Follow-up within 7 days from ED discharge was recorded for 34% of patients. One patient received follow-up outside the NFSGVHS and was not included in this analysis.
Discussion
The aim of this retrospective study was to determine the incidence of AH in a VA ED and describe how these patients were managed. Overall, the rate of patients presenting to the ED with AH during the study period was about 1 patient every 8 days or 45 patients per year. By comparison, more than 30,000 patients are seen at the NFSGVHS ED annually. Although AH seems to be an uncommon occurrence, study findings raise questions about the value of managing the condition in the ED.
This study found several management strategies as well as noteworthy trends. For example, laboratory tests were not ordered routinely for all patients, suggesting that some ED providers question their use for AH. There were no patients with acute elevations in serum creatinine that indicated acute kidney injury, and although hematuria and proteinuria were common findings, neither were specific for acute injury. However, there were findings typical of chronic hypertension, and urinalysis may provide little benefit when testing for acute kidney injury. Only 1 patient showed elevated cardiac enzymes, which was determined to be a result of CKD.
Although not included in the final analysis, the 6 patients who were hospitalized for hypertensive urgency were similar in that they had neither symptoms at presentation to the ED nor laboratory findings indicating end-organ damage. Collectively, these findings support existing literature that questions the utility of laboratory testing of patients with AH in the ED.10
Patients also were treated with a variety of antihypertensive agents in the ED. One explanation might be outpatient nonadherence with medications. In patients with AH, it is common to provide doses of chronic medications that the patient might have missed and should be taking on a regular basis. Therefore, assessing adherence with current medications before modifying chronic therapy is an important initial step when managing AH.
Although oral agents primarily were used, IV antihypertensives were administered to about one-third of patients. Preference for IV administration in the ED might be related to its ability to lower BP quickly. The practice of obtaining IV access for medication in a patient with AH is costly, unnecessary, and potentially harmful.7 The authors theorize that this practice is performed, in many cases, as an attempt to expedite ED discharge after an acceptable BP reading is documented.
Rapid reductions in BP can precipitate hypoperfusion inadvertently and are more likely to occur with IV agents than with oral ones. Therefore, the safety, convenience, and cost savings associated with oral administration make it the preferred route for managing AH. 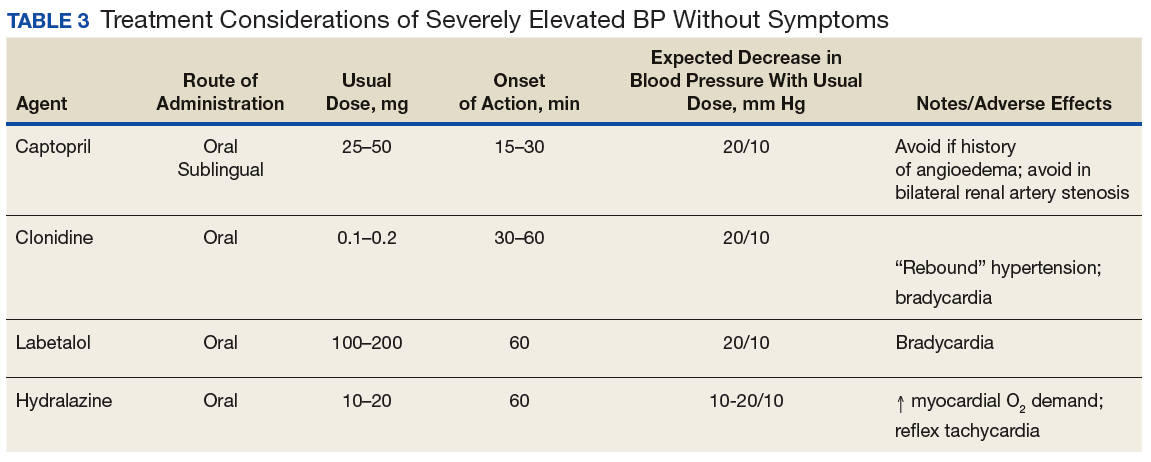
Best Practices
Primary care clinics are best suited to manage AH because medication adjustments and long-term monitoring are easier to perform and at substantially lower costs when compared with that of the ED. Rather than immediately referring a patient to the ED, clinicians should consider factors that could elevate BP, such as medication nonadherence, anxiety, acute pain, recent tobacco or caffeine use, or white coat syndrome. Staff should be well educated on proper BP measurement and instructed to repeat the reading for confirmation. Before measuring BP, allow the patient to sit quietly for 5 minutes with the feet flat on the floor and arm supported.3 Ideally, the measurement used should be the average of 3 BP readings on an automated device.11 If BP readings are high, staff should ask the patient about medication adherence and missed medication(s) should be administered.
It also is reasonable to have the patient rest quietly for up to 30 minutes because rest has been shown to reduce BP in some patients.12 The drawback to the prolonged rest strategy is the potential to cause delays in care for other patients. However, it is important to remember that wait times in the ED often are measured in hours, which causes frustration for patients referred to the ED for AH management. Before completing the office visit, the provider should recheck BP using proper technique and confirm that the patient has antihypertensive medication(s) in his/her possession; a follow-up appointment should be scheduled for no later than 1 week.
Primary care providers might be concerned about taking on additional liability and could favor ED referral, but legislation makes it difficult for EDs to defer nonemergent issues to primary care clinics. The Emergency Medical Treatment and Labor Act states that hospitals are prohibited from denying a patient care during an emergency.13 Despite evidence that AH is not an emergency, many patients continue to be referred to the ED. One-third of patients presented to the ED on their own volition and more than one-half were referred by health care personnel. This strongly suggests that both patients and health care personnel consider AH an emergency medical condition requiring immediate attention. However, patients with AH rarely are found to have any acute end-organ damage; therefore, acute treatment and extensive laboratory or diagnostic testing in the ED provides little, if any, benefit.10 The authors believe the ACEP clinical policy should be adopted into mainstream practice to help reduce health care costs and preserve ED resources for patients with true emergencies.
Another pervasive issue that could contribute to inappropriate AH referrals to the ED is the shortage of PCPs and limited same-day appointments for nonemergent conditions. In a 2017 survey, the average wait time for a PCP appointment ranged between 12 and 109 days, depending on the metropolitan area. The national average wait time conducted by this survey was 29.3 days.14 When primary care appointments are unavailable, triage staff could recommend that patients seek care in the ED. Additionally, patients might choose to seek ED care rather than wait for the next available PCP appointment. Clinic proximity to an ED could influence referral rates. In other words, medical centers or health systems with primary care clinics and ED services under one roof could experience more frequent ED referrals.
A promising strategy to help overcome the challenges of addressing AH and avoiding ED referrals is increasing patient access to and use of qualified, nonphysician providers, such as clinical pharmacists and nurse practitioners. Large health systems such as the VA and Kaiser Permanente have employed clinical pharmacist providers to reduce follow-up times for patients in primary care settings.15 Furthermore, there is substantial evidence that supports the cost-effectiveness and clinical success of pharmacist-driven hypertension clinics.16-18 Nurse-driven efforts to improve hypertension control have been successfully implemented in health systems.19 Both clinical pharmacist and nurse-managed hypertension clinics are effective solutions to manage patients with AH who might otherwise use costly ED services.For example, the average cost of a single ED visit is $740 to $3,437.20 In comparison, a 2010 report from the Agency for Healthcare Research and Quality showed the average annual cost of managing hypertension in ambulatory care clinics was $442 per adult, a cost considerably lower than that of the ED.21
Limitations
The retrospective and observational design of this study are inherent limitations. This study was not designed to evaluate cardiovascular outcomes after ED encounters. The sample size could have been larger if patients with BP < 180/110 mm Hg at ED triage were included; however, the 180/110 mm Hg threshold was chosen because it was the most widely agreed on BP value in the literature. This study did not capture patients who presented with AH and did not receive any acute treatment in the ED.Prescribing patterns based on provider training (eg, emergency medicine, family medicine, or internal medicine) were not tracked and might have accounted for differences in selection of diagnostic tests, laboratory ordering, and route of drug administration preference.
A small subset of patients reported positive pain scores at triage but did not describe acute pain. Pain scores are highly subjective, and few primary literature sources link chronic pain with increased BP.22,23 Nevertheless, patients who reported acute pain and elevated BP were excluded in order to identify truly asymptomatic patients. VA hospitals are unique health systems and data obtained from this study might not be applicable to other public or private facilities. Last, the study did not take into account patients’ psychosocial circumstances that might have fostered a disproportionate reliance on the ED for health care.
Conclusion
Asymptomatic patients with elevated BP are treated in the ED despite no evidence supporting improved outcomes after acute BP lowering in this population. Follow-up after ED encounters for AH did not occur consistently within guideline-recommended 7 days, a trend that also occurs in non-VA systems.8 Clinics and health care systems could establish policies to prevent or minimize management of AH in the ED. Ideally, AH should be managed in a clinic setting by a PCP, but growing clinician workload might lead to increasing wait times and difficultly obtaining same-day appointments. Nurse-led clinics and clinical pharmacists operating under a scope of practice and working closely with a PCP are a cost-effective solution to ensure timely treatment and appropriate follow-up of patients with uncontrolled hypertension.
Acknowledgments
This material is the result of work supported with resources and the use of facilities at the North Florida South Georgia Veterans Health System in Gainesville, Florida.
1. Nwankwo T, Yoon SS, Burt V, Gu Q. Hypertension among adults in the United States: National Health and Nutrition Examination Survey, 2011-2012. NCHS Data Brief. 2013;(133):
1-8.
2. Marik PE, Varon J. Hypertensive crises: challenges and management. Chest. 2007;131(6):1949-1962.
3. Chobanian AV, Bakris GL, Black HR, et al; Joint National Committee on Prevention, Detection, Evaluation, and Treatment of High Blood Pressure. National Heart, Lung, and Blood Institute; National High Blood Pressure Education Program Coordinating Committee. Seventh report of the joint national committee on prevention, detection, evaluation, and treatment of high blood pressure. Hypertension. 2003;42(6):1206-1252.
4. James, PA, Oparil, S, Carter, BL, et al. 2014 Evidence-based guideline for the management of high blood pressure in adults report from the panel members appointed to the Eighth Joint National Committee (JNC 8). JAMA. 2014;311(5):507-520.
5. American Heart Association. High blood pressure ER visits jumped 25 percent in 2006-11. http://newsroom.heart.org/news/high-blood-pressure-er-visits-jumped-25-percent-in-2006-11. Published September 9, 2014. Accessed January 19, 2018.
6. Owens P, Mutter R. Statistical brief #100: emergency department visits for adults in community hospitals. Agency for Healthcare Research and Quality. http://www.hcup-us.ahrq.gov/reports/statbriefs/sb100.pdf. Published November 2010. Accessed January 19, 2018.
7. Wolf SJ, Lo B, Shih RD, Smith MD, Fesmire FM; American College of Emergency Physicians Clinical Policies Committee. Clinical policy: critical issues in the evaluation and management of adult patients in the emergency department with asymptomatic elevated blood pressure. Ann Emerg Med. 2013;62(1):59-68.
8. Patel KK, Young L, Howell EH, et al. Characteristics and outcomes of patients presenting with hypertensive urgency in the office setting. JAMA Intern Med. 2016;176(7):981-988.
9. Acute Kidney Injury Network. AKIN studies. http://www.akinet.org/akinstudies.php. Updated 2017. Accessed January 19, 2018.
10. Karras DJ, Kruus LK, Cienki JJ, et al. Utility of routine testing for patients with asymptomatic severe blood pressure elevation in the emergency department. Ann Emerg Med. 2008;51(3):231-239.
11. The SPRINT Research Group. A Randomized trial of Intensive versus standard blood pressure control. N Engl J Med. 2015;373:2103-2116.
12. Grassi D, O’Flaherty M, Pellizzari M, et al; Group of Investigators of the REHASE Program. Hypertensive urgencies in the emergency department: evaluating blood pressure response to rest and to antihypertensive drugs with different profiles. J Clin Hypertens (Greenwich). 2008;10(9):662-667.
13. Canters for Medicare & Medicaid Services. Emergency medical treatment & labor act (EMTALA). https://www.cms.gov/Regulations-and-Guidance/Legislation/EMTALA/index.html. Updated March 26, 2012. Accessed January 19, 2018.
14. Merritt Hawkins. 2017 Survey of physician appointment wait times and Medicare and Medicaid acceptance rates. https://www.merritthawkins.com/uploadedFiles/Merritt-Hawkins/Pdf/mha2017waittimesurveyPDF.pdf. Published 2017. Accessed January 19, 2018.
15. Galewitz P. VA treats patients’ impatience with clinical pharmacists. USA Today. http://www.usatoday.com/story/news/2016/10/24/kaiser-va-treats-patients-impatience-clinical-pharmacists/92479132/. Published October 24, 2016. Accessed January 19, 2018.
16. Carter BL, Ardery G, Dawson JD, et al. Physician and pharmacist collaboration to improve blood pressure control. Arch Intern Med. 2009;169(21):1996-2002.
17. Borenstein JE, Graber G, Saltiel E, et al. Physician-pharmacist comanagement of hypertension: a randomized comparative trial. Pharmacotherapy. 2003;23(2):209-216.
18. Okamoto MP, Nakahiro RK. Pharmacoeconomic evaluation of a pharmacist-managed hypertension clinic. Pharmacotherapy. 2001;21(11):1337-1344.
19. Brown VM. Managing patients with hypertension in nurse-led clinics. Nursing. 2017;47(4):16-19.
20. Caldwell N, Srebotnjak T, Wang T, Hsia R. “How Much Will I Get Charged for This?” Patient charges for top ten diagnoses in the emergency department. PLoS ONE. 2013;8(2): e55491.
21. Davis KE. Expenditures for hypertension among adults age 18 and older, 2010: estimates for the U.S. civilian noninstitutionalized population. Agency for Healthcare Research and Quality. https://meps.ahrq.gov/data_files/publications/st404/stat404.shtml. Published April 2013. Accessed January 19, 2018.
22. Marco CA, Plewa MC, Buderer N, et al. Self-reported pain scores in the emergency department: lack of association with vital signs. Acad Emerg Med. 2006;13(9):974-979.
23. Wood D, Goodnight S, Haig AJ, Nasari T. Body mass index, but not blood pressure is related to the level of pain in persons with chronic pain. J Back Musculoskelet Rehabil. 2011;24(2):
111-115.
Hypertension affects more than 65 million individuals in the U.S., accounting for nearly 30% of the adult population.1 Less than 50% of those with hypertension are taking appropriate pharmacotherapy.2 Hypertension contributes to cardiovascular events, including cerebrovascular accident, transient ischemic attack, hypertensive retinopathy, renal failure, myocardial infarction, and heart failure.1 Chronic hypertension mainly is an asymptomatic condition, earning the nickname “the silent killer.”2 An acute, symptomatic elevation in blood pressure (BP) often is referred to as hypertensive emergency. Symptoms of end-organ damage can include headache, blurry vision, chest pain, shortness of breath, altered mental status, epistaxis, and oliguria.2 Although rare, hypertensive emergencies should be treated immediately. The Seventh Report of the Joint National Committee (JNC 7), and the more recent JNC 8, have published guidelines on managing chronic hypertension.3,4 However, neither report provides guidance on hypertensive emergency or the appropriate actions in cases of extremely elevated BP in an asymptomatic patient.3,4
Acute hypertensive episodes—often referred to as hypertensive crises—are responsible for nearly 8 million hospitalizations each year and 20 million visits to the emergency department (ED).5,6 Most of these visits are same-day “treat-and-release” events.5 There is no universally accepted BP value associated with a hypertensive crisis, but most resources state that a BP ≥ 180/110 mm Hg requires attention.2,7 Without other symptoms, elevated BP is not an emergency, yet ED referral for acute management is common.7
Three terms fall under the umbrella of hypertensive crises: hypertensive emergency, hypertensive urgency, and asymptomatic hypertension (AH).2 In a 2007 article, the American College of Chest Physicians defined hypertensive emergency as BP ≥ 180/110 mm Hg with evidence of end-organ damage.2 Symptoms are almost always present in true hypertensive emergencies, and immediate medical intervention is required to halt further organ damage. In the same article, hypertensive urgency is defined as BP ≥ 180/110 mm Hg without end-organ damage.2 The definition of hypertensive urgency could be further refined to include the presence of cardiovascular and renal risk factors, although this additional point is not consistent across the literature. Asymptomatic hypertension is similar to hypertensive urgency; however, there is an absence of signs or symptoms of end-organ damage.2 There is ambiguity in the literature concerning managing hypertensive urgency and AH, but both share a basic tenet: Immediate BP reduction is not essential. Gradual dosage adjustment(s) of oral medications, preferably by a primary care provider (PCP), and follow-up within 7 days are recommended.7
Limited evidence exists to guide ED providers in managing AH. Long-term outcomes and guidelines intended for the primary care setting should not be extrapolated to acute management in the ED. With limited treatment guidelines, providers might be more likely to refer patients with AH to the ED for evaluation. In 2013, the American College of Emergency Physicians (ACEP) created a clinical policy concerning AH in the ED. The ACEP concluded that screening for target organ injury and medical intervention in the ED does not reduce rates of adverse events (AEs) and could lead to overtreatment and acute hypoperfusion.7 More recently, Patel and colleagues published findings on hypertensive urgency in the ambulatory care setting, which similarly found that referral to the ED was associated with increased use of health care resources and no change in short-term major AEs.8 The ACEP recommends that patients presenting with AH be referred to primary care clinics where long-term monitoring and medication adjustments can be achieved more cost-effectively.7
The objective of this retrospective evaluation was to assess the incidence and management of AH within a VA ED. The authors aimed to provide insight into how these patients are managed and discuss alternatives to ED use.
Methods
This retrospective observational study was conducted within the North Florida/South Georgia Veterans Health System (NFSGVHS), which provides patient care at 2 medical centers in Gainesville and Lake City, Florida, as well as 11 outpatient clinics located throughout North Florida and South Georgia. The NFSGVHS serves rural and urban veteran populations. Study approval was granted by the NFSGVHS Institutional Review Board and Research and Development Committee.
Inclusion/Exclusion Criteria
Adult patients who were ordered at least 1 antihypertensive medication in the ED from July 1, 2011 to July 1, 2014, in addition to being asymptomatic with BP ≥ 180/110 mm Hg at ED triage were included. Based on clinical experience, the authors estimated that 3 years would provide a sample size of more than 100 patients. Patients were excluded if they presented with any acute symptoms or were hospitalized for further management.
Data Collection
Baseline demographics were collected for all participants. During the ED encounter, pre- and postintervention vital signs were recorded and prespecified laboratory data obtained. Interrater reliability was accounted for by performing random reviews of previously collected data to ensure consistency during the chart review process. Renal end-organ damage was defined using Acute Kidney Injury Network criteria, a serum creatinine 50% above baseline, or an absolute increase in baseline serum creatinine by 0.3 mg/dL.9 Additional laboratory markers of organ damage included cardiac troponin levels. Urinalysis results also were assessed to determine the presence of hematuria or proteinuria. Patient-reported nonadherence with medications was determined by reviewing ED provider and/or nurse documentation notes for the index ED encounter.
Investigators documented the route (IV or oral) and antihypertensive(s) medication selected for each patient. Adverse effects and any changes to patients’ outpatient medication regimens were noted. Investigators also assessed days to next medical contact after ED discharge to determine whether follow-up occurred according to the recommended standard of 7 days.9 Days to next medical contact was defined as any contact—in person or by telephone—that was documented in the electronic health record after the index ED visit.
Statistical Analysis
Descriptive statistics, including mean, median, and standard deviation, were used to analyze data.
Results
A total of 1,052 patients presented with BP ≥ 180/110 mm Hg and for whom antihypertensive medication was ordered but not necessarily given in the ED. Of the total, 724 patients were excluded because of hospital admission for other primary diagnoses; however, 6 of these patients were admitted for hypertensive urgency. The final analysis included 132 patients who presented with the primary condition of elevated BP without any accompanying symptoms. Among these patients, 2 had repeat ED visits for AH during the specified time frame.
Most patients were male with an average age of 63 years and documented history of hypertension. Nearly all patients had established primary care within the NFSGVHS. The most common comorbidity was diabetes mellitus (36%), followed by coronary artery disease (27%) and chronic kidney disease (CKD) (21%) (Table 1). About one-third of patients presented to the ED on their own volition, and slightly more than half were referred to the ED by primary care or specialty clinics.
In the ED, 130 patients received BP treatment (Table 2). Medication was ordered for 2 patients who did not receive treatment. In total, 12 different medication classes were used for treating patients with AH in the ED (Figure).
Treatment in the ED resulted in an average BP and heart rate reduction of 27/20 mm Hg and 5 beats per minute, respectively. About 80% of patients had a basic metabolic panel drawn, and there were no instances of acute kidney injury. Of the patients in the study 38% had cardiac enzymes collected, and only 1 patient had a positive result, which was determined to be unrelated to acute coronary syndrome. Forty-one (31%) of patients had a urinalysis; 12 has positive results for hematuria, and 18 revealed proteinuria. Of note, the 6 patients who were hospitalized for hypertensive urgency had neither symptoms at presentation to the ED nor laboratory findings indicating end-organ damage. The reason these patients were admitted is unclear.
At discharge, ED providers made changes to 54% of patients’ outpatient antihypertensive regimens. These changes included adding a new medication (68%), increasing the dosage of an existing medication (24%), or multiple changes (8%). Refills were provided for 18% of prescriptions. Follow-up within 7 days from ED discharge was recorded for 34% of patients. One patient received follow-up outside the NFSGVHS and was not included in this analysis.
Discussion
The aim of this retrospective study was to determine the incidence of AH in a VA ED and describe how these patients were managed. Overall, the rate of patients presenting to the ED with AH during the study period was about 1 patient every 8 days or 45 patients per year. By comparison, more than 30,000 patients are seen at the NFSGVHS ED annually. Although AH seems to be an uncommon occurrence, study findings raise questions about the value of managing the condition in the ED.
This study found several management strategies as well as noteworthy trends. For example, laboratory tests were not ordered routinely for all patients, suggesting that some ED providers question their use for AH. There were no patients with acute elevations in serum creatinine that indicated acute kidney injury, and although hematuria and proteinuria were common findings, neither were specific for acute injury. However, there were findings typical of chronic hypertension, and urinalysis may provide little benefit when testing for acute kidney injury. Only 1 patient showed elevated cardiac enzymes, which was determined to be a result of CKD.
Although not included in the final analysis, the 6 patients who were hospitalized for hypertensive urgency were similar in that they had neither symptoms at presentation to the ED nor laboratory findings indicating end-organ damage. Collectively, these findings support existing literature that questions the utility of laboratory testing of patients with AH in the ED.10
Patients also were treated with a variety of antihypertensive agents in the ED. One explanation might be outpatient nonadherence with medications. In patients with AH, it is common to provide doses of chronic medications that the patient might have missed and should be taking on a regular basis. Therefore, assessing adherence with current medications before modifying chronic therapy is an important initial step when managing AH.
Although oral agents primarily were used, IV antihypertensives were administered to about one-third of patients. Preference for IV administration in the ED might be related to its ability to lower BP quickly. The practice of obtaining IV access for medication in a patient with AH is costly, unnecessary, and potentially harmful.7 The authors theorize that this practice is performed, in many cases, as an attempt to expedite ED discharge after an acceptable BP reading is documented.
Rapid reductions in BP can precipitate hypoperfusion inadvertently and are more likely to occur with IV agents than with oral ones. Therefore, the safety, convenience, and cost savings associated with oral administration make it the preferred route for managing AH.
Best Practices
Primary care clinics are best suited to manage AH because medication adjustments and long-term monitoring are easier to perform and at substantially lower costs when compared with that of the ED. Rather than immediately referring a patient to the ED, clinicians should consider factors that could elevate BP, such as medication nonadherence, anxiety, acute pain, recent tobacco or caffeine use, or white coat syndrome. Staff should be well educated on proper BP measurement and instructed to repeat the reading for confirmation. Before measuring BP, allow the patient to sit quietly for 5 minutes with the feet flat on the floor and arm supported.3 Ideally, the measurement used should be the average of 3 BP readings on an automated device.11 If BP readings are high, staff should ask the patient about medication adherence and missed medication(s) should be administered.
It also is reasonable to have the patient rest quietly for up to 30 minutes because rest has been shown to reduce BP in some patients.12 The drawback to the prolonged rest strategy is the potential to cause delays in care for other patients. However, it is important to remember that wait times in the ED often are measured in hours, which causes frustration for patients referred to the ED for AH management. Before completing the office visit, the provider should recheck BP using proper technique and confirm that the patient has antihypertensive medication(s) in his/her possession; a follow-up appointment should be scheduled for no later than 1 week.
Primary care providers might be concerned about taking on additional liability and could favor ED referral, but legislation makes it difficult for EDs to defer nonemergent issues to primary care clinics. The Emergency Medical Treatment and Labor Act states that hospitals are prohibited from denying a patient care during an emergency.13 Despite evidence that AH is not an emergency, many patients continue to be referred to the ED. One-third of patients presented to the ED on their own volition and more than one-half were referred by health care personnel. This strongly suggests that both patients and health care personnel consider AH an emergency medical condition requiring immediate attention. However, patients with AH rarely are found to have any acute end-organ damage; therefore, acute treatment and extensive laboratory or diagnostic testing in the ED provides little, if any, benefit.10 The authors believe the ACEP clinical policy should be adopted into mainstream practice to help reduce health care costs and preserve ED resources for patients with true emergencies.
Another pervasive issue that could contribute to inappropriate AH referrals to the ED is the shortage of PCPs and limited same-day appointments for nonemergent conditions. In a 2017 survey, the average wait time for a PCP appointment ranged between 12 and 109 days, depending on the metropolitan area. The national average wait time conducted by this survey was 29.3 days.14 When primary care appointments are unavailable, triage staff could recommend that patients seek care in the ED. Additionally, patients might choose to seek ED care rather than wait for the next available PCP appointment. Clinic proximity to an ED could influence referral rates. In other words, medical centers or health systems with primary care clinics and ED services under one roof could experience more frequent ED referrals.
A promising strategy to help overcome the challenges of addressing AH and avoiding ED referrals is increasing patient access to and use of qualified, nonphysician providers, such as clinical pharmacists and nurse practitioners. Large health systems such as the VA and Kaiser Permanente have employed clinical pharmacist providers to reduce follow-up times for patients in primary care settings.15 Furthermore, there is substantial evidence that supports the cost-effectiveness and clinical success of pharmacist-driven hypertension clinics.16-18 Nurse-driven efforts to improve hypertension control have been successfully implemented in health systems.19 Both clinical pharmacist and nurse-managed hypertension clinics are effective solutions to manage patients with AH who might otherwise use costly ED services.For example, the average cost of a single ED visit is $740 to $3,437.20 In comparison, a 2010 report from the Agency for Healthcare Research and Quality showed the average annual cost of managing hypertension in ambulatory care clinics was $442 per adult, a cost considerably lower than that of the ED.21
Limitations
The retrospective and observational design of this study are inherent limitations. This study was not designed to evaluate cardiovascular outcomes after ED encounters. The sample size could have been larger if patients with BP < 180/110 mm Hg at ED triage were included; however, the 180/110 mm Hg threshold was chosen because it was the most widely agreed on BP value in the literature. This study did not capture patients who presented with AH and did not receive any acute treatment in the ED.Prescribing patterns based on provider training (eg, emergency medicine, family medicine, or internal medicine) were not tracked and might have accounted for differences in selection of diagnostic tests, laboratory ordering, and route of drug administration preference.
A small subset of patients reported positive pain scores at triage but did not describe acute pain. Pain scores are highly subjective, and few primary literature sources link chronic pain with increased BP.22,23 Nevertheless, patients who reported acute pain and elevated BP were excluded in order to identify truly asymptomatic patients. VA hospitals are unique health systems and data obtained from this study might not be applicable to other public or private facilities. Last, the study did not take into account patients’ psychosocial circumstances that might have fostered a disproportionate reliance on the ED for health care.
Conclusion
Asymptomatic patients with elevated BP are treated in the ED despite no evidence supporting improved outcomes after acute BP lowering in this population. Follow-up after ED encounters for AH did not occur consistently within guideline-recommended 7 days, a trend that also occurs in non-VA systems.8 Clinics and health care systems could establish policies to prevent or minimize management of AH in the ED. Ideally, AH should be managed in a clinic setting by a PCP, but growing clinician workload might lead to increasing wait times and difficultly obtaining same-day appointments. Nurse-led clinics and clinical pharmacists operating under a scope of practice and working closely with a PCP are a cost-effective solution to ensure timely treatment and appropriate follow-up of patients with uncontrolled hypertension.
Acknowledgments
This material is the result of work supported with resources and the use of facilities at the North Florida South Georgia Veterans Health System in Gainesville, Florida.
1. Nwankwo T, Yoon SS, Burt V, Gu Q. Hypertension among adults in the United States: National Health and Nutrition Examination Survey, 2011-2012. NCHS Data Brief. 2013;(133):
1-8.
2. Marik PE, Varon J. Hypertensive crises: challenges and management. Chest. 2007;131(6):1949-1962.
3. Chobanian AV, Bakris GL, Black HR, et al; Joint National Committee on Prevention, Detection, Evaluation, and Treatment of High Blood Pressure. National Heart, Lung, and Blood Institute; National High Blood Pressure Education Program Coordinating Committee. Seventh report of the joint national committee on prevention, detection, evaluation, and treatment of high blood pressure. Hypertension. 2003;42(6):1206-1252.
4. James, PA, Oparil, S, Carter, BL, et al. 2014 Evidence-based guideline for the management of high blood pressure in adults report from the panel members appointed to the Eighth Joint National Committee (JNC 8). JAMA. 2014;311(5):507-520.
5. American Heart Association. High blood pressure ER visits jumped 25 percent in 2006-11. http://newsroom.heart.org/news/high-blood-pressure-er-visits-jumped-25-percent-in-2006-11. Published September 9, 2014. Accessed January 19, 2018.
6. Owens P, Mutter R. Statistical brief #100: emergency department visits for adults in community hospitals. Agency for Healthcare Research and Quality. http://www.hcup-us.ahrq.gov/reports/statbriefs/sb100.pdf. Published November 2010. Accessed January 19, 2018.
7. Wolf SJ, Lo B, Shih RD, Smith MD, Fesmire FM; American College of Emergency Physicians Clinical Policies Committee. Clinical policy: critical issues in the evaluation and management of adult patients in the emergency department with asymptomatic elevated blood pressure. Ann Emerg Med. 2013;62(1):59-68.
8. Patel KK, Young L, Howell EH, et al. Characteristics and outcomes of patients presenting with hypertensive urgency in the office setting. JAMA Intern Med. 2016;176(7):981-988.
9. Acute Kidney Injury Network. AKIN studies. http://www.akinet.org/akinstudies.php. Updated 2017. Accessed January 19, 2018.
10. Karras DJ, Kruus LK, Cienki JJ, et al. Utility of routine testing for patients with asymptomatic severe blood pressure elevation in the emergency department. Ann Emerg Med. 2008;51(3):231-239.
11. The SPRINT Research Group. A Randomized trial of Intensive versus standard blood pressure control. N Engl J Med. 2015;373:2103-2116.
12. Grassi D, O’Flaherty M, Pellizzari M, et al; Group of Investigators of the REHASE Program. Hypertensive urgencies in the emergency department: evaluating blood pressure response to rest and to antihypertensive drugs with different profiles. J Clin Hypertens (Greenwich). 2008;10(9):662-667.
13. Canters for Medicare & Medicaid Services. Emergency medical treatment & labor act (EMTALA). https://www.cms.gov/Regulations-and-Guidance/Legislation/EMTALA/index.html. Updated March 26, 2012. Accessed January 19, 2018.
14. Merritt Hawkins. 2017 Survey of physician appointment wait times and Medicare and Medicaid acceptance rates. https://www.merritthawkins.com/uploadedFiles/Merritt-Hawkins/Pdf/mha2017waittimesurveyPDF.pdf. Published 2017. Accessed January 19, 2018.
15. Galewitz P. VA treats patients’ impatience with clinical pharmacists. USA Today. http://www.usatoday.com/story/news/2016/10/24/kaiser-va-treats-patients-impatience-clinical-pharmacists/92479132/. Published October 24, 2016. Accessed January 19, 2018.
16. Carter BL, Ardery G, Dawson JD, et al. Physician and pharmacist collaboration to improve blood pressure control. Arch Intern Med. 2009;169(21):1996-2002.
17. Borenstein JE, Graber G, Saltiel E, et al. Physician-pharmacist comanagement of hypertension: a randomized comparative trial. Pharmacotherapy. 2003;23(2):209-216.
18. Okamoto MP, Nakahiro RK. Pharmacoeconomic evaluation of a pharmacist-managed hypertension clinic. Pharmacotherapy. 2001;21(11):1337-1344.
19. Brown VM. Managing patients with hypertension in nurse-led clinics. Nursing. 2017;47(4):16-19.
20. Caldwell N, Srebotnjak T, Wang T, Hsia R. “How Much Will I Get Charged for This?” Patient charges for top ten diagnoses in the emergency department. PLoS ONE. 2013;8(2): e55491.
21. Davis KE. Expenditures for hypertension among adults age 18 and older, 2010: estimates for the U.S. civilian noninstitutionalized population. Agency for Healthcare Research and Quality. https://meps.ahrq.gov/data_files/publications/st404/stat404.shtml. Published April 2013. Accessed January 19, 2018.
22. Marco CA, Plewa MC, Buderer N, et al. Self-reported pain scores in the emergency department: lack of association with vital signs. Acad Emerg Med. 2006;13(9):974-979.
23. Wood D, Goodnight S, Haig AJ, Nasari T. Body mass index, but not blood pressure is related to the level of pain in persons with chronic pain. J Back Musculoskelet Rehabil. 2011;24(2):
111-115.
Hospitalization Risk With Benzodiazepine and Opioid Use in Veterans With Posttraumatic Stress Disorder (FULL)
Posttraumatic stress disorder (PTSD) is a mental health condition that may develop in response to a traumatic event, such as that experienced by a soldier during active combat duty. In 2009, more than 495,000 veterans within the VA health care system were treated for PTSD—nearly triple the number a decade earlier.1 Core symptoms of PTSD include alterations in arousal and reactivity, avoidant behaviors, negative alterations in mood and cognition, and intrusive thoughts and nightmares. All of the symptoms can be debilitating. First-line pharmacotherapy options that target these core symptoms include selective serotonin reuptake inhibitors (SSRIs) and serotonin norepinephrine reuptake inhibitors (SNRIs).2
The anxiolytic and sedative effects of benzodiazepines may provide quick relief from many of the secondary symptoms of PTSD, including sleep disturbances, irritability, and panic attacks. However, benzodiazepines potentially interfere with the extinction of conditioned fear—a goal integral to certain types of psychotherapy, such as exposure therapy.3,4 In addition, the systematic review and meta-analysis by Guina and colleagues revealed that benzodiazepines are ineffective in the treatment of PTSD.5 The majority of the evaluated studies that used PTSD-specific measures (eg, Clinician-Administered PTSD Scale [CAPS]) found increased PTSD severity and worse prognosis with use of these medications.5 In 2010, the VA and the DoD released a joint guideline for PTSD management.2 According to the guideline, benzodiazepines cause harm when used in PTSD and are relatively contraindicated in combat veterans because of the higher incidence of comorbid substance use disorders (SUDs) in these veterans relative to the general population.2,6
Opioid use also has been linked to poor functional and clinical outcomes in veterans with PTSD. Among patients being treated for opioid use disorder, those with PTSD were less likely to endorse employment as a main source of income and had a higher incidence of recent attempted suicide.7 In a large retrospective cohort study, Operation Iraqi Freedom and Operation Enduring Freedom veterans with PTSD who were prescribed opioids were more likely to present to the emergency department (ED) and to be hospitalized for overdoses and injuries.8
Despite the risks of benzodiazepine and opioid use in this patient population, these medications are still often prescribed to veterans with PTSD for symptomatic relief. In fiscal year 2009, across the VHA system 37% of veterans diagnosed with PTSD were prescribed a benzodiazepine, 69% of the time by a mental health provider.9 Among Iraq and Afghanistan veterans, those with PTSD were significantly more likely to be prescribed an opioid for diagnosed pain—relative to those with a mental health disorder other than PTSD and those without a mental health disorder.8 Thus, there seems to be a disconnect between guideline recommendations and current practice.
The authors conducted a study to assess the potential risk of hospitalization for veterans with PTSD prescribed first-line pharmacotherapy and those also prescribed concurrent benzodiazepine and/or opioid therapy since the release of the PTSD guideline in 2010.2
Methods
In this retrospective cohort study, conducted at the Southern Arizona VA Health Care System (SAVAHCS), the authors analyzed electronic medical record data from November 1, 2009 to August 1, 2015. Study inclusion criteria were veteran, aged 18 to 89 years, diagnosis of PTSD (International Classification of Diseases, Ninth Revision, Clinical Modification code 309.81), and SSRI or SNRI newly prescribed between November 1, 2010 and August 1, 2013.
Any veteran prescribed at least one 30-day or longer supply of any benzodiazepine or opioid within 1 year before the SSRI/SNRI initial prescription date was excluded from the study. Also excluded was any patient treated for PTSD at a facility outside SAVAHCS or whose 2-year evaluation period extended past August 1, 2015.
Study Groups
An outpatient prescription was determined to be the initial SSRI/SNRI prescription for a patient who received less than a 30-day cumulative supply of any SSRI or SNRI within 1 year before that prescription date. Citalopram, desvenlafaxine, duloxetine, escitalopram, fluoxetine, fluvoxamine, levomilnacipran, milnacipran, paroxetine, sertraline, venlafaxine, vilazodone, and vortioxetine were the prespecified SSRI/SNRIs included in the study.
Patients who received at least 1 outpatient prescription for any benzodiazepine (minimum 30-day supply) within 1 year after the initial SSRI/SNRI prescription date were determined to be on concurrent SSRI/SNRI and benzodiazepine therapy. Alprazolam, chlordiazepoxide, clonazepam, clorazepate, diazepam, estazolam, flurazepam, lorazepam, oxazepam, temazepam, and triazolam were the prespecified benzodiazepines included in the study.
Patients who received at least 1 outpatient prescription for any opioid (minimum 30-day supply) within 1 year after the initial SSRI/SNRI prescription date were determined to be on concurrent SSRI/SNRI and opioid therapy. Codeine, fentanyl, hydrocodone, hydromorphone, levorphanol, meperidine, methadone, morphine, oxymorphone, pentazocine, propoxyphene, and tramadol were the prespecified opioids included in this study.
Patients who received at least 1 outpatient prescription for any benzodiazepine and any opioid (minimum 30-day supply) within 1 year after the initial SSRI/SNRI prescription date were determined to be on concurrent SSRI/SNRI, benzodiazepine, and opioid therapy.
The index date was defined as the first date of prescription overlap. If there was no benzodiazepine or opioid prescription within 1 year after the initial SSRI/SNRI prescription date, the patient was categorized as being on SSRI/SNRI monotherapy, and the index date was the date of the initial SSRI/SNRI prescription. For each patient, hospitalization data from the 2-year period after the index date were evaluated.
Outcomes and Data Collection
For evaluation of the primary outcome (2-year overall hospitalization risk), the number of unique mental health and medical/surgical hospitalizations was identified by the number of discharge summaries documented in the patient chart during the evaluation period. Time to first hospitalization was recorded for the survival data analysis. Secondary outcomes were mental health hospitalization risk, medical/surgical hospitalization risk, and all-cause mortality within 2 years.
Demographic data that were collected included age, sex, comorbid mental health disorders, comorbid SUDs, and concomitant use of psychotropic medications at index date (baseline). Select comorbid mental health disorders (anxiety, schizophrenia, depression, bipolar disorder) and substance use disorders (alcohol, opioid, illicit drug) also were identified. Data on insomnia and pain comorbidities (headaches or migraines; neuropathy; head, neck, back, arthritis, or joint pain) were collected, as these comorbidities could be indications for prescribing benzodiazepines and opioids. Concomitant baseline use of classes of psychotropic medications (antipsychotics, non-SSRI/SNRI antidepressants, mood stabilizers, anxiolytics, nonbenzodiazepine sedatives/hypnotics) also were documented. Last, hospitalizations within 6 months before the initial SSRI/SNRI prescription date were noted.
Statistical Analysis
Descriptive statistics were used to analyze all baseline demographic data. Continuous measures were evaluated with 1-way analyses of variance and post hoc Bonferroni-corrected pairwise comparisons, and categorical measures with contingency tables and χ2 tests or Fisher exact tests. When the overall χ2 test was significant across all 4 study groups, post hoc comparisons were performed between the SSRI/SNRI monotherapy group and each other group with Bonferroni adjusted for 3 comparisons.
Unadjusted and adjusted Weibull proportional hazard regression models were used to estimate hospitalization risk within 2 years after the index date for the different study groups with the SSRI/SNRI monotherapy group as the referent. Robust standard errors were used to estimate hazard ratios (HRs) and 95% confidence intervals (CIs). The Weibull model (and not the Cox model) was used because it does not assume hazard remains constant over time, which is appropriate in this instance, as the risk of an adverse event (AE) may be higher when first starting a medication or combination of medications relative to when doses are stabilized. Models were adjusted for age, sex, baseline mental health disorders, and baseline psychotropic medications. As earlier hospitalizations showed evidence of effect modification when this covariate was tested, hazard analyses were limited to patients not previously hospitalized.
The effect size of differences in hospitalization risk meeting statistical significance was assessed by estimating the number needed to harm (NNH) and 95% CIs (not shown) to observe 1 additional hospitalization in each medication group relative to the SSRI/SNRI monotherapy group over a 90-day period. A 95% CI for NNH that did not include 0 indicated the NNH was significant at the .05 level.10 All-cause mortality was evaluated with the Fisher exact test with post hoc Bonferroni-corrected comparisons as appropriate.
Results
Of 1,703 patients screened, 613 met all study inclusion criteria (Figure 1). 
Baseline characteristics revealed no significant differences between groups in age or comorbid depression, schizophrenia, or SUDs (Table 1). 
With the SSRI/SNRI monotherapy group as the referent, all concurrent therapy groups were at significantly increased risk for overall hospitalization within 2 years after the index date (Tables 2 & 3, Figure 2). 
Risk for mental health hospitalization was significantly increased in all concurrent therapy groups relative to the referent group. 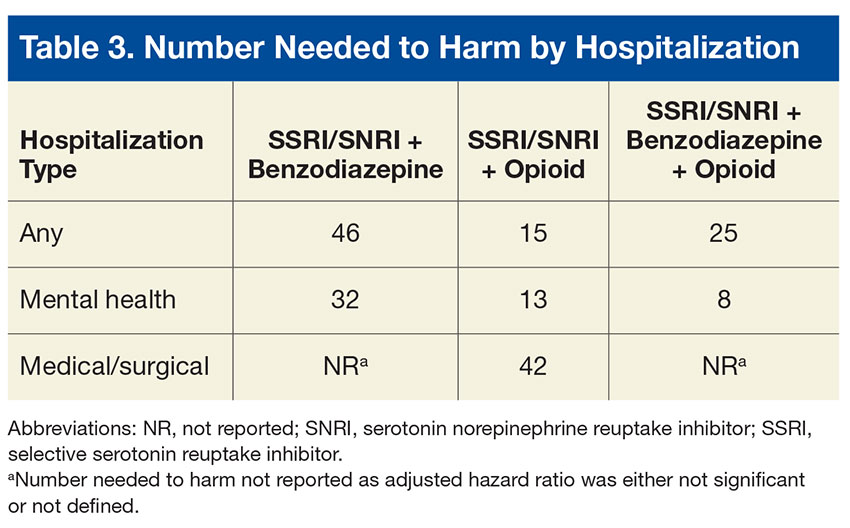
Although the risk for medical/surgical hospitalization was not significantly increased in the SSRI/SNRI and benzodiazepine therapy group (AHR, 1.9; 95% CI, 0.67-5.6), a significant difference was found in the SSRI/SNRI and opioid therapy group (AHR, 4.4; 95% CI, 1.6-12.0; NNH, 42). 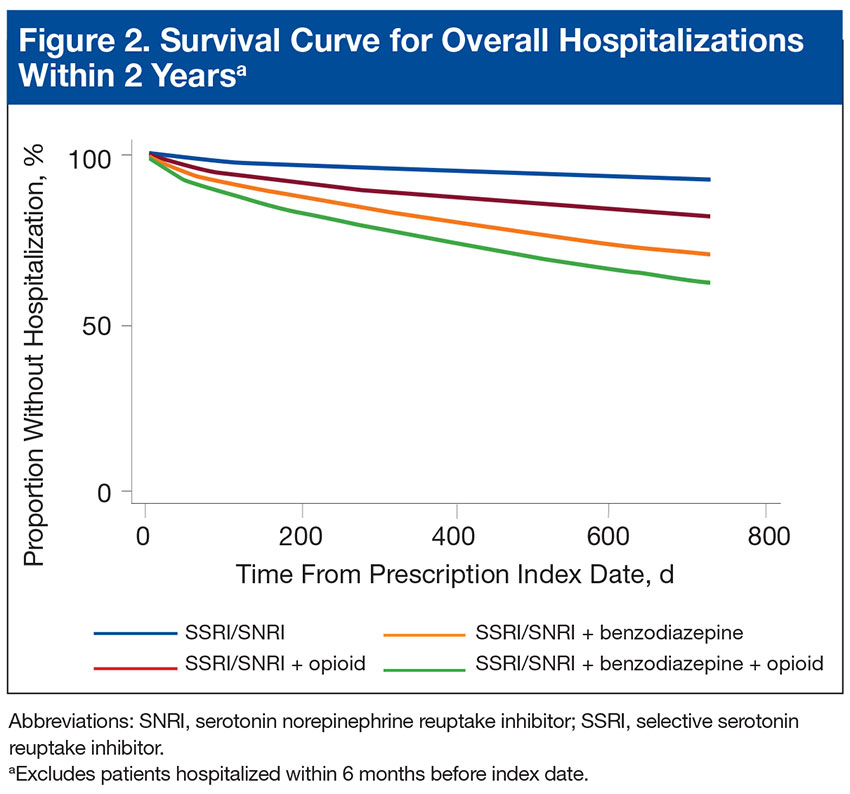
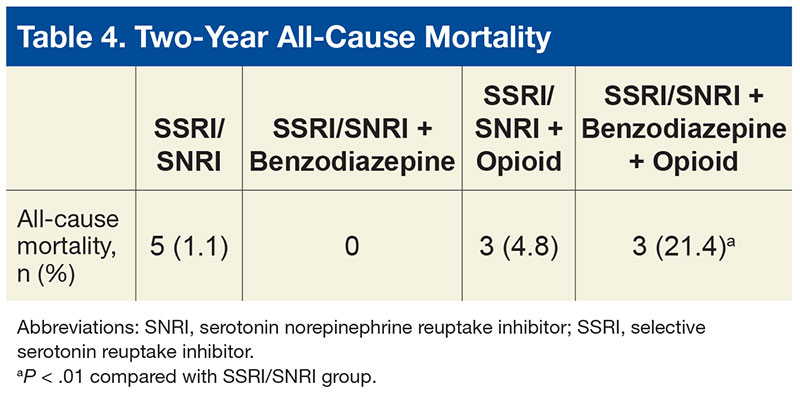
Discussion
In 2013, Hawkins and colleagues evaluated hospitalization risk in veterans treated for PTSD within the Northwest VISN 20 between 2004 and 2010.11 Compared with patients treated with only an SSRI or SNRI, those treated with 1 of those medications and a benzodiazepine were at significantly higher risk for overall hospitalization (AHR, 1.79; 95% CI, 1.38-2.32; P < .001) and mental health hospitalization (AHR, 1.87; 95% CI, 1.37-2.53; P < .001). Furthermore, those prescribed a benzodiazepine and an opioid along with an SSRI or SNRI were at higher risk for overall hospitalization (AHR, 2.98; 95% CI, 2.22-4.00; P < .001), mental health hospitalization (AHR, 2.00; 95% CI, 1.35-2.98; P < .01), medical/surgical hospitalization (AHR, 4.86; 95% CI, 3.30-7.14; P < .001), and ED visits (AHR, 2.01; 95% CI, 1.53-2.65; P < .001).
Findings from the present study, which covered a period after the newest PTSD guideline was released,support findings reported by Hawkins and colleagues in their retrospective cohort study covering an earlier period.2,11 In the present study, compared with the monotherapy group, the SSRI/SNRI and benzodiazepine therapy group and the SSRI/SNRI, benzodiazepine, and opioid therapy group were at higher risk for both overall hospitalization and mental health hospitalization within 2 years. However, in a subset of PTSD patients prescribed opioids along with first-line pharmacotherapy, this study found that overall, mental health, and medical/surgical hospitalizations were significantly increased as well. Furthermore, this study found 2-year mortality was significantly higher for the SSRI/SNRI, benzodiazepine, and opioid therapy group than for the SSRI/SNRI monotherapy group.
Adjusted hazard ratios were higher in the present study than those in the study by Hawkins and colleagues,but CIs were wider as well.11 These differences may be attributable to the relatively smaller sample size of the present study and may explain why the HR was higher for the SSRI/SNRI and opioid therapy group than for the SSRI/SNRI, benzodiazepine, and opioid therapy group.
Nevertheless, these results support the growing body of evidence establishing the many risks for AEs when benzodiazepines and opioids are prescribed in the setting of PTSD. Unfortunately, it seems that, against clear guideline recommendations and literature findings, these medications still are being prescribed to this vulnerable, high-risk population.
In the last few months of 2013, the VA health care system launched 2 important medication safety initiatives. The Psychotropic Drug Safety Initiative (PDSI) was established as a quality improvement initiative for evidence-based provision of psychotropic medications. One PDSI metric in particular focused on reducing the proportion of veterans with PTSD being treated with benzodiazepines. The Opioid Safety Initiative (OSI) came as a response to a dramatic increase in the number of fatal overdoses related to prescription opioids—an increase linked to an unprecedented jump in opioid use for nonmalignant pain. As the present study’s inclusion cutoff date of August 1, 2013, preceded the debut of both PDSI and OSI, the benzodiazepine and opioid prescription rates reported here might be higher than those currently being found under the 2 initiatives.
Limitations
This study had several limitations that might affect the interpretation or generalizability of findings. Requiring at least a 30-day supply for prescription eligibility was an attempt to focus on chronic use of medications rather than on, for example, onetime supplies of opioids for dental procedures. However, prescription fill history was not assessed. Therefore, patients could have been included in certain study groups even if their SSRI, SNRI, benzodiazepine, or opioid prescription was not refilled. Furthermore, only VA medical records were used; non-VA prescriptions were not captured.
In addition, this study was limited to patients who at bare minimum were prescribed an SSRI or an SNRI. Some patients may have been prescribed a benzodiazepine and/or an opioid but were not on appropriate first-line pharmacotherapy for PTSD. These patients were excluded from the study, and their relative hospitalization risk went unexplored. Therefore, the magnitude of the issue at hand might have been underestimated.
Although psychotherapy is a first-line treatment option for PTSD, the study did not assess the potential impact of psychotherapy on outcomes or the groups’ relative proportions of patients undergoing psychotherapy. It is unknown whether the groups were equivalent at baseline in regards to psychotherapy participation rates.
This study did not characterize the specific reasons for hospitalization beyond whether it was for a mental health or a medical/surgical issue; thus, no distinction was made between hospitalizations for an elective procedure and hospitalizations for a drug overdose or an injury. Investigators could characterize admission diagnoses to better assess whether hospitalizations are truly associated with study medications or whether patients are being hospitalized for unrelated reasons. In addition, they could elucidate the true nature of hospitalization risk associated with SSRI/SNRI, benzodiazepine, and opioid use by comparing admission diagnoses made before and after initiation of these pharmacologic therapies.
This study also could not assess outcomes for patients who presented to the ED but were not admitted. If the hospital’s floor and ED beds were at full capacity, some patients might have been transferred to an outside facility. However, this scenario is not common at SAVAHCS, where the study was conducted.
Although some comorbid conditions were noted, the study did not evaluate whether its patients had a compelling indication for benzodiazepines in particular. Opioid use is very limited to the treatment of pain, and the majority of the patients on opioid therapy in this study had a diagnosed pain syndrome.
Because of the study’s sample size and power limitations, patients were eligible to be included in a concurrent therapy group if a benzodiazepine, an opioid, or both were added no later than 1 year after SSRI/SNRI initiation. This gap of up to 1 year might have introduced some variability in exposure to risk from earlier prescribed medications. However, sensitivity analyses were performed with multiple constructed Weibull models of time to hospitalization based on subsets with varying overlapping medication gaps. Analyses revealed relatively stable HRs, suggesting that potential bias did not occur.
Future Directions
Investigators could explore the higher all-cause mortality rates in the SSRI/SNRI, benzodiazepine, and opioid therapy group, as this study did not assess cause of death in these patients. Whether any patients died of reasons directly attributable to benzodiazepines or opioids is unknown.
That SSRIs and SNRIs are the only established first-line pharmacologic treatment options for PTSD symptoms partly accounts for the widespread use of benzodiazepines in this population. For that reason, beyond characterizing the many risks associated with using benzodiazepines to manage these symptoms, there is a huge need to research the viability of other pharmacologic agents in treating PTSD. This is especially important given the slower onset to efficacy of the SSRIs and SNRIs; per estimates, only up to 60% of patients respond to SSRIs, and 20% to 30% achieve full remission of PTSD.12 Furthermore, these rates likely are even lower for combat veterans than those for the general population. Several trials discussed in a 2009 guideline review of the treatment of patients with acute stress disorder and PTSD have called into question the efficacy of SSRIs for combat-related PTSD.13 In these randomized, controlled trials, change in PTSD symptom severity as measured with CAPS was not significantly reduced with SSRIs compared with placebo.
A systematic review revealed that, of the nonantidepressants used as adjuncts in treating patients who do not achieve remission with SSRIs, the atypical antipsychotic risperidone may have the strongest supporting evidence.12 However, the present study found high rates of antipsychotic use in the SSRI/SNRI, benzodiazepine, and opioid therapy group, which also had the highest all-cause mortality rate. The safety of risperidone as an alternative treatment needs further evaluation.
Some prospective studies have suggested that the α1 blockers doxazosin and prazosin, the latter of which is commonly used for PTSD nightmares, also may improve PTSD symptoms as assessed by CAPS.14,15 Although these results are promising, the trials to date have been conducted with relatively small sample sizes.
With more veterans being treated for PTSD within the VA health care system, the central treatment goal remains: Adequately address the symptoms of PTSD while minimizing the harm caused by medications. Prescribers should limit benzodiazepine and opioid use in this population and consider safer nonpharmacologic and pharmacologic treatment options when possible.
Conclusion
Combat veterans with PTSD who are prescribed benzodiazepines and/or opioids in addition to first-line pharmacotherapy are at significantly increased risk for overall and mental health hospitalization.
Click here to read the digital edition.
1. Bernardy NC, Lund BC, Alexander B, Jenkyn AB, Schnurr PP, Friedman MJ. Gender differences in prescribing among veterans diagnosed with posttraumatic stress disorder. J Gen Intern Med. 2013;28(suppl 2):S542-S548.
2. Management of Post-Traumatic Stress Working Group, Department of Veterans Affairs, Department of Defense. VA/DoD Clinical Practice Guideline for Management of Post-Traumatic Stress. http://www.healthquality.va.gov/PTSD-full-2010c .pdf. Published October 2010. Accessed July 12, 2015.
3. Marks IM, Swinson RP, Baso˘glu M, et al. Alprazolam and exposure alone and combined in panic disorder with agoraphobia. A controlled study in London and Toronto. Br J Psychiatry. 1993;162:776-787.
4. Wilhelm FH, Roth WT. Acute and delayed effects of alprazolam on flight phobics during exposure. Behav Res Ther. 1997;35(9):831-841.
5. Guina J, Rossetter SR, DeRhodes BJ, Nahhas RW, Welton RS. Benzodiazepines for PTSD: a systematic review and meta-analysis. J Psychiatr Pract. 2015;21(4):281-303.
6. Pietrzak RH, Goldstein RB, Southwick SM, Grant BF. Prevalence and Axis I comorbidity of full and partial posttraumatic stress disorder in the United States: results from wave 2 of the National Epidemiologic Survey on Alcohol and Related Conditions. J Anxiety Disord. 2011;25(3):456-465.
7. Mills KL, Teesson M, Ross J, Darke S, Shanahan M. The costs and outcomes of treatment for opioid dependence associated with posttraumatic stress disorder. Psychiatr Serv. 2005;56(8):940-945.
8. Seal KH, Shi Y, Cohen G, et al. Association of mental health disorders with prescription opioids and high-risk opioid use in US veterans of Iraq and Afghanistan. JAMA. 2012;307(9):940-947.
9. Abrams TE, Lund BC, Bernardy NC, Friedman MJ. Aligning clinical practice to PTSD treatment guidelines: medication prescribing by provider type. Psychiatr Serv. 2013;64(2):142-148.
10. Altman DG, Andersen PK. Calculating the number needed to treat for trials where the outcome is time to an event. BMJ. 1999;319(7223):1492-1495.
11. Hawkins EJ, Malte CA, Grossbard J, Saxon AJ, Imel ZE, Kivlahan DR. Comparative safety of benzodiazepines and opioids among Veterans Affairs patients with posttraumatic stress disorder. J Addict Med. 2013;7(5):354-362.
12. Berger W, Mendlowicz MV, Marques-Portella C, et al. Pharmacologic alternatives to antidepressants in posttraumatic stress disorder: a systematic review. Prog Neuropsychopharmacol Biol Psychiatry. 2009;33(2):169-180.
13. Benedek DM, Friedman MJ, Zatzick D, Ursano RJ. Guideline watch (March 2009): practice guideline for the treatment of patients with acute stress disorder and posttraumatic stress disorder. Focus. 2009;7(2):204-213.
14. Raskind MA, Peterson K, Williams T, et al. A trial of prazosin for combat trauma PTSD with nightmares in active-duty soldiers returned from Iraq and Afghanistan. Am J Psychiatry. 2013;170(9):1003-1010.
15. Rodgman C, Verrico CD, Holst M, et al. Doxazosin XL reduces symptoms of posttraumatic stress disorder in veterans with PTSD: a pilot clinical trial. J Clin Psychiatry. 2016;77(5):e561-e565.
Posttraumatic stress disorder (PTSD) is a mental health condition that may develop in response to a traumatic event, such as that experienced by a soldier during active combat duty. In 2009, more than 495,000 veterans within the VA health care system were treated for PTSD—nearly triple the number a decade earlier.1 Core symptoms of PTSD include alterations in arousal and reactivity, avoidant behaviors, negative alterations in mood and cognition, and intrusive thoughts and nightmares. All of the symptoms can be debilitating. First-line pharmacotherapy options that target these core symptoms include selective serotonin reuptake inhibitors (SSRIs) and serotonin norepinephrine reuptake inhibitors (SNRIs).2
The anxiolytic and sedative effects of benzodiazepines may provide quick relief from many of the secondary symptoms of PTSD, including sleep disturbances, irritability, and panic attacks. However, benzodiazepines potentially interfere with the extinction of conditioned fear—a goal integral to certain types of psychotherapy, such as exposure therapy.3,4 In addition, the systematic review and meta-analysis by Guina and colleagues revealed that benzodiazepines are ineffective in the treatment of PTSD.5 The majority of the evaluated studies that used PTSD-specific measures (eg, Clinician-Administered PTSD Scale [CAPS]) found increased PTSD severity and worse prognosis with use of these medications.5 In 2010, the VA and the DoD released a joint guideline for PTSD management.2 According to the guideline, benzodiazepines cause harm when used in PTSD and are relatively contraindicated in combat veterans because of the higher incidence of comorbid substance use disorders (SUDs) in these veterans relative to the general population.2,6
Opioid use also has been linked to poor functional and clinical outcomes in veterans with PTSD. Among patients being treated for opioid use disorder, those with PTSD were less likely to endorse employment as a main source of income and had a higher incidence of recent attempted suicide.7 In a large retrospective cohort study, Operation Iraqi Freedom and Operation Enduring Freedom veterans with PTSD who were prescribed opioids were more likely to present to the emergency department (ED) and to be hospitalized for overdoses and injuries.8
Despite the risks of benzodiazepine and opioid use in this patient population, these medications are still often prescribed to veterans with PTSD for symptomatic relief. In fiscal year 2009, across the VHA system 37% of veterans diagnosed with PTSD were prescribed a benzodiazepine, 69% of the time by a mental health provider.9 Among Iraq and Afghanistan veterans, those with PTSD were significantly more likely to be prescribed an opioid for diagnosed pain—relative to those with a mental health disorder other than PTSD and those without a mental health disorder.8 Thus, there seems to be a disconnect between guideline recommendations and current practice.
The authors conducted a study to assess the potential risk of hospitalization for veterans with PTSD prescribed first-line pharmacotherapy and those also prescribed concurrent benzodiazepine and/or opioid therapy since the release of the PTSD guideline in 2010.2
Methods
In this retrospective cohort study, conducted at the Southern Arizona VA Health Care System (SAVAHCS), the authors analyzed electronic medical record data from November 1, 2009 to August 1, 2015. Study inclusion criteria were veteran, aged 18 to 89 years, diagnosis of PTSD (International Classification of Diseases, Ninth Revision, Clinical Modification code 309.81), and SSRI or SNRI newly prescribed between November 1, 2010 and August 1, 2013.
Any veteran prescribed at least one 30-day or longer supply of any benzodiazepine or opioid within 1 year before the SSRI/SNRI initial prescription date was excluded from the study. Also excluded was any patient treated for PTSD at a facility outside SAVAHCS or whose 2-year evaluation period extended past August 1, 2015.
Study Groups
An outpatient prescription was determined to be the initial SSRI/SNRI prescription for a patient who received less than a 30-day cumulative supply of any SSRI or SNRI within 1 year before that prescription date. Citalopram, desvenlafaxine, duloxetine, escitalopram, fluoxetine, fluvoxamine, levomilnacipran, milnacipran, paroxetine, sertraline, venlafaxine, vilazodone, and vortioxetine were the prespecified SSRI/SNRIs included in the study.
Patients who received at least 1 outpatient prescription for any benzodiazepine (minimum 30-day supply) within 1 year after the initial SSRI/SNRI prescription date were determined to be on concurrent SSRI/SNRI and benzodiazepine therapy. Alprazolam, chlordiazepoxide, clonazepam, clorazepate, diazepam, estazolam, flurazepam, lorazepam, oxazepam, temazepam, and triazolam were the prespecified benzodiazepines included in the study.
Patients who received at least 1 outpatient prescription for any opioid (minimum 30-day supply) within 1 year after the initial SSRI/SNRI prescription date were determined to be on concurrent SSRI/SNRI and opioid therapy. Codeine, fentanyl, hydrocodone, hydromorphone, levorphanol, meperidine, methadone, morphine, oxymorphone, pentazocine, propoxyphene, and tramadol were the prespecified opioids included in this study.
Patients who received at least 1 outpatient prescription for any benzodiazepine and any opioid (minimum 30-day supply) within 1 year after the initial SSRI/SNRI prescription date were determined to be on concurrent SSRI/SNRI, benzodiazepine, and opioid therapy.
The index date was defined as the first date of prescription overlap. If there was no benzodiazepine or opioid prescription within 1 year after the initial SSRI/SNRI prescription date, the patient was categorized as being on SSRI/SNRI monotherapy, and the index date was the date of the initial SSRI/SNRI prescription. For each patient, hospitalization data from the 2-year period after the index date were evaluated.
Outcomes and Data Collection
For evaluation of the primary outcome (2-year overall hospitalization risk), the number of unique mental health and medical/surgical hospitalizations was identified by the number of discharge summaries documented in the patient chart during the evaluation period. Time to first hospitalization was recorded for the survival data analysis. Secondary outcomes were mental health hospitalization risk, medical/surgical hospitalization risk, and all-cause mortality within 2 years.
Demographic data that were collected included age, sex, comorbid mental health disorders, comorbid SUDs, and concomitant use of psychotropic medications at index date (baseline). Select comorbid mental health disorders (anxiety, schizophrenia, depression, bipolar disorder) and substance use disorders (alcohol, opioid, illicit drug) also were identified. Data on insomnia and pain comorbidities (headaches or migraines; neuropathy; head, neck, back, arthritis, or joint pain) were collected, as these comorbidities could be indications for prescribing benzodiazepines and opioids. Concomitant baseline use of classes of psychotropic medications (antipsychotics, non-SSRI/SNRI antidepressants, mood stabilizers, anxiolytics, nonbenzodiazepine sedatives/hypnotics) also were documented. Last, hospitalizations within 6 months before the initial SSRI/SNRI prescription date were noted.
Statistical Analysis
Descriptive statistics were used to analyze all baseline demographic data. Continuous measures were evaluated with 1-way analyses of variance and post hoc Bonferroni-corrected pairwise comparisons, and categorical measures with contingency tables and χ2 tests or Fisher exact tests. When the overall χ2 test was significant across all 4 study groups, post hoc comparisons were performed between the SSRI/SNRI monotherapy group and each other group with Bonferroni adjusted for 3 comparisons.
Unadjusted and adjusted Weibull proportional hazard regression models were used to estimate hospitalization risk within 2 years after the index date for the different study groups with the SSRI/SNRI monotherapy group as the referent. Robust standard errors were used to estimate hazard ratios (HRs) and 95% confidence intervals (CIs). The Weibull model (and not the Cox model) was used because it does not assume hazard remains constant over time, which is appropriate in this instance, as the risk of an adverse event (AE) may be higher when first starting a medication or combination of medications relative to when doses are stabilized. Models were adjusted for age, sex, baseline mental health disorders, and baseline psychotropic medications. As earlier hospitalizations showed evidence of effect modification when this covariate was tested, hazard analyses were limited to patients not previously hospitalized.
The effect size of differences in hospitalization risk meeting statistical significance was assessed by estimating the number needed to harm (NNH) and 95% CIs (not shown) to observe 1 additional hospitalization in each medication group relative to the SSRI/SNRI monotherapy group over a 90-day period. A 95% CI for NNH that did not include 0 indicated the NNH was significant at the .05 level.10 All-cause mortality was evaluated with the Fisher exact test with post hoc Bonferroni-corrected comparisons as appropriate.
Results
Of 1,703 patients screened, 613 met all study inclusion criteria (Figure 1).
Baseline characteristics revealed no significant differences between groups in age or comorbid depression, schizophrenia, or SUDs (Table 1).
With the SSRI/SNRI monotherapy group as the referent, all concurrent therapy groups were at significantly increased risk for overall hospitalization within 2 years after the index date (Tables 2 & 3, Figure 2).
Risk for mental health hospitalization was significantly increased in all concurrent therapy groups relative to the referent group.
Although the risk for medical/surgical hospitalization was not significantly increased in the SSRI/SNRI and benzodiazepine therapy group (AHR, 1.9; 95% CI, 0.67-5.6), a significant difference was found in the SSRI/SNRI and opioid therapy group (AHR, 4.4; 95% CI, 1.6-12.0; NNH, 42).
Discussion
In 2013, Hawkins and colleagues evaluated hospitalization risk in veterans treated for PTSD within the Northwest VISN 20 between 2004 and 2010.11 Compared with patients treated with only an SSRI or SNRI, those treated with 1 of those medications and a benzodiazepine were at significantly higher risk for overall hospitalization (AHR, 1.79; 95% CI, 1.38-2.32; P < .001) and mental health hospitalization (AHR, 1.87; 95% CI, 1.37-2.53; P < .001). Furthermore, those prescribed a benzodiazepine and an opioid along with an SSRI or SNRI were at higher risk for overall hospitalization (AHR, 2.98; 95% CI, 2.22-4.00; P < .001), mental health hospitalization (AHR, 2.00; 95% CI, 1.35-2.98; P < .01), medical/surgical hospitalization (AHR, 4.86; 95% CI, 3.30-7.14; P < .001), and ED visits (AHR, 2.01; 95% CI, 1.53-2.65; P < .001).
Findings from the present study, which covered a period after the newest PTSD guideline was released,support findings reported by Hawkins and colleagues in their retrospective cohort study covering an earlier period.2,11 In the present study, compared with the monotherapy group, the SSRI/SNRI and benzodiazepine therapy group and the SSRI/SNRI, benzodiazepine, and opioid therapy group were at higher risk for both overall hospitalization and mental health hospitalization within 2 years. However, in a subset of PTSD patients prescribed opioids along with first-line pharmacotherapy, this study found that overall, mental health, and medical/surgical hospitalizations were significantly increased as well. Furthermore, this study found 2-year mortality was significantly higher for the SSRI/SNRI, benzodiazepine, and opioid therapy group than for the SSRI/SNRI monotherapy group.
Adjusted hazard ratios were higher in the present study than those in the study by Hawkins and colleagues,but CIs were wider as well.11 These differences may be attributable to the relatively smaller sample size of the present study and may explain why the HR was higher for the SSRI/SNRI and opioid therapy group than for the SSRI/SNRI, benzodiazepine, and opioid therapy group.
Nevertheless, these results support the growing body of evidence establishing the many risks for AEs when benzodiazepines and opioids are prescribed in the setting of PTSD. Unfortunately, it seems that, against clear guideline recommendations and literature findings, these medications still are being prescribed to this vulnerable, high-risk population.
In the last few months of 2013, the VA health care system launched 2 important medication safety initiatives. The Psychotropic Drug Safety Initiative (PDSI) was established as a quality improvement initiative for evidence-based provision of psychotropic medications. One PDSI metric in particular focused on reducing the proportion of veterans with PTSD being treated with benzodiazepines. The Opioid Safety Initiative (OSI) came as a response to a dramatic increase in the number of fatal overdoses related to prescription opioids—an increase linked to an unprecedented jump in opioid use for nonmalignant pain. As the present study’s inclusion cutoff date of August 1, 2013, preceded the debut of both PDSI and OSI, the benzodiazepine and opioid prescription rates reported here might be higher than those currently being found under the 2 initiatives.
Limitations
This study had several limitations that might affect the interpretation or generalizability of findings. Requiring at least a 30-day supply for prescription eligibility was an attempt to focus on chronic use of medications rather than on, for example, onetime supplies of opioids for dental procedures. However, prescription fill history was not assessed. Therefore, patients could have been included in certain study groups even if their SSRI, SNRI, benzodiazepine, or opioid prescription was not refilled. Furthermore, only VA medical records were used; non-VA prescriptions were not captured.
In addition, this study was limited to patients who at bare minimum were prescribed an SSRI or an SNRI. Some patients may have been prescribed a benzodiazepine and/or an opioid but were not on appropriate first-line pharmacotherapy for PTSD. These patients were excluded from the study, and their relative hospitalization risk went unexplored. Therefore, the magnitude of the issue at hand might have been underestimated.
Although psychotherapy is a first-line treatment option for PTSD, the study did not assess the potential impact of psychotherapy on outcomes or the groups’ relative proportions of patients undergoing psychotherapy. It is unknown whether the groups were equivalent at baseline in regards to psychotherapy participation rates.
This study did not characterize the specific reasons for hospitalization beyond whether it was for a mental health or a medical/surgical issue; thus, no distinction was made between hospitalizations for an elective procedure and hospitalizations for a drug overdose or an injury. Investigators could characterize admission diagnoses to better assess whether hospitalizations are truly associated with study medications or whether patients are being hospitalized for unrelated reasons. In addition, they could elucidate the true nature of hospitalization risk associated with SSRI/SNRI, benzodiazepine, and opioid use by comparing admission diagnoses made before and after initiation of these pharmacologic therapies.
This study also could not assess outcomes for patients who presented to the ED but were not admitted. If the hospital’s floor and ED beds were at full capacity, some patients might have been transferred to an outside facility. However, this scenario is not common at SAVAHCS, where the study was conducted.
Although some comorbid conditions were noted, the study did not evaluate whether its patients had a compelling indication for benzodiazepines in particular. Opioid use is very limited to the treatment of pain, and the majority of the patients on opioid therapy in this study had a diagnosed pain syndrome.
Because of the study’s sample size and power limitations, patients were eligible to be included in a concurrent therapy group if a benzodiazepine, an opioid, or both were added no later than 1 year after SSRI/SNRI initiation. This gap of up to 1 year might have introduced some variability in exposure to risk from earlier prescribed medications. However, sensitivity analyses were performed with multiple constructed Weibull models of time to hospitalization based on subsets with varying overlapping medication gaps. Analyses revealed relatively stable HRs, suggesting that potential bias did not occur.
Future Directions
Investigators could explore the higher all-cause mortality rates in the SSRI/SNRI, benzodiazepine, and opioid therapy group, as this study did not assess cause of death in these patients. Whether any patients died of reasons directly attributable to benzodiazepines or opioids is unknown.
That SSRIs and SNRIs are the only established first-line pharmacologic treatment options for PTSD symptoms partly accounts for the widespread use of benzodiazepines in this population. For that reason, beyond characterizing the many risks associated with using benzodiazepines to manage these symptoms, there is a huge need to research the viability of other pharmacologic agents in treating PTSD. This is especially important given the slower onset to efficacy of the SSRIs and SNRIs; per estimates, only up to 60% of patients respond to SSRIs, and 20% to 30% achieve full remission of PTSD.12 Furthermore, these rates likely are even lower for combat veterans than those for the general population. Several trials discussed in a 2009 guideline review of the treatment of patients with acute stress disorder and PTSD have called into question the efficacy of SSRIs for combat-related PTSD.13 In these randomized, controlled trials, change in PTSD symptom severity as measured with CAPS was not significantly reduced with SSRIs compared with placebo.
A systematic review revealed that, of the nonantidepressants used as adjuncts in treating patients who do not achieve remission with SSRIs, the atypical antipsychotic risperidone may have the strongest supporting evidence.12 However, the present study found high rates of antipsychotic use in the SSRI/SNRI, benzodiazepine, and opioid therapy group, which also had the highest all-cause mortality rate. The safety of risperidone as an alternative treatment needs further evaluation.
Some prospective studies have suggested that the α1 blockers doxazosin and prazosin, the latter of which is commonly used for PTSD nightmares, also may improve PTSD symptoms as assessed by CAPS.14,15 Although these results are promising, the trials to date have been conducted with relatively small sample sizes.
With more veterans being treated for PTSD within the VA health care system, the central treatment goal remains: Adequately address the symptoms of PTSD while minimizing the harm caused by medications. Prescribers should limit benzodiazepine and opioid use in this population and consider safer nonpharmacologic and pharmacologic treatment options when possible.
Conclusion
Combat veterans with PTSD who are prescribed benzodiazepines and/or opioids in addition to first-line pharmacotherapy are at significantly increased risk for overall and mental health hospitalization.
Click here to read the digital edition.
1. Bernardy NC, Lund BC, Alexander B, Jenkyn AB, Schnurr PP, Friedman MJ. Gender differences in prescribing among veterans diagnosed with posttraumatic stress disorder. J Gen Intern Med. 2013;28(suppl 2):S542-S548.
2. Management of Post-Traumatic Stress Working Group, Department of Veterans Affairs, Department of Defense. VA/DoD Clinical Practice Guideline for Management of Post-Traumatic Stress. http://www.healthquality.va.gov/PTSD-full-2010c .pdf. Published October 2010. Accessed July 12, 2015.
3. Marks IM, Swinson RP, Baso˘glu M, et al. Alprazolam and exposure alone and combined in panic disorder with agoraphobia. A controlled study in London and Toronto. Br J Psychiatry. 1993;162:776-787.
4. Wilhelm FH, Roth WT. Acute and delayed effects of alprazolam on flight phobics during exposure. Behav Res Ther. 1997;35(9):831-841.
5. Guina J, Rossetter SR, DeRhodes BJ, Nahhas RW, Welton RS. Benzodiazepines for PTSD: a systematic review and meta-analysis. J Psychiatr Pract. 2015;21(4):281-303.
6. Pietrzak RH, Goldstein RB, Southwick SM, Grant BF. Prevalence and Axis I comorbidity of full and partial posttraumatic stress disorder in the United States: results from wave 2 of the National Epidemiologic Survey on Alcohol and Related Conditions. J Anxiety Disord. 2011;25(3):456-465.
7. Mills KL, Teesson M, Ross J, Darke S, Shanahan M. The costs and outcomes of treatment for opioid dependence associated with posttraumatic stress disorder. Psychiatr Serv. 2005;56(8):940-945.
8. Seal KH, Shi Y, Cohen G, et al. Association of mental health disorders with prescription opioids and high-risk opioid use in US veterans of Iraq and Afghanistan. JAMA. 2012;307(9):940-947.
9. Abrams TE, Lund BC, Bernardy NC, Friedman MJ. Aligning clinical practice to PTSD treatment guidelines: medication prescribing by provider type. Psychiatr Serv. 2013;64(2):142-148.
10. Altman DG, Andersen PK. Calculating the number needed to treat for trials where the outcome is time to an event. BMJ. 1999;319(7223):1492-1495.
11. Hawkins EJ, Malte CA, Grossbard J, Saxon AJ, Imel ZE, Kivlahan DR. Comparative safety of benzodiazepines and opioids among Veterans Affairs patients with posttraumatic stress disorder. J Addict Med. 2013;7(5):354-362.
12. Berger W, Mendlowicz MV, Marques-Portella C, et al. Pharmacologic alternatives to antidepressants in posttraumatic stress disorder: a systematic review. Prog Neuropsychopharmacol Biol Psychiatry. 2009;33(2):169-180.
13. Benedek DM, Friedman MJ, Zatzick D, Ursano RJ. Guideline watch (March 2009): practice guideline for the treatment of patients with acute stress disorder and posttraumatic stress disorder. Focus. 2009;7(2):204-213.
14. Raskind MA, Peterson K, Williams T, et al. A trial of prazosin for combat trauma PTSD with nightmares in active-duty soldiers returned from Iraq and Afghanistan. Am J Psychiatry. 2013;170(9):1003-1010.
15. Rodgman C, Verrico CD, Holst M, et al. Doxazosin XL reduces symptoms of posttraumatic stress disorder in veterans with PTSD: a pilot clinical trial. J Clin Psychiatry. 2016;77(5):e561-e565.
Shared Medical Appointments and Their Effects on Achieving Diabetes Mellitus Goals in a Veteran Population
In 2012, 9.3% of the U.S. population had diabetes mellitus (DM).1 According to the American Diabetes Association, in 2012, the total cost of diagnosed DM in the U.S. was $245 billion.2 Diabetes mellitus is a leading cause of blindness, end-stage renal disease, and amputation in the U.S.3 Up to 80% of patients with DM will develop or die of macrovascular disease, such as heart attack or stroke.3
Diabetes mellitus is a chronic disease of epidemic proportion with management complexity that threatens to overwhelm providers in the acute care and primary care settings. Limited specialist availability and increased wait times continue to afflict the VA health care system, prompting efforts to increase health care provider (HCP) access and improve clinic efficiency.4 One of the methods proposed to increase HCP access and maximize clinic efficiency is the shared medical appointment (SMA).5,6
The SMA was designed to improve access and quality of care through enhanced education and support. With the number of people living with chronic diseases on the rise, the current patient-provider model is unrealistic in today’s health care environment. Shared medical appointments offer a unique format for providing evidence-based chronic disease management in which patients and a multidisciplinary team of providers collaborate toward education, discussion, and medication management in a supportive environment.7 Research has suggested that SMAs are a successful way to manage type 2 DM (T2DM).8,9 However, there is uncertainty regarding the optimal model design. The goals of this study were to evaluate whether the diabetes SMA at the Adam Benjamin, Jr. (ABJ) community-based outpatient clinic (CBOC) was an effective practice model for achieving improvements in glycemic control and to use subgroup analyses to elucidate unique characteristics about SMAs that may have been correlated with clinical success. This study may provide valuable information for other facilities considering SMAs.
Overview
The Jesse Brown VAMC (JBVAMC) and the ABJ CBOC implemented a T2DM-focused SMA in 2011. The ABJ CBOC multidisciplinary SMA team consisted of a medical administration service clerk, a registered dietician, a certified DM educator, a registered nurse, a nurse practitioner (NP), and a clinical pharmacy specialist (CPS). This team collaborated to deliver high-quality care to patients with poorly controlled T2DM to improve their glycemic control as well as clinical knowledge of their disease. A private conference room at the ABJ CBOC served as the location for the SMAs. This room was divided into 2 adjacent areas: One area with tables was organized in a semicircle to promote group discussion as well as minimize isolated conversations; the other area had computer terminals to facilitate individualized medication management. Other equipment included a scale for obtaining patient weights and various audio-visual devices.
The ABJ CBOC offered monthly SMAs. The team made several attempts to maximize SMA show rates, as previous studies indicated that low SMA show rates were a barrier to success.3,4,7-9 One review reported no-show rates as high as 70% in certain group visit models.4 About 2 weeks prior to a session, prospective SMA patients received automated and customized preappointment letters. Automated and customized phone call reminders were made to prospective SMA patients a few days before each session. As many as 18 patients participated in a single ABJ SMA.
The ABJ SMAs lasted from 60 to 90 minutes, depending on the level of patient participation and the size of the group. The first half of the SMA was dedicated to a group discussion, which involved the SMA team, the patient, and the patient’s family (if desired). The topic of conversation was typically guided by patient curiosity and knowledge deficits in a spontaneous and free-flowing manner; for this reason, these sessions were considered to be open.
The team also engaged in more structured focused sessions, which limited the spontaneous flow of conservation and narrowed the scope to provide targeted education about various aspects of T2DM care. During focused sessions, services such as dental, optometry, podiatry, MOVE! (a VA self-management weight reduction program), and nutrition also participated. Focused sessions addressed topics such as hypoglycemia management, eating around the holidays, sick-day management of T2DM, grocery shopping, exercise, oral health, eye care, and foot care. The specialty services were encouraged to be creative and interactive during the SMA. Many of these services used supportive literature, demonstrations, diagrams, and props to enrich the educational experience. Group discussion typically lasted 30 to 40 minutes; after which patients met individually with either a CPS or NP for medication management.
Medication management focused on optimizing T2DM therapy (both oral and injectable) to improve glycemic control. Interventions outside of T2DM therapy (eg, cholesterol, hypertension, and other risk reduction modalities) were not made, due to time constraints. Once a patient demonstrated improved working knowledge of T2DM and a clinically significant reduction in their glycosylated hemoglobin A1c (A1c) they were discharged from SMAs at the discretion of the SMA team. There was no set minimum or maximum duration for the SMAs.
Methods
This study was a retrospective chart review conducted at the JBVAMC and was approved by the institutional review board and the research and development committee. Patient confidentiality was maintained by identifying patients by means other than name or unique identifiers. Protected health information was accessible only by the aforementioned investigators. There was no direct patient contact during this study.
Patient lists were generated from the computerized patient record system (CPRS). Patients were tracked up to 6 months after SMA discharge or until the last SMA in which they participated. The control group was matched according to location, age, glycemic control, and time. The control group never attended an ABJ SMA but may have received regular care through their primary care provider, CPS, or endocrinologist. Prospective control group patients were randomized and reviewed sequentially to obtain the matched cohort.
The study took place at ABJ, an outpatient clinic serving veterans in northwest Indiana and surrounding areas. Inclusion criteria for the SMA group were patients with T2DM, aged ≥ 45 years, with an A1c ≥ 8.5% seen at ABJ for T2DM from May 1, 2011, to June 30, 2013. The control group included patients with T2DM, aged ≥ 45 years, with an A1c > 9% who never attended SMAs but may have received regular care at ABJ during the study period. The SMA group’s inclusion criteria threshold for A1c was lower in order to maximize sample size. The control group’s inclusion criteria threshold for A1c was higher due to use of a default reminder report called “A1c > 9%” to generate patient lists. Patients were excluded from the study if they did not meet inclusion criteria.
Baseline datum was the most recent parameter available in CPRS prior to enrollment. The endpoint datum was the parameter nearest the time of SMA discharge or the first available parameter within 6 months from the date of discharge. In the control group, the baseline datum was the initial parameter during the study period and the endpoint datum was the closest measure to 4 months after baseline. Four months was chosen to allow for at least 1 A1c measurement during the study period. In addition, it was estimated (prior to collecting any data) that 4 months was the average time a patient participated in SMAs. Serial A1c measurements were defined as values obtained at SMA discharge and 3- and 6-months postdischarge. These parameters were used to evaluate the sustainability of improvements in glycemic control. All values falling outside of these defined parameters were excluded.
Related: Experiences of Veterans With Diabetes From Shared Medical Appointments
The data analysis compared A1c change from baseline to endpoint for the SMA and control groups. Data collection included baseline characteristics, SMA show rate, number of SMA patients seen by a CPS or NP, number and type of SMA interventions made by a CPS or NP, and the number and type of non-SMA interventions made during the study period. Intervention types were medications: added, discontinued, or titrated; and other, defined as referrals made to specialty services (such as dental, optometry, and podiatry).
Secondary endpoints included the number of SMAs and glycemic improvement, SMA format style (open- vs focused session) and glycemic improvement, SMA provider (CPS vs NP) and glycemic improvement, the change in A1c stratified by baseline A1c (A1c ≥ 10% vs < 10%), the change in actual body weight (ABW) and body mass index (BMI), and maintenance of A1c (3- and 6-months postdischarge).
The primary endpoint was evaluated using a 2-sample Student t test. Secondary endpoints were evaluated using the independent t test. Statistical significance was defined as P < .05.
Results
A total of 129 unique patients were scheduled for SMAs, 62 of which met inclusion criteria and were included in the SMA group. During enrollment, 67 patients were excluded: 55 never participated in SMAs, 6 had baseline A1c values < 8.5%, 4 had insufficient data, and 2 were aged < 45 years. A total of 29 SMAs were conducted during the study period, and patients attended an average of 3.15 ± 2.14 (SD) SMAs. The average attendance at each SMA was 7.1 ± 2.62 (SD) patients. For the control group, 754 unique patients were identified and randomized. A total of 90 charts were sequentially reviewed in order to obtain the 62 patients for the control group.
Baseline characteristics were balanced between groups. However, there were more women in the SMA group vs the control group (Table 1). Within the control group, there were a total of 107 appointments that addressed T2DM, which averaged 1.72 ± 1.51 (SD) appointments per patient. The total number of interventions made in the SMA group was 192: 64.6% (124) by a CPS and 35.4% (68) by a NP. For the CPS, the most frequent intervention was medication titration (69.5%), followed by other (23.5%), medication addition (4%), and medication discontinuation (3%). Of note, 53.2% (33) of the SMA patients were seen an average of 1.2 times by non-SMA providers. The SMA patients had a total of 45 non-SMA interventions (0.73 per patient) during the study period.
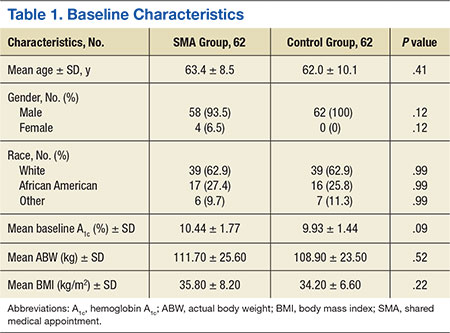
For the primary endpoint, the SMA group had a 1.48% ± 0.02 (SD) reduction in A1c compared with a 0.6% ± 0.02 (SD) decrease in the control group (P = .01). When evaluating mean changes in A1c by the number of SMAs attended, it was noted that participation in ≥ 6 SMAs led to the greatest reduction in A1c of 2.08%. In the SMA group, it was noted that patients with higher A1c values at baseline demonstrated greater improvements in glycemic control compared with patients with lower baseline A1c values. The mean change in A1c, stratified by baseline A1c, was -2.26% for those with baseline A1c values ≥ 10% and -0.87% for those with baseline A1c values < 10%.
In evaluating the format style, open- vs focused-session, it was observed that participation in focused sessions led to greater improvements in glycemic control. Furthermore, when stratified by provider, greater improvements in glycemic control were demonstrated when medication management was completed by a CPS vs a NP (Table 2). The average number of interventions per SMA patient was 3.1 ± 2.22 (SD). For the control group, the total number of interventions made was 86, with an average of 1.37 ± 1.51 (SD) per patient. The overall show rate was 49% ± 16 (SD), 52% ± 16 (SD) for open visits, and 46% ± 15 (SD) for focused visits. The mean change in ABW and BMI from baseline to endpoint was no different between the SMA and control groups (Table 3). The SMA group participants demonstrated a decrease in A1c at 3 months postdischarge, and a moderate increase in A1c was noted at 6 months postdischarge.
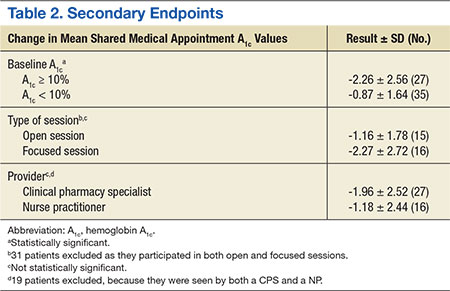
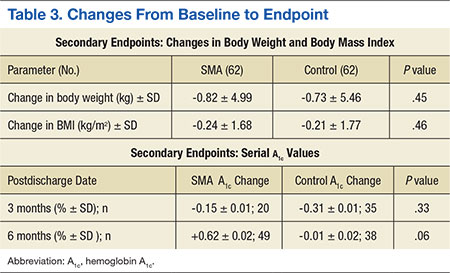
Discussion
Shared medical appointments provide an effective alternative to standards of care in order to obtain improvements in glycemic control. Consistent with previous studies, this study reported significant improvements in glycemic control in the SMA group vs the control group. This study also elucidated unique characteristics about SMAs that may have been correlated with clinical success.
Although the greatest improvements in glycemic control were noted for those who participated in ≥ 6 SMAs, it was observed that participation in only 1 SMA also led to improvements. For a site with limited staff and a high volume of patients waiting to participate in SMAs, it may be mutually beneficial to offer only 1 SMA per patient. In addition, patients with ≥ 10% A1c at baseline demonstrated greater improvements in glycemic control compared to those with < 10% A1c at baseline. The reasons the higher baseline A1c subgroup responded to interventions more robustly are unclear and likely multifactorial. Nonetheless, factors such as psychosocial influences (eg, peer pressure to get healthy) may have increased motivation to prevent complications and improved medication adherence in the setting of closer follow-up. Additionally, hyperresponsiveness to drug therapy may have played a role. Regardless, for new SMA programs interested in making an immediate impact, it may be advantageous to initially select patients with very poorly controlled DM.
A unique aspect of the ABJ SMA was the variety of focused sessions offered. Previous studies did not demonstrate such a variety of focused sessions, nor did they evaluate the impact of a focused visit on the patient’s T2DM control. Participation in focused ABJ SMA sessions may have led to improved T2DM control, which may be attributed to the value patients assigned to specialty care and an increased motivation to get healthy.
Related: SGLT2 Inhibitors for Type 2 Diabetes Mellitus Treatment
Another factor that may have led to improved T2DM control was CPS involvement with medication management. The presence of a NP was highly valued, both from a group discussion and medication management standpoint; still, it is a good idea to involve a CPS who has a strong command of DM pharmacotherapy. One shortcoming of this SMA program was the inability for patients to maintain glycemic improvements 6 months after discharge. This pitfall was likely the result of suboptimal coordination of care after SMA discharge and may be avoided by asking the medical administration service clerk to promptly schedule discharged SMA patients for a general medicine clinic T2DM follow-up.The SMA patients had more T2DM interventions within the same time frame compared with the control patients. Although not causative, the increased number of interventions in addition to the bolstered support of the SMA may have correlated with glycemic improvements.
An important finding of this study was the SMA show rate and how it compared with attendance rates found in other group models. The favorable ABJ SMA show rate could have been due to the rigorous attention paid to reminder letters and phone calls. The literature has not established a standard approach to increasing SMA show rates; however, the current data suggest that increased reminders may have increased attendance.
Limitations
This study had several limitations. The external validity was weakened by the modest sample size and the homogenous baseline characteristics of those enrolled. Another limitation was inconsistent documentation of laboratory parameters. The inability to obtain A1c values exactly at enrollment and discharge could have potentially skewed the results. In addition, incomplete documentation of interventions for dual-care patients (ie, those who obtained care outside of the VA) was an unavoidable challenge. Last, this study did not perform an assessment of SMA patient satisfaction, cost-benefit, or safety.
Conclusion
The ABJ SMA was an effective addition to standards of care in order to achieve improvements in glycemic control in a veteran population with poorly controlled T2DM. Furthermore,the data suggest that a successful program should be multidisciplinary, select poorly controlled patients, offer focused sessions, have a CPS participate in medication management, and encourage patients to complete ≥ 6 sessions. Future studies should be conducted to include more diverse patients to see whether the efficacy of this SMA format is maintained.
A safety analysis should also be conducted to ensure that the SMA format is not only effective, but also a safe means to manage medical conditions. In addition, the scope of the ABJ SMAs should be expanded to allow for evaluation of other diseases. An evaluation of patient satisfaction and cost-benefit could provide additional support for the implementation of SMAs, as improvements in quality of life and cost savings are endpoints to be desired.
Author disclosures
The authors report no actual or potential conflicts of interest with regard to this article.
Disclaimer
The opinions expressed herein are those of the authors and do not necessarily reflect those of Federal Practitioner, Frontline Medical Communications Inc., the U.S. Government, or any of its agencies. This article may discuss unlabeled or investigational use of certain drugs. Please review complete prescribing information for specific drugs or drug combinations—including indications, contraindications, warnings, and adverse effects—before administering pharmacologic therapy to patients.
1. Centers for Disease Control and Prevention. National Diabetes Statistics Report: Estimate of Diabetes and Its Burden in the United States, 2014. Atlanta, GA: U.S. Department of Health and Human Services; 2014.
2. American Diabetes Association. Economic costs of diabetes in the U.S. in 2012. Diabetes Care. 2013;36(4):1033-1046.
3. Kirsh SR, Watts S, Pascuzzi K, et al. Shared medical appointments based on the chronic care model: a quality improvement project to address the challenges of patients with diabetes with high cardiovascular risk. Qual Saf Health Care. 2007;16(5):349-353.
4. Jaber R, Braksmajer A, Trilling JS. Group visits: a qualitative review of current research. J Am Board Fam Med. 2006;19(3):276-290.
5. Klein S. The Veterans Health Administration: implementing patient-centered medical homes in the nation's largest integrated delivery system. Commonwealth Fund Website. http://www.common wealthfund.org/publications/case-studies/2011 /sep/va-medical-homes. Published September 2011. Accessed November 11, 2015.
6. U.S. Department of Veterans Affairs. VA Shared Medical Appointments for Patients With Diabetes: Maximizing Patient & Provider Expertise to Strengthen Patient Management. Washington, DC: U.S. Department of Veterans Affairs; 2008.
7. Bronson DL, Maxwell RA. Shared medical appointments: increasing patient access without increasing physician hours. Cleve Clin J Med. 2004;71(5):369-370, 372, 374 passim.
8. Cohen LB, Taveira T, Khatana SA, Dooley AG, Pirraglia PA, Wu WC. Pharmacist-led shared medical appointments for multiple cardiovascular risk reduction in patients with type 2 diabetes. Diabetes Educ. 2011;37(6):801-812.
9. Naik AD, Palmer N, Petersen NJ, et al. Comparative effectiveness of goal setting in diabetes mellitus group clinics: randomized clinical trial. Arch Intern Med. 2011;171(5):453-459.
In 2012, 9.3% of the U.S. population had diabetes mellitus (DM).1 According to the American Diabetes Association, in 2012, the total cost of diagnosed DM in the U.S. was $245 billion.2 Diabetes mellitus is a leading cause of blindness, end-stage renal disease, and amputation in the U.S.3 Up to 80% of patients with DM will develop or die of macrovascular disease, such as heart attack or stroke.3
Diabetes mellitus is a chronic disease of epidemic proportion with management complexity that threatens to overwhelm providers in the acute care and primary care settings. Limited specialist availability and increased wait times continue to afflict the VA health care system, prompting efforts to increase health care provider (HCP) access and improve clinic efficiency.4 One of the methods proposed to increase HCP access and maximize clinic efficiency is the shared medical appointment (SMA).5,6
The SMA was designed to improve access and quality of care through enhanced education and support. With the number of people living with chronic diseases on the rise, the current patient-provider model is unrealistic in today’s health care environment. Shared medical appointments offer a unique format for providing evidence-based chronic disease management in which patients and a multidisciplinary team of providers collaborate toward education, discussion, and medication management in a supportive environment.7 Research has suggested that SMAs are a successful way to manage type 2 DM (T2DM).8,9 However, there is uncertainty regarding the optimal model design. The goals of this study were to evaluate whether the diabetes SMA at the Adam Benjamin, Jr. (ABJ) community-based outpatient clinic (CBOC) was an effective practice model for achieving improvements in glycemic control and to use subgroup analyses to elucidate unique characteristics about SMAs that may have been correlated with clinical success. This study may provide valuable information for other facilities considering SMAs.
Overview
The Jesse Brown VAMC (JBVAMC) and the ABJ CBOC implemented a T2DM-focused SMA in 2011. The ABJ CBOC multidisciplinary SMA team consisted of a medical administration service clerk, a registered dietician, a certified DM educator, a registered nurse, a nurse practitioner (NP), and a clinical pharmacy specialist (CPS). This team collaborated to deliver high-quality care to patients with poorly controlled T2DM to improve their glycemic control as well as clinical knowledge of their disease. A private conference room at the ABJ CBOC served as the location for the SMAs. This room was divided into 2 adjacent areas: One area with tables was organized in a semicircle to promote group discussion as well as minimize isolated conversations; the other area had computer terminals to facilitate individualized medication management. Other equipment included a scale for obtaining patient weights and various audio-visual devices.
The ABJ CBOC offered monthly SMAs. The team made several attempts to maximize SMA show rates, as previous studies indicated that low SMA show rates were a barrier to success.3,4,7-9 One review reported no-show rates as high as 70% in certain group visit models.4 About 2 weeks prior to a session, prospective SMA patients received automated and customized preappointment letters. Automated and customized phone call reminders were made to prospective SMA patients a few days before each session. As many as 18 patients participated in a single ABJ SMA.
The ABJ SMAs lasted from 60 to 90 minutes, depending on the level of patient participation and the size of the group. The first half of the SMA was dedicated to a group discussion, which involved the SMA team, the patient, and the patient’s family (if desired). The topic of conversation was typically guided by patient curiosity and knowledge deficits in a spontaneous and free-flowing manner; for this reason, these sessions were considered to be open.
The team also engaged in more structured focused sessions, which limited the spontaneous flow of conservation and narrowed the scope to provide targeted education about various aspects of T2DM care. During focused sessions, services such as dental, optometry, podiatry, MOVE! (a VA self-management weight reduction program), and nutrition also participated. Focused sessions addressed topics such as hypoglycemia management, eating around the holidays, sick-day management of T2DM, grocery shopping, exercise, oral health, eye care, and foot care. The specialty services were encouraged to be creative and interactive during the SMA. Many of these services used supportive literature, demonstrations, diagrams, and props to enrich the educational experience. Group discussion typically lasted 30 to 40 minutes; after which patients met individually with either a CPS or NP for medication management.
Medication management focused on optimizing T2DM therapy (both oral and injectable) to improve glycemic control. Interventions outside of T2DM therapy (eg, cholesterol, hypertension, and other risk reduction modalities) were not made, due to time constraints. Once a patient demonstrated improved working knowledge of T2DM and a clinically significant reduction in their glycosylated hemoglobin A1c (A1c) they were discharged from SMAs at the discretion of the SMA team. There was no set minimum or maximum duration for the SMAs.
Methods
This study was a retrospective chart review conducted at the JBVAMC and was approved by the institutional review board and the research and development committee. Patient confidentiality was maintained by identifying patients by means other than name or unique identifiers. Protected health information was accessible only by the aforementioned investigators. There was no direct patient contact during this study.
Patient lists were generated from the computerized patient record system (CPRS). Patients were tracked up to 6 months after SMA discharge or until the last SMA in which they participated. The control group was matched according to location, age, glycemic control, and time. The control group never attended an ABJ SMA but may have received regular care through their primary care provider, CPS, or endocrinologist. Prospective control group patients were randomized and reviewed sequentially to obtain the matched cohort.
The study took place at ABJ, an outpatient clinic serving veterans in northwest Indiana and surrounding areas. Inclusion criteria for the SMA group were patients with T2DM, aged ≥ 45 years, with an A1c ≥ 8.5% seen at ABJ for T2DM from May 1, 2011, to June 30, 2013. The control group included patients with T2DM, aged ≥ 45 years, with an A1c > 9% who never attended SMAs but may have received regular care at ABJ during the study period. The SMA group’s inclusion criteria threshold for A1c was lower in order to maximize sample size. The control group’s inclusion criteria threshold for A1c was higher due to use of a default reminder report called “A1c > 9%” to generate patient lists. Patients were excluded from the study if they did not meet inclusion criteria.
Baseline datum was the most recent parameter available in CPRS prior to enrollment. The endpoint datum was the parameter nearest the time of SMA discharge or the first available parameter within 6 months from the date of discharge. In the control group, the baseline datum was the initial parameter during the study period and the endpoint datum was the closest measure to 4 months after baseline. Four months was chosen to allow for at least 1 A1c measurement during the study period. In addition, it was estimated (prior to collecting any data) that 4 months was the average time a patient participated in SMAs. Serial A1c measurements were defined as values obtained at SMA discharge and 3- and 6-months postdischarge. These parameters were used to evaluate the sustainability of improvements in glycemic control. All values falling outside of these defined parameters were excluded.
Related: Experiences of Veterans With Diabetes From Shared Medical Appointments
The data analysis compared A1c change from baseline to endpoint for the SMA and control groups. Data collection included baseline characteristics, SMA show rate, number of SMA patients seen by a CPS or NP, number and type of SMA interventions made by a CPS or NP, and the number and type of non-SMA interventions made during the study period. Intervention types were medications: added, discontinued, or titrated; and other, defined as referrals made to specialty services (such as dental, optometry, and podiatry).
Secondary endpoints included the number of SMAs and glycemic improvement, SMA format style (open- vs focused session) and glycemic improvement, SMA provider (CPS vs NP) and glycemic improvement, the change in A1c stratified by baseline A1c (A1c ≥ 10% vs < 10%), the change in actual body weight (ABW) and body mass index (BMI), and maintenance of A1c (3- and 6-months postdischarge).
The primary endpoint was evaluated using a 2-sample Student t test. Secondary endpoints were evaluated using the independent t test. Statistical significance was defined as P < .05.
Results
A total of 129 unique patients were scheduled for SMAs, 62 of which met inclusion criteria and were included in the SMA group. During enrollment, 67 patients were excluded: 55 never participated in SMAs, 6 had baseline A1c values < 8.5%, 4 had insufficient data, and 2 were aged < 45 years. A total of 29 SMAs were conducted during the study period, and patients attended an average of 3.15 ± 2.14 (SD) SMAs. The average attendance at each SMA was 7.1 ± 2.62 (SD) patients. For the control group, 754 unique patients were identified and randomized. A total of 90 charts were sequentially reviewed in order to obtain the 62 patients for the control group.
Baseline characteristics were balanced between groups. However, there were more women in the SMA group vs the control group (Table 1). Within the control group, there were a total of 107 appointments that addressed T2DM, which averaged 1.72 ± 1.51 (SD) appointments per patient. The total number of interventions made in the SMA group was 192: 64.6% (124) by a CPS and 35.4% (68) by a NP. For the CPS, the most frequent intervention was medication titration (69.5%), followed by other (23.5%), medication addition (4%), and medication discontinuation (3%). Of note, 53.2% (33) of the SMA patients were seen an average of 1.2 times by non-SMA providers. The SMA patients had a total of 45 non-SMA interventions (0.73 per patient) during the study period.
For the primary endpoint, the SMA group had a 1.48% ± 0.02 (SD) reduction in A1c compared with a 0.6% ± 0.02 (SD) decrease in the control group (P = .01). When evaluating mean changes in A1c by the number of SMAs attended, it was noted that participation in ≥ 6 SMAs led to the greatest reduction in A1c of 2.08%. In the SMA group, it was noted that patients with higher A1c values at baseline demonstrated greater improvements in glycemic control compared with patients with lower baseline A1c values. The mean change in A1c, stratified by baseline A1c, was -2.26% for those with baseline A1c values ≥ 10% and -0.87% for those with baseline A1c values < 10%.
In evaluating the format style, open- vs focused-session, it was observed that participation in focused sessions led to greater improvements in glycemic control. Furthermore, when stratified by provider, greater improvements in glycemic control were demonstrated when medication management was completed by a CPS vs a NP (Table 2). The average number of interventions per SMA patient was 3.1 ± 2.22 (SD). For the control group, the total number of interventions made was 86, with an average of 1.37 ± 1.51 (SD) per patient. The overall show rate was 49% ± 16 (SD), 52% ± 16 (SD) for open visits, and 46% ± 15 (SD) for focused visits. The mean change in ABW and BMI from baseline to endpoint was no different between the SMA and control groups (Table 3). The SMA group participants demonstrated a decrease in A1c at 3 months postdischarge, and a moderate increase in A1c was noted at 6 months postdischarge.
Discussion
Shared medical appointments provide an effective alternative to standards of care in order to obtain improvements in glycemic control. Consistent with previous studies, this study reported significant improvements in glycemic control in the SMA group vs the control group. This study also elucidated unique characteristics about SMAs that may have been correlated with clinical success.
Although the greatest improvements in glycemic control were noted for those who participated in ≥ 6 SMAs, it was observed that participation in only 1 SMA also led to improvements. For a site with limited staff and a high volume of patients waiting to participate in SMAs, it may be mutually beneficial to offer only 1 SMA per patient. In addition, patients with ≥ 10% A1c at baseline demonstrated greater improvements in glycemic control compared to those with < 10% A1c at baseline. The reasons the higher baseline A1c subgroup responded to interventions more robustly are unclear and likely multifactorial. Nonetheless, factors such as psychosocial influences (eg, peer pressure to get healthy) may have increased motivation to prevent complications and improved medication adherence in the setting of closer follow-up. Additionally, hyperresponsiveness to drug therapy may have played a role. Regardless, for new SMA programs interested in making an immediate impact, it may be advantageous to initially select patients with very poorly controlled DM.
A unique aspect of the ABJ SMA was the variety of focused sessions offered. Previous studies did not demonstrate such a variety of focused sessions, nor did they evaluate the impact of a focused visit on the patient’s T2DM control. Participation in focused ABJ SMA sessions may have led to improved T2DM control, which may be attributed to the value patients assigned to specialty care and an increased motivation to get healthy.
Related: SGLT2 Inhibitors for Type 2 Diabetes Mellitus Treatment
Another factor that may have led to improved T2DM control was CPS involvement with medication management. The presence of a NP was highly valued, both from a group discussion and medication management standpoint; still, it is a good idea to involve a CPS who has a strong command of DM pharmacotherapy. One shortcoming of this SMA program was the inability for patients to maintain glycemic improvements 6 months after discharge. This pitfall was likely the result of suboptimal coordination of care after SMA discharge and may be avoided by asking the medical administration service clerk to promptly schedule discharged SMA patients for a general medicine clinic T2DM follow-up.The SMA patients had more T2DM interventions within the same time frame compared with the control patients. Although not causative, the increased number of interventions in addition to the bolstered support of the SMA may have correlated with glycemic improvements.
An important finding of this study was the SMA show rate and how it compared with attendance rates found in other group models. The favorable ABJ SMA show rate could have been due to the rigorous attention paid to reminder letters and phone calls. The literature has not established a standard approach to increasing SMA show rates; however, the current data suggest that increased reminders may have increased attendance.
Limitations
This study had several limitations. The external validity was weakened by the modest sample size and the homogenous baseline characteristics of those enrolled. Another limitation was inconsistent documentation of laboratory parameters. The inability to obtain A1c values exactly at enrollment and discharge could have potentially skewed the results. In addition, incomplete documentation of interventions for dual-care patients (ie, those who obtained care outside of the VA) was an unavoidable challenge. Last, this study did not perform an assessment of SMA patient satisfaction, cost-benefit, or safety.
Conclusion
The ABJ SMA was an effective addition to standards of care in order to achieve improvements in glycemic control in a veteran population with poorly controlled T2DM. Furthermore,the data suggest that a successful program should be multidisciplinary, select poorly controlled patients, offer focused sessions, have a CPS participate in medication management, and encourage patients to complete ≥ 6 sessions. Future studies should be conducted to include more diverse patients to see whether the efficacy of this SMA format is maintained.
A safety analysis should also be conducted to ensure that the SMA format is not only effective, but also a safe means to manage medical conditions. In addition, the scope of the ABJ SMAs should be expanded to allow for evaluation of other diseases. An evaluation of patient satisfaction and cost-benefit could provide additional support for the implementation of SMAs, as improvements in quality of life and cost savings are endpoints to be desired.
Author disclosures
The authors report no actual or potential conflicts of interest with regard to this article.
Disclaimer
The opinions expressed herein are those of the authors and do not necessarily reflect those of Federal Practitioner, Frontline Medical Communications Inc., the U.S. Government, or any of its agencies. This article may discuss unlabeled or investigational use of certain drugs. Please review complete prescribing information for specific drugs or drug combinations—including indications, contraindications, warnings, and adverse effects—before administering pharmacologic therapy to patients.
1. Centers for Disease Control and Prevention. National Diabetes Statistics Report: Estimate of Diabetes and Its Burden in the United States, 2014. Atlanta, GA: U.S. Department of Health and Human Services; 2014.
2. American Diabetes Association. Economic costs of diabetes in the U.S. in 2012. Diabetes Care. 2013;36(4):1033-1046.
3. Kirsh SR, Watts S, Pascuzzi K, et al. Shared medical appointments based on the chronic care model: a quality improvement project to address the challenges of patients with diabetes with high cardiovascular risk. Qual Saf Health Care. 2007;16(5):349-353.
4. Jaber R, Braksmajer A, Trilling JS. Group visits: a qualitative review of current research. J Am Board Fam Med. 2006;19(3):276-290.
5. Klein S. The Veterans Health Administration: implementing patient-centered medical homes in the nation's largest integrated delivery system. Commonwealth Fund Website. http://www.common wealthfund.org/publications/case-studies/2011 /sep/va-medical-homes. Published September 2011. Accessed November 11, 2015.
6. U.S. Department of Veterans Affairs. VA Shared Medical Appointments for Patients With Diabetes: Maximizing Patient & Provider Expertise to Strengthen Patient Management. Washington, DC: U.S. Department of Veterans Affairs; 2008.
7. Bronson DL, Maxwell RA. Shared medical appointments: increasing patient access without increasing physician hours. Cleve Clin J Med. 2004;71(5):369-370, 372, 374 passim.
8. Cohen LB, Taveira T, Khatana SA, Dooley AG, Pirraglia PA, Wu WC. Pharmacist-led shared medical appointments for multiple cardiovascular risk reduction in patients with type 2 diabetes. Diabetes Educ. 2011;37(6):801-812.
9. Naik AD, Palmer N, Petersen NJ, et al. Comparative effectiveness of goal setting in diabetes mellitus group clinics: randomized clinical trial. Arch Intern Med. 2011;171(5):453-459.
The Role of Procalcitonin in the Management of Infectious Diseases
Procalcitonin (PCT) is a precursor to the hormone calcitonin and is a serum biomarker of interest in infectious diseases. Many studies have analyzed its utility and role in assisting clinical decision making, especially in conditions that result in inflammation due to a bacterial infection. A systemic inflammatory response from a bacterial infection begins with the release of endotoxins/exotoxins and a response from immune system mediators that release cytokines, such as interleukin-1β and tumor necrosis factor-α. These cytokines contribute to the development of a fever, the release of stress hormones, such as cortisone and epinephrine, and interleukin-6, which stimulates acute phase reactants, such as C-reactive protein (CRP) and PCT.1,2
C-reactive protein and white blood cell count (WBC) are commonly used clinically as biomarkers that assist in the recognition of the infectious process and may be indicators of disease prognosis, but both lack specificity for bacterial infections. Consequentially, using CRP and WBC as clinical decision aids may result in unnecessary antibiotic therapy, which may result in an increase in drug-related adverse events and antibiotic resistance. A major distinction of PCT is that it has greater specificity than does CRP, because it tends to be elevated primarily as a result of inflammation due to bacterial infections. Procalcitonin can be used to distinguish bacterial from viral infections because its up-regulation is attenuated by interferon-gamma, a cytokine released in response to viral infections.2 Thus, PCT may be a more effective clinical marker for optimizing the diagnosis, monitoring, and treatment in patients with systemic bacterial infections.
Procalcitonin as a Marker
A study evaluating infectious markers compared the use of PCT, lactate, and CRP as diagnostic tools in patients with septic shock. The results of this study indicated that PCT was the only marker significantly elevated in patients with septic shock that was also normal in patients not in septic shock (14 µg/mL vs 1 µg/mL, P = .0003).3 This and other studies led the FDA to approve PCT use in 2005 as an aid to clinical decision making in the assessment of critically ill patients with sepsis.4 Overall, the literature supports the use of PCT as a diagnostic tool in infections requiring antimicrobial therapy within appropriate clinical settings.
Strong evidence exists confirming PCT’s role as an aid to clinical decision making in bronchitis, chronic obstructive pulmonary disease exacerbations, pneumonia, and severe sepsis/shock management.2 Procalcitonin’s kinetic profile makes it a good monitoring tool, because its levels promptly increase within 3 to 6 hours of infection, peak at 12 to 48 hours, and rapidly decline during recovery. Additionally, its levels closely parallel the extent and severity of present inflammation, making it a useful prognostic marker of disease progression and response to antibiotic therapy.2,4,5
Related: Mass Transit for Viruses
Christ-Crain and colleagues studied the outcome of PCT-guided antibiotic algorithms for patients with lower respiratory tract infections (RTIs) presenting to the emergency department. A serum PCT level of 0.25 to 0.5 µg/L suggested a likely bacterial infection, and physicians were advised to initiate antimicrobial therapy. Serum levels above 0.5 µg/L were suggestive of a bacterial infection, and initiation of antimicrobial therapy was strongly recommended. The results showed that PCT-guided algorithms significantly reduced the number of antibiotic-treated patients (n = 99 [83%] vs n = 55 [44%]; P < .0001), reduced the duration of antibiotic treatment (12.8 days vs 10.9 days; P = .03), and decreased the antibiotic cost per patient ($202.5 vs $96.3; P < .0001) compared with the standard group (n = 119) without a significant difference in mortality.6
Sepsis/septic shock is another area in which PCT has been studied. Use of a PCT-guided algorithm in critically ill patients with suspected or documented severe sepsis or septic shock to guide discontinuation of antimicrobial therapy resulted in reduced duration of antibiotic therapy (10 days vs 6 days; P = .003) in the PCT group (n = 31) compared with the standard of care group (n = 37) while maintaining similar mortality and infection recurrence rates between the 2 groups. The PCT algorithm in this study recommended discontinuing antimicrobial therapy when PCT levels had decreased by > 90% from identification of sepsis/septic shock but not prior to 3 or 5 days of therapy, depending on the baseline PCT level.7
Systematic reviews of multiple trials have confirmed these representative results. Using a PCT algorithm to withhold or de-escalate antibiotics in patients with suspected bacterial infection leads to a significant reduction in antimicrobial utilization without adversely affecting patient outcome.8
Related: Health Care Use Among Iraq and Afghanistan Veterans With Infectious Diseases
Procalcitonin levels should be rechecked 48 to 72 hours after beginning antimicrobial therapy in clinically stable patients with RTIs in order to reevaluate patient need for continued therapy. In patients whose antibiotics are withheld due to low PCT levels, it is recommended to obtain a repeat level 12 to 48 hours after the decision if clinical improvement is not seen.6,9-12 Literature suggests that it is reasonable to check PCT levels every 48 to 72 hours in patients with sepsis for considering discontinuation of antibiotic therapy as well as in patients who are not clinically improving and may need to broaden antibiotic therapy.7,12
Limitations of the use of PCT as a clinical biomarker include its inability to be used in immunocompromised patients. In addition, PCT levels are increased in severe, noninfectious inflammatory conditions, such as inhalation injury, pulmonary aspiration, severe burns, pancreatitis, heat stroke, mesenteric infarction, trauma, surgery, and pneumonitis.12 The presence of low-grade inflammation from a bacterial infection can lead to slightly elevated PCT levels that are difficult to quantify due to the low sensitivity of current PCT assays.13
The level of PCT up-regulation may depend on the infecting pathogen. One study showed that PCT was highly elevated in patients with pneumococcal community-acquired pneumonia (CAP), and another study demonstrated that PCT levels did not increase in CAP due to atypical organisms.14,15 Thus, atypical antimicrobial coverage should be continued per current guidelines in patients in whom there is high suspicion of atypical organism-involvement in CAP.
Related: The Importance of an Antimicrobial Stewardship Program
Conclusion
Many studies have analyzed the use of PCT as a biomarker for infectious disease diagnosis, monitoring, and treatment. Current evidence supports its use in RTIs and sepsis, although it may be useful in other conditions as well, such as bacteremia and postoperative infections.2 Due to its limitations and controversy, PCT should not be used as a sole marker but as an adjunct to a patient’s clinical presentation, overall clinical picture, and other biomarkers.
Additional Note
An earlier version of this article appeared in the Pharmacy Related Newsletter: The Capsule, of the William S. Middleton Memorial Veterans Hospital.
Author disclosures
The authors report no actual or potential conflicts of interest with regard to this article.
Disclaimer
The opinions expressed herein are those of the authors and do not necessarily reflect those of Federal Practitioner, Frontline Medical Communications Inc., the U.S. Government, or any of its agencies. This article may discuss unlabeled or investigational use of certain drugs. Please review the complete prescribing information for specific drugs or drug combinations—including indications, contraindications, warnings, and adverse effects—before administering pharmacologic therapy to patients.
Outcomes and Medication Use in a Longitudinal Cohort of Type 2 Diabetes Patients, 2006 to 2012
From the Wake Forest School of Medicine, Winston-Salem, NC.
Abstract
- Objective: To assess outcomes and pharmacotherapy in a cohort of patients with type 2 diabetes in a university-based family medicine teaching practice.
- Methods: We used ICD-9-CM codes to identify a cohort of patients with diabetes seen in 2006 and 2012. A total of 891 patients were identified who made follow-up visits in both years. We collected data on patient characteristics, pharmacotherapy, and outcomes for glycemia, blood pressure (BP), and low-density lipoprotein (LDL) cholesterol. We determined type and number of medications taken to achieve target outcomes.
- Results: A1C remained constant between 2006 and 2012 (7.6% to 7.7%) along with BMI (34.7 kg/m2 to 34.1 kg/m2), while mean LDL cholesterol significantly decreased from 109 mg/dL in 2006 to 98.8 mg/dL in 2012. The number of patients achieving a goal LDL < 100 mg/dL increased from 43.5 % in 2006 to 58.6% in 2012. The largest group with controlled A1C (< 7 %) were taking metformin with a sulfonylurea, DPP-4 inhibitor, glitazone or an injectable GLP-agonist. The majority achieved an LDL goal of < 100 mg/dl. The majority of hypertensive regimens included use of an ACE inhibitor or ARB with overall BP control achieved in at least 45% of patients.
- Conclusion: Multiple medications are necessary to achieve control among patients with type 2 diabetes over time and this cannot be attributed to an increase in BMI. Overall control for A1C and BP can be sustained and significantly decreased for LDL cholesterol using multiple medications, with the primary agent for LDL reduction being a statin.
Diabetes is an illness that affects an estimated 25.8 million Americans and is quickly becoming a worldwide epidemic [1,2]. Diabetes is a significant cause of both microvascular and macrovascular sequelae, but its frequent association with the comorbid conditions of hypertension and dyslipidemia further increases the risk of heart disease, stroke, peripheral vascular complications, and renal impairment [3–5]. The American Diabetes Association (ADA) publishes consensus guidelines annually to guide management for patients with diabetes. From 2006 to 2012, the accepted standard of medical care included achieving a hemoglobin A1C (A1C) measurement of < 7%, a low-density lipoprotein (LDL) level of < 100 mg/dL, and a blood pressure (BP) of < 130/80 mm Hg [6,7]. The National Health and Nutrition Examination Survey (NHANES) recently reported that the goal of simultaneous control of A1C, LDL and BP is met in only about 19% of diabetes patients [8]. Target glycemic control is relaxed to an A1C < 8% in some patients with multiple comorbidities, limited life span, or risk for hypoglycemia; and in 2013 the BP goal was modified to < 140/80 based on clinical trial evidence [9].
In combination with lifestyle modification, pharmacotherapy is a critical component of chronic disease management. Initial pharmacotherapy treatment recommendations include metformin for diabetes, an angiotensin-converting enzyme inhibitor (ACEI) or angiotensin II receptor blocker (ARB) for hypertension, and a statin for dyslipidemia [6,7,9]. In patients who already have a diagnosis of diabetes, achieving control becomes more difficult to accomplish with lifestyle alone, and the benefit of lifestyle intervention on all-cause mortality as well as cardiovascular and microvascular events remains a debated issue [10]. The need for pharmacologic agents in most patients with diabetes is inevitable. Metformin is the agent of choice for initial treatment with drug therapy, with the option of adding a variety of other oral or injectable medications based on clinician decision-making [7]. In this study, we reviewed data from a longitudinal cohort of type 2 diabetes patients and compared medication use and outcomes at 2 different time-points (2006 and 2012) to see how medical management and outcome measures changed over time.
Methods
Setting
Data were obtained from an academic family medicine clinic in the southeastern United States. Approximately 56,000 patient visits to this clinic are conducted annually. Family medicine residents in training, fellows, faculty physicians, physician assistants, a nutritionist, and diabetes educators care for patients seen in this practice.
Data Collection
A cohort of patients was identified using the International Classification of Diseases, 9th Revision, Clinical Modification codes for type 2 diabetes. The cohort comprised patients with diabetes in 2006 and 2012 who made follow-up visits in both years.
The data from both time-points were obtained from electronic medical record (EMR) data capture and structured chart review. Two reviewers reviewed 10% of the charts for accuracy after the data was pre-populated from the EMR. The following data were obtained: demographic variables (patient age, gender, and race), height, weight, insurance, smoking status, A1C, LDL, and BP measurements, pharmacotherapy for glycemia, hypertension, and hyperlipidemia, and number of medications needed for control. For variables that had multiple measures, we calculated an average for the year.
The study protocol was approved by the Institutional Review Board at Wake Forest School of Medicine.
Statistical Analysis
Descriptive statistics were performed to compute means, standard deviations, frequencies, and percentages for demographic variables and for glycemia, BP, LDL includ-ing patient characteristics, diabetes outcomes, and pharmacotherapy medication variables. Paired t tests were used to assess for a difference at the level of the patient in the means of the A1C, BP, and LDL between the 2 study time-points (2-sided alpha = 0.05). The non-parametric McNemar test was used to assess for differences in the proportions of patients at the identified goal for A1C, LDL, and BP for 2006 and 2012.
Results
The number of visits per patient was 5.9 in 2006 and 5.3 in 2012. A1C remained constant between 2006 and 2012 (mean 7.6% vs. 7.7%, ± 1.8) along with body mass index (BMI), while mean LDL cholesterol significantly decreased from 109 ± 36.4 mg/dL in 2006 to 98.8 ± 40.4 mg/dL in 2012 (Table 2). Mean systolic BP marginally increased over the 6-year period from 131.5 ± 14.2 to 134.8 ± 16.1 mm Hg with diastolic BP remaining constant.
The percentage of patients achieving the less stringent A1C goal of < 8% comprised over 50% of the population at both time points; however, compared with 2006, in 2012 there was a lower percentage of patients at the more stringent A1C target of < 7% (43.2% vs. 39.6%). The percentage of patients achieving goal for systolic BP was significantly decreased to 38.6% in 2012 versus 46.5% in 2006 (Table 2). However, the proportion of patients with controlled diastolic BP rose significantly from 70% to 77.6%. The number of patients achieving goal LDL (< 100 mg/dL) increased from 43.5% in 2006 to 58.6% in 2012.
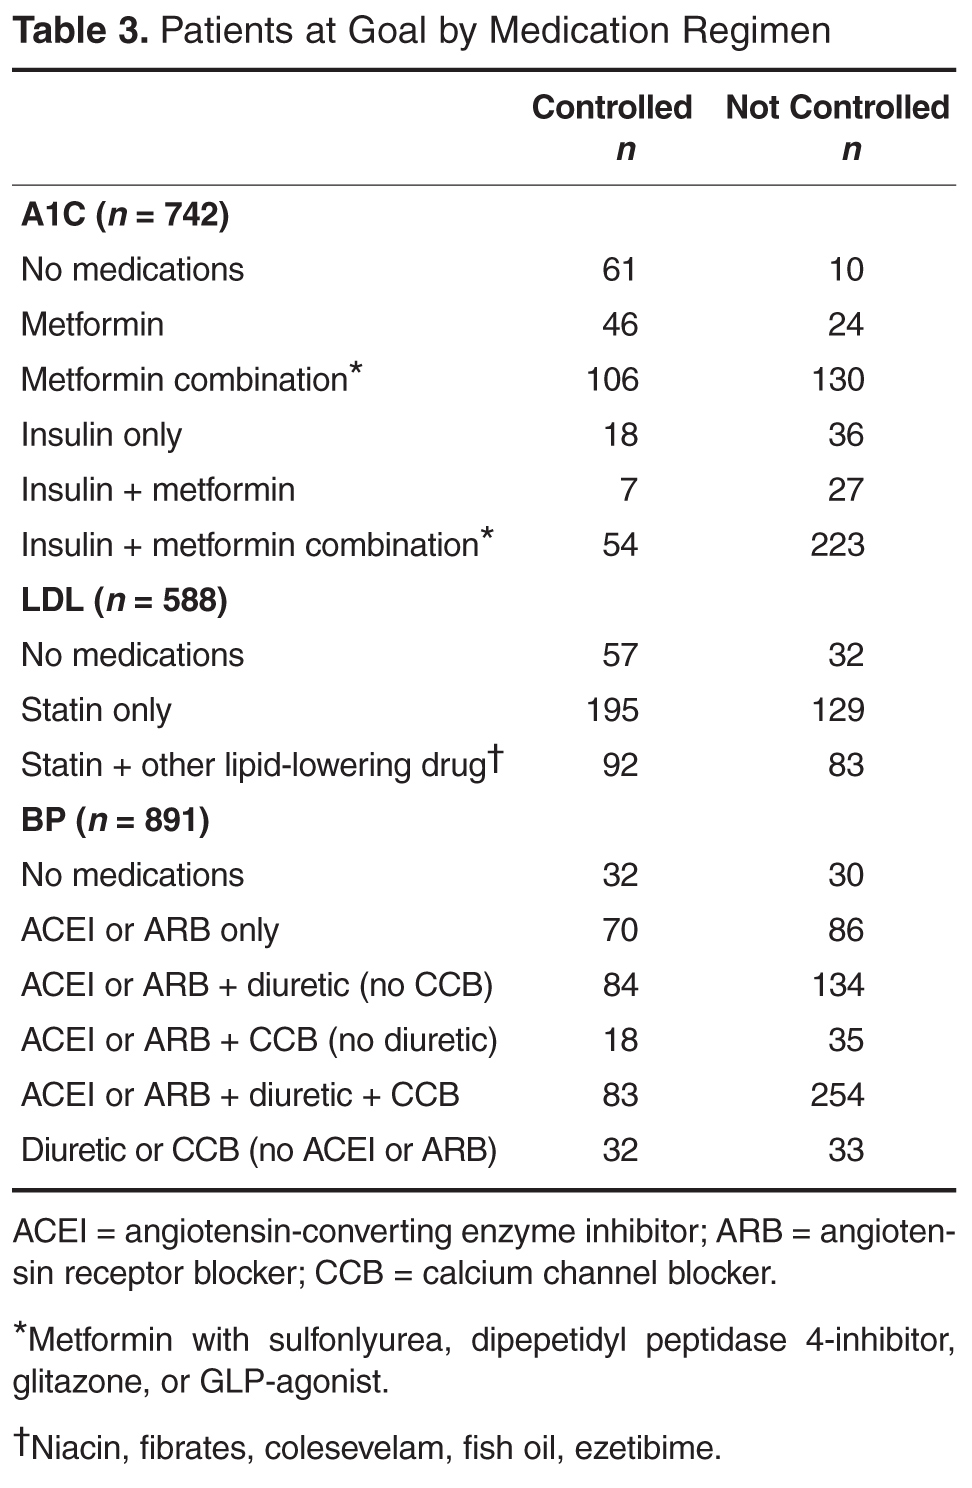
Table 3 shows number of patients at LDL goal of < 100 mg/dL by lipid-lowering agent. There was a large portion (n = 303 or 34%) of the 891 patients that did not have LDL values available in both 2006 and 2012. A total of 89 patients were taking no medications for LDL, with 64% achieving controlled levels. The large majority of patients were controlled on a single statin drug (n = 195, 59%) while those requiring more than a statin drug for control comprised 53% of patients (n = 92).
Table 3 shows achievement of BP < 130/80 by anti-hypertensive regimen. The majority of the hypertensive regimens included the use of an ACEI or an ARB, with overall BP control achieved in at least 45% of patients. The highest BP control (49%) was achieved in the diuretic and CCB–containing regimens without an ACEI or ARB, represented by a smaller group of patients (n = 65). There were 32 patients whose hypertension was controlled without antihypertensive therapy. Ninety-three percent of the cohort had data for evaluation in both years.
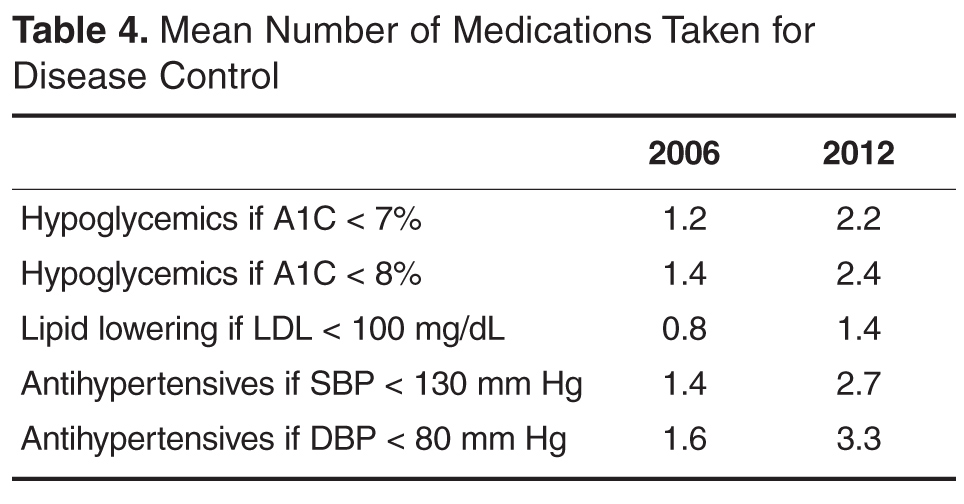
Discussion
Despite the availability of evidence-based guidelines and vast knowledge about microvascular and macrovascular complications due to diabetes, clinical goals for diabetes outcomes are not being routinely achieved in practice. More work is needed to achieve national standards of care. NHANES data from 2007 to 2010 revealed that 52.5% of patients with diabetes achieved an A1C of < 7% while 51.1% had a BP < 130/80 and 56.2% had an LDL < 100 mg/dL [8].
Improvement in LDL cholesterol was seen in the current study, and A1C remained constant during the 6-year time period. While mean A1C, BP, and LDL measurements were close to ADA target goals, a smaller proportion of patients were controlled in 2012 compared with 2006. Hoerger and colleagues [11] found using NHANES data 1999 to 2004 that mean A1C levels significantly declined over time, with 55.7% (up from 36.9%) achieving an A1C of < 7% by 2004 [11]. In our sample of patient with diabetes, only 39.6% were at A1C goal in 2012; 8.2% (61/742) achieved control with no medications.
Metformin is first-line therapy according to ADA recommendations. Most regimens in our study included this drug, with a large percentage of patients with controlled A1C taking this very affordable agent [12]. The combination regimens with metformin plus another oral therapy or 2 oral drugs with insulin resulted in a higher percentage of patients controlled compared to metformin or insulin monotherapy. From our previous chart review [13] of the entire practice of patients with diabetes (n = 1398) from 2006, A1C control was similarly achieved in patients taking insulin (31% vs. 33%) or insulin combinations (19% vs. 20%) from 2006 to 2012, respectively.
For LDL cholesterol control, 9.7% (57/588) of the cohort used no medications to reach goal. Statin use predominated, with 60% of the cohort reaching goal with a single statin agent. Approximately one-third (175/588) of evaluable patients were on more than 1 cholesterol medication, and about half of these (53%) reached goal. Over the 6-year period, atorvastatin become available generically, which may have impacted the number of patients able to use this statin. Compared with a recent literature review over a 12-year period of LDL attainment in primary care [14], the results of our study show equivalent or better LDL goal achievement among patient with diabetes.
The majority of the patients received an ACEI or ARB. There were a comparable number of patients controlled with ACEI or ARB with a diuretic, versus an ACEI or ARB with a diuretic and CCB. Large-scale clinical trials have shown that using an ACEI or ARB in combination with a CCB is superior to a hydrochlorathiazide-based combination for reducing risk of major cardiovascular events [15]. The Action to Control Cardiovascular Risk in Diabetes (ACCORD) trial showed that serious adverse events attributed to antihypertensive treatment occurred more frequently in the intensive therapy group (< 120/80) than in the standard therapy (< 140/80) group [16]. The stringent systolic BP goal in accord was accomplished using 3.4 medications. Aggressive lowering of BP may be dangerous in patients with diabetes and there is no benefit found in many large-scale studies [17]. The 2013 ADA goal for BP is now < 140/80 mm Hg, and while our data show that a significant increase in BP was seen over a 6-year period, the number of medications needed to control BP will likely be lower with the new ADA target and potentially safer.
In our cohort, over the 6-year period there was an increase in the number of medications needed to achieve glycemic, BP, and LDL goals. During this time, there were no major changes in the way the patients received care in the clinic environment. We cannot comment on whether lifestyle changes or diabetes education may have impacted the need for increased medication use. Limitations to this study include the unavailability of A1C (17%) and LDL (34%) data at both time points for every patient, inability to verify insurance data for the 2012 time period, and that the data are from a single practice. We also were unable to determine the duration of diabetes diagnosis due to a change in electronic medical record systems and lack of full documentation by providers.
These findings suggest that as patients live longer with type 2 diabetes, they will need increasing numbers of medications to achieve standard of care goals. Research has shown that there are challenges in implementing diabetes guidelines in primary care, including potential inaccuracies contained in electronic patient health information, inadequate coordination among health care providers, physician lack of awareness of guidelines, and clinical inertia [18]. As shown in the current study and other research, intensification of traditional therapies for glycemic control can sustain target outcomes without the risk of significant weight gain [19].
The chronic condition of diabetes is associated with medical complications as well as challenges for providing optimal care, despite advances in pharmacotherapy. As more medications are added to a patient’s regimen, adherence can become challenging. The cost of medications also warrants consideration. Research is needed to understand the impact on quality of life, cost of care, and outcomes of these regimens as well as whether lifestyle modifications can impact the number of medications needed by individual patients. The current study indicates that overall outcome control for A1C and BP can be sustained and significantly decreased for LDL cholesterol using multiple medications with the primary agent being a statin drug.
Acknowledgements: We would like to thank Drs. Elizabeth Strachan and Madhavi Peechara for their past contributions and diligence in the original chart review.
Corresponding author: Julienne K. Kirk, PharmD, CDE, Wake Forest School of Medicine, Medical Center Blvd., Winston-Salem, NC 27157-1084, jkirk@wakehealth.edu.
Financial disclosures: None.
Author contributions: conception and design, JKK, KL, RWL; analysis and interpretation of data, JKK, SWD, KL, CAH, RWL; drafting of article, JKK, KL, RWL; critical revision of the article, JKK, KL, CAH; provision of study materials or patients, JKK, SWD; statistical expertise, SWD; administrative or technical support, CAH; collection and assembly of data, JKK, KL, CAH.
1. Centers for Disease Control and Prevention. National diabetes fact sheet: national estimates and general information on diabetes and prediabetes in the United States, 2011. Atlanta: US Department of Health and Human Services, Centers for Disease Control and Prevention, 2011.
2. Narayan KM, Boyle JP, Thompson TJ, et al. Lifetime risk for diabetes mellitus in the United States. JAMA 2003;290:1884–90.
3. McWilliams JM, Meara E, Zaslavsky AM, Ayanian JZ. Differences in control of cardiovascular disease and diabetes by race, ethnicity, and education: U.S. trends from 1999 to 2006 and effects of Medicare coverage. Ann Intern Med 2009;150:505–15.
4. Vouri SM, Shaw RF, Waterbury NV, et al. Prevalence of achievement of A1c, blood pressure, and cholesterol (ABC) goal in veterans with diabetes. Manag Care Pharm 2011;17:304–12.
5. Kirk JK, Bell RA, Bertoni AG, et al. Ethnic disparities: control of glycemia, blood pressure, and LDL cholesterol among US adults with type 2 diabetes. Ann Pharmacother 2005;39:1489–501.
6. American Diabetes Association. Standards of medical care in diabetes–2006. Diabetes Care 2006;29(Suppl 1):S4–S42.
7. American Diabetes Association. Standards of medical care in diabetes–2012. Diabetes Care 2012;35(Suppl 1):S11–S63.
8. Casagrande SS, Fradkin JE, Saydah SH, et al. The prevalence of meeting A1C, blood pressure, and LDL goals among people with diabetes, 1988-2010. Diabetes Care 2013;36:2271–9.
9. American Diabetes Association. Standards of medical care in diabetes–2013. Diabetes Care 2013;36(Suppl 1):S11–S66.
10. Schellenberg ES, Dryden DM, Vandermeer B, et al. Lifestyle intervention for patients with and at risk for type 2 diabetes: A systematic review and meta-analysis. Ann Inten Med 2013;159:543–51.
11. Hoerger TJ, Segel JE, Gregg EW, Saaddine JB. Is glycemic control improving in US adults? Diabetes Care 2008;31:81–6.
12. Inzucchi SE, Bergenstal RM, Buse JB, et al. Management of hyperglycemia in type 2 diabetes: a patient-centered approach. Diabetes Care 2012;35:1364–79.
13. Kirk JK, Strachan E, Martin CL, et al. Patient characteristics and process of care measures as predictors of glycemic control. J Clin Outcomes Manag 2010;17:27–30.
14. Chopra I, Kamal KM, Candrilli SD. Variations in blood pressure and lipid goal attainment in primary care. Curr Med Res Opin 2013;29:1115–25.
15. Jamerson K, Weber MA, Bakris GL, et al. Benazepril plus amlodipine or hydrochlorothiazide for hypertension in high-risk patients. N Engl J Med 2008;359:2417–28.
16. Grossman E. Blood pressure: the lower, the better. The con side. Diabetes Care 2011;34:S308–12.
17. Cushman WC, Evans GW, Byington RP, et al. Effects of intensive blood pressure control in type 2 diabetes mellitus. N Engl J Med 2010;362:1575–85.
18. Appiah B, Hong Y, Ory MG, et al. Challenges and opportunities for implementing diabetes self-management guidelines. J Am Board Fam Med 2013;26:90–2.
19. Best JD, Drury PL, Davis TME, et al. Glycemic control over 4 years in 4,900 people with type 2 diabetes. Diabetes Care 2012;35:1165–70.
From the Wake Forest School of Medicine, Winston-Salem, NC.
Abstract
- Objective: To assess outcomes and pharmacotherapy in a cohort of patients with type 2 diabetes in a university-based family medicine teaching practice.
- Methods: We used ICD-9-CM codes to identify a cohort of patients with diabetes seen in 2006 and 2012. A total of 891 patients were identified who made follow-up visits in both years. We collected data on patient characteristics, pharmacotherapy, and outcomes for glycemia, blood pressure (BP), and low-density lipoprotein (LDL) cholesterol. We determined type and number of medications taken to achieve target outcomes.
- Results: A1C remained constant between 2006 and 2012 (7.6% to 7.7%) along with BMI (34.7 kg/m2 to 34.1 kg/m2), while mean LDL cholesterol significantly decreased from 109 mg/dL in 2006 to 98.8 mg/dL in 2012. The number of patients achieving a goal LDL < 100 mg/dL increased from 43.5 % in 2006 to 58.6% in 2012. The largest group with controlled A1C (< 7 %) were taking metformin with a sulfonylurea, DPP-4 inhibitor, glitazone or an injectable GLP-agonist. The majority achieved an LDL goal of < 100 mg/dl. The majority of hypertensive regimens included use of an ACE inhibitor or ARB with overall BP control achieved in at least 45% of patients.
- Conclusion: Multiple medications are necessary to achieve control among patients with type 2 diabetes over time and this cannot be attributed to an increase in BMI. Overall control for A1C and BP can be sustained and significantly decreased for LDL cholesterol using multiple medications, with the primary agent for LDL reduction being a statin.
Diabetes is an illness that affects an estimated 25.8 million Americans and is quickly becoming a worldwide epidemic [1,2]. Diabetes is a significant cause of both microvascular and macrovascular sequelae, but its frequent association with the comorbid conditions of hypertension and dyslipidemia further increases the risk of heart disease, stroke, peripheral vascular complications, and renal impairment [3–5]. The American Diabetes Association (ADA) publishes consensus guidelines annually to guide management for patients with diabetes. From 2006 to 2012, the accepted standard of medical care included achieving a hemoglobin A1C (A1C) measurement of < 7%, a low-density lipoprotein (LDL) level of < 100 mg/dL, and a blood pressure (BP) of < 130/80 mm Hg [6,7]. The National Health and Nutrition Examination Survey (NHANES) recently reported that the goal of simultaneous control of A1C, LDL and BP is met in only about 19% of diabetes patients [8]. Target glycemic control is relaxed to an A1C < 8% in some patients with multiple comorbidities, limited life span, or risk for hypoglycemia; and in 2013 the BP goal was modified to < 140/80 based on clinical trial evidence [9].
In combination with lifestyle modification, pharmacotherapy is a critical component of chronic disease management. Initial pharmacotherapy treatment recommendations include metformin for diabetes, an angiotensin-converting enzyme inhibitor (ACEI) or angiotensin II receptor blocker (ARB) for hypertension, and a statin for dyslipidemia [6,7,9]. In patients who already have a diagnosis of diabetes, achieving control becomes more difficult to accomplish with lifestyle alone, and the benefit of lifestyle intervention on all-cause mortality as well as cardiovascular and microvascular events remains a debated issue [10]. The need for pharmacologic agents in most patients with diabetes is inevitable. Metformin is the agent of choice for initial treatment with drug therapy, with the option of adding a variety of other oral or injectable medications based on clinician decision-making [7]. In this study, we reviewed data from a longitudinal cohort of type 2 diabetes patients and compared medication use and outcomes at 2 different time-points (2006 and 2012) to see how medical management and outcome measures changed over time.
Methods
Setting
Data were obtained from an academic family medicine clinic in the southeastern United States. Approximately 56,000 patient visits to this clinic are conducted annually. Family medicine residents in training, fellows, faculty physicians, physician assistants, a nutritionist, and diabetes educators care for patients seen in this practice.
Data Collection
A cohort of patients was identified using the International Classification of Diseases, 9th Revision, Clinical Modification codes for type 2 diabetes. The cohort comprised patients with diabetes in 2006 and 2012 who made follow-up visits in both years.
The data from both time-points were obtained from electronic medical record (EMR) data capture and structured chart review. Two reviewers reviewed 10% of the charts for accuracy after the data was pre-populated from the EMR. The following data were obtained: demographic variables (patient age, gender, and race), height, weight, insurance, smoking status, A1C, LDL, and BP measurements, pharmacotherapy for glycemia, hypertension, and hyperlipidemia, and number of medications needed for control. For variables that had multiple measures, we calculated an average for the year.
The study protocol was approved by the Institutional Review Board at Wake Forest School of Medicine.
Statistical Analysis
Descriptive statistics were performed to compute means, standard deviations, frequencies, and percentages for demographic variables and for glycemia, BP, LDL includ-ing patient characteristics, diabetes outcomes, and pharmacotherapy medication variables. Paired t tests were used to assess for a difference at the level of the patient in the means of the A1C, BP, and LDL between the 2 study time-points (2-sided alpha = 0.05). The non-parametric McNemar test was used to assess for differences in the proportions of patients at the identified goal for A1C, LDL, and BP for 2006 and 2012.
Results
The number of visits per patient was 5.9 in 2006 and 5.3 in 2012. A1C remained constant between 2006 and 2012 (mean 7.6% vs. 7.7%, ± 1.8) along with body mass index (BMI), while mean LDL cholesterol significantly decreased from 109 ± 36.4 mg/dL in 2006 to 98.8 ± 40.4 mg/dL in 2012 (Table 2). Mean systolic BP marginally increased over the 6-year period from 131.5 ± 14.2 to 134.8 ± 16.1 mm Hg with diastolic BP remaining constant.
The percentage of patients achieving the less stringent A1C goal of < 8% comprised over 50% of the population at both time points; however, compared with 2006, in 2012 there was a lower percentage of patients at the more stringent A1C target of < 7% (43.2% vs. 39.6%). The percentage of patients achieving goal for systolic BP was significantly decreased to 38.6% in 2012 versus 46.5% in 2006 (Table 2). However, the proportion of patients with controlled diastolic BP rose significantly from 70% to 77.6%. The number of patients achieving goal LDL (< 100 mg/dL) increased from 43.5% in 2006 to 58.6% in 2012.
Table 3 shows number of patients at LDL goal of < 100 mg/dL by lipid-lowering agent. There was a large portion (n = 303 or 34%) of the 891 patients that did not have LDL values available in both 2006 and 2012. A total of 89 patients were taking no medications for LDL, with 64% achieving controlled levels. The large majority of patients were controlled on a single statin drug (n = 195, 59%) while those requiring more than a statin drug for control comprised 53% of patients (n = 92).
Table 3 shows achievement of BP < 130/80 by anti-hypertensive regimen. The majority of the hypertensive regimens included the use of an ACEI or an ARB, with overall BP control achieved in at least 45% of patients. The highest BP control (49%) was achieved in the diuretic and CCB–containing regimens without an ACEI or ARB, represented by a smaller group of patients (n = 65). There were 32 patients whose hypertension was controlled without antihypertensive therapy. Ninety-three percent of the cohort had data for evaluation in both years.
Discussion
Despite the availability of evidence-based guidelines and vast knowledge about microvascular and macrovascular complications due to diabetes, clinical goals for diabetes outcomes are not being routinely achieved in practice. More work is needed to achieve national standards of care. NHANES data from 2007 to 2010 revealed that 52.5% of patients with diabetes achieved an A1C of < 7% while 51.1% had a BP < 130/80 and 56.2% had an LDL < 100 mg/dL [8].
Improvement in LDL cholesterol was seen in the current study, and A1C remained constant during the 6-year time period. While mean A1C, BP, and LDL measurements were close to ADA target goals, a smaller proportion of patients were controlled in 2012 compared with 2006. Hoerger and colleagues [11] found using NHANES data 1999 to 2004 that mean A1C levels significantly declined over time, with 55.7% (up from 36.9%) achieving an A1C of < 7% by 2004 [11]. In our sample of patient with diabetes, only 39.6% were at A1C goal in 2012; 8.2% (61/742) achieved control with no medications.
Metformin is first-line therapy according to ADA recommendations. Most regimens in our study included this drug, with a large percentage of patients with controlled A1C taking this very affordable agent [12]. The combination regimens with metformin plus another oral therapy or 2 oral drugs with insulin resulted in a higher percentage of patients controlled compared to metformin or insulin monotherapy. From our previous chart review [13] of the entire practice of patients with diabetes (n = 1398) from 2006, A1C control was similarly achieved in patients taking insulin (31% vs. 33%) or insulin combinations (19% vs. 20%) from 2006 to 2012, respectively.
For LDL cholesterol control, 9.7% (57/588) of the cohort used no medications to reach goal. Statin use predominated, with 60% of the cohort reaching goal with a single statin agent. Approximately one-third (175/588) of evaluable patients were on more than 1 cholesterol medication, and about half of these (53%) reached goal. Over the 6-year period, atorvastatin become available generically, which may have impacted the number of patients able to use this statin. Compared with a recent literature review over a 12-year period of LDL attainment in primary care [14], the results of our study show equivalent or better LDL goal achievement among patient with diabetes.
The majority of the patients received an ACEI or ARB. There were a comparable number of patients controlled with ACEI or ARB with a diuretic, versus an ACEI or ARB with a diuretic and CCB. Large-scale clinical trials have shown that using an ACEI or ARB in combination with a CCB is superior to a hydrochlorathiazide-based combination for reducing risk of major cardiovascular events [15]. The Action to Control Cardiovascular Risk in Diabetes (ACCORD) trial showed that serious adverse events attributed to antihypertensive treatment occurred more frequently in the intensive therapy group (< 120/80) than in the standard therapy (< 140/80) group [16]. The stringent systolic BP goal in accord was accomplished using 3.4 medications. Aggressive lowering of BP may be dangerous in patients with diabetes and there is no benefit found in many large-scale studies [17]. The 2013 ADA goal for BP is now < 140/80 mm Hg, and while our data show that a significant increase in BP was seen over a 6-year period, the number of medications needed to control BP will likely be lower with the new ADA target and potentially safer.
In our cohort, over the 6-year period there was an increase in the number of medications needed to achieve glycemic, BP, and LDL goals. During this time, there were no major changes in the way the patients received care in the clinic environment. We cannot comment on whether lifestyle changes or diabetes education may have impacted the need for increased medication use. Limitations to this study include the unavailability of A1C (17%) and LDL (34%) data at both time points for every patient, inability to verify insurance data for the 2012 time period, and that the data are from a single practice. We also were unable to determine the duration of diabetes diagnosis due to a change in electronic medical record systems and lack of full documentation by providers.
These findings suggest that as patients live longer with type 2 diabetes, they will need increasing numbers of medications to achieve standard of care goals. Research has shown that there are challenges in implementing diabetes guidelines in primary care, including potential inaccuracies contained in electronic patient health information, inadequate coordination among health care providers, physician lack of awareness of guidelines, and clinical inertia [18]. As shown in the current study and other research, intensification of traditional therapies for glycemic control can sustain target outcomes without the risk of significant weight gain [19].
The chronic condition of diabetes is associated with medical complications as well as challenges for providing optimal care, despite advances in pharmacotherapy. As more medications are added to a patient’s regimen, adherence can become challenging. The cost of medications also warrants consideration. Research is needed to understand the impact on quality of life, cost of care, and outcomes of these regimens as well as whether lifestyle modifications can impact the number of medications needed by individual patients. The current study indicates that overall outcome control for A1C and BP can be sustained and significantly decreased for LDL cholesterol using multiple medications with the primary agent being a statin drug.
Acknowledgements: We would like to thank Drs. Elizabeth Strachan and Madhavi Peechara for their past contributions and diligence in the original chart review.
Corresponding author: Julienne K. Kirk, PharmD, CDE, Wake Forest School of Medicine, Medical Center Blvd., Winston-Salem, NC 27157-1084, jkirk@wakehealth.edu.
Financial disclosures: None.
Author contributions: conception and design, JKK, KL, RWL; analysis and interpretation of data, JKK, SWD, KL, CAH, RWL; drafting of article, JKK, KL, RWL; critical revision of the article, JKK, KL, CAH; provision of study materials or patients, JKK, SWD; statistical expertise, SWD; administrative or technical support, CAH; collection and assembly of data, JKK, KL, CAH.
1. Centers for Disease Control and Prevention. National diabetes fact sheet: national estimates and general information on diabetes and prediabetes in the United States, 2011. Atlanta: US Department of Health and Human Services, Centers for Disease Control and Prevention, 2011.
2. Narayan KM, Boyle JP, Thompson TJ, et al. Lifetime risk for diabetes mellitus in the United States. JAMA 2003;290:1884–90.
3. McWilliams JM, Meara E, Zaslavsky AM, Ayanian JZ. Differences in control of cardiovascular disease and diabetes by race, ethnicity, and education: U.S. trends from 1999 to 2006 and effects of Medicare coverage. Ann Intern Med 2009;150:505–15.
4. Vouri SM, Shaw RF, Waterbury NV, et al. Prevalence of achievement of A1c, blood pressure, and cholesterol (ABC) goal in veterans with diabetes. Manag Care Pharm 2011;17:304–12.
5. Kirk JK, Bell RA, Bertoni AG, et al. Ethnic disparities: control of glycemia, blood pressure, and LDL cholesterol among US adults with type 2 diabetes. Ann Pharmacother 2005;39:1489–501.
6. American Diabetes Association. Standards of medical care in diabetes–2006. Diabetes Care 2006;29(Suppl 1):S4–S42.
7. American Diabetes Association. Standards of medical care in diabetes–2012. Diabetes Care 2012;35(Suppl 1):S11–S63.
8. Casagrande SS, Fradkin JE, Saydah SH, et al. The prevalence of meeting A1C, blood pressure, and LDL goals among people with diabetes, 1988-2010. Diabetes Care 2013;36:2271–9.
9. American Diabetes Association. Standards of medical care in diabetes–2013. Diabetes Care 2013;36(Suppl 1):S11–S66.
10. Schellenberg ES, Dryden DM, Vandermeer B, et al. Lifestyle intervention for patients with and at risk for type 2 diabetes: A systematic review and meta-analysis. Ann Inten Med 2013;159:543–51.
11. Hoerger TJ, Segel JE, Gregg EW, Saaddine JB. Is glycemic control improving in US adults? Diabetes Care 2008;31:81–6.
12. Inzucchi SE, Bergenstal RM, Buse JB, et al. Management of hyperglycemia in type 2 diabetes: a patient-centered approach. Diabetes Care 2012;35:1364–79.
13. Kirk JK, Strachan E, Martin CL, et al. Patient characteristics and process of care measures as predictors of glycemic control. J Clin Outcomes Manag 2010;17:27–30.
14. Chopra I, Kamal KM, Candrilli SD. Variations in blood pressure and lipid goal attainment in primary care. Curr Med Res Opin 2013;29:1115–25.
15. Jamerson K, Weber MA, Bakris GL, et al. Benazepril plus amlodipine or hydrochlorothiazide for hypertension in high-risk patients. N Engl J Med 2008;359:2417–28.
16. Grossman E. Blood pressure: the lower, the better. The con side. Diabetes Care 2011;34:S308–12.
17. Cushman WC, Evans GW, Byington RP, et al. Effects of intensive blood pressure control in type 2 diabetes mellitus. N Engl J Med 2010;362:1575–85.
18. Appiah B, Hong Y, Ory MG, et al. Challenges and opportunities for implementing diabetes self-management guidelines. J Am Board Fam Med 2013;26:90–2.
19. Best JD, Drury PL, Davis TME, et al. Glycemic control over 4 years in 4,900 people with type 2 diabetes. Diabetes Care 2012;35:1165–70.
Clozapine Management for Internists
Clozapine is a second‐generation antipsychotic (SGA) medication that was developed in 1959, introduced to Europe in 1971, and withdrawn from the market in 1975 due to associated concerns for potentially fatal agranulocytosis. In 1989, the US Food and Drug Administration (FDA) approved use of clozapine for the management of treatment‐resistant schizophrenia, under strict parameters for complete blood count (CBC) monitoring. Clozapine has since gained an additional FDA indication for reducing suicidal behavior in patients with schizophrenia and schizoaffective disorder,[1, 2, 3] and displayed superiority to both first generation antipsychotics and other SGA agents in reducing symptom burden.[2, 4, 5]
Clozapine's clinical benefits include lowering mortality in schizophrenia,[6] reducing deaths from ischemic heart disease,[7] curtailing substance use in individuals with psychotic disorders,[8] increasing rates of independent living and meaningful occupational activity, and reducing psychiatric hospitalizations and need for involuntary treatment.[9] Because schizophrenia, itself, is associated with a 15‐ to 20‐year decrease in average lifespan,[10] these benefits of clozapine are particularly salient. Yet the mechanism by which clozapine mitigates otherwise‐refractory psychotic symptoms is a conundrum. Structurally a tricyclic dibenzodiazepine, clozapine has relatively little effect on the dopamine D2 receptor, which has classically been thought to mediate the treatment effect of antipsychotics.[11, 12]
The unique nature of clozapine extends to its adverse effect profile. A significant percentage of patients who discontinue clozapine (17%35.4%) cite medical complications, the most common being seizures, constipation, sedation, and neutropenia.[13, 14] Yet several studies, including the landmark Clinical Antipsychotic Trials for Interventions Effectiveness (CATIE) study, have found that patients were more likely to adhere to clozapine therapy than to other antipsychotics.[2, 15] In the CATIE study, 44% of subjects taking clozapine continued the medication for 18 months, compared to 29% of individuals on olanzapine, 14% on risperidone, and 7% on quetiapine. Median time until discontinuation of clozapine was 10.5 months, significantly longer than for quetiapine (2.8 months) and olanzapine (2.7 months).[2] Because patients who experience clozapine‐related medical complications are likely to present first to the primary care or general hospital setting, internists must be aware of potential iatrogenic effects, and of their implications for psychiatric and medical care. Using case examples, we will examine both common and serious complications associated with clozapine, and discuss recommendations for management, including indications for clozapine discontinuation.
NEUROLOGICAL
Case Vignette 1
Mr. A is a 29‐year‐old man with asthma and schizophrenia who experienced a generalized tonic‐clonic seizure during treatment at a psychiatric facility. The patient started clozapine therapy 5 weeks prior, with gradual titration to 425 mg daily. Mr. A's previous medication trials included olanzapine and chlorpromazine, which rendered little improvement to his chronic auditory hallucinations. Clozapine was temporarily withheld during further neurologic workup, in which both electroencephalogram (EEG) and brain magnetic resonance imaging were unremarkable. After 60 hours, clozapine titration was reinitiated, and valproic acid was started for mood stabilization and seizure prophylaxis. Mr. A was discharged 6 weeks later on clozapine, 600 mg at bedtime, and extended‐release divalproate, 2500 mg at bedtime. The patient suffered no further seizure activity throughout hospitalization and for at least 1 year postdischarge.
Seizures complicate clozapine use in up to 5% of cases, with a dose‐dependent risk pattern.[16] Seizures are most commonly associated with serum clozapine levels above 500 g/L), but have also been reported with lower levels of clozapine and its metabolite norclozapine.[17] Though nonspecific EEG changes (ie, focal or generalized spikes, spike‐wave and polyspike discharges) have been associated with clozapine administration, they do not reliably predict seizure tendency.[17] Prophylaxis with antiepileptic drugs (AEDs) is not recommended, though AED treatment may be undertaken for patients who experience a seizure while on clozapine. When seizures occur in the context of elevated serum levels, reducing clozapine to the lowest effective dose is preferred over initiating an AED. Although this reduces the potential for exposure to anticonvulsant‐associated adverse effects, it may also introduce the risk of relapsed psychotic symptoms, and therefore requires close monitoring by a psychiatrist. For those who opt to initiate AED therapy, we recommend consideration of each medication's therapeutic and side‐effect profiles based on the patient's medical history and active symptoms. For example, in the case of Mr. A, valproate was used to target concomitant mood symptoms; likewise, patients who experience troublesome weight gain, as well as seizures, may benefit from topiramate. The occurrence of seizures does not preclude continuation of clozapine therapy, in conjunction with an AED[18] and after consideration of potential risks and benefits of use. Clozapine is not contraindicated in patients with well‐controlled epilepsy.[19]
Sedation, the most common neurologic side effect of clozapine, is also dose dependent and often abates during titration.[20] Though clozapine may induce extrapyramidal symptoms, including rigidity, tremor, and dystonia, the risk is considerably lower with clozapine than other antipsychotics, owing to a lesser affinity for D2 receptors. Associated parkinsonism should prompt consideration of dose reduction, in discussion with a psychiatrist, with concurrent monitoring of serum clozapine levels and close follow‐up for emergence of psychotic symptoms. If dose reduction is ineffective, not indicated, or not preferred by the patient, the addition of an anticholinergic medication may be considered (eg, diphenhydramine 2550 mg, benztropine 12 mg). Neuroleptic malignant syndrome, although rare, is life‐threatening and warrants immediate discontinuation of clozapine, though successful rechallenge after has been reported in case reports.[21]
CARDIAC
Case Vignette 2
Mr. B is a 34‐year‐old man with sinus tachycardia, a benign adrenal tumor, and chronic paranoid schizophrenia that had been poorly responsive to numerous antipsychotic trials. During a psychiatric hospitalization for paranoid delusions with aggressive threats toward family, Mr. B was started on clozapine and titrated to 250 mg daily. On day 16 of clozapine therapy, the patient began to experience cough, and several days later, diffuse rhonchi were noted on examination. Complete blood count revealed WBC 20.3 * 103/L, with 37% eosinophils and absolute eosinophil count of 7.51 (increased from 12%/1.90 the week before), and an electrocardiogram showed sinus tachycardia with ST‐segment changes. Mr. B was transferred to the general medical hospital for workup of presumed myocarditis.
Approximately one‐quarter of patients who take clozapine experience sinus tachycardia, which may be related to clozapine's anticholinergic effects causing rebound noradrenergic elevations[22]; persistent or problematic tachycardia may be treated using a cardio‐selective ‐blocker. Clozapine has also been linked to significant increases in systolic and diastolic blood pressure in 4% of patients (monitoring data); the risk of hypertension increases with the duration of clozapine treatment, and appears to be independent of the patient's weight.[23] Orthostatic hypotension has been reported in 9% of patients on clozapine therapy, though effects can be mitigated with gradual titration, adequate hydration, compression stockings, and patient education. Sinus tachycardia, hypertension, and orthostatic hypotension are not absolute indications to discontinue clozapine; rather, we advocate for treating these side effects while continuing clozapine treatment.[24]
Myocarditis represents the most serious cardiac side effect of clozapine.[25, 26] Although the absolute risk appears to be lower than 0.1%,[24] Kilian et al. calculated a 1000‐to‐2000fold increase in relative risk of myocarditis among patients who take clozapine, compared to the general population.[26] Most cases occur within the first month of treatment, with median time to onset of 15 days. This time course is consistent with an acute immunoglobulin Emediated hypersensitivity (type 1) reaction, and eosinophilic infiltrates have been found on autopsy, consistent with an acute drug reaction.[20]
Because of this early onset, the physician should maintain a particularly high index of suspicion in the first months of treatment, rigorously questioning patients and families about signs and symptoms of cardiac disease. If patients on clozapine present with flu‐like symptoms, fever, myalgia, dizziness, chest pain, dyspnea, tachycardia, palpitations, or other signs or symptoms of heart failure, evaluation for myocarditis should be undertaken.[25] Several centers have utilized cardiac enzymes (e.g., troponin I, troponin T, creatine kinase‐myocardial band) as a universal screen for myocarditis, though this is not a universal practice.[24] Both tachycardia and flu‐like symptoms may be associated with clozapine, particularly during the titration period, and these are normally benign symptoms requiring no intervention. If the diagnosis of myocarditis is made, however, clozapine should be stopped immediately. Myocarditis is often considered to be a contraindication to restarting clozapine, though cases have been reported of successful clozapine rechallenge in patients who had previously experienced myocarditis.[21]
Recommendations for clozapine‐associated electrocardiography (ECG) monitoring have not been standardized. Based on common clinical practice and the time course of serious cardiac complications, we recommend baseline ECG prior to the start of clozapine, with follow‐up ECG 2 to 4 weeks after clozapine initiation, and every 6 months thereafter.
GASTROINTESTINAL
Case Vignette 3
Mr. C is a 61‐year‐old man with chronic paranoid schizophrenia and a history of multiple‐state hospital admissions. He had been maintained on clozapine for 15 years, allowing him to live independently and avoid psychiatric hospitalization. Mr. C was admitted to the general medical hospital with nausea, vomiting, and an inability to tolerate oral intake. He was found to have a high‐grade small‐bowel obstruction, and all oral medications were initially discontinued. After successful management of his acute gastrointestinal presentation and discussion of potential risks and benefits of various treatment options, clozapine was reinitiated along with bulk laxative and stool softening agents.
Affecting 14% to 60% of individuals who are prescribed clozapine, constipation represents the most common associated gastrointestinal complaint.[27] For most patients, this condition is uncomfortable but nonlethal, though it has been implicated in several deaths by aspiration pneumonia and small‐bowel perforation.[28, 29] Providers must screen regularly for constipation and treat aggressively with stimulant laxatives and stool softeners,[18] while reviewing medication lists and, when possible, streamlining extraneous anticholinergic contributors. Clozapine‐prescribed individuals also frequently suffer from gastrointestinal reflux disease (GERD), for which behavioral interventions (eg, smoking cessation or remaining upright for 3 hours after meals) should be considered in addition to pharmacologic treatment with proton pump inhibitors. Clozapine therapy may be continued while constipation and GERD are managed medically.
Potentially fatal gastrointestinal hypomotility and small‐bowel obstruction are rare but well‐described complications that occur in up to 0.3% of patients who take clozapine.[27] This effect appears to be dose dependent, and higher blood levels are associated with greater severity of constipation and risk for serious hypomotility.[27] Clozapine should be withheld during treatment for such serious adverse events as ileus or small‐bowel perforation; however, once these conditions have stabilized, clozapine therapy may be reconsidered based on an analysis of potential benefits and risks. If clozapine is withheld, the internist must monitor for acute worsening of mental status, inattention, and disorientation, as clozapine withdrawal‐related delirium has been reported.[30] Ultimately, aggressive treatment of constipation in conjunction with continued clozapine therapy is the recommended course of action.[28]
Given the increased risk of ileus in the postoperative period, it is particularly important for physicians to inquire about preoperative bowel habits and assess for any existing constipation. Careful monitoring of postoperative bowel motility, along with early and aggressive management of constipation, is recommended. Concurrent administration of other constipating agents (eg, opiates, anticholinergics) should be limited to the lowest effective dose.[27] Although transaminitis, hepatitis, and pancreatitis have all been associated with clozapine in case reports, these are rare,[31] and the approach to management should be considered on a case‐by‐case basis.
HEMATOLOGIC
Case Vignette 4
Ms. D is a 38‐year‐old woman with a schizoaffective disorder who was started on clozapine after 3 other agents had failed to control her psychotic symptoms and alleviate chronic suicidal thoughts. Baseline CBC revealed serum white blood cell count (WBC) of 7800/mm3 and absolute neutrophil count (ANC) of 4700/mm3. In Ms. D's third week of clozapine use, WBC dropped to 4400/mm3 and ANC to 2200/mm3. Repeat lab draw confirmed this, prompting the treatment team to initiate twice‐weekly CBC monitoring. Ms. D's counts continued to fall, and 10 days after the initial drop, WBC was calculated at 1400/mm3 and ANC at 790/mm3. Clozapine was discontinued, and though the patient was asymptomatic, broad‐spectrum antibiotics were initiated. She received daily CBC monitoring until WBC >3000/mm3 and ANC >1500/mm3. An alternate psychotropic medication was initiated several weeks thereafter.
Neutropenia (white blood cell count <3000/mm3) is a common complication that affects approximately 3% of patients who take clozapine.[32] This may be mediated by clozapine's selective impact on the precursors of polymorphonuclear leukocytes, though the mechanism remains unknown.[33] Although neutropenia is not an absolute contraindication for clozapine therapy, guidelines recommend cessation of clozapine when the ANC drops below 1000/mm3.[34] A meta‐analysis of 112 patients who were rechallenged following neutropenia found that 69% tolerated a rechallenge without development of a subsequent dyscrasia.[21]
In the case of chemotherapy‐induced neutropenia, several case reports support the continued use of clozapine during cancer treatment[35]; this requires a written request to the pharmaceutical company that manufactures clozapine and documentation of the expected time course and contribution of chemotherapy to neutropenia.[36] Clozapine's association with neutropenia warrants close monitoring in individuals with human immunodeficiency virus (HIV) and other causes of immune compromise. Reports of clozapine continuation in HIV‐positive individuals underscore the importance of close collaboration between infectious disease and psychiatry, with specific focus on potential interactions between clozapine and antiretroviral agents and close monitoring of viral load and ANC.[37]
The most feared complication of clozapine remains agranulocytosis, defined as ANC<500/mm3,[33] which occurs in up to 1% of monitored patients. In 1975, clozapine was banned worldwide after 8 fatal cases of agranulocytosis were reported in Finland.[38] The drug was reintroduced for treatment‐resistant schizophrenia with strict monitoring parameters, which has sharply reduced the death rate. One study found 12 actual deaths between 1990 and 1994, compared to the 149 predicted deaths without monitoring.[39]
The risk of agranulocytosis appears to be higher in older adults and in patients with a lower baseline WBC count. Although there are reports of delayed agranulocytosis occurring in patients after up to 19 years of treatment,[40] the incidence of leukopenia is greatest in the first year. Given this high‐risk period, mandatory monitoring is as follows: weekly WBC and neutrophil counts for the first 26 weeks, biweekly counts for the second 26 weeks, and every 4 weeks thereafter. Of note, many of the later cases of agranulocytosis appear to be related to medication coadministration, particularly with valproic acid, though no definitive link has been established.[40]
Treatment of clozapine‐induced agranulocytosis consists of immediate clozapine cessation, and consideration of initiation of prophylactic broad‐spectrum antibiotics and granulocyte colony‐stimulating factor (such as filgrastim) until the granulocyte count normalizes.[41, 42] Although few case reports describe successful clozapine rechallenge in patients with a history of agranulocytosis, the data are sparse, and current practice is to permanently discontinue clozapine if ANC falls below 1000/mm3.[21, 41]
ADDITIONAL COMPLICATIONS (METABOLIC, RENAL, URINARY)
Moderate to marked weight gain occurs in over 50% of patients treated with clozapine, with average gains of nearly 10% body weight.[43] In a 10‐year follow‐up study of patients treated with clozapine, Henderson et al. reported an average weight gain of 13 kg, with 34% percent of studied patients developing diabetes mellitus. Metabolic side effects of second‐generation antipsychotics, including clozapine, are a well‐documented and troubling phenomenon.[44] Limited evidence supports use of metformin, alongside behavioral therapy, for concerns related to glucose dysregulation.[45] Some patients have also experienced weight loss with adjunctive topiramate use, particularly if they have also suffered seizures.[46]
Urinary incontinence and nocturnal enuresis are both associated with clozapine, but are likely under‐reported because of patient and provider embarrassment; providers also may not think to ask about these specific symptoms. First‐line treatment for nocturnal enuresis is to limit fluids in the evening. Desmopressin has a controversial role in treating nocturnal enuresis owing to its risk of hyponatremia; appropriate monitoring should be implemented if this agent is used.[18]
Clozapine has been associated with acute interstitial nephritis (AIN), although this is thought to be a relatively rare side effect. Drug‐induced AIN typically appears soon after initiation and presents with the clinical triad of rash, fever, and eosinophilia. Given that weekly CBC is mandatory in the initiation phase, eosinophilia is easily detectible and may serve as a marker for potential AIN.[47]
Sialorrhea, particularly during sleep, is a bothersome condition affecting up to one‐third of patients who take clozapine.[48] Although clozapine is strongly anticholinergic, its agonist activity at the M4 muscarinic receptor and antagonism of the alpha‐2 adrenergic receptor are postulated as the mechanisms underlying hypersalivation. Sialorrhea is frequently seen early in treatment and does not appear to be dose dependent.[48] Excessive salivation is typically managed with behavioral interventions (eg, utilizing towels or other absorbent materials on top of bedding). If hypersalivation occurs during the day, chewing sugar‐free gum may increase the rate of swallowing and make symptoms less bothersome. If this does not provide adequate relief, practitioners may consider use of atropine 1% solution administered directly to the oral cavity.[49]
DRUG‐DRUG INTERACTIONS
For hospitalists, who must frequently alter existing medications or add new ones, awareness of potential drug‐drug interactions is crucial. Clozapine is metabolized by the cytochrome p450 system, with predominant metabolism through the isoenzymes 1A2, 3A4, and 2D6.[50] Common medications that induce clozapine metabolism (thereby decreasing clozapine levels) include phenytoin, phenobarbital, carbamazepine, oxcarbazepine, and corticosteroids. Conversely, stopping these medications after long‐term therapy will raise clozapine levels. Substances that inhibit clozapine metabolism (thereby increasing clozapine levels) include ciprofloxacin, erythromycin, clarithromycin, fluvoxamine, fluoxetine, paroxetine, protease inhibitors, verapamil, and grapefruit juice. We recommend caution when concurrently administering other agents that increase risk for agranulocytosis, including carbamazepine, trimethoprim‐sulfamethoxazole, sulfasalazine, and tricyclic antidepressants.
Cigarette smoking decreases clozapine blood levels by induction of CYP1A2. Patients require a 10% to 30% reduction to clozapine dose during periods of smoking cessation, including when smoking is stopped during inpatient hospitalization.[51] Nicotine replacement therapy does not induce CYP1A2 and therefore does not have a compensatory effect on clozapine levels. On discharge or resumption of smoking, patients may require an increase of their dose of clozapine to maintain adequate antipsychotic effect.
SUMMARY OF RECOMMENDATIONS
Medical complications are cited as the cause in 20% of clozapine discontinuations; most commonly, these include seizures, severe constipation, somnolence, and neutropenia. Given the high risk of psychiatric morbidity posed by discontinuation, we recommend managing mild‐moderate symptoms and side effects while continuing the drug, when possible (Table 1). We encourage hospitalists to confer with the patient's psychiatrist or the inpatient psychiatry consultation service when making changes to clozapine therapy. Specific recommendations are as follows:
- We advocate withholding clozapine administration pending medical optimization for several conditions, including: small‐bowel obstruction, neuroleptic malignant syndrome, venous thromboembolism, diabetic ketoacidosis, or hyperosmolar coma.
- Clinical scenarios requiring acute discontinuation of clozapine include agranulocytosis and myocarditis. Successful rechallenge with clozapine has been described after both conditions; at the same time, given the high morbidity and mortality of myocarditis and agranulocytosis, re‐initiation of clozapine requires an extensive risk‐benefit discussion with the patient and family, informed consent, and, in the case of agranulocytosis, approval from the national clozapine registry (Table 2).
- Although adjunctive therapy with filgrastim was initially thought to permit a clozapine rechallenge in patients with a history of agranulocytosis, case reports on this strategy have been equivocal, and further research is necessary to determine the most effective strategy for management.
| Clinical Lab/Study | Frequency of Monitoring | |
|---|---|---|
| Cardiac | Electrocardiogram | Baseline, 24 weeks after initiation, every 6 months thereafter |
| Cardiac enzymes (eg, troponin I) echocardiogram | No standard guidelines, unless clinically indicated | |
| Hematologic | Complete blood count with differential | Baseline, then weekly 26 weeks, then every 2 weeks 26 weeks, then every 4 weeks thereafter |
| Metabolic | Body mass index; circumference of waist | Baseline, then every 3 to 6 months |
| Fasting glucose | Baseline, then every 6 months | |
| Fasting lipid panel | Baseline, then yearly | |
| Neurologic | Electroencephalogram | No standard guidelines, unless clinically indicated |
| Vital signs | Heart rate, blood pressure, temperature | Baseline and at each follow‐up visit |
| Requires Acute Clozapine Discontinuation* | Clozapine Interruption During Management | Does Not Typically Require Clozapine Discontinuation |
|---|---|---|
| ||
| Agranulocytosis (ANC<1.0 109/mm3) | Diabetic complications (eg, ketoacidosis, hyperosmolar coma) | Constipation |
| Cardiomyopathy (severe) | Gastrointestinal obstruction, ileus | Diabetes mellitus |
| Myocarditis | Neuroleptic malignant syndrome | Gastroesophageal Reflux |
| Venous thromboembolism | Hyperlipidemia | |
| Hypertension | ||
| Orthostatic hypotension | ||
| Sedation | ||
| Seizures | ||
| Sialorrhea | ||
| Sinus tachycardia | ||
| Urinary changes (eg, enuresis, incontinence) | ||
| Weight gain | ||
CONCLUSION
Clozapine has been a very successful treatment for patients with schizophrenia who have failed other antipsychotic therapies. However, fears of potential side effects and frequent monitoring have limited its use and led to unnecessary discontinuation. To mitigate risk for serious complications, we hope to increase hospitalists' awareness of prevention, monitoring, and treatment of side effects, and to promote comfort with circumstances that warrant continuation or discontinuation of clozapine (Table 3). The hospitalist plays a crucial role in managing these complications as well as conveying information and recommendations to primary care providers; as such, their familiarity with the medication is essential for proper management of individuals who take clozapine.
| Take‐Home Points |
|---|
| 1. Clozapine is the gold standard for treatment‐resistant schizophrenia; however, its use is limited by side effects, many of which can be successfully treated by internists. |
| 2. There are few indications for discontinuing clozapine (myocarditis, small‐bowel obstruction, agranulocytosis). The psychiatry service should be consulted in the event that clozapine is discontinued. |
| 3. Seizures are not an indication for discontinuing clozapine; instead, we recommend adding an antiepileptic drug. |
| 4. All second‐generation antipsychotics are associated with diabetes mellitus and significant weight gain. Clozapine is more highly associated with metabolic side effects than many other medications in this class. |
| 5. Sedation, sialorrhea, and constipation are common and can be managed pharmacologically and with behavioral interventions. |
Disclosure: Nothing to report.
- , , , . Clozapine versus typical neuroleptic medication for schizophrenia. Cochrane Database Syst Rev. 2009(1):CD000059.
- , , , et al. Effectiveness of clozapine versus olanzapine, quetiapine, and risperidone in patients with chronic schizophrenia who did not respond to prior atypical antipsychotic treatment. Am J Psychiatry. 2006;163(4):600–610.
- , , , et al. Randomized controlled trial of effect of prescription of clozapine versus other second‐generation antipsychotic drugs in resistant schizophrenia. Schizophr Bull. 2006;32(4):715–723.
- , , , et al. Effects of clozapine on positive and negative symptoms in outpatients with schizophrenia. Am J Psychiatry. 1994;151(1):20–26.
- , , , . Clozapine for the treatment‐resistant schizophrenic. A double‐blind comparison with chlorpromazine. Arch Gen Psychiatry. 1988;45(9):789–796.
- , , , , , . Clozapine treatment for suicidality in schizophrenia: International Suicide Prevention Trial (InterSePT). Arch Gen Psychiatry. 2003;60(1):82–91.
- , , , et al. 11‐year follow‐up of mortality in patients with schizophrenia: a population‐based cohort study (FIN11 study). Lancet. 2009;374(9690):620–627.
- , , , , . Clozapine use and relapses of substance use disorder among patients with co‐occurring schizophrenia and substance use disorders. Schizophr Bull. 2006;32(4):637–643.
- , , . Outcomes for schizophrenia patients with clozapine treatment: how good does it get? J Psychopharmacol. 2009;23(8):957–965.
- , , , . Morbidity and mortality in people with serious mental illness. National Association of State Mental Health Program Directors (NASMHPD) Medical Directors Council. Available at: http://www.nasmhpd.org/docs/publications/MDCdocs/Mortality%20and%20Morbidity%20Final%20Report%208.18.08.pdf. Accessed February 3, 2015.
- , . Pharmacological actions of the atypical antipsychotic drug clozapine: a review. Synapse. 1996;24(4):349–394.
- , . Clozapine. A novel antipsychotic agent. N Engl J Med. 1991;324(11):746–754.
- , . Reason for clozapine cessation. Acta Psychiatr Scand. 2012;125(1):39–44.
- , , , . Termination of clozapine treatment due to medical reasons: when is it warranted and how can it be avoided? J Clin Psychiatry. 2013;74(6):603–613.
- , , , , , . Time to discontinuation of antipsychotic drugs in a schizophrenia cohort: influence of current treatment strategies. Ther Adv Psychopharmacol. 2014;4(6):228–239.
- , , . Clozapine‐related seizures. Neurology. 1991;41(3):369–371.
- , , , . Clozapine‐related EEG changes and seizures: dose and plasma‐level relationships. Ther Adv Psychopharmacol. 2011;1(2):47–66.
- . Review and management of clozapine side effects. J Clin Psychiatry. 2000;61(suppl 8):14–17; discussion 18–19.
- , . Epilepsy, psychosis and clozapine. Human Psychopharmacol Clin Exp. 2002;17:115–119.
- , , , , , . Response of patients with treatment‐refractory schizophrenia to clozapine within three serum level ranges. Am J Psychiatry. 1996;153(12):1579–1584.
- , , , , . When can patients with potentially life‐threatening adverse effects be rechallenged with clozapine? A systematic review of the published literature. Schizophr Res. 2012;134(2–3):180–186.
- , . Clinical profile of clozapine: adverse reactions and agranulocytosis. Psychiatr Q. 1992;63(1):51–70.
- , , , , , . Clozapine and hypertension: a chart review of 82 patients. J Clin Psychiatry. 2004;65(5):686–689.
- , , . Adverse cardiac effects associated with clozapine. J Clin Psychopharmacol. 2005;25(1):32–41.
- , , , , . Clozapine induced myocarditis: a rare but fatal complication. Int J Cardiol. 2006;112(2):e5–e6.
- , , , . Myocarditis and cardiomyopathy associated with clozapine. Lancet. 1999;354(9193):1841–1845.
- , , , . Life‐threatening clozapine‐induced gastrointestinal hypomotility: an analysis of 102 cases. J Clin Psychiatry. 2008;69(5):759–768.
- , , , . Fatalities associated with clozapine‐related constipation and bowel obstruction: a literature review and two case reports. Psychosomatics. 2009;50(4):416–419.
- , , . Death from clozapine‐induced constipation: case report and literature review. Psychosomatics. 2002;43(1):71–73.
- , , , , , . Clozapine: a clinical review of adverse effects and management. Ann Clin Psychiatry. 2003;15(1):33–48.
- , , , , . Beyond white blood cell monitoring: screening in the initial phase of clozapine therapy. J Clin Psychiatry. 2012;73(10):1307–1312.
- Clozapine [package insert]. Sellersville, PA: TEVA Pharmaceuticals USA; 2013. Available at: https://www.clozapineregistry.com/insert.pdf.ashx. Accessed October 27, 2014.
- , , , , . Clozapine‐induced agranulocytosis. Incidence and risk factors in the United States. N Engl J Med. 1993;329(3):162–167.
- Clozaril (clozapine) prescribing information. Washington, DC: U.S. Food and Drug Administration; 2013. Available at: http://www.accessdata.fda.gov/drugsatfda_docs/label/2013/019758s069s071lbl.pdf. Accessed February 4, 2015.
- . Clozapine therapy during cancer treatment. Am J Psychiatry. 2004;161(1):175.
- , , , , . Continuation of clozapine during chemotherapy: a case report and review of literature. Psychosomatics. 2014;55(6):673–679.
- , , . Clozapine use in HIV‐infected schizophrenia patients: a case‐based discussion and review. Psychosomatics. 2009;50(6):626–632.
- , , , . Letter: clozapine and agranulocytosis. Lancet. 1975;2(7935):611.
- . Effects of the clozapine national registry system on incidence of deaths related to agranulocytosis. Psychiatr Serv. 1996;47(1):52–56.
- , . White blood cell monitoring during long‐term clozapine treatment. Am J Psychiatry. 2013;170(4):366–369.
- , , . Add‐on filgrastim during clozapine rechallenge in patients with a history of clozapine‐related granulocytopenia/agranulocytosis. Am J Psychiatry. 2009;166(2):236.
- , , . Add‐on filgrastim during clozapine rechallenge unsuccessful in preventing agranulocytosis. Gen Hosp Psychiatry. 2013;35(5):576.e11–12.
- , , , , , . Clozapine‐induced weight gain: prevalence and clinical relevance. Am J Psychiatry. 1992;149(1):68–72.
- , , , et al. Clozapine, diabetes mellitus, hyperlipidemia, and cardiovascular risks and mortality: results of a 10‐year naturalistic study. J Clin Psychiatry. 2005;66(9):1116–1121.
- , , , et al. Effects of adjunctive metformin on metabolic traits in nondiabetic clozapine‐treated patients with schizophrenia and the effect of metformin discontinuation on body weight: a 24‐week, randomized, double‐blind, placebo‐controlled study. J Clin Psychiatry. 2013;74(5):e424–e430.
- , , , . Topiramate for clozapine‐induced seizures. Am J Psychiatry. 2001;158(6):968–969.
- , , , , . Clozapine‐induced acute interstitial nephritis. Lancet. 1999;354(9185):1180–1181.
- , , , , . Update on the clinical efficacy and side effects of clozapine. Schizophr Bull. 1991;17(2):247–261.
- , , . Clozapine‐induced sialorrhea: pathophysiology and management strategies. Psychopharmacology. 2006;185(3):265–273.
- , , . Clozapine drug‐drug interactions: a review of the literature. Hum Psychopharm Clin. 1997;12(1):5–20.
- , , . The effect of smoking and cytochrome P450 CYP1A2 genetic polymorphism on clozapine clearance and dose requirement. Pharmacogenetics. 2003;13(3):169–172.
Clozapine is a second‐generation antipsychotic (SGA) medication that was developed in 1959, introduced to Europe in 1971, and withdrawn from the market in 1975 due to associated concerns for potentially fatal agranulocytosis. In 1989, the US Food and Drug Administration (FDA) approved use of clozapine for the management of treatment‐resistant schizophrenia, under strict parameters for complete blood count (CBC) monitoring. Clozapine has since gained an additional FDA indication for reducing suicidal behavior in patients with schizophrenia and schizoaffective disorder,[1, 2, 3] and displayed superiority to both first generation antipsychotics and other SGA agents in reducing symptom burden.[2, 4, 5]
Clozapine's clinical benefits include lowering mortality in schizophrenia,[6] reducing deaths from ischemic heart disease,[7] curtailing substance use in individuals with psychotic disorders,[8] increasing rates of independent living and meaningful occupational activity, and reducing psychiatric hospitalizations and need for involuntary treatment.[9] Because schizophrenia, itself, is associated with a 15‐ to 20‐year decrease in average lifespan,[10] these benefits of clozapine are particularly salient. Yet the mechanism by which clozapine mitigates otherwise‐refractory psychotic symptoms is a conundrum. Structurally a tricyclic dibenzodiazepine, clozapine has relatively little effect on the dopamine D2 receptor, which has classically been thought to mediate the treatment effect of antipsychotics.[11, 12]
The unique nature of clozapine extends to its adverse effect profile. A significant percentage of patients who discontinue clozapine (17%35.4%) cite medical complications, the most common being seizures, constipation, sedation, and neutropenia.[13, 14] Yet several studies, including the landmark Clinical Antipsychotic Trials for Interventions Effectiveness (CATIE) study, have found that patients were more likely to adhere to clozapine therapy than to other antipsychotics.[2, 15] In the CATIE study, 44% of subjects taking clozapine continued the medication for 18 months, compared to 29% of individuals on olanzapine, 14% on risperidone, and 7% on quetiapine. Median time until discontinuation of clozapine was 10.5 months, significantly longer than for quetiapine (2.8 months) and olanzapine (2.7 months).[2] Because patients who experience clozapine‐related medical complications are likely to present first to the primary care or general hospital setting, internists must be aware of potential iatrogenic effects, and of their implications for psychiatric and medical care. Using case examples, we will examine both common and serious complications associated with clozapine, and discuss recommendations for management, including indications for clozapine discontinuation.
NEUROLOGICAL
Case Vignette 1
Mr. A is a 29‐year‐old man with asthma and schizophrenia who experienced a generalized tonic‐clonic seizure during treatment at a psychiatric facility. The patient started clozapine therapy 5 weeks prior, with gradual titration to 425 mg daily. Mr. A's previous medication trials included olanzapine and chlorpromazine, which rendered little improvement to his chronic auditory hallucinations. Clozapine was temporarily withheld during further neurologic workup, in which both electroencephalogram (EEG) and brain magnetic resonance imaging were unremarkable. After 60 hours, clozapine titration was reinitiated, and valproic acid was started for mood stabilization and seizure prophylaxis. Mr. A was discharged 6 weeks later on clozapine, 600 mg at bedtime, and extended‐release divalproate, 2500 mg at bedtime. The patient suffered no further seizure activity throughout hospitalization and for at least 1 year postdischarge.
Seizures complicate clozapine use in up to 5% of cases, with a dose‐dependent risk pattern.[16] Seizures are most commonly associated with serum clozapine levels above 500 g/L), but have also been reported with lower levels of clozapine and its metabolite norclozapine.[17] Though nonspecific EEG changes (ie, focal or generalized spikes, spike‐wave and polyspike discharges) have been associated with clozapine administration, they do not reliably predict seizure tendency.[17] Prophylaxis with antiepileptic drugs (AEDs) is not recommended, though AED treatment may be undertaken for patients who experience a seizure while on clozapine. When seizures occur in the context of elevated serum levels, reducing clozapine to the lowest effective dose is preferred over initiating an AED. Although this reduces the potential for exposure to anticonvulsant‐associated adverse effects, it may also introduce the risk of relapsed psychotic symptoms, and therefore requires close monitoring by a psychiatrist. For those who opt to initiate AED therapy, we recommend consideration of each medication's therapeutic and side‐effect profiles based on the patient's medical history and active symptoms. For example, in the case of Mr. A, valproate was used to target concomitant mood symptoms; likewise, patients who experience troublesome weight gain, as well as seizures, may benefit from topiramate. The occurrence of seizures does not preclude continuation of clozapine therapy, in conjunction with an AED[18] and after consideration of potential risks and benefits of use. Clozapine is not contraindicated in patients with well‐controlled epilepsy.[19]
Sedation, the most common neurologic side effect of clozapine, is also dose dependent and often abates during titration.[20] Though clozapine may induce extrapyramidal symptoms, including rigidity, tremor, and dystonia, the risk is considerably lower with clozapine than other antipsychotics, owing to a lesser affinity for D2 receptors. Associated parkinsonism should prompt consideration of dose reduction, in discussion with a psychiatrist, with concurrent monitoring of serum clozapine levels and close follow‐up for emergence of psychotic symptoms. If dose reduction is ineffective, not indicated, or not preferred by the patient, the addition of an anticholinergic medication may be considered (eg, diphenhydramine 2550 mg, benztropine 12 mg). Neuroleptic malignant syndrome, although rare, is life‐threatening and warrants immediate discontinuation of clozapine, though successful rechallenge after has been reported in case reports.[21]
CARDIAC
Case Vignette 2
Mr. B is a 34‐year‐old man with sinus tachycardia, a benign adrenal tumor, and chronic paranoid schizophrenia that had been poorly responsive to numerous antipsychotic trials. During a psychiatric hospitalization for paranoid delusions with aggressive threats toward family, Mr. B was started on clozapine and titrated to 250 mg daily. On day 16 of clozapine therapy, the patient began to experience cough, and several days later, diffuse rhonchi were noted on examination. Complete blood count revealed WBC 20.3 * 103/L, with 37% eosinophils and absolute eosinophil count of 7.51 (increased from 12%/1.90 the week before), and an electrocardiogram showed sinus tachycardia with ST‐segment changes. Mr. B was transferred to the general medical hospital for workup of presumed myocarditis.
Approximately one‐quarter of patients who take clozapine experience sinus tachycardia, which may be related to clozapine's anticholinergic effects causing rebound noradrenergic elevations[22]; persistent or problematic tachycardia may be treated using a cardio‐selective ‐blocker. Clozapine has also been linked to significant increases in systolic and diastolic blood pressure in 4% of patients (monitoring data); the risk of hypertension increases with the duration of clozapine treatment, and appears to be independent of the patient's weight.[23] Orthostatic hypotension has been reported in 9% of patients on clozapine therapy, though effects can be mitigated with gradual titration, adequate hydration, compression stockings, and patient education. Sinus tachycardia, hypertension, and orthostatic hypotension are not absolute indications to discontinue clozapine; rather, we advocate for treating these side effects while continuing clozapine treatment.[24]
Myocarditis represents the most serious cardiac side effect of clozapine.[25, 26] Although the absolute risk appears to be lower than 0.1%,[24] Kilian et al. calculated a 1000‐to‐2000fold increase in relative risk of myocarditis among patients who take clozapine, compared to the general population.[26] Most cases occur within the first month of treatment, with median time to onset of 15 days. This time course is consistent with an acute immunoglobulin Emediated hypersensitivity (type 1) reaction, and eosinophilic infiltrates have been found on autopsy, consistent with an acute drug reaction.[20]
Because of this early onset, the physician should maintain a particularly high index of suspicion in the first months of treatment, rigorously questioning patients and families about signs and symptoms of cardiac disease. If patients on clozapine present with flu‐like symptoms, fever, myalgia, dizziness, chest pain, dyspnea, tachycardia, palpitations, or other signs or symptoms of heart failure, evaluation for myocarditis should be undertaken.[25] Several centers have utilized cardiac enzymes (e.g., troponin I, troponin T, creatine kinase‐myocardial band) as a universal screen for myocarditis, though this is not a universal practice.[24] Both tachycardia and flu‐like symptoms may be associated with clozapine, particularly during the titration period, and these are normally benign symptoms requiring no intervention. If the diagnosis of myocarditis is made, however, clozapine should be stopped immediately. Myocarditis is often considered to be a contraindication to restarting clozapine, though cases have been reported of successful clozapine rechallenge in patients who had previously experienced myocarditis.[21]
Recommendations for clozapine‐associated electrocardiography (ECG) monitoring have not been standardized. Based on common clinical practice and the time course of serious cardiac complications, we recommend baseline ECG prior to the start of clozapine, with follow‐up ECG 2 to 4 weeks after clozapine initiation, and every 6 months thereafter.
GASTROINTESTINAL
Case Vignette 3
Mr. C is a 61‐year‐old man with chronic paranoid schizophrenia and a history of multiple‐state hospital admissions. He had been maintained on clozapine for 15 years, allowing him to live independently and avoid psychiatric hospitalization. Mr. C was admitted to the general medical hospital with nausea, vomiting, and an inability to tolerate oral intake. He was found to have a high‐grade small‐bowel obstruction, and all oral medications were initially discontinued. After successful management of his acute gastrointestinal presentation and discussion of potential risks and benefits of various treatment options, clozapine was reinitiated along with bulk laxative and stool softening agents.
Affecting 14% to 60% of individuals who are prescribed clozapine, constipation represents the most common associated gastrointestinal complaint.[27] For most patients, this condition is uncomfortable but nonlethal, though it has been implicated in several deaths by aspiration pneumonia and small‐bowel perforation.[28, 29] Providers must screen regularly for constipation and treat aggressively with stimulant laxatives and stool softeners,[18] while reviewing medication lists and, when possible, streamlining extraneous anticholinergic contributors. Clozapine‐prescribed individuals also frequently suffer from gastrointestinal reflux disease (GERD), for which behavioral interventions (eg, smoking cessation or remaining upright for 3 hours after meals) should be considered in addition to pharmacologic treatment with proton pump inhibitors. Clozapine therapy may be continued while constipation and GERD are managed medically.
Potentially fatal gastrointestinal hypomotility and small‐bowel obstruction are rare but well‐described complications that occur in up to 0.3% of patients who take clozapine.[27] This effect appears to be dose dependent, and higher blood levels are associated with greater severity of constipation and risk for serious hypomotility.[27] Clozapine should be withheld during treatment for such serious adverse events as ileus or small‐bowel perforation; however, once these conditions have stabilized, clozapine therapy may be reconsidered based on an analysis of potential benefits and risks. If clozapine is withheld, the internist must monitor for acute worsening of mental status, inattention, and disorientation, as clozapine withdrawal‐related delirium has been reported.[30] Ultimately, aggressive treatment of constipation in conjunction with continued clozapine therapy is the recommended course of action.[28]
Given the increased risk of ileus in the postoperative period, it is particularly important for physicians to inquire about preoperative bowel habits and assess for any existing constipation. Careful monitoring of postoperative bowel motility, along with early and aggressive management of constipation, is recommended. Concurrent administration of other constipating agents (eg, opiates, anticholinergics) should be limited to the lowest effective dose.[27] Although transaminitis, hepatitis, and pancreatitis have all been associated with clozapine in case reports, these are rare,[31] and the approach to management should be considered on a case‐by‐case basis.
HEMATOLOGIC
Case Vignette 4
Ms. D is a 38‐year‐old woman with a schizoaffective disorder who was started on clozapine after 3 other agents had failed to control her psychotic symptoms and alleviate chronic suicidal thoughts. Baseline CBC revealed serum white blood cell count (WBC) of 7800/mm3 and absolute neutrophil count (ANC) of 4700/mm3. In Ms. D's third week of clozapine use, WBC dropped to 4400/mm3 and ANC to 2200/mm3. Repeat lab draw confirmed this, prompting the treatment team to initiate twice‐weekly CBC monitoring. Ms. D's counts continued to fall, and 10 days after the initial drop, WBC was calculated at 1400/mm3 and ANC at 790/mm3. Clozapine was discontinued, and though the patient was asymptomatic, broad‐spectrum antibiotics were initiated. She received daily CBC monitoring until WBC >3000/mm3 and ANC >1500/mm3. An alternate psychotropic medication was initiated several weeks thereafter.
Neutropenia (white blood cell count <3000/mm3) is a common complication that affects approximately 3% of patients who take clozapine.[32] This may be mediated by clozapine's selective impact on the precursors of polymorphonuclear leukocytes, though the mechanism remains unknown.[33] Although neutropenia is not an absolute contraindication for clozapine therapy, guidelines recommend cessation of clozapine when the ANC drops below 1000/mm3.[34] A meta‐analysis of 112 patients who were rechallenged following neutropenia found that 69% tolerated a rechallenge without development of a subsequent dyscrasia.[21]
In the case of chemotherapy‐induced neutropenia, several case reports support the continued use of clozapine during cancer treatment[35]; this requires a written request to the pharmaceutical company that manufactures clozapine and documentation of the expected time course and contribution of chemotherapy to neutropenia.[36] Clozapine's association with neutropenia warrants close monitoring in individuals with human immunodeficiency virus (HIV) and other causes of immune compromise. Reports of clozapine continuation in HIV‐positive individuals underscore the importance of close collaboration between infectious disease and psychiatry, with specific focus on potential interactions between clozapine and antiretroviral agents and close monitoring of viral load and ANC.[37]
The most feared complication of clozapine remains agranulocytosis, defined as ANC<500/mm3,[33] which occurs in up to 1% of monitored patients. In 1975, clozapine was banned worldwide after 8 fatal cases of agranulocytosis were reported in Finland.[38] The drug was reintroduced for treatment‐resistant schizophrenia with strict monitoring parameters, which has sharply reduced the death rate. One study found 12 actual deaths between 1990 and 1994, compared to the 149 predicted deaths without monitoring.[39]
The risk of agranulocytosis appears to be higher in older adults and in patients with a lower baseline WBC count. Although there are reports of delayed agranulocytosis occurring in patients after up to 19 years of treatment,[40] the incidence of leukopenia is greatest in the first year. Given this high‐risk period, mandatory monitoring is as follows: weekly WBC and neutrophil counts for the first 26 weeks, biweekly counts for the second 26 weeks, and every 4 weeks thereafter. Of note, many of the later cases of agranulocytosis appear to be related to medication coadministration, particularly with valproic acid, though no definitive link has been established.[40]
Treatment of clozapine‐induced agranulocytosis consists of immediate clozapine cessation, and consideration of initiation of prophylactic broad‐spectrum antibiotics and granulocyte colony‐stimulating factor (such as filgrastim) until the granulocyte count normalizes.[41, 42] Although few case reports describe successful clozapine rechallenge in patients with a history of agranulocytosis, the data are sparse, and current practice is to permanently discontinue clozapine if ANC falls below 1000/mm3.[21, 41]
ADDITIONAL COMPLICATIONS (METABOLIC, RENAL, URINARY)
Moderate to marked weight gain occurs in over 50% of patients treated with clozapine, with average gains of nearly 10% body weight.[43] In a 10‐year follow‐up study of patients treated with clozapine, Henderson et al. reported an average weight gain of 13 kg, with 34% percent of studied patients developing diabetes mellitus. Metabolic side effects of second‐generation antipsychotics, including clozapine, are a well‐documented and troubling phenomenon.[44] Limited evidence supports use of metformin, alongside behavioral therapy, for concerns related to glucose dysregulation.[45] Some patients have also experienced weight loss with adjunctive topiramate use, particularly if they have also suffered seizures.[46]
Urinary incontinence and nocturnal enuresis are both associated with clozapine, but are likely under‐reported because of patient and provider embarrassment; providers also may not think to ask about these specific symptoms. First‐line treatment for nocturnal enuresis is to limit fluids in the evening. Desmopressin has a controversial role in treating nocturnal enuresis owing to its risk of hyponatremia; appropriate monitoring should be implemented if this agent is used.[18]
Clozapine has been associated with acute interstitial nephritis (AIN), although this is thought to be a relatively rare side effect. Drug‐induced AIN typically appears soon after initiation and presents with the clinical triad of rash, fever, and eosinophilia. Given that weekly CBC is mandatory in the initiation phase, eosinophilia is easily detectible and may serve as a marker for potential AIN.[47]
Sialorrhea, particularly during sleep, is a bothersome condition affecting up to one‐third of patients who take clozapine.[48] Although clozapine is strongly anticholinergic, its agonist activity at the M4 muscarinic receptor and antagonism of the alpha‐2 adrenergic receptor are postulated as the mechanisms underlying hypersalivation. Sialorrhea is frequently seen early in treatment and does not appear to be dose dependent.[48] Excessive salivation is typically managed with behavioral interventions (eg, utilizing towels or other absorbent materials on top of bedding). If hypersalivation occurs during the day, chewing sugar‐free gum may increase the rate of swallowing and make symptoms less bothersome. If this does not provide adequate relief, practitioners may consider use of atropine 1% solution administered directly to the oral cavity.[49]
DRUG‐DRUG INTERACTIONS
For hospitalists, who must frequently alter existing medications or add new ones, awareness of potential drug‐drug interactions is crucial. Clozapine is metabolized by the cytochrome p450 system, with predominant metabolism through the isoenzymes 1A2, 3A4, and 2D6.[50] Common medications that induce clozapine metabolism (thereby decreasing clozapine levels) include phenytoin, phenobarbital, carbamazepine, oxcarbazepine, and corticosteroids. Conversely, stopping these medications after long‐term therapy will raise clozapine levels. Substances that inhibit clozapine metabolism (thereby increasing clozapine levels) include ciprofloxacin, erythromycin, clarithromycin, fluvoxamine, fluoxetine, paroxetine, protease inhibitors, verapamil, and grapefruit juice. We recommend caution when concurrently administering other agents that increase risk for agranulocytosis, including carbamazepine, trimethoprim‐sulfamethoxazole, sulfasalazine, and tricyclic antidepressants.
Cigarette smoking decreases clozapine blood levels by induction of CYP1A2. Patients require a 10% to 30% reduction to clozapine dose during periods of smoking cessation, including when smoking is stopped during inpatient hospitalization.[51] Nicotine replacement therapy does not induce CYP1A2 and therefore does not have a compensatory effect on clozapine levels. On discharge or resumption of smoking, patients may require an increase of their dose of clozapine to maintain adequate antipsychotic effect.
SUMMARY OF RECOMMENDATIONS
Medical complications are cited as the cause in 20% of clozapine discontinuations; most commonly, these include seizures, severe constipation, somnolence, and neutropenia. Given the high risk of psychiatric morbidity posed by discontinuation, we recommend managing mild‐moderate symptoms and side effects while continuing the drug, when possible (Table 1). We encourage hospitalists to confer with the patient's psychiatrist or the inpatient psychiatry consultation service when making changes to clozapine therapy. Specific recommendations are as follows:
- We advocate withholding clozapine administration pending medical optimization for several conditions, including: small‐bowel obstruction, neuroleptic malignant syndrome, venous thromboembolism, diabetic ketoacidosis, or hyperosmolar coma.
- Clinical scenarios requiring acute discontinuation of clozapine include agranulocytosis and myocarditis. Successful rechallenge with clozapine has been described after both conditions; at the same time, given the high morbidity and mortality of myocarditis and agranulocytosis, re‐initiation of clozapine requires an extensive risk‐benefit discussion with the patient and family, informed consent, and, in the case of agranulocytosis, approval from the national clozapine registry (Table 2).
- Although adjunctive therapy with filgrastim was initially thought to permit a clozapine rechallenge in patients with a history of agranulocytosis, case reports on this strategy have been equivocal, and further research is necessary to determine the most effective strategy for management.
| Clinical Lab/Study | Frequency of Monitoring | |
|---|---|---|
| Cardiac | Electrocardiogram | Baseline, 24 weeks after initiation, every 6 months thereafter |
| Cardiac enzymes (eg, troponin I) echocardiogram | No standard guidelines, unless clinically indicated | |
| Hematologic | Complete blood count with differential | Baseline, then weekly 26 weeks, then every 2 weeks 26 weeks, then every 4 weeks thereafter |
| Metabolic | Body mass index; circumference of waist | Baseline, then every 3 to 6 months |
| Fasting glucose | Baseline, then every 6 months | |
| Fasting lipid panel | Baseline, then yearly | |
| Neurologic | Electroencephalogram | No standard guidelines, unless clinically indicated |
| Vital signs | Heart rate, blood pressure, temperature | Baseline and at each follow‐up visit |
| Requires Acute Clozapine Discontinuation* | Clozapine Interruption During Management | Does Not Typically Require Clozapine Discontinuation |
|---|---|---|
| ||
| Agranulocytosis (ANC<1.0 109/mm3) | Diabetic complications (eg, ketoacidosis, hyperosmolar coma) | Constipation |
| Cardiomyopathy (severe) | Gastrointestinal obstruction, ileus | Diabetes mellitus |
| Myocarditis | Neuroleptic malignant syndrome | Gastroesophageal Reflux |
| Venous thromboembolism | Hyperlipidemia | |
| Hypertension | ||
| Orthostatic hypotension | ||
| Sedation | ||
| Seizures | ||
| Sialorrhea | ||
| Sinus tachycardia | ||
| Urinary changes (eg, enuresis, incontinence) | ||
| Weight gain | ||
CONCLUSION
Clozapine has been a very successful treatment for patients with schizophrenia who have failed other antipsychotic therapies. However, fears of potential side effects and frequent monitoring have limited its use and led to unnecessary discontinuation. To mitigate risk for serious complications, we hope to increase hospitalists' awareness of prevention, monitoring, and treatment of side effects, and to promote comfort with circumstances that warrant continuation or discontinuation of clozapine (Table 3). The hospitalist plays a crucial role in managing these complications as well as conveying information and recommendations to primary care providers; as such, their familiarity with the medication is essential for proper management of individuals who take clozapine.
| Take‐Home Points |
|---|
| 1. Clozapine is the gold standard for treatment‐resistant schizophrenia; however, its use is limited by side effects, many of which can be successfully treated by internists. |
| 2. There are few indications for discontinuing clozapine (myocarditis, small‐bowel obstruction, agranulocytosis). The psychiatry service should be consulted in the event that clozapine is discontinued. |
| 3. Seizures are not an indication for discontinuing clozapine; instead, we recommend adding an antiepileptic drug. |
| 4. All second‐generation antipsychotics are associated with diabetes mellitus and significant weight gain. Clozapine is more highly associated with metabolic side effects than many other medications in this class. |
| 5. Sedation, sialorrhea, and constipation are common and can be managed pharmacologically and with behavioral interventions. |
Disclosure: Nothing to report.
- , , , . Clozapine versus typical neuroleptic medication for schizophrenia. Cochrane Database Syst Rev. 2009(1):CD000059.
- , , , et al. Effectiveness of clozapine versus olanzapine, quetiapine, and risperidone in patients with chronic schizophrenia who did not respond to prior atypical antipsychotic treatment. Am J Psychiatry. 2006;163(4):600–610.
- , , , et al. Randomized controlled trial of effect of prescription of clozapine versus other second‐generation antipsychotic drugs in resistant schizophrenia. Schizophr Bull. 2006;32(4):715–723.
- , , , et al. Effects of clozapine on positive and negative symptoms in outpatients with schizophrenia. Am J Psychiatry. 1994;151(1):20–26.
- , , , . Clozapine for the treatment‐resistant schizophrenic. A double‐blind comparison with chlorpromazine. Arch Gen Psychiatry. 1988;45(9):789–796.
- , , , , , . Clozapine treatment for suicidality in schizophrenia: International Suicide Prevention Trial (InterSePT). Arch Gen Psychiatry. 2003;60(1):82–91.
- , , , et al. 11‐year follow‐up of mortality in patients with schizophrenia: a population‐based cohort study (FIN11 study). Lancet. 2009;374(9690):620–627.
- , , , , . Clozapine use and relapses of substance use disorder among patients with co‐occurring schizophrenia and substance use disorders. Schizophr Bull. 2006;32(4):637–643.
- , , . Outcomes for schizophrenia patients with clozapine treatment: how good does it get? J Psychopharmacol. 2009;23(8):957–965.
- , , , . Morbidity and mortality in people with serious mental illness. National Association of State Mental Health Program Directors (NASMHPD) Medical Directors Council. Available at: http://www.nasmhpd.org/docs/publications/MDCdocs/Mortality%20and%20Morbidity%20Final%20Report%208.18.08.pdf. Accessed February 3, 2015.
- , . Pharmacological actions of the atypical antipsychotic drug clozapine: a review. Synapse. 1996;24(4):349–394.
- , . Clozapine. A novel antipsychotic agent. N Engl J Med. 1991;324(11):746–754.
- , . Reason for clozapine cessation. Acta Psychiatr Scand. 2012;125(1):39–44.
- , , , . Termination of clozapine treatment due to medical reasons: when is it warranted and how can it be avoided? J Clin Psychiatry. 2013;74(6):603–613.
- , , , , , . Time to discontinuation of antipsychotic drugs in a schizophrenia cohort: influence of current treatment strategies. Ther Adv Psychopharmacol. 2014;4(6):228–239.
- , , . Clozapine‐related seizures. Neurology. 1991;41(3):369–371.
- , , , . Clozapine‐related EEG changes and seizures: dose and plasma‐level relationships. Ther Adv Psychopharmacol. 2011;1(2):47–66.
- . Review and management of clozapine side effects. J Clin Psychiatry. 2000;61(suppl 8):14–17; discussion 18–19.
- , . Epilepsy, psychosis and clozapine. Human Psychopharmacol Clin Exp. 2002;17:115–119.
- , , , , , . Response of patients with treatment‐refractory schizophrenia to clozapine within three serum level ranges. Am J Psychiatry. 1996;153(12):1579–1584.
- , , , , . When can patients with potentially life‐threatening adverse effects be rechallenged with clozapine? A systematic review of the published literature. Schizophr Res. 2012;134(2–3):180–186.
- , . Clinical profile of clozapine: adverse reactions and agranulocytosis. Psychiatr Q. 1992;63(1):51–70.
- , , , , , . Clozapine and hypertension: a chart review of 82 patients. J Clin Psychiatry. 2004;65(5):686–689.
- , , . Adverse cardiac effects associated with clozapine. J Clin Psychopharmacol. 2005;25(1):32–41.
- , , , , . Clozapine induced myocarditis: a rare but fatal complication. Int J Cardiol. 2006;112(2):e5–e6.
- , , , . Myocarditis and cardiomyopathy associated with clozapine. Lancet. 1999;354(9193):1841–1845.
- , , , . Life‐threatening clozapine‐induced gastrointestinal hypomotility: an analysis of 102 cases. J Clin Psychiatry. 2008;69(5):759–768.
- , , , . Fatalities associated with clozapine‐related constipation and bowel obstruction: a literature review and two case reports. Psychosomatics. 2009;50(4):416–419.
- , , . Death from clozapine‐induced constipation: case report and literature review. Psychosomatics. 2002;43(1):71–73.
- , , , , , . Clozapine: a clinical review of adverse effects and management. Ann Clin Psychiatry. 2003;15(1):33–48.
- , , , , . Beyond white blood cell monitoring: screening in the initial phase of clozapine therapy. J Clin Psychiatry. 2012;73(10):1307–1312.
- Clozapine [package insert]. Sellersville, PA: TEVA Pharmaceuticals USA; 2013. Available at: https://www.clozapineregistry.com/insert.pdf.ashx. Accessed October 27, 2014.
- , , , , . Clozapine‐induced agranulocytosis. Incidence and risk factors in the United States. N Engl J Med. 1993;329(3):162–167.
- Clozaril (clozapine) prescribing information. Washington, DC: U.S. Food and Drug Administration; 2013. Available at: http://www.accessdata.fda.gov/drugsatfda_docs/label/2013/019758s069s071lbl.pdf. Accessed February 4, 2015.
- . Clozapine therapy during cancer treatment. Am J Psychiatry. 2004;161(1):175.
- , , , , . Continuation of clozapine during chemotherapy: a case report and review of literature. Psychosomatics. 2014;55(6):673–679.
- , , . Clozapine use in HIV‐infected schizophrenia patients: a case‐based discussion and review. Psychosomatics. 2009;50(6):626–632.
- , , , . Letter: clozapine and agranulocytosis. Lancet. 1975;2(7935):611.
- . Effects of the clozapine national registry system on incidence of deaths related to agranulocytosis. Psychiatr Serv. 1996;47(1):52–56.
- , . White blood cell monitoring during long‐term clozapine treatment. Am J Psychiatry. 2013;170(4):366–369.
- , , . Add‐on filgrastim during clozapine rechallenge in patients with a history of clozapine‐related granulocytopenia/agranulocytosis. Am J Psychiatry. 2009;166(2):236.
- , , . Add‐on filgrastim during clozapine rechallenge unsuccessful in preventing agranulocytosis. Gen Hosp Psychiatry. 2013;35(5):576.e11–12.
- , , , , , . Clozapine‐induced weight gain: prevalence and clinical relevance. Am J Psychiatry. 1992;149(1):68–72.
- , , , et al. Clozapine, diabetes mellitus, hyperlipidemia, and cardiovascular risks and mortality: results of a 10‐year naturalistic study. J Clin Psychiatry. 2005;66(9):1116–1121.
- , , , et al. Effects of adjunctive metformin on metabolic traits in nondiabetic clozapine‐treated patients with schizophrenia and the effect of metformin discontinuation on body weight: a 24‐week, randomized, double‐blind, placebo‐controlled study. J Clin Psychiatry. 2013;74(5):e424–e430.
- , , , . Topiramate for clozapine‐induced seizures. Am J Psychiatry. 2001;158(6):968–969.
- , , , , . Clozapine‐induced acute interstitial nephritis. Lancet. 1999;354(9185):1180–1181.
- , , , , . Update on the clinical efficacy and side effects of clozapine. Schizophr Bull. 1991;17(2):247–261.
- , , . Clozapine‐induced sialorrhea: pathophysiology and management strategies. Psychopharmacology. 2006;185(3):265–273.
- , , . Clozapine drug‐drug interactions: a review of the literature. Hum Psychopharm Clin. 1997;12(1):5–20.
- , , . The effect of smoking and cytochrome P450 CYP1A2 genetic polymorphism on clozapine clearance and dose requirement. Pharmacogenetics. 2003;13(3):169–172.