User login
The Interplay between Financial Incentives, Institutional Culture, and Physician Behavior: An Incompletely Understood Relationship Worth Elucidating
The United States spends approximately 18% of its gross domestic product on healthcare, nearly double the average expenditure by other high-income countries.1 This increased financial investment does not consistently correlate with better care, as quality outcomes in the US rank well below many developed nations that spend far less on clinical care on a per capita basis.1,2 These troubling and unsustainable spending trends have compelled national and regional policymakers, health system leaders, and researchers to search for ways to curb healthcare spending and improve healthcare value.
Approximately 32% of overall healthcare spending in the US occurs in hospitals,3 and there is broad acknowledgment that inpatient care can be delivered more cost effectively.4 In recent years, numerous policy interventions – including Medicare’s hospital readmission reductions program, hospital-acquired condition reductions program, hospital value-based purchasing program, and the Bundled Payment for Care Improvement program – have been implemented in an effort to improve the quality and costs of inpatient care.4,5
These policies attempt to increase care value by utilizing innovative reimbursement techniques designed to hold clinical systems financially accountable for outcomes and spending. They are designed to move our system away from the traditional fee-for-service paradigm, which encourages overuse and has been identified as a major driver of bloated healthcare costs in the US.6,7 The success of certain national payment reform pilots, such as the Comprehensive Care for Joint Replacement Model, indicate that payment models which hold clinicians and systems accountable hold promise for both reducing costs and improving outcomes.8
However, to influence clinical outcomes and costs, these national payment reforms must prompt local changes in how care is delivered and financed. Understanding systems- and clinician-level factors that enable the delivery of higher value care is, therefore, paramount for effectively translating national policies into local improvements in care value. Among hospitalists and hospital-based clinicians, institutional and clinical cultures represent an important lever for influencing physician practice patterns and, by extension, the quality and costs of care. Hospital and departmental cultures have been shown to influence physician behaviors profoundly in ways that improve quality and value, primarily via top-down initiatives focused on education and improving awareness. Examples of cultural success stories include efforts to reduce unnecessary utilization of diagnostic testing,9 improve adoption of hand-washing techniques on wards,10 and translate education about high-value care into sustained increases in the delivery of high-value clinical services.11
In “The Association of Hospitals Productivity Payments and High-Value Care Culture,” Gupta et al. present the results of a study examining associations between how hospitals compensate their hospitalists – specifically the provision of performance-based incentives – and the strength of a hospital’s high-value care culture.12 The authors administered the High-Value Care Culture SurveyTM (HVCCS), a validated survey instrument designed to assess the degree to which a hospital’s culture promotes the delivery of high-value care, to 255 hospitalists across 12 hospitals, including safety-net, community, and university-based hospitals. The hospitals’ predominant physician compensation models were grouped into three categories: salary model (no performance-based bonus), salary model with a productivity adjustment (ie, a bonus based on clinical volumes), and a salary model with a quality/value adjustment (ie, a bonus for delivering higher value care). The authors found that hospitalists who were salaried but also received productivity adjustments reported significantly lower mean HVCCS scores than salaried hospitalists who did not receive bonuses or adjustments. Compared with salaried hospitalists, hospitalists receiving compensation via salary plus value-based adjustments were nonsignificantly more likely to have higher HVCCS scores.
How are we to interpret these results? While we must be exceedingly careful about presuming causal mechanisms underlying these associations, they are nonetheless intriguing and should prompt further discussion about the relationship between payment incentives, provider behavior, and organizational culture. One potential explanation for these findings is that hospitals that rely on high clinical volumes to drive their financial performance may use productivity bonuses as a way to align hospitalists’ incentives with those of their institution, thereby promoting volume at the expense of value.
Behavioral economics theory provides an alternative lens through which to interpret the work of Gupta et al. The relationship between incentives and nonfinancial sources of personal motivation remain an important consideration in financial incentive design.13 A basic concept in behavioral economics is that there are two fundamental types of motivation of human behavior: extrinsic motivation, where people are motivated to act by the prospect of material rewards or punishments, and intrinsic motivation, a source of motivation that leads people to behave in ways that do not produce an obvious personal or material reward.13 Substantial evidence indicates that external rewards can have counterproductive effects on an individual’s intrinsic motivation, leading to a “crowding-out” effect that decreases the individual’s internal drive. When the “crowding-out” effect occurs, behaviors may be motivated by a desire to follow the rules, rather than true intrinsic drive. This change in the underlying forces motivating behavior can have a negative impact on self-esteem and result in a perceived loss of professional autonomy.13,14 Perhaps more than any other professional group, healthcare professionals are fueled by intrinsic motivation and a yearning for professional autonomy. It is therefore plausible that doctors are particularly sensitive to, and disturbed by, the feeling that external rewards are “crowding out” this internal drive. Thus, the inverse association between productivity payments – volume-based rewards – and HVCCS scores may reflect this tension between intrinsic and extrinsic drives.
Of course, we need to interpret the authors’ findings cautiously in light of the cross-sectional study design and the potential for residual confounding. Indeed, the presence of an association between how hospitalists are compensated and their perceptions of the degree to which their institution’s culture promotes the delivery of high-value care does not prove that these two things are causally linked. Additionally, the small sample size limits the generalizability of these findings and efforts to draw robust conclusions from this work regarding the interplay between how a hospital pays its physicians, hospital culture, and the value of care delivered in this institution. Moreover, a more rigorous characterization of the nature of productivity payments compared with value-based performance payments and pure salaried wages would have been extremely useful to help interpret the likelihood that these payment models influenced the behavior of clinicians and perceptions of culture. In particular, how payment models define “productivity” and “quality” thresholds for achieving performance-based payments and the degree of control that physicians have on achieving them are critical determinants of the power of these incentives to influence clinician behavior and of clinicians’ perceptions of the degree to which their institution cultivates a high-value culture.14
Despite these limitations, this study raises a number of interesting hypotheses regarding the relationship between clinician payment models, incentive design, and clinical culture that warrant further investigation. For example, how do financial incentives designed to improve the value of inpatient care actually influence the practice patterns of hospitalists? Surprisingly little is known about this topic. Does the physician payment model design generally and implementation of targeted financial incentives for delivering higher value care in particular directly influence clinical culture? If so, how? Also, does the cultural effect actually undermine the goals of the financial incentive?
More broadly, systematic efforts to evaluate how clinical and hospital cultures impact the ability of financial incentives to motivate desired changes in clinicians’ behaviors will help healthcare leaders use financial incentives more effectively to motivate the delivery of higher quality, more cost-effective care. Increasing use and evaluation of different alternative payment models across hospitals nationwide represents an opportunity to characterize associations between different payment models and the delivery of high-quality, cost-effective care.15 Parallel efforts to characterize the clinical culture of these hospitals could help to better understand if and how hospital culture mediates this relationship. Moreover, because inpatient care is increasing and, in many hospitals, primarily provided by multidisciplinary teams, additional research is needed to understand how different payment models influence inpatient clinical team performance.
The connection between culture, financial incentives, and value-based care remains difficult to determine, but essential to clarify. Gupta et al. demonstrated that how a clinical system pays its physicians appears to be associated with physicians’ perceptions of how strongly the hospital’s culture emphasizes the delivery of high-value care. Work culture is a profound determinant of employee happiness, satisfaction, and productivity. The consistent delivery of high-value care is undoubtedly harder in clinical cultures that do not prize and support this end. Health system leaders focused on improving care value would be wise to pay close attention to their employees’ perceptions of their culture – and use these perceptions as one of several measures of their progress toward enabling their organization to deliver higher value care consistently.
Disclosures
Dr. Blumenthal is the Associate Chief Medical Officer of Devoted Health. Dr. Bergethon has nothing to disclose.
1. Papanicolas I, Woskie LR, Jha AK. Health care spending in the United States and other high-income countries. JAMA. 2018;319(10):1024-1039. doi: 10.1001/jama.2018.1150. PubMed
2. Fullman N, Yearwood J, Abay SM, et al. Measuring performance on the Healthcare Access and Quality Index for 195 countries and territories and selected subnational locations: a systematic analysis from the Global Burden of Disease Study 2016. Lancet. 2018;391(10136):2236-2271. doi: 10.1016/S0140-6736(18)30994-2. PubMed
3. Hartman M, Martin AB, Espinosa N, Catlin A, National Health Expenditure Accounts Team. National health care spending in 2016: spending and enrollment growth slow after initial coverage expansions. Health Aff. 2017;37(1):150-160. doi: 10.1377/hlthaff.2017.1655. PubMed
4. Nussbaum S, McClellan M, Metlay G. Principles for a framework for alternative payment models. JAMA. 2018;319(7):653-654. doi: 10.1001/jama.2017.20226. PubMed
5. Morden NE, Colla CH, Sequist TD, Rosenthal MB. Choosing wisely- the politics and economics of labeling low-value services. N Engl J Med. 2014;370(7):589-592. doi: 10.1056/NEJMp1314965. PubMed
6. Laugesen MJ, Glied SA. Higher fees paid to US physicians drive higher spending for physician services compared to other countries. Health Aff. 2011;30(9):1647-1656. doi: 10.1377/hlthaff.2010.0204. PubMed
7. Korda H, Eldridge GN. Payment incentives and integrated care delivery: Levers for health system reform and cost containment. Inquiry. 2011;48(4):277-287. doi: 10.5034/inquiryjrnl_48.04.01. PubMed
8. Dummit LA, Kahvecioglu D, Marrufo G, et al. Association between hospital participation in a Medicare bundled payment initiative and payments and quality outcomes for lower extremity joint replacement episodes. JAMA. 2016;316(12):1267-1278. doi: 10.1001/jama.2016.12717. PubMed
9. Korenstein D, Husain S, Gennarelli R, White C, Masciale J, Roman B. Impact of clinical specialty on attitudes regarding overuse of inpatient laboratory testing. J Hosp Med. 2018;E1-E4. doi: 10.12788/jhm.2978. PubMed
10. Jain R, Kralovic SM, Evans ME, et al. Veterans Affairs initiative to prevent methicillin-resistant Staphylococcus aureus infections. N Engl J Med. 2011;364(15):1419-1430. doi: 10.1056/NEJMoa1007474. PubMed
11. Stammen LA, Stalmeijer RE, Paternotte E, et al. Training physicians to provide high-value, cost-conscious care a systematic review. JAMA. 2015;314(22):2384-2400. doi: 10.1001/jama.2015.16353. PubMed
12. Gupta R, Steers N, Moriates C, Ong M. Association between hospitalist productivity payments and high-value care culture [published online ahead of print October 31, 2018]. J Hosp Med. 2018. In press. doi: 10.12788/jhm.3084. PubMed
13. Marshall M, Harrison S. It’s about more than money: financial incentives and internal motivation. Qual Saf Health Care. 2005;14(1):4-5. doi: 10.1136/qshc.2004.013193. PubMed
14. Conrad DA. The theory of value-based payment incentives and their application to health care. Health Serv Res. 2015;50(Suppl 2):2057-2089. doi: 10.1111/1475-6773.12408. PubMed
15. Schwartz AL, Chernew ME, Landon BE, McWilliams JM. Changes in low-value services in year 1 of the medicare pioneer accountable care organization program. JAMA Intern Med. 2015;175(11):1815-1825. doi: 10.1001/jamainternmed.2016.2827. PubMed
The United States spends approximately 18% of its gross domestic product on healthcare, nearly double the average expenditure by other high-income countries.1 This increased financial investment does not consistently correlate with better care, as quality outcomes in the US rank well below many developed nations that spend far less on clinical care on a per capita basis.1,2 These troubling and unsustainable spending trends have compelled national and regional policymakers, health system leaders, and researchers to search for ways to curb healthcare spending and improve healthcare value.
Approximately 32% of overall healthcare spending in the US occurs in hospitals,3 and there is broad acknowledgment that inpatient care can be delivered more cost effectively.4 In recent years, numerous policy interventions – including Medicare’s hospital readmission reductions program, hospital-acquired condition reductions program, hospital value-based purchasing program, and the Bundled Payment for Care Improvement program – have been implemented in an effort to improve the quality and costs of inpatient care.4,5
These policies attempt to increase care value by utilizing innovative reimbursement techniques designed to hold clinical systems financially accountable for outcomes and spending. They are designed to move our system away from the traditional fee-for-service paradigm, which encourages overuse and has been identified as a major driver of bloated healthcare costs in the US.6,7 The success of certain national payment reform pilots, such as the Comprehensive Care for Joint Replacement Model, indicate that payment models which hold clinicians and systems accountable hold promise for both reducing costs and improving outcomes.8
However, to influence clinical outcomes and costs, these national payment reforms must prompt local changes in how care is delivered and financed. Understanding systems- and clinician-level factors that enable the delivery of higher value care is, therefore, paramount for effectively translating national policies into local improvements in care value. Among hospitalists and hospital-based clinicians, institutional and clinical cultures represent an important lever for influencing physician practice patterns and, by extension, the quality and costs of care. Hospital and departmental cultures have been shown to influence physician behaviors profoundly in ways that improve quality and value, primarily via top-down initiatives focused on education and improving awareness. Examples of cultural success stories include efforts to reduce unnecessary utilization of diagnostic testing,9 improve adoption of hand-washing techniques on wards,10 and translate education about high-value care into sustained increases in the delivery of high-value clinical services.11
In “The Association of Hospitals Productivity Payments and High-Value Care Culture,” Gupta et al. present the results of a study examining associations between how hospitals compensate their hospitalists – specifically the provision of performance-based incentives – and the strength of a hospital’s high-value care culture.12 The authors administered the High-Value Care Culture SurveyTM (HVCCS), a validated survey instrument designed to assess the degree to which a hospital’s culture promotes the delivery of high-value care, to 255 hospitalists across 12 hospitals, including safety-net, community, and university-based hospitals. The hospitals’ predominant physician compensation models were grouped into three categories: salary model (no performance-based bonus), salary model with a productivity adjustment (ie, a bonus based on clinical volumes), and a salary model with a quality/value adjustment (ie, a bonus for delivering higher value care). The authors found that hospitalists who were salaried but also received productivity adjustments reported significantly lower mean HVCCS scores than salaried hospitalists who did not receive bonuses or adjustments. Compared with salaried hospitalists, hospitalists receiving compensation via salary plus value-based adjustments were nonsignificantly more likely to have higher HVCCS scores.
How are we to interpret these results? While we must be exceedingly careful about presuming causal mechanisms underlying these associations, they are nonetheless intriguing and should prompt further discussion about the relationship between payment incentives, provider behavior, and organizational culture. One potential explanation for these findings is that hospitals that rely on high clinical volumes to drive their financial performance may use productivity bonuses as a way to align hospitalists’ incentives with those of their institution, thereby promoting volume at the expense of value.
Behavioral economics theory provides an alternative lens through which to interpret the work of Gupta et al. The relationship between incentives and nonfinancial sources of personal motivation remain an important consideration in financial incentive design.13 A basic concept in behavioral economics is that there are two fundamental types of motivation of human behavior: extrinsic motivation, where people are motivated to act by the prospect of material rewards or punishments, and intrinsic motivation, a source of motivation that leads people to behave in ways that do not produce an obvious personal or material reward.13 Substantial evidence indicates that external rewards can have counterproductive effects on an individual’s intrinsic motivation, leading to a “crowding-out” effect that decreases the individual’s internal drive. When the “crowding-out” effect occurs, behaviors may be motivated by a desire to follow the rules, rather than true intrinsic drive. This change in the underlying forces motivating behavior can have a negative impact on self-esteem and result in a perceived loss of professional autonomy.13,14 Perhaps more than any other professional group, healthcare professionals are fueled by intrinsic motivation and a yearning for professional autonomy. It is therefore plausible that doctors are particularly sensitive to, and disturbed by, the feeling that external rewards are “crowding out” this internal drive. Thus, the inverse association between productivity payments – volume-based rewards – and HVCCS scores may reflect this tension between intrinsic and extrinsic drives.
Of course, we need to interpret the authors’ findings cautiously in light of the cross-sectional study design and the potential for residual confounding. Indeed, the presence of an association between how hospitalists are compensated and their perceptions of the degree to which their institution’s culture promotes the delivery of high-value care does not prove that these two things are causally linked. Additionally, the small sample size limits the generalizability of these findings and efforts to draw robust conclusions from this work regarding the interplay between how a hospital pays its physicians, hospital culture, and the value of care delivered in this institution. Moreover, a more rigorous characterization of the nature of productivity payments compared with value-based performance payments and pure salaried wages would have been extremely useful to help interpret the likelihood that these payment models influenced the behavior of clinicians and perceptions of culture. In particular, how payment models define “productivity” and “quality” thresholds for achieving performance-based payments and the degree of control that physicians have on achieving them are critical determinants of the power of these incentives to influence clinician behavior and of clinicians’ perceptions of the degree to which their institution cultivates a high-value culture.14
Despite these limitations, this study raises a number of interesting hypotheses regarding the relationship between clinician payment models, incentive design, and clinical culture that warrant further investigation. For example, how do financial incentives designed to improve the value of inpatient care actually influence the practice patterns of hospitalists? Surprisingly little is known about this topic. Does the physician payment model design generally and implementation of targeted financial incentives for delivering higher value care in particular directly influence clinical culture? If so, how? Also, does the cultural effect actually undermine the goals of the financial incentive?
More broadly, systematic efforts to evaluate how clinical and hospital cultures impact the ability of financial incentives to motivate desired changes in clinicians’ behaviors will help healthcare leaders use financial incentives more effectively to motivate the delivery of higher quality, more cost-effective care. Increasing use and evaluation of different alternative payment models across hospitals nationwide represents an opportunity to characterize associations between different payment models and the delivery of high-quality, cost-effective care.15 Parallel efforts to characterize the clinical culture of these hospitals could help to better understand if and how hospital culture mediates this relationship. Moreover, because inpatient care is increasing and, in many hospitals, primarily provided by multidisciplinary teams, additional research is needed to understand how different payment models influence inpatient clinical team performance.
The connection between culture, financial incentives, and value-based care remains difficult to determine, but essential to clarify. Gupta et al. demonstrated that how a clinical system pays its physicians appears to be associated with physicians’ perceptions of how strongly the hospital’s culture emphasizes the delivery of high-value care. Work culture is a profound determinant of employee happiness, satisfaction, and productivity. The consistent delivery of high-value care is undoubtedly harder in clinical cultures that do not prize and support this end. Health system leaders focused on improving care value would be wise to pay close attention to their employees’ perceptions of their culture – and use these perceptions as one of several measures of their progress toward enabling their organization to deliver higher value care consistently.
Disclosures
Dr. Blumenthal is the Associate Chief Medical Officer of Devoted Health. Dr. Bergethon has nothing to disclose.
1. Papanicolas I, Woskie LR, Jha AK. Health care spending in the United States and other high-income countries. JAMA. 2018;319(10):1024-1039. doi: 10.1001/jama.2018.1150. PubMed
2. Fullman N, Yearwood J, Abay SM, et al. Measuring performance on the Healthcare Access and Quality Index for 195 countries and territories and selected subnational locations: a systematic analysis from the Global Burden of Disease Study 2016. Lancet. 2018;391(10136):2236-2271. doi: 10.1016/S0140-6736(18)30994-2. PubMed
3. Hartman M, Martin AB, Espinosa N, Catlin A, National Health Expenditure Accounts Team. National health care spending in 2016: spending and enrollment growth slow after initial coverage expansions. Health Aff. 2017;37(1):150-160. doi: 10.1377/hlthaff.2017.1655. PubMed
4. Nussbaum S, McClellan M, Metlay G. Principles for a framework for alternative payment models. JAMA. 2018;319(7):653-654. doi: 10.1001/jama.2017.20226. PubMed
5. Morden NE, Colla CH, Sequist TD, Rosenthal MB. Choosing wisely- the politics and economics of labeling low-value services. N Engl J Med. 2014;370(7):589-592. doi: 10.1056/NEJMp1314965. PubMed
6. Laugesen MJ, Glied SA. Higher fees paid to US physicians drive higher spending for physician services compared to other countries. Health Aff. 2011;30(9):1647-1656. doi: 10.1377/hlthaff.2010.0204. PubMed
7. Korda H, Eldridge GN. Payment incentives and integrated care delivery: Levers for health system reform and cost containment. Inquiry. 2011;48(4):277-287. doi: 10.5034/inquiryjrnl_48.04.01. PubMed
8. Dummit LA, Kahvecioglu D, Marrufo G, et al. Association between hospital participation in a Medicare bundled payment initiative and payments and quality outcomes for lower extremity joint replacement episodes. JAMA. 2016;316(12):1267-1278. doi: 10.1001/jama.2016.12717. PubMed
9. Korenstein D, Husain S, Gennarelli R, White C, Masciale J, Roman B. Impact of clinical specialty on attitudes regarding overuse of inpatient laboratory testing. J Hosp Med. 2018;E1-E4. doi: 10.12788/jhm.2978. PubMed
10. Jain R, Kralovic SM, Evans ME, et al. Veterans Affairs initiative to prevent methicillin-resistant Staphylococcus aureus infections. N Engl J Med. 2011;364(15):1419-1430. doi: 10.1056/NEJMoa1007474. PubMed
11. Stammen LA, Stalmeijer RE, Paternotte E, et al. Training physicians to provide high-value, cost-conscious care a systematic review. JAMA. 2015;314(22):2384-2400. doi: 10.1001/jama.2015.16353. PubMed
12. Gupta R, Steers N, Moriates C, Ong M. Association between hospitalist productivity payments and high-value care culture [published online ahead of print October 31, 2018]. J Hosp Med. 2018. In press. doi: 10.12788/jhm.3084. PubMed
13. Marshall M, Harrison S. It’s about more than money: financial incentives and internal motivation. Qual Saf Health Care. 2005;14(1):4-5. doi: 10.1136/qshc.2004.013193. PubMed
14. Conrad DA. The theory of value-based payment incentives and their application to health care. Health Serv Res. 2015;50(Suppl 2):2057-2089. doi: 10.1111/1475-6773.12408. PubMed
15. Schwartz AL, Chernew ME, Landon BE, McWilliams JM. Changes in low-value services in year 1 of the medicare pioneer accountable care organization program. JAMA Intern Med. 2015;175(11):1815-1825. doi: 10.1001/jamainternmed.2016.2827. PubMed
© 2019 Society of Hospital Medicine
Improving Veteran Access to Treatment for Hepatitis C Virus Infection (FULL)
In the U.S., 2.7 to 3.9 million people are chronically infected with the hepatitis C virus (HCV).1 Survey data suggest that HCV infection is more prevalent in patients enrolled in the VA health care system than it is in civilian health care systems.2 Studies have shown that Vietnam veterans, veterans with mental health and substance abuse disorders, and veterans without stable housing are more likely to be infected with HCV.3 Data from the VA HCV Clinical Case Registry (CCR) for 2015 showed that 174,842 veterans with chronic HCV infection receieved care within the VHA, which makes the VA the single largest HCV care provider in the nation.4
The VA is dedicated to providing treatment to veterans with HCV infection. For fiscal year (FY) 2016, the VA allocated $1 billion to HCV care,and in February 2016 it began offering treatment to all veterans with HCV, regardless of degree of fibrosis or severity of underlying liver disease.3,5 Each VAMC was tasked with improving veterans’ access to HCV treatment.
In an effort to engage patients in HCV care, the multidisciplinary HCV team at the Richard L. Roudebush VAMC (RLRVAMC) in Indianapolis, Indiana, launched a 2-phase improvement process in 2016. The goal in phase 1 was to increase patient access to HCV clinics, and the goal in phase 2 was to recruit patients for direct-acting antiviral (DAA) therapy for HCV. These efforts were designed to increase screening, identification, and linkage to care for HCV and to expand clinic access for the treatment and cure of all identified veterans who pursued treatment.
Patients with HCV infection, referred from primary care clinics, initially were evaluated by HCV clinic providers (hepatologists, infectious disease specialists, gastroenterology fellows, or nurse practitioners) for eligibility to receive DAA therapy for HCV. Eligible patients then were referred to a pharmacist-run HCV clinic, which had been established at RLRVAMC in 2011. At the start of FY 2016, the clinic, staffed by 3 pharmacists, operated 5 half-days per week and accommodated up to 35 weekly patient appointments.
In this clinic, patients received initial education and medication reconciliation for potential drug interactions with DAAs. Once the HCV treatment was initiated, patients were evaluated in the clinic every 2 weeks for medication refills and assessment for tolerability, adherence, and laboratory abnormalities until end of treatment (8-24 weeks, depending on HCV genotype, experiences with prior HCV treatment, and presence/absence of cirrhosis). Twelve weeks after completion of treatment, viral load was obtained to determine sustained virologic response (SVR12).
Methods
Phase 1: Improve Clinic Access
During FY 2016, methods for expanding clinic access to accommodate a large influx of treatment-eligible patients were reviewed and implemented.
In the first intervention, unneeded follow-up visits were eliminated to make room for additional new patient appointments. In general, patients treated with ribavirin require close monitoring, given the risk for anemia.6 With the release of newer DAAs, however, more patients became eligible for treatment with ribavirin-free regimens.7 As a result, follow-up appointments for these patients were extended to 4-week intervals instead of every 2 weeks. A patient with a history of nonadherence to medication use or clinic visits was still maintained on a 2-week schedule of follow-up for close monitoring.
In the second intervention, opportunities for switching those who completed treatment from face-to-face clinic visits to telephone were identified. These patients historically were seen in clinic for a brief interview and for a blood test used to determine end-of-treatment viral load. Improving access for new patients in the clinic involved moving more existing patients from in-clinic visits to telephone. At the end of the treatment plan, existing patients received an order for laboratory tests that included viral load. When all laboratory results were ready, patients were contacted by telephone. Recruiting a registered nurse to the treatment team who assisted with telephone visits further improved clinic efficiency.
The third intervention was inspired by successful results at other VA sites and launched a group treatment clinic for patients who were starting ribavirin-free DAA regimens.7 Group visits were run by 2 pharmacists and accommodated up to 10 veterans. Patients underwent testing for HCV genotype and viral load before the initial group visit. At check-in, patients received a short questionnaire and consent form for group participation. The questionnaire reviewed patient history of drug and alcohol use and potential barriers to medication adherence. Patients also were encouraged to write down any questions they had about the treatment. During the initial group visit, pharmacists provided general education about the medications, potential adverse effects, treatment expectations, and the monitoring plan. Follow-up visits were conducted in a group setting as well.
Phase 2: Increase Recruitment
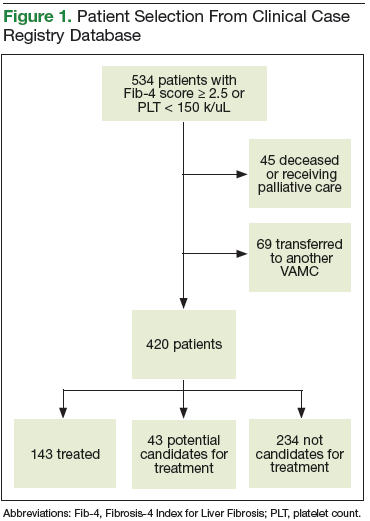
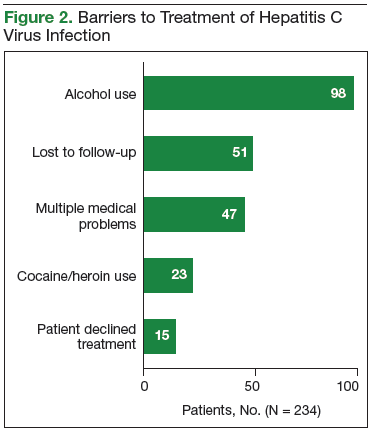
The records of 534 patients with advanced liver disease (F3-F4 fibrosis on the Fibrosis-4 Index for Liver Fibrosis) and HCV infection were identified in the CCR database for the period August 2015 to December 2015 (Figure 1).8 Patients were excluded if they were deceased, were receiving palliative care (n = 45), or if they had transferred their care to another VA facility (n = 69). Of the 420 patients in the study reviewed, 234 (56%) had not previously been referred to an HCV clinic or been started on treatment because of a variety of social issues, including active substance use (Figure 2).
Many of the patients were difficult to engage because the clinic could not effectively assist them in achieving sobriety and lacked support personnel who could address their complex social issues. Given the availability of all-oral HCV treatments, the VA Public Health Department issued guidance allowing all HCV-infected patients to receive DAA treatment regardless of ongoing drug or alcohol use disorders.9 Substance use was not to be considered a contraindication to therapy. It was suggested that health care providers determine these patients’ treatment eligibility on a case-by-case basis. An official VA memorandum supporting this initiative was released in September 2016.10
Interventions
In an effort to engage all HCV-infected patients, the CCR review was expanded to include patients without advanced liver disease. All patients were contacted by mail. Any patient registered for secure messaging through MyHealtheVet also received a secure message. Patients were informed about the newly approved DAA therapies and were connected directly with specialized HCV clinic schedulers at RLRVAMC. Patients who responded were scheduled for a group education class facilitated by 2 members of the HCV treatment team.
Unlike patients in the group treatment clinic, patients in the education class had not completed the necessary workup for treatment initiation. In the class, patients received education on new HCV treatments and were linked to social work care if needed to streamline the referral process. All baseline laboratory test results also were obtained.
Another intervention implemented to recruit patients in this difficult-to-treat population was the addition of a social worker to the treatment team. Beginning in late June 2016, high-risk patients were referred to the social worker by HCV providers or pharmacists. For each referred patient, the social worker performed a psychosocial assessment to identify potential barriers to successful treatment and then connected the patient with either VA or community resources for support.
The social worker linked patients to mental health or substance use-related services, empowered them to access transportation resources for clinic appointments, orchestrated assistance with medication adherence from a home health nurse, and reached out to patients in person or by telephone to address specific needs that might limit their ability to attend appointments. The social worker also provided harm reduction planning and goal setting support to help patients with substance use disorders achieve sobriety or reduce substance use while on HCV treatment. All efforts were made to ensure that patients adhered to their clinic visits and medication use. In addition, during social work assessment, factors such as housing concerns, travel barriers, and loss and grief were identified and promptly addressed.
Results
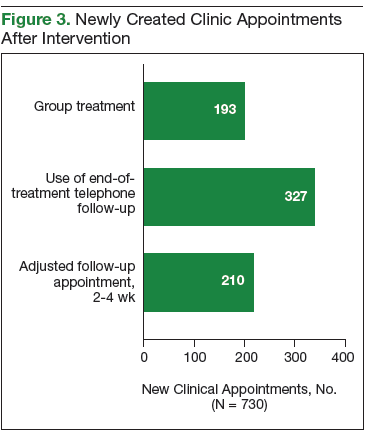
After the phase 1 intervention, 730 additional appointments were added in FY 2016 (Figure 3). As a result, 409 patients with HCV infection were started on treatment in FY 2016 compared with 192 in FY 2015. More important, the rapid increase in capacity and treatment initiation did not sacrifice the quality of care provided. Ninety-eight percent of patients who started treatment in FY 2016 successfully completed their treatment course. The overall SVR12 rate was 96% for all genotype 1 patients treated with ledipasvir/sofosbuvir, ombitasvir/paritaprevir/ritonavir plus dasabuvir, or elbasvir/grazoprevir with or without ribavirin. In addition, the SVR12 rate was 82% for genotype 2 patients (almost all cirrhotic) treated with sofosbuvir plus ribavirin and 93% for genotype 3 patients treated with daclatasvir, sofosbuvir, and ribavirin.
Phase 2: Increase Recruitment
The expanded CCR review identified 234 patients with advanced liver disease and 546 patients without advanced disease. As this was a rolling review, 58 patients were linked to care before being contacted. Of the 722 patients in the cohort, 528 were contacted by mail and 194 both by mail and by MyHealtheVet messaging. One hundred forty-one patients responded: 129 by mail and 12 by MyHealtheVet messaging (eFigure 1). 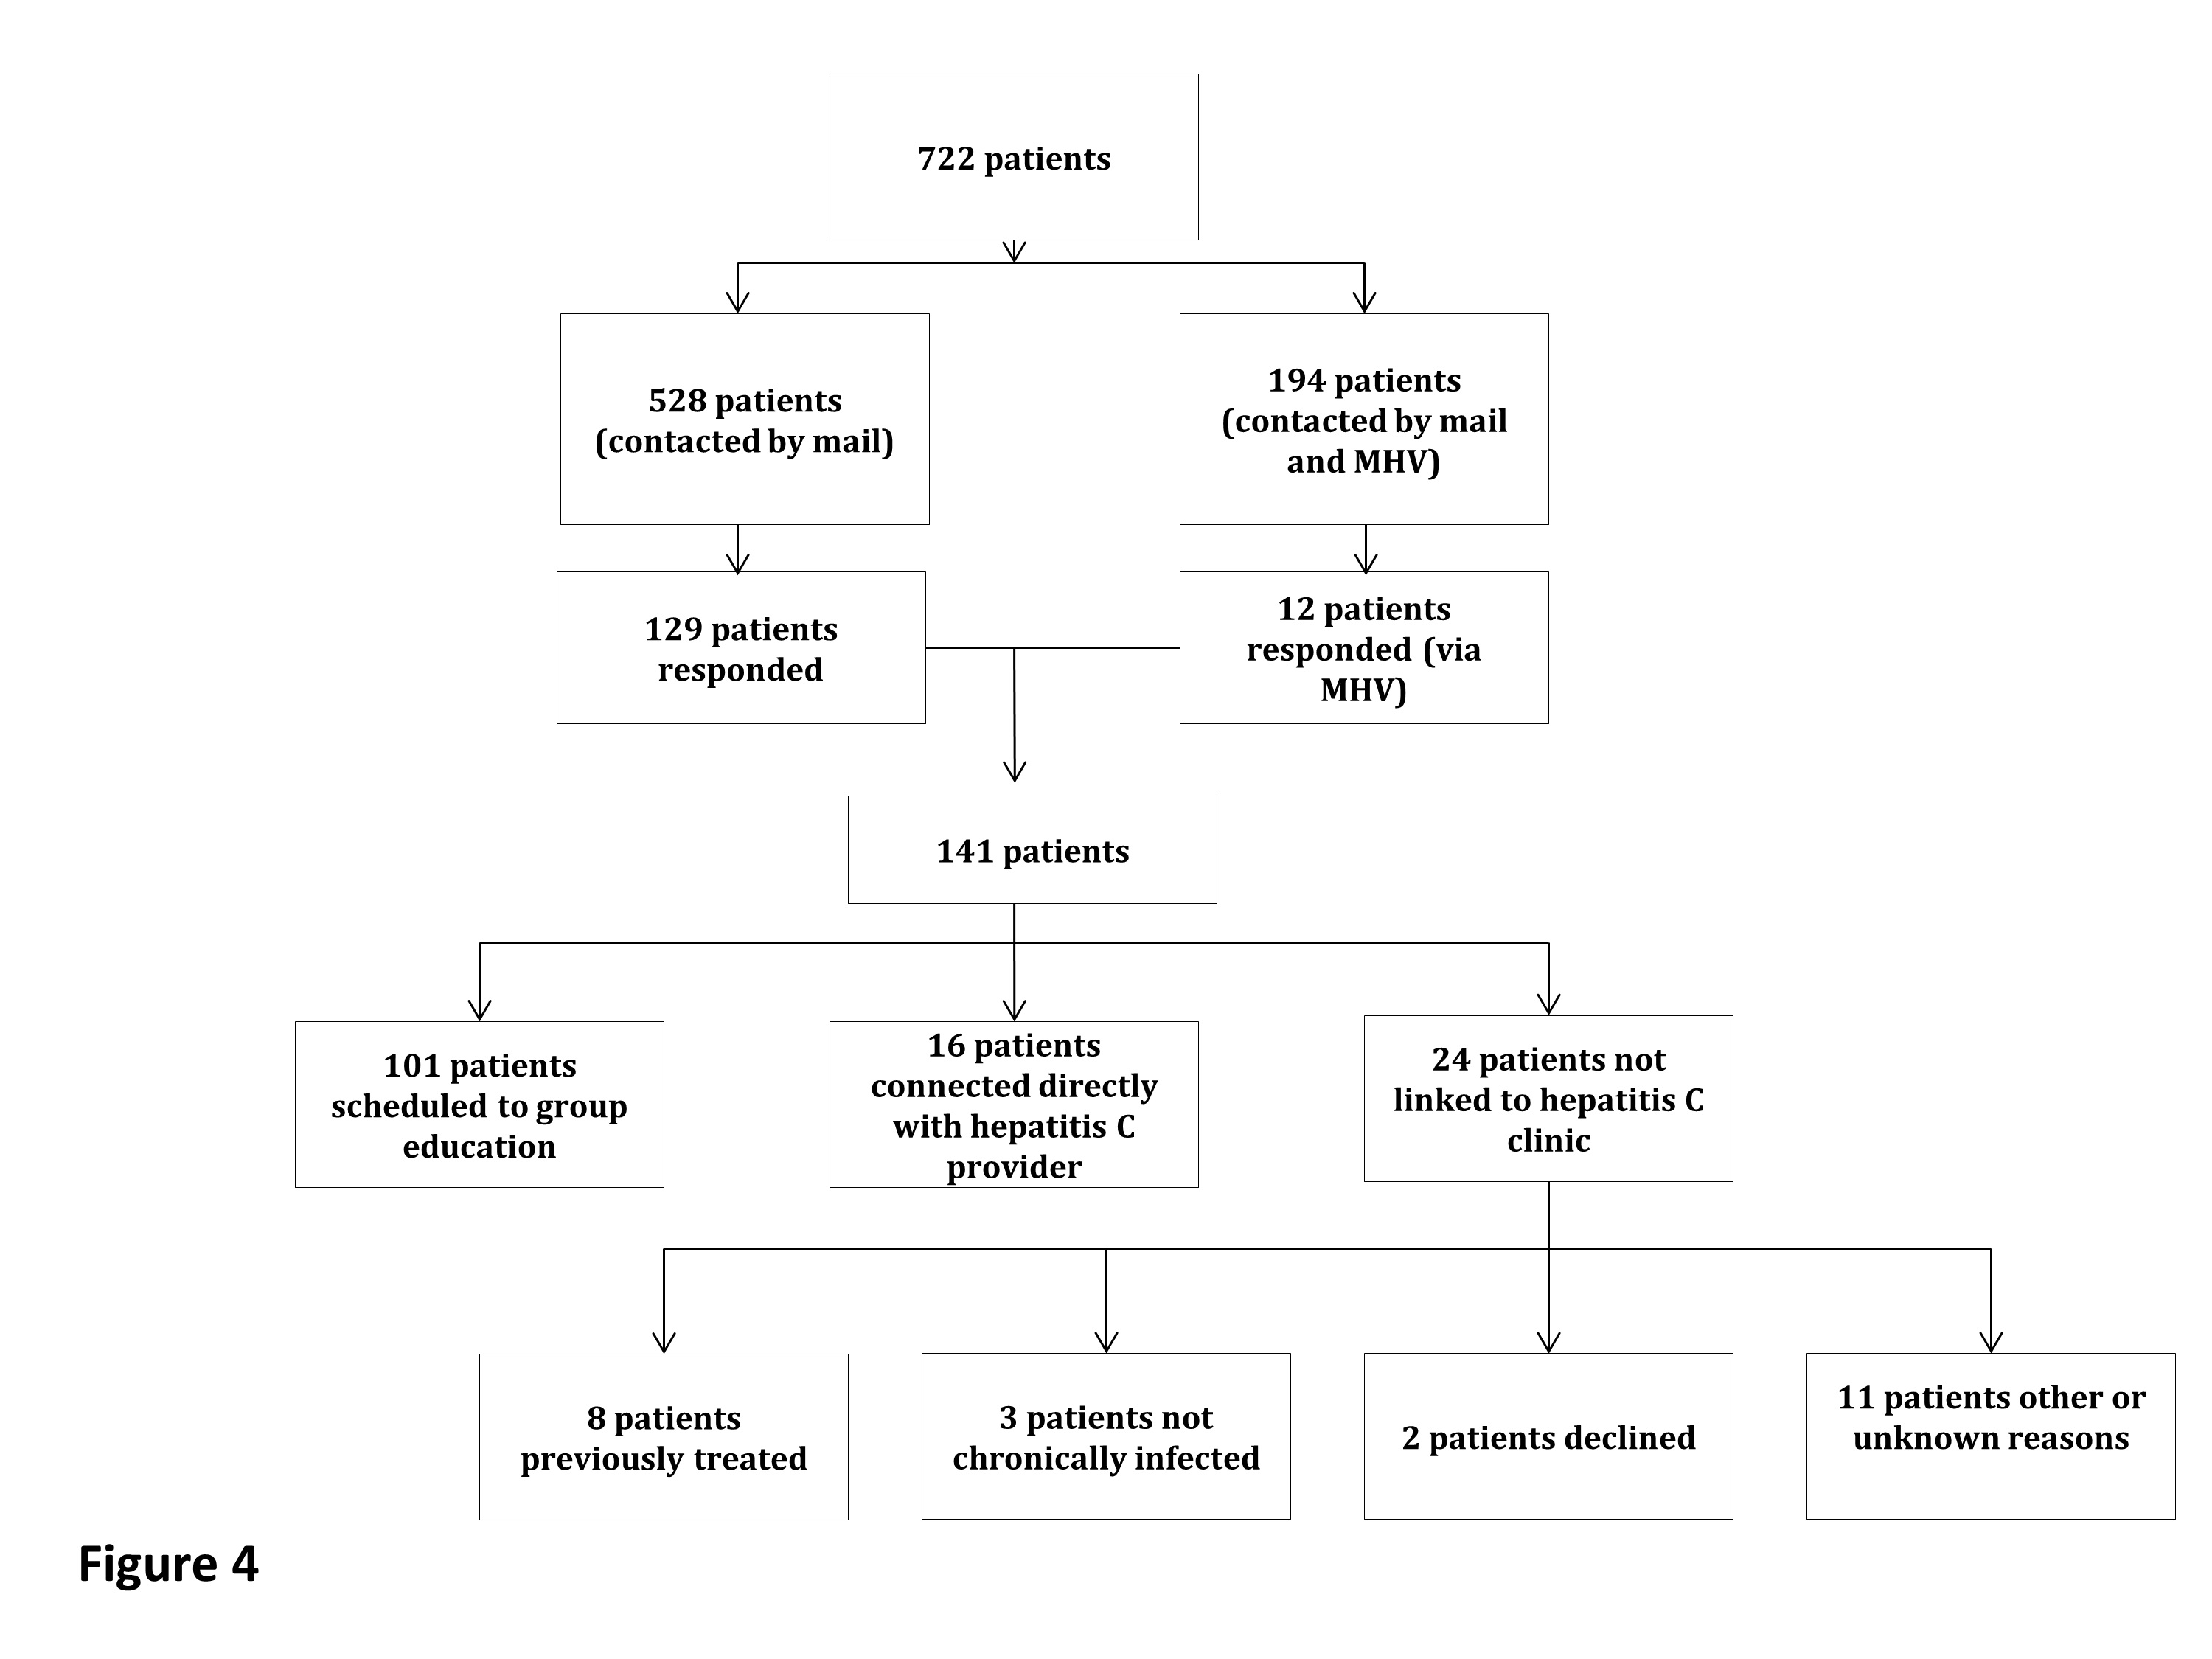
Of the 101 patients scheduled for group education, 43 attended education in FY 2016 (eFigure 2).
In June 2016, a social worker was added to the treatment team in an effort to improve recruitment in this difficult to treat population (Figure 2). Between June 2016 and end of FY 2016, 48 patients were referred to the social worker for evaluation. The primary reasons for referral were ongoing substance/alcohol use or high risk for relapse (n = 22); appointment adherence barriers, including problems with transportation (n = 16); underlying mental health disorders (n = 4); barriers to medication adherence (n = 3); and unstable housing (n = 3). Of these 48 patients, 31 received a single social worker intervention to connect with resources; the other 17 were recommended for intensive case management for ongoing support during preparation for HCV treatment and during therapy. As a result of social work involvement, 31 out of 48 referred patients were successfully started on treatment in FY 2016.
Discussion
The VA continues focusing its efforts and resources on treating HCV infection in FY 2017. To further expand outreach, RLRVAMC is working on several additional process improvements. One reason for the lower than expected number of patients who did not see a provider after attending the group education class is that these patients were difficult to reach for scheduling. A medical support assistant is now attending these classes; immediately after a class ends and before leaving the facility, this assistant schedules patients for appointments with HCV providers. The team social worker continues to help prepare patients for treatment and targets interventions for patients early in their HCV workup so that resources are allocated before treatment initiation. In the first 2 months of FY 2017, about 10 more patients who were referred to the social worker for assessment and support started treatment.
Outreach letter responses identified almost 600 potential candidates for treatment. Pharmacists telephoned these patients in another effort to connect them with VA services. Interested patients were scheduled for a group education visit. Also, pharmacists reached out to all primary care clinics and community-based outpatient clinics connected with the facility to provide education on VA policies regarding HCV treatment eligibility and to encourage providers to refer all patients with HCV infection to the HCV clinic. This education was provided at primary care team meetings, and providers not in attendance receive individual outreach by pharmacists. Primary care providers also received a pocket card that summarized recommendations for HCV screening and referrals. These efforts and initiatives are expected to increase veterans’ access to care for HCV infection within the catchment area.
Conclusion
Treatment team interventions in FY 2016 significantly increased veterans’ access to RLRVAMC HCV care. The number of patients who started treatment more than doubled since the previous year. Many of these patients had complex social issues or treatment barriers but successfully started therapy with the help of additional support staff.
Click here to read the digital edition.
1. Centers for Disease Control and Prevention. Hepatitis C FAQs for health professionals. https://www.cdc.gov/hepatitis/hcv/hcvfaq.htm. Updated January 27, 2017. Accessed May 9, 2017.
2. U.S. Department of Veterans Affairs. Epidemiology of hepatitis C. http://www.hepatitis.va.gov/provider/reviews/epidemiology.asp. Updated August 26, 2016. Accessed May 9, 2017.
3. U.S. Department of Veterans Affairs, Office of Research and Development. VA research on hepatitis C. http://www.research.va.gov/topics/hep-c.cfm. Updated October 14, 2016. Accessed May 9, 2017.
4. U.S. Department of Veterans Affairs. HIV, hepatitis, and public health pathogens programs annual stakeholders report: 2015. https://www.hepatitis.va.gov/pdf/stakeholders-report-2015.pdf. Published May 2015. Accessed May 10, 2017.
5. Lynch TG, McCarthy MF; US Department of Veterans Affairs. Hepatitis C virus (HCV) funding and prioritization status update [memorandum]. http://www.hepatitis.va.gov/pdf/choice-prioritization-update.pdf. Published February 24, 2016. Accessed May 9, 2017.
6. Fried MW. Side effects of therapy of hepatitis C and their management. Hepatology. 2002;36(5 suppl 1):S237-S244.
7. AASLD/IDSA HCV Guidance Panel. Hepatitis C guidance: AASLD-IDSA recommendations for testing, managing, and treating adults infected with hepatitis C virus. Hepatology. 2015;62(3):932-954.
8. Vallet-Pichard A, Mallet V, Nalpas B, et al. Fib-4: an inexpensive and accurate marker of fibrosis in HCV infection. Comparison with liver biopsy and fibrotest. Hepatology. 2007;46(1):32-36.
9. U.S. Department of Veterans Affairs National Hepatitis C Resource Center Program and National Viral Hepatitis Program the HIV, Hepatitis, and Related Conditions Program in the Office of Specialty Care Services. Chronic hepatitis C virus (HCV) infection: treatment considerations. https://www.hepatitis.va.gov/pdf/treatment-considerations-2017-03-08.pdf. Updated March 8, 2017. Accessed May 9, 2017.
10. Lynch TG; U.S. Department of Veterans Affairs. Evaluation and treatment of veterans with hepatitis C (HCV) and co-occurring substance use or mental health concerns [memorandum]. http://www.hepatitis.va.gov/pdf/memo-HCV-and -mental-health.pdf. Published September 9, 2016. Accessed May 9, 2017.
In the U.S., 2.7 to 3.9 million people are chronically infected with the hepatitis C virus (HCV).1 Survey data suggest that HCV infection is more prevalent in patients enrolled in the VA health care system than it is in civilian health care systems.2 Studies have shown that Vietnam veterans, veterans with mental health and substance abuse disorders, and veterans without stable housing are more likely to be infected with HCV.3 Data from the VA HCV Clinical Case Registry (CCR) for 2015 showed that 174,842 veterans with chronic HCV infection receieved care within the VHA, which makes the VA the single largest HCV care provider in the nation.4
The VA is dedicated to providing treatment to veterans with HCV infection. For fiscal year (FY) 2016, the VA allocated $1 billion to HCV care,and in February 2016 it began offering treatment to all veterans with HCV, regardless of degree of fibrosis or severity of underlying liver disease.3,5 Each VAMC was tasked with improving veterans’ access to HCV treatment.
In an effort to engage patients in HCV care, the multidisciplinary HCV team at the Richard L. Roudebush VAMC (RLRVAMC) in Indianapolis, Indiana, launched a 2-phase improvement process in 2016. The goal in phase 1 was to increase patient access to HCV clinics, and the goal in phase 2 was to recruit patients for direct-acting antiviral (DAA) therapy for HCV. These efforts were designed to increase screening, identification, and linkage to care for HCV and to expand clinic access for the treatment and cure of all identified veterans who pursued treatment.
Patients with HCV infection, referred from primary care clinics, initially were evaluated by HCV clinic providers (hepatologists, infectious disease specialists, gastroenterology fellows, or nurse practitioners) for eligibility to receive DAA therapy for HCV. Eligible patients then were referred to a pharmacist-run HCV clinic, which had been established at RLRVAMC in 2011. At the start of FY 2016, the clinic, staffed by 3 pharmacists, operated 5 half-days per week and accommodated up to 35 weekly patient appointments.
In this clinic, patients received initial education and medication reconciliation for potential drug interactions with DAAs. Once the HCV treatment was initiated, patients were evaluated in the clinic every 2 weeks for medication refills and assessment for tolerability, adherence, and laboratory abnormalities until end of treatment (8-24 weeks, depending on HCV genotype, experiences with prior HCV treatment, and presence/absence of cirrhosis). Twelve weeks after completion of treatment, viral load was obtained to determine sustained virologic response (SVR12).
Methods
Phase 1: Improve Clinic Access
During FY 2016, methods for expanding clinic access to accommodate a large influx of treatment-eligible patients were reviewed and implemented.
In the first intervention, unneeded follow-up visits were eliminated to make room for additional new patient appointments. In general, patients treated with ribavirin require close monitoring, given the risk for anemia.6 With the release of newer DAAs, however, more patients became eligible for treatment with ribavirin-free regimens.7 As a result, follow-up appointments for these patients were extended to 4-week intervals instead of every 2 weeks. A patient with a history of nonadherence to medication use or clinic visits was still maintained on a 2-week schedule of follow-up for close monitoring.
In the second intervention, opportunities for switching those who completed treatment from face-to-face clinic visits to telephone were identified. These patients historically were seen in clinic for a brief interview and for a blood test used to determine end-of-treatment viral load. Improving access for new patients in the clinic involved moving more existing patients from in-clinic visits to telephone. At the end of the treatment plan, existing patients received an order for laboratory tests that included viral load. When all laboratory results were ready, patients were contacted by telephone. Recruiting a registered nurse to the treatment team who assisted with telephone visits further improved clinic efficiency.
The third intervention was inspired by successful results at other VA sites and launched a group treatment clinic for patients who were starting ribavirin-free DAA regimens.7 Group visits were run by 2 pharmacists and accommodated up to 10 veterans. Patients underwent testing for HCV genotype and viral load before the initial group visit. At check-in, patients received a short questionnaire and consent form for group participation. The questionnaire reviewed patient history of drug and alcohol use and potential barriers to medication adherence. Patients also were encouraged to write down any questions they had about the treatment. During the initial group visit, pharmacists provided general education about the medications, potential adverse effects, treatment expectations, and the monitoring plan. Follow-up visits were conducted in a group setting as well.
Phase 2: Increase Recruitment
The records of 534 patients with advanced liver disease (F3-F4 fibrosis on the Fibrosis-4 Index for Liver Fibrosis) and HCV infection were identified in the CCR database for the period August 2015 to December 2015 (Figure 1).8 Patients were excluded if they were deceased, were receiving palliative care (n = 45), or if they had transferred their care to another VA facility (n = 69). Of the 420 patients in the study reviewed, 234 (56%) had not previously been referred to an HCV clinic or been started on treatment because of a variety of social issues, including active substance use (Figure 2).
Many of the patients were difficult to engage because the clinic could not effectively assist them in achieving sobriety and lacked support personnel who could address their complex social issues. Given the availability of all-oral HCV treatments, the VA Public Health Department issued guidance allowing all HCV-infected patients to receive DAA treatment regardless of ongoing drug or alcohol use disorders.9 Substance use was not to be considered a contraindication to therapy. It was suggested that health care providers determine these patients’ treatment eligibility on a case-by-case basis. An official VA memorandum supporting this initiative was released in September 2016.10
Interventions
In an effort to engage all HCV-infected patients, the CCR review was expanded to include patients without advanced liver disease. All patients were contacted by mail. Any patient registered for secure messaging through MyHealtheVet also received a secure message. Patients were informed about the newly approved DAA therapies and were connected directly with specialized HCV clinic schedulers at RLRVAMC. Patients who responded were scheduled for a group education class facilitated by 2 members of the HCV treatment team.
Unlike patients in the group treatment clinic, patients in the education class had not completed the necessary workup for treatment initiation. In the class, patients received education on new HCV treatments and were linked to social work care if needed to streamline the referral process. All baseline laboratory test results also were obtained.
Another intervention implemented to recruit patients in this difficult-to-treat population was the addition of a social worker to the treatment team. Beginning in late June 2016, high-risk patients were referred to the social worker by HCV providers or pharmacists. For each referred patient, the social worker performed a psychosocial assessment to identify potential barriers to successful treatment and then connected the patient with either VA or community resources for support.
The social worker linked patients to mental health or substance use-related services, empowered them to access transportation resources for clinic appointments, orchestrated assistance with medication adherence from a home health nurse, and reached out to patients in person or by telephone to address specific needs that might limit their ability to attend appointments. The social worker also provided harm reduction planning and goal setting support to help patients with substance use disorders achieve sobriety or reduce substance use while on HCV treatment. All efforts were made to ensure that patients adhered to their clinic visits and medication use. In addition, during social work assessment, factors such as housing concerns, travel barriers, and loss and grief were identified and promptly addressed.
Results
After the phase 1 intervention, 730 additional appointments were added in FY 2016 (Figure 3). As a result, 409 patients with HCV infection were started on treatment in FY 2016 compared with 192 in FY 2015. More important, the rapid increase in capacity and treatment initiation did not sacrifice the quality of care provided. Ninety-eight percent of patients who started treatment in FY 2016 successfully completed their treatment course. The overall SVR12 rate was 96% for all genotype 1 patients treated with ledipasvir/sofosbuvir, ombitasvir/paritaprevir/ritonavir plus dasabuvir, or elbasvir/grazoprevir with or without ribavirin. In addition, the SVR12 rate was 82% for genotype 2 patients (almost all cirrhotic) treated with sofosbuvir plus ribavirin and 93% for genotype 3 patients treated with daclatasvir, sofosbuvir, and ribavirin.
Phase 2: Increase Recruitment
The expanded CCR review identified 234 patients with advanced liver disease and 546 patients without advanced disease. As this was a rolling review, 58 patients were linked to care before being contacted. Of the 722 patients in the cohort, 528 were contacted by mail and 194 both by mail and by MyHealtheVet messaging. One hundred forty-one patients responded: 129 by mail and 12 by MyHealtheVet messaging (eFigure 1).
Of the 101 patients scheduled for group education, 43 attended education in FY 2016 (eFigure 2).
In June 2016, a social worker was added to the treatment team in an effort to improve recruitment in this difficult to treat population (Figure 2). Between June 2016 and end of FY 2016, 48 patients were referred to the social worker for evaluation. The primary reasons for referral were ongoing substance/alcohol use or high risk for relapse (n = 22); appointment adherence barriers, including problems with transportation (n = 16); underlying mental health disorders (n = 4); barriers to medication adherence (n = 3); and unstable housing (n = 3). Of these 48 patients, 31 received a single social worker intervention to connect with resources; the other 17 were recommended for intensive case management for ongoing support during preparation for HCV treatment and during therapy. As a result of social work involvement, 31 out of 48 referred patients were successfully started on treatment in FY 2016.
Discussion
The VA continues focusing its efforts and resources on treating HCV infection in FY 2017. To further expand outreach, RLRVAMC is working on several additional process improvements. One reason for the lower than expected number of patients who did not see a provider after attending the group education class is that these patients were difficult to reach for scheduling. A medical support assistant is now attending these classes; immediately after a class ends and before leaving the facility, this assistant schedules patients for appointments with HCV providers. The team social worker continues to help prepare patients for treatment and targets interventions for patients early in their HCV workup so that resources are allocated before treatment initiation. In the first 2 months of FY 2017, about 10 more patients who were referred to the social worker for assessment and support started treatment.
Outreach letter responses identified almost 600 potential candidates for treatment. Pharmacists telephoned these patients in another effort to connect them with VA services. Interested patients were scheduled for a group education visit. Also, pharmacists reached out to all primary care clinics and community-based outpatient clinics connected with the facility to provide education on VA policies regarding HCV treatment eligibility and to encourage providers to refer all patients with HCV infection to the HCV clinic. This education was provided at primary care team meetings, and providers not in attendance receive individual outreach by pharmacists. Primary care providers also received a pocket card that summarized recommendations for HCV screening and referrals. These efforts and initiatives are expected to increase veterans’ access to care for HCV infection within the catchment area.
Conclusion
Treatment team interventions in FY 2016 significantly increased veterans’ access to RLRVAMC HCV care. The number of patients who started treatment more than doubled since the previous year. Many of these patients had complex social issues or treatment barriers but successfully started therapy with the help of additional support staff.
Click here to read the digital edition.
1. Centers for Disease Control and Prevention. Hepatitis C FAQs for health professionals. https://www.cdc.gov/hepatitis/hcv/hcvfaq.htm. Updated January 27, 2017. Accessed May 9, 2017.
2. U.S. Department of Veterans Affairs. Epidemiology of hepatitis C. http://www.hepatitis.va.gov/provider/reviews/epidemiology.asp. Updated August 26, 2016. Accessed May 9, 2017.
3. U.S. Department of Veterans Affairs, Office of Research and Development. VA research on hepatitis C. http://www.research.va.gov/topics/hep-c.cfm. Updated October 14, 2016. Accessed May 9, 2017.
4. U.S. Department of Veterans Affairs. HIV, hepatitis, and public health pathogens programs annual stakeholders report: 2015. https://www.hepatitis.va.gov/pdf/stakeholders-report-2015.pdf. Published May 2015. Accessed May 10, 2017.
5. Lynch TG, McCarthy MF; US Department of Veterans Affairs. Hepatitis C virus (HCV) funding and prioritization status update [memorandum]. http://www.hepatitis.va.gov/pdf/choice-prioritization-update.pdf. Published February 24, 2016. Accessed May 9, 2017.
6. Fried MW. Side effects of therapy of hepatitis C and their management. Hepatology. 2002;36(5 suppl 1):S237-S244.
7. AASLD/IDSA HCV Guidance Panel. Hepatitis C guidance: AASLD-IDSA recommendations for testing, managing, and treating adults infected with hepatitis C virus. Hepatology. 2015;62(3):932-954.
8. Vallet-Pichard A, Mallet V, Nalpas B, et al. Fib-4: an inexpensive and accurate marker of fibrosis in HCV infection. Comparison with liver biopsy and fibrotest. Hepatology. 2007;46(1):32-36.
9. U.S. Department of Veterans Affairs National Hepatitis C Resource Center Program and National Viral Hepatitis Program the HIV, Hepatitis, and Related Conditions Program in the Office of Specialty Care Services. Chronic hepatitis C virus (HCV) infection: treatment considerations. https://www.hepatitis.va.gov/pdf/treatment-considerations-2017-03-08.pdf. Updated March 8, 2017. Accessed May 9, 2017.
10. Lynch TG; U.S. Department of Veterans Affairs. Evaluation and treatment of veterans with hepatitis C (HCV) and co-occurring substance use or mental health concerns [memorandum]. http://www.hepatitis.va.gov/pdf/memo-HCV-and -mental-health.pdf. Published September 9, 2016. Accessed May 9, 2017.
Patient Knowledge of and Barriers to Breast, Colon, and Cervical Cancer Screenings: A Cross-Sectional Survey of TRICARE Beneficiaries (FULL)
The National Defense Appropriations Act for fiscal year 2009, Subtitle B, waived copayments for preventive cancer screening services for all TRICARE beneficiaries, excluding Medicare-eligible beneficiaries.1 These preventive services include screening for colorectal cancer (CRC), breast cancer, and cervical cancer based on current guidelines (eAppendix1).
Despite having unrestricted access to these cancer screenings, TRICARE Prime beneficiaries report overall screening completion rates that are below the national commercial benchmarks established by the Healthcare Effectiveness Data and Information Set (HEDIS) for all 3 cancer types.2 Specifically, among TRICARE Prime beneficiaries enrolled in the western region of the U.S. in October 2013, the reported breast cancer screening rate was 61.6% (43,138/69,976) for women aged 42 to 69 years, which is well below the HEDIS 75th percentile of 76%. Similarly, the reported rate of cervical cancer screening among women aged 24 to 64 years was 68.3% (63,523/92,946), well below the HEDIS 75th percentile of 79%. Last, the reported rate of CRC screening among male and female TRICARE Prime members aged 51 to 75 years was 61.6% (52,860/85,827), also below the 2013 HEDIS 75th percentile of 63% based on internal review of TRICARE data used for HEDIS reporting.
Given the reported low screening rates, the Defense Health Agency (DHA) performed a cross-sectional survey to assess TRICARE Prime West region beneficiaries’ knowledge and understanding of preventive health screening, specifically for breast cancer, cervical cancer, and CRC, and to identify any potential barriers to access for these screenings.
Methods
A mostly closed-ended, 42-item telephone survey was designed and conducted (eAppendix2)
All women participating in the survey, regardless of age, were asked questions regarding cervical cancer screening. Women aged ≥ 42 years additionally were asked a second set of survey questions specific to breast cancer screening, and women aged between 51 and 64 years were asked a third set of questions related to CRC screening. The ages selected were 1 to 2 years after the recommended age for the respective screening to ensure adequate follow-up time for the member to obtain the screening. Men included in the survey were asked questions related only to CRC screening.
The target survey sample was 3,500 beneficiaries, separated into the following 4 strata: women aged 21 to 64 years of age enrolled in the direct care system (n = 1,250); women aged 21 to 64 years enrolled in the purchased (commercial) care network (n = 1,250); men aged 51 to 64 years enrolled in the direct care system (n = 500); and men aged 51 to 64 years enrolled in the purchased care network (n = 500). The random sample was drawn from an overall population of about 35,000 members. Sampling was performed without replacement until the target number of surveys was achieved. Survey completion was defined as the respondent having reached the end of the survey questionnaire but not necessarily having answered every question.
Data Elements
The preventive health survey collected information on beneficiaries’ knowledge of and satisfaction with their PCM, the primary location where they sought health care in the previous 12 months, preference for scheduling cancer screening tests, and general knowledge about the frequency and type of screening for breast, cervical, and colorectal cancers. Responses were scored based on guidelines effective as of 2009. In addition, the survey collected information on the beneficiary’s overall health status, current age, highest level of education achieved, current employment status, place of residence (on or off a military installation), race, and whether the beneficiary carried other health insurance aside from TRICARE.
Survey Mode and Fielding
A sampling population of eligible beneficiaries was created from a database of all TRICARE Prime beneficiaries. An automated system was used to randomly draw potential participants from the sample. Survey interviewers were given the beneficiary’s name and telephone number but no other identifiable information. Phone numbers from the sample were dialed up to 6 times before the number was classified as a “no answer.” Interviewers read to each beneficiary a statement describing the survey and participation risk and benefits and explained that participation was voluntary and the participant could end the survey at any time without penalty or prejudice. The survey commenced only after verbal consent was obtained.
Sample Weighting and Statistical Analysis
Each survey record was weighted to control for potential bias associated with unequal rates of noncoverage and nonresponse in the sampled population. A design weight was calculated as the ratio of the frame size and the sample size in each stratum. For each stratum, an adjusted response rate (RR) was calculated as the number of completed surveys divided by the number of eligible respondents. Since all respondents were eligible, the RR was not adjusted. The ratio of the design weight to the adjusted RR was calculated and assigned to each survey.
Frequency distributions and descriptive statistics were calculated for all close-ended survey items. Open-ended survey items were summarized and assessed qualitatively. When appropriate, open-ended responses were categorized and included in descriptive analyses. No formal statistical testing was performed.
Results
A total of 6,563 beneficiaries were contacted, and 3,688 agreed to participate (56%), resulting in 3,500 TRICARE beneficiaries completing the survey (95% completion rate), of whom 71% (2,500) were female. The overall cooperation rates were similar across the 4 strata. Interviews ceased once 3,500 surveys were completed. The largest distribution of respondents was aged between 55 and 64 years (37%) (Table 1). Respondents aged 21 to 24 years comprised the smallest percentage of the sample (7%). Nearly a third of respondents were dependents of ADSMs (30%), another 30% were retirees, and most respondents self-identified as white (Table 1).
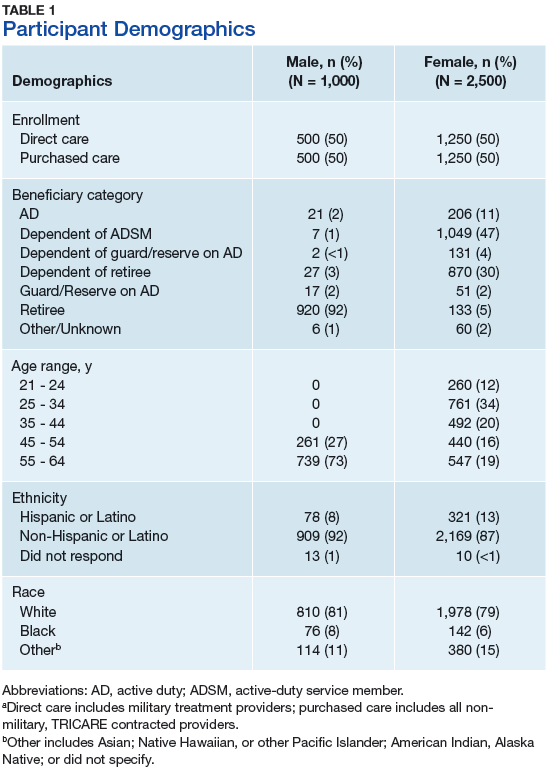
Barriers to Screening
A series of survey questions was asked about specific barriers to cancer screening, including the convenience of appointment times for the respondent’s last cancer screening. The majority (69%, 2,415 of 3,500) responded that the appointment times were convenient. Among those who stated that times were not convenient and those who had not scheduled an examination, 66% responded that they did not know or were not sure how to schedule a cancer screening test.
Screening Preferences
Less than half of survey respondents (48%) reported that they received screening guideline information from their physician or provider; 24% reported that they performed their own research. Only 9% reported that they learned about the guidelines through TRICARE materials, and 7% of respondents indicated that media, family, or friends were their source of screening information.
The survey respondents who indicated that they had not scheduled a screening examination were asked when (time of day) they preferred to have a screening. Less than half (47%) reported that varying available appointment times would not affect their ability to obtain screening. One-quarter preferred times for screening during working hours, 20% preferred times after working hours, 6% preferred times before working hours, and 2% responded that they were unsure or did not know. The majority (89%) reported that they would prefer to receive all available screenings on the same day if possible.
Breast Cancer Screening
Nearly all (98%) of the 1,100 women aged between 42 and 64 years reported having received a mammogram. These women were asked a specific subset of questions related to breast cancer screening. Respondents were asked to state the recommended age at which women should begin receiving mammogram screenings. More than half (55%) provided the correct response (40 years old, per the U.S. Preventive Services Task Force guidelines).3,4 About three-quarters of respondents (789) correctly responded annually to the question regarding how often women should receive mammograms.
The survey also sought to identify barriers that prevented women from obtaining necessary breast cancer screening. However, the majority surveyed (85%) noted that the question was not applicable because they typically scheduled screening appointments. Only a few (3%) reported factors such as either themselves or someone they know having had a negative experience, discomfort, pain, or concerns of a falsepositive result as reasons for not obtaining breast cancer screening. Of the 112 respondents to the open-ended question, 25% reported that their schedules prevented them from scheduling a mammogram in the past; 12% reported that an inconvenient clinic location, appointment time, or process prevented them from receiving a screening; and 13% reported forgetting to schedule the screening (Table 2).
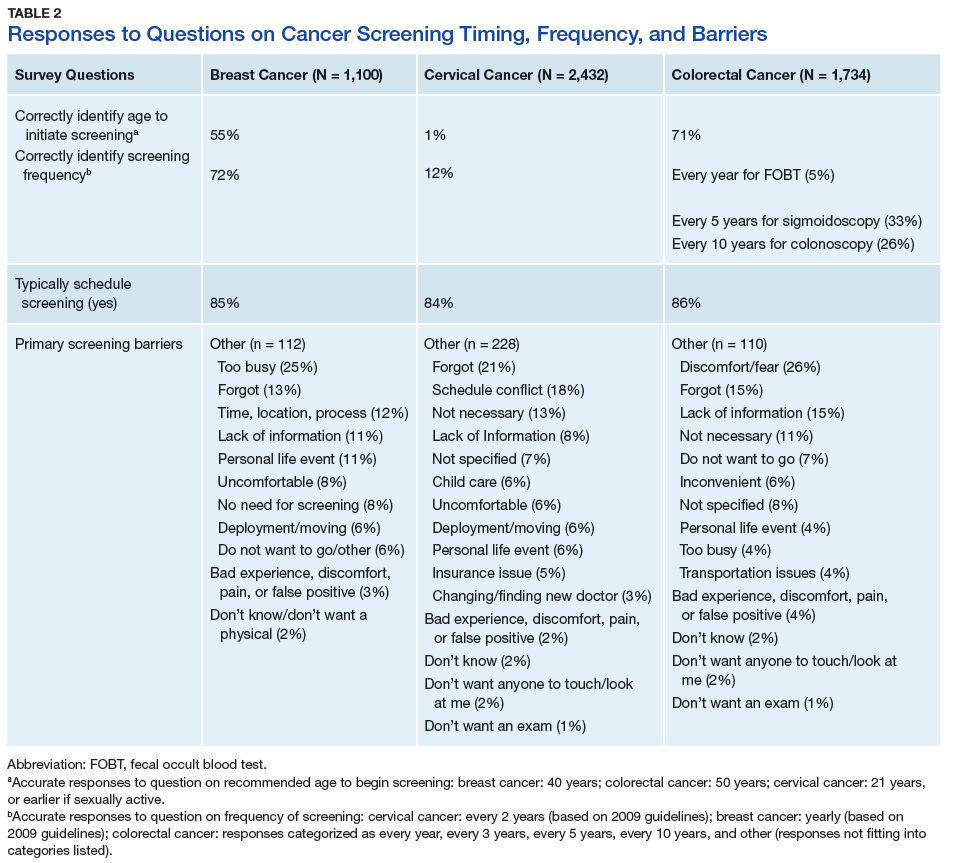
Cervical Cancer Screening
Female respondents aged between 21 and 64 years (n = 2,432) were asked about the recommended age at which women should begin receiving cervical cancer screening. Only 1% of respondents provided the correct response (that screening begins at 21 years of age per the U.S. Preventive Services Task Force Report guidelines), while 88% provided an incorrect response, and 11% were unsure or did not provide any response.5 Among all respondents, 98% reported having had a cervical cancer screening.
Respondents were asked how frequently women should have a Papanicolaou (Pap) test. Responses such as “2 to 3 years,” “2 years,” or “every other year” were labeled as correct, whereas responses such as “every 6 months” or “greater than 3 years” were labeled as incorrect. Just 12% of respondents provided a correct response, whereas 86% answered incorrectly, and 2% did not answer or did not know. Of those who answered incorrectly, the most common response was “annually” or “every year,” with no notable differences according to race, age, or beneficiary category.
To better understand barriers to screening, respondents were asked to identify reasons they might not have sought cervical cancer screening. The majority (84%) reported that they typically scheduled appointments and that the question was not applicable. However, among 228 respondents who provided an open-ended response and who had not previously undergone a hysterectomy, 8% stated that they had received no reminder or that they lacked sufficient information to schedule the appointment, 21% forgot to schedule, 18% reported a scheduling conflict or difficulty in receiving care, and 13% noted that they did not believe in annual screening (Table 2).
Colorectal Cancer Screening
Eighty-seven percent of eligible respondents (n = 1,734) reported having ever had a sigmoidoscopy and/or colonoscopy. Respondents were asked for their understanding of the recommended age for men and women to begin CRC screening.6 Nearly three-quarters of respondents provided a correct response (n = 1,225), compared with 23% of respondents (n = 407) who answered incorrectly and 6% (n = 102) who did not provide a response or stated they did not know. Correct responses were numerically higher among white respondents (73%) compared with black (62%) and other (62%) respondents as well as among persons aged < 60 years (73%) vs those aged > 60 years (67%).
Respondents aged between 51 and 64 years were asked how often the average person should receive colon cancer screenings. The most common response was that screening should occur every 5 years (33%) followed by every 10 years (26%). This aligns with the U.S. Preventive Services Task Force’s recommendations for flexible sigmoidoscopy every 5 years or colonoscopy every 10 years.
Eligible respondents were asked to identify reasons they did not seek CRC screening. Eighty-six percent of respondents indicated that they typically scheduled CRC screening and that the question was not applicable. Among respondents who provided an open-ended response, 26% cited feeling uncomfortable with the procedure, 15% cited forgetting to schedule a screening, 15% noted a lack of information on screening, and 11% reported no need for screening (Table 2). Among the 1,734 respondents, 80% reported that they would prefer a fecal occult blood test (FOBT) over either a colonoscopy or a sigmoidoscopy. Only 51% reported that their PCM had previously discussed the different types of CRC screenings at some point.
Discussion
The purpose of this large, representative survey was to obtain information on beneficiaries’ knowledge, perceived barriers, and beliefs regarding breast, cervical, and colorectal cancer screenings to identify factors contributing to low completion rates. As far as is known, this is the first study to address these questions in a TRICARE population. Overall, the findings suggest that beneficiaries consider cancer screening important, largely relying on their PCM or their research to better understand how and when to obtain such screenings. The majority received 1 or more screenings prior to the survey, but there were some common knowledge gaps about how to schedule screening appointments, relevant TRICARE medical benefits, and the current recommendations regarding screening timing and frequency. A commonly reported issue across all surveyed groups was inconvenient screening times.
More than half (55%) of respondents correctly noted that breast cancer screening begins at age 40 years (based on recommendations at the time the survey was conducted), and 72% understood when screening should occur. Despite access to care, inconvenient schedules and testing locations were considered the biggest barriers to regularly obtaining a mammogram. There are few studies on knowledge of breast cancer screening in an insured population available for comparison.7-10 One study of medically insured black and non-Hispanic women aged 43 to 49 years showed that lack of reminders or knowledge about the need for mammograms, cost, being too busy, and forgetting to schedule appointments were all factors associated with nonadherence to repeat mammography examinations.8 In an integrative review published in 2000, authors cited that among 8 of 13 relevant studies, the major barrier to receiving a recommended mammogram was lack of physician recommendation.7
For cervical cancer screening, few respondents (1%) correctly identified the age for initiation of screening, and just 12% correctly identified the frequency of screening. These findings are consistent with those of other studies, suggesting a general misunderstanding
about Pap tests in the U.S. and among low-income women.11,12 Reported barriers to screening were uncommon but included scheduling conflicts and lack of reminders or information and were consistent with barriers cited in prior studies.13,14 A few respondents (13%) noted that they did not believe in annual screening, which is similar to the findings of Decker and colleagues who cited lack of knowledge about the test and belief that screening is of no benefit as reasons for failure to get a recommended Pap test.13 These findings suggest a need to improve patientprovider communication and to provide more patient educational materials about the importance of cervical cancer screening.
A large proportion (71%) gave the correct response regarding the appropriate age to initiate CRC screening. Discomfort with the procedure, belief that the screening is unnecessary, or lack of physician’s recommendation were noted barriers to CRC screening. These findings are similar to those reported elsewhere in non-TRICARE populations.15-20 Two focus groups included participants with little knowledge about CRC screening, such as risk factors and symptoms, and expressed fear and embarrassment about CRC and screening. Few of the focus group participants were aware of the available options for screening, and some were confused about the purpose and benefits of the various screening modalities.16
A Health Information National Trends survey reported that 24% participants had not received a colonoscopy or a sigmoidoscopy because their PCM did not order it or say that it was necessary.15 The reported perceived barriers included fear of an adverse finding, injury to the colon from screening, and embarrassment. A study performed in 1,901 Medicare-insured individuals with no history of CRC cited lack of knowledge/awareness and no physician order as the most common reasons for not undergoing CRC screening.18
Strengths and Limitations
A major strength of the current survey is the 56% completion rate, which far exceeds other survey participation rates that were as low as 9%.21 A second strength is the scope of the survey to capture information on not 1 but 3 different cancer screening practices in a unique population who receive preventive screenings at low to no cost.
There are a few study limitations. The majority of respondents identified as white (80%), which does not fully align with the racial distribution of the TRICARE Prime population in the West Region, which is about 68% white. This higher proportion of white respondents may affect the ability to generalize findings to other populations. However, given the open access to care, race should not be a major factor contributing to screening decisions. Another potential limitation to the generalizability of the study is that the age of the respondents was capped at 64 years. Considering that some of the reported barriers to screening were “too busy” or “scheduling conflict,” a study population that included respondents aged ≥ 65 years (who might be more likely to be retired) might report lower rates of these schedule-related barriers.
A third limitation is that most questions about prior screenings pertained to any time in the past, and, therefore, limited the ability to identify current factors leading to lower screening rates. Last, the survey was developed prior to the 2012 changes in cervical and breast cancer screening recommendations and was therefore scored based on prior recommendations. Given that the goal was to assess knowledge and barriers, results are not expected to differ greatly if they are scored using the newer guidelines.
Conclusion
Findings from this cross-sectional survey indicate high levels of knowledge among TRICARE West Region beneficiaries regarding when and how often screening for breast cancer, cervical cancer, and CRC should occur. To encourage TRICARE beneficiaries to seek and obtain recommended and covered cancer screenings, further efforts are needed, including more education about the importance of screening and how to obtain screening. The survey results suggest that TRICARE Prime beneficiaries view cancer screening as important for overall health but they require (and also may desire) more frequent scheduling reminders, education, and more options for scheduling. Newer modalities for communicating with beneficiaries, such as automated telephone appointment reminders, reminder texts, online appointment scheduling, educational blogs, podcasts on cancer screening, extended appointment hours, or unconventional strategies to bundle screening services, are tools that could be used by providers to achieve greater compliance with cancer screening recommendations.
Author Disclosure
The authors report no actual or potential conflicts of interest with regard to this article.
Disclaimer
The opinions expressed herein are those of the authors and do not necessarily reflect those of Federal Practitioner, Frontline Medical Communications Inc., the U.S. Government, or any of its agencies.
Click here to read the digital edition.
1. TRICARE. TRICARE policy manual 6010.57-M. http://manuals.tricare.osd.mil/pages/DisplayManualaspx?SeriesId=POLICY. Published February 1, 2008. Accessed March 9, 2017.
2. National Committee for Quality Assurance. 2013 accreditation benchmarks and thresholds—mid-year update. http://www.ncqa.org/Portals/0/PolicyUpdates/Trending %20and%20Benchmarks/archives/2013_BENCHMARKS ANDTHRESHOLDS_for%20MidYear%20Update_Final.pdf. Published July 24, 2013. Accessed March 9, 2017.
3. U.S. Preventative Services Task Force. Archived final recommendation statement: breast cancer: screening, 2002. https://www.uspreventiveservicestaskforce.org/Page/Document/RecommendationStatementFinal/breast-cancer-screening-2002. Published December 30, 2013. Accessed March 9, 2017.
4. Smith RA, Saslow D, Sawyer KA, et al; American Cancer Society High-Risk Work Group; American Cancer Society Screening Older Women Work Group; American Cancer Society Mammography Work Group; American Cancer Society Physical Examination Work Group; American Cancer Society New Technologies Work Group; American Cancer Society Breast Cancer Advisory Group. American Cancer Society guidelines for breast cancer screening: update 2003. CA Cancer J Clin. 2003;53(3):141-169.
5. Moyer VA; U.S. Preventive Services Task Force. Screening for cervical cancer: U.S. Preventive Services Task Force recommendation statement. Ann Intern Med. 2012;156(12):880-891, W312.
6. U.S. Preventive Services Task Force. Archived: colorectal cancer: screening. https://www.uspreventiveservicestaskforce.org/Page/Document/UpdateSummaryFinal/colorectal-cancer-screening. Published October 2008. Accessed March 9, 2017.
7. George SA. Barriers to breast cancer screening: an integrative review. Health Care Women Int. 2000;21(1):53-65.
8. Gierisch JM, O’Neill SC, Rimer BK, DeFrank JT, Bowling JM, Skinner CS. Factors associated with annual-interval mammography for women in their 40s. Cancer Epidemiol. 2009;33(1):72-78.
9. Peppercorn J, Houck K, Beri N, et al. Breast cancer screening utilization and understanding of current guidelines among rural U.S. women with private insurance. Breast Cancer Res Treat. 2015;153(3):659-667.
10. Sarma EA. Barriers to screening mammography. Health Psychol Rev. 2015;9(1):42-62.
11. Hawkins NA, Benard VB, Greek A, Roland KB, Manninen D, Saraiya M. Patient knowledge and beliefs as barriers to extending cervical cancer screening intervals in federally qualified health centers. Prev Med. 2013;57(5):641-645.
12. Hawkins NA, Cooper CP, Saraiya M, Gelb CA, Polonec L. Why the Pap test? Awareness and use of the Pap test among women in the United States. J Womens Health (Larchmt). 2011;20(4):511-515.
13. Decker KM, Turner D, Demers AA, Martens PJ, Lambert P, Chateau D. Evaluating the effectiveness of cervical cancer screening invitation letters. J Womens Health (Larchmt). 2013;22(8):687-693.
14. Yao X, Dembe AE, Wickizer T, Lu B. Does time pressure create barriers for people to receive preventive health services? Prev Med. 2015;74:55-58.
15. Geiger TM, Miedema BW, Geana MV, Thaler K, Rangnekar NJ, Cameron GT. Improving rates for screening colonoscopy: analysis of the Health Information National Trends Survey (HINTS I) data. Surgical Endoscopy. 2008;22(2):527-533.
16. Greisinger A, Hawley ST, Bettencourt JL, Perz CA, Vernon SW. Primary care patients’ understanding of colorectal cancer screening. Cancer Detect Prev. 2006;30(1):67-74.
17. Janz NK, Wren PA, Schottenfeld D, Guire KE. Colorectal cancer screening attitudes and behavior: a populationbased study. Prev Med. 2003;37(6, pt 1):627-634.
18. Klabunde CN, Schenck AP, Davis WW. Barriers to colorectal cancer screening among Medicare consumers. Am J Prev Med. 2006;30(4):313-319.
19. Klabunde CN, Vernon SW, Nadel MR, Breen N, Seeff LC, Brown ML. Barriers to colorectal cancer screening: a comparison of reports from primary care physicians and average-risk adults. Med Care. 2005;43(9):939-944.
20. Berkowitz Z, Hawkins NA, Peipins LA, White MC, Nadel MR. Beliefs, risk perceptions, and gaps in knowledge as barriers to colorectal cancer screening in older adults. J Am Geriatr Soc. 2008;56(2):307-314.
21. Pew Research Center. Assessing the representativeness of public opinion surveys. http://www.people-press.org/2012/05/15/assessing-the-representativeness-of-public-opinion-surveys/. Published May 15, 2012. Accessed March 9, 2017.
The National Defense Appropriations Act for fiscal year 2009, Subtitle B, waived copayments for preventive cancer screening services for all TRICARE beneficiaries, excluding Medicare-eligible beneficiaries.1 These preventive services include screening for colorectal cancer (CRC), breast cancer, and cervical cancer based on current guidelines (eAppendix1).
Despite having unrestricted access to these cancer screenings, TRICARE Prime beneficiaries report overall screening completion rates that are below the national commercial benchmarks established by the Healthcare Effectiveness Data and Information Set (HEDIS) for all 3 cancer types.2 Specifically, among TRICARE Prime beneficiaries enrolled in the western region of the U.S. in October 2013, the reported breast cancer screening rate was 61.6% (43,138/69,976) for women aged 42 to 69 years, which is well below the HEDIS 75th percentile of 76%. Similarly, the reported rate of cervical cancer screening among women aged 24 to 64 years was 68.3% (63,523/92,946), well below the HEDIS 75th percentile of 79%. Last, the reported rate of CRC screening among male and female TRICARE Prime members aged 51 to 75 years was 61.6% (52,860/85,827), also below the 2013 HEDIS 75th percentile of 63% based on internal review of TRICARE data used for HEDIS reporting.
Given the reported low screening rates, the Defense Health Agency (DHA) performed a cross-sectional survey to assess TRICARE Prime West region beneficiaries’ knowledge and understanding of preventive health screening, specifically for breast cancer, cervical cancer, and CRC, and to identify any potential barriers to access for these screenings.
Methods
A mostly closed-ended, 42-item telephone survey was designed and conducted (eAppendix2)
All women participating in the survey, regardless of age, were asked questions regarding cervical cancer screening. Women aged ≥ 42 years additionally were asked a second set of survey questions specific to breast cancer screening, and women aged between 51 and 64 years were asked a third set of questions related to CRC screening. The ages selected were 1 to 2 years after the recommended age for the respective screening to ensure adequate follow-up time for the member to obtain the screening. Men included in the survey were asked questions related only to CRC screening.
The target survey sample was 3,500 beneficiaries, separated into the following 4 strata: women aged 21 to 64 years of age enrolled in the direct care system (n = 1,250); women aged 21 to 64 years enrolled in the purchased (commercial) care network (n = 1,250); men aged 51 to 64 years enrolled in the direct care system (n = 500); and men aged 51 to 64 years enrolled in the purchased care network (n = 500). The random sample was drawn from an overall population of about 35,000 members. Sampling was performed without replacement until the target number of surveys was achieved. Survey completion was defined as the respondent having reached the end of the survey questionnaire but not necessarily having answered every question.
Data Elements
The preventive health survey collected information on beneficiaries’ knowledge of and satisfaction with their PCM, the primary location where they sought health care in the previous 12 months, preference for scheduling cancer screening tests, and general knowledge about the frequency and type of screening for breast, cervical, and colorectal cancers. Responses were scored based on guidelines effective as of 2009. In addition, the survey collected information on the beneficiary’s overall health status, current age, highest level of education achieved, current employment status, place of residence (on or off a military installation), race, and whether the beneficiary carried other health insurance aside from TRICARE.
Survey Mode and Fielding
A sampling population of eligible beneficiaries was created from a database of all TRICARE Prime beneficiaries. An automated system was used to randomly draw potential participants from the sample. Survey interviewers were given the beneficiary’s name and telephone number but no other identifiable information. Phone numbers from the sample were dialed up to 6 times before the number was classified as a “no answer.” Interviewers read to each beneficiary a statement describing the survey and participation risk and benefits and explained that participation was voluntary and the participant could end the survey at any time without penalty or prejudice. The survey commenced only after verbal consent was obtained.
Sample Weighting and Statistical Analysis
Each survey record was weighted to control for potential bias associated with unequal rates of noncoverage and nonresponse in the sampled population. A design weight was calculated as the ratio of the frame size and the sample size in each stratum. For each stratum, an adjusted response rate (RR) was calculated as the number of completed surveys divided by the number of eligible respondents. Since all respondents were eligible, the RR was not adjusted. The ratio of the design weight to the adjusted RR was calculated and assigned to each survey.
Frequency distributions and descriptive statistics were calculated for all close-ended survey items. Open-ended survey items were summarized and assessed qualitatively. When appropriate, open-ended responses were categorized and included in descriptive analyses. No formal statistical testing was performed.
Results
A total of 6,563 beneficiaries were contacted, and 3,688 agreed to participate (56%), resulting in 3,500 TRICARE beneficiaries completing the survey (95% completion rate), of whom 71% (2,500) were female. The overall cooperation rates were similar across the 4 strata. Interviews ceased once 3,500 surveys were completed. The largest distribution of respondents was aged between 55 and 64 years (37%) (Table 1). Respondents aged 21 to 24 years comprised the smallest percentage of the sample (7%). Nearly a third of respondents were dependents of ADSMs (30%), another 30% were retirees, and most respondents self-identified as white (Table 1).
Barriers to Screening
A series of survey questions was asked about specific barriers to cancer screening, including the convenience of appointment times for the respondent’s last cancer screening. The majority (69%, 2,415 of 3,500) responded that the appointment times were convenient. Among those who stated that times were not convenient and those who had not scheduled an examination, 66% responded that they did not know or were not sure how to schedule a cancer screening test.
Screening Preferences
Less than half of survey respondents (48%) reported that they received screening guideline information from their physician or provider; 24% reported that they performed their own research. Only 9% reported that they learned about the guidelines through TRICARE materials, and 7% of respondents indicated that media, family, or friends were their source of screening information.
The survey respondents who indicated that they had not scheduled a screening examination were asked when (time of day) they preferred to have a screening. Less than half (47%) reported that varying available appointment times would not affect their ability to obtain screening. One-quarter preferred times for screening during working hours, 20% preferred times after working hours, 6% preferred times before working hours, and 2% responded that they were unsure or did not know. The majority (89%) reported that they would prefer to receive all available screenings on the same day if possible.
Breast Cancer Screening
Nearly all (98%) of the 1,100 women aged between 42 and 64 years reported having received a mammogram. These women were asked a specific subset of questions related to breast cancer screening. Respondents were asked to state the recommended age at which women should begin receiving mammogram screenings. More than half (55%) provided the correct response (40 years old, per the U.S. Preventive Services Task Force guidelines).3,4 About three-quarters of respondents (789) correctly responded annually to the question regarding how often women should receive mammograms.
The survey also sought to identify barriers that prevented women from obtaining necessary breast cancer screening. However, the majority surveyed (85%) noted that the question was not applicable because they typically scheduled screening appointments. Only a few (3%) reported factors such as either themselves or someone they know having had a negative experience, discomfort, pain, or concerns of a falsepositive result as reasons for not obtaining breast cancer screening. Of the 112 respondents to the open-ended question, 25% reported that their schedules prevented them from scheduling a mammogram in the past; 12% reported that an inconvenient clinic location, appointment time, or process prevented them from receiving a screening; and 13% reported forgetting to schedule the screening (Table 2).
Cervical Cancer Screening
Female respondents aged between 21 and 64 years (n = 2,432) were asked about the recommended age at which women should begin receiving cervical cancer screening. Only 1% of respondents provided the correct response (that screening begins at 21 years of age per the U.S. Preventive Services Task Force Report guidelines), while 88% provided an incorrect response, and 11% were unsure or did not provide any response.5 Among all respondents, 98% reported having had a cervical cancer screening.
Respondents were asked how frequently women should have a Papanicolaou (Pap) test. Responses such as “2 to 3 years,” “2 years,” or “every other year” were labeled as correct, whereas responses such as “every 6 months” or “greater than 3 years” were labeled as incorrect. Just 12% of respondents provided a correct response, whereas 86% answered incorrectly, and 2% did not answer or did not know. Of those who answered incorrectly, the most common response was “annually” or “every year,” with no notable differences according to race, age, or beneficiary category.
To better understand barriers to screening, respondents were asked to identify reasons they might not have sought cervical cancer screening. The majority (84%) reported that they typically scheduled appointments and that the question was not applicable. However, among 228 respondents who provided an open-ended response and who had not previously undergone a hysterectomy, 8% stated that they had received no reminder or that they lacked sufficient information to schedule the appointment, 21% forgot to schedule, 18% reported a scheduling conflict or difficulty in receiving care, and 13% noted that they did not believe in annual screening (Table 2).
Colorectal Cancer Screening
Eighty-seven percent of eligible respondents (n = 1,734) reported having ever had a sigmoidoscopy and/or colonoscopy. Respondents were asked for their understanding of the recommended age for men and women to begin CRC screening.6 Nearly three-quarters of respondents provided a correct response (n = 1,225), compared with 23% of respondents (n = 407) who answered incorrectly and 6% (n = 102) who did not provide a response or stated they did not know. Correct responses were numerically higher among white respondents (73%) compared with black (62%) and other (62%) respondents as well as among persons aged < 60 years (73%) vs those aged > 60 years (67%).
Respondents aged between 51 and 64 years were asked how often the average person should receive colon cancer screenings. The most common response was that screening should occur every 5 years (33%) followed by every 10 years (26%). This aligns with the U.S. Preventive Services Task Force’s recommendations for flexible sigmoidoscopy every 5 years or colonoscopy every 10 years.
Eligible respondents were asked to identify reasons they did not seek CRC screening. Eighty-six percent of respondents indicated that they typically scheduled CRC screening and that the question was not applicable. Among respondents who provided an open-ended response, 26% cited feeling uncomfortable with the procedure, 15% cited forgetting to schedule a screening, 15% noted a lack of information on screening, and 11% reported no need for screening (Table 2). Among the 1,734 respondents, 80% reported that they would prefer a fecal occult blood test (FOBT) over either a colonoscopy or a sigmoidoscopy. Only 51% reported that their PCM had previously discussed the different types of CRC screenings at some point.
Discussion
The purpose of this large, representative survey was to obtain information on beneficiaries’ knowledge, perceived barriers, and beliefs regarding breast, cervical, and colorectal cancer screenings to identify factors contributing to low completion rates. As far as is known, this is the first study to address these questions in a TRICARE population. Overall, the findings suggest that beneficiaries consider cancer screening important, largely relying on their PCM or their research to better understand how and when to obtain such screenings. The majority received 1 or more screenings prior to the survey, but there were some common knowledge gaps about how to schedule screening appointments, relevant TRICARE medical benefits, and the current recommendations regarding screening timing and frequency. A commonly reported issue across all surveyed groups was inconvenient screening times.
More than half (55%) of respondents correctly noted that breast cancer screening begins at age 40 years (based on recommendations at the time the survey was conducted), and 72% understood when screening should occur. Despite access to care, inconvenient schedules and testing locations were considered the biggest barriers to regularly obtaining a mammogram. There are few studies on knowledge of breast cancer screening in an insured population available for comparison.7-10 One study of medically insured black and non-Hispanic women aged 43 to 49 years showed that lack of reminders or knowledge about the need for mammograms, cost, being too busy, and forgetting to schedule appointments were all factors associated with nonadherence to repeat mammography examinations.8 In an integrative review published in 2000, authors cited that among 8 of 13 relevant studies, the major barrier to receiving a recommended mammogram was lack of physician recommendation.7
For cervical cancer screening, few respondents (1%) correctly identified the age for initiation of screening, and just 12% correctly identified the frequency of screening. These findings are consistent with those of other studies, suggesting a general misunderstanding
about Pap tests in the U.S. and among low-income women.11,12 Reported barriers to screening were uncommon but included scheduling conflicts and lack of reminders or information and were consistent with barriers cited in prior studies.13,14 A few respondents (13%) noted that they did not believe in annual screening, which is similar to the findings of Decker and colleagues who cited lack of knowledge about the test and belief that screening is of no benefit as reasons for failure to get a recommended Pap test.13 These findings suggest a need to improve patientprovider communication and to provide more patient educational materials about the importance of cervical cancer screening.
A large proportion (71%) gave the correct response regarding the appropriate age to initiate CRC screening. Discomfort with the procedure, belief that the screening is unnecessary, or lack of physician’s recommendation were noted barriers to CRC screening. These findings are similar to those reported elsewhere in non-TRICARE populations.15-20 Two focus groups included participants with little knowledge about CRC screening, such as risk factors and symptoms, and expressed fear and embarrassment about CRC and screening. Few of the focus group participants were aware of the available options for screening, and some were confused about the purpose and benefits of the various screening modalities.16
A Health Information National Trends survey reported that 24% participants had not received a colonoscopy or a sigmoidoscopy because their PCM did not order it or say that it was necessary.15 The reported perceived barriers included fear of an adverse finding, injury to the colon from screening, and embarrassment. A study performed in 1,901 Medicare-insured individuals with no history of CRC cited lack of knowledge/awareness and no physician order as the most common reasons for not undergoing CRC screening.18
Strengths and Limitations
A major strength of the current survey is the 56% completion rate, which far exceeds other survey participation rates that were as low as 9%.21 A second strength is the scope of the survey to capture information on not 1 but 3 different cancer screening practices in a unique population who receive preventive screenings at low to no cost.
There are a few study limitations. The majority of respondents identified as white (80%), which does not fully align with the racial distribution of the TRICARE Prime population in the West Region, which is about 68% white. This higher proportion of white respondents may affect the ability to generalize findings to other populations. However, given the open access to care, race should not be a major factor contributing to screening decisions. Another potential limitation to the generalizability of the study is that the age of the respondents was capped at 64 years. Considering that some of the reported barriers to screening were “too busy” or “scheduling conflict,” a study population that included respondents aged ≥ 65 years (who might be more likely to be retired) might report lower rates of these schedule-related barriers.
A third limitation is that most questions about prior screenings pertained to any time in the past, and, therefore, limited the ability to identify current factors leading to lower screening rates. Last, the survey was developed prior to the 2012 changes in cervical and breast cancer screening recommendations and was therefore scored based on prior recommendations. Given that the goal was to assess knowledge and barriers, results are not expected to differ greatly if they are scored using the newer guidelines.
Conclusion
Findings from this cross-sectional survey indicate high levels of knowledge among TRICARE West Region beneficiaries regarding when and how often screening for breast cancer, cervical cancer, and CRC should occur. To encourage TRICARE beneficiaries to seek and obtain recommended and covered cancer screenings, further efforts are needed, including more education about the importance of screening and how to obtain screening. The survey results suggest that TRICARE Prime beneficiaries view cancer screening as important for overall health but they require (and also may desire) more frequent scheduling reminders, education, and more options for scheduling. Newer modalities for communicating with beneficiaries, such as automated telephone appointment reminders, reminder texts, online appointment scheduling, educational blogs, podcasts on cancer screening, extended appointment hours, or unconventional strategies to bundle screening services, are tools that could be used by providers to achieve greater compliance with cancer screening recommendations.
Author Disclosure
The authors report no actual or potential conflicts of interest with regard to this article.
Disclaimer
The opinions expressed herein are those of the authors and do not necessarily reflect those of Federal Practitioner, Frontline Medical Communications Inc., the U.S. Government, or any of its agencies.
Click here to read the digital edition.
1. TRICARE. TRICARE policy manual 6010.57-M. http://manuals.tricare.osd.mil/pages/DisplayManualaspx?SeriesId=POLICY. Published February 1, 2008. Accessed March 9, 2017.
2. National Committee for Quality Assurance. 2013 accreditation benchmarks and thresholds—mid-year update. http://www.ncqa.org/Portals/0/PolicyUpdates/Trending %20and%20Benchmarks/archives/2013_BENCHMARKS ANDTHRESHOLDS_for%20MidYear%20Update_Final.pdf. Published July 24, 2013. Accessed March 9, 2017.
3. U.S. Preventative Services Task Force. Archived final recommendation statement: breast cancer: screening, 2002. https://www.uspreventiveservicestaskforce.org/Page/Document/RecommendationStatementFinal/breast-cancer-screening-2002. Published December 30, 2013. Accessed March 9, 2017.
4. Smith RA, Saslow D, Sawyer KA, et al; American Cancer Society High-Risk Work Group; American Cancer Society Screening Older Women Work Group; American Cancer Society Mammography Work Group; American Cancer Society Physical Examination Work Group; American Cancer Society New Technologies Work Group; American Cancer Society Breast Cancer Advisory Group. American Cancer Society guidelines for breast cancer screening: update 2003. CA Cancer J Clin. 2003;53(3):141-169.
5. Moyer VA; U.S. Preventive Services Task Force. Screening for cervical cancer: U.S. Preventive Services Task Force recommendation statement. Ann Intern Med. 2012;156(12):880-891, W312.
6. U.S. Preventive Services Task Force. Archived: colorectal cancer: screening. https://www.uspreventiveservicestaskforce.org/Page/Document/UpdateSummaryFinal/colorectal-cancer-screening. Published October 2008. Accessed March 9, 2017.
7. George SA. Barriers to breast cancer screening: an integrative review. Health Care Women Int. 2000;21(1):53-65.
8. Gierisch JM, O’Neill SC, Rimer BK, DeFrank JT, Bowling JM, Skinner CS. Factors associated with annual-interval mammography for women in their 40s. Cancer Epidemiol. 2009;33(1):72-78.
9. Peppercorn J, Houck K, Beri N, et al. Breast cancer screening utilization and understanding of current guidelines among rural U.S. women with private insurance. Breast Cancer Res Treat. 2015;153(3):659-667.
10. Sarma EA. Barriers to screening mammography. Health Psychol Rev. 2015;9(1):42-62.
11. Hawkins NA, Benard VB, Greek A, Roland KB, Manninen D, Saraiya M. Patient knowledge and beliefs as barriers to extending cervical cancer screening intervals in federally qualified health centers. Prev Med. 2013;57(5):641-645.
12. Hawkins NA, Cooper CP, Saraiya M, Gelb CA, Polonec L. Why the Pap test? Awareness and use of the Pap test among women in the United States. J Womens Health (Larchmt). 2011;20(4):511-515.
13. Decker KM, Turner D, Demers AA, Martens PJ, Lambert P, Chateau D. Evaluating the effectiveness of cervical cancer screening invitation letters. J Womens Health (Larchmt). 2013;22(8):687-693.
14. Yao X, Dembe AE, Wickizer T, Lu B. Does time pressure create barriers for people to receive preventive health services? Prev Med. 2015;74:55-58.
15. Geiger TM, Miedema BW, Geana MV, Thaler K, Rangnekar NJ, Cameron GT. Improving rates for screening colonoscopy: analysis of the Health Information National Trends Survey (HINTS I) data. Surgical Endoscopy. 2008;22(2):527-533.
16. Greisinger A, Hawley ST, Bettencourt JL, Perz CA, Vernon SW. Primary care patients’ understanding of colorectal cancer screening. Cancer Detect Prev. 2006;30(1):67-74.
17. Janz NK, Wren PA, Schottenfeld D, Guire KE. Colorectal cancer screening attitudes and behavior: a populationbased study. Prev Med. 2003;37(6, pt 1):627-634.
18. Klabunde CN, Schenck AP, Davis WW. Barriers to colorectal cancer screening among Medicare consumers. Am J Prev Med. 2006;30(4):313-319.
19. Klabunde CN, Vernon SW, Nadel MR, Breen N, Seeff LC, Brown ML. Barriers to colorectal cancer screening: a comparison of reports from primary care physicians and average-risk adults. Med Care. 2005;43(9):939-944.
20. Berkowitz Z, Hawkins NA, Peipins LA, White MC, Nadel MR. Beliefs, risk perceptions, and gaps in knowledge as barriers to colorectal cancer screening in older adults. J Am Geriatr Soc. 2008;56(2):307-314.
21. Pew Research Center. Assessing the representativeness of public opinion surveys. http://www.people-press.org/2012/05/15/assessing-the-representativeness-of-public-opinion-surveys/. Published May 15, 2012. Accessed March 9, 2017.
Liposomal Bupivacaine vs Interscalene Nerve Block for Pain Control After Shoulder Arthroplasty: A Retrospective Cohort Analysis
The annual number of total shoulder arthroplasties (TSAs) is rising with the growing elderly population and development of new technologies such as reverse shoulder arthroplasty.1 In 2008, 47,000 shoulder arthroplasties were performed in the US compared with 19,000 in 1998.1 As of 2011, there were 53,000 shoulder arthroplasties performed annually.2 Pain control after shoulder procedures, particularly TSA, is challenging. 3
Several modalities exist to manage pain after shoulder arthroplasty. The interscalene brachial plexus nerve block is considered the “gold standard” for shoulder analgesia. A new approach is the periarticular injection method, in which the surgeon administers a local anesthetic intraoperatively. Liposomal bupivacaine (Exparel, Pacira Pharmaceuticals, Inc.) is a nonopioid anesthetic that has been shown to improve pain control, shorten hospital stays, and decrease costs for total knee and hip arthroplasty compared with nerve blocks.4-6 Patients who were treated with liposomal bupivacaine consumed less opioid medication than a placebo group.7
Our purpose was to compare intraoperative local liposomal bupivacaine injection with preoperative single-shot interscalene nerve block (ISNB) in terms of pain control, opioid use, and length of hospital stay (LOS) after shoulder arthroplasty. We hypothesized that patients in the liposomal bupivacaine group would have lower pain scores, less opioid use, and shorter LOS compared with patients in the ISNB group.
Methods
A retrospective cohort analysis was conducted with 58 patients who underwent shoulder arthroplasty by 1 surgeon at our academically affiliated community hospital from January 2012 through January 2015. ISNBs were the standard at the beginning of the study period and were used until Exparel became available on the hospital formulary in 2013. We began using Exparel for all shoulder arthroplasties in November 2013. No other changes were made in the perioperative management of our arthroplasty patients during this period. Patients who underwent TSA, reverse TSA, or hemiarthroplasty of the shoulder were included. Patients who underwent revision TSA were excluded. Twenty-one patients received ISNBs and 37 received liposomal bupivacaine injections. This study was approved by our Institutional Review Board.
Baseline data for each patient were age, sex, body mass index, and the American Society of Anesthesiologists (ASA) Physical Status Classification. The primary outcome measure was the numeric rating scale (NRS) pain score at 4 post-operative time intervals. The NRS pain score has a range of 0 to 10, with 10 representing severe pain. Data were gathered from nursing and physical therapy notes in patient charts. The postoperative time intervals were 0 to 1 hour, 8 to 14 hours, 18 to 24 hours, and 27 to 36 hours. Available NRS scores for these time intervals were averaged. Patients were included if they had pain scores for at least 3 of the postoperative time intervals documented in their charts. Secondary outcome measures were LOS and opioid consumption during hospital admission. Intravenous acetaminophen use was also measured in both groups. All data on opioids were converted to oral morphine equivalents using the method described by Schneider and colleagues.8
A board-certified, fellowship-trained anesthesiologist, experienced in regional anesthesia, administered the single-shot ISNB before surgery. The block was administered under ultrasound guidance using a 44-mm, 22-gauge needle with the patient in the supine position. No indwelling catheter was used. The medication consisted of 30 mL of 5% ropivacaine (5 mg/mL). The surgeon injected liposomal bupivacaine (266 mg diluted into 40 mL of injectable saline) near the end of the procedure throughout the pericapsular area and multiple layers of the wound, per manufacturer guidelines.9 A 60-mL syringe with a 20-gauge needle was used. All operations were performed by 1 board-certified, fellowship-trained surgeon using a standard deltopectoral approach with the same surgical equipment. The same postoperative pain protocol was used for all patients, including intravenous acetaminophen and patient-controlled analgesia. Additional oral pain medication was provided as needed for all patients. Physical therapy protocols were identical between groups.
Statistical Analysis
Mean patient ages in the 2 treatment groups were compared using the Student t test. Sex distribution and the ASA scores were compared using a χ2 test and a Fisher exact test, respectively. Arthroplasty types were compared using a Fisher exact test. The medians and interquartile ranges of the NRS scores at each time point measured were tabulated by treatment group, and at each time point the difference between groups was tested using nonparametric rank sum tests.
We tested the longitudinal trajectory of NRS scores over time, accounting for repeated measurements in the same patients using linear mixed model analysis. Treatment group, time period as a categorical variable, and the interaction between treatment and time period were included as fixed effects, and patient identification number was included as the random effect. An initial omnibus test was performed for all treatment and treatment-by-time interaction effects. Subsequently, the treatment-by-time interaction was tested for each of the time periods. The association of day of discharge (as a categorical variable) with treatment was tested using the Fisher exact test. All analyses were conducted using Stata, version 13, software (StataCorp LP). P values <.05 were considered significant.
Sample Size Analysis
We calculated the minimum detectable effect size with 80% power at an alpha level of 0.05 for the nonparametric rank sum test in terms of the proportion of every possible pair of patients treated with the 2 treatments, where the patient treated with liposomal bupivacaine has a lower pain score than the patient treated with ISNB. For pain score at 18 to 24 hours, the sample sizes of 33 patients treated with liposomal bupivacaine and 20 treated with ISNB, the minimum detectable effect size is 73%.
Results
Fifty-eight patient charts (21 in the ISNB group and 37 in the liposomal bupivacaine group) were reviewed for the study. Patient sex distribution, mean age, mean body mass index, and mean baseline ASA scores were not statistically different (Table 1). 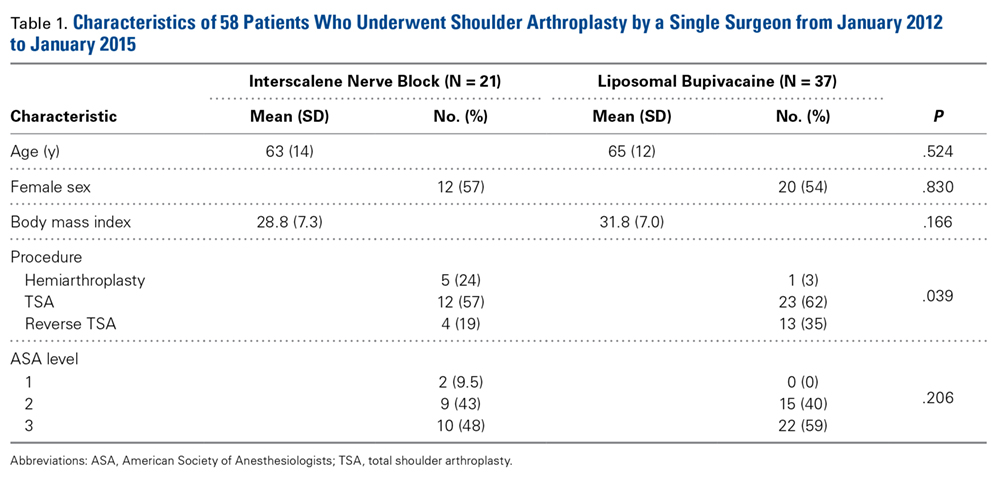
The primary outcome measure, NRS pain score, showed no significant differences between groups at 0 to 1 hour after surgery (P = .99) or 8 to 14 hours after surgery (P = .208). 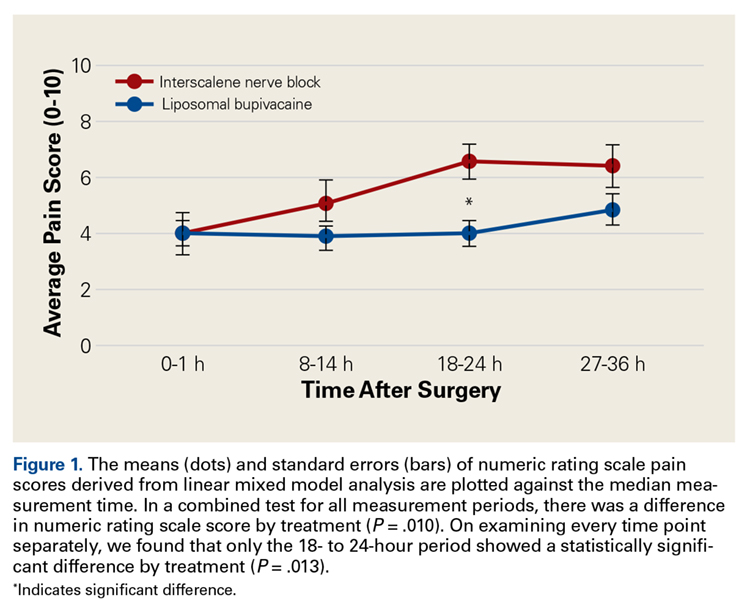
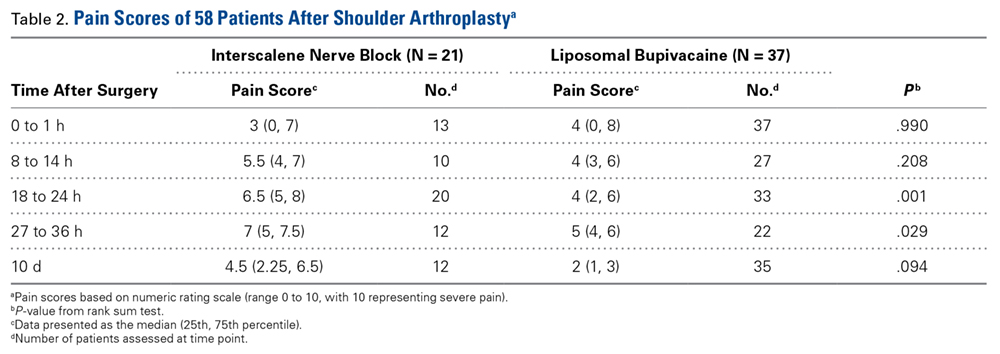
There was no difference in the amount of intravenous acetaminophen given during the hospital stay between groups. There was no significant difference in opioid consumption on postoperative day 1 in the hospital (P = .59) (Figure 2). However, there were significant differences between groups on postoperative days 2 and 3. 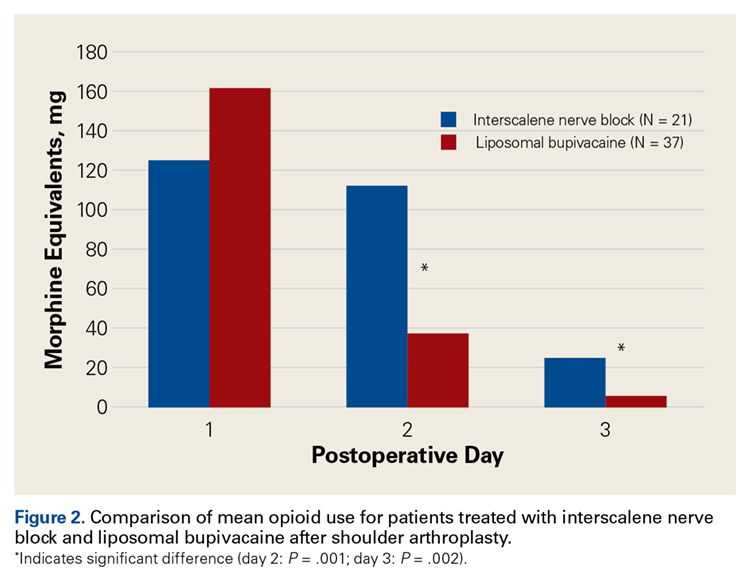
Sixteen of 37 patients in the liposomal bupivacaine group and 2 of 21 in the ISNB group were discharged on the day after surgery (P = .010) (Table 3). 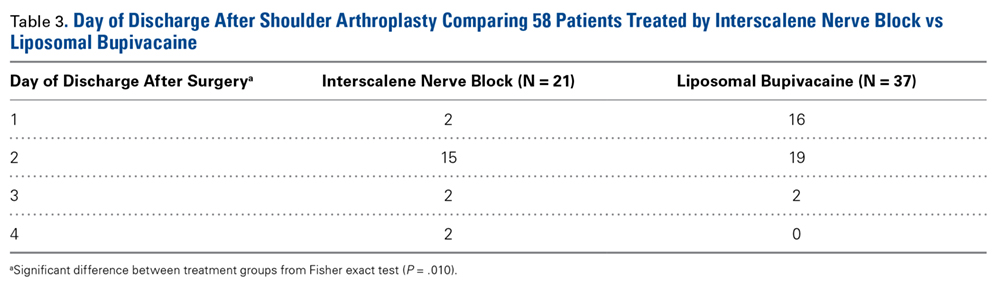
There were no major cardiac or respiratory events in either group. No long-term paresthesias or neuropathies were noted. There were no readmissions for either group.
Discussion
Postoperative pain control after shoulder arthroplasty can be challenging, and several modalities have been tried in various combinations to minimize pain and decrease adverse effects of opioid medications. The most common method for pain relief after shoulder arthroplasty is the ISNB. Several studies of ISNBs have shown improved pain control after shoulder arthroplasty with associated decreased opioid consumption and related side effects.10 Patient rehabilitation and satisfaction have improved with the increasing use of peripheral nerve blocks.11
Despite the well-established benefits of ISNBs, several limitations exist. Although the superior portion of the shoulder is well covered by an ISNB, the inferior portion of the brachial plexus can remain uncovered or only partially covered.12 Complications of ISNBs include hemidiaphragmatic paresis, rebound pain 24 hours after surgery,13 chronic neurologic complications,14 and substantial respiratory and cardiovascular events.15 Nerve blocks also require additional time and resources in the perioperative period, including an anesthesiologist with specialized training, assistants, and ultrasonography or nerve stimulation equipment contraindicated in patients taking blood thinners.16
Periarticular injections of local anesthetics have also shown promise in reducing pain after arthroplasty.4 Benefits include an enhanced safety profile because local injection avoids the concurrent blockade of the phrenic nerve and recurrent laryngeal nerve and has not been associated with the risk of peripheral neuropathies. Further, local injection is a simple technique that can be performed during surgery without additional personnel or expertise. A limitation of this approach is the relatively short duration of effectiveness of the local anesthetic and uncertainty regarding the best agent and the ideal volume of injection.6 Liposomal bupivacaine is a new agent (approved by the US Food and Drug Administration in 201117) with a sustained release over 72 to 96 hours.18 The most common adverse effects of liposomal bupivacaine are nausea, vomiting, constipation, pyrexia, dizziness, and headache.19 Chondrotoxicity and granulomatous inflammation are more serious, yet rare, complications of liposomal bupivacaine.20
We found that liposomal bupivacaine injections were associated with lower pain scores compared with ISNB at 18 to 24 hours after surgery. This correlated with less opioid consumption in the liposomal bupivacaine group than in the ISNB group on the second postoperative day. These differences in pain values are consistent with the known pharmacokinetics of liposomal bupivacaine.18 Peak plasma levels normally occur approximately 24 hours after injection, leaving the early postoperative period relatively uncovered by anesthetic agent. This finding of relatively poor pain control early after surgery has also been noted in patients undergoing knee arthroplasty.5 On the basis of the findings of this study, we have added standard bupivacaine injections to our separate liposomal bupivacaine injection to cover early postoperative pain. Opioid consumption was significantly lower in the liposomal bupivacaine group than in the ISNB group on postoperative days 2 and 3. We did not measure adverse events related to opioid consumption, so we cannot comment on whether the decreased opioid consumption was associated with the rate of adverse events. However, other studies21,22 have established this relationship.
We found the liposomal bupivacaine group to have earlier discharges to home. Sixteen of 37 patients in the liposomal bupivacaine group compared with 2 of 21 patients in the ISNB group were discharged on the day after surgery. A mean reduction in LOS of 18 hours for the liposomal bupivacaine group was statistically significant (P = .012). This reduction in LOS has important implications for hospitals and value analysis committees considering whether to keep a new, more expensive local anesthetic on formulary. Savings from reduced LOS and improvements in patient satisfaction may justify the expense (approximately $300 per 266-mg vial) of Exparel.
From a societal cost perspective, liposomal bupivacaine is more economical compared with ISNB, which adds approximately $1500 to the cost of anesthesia per patient.23 Eliminating the costs associated with ISNB administration in shoulder arthroplasties could result in substantial savings to our healthcare system. More research examining time savings and exact costs of each procedure is needed to determine the true cost effectiveness of each approach.
Limitations of our study include the retrospective design, relatively small numbers of patients in each group, missing data for some patients at various time points, variation in the types of procedures in each group, and lack of long-term outcome measures. It is important to note that we did not confirm the success of the nerve block after administration. However, this study reflects the effectiveness of each of the modalities in actual clinical conditions (as opposed to a controlled experimental setting). The actual effectiveness of a nerve block varies, even when performed by an experienced anesthesiologist with ultrasound guidance. Furthermore, immediate postoperative pain scores in the nerve block group are consistent with those of prior research reporting pain values ranging from 4 to 5 and a mean duration of effect ranging from 9 to 14 hours.23,24 Additionally, the patients, surgeon, and nursing team were not blinded to the treatment group. Although we did note a significant difference in the types of procedures between groups, this finding is related to the greater number of hemiarthroplasties performed in the ISNB group (N = 5) compared with the liposomal group (N = 1). Because of this variation and the decreased invasiveness of hemiarthroplasties, the bias is against the liposomal group. Finally, our primary outcome variable was pain, which is a subjective, self-reported measure. However, our opioid consumption data and LOS data corroborate the improved pain scores in the liposomal bupivacaine group.
Limiting the study to a single surgeon may limit external validity. Another limitation is the lack of data on adverse events related to opioid medication use. There was no additional experimental group to determine whether less expensive local anesthetics injected locally would perform similarly to liposomal bupivacaine. In total knee arthroplasty, periarticular injections of liposomal bupivacaine were not as effective as less expensive periarticular injections.25 It is unclear which agents (and in what doses or combinations) should be used for periarticular injections. Finally, we acknowledge that our retrospective study design cannot account for all potential factors affecting discharge time.
This is the first comparative study of liposomal bupivacaine and ISNB in TSA. The study design allowed us to control for variables such as surgical technique, postoperative protocols (including use and type of sling), and use of other pain modalities such as patient-controlled analgesia and intravenous acetaminophen that are likely to affect postoperative pain and LOS. This study provides preliminary data that confirm relative equipoise between liposomal bupivacaine and ISNB, which is needed for the ethical conduct of a randomized controlled trial. Such a trial would allow for a more robust comparison, and this retrospective study provides appropriate pilot data on which to base this design and the clinical information needed to counsel patients during enrollment.
Our results suggest that liposomal bupivacaine may provide superior or similar pain relief compared with ISNB after shoulder arthroplasty. Additionally, the use of liposomal bupivacaine was associated with decreased opioid consumption and earlier discharge to home compared with ISNB. These findings have important implications for pain control after TSA because pain represents a major concern for patients and providers after surgery. In addition to clinical improvements, use of liposomal bupivacaine may save time and eliminate costs associated with administering nerve blocks. Local injection may also be used in patients who are contraindicated for ISNB such as those with obesity, pulmonary disease, or peripheral neuropathy. Although we cannot definitively suggest that liposomal bupivacaine is superior to the current gold standard ISNB for pain control after shoulder arthroplasty, our results suggest a relative clinical equipoise between these modalities. Larger analytical studies, including randomized trials, should be performed to explore the potential benefits of liposomal bupivacaine injections for pain control after shoulder arthroplasty.
Am J Orthop. 2016;45(7):424-430. Copyright Frontline Medical Communications Inc. 2016. All rights reserved.
1. Kim SH, Wise BL, Zhang Y, Szabo RM. Increasing incidence of shoulder arthroplasty in the United States. J Bone Joint Surg Am. 2011;93(24):2249-2254.
2. American Academy of Orthopaedic Surgeons. Shoulder joint replacement. http://orthoinfo.aaos.org/topic.cfm?topic=A00094. Accessed June 3, 2015.
3. Desai VN, Cheung EV. Postoperative pain associated with orthopedic shoulder and elbow surgery: a prospective study. J Shoulder Elbow Surg. 2012;21(4):441-450.
4. Springer BD. Transition from nerve blocks to periarticular injections and emerging techniques in total joint arthroplasty. Am J Orthop. 2014;43(10 Suppl):S6-S9.
5. Surdam JW, Licini DJ, Baynes NT, Arce BR. The use of exparel (liposomal bupivacaine) to manage postoperative pain in unilateral total knee arthroplasty patients. J Arthroplasty. 2015;30(2):325-329.
6. Tong YC, Kaye AD, Urman RD. Liposomal bupivacaine and clinical outcomes. Best Pract Res Clin Anaesthesiol. 2014;28(1):15-27.
7. Chahar P, Cummings KC 3rd. Liposomal bupivacaine: a review of a new bupivacaine formulation. J Pain Res. 2012;5:257-264.
8. Schneider C, Yale SH, Larson M. Principles of pain management. Clin Med Res. 2003;1(4):337-340.
9. Pacira Pharmaceuticals, Inc. Highlights of prescribing information. http://www.exparel.com/pdf/EXPAREL_Prescribing_Information.pdf. Accessed May 7, 2015.
10. Gohl MR, Moeller RK, Olson RL, Vacchiano CA. The addition of interscalene block to general anesthesia for patients undergoing open shoulder procedures. AANA J. 2001;69(2):105-109.
11. Ironfield CM, Barrington MJ, Kluger R, Sites B. Are patients satisfied after peripheral nerve blockade? Results from an International Registry of Regional Anesthesia. Reg Anesth Pain Med. 2014;39(1):48-55.
12. Srikumaran U, Stein BE, Tan EW, Freehill MT, Wilckens JH. Upper-extremity peripheral nerve blocks in the perioperative pain management of orthopaedic patients: AAOS exhibit selection. J Bone Joint Surg Am. 2013;95(24):e197(1-13).
13. DeMarco JR, Componovo R, Barfield WR, Liles L, Nietert P. Efficacy of augmenting a subacromial continuous-infusion pump with a preoperative interscalene block in outpatient arthroscopic shoulder surgery: a prospective, randomized, blinded, and placebo-controlled study. Arthroscopy. 2011;27(5):603-610.
14. Misamore G, Webb B, McMurray S, Sallay P. A prospective analysis of interscalene brachial plexus blocks performed under general anesthesia. J Shoulder Elbow Surg. 2011;20(2):308-314.
15. Lenters TR, Davies J, Matsen FA 3rd. The types and severity of complications associated with interscalene brachial plexus block anesthesia: local and national evidence. J Shoulder Elbow Surg. 2007;16(4):379-387.
16. Park SK, Choi YS, Choi SW, Song SW. A comparison of three methods for postoperative pain control in patients undergoing arthroscopic shoulder surgery. Korean J Pain. 2015;28(1):45-51.
17. Pacira Pharmaceuticals, Inc. Pacira Pharmaceuticals, Inc. announces U.S. FDA approval of EXPAREL™ for postsurgical pain management. http://investor.pacira.com/phoenix.zhtml?c=220759&p=irol-newsArticle_print&ID=1623529. Published October 31, 2011. Accessed June 3, 2015.
18. White PF, Ardeleanu M, Schooley G, Burch RM. Pharmocokinetics of depobupivacaine following infiltration in patients undergoing two types of surgery and in normal volunteers. Paper presented at: Annual Meeting of the International Anesthesia Research Society; March 14, 2009; San Diego, CA.
19. Bramlett K, Onel E, Viscusi ER, Jones K. A randomized, double-blind, dose-ranging study comparing wound infiltration of DepoFoam bupivacaine, an extended-release liposomal bupivacaine, to bupivacaine HCl for postsurgical analgesia in total knee arthroplasty. Knee. 2012;19(5):530-536.
20. Lambrechts M, O’Brien MJ, Savoie FH, You Z. Liposomal extended-release bupivacaine for postsurgical analgesia. Patient Prefer Adherence. 2013;7:885-890.
21. American Society of Anesthesiologists Task Force on Acute Pain Management. Practice guidelines for acute pain management in the perioperative setting: an updated report by the American Society of Anesthesiologists Task Force on Acute Pain Management. Anesthesiology. 2012;116(2):248-273.
22. Candiotti KA, Sands LR, Lee E, et al. Liposome bupivacaine for postsurgical analgesia in adult patients undergoing laparoscopic colectomy: results from prospective phase IV sequential cohort studies assessing health economic outcomes. Curr Ther Res Clin Exp. 2013;76:1-6.
23. Weber SC, Jain R. Scalene regional anesthesia for shoulder surgery in a community setting: an assessment of risk. J Bone Joint Surg Am. 2002;84-A(5):775-779.
24. Beaudet V, Williams SR, Tétreault P, Perrault MA. Perioperative interscalene block versus intra-articular injection of local anesthetics for postoperative analgesia in shoulder surgery. Reg Anesth Pain Med. 2008;33(2):134-138.
25. Bagsby DT, Ireland PH, Meneghini RM. Liposomal bupivacaine versus traditional periarticular injection for pain control after total knee arthroplasty. J Arthroplasty. 2014;29(8):1687-1690.
The annual number of total shoulder arthroplasties (TSAs) is rising with the growing elderly population and development of new technologies such as reverse shoulder arthroplasty.1 In 2008, 47,000 shoulder arthroplasties were performed in the US compared with 19,000 in 1998.1 As of 2011, there were 53,000 shoulder arthroplasties performed annually.2 Pain control after shoulder procedures, particularly TSA, is challenging. 3
Several modalities exist to manage pain after shoulder arthroplasty. The interscalene brachial plexus nerve block is considered the “gold standard” for shoulder analgesia. A new approach is the periarticular injection method, in which the surgeon administers a local anesthetic intraoperatively. Liposomal bupivacaine (Exparel, Pacira Pharmaceuticals, Inc.) is a nonopioid anesthetic that has been shown to improve pain control, shorten hospital stays, and decrease costs for total knee and hip arthroplasty compared with nerve blocks.4-6 Patients who were treated with liposomal bupivacaine consumed less opioid medication than a placebo group.7
Our purpose was to compare intraoperative local liposomal bupivacaine injection with preoperative single-shot interscalene nerve block (ISNB) in terms of pain control, opioid use, and length of hospital stay (LOS) after shoulder arthroplasty. We hypothesized that patients in the liposomal bupivacaine group would have lower pain scores, less opioid use, and shorter LOS compared with patients in the ISNB group.
Methods
A retrospective cohort analysis was conducted with 58 patients who underwent shoulder arthroplasty by 1 surgeon at our academically affiliated community hospital from January 2012 through January 2015. ISNBs were the standard at the beginning of the study period and were used until Exparel became available on the hospital formulary in 2013. We began using Exparel for all shoulder arthroplasties in November 2013. No other changes were made in the perioperative management of our arthroplasty patients during this period. Patients who underwent TSA, reverse TSA, or hemiarthroplasty of the shoulder were included. Patients who underwent revision TSA were excluded. Twenty-one patients received ISNBs and 37 received liposomal bupivacaine injections. This study was approved by our Institutional Review Board.
Baseline data for each patient were age, sex, body mass index, and the American Society of Anesthesiologists (ASA) Physical Status Classification. The primary outcome measure was the numeric rating scale (NRS) pain score at 4 post-operative time intervals. The NRS pain score has a range of 0 to 10, with 10 representing severe pain. Data were gathered from nursing and physical therapy notes in patient charts. The postoperative time intervals were 0 to 1 hour, 8 to 14 hours, 18 to 24 hours, and 27 to 36 hours. Available NRS scores for these time intervals were averaged. Patients were included if they had pain scores for at least 3 of the postoperative time intervals documented in their charts. Secondary outcome measures were LOS and opioid consumption during hospital admission. Intravenous acetaminophen use was also measured in both groups. All data on opioids were converted to oral morphine equivalents using the method described by Schneider and colleagues.8
A board-certified, fellowship-trained anesthesiologist, experienced in regional anesthesia, administered the single-shot ISNB before surgery. The block was administered under ultrasound guidance using a 44-mm, 22-gauge needle with the patient in the supine position. No indwelling catheter was used. The medication consisted of 30 mL of 5% ropivacaine (5 mg/mL). The surgeon injected liposomal bupivacaine (266 mg diluted into 40 mL of injectable saline) near the end of the procedure throughout the pericapsular area and multiple layers of the wound, per manufacturer guidelines.9 A 60-mL syringe with a 20-gauge needle was used. All operations were performed by 1 board-certified, fellowship-trained surgeon using a standard deltopectoral approach with the same surgical equipment. The same postoperative pain protocol was used for all patients, including intravenous acetaminophen and patient-controlled analgesia. Additional oral pain medication was provided as needed for all patients. Physical therapy protocols were identical between groups.
Statistical Analysis
Mean patient ages in the 2 treatment groups were compared using the Student t test. Sex distribution and the ASA scores were compared using a χ2 test and a Fisher exact test, respectively. Arthroplasty types were compared using a Fisher exact test. The medians and interquartile ranges of the NRS scores at each time point measured were tabulated by treatment group, and at each time point the difference between groups was tested using nonparametric rank sum tests.
We tested the longitudinal trajectory of NRS scores over time, accounting for repeated measurements in the same patients using linear mixed model analysis. Treatment group, time period as a categorical variable, and the interaction between treatment and time period were included as fixed effects, and patient identification number was included as the random effect. An initial omnibus test was performed for all treatment and treatment-by-time interaction effects. Subsequently, the treatment-by-time interaction was tested for each of the time periods. The association of day of discharge (as a categorical variable) with treatment was tested using the Fisher exact test. All analyses were conducted using Stata, version 13, software (StataCorp LP). P values <.05 were considered significant.
Sample Size Analysis
We calculated the minimum detectable effect size with 80% power at an alpha level of 0.05 for the nonparametric rank sum test in terms of the proportion of every possible pair of patients treated with the 2 treatments, where the patient treated with liposomal bupivacaine has a lower pain score than the patient treated with ISNB. For pain score at 18 to 24 hours, the sample sizes of 33 patients treated with liposomal bupivacaine and 20 treated with ISNB, the minimum detectable effect size is 73%.
Results
Fifty-eight patient charts (21 in the ISNB group and 37 in the liposomal bupivacaine group) were reviewed for the study. Patient sex distribution, mean age, mean body mass index, and mean baseline ASA scores were not statistically different (Table 1).
The primary outcome measure, NRS pain score, showed no significant differences between groups at 0 to 1 hour after surgery (P = .99) or 8 to 14 hours after surgery (P = .208).
There was no difference in the amount of intravenous acetaminophen given during the hospital stay between groups. There was no significant difference in opioid consumption on postoperative day 1 in the hospital (P = .59) (Figure 2). However, there were significant differences between groups on postoperative days 2 and 3.
Sixteen of 37 patients in the liposomal bupivacaine group and 2 of 21 in the ISNB group were discharged on the day after surgery (P = .010) (Table 3).
There were no major cardiac or respiratory events in either group. No long-term paresthesias or neuropathies were noted. There were no readmissions for either group.
Discussion
Postoperative pain control after shoulder arthroplasty can be challenging, and several modalities have been tried in various combinations to minimize pain and decrease adverse effects of opioid medications. The most common method for pain relief after shoulder arthroplasty is the ISNB. Several studies of ISNBs have shown improved pain control after shoulder arthroplasty with associated decreased opioid consumption and related side effects.10 Patient rehabilitation and satisfaction have improved with the increasing use of peripheral nerve blocks.11
Despite the well-established benefits of ISNBs, several limitations exist. Although the superior portion of the shoulder is well covered by an ISNB, the inferior portion of the brachial plexus can remain uncovered or only partially covered.12 Complications of ISNBs include hemidiaphragmatic paresis, rebound pain 24 hours after surgery,13 chronic neurologic complications,14 and substantial respiratory and cardiovascular events.15 Nerve blocks also require additional time and resources in the perioperative period, including an anesthesiologist with specialized training, assistants, and ultrasonography or nerve stimulation equipment contraindicated in patients taking blood thinners.16
Periarticular injections of local anesthetics have also shown promise in reducing pain after arthroplasty.4 Benefits include an enhanced safety profile because local injection avoids the concurrent blockade of the phrenic nerve and recurrent laryngeal nerve and has not been associated with the risk of peripheral neuropathies. Further, local injection is a simple technique that can be performed during surgery without additional personnel or expertise. A limitation of this approach is the relatively short duration of effectiveness of the local anesthetic and uncertainty regarding the best agent and the ideal volume of injection.6 Liposomal bupivacaine is a new agent (approved by the US Food and Drug Administration in 201117) with a sustained release over 72 to 96 hours.18 The most common adverse effects of liposomal bupivacaine are nausea, vomiting, constipation, pyrexia, dizziness, and headache.19 Chondrotoxicity and granulomatous inflammation are more serious, yet rare, complications of liposomal bupivacaine.20
We found that liposomal bupivacaine injections were associated with lower pain scores compared with ISNB at 18 to 24 hours after surgery. This correlated with less opioid consumption in the liposomal bupivacaine group than in the ISNB group on the second postoperative day. These differences in pain values are consistent with the known pharmacokinetics of liposomal bupivacaine.18 Peak plasma levels normally occur approximately 24 hours after injection, leaving the early postoperative period relatively uncovered by anesthetic agent. This finding of relatively poor pain control early after surgery has also been noted in patients undergoing knee arthroplasty.5 On the basis of the findings of this study, we have added standard bupivacaine injections to our separate liposomal bupivacaine injection to cover early postoperative pain. Opioid consumption was significantly lower in the liposomal bupivacaine group than in the ISNB group on postoperative days 2 and 3. We did not measure adverse events related to opioid consumption, so we cannot comment on whether the decreased opioid consumption was associated with the rate of adverse events. However, other studies21,22 have established this relationship.
We found the liposomal bupivacaine group to have earlier discharges to home. Sixteen of 37 patients in the liposomal bupivacaine group compared with 2 of 21 patients in the ISNB group were discharged on the day after surgery. A mean reduction in LOS of 18 hours for the liposomal bupivacaine group was statistically significant (P = .012). This reduction in LOS has important implications for hospitals and value analysis committees considering whether to keep a new, more expensive local anesthetic on formulary. Savings from reduced LOS and improvements in patient satisfaction may justify the expense (approximately $300 per 266-mg vial) of Exparel.
From a societal cost perspective, liposomal bupivacaine is more economical compared with ISNB, which adds approximately $1500 to the cost of anesthesia per patient.23 Eliminating the costs associated with ISNB administration in shoulder arthroplasties could result in substantial savings to our healthcare system. More research examining time savings and exact costs of each procedure is needed to determine the true cost effectiveness of each approach.
Limitations of our study include the retrospective design, relatively small numbers of patients in each group, missing data for some patients at various time points, variation in the types of procedures in each group, and lack of long-term outcome measures. It is important to note that we did not confirm the success of the nerve block after administration. However, this study reflects the effectiveness of each of the modalities in actual clinical conditions (as opposed to a controlled experimental setting). The actual effectiveness of a nerve block varies, even when performed by an experienced anesthesiologist with ultrasound guidance. Furthermore, immediate postoperative pain scores in the nerve block group are consistent with those of prior research reporting pain values ranging from 4 to 5 and a mean duration of effect ranging from 9 to 14 hours.23,24 Additionally, the patients, surgeon, and nursing team were not blinded to the treatment group. Although we did note a significant difference in the types of procedures between groups, this finding is related to the greater number of hemiarthroplasties performed in the ISNB group (N = 5) compared with the liposomal group (N = 1). Because of this variation and the decreased invasiveness of hemiarthroplasties, the bias is against the liposomal group. Finally, our primary outcome variable was pain, which is a subjective, self-reported measure. However, our opioid consumption data and LOS data corroborate the improved pain scores in the liposomal bupivacaine group.
Limiting the study to a single surgeon may limit external validity. Another limitation is the lack of data on adverse events related to opioid medication use. There was no additional experimental group to determine whether less expensive local anesthetics injected locally would perform similarly to liposomal bupivacaine. In total knee arthroplasty, periarticular injections of liposomal bupivacaine were not as effective as less expensive periarticular injections.25 It is unclear which agents (and in what doses or combinations) should be used for periarticular injections. Finally, we acknowledge that our retrospective study design cannot account for all potential factors affecting discharge time.
This is the first comparative study of liposomal bupivacaine and ISNB in TSA. The study design allowed us to control for variables such as surgical technique, postoperative protocols (including use and type of sling), and use of other pain modalities such as patient-controlled analgesia and intravenous acetaminophen that are likely to affect postoperative pain and LOS. This study provides preliminary data that confirm relative equipoise between liposomal bupivacaine and ISNB, which is needed for the ethical conduct of a randomized controlled trial. Such a trial would allow for a more robust comparison, and this retrospective study provides appropriate pilot data on which to base this design and the clinical information needed to counsel patients during enrollment.
Our results suggest that liposomal bupivacaine may provide superior or similar pain relief compared with ISNB after shoulder arthroplasty. Additionally, the use of liposomal bupivacaine was associated with decreased opioid consumption and earlier discharge to home compared with ISNB. These findings have important implications for pain control after TSA because pain represents a major concern for patients and providers after surgery. In addition to clinical improvements, use of liposomal bupivacaine may save time and eliminate costs associated with administering nerve blocks. Local injection may also be used in patients who are contraindicated for ISNB such as those with obesity, pulmonary disease, or peripheral neuropathy. Although we cannot definitively suggest that liposomal bupivacaine is superior to the current gold standard ISNB for pain control after shoulder arthroplasty, our results suggest a relative clinical equipoise between these modalities. Larger analytical studies, including randomized trials, should be performed to explore the potential benefits of liposomal bupivacaine injections for pain control after shoulder arthroplasty.
Am J Orthop. 2016;45(7):424-430. Copyright Frontline Medical Communications Inc. 2016. All rights reserved.
1. Kim SH, Wise BL, Zhang Y, Szabo RM. Increasing incidence of shoulder arthroplasty in the United States. J Bone Joint Surg Am. 2011;93(24):2249-2254.
2. American Academy of Orthopaedic Surgeons. Shoulder joint replacement. http://orthoinfo.aaos.org/topic.cfm?topic=A00094. Accessed June 3, 2015.
3. Desai VN, Cheung EV. Postoperative pain associated with orthopedic shoulder and elbow surgery: a prospective study. J Shoulder Elbow Surg. 2012;21(4):441-450.
4. Springer BD. Transition from nerve blocks to periarticular injections and emerging techniques in total joint arthroplasty. Am J Orthop. 2014;43(10 Suppl):S6-S9.
5. Surdam JW, Licini DJ, Baynes NT, Arce BR. The use of exparel (liposomal bupivacaine) to manage postoperative pain in unilateral total knee arthroplasty patients. J Arthroplasty. 2015;30(2):325-329.
6. Tong YC, Kaye AD, Urman RD. Liposomal bupivacaine and clinical outcomes. Best Pract Res Clin Anaesthesiol. 2014;28(1):15-27.
7. Chahar P, Cummings KC 3rd. Liposomal bupivacaine: a review of a new bupivacaine formulation. J Pain Res. 2012;5:257-264.
8. Schneider C, Yale SH, Larson M. Principles of pain management. Clin Med Res. 2003;1(4):337-340.
9. Pacira Pharmaceuticals, Inc. Highlights of prescribing information. http://www.exparel.com/pdf/EXPAREL_Prescribing_Information.pdf. Accessed May 7, 2015.
10. Gohl MR, Moeller RK, Olson RL, Vacchiano CA. The addition of interscalene block to general anesthesia for patients undergoing open shoulder procedures. AANA J. 2001;69(2):105-109.
11. Ironfield CM, Barrington MJ, Kluger R, Sites B. Are patients satisfied after peripheral nerve blockade? Results from an International Registry of Regional Anesthesia. Reg Anesth Pain Med. 2014;39(1):48-55.
12. Srikumaran U, Stein BE, Tan EW, Freehill MT, Wilckens JH. Upper-extremity peripheral nerve blocks in the perioperative pain management of orthopaedic patients: AAOS exhibit selection. J Bone Joint Surg Am. 2013;95(24):e197(1-13).
13. DeMarco JR, Componovo R, Barfield WR, Liles L, Nietert P. Efficacy of augmenting a subacromial continuous-infusion pump with a preoperative interscalene block in outpatient arthroscopic shoulder surgery: a prospective, randomized, blinded, and placebo-controlled study. Arthroscopy. 2011;27(5):603-610.
14. Misamore G, Webb B, McMurray S, Sallay P. A prospective analysis of interscalene brachial plexus blocks performed under general anesthesia. J Shoulder Elbow Surg. 2011;20(2):308-314.
15. Lenters TR, Davies J, Matsen FA 3rd. The types and severity of complications associated with interscalene brachial plexus block anesthesia: local and national evidence. J Shoulder Elbow Surg. 2007;16(4):379-387.
16. Park SK, Choi YS, Choi SW, Song SW. A comparison of three methods for postoperative pain control in patients undergoing arthroscopic shoulder surgery. Korean J Pain. 2015;28(1):45-51.
17. Pacira Pharmaceuticals, Inc. Pacira Pharmaceuticals, Inc. announces U.S. FDA approval of EXPAREL™ for postsurgical pain management. http://investor.pacira.com/phoenix.zhtml?c=220759&p=irol-newsArticle_print&ID=1623529. Published October 31, 2011. Accessed June 3, 2015.
18. White PF, Ardeleanu M, Schooley G, Burch RM. Pharmocokinetics of depobupivacaine following infiltration in patients undergoing two types of surgery and in normal volunteers. Paper presented at: Annual Meeting of the International Anesthesia Research Society; March 14, 2009; San Diego, CA.
19. Bramlett K, Onel E, Viscusi ER, Jones K. A randomized, double-blind, dose-ranging study comparing wound infiltration of DepoFoam bupivacaine, an extended-release liposomal bupivacaine, to bupivacaine HCl for postsurgical analgesia in total knee arthroplasty. Knee. 2012;19(5):530-536.
20. Lambrechts M, O’Brien MJ, Savoie FH, You Z. Liposomal extended-release bupivacaine for postsurgical analgesia. Patient Prefer Adherence. 2013;7:885-890.
21. American Society of Anesthesiologists Task Force on Acute Pain Management. Practice guidelines for acute pain management in the perioperative setting: an updated report by the American Society of Anesthesiologists Task Force on Acute Pain Management. Anesthesiology. 2012;116(2):248-273.
22. Candiotti KA, Sands LR, Lee E, et al. Liposome bupivacaine for postsurgical analgesia in adult patients undergoing laparoscopic colectomy: results from prospective phase IV sequential cohort studies assessing health economic outcomes. Curr Ther Res Clin Exp. 2013;76:1-6.
23. Weber SC, Jain R. Scalene regional anesthesia for shoulder surgery in a community setting: an assessment of risk. J Bone Joint Surg Am. 2002;84-A(5):775-779.
24. Beaudet V, Williams SR, Tétreault P, Perrault MA. Perioperative interscalene block versus intra-articular injection of local anesthetics for postoperative analgesia in shoulder surgery. Reg Anesth Pain Med. 2008;33(2):134-138.
25. Bagsby DT, Ireland PH, Meneghini RM. Liposomal bupivacaine versus traditional periarticular injection for pain control after total knee arthroplasty. J Arthroplasty. 2014;29(8):1687-1690.
Letter from the Editor: Value-based reimbursement is here to stay
For years, we advocated to repeal the sustainable growth rate (SGR) payment formula. Congress, by passing the MACRA legislation, eliminated SGR but created a new process that links provider reimbursement to value (quality and cost). Value-based reimbursement is here to stay. We now must help CMS devise reasonable linkages that will truly improve patient care, yet keep us in business. MACRA’s final rule is an improvement over the preliminary rule published earlier this spring. Gastroenterologists that plan to practice (and accept Medicare reimbursement) must educate themselves about both the incentive portion (MIPS) and alternative payment models.

MACRA intends to move independent practices into health systems (whether employed or contracted) that will assume financial and clinical risk. Gastroenterologists must lead clinical service lines for colon cancer prevention and integrated care for patients with IBD or cirrhosis. These care models must demonstrate good outcomes and substantive cost savings.
There are many sources of information about MACRA (see AGA resources at www.gastro.org/MACRA). I have listed four key websites:
https://qpp.cms.gov/docs/QPP_Executive_Summary_of_Final_Rule.pdf
http://healthaffairs.org/healthpolicybriefs/brief_pdfs/healthpolicybrief_156.pdf
https://innovation.cms.gov/initiatives/Transforming-Clinical-Practices/
I hope you will take it to heart that we are moving into a new world of care delivery and payment. We need physician leaders and innovators to make sure this works well for our patients and our profession.
John I. Allen MD, MBA, AGAF
Editor in Chief
For years, we advocated to repeal the sustainable growth rate (SGR) payment formula. Congress, by passing the MACRA legislation, eliminated SGR but created a new process that links provider reimbursement to value (quality and cost). Value-based reimbursement is here to stay. We now must help CMS devise reasonable linkages that will truly improve patient care, yet keep us in business. MACRA’s final rule is an improvement over the preliminary rule published earlier this spring. Gastroenterologists that plan to practice (and accept Medicare reimbursement) must educate themselves about both the incentive portion (MIPS) and alternative payment models.
MACRA intends to move independent practices into health systems (whether employed or contracted) that will assume financial and clinical risk. Gastroenterologists must lead clinical service lines for colon cancer prevention and integrated care for patients with IBD or cirrhosis. These care models must demonstrate good outcomes and substantive cost savings.
There are many sources of information about MACRA (see AGA resources at www.gastro.org/MACRA). I have listed four key websites:
https://qpp.cms.gov/docs/QPP_Executive_Summary_of_Final_Rule.pdf
http://healthaffairs.org/healthpolicybriefs/brief_pdfs/healthpolicybrief_156.pdf
https://innovation.cms.gov/initiatives/Transforming-Clinical-Practices/
I hope you will take it to heart that we are moving into a new world of care delivery and payment. We need physician leaders and innovators to make sure this works well for our patients and our profession.
John I. Allen MD, MBA, AGAF
Editor in Chief
Setting Up Your New Physician for Success
Practices and hospitals invest significant time and money in recruiting a new physician. From phone interviews to site visits to contract negotiations, it’s a long and involved process.
Beyond setting up a new physician’s office and appointment schedule, completing human resources paperwork, and ordering business cards, what does your practice do to support new physicians to ensure they are successful? Although a new colleague may arrive with excellent clinical skills, even the most promising surgeon can fall short if not provided with the right expectations, training, and collegial support. Here’s how to fast track your new physician to professional heights.
Credentialing Is Key
At the crux of a new physician’s success is credentialing him or her with hospitals and insurance plans before the official start date to see patients.
“A state medical license is the first domino,” says orthopedic surgeon Michael R. Marks, MD, MBA, consultant and coding educator with KarenZupko & Associates, Inc. Marks has led or participated in physician recruitment in orthopedic and multispecialty groups. The firm has developed a comprehensive New Physician Onboarding Checklist, available at https://www.karenzupko.com/new-physician-onboarding-checklist/.
“Without a medical license,” Marks continues, “you can’t get the new physician hospital privileges and you can’t get him or her credentialed with plans. Without being credentialed, the physician can’t bill for patients treated.” Because commercial carriers won’t allow retrospective billing for services already rendered, “even a 3-month delay in credentialing could cost an orthopedic practice $60,000 to $180,000 in lost revenue.”
And if you think you can bill the new physician’s services under another partner’s name, you are incorrect. “The billing physician will have signed the note, but not have treated the patient,” warns Marks. “This is improper billing. Don’t do it.”
The remedy for ensuring that the new physician is credentialed is simple: get organized and plan ahead. 
“When I first started participating in recruitment, I remember telling physicians, ‘I need you tomorrow!’” admits Amon T. Ferry, MD, a practicing orthopedist who leads recruitment efforts at IMS Orthopedics, a division of Integrated Medical Specialists in Phoenix, Arizona. “So they’d get hired before the practice was prepared and before credentialing was completed. Now, I set more realistic expectations,” he says, noting that in Arizona it takes 3 months to get a medical license, 6 months to contract with the hospital, and 9 months to get on insurance plans. And even after a plan has credentialed a new physician, “sometimes it still takes 4 to 6 weeks before the physician’s data is loaded into the plan’s computer systems.”
“The way to do credentialing right is to get all departments communicating,” Marks says. “If you keep everyone siloed, staff don’t understand that a lack of timeliness on their part impacts other areas of the practice.”
Ferry agrees, and says his group learned to organize its multiple departments after making mistakes and missing deadlines. “We now have an 8-page pre-employment application for new physicians,” he explains. “In addition to asking for contact information and everything we need to know in order to get the physician credentialed, we ask questions about malpractice suit history and whether there are issues with the medical board. We also ask about gaps in employment and details about where the physician has practiced in the past.” All of this is done to identify early whether credentialing will require more time and effort. Ferry says that the application has solved a number of processing problems the practice had in the past.
And whether credentialing is done within the practice or outsourced, Ferry says that it pays to be persistent. “Don’t sit back and assume it will get done. Even if you have outsourced credentialing to a company, someone must check with payers and hospitals weekly and provide the practice a status update.”
In one case, when getting a new physician contracted at a hospital was taking forever, Ferry directed the staff to call. “Turns out, they had been trying to reach us and had the wrong phone number,” he says. “When people are processing thousands of physician renewals, things get lost. You have to be proactive and be your own advocate. Don’t be afraid to be the squeaky wheel.”
Staff Relationships and Operational Wisdom
Marks points out that in many practices, the new physician is shown the examination rooms and his or her office, gets electronic health record (EHR) training, and that’s it. To be successful, Marks insists that the new physician must build relationships with personnel and understand operational basics. “In other business industries, successful leaders understand at least the basics of what everyone does. Part of how they do this is by getting to know the employees.”
Ideally, Marks advises that new physicians spend time with each staff member. “The best time to do this is in the first few weeks of employment,” he suggests. “Odds are, the new orthopedist doesn’t have 40 patients a day on the schedule. So schedule conversations within the first few weeks or month, and schedule observation time as well. When a patient complains about check-in, the physician will have an understanding of how things work up there if he or she knows the basic processes.” The new doctor should also spend time in the billing office getting to know the challenges faced by staff, and sit with the surgery coordinator to understand the process of getting cases booked and scheduled.
Plan for an initial and then periodic meetings with the practice administrator and other supervisors. Transparency about business operations, data, and strategy will help the new physician get up to speed faster.
“The executive director of our group was an absolutely invaluable information resource,” says Kathryn J. McCarthy, MD, an orthopedic spine surgeon with Arkansas Specialty Orthopaedics in Little Rock, Arkansas. McCarthy has been with the group for 3 years.
The practice’s executive director developed and presented a PowerPoint (Microsoft) explaining general business procedures, expectations for the coding and billing process, and pertinent compliance and risk issues. She had also developed an interactive model of the compensation formula and buy-in program, using Excel (Microsoft). McCarthy met with the executive director at 3 months, 6 months, and 9 months to review her patient and case volumes and how they were trending against the estimates made about her income, bonus, and buy-in status.
From the new physician’s perspective, McCarthy says having the new physician understand the complexities of certain business systems helps them understand things better. “If you sit in the business meetings long enough, you figure it out,” she says, “but it would have made some of the growing pains less painful if I understood what my overhead charge was going to, or more about the workflow of the clinic.” She adds that an overview of hospital relationships and any overlapping ownership interests will benefit new physicians as well.
“I think it’s useful to provide new physicians with a history of the practice and the vision of where things are going,” McCarthy says. “It’s important to outline the business vision, especially for subspecialties. If you explain to the new physician where you want to grow and when the practice plans on bringing on the next physician, it could really drive someone to grow their practice.”
Don’t Underestimate the Need for Coding Training
“When fellows come out of training, they are comfortable with clinical activity but uncomfortable with business administration,” Marks says. “And we know they don’t get training on coding and billing.”
Marks cites a recent conversation at an American Academy of Orthopaedic Surgeons (AAOS) coding workshop. “A surgeon new in practice told me, ‘I’ve been in practice for 4 months. I understand the clinical side but nobody educated me about coding and billing before this course.’” Practices must provide new physicians with coding and documentation training, and coach them to make sure they feel up to speed and comfortable. “The practice’s future revenue depends on it,” Marks says.
McCarthy agrees. “Having an administrative mentorship for coding is incredibly valuable. They don’t teach it in school.”
So from a practical standpoint, purchase AAOS’ Orthopaedic Code-X, a software tool that will help the new physician navigate and integrate Current Procedural Terminology (CPT), ICD-10 (International Classification of Diseases, Tenth Revision), and other coding data easily and accurately. Send him or her to one of the Academy’s regional coding and reimbursement workshops as well. “It will behoove the practice to send them even before they start seeing patients,” Marks says.
And don’t just stop there. High-performing groups conduct peer reviews of evaluation and management (E/M) and operative notes, blinding the codes billed and discussing which CPT and ICD-10 codes are appropriate for the visit or case. “It will take time for the new physician to completely integrate coding with their clinical care,” says Marks. “Peer review sessions, as well as having a partner review codes before they go to the billing office, can help speed learning.”
Collegial Coaching Counts
The week before her official start day, Mc-Carthy scrubbed in as a first assist with each of her new partners. “It was a great way to start ramping up,” she says. “I could see what kind of equipment was present in the hospitals, and got a touch point for hospital logistics. Plus, as a young surgeon it’s great to see how your skill sets match up with your new partners, and which best practices are being deployed by the group.”
This kind of “collegial coaching” is a vital part of the clinical and cultural integration to the practice. Beyond providing clinical support, it builds relationships and trust among the group, and fosters collaboration.
Arkansas Specialty Orthopaedics organized McCarthy’s clinic and operating room (OR) schedules so that a partner was always present. “There was also someone I could bounce ideas off of,” McCarthy explains. “Every day in the OR, there was a partner there at the same time. If I got into a sticky situation, one of my colleagues was willing to come in and scrub in the OR.”
McCarthy says that patients responded favorably when she told them her plan was developed in conjunction with her partners. “Patients find comfort in knowing that several people’s opinions were considered,” she says. “And as a young surgeon, knowing that you have backup, even if you don’t use it, when caring for high-risk and complex cases really means a lot,” she says.
And although her group didn’t offer a formal mentoring program, McCarthy found that an informal mentorship grew organically when a friendship developed with one of her new partners. “In the first 6 months, every single weekend we sat by the pool and rolled through a ton of cases,” she says. “That was fabulous and it alleviated so much stress for me.” And when it was time for McCarthy to move into board case selection, this colleague and another were instrumental in her board preparation because, “they knew my style and where I would need to focus.”
IMS Orthopedics’ approach is to provide the staff and systems that allow new physicians to step up and take responsibility. “If they want to scrub in with me, that’s great. If they’d like to visit additional facilities and get the lay of the land, we encourage it. But we don’t do a lot of handholding. We set them up for success and make sure people are in place to help them,” says Ferry.
A Marketing Plan Is a Must
“The vast majority of practices do very little when it comes to thinking about how to market and build the practice of their new physician,” Marks says. “Practice-building is more of a challenge for surgical specialists today than it was in the old days when new surgeons could easily meet internists as they were rounding at the hospital. Now, a new physician and the practice must come up with a game plan.”
That game plan starts with the easy things: order business cards, schedule a photo shoot, and update the practice’s Web site pages with the physician’s biography and an introductory video. But with social media, online reviews, and subspecialty competition, Marks says practices must think beyond the basics. Think through each element of marketing, from online to outreach to developing referral relationships.
“I tell practices to draft a written marketing plan,” he says. “Not only does it provide a roadmap for the new physician, but also indicates that the practice has put some thought into how he or she can build a practice. It can make the new physician feel less overwhelmed knowing that he or she doesn’t have to do the marketing alone.” Once you’ve developed a list of actions, Marks suggests creating a spreadsheet with deadlines, and ensuring each action is completed.
McCarthy was scheduled to visit family practice clinics, and joined by the administrator who “handed out cookies and cards while I talked,” she says. Arkansas Specialty Orthopaedics also hired an external marketing firm to develop promotional opportunities for her. For example, “I was scheduled to appear on news channels, where I discussed new and interesting procedures,” she says. “It got my name out into the community.”
If your practice is too small to hire an outside firm, Marks suggests reaching out to agencies such as nursing homes, fitness centers, or the YMCA, which frequently offers educational programs for members. “Contact the administrators or medical directors in these organizations. A few minutes on the phone or a short visit can go a long way to building these relationships and getting your new physician on the map.”
As the old saying goes, an ounce of prevention is worth a pound of cure. Scheduling time for orientation, training, staff integration, and collegial coaching will speed up a new physician’s integration into the practice, and increase his or her opportunity for success.
Practices and hospitals invest significant time and money in recruiting a new physician. From phone interviews to site visits to contract negotiations, it’s a long and involved process.
Beyond setting up a new physician’s office and appointment schedule, completing human resources paperwork, and ordering business cards, what does your practice do to support new physicians to ensure they are successful? Although a new colleague may arrive with excellent clinical skills, even the most promising surgeon can fall short if not provided with the right expectations, training, and collegial support. Here’s how to fast track your new physician to professional heights.
Credentialing Is Key
At the crux of a new physician’s success is credentialing him or her with hospitals and insurance plans before the official start date to see patients.
“A state medical license is the first domino,” says orthopedic surgeon Michael R. Marks, MD, MBA, consultant and coding educator with KarenZupko & Associates, Inc. Marks has led or participated in physician recruitment in orthopedic and multispecialty groups. The firm has developed a comprehensive New Physician Onboarding Checklist, available at https://www.karenzupko.com/new-physician-onboarding-checklist/.
“Without a medical license,” Marks continues, “you can’t get the new physician hospital privileges and you can’t get him or her credentialed with plans. Without being credentialed, the physician can’t bill for patients treated.” Because commercial carriers won’t allow retrospective billing for services already rendered, “even a 3-month delay in credentialing could cost an orthopedic practice $60,000 to $180,000 in lost revenue.”
And if you think you can bill the new physician’s services under another partner’s name, you are incorrect. “The billing physician will have signed the note, but not have treated the patient,” warns Marks. “This is improper billing. Don’t do it.”
The remedy for ensuring that the new physician is credentialed is simple: get organized and plan ahead.
“When I first started participating in recruitment, I remember telling physicians, ‘I need you tomorrow!’” admits Amon T. Ferry, MD, a practicing orthopedist who leads recruitment efforts at IMS Orthopedics, a division of Integrated Medical Specialists in Phoenix, Arizona. “So they’d get hired before the practice was prepared and before credentialing was completed. Now, I set more realistic expectations,” he says, noting that in Arizona it takes 3 months to get a medical license, 6 months to contract with the hospital, and 9 months to get on insurance plans. And even after a plan has credentialed a new physician, “sometimes it still takes 4 to 6 weeks before the physician’s data is loaded into the plan’s computer systems.”
“The way to do credentialing right is to get all departments communicating,” Marks says. “If you keep everyone siloed, staff don’t understand that a lack of timeliness on their part impacts other areas of the practice.”
Ferry agrees, and says his group learned to organize its multiple departments after making mistakes and missing deadlines. “We now have an 8-page pre-employment application for new physicians,” he explains. “In addition to asking for contact information and everything we need to know in order to get the physician credentialed, we ask questions about malpractice suit history and whether there are issues with the medical board. We also ask about gaps in employment and details about where the physician has practiced in the past.” All of this is done to identify early whether credentialing will require more time and effort. Ferry says that the application has solved a number of processing problems the practice had in the past.
And whether credentialing is done within the practice or outsourced, Ferry says that it pays to be persistent. “Don’t sit back and assume it will get done. Even if you have outsourced credentialing to a company, someone must check with payers and hospitals weekly and provide the practice a status update.”
In one case, when getting a new physician contracted at a hospital was taking forever, Ferry directed the staff to call. “Turns out, they had been trying to reach us and had the wrong phone number,” he says. “When people are processing thousands of physician renewals, things get lost. You have to be proactive and be your own advocate. Don’t be afraid to be the squeaky wheel.”
Staff Relationships and Operational Wisdom
Marks points out that in many practices, the new physician is shown the examination rooms and his or her office, gets electronic health record (EHR) training, and that’s it. To be successful, Marks insists that the new physician must build relationships with personnel and understand operational basics. “In other business industries, successful leaders understand at least the basics of what everyone does. Part of how they do this is by getting to know the employees.”
Ideally, Marks advises that new physicians spend time with each staff member. “The best time to do this is in the first few weeks of employment,” he suggests. “Odds are, the new orthopedist doesn’t have 40 patients a day on the schedule. So schedule conversations within the first few weeks or month, and schedule observation time as well. When a patient complains about check-in, the physician will have an understanding of how things work up there if he or she knows the basic processes.” The new doctor should also spend time in the billing office getting to know the challenges faced by staff, and sit with the surgery coordinator to understand the process of getting cases booked and scheduled.
Plan for an initial and then periodic meetings with the practice administrator and other supervisors. Transparency about business operations, data, and strategy will help the new physician get up to speed faster.
“The executive director of our group was an absolutely invaluable information resource,” says Kathryn J. McCarthy, MD, an orthopedic spine surgeon with Arkansas Specialty Orthopaedics in Little Rock, Arkansas. McCarthy has been with the group for 3 years.
The practice’s executive director developed and presented a PowerPoint (Microsoft) explaining general business procedures, expectations for the coding and billing process, and pertinent compliance and risk issues. She had also developed an interactive model of the compensation formula and buy-in program, using Excel (Microsoft). McCarthy met with the executive director at 3 months, 6 months, and 9 months to review her patient and case volumes and how they were trending against the estimates made about her income, bonus, and buy-in status.
From the new physician’s perspective, McCarthy says having the new physician understand the complexities of certain business systems helps them understand things better. “If you sit in the business meetings long enough, you figure it out,” she says, “but it would have made some of the growing pains less painful if I understood what my overhead charge was going to, or more about the workflow of the clinic.” She adds that an overview of hospital relationships and any overlapping ownership interests will benefit new physicians as well.
“I think it’s useful to provide new physicians with a history of the practice and the vision of where things are going,” McCarthy says. “It’s important to outline the business vision, especially for subspecialties. If you explain to the new physician where you want to grow and when the practice plans on bringing on the next physician, it could really drive someone to grow their practice.”
Don’t Underestimate the Need for Coding Training
“When fellows come out of training, they are comfortable with clinical activity but uncomfortable with business administration,” Marks says. “And we know they don’t get training on coding and billing.”
Marks cites a recent conversation at an American Academy of Orthopaedic Surgeons (AAOS) coding workshop. “A surgeon new in practice told me, ‘I’ve been in practice for 4 months. I understand the clinical side but nobody educated me about coding and billing before this course.’” Practices must provide new physicians with coding and documentation training, and coach them to make sure they feel up to speed and comfortable. “The practice’s future revenue depends on it,” Marks says.
McCarthy agrees. “Having an administrative mentorship for coding is incredibly valuable. They don’t teach it in school.”
So from a practical standpoint, purchase AAOS’ Orthopaedic Code-X, a software tool that will help the new physician navigate and integrate Current Procedural Terminology (CPT), ICD-10 (International Classification of Diseases, Tenth Revision), and other coding data easily and accurately. Send him or her to one of the Academy’s regional coding and reimbursement workshops as well. “It will behoove the practice to send them even before they start seeing patients,” Marks says.
And don’t just stop there. High-performing groups conduct peer reviews of evaluation and management (E/M) and operative notes, blinding the codes billed and discussing which CPT and ICD-10 codes are appropriate for the visit or case. “It will take time for the new physician to completely integrate coding with their clinical care,” says Marks. “Peer review sessions, as well as having a partner review codes before they go to the billing office, can help speed learning.”
Collegial Coaching Counts
The week before her official start day, Mc-Carthy scrubbed in as a first assist with each of her new partners. “It was a great way to start ramping up,” she says. “I could see what kind of equipment was present in the hospitals, and got a touch point for hospital logistics. Plus, as a young surgeon it’s great to see how your skill sets match up with your new partners, and which best practices are being deployed by the group.”
This kind of “collegial coaching” is a vital part of the clinical and cultural integration to the practice. Beyond providing clinical support, it builds relationships and trust among the group, and fosters collaboration.
Arkansas Specialty Orthopaedics organized McCarthy’s clinic and operating room (OR) schedules so that a partner was always present. “There was also someone I could bounce ideas off of,” McCarthy explains. “Every day in the OR, there was a partner there at the same time. If I got into a sticky situation, one of my colleagues was willing to come in and scrub in the OR.”
McCarthy says that patients responded favorably when she told them her plan was developed in conjunction with her partners. “Patients find comfort in knowing that several people’s opinions were considered,” she says. “And as a young surgeon, knowing that you have backup, even if you don’t use it, when caring for high-risk and complex cases really means a lot,” she says.
And although her group didn’t offer a formal mentoring program, McCarthy found that an informal mentorship grew organically when a friendship developed with one of her new partners. “In the first 6 months, every single weekend we sat by the pool and rolled through a ton of cases,” she says. “That was fabulous and it alleviated so much stress for me.” And when it was time for McCarthy to move into board case selection, this colleague and another were instrumental in her board preparation because, “they knew my style and where I would need to focus.”
IMS Orthopedics’ approach is to provide the staff and systems that allow new physicians to step up and take responsibility. “If they want to scrub in with me, that’s great. If they’d like to visit additional facilities and get the lay of the land, we encourage it. But we don’t do a lot of handholding. We set them up for success and make sure people are in place to help them,” says Ferry.
A Marketing Plan Is a Must
“The vast majority of practices do very little when it comes to thinking about how to market and build the practice of their new physician,” Marks says. “Practice-building is more of a challenge for surgical specialists today than it was in the old days when new surgeons could easily meet internists as they were rounding at the hospital. Now, a new physician and the practice must come up with a game plan.”
That game plan starts with the easy things: order business cards, schedule a photo shoot, and update the practice’s Web site pages with the physician’s biography and an introductory video. But with social media, online reviews, and subspecialty competition, Marks says practices must think beyond the basics. Think through each element of marketing, from online to outreach to developing referral relationships.
“I tell practices to draft a written marketing plan,” he says. “Not only does it provide a roadmap for the new physician, but also indicates that the practice has put some thought into how he or she can build a practice. It can make the new physician feel less overwhelmed knowing that he or she doesn’t have to do the marketing alone.” Once you’ve developed a list of actions, Marks suggests creating a spreadsheet with deadlines, and ensuring each action is completed.
McCarthy was scheduled to visit family practice clinics, and joined by the administrator who “handed out cookies and cards while I talked,” she says. Arkansas Specialty Orthopaedics also hired an external marketing firm to develop promotional opportunities for her. For example, “I was scheduled to appear on news channels, where I discussed new and interesting procedures,” she says. “It got my name out into the community.”
If your practice is too small to hire an outside firm, Marks suggests reaching out to agencies such as nursing homes, fitness centers, or the YMCA, which frequently offers educational programs for members. “Contact the administrators or medical directors in these organizations. A few minutes on the phone or a short visit can go a long way to building these relationships and getting your new physician on the map.”
As the old saying goes, an ounce of prevention is worth a pound of cure. Scheduling time for orientation, training, staff integration, and collegial coaching will speed up a new physician’s integration into the practice, and increase his or her opportunity for success.
Attitudes Surrounding Continuous Telemetry Utilization by Providers at an Academic Tertiary Medical Center
From the Johns Hopkins Bayview Medical Center, Baltimore, MD (Drs. Johnson, Knight, Maygers, and Zakaria), and Duke University Hospital, Durham, NC (Dr. Mock).
Abstract
- Objective: To determine patterns of telemetry use at a tertiary academic institution and identify factors contributing to noncompliance with guidelines regarding telemetry use.
- Methods: Web-based survey of 180 providers, including internal medicine residents and cardiovascular disease fellows, hospitalists, non-hospitalist teaching attending physicians, nurse practitioners, and physician assistants.
- Results: Of the 180 providers surveyed, 67 (37%) replied. Most providers (76%) were unaware of guidelines regarding appropriate telemetry use and 85% selected inappropriate diagnoses as warranting telemetry. Only 21% routinely discontinued the telemetry order within 48 hours.
- Conclusions: Many providers at a tertiary academic institution utilize continuous telemetry inappropriately and are unaware of telemetry guidelines. These findings should guide interventions to improve telemetry utilization.
For many decades, telemetry has been widely used in the management and monitoring of patients with possible acute coronary syndromes (ACS), arrhythmias, cardiac events, and strokes [1]. In addition, telemetry has often been used in other clinical scenarios with less rigorous data supporting its use [2–4]. As a result, in 2004 the American Heart Association (AHA) issued guidelines providing recommendations for best practices in hospital ECG monitoring. Indications for telemetry were classified into 3 diagnosis-driven groups: class I (indicated in all patients), class II (indicated in most patients, may be of benefit) and class III (not indicated, no therapeutic benefit) [2]. However, these recommendations have not been widely followed and telemetry is inappropriately used for many inpatients [5,6].
There are several reasons why clinicians fail to adhere to guidelines, including knowledge deficits, attitudes regarding the current guidelines, and institution-specific factors influencing practitioner behaviors [7]. In response to reports of widespread telemetry overuse, the Choosing Wisely Campaign of the American Board of Internal Medicine Foundation has championed judicious telemetry use, advocating evidence-based, protocol-driven telemetry management for patients not in intensive care units who do not meet guideline-based criteria for continuous telemetry [8].
In order to understand patterns of telemetry use at our academic institution and identify factors associated with this practice, we systematically analyzed telemetry use perceptions through provider surveys. We hypothesized that providers have misperceptions about appropriate use of telemetry and that this knowledge gap results in overuse of telemetry at our institution.
Methods
Setting
Johns Hopkins Bayview Medical Center is a 400-bed academic medical center serving southeastern Baltimore. Providers included internal medicine residents and cardiovascular disease fellows who rotate to the medical center and Johns Hopkins Hospital, hospitalists, non-hospitalist teaching attending physicians, nurse practitioners (NPs), and physician assistants (PAs).
Current Telemetry Practice
Remote telemetric monitoring is available in all adult, non-intensive care units of the hospital except for the psychiatry unit. However, the number of monitors are limited and it is not possible to monitor every patient if the wards are at capacity. Obstetrics uses its own unique cardiac monitoring system and thus was not included in the survey. Each monitor (IntelliVue, Philips Healthcare, Amsterdam, Netherlands) is attached to the patient using 5 lead wires, with electrocardiographic data transmitted to a monitoring station based in the progressive care unit, a cardio-pulmonary step-down unit. Monitors can be ordered in one of 3 manners, as mandated by hospital policy:
- Continuous telemetry – Telemetry monitoring is uninterrupted until discontinued by a provider.
- Telemetry protocol – Within 12 hours of telemetry placement, a monitor technician generates a report, which is reviewed by the nurse caring for the patient. The nurse performs an electrocardiogram (ECG) if the patient meets pre-specified criteria for telemetry discontinuation, which includes the absence of arrhythmias, troponin elevations, chest pain, or hemodynamic instability. The repeat ECG is then read and signed by the provider. After these criteria are met, telemetry can be discontinued.
- Stroke telemetry protocol – Telemetry is applied for 48 hours, mainly for detection of paroxysmal atrial fibrillation. Monitoring can be temporarily discontinued if the patient requires magnetic resonance imaging, which interferes with the telemetric monitors.
When entering any of the 3 possible telemetry orders in our computerized provider order entry system (Meditech, Westwood, MA), the ordering provider is required to indicate baseline rhythm, pacemaker presence, and desired heart rate warning parameters. Once the order is electronically signed, a monitor technician notes the order in a logbook and assigns the patient a telemeter, which is applied by the patient’s nurse.
If a monitored patient develops any predefined abnormal rhythm, audible alerts notify monitor technicians and an alert is sent to a portable telephone carried by the patient’s assigned nurse. Either the monitoring technician or the nurse then has the discretion to silence the alarm, note it in the chart, and/or contact the patient’s provider. If alerts are recorded, then a sample telemetry monitoring strip is saved into the patient’s paper medical chart.
Survey Instrument
After approval from the Johns Hopkins institutional review board, we queried providers who worked on the medicine and cardiology wards to assess the context and culture in which telemetry monitoring is used (see Appendix). The study was exempt from requiring informed consent. All staff had the option to decline study participation. We administered the survey using an online survey software program (SurveyMonkey, Palo Alto, CA), sending survey links via email to all internal medicine residents, cardiovascular disease fellows, internal medicine and cardiology teaching attending physicians, hospitalists, NPs, and PAs. Respondents completed the survey anonymously. To increase response rates, providers were sent a monthly reminder email. The survey was open from March 2014 to May 2014 for a total of 3 months.
Analysis
The survey data were compiled and analyzed using Microsoft Excel (Mac version 14.4; Microsoft, Redmond, WA). Variables are displayed as numbers and percentages, as appropriate.
Results
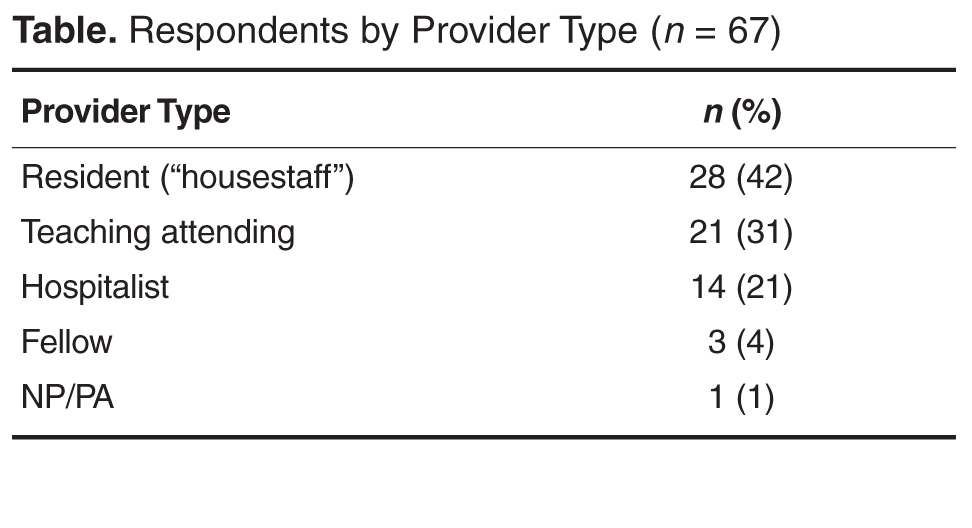
All providers reported having ordered telemetry, but almost all were either unaware of (76%) or only somewhat familiar with (21%) the AHA guidelines for appropriate telemetry use. Notably, the vast majority of fellows and residents reported that they were not at all familiar with the guidelines (100% and 96%, respectively). When asked why providers do not adhere to telemetry guidelines, lack of awareness of and lack of familiarity with the guidelines were the top 2 choices among respondents (Figure 1). 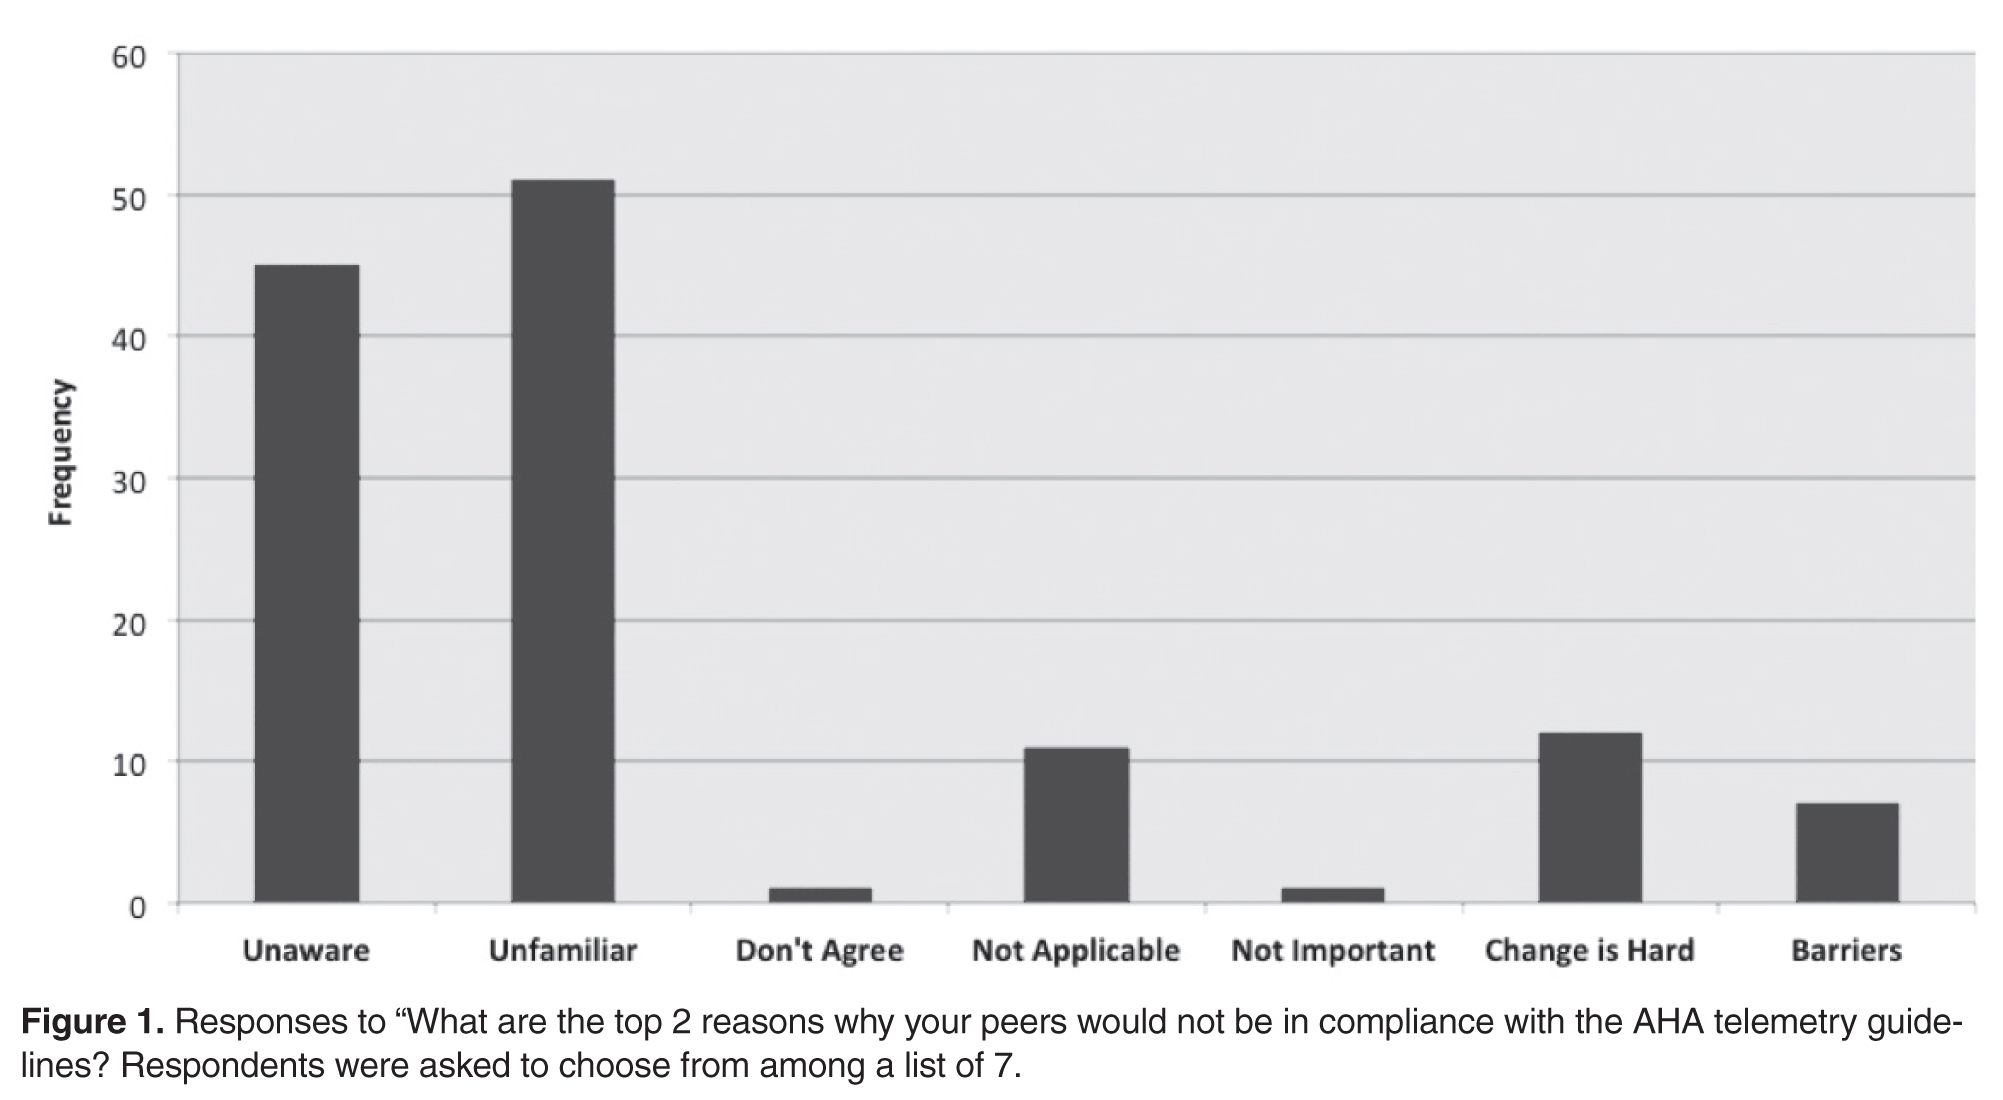
Additionally, most providers acknowledged experiencing adverse effects of telemetry: 86% (57/66) had experienced delayed patient transfers from the emergency department to inpatient floors due to telemetry unavailability and 97% (65/67) had experienced some delay in obtaining tests or studies for their telemetry-monitored patients. Despite acknowledging the potential consequences of telemetry use, only 21% (14/66) of providers routinely (ie, > 75% of the time) discontinued telemetry within 48 hours. Fifteen percent (10/65) routinely allowed telemetry to continue until the time of patient discharge. When discontinued, it was mainly due to the provider’s decision (57%); however, respondents noted that nurses prompted telemetry discontinuation 28% of the time.
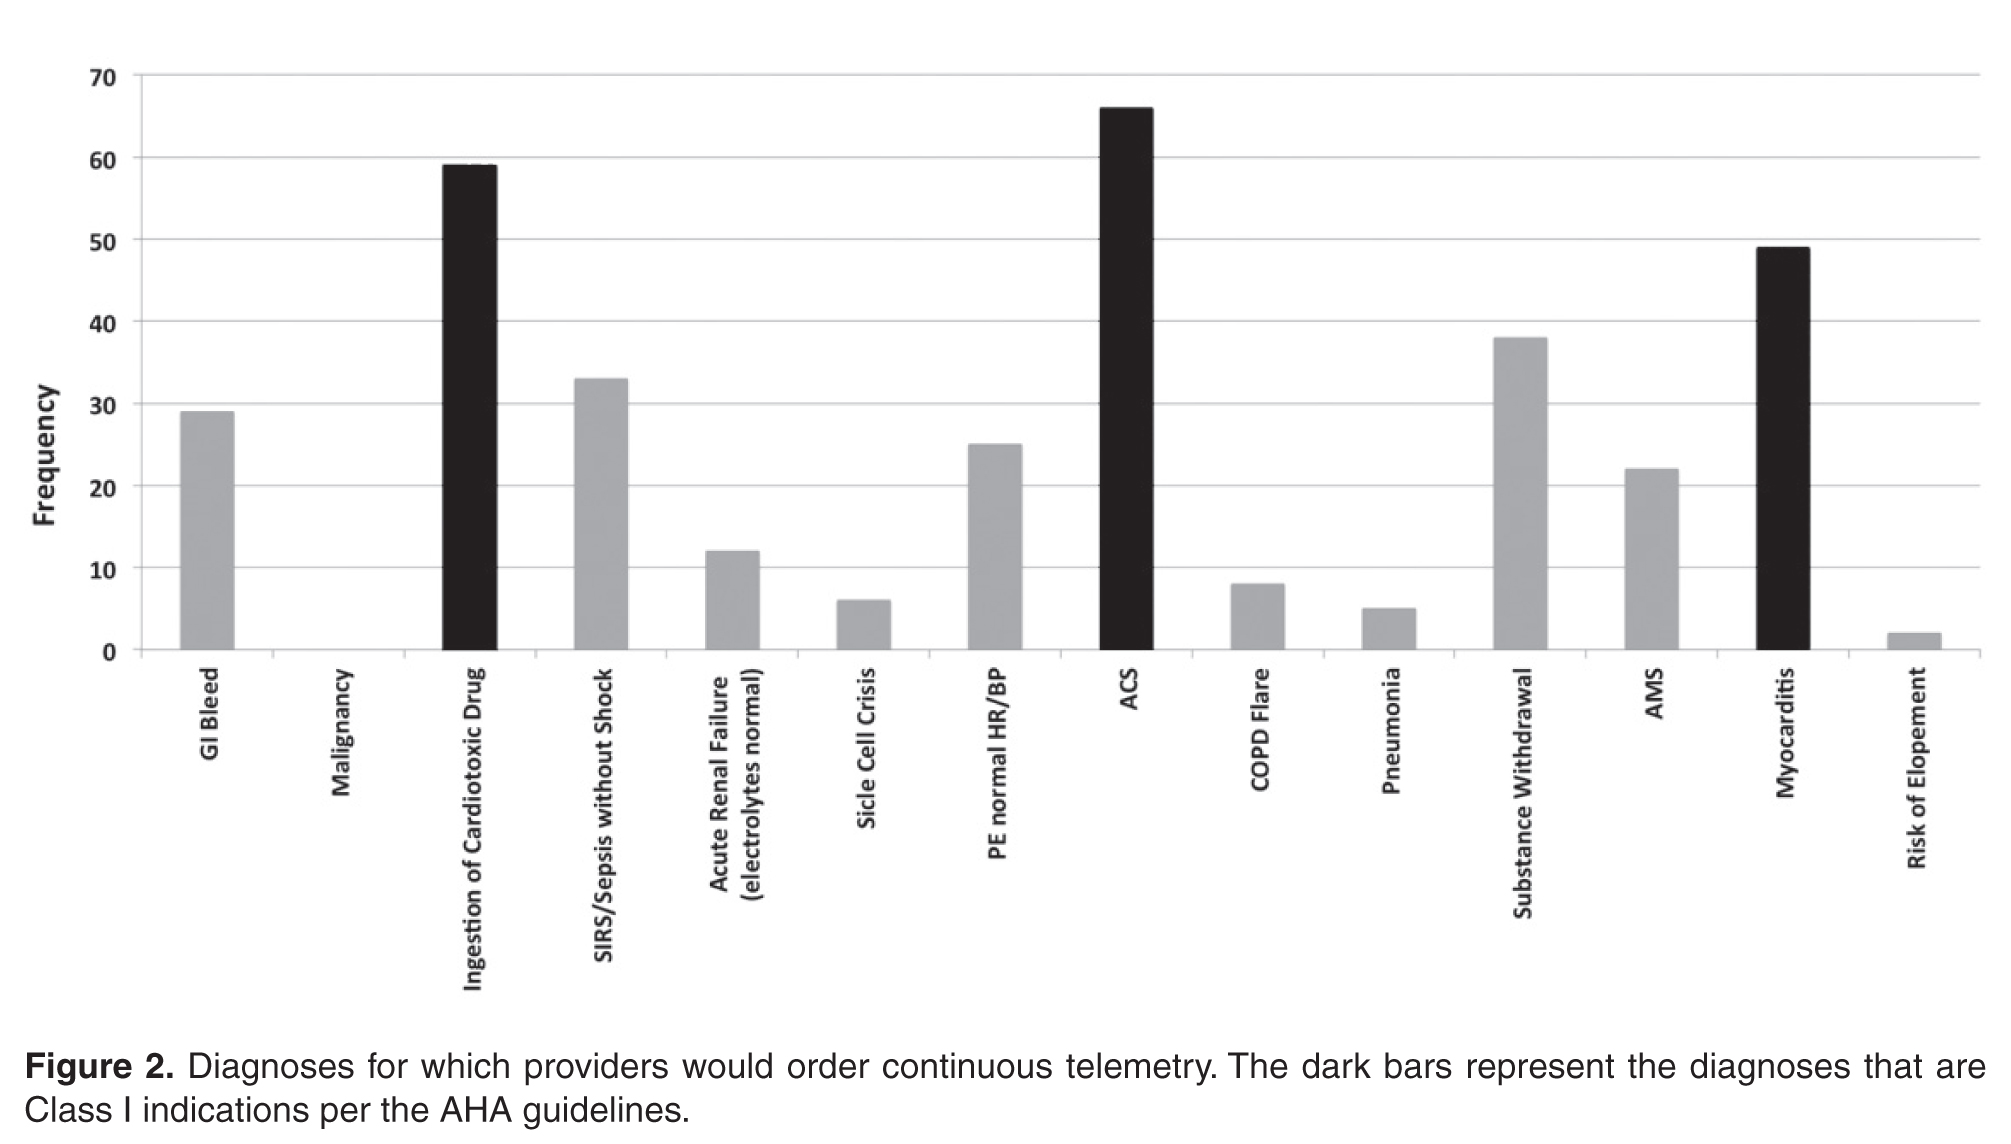
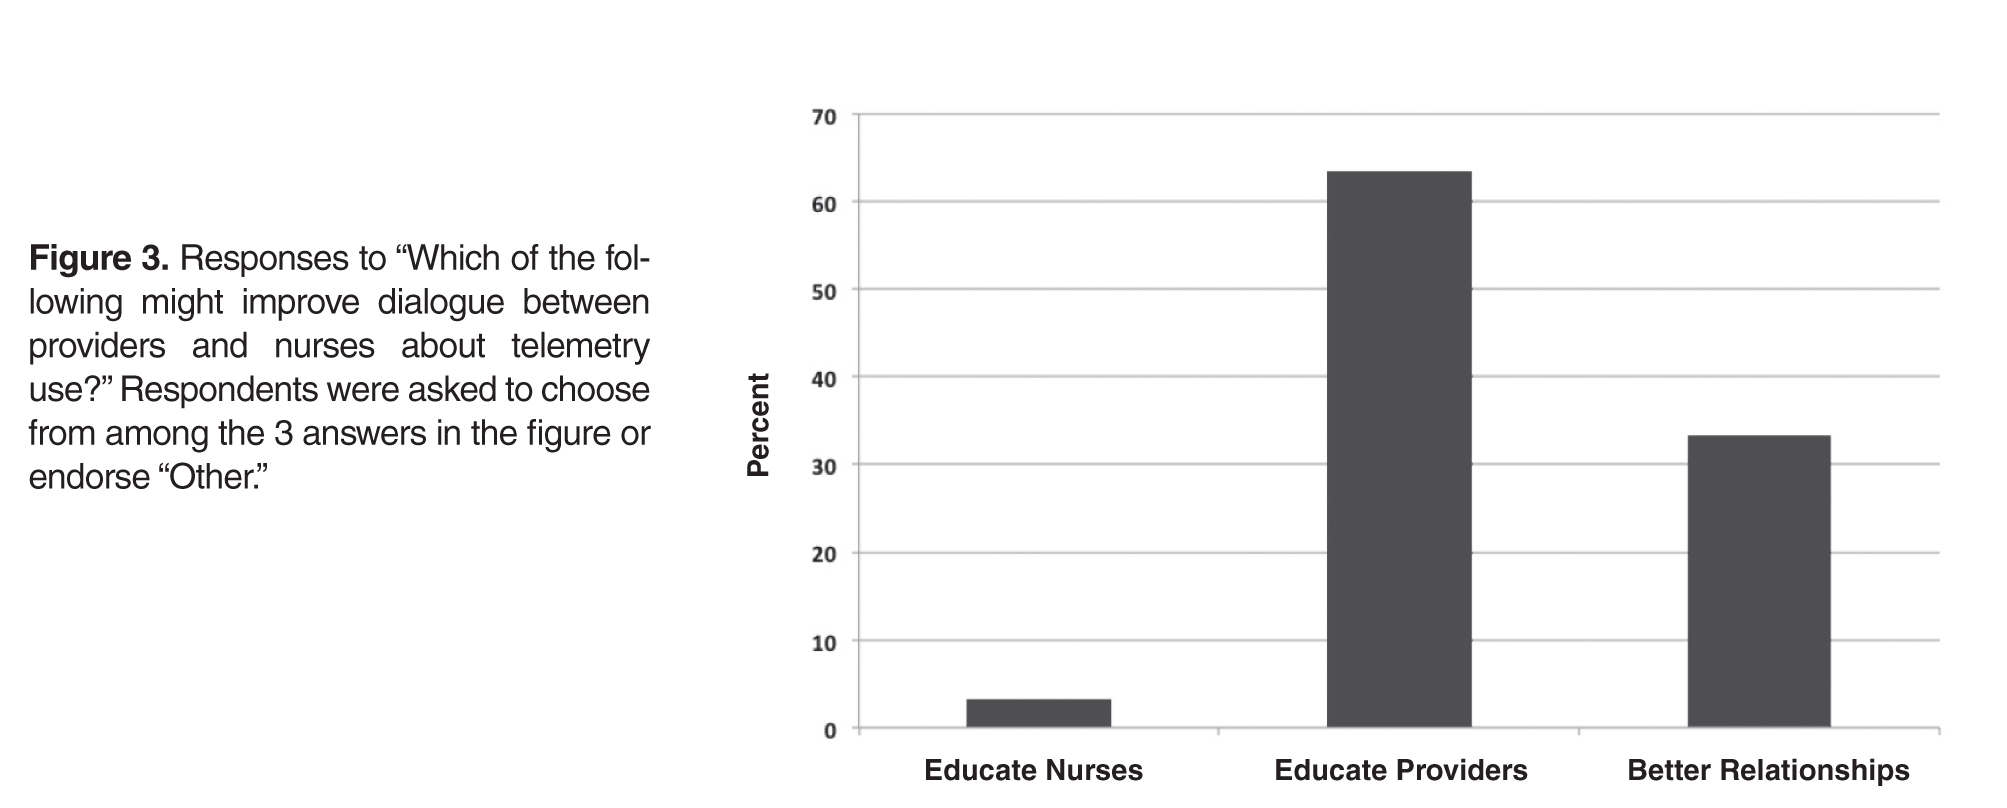
Discussion
Consistent with previous studies [3–5,9–15], the majority of providers at our institution do not think continuous telemetry is appropriately utilized. Most survey respondents acknowledged a lack of awareness surrounding current guideline recommendations, which could explain why providers often do not follow them. Despite conceding their knowledge deficits, providers assumed their practice patterns for ordering telemetry were “appropriate”(ie, guideline-supported). This assertion may be incorrect as the majority of providers in our survey chose at least 1 non–guideline-supported indication for telemetry. Other studies have suggested additional reasons for inappropriate telemetry utilization. Providers may disagree with guideline recommendations, may assign lesser importance to guidelines when caring for an individual patient, or may fall victim to inertia (ie, not ordering telemetry appropriately simply because changing one’s practice pattern is difficult) [7].
In addition, the majority of our providers perceived telemetry overuse, which has been well-recognized nationwide [4]. While we did not assess this directly, other studies suggest that providers may overuse telemetry to provide a sense of reassurance when caring for a sick patient, since continuous telemetry is perceived to provide a higher level of care [6,15–17]. Unfortunately, no study has shown a benefit for continuous telemetry when placed for non-guideline-based diagnoses—whether for cardiac or non-cardiac diagnoses [3,9–11,13,14]. Likewise, the guidelines suggest that telemetry use should be time-limited, since the majority of benefit is accrued in the first 48 hours. Beyond that time, no study has shown a clear benefit to continuous telemetry [2]. Therefore, telemetry overuse may lead to unnecessarily increased costs without added benefits [3,9–11,13–15,18].
Our conclusions are tempered by the nature of our survey data. We recognize that our survey has not been previously validated. In addition, our response rates were low. This low sample size may lead to under-representation of diverse ideas. Also, our survey results may not be generalizable, since our study was conducted at a single academic hospital. Our institution’s telemetry ordering culture may differ from others, therefore making our results less applicable to other centers.
Despite these limitations, our results aid in understanding attitudes that surround the use of continuous telemetry, which can shape formal educational interventions to encourage appropriate guideline-based telemetry use. Since our providers agree on the need for more education about the guidelines, components such as online modules or in-person lecture educational sessions, newsletters, email communications, and incorporation of AHA guidelines into the institution’s automated computer order entry system could be utilized [17]. Didactic interventions could be designed especially for trainees given their overall lack of familiarity with the guidelines. Another potential intervention could include supplying providers with publically shared personalized measures of their own practices, since providers benefit from reinforcement and individualized feedback on appropriate utilization practices [19]. Previous studies have suggested that a multidisciplinary approach to patient care leads to positive outcomes [20,21], and in our experience, nursing input is absolutely critical in outlining potential problems and in developing solutions. Our findings suggest that nurses could play an active role in alerting providers when patients have telemetry in use and identifying patients who may no longer need it.
In summary, we have shown that many providers at a tertiary academic institution utilized continuous telemetry inappropriately, and were unaware of guidelines surrounding telemetry use. Future interventions aimed at educating providers, encouraging dialogue between staff, and enabling guideline-supported utilization may increase appropriate telemetry use leading to lower cost and improved quality of patient care.
Acknowledgment: The authors wish to thank Dr. Colleen Christmas, Dr. Panagis Galiatsatos, Mrs. Barbara Brigade, Ms. Joetta Love, Ms. Terri Rigsby, and Mrs. Lisa Shirk for their invaluable technical and administrative support.
Corresponding author: Amber Johnson, MD, MBA, 200 Lothrop St., S-553 Scaife Hall, Pittsburgh, PA 15213, amberjohn@gmail.com.
Financial disclosures: None.


1. Day H. Preliminary studies of an acute coronary care area. J Lancet 1963;83:53–5.
2. Drew B, Califf R, Funk M, et al. Practice standards for electrocardiographic monitoring in hospital settings: an American Heart Association scientific statement from the Councils on Cardiovascular Nursing, Clinical Cardiology, and Cardiovascular Disease in the Young: Endorsed by the International Society of Computerized Electrocardiology and the American Association of Critical-Care Nurses. Circulation 2004;110:2721–46.
3. Estrada C, Battilana G, Alexander M, et al. Evaluation of guidelines for the use of telemetry in the non-intensive-care setting. J Gen Intern Med 2000;15:51–5.
4. Henriques-Forsythe M, Ivonye C, Jamched U, et al. Is telemetry overused? Is it as helpful as thought? Cleve Clin J Med 2009;76:368–72.
5. Chen E, Hollander, J. When do patients need admission to a telemetry bed? J Emerg Med 2007;33:53–60.
6. Najafi N, Auerbach A. Use and outcomes of telemetry monitoring on a medicine service. Arch Intern Med 2012;172:1349–50.
7. Cabana M, Rand C, Powe N, et al. Why don't physicians follow clinical practice guidelines?: A framework for improvement. JAMA 1999;282:1458–65.
8. Adult hospital medicine. Five things physicians and patients should question. 15 Aug 2013. Available at www.choosingwisely.org/doctor-patient-lists/society-of-hospital-medicine-adult-hospital-medicine/
9. Durairaj L, Reilly B, Das K, et al. Emergency department admissions to inpatient cardiac telemetry beds: A prospective cohort study of risk stratification and outcomes. Am J Med 2001;110:7–11.
10. Estrada C, Rosman H, Prasad N, et al. Role of telemetry monitoring in the non-intensive care unit. Am J Cardiol 1995;76:960–5.
11. Hollander J, Sites F, Pollack C, Shofer F. Lack of utility of telemetry monitoring for identification of cardiac death and life-threatening ventricular dysrhythmias in low-risk patients with chest pain. Ann Emerg Med 2004;43:71–6.
12. Ivonye C, Ohuabunwo C, Henriques-Forsythe M, et al. Evaluation of telemetry utilization, policy, and outcomes in an inner-city academic medical center. J Natl Med Assoc 2010;102:598–604.
13. Schull M, Redelmeier D. Continuous electrocardiographic monitoring and cardiac arrest outcomes in 8,932 telemetry ward patients. Acad Emerg Med 2000;7:647–52.
14. Sivaram C, Summers J, Ahmed N. Telemetry outside critical care units: patterns of utilization and influence on management decisions. Clin Cardiol 1998;21:503–5.
15. Snider A, Papaleo M, Beldner S, et al. Is telemetry monitoring necessary in low-risk suspected acute chest pain syndromes? Chest 2002;122:517–23.
16. Chen S, Zakaria S. Behind the monitor-The trouble with telemetry: a teachable moment. JAMA Intern Med 2015;175:894.
17. Dressler R, Dryer M, Coletti C, et al. Altering overuse of cardiac telemetry in non-intensive care unit settings by hardwiring the use of American Heart Association guidelines. JAMA Intern Med 2014;174:1852–4.
18. Benjamin E, Klugman R, Luckmann R, et al. Impact of cardiac telemetry on patient safety and cost. Am J Manag Care 2013;19:e225–32.
19. Solomon D, Hashimoto H, Daltroy L, Liang M. Techniques to improve physicians use of diagnostic tests: A new conceptual framework. JAMA 1998;280:2020–7.
20. Richeson J, Johnson J. The association between interdisciplinary collaboration and patient outcomes in a medical intensive care unit. Heart Lung 1992;21:18–24.
21. Curley C, McEachern J, Speroff T. A firm trial of interdisciplinary rounds on the inpatient medical wards: an intervention designed using continuous quality improvement. Med Care 1998;36:AS4–12.
From the Johns Hopkins Bayview Medical Center, Baltimore, MD (Drs. Johnson, Knight, Maygers, and Zakaria), and Duke University Hospital, Durham, NC (Dr. Mock).
Abstract
- Objective: To determine patterns of telemetry use at a tertiary academic institution and identify factors contributing to noncompliance with guidelines regarding telemetry use.
- Methods: Web-based survey of 180 providers, including internal medicine residents and cardiovascular disease fellows, hospitalists, non-hospitalist teaching attending physicians, nurse practitioners, and physician assistants.
- Results: Of the 180 providers surveyed, 67 (37%) replied. Most providers (76%) were unaware of guidelines regarding appropriate telemetry use and 85% selected inappropriate diagnoses as warranting telemetry. Only 21% routinely discontinued the telemetry order within 48 hours.
- Conclusions: Many providers at a tertiary academic institution utilize continuous telemetry inappropriately and are unaware of telemetry guidelines. These findings should guide interventions to improve telemetry utilization.
For many decades, telemetry has been widely used in the management and monitoring of patients with possible acute coronary syndromes (ACS), arrhythmias, cardiac events, and strokes [1]. In addition, telemetry has often been used in other clinical scenarios with less rigorous data supporting its use [2–4]. As a result, in 2004 the American Heart Association (AHA) issued guidelines providing recommendations for best practices in hospital ECG monitoring. Indications for telemetry were classified into 3 diagnosis-driven groups: class I (indicated in all patients), class II (indicated in most patients, may be of benefit) and class III (not indicated, no therapeutic benefit) [2]. However, these recommendations have not been widely followed and telemetry is inappropriately used for many inpatients [5,6].
There are several reasons why clinicians fail to adhere to guidelines, including knowledge deficits, attitudes regarding the current guidelines, and institution-specific factors influencing practitioner behaviors [7]. In response to reports of widespread telemetry overuse, the Choosing Wisely Campaign of the American Board of Internal Medicine Foundation has championed judicious telemetry use, advocating evidence-based, protocol-driven telemetry management for patients not in intensive care units who do not meet guideline-based criteria for continuous telemetry [8].
In order to understand patterns of telemetry use at our academic institution and identify factors associated with this practice, we systematically analyzed telemetry use perceptions through provider surveys. We hypothesized that providers have misperceptions about appropriate use of telemetry and that this knowledge gap results in overuse of telemetry at our institution.
Methods
Setting
Johns Hopkins Bayview Medical Center is a 400-bed academic medical center serving southeastern Baltimore. Providers included internal medicine residents and cardiovascular disease fellows who rotate to the medical center and Johns Hopkins Hospital, hospitalists, non-hospitalist teaching attending physicians, nurse practitioners (NPs), and physician assistants (PAs).
Current Telemetry Practice
Remote telemetric monitoring is available in all adult, non-intensive care units of the hospital except for the psychiatry unit. However, the number of monitors are limited and it is not possible to monitor every patient if the wards are at capacity. Obstetrics uses its own unique cardiac monitoring system and thus was not included in the survey. Each monitor (IntelliVue, Philips Healthcare, Amsterdam, Netherlands) is attached to the patient using 5 lead wires, with electrocardiographic data transmitted to a monitoring station based in the progressive care unit, a cardio-pulmonary step-down unit. Monitors can be ordered in one of 3 manners, as mandated by hospital policy:
- Continuous telemetry – Telemetry monitoring is uninterrupted until discontinued by a provider.
- Telemetry protocol – Within 12 hours of telemetry placement, a monitor technician generates a report, which is reviewed by the nurse caring for the patient. The nurse performs an electrocardiogram (ECG) if the patient meets pre-specified criteria for telemetry discontinuation, which includes the absence of arrhythmias, troponin elevations, chest pain, or hemodynamic instability. The repeat ECG is then read and signed by the provider. After these criteria are met, telemetry can be discontinued.
- Stroke telemetry protocol – Telemetry is applied for 48 hours, mainly for detection of paroxysmal atrial fibrillation. Monitoring can be temporarily discontinued if the patient requires magnetic resonance imaging, which interferes with the telemetric monitors.
When entering any of the 3 possible telemetry orders in our computerized provider order entry system (Meditech, Westwood, MA), the ordering provider is required to indicate baseline rhythm, pacemaker presence, and desired heart rate warning parameters. Once the order is electronically signed, a monitor technician notes the order in a logbook and assigns the patient a telemeter, which is applied by the patient’s nurse.
If a monitored patient develops any predefined abnormal rhythm, audible alerts notify monitor technicians and an alert is sent to a portable telephone carried by the patient’s assigned nurse. Either the monitoring technician or the nurse then has the discretion to silence the alarm, note it in the chart, and/or contact the patient’s provider. If alerts are recorded, then a sample telemetry monitoring strip is saved into the patient’s paper medical chart.
Survey Instrument
After approval from the Johns Hopkins institutional review board, we queried providers who worked on the medicine and cardiology wards to assess the context and culture in which telemetry monitoring is used (see Appendix). The study was exempt from requiring informed consent. All staff had the option to decline study participation. We administered the survey using an online survey software program (SurveyMonkey, Palo Alto, CA), sending survey links via email to all internal medicine residents, cardiovascular disease fellows, internal medicine and cardiology teaching attending physicians, hospitalists, NPs, and PAs. Respondents completed the survey anonymously. To increase response rates, providers were sent a monthly reminder email. The survey was open from March 2014 to May 2014 for a total of 3 months.
Analysis
The survey data were compiled and analyzed using Microsoft Excel (Mac version 14.4; Microsoft, Redmond, WA). Variables are displayed as numbers and percentages, as appropriate.
Results
All providers reported having ordered telemetry, but almost all were either unaware of (76%) or only somewhat familiar with (21%) the AHA guidelines for appropriate telemetry use. Notably, the vast majority of fellows and residents reported that they were not at all familiar with the guidelines (100% and 96%, respectively). When asked why providers do not adhere to telemetry guidelines, lack of awareness of and lack of familiarity with the guidelines were the top 2 choices among respondents (Figure 1).
Additionally, most providers acknowledged experiencing adverse effects of telemetry: 86% (57/66) had experienced delayed patient transfers from the emergency department to inpatient floors due to telemetry unavailability and 97% (65/67) had experienced some delay in obtaining tests or studies for their telemetry-monitored patients. Despite acknowledging the potential consequences of telemetry use, only 21% (14/66) of providers routinely (ie, > 75% of the time) discontinued telemetry within 48 hours. Fifteen percent (10/65) routinely allowed telemetry to continue until the time of patient discharge. When discontinued, it was mainly due to the provider’s decision (57%); however, respondents noted that nurses prompted telemetry discontinuation 28% of the time.
Discussion
Consistent with previous studies [3–5,9–15], the majority of providers at our institution do not think continuous telemetry is appropriately utilized. Most survey respondents acknowledged a lack of awareness surrounding current guideline recommendations, which could explain why providers often do not follow them. Despite conceding their knowledge deficits, providers assumed their practice patterns for ordering telemetry were “appropriate”(ie, guideline-supported). This assertion may be incorrect as the majority of providers in our survey chose at least 1 non–guideline-supported indication for telemetry. Other studies have suggested additional reasons for inappropriate telemetry utilization. Providers may disagree with guideline recommendations, may assign lesser importance to guidelines when caring for an individual patient, or may fall victim to inertia (ie, not ordering telemetry appropriately simply because changing one’s practice pattern is difficult) [7].
In addition, the majority of our providers perceived telemetry overuse, which has been well-recognized nationwide [4]. While we did not assess this directly, other studies suggest that providers may overuse telemetry to provide a sense of reassurance when caring for a sick patient, since continuous telemetry is perceived to provide a higher level of care [6,15–17]. Unfortunately, no study has shown a benefit for continuous telemetry when placed for non-guideline-based diagnoses—whether for cardiac or non-cardiac diagnoses [3,9–11,13,14]. Likewise, the guidelines suggest that telemetry use should be time-limited, since the majority of benefit is accrued in the first 48 hours. Beyond that time, no study has shown a clear benefit to continuous telemetry [2]. Therefore, telemetry overuse may lead to unnecessarily increased costs without added benefits [3,9–11,13–15,18].
Our conclusions are tempered by the nature of our survey data. We recognize that our survey has not been previously validated. In addition, our response rates were low. This low sample size may lead to under-representation of diverse ideas. Also, our survey results may not be generalizable, since our study was conducted at a single academic hospital. Our institution’s telemetry ordering culture may differ from others, therefore making our results less applicable to other centers.
Despite these limitations, our results aid in understanding attitudes that surround the use of continuous telemetry, which can shape formal educational interventions to encourage appropriate guideline-based telemetry use. Since our providers agree on the need for more education about the guidelines, components such as online modules or in-person lecture educational sessions, newsletters, email communications, and incorporation of AHA guidelines into the institution’s automated computer order entry system could be utilized [17]. Didactic interventions could be designed especially for trainees given their overall lack of familiarity with the guidelines. Another potential intervention could include supplying providers with publically shared personalized measures of their own practices, since providers benefit from reinforcement and individualized feedback on appropriate utilization practices [19]. Previous studies have suggested that a multidisciplinary approach to patient care leads to positive outcomes [20,21], and in our experience, nursing input is absolutely critical in outlining potential problems and in developing solutions. Our findings suggest that nurses could play an active role in alerting providers when patients have telemetry in use and identifying patients who may no longer need it.
In summary, we have shown that many providers at a tertiary academic institution utilized continuous telemetry inappropriately, and were unaware of guidelines surrounding telemetry use. Future interventions aimed at educating providers, encouraging dialogue between staff, and enabling guideline-supported utilization may increase appropriate telemetry use leading to lower cost and improved quality of patient care.
Acknowledgment: The authors wish to thank Dr. Colleen Christmas, Dr. Panagis Galiatsatos, Mrs. Barbara Brigade, Ms. Joetta Love, Ms. Terri Rigsby, and Mrs. Lisa Shirk for their invaluable technical and administrative support.
Corresponding author: Amber Johnson, MD, MBA, 200 Lothrop St., S-553 Scaife Hall, Pittsburgh, PA 15213, amberjohn@gmail.com.
Financial disclosures: None.
1. Day H. Preliminary studies of an acute coronary care area. J Lancet 1963;83:53–5.
2. Drew B, Califf R, Funk M, et al. Practice standards for electrocardiographic monitoring in hospital settings: an American Heart Association scientific statement from the Councils on Cardiovascular Nursing, Clinical Cardiology, and Cardiovascular Disease in the Young: Endorsed by the International Society of Computerized Electrocardiology and the American Association of Critical-Care Nurses. Circulation 2004;110:2721–46.
3. Estrada C, Battilana G, Alexander M, et al. Evaluation of guidelines for the use of telemetry in the non-intensive-care setting. J Gen Intern Med 2000;15:51–5.
4. Henriques-Forsythe M, Ivonye C, Jamched U, et al. Is telemetry overused? Is it as helpful as thought? Cleve Clin J Med 2009;76:368–72.
5. Chen E, Hollander, J. When do patients need admission to a telemetry bed? J Emerg Med 2007;33:53–60.
6. Najafi N, Auerbach A. Use and outcomes of telemetry monitoring on a medicine service. Arch Intern Med 2012;172:1349–50.
7. Cabana M, Rand C, Powe N, et al. Why don't physicians follow clinical practice guidelines?: A framework for improvement. JAMA 1999;282:1458–65.
8. Adult hospital medicine. Five things physicians and patients should question. 15 Aug 2013. Available at www.choosingwisely.org/doctor-patient-lists/society-of-hospital-medicine-adult-hospital-medicine/
9. Durairaj L, Reilly B, Das K, et al. Emergency department admissions to inpatient cardiac telemetry beds: A prospective cohort study of risk stratification and outcomes. Am J Med 2001;110:7–11.
10. Estrada C, Rosman H, Prasad N, et al. Role of telemetry monitoring in the non-intensive care unit. Am J Cardiol 1995;76:960–5.
11. Hollander J, Sites F, Pollack C, Shofer F. Lack of utility of telemetry monitoring for identification of cardiac death and life-threatening ventricular dysrhythmias in low-risk patients with chest pain. Ann Emerg Med 2004;43:71–6.
12. Ivonye C, Ohuabunwo C, Henriques-Forsythe M, et al. Evaluation of telemetry utilization, policy, and outcomes in an inner-city academic medical center. J Natl Med Assoc 2010;102:598–604.
13. Schull M, Redelmeier D. Continuous electrocardiographic monitoring and cardiac arrest outcomes in 8,932 telemetry ward patients. Acad Emerg Med 2000;7:647–52.
14. Sivaram C, Summers J, Ahmed N. Telemetry outside critical care units: patterns of utilization and influence on management decisions. Clin Cardiol 1998;21:503–5.
15. Snider A, Papaleo M, Beldner S, et al. Is telemetry monitoring necessary in low-risk suspected acute chest pain syndromes? Chest 2002;122:517–23.
16. Chen S, Zakaria S. Behind the monitor-The trouble with telemetry: a teachable moment. JAMA Intern Med 2015;175:894.
17. Dressler R, Dryer M, Coletti C, et al. Altering overuse of cardiac telemetry in non-intensive care unit settings by hardwiring the use of American Heart Association guidelines. JAMA Intern Med 2014;174:1852–4.
18. Benjamin E, Klugman R, Luckmann R, et al. Impact of cardiac telemetry on patient safety and cost. Am J Manag Care 2013;19:e225–32.
19. Solomon D, Hashimoto H, Daltroy L, Liang M. Techniques to improve physicians use of diagnostic tests: A new conceptual framework. JAMA 1998;280:2020–7.
20. Richeson J, Johnson J. The association between interdisciplinary collaboration and patient outcomes in a medical intensive care unit. Heart Lung 1992;21:18–24.
21. Curley C, McEachern J, Speroff T. A firm trial of interdisciplinary rounds on the inpatient medical wards: an intervention designed using continuous quality improvement. Med Care 1998;36:AS4–12.