User login
DOACs for treatment of cancer-associated venous thromboembolism
Bleeding risk may determine best option
Case
A 52-year-old female with past medical history of diabetes, hypertension, and stage 4 lung cancer on palliative chemotherapy presents with acute-onset dyspnea, pleuritic chest pain, and cough. Her exam is notable for tachycardia, hypoxemia, and diminished breath sounds. A CT pulmonary embolism study shows new left segmental thrombus. What is her preferred method of anticoagulation?

Brief overview of the issue
Venous thromboembolism (VTE) including deep vein thrombosis (DVT) and pulmonary embolism (PE), is a significant concern in the context of malignancy and is associated with higher rates of mortality at 1 year.
The standard of care in the recent past has relied on low-molecular-weight heparin (LMWH) after several trials showed decreased VTE recurrence in cancer patients, compared with vitamin K antagonist (VKA) treatment.1,2 LMWH has been recommended as a first-line treatment by clinical guidelines for cancer-related VTE given lower drug-drug interactions between LMWH and chemotherapy regimens, as compared with traditional VKAs, and it does not rely on intestinal absorption.3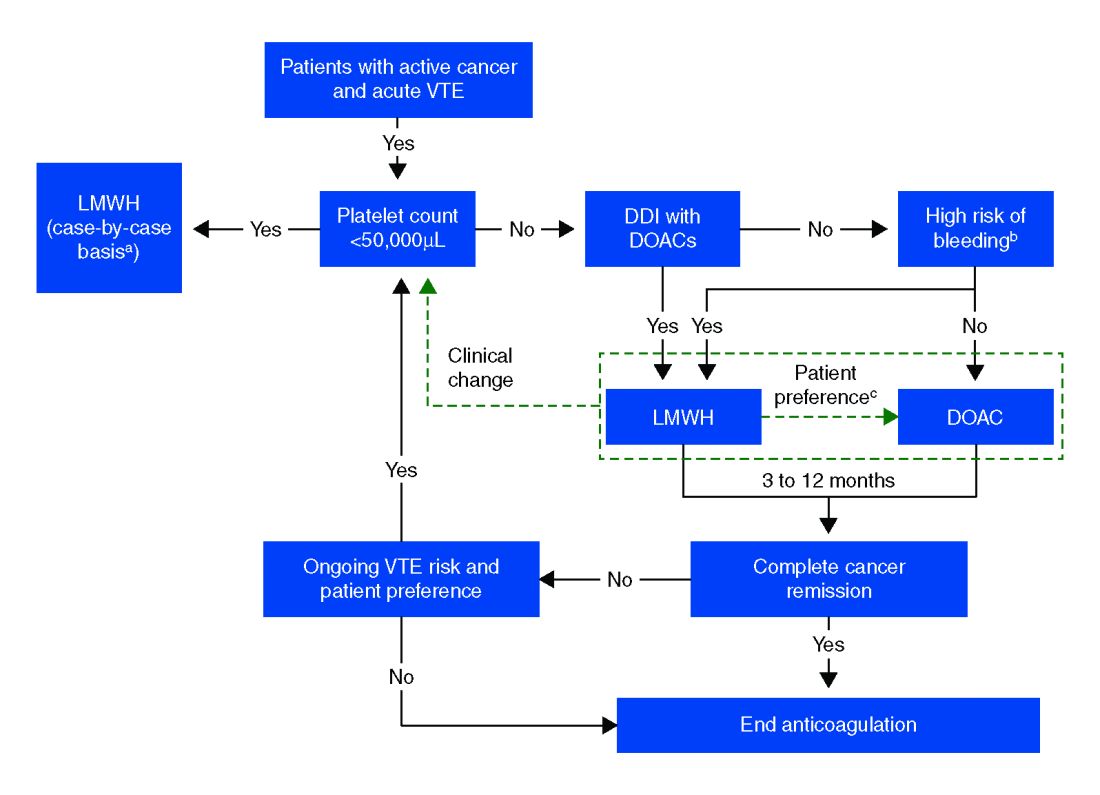
In more recent years, the focus has shifted to direct oral anticoagulants (DOACs) as potential treatment options for cancer-related VTE given their ease of administration, low side-effect profile, and decreased cost. Until recently, studies have mainly been small and largely retrospective, however, several larger randomized control studies have recently been published.
Overview of the data
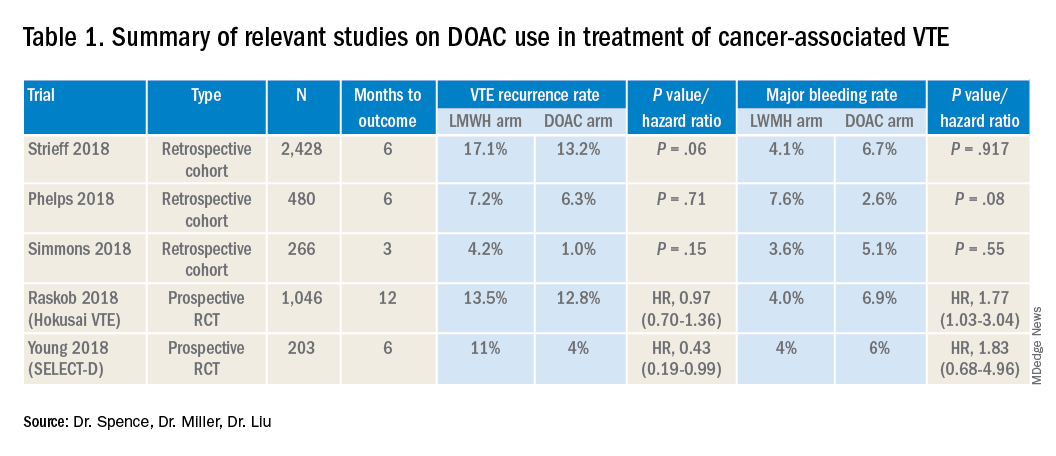
Several retrospective trials have investigated the use of DOACs in cancer-associated VTE. One study looking at VTE recurrence rates showed a trend towards lower rates with rivaroxaban, compared with LMWH at 6 months (13% vs. 17%) that was significantly lower at 12 months (16.5 % vs. 22%). Similar results were found when comparing rivaroxaban to warfarin. Major bleeding rates were similar among cohorts.4
Several other retrospective cohort studies looking at treatment of cancer-associated VTE treated with LMWH vs. DOACs found that overall patients treated with DOACs had cancers with lower risk for VTE and had lower burden of metastatic disease. When this was adjusted for, there was no significant difference in the rate of recurrent cancer-associated thrombosis or major bleeding.5,6
Recently several prospective studies have corroborated the noninferiority or slight superiority of DOACs when compared with LMWH in treatment of cancer-associated VTE, while showing similar rates of bleeding. These are summarized as follows: a prospective, open-label, randomized controlled (RCT), noninferiority trial of 1,046 patients with malignancy-related VTE assigned to either LMWH for at least 5 days, followed by oral edoxaban vs. subcutaneous dalteparin for at least 6 months and up to 12 months. Investigators found no significant difference in the rate of recurrent VTE in the edoxaban group (12.8%), as compared to the dalteparin group (13.5%, P = .006 for noninferiority). Risk of major bleeding was not significantly different between the groups.7
A small RCT of 203 patients comparing recurrent VTE rates with rivaroxaban vs. dalteparin found significantly fewer recurrent clots in the rivaroxaban group compared to the dalteparin group (11% vs 4%) with no significant difference in the 6-month cumulative rate of major bleeding, 4% in the dalteparin group and 6% for the rivaroxaban group.8 Preliminary results from the ADAM VTE trial comparing apixaban to dalteparin found significantly fewer recurrent VTE in the apixaban group (3.4% vs. 14.1%) with no significant difference in major bleeding events (0% vs 2.1%).9 The Caravaggio study is a large multinational randomized, controlled, open-label, noninferiority trial looking at apixaban vs. dalteparin with endpoints being 6-month recurrent VTE and bleeding risk that will likely report results soon.
Risk of bleeding is also a major consideration in VTE treatment as studies suggest that patients with metastatic cancer are at sixfold higher risk for anticoagulant-associated bleeding.3 Subgroup analysis of Hokusai VTE cancer study found that major bleeding occurred in 32 of 522 patients given edoxaban and 16 of 524 patients treated with dalteparin. Excess of major bleeding with edoxaban was confined to patients with GI cancer. However, rates of severe major bleeding at presentation were similar.10
Overall, the existing data suggests that DOACs may be a viable option in the treatment of malignancy-associated VTE given its similar efficacy in preventing recurrent VTE without significant increased risk of major bleeding. The 2018 International Society on Thrombosis and Haemostasis VTE in cancer guidelines have been updated to include rivaroxaban and edoxaban for use in patients at low risk of bleeding, but recommend an informed discussion between patients and clinicians in deciding between DOAC and LMWH.11 The Chest VTE guidelines have not been updated since 2016, prior to when the above mentioned DOAC studies were published.
Application of data to our patient
Compared with patients without cancer, anticoagulation in cancer patients with acute VTE is challenging because of higher rates of VTE recurrence and bleeding, as well as the potential for drug interactions with anticancer agents. Our patient is not at increased risk for gastrointestinal bleeding and no drug interactions exist between her current chemotherapy regimen and the available DOACs, therefore she is a candidate for treatment with a DOAC.

After an informed discussion, she chose to start rivaroxaban for treatment of her pulmonary embolism. While more studies are needed to definitively determine the best treatment for cancer-associated VTE, DOACs appear to be an attractive alternative to LMWH. Patient preferences of taking oral medications over injections as well as the significant cost savings of DOACs over LMWH will likely play into many patients’ and providers’ anticoagulant choices.
Bottom line
Direct oral anticoagulants are a treatment option for cancer-associated VTE in patients at low risk of bleeding complications. Patients at increased risk of bleeding (especially patients with GI malignancies) should continue to be treated with LMWH.
Dr. Spence is a hospitalist and palliative care physician at Denver Health, and an assistant professor of medicine at the University of Colorado at Denver, Aurora. Dr. Miller and Dr. Liu are hospitalists at Denver Health, and assistant professors of medicine at the University of Colorado at Denver.
References
1. Hull RD et al. Long term low-molecular-weight heparin versus usual care in proximal-vein thrombosis patient with cancer. Am J Med. 2006;19(12):1062-72.
2. Lee AY et al. Low-molecular-weight heparin versus Coumadin for the prevention of recurrent venous thromboembolism in patients with cancer. N Engl J Med. 2003;349(2):146-53.
3. Ay C et al. Treatment of cancer-associated venous thromboembolism in the age of direct oral anticoagulants. Ann Oncol. 2019 Mar 27 [epub].
4. Streiff MB et al. Effectiveness and safety of anticoagulants for the treatment of venous thromboembolism in patients with cancer. Am J Hematol. 2018 May;93(5):664-71.
5. Phelps MK et al. A single center retrospective cohort study comparing low-molecular-weight heparins to direct oral anticoagulants for the treatment of venous thromboembolism in patients with cancer – A real-world experience. J Oncol Pharm Pract. 2019 Jun;25(4):793-800.
6. Simmons B et al. Efficacy and safety of rivaroxaban compared to enoxaparin in treatment of cancer-associated venous thromboembolism. Eur J Haematol. 2018 Apr 4. (Epub).
7. Raskob GE et al.; Hokusai VTE Cancer Investigators. Edoxaban for the treatment of cancer-associated venous thromboembolism. N Engl J Med. 2018 Feb 15;378(7):615-24.
8. Young AM et al. Comparison of an oral factor Xa inhibitor with low molecular weight heparin in patients with cancer with venous thromboembolism: Results of a randomized trial (SELECT-D). J Clin Oncol. 2018 Jul 10;36(20):2017-23.
9. McBane, RD et al. Apixaban, dalteparin, in active cancer associated venous thromboembolism, the ADAM VTE trial. Blood. 2018 Nov 29;132(suppl 1):421.
10. Kraaijpoel N et al. Clinical impact of bleeding in cancer-associated venous thromboembolism: Results from the Hokusai VTE cancer study. Thromb Haemost. 2018 Aug;118(8):1439-49.
11. Khorana AA et al. Role of direct oral anticoagulants in the treatment of cancer-associated venous thromboembolism: Guidance from the SSC of the ISTH. J Thromb Haemost. 2018 Sep;16(9):1891-94.
Key points
- DOACs are a reasonable treatment option for malignancy-associated VTE in patients without GI tract malignancies and at low risk for bleeding complications.
- In patients with gastrointestinal malignancies or increased risk of bleeding, DOACs may have an increased bleeding risk and therefore LMWH is recommended.
- An informed discussion should occur between providers and patients to determine the best treatment option for cancer patients with VTE.
Additional reading
Dong Y et al. Efficacy and safety of direct oral anticoagulants versus low-molecular-weight heparin in patients with cancer: A systematic review and meta-analysis. J Thromb Thrombolysis. 2019 May 6.
Khorana AA et al. Role of direct oral anticoagulants in the treatment of cancer-associated venous thromboembolism: guidance from the SSC of the ISTH. J Thromb Haemost. 2018 Sep;16(9):1891-94.
Tritschler T et al. Venous thromboembolism advances in diagnosis and treatment. JAMA. 2018 Oct;320(15):1583-94.
Quiz
Which of the following is the recommended treatment of VTE in a patient with brain metastases?
A. Unfractionated heparin
B. Low molecular weight heparin
C. Direct oral anticoagulant
D. Vitamin K antagonist
The answer is B. Although there are very few data, LMWH is the recommended agent in patients with VTE and brain metastases.
A. LMWH has been shown to decrease mortality in patients with VTE and cancer, compared with unfractionated heparin (risk ratio, 0.66).
C. The safety of DOACs is not yet well established in patients with brain tumors. Antidotes and/or specific reversal agents for some DOACs are not available.
D. Vitamin K antagonists such as warfarin are not recommended in cancer patients because LMWH has a reduced risk of recurrent VTE without increased risk of bleeding.
Bleeding risk may determine best option
Bleeding risk may determine best option
Case
A 52-year-old female with past medical history of diabetes, hypertension, and stage 4 lung cancer on palliative chemotherapy presents with acute-onset dyspnea, pleuritic chest pain, and cough. Her exam is notable for tachycardia, hypoxemia, and diminished breath sounds. A CT pulmonary embolism study shows new left segmental thrombus. What is her preferred method of anticoagulation?
Brief overview of the issue
Venous thromboembolism (VTE) including deep vein thrombosis (DVT) and pulmonary embolism (PE), is a significant concern in the context of malignancy and is associated with higher rates of mortality at 1 year.
The standard of care in the recent past has relied on low-molecular-weight heparin (LMWH) after several trials showed decreased VTE recurrence in cancer patients, compared with vitamin K antagonist (VKA) treatment.1,2 LMWH has been recommended as a first-line treatment by clinical guidelines for cancer-related VTE given lower drug-drug interactions between LMWH and chemotherapy regimens, as compared with traditional VKAs, and it does not rely on intestinal absorption.3
In more recent years, the focus has shifted to direct oral anticoagulants (DOACs) as potential treatment options for cancer-related VTE given their ease of administration, low side-effect profile, and decreased cost. Until recently, studies have mainly been small and largely retrospective, however, several larger randomized control studies have recently been published.
Overview of the data
Several retrospective trials have investigated the use of DOACs in cancer-associated VTE. One study looking at VTE recurrence rates showed a trend towards lower rates with rivaroxaban, compared with LMWH at 6 months (13% vs. 17%) that was significantly lower at 12 months (16.5 % vs. 22%). Similar results were found when comparing rivaroxaban to warfarin. Major bleeding rates were similar among cohorts.4
Several other retrospective cohort studies looking at treatment of cancer-associated VTE treated with LMWH vs. DOACs found that overall patients treated with DOACs had cancers with lower risk for VTE and had lower burden of metastatic disease. When this was adjusted for, there was no significant difference in the rate of recurrent cancer-associated thrombosis or major bleeding.5,6
Recently several prospective studies have corroborated the noninferiority or slight superiority of DOACs when compared with LMWH in treatment of cancer-associated VTE, while showing similar rates of bleeding. These are summarized as follows: a prospective, open-label, randomized controlled (RCT), noninferiority trial of 1,046 patients with malignancy-related VTE assigned to either LMWH for at least 5 days, followed by oral edoxaban vs. subcutaneous dalteparin for at least 6 months and up to 12 months. Investigators found no significant difference in the rate of recurrent VTE in the edoxaban group (12.8%), as compared to the dalteparin group (13.5%, P = .006 for noninferiority). Risk of major bleeding was not significantly different between the groups.7
A small RCT of 203 patients comparing recurrent VTE rates with rivaroxaban vs. dalteparin found significantly fewer recurrent clots in the rivaroxaban group compared to the dalteparin group (11% vs 4%) with no significant difference in the 6-month cumulative rate of major bleeding, 4% in the dalteparin group and 6% for the rivaroxaban group.8 Preliminary results from the ADAM VTE trial comparing apixaban to dalteparin found significantly fewer recurrent VTE in the apixaban group (3.4% vs. 14.1%) with no significant difference in major bleeding events (0% vs 2.1%).9 The Caravaggio study is a large multinational randomized, controlled, open-label, noninferiority trial looking at apixaban vs. dalteparin with endpoints being 6-month recurrent VTE and bleeding risk that will likely report results soon.
Risk of bleeding is also a major consideration in VTE treatment as studies suggest that patients with metastatic cancer are at sixfold higher risk for anticoagulant-associated bleeding.3 Subgroup analysis of Hokusai VTE cancer study found that major bleeding occurred in 32 of 522 patients given edoxaban and 16 of 524 patients treated with dalteparin. Excess of major bleeding with edoxaban was confined to patients with GI cancer. However, rates of severe major bleeding at presentation were similar.10
Overall, the existing data suggests that DOACs may be a viable option in the treatment of malignancy-associated VTE given its similar efficacy in preventing recurrent VTE without significant increased risk of major bleeding. The 2018 International Society on Thrombosis and Haemostasis VTE in cancer guidelines have been updated to include rivaroxaban and edoxaban for use in patients at low risk of bleeding, but recommend an informed discussion between patients and clinicians in deciding between DOAC and LMWH.11 The Chest VTE guidelines have not been updated since 2016, prior to when the above mentioned DOAC studies were published.
Application of data to our patient
Compared with patients without cancer, anticoagulation in cancer patients with acute VTE is challenging because of higher rates of VTE recurrence and bleeding, as well as the potential for drug interactions with anticancer agents. Our patient is not at increased risk for gastrointestinal bleeding and no drug interactions exist between her current chemotherapy regimen and the available DOACs, therefore she is a candidate for treatment with a DOAC.
After an informed discussion, she chose to start rivaroxaban for treatment of her pulmonary embolism. While more studies are needed to definitively determine the best treatment for cancer-associated VTE, DOACs appear to be an attractive alternative to LMWH. Patient preferences of taking oral medications over injections as well as the significant cost savings of DOACs over LMWH will likely play into many patients’ and providers’ anticoagulant choices.
Bottom line
Direct oral anticoagulants are a treatment option for cancer-associated VTE in patients at low risk of bleeding complications. Patients at increased risk of bleeding (especially patients with GI malignancies) should continue to be treated with LMWH.
Dr. Spence is a hospitalist and palliative care physician at Denver Health, and an assistant professor of medicine at the University of Colorado at Denver, Aurora. Dr. Miller and Dr. Liu are hospitalists at Denver Health, and assistant professors of medicine at the University of Colorado at Denver.
References
1. Hull RD et al. Long term low-molecular-weight heparin versus usual care in proximal-vein thrombosis patient with cancer. Am J Med. 2006;19(12):1062-72.
2. Lee AY et al. Low-molecular-weight heparin versus Coumadin for the prevention of recurrent venous thromboembolism in patients with cancer. N Engl J Med. 2003;349(2):146-53.
3. Ay C et al. Treatment of cancer-associated venous thromboembolism in the age of direct oral anticoagulants. Ann Oncol. 2019 Mar 27 [epub].
4. Streiff MB et al. Effectiveness and safety of anticoagulants for the treatment of venous thromboembolism in patients with cancer. Am J Hematol. 2018 May;93(5):664-71.
5. Phelps MK et al. A single center retrospective cohort study comparing low-molecular-weight heparins to direct oral anticoagulants for the treatment of venous thromboembolism in patients with cancer – A real-world experience. J Oncol Pharm Pract. 2019 Jun;25(4):793-800.
6. Simmons B et al. Efficacy and safety of rivaroxaban compared to enoxaparin in treatment of cancer-associated venous thromboembolism. Eur J Haematol. 2018 Apr 4. (Epub).
7. Raskob GE et al.; Hokusai VTE Cancer Investigators. Edoxaban for the treatment of cancer-associated venous thromboembolism. N Engl J Med. 2018 Feb 15;378(7):615-24.
8. Young AM et al. Comparison of an oral factor Xa inhibitor with low molecular weight heparin in patients with cancer with venous thromboembolism: Results of a randomized trial (SELECT-D). J Clin Oncol. 2018 Jul 10;36(20):2017-23.
9. McBane, RD et al. Apixaban, dalteparin, in active cancer associated venous thromboembolism, the ADAM VTE trial. Blood. 2018 Nov 29;132(suppl 1):421.
10. Kraaijpoel N et al. Clinical impact of bleeding in cancer-associated venous thromboembolism: Results from the Hokusai VTE cancer study. Thromb Haemost. 2018 Aug;118(8):1439-49.
11. Khorana AA et al. Role of direct oral anticoagulants in the treatment of cancer-associated venous thromboembolism: Guidance from the SSC of the ISTH. J Thromb Haemost. 2018 Sep;16(9):1891-94.
Key points
- DOACs are a reasonable treatment option for malignancy-associated VTE in patients without GI tract malignancies and at low risk for bleeding complications.
- In patients with gastrointestinal malignancies or increased risk of bleeding, DOACs may have an increased bleeding risk and therefore LMWH is recommended.
- An informed discussion should occur between providers and patients to determine the best treatment option for cancer patients with VTE.
Additional reading
Dong Y et al. Efficacy and safety of direct oral anticoagulants versus low-molecular-weight heparin in patients with cancer: A systematic review and meta-analysis. J Thromb Thrombolysis. 2019 May 6.
Khorana AA et al. Role of direct oral anticoagulants in the treatment of cancer-associated venous thromboembolism: guidance from the SSC of the ISTH. J Thromb Haemost. 2018 Sep;16(9):1891-94.
Tritschler T et al. Venous thromboembolism advances in diagnosis and treatment. JAMA. 2018 Oct;320(15):1583-94.
Quiz
Which of the following is the recommended treatment of VTE in a patient with brain metastases?
A. Unfractionated heparin
B. Low molecular weight heparin
C. Direct oral anticoagulant
D. Vitamin K antagonist
The answer is B. Although there are very few data, LMWH is the recommended agent in patients with VTE and brain metastases.
A. LMWH has been shown to decrease mortality in patients with VTE and cancer, compared with unfractionated heparin (risk ratio, 0.66).
C. The safety of DOACs is not yet well established in patients with brain tumors. Antidotes and/or specific reversal agents for some DOACs are not available.
D. Vitamin K antagonists such as warfarin are not recommended in cancer patients because LMWH has a reduced risk of recurrent VTE without increased risk of bleeding.
Opioid Utilization and Perception of Pain Control in Hospitalized Patients: A Cross-Sectional Study of 11 Sites in 8 Countries
Since 2000, the United States has seen a marked increase in opioid prescribing1-3 and opioid-related complications, including overdoses, hospitalizations, and deaths.2,4,5 A study from 2015 showed that more than one-third of the US civilian noninstitutionalized population reported receiving an opioid prescription in the prior year, with 12.5% reporting misuse, and, of those, 16.7% reported a prescription use disorder.6 While there has been a slight decrease in opioid prescriptions in the US since 2012, rates of opioid prescribing in 2015 were three times higher than in 1999 and approximately four times higher than in Europe in 2015.3,7
Pain is commonly reported by hospitalized patients,8,9 and opioids are often a mainstay of treatment;9,10 however, treatment with opioids can have a number of adverse outcomes.2,10,11 Short-term exposure to opioids can lead to long-term use,12-16 and patients on opioids are at an increased risk for subsequent hospitalization and longer inpatient lengths of stay.5
Physician prescribing practices for opioids and patient expectations for pain control vary as a function of geographic region and culture,10,12,17,18 and pain is influenced by the cultural context in which it occurs.17,19-22 Treatment of pain may also be affected by limited access to or restrictions on selected medications, as well as by cultural biases.23 Whether these variations in the treatment of pain are reflected in patients’ satisfaction with pain control is uncertain.
We sought to compare the inpatient analgesic prescribing practices and patients’ perceptions of pain control for medical patients in four teaching hospitals in the US and in seven teaching hospitals in seven other countries.
METHODS
Study Design
We utilized a cross-sectional, observational design. The study was approved by the Institutional Review Boards at all participating sites.
Setting
The study was conducted at 11 academic hospitals in eight countries from October 8, 2013 to August 31, 2015. Sites in the US included Denver Health in Denver, Colorado; the University of Colorado Hospital in Aurora, Colorado; Hennepin Healthcare in Minneapolis, Minnesota; and Legacy Health in Portland, Oregon. Sites outside the US included McMaster University in Hamilton, Ontario, Canada; Hospital de la Santa Creu i Sant Pau, Universitat Autonòma de Barcelona in Barcelona, Spain; the University of Study of Milan and the University Ospedale “Luigi Sacco” in Milan, Italy, the National Taiwan University Hospital, in Taipei, Taiwan, the University of Ulsan College of Medicine, Asan Medical Center, in Seoul, Korea, the Imperial College, Chelsea and Westminster Hospital, in London, United Kingdom and Dunedin Hospital, Dunedin, New Zealand.
Inclusion and Exclusion Criteria
We included patients 18-89 years of age (20-89 in Taiwan because patients under 20 years of age in this country are a restricted group with respect to participating in research), admitted to an internal medicine service from the Emergency Department or Urgent Care clinic with an acute illness for a minimum of 24 hours (with time zero defined as the time care was initiated in the Emergency Department or Urgent Care Clinic), who reported pain at some time during the first 24-36 hours of their hospitalization and who provided informed consent. In the US, “admission” included both observation and inpatient status. We limited the patient population to those admitted via emergency departments and urgent care clinics in order to enroll similar patient populations across sites.
Scheduled admissions, patients transferred from an outside facility, patients admitted directly from a clinic, and those receiving care in intensive care units were excluded. We also excluded patients who were incarcerated, pregnant, those who received major surgery within the previous 14 days, those with a known diagnosis of active cancer, and those who were receiving palliative or hospice care. Patients receiving care from an investigator in the study at the time of enrollment were not eligible due to the potential conflict of interest.
Patient Screening
Primary teams were contacted to determine if any patients on their service might meet the criteria for inclusion in the study on preselected study days chosen on the basis of the research team’s availability. Identified patients were then screened to establish if they met the eligibility criteria. Patients were asked directly if they had experienced pain during their preadmission evaluation or during their hospitalization.
Data Collection
All patients were hospitalized at the time they gave consent and when data were collected. Data were collected via interviews with patients, as well as through chart review. We recorded patients’ age, gender, race, admitting diagnosis(es), length of stay, psychiatric illness, illicit drug use, whether they reported receiving opioid analgesics at the time of hospitalization, whether they were prescribed opioids and/or nonopioid analgesics during their hospitalization, the median and maximum doses of opioids prescribed and dispensed, and whether they were discharged on opioids. The question of illicit drug use was asked of all patients with the exception of those hospitalized in South Korea due to potential legal implications.
Opioid prescribing and receipt of opioids was recorded based upon current provider orders and medication administration records, respectively. Perception of and satisfaction with pain control was assessed with the American Pain Society Patient Outcome Questionnaire–Modified (APS-POQ-Modified).24,25 Versions of this survey have been validated in English as well as in other languages and cultures.26-28 Because hospitalization practices could differ across hospitals and in different countries, we compared patients’ severity of illness by using Charlson comorbidity scores. Consent forms and the APS-POQ were translated into each country’s primary language according to established processes.29 The survey was filled out by having site investigators read questions aloud and by use of a large-font visual analog scale to aid patients’ verbal responses.
Data were collected and managed using a secure, web-based application electronic data capture tool (Research Electronic Data Capture [REDCap], Nashville, Tennessee), hosted at Denver Health.30
Study Size
Preliminary data from the internal medicine units at our institution suggested that 40% of patients without cancer received opioid analgesics during their hospitalization. Assuming 90% power to detect an absolute difference in the proportion of inpatient medical patients who are receiving opioid analgesics during their hospital stay of 17%, a two-sided type 1 error rate of 0.05, six hospitals in the US, and nine hospitals from all other countries, we calculated an initial sample size of 150 patients per site. This sample size was considered feasible for enrollment in a busy inpatient clinical setting. Study end points were to either reach the goal number of patients (150 per site) or the predetermined study end date, whichever came first.
Data Analysis
We generated means with standard deviations (SDs) and medians with interquartile ranges (IQRs) for normally and nonnormally distributed continuous variables, respectively, and frequencies for categorical variables. We used linear mixed modeling for the analysis of continuous variables. For binary outcomes, our data were fitted to a generalized linear mixed model with logit as the link function and a binary distribution. For ordinal variables, specifically patient-reported satisfaction with pain control and the opinion statements, the data were fitted to a generalized linear mixed model with a cumulative logit link and a multinomial distribution. Hospital was included as a random effect in all models to account for patients cared for in the same hospital.
Country of origin, dichotomized as US or non-US, was the independent variable of interest for all models. An interaction term for exposure to opioids prior to admission and country was entered into all models to explore whether differences in the effect of country existed for patients who reported taking opioids prior to admission and those who did not.
The models for the frequency with which analgesics were given, doses of opioids given during hospitalization and at discharge, patient-reported pain score, and patient-reported satisfaction with pain control were adjusted for (1) age, (2) gender, (3) Charlson Comorbidity Index, (4) length of stay, (5) history of illicit drug use, (6) history of psychiatric illness, (7) daily dose in morphine milligram equivalents (MME) for opioids prior to admission, (8) average pain score, and (9) hospital. The patient-reported satisfaction with pain control model was also adjusted for whether or not opioids were given to the patient during their hospitalization. P < .05 was considered to indicate significance. All analyses were performed using SAS Enterprise Guide 7.1 (SAS Institute, Inc., Cary, North Carolina). We reported data on medications that were prescribed and dispensed (as opposed to just prescribed and not necessarily given). Opioids prescribed at discharge represented the total possible opioids that could be given based upon the order/prescription (eg, oxycodone 5 mg every 6 hours as needed for pain would be counted as 20 mg/24 hours maximum possible dose followed by conversion to MME).
Missing Data
When there were missing data, a query was sent to sites to verify if the data were retrievable. If retrievable, the data were then entered. Data were missing in 5% and 2% of patients who did or did not report taking an opioid prior to admission, respectively. If a variable was included in a specific statistical test, then subjects with missing data were excluded from that analysis (ie, complete case analysis).
RESULTS
We approached 1,309 eligible patients, of which 981 provided informed consent, for a response rate of 75%; 503 from the US and 478 patients from other countries (Figure). In unadjusted analyses, we found no significant differences between US and non-US patients in age (mean age 51, SD 15 vs 59, SD 19; P = .30), race, ethnicity, or Charlson comorbidity index scores (median 2, IQR 1-3 vs 3, IQR 1-4; P = .45). US patients had shorter lengths of stay (median 3 days, IQR 2-4 vs 6 days, IQR 3-11; P = .04), a more frequent history of illicit drug use (33% vs 6%; P = .003), a higher frequency of psychiatric illness (27% vs 8%; P < .0001), and more were receiving opioid analgesics prior to admission (38% vs 17%; P = .007) than those hospitalized in other countries (Table 1, Appendix 1). The primary admitting diagnoses for all patients in the study are listed in Appendix 2. Opioid prescribing practices across the individual sites are shown in Appendix 3.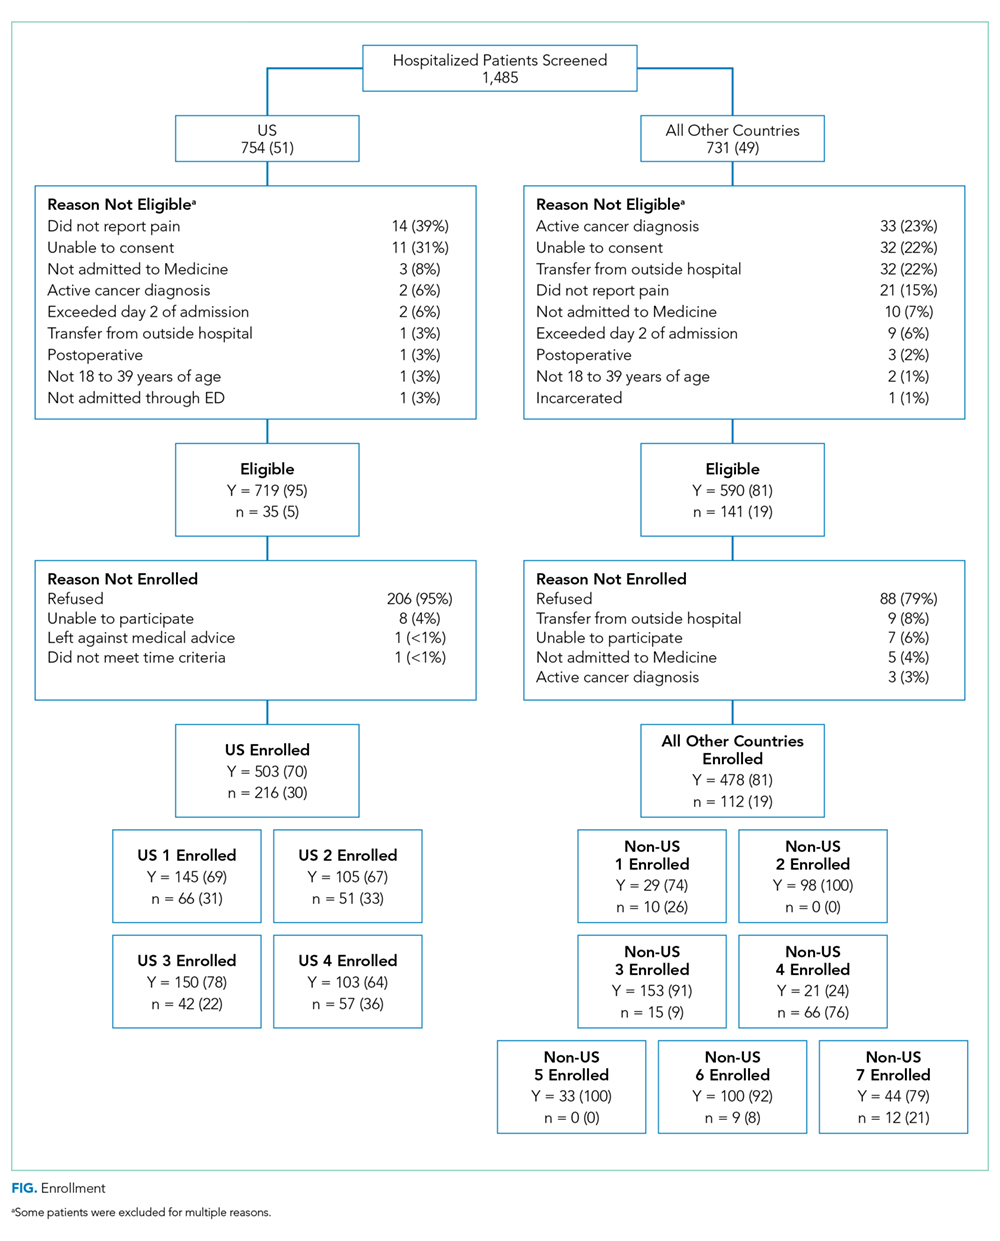
Patients Taking Opioids Prior to Admission
After adjusting for relevant covariates, we found that more patients in the US were given opioids during their hospitalization and in higher doses than patients from other countries and more were prescribed opioids at discharge. Fewer patients in the US were dispensed nonopioid analgesics during their hospitalization than patients from other countries, but this difference was not significant (Table 2). Appendix 4 shows the types of nonopioid pain medications prescribed in the US and other countries.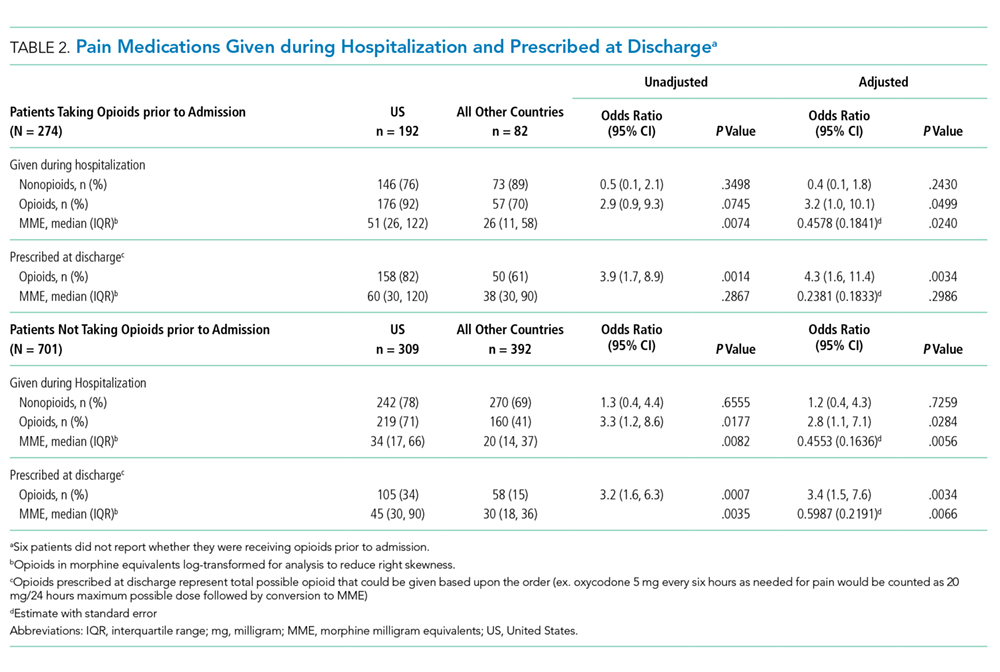
After adjustment for relevant covariates, US patients reported greater pain severity at the time they completed their pain surveys. We found no significant difference in satisfaction with pain control between patients from the US and other countries in the models, regardless of whether we included average pain score or opioid receipt during hospitalization in the model (Table 3).
In unadjusted analyses, compared with patients hospitalized in other countries, more patients in the US stated that they would like a stronger dose of analgesic if they were still in pain, though the difference was nonsignificant, and US patients were more likely to agree with the statement that people become addicted to pain medication easily and less likely to agree with the statement that it is easier to endure pain than deal with the side effects of pain medications (Table 3).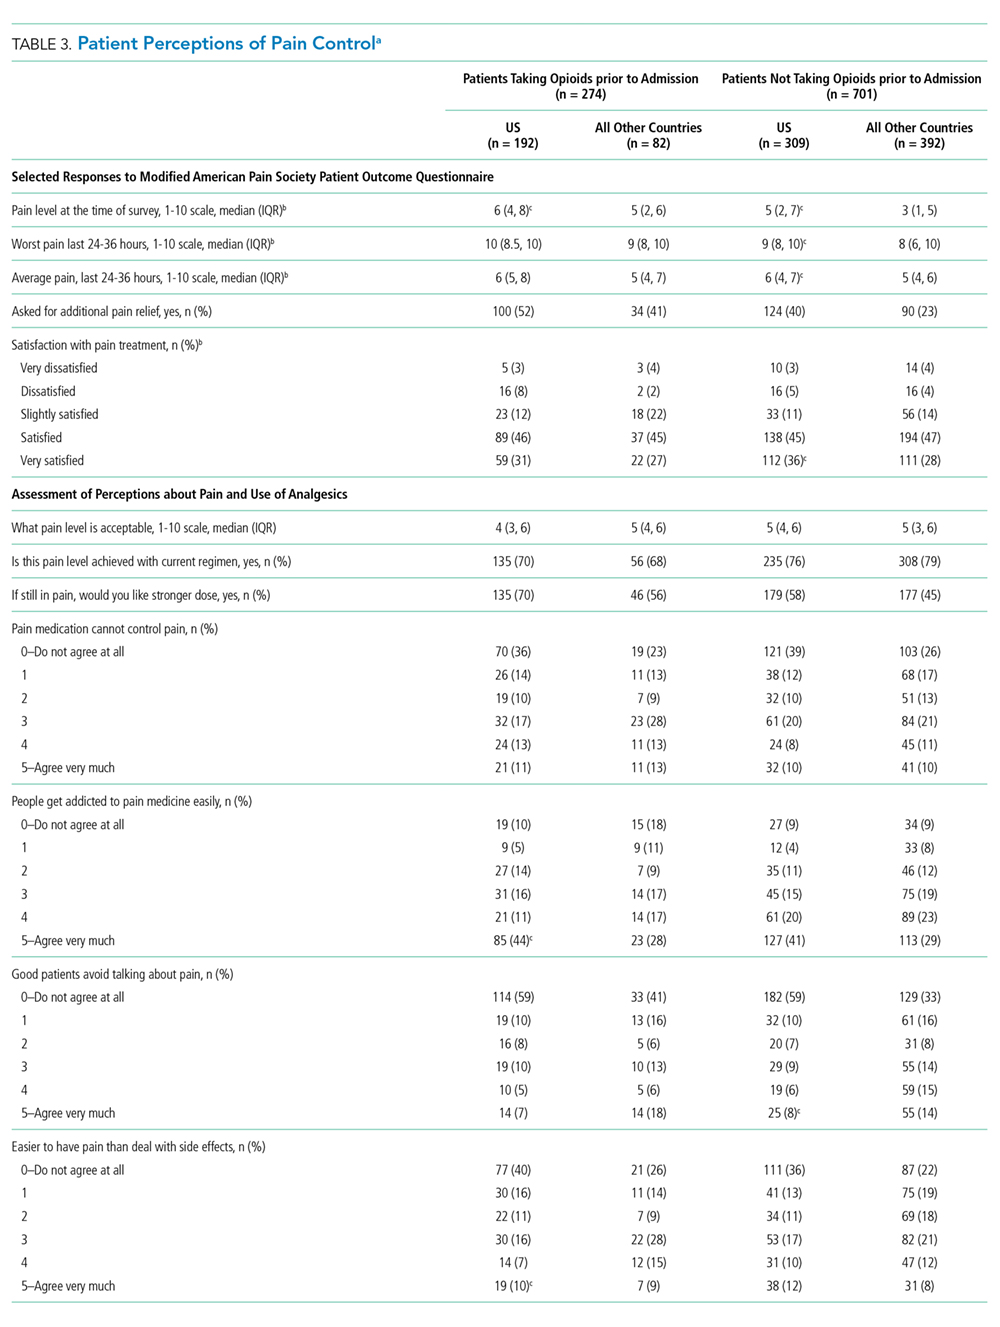
Patients Not Taking Opioids Prior to Admission
After adjusting for relevant covariates, we found no significant difference in the proportion of US patients provided with nonopioid pain medications during their hospitalization compared with patients in other countries, but a greater percentage of US patients were given opioids during their hospitalization and at discharge and in higher doses (Table 2).
After adjusting for relevant covariates, US patients reported greater pain severity at the time they completed their pain surveys and greater pain severity in the 24-36 hours prior to completing the survey than patients from other countries, but we found no difference in patient satisfaction with pain control (Table 3). After we included the average pain score and whether or not opioids were given to the patient during their hospitalization in this model, patients in the US were more likely to report a higher level of satisfaction with pain control than patients in all other countries (P = .001).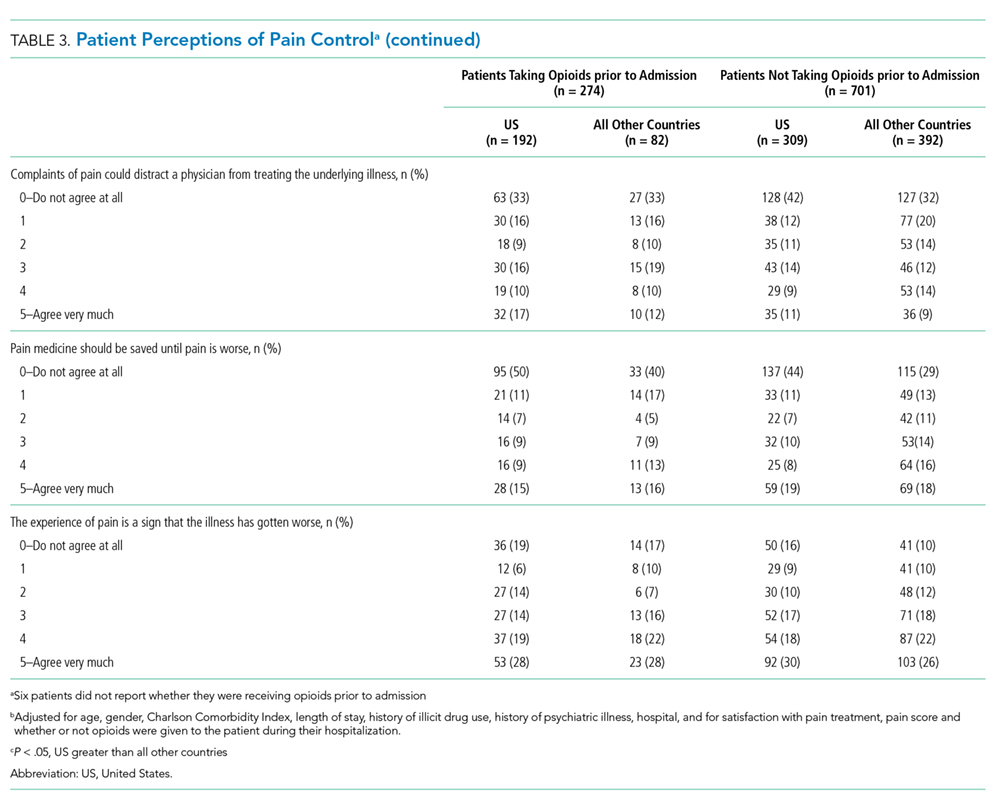
In unadjusted analyses, compared with patients hospitalized in other countries, those in the US were less likely to agree with the statement that good patients avoid talking about pain (Table 3).
Patient Satisfaction and Opioid Receipt
Among patients cared for in the US, after controlling for the average pain score, we did not find a significant association between receiving opioids while in the hospital and satisfaction with pain control for patients who either did or did not endorse taking opioids prior to admission (P = .38 and P = .24, respectively). Among patients cared for in all other countries, after controlling for the average pain score, we found a significant association between receiving opioids while in the hospital and a lower level of satisfaction with pain control for patients who reported taking opioids prior to admission (P = .02) but not for patients who did not report taking opioids prior to admission (P = .08).
DISCUSSION
Compared with patients hospitalized in other countries, a greater percentage of those hospitalized in the US were prescribed opioid analgesics both during hospitalization and at the time of discharge, even after adjustment for pain severity. In addition, patients hospitalized in the US reported greater pain severity at the time they completed their pain surveys and in the 24 to 36 hours prior to completing the survey than patients from other countries. In this sample, satisfaction, beliefs, and expectations about pain control differed between patients in the US and other sites. Our study also suggests that opioid receipt did not lead to improved patient satisfaction with pain control.
The frequency with which we observed opioid analgesics being prescribed during hospitalization in US hospitals (79%) was higher than the 51% of patients who received opioids reported by Herzig and colleagues.10 Patients in our study had a higher prevalence of illicit drug abuse and psychiatric illness, and our study only included patients who reported pain at some point during their hospitalization. We also studied prescribing practices through analysis of provider orders and medication administration records at the time the patient was hospitalized.
While we observed that physicians in the US more frequently prescribed opioid analgesics during hospitalizations than physicians working in other countries, we also observed that patients in the US reported higher levels of pain during their hospitalization. After adjusting for a number of variables, including pain severity, however, we still found that opioids were more commonly prescribed during hospitalizations by physicians working in the US sites studied than by physicians in the non-US sites.
Opioid prescribing practices varied across the sites sampled in our study. While the US sites, Taiwan, and Korea tended to be heavier utilizers of opioids during hospitalization, there were notable differences in discharge prescribing of opioids, with the US sites more commonly prescribing opioids and higher MME for patients who did not report taking opioids prior to their hospitalization (Appendix 3). A sensitivity analysis was conducted excluding South Korea from modeling, given that patients there were not asked about illicit opioid use. There were no important changes in the magnitude or direction of the results.
Our study supports previous studies indicating that there are cultural and societal differences when it comes to the experience of pain and the expectations around pain control.17,20-22,31 Much of the focus on reducing opioid utilization has been on provider practices32 and on prescription drug monitoring programs.33 Our findings suggest that another area of focus that may be important in mitigating the opioid epidemic is patient expectations of pain control.
Our study has a number of strengths. First, we included 11 hospitals from eight different countries. Second, we believe this is the first study to assess opioid prescribing and dispensing practices during hospitalization as well as at the time of discharge. Third, patient perceptions of pain control were assessed in conjunction with analgesic prescribing and were assessed during hospitalization. Fourth, we had high response rates for patient participation in our study. Fifth, we found much larger differences in opioid prescribing than anticipated, and thus, while we did not achieve the sample size originally planned for either the number of hospitals or patients enrolled per hospital, we were sufficiently powered. This is likely secondary to the fact that the population we studied was one that specifically reported pain, resulting in the larger differences seen.
Our study also had a number of limitations. First, the prescribing practices in countries other than the US are represented by only one hospital per country and, in some countries, by limited numbers of patients. While we studied four sites in the US, we did not have a site in the Northeast, a region previously shown to have lower prescribing rates.10 Additionally, patient samples for the US sites compared with the sites in other countries varied considerably with respect to ethnicity. While some studies in US patients have shown that opioid prescribing may vary based on race/ethnicity,34 we are uncertain as to how this might impact a study that crosses multiple countries. We also had a low number of patients receiving opioids prior to hospitalization for several of the non-US countries, which reduced the power to detect differences in this subgroup. Previous research has shown that there are wide variations in prescribing practices even within countries;10,12,18 therefore, caution should be taken when generalizing our findings. Second, we assessed analgesic prescribing patterns and pain control during the first 24 to 36 hours of hospitalization and did not consider hospital days beyond this timeframe with the exception of noting what medications were prescribed at discharge. We chose this methodology in an attempt to eliminate as many differences that might exist in the duration of hospitalization across many countries. Third, investigators in the study administered the survey, and respondents may have been affected by social desirability bias in how the survey questions were answered. Because investigators were not a part of the care team of any study patients, we believe this to be unlikely. Fourth, our study was conducted from October 8, 2013 to August 31, 2015 and the opioid epidemic is dynamic. Accordingly, our data may not reflect current opioid prescribing practices or patients’ current beliefs regarding pain control. Fifth, we did not collect demographic data on the patients who did not participate and could not look for systematic differences between participants and nonparticipants. Sixth, we relied on patients to self-report whether they were taking opioids prior to hospitalization or using illicit drugs. Seventh, we found comorbid mental health conditions to be more frequent in the US population studied. Previous work has shown regional variation in mental health conditions,35,36 which could have affected our findings. To account for this, our models included psychiatric illness.
CONCLUSIONS
Our data suggest that physicians in the US may prescribe opioids more frequently during patients’ hospitalizations and at discharge than their colleagues in other countries. We also found that patient satisfaction, beliefs, and expectations about pain control differed between patients in the US and other sites. Although the small number of hospitals included in our sample coupled with the small sample size in some of the non-US countries limits the generalizability of our findings, the data suggest that reducing the opioid epidemic in the US may require addressing patients’ expectations regarding pain control in addition to providers’ inpatient analgesic prescribing patterns.
Disclosures
The authors report no conflicts of interest.
Funding
The authors report no funding source for this work.
1. Pletcher MJ, Kertesz SG, Kohn MA, Gonzales R. Trends in opioid prescribing by race/ethnicity for patients seeking care in US emergency departments. JAMA. 2008;299(1):70-78. https://doi.org/10.1001/jama.2007.64.
2. Herzig SJ. Growing concerns regarding long-term opioid use: the hospitalization hazard. J Hosp Med. 2015;10(7):469-470. https://doi.org/10.1002/jhm.2369.
3. Guy GP Jr, Zhang K, Bohm MK, et al. Vital Signs: changes in opioid prescribing in the United States, 2006–2015. MMWR Morb Mortal Wkly Rep. 2017;66(26):697-704. https://doi.org/10.15585/mmwr.mm6626a4.
4. Okie S. A flood of opioids, a rising tide of deaths. N Engl J Med. 2010;363(21):1981-1985. https://doi.org/10.1056/NEJMp1011512.
5. Liang Y, Turner BJ. National cohort study of opioid analgesic dose and risk of future hospitalization. J Hosp Med. 2015;10(7):425-431. https://doi.org/10.1002/jhm.2350.
6. Han B, Compton WM, Blanco C, et al. Prescription opioid use, misuse, and use disorders in U.S. Adults: 2015 national survey on drug use and health. Ann Intern Med. 2017;167(5):293-301. https://doi.org/10.7326/M17-0865.
7. Schuchat A, Houry D, Guy GP, Jr. New data on opioid use and prescribing in the United States. JAMA. 2017;318(5):425-426. https://doi.org/10.1001/jama.2017.8913.
8. Sawyer J, Haslam L, Robinson S, Daines P, Stilos K. Pain prevalence study in a large Canadian teaching hospital. Pain Manag Nurs. 2008;9(3):104-112. https://doi.org/10.1016/j.pmn.2008.02.001.
9. Gupta A, Daigle S, Mojica J, Hurley RW. Patient perception of pain care in hospitals in the United States. J Pain Res. 2009;2:157-164. https://doi.org/10.2147/JPR.S7903.
10. Herzig SJ, Rothberg MB, Cheung M, Ngo LH, Marcantonio ER. Opioid utilization and opioid-related adverse events in nonsurgical patients in US hospitals. J Hosp Med. 2014;9(2):73-81. https://doi.org/10.1002/jhm.2102.
11. Kanjanarat P, Winterstein AG, Johns TE, et al. Nature of preventable adverse drug events in hospitals: a literature review. Am J Health Syst Pharm. 2003;60(17):1750-1759. https://doi.org/10.1093/ajhp/60.17.1750.
12. Jena AB, Goldman D, Karaca-Mandic P. Hospital prescribing of opioids to medicare beneficiaries. JAMA Intern Med. 2016;176(7):990-997. https://doi.org/10.1001/jamainternmed.2016.2737.
13. Hooten WM, St Sauver JL, McGree ME, Jacobson DJ, Warner DO. Incidence and risk factors for progression From short-term to episodic or long-term opioid prescribing: A population-based study. Mayo Clin Proc. 2015;90(7):850-856. https://doi.org/10.1016/j.mayocp.2015.04.012.
14. Alam A, Gomes T, Zheng H, et al. Long-term analgesic use after low-risk surgery: a retrospective cohort study. Arch Intern Med. 2012;172(5):425-430. https://doi.org/10.1001/archinternmed.2011.1827.
15. Barnett ML, Olenski AR, Jena AB. Opioid-prescribing patterns of emergency physicians and risk of long-term use. N Engl J Med. 2017;376(7):663-673. https://doi.org/10.1056/NEJMsa1610524.
16. Calcaterra SL, Scarbro S, Hull ML, et al. Prediction of future chronic opioid use Among hospitalized patients. J Gen Intern Med. 2018;33(6):898-905. https://doi.org/10.1007/s11606-018-4335-8.
17. Callister LC. Cultural influences on pain perceptions and behaviors. Home Health Care Manag Pract. 2003;15(3):207-211. https://doi.org/10.1177/1084822302250687.
18. Paulozzi LJ, Mack KA, Hockenberry JM. Vital signs: Variation among states in prescribing of opioid pain relievers and benzodiazepines--United States, 2012. J Saf Res. 2014;63(26):563-568. https://doi.org/10.1016/j.jsr.2014.09.001.
19. Callister LC, Khalaf I, Semenic S, Kartchner R, Vehvilainen-Julkunen K. The pain of childbirth: perceptions of culturally diverse women. Pain Manag Nurs. 2003;4(4):145-154. https://doi.org/10.1016/S1524-9042(03)00028-6.
20. Moore R, Brødsgaard I, Mao TK, Miller ML, Dworkin SF. Perceived need for local anesthesia in tooth drilling among Anglo-Americans, Chinese, and Scandinavians. Anesth Prog. 1998;45(1):22-28.
21. Kankkunen PM, Vehviläinen-Julkunen KM, Pietilä AM, et al. A tale of two countries: comparison of the perceptions of analgesics among Finnish and American parents. Pain Manag Nurs. 2008;9(3):113-119. https://doi.org/10.1016/j.pmn.2007.12.003.
22. Hanoch Y, Katsikopoulos KV, Gummerum M, Brass EP. American and German students’ knowledge, perceptions, and behaviors with respect to over-the-counter pain relievers. Health Psychol. 2007;26(6):802-806. https://doi.org/10.1037/0278-6133.26.6.802.
23. Manjiani D, Paul DB, Kunnumpurath S, Kaye AD, Vadivelu N. Availability and utilization of opioids for pain management: global issues. Ochsner J. 2014;14(2):208-215.
24. Quality improvement guidelines for the treatment of acute pain and cancer pain. JAMA. 1995;274(23):1874-1880.
25. McNeill JA, Sherwood GD, Starck PL, Thompson CJ. Assessing clinical outcomes: patient satisfaction with pain management. J Pain Symptom Manag. 1998;16(1):29-40. https://doi.org/10.1016/S0885-3924(98)00034-7.
26. Ferrari R, Novello C, Catania G, Visentin M. Patients’ satisfaction with pain management: the Italian version of the Patient Outcome Questionnaire of the American Pain Society. Recenti Prog Med. 2010;101(7–8):283-288.
27. Malouf J, Andión O, Torrubia R, Cañellas M, Baños JE. A survey of perceptions with pain management in Spanish inpatients. J Pain Symptom Manag. 2006;32(4):361-371. https://doi.org/10.1016/j.jpainsymman.2006.05.006.
28. Gordon DB, Polomano RC, Pellino TA, et al. Revised American Pain Society Patient Outcome Questionnaire (APS-POQ-R) for quality improvement of pain management in hospitalized adults: preliminary psychometric evaluation. J Pain. 2010;11(11):1172-1186. https://doi.org/10.1016/j.jpain.2010.02.012.
29. Beaton DE, Bombardier C, Guillemin F, Ferraz MB. Guidelines for the process of cross-cultural adaptation of self-report measures. Spine (Phila Pa 1976). 2000;25(24):3186-3191. https://doi.org/10.1097/00007632-200012150-00014.
30. Harris PA, Taylor R, Thielke R, et al. Research Electronic Data Capture (REDCap)--a metadata-driven methodology and workflow process for providing translational research informatics support. J Biomed Inform. 2009;42(2):377-381. https://doi.org/10.1016/j.jbi.2008.08.010.
31. Duman F. After surgery in Germany, I wanted Vicodin, not herbal tea. New York Times. January 27, 2018. https://www.nytimes.com/2018/01/27/opinion/sunday/surgery-germany-vicodin.html. Accessed November 6, 2018.
32. Beaudoin FL, Banerjee GN, Mello MJ. State-level and system-level opioid prescribing policies: the impact on provider practices and overdose deaths, a systematic review. J Opioid Manag. 2016;12(2):109-118. https://doi.org/10.5055/jom.2016.0322. 33. Bao Y, Wen K, Johnson P, et al. Assessing the impact of state policies for prescription drug monitoring programs on high-risk opioid prescriptions. Health Aff (Millwood). 2018;37(10):1596-1604. https://doi.org/10.1377/hlthaff.2018.0512.
34. Friedman J, Kim D, Schneberk T, et al. Assessment of racial/ethnic and income disparities in the prescription of opioids and other controlled medications in California. JAMA Intern Med. 2019. https://doi.org/10.1001/jamainternmed.2018.6721.
35. Steel Z, Marnane C, Iranpour C, et al. The global prevalence of common mental disorders: a systematic review and meta-analysis 1980-2013. Int J Epidemiol. 2014;43(2):476-493. https://doi.org/10.1093/ije/dyu038.
36. Simon GE, Goldberg DP, Von Korff M, Ustün TB. Understanding cross-national differences in depression prevalence. Psychol Med. 2002;32(4):585-594. https://doi.org/10.1017/S0033291702005457.
Since 2000, the United States has seen a marked increase in opioid prescribing1-3 and opioid-related complications, including overdoses, hospitalizations, and deaths.2,4,5 A study from 2015 showed that more than one-third of the US civilian noninstitutionalized population reported receiving an opioid prescription in the prior year, with 12.5% reporting misuse, and, of those, 16.7% reported a prescription use disorder.6 While there has been a slight decrease in opioid prescriptions in the US since 2012, rates of opioid prescribing in 2015 were three times higher than in 1999 and approximately four times higher than in Europe in 2015.3,7
Pain is commonly reported by hospitalized patients,8,9 and opioids are often a mainstay of treatment;9,10 however, treatment with opioids can have a number of adverse outcomes.2,10,11 Short-term exposure to opioids can lead to long-term use,12-16 and patients on opioids are at an increased risk for subsequent hospitalization and longer inpatient lengths of stay.5
Physician prescribing practices for opioids and patient expectations for pain control vary as a function of geographic region and culture,10,12,17,18 and pain is influenced by the cultural context in which it occurs.17,19-22 Treatment of pain may also be affected by limited access to or restrictions on selected medications, as well as by cultural biases.23 Whether these variations in the treatment of pain are reflected in patients’ satisfaction with pain control is uncertain.
We sought to compare the inpatient analgesic prescribing practices and patients’ perceptions of pain control for medical patients in four teaching hospitals in the US and in seven teaching hospitals in seven other countries.
METHODS
Study Design
We utilized a cross-sectional, observational design. The study was approved by the Institutional Review Boards at all participating sites.
Setting
The study was conducted at 11 academic hospitals in eight countries from October 8, 2013 to August 31, 2015. Sites in the US included Denver Health in Denver, Colorado; the University of Colorado Hospital in Aurora, Colorado; Hennepin Healthcare in Minneapolis, Minnesota; and Legacy Health in Portland, Oregon. Sites outside the US included McMaster University in Hamilton, Ontario, Canada; Hospital de la Santa Creu i Sant Pau, Universitat Autonòma de Barcelona in Barcelona, Spain; the University of Study of Milan and the University Ospedale “Luigi Sacco” in Milan, Italy, the National Taiwan University Hospital, in Taipei, Taiwan, the University of Ulsan College of Medicine, Asan Medical Center, in Seoul, Korea, the Imperial College, Chelsea and Westminster Hospital, in London, United Kingdom and Dunedin Hospital, Dunedin, New Zealand.
Inclusion and Exclusion Criteria
We included patients 18-89 years of age (20-89 in Taiwan because patients under 20 years of age in this country are a restricted group with respect to participating in research), admitted to an internal medicine service from the Emergency Department or Urgent Care clinic with an acute illness for a minimum of 24 hours (with time zero defined as the time care was initiated in the Emergency Department or Urgent Care Clinic), who reported pain at some time during the first 24-36 hours of their hospitalization and who provided informed consent. In the US, “admission” included both observation and inpatient status. We limited the patient population to those admitted via emergency departments and urgent care clinics in order to enroll similar patient populations across sites.
Scheduled admissions, patients transferred from an outside facility, patients admitted directly from a clinic, and those receiving care in intensive care units were excluded. We also excluded patients who were incarcerated, pregnant, those who received major surgery within the previous 14 days, those with a known diagnosis of active cancer, and those who were receiving palliative or hospice care. Patients receiving care from an investigator in the study at the time of enrollment were not eligible due to the potential conflict of interest.
Patient Screening
Primary teams were contacted to determine if any patients on their service might meet the criteria for inclusion in the study on preselected study days chosen on the basis of the research team’s availability. Identified patients were then screened to establish if they met the eligibility criteria. Patients were asked directly if they had experienced pain during their preadmission evaluation or during their hospitalization.
Data Collection
All patients were hospitalized at the time they gave consent and when data were collected. Data were collected via interviews with patients, as well as through chart review. We recorded patients’ age, gender, race, admitting diagnosis(es), length of stay, psychiatric illness, illicit drug use, whether they reported receiving opioid analgesics at the time of hospitalization, whether they were prescribed opioids and/or nonopioid analgesics during their hospitalization, the median and maximum doses of opioids prescribed and dispensed, and whether they were discharged on opioids. The question of illicit drug use was asked of all patients with the exception of those hospitalized in South Korea due to potential legal implications.
Opioid prescribing and receipt of opioids was recorded based upon current provider orders and medication administration records, respectively. Perception of and satisfaction with pain control was assessed with the American Pain Society Patient Outcome Questionnaire–Modified (APS-POQ-Modified).24,25 Versions of this survey have been validated in English as well as in other languages and cultures.26-28 Because hospitalization practices could differ across hospitals and in different countries, we compared patients’ severity of illness by using Charlson comorbidity scores. Consent forms and the APS-POQ were translated into each country’s primary language according to established processes.29 The survey was filled out by having site investigators read questions aloud and by use of a large-font visual analog scale to aid patients’ verbal responses.
Data were collected and managed using a secure, web-based application electronic data capture tool (Research Electronic Data Capture [REDCap], Nashville, Tennessee), hosted at Denver Health.30
Study Size
Preliminary data from the internal medicine units at our institution suggested that 40% of patients without cancer received opioid analgesics during their hospitalization. Assuming 90% power to detect an absolute difference in the proportion of inpatient medical patients who are receiving opioid analgesics during their hospital stay of 17%, a two-sided type 1 error rate of 0.05, six hospitals in the US, and nine hospitals from all other countries, we calculated an initial sample size of 150 patients per site. This sample size was considered feasible for enrollment in a busy inpatient clinical setting. Study end points were to either reach the goal number of patients (150 per site) or the predetermined study end date, whichever came first.
Data Analysis
We generated means with standard deviations (SDs) and medians with interquartile ranges (IQRs) for normally and nonnormally distributed continuous variables, respectively, and frequencies for categorical variables. We used linear mixed modeling for the analysis of continuous variables. For binary outcomes, our data were fitted to a generalized linear mixed model with logit as the link function and a binary distribution. For ordinal variables, specifically patient-reported satisfaction with pain control and the opinion statements, the data were fitted to a generalized linear mixed model with a cumulative logit link and a multinomial distribution. Hospital was included as a random effect in all models to account for patients cared for in the same hospital.
Country of origin, dichotomized as US or non-US, was the independent variable of interest for all models. An interaction term for exposure to opioids prior to admission and country was entered into all models to explore whether differences in the effect of country existed for patients who reported taking opioids prior to admission and those who did not.
The models for the frequency with which analgesics were given, doses of opioids given during hospitalization and at discharge, patient-reported pain score, and patient-reported satisfaction with pain control were adjusted for (1) age, (2) gender, (3) Charlson Comorbidity Index, (4) length of stay, (5) history of illicit drug use, (6) history of psychiatric illness, (7) daily dose in morphine milligram equivalents (MME) for opioids prior to admission, (8) average pain score, and (9) hospital. The patient-reported satisfaction with pain control model was also adjusted for whether or not opioids were given to the patient during their hospitalization. P < .05 was considered to indicate significance. All analyses were performed using SAS Enterprise Guide 7.1 (SAS Institute, Inc., Cary, North Carolina). We reported data on medications that were prescribed and dispensed (as opposed to just prescribed and not necessarily given). Opioids prescribed at discharge represented the total possible opioids that could be given based upon the order/prescription (eg, oxycodone 5 mg every 6 hours as needed for pain would be counted as 20 mg/24 hours maximum possible dose followed by conversion to MME).
Missing Data
When there were missing data, a query was sent to sites to verify if the data were retrievable. If retrievable, the data were then entered. Data were missing in 5% and 2% of patients who did or did not report taking an opioid prior to admission, respectively. If a variable was included in a specific statistical test, then subjects with missing data were excluded from that analysis (ie, complete case analysis).
RESULTS
We approached 1,309 eligible patients, of which 981 provided informed consent, for a response rate of 75%; 503 from the US and 478 patients from other countries (Figure). In unadjusted analyses, we found no significant differences between US and non-US patients in age (mean age 51, SD 15 vs 59, SD 19; P = .30), race, ethnicity, or Charlson comorbidity index scores (median 2, IQR 1-3 vs 3, IQR 1-4; P = .45). US patients had shorter lengths of stay (median 3 days, IQR 2-4 vs 6 days, IQR 3-11; P = .04), a more frequent history of illicit drug use (33% vs 6%; P = .003), a higher frequency of psychiatric illness (27% vs 8%; P < .0001), and more were receiving opioid analgesics prior to admission (38% vs 17%; P = .007) than those hospitalized in other countries (Table 1, Appendix 1). The primary admitting diagnoses for all patients in the study are listed in Appendix 2. Opioid prescribing practices across the individual sites are shown in Appendix 3.
Patients Taking Opioids Prior to Admission
After adjusting for relevant covariates, we found that more patients in the US were given opioids during their hospitalization and in higher doses than patients from other countries and more were prescribed opioids at discharge. Fewer patients in the US were dispensed nonopioid analgesics during their hospitalization than patients from other countries, but this difference was not significant (Table 2). Appendix 4 shows the types of nonopioid pain medications prescribed in the US and other countries.
After adjustment for relevant covariates, US patients reported greater pain severity at the time they completed their pain surveys. We found no significant difference in satisfaction with pain control between patients from the US and other countries in the models, regardless of whether we included average pain score or opioid receipt during hospitalization in the model (Table 3).
In unadjusted analyses, compared with patients hospitalized in other countries, more patients in the US stated that they would like a stronger dose of analgesic if they were still in pain, though the difference was nonsignificant, and US patients were more likely to agree with the statement that people become addicted to pain medication easily and less likely to agree with the statement that it is easier to endure pain than deal with the side effects of pain medications (Table 3).
Patients Not Taking Opioids Prior to Admission
After adjusting for relevant covariates, we found no significant difference in the proportion of US patients provided with nonopioid pain medications during their hospitalization compared with patients in other countries, but a greater percentage of US patients were given opioids during their hospitalization and at discharge and in higher doses (Table 2).
After adjusting for relevant covariates, US patients reported greater pain severity at the time they completed their pain surveys and greater pain severity in the 24-36 hours prior to completing the survey than patients from other countries, but we found no difference in patient satisfaction with pain control (Table 3). After we included the average pain score and whether or not opioids were given to the patient during their hospitalization in this model, patients in the US were more likely to report a higher level of satisfaction with pain control than patients in all other countries (P = .001).
In unadjusted analyses, compared with patients hospitalized in other countries, those in the US were less likely to agree with the statement that good patients avoid talking about pain (Table 3).
Patient Satisfaction and Opioid Receipt
Among patients cared for in the US, after controlling for the average pain score, we did not find a significant association between receiving opioids while in the hospital and satisfaction with pain control for patients who either did or did not endorse taking opioids prior to admission (P = .38 and P = .24, respectively). Among patients cared for in all other countries, after controlling for the average pain score, we found a significant association between receiving opioids while in the hospital and a lower level of satisfaction with pain control for patients who reported taking opioids prior to admission (P = .02) but not for patients who did not report taking opioids prior to admission (P = .08).
DISCUSSION
Compared with patients hospitalized in other countries, a greater percentage of those hospitalized in the US were prescribed opioid analgesics both during hospitalization and at the time of discharge, even after adjustment for pain severity. In addition, patients hospitalized in the US reported greater pain severity at the time they completed their pain surveys and in the 24 to 36 hours prior to completing the survey than patients from other countries. In this sample, satisfaction, beliefs, and expectations about pain control differed between patients in the US and other sites. Our study also suggests that opioid receipt did not lead to improved patient satisfaction with pain control.
The frequency with which we observed opioid analgesics being prescribed during hospitalization in US hospitals (79%) was higher than the 51% of patients who received opioids reported by Herzig and colleagues.10 Patients in our study had a higher prevalence of illicit drug abuse and psychiatric illness, and our study only included patients who reported pain at some point during their hospitalization. We also studied prescribing practices through analysis of provider orders and medication administration records at the time the patient was hospitalized.
While we observed that physicians in the US more frequently prescribed opioid analgesics during hospitalizations than physicians working in other countries, we also observed that patients in the US reported higher levels of pain during their hospitalization. After adjusting for a number of variables, including pain severity, however, we still found that opioids were more commonly prescribed during hospitalizations by physicians working in the US sites studied than by physicians in the non-US sites.
Opioid prescribing practices varied across the sites sampled in our study. While the US sites, Taiwan, and Korea tended to be heavier utilizers of opioids during hospitalization, there were notable differences in discharge prescribing of opioids, with the US sites more commonly prescribing opioids and higher MME for patients who did not report taking opioids prior to their hospitalization (Appendix 3). A sensitivity analysis was conducted excluding South Korea from modeling, given that patients there were not asked about illicit opioid use. There were no important changes in the magnitude or direction of the results.
Our study supports previous studies indicating that there are cultural and societal differences when it comes to the experience of pain and the expectations around pain control.17,20-22,31 Much of the focus on reducing opioid utilization has been on provider practices32 and on prescription drug monitoring programs.33 Our findings suggest that another area of focus that may be important in mitigating the opioid epidemic is patient expectations of pain control.
Our study has a number of strengths. First, we included 11 hospitals from eight different countries. Second, we believe this is the first study to assess opioid prescribing and dispensing practices during hospitalization as well as at the time of discharge. Third, patient perceptions of pain control were assessed in conjunction with analgesic prescribing and were assessed during hospitalization. Fourth, we had high response rates for patient participation in our study. Fifth, we found much larger differences in opioid prescribing than anticipated, and thus, while we did not achieve the sample size originally planned for either the number of hospitals or patients enrolled per hospital, we were sufficiently powered. This is likely secondary to the fact that the population we studied was one that specifically reported pain, resulting in the larger differences seen.
Our study also had a number of limitations. First, the prescribing practices in countries other than the US are represented by only one hospital per country and, in some countries, by limited numbers of patients. While we studied four sites in the US, we did not have a site in the Northeast, a region previously shown to have lower prescribing rates.10 Additionally, patient samples for the US sites compared with the sites in other countries varied considerably with respect to ethnicity. While some studies in US patients have shown that opioid prescribing may vary based on race/ethnicity,34 we are uncertain as to how this might impact a study that crosses multiple countries. We also had a low number of patients receiving opioids prior to hospitalization for several of the non-US countries, which reduced the power to detect differences in this subgroup. Previous research has shown that there are wide variations in prescribing practices even within countries;10,12,18 therefore, caution should be taken when generalizing our findings. Second, we assessed analgesic prescribing patterns and pain control during the first 24 to 36 hours of hospitalization and did not consider hospital days beyond this timeframe with the exception of noting what medications were prescribed at discharge. We chose this methodology in an attempt to eliminate as many differences that might exist in the duration of hospitalization across many countries. Third, investigators in the study administered the survey, and respondents may have been affected by social desirability bias in how the survey questions were answered. Because investigators were not a part of the care team of any study patients, we believe this to be unlikely. Fourth, our study was conducted from October 8, 2013 to August 31, 2015 and the opioid epidemic is dynamic. Accordingly, our data may not reflect current opioid prescribing practices or patients’ current beliefs regarding pain control. Fifth, we did not collect demographic data on the patients who did not participate and could not look for systematic differences between participants and nonparticipants. Sixth, we relied on patients to self-report whether they were taking opioids prior to hospitalization or using illicit drugs. Seventh, we found comorbid mental health conditions to be more frequent in the US population studied. Previous work has shown regional variation in mental health conditions,35,36 which could have affected our findings. To account for this, our models included psychiatric illness.
CONCLUSIONS
Our data suggest that physicians in the US may prescribe opioids more frequently during patients’ hospitalizations and at discharge than their colleagues in other countries. We also found that patient satisfaction, beliefs, and expectations about pain control differed between patients in the US and other sites. Although the small number of hospitals included in our sample coupled with the small sample size in some of the non-US countries limits the generalizability of our findings, the data suggest that reducing the opioid epidemic in the US may require addressing patients’ expectations regarding pain control in addition to providers’ inpatient analgesic prescribing patterns.
Disclosures
The authors report no conflicts of interest.
Funding
The authors report no funding source for this work.
1. Pletcher MJ, Kertesz SG, Kohn MA, Gonzales R. Trends in opioid prescribing by race/ethnicity for patients seeking care in US emergency departments. JAMA. 2008;299(1):70-78. https://doi.org/10.1001/jama.2007.64.
2. Herzig SJ. Growing concerns regarding long-term opioid use: the hospitalization hazard. J Hosp Med. 2015;10(7):469-470. https://doi.org/10.1002/jhm.2369.
3. Guy GP Jr, Zhang K, Bohm MK, et al. Vital Signs: changes in opioid prescribing in the United States, 2006–2015. MMWR Morb Mortal Wkly Rep. 2017;66(26):697-704. https://doi.org/10.15585/mmwr.mm6626a4.
4. Okie S. A flood of opioids, a rising tide of deaths. N Engl J Med. 2010;363(21):1981-1985. https://doi.org/10.1056/NEJMp1011512.
5. Liang Y, Turner BJ. National cohort study of opioid analgesic dose and risk of future hospitalization. J Hosp Med. 2015;10(7):425-431. https://doi.org/10.1002/jhm.2350.
6. Han B, Compton WM, Blanco C, et al. Prescription opioid use, misuse, and use disorders in U.S. Adults: 2015 national survey on drug use and health. Ann Intern Med. 2017;167(5):293-301. https://doi.org/10.7326/M17-0865.
7. Schuchat A, Houry D, Guy GP, Jr. New data on opioid use and prescribing in the United States. JAMA. 2017;318(5):425-426. https://doi.org/10.1001/jama.2017.8913.
8. Sawyer J, Haslam L, Robinson S, Daines P, Stilos K. Pain prevalence study in a large Canadian teaching hospital. Pain Manag Nurs. 2008;9(3):104-112. https://doi.org/10.1016/j.pmn.2008.02.001.
9. Gupta A, Daigle S, Mojica J, Hurley RW. Patient perception of pain care in hospitals in the United States. J Pain Res. 2009;2:157-164. https://doi.org/10.2147/JPR.S7903.
10. Herzig SJ, Rothberg MB, Cheung M, Ngo LH, Marcantonio ER. Opioid utilization and opioid-related adverse events in nonsurgical patients in US hospitals. J Hosp Med. 2014;9(2):73-81. https://doi.org/10.1002/jhm.2102.
11. Kanjanarat P, Winterstein AG, Johns TE, et al. Nature of preventable adverse drug events in hospitals: a literature review. Am J Health Syst Pharm. 2003;60(17):1750-1759. https://doi.org/10.1093/ajhp/60.17.1750.
12. Jena AB, Goldman D, Karaca-Mandic P. Hospital prescribing of opioids to medicare beneficiaries. JAMA Intern Med. 2016;176(7):990-997. https://doi.org/10.1001/jamainternmed.2016.2737.
13. Hooten WM, St Sauver JL, McGree ME, Jacobson DJ, Warner DO. Incidence and risk factors for progression From short-term to episodic or long-term opioid prescribing: A population-based study. Mayo Clin Proc. 2015;90(7):850-856. https://doi.org/10.1016/j.mayocp.2015.04.012.
14. Alam A, Gomes T, Zheng H, et al. Long-term analgesic use after low-risk surgery: a retrospective cohort study. Arch Intern Med. 2012;172(5):425-430. https://doi.org/10.1001/archinternmed.2011.1827.
15. Barnett ML, Olenski AR, Jena AB. Opioid-prescribing patterns of emergency physicians and risk of long-term use. N Engl J Med. 2017;376(7):663-673. https://doi.org/10.1056/NEJMsa1610524.
16. Calcaterra SL, Scarbro S, Hull ML, et al. Prediction of future chronic opioid use Among hospitalized patients. J Gen Intern Med. 2018;33(6):898-905. https://doi.org/10.1007/s11606-018-4335-8.
17. Callister LC. Cultural influences on pain perceptions and behaviors. Home Health Care Manag Pract. 2003;15(3):207-211. https://doi.org/10.1177/1084822302250687.
18. Paulozzi LJ, Mack KA, Hockenberry JM. Vital signs: Variation among states in prescribing of opioid pain relievers and benzodiazepines--United States, 2012. J Saf Res. 2014;63(26):563-568. https://doi.org/10.1016/j.jsr.2014.09.001.
19. Callister LC, Khalaf I, Semenic S, Kartchner R, Vehvilainen-Julkunen K. The pain of childbirth: perceptions of culturally diverse women. Pain Manag Nurs. 2003;4(4):145-154. https://doi.org/10.1016/S1524-9042(03)00028-6.
20. Moore R, Brødsgaard I, Mao TK, Miller ML, Dworkin SF. Perceived need for local anesthesia in tooth drilling among Anglo-Americans, Chinese, and Scandinavians. Anesth Prog. 1998;45(1):22-28.
21. Kankkunen PM, Vehviläinen-Julkunen KM, Pietilä AM, et al. A tale of two countries: comparison of the perceptions of analgesics among Finnish and American parents. Pain Manag Nurs. 2008;9(3):113-119. https://doi.org/10.1016/j.pmn.2007.12.003.
22. Hanoch Y, Katsikopoulos KV, Gummerum M, Brass EP. American and German students’ knowledge, perceptions, and behaviors with respect to over-the-counter pain relievers. Health Psychol. 2007;26(6):802-806. https://doi.org/10.1037/0278-6133.26.6.802.
23. Manjiani D, Paul DB, Kunnumpurath S, Kaye AD, Vadivelu N. Availability and utilization of opioids for pain management: global issues. Ochsner J. 2014;14(2):208-215.
24. Quality improvement guidelines for the treatment of acute pain and cancer pain. JAMA. 1995;274(23):1874-1880.
25. McNeill JA, Sherwood GD, Starck PL, Thompson CJ. Assessing clinical outcomes: patient satisfaction with pain management. J Pain Symptom Manag. 1998;16(1):29-40. https://doi.org/10.1016/S0885-3924(98)00034-7.
26. Ferrari R, Novello C, Catania G, Visentin M. Patients’ satisfaction with pain management: the Italian version of the Patient Outcome Questionnaire of the American Pain Society. Recenti Prog Med. 2010;101(7–8):283-288.
27. Malouf J, Andión O, Torrubia R, Cañellas M, Baños JE. A survey of perceptions with pain management in Spanish inpatients. J Pain Symptom Manag. 2006;32(4):361-371. https://doi.org/10.1016/j.jpainsymman.2006.05.006.
28. Gordon DB, Polomano RC, Pellino TA, et al. Revised American Pain Society Patient Outcome Questionnaire (APS-POQ-R) for quality improvement of pain management in hospitalized adults: preliminary psychometric evaluation. J Pain. 2010;11(11):1172-1186. https://doi.org/10.1016/j.jpain.2010.02.012.
29. Beaton DE, Bombardier C, Guillemin F, Ferraz MB. Guidelines for the process of cross-cultural adaptation of self-report measures. Spine (Phila Pa 1976). 2000;25(24):3186-3191. https://doi.org/10.1097/00007632-200012150-00014.
30. Harris PA, Taylor R, Thielke R, et al. Research Electronic Data Capture (REDCap)--a metadata-driven methodology and workflow process for providing translational research informatics support. J Biomed Inform. 2009;42(2):377-381. https://doi.org/10.1016/j.jbi.2008.08.010.
31. Duman F. After surgery in Germany, I wanted Vicodin, not herbal tea. New York Times. January 27, 2018. https://www.nytimes.com/2018/01/27/opinion/sunday/surgery-germany-vicodin.html. Accessed November 6, 2018.
32. Beaudoin FL, Banerjee GN, Mello MJ. State-level and system-level opioid prescribing policies: the impact on provider practices and overdose deaths, a systematic review. J Opioid Manag. 2016;12(2):109-118. https://doi.org/10.5055/jom.2016.0322.33. Bao Y, Wen K, Johnson P, et al. Assessing the impact of state policies for prescription drug monitoring programs on high-risk opioid prescriptions. Health Aff (Millwood). 2018;37(10):1596-1604. https://doi.org/10.1377/hlthaff.2018.0512.
34. Friedman J, Kim D, Schneberk T, et al. Assessment of racial/ethnic and income disparities in the prescription of opioids and other controlled medications in California. JAMA Intern Med. 2019. https://doi.org/10.1001/jamainternmed.2018.6721.
35. Steel Z, Marnane C, Iranpour C, et al. The global prevalence of common mental disorders: a systematic review and meta-analysis 1980-2013. Int J Epidemiol. 2014;43(2):476-493. https://doi.org/10.1093/ije/dyu038.
36. Simon GE, Goldberg DP, Von Korff M, Ustün TB. Understanding cross-national differences in depression prevalence. Psychol Med. 2002;32(4):585-594. https://doi.org/10.1017/S0033291702005457.
© 2019 Society of Hospital Medicine
Gender Disparities for Academic Hospitalists
Gender disparities still exist for women in academic medicine.[1, 2, 3, 4, 5, 6, 7, 8, 9] The most recent data from the Association of American Medical Colleges (AAMC) show that although gender disparities are decreasing, women are still under‐represented in the assistant, associate, and full‐professor ranks as well as in leadership positions.[1]
Some studies indicate that gender differences are less evident when examining younger cohorts.[1, 10, 11, 12, 13] Hospital medicine emerged around 1996, when the term hospitalist was first coined.[14] The gender distribution of academic hospitalists is likely nearly equal,[15, 16] and they are generally younger physicians.[15, 17, 18, 19, 20] Accordingly, we questioned whether gender disparities existed in academic hospital medicine (HM) and, if so, whether these disparities were greater than those that might exist in academic general internal medicine (GIM).
METHODS
This study consisted of both prospective and retrospective observation of data collected for academic adult hospitalists and general internists who practice in the United States. It was approved by the Colorado Multiple Institutional Review Board.
Gender distribution was assessed with respect to: (1) academic HM and GIM faculty, (2) leadership (ie, division or section heads), and (3) scholarly work (ie, speaking opportunities and publications). Data were collected between October 1, 2012 and August 31, 2014.
Gender Distribution of Faculty and Division/Section Heads
All US internal medicine residency programs were identified from the list of members or affiliates of the AAMC that were fully accredited by the Liaison Committee on Medical Education[21] using the Graduate Medical Education Directory.[22] We then determined the primary training hospital(s) affiliated with each program and selected those that were considered to be university hospitals and eliminated those that did not have divisions or sections of HM or GIM. We determined the gender of the respective division/section heads on the basis of the faculty member's first name (and often from accompanying photos) as well as from information obtained via Internet searches and, if necessary, contacted the individual institutions via email or phone call(s). We also determined the number and gender of all of the HM and GIM faculty members in a random sample of 25% of these hospitals from information on their respective websites.
Gender Distribution for Scholarly Productivity
We determined the gender and specialty of all speakers at the Society of Hospital Medicine and the Society of General Internal Medicine national conferences from 2006 to 2012. A list of speakers at each conference was obtained from conference pamphlets or agendas that were available via Internet searches or obtained directly from the organization. We also determined whether each presenter was a featured speaker (defined as one whose talk was unopposed by other sessions), plenary speaker (defined as such in the conference pamphlets), or if they spoke in a group format (also as indicated in the conference pamphlets). Because of the low number of featured and plenary speakers, these data were combined. Faculty labeled as additional faculty when presenting in a group format were excluded as were speakers at precourses, those presenting abstracts, and those participating in interest group sessions.
For authorship, a PubMed search was used to identify all articles published in the Journal of Hospital Medicine (JHM) and the Journal of General Internal Medicine (JGIM) from January 1, 2006 through December 31, 2012, and the gender and specialty of all the first and last authors were determined as described above. Specialty was determined from the division, section or department affiliation indicated for each author and by Internet searches. In some instances, it was necessary to contact the authors or their departments directly to verify their specialty. When articles had only 1 author, the author was considered a first author.
Duplicate records (eg, same author, same journal) and articles without an author were excluded, as were authors who did not have an MD, DO, or MBBS degree and those who were not affiliated with an institution in the United States. All manuscripts, with the exception of errata, were analyzed together as well as in 3 subgroups: original research, editorials, and others.
A second investigator corroborated data regarding gender and specialty for all speakers and authors to strengthen data integrity. On the rare occasion when discrepancies were found, a third investigator adjudicated the results.
Definitions
Physicians were defined as being hospitalists if they were listed as a member of a division or section of HM on their publications or if Internet searches indicated that they were a hospitalist or primarily worked on inpatient medical services. Physicians were considered to be general internists if they were listed as such on their publications and their specialty could be verified in Web‐based searches. If physicians appeared to have changing roles over time, we attempted to assign their specialty based upon their role at the time the article was published or the presentation was delivered. If necessary, phone calls and/or emails were also done to determine the physician's specialty.
Analysis
REDCap, a secure, Web‐based application for building and managing online surveys and databases, was used to collect and manage all study data.[23] All analyses were performed using SAS Enterprise Guide 4.3 (SAS Institute, Inc., Cary, NC). A [2] test was used to compare proportions of male versus female physicians, and data from hospitalists versus general internists. Because we performed multiple comparisons when analyzing presentations and publications, a Bonferroni adjustment was made such that a P<0.0125 for presentations and P<0.006 (within specialty) or P<0.0125 (between specialty) for the publication analyses were considered significant. P<0.05 was considered significant for all other comparisons.
RESULTS
Gender Distribution of Faculty
Eighteen HM and 20 GIM programs from university hospitals were randomly selected for review (see Supporting Figure 1 in the online version of this article). Seven of the HM programs and 1 of the GIM programs did not have a website, did not differentiate hospitalists from other faculty, or did not list their faculty on the website and were excluded from the analysis. In the remaining 11 HM programs and 19 GIM programs, women made up 277/568 (49%) and 555/1099 (51%) of the faculty, respectively (P=0.50).
Gender Distribution of Division/Section Heads
Eighty‐six of the programs were classified as university hospitals (see Supporting Figure 1 in the online version of this article), and in these, women led 11/69 (16%) of the HM divisions or sections and 28/80 (35%) of the GIM divisions (P=0.008).
Gender Distribution for Scholarly Productivity
Speaking Opportunities
A total of 1227 presentations were given at the 2 conferences from 2006 to 2012, with 1343 of the speakers meeting inclusion criteria (see Supporting Figure 2 in the online version of this article). Hospitalists accounted for 557 of the speakers, of which 146 (26%) were women. General internists accounted for 580 of the speakers, of which 291 (50%) were women (P<0.0001) (Table 1).
| Male, N (%) | Female, N (%) | |
|---|---|---|
| ||
| Hospitalists | ||
| All presentations | 411 (74) | 146 (26)* |
| Featured or plenary presentations | 49 (91) | 5 (9)* |
| General internists | ||
| All presentations | 289 (50) | 291 (50) |
| Featured or plenary presentations | 27 (55) | 22 (45) |
Of the 117 featured or plenary speakers, 54 were hospitalists and 5 (9%) of these were women. Of the 49 who were general internists, 22 (45%) were women (P<0.0001).
Authorship
The PubMed search identified a total of 3285 articles published in the JHM and the JGIM from 2006 to 2012, and 2172 first authors and 1869 last authors met inclusion criteria (see Supporting Figure 3 in the online version of this article). Hospitalists were listed as first or last authors on 464 and 305 articles, respectively, and of these, women were first authors on 153 (33%) and last authors on 63 (21%). General internists were listed as first or last authors on 895 and 769 articles, respectively, with women as first authors on 423 (47%) and last authors on 265 (34%). Compared with general internists, fewer women hospitalists were listed as either first or last authors (both P<0.0001) (Table 2).
| First Author | Last Author | |||
|---|---|---|---|---|
| Male, N (%) | Female, N (%) | Male, N (%) | Female, N (%) | |
| ||||
| Hospitalists | ||||
| All publications | 311 (67) | 153 (33)* | 242 (79) | 63 (21)* |
| Original investigations/brief reports | 124 (61) | 79 (39)* | 96 (76) | 30 (24)* |
| Editorials | 34 (77) | 10 (23)* | 18 (86) | 3 (14)* |
| Other | 153 (71) | 64 (29)* | 128 (81) | 30 (19)* |
| General internists | ||||
| All publications | 472 (53) | 423 (47) | 504 (66) | 265 (34)* |
| Original investigations/brief reports | 218 (46) | 261 (54) | 310 (65) | 170 (35)* |
| Editorial | 98 (68) | 46 (32)* | 43 (73) | 16 (27)* |
| Other | 156 (57) | 116 (43) | 151 (66) | 79 (34)* |
Fewer women hospitalists were listed as first or last authors on all article types. For original research articles written by general internists, there was a trend for more women to be listed as first authors than men (261/479, 54%), but this difference was not statistically significant.
DISCUSSION
The important findings of this study are that, despite an equal gender distribution of academic HM and GIM faculty, fewer women were HM division/section chiefs, fewer women were speakers at the 2 selected national meetings, and fewer women were first or last authors of publications in 2 selected journals in comparison with general internists.
Previous studies have found that women lag behind their male counterparts with respect to academic productivity, leadership, and promotion.[1, 5, 7] Some studies suggest, however, that gender differences are reduced when younger cohorts are examined.[1, 10, 11, 12, 13] Surveys indicate that that the mean age of hospitalists is younger than most other specialties.[15, 19, 20, 24] The mean age of academic GIM physicians is unknown, but surveys of GIM (not differentiating academic from nonacademic) suggest that it is an older cohort than that of HM.[24] Despite hospitalists being a younger cohort, we found gender disparities in all areas investigated.
Our findings with respect to gender disparities in HM division or section leadership are consistent with the annual AAMC Women in US Academic Medicine and Science Benchmarking Report that found only 22% of all permanent division or section heads were women.[1]
Gender disparities with respect to authorship of medical publications have been previously noted,[3, 6, 15, 25] but to our knowledge, this is the first study to investigate the gender of authors who were hospitalists. Although we found a higher proportion of women hospitalists who were first or last authors than was observed by Jagsi and colleagues,[3] women hospitalists were still under‐represented with respect to this measure of academic productivity. Erren et al. reviewed 6 major journals from 2010 and 2011, and found that first authorship of original research by women ranged from 23.7% to 46.7%, and for last authorship from 18.3% to 28.8%.[25] Interestingly, we found no significant gender difference for first authors who were general internists, and there was a trend toward more women general internists being first authors than men for original research, reviews, and brief reports (data not shown).
Our study did not attempt to answer the question of why gender disparities persist, but many previous studies have explored this issue.[4, 8, 12, 26, 27, 28, 29, 30, 31, 32, 33, 34, 35, 36, 37, 38, 39, 40, 41, 42] Issues raised by others include the quantity of academic work (ie, publications and grants obtained), differences in hours worked and allocation of time, lack of mentorship, family responsibilities, discrimination, differences in career motivation, and levels of institutional support, to name a few.
The under‐representation of women hospitalists in leadership, authorship, and speaking opportunities may be consistent with gender‐related differences in research productivity. Fewer publications could lead to fewer national presentations, which could lead to fewer leadership opportunities. Our findings with respect to general internists are not consistent with this idea, however, as whereas women were under‐represented in GIM leadership positions, we found no disparities with respect to the gender of first authors or speakers at national meetings for general internists. The finding that hospitalists had gender disparities with respect to first authors and national speakers but general internists did not, argues against several hypotheses (ie, that women lack mentorship, have less career motivation, fewer career building opportunities).
One notable hypothesis, and perhaps one that is often discussed in the literature, is that women shoulder the majority of family responsibilities, and this may result in women having less time for their careers. Jolly and colleagues studied physician‐researchers and noted that women were more likely than men to have spouses or domestic partners who were fully employed, spent 8.5 more hours per week on domestic activities, and were more likely to take time off during disruptions of usual child care.[33] Carr and colleagues found that women with children (compared to men with children) had fewer publications, slower self‐perceived career progress, and lower career satisfaction, but having children had little effect on faculty aspirations and goals.[2] Kaplan et al., however, found that family responsibilities do not appear to account for sex differences in academic advancement.[4] Interestingly, in a study comparing physicians from Generation X to those of the Baby Boomer age, Generation X women reported working more than their male Generation X counterparts, and both had more of a focus on worklife balance than the older generation.[12]
The nature the of 2 specialties' work environment and job requirements could have also resulted in some of the differences seen. Primary care clinical work is typically conducted Monday through Friday, and hospitalist work frequently includes some weekend, evening, night, and holiday coverage. Although these are known differences, both specialties have also been noted to offer many advantages to women and men alike, including collaborative working environments and flexible work hours.[16]
Finally, finding disparity in leadership positions in both specialties supports the possibility that those responsible for hiring could have implicit gender biases. Under‐representation in entry‐level positions is also not a likely explanation for the differences we observed, because nearly an equal number of men and women graduate from medical school, pursue residency training in internal medicine, and become either academic hospitalists or general internists at university settings.[1, 15, 24] This hypothesis could, however, explain why disparities exist with respect to senior authorship and leadership positions, as typically, these individuals have been in practice longer and the current trends of improved gender equality have not always been the case.
Our study has a number of limitations. First, we only examined publications in 2 journals and presentations at 2 national conferences, although the journals and conferences selected are considered to be the major ones in the 2 specialties. Second, using Internet searches may have resulted in inaccurate gender and specialty assignment, but previous studies have used similar methodology.[3, 43] Additionally, we also attempted to contact individuals for direct confirmation when the information we obtained was not clear and had a second investigator independently verify the gender and specialty data. Third, we utilized division/department websites when available to determine the gender of HM divisions/sections. If not recently updated, these websites may not have reflected the most current leader of the unit, but this concern would seemingly pertain to both hospitalists and general internists. Fourth, we opted to only study faculty and division/section heads at university hospitals, as typically these institutions had GIM and hospitalist groups and also typically had websites. Because we only studied faculty and leadership at university hospitals, our data are not generalizable to all hospitalist and GIM groups. Finally, we excluded pediatric hospitalists, and thus, this study is representative of adult hospitalists only. Including pediatric hospitalists was out of the scope of this project.
Our study also had a number of strengths. To our knowledge, this is the first study to provide an estimate of the gender distribution in academic HM, of hospitalists as speakers at national meetings, as first and last authors, and of HM division or section heads, and is the first to compare these results with those observed for general internists. In addition, we examined 7 years of data from 2 of the major journals and national conferences for these specialties.
In summary, despite HM being a newer field with a younger cohort of physicians, we found that gender disparities exist for women with respect to authorship, national speaking opportunities, and division or section leadership. Identifying why these gender differences exist presents an important next step.
Disclosures: Nothing to report. Marisha Burden, MD and Maria G. Frank, MD are coprincipal authors.
- Association of American Medical Colleges. Women in U.S. academic medicine and science: Statistics and benchmarking report. 2012. Available at: https://members.aamc.org/eweb/upload/Women%20in%20U%20S%20%20Academic%20Medicine%20Statistics%20and%20Benchmarking%20Report%202011-20123.pdf. Accessed September 1, 2014.
- , , , et al. Relation of family responsibilities and gender to the productivity and career satisfaction of medical faculty. Ann Intern Med. 1998;129:532–538.
- , , , et al. The “gender gap” in authorship of academic medical literature—a 35‐year perspective. N Engl J Med. 2006;355:281–287.
- , , , , , . Sex differences in academic advancement. Results of a national study of pediatricians. N Engl J Med. 1996;335:1282–1289.
- . Women physicians in academic medicine: new insights from cohort studies. N Engl J Med. 2000;342:399–405.
- , , , , . Gender differences in academic productivity and leadership appointments of physicians throughout academic careers. Acad Med. 2011;86:43–47.
- , , , . Promotion of women physicians in academic medicine. Glass ceiling or sticky floor? JAMA. 1995;273:1022–1025.
- , , , . Compensation and advancement of women in academic medicine: is there equity? Ann Intern Med. 2004;141:205–212.
- , , . Women physicians: choosing a career in academic medicine. Acad Med. 2012;87:105–114.
- , , , . The status of women at one academic medical center. Breaking through the glass ceiling. JAMA. 1990;264:1813–1817.
- , . Status of women in academic anesthesiology. Anesthesiology. 1986;64:496–500.
- , , . The generation and gender shifts in medicine: an exploratory survey of internal medicine physicians. BMC Health Serv Res. 2006;6:55.
- Pew Research Center. On pay gap, millenial women near parity—for now. December 2013. Available at: http://www.pewsocialtrends.org/files/2013/12/gender-and-work_final.pdf. Published December 11, 2013. Accessed February 5, 2015.
- , . The emerging role of "hospitalists" in the American health care system. N Engl J Med. 1996;335:514–517.
- , , , , , . Mentorship, productivity, and promotion among academic hospitalists. J Gen Intern Med. 2012;27:23–27.
- . The gender factor. The Hospitalist. Available at: http://www.the‐hospitalist.org/article/the‐gender‐factor. Published March 1, 2006. Accessed September 1, 2014.
- Association of American Medical Colleges. Analysis in brief: Supplemental information for estimating the number and characteristics of hospitalist physicians in the United States and their possible workforce implications. Available at: https://www.aamc.org/download/300686/data/aibvol12_no3-supplemental.pdf. Published August 2012. Accessed September 1, 2014.
- , , , . Survey of US academic hospitalist leaders about mentorship and academic activities in hospitalist groups. J Hosp Med. 2011;6:5–9.
- State of Hospital Medicine: 2011 Report Based on 2010 Data. Medical Group Management Association and Society of Hospital Medicine. www.mgma.com, www.hospitalmedicine.org.
- Today's Hospitalist Survey. Compensation and Career Survey Results. 2013. Available at: http://www.todayshospitalist.com/index.php?b=salary_survey_results. Accessed January 11, 2015.
- Association of American Medical Colleges. Women in U.S. Academic Medicine: Statistics and Benchmarking Report. 2009–2010. Available at: https://www.aamc.org/download/182674/data/gwims_stats_2009‐2010.pdf. Accessed September 1, 2014.
- American Medical Association. Graduate Medical Education Directory 2012–2013. Chicago, IL: American Medical Association; 2012:182–203.
- , , , , , . Research electronic data capture (REDCap)—a metadata‐driven methodology and workflow process for providing translational research informatics support. J Biomed Inform. 2009;42:377–381.
- Association of American Medical Colleges. 2012 Physician Specialty Data Book. Center for Workforce Studies. Available at: https://www.aamc.org/download/313228/data/2012physicianspecialtydatabook.pdf. Published November 2012. Accessed September 1, 2014.
- , , , . Representation of women as authors, reviewers, editors in chief, and editorial board members at 6 general medical journals in 2010 and 2011. JAMA Intern Med. 2014;174:633–635.
- , , , et al. Relationships of gender and career motivation to medical faculty members' production of academic publications. Acad Med. 1998;73:180–186.
- , , , et al. Faculty perceptions of gender discrimination and sexual harassment in academic medicine. Ann Intern Med. 2000;132:889–896.
- , , , . Attitudes of clinical faculty about career progress, career success and recognition, and commitment to academic medicine. Results of a survey. Arch Intern Med. 2000;160:2625–2629.
- , , , , . A "ton of feathers": gender discrimination in academic medical careers and how to manage it. J Womens Health (Larchmt). 2003;12:1009–1018.
- , , . Perceived obstacles to career success for women in academic surgery. Arch Surg. 2000;135:972–977.
- , , , . Career satisfaction of US women physicians: results from the Women Physicians' Health Study. Society of General Internal Medicine Career Satisfaction Study Group. Arch Intern Med. 1999;159:1417–1426.
- . Doing the same and earning less: male and female physicians in a new medical specialty. Inquiry. 2004;41:301–315.
- , , , , , . Gender differences in time spent on parenting and domestic responsibilities by high‐achieving young physician‐researchers. Ann Intern Med. 2014;160:344–353.
- , , , , . Stories from early‐career women physicians who have left academic medicine: a qualitative study at a single institution. Acad Med. 2011;86:752–758.
- , , , . The $16,819 pay gap for newly trained physicians: the unexplained trend of men earning more than women. Health Aff (Millwood). 2011;30:193–201.
- , , , , . Experiencing the culture of academic medicine: gender matters, a national study. J Gen Intern Med. 2013;28:201–207.
- . Gender pay gaps in hospital medicine. The Hospitalist. Available at: http://www.the‐hospitalist.org/article/gender‐pay‐gaps‐in‐hospital‐medicine. Published February 29, 2012. Accessed September 1, 2014.
- , , . Mentoring in academic medicine: a systematic review. JAMA. 2006;296:1103–1115.
- . Inequality quantified: mind the gender gap. Nature. 2013;495:22–24.
- , , , et al. Gender differences in academic advancement: patterns, causes, and potential solutions in one US College of Medicine. Acad Med. 2003;78:500–508.
- , . Why aren't there more women leaders in academic medicine? The views of clinical department chairs. Acad Med. 2001;76:453–465.
- . Gender factors in reviewer recommendations for manuscript publication. J Appl Behav Anal. 1990;23:539–543.
- , , , . Scientific impact of women in academic surgery. J Surg Res. 2008;148:13–16.
Gender disparities still exist for women in academic medicine.[1, 2, 3, 4, 5, 6, 7, 8, 9] The most recent data from the Association of American Medical Colleges (AAMC) show that although gender disparities are decreasing, women are still under‐represented in the assistant, associate, and full‐professor ranks as well as in leadership positions.[1]
Some studies indicate that gender differences are less evident when examining younger cohorts.[1, 10, 11, 12, 13] Hospital medicine emerged around 1996, when the term hospitalist was first coined.[14] The gender distribution of academic hospitalists is likely nearly equal,[15, 16] and they are generally younger physicians.[15, 17, 18, 19, 20] Accordingly, we questioned whether gender disparities existed in academic hospital medicine (HM) and, if so, whether these disparities were greater than those that might exist in academic general internal medicine (GIM).
METHODS
This study consisted of both prospective and retrospective observation of data collected for academic adult hospitalists and general internists who practice in the United States. It was approved by the Colorado Multiple Institutional Review Board.
Gender distribution was assessed with respect to: (1) academic HM and GIM faculty, (2) leadership (ie, division or section heads), and (3) scholarly work (ie, speaking opportunities and publications). Data were collected between October 1, 2012 and August 31, 2014.
Gender Distribution of Faculty and Division/Section Heads
All US internal medicine residency programs were identified from the list of members or affiliates of the AAMC that were fully accredited by the Liaison Committee on Medical Education[21] using the Graduate Medical Education Directory.[22] We then determined the primary training hospital(s) affiliated with each program and selected those that were considered to be university hospitals and eliminated those that did not have divisions or sections of HM or GIM. We determined the gender of the respective division/section heads on the basis of the faculty member's first name (and often from accompanying photos) as well as from information obtained via Internet searches and, if necessary, contacted the individual institutions via email or phone call(s). We also determined the number and gender of all of the HM and GIM faculty members in a random sample of 25% of these hospitals from information on their respective websites.
Gender Distribution for Scholarly Productivity
We determined the gender and specialty of all speakers at the Society of Hospital Medicine and the Society of General Internal Medicine national conferences from 2006 to 2012. A list of speakers at each conference was obtained from conference pamphlets or agendas that were available via Internet searches or obtained directly from the organization. We also determined whether each presenter was a featured speaker (defined as one whose talk was unopposed by other sessions), plenary speaker (defined as such in the conference pamphlets), or if they spoke in a group format (also as indicated in the conference pamphlets). Because of the low number of featured and plenary speakers, these data were combined. Faculty labeled as additional faculty when presenting in a group format were excluded as were speakers at precourses, those presenting abstracts, and those participating in interest group sessions.
For authorship, a PubMed search was used to identify all articles published in the Journal of Hospital Medicine (JHM) and the Journal of General Internal Medicine (JGIM) from January 1, 2006 through December 31, 2012, and the gender and specialty of all the first and last authors were determined as described above. Specialty was determined from the division, section or department affiliation indicated for each author and by Internet searches. In some instances, it was necessary to contact the authors or their departments directly to verify their specialty. When articles had only 1 author, the author was considered a first author.
Duplicate records (eg, same author, same journal) and articles without an author were excluded, as were authors who did not have an MD, DO, or MBBS degree and those who were not affiliated with an institution in the United States. All manuscripts, with the exception of errata, were analyzed together as well as in 3 subgroups: original research, editorials, and others.
A second investigator corroborated data regarding gender and specialty for all speakers and authors to strengthen data integrity. On the rare occasion when discrepancies were found, a third investigator adjudicated the results.
Definitions
Physicians were defined as being hospitalists if they were listed as a member of a division or section of HM on their publications or if Internet searches indicated that they were a hospitalist or primarily worked on inpatient medical services. Physicians were considered to be general internists if they were listed as such on their publications and their specialty could be verified in Web‐based searches. If physicians appeared to have changing roles over time, we attempted to assign their specialty based upon their role at the time the article was published or the presentation was delivered. If necessary, phone calls and/or emails were also done to determine the physician's specialty.
Analysis
REDCap, a secure, Web‐based application for building and managing online surveys and databases, was used to collect and manage all study data.[23] All analyses were performed using SAS Enterprise Guide 4.3 (SAS Institute, Inc., Cary, NC). A [2] test was used to compare proportions of male versus female physicians, and data from hospitalists versus general internists. Because we performed multiple comparisons when analyzing presentations and publications, a Bonferroni adjustment was made such that a P<0.0125 for presentations and P<0.006 (within specialty) or P<0.0125 (between specialty) for the publication analyses were considered significant. P<0.05 was considered significant for all other comparisons.
RESULTS
Gender Distribution of Faculty
Eighteen HM and 20 GIM programs from university hospitals were randomly selected for review (see Supporting Figure 1 in the online version of this article). Seven of the HM programs and 1 of the GIM programs did not have a website, did not differentiate hospitalists from other faculty, or did not list their faculty on the website and were excluded from the analysis. In the remaining 11 HM programs and 19 GIM programs, women made up 277/568 (49%) and 555/1099 (51%) of the faculty, respectively (P=0.50).
Gender Distribution of Division/Section Heads
Eighty‐six of the programs were classified as university hospitals (see Supporting Figure 1 in the online version of this article), and in these, women led 11/69 (16%) of the HM divisions or sections and 28/80 (35%) of the GIM divisions (P=0.008).
Gender Distribution for Scholarly Productivity
Speaking Opportunities
A total of 1227 presentations were given at the 2 conferences from 2006 to 2012, with 1343 of the speakers meeting inclusion criteria (see Supporting Figure 2 in the online version of this article). Hospitalists accounted for 557 of the speakers, of which 146 (26%) were women. General internists accounted for 580 of the speakers, of which 291 (50%) were women (P<0.0001) (Table 1).
| Male, N (%) | Female, N (%) | |
|---|---|---|
| ||
| Hospitalists | ||
| All presentations | 411 (74) | 146 (26)* |
| Featured or plenary presentations | 49 (91) | 5 (9)* |
| General internists | ||
| All presentations | 289 (50) | 291 (50) |
| Featured or plenary presentations | 27 (55) | 22 (45) |
Of the 117 featured or plenary speakers, 54 were hospitalists and 5 (9%) of these were women. Of the 49 who were general internists, 22 (45%) were women (P<0.0001).
Authorship
The PubMed search identified a total of 3285 articles published in the JHM and the JGIM from 2006 to 2012, and 2172 first authors and 1869 last authors met inclusion criteria (see Supporting Figure 3 in the online version of this article). Hospitalists were listed as first or last authors on 464 and 305 articles, respectively, and of these, women were first authors on 153 (33%) and last authors on 63 (21%). General internists were listed as first or last authors on 895 and 769 articles, respectively, with women as first authors on 423 (47%) and last authors on 265 (34%). Compared with general internists, fewer women hospitalists were listed as either first or last authors (both P<0.0001) (Table 2).
| First Author | Last Author | |||
|---|---|---|---|---|
| Male, N (%) | Female, N (%) | Male, N (%) | Female, N (%) | |
| ||||
| Hospitalists | ||||
| All publications | 311 (67) | 153 (33)* | 242 (79) | 63 (21)* |
| Original investigations/brief reports | 124 (61) | 79 (39)* | 96 (76) | 30 (24)* |
| Editorials | 34 (77) | 10 (23)* | 18 (86) | 3 (14)* |
| Other | 153 (71) | 64 (29)* | 128 (81) | 30 (19)* |
| General internists | ||||
| All publications | 472 (53) | 423 (47) | 504 (66) | 265 (34)* |
| Original investigations/brief reports | 218 (46) | 261 (54) | 310 (65) | 170 (35)* |
| Editorial | 98 (68) | 46 (32)* | 43 (73) | 16 (27)* |
| Other | 156 (57) | 116 (43) | 151 (66) | 79 (34)* |
Fewer women hospitalists were listed as first or last authors on all article types. For original research articles written by general internists, there was a trend for more women to be listed as first authors than men (261/479, 54%), but this difference was not statistically significant.
DISCUSSION
The important findings of this study are that, despite an equal gender distribution of academic HM and GIM faculty, fewer women were HM division/section chiefs, fewer women were speakers at the 2 selected national meetings, and fewer women were first or last authors of publications in 2 selected journals in comparison with general internists.
Previous studies have found that women lag behind their male counterparts with respect to academic productivity, leadership, and promotion.[1, 5, 7] Some studies suggest, however, that gender differences are reduced when younger cohorts are examined.[1, 10, 11, 12, 13] Surveys indicate that that the mean age of hospitalists is younger than most other specialties.[15, 19, 20, 24] The mean age of academic GIM physicians is unknown, but surveys of GIM (not differentiating academic from nonacademic) suggest that it is an older cohort than that of HM.[24] Despite hospitalists being a younger cohort, we found gender disparities in all areas investigated.
Our findings with respect to gender disparities in HM division or section leadership are consistent with the annual AAMC Women in US Academic Medicine and Science Benchmarking Report that found only 22% of all permanent division or section heads were women.[1]
Gender disparities with respect to authorship of medical publications have been previously noted,[3, 6, 15, 25] but to our knowledge, this is the first study to investigate the gender of authors who were hospitalists. Although we found a higher proportion of women hospitalists who were first or last authors than was observed by Jagsi and colleagues,[3] women hospitalists were still under‐represented with respect to this measure of academic productivity. Erren et al. reviewed 6 major journals from 2010 and 2011, and found that first authorship of original research by women ranged from 23.7% to 46.7%, and for last authorship from 18.3% to 28.8%.[25] Interestingly, we found no significant gender difference for first authors who were general internists, and there was a trend toward more women general internists being first authors than men for original research, reviews, and brief reports (data not shown).
Our study did not attempt to answer the question of why gender disparities persist, but many previous studies have explored this issue.[4, 8, 12, 26, 27, 28, 29, 30, 31, 32, 33, 34, 35, 36, 37, 38, 39, 40, 41, 42] Issues raised by others include the quantity of academic work (ie, publications and grants obtained), differences in hours worked and allocation of time, lack of mentorship, family responsibilities, discrimination, differences in career motivation, and levels of institutional support, to name a few.
The under‐representation of women hospitalists in leadership, authorship, and speaking opportunities may be consistent with gender‐related differences in research productivity. Fewer publications could lead to fewer national presentations, which could lead to fewer leadership opportunities. Our findings with respect to general internists are not consistent with this idea, however, as whereas women were under‐represented in GIM leadership positions, we found no disparities with respect to the gender of first authors or speakers at national meetings for general internists. The finding that hospitalists had gender disparities with respect to first authors and national speakers but general internists did not, argues against several hypotheses (ie, that women lack mentorship, have less career motivation, fewer career building opportunities).
One notable hypothesis, and perhaps one that is often discussed in the literature, is that women shoulder the majority of family responsibilities, and this may result in women having less time for their careers. Jolly and colleagues studied physician‐researchers and noted that women were more likely than men to have spouses or domestic partners who were fully employed, spent 8.5 more hours per week on domestic activities, and were more likely to take time off during disruptions of usual child care.[33] Carr and colleagues found that women with children (compared to men with children) had fewer publications, slower self‐perceived career progress, and lower career satisfaction, but having children had little effect on faculty aspirations and goals.[2] Kaplan et al., however, found that family responsibilities do not appear to account for sex differences in academic advancement.[4] Interestingly, in a study comparing physicians from Generation X to those of the Baby Boomer age, Generation X women reported working more than their male Generation X counterparts, and both had more of a focus on worklife balance than the older generation.[12]
The nature the of 2 specialties' work environment and job requirements could have also resulted in some of the differences seen. Primary care clinical work is typically conducted Monday through Friday, and hospitalist work frequently includes some weekend, evening, night, and holiday coverage. Although these are known differences, both specialties have also been noted to offer many advantages to women and men alike, including collaborative working environments and flexible work hours.[16]
Finally, finding disparity in leadership positions in both specialties supports the possibility that those responsible for hiring could have implicit gender biases. Under‐representation in entry‐level positions is also not a likely explanation for the differences we observed, because nearly an equal number of men and women graduate from medical school, pursue residency training in internal medicine, and become either academic hospitalists or general internists at university settings.[1, 15, 24] This hypothesis could, however, explain why disparities exist with respect to senior authorship and leadership positions, as typically, these individuals have been in practice longer and the current trends of improved gender equality have not always been the case.
Our study has a number of limitations. First, we only examined publications in 2 journals and presentations at 2 national conferences, although the journals and conferences selected are considered to be the major ones in the 2 specialties. Second, using Internet searches may have resulted in inaccurate gender and specialty assignment, but previous studies have used similar methodology.[3, 43] Additionally, we also attempted to contact individuals for direct confirmation when the information we obtained was not clear and had a second investigator independently verify the gender and specialty data. Third, we utilized division/department websites when available to determine the gender of HM divisions/sections. If not recently updated, these websites may not have reflected the most current leader of the unit, but this concern would seemingly pertain to both hospitalists and general internists. Fourth, we opted to only study faculty and division/section heads at university hospitals, as typically these institutions had GIM and hospitalist groups and also typically had websites. Because we only studied faculty and leadership at university hospitals, our data are not generalizable to all hospitalist and GIM groups. Finally, we excluded pediatric hospitalists, and thus, this study is representative of adult hospitalists only. Including pediatric hospitalists was out of the scope of this project.
Our study also had a number of strengths. To our knowledge, this is the first study to provide an estimate of the gender distribution in academic HM, of hospitalists as speakers at national meetings, as first and last authors, and of HM division or section heads, and is the first to compare these results with those observed for general internists. In addition, we examined 7 years of data from 2 of the major journals and national conferences for these specialties.
In summary, despite HM being a newer field with a younger cohort of physicians, we found that gender disparities exist for women with respect to authorship, national speaking opportunities, and division or section leadership. Identifying why these gender differences exist presents an important next step.
Disclosures: Nothing to report. Marisha Burden, MD and Maria G. Frank, MD are coprincipal authors.
- Association of American Medical Colleges. Women in U.S. academic medicine and science: Statistics and benchmarking report. 2012. Available at: https://members.aamc.org/eweb/upload/Women%20in%20U%20S%20%20Academic%20Medicine%20Statistics%20and%20Benchmarking%20Report%202011-20123.pdf. Accessed September 1, 2014.
- , , , et al. Relation of family responsibilities and gender to the productivity and career satisfaction of medical faculty. Ann Intern Med. 1998;129:532–538.
- , , , et al. The “gender gap” in authorship of academic medical literature—a 35‐year perspective. N Engl J Med. 2006;355:281–287.
- , , , , , . Sex differences in academic advancement. Results of a national study of pediatricians. N Engl J Med. 1996;335:1282–1289.
- . Women physicians in academic medicine: new insights from cohort studies. N Engl J Med. 2000;342:399–405.
- , , , , . Gender differences in academic productivity and leadership appointments of physicians throughout academic careers. Acad Med. 2011;86:43–47.
- , , , . Promotion of women physicians in academic medicine. Glass ceiling or sticky floor? JAMA. 1995;273:1022–1025.
- , , , . Compensation and advancement of women in academic medicine: is there equity? Ann Intern Med. 2004;141:205–212.
- , , . Women physicians: choosing a career in academic medicine. Acad Med. 2012;87:105–114.
- , , , . The status of women at one academic medical center. Breaking through the glass ceiling. JAMA. 1990;264:1813–1817.
- , . Status of women in academic anesthesiology. Anesthesiology. 1986;64:496–500.
- , , . The generation and gender shifts in medicine: an exploratory survey of internal medicine physicians. BMC Health Serv Res. 2006;6:55.
- Pew Research Center. On pay gap, millenial women near parity—for now. December 2013. Available at: http://www.pewsocialtrends.org/files/2013/12/gender-and-work_final.pdf. Published December 11, 2013. Accessed February 5, 2015.
- , . The emerging role of "hospitalists" in the American health care system. N Engl J Med. 1996;335:514–517.
- , , , , , . Mentorship, productivity, and promotion among academic hospitalists. J Gen Intern Med. 2012;27:23–27.
- . The gender factor. The Hospitalist. Available at: http://www.the‐hospitalist.org/article/the‐gender‐factor. Published March 1, 2006. Accessed September 1, 2014.
- Association of American Medical Colleges. Analysis in brief: Supplemental information for estimating the number and characteristics of hospitalist physicians in the United States and their possible workforce implications. Available at: https://www.aamc.org/download/300686/data/aibvol12_no3-supplemental.pdf. Published August 2012. Accessed September 1, 2014.
- , , , . Survey of US academic hospitalist leaders about mentorship and academic activities in hospitalist groups. J Hosp Med. 2011;6:5–9.
- State of Hospital Medicine: 2011 Report Based on 2010 Data. Medical Group Management Association and Society of Hospital Medicine. www.mgma.com, www.hospitalmedicine.org.
- Today's Hospitalist Survey. Compensation and Career Survey Results. 2013. Available at: http://www.todayshospitalist.com/index.php?b=salary_survey_results. Accessed January 11, 2015.
- Association of American Medical Colleges. Women in U.S. Academic Medicine: Statistics and Benchmarking Report. 2009–2010. Available at: https://www.aamc.org/download/182674/data/gwims_stats_2009‐2010.pdf. Accessed September 1, 2014.
- American Medical Association. Graduate Medical Education Directory 2012–2013. Chicago, IL: American Medical Association; 2012:182–203.
- , , , , , . Research electronic data capture (REDCap)—a metadata‐driven methodology and workflow process for providing translational research informatics support. J Biomed Inform. 2009;42:377–381.
- Association of American Medical Colleges. 2012 Physician Specialty Data Book. Center for Workforce Studies. Available at: https://www.aamc.org/download/313228/data/2012physicianspecialtydatabook.pdf. Published November 2012. Accessed September 1, 2014.
- , , , . Representation of women as authors, reviewers, editors in chief, and editorial board members at 6 general medical journals in 2010 and 2011. JAMA Intern Med. 2014;174:633–635.
- , , , et al. Relationships of gender and career motivation to medical faculty members' production of academic publications. Acad Med. 1998;73:180–186.
- , , , et al. Faculty perceptions of gender discrimination and sexual harassment in academic medicine. Ann Intern Med. 2000;132:889–896.
- , , , . Attitudes of clinical faculty about career progress, career success and recognition, and commitment to academic medicine. Results of a survey. Arch Intern Med. 2000;160:2625–2629.
- , , , , . A "ton of feathers": gender discrimination in academic medical careers and how to manage it. J Womens Health (Larchmt). 2003;12:1009–1018.
- , , . Perceived obstacles to career success for women in academic surgery. Arch Surg. 2000;135:972–977.
- , , , . Career satisfaction of US women physicians: results from the Women Physicians' Health Study. Society of General Internal Medicine Career Satisfaction Study Group. Arch Intern Med. 1999;159:1417–1426.
- . Doing the same and earning less: male and female physicians in a new medical specialty. Inquiry. 2004;41:301–315.
- , , , , , . Gender differences in time spent on parenting and domestic responsibilities by high‐achieving young physician‐researchers. Ann Intern Med. 2014;160:344–353.
- , , , , . Stories from early‐career women physicians who have left academic medicine: a qualitative study at a single institution. Acad Med. 2011;86:752–758.
- , , , . The $16,819 pay gap for newly trained physicians: the unexplained trend of men earning more than women. Health Aff (Millwood). 2011;30:193–201.
- , , , , . Experiencing the culture of academic medicine: gender matters, a national study. J Gen Intern Med. 2013;28:201–207.
- . Gender pay gaps in hospital medicine. The Hospitalist. Available at: http://www.the‐hospitalist.org/article/gender‐pay‐gaps‐in‐hospital‐medicine. Published February 29, 2012. Accessed September 1, 2014.
- , , . Mentoring in academic medicine: a systematic review. JAMA. 2006;296:1103–1115.
- . Inequality quantified: mind the gender gap. Nature. 2013;495:22–24.
- , , , et al. Gender differences in academic advancement: patterns, causes, and potential solutions in one US College of Medicine. Acad Med. 2003;78:500–508.
- , . Why aren't there more women leaders in academic medicine? The views of clinical department chairs. Acad Med. 2001;76:453–465.
- . Gender factors in reviewer recommendations for manuscript publication. J Appl Behav Anal. 1990;23:539–543.
- , , , . Scientific impact of women in academic surgery. J Surg Res. 2008;148:13–16.
© 2015 Society of Hospital Medicine