User login
Surgical Comanagement for Hip Fracture: Time for a Randomized Trial
The growth in the hospitalist workforce has been one of the major trends shaping US (and international) inpatient medicine over the last 25 years.1 Hospitalists’ clinical work is typically split among serving as the primary attending for admitted patients (termed “most responsible physician,” or MRP, in Canada), outpatient clinics, medical consults, and comanagement.2,3 Comanagement typically involves the cooperative efforts of hospitalists and subspecialists ranging from general surgery to orthopedics to medical oncology. Comanagement differs from typical medical consultation because comanaging hospitalists are commonly given broad discretion to directly write orders, manage intercurrent medical illness (eg, hyperglycemia), and even discharge patients from the hospital when appropriate. There can be significant heterogeneity in how comanagement is implemented across institutions.4
With respect to hip fractures, literature suggests that subspecialists value comanagement and that comanagement is associated with reductions in hospital length of stay, timelier surgical repair, and potential cost savings for hospitals.5-7 Some studies have found reductions in in-hospital and 1-year mortality (including one meta-analysis on ortho-geriatric comanagement)8 and complications,9 but others have found no such benefits.10,11
In the current issue of the Journal of Hospital Medicine, Maxwell and Mirza used data from the National Surgical Quality Improvement Program (NSQIP) Participant Use Data File (PUF)—specifically, from the Hip Fracture PUF—to investigate the relationship between comanagement and mortality and major morbidity among more than 15,000 patients hospitalized with hip fracture.12 The investigators did not find that comanagement was associated with a reduction in either morbidity or mortality.
Several factors give gravitas to their analysis. First, the NSQIP PUF is an extremely rigorous data source for evaluating surgical outcomes. Originally developed in the US Veterans Health Administration in the 1980’s to standardize data elements needed for quality improvement and hospital benchmarking, today NSQIP involves more than 600 hospitals in 9 different countries submitting hundreds of thousands of cases annually.13 Second, the authors recognized that the comanagement and noncomanagement groups differed substantially and used propensity score matching in an effort to account for these differences. Surprisingly, they found that the comanagement had significantly higher mortality and morbidity than the noncomanagement group, even after propensity score matching.
These results are important in testing the assumption of the inherent “good” of comanagement. Does this study provide definitive evidence that surgical comanagement does not improve outcomes? We would suggest that this study be interpreted in light of certain considerations.
First, comanagement is a broad term including a variety of operationalizations, such as geriatrician vs hospitalist comanagement, involvement before vs after surgery, and varying divisions of responsibility between the surgical and medical services. Research indicates that successful comanagement models tend to incorporate multidisciplinary teams, embrace the “dual primary caregiver” nature of comanagement, and shared goals among primary caregivers, specifically anticipating prevention of complications.5 The NSQIP data do not provide sufficient granularity to allow for investigation of these crucial nuances that may ultimately determine whether comanagement programs are effective. Additionally, comanagement often (but not always) coexists with a care pathway, and so deficiencies in or absence of a care pathway add additional heterogeneity to the comanagement group which is not captured in the NSQIP PUF.
Second, it is important to consider the potential for unmeasured confounding. The propensity score matching did seem to achieve balance in the distribution of most baseline variables between the comanagement and noncomanagement groups, though differences remain for certain covariates. A key assumption in propensity score matching (and in observational research more broadly) is the principle of “no unmeasured confounders” (ie, the assumption that all variables that might influence treatment assignment and outcomes are measured).14 For the NSQIP PUF this absence of unmeasured confounders is clearly not the case because hospital and surgeon variables are omitted from the PUF for reasons of confidentiality. Inclusion of hospital and surgeon variables could well be important because outcomes may vary by hospital or by surgeon, and simultaneously, different hospitals and different surgeons will have different protocols and preferences regarding comanagement. Furthermore, confounding is virtually guaranteed to the extent that hospitals and surgeons do not randomly assign hip fracture patients to comanagement or usual care. The finding of higher mortality in the comanagement group, even after adjustment and matching, suggests the presence of residual confounding. Even if residual confounding is the explanation for the worse outcomes observed in the comanagement group, the finding of a lack of benefit of comanagement is noteworthy and should not be dismissed out of hand.
Limitations aside, these results suggest a need for humility among strong proponents of comanagement, at least in the hip fracture population. While it may still be reasonable to claim that comanagement improves efficiency and may enhance certain aspects of patient or physician satisfaction, the lack of an impact on mortality highlights a need to examine the benefits of these programs more carefully. From a clinical perspective, hospitalists and orthopedic surgeons should consider which hip fracture patients might be most likely to benefit from comanagement.4 From a research perspective, the current study highlights the pressing need for a randomized trial of comanagement to definitively address the effectiveness of these programs.
1. Wachter RM, Goldman L. Zero to 50,000 — the 20th anniversary of the hospitalist. N Engl J Med. 2016;375(11):1009-1011. https://doi.org/10.1056/NEJMp1607958
2. Hinami K, Whelan CT, Miller JA, Wolosin RJ, Wetterneck TB; Society of Hospital Medicine Career Satisfaction Task Force. Job characteristics, satisfaction, and burnout across hospitalist practice models. J Hosp Med. 2012;7(5):402-410. https://doi.org/10.1002/jhm.1907
3. Soong C, Eddy Fan, Eric E Howell, et al. Characteristics of hospitalists and hospitalist programs in the United States and Canada. J Clin Outcomes Manag . 2009;16(2):69
4. Siegal EM. Just because you can, doesn’t mean that you should: a call for the rational application of hospitalist comanagement. J Hosp Med. 2008;3(5):398-402. https://doi.org/10.1002/jhm.361
5. Swart E, Vasudeva E, Makhni EC, Macaulay W, Bozic KJ. Dedicated perioperative hip fracture comanagement programs are cost-effective in high-volume centers: an economic analysis. Clin Orthop Relat Res. 2016;474(1):222-233. https://doi.org/10.1007/s11999-015-4494-4
6. Bracey DN, Kiymaz TC, Holst DC, et al. An orthopedic-hospitalist comanaged hip fracture service reduces inpatient length of stay. Geriatr Orthop Surg Rehabil. 2016;7(4):171-177. https://doi.org/10.1177/2151458516661383.
7. Soong C, Cram P, Chezar K, et al. Impact of an integrated hip fracture inpatient program on length of stay and costs. J Orthop Trauma. 2016;30(12):647-652. https://doi.org/10.1097/BOT.0000000000000691
8. Grigoryan KV, Javedan H, Rudolph JL. Ortho-geriatric care models and outcomes in hip fracture patients: a systematic review and meta-analysis. J Orthop Trauma. 2014;28(3):e49-e55. https://doi.org/10.1097/BOT.0b013e3182a5a045
9. Vidán M, Serra JA, Moreno C, Riquelme G, Ortiz J. Efficacy of a comprehensive geriatric intervention in older patients hospitalized for hip fracture: a randomized, controlled trial. J Am Geriatr Soc. 2005;53(9):1476-1482. https://doi.org/10.1111/j.1532-5415.2005.53466.x
10. Gregersen M, Mørch MM, Hougaard K, Damsgaard EM. Geriatric intervention in elderly patients with hip fracture in an orthopedic ward. J Inj Violence Res. 2012;4(2):45-51. https://doi.org/10.5249/jivr.v4i2.96
11. Southern WN, Berger MA, Bellin EY, Hailpern SM, Arnsten JH. Hospitalist care and length of stay in patients requiring complex discharge planning and close clinical monitoring. Arch Intern Med. 2007;167(17):1869-1874. http://doi.org/10.1001/archinte.167.17.1869
12. Maxwell B, Mirza A. Medical comanagement of hip fracture patients is not associated with superior perioperative outcomes: A propensity score matched retrospective cohort analysis of the national surgical quality improvement project. J Hosp Med. 2020;15:468-474. http://doi.org/10.12788/jhm.3343
13. Cohen ME, Ko CY, Bilimoria KY, et al. Optimizing ACS NSQIP modeling for evaluation of surgical quality and risk: patient risk adjustment, procedure mix adjustment, shrinkage adjustment, and surgical focus. J Am Coll Surg. 2013;217(2):336–46.e1. https://doi.org/10.1016/j.jamcollsurg.2013.02.027
14. Austin PC. An introduction to propensity score methods for reducing the effects of confounding in observational studies. Multivariate Behav Res. 2011;46(3):399–424. https://doi.org/10.1080/00273171.2011.568786
The growth in the hospitalist workforce has been one of the major trends shaping US (and international) inpatient medicine over the last 25 years.1 Hospitalists’ clinical work is typically split among serving as the primary attending for admitted patients (termed “most responsible physician,” or MRP, in Canada), outpatient clinics, medical consults, and comanagement.2,3 Comanagement typically involves the cooperative efforts of hospitalists and subspecialists ranging from general surgery to orthopedics to medical oncology. Comanagement differs from typical medical consultation because comanaging hospitalists are commonly given broad discretion to directly write orders, manage intercurrent medical illness (eg, hyperglycemia), and even discharge patients from the hospital when appropriate. There can be significant heterogeneity in how comanagement is implemented across institutions.4
With respect to hip fractures, literature suggests that subspecialists value comanagement and that comanagement is associated with reductions in hospital length of stay, timelier surgical repair, and potential cost savings for hospitals.5-7 Some studies have found reductions in in-hospital and 1-year mortality (including one meta-analysis on ortho-geriatric comanagement)8 and complications,9 but others have found no such benefits.10,11
In the current issue of the Journal of Hospital Medicine, Maxwell and Mirza used data from the National Surgical Quality Improvement Program (NSQIP) Participant Use Data File (PUF)—specifically, from the Hip Fracture PUF—to investigate the relationship between comanagement and mortality and major morbidity among more than 15,000 patients hospitalized with hip fracture.12 The investigators did not find that comanagement was associated with a reduction in either morbidity or mortality.
Several factors give gravitas to their analysis. First, the NSQIP PUF is an extremely rigorous data source for evaluating surgical outcomes. Originally developed in the US Veterans Health Administration in the 1980’s to standardize data elements needed for quality improvement and hospital benchmarking, today NSQIP involves more than 600 hospitals in 9 different countries submitting hundreds of thousands of cases annually.13 Second, the authors recognized that the comanagement and noncomanagement groups differed substantially and used propensity score matching in an effort to account for these differences. Surprisingly, they found that the comanagement had significantly higher mortality and morbidity than the noncomanagement group, even after propensity score matching.
These results are important in testing the assumption of the inherent “good” of comanagement. Does this study provide definitive evidence that surgical comanagement does not improve outcomes? We would suggest that this study be interpreted in light of certain considerations.
First, comanagement is a broad term including a variety of operationalizations, such as geriatrician vs hospitalist comanagement, involvement before vs after surgery, and varying divisions of responsibility between the surgical and medical services. Research indicates that successful comanagement models tend to incorporate multidisciplinary teams, embrace the “dual primary caregiver” nature of comanagement, and shared goals among primary caregivers, specifically anticipating prevention of complications.5 The NSQIP data do not provide sufficient granularity to allow for investigation of these crucial nuances that may ultimately determine whether comanagement programs are effective. Additionally, comanagement often (but not always) coexists with a care pathway, and so deficiencies in or absence of a care pathway add additional heterogeneity to the comanagement group which is not captured in the NSQIP PUF.
Second, it is important to consider the potential for unmeasured confounding. The propensity score matching did seem to achieve balance in the distribution of most baseline variables between the comanagement and noncomanagement groups, though differences remain for certain covariates. A key assumption in propensity score matching (and in observational research more broadly) is the principle of “no unmeasured confounders” (ie, the assumption that all variables that might influence treatment assignment and outcomes are measured).14 For the NSQIP PUF this absence of unmeasured confounders is clearly not the case because hospital and surgeon variables are omitted from the PUF for reasons of confidentiality. Inclusion of hospital and surgeon variables could well be important because outcomes may vary by hospital or by surgeon, and simultaneously, different hospitals and different surgeons will have different protocols and preferences regarding comanagement. Furthermore, confounding is virtually guaranteed to the extent that hospitals and surgeons do not randomly assign hip fracture patients to comanagement or usual care. The finding of higher mortality in the comanagement group, even after adjustment and matching, suggests the presence of residual confounding. Even if residual confounding is the explanation for the worse outcomes observed in the comanagement group, the finding of a lack of benefit of comanagement is noteworthy and should not be dismissed out of hand.
Limitations aside, these results suggest a need for humility among strong proponents of comanagement, at least in the hip fracture population. While it may still be reasonable to claim that comanagement improves efficiency and may enhance certain aspects of patient or physician satisfaction, the lack of an impact on mortality highlights a need to examine the benefits of these programs more carefully. From a clinical perspective, hospitalists and orthopedic surgeons should consider which hip fracture patients might be most likely to benefit from comanagement.4 From a research perspective, the current study highlights the pressing need for a randomized trial of comanagement to definitively address the effectiveness of these programs.
1. Wachter RM, Goldman L. Zero to 50,000 — the 20th anniversary of the hospitalist. N Engl J Med. 2016;375(11):1009-1011. https://doi.org/10.1056/NEJMp1607958
2. Hinami K, Whelan CT, Miller JA, Wolosin RJ, Wetterneck TB; Society of Hospital Medicine Career Satisfaction Task Force. Job characteristics, satisfaction, and burnout across hospitalist practice models. J Hosp Med. 2012;7(5):402-410. https://doi.org/10.1002/jhm.1907
3. Soong C, Eddy Fan, Eric E Howell, et al. Characteristics of hospitalists and hospitalist programs in the United States and Canada. J Clin Outcomes Manag . 2009;16(2):69
4. Siegal EM. Just because you can, doesn’t mean that you should: a call for the rational application of hospitalist comanagement. J Hosp Med. 2008;3(5):398-402. https://doi.org/10.1002/jhm.361
5. Swart E, Vasudeva E, Makhni EC, Macaulay W, Bozic KJ. Dedicated perioperative hip fracture comanagement programs are cost-effective in high-volume centers: an economic analysis. Clin Orthop Relat Res. 2016;474(1):222-233. https://doi.org/10.1007/s11999-015-4494-4
6. Bracey DN, Kiymaz TC, Holst DC, et al. An orthopedic-hospitalist comanaged hip fracture service reduces inpatient length of stay. Geriatr Orthop Surg Rehabil. 2016;7(4):171-177. https://doi.org/10.1177/2151458516661383.
7. Soong C, Cram P, Chezar K, et al. Impact of an integrated hip fracture inpatient program on length of stay and costs. J Orthop Trauma. 2016;30(12):647-652. https://doi.org/10.1097/BOT.0000000000000691
8. Grigoryan KV, Javedan H, Rudolph JL. Ortho-geriatric care models and outcomes in hip fracture patients: a systematic review and meta-analysis. J Orthop Trauma. 2014;28(3):e49-e55. https://doi.org/10.1097/BOT.0b013e3182a5a045
9. Vidán M, Serra JA, Moreno C, Riquelme G, Ortiz J. Efficacy of a comprehensive geriatric intervention in older patients hospitalized for hip fracture: a randomized, controlled trial. J Am Geriatr Soc. 2005;53(9):1476-1482. https://doi.org/10.1111/j.1532-5415.2005.53466.x
10. Gregersen M, Mørch MM, Hougaard K, Damsgaard EM. Geriatric intervention in elderly patients with hip fracture in an orthopedic ward. J Inj Violence Res. 2012;4(2):45-51. https://doi.org/10.5249/jivr.v4i2.96
11. Southern WN, Berger MA, Bellin EY, Hailpern SM, Arnsten JH. Hospitalist care and length of stay in patients requiring complex discharge planning and close clinical monitoring. Arch Intern Med. 2007;167(17):1869-1874. http://doi.org/10.1001/archinte.167.17.1869
12. Maxwell B, Mirza A. Medical comanagement of hip fracture patients is not associated with superior perioperative outcomes: A propensity score matched retrospective cohort analysis of the national surgical quality improvement project. J Hosp Med. 2020;15:468-474. http://doi.org/10.12788/jhm.3343
13. Cohen ME, Ko CY, Bilimoria KY, et al. Optimizing ACS NSQIP modeling for evaluation of surgical quality and risk: patient risk adjustment, procedure mix adjustment, shrinkage adjustment, and surgical focus. J Am Coll Surg. 2013;217(2):336–46.e1. https://doi.org/10.1016/j.jamcollsurg.2013.02.027
14. Austin PC. An introduction to propensity score methods for reducing the effects of confounding in observational studies. Multivariate Behav Res. 2011;46(3):399–424. https://doi.org/10.1080/00273171.2011.568786
© 2020 Society of Hospital Medicine
Controversies in Respiratory Protective Equipment Selection and Use During COVID-19
One contentious issue during the COVID-19 crisis has been the appropriate selection and use of respiratory protective equipment (RPE) for healthcare workers (HCWs) in hospitals and long-term care settings. As of April 2020, discrepancies exist in the recommendations from health authorities such as the World Health Organization (WHO), Centers for Disease Control and Prevention (CDC), and Canadian Standards Association (CSA). The first of these recommends a surgical mask for routine care and a respirator for high-risk care such as aerosol-generating procedures, while the CDC recommends respirators for all aspects of patient care for these SARS-CoV-2–infected patients, and the CSA risk assessment tool would also result in selection of a respirator.1-3
Given the contradictory guidance, we will discuss several important considerations for hospital leaders in the implementation of a healthcare respiratory protection program during the current pandemic, including a focused review of the empirical data on surgical mask vs face-fitted respirator (most commonly available in healthcare as N95 in North America), continuous use of the RPE throughout an entire shift vs targeted use when caring for patients, and key areas of uncertainty.
SURGICAL MASK OR RESPIRATOR
Surgical masks are traditionally used for protection against droplet transmission of respiratory infections, in which large droplets often fall to the ground within short distances; on the other hand, N95 respirators are used for much smaller airborne pathogens, which can remain suspended in the air for long periods of time. Although empiric studies have supported the superiority of respirators over surgical masks in simulated settings (frequently defined as a calculated concentration ratio outside vs inside the RPE), most clinical studies fail to demonstrate a difference in clinical outcomes such as the prevention of respiratory infection. For instance, an exposure study using saline aerosol to simulate viral particles showed that N95 respirators conferred up to 8 to 12 times greater protection against particulate penetration, compared with surgical masks.4 However, these advantages of respirators over surgical masks in carefully controlled laboratory studies do not seem to translate to decreased infection risk in real-world settings.
The effectiveness of N95 respirators vs surgical masks in preventing respiratory infections has been evaluated in a small number of clinical randomized, controlled trials (RCTs). We identified five systematic reviews and/or metanalyses published after 2010 and three RCTs published after 1990.5-12 The RCTs used laboratory-confirmed respiratory virus or clinical infection in HCWs as a clinical outcome, but studies differed in the implementation of RPE use (ie, continuous or targeted use). In a systematic review and metanalysis, Long et al identified six RCTs (9,171 participants) and concluded that, with the exception of laboratory-confirmed bacterial colonization, N95 respirators did not reduce the rate of laboratory-confirmed influenza, viral respiratory infections, or influenza-like illness among HCWs, compared with surgical masks.5 The authors noted risks of bias in these studies owing to the inability to blind and conceal allocation. In addition, the studies focused on infections that are known to transmit via droplet, such as influenza, so the results might not be applicable in the face of a new pandemic in which the important modes of transmission are not yet clear.
WHOLE-SHIFT OR INTERMITTENT USE
The evidence base evaluating continuous vs targeted use of RPE in healthcare settings is quite small. Continuous use refers to using the RPE during an entire shift, whereas targeted use involves using RPE only when caring for confirmed or suspected respiratory patients. In our literature review we identified only one RCT that included separate study arms for continuous and targeted N95 respirator use.13 The authors found a significantly lower rate of clinical respiratory illness among HCWs in the continuous-use group, compared with that in the targeted-use group. Limitations of the study included a relatively short follow-up of 4 weeks and uneven distribution of baseline characteristics, although the authors adjusted for these differences in their analysis. The study, however, did not compare continuous vs targeted use of surgical masks with regard to clinical outcomes. Based on the study results, we can only infer that continuous use of RPE, either surgical mask or N95 respirator, may provide additional benefit to HCWs vs targeted use only.
Given the lack of robust evidence informing continuous or targeted RPE use, we suggest some additional factors to guide decision making. In settings with high HCW compliance with universal RPE (above 50%), even noncompliant HCW are protected against clinical respiratory illness, which suggests a herd protective effect when universal RPE use is implemented, likely owing to the prevention of symptomatic or asymptomatic infectious spread among HCWs.14 It is important to note that the compliance rate may be limited by discomfort of prolonged wear of certain RPEs. One study reported that compliance rate is lower for continuous use (66%) than it is for targeted use (82%).13 Accumulated respiratory pathogen deposition on RPEs from an extended period of use that could result in self-contamination to the wearer is a potential concern, although these risks must be balanced against the repeated donning and doffing required by targeted use. Pilot studies examining viral particles left on surgical masks after being worn for entire shifts (or as long as tolerated) found that there were significantly more viral particles detected after 6 hours of continuous wear, which may increase the risk of self-contamination.15
UNCERTAINTIES
The current literature is applicable to infections that are known to spread via droplet contact, and this is a major limitation in generalizing the available evidence to the SARS-CoV-2 pandemic, in which debate persists regarding the exact mode of transmission. It is postulated that, even in infections traditionally considered to be spread by droplets, such as influenza, aerosol transmission may occur when HCWs are working in close proximity to the exposure source or when the droplet evaporates and becomes droplet nuclei. The United States National Academies of Science, Engineering, and Medicine expert consultation report, published in April 2020, concluded that current studies support the possibility of aerosolization of SARS-CoV-2 virus from normal breathing.16 As of April 2020, the WHO recommendation for SARS-CoV-2 is to use droplet contact precautions with a surgical mask for regular patient care and N95 respirator for aerosol-generating procedures.1 Although we have not come across any studies specifically comparing the efficacy between surgical mask to N95 respirator protection while performing aerosol-generating procedures, a systematic review found that certain aerosol-generating procedures, such as endotracheal intubation and noninvasive ventilation, conferred a significantly higher risk of transmission of SARS-CoV-1 to HCWs in 2003.17 For the current crisis, the CDC is taking a cautious approach in which N95 respirators are recommended for HCWs caring for patients with confirmed or suspected SARS-CoV-2 infection if the supply chain is secure, with advice in place in times of RPE shortage, such as use of expired respirators, other types of equivalent respirators, or respirators not approved by the National Institute for Occupational Safety and Health, as well as optimization of administrative and engineering controls (eg, telemedicine, limiting patient and visitor numbers, physical barriers, optimizing ventilation systems).2,18 This advice is unusual in terms of deviating from advising the most appropriate RPE, and we presume it reflects the present global supply problems.
RPEs are only one component of a necessary personal protective equipment ensemble. Although eye protection (goggles or face shields) is recommended by the WHO and CDC when caring for patients with SARS-CoV-2, there is considerable uncertainty regarding the incremental effectiveness of eye protection because such protection is usually worn in conjunction with RPE. A 2019 Cochrane review did not identify any good-quality studies that could inform judgments regarding the effectiveness of eye protective equipment,19 and a recent rapid review reporting on the efficacy of eye protection in primary care settings reached a similar conclusion.20 A risk-based approach would be to include eye protection in a well-designed personal protective equipment program.
In the absence of aerosol-generating procedures, N95 respirators confer no additional benefit in preventing HCW respiratory infections when droplet transmission is suspected. However, the applicability of the available evidence is limited given the uncertainties surrounding SARS-CoV-2 transmission. When RPE may become scarce during a pandemic, the risk of potential self-contamination must be weighed against RPE conservation strategies. RPE compliance, herd-protection effects of routine RPE use, and RPE contamination from prolonged use are therefore important elements to consider when implementing hospital policies regarding universal masking because they all impact the potential effectiveness of RPE.
CONCLUSIONS
At the present time we lack definitive evidence on the effectiveness of surgical masks vs respirators and continuous vs targeted RPE use in the hospital setting for SARS-CoV-2. If our goal is to minimize risk of HCW infection, continuous use of N95 respirator could be considered. However, a more pragmatic solution in the setting of a limited supply of N95 respirators would be continuous use of surgical masks while engaged in clinical care of patients under investigation or with confirmed COVID-19.
1. World Health Organization. Rational use of personal protective equipment for coronavirus disease (COVID-19): Interim guidance. February 27, 2020. https://apps.who.int/iris/bitstream/handle/10665/331215/WHO-2019-nCov-IPCPPE_use-2020.1-eng.pdf. Accessed April 1, 2020.
2. Centers for Disease Control and Prevention. Interim Infection Prevention and Control Recommendations for Patients with Suspected or Confirmed Coronavirus Disease 2019 (COVID-19) in Healthcare Settings. 2020. https://www.cdc.gov/coronavirus/2019-ncov/hcp/infection-control-recommendations.html. Accessed April 1, 2020.
3. Canadian Standard Association. Selection, Use, and Care of Respirators (CAN/CSA-Z94.4-18). Toronto, Canada: CSA Group; 2018.
4. Lee SA, Grinshpun SA, Reponen T. Respiratory performance offered by N95 respirators and surgical masks: human subject evaluation with NaCl aerosol representing bacterial and viral particle size range. Ann Occup Hyg. 2008;52(3):177-185. https://doi.org/10.1093/annhyg/men005.
5. Long Y, Hu T, Liu L, et al. Effectiveness of N95 respirators versus surgical masks against influenza: a systematic review and meta‐analysis. J Evid Based Med. 2020. https://doi.org/10.1111/jebm.12381.
6. Offeddu V, Yung CF, Low MSF, Tam CC. Effectiveness of masks and respirators against respiratory infections in healthcare workers: a systematic review and meta-analysis. Clin Infect Dis. 2017;65(11):1934-1942. https://doi.org/10.1093/cid/cix681.
7. Smith JD, MacDougall CC, Johnstone J, Copes RA, Schwartz B, Garber GE. Effectiveness of N95 respirators versus surgical masks in protecting health care workers from acute respiratory infection: a systematic review and meta-analysis. CMAJ. 2016;188(8):567-574. https://doi.org/10.1503/cmaj.150835.
8. Bin-Reza F, Lopez Chavarrias V, Nicoll A, Chamberland ME. The use of masks and respirators to prevent transmission of influenza: a systematic review of the scientific evidence. Influenza Other Respir Viruses. 2012;6(4):257-267. https://doi.org/10.1111/j.1750-2659.2011.00307.x.
9. Jefferson T, Del Mar CB, Dooley L, et al. Physical interventions to interrupt or reduce the spread of respiratory viruses. Cochrane Database Syst Rev. 2011;2011(7):CD006207. https://doi.org/10.1002/14651858.CD006207.pub4.
10. Radonovich LJ Jr, Simberkoff MS, Bessesen MT, et al. N95 respirators vs medical masks for preventing influenza among health care personnel: a randomized clinical trial. JAMA. 2019;322(9):824-833. https://doi.org/10.1001/jama.2019.11645.
11. MacIntyre CR, Chughtai AA, Rahman B, et al. The efficacy of medical masks and respirators against respiratory infection in healthcare workers. Influenza Other Respir Viruses. 2017;11(6):511-517. https://doi.org/10.1111/irv.12474.
12. Loeb M, Dafoe N, Mahony J, et al. Surgical mask vs N95 respirator for preventing influenza among health care workers. JAMA. 2009;302(17):1865-1871. https://doi.org/10.1001/jama.2009.1466.
13. Macintyre CR, Wang Q, Seale H, et al. A randomized clinical trial of three options for N95 respirators and medical masks in health workers. Am J Respir Crit Care Med. 2013;187(9):960-966. https://doi.org/10.1164/rccm.201207-1164OC.
14. Chen X, Chughtai AA, Macintyre CR. Herd protection effect of N95 respirators in healthcare workers. J Int Med Res. 2017;45(6):1760-1767. https://doi.org/10.1177/0300060516665491.
15. Chughtai AA, Stelzer-Braid S, Rawlinson W, et al. Contamination by respiratory viruses on outer surface of medical masks used by hospital healthcare workers. BMC Infect Dis. 2019;19(1):491. https://doi.org/10.1186/s12879-019-4109-x.
16. National Research Council. Rapid Expert Consultation on the Possibility of Bioaerosol Spread of SARS-CoV-2 for the COVID-19 Pandemic (April 1, 2020). Washington, DC: National Academies Press; 2020. https://doi.org/10.17226/25769.
17. Tran K, Cimon K, Severn M, Pessoa-Silva CL, Conly J. Aerosol generating procedures and risk of transmission of acute respiratory infections to healthcare workers: a systematic review. PLoS One. 2012;7(4):e35797. https://doi.org/10.1371/journal.pone.0035797.
18. Centers for Disease Control and Prevention. Strategies for Optimizing the Supply of N95 Respirators: COVID-19. 2020. https://www.cdc.gov/coronavirus/2019-ncov/hcp/respirators-strategy/crisis-alternate-strategies.html. Accessed March 31, 2020.
19. Verbeek JH, Rajamaki B, Ijaz S, et al. Personal protective equipment for preventing highly infectious diseases due to exposure to contaminated body fluids in healthcare staff. Cochrane Database Syst Rev. 2019;7(7):CD011621. https://doi.org/10.1002/14651858.CD011621.pub3.
20. Khunti K, Greenhalgh T, Chan XH, et al. What is the efficacy of eye protection equipment compared to no eye protection equipment in preventing transmission of COVID-19-type respiratory illnesses in primary and community care?. CEBM. April 3, 2020. https://www.cebm.net/covid-19/what-is-the-efficacy-of-eye-protection-equipment-compared-to-no-eye-protection-equipment-in-preventing-transmission-of-covid-19-type-respiratory-illnesses-in-primary-and-community-care/. Accessed April 6, 2020.
One contentious issue during the COVID-19 crisis has been the appropriate selection and use of respiratory protective equipment (RPE) for healthcare workers (HCWs) in hospitals and long-term care settings. As of April 2020, discrepancies exist in the recommendations from health authorities such as the World Health Organization (WHO), Centers for Disease Control and Prevention (CDC), and Canadian Standards Association (CSA). The first of these recommends a surgical mask for routine care and a respirator for high-risk care such as aerosol-generating procedures, while the CDC recommends respirators for all aspects of patient care for these SARS-CoV-2–infected patients, and the CSA risk assessment tool would also result in selection of a respirator.1-3
Given the contradictory guidance, we will discuss several important considerations for hospital leaders in the implementation of a healthcare respiratory protection program during the current pandemic, including a focused review of the empirical data on surgical mask vs face-fitted respirator (most commonly available in healthcare as N95 in North America), continuous use of the RPE throughout an entire shift vs targeted use when caring for patients, and key areas of uncertainty.
SURGICAL MASK OR RESPIRATOR
Surgical masks are traditionally used for protection against droplet transmission of respiratory infections, in which large droplets often fall to the ground within short distances; on the other hand, N95 respirators are used for much smaller airborne pathogens, which can remain suspended in the air for long periods of time. Although empiric studies have supported the superiority of respirators over surgical masks in simulated settings (frequently defined as a calculated concentration ratio outside vs inside the RPE), most clinical studies fail to demonstrate a difference in clinical outcomes such as the prevention of respiratory infection. For instance, an exposure study using saline aerosol to simulate viral particles showed that N95 respirators conferred up to 8 to 12 times greater protection against particulate penetration, compared with surgical masks.4 However, these advantages of respirators over surgical masks in carefully controlled laboratory studies do not seem to translate to decreased infection risk in real-world settings.
The effectiveness of N95 respirators vs surgical masks in preventing respiratory infections has been evaluated in a small number of clinical randomized, controlled trials (RCTs). We identified five systematic reviews and/or metanalyses published after 2010 and three RCTs published after 1990.5-12 The RCTs used laboratory-confirmed respiratory virus or clinical infection in HCWs as a clinical outcome, but studies differed in the implementation of RPE use (ie, continuous or targeted use). In a systematic review and metanalysis, Long et al identified six RCTs (9,171 participants) and concluded that, with the exception of laboratory-confirmed bacterial colonization, N95 respirators did not reduce the rate of laboratory-confirmed influenza, viral respiratory infections, or influenza-like illness among HCWs, compared with surgical masks.5 The authors noted risks of bias in these studies owing to the inability to blind and conceal allocation. In addition, the studies focused on infections that are known to transmit via droplet, such as influenza, so the results might not be applicable in the face of a new pandemic in which the important modes of transmission are not yet clear.
WHOLE-SHIFT OR INTERMITTENT USE
The evidence base evaluating continuous vs targeted use of RPE in healthcare settings is quite small. Continuous use refers to using the RPE during an entire shift, whereas targeted use involves using RPE only when caring for confirmed or suspected respiratory patients. In our literature review we identified only one RCT that included separate study arms for continuous and targeted N95 respirator use.13 The authors found a significantly lower rate of clinical respiratory illness among HCWs in the continuous-use group, compared with that in the targeted-use group. Limitations of the study included a relatively short follow-up of 4 weeks and uneven distribution of baseline characteristics, although the authors adjusted for these differences in their analysis. The study, however, did not compare continuous vs targeted use of surgical masks with regard to clinical outcomes. Based on the study results, we can only infer that continuous use of RPE, either surgical mask or N95 respirator, may provide additional benefit to HCWs vs targeted use only.
Given the lack of robust evidence informing continuous or targeted RPE use, we suggest some additional factors to guide decision making. In settings with high HCW compliance with universal RPE (above 50%), even noncompliant HCW are protected against clinical respiratory illness, which suggests a herd protective effect when universal RPE use is implemented, likely owing to the prevention of symptomatic or asymptomatic infectious spread among HCWs.14 It is important to note that the compliance rate may be limited by discomfort of prolonged wear of certain RPEs. One study reported that compliance rate is lower for continuous use (66%) than it is for targeted use (82%).13 Accumulated respiratory pathogen deposition on RPEs from an extended period of use that could result in self-contamination to the wearer is a potential concern, although these risks must be balanced against the repeated donning and doffing required by targeted use. Pilot studies examining viral particles left on surgical masks after being worn for entire shifts (or as long as tolerated) found that there were significantly more viral particles detected after 6 hours of continuous wear, which may increase the risk of self-contamination.15
UNCERTAINTIES
The current literature is applicable to infections that are known to spread via droplet contact, and this is a major limitation in generalizing the available evidence to the SARS-CoV-2 pandemic, in which debate persists regarding the exact mode of transmission. It is postulated that, even in infections traditionally considered to be spread by droplets, such as influenza, aerosol transmission may occur when HCWs are working in close proximity to the exposure source or when the droplet evaporates and becomes droplet nuclei. The United States National Academies of Science, Engineering, and Medicine expert consultation report, published in April 2020, concluded that current studies support the possibility of aerosolization of SARS-CoV-2 virus from normal breathing.16 As of April 2020, the WHO recommendation for SARS-CoV-2 is to use droplet contact precautions with a surgical mask for regular patient care and N95 respirator for aerosol-generating procedures.1 Although we have not come across any studies specifically comparing the efficacy between surgical mask to N95 respirator protection while performing aerosol-generating procedures, a systematic review found that certain aerosol-generating procedures, such as endotracheal intubation and noninvasive ventilation, conferred a significantly higher risk of transmission of SARS-CoV-1 to HCWs in 2003.17 For the current crisis, the CDC is taking a cautious approach in which N95 respirators are recommended for HCWs caring for patients with confirmed or suspected SARS-CoV-2 infection if the supply chain is secure, with advice in place in times of RPE shortage, such as use of expired respirators, other types of equivalent respirators, or respirators not approved by the National Institute for Occupational Safety and Health, as well as optimization of administrative and engineering controls (eg, telemedicine, limiting patient and visitor numbers, physical barriers, optimizing ventilation systems).2,18 This advice is unusual in terms of deviating from advising the most appropriate RPE, and we presume it reflects the present global supply problems.
RPEs are only one component of a necessary personal protective equipment ensemble. Although eye protection (goggles or face shields) is recommended by the WHO and CDC when caring for patients with SARS-CoV-2, there is considerable uncertainty regarding the incremental effectiveness of eye protection because such protection is usually worn in conjunction with RPE. A 2019 Cochrane review did not identify any good-quality studies that could inform judgments regarding the effectiveness of eye protective equipment,19 and a recent rapid review reporting on the efficacy of eye protection in primary care settings reached a similar conclusion.20 A risk-based approach would be to include eye protection in a well-designed personal protective equipment program.
In the absence of aerosol-generating procedures, N95 respirators confer no additional benefit in preventing HCW respiratory infections when droplet transmission is suspected. However, the applicability of the available evidence is limited given the uncertainties surrounding SARS-CoV-2 transmission. When RPE may become scarce during a pandemic, the risk of potential self-contamination must be weighed against RPE conservation strategies. RPE compliance, herd-protection effects of routine RPE use, and RPE contamination from prolonged use are therefore important elements to consider when implementing hospital policies regarding universal masking because they all impact the potential effectiveness of RPE.
CONCLUSIONS
At the present time we lack definitive evidence on the effectiveness of surgical masks vs respirators and continuous vs targeted RPE use in the hospital setting for SARS-CoV-2. If our goal is to minimize risk of HCW infection, continuous use of N95 respirator could be considered. However, a more pragmatic solution in the setting of a limited supply of N95 respirators would be continuous use of surgical masks while engaged in clinical care of patients under investigation or with confirmed COVID-19.
1. World Health Organization. Rational use of personal protective equipment for coronavirus disease (COVID-19): Interim guidance. February 27, 2020. https://apps.who.int/iris/bitstream/handle/10665/331215/WHO-2019-nCov-IPCPPE_use-2020.1-eng.pdf. Accessed April 1, 2020.
2. Centers for Disease Control and Prevention. Interim Infection Prevention and Control Recommendations for Patients with Suspected or Confirmed Coronavirus Disease 2019 (COVID-19) in Healthcare Settings. 2020. https://www.cdc.gov/coronavirus/2019-ncov/hcp/infection-control-recommendations.html. Accessed April 1, 2020.
3. Canadian Standard Association. Selection, Use, and Care of Respirators (CAN/CSA-Z94.4-18). Toronto, Canada: CSA Group; 2018.
4. Lee SA, Grinshpun SA, Reponen T. Respiratory performance offered by N95 respirators and surgical masks: human subject evaluation with NaCl aerosol representing bacterial and viral particle size range. Ann Occup Hyg. 2008;52(3):177-185. https://doi.org/10.1093/annhyg/men005.
5. Long Y, Hu T, Liu L, et al. Effectiveness of N95 respirators versus surgical masks against influenza: a systematic review and meta‐analysis. J Evid Based Med. 2020. https://doi.org/10.1111/jebm.12381.
6. Offeddu V, Yung CF, Low MSF, Tam CC. Effectiveness of masks and respirators against respiratory infections in healthcare workers: a systematic review and meta-analysis. Clin Infect Dis. 2017;65(11):1934-1942. https://doi.org/10.1093/cid/cix681.
7. Smith JD, MacDougall CC, Johnstone J, Copes RA, Schwartz B, Garber GE. Effectiveness of N95 respirators versus surgical masks in protecting health care workers from acute respiratory infection: a systematic review and meta-analysis. CMAJ. 2016;188(8):567-574. https://doi.org/10.1503/cmaj.150835.
8. Bin-Reza F, Lopez Chavarrias V, Nicoll A, Chamberland ME. The use of masks and respirators to prevent transmission of influenza: a systematic review of the scientific evidence. Influenza Other Respir Viruses. 2012;6(4):257-267. https://doi.org/10.1111/j.1750-2659.2011.00307.x.
9. Jefferson T, Del Mar CB, Dooley L, et al. Physical interventions to interrupt or reduce the spread of respiratory viruses. Cochrane Database Syst Rev. 2011;2011(7):CD006207. https://doi.org/10.1002/14651858.CD006207.pub4.
10. Radonovich LJ Jr, Simberkoff MS, Bessesen MT, et al. N95 respirators vs medical masks for preventing influenza among health care personnel: a randomized clinical trial. JAMA. 2019;322(9):824-833. https://doi.org/10.1001/jama.2019.11645.
11. MacIntyre CR, Chughtai AA, Rahman B, et al. The efficacy of medical masks and respirators against respiratory infection in healthcare workers. Influenza Other Respir Viruses. 2017;11(6):511-517. https://doi.org/10.1111/irv.12474.
12. Loeb M, Dafoe N, Mahony J, et al. Surgical mask vs N95 respirator for preventing influenza among health care workers. JAMA. 2009;302(17):1865-1871. https://doi.org/10.1001/jama.2009.1466.
13. Macintyre CR, Wang Q, Seale H, et al. A randomized clinical trial of three options for N95 respirators and medical masks in health workers. Am J Respir Crit Care Med. 2013;187(9):960-966. https://doi.org/10.1164/rccm.201207-1164OC.
14. Chen X, Chughtai AA, Macintyre CR. Herd protection effect of N95 respirators in healthcare workers. J Int Med Res. 2017;45(6):1760-1767. https://doi.org/10.1177/0300060516665491.
15. Chughtai AA, Stelzer-Braid S, Rawlinson W, et al. Contamination by respiratory viruses on outer surface of medical masks used by hospital healthcare workers. BMC Infect Dis. 2019;19(1):491. https://doi.org/10.1186/s12879-019-4109-x.
16. National Research Council. Rapid Expert Consultation on the Possibility of Bioaerosol Spread of SARS-CoV-2 for the COVID-19 Pandemic (April 1, 2020). Washington, DC: National Academies Press; 2020. https://doi.org/10.17226/25769.
17. Tran K, Cimon K, Severn M, Pessoa-Silva CL, Conly J. Aerosol generating procedures and risk of transmission of acute respiratory infections to healthcare workers: a systematic review. PLoS One. 2012;7(4):e35797. https://doi.org/10.1371/journal.pone.0035797.
18. Centers for Disease Control and Prevention. Strategies for Optimizing the Supply of N95 Respirators: COVID-19. 2020. https://www.cdc.gov/coronavirus/2019-ncov/hcp/respirators-strategy/crisis-alternate-strategies.html. Accessed March 31, 2020.
19. Verbeek JH, Rajamaki B, Ijaz S, et al. Personal protective equipment for preventing highly infectious diseases due to exposure to contaminated body fluids in healthcare staff. Cochrane Database Syst Rev. 2019;7(7):CD011621. https://doi.org/10.1002/14651858.CD011621.pub3.
20. Khunti K, Greenhalgh T, Chan XH, et al. What is the efficacy of eye protection equipment compared to no eye protection equipment in preventing transmission of COVID-19-type respiratory illnesses in primary and community care?. CEBM. April 3, 2020. https://www.cebm.net/covid-19/what-is-the-efficacy-of-eye-protection-equipment-compared-to-no-eye-protection-equipment-in-preventing-transmission-of-covid-19-type-respiratory-illnesses-in-primary-and-community-care/. Accessed April 6, 2020.
© 2020 Society of Hospital Medicine
All Hands on Deck: Learning to “Un-specialize” in the COVID-19 Pandemic
Specialization, as detailed in Adam Smith’s 1776 landmark treatise, Wealth of Nations,1 has been an enduring trend in labor and economics for centuries. Mirroring evolution in other sectors of the economy, the healthcare workforce has become ever more specialized.2 General practitioners and family doctors have ceded ground to a bevy of specialists and subspecialists ranging from pediatric endocrinologists to otolaryngology-neurotologists. Given the growth in medical knowledge over the past century, this specialization seems both necessary and good. This same specialization that serves us in good times, though, leaves us woefully underprepared for an epidemic that will require large numbers of hospitalists/generalists and intensivists, such as the current coronavirus disease 2019 (COVID-19) pandemic.
A bit on terminology before we proceed. For purposes of this paper we define generalists as physicians trained in Internal Medicine, Family Medicine, Pediatrics, or Med/Peds who provide primary hospital care to adults and children. While some may argue that hospitalists are specialists in inpatient care, we would like to focus on hospitalists as generalists who focus on inpatient care and what we have in common with the broader community of generalists. We include as generalists anyone, irrespective of clinical training, who chooses broad primary patient responsibility over the narrower consultative role. There is always a specialist in our midst who knows more about a particular disease or condition; as generalists, most of us appreciate and welcome that expertise.
Sometimes it takes a pandemic like COVID-19 to highlight a tremendous blind spot in our healthcare system that, in retrospect, seems hard to have missed. What do we do when we need more generalists and have only a surplus of specialists, many of whom were involuntarily “furloughed” by canceled elective procedures and postponed clinics? How do we “un-specialize” our specialist workforce?
We will discuss some of the most pressing problems facing hospitals working to ensure adequate staffing for general inpatient units caused by the simultaneous reductions in physician availability (because of illness and/or quarantine) and markedly increased admissions of undifferentiated COVID-19–related illnesses. We will assume that hospitals have already activated all providers practicing in areas most similar to hospital medicine, including generalists who have mixed inpatient/outpatient practices, subspecialists with significant inpatient clinical roles, fellows, and advanced practice providers (APPs) with inpatient experience. The Accreditation Council for Graduate Medical Education released guidance around the roles of physician trainees during the pandemic.3 Despite these measures, though, further workforce augmentation will be vital. To that end, several challenges to clinical staffing are enumerated below, accompanied by strategies to address them.
CLINICAL STAFFING CHALLENGES
1. Clinicians eager to help, but out of practice in the inpatient setting: As hospitals across the country work to develop physician staffing contingency plans for scenarios in which general inpatient volumes increase by 50%-300% while 33%-50% of hospitalists either become infected or require quarantine, many hospitals are looking to bolster their physician depth. We have been extremely gratified by the tremendous response from the broader physician communities in which we work. We have encountered retired physicians who have volunteered to come back to work despite being at higher risk of severe COVID-19 complications and physician-scientists offering to step back into clinical roles. We have found outstanding subspecialists asking to work under the tutelage of experienced hospitalists; these specialists recognize how, despite years of clinical experience, they would need significant supervision to function in the inpatient setting. The humility and self-awareness of these volunteers has been phenomenal.
Retraining researchers, subspecialists, and retirees as hospitalists requires purposeful onboarding to target key educational goals. This onboarding should stress COVID-19–specific medical management, training in infection prevention and control, and hospital-specific workflow processes (eg, shift length, sign-over). Onboarding must also include access and orientation to electronic health records, training around inpatient documentation requirements, and billing practices. Non–COVID-19 healthcare will continue; hospitals and clinical leaders will need to determine whether certain specialists should focus on COVID-19 care alone and leave others to continue with speciality practice still needed. Ready access to hospital medicine and medical subspecialty consultation will be pivotal in supervising providers asked to step into hospitalist roles.
The onboarding process we describe might best be viewed through the lens of focused professional practice evaluation (FPPE). Required by the Joint Commission, FPPE is a process for the medical staff of a facility to evaluate privilege-specific competence by clinicians and is used for any new clinical privileges and when there may be question as to a current practitioner’s capabilities. The usual FPPE process includes reassessment of provider practice, typically at 3 to 6 months. Doing so may be challenging given overall workforce stress and the timing of clinical demand—eg, time for medical record review will be limited. Consideration of a “preceptorship” with an experienced hospitalist providing verbal oversight for providers with emergency privileges may be very appropriate. Indeed the Joint Commission recently published guidance around FPPE during the COVID-19 epidemic with the suggestion that mentorship and direct observation are reasonable ways to ensure quality.4
Concerns around scope of practice and medicolegal liability must be rapidly addressed by professional practice organizations, state medical boards, and medical malpractice insurers to protect frontline providers, nurses, and pharmacists. In particular, Joint Commission FPPE process requirements may need to be relaxed to respond to a surge in clinical demand. Contingency and crisis standards of care permit doing so. We welcome the introduction of processes to expedite provider licensure in many hard-hit states.
2. Clinicians who should not help because of medical comorbidities or age: Individuals with certain significant comorbidities (eg, inflammatory conditions treated with immunosuppressants, pulmonary disease, cancer with active treatment) or meeting certain age criteria should be discouraged from clinical work because the dangers of illness for them and of transmission of illness are high. Judgment and a version of mutual informed consent will be needed to address fewer clear scenarios, such as whether a 35-year-old physician who requires a steroid inhaler for asthma or a 64-year-old physician who is otherwise healthy have higher risk. It is our opinion that all physicians should contribute to the care of patients with documented or suspected COVID-19 unless they meet institutionally defined exclusion criteria. We should recognize that physicians who are unable to provide direct care to patients with COVID-19 infection may have significant remorse and feelings that they are letting down their colleagues and the oath they have taken. As the COVID -19 pandemic continues, we are quickly learning that physicians who have contraindications to providing care to patients with active COVID-19 infection can still contribute in numerous mission-critical ways. This may include virtual (telehealth) visits, preceptorship via telehealth of providers completing FPPE in hospital medicine practice, postdischarge follow-up of patients who are no longer infectious, and other care-coordination activities, such as triaging direct admission calls.
3. Clinicians who should be able to help but are fearful: All efforts must be undertaken to protect healthcare workers from acquiring COVID-19. Nevertheless, there are models predicting that ultimately the vast majority of the world’s population will be exposed, including healthcare workers.5,6 In our personal experience as hospitalists and leaders, the vast majority (95%-plus) of our hospitalists have not only continued to do their job but taken on additional responsibilities and clinical work despite the risk. We are hesitant to co-opt words like courage and bravery that we typically would reserve for people in far more hazardous lines of work than physicians, but in the current setting perhaps courage is the correct term. In quiet conversation, many are vaguely unnerved and some significantly so, but they set their angst aside and get to work. The same can be said for the numerous subspecialists, surgeons, nurses, and others who have volunteered to help.
Alternatively, as leaders, we must manage an extremely small minority of faculty who request to not care for patients with COVID-19 despite no clear contraindication. These situations are nuanced and fraught with difficulty for leaders. As physicians we have moral and ethical obligations to society.7 We also have contractual obligations to our employers. Finally, we have a professional duty to our colleagues. When such cases arise, as leaders we should try to understand the perspective of the physician making the request. It is also important to remember that as leaders we are obliged to be fair and equitable to all faculty; granting exceptions to some who ask to avoid COVID-19-related work, but not to others, is difficult to justify. Moreover, granting exceptions can undermine faith in leadership and inevitably sow discord. We suggest setting clear mutual expectations of engagement and not granting unwarranted exceptions.
CONCLUSION
In this time of a global pandemic, we face a looming shortage of hospital generalists, which calls for immediate and purposeful workforce expansion facilitated by learning to “un-specialize” certain providers. We propose utilizing the framework of FPPE to educate and support those joining hospital medicine teams. Hospitalists are innovators and health systems science leaders. Let’s draw on that strength now to rise to the challenge of COVID-19.
1. Smith A. An Inquiry into the Nature and Causes of the Wealth of Nations. Chicago, Illinois: University of Chicago Press; 1976.
2. Cram P, Ettinger WH, Jr. Generalists or specialists--who does it better? Physician Exec. 1998;24(1):40-45.
3. Accreditation Council for Graduate Medical Education. ACGME Response to Pandemic Crisis. https://acgme.org/COVID-19. Accessed April 1, 2020.
4. The Joint Commission. Emergency Management—Meeting FPPE and OPPE Requirements During the COVID-19 Emergency. https://www.jointcommission.org/standards/standard-faqs/hospital-and-hospital-clinics/medical-staff-ms/000002291/. Accessed April 1, 2020.
5. Petropoulos F, Makridakis S. Forecasting the novel coronavirus COVID-19. PLoS One. 2020;15(3):e0231236. https://doi.org/10.1371/journal.pone.0231236.eCollection 2020.
6. Ioannidis JPA. Coronavirus disease 2019: the harms of exaggerated information and non-evidence-based measures. Eur J Clin Invest. 2020;e13222. https://doi.org/10.1111/eci.13222.
7. Antommaria M. Conflicting duties and reciprocal obligations during a pandemic. J Hosp Med. 2020;15(5):xx-xx. https://doi.org/10.12788/jhm.3425.
Specialization, as detailed in Adam Smith’s 1776 landmark treatise, Wealth of Nations,1 has been an enduring trend in labor and economics for centuries. Mirroring evolution in other sectors of the economy, the healthcare workforce has become ever more specialized.2 General practitioners and family doctors have ceded ground to a bevy of specialists and subspecialists ranging from pediatric endocrinologists to otolaryngology-neurotologists. Given the growth in medical knowledge over the past century, this specialization seems both necessary and good. This same specialization that serves us in good times, though, leaves us woefully underprepared for an epidemic that will require large numbers of hospitalists/generalists and intensivists, such as the current coronavirus disease 2019 (COVID-19) pandemic.
A bit on terminology before we proceed. For purposes of this paper we define generalists as physicians trained in Internal Medicine, Family Medicine, Pediatrics, or Med/Peds who provide primary hospital care to adults and children. While some may argue that hospitalists are specialists in inpatient care, we would like to focus on hospitalists as generalists who focus on inpatient care and what we have in common with the broader community of generalists. We include as generalists anyone, irrespective of clinical training, who chooses broad primary patient responsibility over the narrower consultative role. There is always a specialist in our midst who knows more about a particular disease or condition; as generalists, most of us appreciate and welcome that expertise.
Sometimes it takes a pandemic like COVID-19 to highlight a tremendous blind spot in our healthcare system that, in retrospect, seems hard to have missed. What do we do when we need more generalists and have only a surplus of specialists, many of whom were involuntarily “furloughed” by canceled elective procedures and postponed clinics? How do we “un-specialize” our specialist workforce?
We will discuss some of the most pressing problems facing hospitals working to ensure adequate staffing for general inpatient units caused by the simultaneous reductions in physician availability (because of illness and/or quarantine) and markedly increased admissions of undifferentiated COVID-19–related illnesses. We will assume that hospitals have already activated all providers practicing in areas most similar to hospital medicine, including generalists who have mixed inpatient/outpatient practices, subspecialists with significant inpatient clinical roles, fellows, and advanced practice providers (APPs) with inpatient experience. The Accreditation Council for Graduate Medical Education released guidance around the roles of physician trainees during the pandemic.3 Despite these measures, though, further workforce augmentation will be vital. To that end, several challenges to clinical staffing are enumerated below, accompanied by strategies to address them.
CLINICAL STAFFING CHALLENGES
1. Clinicians eager to help, but out of practice in the inpatient setting: As hospitals across the country work to develop physician staffing contingency plans for scenarios in which general inpatient volumes increase by 50%-300% while 33%-50% of hospitalists either become infected or require quarantine, many hospitals are looking to bolster their physician depth. We have been extremely gratified by the tremendous response from the broader physician communities in which we work. We have encountered retired physicians who have volunteered to come back to work despite being at higher risk of severe COVID-19 complications and physician-scientists offering to step back into clinical roles. We have found outstanding subspecialists asking to work under the tutelage of experienced hospitalists; these specialists recognize how, despite years of clinical experience, they would need significant supervision to function in the inpatient setting. The humility and self-awareness of these volunteers has been phenomenal.
Retraining researchers, subspecialists, and retirees as hospitalists requires purposeful onboarding to target key educational goals. This onboarding should stress COVID-19–specific medical management, training in infection prevention and control, and hospital-specific workflow processes (eg, shift length, sign-over). Onboarding must also include access and orientation to electronic health records, training around inpatient documentation requirements, and billing practices. Non–COVID-19 healthcare will continue; hospitals and clinical leaders will need to determine whether certain specialists should focus on COVID-19 care alone and leave others to continue with speciality practice still needed. Ready access to hospital medicine and medical subspecialty consultation will be pivotal in supervising providers asked to step into hospitalist roles.
The onboarding process we describe might best be viewed through the lens of focused professional practice evaluation (FPPE). Required by the Joint Commission, FPPE is a process for the medical staff of a facility to evaluate privilege-specific competence by clinicians and is used for any new clinical privileges and when there may be question as to a current practitioner’s capabilities. The usual FPPE process includes reassessment of provider practice, typically at 3 to 6 months. Doing so may be challenging given overall workforce stress and the timing of clinical demand—eg, time for medical record review will be limited. Consideration of a “preceptorship” with an experienced hospitalist providing verbal oversight for providers with emergency privileges may be very appropriate. Indeed the Joint Commission recently published guidance around FPPE during the COVID-19 epidemic with the suggestion that mentorship and direct observation are reasonable ways to ensure quality.4
Concerns around scope of practice and medicolegal liability must be rapidly addressed by professional practice organizations, state medical boards, and medical malpractice insurers to protect frontline providers, nurses, and pharmacists. In particular, Joint Commission FPPE process requirements may need to be relaxed to respond to a surge in clinical demand. Contingency and crisis standards of care permit doing so. We welcome the introduction of processes to expedite provider licensure in many hard-hit states.
2. Clinicians who should not help because of medical comorbidities or age: Individuals with certain significant comorbidities (eg, inflammatory conditions treated with immunosuppressants, pulmonary disease, cancer with active treatment) or meeting certain age criteria should be discouraged from clinical work because the dangers of illness for them and of transmission of illness are high. Judgment and a version of mutual informed consent will be needed to address fewer clear scenarios, such as whether a 35-year-old physician who requires a steroid inhaler for asthma or a 64-year-old physician who is otherwise healthy have higher risk. It is our opinion that all physicians should contribute to the care of patients with documented or suspected COVID-19 unless they meet institutionally defined exclusion criteria. We should recognize that physicians who are unable to provide direct care to patients with COVID-19 infection may have significant remorse and feelings that they are letting down their colleagues and the oath they have taken. As the COVID -19 pandemic continues, we are quickly learning that physicians who have contraindications to providing care to patients with active COVID-19 infection can still contribute in numerous mission-critical ways. This may include virtual (telehealth) visits, preceptorship via telehealth of providers completing FPPE in hospital medicine practice, postdischarge follow-up of patients who are no longer infectious, and other care-coordination activities, such as triaging direct admission calls.
3. Clinicians who should be able to help but are fearful: All efforts must be undertaken to protect healthcare workers from acquiring COVID-19. Nevertheless, there are models predicting that ultimately the vast majority of the world’s population will be exposed, including healthcare workers.5,6 In our personal experience as hospitalists and leaders, the vast majority (95%-plus) of our hospitalists have not only continued to do their job but taken on additional responsibilities and clinical work despite the risk. We are hesitant to co-opt words like courage and bravery that we typically would reserve for people in far more hazardous lines of work than physicians, but in the current setting perhaps courage is the correct term. In quiet conversation, many are vaguely unnerved and some significantly so, but they set their angst aside and get to work. The same can be said for the numerous subspecialists, surgeons, nurses, and others who have volunteered to help.
Alternatively, as leaders, we must manage an extremely small minority of faculty who request to not care for patients with COVID-19 despite no clear contraindication. These situations are nuanced and fraught with difficulty for leaders. As physicians we have moral and ethical obligations to society.7 We also have contractual obligations to our employers. Finally, we have a professional duty to our colleagues. When such cases arise, as leaders we should try to understand the perspective of the physician making the request. It is also important to remember that as leaders we are obliged to be fair and equitable to all faculty; granting exceptions to some who ask to avoid COVID-19-related work, but not to others, is difficult to justify. Moreover, granting exceptions can undermine faith in leadership and inevitably sow discord. We suggest setting clear mutual expectations of engagement and not granting unwarranted exceptions.
CONCLUSION
In this time of a global pandemic, we face a looming shortage of hospital generalists, which calls for immediate and purposeful workforce expansion facilitated by learning to “un-specialize” certain providers. We propose utilizing the framework of FPPE to educate and support those joining hospital medicine teams. Hospitalists are innovators and health systems science leaders. Let’s draw on that strength now to rise to the challenge of COVID-19.
1. Smith A. An Inquiry into the Nature and Causes of the Wealth of Nations. Chicago, Illinois: University of Chicago Press; 1976.
2. Cram P, Ettinger WH, Jr. Generalists or specialists--who does it better? Physician Exec. 1998;24(1):40-45.
3. Accreditation Council for Graduate Medical Education. ACGME Response to Pandemic Crisis. https://acgme.org/COVID-19. Accessed April 1, 2020.
4. The Joint Commission. Emergency Management—Meeting FPPE and OPPE Requirements During the COVID-19 Emergency. https://www.jointcommission.org/standards/standard-faqs/hospital-and-hospital-clinics/medical-staff-ms/000002291/. Accessed April 1, 2020.
5. Petropoulos F, Makridakis S. Forecasting the novel coronavirus COVID-19. PLoS One. 2020;15(3):e0231236. https://doi.org/10.1371/journal.pone.0231236.eCollection 2020.
6. Ioannidis JPA. Coronavirus disease 2019: the harms of exaggerated information and non-evidence-based measures. Eur J Clin Invest. 2020;e13222. https://doi.org/10.1111/eci.13222.
7. Antommaria M. Conflicting duties and reciprocal obligations during a pandemic. J Hosp Med. 2020;15(5):xx-xx. https://doi.org/10.12788/jhm.3425.
© 2020 Society of Hospital Medicine
Reimagining Inpatient Care in Canadian Teaching Hospitals: Bold Initiatives or Tinkering at the Margins?
Canada’s 17 medical schools and their affiliated teaching hospitals are instrumental in serving local communities and providing regional and national access to specialized therapies. Akin to many other countries, patients in Canadian teaching hospitals typically receive care from trainees supervised by attending physicians on teams that Canadians refer to as clinical teaching units (CTUs).1 For more than 50 years, the CTU model has served trainees, attendings, and patients well.2 The success of the CTU model has been dependent on several factors including the crucial balance between the number of trainees and volume of patients. However, Canadian teaching hospitals are increasingly challenged by an imbalance in the trainee-to-patient volume equilibrium spurred by increasing patient volumes and declining house staff availability. The challenges we are facing today in Canada are similar to those teaching hospitals in the United States have faced and adapted to over the last 15 years. Can we build a new, sustainable model of inpatient care through attending-directed inpatient services much as has happened in the US?
Canada’s population of 36 million people is growing by approximately 1% per year, largely driven by immigration.3 At the same time, Canada’s population is aging and becoming increasingly medically complex; the percentage of Canadians age 65 years and older is anticipated to rise from approximately 17% today to 25% in 2035.4 Canada’s healthcare system historically functioned with relatively few inpatient beds, encouraging efficiency particularly with respect to which patients require hospital admission and which do not.5 Although data suggest that the number of hospital admissions declined in Canada between 1980 and 1995, recent data documented that General Internal Medicine admissions increased by 32% between 2010 and 2015 and accounted for 24% of total hospital bed days.6,7 The effects of population growth and aging on admission volumes might be mitigated to some extent by innovations in healthcare delivery such as improved access to primary care (largely family physicians in Canada). However, even with these innovations, a growing and aging population is likely to have a disproportionate effect on the types of undifferentiated illnesses that are typically admitted to General Internal Medicine in Canadian teaching hospitals.
Increasing volumes and complexity are occurring at the same time that residency training in Canada is undergoing an extraordinary shift, mirroring trends in other countries.8 CTUs in Canada typically have a census of 20 or more patients and are staffed by an attending, one senior resident, two to three junior residents, and medical students. Recognition that physician fatigue is associated with patient safety events and physician burnout has led to shorter resident shifts, though Canadian hospitals typically operate without concrete work hour limits or “hard” caps on team size.8 To fulfill accreditation standards set by the Royal College of Physicians and Surgeons of Canada, residency programs have required increases in formal teaching sessions during working hours, further reducing resident presence at the bedside. Many specialty training programs (eg, anesthesiology and ophthalmology) that traditionally required trainees to rotate through General Medicine have eliminated this requirement. Moreover, postgraduate training now requires additional time be spent in ambulatory and community hospital settings to better prepare residents for practice.9 There is little enthusiasm for increasing the number of residents, as postgraduate training spots increased by 85% between 2000 and 2013, before stabilizing in recent years.10
These factors are leading to a substantial decline in resident availability on CTUs, shifting increasing amounts of direct patient care to attending physicians in Canadian teaching hospitals across virtually all specialties. Unsurprisingly, increased rates of burnout and decreases in job satisfactio
Canadian teaching hospitals currently find themselves facing a confluence of factors nearly identical to those faced by teaching hospitals in the United States during 2003 when the Accreditation Council for Graduate Medical Education instituted resident duty hour restrictions to address concerns over trainee wellness, shift length, and patient safety.8 Instantly, hundreds of US teaching hospitals faced uncertainty over who would provide patient care when residents were unavailable. Virtually all US teaching hospitals responded with a creativity and speed that we are unaccustomed to in academic medicine. Hospitals reallocated money to finance attending-directed services where patient care was provided directly by attending physicians often working without trainees12 but frequently supported by nurse practitioners or physician assistants.13 Despite the differences between US and Canadian healthcare, 15 years later, we in Canada can and should learn from the US experience.14
Attending-directed services offer several advantages. First, attending-directed services offer patient outcomes including ICU transfer, mortality, readmissions, and satisfaction that are similar, if not modestly improved, when compared with traditional teaching services.15 Results also suggest potential reductions in hospital length of stay and diagnostic testing.16 Attending-directed services can enhance trainee education by insuring attending physician presence and oversight in-hospital 24-hours per day.17 Although not well studied, attending-directed services may reduce variation in CTU patient census so that excess volumes can be absorbed by attending-directed teams even with seasonal surges (eg, influenza). Recognizing that many specialties were experiencing the same challenges as General Medicine in 2003, attending-directed services in the US have been designed to care for a wide spectrum of patients drawn from an array of different specialties with evidence of improved outcomes.12 Building attending-directed services in Canadian teaching hospitals may expand to include patients from multiple specialties and subspecialties (surgery, orthopedics, and cardiology) where patient volumes are increasing and resident coverage is increasingly scarce.
The challenges that accompany the implementation of attending-directed teams must be acknowledged. First, while attending-directed teams solve many problems for teaching hospitals, physician billings may not generate sufficient income to be self-sustaining and require additional financial support.18 Without investment from hospitals or government, attending-directed models cannot flourish in teaching hospitals. US hospitals typically provide substantial financial support ($50,000-$100,000 per physician) to hospitalist programs, but Canadian teaching hospitals have been reluctant to follow suit.
Second, attending-directed services require a sustainable workforce. In Canada, inpatient care is provided predominately by family physician hospitalists in community hospitals, whereas internists typically fulfill these roles in teaching hospitals.19 Family physician hospitalists are commonly represented by the Canadian Society for Hospital Medicine, which is the Canadian branch of the Society of Hospital Medicine. Hospital medicine in Canada is typically organized around physician training (family physician vs internist) rather than clinical focus (outpatient vs inpatient). Collaborative models of care that unite hospitalists from all training streams (family physician, internist, and pediatrics) are only just emerging in Canadian teaching hospitals. How these programs are developed will be critical to the successful growth of attending-directed services. Third, if attending-directed services expand in teaching hospitals, the physicians who staff these services must come from somewhere. Either the “production” of physicians will need to increase or physicians will migrate to attending-directed services from outpatient practice or from community hospitals.20 Canadian teaching hospitals can also explore nurse practitioners and physician assistants, a previously underutilized resource. Though the costs of such programs can be significant,21 the payoff in safety, quality, and efficiency may be worth it—as demonstrated in the US system. Fourth, teaching hospitals and medical schools must create academic homes to support and mentor the physicians working on attending-directed services. Although physicians hired for attending-directed services primarily provide direct patient care, few will join academic medical centers solely for this purpose. Teaching hospitals and medical schools need to carefully consider job descriptions, mentoring, and career advancement opportunities as they build attending-directed services. Finally, the interactions between teaching and attending-directed services are complex. There is an inevitable learning curve as clinical operations and protocols are built and developed. For example, decisions need to be made about how patients are divided between services and whether nocturnists are responsible for teaching overnight residents.17 Successful programs have the potential to benefit hospitals, patients, learners, and faculty alike.
The risks associated with the status quo in Canada must also be addressed. Patient volumes and complexity in Canada are likely to continue to slowly increase, while the number of trainees in Canadian teaching hospitals will remain stable at best. Forcing more patients onto already overtaxed teaching services is likely to worsen hospital efficiency, patient outcomes, and educational experiences.22 Forcing additional patient care onto overstretched faculty will slowly erode the academic work (teaching and research) that has characterized excellence in Canadian medicine.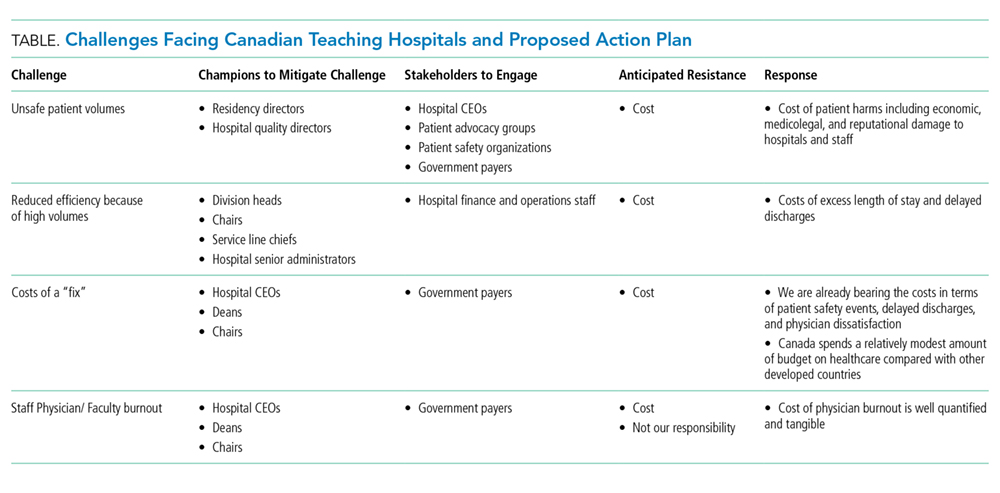
The changes we propose to overcome the challenges facing Canadian teaching hospitals are neither cheap nor easy (Table). We expect resistance on many fronts. Implementing them will likely require concerted advocacy from a diverse group of champions shining a bright spotlight on the sizable challenges Canadian teaching hospitals are confronting. We believe that each challenge maps to a discrete group of champions with discrete targets within hospital leadership, medical school administration, and government who will need to be engaged. In our opinion, organizing around these challenges offers the best opportunity to overcome the perpetual resistance around costs. Canadian teaching hospitals and their CTUs are under unprecedented pressure. Do we act boldly and embrace attending-directed models of care or continue tinkering at the margins?
Acknowledgments
The authors thank Chaim Bell for his advice and suggestions.
Disclosures
The authors have nothing to disclose.
1. Schrewe B, Pratt DD, McKellin WH. Adapting the forms of yesterday to the functions of today and the needs of tomorrow: a genealogical case study of clinical teaching units in Canada. Adv Health Sci Educ Theory Pract. 2016;21(2):475-499. PubMed
2. Maudsley RF. The clinical teaching unit in transition. CMAJ. 1993;148(9):1564-1566. PubMed
3. Statistics Canada. Recent Changes in Demographic Trends in Canada. Ottawa: Ontario, 2015. https://www150.statcan.gc.ca/n1/pub/75-006-x/2015001/article/14240-eng.htm. Accessed December 9, 2018
4. Statistics Canada. Census, Age and Sex. Ottawa: Ontario, 2016. https://www12.statcan.gc.ca/census-recensement/2016/rt-td/as-eng.cfm. Accessed December 10, 2018.
5. Papanicolas I, Woskie LR, Jha AK. Health care spending in the United States and other high-income countries. JAMA. 2018;319(10):1024-1039. PubMed
6. van Walraven C. Trends in 1-year survival of people admitted to hospital in Ontario, 1994-2009. CMAJ. 2013;185(16):E755-E762. PubMed
7. Verma AA, Guo Y, Kwan JL, et al. Patient characteristics, resource use and outcomes associated with general internal medicine hospital care: the General Medicine Inpatient Initiative (GEMINI) retrospective cohort study. CMAJ Open. 2017;5(4):E842-E849. PubMed
8. Pattani R, Wu PE, Dhalla IA. Resident duty hours in Canada: past, present and future. CMAJ. 2014;186(10):761-765. PubMed
9. Royal College of Physicians and Surgeons. Specialty Training Requirements in Internal medicine 2015. http://www.royalcollege.ca/cs/groups/public/documents/document/mdaw/mdg4/~edisp/088402.pdf. Accessed December 12, 2018.
10. Freeman TR, Petterson S, Finnegan S, Bazemore A. Shifting tides in the emigration patterns of Canadian physicians to the United States: a cross-sectional secondary data analysis. BMC Health Serv Res. 2016;16(1):678. PubMed
11. Wong BM, Imrie K. Why resident duty hours regulations must address attending physicians’ workload. Acad Med. 2013;88(9):1209-1211. PubMed
12. Flanders SA, Centor B, Weber V, McGinn T, DeSalvo K, Auerbach A. Challenges and opportunities in academic hospital medicine: report from the Academic Hospital Medicine Summit. J Hosp Med. 2009;4(4):240-246. PubMed
13. Torok H, Lackner C, Landis R, Wright S. Learning needs of physician assistants working in hospital medicine. J Hosp Med. 2012;7(3):190-194. PubMed
14. Ivers N, Brown AD, Detsky AS. Lessons from the Canadian experience with single-payer health insurance: just comfortable enough with the status quo. JAMA Intern Med. 2018;178(9):1250-1255. PubMed
15. Wray CM, Flores A, Padula WV, Prochaska MT, Meltzer DO, Arora VM. Measuring patient experiences on hospitalist and teaching services: patient responses to a 30-day postdischarge questionnaire. J Hosp Med. 2016;11(2):99-104. PubMed
16. Auerbach AD, Wachter RM, Katz P, Showstack J, Baron RB, Goldman L. Implementation of a voluntary hospitalist service at a community teaching hospital: improved clinical efficiency and patient outcomes. Ann Intern Med. 2002;137(11):859-865. PubMed
17. Farnan JM, Burger A, Boonyasai RT, et al. Survey of overnight academic hospitalist supervision of trainees. J Hosp Med. 2012;7(7):521-523. PubMed
18. Gonzalo JD, Kuperman EF, Chuang CH, Lehman E, Glasser F, Abendroth T. Impact of an overnight internal medicine academic hospitalist program on patient outcomes. J Gen Intern Med. 2015;30(12):1795-1802. PubMed
19. Soong C, Fan E, Howell EE, et al. Characteristics of Hospitalists and Hospitalist Programs in the United States and Canada 2009. J Clin Outcomes Meas. 2009; 16 (2): 69-74.
20. Yousefi V, Maslowski R. Health system drivers of hospital medicine in Canada: systematic review. Can Fam Phys Med Fam Can. 2013;59(7):762-767. PubMed
21. Nuckols TK, Escarce JJ. Cost implications of ACGME’s 2011 changes to resident duty hours and the training environment. J Gen Intern Med. 2012;27(2):241-249. PubMed
22. Elliott DJ, Young RS, Brice J, Aguiar R, Kolm P. Effect of hospitalist workload on the quality and efficiency of care. JAMA Intern Med. 2014;174(5):786-793. PubMed
Canada’s 17 medical schools and their affiliated teaching hospitals are instrumental in serving local communities and providing regional and national access to specialized therapies. Akin to many other countries, patients in Canadian teaching hospitals typically receive care from trainees supervised by attending physicians on teams that Canadians refer to as clinical teaching units (CTUs).1 For more than 50 years, the CTU model has served trainees, attendings, and patients well.2 The success of the CTU model has been dependent on several factors including the crucial balance between the number of trainees and volume of patients. However, Canadian teaching hospitals are increasingly challenged by an imbalance in the trainee-to-patient volume equilibrium spurred by increasing patient volumes and declining house staff availability. The challenges we are facing today in Canada are similar to those teaching hospitals in the United States have faced and adapted to over the last 15 years. Can we build a new, sustainable model of inpatient care through attending-directed inpatient services much as has happened in the US?
Canada’s population of 36 million people is growing by approximately 1% per year, largely driven by immigration.3 At the same time, Canada’s population is aging and becoming increasingly medically complex; the percentage of Canadians age 65 years and older is anticipated to rise from approximately 17% today to 25% in 2035.4 Canada’s healthcare system historically functioned with relatively few inpatient beds, encouraging efficiency particularly with respect to which patients require hospital admission and which do not.5 Although data suggest that the number of hospital admissions declined in Canada between 1980 and 1995, recent data documented that General Internal Medicine admissions increased by 32% between 2010 and 2015 and accounted for 24% of total hospital bed days.6,7 The effects of population growth and aging on admission volumes might be mitigated to some extent by innovations in healthcare delivery such as improved access to primary care (largely family physicians in Canada). However, even with these innovations, a growing and aging population is likely to have a disproportionate effect on the types of undifferentiated illnesses that are typically admitted to General Internal Medicine in Canadian teaching hospitals.
Increasing volumes and complexity are occurring at the same time that residency training in Canada is undergoing an extraordinary shift, mirroring trends in other countries.8 CTUs in Canada typically have a census of 20 or more patients and are staffed by an attending, one senior resident, two to three junior residents, and medical students. Recognition that physician fatigue is associated with patient safety events and physician burnout has led to shorter resident shifts, though Canadian hospitals typically operate without concrete work hour limits or “hard” caps on team size.8 To fulfill accreditation standards set by the Royal College of Physicians and Surgeons of Canada, residency programs have required increases in formal teaching sessions during working hours, further reducing resident presence at the bedside. Many specialty training programs (eg, anesthesiology and ophthalmology) that traditionally required trainees to rotate through General Medicine have eliminated this requirement. Moreover, postgraduate training now requires additional time be spent in ambulatory and community hospital settings to better prepare residents for practice.9 There is little enthusiasm for increasing the number of residents, as postgraduate training spots increased by 85% between 2000 and 2013, before stabilizing in recent years.10
These factors are leading to a substantial decline in resident availability on CTUs, shifting increasing amounts of direct patient care to attending physicians in Canadian teaching hospitals across virtually all specialties. Unsurprisingly, increased rates of burnout and decreases in job satisfactio
Canadian teaching hospitals currently find themselves facing a confluence of factors nearly identical to those faced by teaching hospitals in the United States during 2003 when the Accreditation Council for Graduate Medical Education instituted resident duty hour restrictions to address concerns over trainee wellness, shift length, and patient safety.8 Instantly, hundreds of US teaching hospitals faced uncertainty over who would provide patient care when residents were unavailable. Virtually all US teaching hospitals responded with a creativity and speed that we are unaccustomed to in academic medicine. Hospitals reallocated money to finance attending-directed services where patient care was provided directly by attending physicians often working without trainees12 but frequently supported by nurse practitioners or physician assistants.13 Despite the differences between US and Canadian healthcare, 15 years later, we in Canada can and should learn from the US experience.14
Attending-directed services offer several advantages. First, attending-directed services offer patient outcomes including ICU transfer, mortality, readmissions, and satisfaction that are similar, if not modestly improved, when compared with traditional teaching services.15 Results also suggest potential reductions in hospital length of stay and diagnostic testing.16 Attending-directed services can enhance trainee education by insuring attending physician presence and oversight in-hospital 24-hours per day.17 Although not well studied, attending-directed services may reduce variation in CTU patient census so that excess volumes can be absorbed by attending-directed teams even with seasonal surges (eg, influenza). Recognizing that many specialties were experiencing the same challenges as General Medicine in 2003, attending-directed services in the US have been designed to care for a wide spectrum of patients drawn from an array of different specialties with evidence of improved outcomes.12 Building attending-directed services in Canadian teaching hospitals may expand to include patients from multiple specialties and subspecialties (surgery, orthopedics, and cardiology) where patient volumes are increasing and resident coverage is increasingly scarce.
The challenges that accompany the implementation of attending-directed teams must be acknowledged. First, while attending-directed teams solve many problems for teaching hospitals, physician billings may not generate sufficient income to be self-sustaining and require additional financial support.18 Without investment from hospitals or government, attending-directed models cannot flourish in teaching hospitals. US hospitals typically provide substantial financial support ($50,000-$100,000 per physician) to hospitalist programs, but Canadian teaching hospitals have been reluctant to follow suit.
Second, attending-directed services require a sustainable workforce. In Canada, inpatient care is provided predominately by family physician hospitalists in community hospitals, whereas internists typically fulfill these roles in teaching hospitals.19 Family physician hospitalists are commonly represented by the Canadian Society for Hospital Medicine, which is the Canadian branch of the Society of Hospital Medicine. Hospital medicine in Canada is typically organized around physician training (family physician vs internist) rather than clinical focus (outpatient vs inpatient). Collaborative models of care that unite hospitalists from all training streams (family physician, internist, and pediatrics) are only just emerging in Canadian teaching hospitals. How these programs are developed will be critical to the successful growth of attending-directed services. Third, if attending-directed services expand in teaching hospitals, the physicians who staff these services must come from somewhere. Either the “production” of physicians will need to increase or physicians will migrate to attending-directed services from outpatient practice or from community hospitals.20 Canadian teaching hospitals can also explore nurse practitioners and physician assistants, a previously underutilized resource. Though the costs of such programs can be significant,21 the payoff in safety, quality, and efficiency may be worth it—as demonstrated in the US system. Fourth, teaching hospitals and medical schools must create academic homes to support and mentor the physicians working on attending-directed services. Although physicians hired for attending-directed services primarily provide direct patient care, few will join academic medical centers solely for this purpose. Teaching hospitals and medical schools need to carefully consider job descriptions, mentoring, and career advancement opportunities as they build attending-directed services. Finally, the interactions between teaching and attending-directed services are complex. There is an inevitable learning curve as clinical operations and protocols are built and developed. For example, decisions need to be made about how patients are divided between services and whether nocturnists are responsible for teaching overnight residents.17 Successful programs have the potential to benefit hospitals, patients, learners, and faculty alike.
The risks associated with the status quo in Canada must also be addressed. Patient volumes and complexity in Canada are likely to continue to slowly increase, while the number of trainees in Canadian teaching hospitals will remain stable at best. Forcing more patients onto already overtaxed teaching services is likely to worsen hospital efficiency, patient outcomes, and educational experiences.22 Forcing additional patient care onto overstretched faculty will slowly erode the academic work (teaching and research) that has characterized excellence in Canadian medicine.
The changes we propose to overcome the challenges facing Canadian teaching hospitals are neither cheap nor easy (Table). We expect resistance on many fronts. Implementing them will likely require concerted advocacy from a diverse group of champions shining a bright spotlight on the sizable challenges Canadian teaching hospitals are confronting. We believe that each challenge maps to a discrete group of champions with discrete targets within hospital leadership, medical school administration, and government who will need to be engaged. In our opinion, organizing around these challenges offers the best opportunity to overcome the perpetual resistance around costs. Canadian teaching hospitals and their CTUs are under unprecedented pressure. Do we act boldly and embrace attending-directed models of care or continue tinkering at the margins?
Acknowledgments
The authors thank Chaim Bell for his advice and suggestions.
Disclosures
The authors have nothing to disclose.
1. Schrewe B, Pratt DD, McKellin WH. Adapting the forms of yesterday to the functions of today and the needs of tomorrow: a genealogical case study of clinical teaching units in Canada. Adv Health Sci Educ Theory Pract. 2016;21(2):475-499. PubMed
2. Maudsley RF. The clinical teaching unit in transition. CMAJ. 1993;148(9):1564-1566. PubMed
3. Statistics Canada. Recent Changes in Demographic Trends in Canada. Ottawa: Ontario, 2015. https://www150.statcan.gc.ca/n1/pub/75-006-x/2015001/article/14240-eng.htm. Accessed December 9, 2018
4. Statistics Canada. Census, Age and Sex. Ottawa: Ontario, 2016. https://www12.statcan.gc.ca/census-recensement/2016/rt-td/as-eng.cfm. Accessed December 10, 2018.
5. Papanicolas I, Woskie LR, Jha AK. Health care spending in the United States and other high-income countries. JAMA. 2018;319(10):1024-1039. PubMed
6. van Walraven C. Trends in 1-year survival of people admitted to hospital in Ontario, 1994-2009. CMAJ. 2013;185(16):E755-E762. PubMed
7. Verma AA, Guo Y, Kwan JL, et al. Patient characteristics, resource use and outcomes associated with general internal medicine hospital care: the General Medicine Inpatient Initiative (GEMINI) retrospective cohort study. CMAJ Open. 2017;5(4):E842-E849. PubMed
8. Pattani R, Wu PE, Dhalla IA. Resident duty hours in Canada: past, present and future. CMAJ. 2014;186(10):761-765. PubMed
9. Royal College of Physicians and Surgeons. Specialty Training Requirements in Internal medicine 2015. http://www.royalcollege.ca/cs/groups/public/documents/document/mdaw/mdg4/~edisp/088402.pdf. Accessed December 12, 2018.
10. Freeman TR, Petterson S, Finnegan S, Bazemore A. Shifting tides in the emigration patterns of Canadian physicians to the United States: a cross-sectional secondary data analysis. BMC Health Serv Res. 2016;16(1):678. PubMed
11. Wong BM, Imrie K. Why resident duty hours regulations must address attending physicians’ workload. Acad Med. 2013;88(9):1209-1211. PubMed
12. Flanders SA, Centor B, Weber V, McGinn T, DeSalvo K, Auerbach A. Challenges and opportunities in academic hospital medicine: report from the Academic Hospital Medicine Summit. J Hosp Med. 2009;4(4):240-246. PubMed
13. Torok H, Lackner C, Landis R, Wright S. Learning needs of physician assistants working in hospital medicine. J Hosp Med. 2012;7(3):190-194. PubMed
14. Ivers N, Brown AD, Detsky AS. Lessons from the Canadian experience with single-payer health insurance: just comfortable enough with the status quo. JAMA Intern Med. 2018;178(9):1250-1255. PubMed
15. Wray CM, Flores A, Padula WV, Prochaska MT, Meltzer DO, Arora VM. Measuring patient experiences on hospitalist and teaching services: patient responses to a 30-day postdischarge questionnaire. J Hosp Med. 2016;11(2):99-104. PubMed
16. Auerbach AD, Wachter RM, Katz P, Showstack J, Baron RB, Goldman L. Implementation of a voluntary hospitalist service at a community teaching hospital: improved clinical efficiency and patient outcomes. Ann Intern Med. 2002;137(11):859-865. PubMed
17. Farnan JM, Burger A, Boonyasai RT, et al. Survey of overnight academic hospitalist supervision of trainees. J Hosp Med. 2012;7(7):521-523. PubMed
18. Gonzalo JD, Kuperman EF, Chuang CH, Lehman E, Glasser F, Abendroth T. Impact of an overnight internal medicine academic hospitalist program on patient outcomes. J Gen Intern Med. 2015;30(12):1795-1802. PubMed
19. Soong C, Fan E, Howell EE, et al. Characteristics of Hospitalists and Hospitalist Programs in the United States and Canada 2009. J Clin Outcomes Meas. 2009; 16 (2): 69-74.
20. Yousefi V, Maslowski R. Health system drivers of hospital medicine in Canada: systematic review. Can Fam Phys Med Fam Can. 2013;59(7):762-767. PubMed
21. Nuckols TK, Escarce JJ. Cost implications of ACGME’s 2011 changes to resident duty hours and the training environment. J Gen Intern Med. 2012;27(2):241-249. PubMed
22. Elliott DJ, Young RS, Brice J, Aguiar R, Kolm P. Effect of hospitalist workload on the quality and efficiency of care. JAMA Intern Med. 2014;174(5):786-793. PubMed
© 2019 Society of Hospital Medicine
Follow Up of Incidental High-Risk Pulmonary Nodules on Computed Tomography Pulmonary Angiography at Care Transitions
Computed tomography pulmonary angiography (CTPA) is often used in the evaluation of suspected pulmonary embolism (PE). The detection of incidental findings that require follow-up is common; in just over 50% of cases, those incidental findings are pulmonary nodules.1 Although the majority of these nodules are benign, Fleischner Society guidelines2 recommend that patients with nodules at high risk for malignancy should undergo follow-up CT imaging within 3-12 months, with patients who smoke and have large nodules requiring closer follow up.
The failure to follow-up on abnormal test results is known to contribute to diagnostic error and can lead to patient harm.3 We sought to determine the proportion of high-risk pulmonary nodules on CTPA which did not undergo the recommended follow-up imaging.
Study Setting and Design
This retrospective cohort study included all patients who underwent CTPA in the emergency department (ED) and inpatient settings at three academic health centers (Mount Sinai Hospital, Toronto General Hospital, and Toronto Western Hospital) in Toronto, Canada between September 1, 2014, and August 31, 2015.
We examined the proportion of patients with pulmonary nodules requiring follow up who received repeat CT imaging within six weeks of the time frame recommended by the radiologist. Since we were interested in measuring the rate of an important test result that is missed (rather than accuracy of the test itself), we defined “requiring follow up” as the inclusion of explicit recommendations for follow up in the radiology report.
Montage (Philadelphia, Pennsylvania), a natural language processing software, was applied to a linked radiology information system (RIS) to identify all CTPAs that contained pulmonary nodules. We conducted manual chart review to confirm software accuracy. We initially searched the RIS for all CTPAs that were completed within the study period, resulting in the identification of 1932 imaging studies. Following a review of these 1,932 studies, we excluded 22 as they were not CTPAs. We then applied the search term, “nodule-” to 1,910 confirmed CTPAs, resulting in the identification of 836 imaging studies. Following a review of these 836 studies, we excluded 10 as they were duplicate studies. We also excluded 152 studies where the term “nodule-” did not identify a pulmonary nodule but instead referred to a radiologist reporting the absence of pulmonary nodules (eg “there were no pulmonary nodules found”) or the presence of non-lung nodules (eg thyroid nodules). This resulted in the identification of 674 CTPAs containing pulmonary nodules (Figure 1).
Thereafter, we generated a cohort with possible new lung malignancy eligible for follow-up imaging by reviewing available health records and applying the following prespecified exclusion criteria: (1) patients who died, (2) left against medical advice, (3) were critically ill during the follow-up period, (4) lived outside the hospital catchment area (Greater Toronto Area), (5) were seen in the outpatient setting, (6) identified as palliative, (7) had an active malignancy, (8) had nodules that were already being followed, or (9) had nodules with characteristics suggestive of alternate diagnoses to lung malignancy (such as infection or inflammation) with no follow up recommended as reported by the radiologist. For patients with multiple CTPAs, we included only the first study. For each eligible patient, we determined whether follow-up imaging was completed by manually reviewing the linked RIS. We reviewed available health records to determine whether the pulmonary nodule findings had been discussed with the patient and whether the patient had attended an outpatient follow-up visit. In patients for whom recommended follow-up imaging was not confirmed, we notified the ordering physician by e-mail.
Each radiology department followed the same protocol adherent to the 2005 Fleischner guidelines for identifying nodules requiring follow up.2 Virtually all CTPAs at the three study institutions are read and reported within 72 hours. The ordering physician is sometimes called at the discretion of the reading radiologist when the findings are judged to be urgent and time-sensitive in nature. For example, the ordering physician may be contacted if a CTPA is positive for segmental PE but is not typically called for incidental pulmonary nodules. It is not common practice for ordering physicians to be notified of incidental findings above and beyond the radiology report. Primary care physicians are not typically copied on radiology reports and usually do not use the same electronic health record.
Statistical Analysis
We calculated simple descriptive statistics for all results. Mean values were compared using two-tailed t-tests, categorical groups using chi-square tests, and median values using Mann-Whitney U tests. We performed all analyses using Microsoft Excel version 16.14.1 (Redmond, Washington).
Ethics Approval
This study was approved by each institution’s research ethics board.
RESULTS
Follow Up of Incidental High-Risk Pulmonary Nodules
Of the 1910 CTPAs performed over the study period (Figure), 674 (35.3%) contained pulmonary nodules. Of the 259 patients with new pulmonary nodules eligible for follow-up imaging, 194 (74.9%) did not have an explicit suggestion for follow up by the radiologist. Ninety-five percent of radiologists (184 out of 194) provided an explanation for not recommending follow up in the radiology report; the two most common reasons were small nodule size (often described as “tiny”) and no interval change compared with the prior imaging study.2 Of the 65 patients who did receive an explicit suggestion for follow up by radiology, 35 (53.8%) did not receive repeat imaging within the recommended time frame, allowing for a six-week grace period. Of these 35 patients, 10 eventually went on to receive delayed repeat imaging. The median follow-up time for the 30 patients who received timely repeat imaging was four months (IQR 2-6 months); in contrast, the median follow-up time for the 10 patients who received delayed repeat imaging was seven months (IQR 6-8 months), P = .01.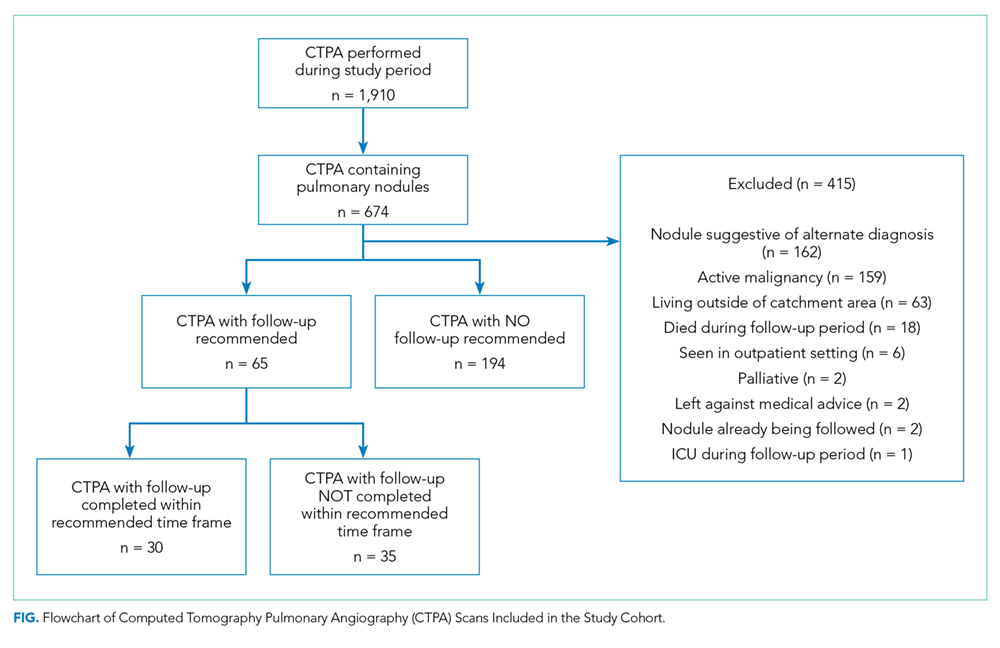
Of the 65 patients for whom follow up was recommended, the medical record showed evidence that there was a discussion between the medical team and the patient regarding patient preference for or against follow up in 55.4% (36 out of 65) of the patients. Notably, all 36 patients showed interest in receiving follow up; no patient indicated a preference for no follow up.
Furthermore, of the 65 patients that had follow up recommended, two patients were eventually diagnosed with lung cancer (one via lung biopsy, the other via positron emission tomography imaging); both patients did not receive timely follow-up imaging. While we did not include nodule size as an exclusion criterion, not one of the 65 patients included in the final cohort had nodules larger than 3 cm.
Physician Notification
In circumstances where we could not confirm that followed up had occurred, we notified the ordering physician by e-mail. Since 10 of the 35 patients who did not receive timely follow-up imaging went on to receive delayed repeat imaging, we notified 25 physicians. Of the 25 physicians that we e-mailed, 24 acknowledged receipt of the information. Of these 24 physicians, 14 reported conducting a detailed review of the chart, from which the following additional information was obtained: one patient expired, and five physicians notified the corresponding primary care physicians (two of whom were unaware of the nodule, and subsequently arranged further follow up with the patient).
Characteristics Associated with Timely Follow Up
Explicit mention that follow up was required in the discharge summary (P = .03), attending an outpatient follow-up visit (P < .001), and younger age (P = .03) were associated with receiving timely follow up; patient sex, smoking history, history of chronic obstructive pulmonary disease, lung nodule count, recommended follow-up time, and hospital department (defined as the discharging service) were not (Table).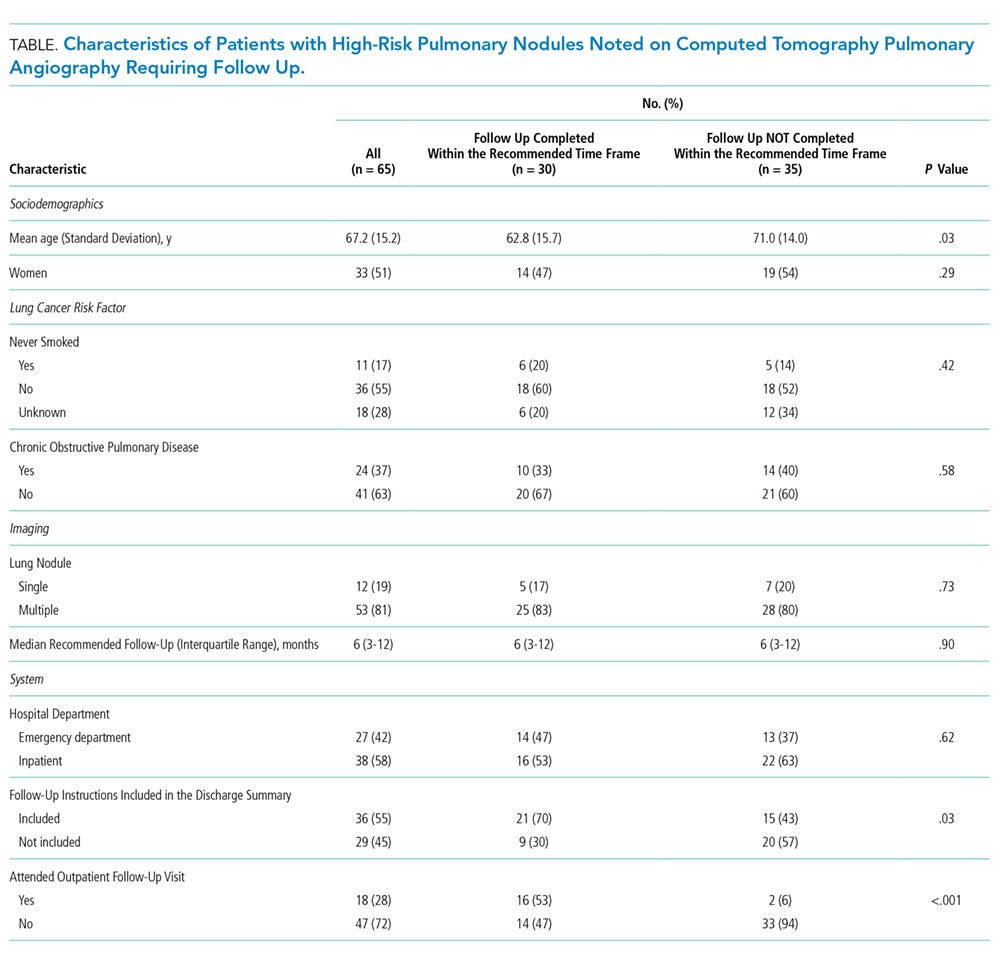
DISCUSSION
In this multicenter cohort study, over 50% of patients with new high-risk pulmonary nodules detected incidentally on CTPA did not receive timely follow-up imaging. Including follow-up recommendations in the discharge summary, attending an outpatient follow-up visit, and younger age were associated with timely follow-up imaging.
Few studies have assessed the follow up of incidental nodules identified on CTPA. In a retrospective cohort study of ED patients in the United States, Blagev et al. found that only 29% received timely follow up.4 Our study contributes to the literature in several ways. First, our study included all hospitalized patients, not only those in the ED. Notably, most of our cohort were inpatients, a group of patients not previously described. Second, we examined factors associated with timely follow up, which may help to inform future quality improvement initiatives and interventions. Third, we included data from three different hospitals, which may improve generalization. Lastly, our study draws on contemporary Canadian data. Most of the studies investigating test result follow up have been conducted in the US5,6 and Europe,7 with few empirical studies describing this phenomenon within the Canadian healthcare setting. We believe that our work contributes to the existing evidence that missed test results occur across diverse healthcare systems and have yet to be solved.5-7
Our study had limitations. First, we defined follow up as repeat imaging and did not include office visits or biopsy in this definition. Second, we may have missed repeat imaging and outpatient follow-up visits that occurred outside the study hospitals. Although we were able to determine if repeat imaging and outpatient follow-up visits (eg, pulmonology or thoracic surgery clinics) had occurred within the study hospitals, we did not have access to follow-up encounters that occurred outside of the study hospitals (eg primary care clinics). We are unaware of any published regional data on the rate of outpatient follow up at the index facility following discharge. However, we know from provincial data of patients discharged from the ED with a new cardiac diagnosis that just under half are seen by a family physician, cardiologist, or internist within seven days, with just under 80% seen within 30 days.8 Third, although we attempted to capture patient preference for or against repeat imaging using chart review, the absence of documentation of patient preference did not confirm that a discussion regarding patient preferences had not occurred. Fourth, while we did exclude patients that had an active malignancy, we did not exclude patients who were younger than 35 years or were immunocompromised, which may have led to an overestimation of the percentage of patients who did not receive follow up.
Incidental findings detected on acute diagnostic tests requiring handoffs for chronic follow up are at risk of falling through the cracks. The inclusion of follow-up recommendations in discharge summaries has been shown to increase the likelihood of follow-up completion.9 Our study provides additional evidence of the urgent need for interventions aimed at closing the loop on test result follow up.5,6
Disclosures
None of the authors have any conflicts of interest to disclose in reference to this study.
Funding
JLK is supported by the Mount Sinai Hospital Department of Medicine Research Fund. PC is supported by a K24 award from the National Institute of Arthritis and Musculoskeletal and Skin Diseases (AR062133).
1. Hall WB, Truitt SG, Scheunemann LP, et al. The prevalence of clinically relevant incidental findings on chest computed tomographic angiograms ordered to diagnose pulmonary embolism. Arch Intern Med 2009;169(21):1961. doi: 10.1001/archinternmed.2009.360. PubMed
2. Macmahon H, Austin JHM, Gamsu G, et al. Guidelines for Management of Small Pulmonary Nodules Detected on CT Scans: A Statement from the Fleischner Society. Radiology 2005;237(2):395-400. doi: 10.1148/radiol.2372041887. PubMed
3. National Academies of Sciences, Engineering, and Medicine. Improving diagnosis in health care. Washington, DC. 2015. PubMed
4. Blagev DP, Lloyd JF, Conner K, et al. Follow-up of incidental pulmonary nodules and the radiology report. J Am Coll Radiol 2014;11(4):378-383. doi: 10.1016/j.jacr.2013.08.003. PubMed
5. Callen J, Georgiou A, Li J, Westbrook JI. The safety implications of missed test results for hospitalized patients: a systematic review. BMJ Quality Safety 2011;20(2):194-199. doi: 10.1136/bmjqs.2010.044339.
6. Callen JL, Westbrook JI, Georgiou A, Li J. Failure to follow-up test results for ambulatory patients: a systematic review. J Gen Intern Med 2011;27(10):1334-1348. doi: 10.1007/s11606-011-1949-5. PubMed
7. Litchfield I, Bentham L, Lilford R, Mcmanus RJ, Hill A, Greenfield S. Test result communication in primary care: a survey of current practice. BMJ Quality Safety 2015;24(11):691-699. doi: 10.1136/bmjqs-2014-003712. PubMed
8. Atzema CL, Yu B, Ivers NM, et al. Predictors of obtaining follow-up care in the province of Ontario, Canada, following a new diagnosis of atrial fibrillation, heart failure, and hypertension in the emergency department. Cjem 2017;20(03):377-391. doi: 10.1017/cem.2017.371. PubMed
9. Moore C, McGinn T, Halm E. Tying up loose ends: Discharging patients with unresolved medical issues. Arch Intern Med 2007;167(12):1305-1311. doi: 10.1001/archinte.167.12.1305 PubMed
Computed tomography pulmonary angiography (CTPA) is often used in the evaluation of suspected pulmonary embolism (PE). The detection of incidental findings that require follow-up is common; in just over 50% of cases, those incidental findings are pulmonary nodules.1 Although the majority of these nodules are benign, Fleischner Society guidelines2 recommend that patients with nodules at high risk for malignancy should undergo follow-up CT imaging within 3-12 months, with patients who smoke and have large nodules requiring closer follow up.
The failure to follow-up on abnormal test results is known to contribute to diagnostic error and can lead to patient harm.3 We sought to determine the proportion of high-risk pulmonary nodules on CTPA which did not undergo the recommended follow-up imaging.
Study Setting and Design
This retrospective cohort study included all patients who underwent CTPA in the emergency department (ED) and inpatient settings at three academic health centers (Mount Sinai Hospital, Toronto General Hospital, and Toronto Western Hospital) in Toronto, Canada between September 1, 2014, and August 31, 2015.
We examined the proportion of patients with pulmonary nodules requiring follow up who received repeat CT imaging within six weeks of the time frame recommended by the radiologist. Since we were interested in measuring the rate of an important test result that is missed (rather than accuracy of the test itself), we defined “requiring follow up” as the inclusion of explicit recommendations for follow up in the radiology report.
Montage (Philadelphia, Pennsylvania), a natural language processing software, was applied to a linked radiology information system (RIS) to identify all CTPAs that contained pulmonary nodules. We conducted manual chart review to confirm software accuracy. We initially searched the RIS for all CTPAs that were completed within the study period, resulting in the identification of 1932 imaging studies. Following a review of these 1,932 studies, we excluded 22 as they were not CTPAs. We then applied the search term, “nodule-” to 1,910 confirmed CTPAs, resulting in the identification of 836 imaging studies. Following a review of these 836 studies, we excluded 10 as they were duplicate studies. We also excluded 152 studies where the term “nodule-” did not identify a pulmonary nodule but instead referred to a radiologist reporting the absence of pulmonary nodules (eg “there were no pulmonary nodules found”) or the presence of non-lung nodules (eg thyroid nodules). This resulted in the identification of 674 CTPAs containing pulmonary nodules (Figure 1).
Thereafter, we generated a cohort with possible new lung malignancy eligible for follow-up imaging by reviewing available health records and applying the following prespecified exclusion criteria: (1) patients who died, (2) left against medical advice, (3) were critically ill during the follow-up period, (4) lived outside the hospital catchment area (Greater Toronto Area), (5) were seen in the outpatient setting, (6) identified as palliative, (7) had an active malignancy, (8) had nodules that were already being followed, or (9) had nodules with characteristics suggestive of alternate diagnoses to lung malignancy (such as infection or inflammation) with no follow up recommended as reported by the radiologist. For patients with multiple CTPAs, we included only the first study. For each eligible patient, we determined whether follow-up imaging was completed by manually reviewing the linked RIS. We reviewed available health records to determine whether the pulmonary nodule findings had been discussed with the patient and whether the patient had attended an outpatient follow-up visit. In patients for whom recommended follow-up imaging was not confirmed, we notified the ordering physician by e-mail.
Each radiology department followed the same protocol adherent to the 2005 Fleischner guidelines for identifying nodules requiring follow up.2 Virtually all CTPAs at the three study institutions are read and reported within 72 hours. The ordering physician is sometimes called at the discretion of the reading radiologist when the findings are judged to be urgent and time-sensitive in nature. For example, the ordering physician may be contacted if a CTPA is positive for segmental PE but is not typically called for incidental pulmonary nodules. It is not common practice for ordering physicians to be notified of incidental findings above and beyond the radiology report. Primary care physicians are not typically copied on radiology reports and usually do not use the same electronic health record.
Statistical Analysis
We calculated simple descriptive statistics for all results. Mean values were compared using two-tailed t-tests, categorical groups using chi-square tests, and median values using Mann-Whitney U tests. We performed all analyses using Microsoft Excel version 16.14.1 (Redmond, Washington).
Ethics Approval
This study was approved by each institution’s research ethics board.
RESULTS
Follow Up of Incidental High-Risk Pulmonary Nodules
Of the 1910 CTPAs performed over the study period (Figure), 674 (35.3%) contained pulmonary nodules. Of the 259 patients with new pulmonary nodules eligible for follow-up imaging, 194 (74.9%) did not have an explicit suggestion for follow up by the radiologist. Ninety-five percent of radiologists (184 out of 194) provided an explanation for not recommending follow up in the radiology report; the two most common reasons were small nodule size (often described as “tiny”) and no interval change compared with the prior imaging study.2 Of the 65 patients who did receive an explicit suggestion for follow up by radiology, 35 (53.8%) did not receive repeat imaging within the recommended time frame, allowing for a six-week grace period. Of these 35 patients, 10 eventually went on to receive delayed repeat imaging. The median follow-up time for the 30 patients who received timely repeat imaging was four months (IQR 2-6 months); in contrast, the median follow-up time for the 10 patients who received delayed repeat imaging was seven months (IQR 6-8 months), P = .01.
Of the 65 patients for whom follow up was recommended, the medical record showed evidence that there was a discussion between the medical team and the patient regarding patient preference for or against follow up in 55.4% (36 out of 65) of the patients. Notably, all 36 patients showed interest in receiving follow up; no patient indicated a preference for no follow up.
Furthermore, of the 65 patients that had follow up recommended, two patients were eventually diagnosed with lung cancer (one via lung biopsy, the other via positron emission tomography imaging); both patients did not receive timely follow-up imaging. While we did not include nodule size as an exclusion criterion, not one of the 65 patients included in the final cohort had nodules larger than 3 cm.
Physician Notification
In circumstances where we could not confirm that followed up had occurred, we notified the ordering physician by e-mail. Since 10 of the 35 patients who did not receive timely follow-up imaging went on to receive delayed repeat imaging, we notified 25 physicians. Of the 25 physicians that we e-mailed, 24 acknowledged receipt of the information. Of these 24 physicians, 14 reported conducting a detailed review of the chart, from which the following additional information was obtained: one patient expired, and five physicians notified the corresponding primary care physicians (two of whom were unaware of the nodule, and subsequently arranged further follow up with the patient).
Characteristics Associated with Timely Follow Up
Explicit mention that follow up was required in the discharge summary (P = .03), attending an outpatient follow-up visit (P < .001), and younger age (P = .03) were associated with receiving timely follow up; patient sex, smoking history, history of chronic obstructive pulmonary disease, lung nodule count, recommended follow-up time, and hospital department (defined as the discharging service) were not (Table).
DISCUSSION
In this multicenter cohort study, over 50% of patients with new high-risk pulmonary nodules detected incidentally on CTPA did not receive timely follow-up imaging. Including follow-up recommendations in the discharge summary, attending an outpatient follow-up visit, and younger age were associated with timely follow-up imaging.
Few studies have assessed the follow up of incidental nodules identified on CTPA. In a retrospective cohort study of ED patients in the United States, Blagev et al. found that only 29% received timely follow up.4 Our study contributes to the literature in several ways. First, our study included all hospitalized patients, not only those in the ED. Notably, most of our cohort were inpatients, a group of patients not previously described. Second, we examined factors associated with timely follow up, which may help to inform future quality improvement initiatives and interventions. Third, we included data from three different hospitals, which may improve generalization. Lastly, our study draws on contemporary Canadian data. Most of the studies investigating test result follow up have been conducted in the US5,6 and Europe,7 with few empirical studies describing this phenomenon within the Canadian healthcare setting. We believe that our work contributes to the existing evidence that missed test results occur across diverse healthcare systems and have yet to be solved.5-7
Our study had limitations. First, we defined follow up as repeat imaging and did not include office visits or biopsy in this definition. Second, we may have missed repeat imaging and outpatient follow-up visits that occurred outside the study hospitals. Although we were able to determine if repeat imaging and outpatient follow-up visits (eg, pulmonology or thoracic surgery clinics) had occurred within the study hospitals, we did not have access to follow-up encounters that occurred outside of the study hospitals (eg primary care clinics). We are unaware of any published regional data on the rate of outpatient follow up at the index facility following discharge. However, we know from provincial data of patients discharged from the ED with a new cardiac diagnosis that just under half are seen by a family physician, cardiologist, or internist within seven days, with just under 80% seen within 30 days.8 Third, although we attempted to capture patient preference for or against repeat imaging using chart review, the absence of documentation of patient preference did not confirm that a discussion regarding patient preferences had not occurred. Fourth, while we did exclude patients that had an active malignancy, we did not exclude patients who were younger than 35 years or were immunocompromised, which may have led to an overestimation of the percentage of patients who did not receive follow up.
Incidental findings detected on acute diagnostic tests requiring handoffs for chronic follow up are at risk of falling through the cracks. The inclusion of follow-up recommendations in discharge summaries has been shown to increase the likelihood of follow-up completion.9 Our study provides additional evidence of the urgent need for interventions aimed at closing the loop on test result follow up.5,6
Disclosures
None of the authors have any conflicts of interest to disclose in reference to this study.
Funding
JLK is supported by the Mount Sinai Hospital Department of Medicine Research Fund. PC is supported by a K24 award from the National Institute of Arthritis and Musculoskeletal and Skin Diseases (AR062133).
1. Hall WB, Truitt SG, Scheunemann LP, et al. The prevalence of clinically relevant incidental findings on chest computed tomographic angiograms ordered to diagnose pulmonary embolism. Arch Intern Med 2009;169(21):1961. doi: 10.1001/archinternmed.2009.360. PubMed
2. Macmahon H, Austin JHM, Gamsu G, et al. Guidelines for Management of Small Pulmonary Nodules Detected on CT Scans: A Statement from the Fleischner Society. Radiology 2005;237(2):395-400. doi: 10.1148/radiol.2372041887. PubMed
3. National Academies of Sciences, Engineering, and Medicine. Improving diagnosis in health care. Washington, DC. 2015. PubMed
4. Blagev DP, Lloyd JF, Conner K, et al. Follow-up of incidental pulmonary nodules and the radiology report. J Am Coll Radiol 2014;11(4):378-383. doi: 10.1016/j.jacr.2013.08.003. PubMed
5. Callen J, Georgiou A, Li J, Westbrook JI. The safety implications of missed test results for hospitalized patients: a systematic review. BMJ Quality Safety 2011;20(2):194-199. doi: 10.1136/bmjqs.2010.044339.
6. Callen JL, Westbrook JI, Georgiou A, Li J. Failure to follow-up test results for ambulatory patients: a systematic review. J Gen Intern Med 2011;27(10):1334-1348. doi: 10.1007/s11606-011-1949-5. PubMed
7. Litchfield I, Bentham L, Lilford R, Mcmanus RJ, Hill A, Greenfield S. Test result communication in primary care: a survey of current practice. BMJ Quality Safety 2015;24(11):691-699. doi: 10.1136/bmjqs-2014-003712. PubMed
8. Atzema CL, Yu B, Ivers NM, et al. Predictors of obtaining follow-up care in the province of Ontario, Canada, following a new diagnosis of atrial fibrillation, heart failure, and hypertension in the emergency department. Cjem 2017;20(03):377-391. doi: 10.1017/cem.2017.371. PubMed
9. Moore C, McGinn T, Halm E. Tying up loose ends: Discharging patients with unresolved medical issues. Arch Intern Med 2007;167(12):1305-1311. doi: 10.1001/archinte.167.12.1305 PubMed
© 2019 Society of Hospital Medicine
Prior Opioid use Among Veterans
Recent trends show a marked increase in outpatient use of chronic opioid therapy (COT) for chronic noncancer pain (CNCP)[1, 2] without decreases in reported CNCP,[3] raising concerns about the efficacy and risk‐to‐benefit ratio of opioids in this population.[4, 5, 6, 7, 8] Increasing rates of outpatient use likely are accompanied by increasing rates of opioid exposure among patients admitted to the hospital. To our knowledge there are no published data regarding the prevalence of COT during the months preceding hospitalization.
Opioid use has been linked to increased emergency room utilization[9, 10] and emergency hospitalization,[11] but associations between opioid use and inpatient metrics (eg, mortality, readmission) have not been explored. Furthermore, lack of knowledge about the prevalence of opioid use prior to hospitalization may impede efforts to improve inpatient pain management and satisfaction with care. Although there is reason to expect that strategies to safely and effectively treat acute pain during the inpatient stay differ between opioid‐nave patients and opioid‐exposed patients, evidence regarding treatment strategies is limited.[12, 13, 14] Opioid pain medications are associated with hospital adverse events, with both prior opioid exposure and lack of opioid use as proposed risk factors.[15] A better understanding of the prevalence and characteristics of hospitalized COT patients is fundamental to future work to achieve safer and more effective inpatient pain management.
The primary purpose of this study was to determine the prevalence of prior COT among hospitalized medical patients. Additionally, we aimed to characterize inpatients with occasional and chronic opioid therapy prior to admission in comparison to opioid‐nave inpatients, as differences between these groups may suggest directions for further investigation into the distinct needs or challenges of hospitalized opioid‐exposed patients.
METHODS
We used inpatient and outpatient administrative data from the Department of Veterans Affairs (VA) Healthcare System. The primary data source to identify acute medical admissions was the VA Patient Treatment File, a national administrative database of all inpatient admissions, including patient demographic characteristics, primary and secondary diagnoses (using International Classification of Diseases, 9th Revision, Clinical Modification [ICD‐9‐CM], codes), and hospitalization characteristics. Outpatient pharmacy data were from the VA Pharmacy Prescription Data Files. The VA Vital Status Files provided dates of death.
We identified all first acute medical admissions to 129 VA hospitals during fiscal years (FYs) 2009 to 2011 (October 2009September 2011). We defined first admissions as the initial medical hospitalization occurring following a minimum 365‐day hospitalization‐free period. Patients were required to demonstrate pharmacy use by receipt of any outpatient medication from the VA on 2 separate occasions within 270 days preceding the first admission, to avoid misclassification of patients who routinely obtained medications only from a non‐VA provider. Patients admitted from extended care facilities were excluded.
We grouped patients by opioid‐use status based on outpatient prescription records: (1) no opioid use, defined as no opioid prescriptions in the 6 months prior to hospitalization; (2) occasional opioid use, defined as patients who received any opioid prescription during the 6 months prior but did not meet definition of chronic use; and (3) chronic opioid therapy, defined as 90 or more days' supply of opioids received within 6 months preceding hospitalization. We did not specify continuous prescribing. Opioids included in the definition were codeine, dihydrocodeine, fentanyl (mucosal and topical), hydrocodone, hydromorphone, meperidine, methadone, morphine, oxycodone, oxymorphone, pentazocine, propoxyphene, tapentadol, and tramadol.[16, 17]
We compared groups by demographic variables including age, sex, race, income, rural vs urban residence (determined from Rural‐Urban Commuting Area codes), region based on hospital location; overall comorbidity using the Charlson Comorbidity Index (CCI);[18] and 10 selected conditions to characterize comorbidity (see Supporting Information, Appendix A, in the online version of this article). These 10 conditions were chosen based on probable associations with chronic opioid use or high prevalence among hospitalized veterans.[9, 19, 20]
We used a CNCP definition based on ICD‐9‐CM codes.[9] This definition did not include episodic conditions such as migraine[2] or a measure of pain intensity.[21] All conditions were determined from diagnoses coded during any encounter in the year prior to hospitalization, exclusive of the first (ie, index) admission. We also determined the frequency of palliative care use, defined as presence of ICD‐9‐CM code V667 during index hospitalization or within the past year. Patients with palliative care use (n=3070) were excluded from further analyses.
We compared opioid use groups by baseline characteristics using the [2] statistic to determine if the distribution was nonrandom. We used analysis of variance to compare hospital length of stay between groups. We used the [2] statistic to compare rates of 4 outcomes of interest: intensive care unit (ICU) admission during the index hospitalization, discharge disposition other than home, 30‐day readmission rate, and in‐hospital or 30‐day mortality.
To assess the association between opioid‐use status and the 4 outcomes of interest, we constructed 2 multivariable regression models; the first was adjusted only for admission diagnosis using the Clinical Classification Software (CCS),[22] and the second was adjusted for demographics, CCI, and the 10 selected comorbidities in addition to admission diagnosis.
The authors had full access to and take full responsibility for the integrity of the data. All analyses were conducted using SAS statistical software version 9.2 (SAS Institute, Cary, NC). The study was approved by the University of Iowa institutional review board and the Iowa City VA Health Care System Research and Development Committee.
RESULTS
Patient Demographics
Demographic characteristics of patients differed by opioid‐use group (Table 1). Hospitalized patients who received COT in the 6 months prior to admission tended to be younger than their comparators, more often female, white, have a rural residence, and live in the South or West.
| Variables | No Opioids, n=66,899 (54.5%) | Occasional Opioids, n=24,093 (19.6%) | Chronic Opioids, n=31,802 (25.9%) |
|---|---|---|---|
| |||
| Age, y, mean (SD) | 68.7 (12.8) | 66.5 (12.7) | 64.5 (11.5) |
| Age, n (%) | |||
| 59 (reference) | 15,170 (22.7) | 6,703 (27.8) | 10,334 (32.5) |
| 6065 | 15,076 (22.5) | 5,973 (24.8) | 8,983 (28.3) |
| 6677 | 17,226 (25.8) | 5,871 (24.4) | 7,453 (23.4) |
| 78 | 19,427 (29.0) | 5,546 (23.0) | 5,032 (15.8) |
| Male, n (%) | 64,673 (96.7) | 22,964 (95.3) | 30,200 (95.0) |
| Race, n (%) | |||
| White | 48,888 (73.1) | 17,358 (72.1) | 25,087 (78.9) |
| Black | 14,480 (21.6) | 5,553 (23.1) | 5,089 (16.0) |
| Other | 1,172 (1.8) | 450 (1.9) | 645 (2.0) |
| Unknown | 2,359 (3.5) | 732 (3.0) | 981 (3.1) |
| Income $20,000, n (%) | 40,414 (60.4) | 14,105 (58.5) | 18,945 (59.6) |
| Rural residence, n (%) | 16,697 (25.0) | 6,277 (26.1) | 9,356 (29.4) |
| Region, n (%) | |||
| Northeast | 15,053 (22.5) | 4,437 (18.4) | 5,231 (16.5) |
| South | 24,083 (36.0) | 9,390 (39.0) | 12,720 (40.0) |
| Midwest | 16,000 (23.9) | 5,714 (23.7) | 7,762 (24.4) |
| West | 11,763 (17.6) | 4,552 (18.9) | 6,089 (19.2) |
| Charlson Comorbidity Index, mean (SD) | 2.3 (2.0) | 2.6 (2.3) | 2.7 (2.3) |
| Comorbidities, n (%) | |||
| Cancer (not metastatic) | 11,818 (17.7) | 5,549 (23.0) | 6,874 (21.6) |
| Metastatic cancer | 866 (1.3) | 733 (3.0) | 1,104 (3.5) |
| Chronic pain | 25,748 (38.5) | 14,811 (61.5) | 23,894 (75.1) |
| COPD | 20,750 (31.0) | 7,876 (32.7) | 12,117 (38.1) |
| Diabetes, complicated | 10,917 (16.3) | 4,620 (19.2) | 6,304 (19.8) |
| Heart failure | 14,267 (21.3) | 5,035 (20.9) | 6,501 (20.4) |
| Renal disease | 11,311 (16.9) | 4,586 (19.0) | 4,981 (15.7) |
| Dementia | 2,180 (3.3) | 459 (1.9) | 453 (1.4) |
| Mental health other than PTSD | 33,390 (49.9) | 13,657 (56.7) | 20,726 (65.2) |
| PTSD | 7,216 (10.8) | 3,607 (15.0) | 5,938 (18.7) |
| Palliative care use, n (%) | 1,407 (2.1) | 639 (2.7) | 1,024 (3.2) |
Prevalence of Opioid Use
Among the cohort (N=122,794) of hospitalized veterans, 66,899 (54.5%) received no opioids from the VA during the 6‐month period prior to hospitalization; 31,802 (25.9%) received COT in the 6 months prior to admission. An additional 24,093 (19.6%) had occasional opioid therapy (Table 1). A total of 257,623 opioid prescriptions were provided to patients in the 6‐month period prior to their index hospitalization. Of these, 100,379 (39.0%) were for hydrocodone, 48,584 (18.9%) for oxycodone, 36,658 (14.2%) for tramadol, and 35,471 (13.8%) for morphine. These 4 medications accounted for 85.8% of total opioid prescriptions (see Supporting Information, Appendix B, in the online version of this article).
Among the COT group, 3610 (11.4%) received opioids 90 days, 10,110 (31.8%) received opioids between 91 and 179 days, and 18,082 (56.9%) patients received opioids 180 days in the prior 6 months (see Supporting Information, Appendix C, in the online version of this article).
Among the subset of patients with cancer (metastatic and nonmetastatic, n=26,944), 29.6% were prescribed COT, and 23.3% had occasional opioid use. Among the subset of patients with CNCP (n=64,453), 37.1% were prescribed COT, and 23.0% had occasional opioid use.
Comorbid Conditions
Compared to patients not receiving opioids, a larger proportion of patients receiving both occasional and chronic opioids had diagnoses of cancer and of CNCP. Diagnoses more common in COT patients included chronic obstructive pulmonary disease (COPD), complicated diabetes, post‐traumatic stress disorder (PTSD), and other mental health disorders. In contrast, COT patients were less likely than no‐opioid and occasional opioid patients to have heart failure (HF), renal disease, and dementia. Palliative care was used by 2.1% of patients in the no‐opioid group, and 3.2% of patients in the COT group (Table 1). Renal disease was most common among the occasional‐use group.
Unadjusted Hospitalization Outcomes
Unadjusted hospitalization outcomes differed between opioid‐exposure groups (Table 2). Patients receiving occasional or chronic opioids had shorter length of stay and lower rates of non‐home discharge than did patients without any opioid use. The rate of death during hospitalization or within 30 days did not differ between groups. The occasional‐use and COT groups had higher 30‐day readmission rates than did the no‐use group.
| No Opioids, n=65,492 | Occasional Opioids, n=23,454 | Chronic Opioids, n=30,778 | P | |
|---|---|---|---|---|
| ||||
| Hospital length of stay, d, mean (SD) | 4.7 (5.1) | 4.5 (4.8) | 4.5 (4.8) | 0.0003 |
| ICU stay, n (%) | 10,281 (15.7) | 3,299 (14.1) | 4,570 (14.9) | <0.0001 |
| Non‐home discharge, n (%) | 2,944 (4.5) | 997 (4.3) | 1,233 (4.0) | 0.0020 |
| 30‐day readmission, n (%) | 9,023 (13.8) | 3,629 (15.5) | 4,773 (15.5) | <0.0001 |
| Death during hospitalization or within 30 days, n (%) | 2,532 (3.9) | 863 (3.7) | 1,191 (3.9) | 0.4057 |
Multivariable Models
In the fully adjusted multivariable models, opioid exposure (in the form of either chronic or occasional use) had no significant association with ICU stay during index admission or non‐home discharge (Table 3). Both the occasional‐opioid use and COT groups were more likely to experience 30‐day hospital readmission, a relationship that remained consistent across the partially and fully adjusted models. The occasional‐opioid use group saw no increased mortality risk. In the model adjusted only for admission diagnosis, COT was not associated with increased mortality risk. When additionally adjusted for demographic variables, CCI, and selected comorbidities, however, COT was associated with increased risk of death during hospitalization or within 30 days (odds ratio: 1.19, 90% confidence interval: 1.10‐1.29).
| Occasional Opioid Use | Chronic Opioid Therapy | |||
|---|---|---|---|---|
| Model 1, OR (95% CI) | Model 2, OR (95% CI) | Model 1, OR (95% CI) | Model 2, OR (95% CI) | |
| ||||
| ICU stay | 0.94 (0.90‐0.99) | 0.95 (0.91‐1.00) | 1.00 (0.96‐1.04) | 1.01 (0.97‐1.05) |
| Non‐home discharge | 0.92 (0.85‐0.99) | 0.97 (0.90‐1.05) | 0.85 (0.80‐0.92) | 0.95 (0.88‐1.03) |
| 30‐day readmission | 1.14 (1.09‐1.19) | 1.14 (1.09‐1.19) | 1.14 (1.10‐1.19) | 1.15 (1.10‐1.20) |
| Death during hospitalization or within 30 days | 0.96 (0.88‐1.04) | 1.04 (0.95‐1.13) | 0.96 (0.90‐1.04) | 1.19 (1.10‐1.29) |
DISCUSSION
This observational study is, to our knowledge, the first to report prevalence of and characteristics associated with prior opioid use among hospitalized medical patients. The prevalence of any opioid use and of COT was substantially higher in this hospitalized cohort than reported in outpatient settings. The prevalence of any opioid use during 1 year (FY 2009) among all veterans with VA primary care use was 26.1%.[23] A study of incident prescribing rates among veterans with new diagnoses of noncancer‐related pain demonstrated 11% received an opioid prescription within 1 year.[24] Using a definition of 90 consecutive prescription days to define COT, Dobscha et al.[25] found that 5% of veterans with persistent elevated pain intensity and no previous opioid prescriptions subsequently received COT within 12 months. The high prevalence we found likely reflects cumulative effects of incident use as well as an increased symptom burden in a population defined by need for medical hospitalization.
Although a veteran population may not be generalizable to a nonveteran setting, we do note prior studies reporting prevalence of any opioid use in outpatient cohorts (in 2000 and 2005) of between 18% and 30%, with higher rates among women and patients over 65 years of age.[1, 2]
Our work was purposefully inclusive of cancer patients so that we might assess the degree to which cancer diagnoses accounted for prior opioid use in hospitalized patients. Surprisingly, the rate of COT for patients with cancer was lower than that for patients with CNCP, perhaps reflecting that a cancer condition defined in administrative data may not constitute a pain‐causing disease.
Recognition of the prevalence of opioid therapy is important as we work to understand and improve safety, satisfaction, utilization, and long‐term health outcomes associated with hospitalization. Our finding that over half of medical inpatients have preexisting CNCP diagnoses, and a not entirely overlapping proportion has prior opioid exposure, implies a need for future work to refine expectations and strategies for inpatient management, potentially tailored to prior opioid use and presence of CNCP.
A recent Joint Commission sentinel event alert[26] highlights opioid adverse events in the hospital and identifies both lack of previous opioid therapy and prior opioid therapy as factors increasing risk. ICU admission during the hospital stay may reflect adverse events such as opioid‐induced respiratory depression; in our study, patients with no opioid use prior to admission were more likely to have an ICU stay, although the effect was small. One might speculate that clinicians, accustomed to treating pain in opioid‐exposed patients, are using inappropriately large starting dosages of narcotics for inpatients without first assessing prior opioid exposure. Another possible explanation is that patients on COT are admitted to the hospital with less severe illness, potentially reflecting functional, social, or access limitations that compromise ability to manage illness in the outpatient setting. More detailed comparison of illness severity is beyond the scope of the present work.
Patient satisfaction with pain management is reflected in 2 of the Hospital Consumer Assessment of Healthcare Providers and Systems (HCAHPS) questions, and is publically reported.[27] HCAHPS results also figure in the formula for the Centers for Medicare and Medicaid Services value‐based purchasing.[28] Preadmission pain is predictive of postoperative pain[29, 30] and may shape patient expectations; how preadmission opioid use modulates nonsurgical pain and satisfaction with management in the medical inpatient remains to be studied. The high prevalence of prior COT underscores the importance of understanding characteristics of patients on COT, and potential differences and disparities in pain management, when designing interventions to augment patient satisfaction with pain management.
Although the age distribution and patterns of comorbidities differed between the opioid‐use groups, opioid therapy remained a small but significant predictor of hospital readmission; this association was independent of CNCP diagnosis. Functional outcomes are recognized as important measures of efficacy of outpatient pain management strategies,[31] with some evidence that opioids are associated with worse functioning.[32, 33] Functional limitations, as well as inadequately or inappropriately treated pain, may drive both admissions and readmissions. Alternately, COT may be a marker for unmeasured factors that increase a patient's risk of returning to the hospital. Further work is needed to elucidate the relationship between COT and healthcare utilization associated with the inpatient stay.
Our finding that patients on COT have an increased mortality risk is concerning, given the rapid expansion in use of these medications. Although pain is increasingly prevalent toward end of life,[34] we did not observe an association between either CNCP (data not shown) or occasional opioid use and mortality. COT may complicate chronic disease through adverse drug effects including respiratory depression, apnea, or endocrine or immune alteration. Complex chronically ill patients with conditions such as COPD, HF, or diabetes may be particularly susceptible to these effects. Incident use of morphine is associated with increased mortality in acute coronary syndrome and HF[35, 36]: we are not aware of any work describing the relationship between prior opioid use and incident use during hospitalization in medical patients.
Limitations
Our work focuses on hospitalized veterans, a population that remains predominately male, limiting generalizability of the findings. Rates of mental health diagnoses and PTSD, associated with CNCP and COT,[24, 37] are higher in this population than would be expected in a general hospitalized population. Because our outcomes included readmission, and our definition of opioid exposure was designed to reflect outpatient prescribing, we included only patients without recent hospitalization. Therefore, our results may not be generalizable to patients with frequent and recurring hospitalization.
Our definition of opioid exposure depended on pharmacy dispensing records; we are not able to confirm if veterans were taking the medications as prescribed. Further, we were not able to capture data on opioids prescribed by non‐VA providers, which may have led to underestimation of prevalence.
Our definitions of COT and CNCP are imperfect, and should be noted when comparing to other studies. Because we did not specify continuous 90‐day prescribing, we may have misclassified occasional opioid therapy as COT in comparison to other authors. That continuous prescribing is equivalent to continuous use assumes that patients take medications exactly as prescribed. We used occasional opioid therapy as a comparison group, and detailed the distribution of days prescribed among the COT group (see Supporting Information, Appendix C, in the online version of this article), to augment interpretability of these results. Our CNCP diagnosis was less inclusive than others,[2] as we omitted episodic pain (eg, migraine and sprains) and human immunodeficiency virus‐related pain. As COT for CNCP conditions lacks a robust evidence base,[38] defining pain diagnoses using administrative data to reflect conditions for which COT is used in a guideline‐concordant way remains difficult.
Last, differences observed between opioid‐use groups may be due to an unmeasured confounder not captured by the variables we included. Specifically, we did not include other long‐term outpatient medications in our models. It is possible that COT is part of a larger context of inappropriate prescribing, rather than a single‐medication effect on outcomes studied.
CONCLUSION
Nearly 1 in 4 hospitalized veterans has current or recent COT at the time of hospital admission for nonsurgical conditions; nearly half have been prescribed any opioids. Practitioners designing interventions to improve pain management in the inpatient setting should account for prior opioid use. Patients who are on COT prior to hospitalization differ in age and comorbidities from their counterparts who are not on COT. Further elucidation of differences between opioid‐use groups may help providers address care needs during the transition to posthospitalization care. CNCP diagnoses and chronic opioid exposure are different entities and cannot serve as proxies in administrative data. Additional work on utilization and outcomes in specific patient populations may improve our understanding of the long‐term health effects of chronic opioid therapy.
Disclosures: Dr. Mosher is supported by the Veterans Administration (VA) Quality Scholars Fellowship, Office of Academic Affiliations, Department of Veterans Affairs. Dr. Cram is supported by a K24 award from NIAMS (AR062133) at the National Institutes of Health. The preliminary results of this article were presented at the Society of General Internal Medicine Annual Meeting in Denver, Colordao, April 2013. The views expressed in this article are those of the authors and do not necessarily represent the views of the Department of Veterans Affairs. Data are available to researchers with VA accreditation, the statistical code and the protocol are available to interested readers by contacting Dr. Mosher. The authors report no conflict of interest in regard to this study.
- , , , et al. Age and gender trends in long‐term opioid analgesic use for noncancer pain. Am J Public Health. 2010;100:2541–2547.
- , , , , , . Trends in use of opioids for non‐cancer pain conditions 2000–2005 in commercial and Medicaid insurance plans: the TROUP study. Pain. 2008;138:440–449.
- Institute of Medicine (US) Committee on Advancing Pain Research, Care, and Education. Relieving pain in America: a blueprint for transforming prevention, care, education, and research. Washington, DC: National Academies Press; 2011.
- , , , . Long‐term opioid therapy reconsidered. Ann Intern Med. 2011;155:325–328.
- , . What are we treating with long‐term opioid therapy? Arch Intern Med. 2012;172:433–434.
- , , , . Opioids for chronic noncancer pain: a meta‐analysis of effectiveness and side effects. CMAJ. 2006;174:1589–1594.
- , , , . Opioids in chronic non‐cancer pain: systematic review of efficacy and safety. Pain. 2004;112:372–380.
- , , , et al. A systematic review of randomized trials of long‐term opioid management for chronic non‐cancer pain. Pain Physician. 2011;14:91–121.
- , , , , , . Rates of adverse events of long‐acting opioids in a state Medicaid program. Ann Pharmacother. 2007;41:921–928.
- , , , et al. Emergency department visits among recipients of chronic opioid therapy. Arch Intern Med. 2010;170:1425–1432.
- , , , . Emergency hospitalizations for adverse drug events in older Americans. N Engl J Med. 2011;365:2002–2012.
- , . Assessment and management of acute pain in adult medical inpatients: a systematic review. Pain Med. 2009;10:1183–1199.
- , , , . Acute pain management in opioid‐tolerant patients: a growing challenge. Anaesth Intensive Care. 2011;39:804–823.
- , , , . Acute pain management of the chronic pain patient on opiates: a survey of caregivers at University of Washington Medical Center. Clin J Pain. 1994;10:133–138.
- The Joint Commission and the FDA take steps to curb adverse events related to the use and misuse of opioid drugs. ED Manag. 2012;24:112–116.
- , . Tramadol. CMAJ. 2013;185:E352.
- , , , , . Prescription opioid abuse in the United Kingdom. Br J Clin Pharmacol. 2013;76:823–824.
- , , , . Validation of a combined comorbidity index. J Clin Epidemiol. 1994;47:1245–1251.
- , , , , . Bringing the war back home: mental health disorders among 103,788 US veterans returning from Iraq and Afghanistan seen at Department of Veterans Affairs facilities. Arch Intern Med. 2007;167:476–482.
- , , , et al. Coding algorithms for defining comorbidities in ICD‐9‐CM and ICD‐10 administrative data. Med Care. 2005;43:1130–1139.
- , , , , , . Sex Differences in the medical care of VA patients with chronic non‐cancer pain [published online ahead of print June 26, 2013]. Pain Med. doi: 10.1111/pme.12177.
- Agency for Healthcare Research and Quality. Clinical Classifications Software (CCS) for ICD‐9‐CM. Available at: http://www.hcup‐us.ahrq.gov/toolssoftware/ccs/ccs.jsp. Accessed October 17, 2013.
- , , , et al. Predicting risk of hospitalization or death among patients receiving primary care in the Veterans Health Administration. Med Care. 2013;51:368–373.
- , , , et al. Association of mental health disorders with prescription opioids and high‐risk opioid use in US veterans of Iraq and Afghanistan. JAMA. 2012;307:940–947.
- , , , , . Correlates of prescription opioid initiation and long‐term opioid use in veterans with persistent pain. Clin J Pain. 2013;29:102–108.
- Safe use of opioids in hospitals. Sentinel Event Alert. 2012;49:1–5.
- Centers for Medicare (2):2–9.
- , , , , , . The risk of severe postoperative pain: modification and validation of a clinical prediction rule. Anesth Analg. 2008;107:1330–1339.
- , , , et al. Preoperative predictors of moderate to intense acute postoperative pain in patients undergoing abdominal surgery. Acta Anaesthesiol Scand. 2002;46:1265–1271.
- , , , , , . Successful and unsuccessful outcomes with long‐term opioid therapy: a survey of physicians' opinions. J Palliat Med. 2006;9:50–56.
- , , , . Opioid use among low back pain patients in primary care: is opioid prescription associated with disability at 6‐month follow‐up? Pain. 2013;154:1038–1044.
- , , , , ; Disability Risk Identification Study Cohort. Early opioid prescription and subsequent disability among workers with back injuries: the Disability Risk Identification Study Cohort. Spine (Phila Pa 1976). 2008;33:199–204.
- , , , et al. The epidemiology of pain during the last 2 years of life. Ann Intern Med. 2010;153:563–569.
- , , , et al. Association of intravenous morphine use and outcomes in acute coronary syndromes: results from the CRUSADE Quality Improvement Initiative. Am Heart J. 2005;149:1043–1049.
- , , , et al. Use of intravenous morphine for acute decompensated heart failure in patients with and without acute coronary syndromes. Acute Card Care. 2011;13:76–80.
- , , , et al. VA mental health services utilization in Iraq and Afghanistan veterans in the first year of receiving new mental health diagnoses. J Trauma Stress. 2010;23:5–16.
- , , , et al. Long‐term opioid management for chronic noncancer pain. Cochrane Database Syst Rev. 2010;(1):CD006605.
Recent trends show a marked increase in outpatient use of chronic opioid therapy (COT) for chronic noncancer pain (CNCP)[1, 2] without decreases in reported CNCP,[3] raising concerns about the efficacy and risk‐to‐benefit ratio of opioids in this population.[4, 5, 6, 7, 8] Increasing rates of outpatient use likely are accompanied by increasing rates of opioid exposure among patients admitted to the hospital. To our knowledge there are no published data regarding the prevalence of COT during the months preceding hospitalization.
Opioid use has been linked to increased emergency room utilization[9, 10] and emergency hospitalization,[11] but associations between opioid use and inpatient metrics (eg, mortality, readmission) have not been explored. Furthermore, lack of knowledge about the prevalence of opioid use prior to hospitalization may impede efforts to improve inpatient pain management and satisfaction with care. Although there is reason to expect that strategies to safely and effectively treat acute pain during the inpatient stay differ between opioid‐nave patients and opioid‐exposed patients, evidence regarding treatment strategies is limited.[12, 13, 14] Opioid pain medications are associated with hospital adverse events, with both prior opioid exposure and lack of opioid use as proposed risk factors.[15] A better understanding of the prevalence and characteristics of hospitalized COT patients is fundamental to future work to achieve safer and more effective inpatient pain management.
The primary purpose of this study was to determine the prevalence of prior COT among hospitalized medical patients. Additionally, we aimed to characterize inpatients with occasional and chronic opioid therapy prior to admission in comparison to opioid‐nave inpatients, as differences between these groups may suggest directions for further investigation into the distinct needs or challenges of hospitalized opioid‐exposed patients.
METHODS
We used inpatient and outpatient administrative data from the Department of Veterans Affairs (VA) Healthcare System. The primary data source to identify acute medical admissions was the VA Patient Treatment File, a national administrative database of all inpatient admissions, including patient demographic characteristics, primary and secondary diagnoses (using International Classification of Diseases, 9th Revision, Clinical Modification [ICD‐9‐CM], codes), and hospitalization characteristics. Outpatient pharmacy data were from the VA Pharmacy Prescription Data Files. The VA Vital Status Files provided dates of death.
We identified all first acute medical admissions to 129 VA hospitals during fiscal years (FYs) 2009 to 2011 (October 2009September 2011). We defined first admissions as the initial medical hospitalization occurring following a minimum 365‐day hospitalization‐free period. Patients were required to demonstrate pharmacy use by receipt of any outpatient medication from the VA on 2 separate occasions within 270 days preceding the first admission, to avoid misclassification of patients who routinely obtained medications only from a non‐VA provider. Patients admitted from extended care facilities were excluded.
We grouped patients by opioid‐use status based on outpatient prescription records: (1) no opioid use, defined as no opioid prescriptions in the 6 months prior to hospitalization; (2) occasional opioid use, defined as patients who received any opioid prescription during the 6 months prior but did not meet definition of chronic use; and (3) chronic opioid therapy, defined as 90 or more days' supply of opioids received within 6 months preceding hospitalization. We did not specify continuous prescribing. Opioids included in the definition were codeine, dihydrocodeine, fentanyl (mucosal and topical), hydrocodone, hydromorphone, meperidine, methadone, morphine, oxycodone, oxymorphone, pentazocine, propoxyphene, tapentadol, and tramadol.[16, 17]
We compared groups by demographic variables including age, sex, race, income, rural vs urban residence (determined from Rural‐Urban Commuting Area codes), region based on hospital location; overall comorbidity using the Charlson Comorbidity Index (CCI);[18] and 10 selected conditions to characterize comorbidity (see Supporting Information, Appendix A, in the online version of this article). These 10 conditions were chosen based on probable associations with chronic opioid use or high prevalence among hospitalized veterans.[9, 19, 20]
We used a CNCP definition based on ICD‐9‐CM codes.[9] This definition did not include episodic conditions such as migraine[2] or a measure of pain intensity.[21] All conditions were determined from diagnoses coded during any encounter in the year prior to hospitalization, exclusive of the first (ie, index) admission. We also determined the frequency of palliative care use, defined as presence of ICD‐9‐CM code V667 during index hospitalization or within the past year. Patients with palliative care use (n=3070) were excluded from further analyses.
We compared opioid use groups by baseline characteristics using the [2] statistic to determine if the distribution was nonrandom. We used analysis of variance to compare hospital length of stay between groups. We used the [2] statistic to compare rates of 4 outcomes of interest: intensive care unit (ICU) admission during the index hospitalization, discharge disposition other than home, 30‐day readmission rate, and in‐hospital or 30‐day mortality.
To assess the association between opioid‐use status and the 4 outcomes of interest, we constructed 2 multivariable regression models; the first was adjusted only for admission diagnosis using the Clinical Classification Software (CCS),[22] and the second was adjusted for demographics, CCI, and the 10 selected comorbidities in addition to admission diagnosis.
The authors had full access to and take full responsibility for the integrity of the data. All analyses were conducted using SAS statistical software version 9.2 (SAS Institute, Cary, NC). The study was approved by the University of Iowa institutional review board and the Iowa City VA Health Care System Research and Development Committee.
RESULTS
Patient Demographics
Demographic characteristics of patients differed by opioid‐use group (Table 1). Hospitalized patients who received COT in the 6 months prior to admission tended to be younger than their comparators, more often female, white, have a rural residence, and live in the South or West.
| Variables | No Opioids, n=66,899 (54.5%) | Occasional Opioids, n=24,093 (19.6%) | Chronic Opioids, n=31,802 (25.9%) |
|---|---|---|---|
| |||
| Age, y, mean (SD) | 68.7 (12.8) | 66.5 (12.7) | 64.5 (11.5) |
| Age, n (%) | |||
| 59 (reference) | 15,170 (22.7) | 6,703 (27.8) | 10,334 (32.5) |
| 6065 | 15,076 (22.5) | 5,973 (24.8) | 8,983 (28.3) |
| 6677 | 17,226 (25.8) | 5,871 (24.4) | 7,453 (23.4) |
| 78 | 19,427 (29.0) | 5,546 (23.0) | 5,032 (15.8) |
| Male, n (%) | 64,673 (96.7) | 22,964 (95.3) | 30,200 (95.0) |
| Race, n (%) | |||
| White | 48,888 (73.1) | 17,358 (72.1) | 25,087 (78.9) |
| Black | 14,480 (21.6) | 5,553 (23.1) | 5,089 (16.0) |
| Other | 1,172 (1.8) | 450 (1.9) | 645 (2.0) |
| Unknown | 2,359 (3.5) | 732 (3.0) | 981 (3.1) |
| Income $20,000, n (%) | 40,414 (60.4) | 14,105 (58.5) | 18,945 (59.6) |
| Rural residence, n (%) | 16,697 (25.0) | 6,277 (26.1) | 9,356 (29.4) |
| Region, n (%) | |||
| Northeast | 15,053 (22.5) | 4,437 (18.4) | 5,231 (16.5) |
| South | 24,083 (36.0) | 9,390 (39.0) | 12,720 (40.0) |
| Midwest | 16,000 (23.9) | 5,714 (23.7) | 7,762 (24.4) |
| West | 11,763 (17.6) | 4,552 (18.9) | 6,089 (19.2) |
| Charlson Comorbidity Index, mean (SD) | 2.3 (2.0) | 2.6 (2.3) | 2.7 (2.3) |
| Comorbidities, n (%) | |||
| Cancer (not metastatic) | 11,818 (17.7) | 5,549 (23.0) | 6,874 (21.6) |
| Metastatic cancer | 866 (1.3) | 733 (3.0) | 1,104 (3.5) |
| Chronic pain | 25,748 (38.5) | 14,811 (61.5) | 23,894 (75.1) |
| COPD | 20,750 (31.0) | 7,876 (32.7) | 12,117 (38.1) |
| Diabetes, complicated | 10,917 (16.3) | 4,620 (19.2) | 6,304 (19.8) |
| Heart failure | 14,267 (21.3) | 5,035 (20.9) | 6,501 (20.4) |
| Renal disease | 11,311 (16.9) | 4,586 (19.0) | 4,981 (15.7) |
| Dementia | 2,180 (3.3) | 459 (1.9) | 453 (1.4) |
| Mental health other than PTSD | 33,390 (49.9) | 13,657 (56.7) | 20,726 (65.2) |
| PTSD | 7,216 (10.8) | 3,607 (15.0) | 5,938 (18.7) |
| Palliative care use, n (%) | 1,407 (2.1) | 639 (2.7) | 1,024 (3.2) |
Prevalence of Opioid Use
Among the cohort (N=122,794) of hospitalized veterans, 66,899 (54.5%) received no opioids from the VA during the 6‐month period prior to hospitalization; 31,802 (25.9%) received COT in the 6 months prior to admission. An additional 24,093 (19.6%) had occasional opioid therapy (Table 1). A total of 257,623 opioid prescriptions were provided to patients in the 6‐month period prior to their index hospitalization. Of these, 100,379 (39.0%) were for hydrocodone, 48,584 (18.9%) for oxycodone, 36,658 (14.2%) for tramadol, and 35,471 (13.8%) for morphine. These 4 medications accounted for 85.8% of total opioid prescriptions (see Supporting Information, Appendix B, in the online version of this article).
Among the COT group, 3610 (11.4%) received opioids 90 days, 10,110 (31.8%) received opioids between 91 and 179 days, and 18,082 (56.9%) patients received opioids 180 days in the prior 6 months (see Supporting Information, Appendix C, in the online version of this article).
Among the subset of patients with cancer (metastatic and nonmetastatic, n=26,944), 29.6% were prescribed COT, and 23.3% had occasional opioid use. Among the subset of patients with CNCP (n=64,453), 37.1% were prescribed COT, and 23.0% had occasional opioid use.
Comorbid Conditions
Compared to patients not receiving opioids, a larger proportion of patients receiving both occasional and chronic opioids had diagnoses of cancer and of CNCP. Diagnoses more common in COT patients included chronic obstructive pulmonary disease (COPD), complicated diabetes, post‐traumatic stress disorder (PTSD), and other mental health disorders. In contrast, COT patients were less likely than no‐opioid and occasional opioid patients to have heart failure (HF), renal disease, and dementia. Palliative care was used by 2.1% of patients in the no‐opioid group, and 3.2% of patients in the COT group (Table 1). Renal disease was most common among the occasional‐use group.
Unadjusted Hospitalization Outcomes
Unadjusted hospitalization outcomes differed between opioid‐exposure groups (Table 2). Patients receiving occasional or chronic opioids had shorter length of stay and lower rates of non‐home discharge than did patients without any opioid use. The rate of death during hospitalization or within 30 days did not differ between groups. The occasional‐use and COT groups had higher 30‐day readmission rates than did the no‐use group.
| No Opioids, n=65,492 | Occasional Opioids, n=23,454 | Chronic Opioids, n=30,778 | P | |
|---|---|---|---|---|
| ||||
| Hospital length of stay, d, mean (SD) | 4.7 (5.1) | 4.5 (4.8) | 4.5 (4.8) | 0.0003 |
| ICU stay, n (%) | 10,281 (15.7) | 3,299 (14.1) | 4,570 (14.9) | <0.0001 |
| Non‐home discharge, n (%) | 2,944 (4.5) | 997 (4.3) | 1,233 (4.0) | 0.0020 |
| 30‐day readmission, n (%) | 9,023 (13.8) | 3,629 (15.5) | 4,773 (15.5) | <0.0001 |
| Death during hospitalization or within 30 days, n (%) | 2,532 (3.9) | 863 (3.7) | 1,191 (3.9) | 0.4057 |
Multivariable Models
In the fully adjusted multivariable models, opioid exposure (in the form of either chronic or occasional use) had no significant association with ICU stay during index admission or non‐home discharge (Table 3). Both the occasional‐opioid use and COT groups were more likely to experience 30‐day hospital readmission, a relationship that remained consistent across the partially and fully adjusted models. The occasional‐opioid use group saw no increased mortality risk. In the model adjusted only for admission diagnosis, COT was not associated with increased mortality risk. When additionally adjusted for demographic variables, CCI, and selected comorbidities, however, COT was associated with increased risk of death during hospitalization or within 30 days (odds ratio: 1.19, 90% confidence interval: 1.10‐1.29).
| Occasional Opioid Use | Chronic Opioid Therapy | |||
|---|---|---|---|---|
| Model 1, OR (95% CI) | Model 2, OR (95% CI) | Model 1, OR (95% CI) | Model 2, OR (95% CI) | |
| ||||
| ICU stay | 0.94 (0.90‐0.99) | 0.95 (0.91‐1.00) | 1.00 (0.96‐1.04) | 1.01 (0.97‐1.05) |
| Non‐home discharge | 0.92 (0.85‐0.99) | 0.97 (0.90‐1.05) | 0.85 (0.80‐0.92) | 0.95 (0.88‐1.03) |
| 30‐day readmission | 1.14 (1.09‐1.19) | 1.14 (1.09‐1.19) | 1.14 (1.10‐1.19) | 1.15 (1.10‐1.20) |
| Death during hospitalization or within 30 days | 0.96 (0.88‐1.04) | 1.04 (0.95‐1.13) | 0.96 (0.90‐1.04) | 1.19 (1.10‐1.29) |
DISCUSSION
This observational study is, to our knowledge, the first to report prevalence of and characteristics associated with prior opioid use among hospitalized medical patients. The prevalence of any opioid use and of COT was substantially higher in this hospitalized cohort than reported in outpatient settings. The prevalence of any opioid use during 1 year (FY 2009) among all veterans with VA primary care use was 26.1%.[23] A study of incident prescribing rates among veterans with new diagnoses of noncancer‐related pain demonstrated 11% received an opioid prescription within 1 year.[24] Using a definition of 90 consecutive prescription days to define COT, Dobscha et al.[25] found that 5% of veterans with persistent elevated pain intensity and no previous opioid prescriptions subsequently received COT within 12 months. The high prevalence we found likely reflects cumulative effects of incident use as well as an increased symptom burden in a population defined by need for medical hospitalization.
Although a veteran population may not be generalizable to a nonveteran setting, we do note prior studies reporting prevalence of any opioid use in outpatient cohorts (in 2000 and 2005) of between 18% and 30%, with higher rates among women and patients over 65 years of age.[1, 2]
Our work was purposefully inclusive of cancer patients so that we might assess the degree to which cancer diagnoses accounted for prior opioid use in hospitalized patients. Surprisingly, the rate of COT for patients with cancer was lower than that for patients with CNCP, perhaps reflecting that a cancer condition defined in administrative data may not constitute a pain‐causing disease.
Recognition of the prevalence of opioid therapy is important as we work to understand and improve safety, satisfaction, utilization, and long‐term health outcomes associated with hospitalization. Our finding that over half of medical inpatients have preexisting CNCP diagnoses, and a not entirely overlapping proportion has prior opioid exposure, implies a need for future work to refine expectations and strategies for inpatient management, potentially tailored to prior opioid use and presence of CNCP.
A recent Joint Commission sentinel event alert[26] highlights opioid adverse events in the hospital and identifies both lack of previous opioid therapy and prior opioid therapy as factors increasing risk. ICU admission during the hospital stay may reflect adverse events such as opioid‐induced respiratory depression; in our study, patients with no opioid use prior to admission were more likely to have an ICU stay, although the effect was small. One might speculate that clinicians, accustomed to treating pain in opioid‐exposed patients, are using inappropriately large starting dosages of narcotics for inpatients without first assessing prior opioid exposure. Another possible explanation is that patients on COT are admitted to the hospital with less severe illness, potentially reflecting functional, social, or access limitations that compromise ability to manage illness in the outpatient setting. More detailed comparison of illness severity is beyond the scope of the present work.
Patient satisfaction with pain management is reflected in 2 of the Hospital Consumer Assessment of Healthcare Providers and Systems (HCAHPS) questions, and is publically reported.[27] HCAHPS results also figure in the formula for the Centers for Medicare and Medicaid Services value‐based purchasing.[28] Preadmission pain is predictive of postoperative pain[29, 30] and may shape patient expectations; how preadmission opioid use modulates nonsurgical pain and satisfaction with management in the medical inpatient remains to be studied. The high prevalence of prior COT underscores the importance of understanding characteristics of patients on COT, and potential differences and disparities in pain management, when designing interventions to augment patient satisfaction with pain management.
Although the age distribution and patterns of comorbidities differed between the opioid‐use groups, opioid therapy remained a small but significant predictor of hospital readmission; this association was independent of CNCP diagnosis. Functional outcomes are recognized as important measures of efficacy of outpatient pain management strategies,[31] with some evidence that opioids are associated with worse functioning.[32, 33] Functional limitations, as well as inadequately or inappropriately treated pain, may drive both admissions and readmissions. Alternately, COT may be a marker for unmeasured factors that increase a patient's risk of returning to the hospital. Further work is needed to elucidate the relationship between COT and healthcare utilization associated with the inpatient stay.
Our finding that patients on COT have an increased mortality risk is concerning, given the rapid expansion in use of these medications. Although pain is increasingly prevalent toward end of life,[34] we did not observe an association between either CNCP (data not shown) or occasional opioid use and mortality. COT may complicate chronic disease through adverse drug effects including respiratory depression, apnea, or endocrine or immune alteration. Complex chronically ill patients with conditions such as COPD, HF, or diabetes may be particularly susceptible to these effects. Incident use of morphine is associated with increased mortality in acute coronary syndrome and HF[35, 36]: we are not aware of any work describing the relationship between prior opioid use and incident use during hospitalization in medical patients.
Limitations
Our work focuses on hospitalized veterans, a population that remains predominately male, limiting generalizability of the findings. Rates of mental health diagnoses and PTSD, associated with CNCP and COT,[24, 37] are higher in this population than would be expected in a general hospitalized population. Because our outcomes included readmission, and our definition of opioid exposure was designed to reflect outpatient prescribing, we included only patients without recent hospitalization. Therefore, our results may not be generalizable to patients with frequent and recurring hospitalization.
Our definition of opioid exposure depended on pharmacy dispensing records; we are not able to confirm if veterans were taking the medications as prescribed. Further, we were not able to capture data on opioids prescribed by non‐VA providers, which may have led to underestimation of prevalence.
Our definitions of COT and CNCP are imperfect, and should be noted when comparing to other studies. Because we did not specify continuous 90‐day prescribing, we may have misclassified occasional opioid therapy as COT in comparison to other authors. That continuous prescribing is equivalent to continuous use assumes that patients take medications exactly as prescribed. We used occasional opioid therapy as a comparison group, and detailed the distribution of days prescribed among the COT group (see Supporting Information, Appendix C, in the online version of this article), to augment interpretability of these results. Our CNCP diagnosis was less inclusive than others,[2] as we omitted episodic pain (eg, migraine and sprains) and human immunodeficiency virus‐related pain. As COT for CNCP conditions lacks a robust evidence base,[38] defining pain diagnoses using administrative data to reflect conditions for which COT is used in a guideline‐concordant way remains difficult.
Last, differences observed between opioid‐use groups may be due to an unmeasured confounder not captured by the variables we included. Specifically, we did not include other long‐term outpatient medications in our models. It is possible that COT is part of a larger context of inappropriate prescribing, rather than a single‐medication effect on outcomes studied.
CONCLUSION
Nearly 1 in 4 hospitalized veterans has current or recent COT at the time of hospital admission for nonsurgical conditions; nearly half have been prescribed any opioids. Practitioners designing interventions to improve pain management in the inpatient setting should account for prior opioid use. Patients who are on COT prior to hospitalization differ in age and comorbidities from their counterparts who are not on COT. Further elucidation of differences between opioid‐use groups may help providers address care needs during the transition to posthospitalization care. CNCP diagnoses and chronic opioid exposure are different entities and cannot serve as proxies in administrative data. Additional work on utilization and outcomes in specific patient populations may improve our understanding of the long‐term health effects of chronic opioid therapy.
Disclosures: Dr. Mosher is supported by the Veterans Administration (VA) Quality Scholars Fellowship, Office of Academic Affiliations, Department of Veterans Affairs. Dr. Cram is supported by a K24 award from NIAMS (AR062133) at the National Institutes of Health. The preliminary results of this article were presented at the Society of General Internal Medicine Annual Meeting in Denver, Colordao, April 2013. The views expressed in this article are those of the authors and do not necessarily represent the views of the Department of Veterans Affairs. Data are available to researchers with VA accreditation, the statistical code and the protocol are available to interested readers by contacting Dr. Mosher. The authors report no conflict of interest in regard to this study.
- , , , et al. Age and gender trends in long‐term opioid analgesic use for noncancer pain. Am J Public Health. 2010;100:2541–2547.
- , , , , , . Trends in use of opioids for non‐cancer pain conditions 2000–2005 in commercial and Medicaid insurance plans: the TROUP study. Pain. 2008;138:440–449.
- Institute of Medicine (US) Committee on Advancing Pain Research, Care, and Education. Relieving pain in America: a blueprint for transforming prevention, care, education, and research. Washington, DC: National Academies Press; 2011.
- , , , . Long‐term opioid therapy reconsidered. Ann Intern Med. 2011;155:325–328.
- , . What are we treating with long‐term opioid therapy? Arch Intern Med. 2012;172:433–434.
- , , , . Opioids for chronic noncancer pain: a meta‐analysis of effectiveness and side effects. CMAJ. 2006;174:1589–1594.
- , , , . Opioids in chronic non‐cancer pain: systematic review of efficacy and safety. Pain. 2004;112:372–380.
- , , , et al. A systematic review of randomized trials of long‐term opioid management for chronic non‐cancer pain. Pain Physician. 2011;14:91–121.
- , , , , , . Rates of adverse events of long‐acting opioids in a state Medicaid program. Ann Pharmacother. 2007;41:921–928.
- , , , et al. Emergency department visits among recipients of chronic opioid therapy. Arch Intern Med. 2010;170:1425–1432.
- , , , . Emergency hospitalizations for adverse drug events in older Americans. N Engl J Med. 2011;365:2002–2012.
- , . Assessment and management of acute pain in adult medical inpatients: a systematic review. Pain Med. 2009;10:1183–1199.
- , , , . Acute pain management in opioid‐tolerant patients: a growing challenge. Anaesth Intensive Care. 2011;39:804–823.
- , , , . Acute pain management of the chronic pain patient on opiates: a survey of caregivers at University of Washington Medical Center. Clin J Pain. 1994;10:133–138.
- The Joint Commission and the FDA take steps to curb adverse events related to the use and misuse of opioid drugs. ED Manag. 2012;24:112–116.
- , . Tramadol. CMAJ. 2013;185:E352.
- , , , , . Prescription opioid abuse in the United Kingdom. Br J Clin Pharmacol. 2013;76:823–824.
- , , , . Validation of a combined comorbidity index. J Clin Epidemiol. 1994;47:1245–1251.
- , , , , . Bringing the war back home: mental health disorders among 103,788 US veterans returning from Iraq and Afghanistan seen at Department of Veterans Affairs facilities. Arch Intern Med. 2007;167:476–482.
- , , , et al. Coding algorithms for defining comorbidities in ICD‐9‐CM and ICD‐10 administrative data. Med Care. 2005;43:1130–1139.
- , , , , , . Sex Differences in the medical care of VA patients with chronic non‐cancer pain [published online ahead of print June 26, 2013]. Pain Med. doi: 10.1111/pme.12177.
- Agency for Healthcare Research and Quality. Clinical Classifications Software (CCS) for ICD‐9‐CM. Available at: http://www.hcup‐us.ahrq.gov/toolssoftware/ccs/ccs.jsp. Accessed October 17, 2013.
- , , , et al. Predicting risk of hospitalization or death among patients receiving primary care in the Veterans Health Administration. Med Care. 2013;51:368–373.
- , , , et al. Association of mental health disorders with prescription opioids and high‐risk opioid use in US veterans of Iraq and Afghanistan. JAMA. 2012;307:940–947.
- , , , , . Correlates of prescription opioid initiation and long‐term opioid use in veterans with persistent pain. Clin J Pain. 2013;29:102–108.
- Safe use of opioids in hospitals. Sentinel Event Alert. 2012;49:1–5.
- Centers for Medicare (2):2–9.
- , , , , , . The risk of severe postoperative pain: modification and validation of a clinical prediction rule. Anesth Analg. 2008;107:1330–1339.
- , , , et al. Preoperative predictors of moderate to intense acute postoperative pain in patients undergoing abdominal surgery. Acta Anaesthesiol Scand. 2002;46:1265–1271.
- , , , , , . Successful and unsuccessful outcomes with long‐term opioid therapy: a survey of physicians' opinions. J Palliat Med. 2006;9:50–56.
- , , , . Opioid use among low back pain patients in primary care: is opioid prescription associated with disability at 6‐month follow‐up? Pain. 2013;154:1038–1044.
- , , , , ; Disability Risk Identification Study Cohort. Early opioid prescription and subsequent disability among workers with back injuries: the Disability Risk Identification Study Cohort. Spine (Phila Pa 1976). 2008;33:199–204.
- , , , et al. The epidemiology of pain during the last 2 years of life. Ann Intern Med. 2010;153:563–569.
- , , , et al. Association of intravenous morphine use and outcomes in acute coronary syndromes: results from the CRUSADE Quality Improvement Initiative. Am Heart J. 2005;149:1043–1049.
- , , , et al. Use of intravenous morphine for acute decompensated heart failure in patients with and without acute coronary syndromes. Acute Card Care. 2011;13:76–80.
- , , , et al. VA mental health services utilization in Iraq and Afghanistan veterans in the first year of receiving new mental health diagnoses. J Trauma Stress. 2010;23:5–16.
- , , , et al. Long‐term opioid management for chronic noncancer pain. Cochrane Database Syst Rev. 2010;(1):CD006605.
© 2013 Society of Hospital Medicine