User login
Patterns and Predictors of Short-Term Peripherally Inserted Central Catheter Use: A Multicenter Prospective Cohort Study
Peripherally inserted central catheters (PICCs) are integral to the care of hospitalized patients in the United States.1 Consequently, utilization of these devices in acutely ill patients has steadily increased in the past decade.2 Although originally designed to support the delivery of total parenteral nutrition, PICCs have found broader applications in the hospital setting given the ease and safety of placement, the advances in technology that facilitate insertion, and the growing availability of specially trained vascular nurses that place these devices at the bedside.3 Furthermore, because they are placed in deeper veins of the arm, PICCs are more durable than peripheral catheters and can support venous access for extended durations.4-6
However, the growing use of PICCs has led to the realization that these devices are not without attendant risks. For example, PICCs are associated with venous thromboembolism (VTE) and central-line associated blood stream infection (CLABSI).7,8 Additionally, complications such as catheter occlusion and tip migration commonly occur and may interrupt care or necessitate device removal.9-11 Hence, thoughtful weighing of the risks against the benefits of PICC use prior to placement is necessary. To facilitate such decision-making, we developed the Michigan Appropriateness Guide for Intravenous (IV) Catheters (MAGIC) criteria,12 which is an evidence-based tool that defines when the use of a PICC is appropriate in hospitalized adults.
The use of PICCs for infusion of peripherally compatible therapies for 5 or fewer days is rated as inappropriate by MAGIC.12 This strategy is also endorsed by the Centers for Disease Control and Prevention’s (CDC) guidelines for the prevention of catheter-related infections.13 Despite these recommendations, short-term PICC use remains common. For example, a study conducted at a tertiary pediatric care center reported a trend toward shorter PICC dwell times and increasing rates of early removal.2 However, factors that prompt such short-term PICC use are poorly understood. Without understanding drivers and outcomes of short-term PICC use, interventions to prevent such practice are unlikely to succeed.
Therefore, by using data from a multicenter cohort study, we examined patterns of short-term PICC use and sought to identify which patient, provider, and device factors were associated with such use. We hypothesized that short-term placement would be associated with difficult venous access and would also be associated with the risk of major and minor complications.
METHODS
Study Setting and Design
We used data from the Michigan Hospital Medicine Safety (HMS) Consortium to examine patterns and predictors of short-term PICC use.14 As a multi-institutional clinical quality initiative sponsored by Blue Cross Blue Shield of Michigan and Blue Care Network, HMS aims to improve the quality of care by preventing adverse events in hospitalized medical patients.4,15-17 In January of 2014, dedicated, trained abstractors started collecting data on PICC placements at participating HMS hospitals by using a standard protocol and template for data collection. Patients who received PICCs while admitted to either a general medicine unit or an intensive care unit (ICU) during clinical care were eligible for inclusion. Patients were excluded if they were (a) under the age of 18 years, (b) pregnant, (c) admitted to a nonmedical service (eg, surgery), or (d) admitted under observation status.
Every 14 days, each hospital collected data on the first 17 eligible patients that received a PICC, with at least 7 of these placements occurring in an ICU setting. All patients were prospectively followed until the PICC was removed, death, or until 70 days after insertion, whichever occurred first. For patients who had their PICC removed prior to hospital discharge, follow-up occurred via a review of medical records. For those discharged with a PICC in place, both medical record review and telephone follow-up were performed. To ensure data quality, annual random audits at each participating hospital were performed by the coordinating center at the University of Michigan.
For this analysis, we included all available data as of June 30, 2016. However, HMS hospitals continue to collect data on PICC use and outcomes as part of an ongoing clinical quality initiative to reduce the incidence of PICC-related complications.
Patient, Provider, and Device Data
Patient characteristics, including demographics, detailed medical history, comorbidities, physical findings, laboratory results, and medications were abstracted directly from medical records. To estimate the comorbidity burden, the Charlson-Deyo comorbidity score was calculated for each patient by using data available in the medical record at the time of PICC placement.18 Data, such as the documented indication for PICC insertion and the reason for removal, were obtained directly from medical records. Provider characteristics, including the specialty of the attending physician at the time of insertion and the type of operator who inserted the PICC, were also collected. Institutional characteristics, such as total number of beds, teaching versus nonteaching, and urban versus rural, were obtained from hospital publicly reported data and semiannual surveys of HMS sites.19,20 Data on device characteristics, such as catheter gauge, coating, insertion attempts, tip location, and number of lumens, were abstracted from PICC insertion notes.
Outcomes of Interest
The outcome of interest was short-term PICC use, defined as PICCs removed within 5 days of insertion. Patients who expired with a PICC in situ were excluded. Secondary outcomes of interest included PICC-related complications, categorized as major (eg, symptomatic VTE and CLABSI) or minor (eg, catheter occlusion, superficial thrombosis, mechanical complications [kinking, coiling], exit site infection, and tip migration). Symptomatic VTE was defined as clinically diagnosed deep venous thrombosis (DVT) and/or pulmonary embolism (PE) not present at the time of PICC placement and confirmed via imaging (ultrasound or venogram for DVT; computed tomography scan, ventilation perfusion scan, or pulmonary angiogram for PE). CLABSI was defined in accordance with the CDC’s National Healthcare Safety Network criteria or according to Infectious Diseases Society of America recommendations.21,22 All minor PICC complications were defined in accordance with prior published definitions.4
Statistical Analysis
Cases of short-term PICC use were identified and compared with patients with a PICC dwell time of 6 or more days by patient, provider, and device characteristics. The initial analyses for the associations of putative factors with short-term PICC use were performed using χ2 or Wilcoxon tests for categorical and continuous variables, respectively. Univariable mixed effect logistic regression models (with a random hospital-specific intercept) were then used to control for hospital-level clustering. Next, a mixed effects multivariable logistic regression model was used to identify factors associated with short-term PICC use. Variables with P ≤ .25 were considered as candidate predictors for the final multivariable model, which was chosen through a stepwise variable selection algorithm performed on 1000 bootstrapped data sets.23 Variables in the final model were retained based on their frequency of selection in the bootstrapped samples, significance level, and contribution to the overall model likelihood. Results were expressed as odds ratios (OR) with corresponding 95% confidence intervals (CI). SAS for Windows (version 9.3, SAS Institute Inc., Cary, NC) was used for analyses.
Ethical and Regulatory Oversight
The study was classified as “not regulated” by the Institutional Review Board at the University of Michigan (HUM00078730).
RESULTS
Overall Characteristics of the Study Cohort
Characteristics of Short-Term Peripherally Inserted Central Catheter Use
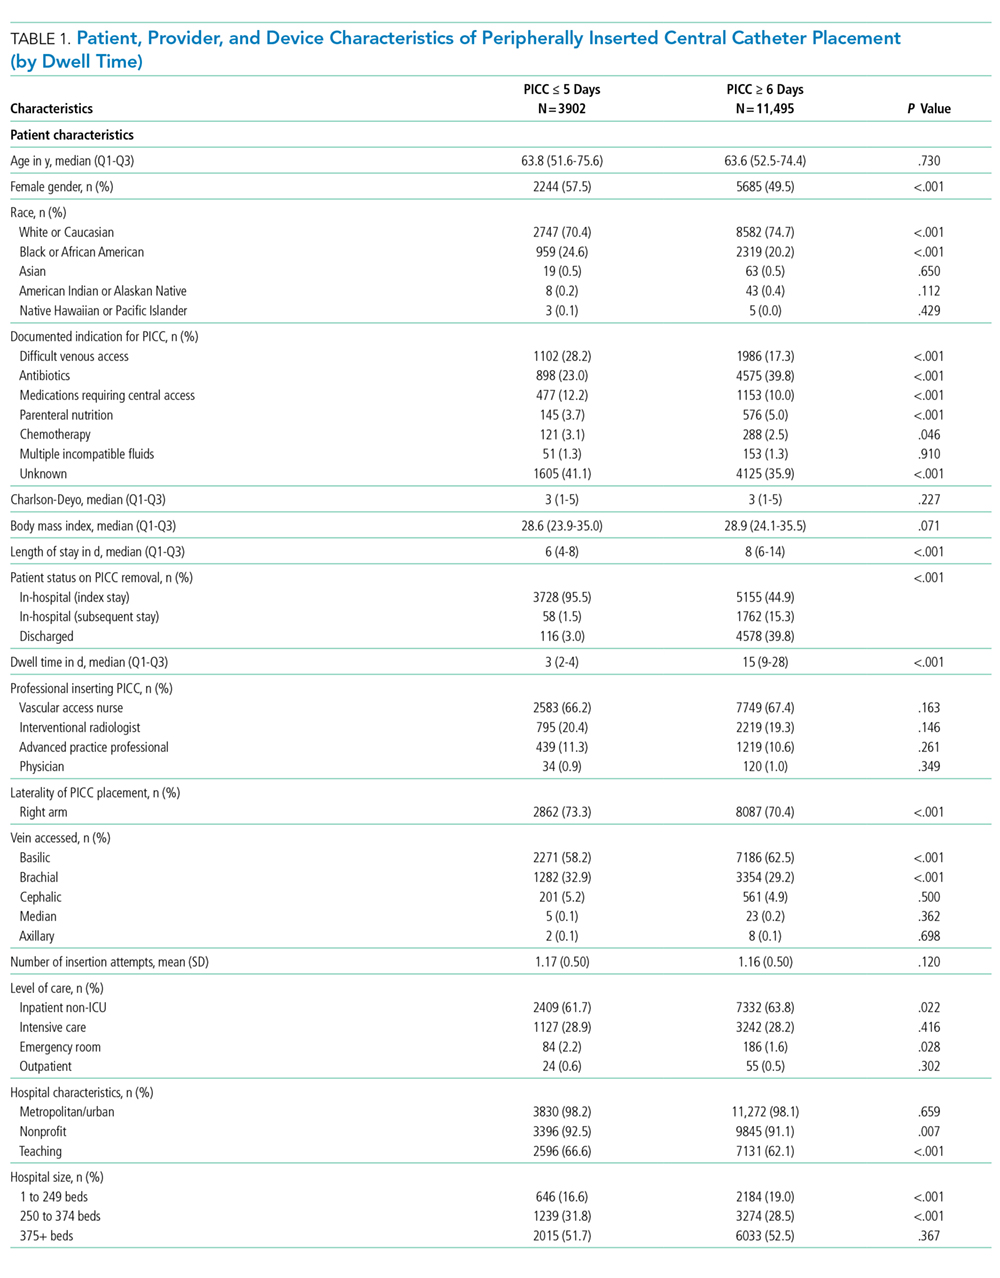
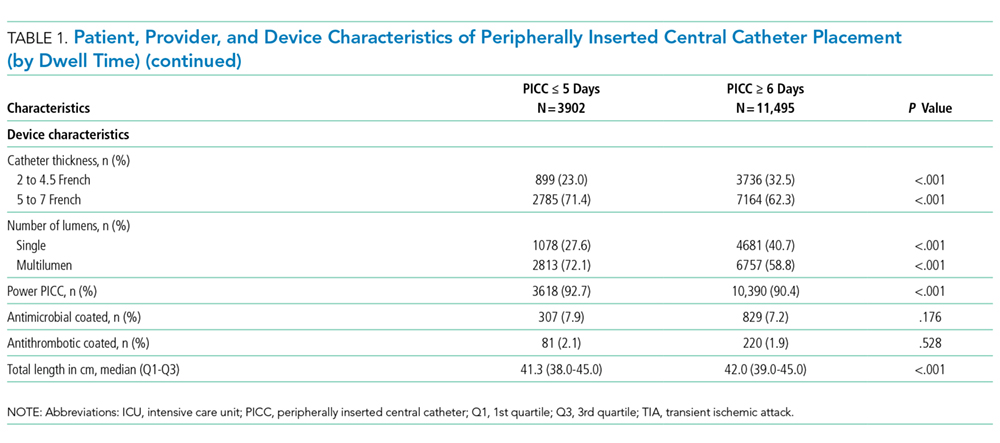
Of the 15,397 PICCs included, we identified 3902 PICCs (25.3%) with a dwell time of ≤5 days (median = 3 days; IQR, 2-4 days). When compared to PICCs that were in place for longer durations, no significant differences in age or comorbidity scores were observed. Importantly, despite recommendations to avoid PICCs in patients with moderate to severe chronic kidney disease (glomerular filtration rate [GFR] ≤ 59 ml/min), 1292 (33.1%) short-term PICCs occurred in patients that met such criteria.
Among short-term PICCs, 3618 (92.7%) were power-capable devices, 2785 (71.4%) were 5-French, and 2813 (72.1%) were multilumen. Indications for the use of short-term PICCs differed from longer term devices in important ways (P < .001). For example, the most common documented indication for short-term PICC use was difficult venous access (28.2%), while for long-term PICCs, it was antibiotic administration (39.8%). General internists and hospitalists were the most common attending physicians for patients with short-term and long-term PICCs (65.1% and 65.5%, respectively [P = .73]). Also, the proportion of critical care physicians responsible for patients with short versus long-term PICC use was similar (14.0% vs 15.0%, respectively [P = .123]). Of the short-term PICCs, 2583 (66.2%) were inserted by vascular access nurses, 795 (20.4%) by interventional radiologists, and 439 (11.3%) by advance practice professionals. Almost all of the PICCs placed ≤5 days (95.5%) were removed during hospitalization.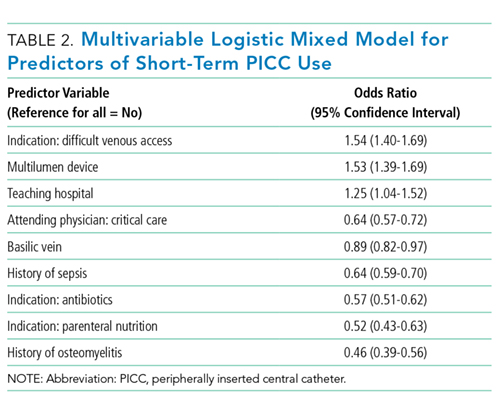
Complications Associated with Short-Term Peripherally Inserted Central Catheter Use
DISCUSSION
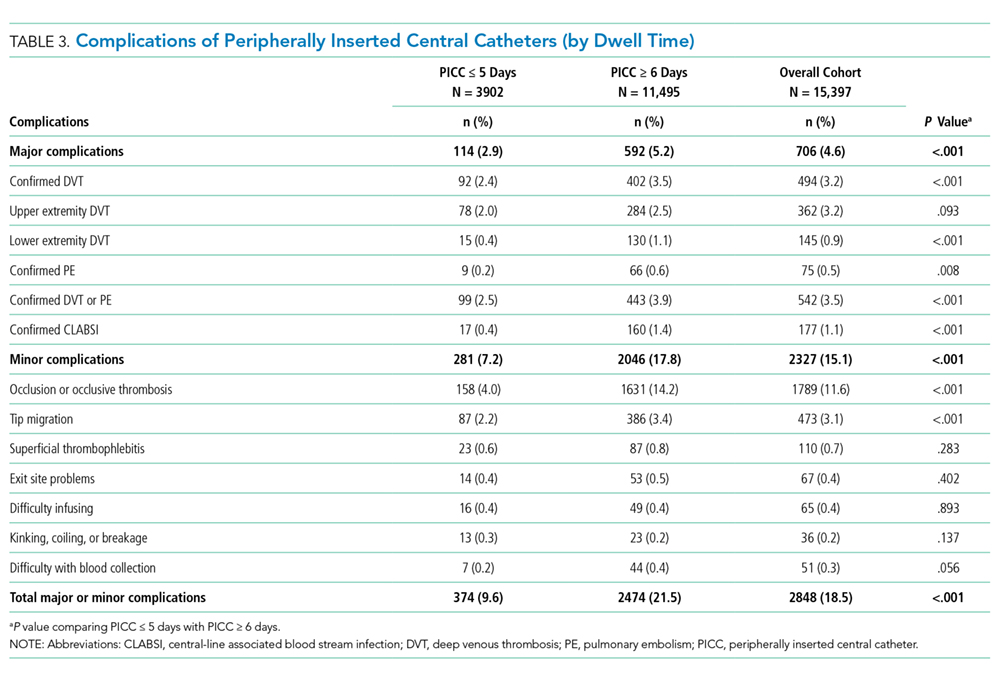
This large, multisite prospective cohort study is the first to examine patterns and predictors of short-term PICC use in hospitalized adults. By examining clinically granular data derived from the medical records of patients across 52 hospitals, we found that short-term use was common, representing 25% of all PICCs placed. Almost all such PICCs were removed prior to discharge, suggesting that they were placed primarily to meet acute needs during hospitalization. Multivariable models indicated that patients with difficult venous access, multilumen devices, and teaching hospital settings were associated with short-term use. Given that (a) short term PICC use is not recommended by published evidence-based guidelines,12,13 (b) both major and minor complications were not uncommon despite brief exposure, and (c) specific factors might be targeted to avoid such use, strategies to improve PICC decision-making in the hospital appear increasingly necessary.
In our study, difficult venous access was the most common documented indication for short-term PICC placement. For patients in whom an anticipated catheter dwell time of 5 days or less is expected, MAGIC recommends the consideration of midline or peripheral IV catheters placed under ultrasound guidance.12 A midline is a type of peripheral IV catheter that is about 7.5 cm to 25 cm in length and is typically inserted in the larger diameter veins of the upper extremity, such as the cephalic or basilic veins, with the tip terminating distal to the subclavian vein.7,12 While there is a paucity of information that directly compares PICCs to midlines, some data suggest a lower risk of bloodstream infection and thrombosis associated with the latter.24-26 For example, at one quaternary teaching hospital, house staff who are trained to insert midline catheters under ultrasound guidance in critically ill patients with difficult venous access reported no CLABSI and DVT events.26
Interestingly, multilumen catheters were used twice as often as single lumen catheters in patients with short-term PICCs. In these instances, the use of additional lumens is questionable, as infusion of multiple incompatible fluids was not commonly listed as an indication prompting PICC use. Because multilumen PICCs are associated with higher risks of both VTE and CLABSI compared to single lumen devices, such use represents an important safety concern.27-29 Institutional efforts that not only limit the use of multilumen PICCs but also fundamentally define when use of a PICC is appropriate may substantially improve outcomes related to vascular access.28,30,31We observed that short-term PICCs were more common in teaching compared to nonteaching hospitals. While the design of the present study precludes understanding the reasons for such a difference, some plausible theories include the presence of physician trainees who may not appreciate the risks of PICC use, diminishing peripheral IV access securement skills, and the lack of alternatives to PICC use. Educating trainees who most often order PICCs in teaching settings as to when they should or should not consider this device may represent an important quality improvement opportunity.32 Similarly, auditing and assessing the clinical skills of those entrusted to place peripheral IVs might prove helpful.33,34 Finally, the introduction of a midline program, or similar programs that expand the scope of vascular access teams to place alternative devices, should be explored as a means to improve PICC use and patient safety.
Our study also found that a third of patients who received PICCs for 5 or fewer days had moderate to severe chronic kidney disease. In these patients who may require renal replacement therapy, prior PICC placement is among the strongest predictors of arteriovenous fistula failure.35,36 Therefore, even though national guidelines discourage the use of PICCs in these patients and recommend alternative routes of venous access,12,37,38 such practice is clearly not happening. System-based interventions that begin by identifying patients who require vein preservation (eg, those with a GFR < 45 ml/min) and are therefore not appropriate for a PICC would be a welcomed first step in improving care for such patients.37,38Our study has limitations. First, the observational nature of the study limits the ability to assess for causality or to account for the effects of unmeasured confounders. Second, while the use of medical records to collect granular data is valuable, differences in documentation patterns within and across hospitals, including patterns of missing data, may produce a misclassification of covariates or outcomes. Third, while we found that higher rates of short-term PICC use were associated with teaching hospitals and patients with difficult venous access, we were unable to determine the precise reasons for this practice trend. Qualitative or mixed-methods approaches to understand provider decision-making in these settings would be welcomed.
Our study also has several strengths. First, to our knowledge, this is the first study to systematically describe and evaluate patterns and predictors of short-term PICC use. The finding that PICCs placed for difficult venous access is a dominant category of short-term placement confirms clinical suspicions regarding inappropriate use and strengthens the need for pathways or protocols to manage such patients. Second, the inclusion of medical patients in diverse institutions offers not only real-world insights related to PICC use, but also offers findings that should be generalizable to other hospitals and health systems. Third, the use of a robust data collection strategy that emphasized standardized data collection, dedicated trained abstractors, and random audits to ensure data quality strengthen the findings of this work. Finally, our findings highlight an urgent need to develop policies related to PICC use, including limiting the use of multiple lumens and avoidance in patients with moderate to severe kidney disease.
In conclusion, short-term use of PICCs is prevalent and associated with key patient, provider, and device factors. Such use is also associated with complications, such as catheter occlusion, tip migration, VTE, and CLABSI. Limiting the use of multiple-lumen PICCs, enhancing education for when a PICC should be used, and defining strategies for patients with difficult access may help reduce inappropriate PICC use and improve patient safety. Future studies to examine implementation of such interventions would be welcomed.
Disclosure: Drs. Paje, Conlon, Swaminathan, and Boldenow disclose no conflicts of interest. Dr. Chopra has received honoraria for talks at hospitals as a visiting professor. Dr. Flanders discloses consultancies for the Institute for Healthcare Improvement and the Society of Hospital Medicine, royalties from Wiley Publishing, honoraria for various talks at hospitals as a visiting professor, grants from the CDC Foundation, Agency for Healthcare Research and Quality, Blue Cross Blue Shield of Michigan (BCBSM), and Michigan Hospital Association, and expert witness testimony. Dr. Bernstein discloses consultancies for Blue Care Network and grants from BCBSM, Department of Veterans Affairs, and National Institutes of Health. Dr. Kaatz discloses no relevant conflicts of interest. BCBSM and Blue Care Network provided support for the Michigan HMS Consortium as part of the BCBSM Value Partnerships program. Although BCBSM and HMS work collaboratively, the opinions, beliefs, and viewpoints expressed by the author do not necessarily reflect the opinions, beliefs, and viewpoints of BCBSM or any of its employees. Dr. Chopra is supported by a career development award from the Agency for Healthcare Research and Quality (1-K08-HS022835-01). BCBSM and Blue Care Network supported data collection at each participating site and funded the data coordinating center but had no role in study concept, interpretation of findings, or in the preparation, final approval, or decision to submit the manuscript.
1. Al Raiy B, Fakih MG, Bryan-Nomides N, et al. Peripherally inserted central venous catheters in the acute care setting: A safe alternative to high-risk short-term central venous catheters. Am J Infect Control. 2010;38(2):149-153. PubMed
2. Gibson C, Connolly BL, Moineddin R, Mahant S, Filipescu D, Amaral JG. Peripherally inserted central catheters: use at a tertiary care pediatric center. J Vasc Interv Radiol. 2013;24(9):1323-1331. PubMed
3. Chopra V, Flanders SA, Saint S. The problem with peripherally inserted central catheters. JAMA. 2012;308(15):1527-1528. PubMed
4. Chopra V, Smith S, Swaminathan L, et al. Variations in Peripherally Inserted Central Catheter Use and Outcomes in Michigan Hospitals. JAMA Intern Med. 2016;176(4):548-551. PubMed
5. Cowl CT, Weinstock JV, Al-Jurf A, Ephgrave K, Murray JA, Dillon K. Complications and cost associated with parenteral nutrition delivered to hospitalized patients through either subclavian or peripherally-inserted central catheters. Clin Nutr. 2000;19(4):237-243. PubMed
6. MacDonald AS, Master SK, Moffitt EA. A comparative study of peripherally inserted silicone catheters for parenteral nutrition. Can J Anaesth. 1977;24(2):263-269. PubMed
7. Chopra V, O’Horo JC, Rogers MA, Maki DG, Safdar N. The risk of bloodstream infection associated with peripherally inserted central catheters compared with central venous catheters in adults: a systematic review and meta-analysis. Infect Control Hosp Epidemiol. 2013;34(9):908-918. PubMed
8. Chopra V, Anand S, Hickner A, et al. Risk of venous thromboembolism associated with peripherally inserted central catheters: a systematic review and meta-analysis. Lancet. 2013;382(9889):311-325. PubMed
9. Beccaria P, Silvetti S, Mucci M, Battini I, Brambilla P, Zangrillo A. Contributing factors for a late spontaneous peripherally inserted central catheter migration: a case report and review of literature. J Vasc Access. 2015;16(3):178-182. PubMed
10. Turcotte S, Dube S, Beauchamp G. Peripherally inserted central venous catheters are not superior to central venous catheters in the acute care of surgical patients on the ward. World J Surg. 2006;30(8):1605-1619. PubMed
11. Pikwer A, Akeson J, Lindgren S. Complications associated with peripheral or central routes for central venous cannulation. Anaesthesia. 2012;67(1):65-71. PubMed
12. Chopra V, Flanders SA, Saint S, et al. The Michigan Appropriateness Guide for Intravenous Catheters (MAGIC): Results From a Multispecialty Panel Using the RAND/UCLA Appropriateness Method. Ann Intern Med. 15 2015;163(6 Suppl):S1-S40. PubMed
13. O’Grady NP, Alexander M, Burns LA, et al. Guidelines for the prevention of intravascular catheter-related infections. Am J Infect Control. 2011;39(4 Suppl 1):S1-S34. PubMed
14. Michigan Hospital Medicine Safety Consortium. 2016; http://mi-hms.org/. Accessed November 11, 2016.
15. Greene MT, Spyropoulos AC, Chopra V, et al. Validation of Risk Assessment Models of Venous Thromboembolism in Hospitalized Medical Patients. Am J Med. 2016;129(9):1001.e1009-1001.e1018. PubMed
16. Greene MT, Flanders SA, Woller SC, Bernstein SJ, Chopra V. The Association Between PICC Use and Venous Thromboembolism in Upper and Lower Extremities. Am J Med. 2015;128(9):986-993. PubMed
17. Flanders SA, Greene MT, Grant P, et al. Hospital performance for pharmacologic venous thromboembolism prophylaxis and rate of venous thromboembolism : a cohort study. JAMA Intern Med. 2014;174(10):1577-1584. PubMed
18. Deyo RA, Cherkin DC, Ciol MA. Adapting a clinical comorbidity index for use with ICD-9-CM administrative databases. J Clin Epidemiol. 1992;45(6):613-619. PubMed
19. Hospital Bed Inventory. 2016; http://www.michigan.gov/documents/mdhhs/HOSPBEDINV_October_3__2016_536834_7.pdf. Accessed November 22, 2016.
20. Compare Hospitals. 2016; http://www.leapfroggroup.org/compare-hospitals. Accessed November 22, 2016.
21. NHSN Patient Safety Component Manual. 2016; http://www.cdc.gov/nhsn/pdfs/pscmanual/pcsmanual_current.pdf. Accessed November 22, 2016.
22. Mermel LA, Allon M, Bouza E, et al. Clinical practice guidelines for the diagnosis and management of intravascular catheter-related infection: 2009 Update by the Infectious Diseases Society of America. Clin Infect Dis. 2009;49(1):1-45. PubMed
23. Austin PC, Tu JV. Bootstrap Methods for Developing Predictive Models. Am Stat. 2004;58(2):131-137.
24. Pathak R, Patel A, Enuh H, Adekunle O, Shrisgantharajah V, Diaz K. The Incidence of Central Line-Associated Bacteremia After the Introduction of Midline Catheters in a Ventilator Unit Population. Infect Dis Clin Pract. 2015;23(3):131-134. PubMed
25. Adams DZ, Little A, Vinsant C, Khandelwal S. The Midline Catheter: A Clinical Review. J Emerg Med. 2016;51(3):252-258. PubMed
26. Deutsch GB, Sathyanarayana SA, Singh N, Nicastro J. Ultrasound-guided placement of midline catheters in the surgical intensive care unit: a cost-effective proposal for timely central line removal. J Surg Res. 2014;191(1):1-5. PubMed
27. Chopra V, Anand S, Krein SL, Chenoweth C, Saint S. Bloodstream Infection, Venous Thrombosis, and Peripherally Inserted Central Catheters: Reappraising the Evidence. Am J Med. 2012;125(8):733-741. PubMed
28. Ratz D, Hofer T, Flanders SA, Saint S, Chopra V. Limiting the Number of Lumens in Peripherally Inserted Central Catheters to Improve Outcomes and Reduce Cost: A Simulation Study. Infect Control Hosp Epidemiol. 2016;37(7):811-817. PubMed
29. Pongruangporn M, Ajenjo MC, Russo AJ, et al. Patient- and device-specific risk factors for peripherally inserted central venous catheter-related bloodstream infections. Infect Control Hosp Epidemiol. 2013;34(2):184-189. PubMed
30. Shannon RP, Patel B, Cummins D, Shannon AH, Ganguli G, Lu Y. Economics of central line--associated bloodstream infections. Am J Med Qual. 2006;21(6 Suppl):7S-16S. PubMed
31. O’Brien J, Paquet F, Lindsay R, Valenti D. Insertion of PICCs with minimum number of lumens reduces complications and costs. J AmColl Radiol. 2013;10(11):864-868. PubMed
32. Wong BM, Etchells EE, Kuper A, Levinson W, Shojania KG. Teaching quality improvement and patient safety to trainees: a systematic review. Acad Med. 2010;85(9):1425-1439. PubMed
33. Conlon T, Himebauch A, Marie Cahill A, et al. 1246: Bedside Picc Placement by Pediatric Icu Providers Is Feasible and Safe. Crit Care Med. 2016;44(12 Suppl 1):387.
34. Moran J, Colbert CY, Song J, et al. Screening for novel risk factors related to peripherally inserted central catheter-associated complications. J Hosp Med. 2014;9(8):481-489. PubMed
35. Gonsalves CF, Eschelman DJ, Sullivan KL, DuBois N, Bonn J. Incidence of central vein stenosis and occlusion following upper extremity PICC and port placement. Cardiovasc Intervent Radiol. 2003;26(2):123-127. PubMed
36. El Ters M, Schears GJ, Taler SJ, et al. Association between prior peripherally inserted central catheters and lack of functioning arteriovenous fistulas: a case-control study in hemodialysis patients. Am J Kidney Dis. 2012;60(4):601-608. PubMed
37. Vascular Access 2006 Work Group. Clinical practice guidelines for vascular access. Am J Kidney Dis. 2006;48 Suppl 1:S248-S273. PubMed
38. Hoggard J, Saad T, Schon D, et al. Guidelines for venous access in patients with chronic kidney disease. A Position Statement from the American Society of Diagnostic and Interventional Nephrology, Clinical Practice Committee and the Association for Vascular Access. Semin Dial. 2008;21(2):186-191. PubMed
Peripherally inserted central catheters (PICCs) are integral to the care of hospitalized patients in the United States.1 Consequently, utilization of these devices in acutely ill patients has steadily increased in the past decade.2 Although originally designed to support the delivery of total parenteral nutrition, PICCs have found broader applications in the hospital setting given the ease and safety of placement, the advances in technology that facilitate insertion, and the growing availability of specially trained vascular nurses that place these devices at the bedside.3 Furthermore, because they are placed in deeper veins of the arm, PICCs are more durable than peripheral catheters and can support venous access for extended durations.4-6
However, the growing use of PICCs has led to the realization that these devices are not without attendant risks. For example, PICCs are associated with venous thromboembolism (VTE) and central-line associated blood stream infection (CLABSI).7,8 Additionally, complications such as catheter occlusion and tip migration commonly occur and may interrupt care or necessitate device removal.9-11 Hence, thoughtful weighing of the risks against the benefits of PICC use prior to placement is necessary. To facilitate such decision-making, we developed the Michigan Appropriateness Guide for Intravenous (IV) Catheters (MAGIC) criteria,12 which is an evidence-based tool that defines when the use of a PICC is appropriate in hospitalized adults.
The use of PICCs for infusion of peripherally compatible therapies for 5 or fewer days is rated as inappropriate by MAGIC.12 This strategy is also endorsed by the Centers for Disease Control and Prevention’s (CDC) guidelines for the prevention of catheter-related infections.13 Despite these recommendations, short-term PICC use remains common. For example, a study conducted at a tertiary pediatric care center reported a trend toward shorter PICC dwell times and increasing rates of early removal.2 However, factors that prompt such short-term PICC use are poorly understood. Without understanding drivers and outcomes of short-term PICC use, interventions to prevent such practice are unlikely to succeed.
Therefore, by using data from a multicenter cohort study, we examined patterns of short-term PICC use and sought to identify which patient, provider, and device factors were associated with such use. We hypothesized that short-term placement would be associated with difficult venous access and would also be associated with the risk of major and minor complications.
METHODS
Study Setting and Design
We used data from the Michigan Hospital Medicine Safety (HMS) Consortium to examine patterns and predictors of short-term PICC use.14 As a multi-institutional clinical quality initiative sponsored by Blue Cross Blue Shield of Michigan and Blue Care Network, HMS aims to improve the quality of care by preventing adverse events in hospitalized medical patients.4,15-17 In January of 2014, dedicated, trained abstractors started collecting data on PICC placements at participating HMS hospitals by using a standard protocol and template for data collection. Patients who received PICCs while admitted to either a general medicine unit or an intensive care unit (ICU) during clinical care were eligible for inclusion. Patients were excluded if they were (a) under the age of 18 years, (b) pregnant, (c) admitted to a nonmedical service (eg, surgery), or (d) admitted under observation status.
Every 14 days, each hospital collected data on the first 17 eligible patients that received a PICC, with at least 7 of these placements occurring in an ICU setting. All patients were prospectively followed until the PICC was removed, death, or until 70 days after insertion, whichever occurred first. For patients who had their PICC removed prior to hospital discharge, follow-up occurred via a review of medical records. For those discharged with a PICC in place, both medical record review and telephone follow-up were performed. To ensure data quality, annual random audits at each participating hospital were performed by the coordinating center at the University of Michigan.
For this analysis, we included all available data as of June 30, 2016. However, HMS hospitals continue to collect data on PICC use and outcomes as part of an ongoing clinical quality initiative to reduce the incidence of PICC-related complications.
Patient, Provider, and Device Data
Patient characteristics, including demographics, detailed medical history, comorbidities, physical findings, laboratory results, and medications were abstracted directly from medical records. To estimate the comorbidity burden, the Charlson-Deyo comorbidity score was calculated for each patient by using data available in the medical record at the time of PICC placement.18 Data, such as the documented indication for PICC insertion and the reason for removal, were obtained directly from medical records. Provider characteristics, including the specialty of the attending physician at the time of insertion and the type of operator who inserted the PICC, were also collected. Institutional characteristics, such as total number of beds, teaching versus nonteaching, and urban versus rural, were obtained from hospital publicly reported data and semiannual surveys of HMS sites.19,20 Data on device characteristics, such as catheter gauge, coating, insertion attempts, tip location, and number of lumens, were abstracted from PICC insertion notes.
Outcomes of Interest
The outcome of interest was short-term PICC use, defined as PICCs removed within 5 days of insertion. Patients who expired with a PICC in situ were excluded. Secondary outcomes of interest included PICC-related complications, categorized as major (eg, symptomatic VTE and CLABSI) or minor (eg, catheter occlusion, superficial thrombosis, mechanical complications [kinking, coiling], exit site infection, and tip migration). Symptomatic VTE was defined as clinically diagnosed deep venous thrombosis (DVT) and/or pulmonary embolism (PE) not present at the time of PICC placement and confirmed via imaging (ultrasound or venogram for DVT; computed tomography scan, ventilation perfusion scan, or pulmonary angiogram for PE). CLABSI was defined in accordance with the CDC’s National Healthcare Safety Network criteria or according to Infectious Diseases Society of America recommendations.21,22 All minor PICC complications were defined in accordance with prior published definitions.4
Statistical Analysis
Cases of short-term PICC use were identified and compared with patients with a PICC dwell time of 6 or more days by patient, provider, and device characteristics. The initial analyses for the associations of putative factors with short-term PICC use were performed using χ2 or Wilcoxon tests for categorical and continuous variables, respectively. Univariable mixed effect logistic regression models (with a random hospital-specific intercept) were then used to control for hospital-level clustering. Next, a mixed effects multivariable logistic regression model was used to identify factors associated with short-term PICC use. Variables with P ≤ .25 were considered as candidate predictors for the final multivariable model, which was chosen through a stepwise variable selection algorithm performed on 1000 bootstrapped data sets.23 Variables in the final model were retained based on their frequency of selection in the bootstrapped samples, significance level, and contribution to the overall model likelihood. Results were expressed as odds ratios (OR) with corresponding 95% confidence intervals (CI). SAS for Windows (version 9.3, SAS Institute Inc., Cary, NC) was used for analyses.
Ethical and Regulatory Oversight
The study was classified as “not regulated” by the Institutional Review Board at the University of Michigan (HUM00078730).
RESULTS
Overall Characteristics of the Study Cohort
Characteristics of Short-Term Peripherally Inserted Central Catheter Use
Of the 15,397 PICCs included, we identified 3902 PICCs (25.3%) with a dwell time of ≤5 days (median = 3 days; IQR, 2-4 days). When compared to PICCs that were in place for longer durations, no significant differences in age or comorbidity scores were observed. Importantly, despite recommendations to avoid PICCs in patients with moderate to severe chronic kidney disease (glomerular filtration rate [GFR] ≤ 59 ml/min), 1292 (33.1%) short-term PICCs occurred in patients that met such criteria.
Among short-term PICCs, 3618 (92.7%) were power-capable devices, 2785 (71.4%) were 5-French, and 2813 (72.1%) were multilumen. Indications for the use of short-term PICCs differed from longer term devices in important ways (P < .001). For example, the most common documented indication for short-term PICC use was difficult venous access (28.2%), while for long-term PICCs, it was antibiotic administration (39.8%). General internists and hospitalists were the most common attending physicians for patients with short-term and long-term PICCs (65.1% and 65.5%, respectively [P = .73]). Also, the proportion of critical care physicians responsible for patients with short versus long-term PICC use was similar (14.0% vs 15.0%, respectively [P = .123]). Of the short-term PICCs, 2583 (66.2%) were inserted by vascular access nurses, 795 (20.4%) by interventional radiologists, and 439 (11.3%) by advance practice professionals. Almost all of the PICCs placed ≤5 days (95.5%) were removed during hospitalization.
Complications Associated with Short-Term Peripherally Inserted Central Catheter Use
DISCUSSION
This large, multisite prospective cohort study is the first to examine patterns and predictors of short-term PICC use in hospitalized adults. By examining clinically granular data derived from the medical records of patients across 52 hospitals, we found that short-term use was common, representing 25% of all PICCs placed. Almost all such PICCs were removed prior to discharge, suggesting that they were placed primarily to meet acute needs during hospitalization. Multivariable models indicated that patients with difficult venous access, multilumen devices, and teaching hospital settings were associated with short-term use. Given that (a) short term PICC use is not recommended by published evidence-based guidelines,12,13 (b) both major and minor complications were not uncommon despite brief exposure, and (c) specific factors might be targeted to avoid such use, strategies to improve PICC decision-making in the hospital appear increasingly necessary.
In our study, difficult venous access was the most common documented indication for short-term PICC placement. For patients in whom an anticipated catheter dwell time of 5 days or less is expected, MAGIC recommends the consideration of midline or peripheral IV catheters placed under ultrasound guidance.12 A midline is a type of peripheral IV catheter that is about 7.5 cm to 25 cm in length and is typically inserted in the larger diameter veins of the upper extremity, such as the cephalic or basilic veins, with the tip terminating distal to the subclavian vein.7,12 While there is a paucity of information that directly compares PICCs to midlines, some data suggest a lower risk of bloodstream infection and thrombosis associated with the latter.24-26 For example, at one quaternary teaching hospital, house staff who are trained to insert midline catheters under ultrasound guidance in critically ill patients with difficult venous access reported no CLABSI and DVT events.26
Interestingly, multilumen catheters were used twice as often as single lumen catheters in patients with short-term PICCs. In these instances, the use of additional lumens is questionable, as infusion of multiple incompatible fluids was not commonly listed as an indication prompting PICC use. Because multilumen PICCs are associated with higher risks of both VTE and CLABSI compared to single lumen devices, such use represents an important safety concern.27-29 Institutional efforts that not only limit the use of multilumen PICCs but also fundamentally define when use of a PICC is appropriate may substantially improve outcomes related to vascular access.28,30,31We observed that short-term PICCs were more common in teaching compared to nonteaching hospitals. While the design of the present study precludes understanding the reasons for such a difference, some plausible theories include the presence of physician trainees who may not appreciate the risks of PICC use, diminishing peripheral IV access securement skills, and the lack of alternatives to PICC use. Educating trainees who most often order PICCs in teaching settings as to when they should or should not consider this device may represent an important quality improvement opportunity.32 Similarly, auditing and assessing the clinical skills of those entrusted to place peripheral IVs might prove helpful.33,34 Finally, the introduction of a midline program, or similar programs that expand the scope of vascular access teams to place alternative devices, should be explored as a means to improve PICC use and patient safety.
Our study also found that a third of patients who received PICCs for 5 or fewer days had moderate to severe chronic kidney disease. In these patients who may require renal replacement therapy, prior PICC placement is among the strongest predictors of arteriovenous fistula failure.35,36 Therefore, even though national guidelines discourage the use of PICCs in these patients and recommend alternative routes of venous access,12,37,38 such practice is clearly not happening. System-based interventions that begin by identifying patients who require vein preservation (eg, those with a GFR < 45 ml/min) and are therefore not appropriate for a PICC would be a welcomed first step in improving care for such patients.37,38Our study has limitations. First, the observational nature of the study limits the ability to assess for causality or to account for the effects of unmeasured confounders. Second, while the use of medical records to collect granular data is valuable, differences in documentation patterns within and across hospitals, including patterns of missing data, may produce a misclassification of covariates or outcomes. Third, while we found that higher rates of short-term PICC use were associated with teaching hospitals and patients with difficult venous access, we were unable to determine the precise reasons for this practice trend. Qualitative or mixed-methods approaches to understand provider decision-making in these settings would be welcomed.
Our study also has several strengths. First, to our knowledge, this is the first study to systematically describe and evaluate patterns and predictors of short-term PICC use. The finding that PICCs placed for difficult venous access is a dominant category of short-term placement confirms clinical suspicions regarding inappropriate use and strengthens the need for pathways or protocols to manage such patients. Second, the inclusion of medical patients in diverse institutions offers not only real-world insights related to PICC use, but also offers findings that should be generalizable to other hospitals and health systems. Third, the use of a robust data collection strategy that emphasized standardized data collection, dedicated trained abstractors, and random audits to ensure data quality strengthen the findings of this work. Finally, our findings highlight an urgent need to develop policies related to PICC use, including limiting the use of multiple lumens and avoidance in patients with moderate to severe kidney disease.
In conclusion, short-term use of PICCs is prevalent and associated with key patient, provider, and device factors. Such use is also associated with complications, such as catheter occlusion, tip migration, VTE, and CLABSI. Limiting the use of multiple-lumen PICCs, enhancing education for when a PICC should be used, and defining strategies for patients with difficult access may help reduce inappropriate PICC use and improve patient safety. Future studies to examine implementation of such interventions would be welcomed.
Disclosure: Drs. Paje, Conlon, Swaminathan, and Boldenow disclose no conflicts of interest. Dr. Chopra has received honoraria for talks at hospitals as a visiting professor. Dr. Flanders discloses consultancies for the Institute for Healthcare Improvement and the Society of Hospital Medicine, royalties from Wiley Publishing, honoraria for various talks at hospitals as a visiting professor, grants from the CDC Foundation, Agency for Healthcare Research and Quality, Blue Cross Blue Shield of Michigan (BCBSM), and Michigan Hospital Association, and expert witness testimony. Dr. Bernstein discloses consultancies for Blue Care Network and grants from BCBSM, Department of Veterans Affairs, and National Institutes of Health. Dr. Kaatz discloses no relevant conflicts of interest. BCBSM and Blue Care Network provided support for the Michigan HMS Consortium as part of the BCBSM Value Partnerships program. Although BCBSM and HMS work collaboratively, the opinions, beliefs, and viewpoints expressed by the author do not necessarily reflect the opinions, beliefs, and viewpoints of BCBSM or any of its employees. Dr. Chopra is supported by a career development award from the Agency for Healthcare Research and Quality (1-K08-HS022835-01). BCBSM and Blue Care Network supported data collection at each participating site and funded the data coordinating center but had no role in study concept, interpretation of findings, or in the preparation, final approval, or decision to submit the manuscript.
1. Al Raiy B, Fakih MG, Bryan-Nomides N, et al. Peripherally inserted central venous catheters in the acute care setting: A safe alternative to high-risk short-term central venous catheters. Am J Infect Control. 2010;38(2):149-153. PubMed
2. Gibson C, Connolly BL, Moineddin R, Mahant S, Filipescu D, Amaral JG. Peripherally inserted central catheters: use at a tertiary care pediatric center. J Vasc Interv Radiol. 2013;24(9):1323-1331. PubMed
3. Chopra V, Flanders SA, Saint S. The problem with peripherally inserted central catheters. JAMA. 2012;308(15):1527-1528. PubMed
4. Chopra V, Smith S, Swaminathan L, et al. Variations in Peripherally Inserted Central Catheter Use and Outcomes in Michigan Hospitals. JAMA Intern Med. 2016;176(4):548-551. PubMed
5. Cowl CT, Weinstock JV, Al-Jurf A, Ephgrave K, Murray JA, Dillon K. Complications and cost associated with parenteral nutrition delivered to hospitalized patients through either subclavian or peripherally-inserted central catheters. Clin Nutr. 2000;19(4):237-243. PubMed
6. MacDonald AS, Master SK, Moffitt EA. A comparative study of peripherally inserted silicone catheters for parenteral nutrition. Can J Anaesth. 1977;24(2):263-269. PubMed
7. Chopra V, O’Horo JC, Rogers MA, Maki DG, Safdar N. The risk of bloodstream infection associated with peripherally inserted central catheters compared with central venous catheters in adults: a systematic review and meta-analysis. Infect Control Hosp Epidemiol. 2013;34(9):908-918. PubMed
8. Chopra V, Anand S, Hickner A, et al. Risk of venous thromboembolism associated with peripherally inserted central catheters: a systematic review and meta-analysis. Lancet. 2013;382(9889):311-325. PubMed
9. Beccaria P, Silvetti S, Mucci M, Battini I, Brambilla P, Zangrillo A. Contributing factors for a late spontaneous peripherally inserted central catheter migration: a case report and review of literature. J Vasc Access. 2015;16(3):178-182. PubMed
10. Turcotte S, Dube S, Beauchamp G. Peripherally inserted central venous catheters are not superior to central venous catheters in the acute care of surgical patients on the ward. World J Surg. 2006;30(8):1605-1619. PubMed
11. Pikwer A, Akeson J, Lindgren S. Complications associated with peripheral or central routes for central venous cannulation. Anaesthesia. 2012;67(1):65-71. PubMed
12. Chopra V, Flanders SA, Saint S, et al. The Michigan Appropriateness Guide for Intravenous Catheters (MAGIC): Results From a Multispecialty Panel Using the RAND/UCLA Appropriateness Method. Ann Intern Med. 15 2015;163(6 Suppl):S1-S40. PubMed
13. O’Grady NP, Alexander M, Burns LA, et al. Guidelines for the prevention of intravascular catheter-related infections. Am J Infect Control. 2011;39(4 Suppl 1):S1-S34. PubMed
14. Michigan Hospital Medicine Safety Consortium. 2016; http://mi-hms.org/. Accessed November 11, 2016.
15. Greene MT, Spyropoulos AC, Chopra V, et al. Validation of Risk Assessment Models of Venous Thromboembolism in Hospitalized Medical Patients. Am J Med. 2016;129(9):1001.e1009-1001.e1018. PubMed
16. Greene MT, Flanders SA, Woller SC, Bernstein SJ, Chopra V. The Association Between PICC Use and Venous Thromboembolism in Upper and Lower Extremities. Am J Med. 2015;128(9):986-993. PubMed
17. Flanders SA, Greene MT, Grant P, et al. Hospital performance for pharmacologic venous thromboembolism prophylaxis and rate of venous thromboembolism : a cohort study. JAMA Intern Med. 2014;174(10):1577-1584. PubMed
18. Deyo RA, Cherkin DC, Ciol MA. Adapting a clinical comorbidity index for use with ICD-9-CM administrative databases. J Clin Epidemiol. 1992;45(6):613-619. PubMed
19. Hospital Bed Inventory. 2016; http://www.michigan.gov/documents/mdhhs/HOSPBEDINV_October_3__2016_536834_7.pdf. Accessed November 22, 2016.
20. Compare Hospitals. 2016; http://www.leapfroggroup.org/compare-hospitals. Accessed November 22, 2016.
21. NHSN Patient Safety Component Manual. 2016; http://www.cdc.gov/nhsn/pdfs/pscmanual/pcsmanual_current.pdf. Accessed November 22, 2016.
22. Mermel LA, Allon M, Bouza E, et al. Clinical practice guidelines for the diagnosis and management of intravascular catheter-related infection: 2009 Update by the Infectious Diseases Society of America. Clin Infect Dis. 2009;49(1):1-45. PubMed
23. Austin PC, Tu JV. Bootstrap Methods for Developing Predictive Models. Am Stat. 2004;58(2):131-137.
24. Pathak R, Patel A, Enuh H, Adekunle O, Shrisgantharajah V, Diaz K. The Incidence of Central Line-Associated Bacteremia After the Introduction of Midline Catheters in a Ventilator Unit Population. Infect Dis Clin Pract. 2015;23(3):131-134. PubMed
25. Adams DZ, Little A, Vinsant C, Khandelwal S. The Midline Catheter: A Clinical Review. J Emerg Med. 2016;51(3):252-258. PubMed
26. Deutsch GB, Sathyanarayana SA, Singh N, Nicastro J. Ultrasound-guided placement of midline catheters in the surgical intensive care unit: a cost-effective proposal for timely central line removal. J Surg Res. 2014;191(1):1-5. PubMed
27. Chopra V, Anand S, Krein SL, Chenoweth C, Saint S. Bloodstream Infection, Venous Thrombosis, and Peripherally Inserted Central Catheters: Reappraising the Evidence. Am J Med. 2012;125(8):733-741. PubMed
28. Ratz D, Hofer T, Flanders SA, Saint S, Chopra V. Limiting the Number of Lumens in Peripherally Inserted Central Catheters to Improve Outcomes and Reduce Cost: A Simulation Study. Infect Control Hosp Epidemiol. 2016;37(7):811-817. PubMed
29. Pongruangporn M, Ajenjo MC, Russo AJ, et al. Patient- and device-specific risk factors for peripherally inserted central venous catheter-related bloodstream infections. Infect Control Hosp Epidemiol. 2013;34(2):184-189. PubMed
30. Shannon RP, Patel B, Cummins D, Shannon AH, Ganguli G, Lu Y. Economics of central line--associated bloodstream infections. Am J Med Qual. 2006;21(6 Suppl):7S-16S. PubMed
31. O’Brien J, Paquet F, Lindsay R, Valenti D. Insertion of PICCs with minimum number of lumens reduces complications and costs. J AmColl Radiol. 2013;10(11):864-868. PubMed
32. Wong BM, Etchells EE, Kuper A, Levinson W, Shojania KG. Teaching quality improvement and patient safety to trainees: a systematic review. Acad Med. 2010;85(9):1425-1439. PubMed
33. Conlon T, Himebauch A, Marie Cahill A, et al. 1246: Bedside Picc Placement by Pediatric Icu Providers Is Feasible and Safe. Crit Care Med. 2016;44(12 Suppl 1):387.
34. Moran J, Colbert CY, Song J, et al. Screening for novel risk factors related to peripherally inserted central catheter-associated complications. J Hosp Med. 2014;9(8):481-489. PubMed
35. Gonsalves CF, Eschelman DJ, Sullivan KL, DuBois N, Bonn J. Incidence of central vein stenosis and occlusion following upper extremity PICC and port placement. Cardiovasc Intervent Radiol. 2003;26(2):123-127. PubMed
36. El Ters M, Schears GJ, Taler SJ, et al. Association between prior peripherally inserted central catheters and lack of functioning arteriovenous fistulas: a case-control study in hemodialysis patients. Am J Kidney Dis. 2012;60(4):601-608. PubMed
37. Vascular Access 2006 Work Group. Clinical practice guidelines for vascular access. Am J Kidney Dis. 2006;48 Suppl 1:S248-S273. PubMed
38. Hoggard J, Saad T, Schon D, et al. Guidelines for venous access in patients with chronic kidney disease. A Position Statement from the American Society of Diagnostic and Interventional Nephrology, Clinical Practice Committee and the Association for Vascular Access. Semin Dial. 2008;21(2):186-191. PubMed
© 2018 Society of Hospital Medicine
Perception of Resources Spent on Defensive Medicine and History of Being Sued Among Hospitalists: Results from a National Survey
Annual healthcare costs in the United States are over $3 trillion and are garnering significant national attention.1 The United States spends approximately 2.5 times more per capita on healthcare when compared to other developed nations.2 One source of unnecessary cost in healthcare is defensive medicine. Defensive medicine has been defined by Congress as occurring “when doctors order tests, procedures, or visits, or avoid certain high-risk patients or procedures, primarily (but not necessarily) because of concern about malpractice liability.”3
Though difficult to assess, in 1 study, defensive medicine was estimated to cost $45 billion annually.4 While general agreement exists that physicians practice defensive medicine, the extent of defensive practices and the subsequent impact on healthcare costs remain unclear. This is especially true for a group of clinicians that is rapidly increasing in number: hospitalists. Currently, there are more than 50,000 hospitalists in the United States,5 yet the prevalence of defensive medicine in this relatively new specialty is unknown. Inpatient care is complex and time constraints can impede establishing an optimal therapeutic relationship with the patient, potentially raising liability fears. We therefore sought to quantify hospitalist physician estimates of the cost of defensive medicine and assess correlates of their estimates. As being sued might spur defensive behaviors, we also assessed how many hospitalists reported being sued and whether this was associated with their estimates of defensive medicine.
METHODS
Survey Questionnaire
In a previously published survey-based analysis, we reported on physician practice and overuse for 2 common scenarios in hospital medicine: preoperative evaluation and management of uncomplicated syncope.6 After responding to the vignettes, each physician was asked to provide demographic and employment information and malpractice history. In addition, they were asked the following: In your best estimation, what percentage of healthcare-related resources (eg, hospital admissions, diagnostic testing, treatment) are spent purely because of defensive medicine concerns? __________% resources
Survey Sample & Administration
The survey was sent to a sample of 1753 hospitalists, randomly identified through the Society of Hospital Medicine’s (SHM) database of members and annual meeting attendees. It is estimated that almost 30% of practicing hospitalists in the United States are members of the SHM.5 A full description of the sampling methodology was previously published.6 Selected hospitalists were mailed surveys, a $20 financial incentive, and subsequent reminders between June and October 2011.
The study was exempted from institutional review board review by the University of Michigan and the VA Ann Arbor Healthcare System.
Variables
The primary outcome of interest was the response to the “% resources” estimated to be spent on defensive medicine. This was analyzed as a continuous variable. Independent variables included the following: VA employment, malpractice insurance payer, employer, history of malpractice lawsuit, sex, race, and years practicing as a physician.
Statistical Analysis
Analyses were conducted using SAS, version 9.4 (SAS Institute). Descriptive statistics were first calculated for all variables. Next, bivariable comparisons between the outcome variables and other variables of interest were performed. Multivariable comparisons were made using linear regression for the outcome of estimated resources spent on defensive medicine. A P value of < 0.05 was considered statistically significant.
RESULTS
Of the 1753 surveys mailed, 253 were excluded due to incorrect addresses or because the recipients were not practicing hospitalists. A total of 1020 were completed and returned, yielding a 68% response rate (1020 out of 1500 eligible). The hospitalist respondents were in practice for an average of 11 years (range 1-40 years). Respondents represented all 50 states and had a diverse background of experience and demographic characteristics, which has been previously described.6
Resources Estimated Spent on Defensive Medicine


Hospitalists reported, on average, that they believed defensive medicine accounted for 37.5% (standard deviation, 20.2%) of all healthcare spending. Results from the multivariable regression are presented in the Table. Hospitalists affiliated with a VA hospital reported 5.5% less in resources spent on defensive medicine than those not affiliated with a VA hospital (32.2% VA vs 37.7% non-VA, P = 0.025). For every 10 years in practice, the estimate of resources spent on defensive medicine decreased by 3% (P = 0.003). Those who were male (36.4% male vs 39.4% female, P = 0.023) and non-Hispanic white (32.5% non-Hispanic white vs 44.7% other, P ≤ 0.001) also estimated less resources spent on defensive medicine. We did not find an association between a hospitalist reporting being sued and their perception of resources spent on defensive medicine.
Risk of Being Sued

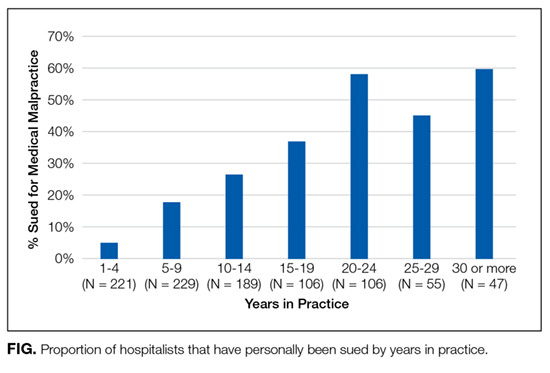
Over a quarter of our sample (25.6%) reported having been sued at least once for medical malpractice. The proportion of hospitalists that reported a history of being sued generally increased with more years of practice (Figure). For those who had been in practice for at least 20 years, more than half (55%) had been sued at least once during their career.
DISCUSSION
In a national survey, hospitalists estimated that almost 40% of all healthcare-related resources are spent purely because of defensive medicine concerns. This estimate was affected by personal demographic and employment factors. Our second major finding is that over one-quarter of a large random sample of hospitalist physicians reported being sued for malpractice.
Hospitalist perceptions of defensive medicine varied significantly based on employment at a VA hospital, with VA-affiliated hospitalists reporting less estimated spending on defensive medicine. This effect may reflect a less litigious environment within the VA, even though physicians practicing within the VA can be reported to the National Practitioner Data Bank.7 The different environment may be due to the VA’s patient mix (VA patients tend to be poorer, older, sicker, and have more mental illness)8; however, it could also be due to its de facto practice of a form of enterprise liability, in which, by law, the VA assumes responsibility for negligence, sheltering its physicians from direct liability.
We also found that the higher the number of years a hospitalist reported practicing, the lower the perception of resources being spent on defensive medicine. The reason for this finding is unclear. There has been a recent focus on high-value care and overspending, and perhaps younger hospitalists are more aware of these initiatives and thus have higher estimates. Additionally, non-Hispanic white male respondents estimated a lower amount spent on defensive medicine compared with other respondents. This is consistent with previous studies of risk perception which have noted a “white male effect” in which white males generally perceive a wide range of risks to be lower than female and non-white individuals, likely due to sociopolitical factors.9 Here, the white male effect is particularly interesting, considering that male physicians are almost 2.5 times as likely as female physicians to report being sued.10
Similar to prior studies,11 there was no association with personal liability claim experience and perceived resources spent on defensive medicine. It is unclear why personal experience of being sued does not appear to be associated with perceptions of defensive medicine practice. It is possible that the fear of being sued is worse than the actual experience or that physicians believe that lawsuits are either random events or inevitable and, as a result, do not change their practice patterns.
The lifetime risk of being named in a malpractice suit is substantial for hospitalists: in our study, over half of hospitalists in practice for 20 years or more reported they had been sued. This corresponds with the projection made by Jena and colleagues,12 which estimated that 55% of internal medicine physicians will be sued by the age of 45, a number just slightly higher than the average for all physicians.
Our study has important limitations. Our sample was of hospitalists and therefore may not be reflective of other medical specialties. Second, due to the nature of the study design, the responses to spending on defensive medicine may not represent actual practice. Third, we did not confirm details such as place of employment or history of lawsuit, and this may be subject to recall bias. However, physicians are unlikely to forget having been sued. Finally, this survey is observational and cross-sectional. Our data imply association rather than causation. Without longitudinal data, it is impossible to know if years of practice correlate with perceived defensive medicine spending due to a generational effect or a longitudinal effect (such as more confidence in diagnostic skills with more years of practice).
Despite these limitations, our survey has important policy implications. First, we found that defensive medicine is perceived by hospitalists to be costly. Although physicians likely overestimated the cost (37.5%, or an estimated $1 trillion is far higher than previous estimates of approximately 2% of all healthcare spending),4 it also demonstrates the extent to which physicians feel as though the medical care that is provided may be unnecessary. Second, at least a quarter of hospitalist physicians have been sued, and the risk of being named as a defendant in a lawsuit increases the longer they have been in clinical practice.
Given these findings, policies aimed to reduce the practice of defensive medicine may help the rising costs of healthcare. Reducing defensive medicine requires decreasing physician fears of liability and related reporting. Traditional tort reforms (with the exception of damage caps) have not been proven to do this. And damage caps can be inequitable, hard to pass, and even found to be unconstitutional in some states.13 However, other reform options hold promise in reducing liability fears, including enterprise liability, safe harbor legislation, and health courts.13 Finally, shared decision-making models may also provide a method to reduce defensive fears as well.6
Acknowledgments
The authors thank the Society of Hospital Medicine, Dr. Scott Flanders, Andrew Hickner, and David Ratz for their assistance with this project.
Disclosure
The authors received financial support from the Blue Cross Blue Shield of Michigan Foundation, the Department of Veterans Affairs Health Services Research and Development Center for Clinical Management Research, the University of Michigan Specialist-Hospitalist Allied Research Program, and the Ann Arbor University of Michigan VA Patient Safety Enhancement Program.
Disclaimer
The views expressed in this article are those of the authors and do not necessarily reflect the position or policy of Blue Cross Blue Shield of Michigan Foundation, the Department of Veterans Affairs, or the Society of Hospital Medicine.
1. Centers for Medicare & Medicaid Services. National Health Expenditures 2014 Highlights. 2015; https://www.cms.gov/Research-Statistics-Data-and-Systems/Statistics-Trends-and-Reports/NationalHealthExpendData/NationalHealthAccountsHistorical.html. Accessed on July 28, 2016.
2. OECD. Health expenditure per capita. Health at a Glance 2015. Paris: OECD Publishing; 2015.
3. U.S. Congress, Office of Technology Assessment. Defensive Medicine and Medical Malpractice. Washington, DC: U.S. Government Printing Office; July 1994. OTA-H-602.
4. Mello MM, Chandra A, Gawande AA, Studdert DM. National costs of the medical liability system. Health Aff (Millwood). 2010;29(9):1569-1577. PubMed
5. Society of Hospital Medicine. Society of Hospital Medicine: Membership. 2017; http://www.hospitalmedicine.org/Web/Membership/Web/Membership/Membership_Landing_Page.aspx?hkey=97f40c85-fdcd-411f-b3f6-e617bc38a2c5. Accessed on January 5, 2017.
6. Kachalia A, Berg A, Fagerlin A, et al. Overuse of testing in preoperative evaluation and syncope: a survey of hospitalists. Ann Intern Med. 2015;162(2):100-108. PubMed
7. Pugatch MB. Federal tort claims and military medical malpractice. J Legal Nurse Consulting. 2008;19(2):3-6.
8. Eibner C, Krull H, Brown K, et al. Current and projected characteristics and unique health care needs of the patient population served by the Department of Veterans Affairs. Santa Monica, CA: RAND Corporation; 2015. PubMed
9. Finucane ML, Slovic P, Mertz CK, Flynn J, Satterfield TA. Gender, race, and perceived risk: the ‘white male’ effect. Health, Risk & Society. 2000;2(2):159-172.
10. Unwin E, Woolf K, Wadlow C, Potts HW, Dacre J. Sex differences in medico-legal action against doctors: a systematic review and meta-analysis. BMC Med. 2015;13:172. PubMed
11. Glassman PA, Rolph JE, Petersen LP, Bradley MA, Kravitz RL. Physicians’ personal malpractice experiences are not related to defensive clinical practices. J Health Polit Policy Law. 1996;21(2):219-241. PubMed
12. Jena AB, Seabury S, Lakdawalla D, Chandra A. Malpractice risk according to physician specialty. N Engl J Med. 2011;365(7):629-636. PubMed
13. Mello MM, Studdert DM, Kachalia A. The medical liability climate and prospects for reform. JAMA. 2014;312(20):2146-2155. PubMed
Annual healthcare costs in the United States are over $3 trillion and are garnering significant national attention.1 The United States spends approximately 2.5 times more per capita on healthcare when compared to other developed nations.2 One source of unnecessary cost in healthcare is defensive medicine. Defensive medicine has been defined by Congress as occurring “when doctors order tests, procedures, or visits, or avoid certain high-risk patients or procedures, primarily (but not necessarily) because of concern about malpractice liability.”3
Though difficult to assess, in 1 study, defensive medicine was estimated to cost $45 billion annually.4 While general agreement exists that physicians practice defensive medicine, the extent of defensive practices and the subsequent impact on healthcare costs remain unclear. This is especially true for a group of clinicians that is rapidly increasing in number: hospitalists. Currently, there are more than 50,000 hospitalists in the United States,5 yet the prevalence of defensive medicine in this relatively new specialty is unknown. Inpatient care is complex and time constraints can impede establishing an optimal therapeutic relationship with the patient, potentially raising liability fears. We therefore sought to quantify hospitalist physician estimates of the cost of defensive medicine and assess correlates of their estimates. As being sued might spur defensive behaviors, we also assessed how many hospitalists reported being sued and whether this was associated with their estimates of defensive medicine.
METHODS
Survey Questionnaire
In a previously published survey-based analysis, we reported on physician practice and overuse for 2 common scenarios in hospital medicine: preoperative evaluation and management of uncomplicated syncope.6 After responding to the vignettes, each physician was asked to provide demographic and employment information and malpractice history. In addition, they were asked the following: In your best estimation, what percentage of healthcare-related resources (eg, hospital admissions, diagnostic testing, treatment) are spent purely because of defensive medicine concerns? __________% resources
Survey Sample & Administration
The survey was sent to a sample of 1753 hospitalists, randomly identified through the Society of Hospital Medicine’s (SHM) database of members and annual meeting attendees. It is estimated that almost 30% of practicing hospitalists in the United States are members of the SHM.5 A full description of the sampling methodology was previously published.6 Selected hospitalists were mailed surveys, a $20 financial incentive, and subsequent reminders between June and October 2011.
The study was exempted from institutional review board review by the University of Michigan and the VA Ann Arbor Healthcare System.
Variables
The primary outcome of interest was the response to the “% resources” estimated to be spent on defensive medicine. This was analyzed as a continuous variable. Independent variables included the following: VA employment, malpractice insurance payer, employer, history of malpractice lawsuit, sex, race, and years practicing as a physician.
Statistical Analysis
Analyses were conducted using SAS, version 9.4 (SAS Institute). Descriptive statistics were first calculated for all variables. Next, bivariable comparisons between the outcome variables and other variables of interest were performed. Multivariable comparisons were made using linear regression for the outcome of estimated resources spent on defensive medicine. A P value of < 0.05 was considered statistically significant.
RESULTS
Of the 1753 surveys mailed, 253 were excluded due to incorrect addresses or because the recipients were not practicing hospitalists. A total of 1020 were completed and returned, yielding a 68% response rate (1020 out of 1500 eligible). The hospitalist respondents were in practice for an average of 11 years (range 1-40 years). Respondents represented all 50 states and had a diverse background of experience and demographic characteristics, which has been previously described.6
Resources Estimated Spent on Defensive Medicine
Hospitalists reported, on average, that they believed defensive medicine accounted for 37.5% (standard deviation, 20.2%) of all healthcare spending. Results from the multivariable regression are presented in the Table. Hospitalists affiliated with a VA hospital reported 5.5% less in resources spent on defensive medicine than those not affiliated with a VA hospital (32.2% VA vs 37.7% non-VA, P = 0.025). For every 10 years in practice, the estimate of resources spent on defensive medicine decreased by 3% (P = 0.003). Those who were male (36.4% male vs 39.4% female, P = 0.023) and non-Hispanic white (32.5% non-Hispanic white vs 44.7% other, P ≤ 0.001) also estimated less resources spent on defensive medicine. We did not find an association between a hospitalist reporting being sued and their perception of resources spent on defensive medicine.
Risk of Being Sued
Over a quarter of our sample (25.6%) reported having been sued at least once for medical malpractice. The proportion of hospitalists that reported a history of being sued generally increased with more years of practice (Figure). For those who had been in practice for at least 20 years, more than half (55%) had been sued at least once during their career.
DISCUSSION
In a national survey, hospitalists estimated that almost 40% of all healthcare-related resources are spent purely because of defensive medicine concerns. This estimate was affected by personal demographic and employment factors. Our second major finding is that over one-quarter of a large random sample of hospitalist physicians reported being sued for malpractice.
Hospitalist perceptions of defensive medicine varied significantly based on employment at a VA hospital, with VA-affiliated hospitalists reporting less estimated spending on defensive medicine. This effect may reflect a less litigious environment within the VA, even though physicians practicing within the VA can be reported to the National Practitioner Data Bank.7 The different environment may be due to the VA’s patient mix (VA patients tend to be poorer, older, sicker, and have more mental illness)8; however, it could also be due to its de facto practice of a form of enterprise liability, in which, by law, the VA assumes responsibility for negligence, sheltering its physicians from direct liability.
We also found that the higher the number of years a hospitalist reported practicing, the lower the perception of resources being spent on defensive medicine. The reason for this finding is unclear. There has been a recent focus on high-value care and overspending, and perhaps younger hospitalists are more aware of these initiatives and thus have higher estimates. Additionally, non-Hispanic white male respondents estimated a lower amount spent on defensive medicine compared with other respondents. This is consistent with previous studies of risk perception which have noted a “white male effect” in which white males generally perceive a wide range of risks to be lower than female and non-white individuals, likely due to sociopolitical factors.9 Here, the white male effect is particularly interesting, considering that male physicians are almost 2.5 times as likely as female physicians to report being sued.10
Similar to prior studies,11 there was no association with personal liability claim experience and perceived resources spent on defensive medicine. It is unclear why personal experience of being sued does not appear to be associated with perceptions of defensive medicine practice. It is possible that the fear of being sued is worse than the actual experience or that physicians believe that lawsuits are either random events or inevitable and, as a result, do not change their practice patterns.
The lifetime risk of being named in a malpractice suit is substantial for hospitalists: in our study, over half of hospitalists in practice for 20 years or more reported they had been sued. This corresponds with the projection made by Jena and colleagues,12 which estimated that 55% of internal medicine physicians will be sued by the age of 45, a number just slightly higher than the average for all physicians.
Our study has important limitations. Our sample was of hospitalists and therefore may not be reflective of other medical specialties. Second, due to the nature of the study design, the responses to spending on defensive medicine may not represent actual practice. Third, we did not confirm details such as place of employment or history of lawsuit, and this may be subject to recall bias. However, physicians are unlikely to forget having been sued. Finally, this survey is observational and cross-sectional. Our data imply association rather than causation. Without longitudinal data, it is impossible to know if years of practice correlate with perceived defensive medicine spending due to a generational effect or a longitudinal effect (such as more confidence in diagnostic skills with more years of practice).
Despite these limitations, our survey has important policy implications. First, we found that defensive medicine is perceived by hospitalists to be costly. Although physicians likely overestimated the cost (37.5%, or an estimated $1 trillion is far higher than previous estimates of approximately 2% of all healthcare spending),4 it also demonstrates the extent to which physicians feel as though the medical care that is provided may be unnecessary. Second, at least a quarter of hospitalist physicians have been sued, and the risk of being named as a defendant in a lawsuit increases the longer they have been in clinical practice.
Given these findings, policies aimed to reduce the practice of defensive medicine may help the rising costs of healthcare. Reducing defensive medicine requires decreasing physician fears of liability and related reporting. Traditional tort reforms (with the exception of damage caps) have not been proven to do this. And damage caps can be inequitable, hard to pass, and even found to be unconstitutional in some states.13 However, other reform options hold promise in reducing liability fears, including enterprise liability, safe harbor legislation, and health courts.13 Finally, shared decision-making models may also provide a method to reduce defensive fears as well.6
Acknowledgments
The authors thank the Society of Hospital Medicine, Dr. Scott Flanders, Andrew Hickner, and David Ratz for their assistance with this project.
Disclosure
The authors received financial support from the Blue Cross Blue Shield of Michigan Foundation, the Department of Veterans Affairs Health Services Research and Development Center for Clinical Management Research, the University of Michigan Specialist-Hospitalist Allied Research Program, and the Ann Arbor University of Michigan VA Patient Safety Enhancement Program.
Disclaimer
The views expressed in this article are those of the authors and do not necessarily reflect the position or policy of Blue Cross Blue Shield of Michigan Foundation, the Department of Veterans Affairs, or the Society of Hospital Medicine.
1. Centers for Medicare & Medicaid Services. National Health Expenditures 2014 Highlights. 2015; https://www.cms.gov/Research-Statistics-Data-and-Systems/Statistics-Trends-and-Reports/NationalHealthExpendData/NationalHealthAccountsHistorical.html. Accessed on July 28, 2016.
2. OECD. Health expenditure per capita. Health at a Glance 2015. Paris: OECD Publishing; 2015.
3. U.S. Congress, Office of Technology Assessment. Defensive Medicine and Medical Malpractice. Washington, DC: U.S. Government Printing Office; July 1994. OTA-H-602.
4. Mello MM, Chandra A, Gawande AA, Studdert DM. National costs of the medical liability system. Health Aff (Millwood). 2010;29(9):1569-1577. PubMed
5. Society of Hospital Medicine. Society of Hospital Medicine: Membership. 2017; http://www.hospitalmedicine.org/Web/Membership/Web/Membership/Membership_Landing_Page.aspx?hkey=97f40c85-fdcd-411f-b3f6-e617bc38a2c5. Accessed on January 5, 2017.
6. Kachalia A, Berg A, Fagerlin A, et al. Overuse of testing in preoperative evaluation and syncope: a survey of hospitalists. Ann Intern Med. 2015;162(2):100-108. PubMed
7. Pugatch MB. Federal tort claims and military medical malpractice. J Legal Nurse Consulting. 2008;19(2):3-6.
8. Eibner C, Krull H, Brown K, et al. Current and projected characteristics and unique health care needs of the patient population served by the Department of Veterans Affairs. Santa Monica, CA: RAND Corporation; 2015. PubMed
9. Finucane ML, Slovic P, Mertz CK, Flynn J, Satterfield TA. Gender, race, and perceived risk: the ‘white male’ effect. Health, Risk & Society. 2000;2(2):159-172.
10. Unwin E, Woolf K, Wadlow C, Potts HW, Dacre J. Sex differences in medico-legal action against doctors: a systematic review and meta-analysis. BMC Med. 2015;13:172. PubMed
11. Glassman PA, Rolph JE, Petersen LP, Bradley MA, Kravitz RL. Physicians’ personal malpractice experiences are not related to defensive clinical practices. J Health Polit Policy Law. 1996;21(2):219-241. PubMed
12. Jena AB, Seabury S, Lakdawalla D, Chandra A. Malpractice risk according to physician specialty. N Engl J Med. 2011;365(7):629-636. PubMed
13. Mello MM, Studdert DM, Kachalia A. The medical liability climate and prospects for reform. JAMA. 2014;312(20):2146-2155. PubMed
© 2018 Society of Hospital Medicine
Do Bedside Visual Tools Improve Patient and Caregiver Satisfaction? A Systematic Review of the Literature
Patient satisfaction with medical care during hospitalization is a common quality metric.1,2 Studies showing higher patient satisfaction have reported lower 30-day hospital readmissions3 and improved overall health.4,5 Conversely, communication failures are associated with dissatisfaction among hospitalized patients and adverse outcomes.6,7 A lack of familiarity with hospital providers weakens collaborative decision making and prevents high-quality patient care.8,9
Bedside visual tools, such as whiteboards and pictures of medical staff, have been widely used to enhance communication between patients, families, and providers.10,11 Results of studies evaluating these tools are varied. For example, 1 study found that 98% of patients were better able to identify physicians when their names were written on whiteboards.12 Yet in another, only 21.1% of patients were more likely to correctly identify ≥1 physicians using pictures.13 Thus, despite widespread use,11 whether visual tools improve patient satisfaction and patient care more broadly remains unclear.14,15
We performed a systematic review to answer the following 3 questions: first, what is the effect of visual tools on outcomes (ie, provider identification, understanding of providers’ roles, patient–provider communication, and satisfaction); second, does impact vary by type of visual tool (eg, whiteboards vs pictures of providers); and third, what factors (eg, study design, patient population) are associated with provider identification, communication, and patient satisfaction?
METHODS
Search Strategy
We used the Preferred Reporting Items for Systematic Reviews and Meta-Analysis when performing this review.16 A research librarian (WT) conducted serial searches for studies reporting the use of bedside visual tools for hospitalized patients in Medline (via OVID), Embase, SCOPUS, Web of Science, CINAHL, and Cochrane DSR and CENTRAL. Controlled vocabularies (ie, Medical Subject Headings terms) were used to identify synonyms for visual tools of interest. Additional studies were identified manually through bibliographies and meeting abstracts. No study design, publication date, or language restrictions were placed on the search, which was conducted between April 2016 and February 2017 (see supplementary Appendix A).
Study Selection
Two reviewers (AG and KT) independently assessed study eligibility; discrepancies were resolved by a third reviewer (VC). We included all adult or pediatric English language studies in which the effect of visual tool(s) on patient outcomes was reported. Visual tools were defined as the bedside display of information or an instrument given to patients to convey information regarding providers or medical care. Patient-reported outcomes included the following: (a) physician identification, (b) understanding of provider roles, (c) patient–provider communication, and (d) patient satisfaction with care. Providers were defined as physicians, residents, interns, medical students, nurse practitioners, or nurses. We excluded studies that were not original research (eg, conference abstracts, not peer reviewed), reported qualitative data without quantitative outcomes, or did not include a bedside visual tool. Given our interest in hospitalized general medicine patients, studies conducted in emergency departments, surgical units, obstetrics and gynecology wards, and intensive care units were excluded.
Data Extraction and Analysis
Data were extracted independently and in duplicate from all studies by using a template adapted from the Cochrane Collaboration.17 For all studies, we abstracted study design, type of visual tool (eg, whiteboards), unit setting (eg, medical), population studied (eg, adult vs pediatric), and outcomes reported (ie, physician identification, understanding of provider roles, communication, and satisfaction with care). Reviewers independently assessed and categorized the impact of tools on reported outcomes.
To standardize and compare outcomes across studies, the following were used to denote a positive association between visual tools and relevant outcomes: a greater number of physicians correctly identified by name/picture or title/role; the use of terms such as “high,” “agreed,” or “significant” on surveys; or ≥4 Likert scores for domains of identification, understanding of roles, communication, and satisfaction with care. Conversely, the inability to identify providers compared to the control/baseline; poor recall of titles/roles; lower Likert-scale scores (ie, ≤2); or survey terms such as “poor,” “disagreed,” or “insignificant” were considered to connote negative impact. Studies in which Likert scores were rated neither high nor low (ie, 3), or in which patients neither agreed nor disagreed on value were considered neutral.
Owing to clinical heterogeneity within studies, meta-analyses were not performed. Descriptive statistics were used to describe study outcomes. A priori18 studies were evaluated according to the following categories: design (eg, randomized vs observational), outcomes (eg, patient satisfaction), intervention (type of visual tool), and patient population (adult or pediatric). Because pediatric patients have underdeveloped communication skills and include parents and/or guardians, data from pediatric studies were tabulated and reported separately to those from adult studies.
Quality Assessment
As recommended by the Cochrane Collaboration, 2 reviewers (AG, KT) assessed the risk of study bias by using the Downs and Black Scale.17,19 Discrepancies in assessment were resolved by a third reviewer (VC). This instrument uses a point-based system to estimate the quality of a study by rating domains such as internal and external validity, bias, and confounding. In keeping with prior systematic reviews,18,20,21 studies with a score of ≥18 were considered high quality. Interrater agreement for the adjudication of study quality was calculated using the Cohen κ statistic.
RESULTS
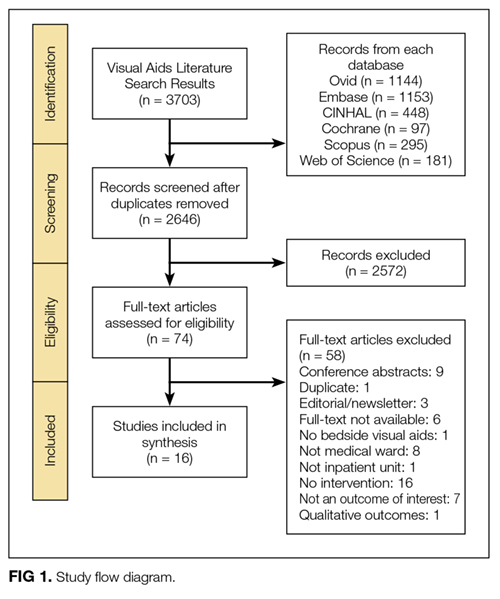


STUDIES OF ADULT HOSPITALIZED PATIENTS
Eleven studies were conducted on adult hospitalized patients 12-14,22-24,26,27,29,30,33 and included 3 randomized controlled studies.14,27,33
Results by Outcomes Provider Identification Nine studies measured patients’ ability to identify providers with the use of visual aids, and all 9 reported improvements in this outcome. Visual tools used to measure provider identification included pictures (n = 5),13,14,23,27,33 whiteboards (n = 3),12,22,30 and patient portals (n = 1).26 Within studies that used pictures, individual pictures (n = 2)13,23 and handouts with pictures of multiple providers (n = 3) were used.14,27,33 In 2 studies, care team members such as a dietitian, physiotherapist or pharmacist, were included when measuring identification.14,33
Understanding Providers’ RolesSix studies assessed the effect of visual tools on patients’ understanding of provider roles.13,14,22,26,27,33 Four studies reported a positive effect with the use of pictures,27,33 whiteboards,22 and patient portals.26 However, 2 studies reported either no difference or negative impressions. Appel et al.14 reported no difference in the understanding of physician roles using a handout of providers’ pictures and titles. Arora et al.13 used individual pictures of physicians with descriptions of roles and found a negative association, as demonstrated by fewer patients rating their understanding of physicians’ roles as excellent or very good in the intervention period (45.6%) compared with the baseline (55.3%).
Patient–Provider Communication
Three studies evaluated the influence of visual tools on communication.14,24,29 Using pictures, Appel et al.14 found no difference in the perceived quality of communication. Singh et al.29 used whiteboards and reported improved communication scores for physicians and nurses. With notepads, patients surveyed by Farberg et al.24 stated that the tool improved provider communication.
Patient Satisfaction
Five studies assessed patient satisfaction related to the use of visual tools. 22,23,27,30,33 One study reported satisfaction as positive with the use of individual pictures.23 Two studies that used handouts with pictures of all team members reported either a positive33 or neutral27 impact on satisfaction. Studies that used whiteboards reported a positive association with satisfaction22,30 despite differences in content, such as the inclusion of prewritten prompts for writing goals of care and scheduled tests30 versus the name of the nurse and their education level.22
Results by Type of Visual Tool Pictures
Five studies that used pictures reported a positive effect on provider identification.13,14,23,27,33 Two27,33 of 4 studies13,14,27,33 that assessed patients’ understanding of team member roles reported a positive influence, while 1 reported no difference.14 A fourth study demonstrated a negative association, perhaps due to differences in the description of providers’ roles listed on the tool.13 Only 1 study examined the influence of pictures on patient–provider communication, and this study found no difference.14 Satisfaction with care via the use of pictures varied between positive (2 studies)23,33 and neutral (1 study).27
Whiteboards
Four studies tested the use of whiteboards; of these, 3 reported a positive influence on provider identification.12,22,30 One study reported a positive impact on patient–provider communication.29 Two studies noted a positive effect on patient satisfaction.22,30 Notably, the responsibility for updating whiteboards differed between the studies (ie, nurses only22 vs residents, medical students, and nurses).30
Patient Portal
In 1 study, an electronic portal that included names with pictures of providers, descriptions of their roles, lists of medications, and scheduled tests and/or procedures was used as a visual tool. The portal improved patients’ identification of physicians and patients’ understanding of roles. However, improvements in the knowledge of medication changes and planned tests and/or procedures during hospitalization were not observed.26 This finding would suggest limitations in the hospitalized patient’s knowledge of the plan of care, which could potentially weaken patient–provider communication.
Notepads
Only 1 study assessed the use of formatted notepads on patient–provider communication and noted a positive association. Notepads used prompts for different categories (eg, diagnosis/treatment, medications, etc) to encourage patient questions for providers.24
STUDIES OF PEDIATRIC HOSPITALIZED PATIENTS
Five studies were conducted on hospitalized pediatric units.15,25,28,31,32 All studies surveyed the parents, guardians, or caregivers of pediatric patients. One study excluded patients ≥12 years of age because of legal differences in access to adolescent health information,32 while another interviewed parents and/or guardians of teenagers.15
Results by Outcomes Provider Identification and Understanding of Physicians’ Roles
Four studies that assessed the influence of visual tools on provider identification and understanding of roles reported a positive association.15,25,28,31 Visual tools varied between pictures (n = 2),15,31 patient portal (n = 1),28 and whiteboards and pictures combined (n = 1).25 The measurement of outcomes varied between surveys with free text responses,28 multiple choice questions,25 and 1-5 Likert scales.15,31
Patient–Provider Communication
Two studies assessed the impact of patient portal use on communication and reported a positive association.28,32 The 2 portals autopopulated names, pictures, and roles of providers from electronic medical records. Singh et al.28 used a portal that was also available in Spanish and accommodated for non-English speakers. Kelly et al.32 reported that 90% of parents perceived that portal use was associated with reduced errors in care, with 8% finding errors in their child’s medication list.
Patient Satisfaction
Three studies assessed patient satisfaction via the use of visual tools.15,28,31 Singh et al.28 noted a positive influence on satisfaction via a patient portal. Dudas et al.15 used a single-page handout with names and pictures of each provider, along with information regarding the training and roles of each provider. Distribution of these handouts to patients by investigators led to a positive influence on satisfaction. While Unaka et al.31 used a similar handout, they asked residents to distribute them and found no significant difference in satisfaction scores between the intervention (66%) and control group (62%).
Results by Type of Visual Tool Pictures
Two studies reported a positive impact on provider identification and understanding of roles with the use of pictures.15,31 Dudas et al.15 demonstrated a 4.8-fold increase in the odds of parents identifying a medical student, as compared with the control. Similarly, after adjusting for length of stay and prior hospitalization, Unaka et al.31 reported that a higher percentage of patients correctly identified providers using this approach.
Whiteboard and Picture
One study evaluated the simultaneous use of whiteboards and pictures to improve the identification of providers. The study noted improved identification of supervising doctors and increased recognition of roles for supervising doctors, residents, and medical students.25
Patient Portal
Two studies used patient portals as visual tools. Singh et al.28 assessed the use of a patient portal with names, roles, and pictures of treatment team members. Use of this tool was positively associated with provider identification, understanding of roles, communication, and satisfaction. Kelly et al.32 noted that 60% of parents felt that portal use improved healthcare team communication.
RISK OF STUDY BIAS
The risk of bias was assessed for both adult and pediatric studies in aggregate. The average risk of bias using the Downs and Black Scale was 17.81 (range 14-22, standard deviation [SD] 2.20). Of the 16 included studies, 9 were rated at a low risk of bias (score
- >
18).13-15,26-31 Risk of bias was greatest for measures of external validity (mean 2.88, range 2-3, SD 0.34), internal validity (mean 4.06, range 3-6, SD 1.00), and confounding (mean 2.69, range 1-6, SD 1.35). Two of 3 randomized controlled trials had a low risk of bias.14,27 Interrater reliability for study quality adjudication was 0.90, suggesting excellent agreement (see supplementary Appendix B).
DISCUSSION
In this systematic review, the effects of visual tools on outcomes, such as provider identification, understanding of roles, patient–provider communication, and satisfaction with care, were variable. The majority of included studies were conducted on adult patients (n = 11).12-14,22-24,26,27,29,30,33 Pictures were the most frequently used tool (n = 7)13-15,23,27,31,33 and consequently had the greatest sample size across the review (n = 1297). While pictures had a positive influence on provider identification in all studies, comprehension of provider roles and satisfaction were variable. Although the content of whiteboards varied between studies, they showed favorable effects on provider identification (3 of 4 studies)12,22,30 and satisfaction (2 of 2 studies).22,30 While electronic medical record-based tools had a positive influence on outcomes,26,28 only 1 accounted for language preferences.28 Formatted notepads positively influenced patient–provider communication, but their use was limited by literacy.24 Collectively, these data suggest that visual tools have varying effects on patient-reported outcomes, likely owing to differences in study design, interventions, and evaluation methods.
Theoretically, visual tools should facilitate easier identification of providers and engender collaborative relationships. However, such tools do not replace face-to-face patient–provider and family discussions. Rather, these enhancements best serve as a medium to asynchronously display information to patients and family members. Indeed, within the included studies, we found that the use of visual tools was effective in improving satisfaction (6/8 studies), identification (13/13 studies), and understanding of provider roles (8/10 studies). Thus, it is reasonable to say that, in conjunction with excellent clinical care, these tools have an important role in improving care delivery in the hospital.
Despite this promise, we noted that the effectiveness of individual tools varied, a fact that may relate to differences across studies. First, inconsistencies in the format and/or content of the tools were noted. For example, within studies using pictures, tools varied from individual photographs of each team member13,23 to 1-page handouts with pictures of all team members.14,15,31 Such differences in presentation could affect spatial recognition in identifying providers, as single photos are known to be easier to process than multiple images at the same time.34 Second, no study evaluated patient preference of a visual tool. Thus, personal preferences for pictures versus whiteboards versus electronic modalities or a combination of tools might affect outcomes. Additionally, the utility of visual tools in visually impaired, confused, or non-English-speaking patients may limit effectiveness. Future studies that address these aspects and account for patient preferences may better elucidate the role of visual tools in hospitals.
Our results should be considered in the context of several limitations. First, only 3 studies used randomized trial designs; thus, confounding from unmeasured variables inherent to observational designs is possible. Second, none of the interventions tested were blinded to providers, raising the possibility of a Hawthorne effect (ie, alteration of provider behavior in response to awareness of being observed).35 Third, all studies were conducted at single centers, and only 9 of 16 studies were rated at a low risk of bias; thus, caution in broad extrapolations of this literature is necessary.
However, our study has several strengths, including a thorough search of heterogeneous literature, inclusion of both adult and pediatric populations, and a focus on myriad patient-reported outcomes. Second, by contrasting outcomes and measurement strategies across studies, our review helps explicate differences in results related to variation in outcome measurement or presentation of visual data. Third, because we frame results by outcome and type of visual tool used, we are able to identify strengths and weaknesses of individual tools in novel ways. Finally, our data suggest that the use of picture-based techniques and whiteboards are among the most promising visual interventions. Future studies that pair graphic designers with patients to improve the layout of these tools might prove valuable. Additionally, because the measurement of outcomes is confounded by aspects such as lack of controls, severity of illness, and language barriers, a randomized design would help provide greater clarity regarding effectiveness.
In conclusion, we found that visual tools appear to foster recognition of providers and understanding of their roles. However, variability of format, content, and measurement of outcomes hinders the identification of a single optimal approach. Future work using randomized controlled trial designs and standardized tools and measurements would be welcomed.
Acknowledgments
The authors thank Laura Appel, Kevin O’Leary, and Siddharth Singh for providing unpublished data and clarifications to help these analyses.
Disclosure
Anupama Goyal is the guarantor. Anupama Goyal and Komalpreet Tur performed primary data abstraction and analysis. Anupama Goyal, Scott Flanders, Jason Mann, and Vineet Chopra drafted the manuscript. All authors contributed to the development of the selection criteria, the risk of bias assessment strategy, and the data extraction criteria. Anupama Goyal, Jason Mann, Whitney Townsend, and Vineet Chopra developed the search strategy. Vineet Chopra provided systematic review expertise. All authors read, provided feedback, and approved the final manuscript. The authors declare that they have no conflicts of interest.
1. Berwick DM. A user’s manual for the IOM’s ‘Quality Chasm’ report. Health Aff (Millwood). 2002;21(3):80-90. PubMed
2. Jha AK, Orav EJ, Zheng J, Epstein AM. Patients’ perception of hospital care in the United States. N Engl J Med. 2008;359(18):1921-1931. PubMed
3. Boulding W, Glickman SW, Manary MP, Schulman KA, Staelin R. Relationship between patient satisfaction with inpatient care and hospital readmission within 30 days. Am J Manag Care. 2011;17(1):41-48. PubMed
4. Little P, Everitt H, Williamson I, et al. Observational study of effect of patient centredness and positive approach on outcomes of general practice consultations. BMJ. 2001;323(7318):908-911. PubMed
5. Stewart MA. Effective physician-patient communication and health outcomes: a review. CMAJ. 1995;152(9):1422-1433. PubMed
6. Arora V, Johnson J, Lovinger D, Humphrey HJ, Meltzer DO. Communication failures in patient sign-out and suggestions for improvement: a critical incident analysis. Qual Saf Health Care. 2005;14(6):401-407. PubMed
7. Leonard M, Graham S, Bonacum D. The human factor: the critical importance of effective teamwork and communication in providing safe care. Qual Saf Health Care. 2004;13 Suppl 1:i85-i90. PubMed
8. Alam M, Lee A, Ibrahimi OA, et al. A multistep approach to improving biopsy site identification in dermatology: physician, staff, and patient roles based on a Delphi consensus. JAMA Dermatol. 2014;150(5):550-558. PubMed
9. Arora V, Gangireddy S, Mehrotra A, Ginde R, Tormey M, Meltzer D. Ability of hospitalized patients to identify their in-hospital physicians. Arch Intern Med. 2009;169(2):199-201. PubMed
10. Makaryus AN, Friedman EA. Does your patient know your name? An approach to enhancing patients’ awareness of their caretaker’s name. J Healthc Qual. 2005;27(4):53-56. PubMed
11. Sehgal NL, Green A, Vidyarthi AR, Blegen MA, Wachter RM. Patient whiteboards as a communication tool in the hospital setting: a survey of practices and recommendations. J Hosp Med. 2010;5(4):234-239. PubMed
12. Maniaci MJ, Heckman MG, Dawson NL. Increasing a patient’s ability to identify his or her attending physician using a patient room display. Arch Intern Med. 2010;170:1084-1085. PubMed
13. Arora VM, Schaninger C, D’Arcy M, et al. Improving inpatients’ identification of their doctors: Use of FACE™ cards. Jt Comm J Qual Patient Saf. 2009;35(12):613-619. PubMed
14. Appel L, Abrams H, Morra D, Wu RC. Put a face to a name: a randomized controlled trial evaluating the impact of providing clinician photographs on inpatients’ recall. Am J Med. 2015;128(1):82-89. PubMed
15. Dudas RA, Lemerman H, Barone M, Serwint JR. PHACES (Photographs of Academic Clinicians and Their Educational Status): a tool to improve delivery of family-centered care. Acad Pediatr. 2010;10(2):138-145. PubMed
16. Moher D, Liberati A, Tetzlaff J, Altman DG, PRISMA Group. Preferred reporting items for systematic reviews and meta-analyses: the PRISMA statement. Ann Intern Med. 2009;151(4):264-269. PubMed
17. Higgins JP, Green S, editors. Cochrane handbook for systematic reviews of interventions. West Sussex, UK: The Cochrane Collaboration and Wiley Online Library; 2008.
18. Petrilli CM, Mack M, Petrilli JJ, Hickner A, Saint S, Chopra V. Understanding the role of physician attire on patient perceptions: a systematic review of the literature—targeting attire to improve likelihood of rapport (TAILOR) investigators. BMJ Open. 2015;5(1):e006578. PubMed
19. Downs SH, Black N. The feasibility of creating a checklist for the assessment of the methodological quality both of randomised and non-randomised studies of health care interventions. J Epidemiol Community Health. 1998;52(6):377-384. PubMed
20. Seyffert M, Lagisetty P, Landgraf J, et al. Internet-delivered cognitive behavioral therapy to treat insomnia: a systematic review and meta-analysis. PLoS One. 2016;11(2):e0149139. PubMed
21. Patel R, Chang T, Greysen SR, Chopra V. Social media use in chronic disease: a systematic review and novel taxonomy. Am J Med. 2015;128(12):1335-1350. PubMed
22. Carlin BJ. Using whiteboards: fixed identities. Am J Nurs. 2008;108(11):72A-72B, 72D-72E. PubMed
23. Francis JJ, Pankratz VS, Huddleston JM. Patient satisfaction associated with correct identification of physician’s photographs. Mayo Clin Proc. 2001;76(6):604-608. PubMed
24. Farberg AS, Lin AM, Kuhn L, Flanders SA, Kim CS. Dear Doctor: a tool to facilitate patient-centered communication. J Hosp Med. 2013;8(10):553-558. PubMed
25. Hayes RM, Wickline A, Hensley C, et al. A quality improvement project to improve family recognition of medical team member roles. Hosp Pediatr. 2015;5(9):480-486. PubMed
26. O’Leary KJ, Lohman ME, Culver E, Killarney A, Randy Smith G Jr, Liebovitz DM. The effect of tablet computers with a mobile patient portal application on hospitalized patients’ knowledge and activation. J Am Med Inform Assoc. 2016;23(1):159-165. PubMed
27. Simons Y, Caprio T, Furiasse N, Kriss M, Williams MV, O’Leary KJ. The impact of facecards on patients’ knowledge, satisfaction, trust, and agreement with hospital physicians: a pilot study. J Hosp Med. 2014;9(3):137-141. PubMed
28. Singh A, Rhee KE, Brennan JJ, Kuelbs C, El-Kareh R, Fisher ES. Who’s my doctor? Using an electronic tool to improve team member identification on an inpatient pediatrics team. Hosp Pediatr. 2016;6(3):157-165. PubMed
29. Singh S, Fletcher KE, Pandl GJ, et al. It’s the writing on the wall: whiteboards improve inpatient satisfaction with provider communication. Am J Med Qual. 2011;26(2):127-131. PubMed
30. Tan M, Hooper Evans K, Braddock CH 3rd, Shieh L. Patient whiteboards to improve patient-centred care in the hospital. Postgrad Med J. 2013;89(1056):604-609. PubMed
31. Unaka NI, White CM, Sucharew HJ, Yau C, Clark SL, Brady PW. Effect of a face sheet tool on medical team provider identification and family satisfaction. J Hosp Med. 2014;9(3):186-188. PubMed
32. Kelly MM, Hoonakker PL, Dean SM. Using an inpatient portal to engage families in pediatric hospital care. J Am Med Inform Assoc. 2017;24(1):153-161. PubMed
33. Brener MI, Epstein JA, Cho J, Yeh HC, Dudas RA, Feldman L. Faces of all clinically engaged staff: a quality improvement project that enhances the hospitalised patient experience. Int J Clin Pract. 2016;70(11):923-929. PubMed
34. De Valois RL, De Valois KK. Spatial vision. Annu Rev Psychol. 1980;31:309-341. PubMed
Patient satisfaction with medical care during hospitalization is a common quality metric.1,2 Studies showing higher patient satisfaction have reported lower 30-day hospital readmissions3 and improved overall health.4,5 Conversely, communication failures are associated with dissatisfaction among hospitalized patients and adverse outcomes.6,7 A lack of familiarity with hospital providers weakens collaborative decision making and prevents high-quality patient care.8,9
Bedside visual tools, such as whiteboards and pictures of medical staff, have been widely used to enhance communication between patients, families, and providers.10,11 Results of studies evaluating these tools are varied. For example, 1 study found that 98% of patients were better able to identify physicians when their names were written on whiteboards.12 Yet in another, only 21.1% of patients were more likely to correctly identify ≥1 physicians using pictures.13 Thus, despite widespread use,11 whether visual tools improve patient satisfaction and patient care more broadly remains unclear.14,15
We performed a systematic review to answer the following 3 questions: first, what is the effect of visual tools on outcomes (ie, provider identification, understanding of providers’ roles, patient–provider communication, and satisfaction); second, does impact vary by type of visual tool (eg, whiteboards vs pictures of providers); and third, what factors (eg, study design, patient population) are associated with provider identification, communication, and patient satisfaction?
METHODS
Search Strategy
We used the Preferred Reporting Items for Systematic Reviews and Meta-Analysis when performing this review.16 A research librarian (WT) conducted serial searches for studies reporting the use of bedside visual tools for hospitalized patients in Medline (via OVID), Embase, SCOPUS, Web of Science, CINAHL, and Cochrane DSR and CENTRAL. Controlled vocabularies (ie, Medical Subject Headings terms) were used to identify synonyms for visual tools of interest. Additional studies were identified manually through bibliographies and meeting abstracts. No study design, publication date, or language restrictions were placed on the search, which was conducted between April 2016 and February 2017 (see supplementary Appendix A).
Study Selection
Two reviewers (AG and KT) independently assessed study eligibility; discrepancies were resolved by a third reviewer (VC). We included all adult or pediatric English language studies in which the effect of visual tool(s) on patient outcomes was reported. Visual tools were defined as the bedside display of information or an instrument given to patients to convey information regarding providers or medical care. Patient-reported outcomes included the following: (a) physician identification, (b) understanding of provider roles, (c) patient–provider communication, and (d) patient satisfaction with care. Providers were defined as physicians, residents, interns, medical students, nurse practitioners, or nurses. We excluded studies that were not original research (eg, conference abstracts, not peer reviewed), reported qualitative data without quantitative outcomes, or did not include a bedside visual tool. Given our interest in hospitalized general medicine patients, studies conducted in emergency departments, surgical units, obstetrics and gynecology wards, and intensive care units were excluded.
Data Extraction and Analysis
Data were extracted independently and in duplicate from all studies by using a template adapted from the Cochrane Collaboration.17 For all studies, we abstracted study design, type of visual tool (eg, whiteboards), unit setting (eg, medical), population studied (eg, adult vs pediatric), and outcomes reported (ie, physician identification, understanding of provider roles, communication, and satisfaction with care). Reviewers independently assessed and categorized the impact of tools on reported outcomes.
To standardize and compare outcomes across studies, the following were used to denote a positive association between visual tools and relevant outcomes: a greater number of physicians correctly identified by name/picture or title/role; the use of terms such as “high,” “agreed,” or “significant” on surveys; or ≥4 Likert scores for domains of identification, understanding of roles, communication, and satisfaction with care. Conversely, the inability to identify providers compared to the control/baseline; poor recall of titles/roles; lower Likert-scale scores (ie, ≤2); or survey terms such as “poor,” “disagreed,” or “insignificant” were considered to connote negative impact. Studies in which Likert scores were rated neither high nor low (ie, 3), or in which patients neither agreed nor disagreed on value were considered neutral.
Owing to clinical heterogeneity within studies, meta-analyses were not performed. Descriptive statistics were used to describe study outcomes. A priori18 studies were evaluated according to the following categories: design (eg, randomized vs observational), outcomes (eg, patient satisfaction), intervention (type of visual tool), and patient population (adult or pediatric). Because pediatric patients have underdeveloped communication skills and include parents and/or guardians, data from pediatric studies were tabulated and reported separately to those from adult studies.
Quality Assessment
As recommended by the Cochrane Collaboration, 2 reviewers (AG, KT) assessed the risk of study bias by using the Downs and Black Scale.17,19 Discrepancies in assessment were resolved by a third reviewer (VC). This instrument uses a point-based system to estimate the quality of a study by rating domains such as internal and external validity, bias, and confounding. In keeping with prior systematic reviews,18,20,21 studies with a score of ≥18 were considered high quality. Interrater agreement for the adjudication of study quality was calculated using the Cohen κ statistic.
RESULTS
STUDIES OF ADULT HOSPITALIZED PATIENTS
Eleven studies were conducted on adult hospitalized patients 12-14,22-24,26,27,29,30,33 and included 3 randomized controlled studies.14,27,33
Results by Outcomes Provider Identification Nine studies measured patients’ ability to identify providers with the use of visual aids, and all 9 reported improvements in this outcome. Visual tools used to measure provider identification included pictures (n = 5),13,14,23,27,33 whiteboards (n = 3),12,22,30 and patient portals (n = 1).26 Within studies that used pictures, individual pictures (n = 2)13,23 and handouts with pictures of multiple providers (n = 3) were used.14,27,33 In 2 studies, care team members such as a dietitian, physiotherapist or pharmacist, were included when measuring identification.14,33
Understanding Providers’ RolesSix studies assessed the effect of visual tools on patients’ understanding of provider roles.13,14,22,26,27,33 Four studies reported a positive effect with the use of pictures,27,33 whiteboards,22 and patient portals.26 However, 2 studies reported either no difference or negative impressions. Appel et al.14 reported no difference in the understanding of physician roles using a handout of providers’ pictures and titles. Arora et al.13 used individual pictures of physicians with descriptions of roles and found a negative association, as demonstrated by fewer patients rating their understanding of physicians’ roles as excellent or very good in the intervention period (45.6%) compared with the baseline (55.3%).
Patient–Provider Communication
Three studies evaluated the influence of visual tools on communication.14,24,29 Using pictures, Appel et al.14 found no difference in the perceived quality of communication. Singh et al.29 used whiteboards and reported improved communication scores for physicians and nurses. With notepads, patients surveyed by Farberg et al.24 stated that the tool improved provider communication.
Patient Satisfaction
Five studies assessed patient satisfaction related to the use of visual tools. 22,23,27,30,33 One study reported satisfaction as positive with the use of individual pictures.23 Two studies that used handouts with pictures of all team members reported either a positive33 or neutral27 impact on satisfaction. Studies that used whiteboards reported a positive association with satisfaction22,30 despite differences in content, such as the inclusion of prewritten prompts for writing goals of care and scheduled tests30 versus the name of the nurse and their education level.22
Results by Type of Visual Tool Pictures
Five studies that used pictures reported a positive effect on provider identification.13,14,23,27,33 Two27,33 of 4 studies13,14,27,33 that assessed patients’ understanding of team member roles reported a positive influence, while 1 reported no difference.14 A fourth study demonstrated a negative association, perhaps due to differences in the description of providers’ roles listed on the tool.13 Only 1 study examined the influence of pictures on patient–provider communication, and this study found no difference.14 Satisfaction with care via the use of pictures varied between positive (2 studies)23,33 and neutral (1 study).27
Whiteboards
Four studies tested the use of whiteboards; of these, 3 reported a positive influence on provider identification.12,22,30 One study reported a positive impact on patient–provider communication.29 Two studies noted a positive effect on patient satisfaction.22,30 Notably, the responsibility for updating whiteboards differed between the studies (ie, nurses only22 vs residents, medical students, and nurses).30
Patient Portal
In 1 study, an electronic portal that included names with pictures of providers, descriptions of their roles, lists of medications, and scheduled tests and/or procedures was used as a visual tool. The portal improved patients’ identification of physicians and patients’ understanding of roles. However, improvements in the knowledge of medication changes and planned tests and/or procedures during hospitalization were not observed.26 This finding would suggest limitations in the hospitalized patient’s knowledge of the plan of care, which could potentially weaken patient–provider communication.
Notepads
Only 1 study assessed the use of formatted notepads on patient–provider communication and noted a positive association. Notepads used prompts for different categories (eg, diagnosis/treatment, medications, etc) to encourage patient questions for providers.24
STUDIES OF PEDIATRIC HOSPITALIZED PATIENTS
Five studies were conducted on hospitalized pediatric units.15,25,28,31,32 All studies surveyed the parents, guardians, or caregivers of pediatric patients. One study excluded patients ≥12 years of age because of legal differences in access to adolescent health information,32 while another interviewed parents and/or guardians of teenagers.15
Results by Outcomes Provider Identification and Understanding of Physicians’ Roles
Four studies that assessed the influence of visual tools on provider identification and understanding of roles reported a positive association.15,25,28,31 Visual tools varied between pictures (n = 2),15,31 patient portal (n = 1),28 and whiteboards and pictures combined (n = 1).25 The measurement of outcomes varied between surveys with free text responses,28 multiple choice questions,25 and 1-5 Likert scales.15,31
Patient–Provider Communication
Two studies assessed the impact of patient portal use on communication and reported a positive association.28,32 The 2 portals autopopulated names, pictures, and roles of providers from electronic medical records. Singh et al.28 used a portal that was also available in Spanish and accommodated for non-English speakers. Kelly et al.32 reported that 90% of parents perceived that portal use was associated with reduced errors in care, with 8% finding errors in their child’s medication list.
Patient Satisfaction
Three studies assessed patient satisfaction via the use of visual tools.15,28,31 Singh et al.28 noted a positive influence on satisfaction via a patient portal. Dudas et al.15 used a single-page handout with names and pictures of each provider, along with information regarding the training and roles of each provider. Distribution of these handouts to patients by investigators led to a positive influence on satisfaction. While Unaka et al.31 used a similar handout, they asked residents to distribute them and found no significant difference in satisfaction scores between the intervention (66%) and control group (62%).
Results by Type of Visual Tool Pictures
Two studies reported a positive impact on provider identification and understanding of roles with the use of pictures.15,31 Dudas et al.15 demonstrated a 4.8-fold increase in the odds of parents identifying a medical student, as compared with the control. Similarly, after adjusting for length of stay and prior hospitalization, Unaka et al.31 reported that a higher percentage of patients correctly identified providers using this approach.
Whiteboard and Picture
One study evaluated the simultaneous use of whiteboards and pictures to improve the identification of providers. The study noted improved identification of supervising doctors and increased recognition of roles for supervising doctors, residents, and medical students.25
Patient Portal
Two studies used patient portals as visual tools. Singh et al.28 assessed the use of a patient portal with names, roles, and pictures of treatment team members. Use of this tool was positively associated with provider identification, understanding of roles, communication, and satisfaction. Kelly et al.32 noted that 60% of parents felt that portal use improved healthcare team communication.
RISK OF STUDY BIAS
The risk of bias was assessed for both adult and pediatric studies in aggregate. The average risk of bias using the Downs and Black Scale was 17.81 (range 14-22, standard deviation [SD] 2.20). Of the 16 included studies, 9 were rated at a low risk of bias (score
- >
18).13-15,26-31 Risk of bias was greatest for measures of external validity (mean 2.88, range 2-3, SD 0.34), internal validity (mean 4.06, range 3-6, SD 1.00), and confounding (mean 2.69, range 1-6, SD 1.35). Two of 3 randomized controlled trials had a low risk of bias.14,27 Interrater reliability for study quality adjudication was 0.90, suggesting excellent agreement (see supplementary Appendix B).
DISCUSSION
In this systematic review, the effects of visual tools on outcomes, such as provider identification, understanding of roles, patient–provider communication, and satisfaction with care, were variable. The majority of included studies were conducted on adult patients (n = 11).12-14,22-24,26,27,29,30,33 Pictures were the most frequently used tool (n = 7)13-15,23,27,31,33 and consequently had the greatest sample size across the review (n = 1297). While pictures had a positive influence on provider identification in all studies, comprehension of provider roles and satisfaction were variable. Although the content of whiteboards varied between studies, they showed favorable effects on provider identification (3 of 4 studies)12,22,30 and satisfaction (2 of 2 studies).22,30 While electronic medical record-based tools had a positive influence on outcomes,26,28 only 1 accounted for language preferences.28 Formatted notepads positively influenced patient–provider communication, but their use was limited by literacy.24 Collectively, these data suggest that visual tools have varying effects on patient-reported outcomes, likely owing to differences in study design, interventions, and evaluation methods.
Theoretically, visual tools should facilitate easier identification of providers and engender collaborative relationships. However, such tools do not replace face-to-face patient–provider and family discussions. Rather, these enhancements best serve as a medium to asynchronously display information to patients and family members. Indeed, within the included studies, we found that the use of visual tools was effective in improving satisfaction (6/8 studies), identification (13/13 studies), and understanding of provider roles (8/10 studies). Thus, it is reasonable to say that, in conjunction with excellent clinical care, these tools have an important role in improving care delivery in the hospital.
Despite this promise, we noted that the effectiveness of individual tools varied, a fact that may relate to differences across studies. First, inconsistencies in the format and/or content of the tools were noted. For example, within studies using pictures, tools varied from individual photographs of each team member13,23 to 1-page handouts with pictures of all team members.14,15,31 Such differences in presentation could affect spatial recognition in identifying providers, as single photos are known to be easier to process than multiple images at the same time.34 Second, no study evaluated patient preference of a visual tool. Thus, personal preferences for pictures versus whiteboards versus electronic modalities or a combination of tools might affect outcomes. Additionally, the utility of visual tools in visually impaired, confused, or non-English-speaking patients may limit effectiveness. Future studies that address these aspects and account for patient preferences may better elucidate the role of visual tools in hospitals.
Our results should be considered in the context of several limitations. First, only 3 studies used randomized trial designs; thus, confounding from unmeasured variables inherent to observational designs is possible. Second, none of the interventions tested were blinded to providers, raising the possibility of a Hawthorne effect (ie, alteration of provider behavior in response to awareness of being observed).35 Third, all studies were conducted at single centers, and only 9 of 16 studies were rated at a low risk of bias; thus, caution in broad extrapolations of this literature is necessary.
However, our study has several strengths, including a thorough search of heterogeneous literature, inclusion of both adult and pediatric populations, and a focus on myriad patient-reported outcomes. Second, by contrasting outcomes and measurement strategies across studies, our review helps explicate differences in results related to variation in outcome measurement or presentation of visual data. Third, because we frame results by outcome and type of visual tool used, we are able to identify strengths and weaknesses of individual tools in novel ways. Finally, our data suggest that the use of picture-based techniques and whiteboards are among the most promising visual interventions. Future studies that pair graphic designers with patients to improve the layout of these tools might prove valuable. Additionally, because the measurement of outcomes is confounded by aspects such as lack of controls, severity of illness, and language barriers, a randomized design would help provide greater clarity regarding effectiveness.
In conclusion, we found that visual tools appear to foster recognition of providers and understanding of their roles. However, variability of format, content, and measurement of outcomes hinders the identification of a single optimal approach. Future work using randomized controlled trial designs and standardized tools and measurements would be welcomed.
Acknowledgments
The authors thank Laura Appel, Kevin O’Leary, and Siddharth Singh for providing unpublished data and clarifications to help these analyses.
Disclosure
Anupama Goyal is the guarantor. Anupama Goyal and Komalpreet Tur performed primary data abstraction and analysis. Anupama Goyal, Scott Flanders, Jason Mann, and Vineet Chopra drafted the manuscript. All authors contributed to the development of the selection criteria, the risk of bias assessment strategy, and the data extraction criteria. Anupama Goyal, Jason Mann, Whitney Townsend, and Vineet Chopra developed the search strategy. Vineet Chopra provided systematic review expertise. All authors read, provided feedback, and approved the final manuscript. The authors declare that they have no conflicts of interest.
1. Berwick DM. A user’s manual for the IOM’s ‘Quality Chasm’ report. Health Aff (Millwood). 2002;21(3):80-90. PubMed
2. Jha AK, Orav EJ, Zheng J, Epstein AM. Patients’ perception of hospital care in the United States. N Engl J Med. 2008;359(18):1921-1931. PubMed
3. Boulding W, Glickman SW, Manary MP, Schulman KA, Staelin R. Relationship between patient satisfaction with inpatient care and hospital readmission within 30 days. Am J Manag Care. 2011;17(1):41-48. PubMed
4. Little P, Everitt H, Williamson I, et al. Observational study of effect of patient centredness and positive approach on outcomes of general practice consultations. BMJ. 2001;323(7318):908-911. PubMed
5. Stewart MA. Effective physician-patient communication and health outcomes: a review. CMAJ. 1995;152(9):1422-1433. PubMed
6. Arora V, Johnson J, Lovinger D, Humphrey HJ, Meltzer DO. Communication failures in patient sign-out and suggestions for improvement: a critical incident analysis. Qual Saf Health Care. 2005;14(6):401-407. PubMed
7. Leonard M, Graham S, Bonacum D. The human factor: the critical importance of effective teamwork and communication in providing safe care. Qual Saf Health Care. 2004;13 Suppl 1:i85-i90. PubMed
8. Alam M, Lee A, Ibrahimi OA, et al. A multistep approach to improving biopsy site identification in dermatology: physician, staff, and patient roles based on a Delphi consensus. JAMA Dermatol. 2014;150(5):550-558. PubMed
9. Arora V, Gangireddy S, Mehrotra A, Ginde R, Tormey M, Meltzer D. Ability of hospitalized patients to identify their in-hospital physicians. Arch Intern Med. 2009;169(2):199-201. PubMed
10. Makaryus AN, Friedman EA. Does your patient know your name? An approach to enhancing patients’ awareness of their caretaker’s name. J Healthc Qual. 2005;27(4):53-56. PubMed
11. Sehgal NL, Green A, Vidyarthi AR, Blegen MA, Wachter RM. Patient whiteboards as a communication tool in the hospital setting: a survey of practices and recommendations. J Hosp Med. 2010;5(4):234-239. PubMed
12. Maniaci MJ, Heckman MG, Dawson NL. Increasing a patient’s ability to identify his or her attending physician using a patient room display. Arch Intern Med. 2010;170:1084-1085. PubMed
13. Arora VM, Schaninger C, D’Arcy M, et al. Improving inpatients’ identification of their doctors: Use of FACE™ cards. Jt Comm J Qual Patient Saf. 2009;35(12):613-619. PubMed
14. Appel L, Abrams H, Morra D, Wu RC. Put a face to a name: a randomized controlled trial evaluating the impact of providing clinician photographs on inpatients’ recall. Am J Med. 2015;128(1):82-89. PubMed
15. Dudas RA, Lemerman H, Barone M, Serwint JR. PHACES (Photographs of Academic Clinicians and Their Educational Status): a tool to improve delivery of family-centered care. Acad Pediatr. 2010;10(2):138-145. PubMed
16. Moher D, Liberati A, Tetzlaff J, Altman DG, PRISMA Group. Preferred reporting items for systematic reviews and meta-analyses: the PRISMA statement. Ann Intern Med. 2009;151(4):264-269. PubMed
17. Higgins JP, Green S, editors. Cochrane handbook for systematic reviews of interventions. West Sussex, UK: The Cochrane Collaboration and Wiley Online Library; 2008.
18. Petrilli CM, Mack M, Petrilli JJ, Hickner A, Saint S, Chopra V. Understanding the role of physician attire on patient perceptions: a systematic review of the literature—targeting attire to improve likelihood of rapport (TAILOR) investigators. BMJ Open. 2015;5(1):e006578. PubMed
19. Downs SH, Black N. The feasibility of creating a checklist for the assessment of the methodological quality both of randomised and non-randomised studies of health care interventions. J Epidemiol Community Health. 1998;52(6):377-384. PubMed
20. Seyffert M, Lagisetty P, Landgraf J, et al. Internet-delivered cognitive behavioral therapy to treat insomnia: a systematic review and meta-analysis. PLoS One. 2016;11(2):e0149139. PubMed
21. Patel R, Chang T, Greysen SR, Chopra V. Social media use in chronic disease: a systematic review and novel taxonomy. Am J Med. 2015;128(12):1335-1350. PubMed
22. Carlin BJ. Using whiteboards: fixed identities. Am J Nurs. 2008;108(11):72A-72B, 72D-72E. PubMed
23. Francis JJ, Pankratz VS, Huddleston JM. Patient satisfaction associated with correct identification of physician’s photographs. Mayo Clin Proc. 2001;76(6):604-608. PubMed
24. Farberg AS, Lin AM, Kuhn L, Flanders SA, Kim CS. Dear Doctor: a tool to facilitate patient-centered communication. J Hosp Med. 2013;8(10):553-558. PubMed
25. Hayes RM, Wickline A, Hensley C, et al. A quality improvement project to improve family recognition of medical team member roles. Hosp Pediatr. 2015;5(9):480-486. PubMed
26. O’Leary KJ, Lohman ME, Culver E, Killarney A, Randy Smith G Jr, Liebovitz DM. The effect of tablet computers with a mobile patient portal application on hospitalized patients’ knowledge and activation. J Am Med Inform Assoc. 2016;23(1):159-165. PubMed
27. Simons Y, Caprio T, Furiasse N, Kriss M, Williams MV, O’Leary KJ. The impact of facecards on patients’ knowledge, satisfaction, trust, and agreement with hospital physicians: a pilot study. J Hosp Med. 2014;9(3):137-141. PubMed
28. Singh A, Rhee KE, Brennan JJ, Kuelbs C, El-Kareh R, Fisher ES. Who’s my doctor? Using an electronic tool to improve team member identification on an inpatient pediatrics team. Hosp Pediatr. 2016;6(3):157-165. PubMed
29. Singh S, Fletcher KE, Pandl GJ, et al. It’s the writing on the wall: whiteboards improve inpatient satisfaction with provider communication. Am J Med Qual. 2011;26(2):127-131. PubMed
30. Tan M, Hooper Evans K, Braddock CH 3rd, Shieh L. Patient whiteboards to improve patient-centred care in the hospital. Postgrad Med J. 2013;89(1056):604-609. PubMed
31. Unaka NI, White CM, Sucharew HJ, Yau C, Clark SL, Brady PW. Effect of a face sheet tool on medical team provider identification and family satisfaction. J Hosp Med. 2014;9(3):186-188. PubMed
32. Kelly MM, Hoonakker PL, Dean SM. Using an inpatient portal to engage families in pediatric hospital care. J Am Med Inform Assoc. 2017;24(1):153-161. PubMed
33. Brener MI, Epstein JA, Cho J, Yeh HC, Dudas RA, Feldman L. Faces of all clinically engaged staff: a quality improvement project that enhances the hospitalised patient experience. Int J Clin Pract. 2016;70(11):923-929. PubMed
34. De Valois RL, De Valois KK. Spatial vision. Annu Rev Psychol. 1980;31:309-341. PubMed
© 2017 Society of Hospital Medicine
A Longitudinal Study of Transfusion Utilization in Hospitalized Veterans
Abstract
- Background: Although transfusion guidelines have changed considerably over the past 2 decades, the adoption of patient blood management programs has not been fully realized across hospitals in the United States.
- Objective: To evaluate trends in red blood cell (RBC), platelet, and plasma transfusion at 3 Veterans Health Administration (VHA) hospitals from 2000 through 2010.
- Methods: Data from all hospitalizations were collected from January 2000 through December 2010. Blood bank data (including the type and volume of products administered) were available electronically from each hospital. These files were linked to inpatient data, which included ICD-9-CM diagnoses (principal and secondary) and procedures during hospitalization. Statistical analyses were conducted using generalized linear models to evaluate trends over time. The unit of observation was hospitalization, with categorization by type.
- Results: There were 176,521 hospitalizations in 69,621 patients; of these, 13.6% of hospitalizations involved transfusion of blood products (12.7% RBCs, 1.4% platelets, 3.0% plasma). Transfusion occurred in 25.2% of surgical and 5.3% of medical hospitalizations. Transfusion use peaked in 2002 for surgical hospitalizations and declined afterwards (P < 0.001). There was no significant change in transfusion use over time (P = 0.126) for medical hospitalizations. In hospitalizations that involved transfusions, there was a 20.3% reduction in the proportion of hospitalizations in which ≥ 3 units of RBCs were given (from 51.7% to 41.1%; P < 0.001) and a 73.6% increase when 1 RBC unit was given (from 8.0% to 13.8%; P < 0.001) from 2000-2010. Of the hospitalizations with RBC transfusion, 9.6% involved the use of 1 unit over the entire study period. The most common principal diagnoses for medical patients receiving transfusion were anemia, malignancy, heart failure, pneumonia and renal failure. Over time, transfusion utilization increased in patients who were admitted for infection (P = 0.009).
- Conclusion: Blood transfusions in 3 VHA hospitals have decreased over time for surgical patients but remained the same for medical patients. Further study examining appropriateness of blood products in medical patients appears necessary.
Key words: Transfusion; red blood cells; plasma; platelets; veterans.
Transfusion practices during hospitalization have changed considerably over the past 2 decades. Guided by evidence from randomized controlled trials, patient blood management programs have been expanded [1]. Such programs include recommendations regarding minimization of blood loss during surgery, prevention and treatment of anemia, strategies for reducing transfusions in both medical and surgical patients, improved blood utilization, education of health professionals, and standardization of blood management-related metrics [2]. Some of the guidelines have been incorporated into the Choosing Wisely initiative of the American Board of Internal Medicine Foundation, including: (a) don’t transfuse more units of blood than absolutely necessary, (b) don’t transfuse red blood cells for iron deficiency without hemodynamic instability, (c) don’t routinely use blood products to reverse warfarin, and (d) don’t perform serial blood counts on clinically stable patients [3]. Although there has been growing interest in blood management, only 37.8% of the 607 AABB (formerly, American Association of Blood Banks) facilities in the United States reported having a patient blood management program in 2013 [2].
While the importance of blood safety is recognized, data regarding the overall trends in practices are conflicting. A study using the Nationwide Inpatient Sample indicated that there was a 5.6% annual mean increase in the transfusion of blood products from 2002 to 2011 in the United States [4]. This contrasts with the experience of Kaiser Permanente in Northern California, in which the incidence of RBC transfusion decreased by 3.2% from 2009 to 2013 [5]. A decline in rates of intraoperative transfusion was also reported among elderly veterans in the United States from 1997 to 2009 [6].
We conducted a study in hospitalized veterans with 2 main objectives: (a) to evaluate trends in utilization of red blood cells (RBCs), platelets, and plasma over time, and (b) to identify those groups of veterans who received specific blood products. We were particularly interested in transfusion use in medical patients.
Methods
Participants were hospitalized veterans at 3 Department of Veterans Affairs (VA) medical centers. Data from all hospitalizations were collected from January 2000 through December 2010. Blood bank data (including the type and volume of products administered) were available electronically from each hospital. These files were linked to inpatient data, which included ICD-9-CM diagnoses (principal and secondary) and procedures during hospitalization.
Statistical analyses were conducted using generalized linear models to evaluate trends over time. The unit of observation was hospitalization, with categorization by type. Surgical hospitalizations were defined as admissions in which any surgical procedure occurred, whereas medical hospitalizations were defined as admissions without any surgery. Alpha was set at 0.05, 2-tailed. All analyses were conducted in Stata/MP 14.1 (StataCorp, College Station, TX). The study received institutional review board approval from the VA Ann Arbor Healthcare System.
Results
From 2000 through 2010, there were 176,521 hospitalizations in 69,621 patients. Within this cohort, 6% were < 40 years of age, 66% were 40 to 69 years of age, and 28% were 70 years or older at the time of admission. In this cohort, 96% of patients were male. Overall, 13.6% of all hospitalizations involved transfusion of a blood product (12.7% RBCs, 1.4% platelets, 3.0% plasma).
Transfusion occurred in 25.2% of surgical hospitalizations and 5.3% of medical hospitalizations. For surgical hospitalizations, transfusion use peaked in 2002 (when 30.9% of the surgical hospitalizations involved a trans-fusion) and significantly declined afterwards (P < 0.001). By 2010, 22.5% of the surgical hospitalizations involved a transfusion. Most of the surgeries where blood products were transfused involved cardiovascular procedures. For medical hospitalizations only, there was no significant change in transfusion use over time, either from 2000 to 2010 (P = 0.126) or from 2002 to 2010 (P = 0.072). In 2010, 5.2% of the medical hospitalizations involved a transfusion.
Rates of transfusion varied by principal diagnosis (Figure 1). For patients admitted with a principal diagnosis of infection (n = 20,981 hospitalizations), there was an increase in the percentage of hospitalizations in which transfusions (RBCs, platelet, plasma) were administered over time (P = 0.009) (Figure 1). For patients admitted with a principal diagnosis of malignancy (n = 12,904 hospitalizations), cardiovascular disease (n = 40,324 hospitalizations), and other diagnoses (n = 102,312 hospitalizations), there were no significant linear trends over the entire study period (P = 0.191, P = 0.052, P = 0.314, respectively). Rather, blood utilization peaked in year 2002 and significantly declined afterwards for patients admitted for malignancy (P < 0.001) and for cardiovascular disease (P < 0.001).
The most common principal diagnoses for medical patients receiving any transfusion (RBCs, platelet, plasma) are listed in Table 1. For medical patients with a principal diagnosis of anemia, 88% of hospitalizations involved a transfusion (Table 1). Transfusion occurred in 6% to 11% of medical hospitalizations with malignancies, heart failure, pneumonia or renal failure (Table 1). A considerable proportion (43%) of medical patients with gastrointestinal hemorrhage received a transfusion.
![]()
![]()
9.6% (2154/22,344) involved the use of only 1 unit, 43.8% (9791/22,344) involved 2 units, and 46.5% (10,399/22,344) involved 3 or more units during the hospitalization. From 2000 through 2010, there was a 20.3% reduction in the proportion of hospitalizations in which 3 or more units of RBCs were given (from 51.7% to 41.1%; P < 0.001). That is, among those hospitalizations in which a RBC transfusion occurred, a smaller proportion of hospitalizations involved the administration of 3 or more units of RBCs from 2000 through 2010 (Figure 2). There was an 11.5% increase in the proportion of hospitalizations in which 2 units of RBCs were used (from 40.4% to 45.0%; P < 0.001). In addition, there was a 73.6% increase in the proportion of hospitalizations in which 1 RBC unit was given (from 8.0% to 13.8%;
P = 0.001).
![]()
16.8 mL/hospitalization in 2010. For plasma, the mean mL/hospitalization was 28.9 in year 2000, increased to 50.1 mL/hospitalization in year 2008, and declined, thereafter, to 35.1 mL/hospitalization in year 2010.
Discussion
![]()
We also observed secular trends in the volume of RBCs administered. There was an increase in the percentage of hospitalizations in which 1 or 2 RBC units were used and a decline in transfusion of 3 or more units. The reduction in the use of 3 or more RBC units may reflect the adoption and integration of recommendations in patient blood management by clinicians,
which encourage assessment of the patients’ symptoms in determining whether additional units are necessary [7]. Such guidelines also endorse the avoidance of routine
administration of 2 units of RBCs if 1 unit is sufficient [8]. We have previously shown that, after coronary artery bypass grafting, 2 RBC units doubled the risk of pneumonia [9]; additional analyses indicated that 1 or 2 units of RBCs were associated with increased postoperative morbidity [10]. In addition, our previous research indicated that the probability of infection increased considerably between 1 and 2 RBC units, with a more gradual increase beyond 2 units [11]. With this evidence in mind, some studies at single sites have reported that there was a dramatic decline from 2 RBC units before initiation of patient blood management programs to 1 unit after the programs were implemented [12,13].
![]()
Medical patients who received a transfusion were often admitted for reason of anemia, cancer, organ failure, or pneumonia. Some researchers are now reporting that blood use, at certain sites, is becoming more common in medical rather than surgical patients, which may be due to an expansion of patient blood management procedures in surgery [16]. There are a substantial number of patient blood management programs among surgical specialties and their adoption has expanded [17]. Although there are fewer patient blood management programs in the nonsurgical setting, some have been targeted to internal medicine physicians and specifically, to hospitalists [1,18]. For example, a toolkit from the Society of Hospital Medicine centers on anemia management and includes anemia assessment, treatment, evaluation of RBC transfusion risk, blood conservation, optimization of coagulation, and patient-centered decision-making [19]. Additionally, bundling of patient blood management strategies has been launched to help encourage a wider adoption of such programs [20].
While guidelines regarding use of RBCs are becoming increasingly recognized, recommendations for the use of platelets and plasma are hampered by the paucity of evidence from randomized controlled trials [21,22]. There is moderate-quality evidence for the use of platelets with therapy-induced hypoproliferative thrombocytopenia in hospitalized patients [21], but low quality evidence for other uses. Moreover, a recent review of plasma transfusion in bleeding patients found no randomized controlled trials on plasma use in hospitalized patients, although several trials were currently underway [22].
Our findings need to be considered in the context of the following limitations. The data were from 3 VA hospitals, so the results may not reflect patterns of usage at other hospitals. However, AABB reports that there has been a general decrease in transfusion of allogeneic whole blood and RBC units since 2008 at the AABB-affiliated sites in the United States [2]; this is similar to the pattern that we observed in surgical patients. In addition, we report an overall view of trends without having details regarding which specific factors influenced changes in transfusion during this 11-year period. It is possible that the severity of hospitalized patients may have changed with time which could have influenced decisions regarding the need for transfusion.
In conclusion, the use of blood products decreased in surgical patients since 2002 but remained the same in medical patients in this VA population. Transfusions increased over time for patients who were admitted to the hospital for reason of infection, but decreased since 2002 for those admitted for cardiovascular disease or cancer. The number of RBC units per hospitalization decreased over time. Additional surveillance is needed to determine whether recent evidence regarding blood management has been incorporated into clinical practice for medical patients, as we strive to deliver optimal care to our veterans.
Corresponding author: Mary A.M. Rogers, PhD, MS, Dept. of Internal Medicine, Univ. of Michigan, 016-422W NCRC, Ann Arbor, MI 48109-2800, maryroge@umich.edu.
Funding/support: Department of Veterans Affairs, Clinical Sciences Research & Development Service Merit Review Award (EPID-011-11S). The contents do not represent the views of the U.S. Department of Veterans Affairs or the U.S. Government.
Financial disclosures: None.
Author contributions: conception and design, MAMR, SS; analysis and interpretation of data, MAMR, JDB, DR, LK, SS; drafting of article, MAMR; critical revision of the article, MAMR, MTG, DR, LK, SS, VC; statistical expertise, MAMR, DR; obtaining of funding, MTG, SS, VC; administrative or technical support, MTG, LK, SS, VC; collection and assembly of data, JDB, LK.
1. Hohmuth B, Ozawa S, Ashton M, Melseth RL. Patient-centered blood management. J Hosp Med 2014;9:60–5.
2. Whitaker B, Rajbhandary S, Harris A. The 2013 AABB blood collection, utilization, and patient blood management survey report. United States Department of Health and Human Services, AABB; 2015.
3. Cassel CK, Guest JA. Choosing wisely: helping physicians and patients make smart decisions about their care. JAMA 2012;307:1801–2.
4. Pathak R, Bhatt VR, Karmacharya P, et al. Trends in blood-product transfusion among inpatients in the United States from 2002 to 2011: data from the nationwide inpatient sample. J Hosp Med 2014;9:800–1.
5. Roubinian NH, Escobar GJ, Liu V, et al. Trends in red blood cell transfusion and 30-day mortality among hospitalized patients. Transfusion 2014;54:2678–86.
6. Chen A, Trivedi AN, Jiang L, et al. Hospital blood transfusion patterns during major noncardiac surgery and surgical mortality. Medicine (Baltimore) 2015;94:e1342.
7. Carson JL, Guyatt G, Heddle NM, et al. Clinical practice guidelines from the AABB: Red blood cell transfusion thresholds and storage. JAMA 2016;316:2025–35.
8. Hicks LK, Bering H, Carson KR, et al. The ASH choosing wisely® campaign: five hematologic tests and treatments to question. Blood 2013;122:3879–83.
9. Likosky DS, Paone G, Zhang M, et al. Red blood cell transfusions impact pneumonia rates after coronary artery bypass grafting. Ann Thorac Surg 2015;100:794–801.
10. Paone G, Likosky DS, Brewer R, et al. Transfusion of 1 and 2 units of red blood cells is associated with increased morbidity and mortality. Ann Thorac Surg 2014;97:87–93; discussion 93–4.
11. Rogers MAM, Blumberg N, Heal JM, et al. Role of transfusion in the development of urinary tract–related bloodstream infection. Arch Intern Med 2011;171:1587–9.
12. Oliver JC, Griffin RL, Hannon T, Marques MB. The success of our patient blood management program depended on an institution-wide change in transfusion practices. Transfusion 2014;54:2617–24.
13. Yerrabothala S, Desrosiers KP, Szczepiorkowski ZM, Dunbar NM. Significant reduction in red blood cell transfusions in a general hospital after successful implementation of a restrictive transfusion policy supported by prospective computerized order auditing. Transfusion 2014;54:2640–5.
14. Rehm JP, Otto PS, West WW, et al. Hospital-wide educational program decreases red blood cell transfusions. J Surg Res 1998;75:183–6.
15. Lawler EV, Bradbury BD, Fonda JR, et al. Transfusion burden among patients with chronic kidney disease and anemia. Clin J Am Soc Nephrol 2010;5:667–72.
16. Tinegate H, Pendry K, Murphy M, et al. Where do all the red blood cells (RBCs) go? Results of a survey of RBC use in England and North Wales in 2014. Transfusion 2016;56:139–45.
17. Meybohm P, Herrmann E, Steinbicker AU, et al. Patient blood management is associated with a substantial reduction of red blood cell utilization and safe for patient’s outcome: a prospective, multicenter cohort study with a noninferiority design. Ann Surg 2016;264:203–11.
18. Corwin HL, Theus JW, Cargile CS, Lang NP. Red blood cell transfusion: impact of an education program and a clinical guideline on transfusion practice. J Hosp Med 2014;9:745–9.
19. Society of Hospital Medicine. Anemia prevention and management program implementation toolkit. Accessed at www.hospitalmedicine.org/Web/Quality___Innovation/Implementation_Toolkit/Anemia/anemia_overview.aspx on 9 June 2017.
20. Meybohm P, Richards T, Isbister J, et al. Patient blood management bundles to facilitate implementation. Transfus Med Rev 2017;31:62–71.
21. Kaufman RM, Djulbegovic B, Gernsheimer T, et al. Platelet transfusion: a clinical practice guideline from the AABB. Ann Intern Med 2015;162:205–13.
22. Levy JH, Grottke O, Fries D, Kozek-Langenecker S. Therapeutic plasma transfusion in bleeding patients: A systematic review. Anesth Analg 2017;124:1268–76.
Abstract
- Background: Although transfusion guidelines have changed considerably over the past 2 decades, the adoption of patient blood management programs has not been fully realized across hospitals in the United States.
- Objective: To evaluate trends in red blood cell (RBC), platelet, and plasma transfusion at 3 Veterans Health Administration (VHA) hospitals from 2000 through 2010.
- Methods: Data from all hospitalizations were collected from January 2000 through December 2010. Blood bank data (including the type and volume of products administered) were available electronically from each hospital. These files were linked to inpatient data, which included ICD-9-CM diagnoses (principal and secondary) and procedures during hospitalization. Statistical analyses were conducted using generalized linear models to evaluate trends over time. The unit of observation was hospitalization, with categorization by type.
- Results: There were 176,521 hospitalizations in 69,621 patients; of these, 13.6% of hospitalizations involved transfusion of blood products (12.7% RBCs, 1.4% platelets, 3.0% plasma). Transfusion occurred in 25.2% of surgical and 5.3% of medical hospitalizations. Transfusion use peaked in 2002 for surgical hospitalizations and declined afterwards (P < 0.001). There was no significant change in transfusion use over time (P = 0.126) for medical hospitalizations. In hospitalizations that involved transfusions, there was a 20.3% reduction in the proportion of hospitalizations in which ≥ 3 units of RBCs were given (from 51.7% to 41.1%; P < 0.001) and a 73.6% increase when 1 RBC unit was given (from 8.0% to 13.8%; P < 0.001) from 2000-2010. Of the hospitalizations with RBC transfusion, 9.6% involved the use of 1 unit over the entire study period. The most common principal diagnoses for medical patients receiving transfusion were anemia, malignancy, heart failure, pneumonia and renal failure. Over time, transfusion utilization increased in patients who were admitted for infection (P = 0.009).
- Conclusion: Blood transfusions in 3 VHA hospitals have decreased over time for surgical patients but remained the same for medical patients. Further study examining appropriateness of blood products in medical patients appears necessary.
Key words: Transfusion; red blood cells; plasma; platelets; veterans.
Transfusion practices during hospitalization have changed considerably over the past 2 decades. Guided by evidence from randomized controlled trials, patient blood management programs have been expanded [1]. Such programs include recommendations regarding minimization of blood loss during surgery, prevention and treatment of anemia, strategies for reducing transfusions in both medical and surgical patients, improved blood utilization, education of health professionals, and standardization of blood management-related metrics [2]. Some of the guidelines have been incorporated into the Choosing Wisely initiative of the American Board of Internal Medicine Foundation, including: (a) don’t transfuse more units of blood than absolutely necessary, (b) don’t transfuse red blood cells for iron deficiency without hemodynamic instability, (c) don’t routinely use blood products to reverse warfarin, and (d) don’t perform serial blood counts on clinically stable patients [3]. Although there has been growing interest in blood management, only 37.8% of the 607 AABB (formerly, American Association of Blood Banks) facilities in the United States reported having a patient blood management program in 2013 [2].
While the importance of blood safety is recognized, data regarding the overall trends in practices are conflicting. A study using the Nationwide Inpatient Sample indicated that there was a 5.6% annual mean increase in the transfusion of blood products from 2002 to 2011 in the United States [4]. This contrasts with the experience of Kaiser Permanente in Northern California, in which the incidence of RBC transfusion decreased by 3.2% from 2009 to 2013 [5]. A decline in rates of intraoperative transfusion was also reported among elderly veterans in the United States from 1997 to 2009 [6].
We conducted a study in hospitalized veterans with 2 main objectives: (a) to evaluate trends in utilization of red blood cells (RBCs), platelets, and plasma over time, and (b) to identify those groups of veterans who received specific blood products. We were particularly interested in transfusion use in medical patients.
Methods
Participants were hospitalized veterans at 3 Department of Veterans Affairs (VA) medical centers. Data from all hospitalizations were collected from January 2000 through December 2010. Blood bank data (including the type and volume of products administered) were available electronically from each hospital. These files were linked to inpatient data, which included ICD-9-CM diagnoses (principal and secondary) and procedures during hospitalization.
Statistical analyses were conducted using generalized linear models to evaluate trends over time. The unit of observation was hospitalization, with categorization by type. Surgical hospitalizations were defined as admissions in which any surgical procedure occurred, whereas medical hospitalizations were defined as admissions without any surgery. Alpha was set at 0.05, 2-tailed. All analyses were conducted in Stata/MP 14.1 (StataCorp, College Station, TX). The study received institutional review board approval from the VA Ann Arbor Healthcare System.
Results
From 2000 through 2010, there were 176,521 hospitalizations in 69,621 patients. Within this cohort, 6% were < 40 years of age, 66% were 40 to 69 years of age, and 28% were 70 years or older at the time of admission. In this cohort, 96% of patients were male. Overall, 13.6% of all hospitalizations involved transfusion of a blood product (12.7% RBCs, 1.4% platelets, 3.0% plasma).
Transfusion occurred in 25.2% of surgical hospitalizations and 5.3% of medical hospitalizations. For surgical hospitalizations, transfusion use peaked in 2002 (when 30.9% of the surgical hospitalizations involved a trans-fusion) and significantly declined afterwards (P < 0.001). By 2010, 22.5% of the surgical hospitalizations involved a transfusion. Most of the surgeries where blood products were transfused involved cardiovascular procedures. For medical hospitalizations only, there was no significant change in transfusion use over time, either from 2000 to 2010 (P = 0.126) or from 2002 to 2010 (P = 0.072). In 2010, 5.2% of the medical hospitalizations involved a transfusion.
Rates of transfusion varied by principal diagnosis (Figure 1). For patients admitted with a principal diagnosis of infection (n = 20,981 hospitalizations), there was an increase in the percentage of hospitalizations in which transfusions (RBCs, platelet, plasma) were administered over time (P = 0.009) (Figure 1). For patients admitted with a principal diagnosis of malignancy (n = 12,904 hospitalizations), cardiovascular disease (n = 40,324 hospitalizations), and other diagnoses (n = 102,312 hospitalizations), there were no significant linear trends over the entire study period (P = 0.191, P = 0.052, P = 0.314, respectively). Rather, blood utilization peaked in year 2002 and significantly declined afterwards for patients admitted for malignancy (P < 0.001) and for cardiovascular disease (P < 0.001).
The most common principal diagnoses for medical patients receiving any transfusion (RBCs, platelet, plasma) are listed in Table 1. For medical patients with a principal diagnosis of anemia, 88% of hospitalizations involved a transfusion (Table 1). Transfusion occurred in 6% to 11% of medical hospitalizations with malignancies, heart failure, pneumonia or renal failure (Table 1). A considerable proportion (43%) of medical patients with gastrointestinal hemorrhage received a transfusion.
![]()
![]()
9.6% (2154/22,344) involved the use of only 1 unit, 43.8% (9791/22,344) involved 2 units, and 46.5% (10,399/22,344) involved 3 or more units during the hospitalization. From 2000 through 2010, there was a 20.3% reduction in the proportion of hospitalizations in which 3 or more units of RBCs were given (from 51.7% to 41.1%; P < 0.001). That is, among those hospitalizations in which a RBC transfusion occurred, a smaller proportion of hospitalizations involved the administration of 3 or more units of RBCs from 2000 through 2010 (Figure 2). There was an 11.5% increase in the proportion of hospitalizations in which 2 units of RBCs were used (from 40.4% to 45.0%; P < 0.001). In addition, there was a 73.6% increase in the proportion of hospitalizations in which 1 RBC unit was given (from 8.0% to 13.8%;
P = 0.001).
![]()
16.8 mL/hospitalization in 2010. For plasma, the mean mL/hospitalization was 28.9 in year 2000, increased to 50.1 mL/hospitalization in year 2008, and declined, thereafter, to 35.1 mL/hospitalization in year 2010.
Discussion
![]()
We also observed secular trends in the volume of RBCs administered. There was an increase in the percentage of hospitalizations in which 1 or 2 RBC units were used and a decline in transfusion of 3 or more units. The reduction in the use of 3 or more RBC units may reflect the adoption and integration of recommendations in patient blood management by clinicians,
which encourage assessment of the patients’ symptoms in determining whether additional units are necessary [7]. Such guidelines also endorse the avoidance of routine
administration of 2 units of RBCs if 1 unit is sufficient [8]. We have previously shown that, after coronary artery bypass grafting, 2 RBC units doubled the risk of pneumonia [9]; additional analyses indicated that 1 or 2 units of RBCs were associated with increased postoperative morbidity [10]. In addition, our previous research indicated that the probability of infection increased considerably between 1 and 2 RBC units, with a more gradual increase beyond 2 units [11]. With this evidence in mind, some studies at single sites have reported that there was a dramatic decline from 2 RBC units before initiation of patient blood management programs to 1 unit after the programs were implemented [12,13].
![]()
Medical patients who received a transfusion were often admitted for reason of anemia, cancer, organ failure, or pneumonia. Some researchers are now reporting that blood use, at certain sites, is becoming more common in medical rather than surgical patients, which may be due to an expansion of patient blood management procedures in surgery [16]. There are a substantial number of patient blood management programs among surgical specialties and their adoption has expanded [17]. Although there are fewer patient blood management programs in the nonsurgical setting, some have been targeted to internal medicine physicians and specifically, to hospitalists [1,18]. For example, a toolkit from the Society of Hospital Medicine centers on anemia management and includes anemia assessment, treatment, evaluation of RBC transfusion risk, blood conservation, optimization of coagulation, and patient-centered decision-making [19]. Additionally, bundling of patient blood management strategies has been launched to help encourage a wider adoption of such programs [20].
While guidelines regarding use of RBCs are becoming increasingly recognized, recommendations for the use of platelets and plasma are hampered by the paucity of evidence from randomized controlled trials [21,22]. There is moderate-quality evidence for the use of platelets with therapy-induced hypoproliferative thrombocytopenia in hospitalized patients [21], but low quality evidence for other uses. Moreover, a recent review of plasma transfusion in bleeding patients found no randomized controlled trials on plasma use in hospitalized patients, although several trials were currently underway [22].
Our findings need to be considered in the context of the following limitations. The data were from 3 VA hospitals, so the results may not reflect patterns of usage at other hospitals. However, AABB reports that there has been a general decrease in transfusion of allogeneic whole blood and RBC units since 2008 at the AABB-affiliated sites in the United States [2]; this is similar to the pattern that we observed in surgical patients. In addition, we report an overall view of trends without having details regarding which specific factors influenced changes in transfusion during this 11-year period. It is possible that the severity of hospitalized patients may have changed with time which could have influenced decisions regarding the need for transfusion.
In conclusion, the use of blood products decreased in surgical patients since 2002 but remained the same in medical patients in this VA population. Transfusions increased over time for patients who were admitted to the hospital for reason of infection, but decreased since 2002 for those admitted for cardiovascular disease or cancer. The number of RBC units per hospitalization decreased over time. Additional surveillance is needed to determine whether recent evidence regarding blood management has been incorporated into clinical practice for medical patients, as we strive to deliver optimal care to our veterans.
Corresponding author: Mary A.M. Rogers, PhD, MS, Dept. of Internal Medicine, Univ. of Michigan, 016-422W NCRC, Ann Arbor, MI 48109-2800, maryroge@umich.edu.
Funding/support: Department of Veterans Affairs, Clinical Sciences Research & Development Service Merit Review Award (EPID-011-11S). The contents do not represent the views of the U.S. Department of Veterans Affairs or the U.S. Government.
Financial disclosures: None.
Author contributions: conception and design, MAMR, SS; analysis and interpretation of data, MAMR, JDB, DR, LK, SS; drafting of article, MAMR; critical revision of the article, MAMR, MTG, DR, LK, SS, VC; statistical expertise, MAMR, DR; obtaining of funding, MTG, SS, VC; administrative or technical support, MTG, LK, SS, VC; collection and assembly of data, JDB, LK.
1. Hohmuth B, Ozawa S, Ashton M, Melseth RL. Patient-centered blood management. J Hosp Med 2014;9:60–5.
2. Whitaker B, Rajbhandary S, Harris A. The 2013 AABB blood collection, utilization, and patient blood management survey report. United States Department of Health and Human Services, AABB; 2015.
3. Cassel CK, Guest JA. Choosing wisely: helping physicians and patients make smart decisions about their care. JAMA 2012;307:1801–2.
4. Pathak R, Bhatt VR, Karmacharya P, et al. Trends in blood-product transfusion among inpatients in the United States from 2002 to 2011: data from the nationwide inpatient sample. J Hosp Med 2014;9:800–1.
5. Roubinian NH, Escobar GJ, Liu V, et al. Trends in red blood cell transfusion and 30-day mortality among hospitalized patients. Transfusion 2014;54:2678–86.
6. Chen A, Trivedi AN, Jiang L, et al. Hospital blood transfusion patterns during major noncardiac surgery and surgical mortality. Medicine (Baltimore) 2015;94:e1342.
7. Carson JL, Guyatt G, Heddle NM, et al. Clinical practice guidelines from the AABB: Red blood cell transfusion thresholds and storage. JAMA 2016;316:2025–35.
8. Hicks LK, Bering H, Carson KR, et al. The ASH choosing wisely® campaign: five hematologic tests and treatments to question. Blood 2013;122:3879–83.
9. Likosky DS, Paone G, Zhang M, et al. Red blood cell transfusions impact pneumonia rates after coronary artery bypass grafting. Ann Thorac Surg 2015;100:794–801.
10. Paone G, Likosky DS, Brewer R, et al. Transfusion of 1 and 2 units of red blood cells is associated with increased morbidity and mortality. Ann Thorac Surg 2014;97:87–93; discussion 93–4.
11. Rogers MAM, Blumberg N, Heal JM, et al. Role of transfusion in the development of urinary tract–related bloodstream infection. Arch Intern Med 2011;171:1587–9.
12. Oliver JC, Griffin RL, Hannon T, Marques MB. The success of our patient blood management program depended on an institution-wide change in transfusion practices. Transfusion 2014;54:2617–24.
13. Yerrabothala S, Desrosiers KP, Szczepiorkowski ZM, Dunbar NM. Significant reduction in red blood cell transfusions in a general hospital after successful implementation of a restrictive transfusion policy supported by prospective computerized order auditing. Transfusion 2014;54:2640–5.
14. Rehm JP, Otto PS, West WW, et al. Hospital-wide educational program decreases red blood cell transfusions. J Surg Res 1998;75:183–6.
15. Lawler EV, Bradbury BD, Fonda JR, et al. Transfusion burden among patients with chronic kidney disease and anemia. Clin J Am Soc Nephrol 2010;5:667–72.
16. Tinegate H, Pendry K, Murphy M, et al. Where do all the red blood cells (RBCs) go? Results of a survey of RBC use in England and North Wales in 2014. Transfusion 2016;56:139–45.
17. Meybohm P, Herrmann E, Steinbicker AU, et al. Patient blood management is associated with a substantial reduction of red blood cell utilization and safe for patient’s outcome: a prospective, multicenter cohort study with a noninferiority design. Ann Surg 2016;264:203–11.
18. Corwin HL, Theus JW, Cargile CS, Lang NP. Red blood cell transfusion: impact of an education program and a clinical guideline on transfusion practice. J Hosp Med 2014;9:745–9.
19. Society of Hospital Medicine. Anemia prevention and management program implementation toolkit. Accessed at www.hospitalmedicine.org/Web/Quality___Innovation/Implementation_Toolkit/Anemia/anemia_overview.aspx on 9 June 2017.
20. Meybohm P, Richards T, Isbister J, et al. Patient blood management bundles to facilitate implementation. Transfus Med Rev 2017;31:62–71.
21. Kaufman RM, Djulbegovic B, Gernsheimer T, et al. Platelet transfusion: a clinical practice guideline from the AABB. Ann Intern Med 2015;162:205–13.
22. Levy JH, Grottke O, Fries D, Kozek-Langenecker S. Therapeutic plasma transfusion in bleeding patients: A systematic review. Anesth Analg 2017;124:1268–76.
The Authors Reply: “Cost and Utility of Thrombophilia Testing”
We thank Dr. Berse and colleagues for their correspondence about our paper.1,2 We are pleased they agreed with our conclusion: Thrombophilia testing has limited clinical utility in most inpatient settings.
Berse and colleagues critiqued details of our methodology in calculating payer cost, including how we estimated the number of Medicare claims for thrombophilia testing. We estimated that there were at least 280,000 Medicare claims in 2014 using CodeMap® (Wheaton Partners, LLC, Schaumburg, IL), a dataset of utilization data from the Physician Supplier Procedure Summary Master File from all Medicare Part B carriers.3 This estimate was similar to that reported in a previous publication.4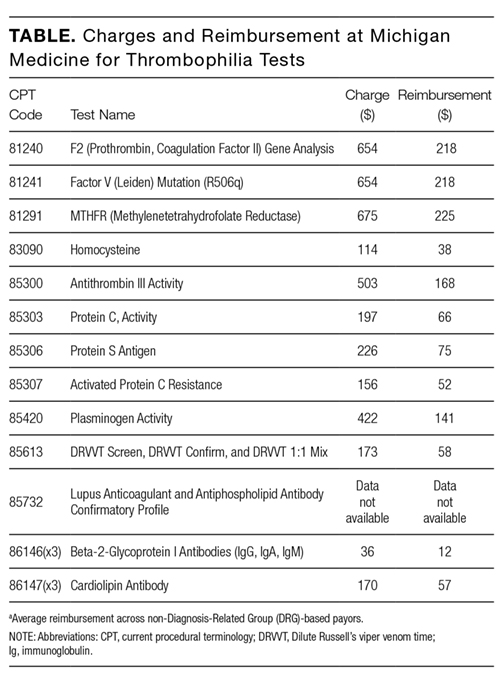
Thus, regardless of the precise estimates, even a conservative estimate of 33 to 80 million dollars of unnecessary spending is far too much. Rather, it is a perfect example of “Things We Do for No Reason.”
Disclosure
Nothing to report.
1. Petrilli CM, Mack M, Petrilli JJ, Hickner A, Saint S, Chopra V. Understanding the role of physician attire on patient perceptions: a systematic review of the literature--targeting attire to improve likelihood of rapport (TAILOR) investigators. BMJ Open. 2015;5(1):e006578. DOI:10.1136/bmjopen-2014-006578. PubMed
2. Berse B, Lynch JA, Bowen S, Grosse SD. In Reference to: “Cost and Utility of Thrombophilia Testing.” J Hosp Med. 2017;12(9):783.
3. CodeMap® https://www.codemap.com/. Accessed March 2, 2017.
4. Somma J, Sussman, II, Rand JH. An evaluation of thrombophilia screening in an urban tertiary care medical center: A “real world” experience. Am J Clin Pathol. 2006;126(1):120-7. DOI:10.1309/KV06-32LJ-8EDM-EWQT. PubMed
We thank Dr. Berse and colleagues for their correspondence about our paper.1,2 We are pleased they agreed with our conclusion: Thrombophilia testing has limited clinical utility in most inpatient settings.
Berse and colleagues critiqued details of our methodology in calculating payer cost, including how we estimated the number of Medicare claims for thrombophilia testing. We estimated that there were at least 280,000 Medicare claims in 2014 using CodeMap® (Wheaton Partners, LLC, Schaumburg, IL), a dataset of utilization data from the Physician Supplier Procedure Summary Master File from all Medicare Part B carriers.3 This estimate was similar to that reported in a previous publication.4
Thus, regardless of the precise estimates, even a conservative estimate of 33 to 80 million dollars of unnecessary spending is far too much. Rather, it is a perfect example of “Things We Do for No Reason.”
Disclosure
Nothing to report.
1. Petrilli CM, Mack M, Petrilli JJ, Hickner A, Saint S, Chopra V. Understanding the role of physician attire on patient perceptions: a systematic review of the literature--targeting attire to improve likelihood of rapport (TAILOR) investigators. BMJ Open. 2015;5(1):e006578. DOI:10.1136/bmjopen-2014-006578. PubMed
2. Berse B, Lynch JA, Bowen S, Grosse SD. In Reference to: “Cost and Utility of Thrombophilia Testing.” J Hosp Med. 2017;12(9):783.
3. CodeMap® https://www.codemap.com/. Accessed March 2, 2017.
4. Somma J, Sussman, II, Rand JH. An evaluation of thrombophilia screening in an urban tertiary care medical center: A “real world” experience. Am J Clin Pathol. 2006;126(1):120-7. DOI:10.1309/KV06-32LJ-8EDM-EWQT. PubMed
© 2017 Society of Hospital Medicine
A Contemporary Assessment of Mechanical Complication Rates and Trainee Perceptions of Central Venous Catheter Insertion
Central venous catheter (CVC) placement is commonly performed in emergency and critical care settings for parenteral access, central monitoring, and hemodialysis. Although potentially lifesaving CVC insertion is associated with immediate risks including injury to nerves, vessels, and lungs.1-3 These “insertion-related complications” are of particular interest for several reasons. First, the frequency of such complications varies widely, with published rates between 1.4% and 33.2%.2-7 Reasons for such variation include differences in study definitions of complications (eg, pneumothorax and tip position),2,5 setting of CVC placement (eg, intensive care unit [ICU] vs emergency room), timing of placement (eg, elective vs emergent), differences in technique, and type of operator (eg, experienced vs learner). Thus, the precise incidence of such events in modern-day training settings with use of ultrasound guidance remains uncertain. Second, mechanical complications might be preventable with adequate training and supervision. Indeed, studies using simulation-based mastery techniques have demonstrated a reduction in rates of complications following intensive training.8 Finally, understanding risk factors associated with insertion complications might inform preventative strategies and improve patient safety.9-11
Few studies to date have examined trainees’ perceptions on CVC training, experience, supervision, and ability to recognize and prevent mechanical complications. While research investigating effects of simulation training has accumulated, most focus on successful completion of the procedure or individual procedural steps with little emphasis on operator perceptions.12-14 In addition, while multiple studies have shown that unsuccessful line attempts are a risk factor for CVC complications,3,4,7,15 there is very little known about trainee behavior and perceptions regarding unsuccessful line placement. CVC simulation trainings often assume successful completion of the procedure and do not address the crucial postprocedure steps that should be undertaken if a procedure is unsuccessful. For these reasons, we developed a survey to specifically examine trainee experience with CVC placement, supervision, postprocedural behavior, and attitudes regarding unsuccessful line placement.
Therefore, we designed a study with 2 specific goals: The first is to perform a contemporary analysis of CVC mechanical complication rate at an academic teaching institution and identify potential risk factors associated with these complications. Second, we sought to determine trainee perceptions regarding CVC complication experience, prevention, procedural supervision, and perceptions surrounding unsuccessful line placement.
METHODS
Design and Setting
We conducted a single-center retrospective review of nontunneled acute CVC procedures between June 1, 2014, and May 1, 2015, at the University of Michigan Health System (UMHS). UMHS is a tertiary care referral center with over 900 inpatient beds, including 99 ICU beds.
All residents in internal medicine, surgery, anesthesia, and emergency medicine receive mandatory education in CVC placement that includes an online training module and simulation-based training with competency assessment. Use of real-time ultrasound guidance is considered the standard of care for CVC placement.
Data Collection
Inpatient procedure notes were electronically searched for terms indicating CVC placement. This was performed by using our hospital’s Data Office for Clinical and Translational Research using the Electronic Medical Record Search Engine tool. Please see the supplemental materials for the full list of search terms. We electronically extracted data, including date of procedure, gender, and most recent body mass index (BMI), within 1 year prior to note. Acute Physiology and Chronic Health Evaluation III (APACHE III) data are tracked for all patients on admission to ICU; this was collected when available. Charts were then manually reviewed to collect additional data, including international normalized ratio (INR), platelet count, lactate level on the day of CVC placement, anticoagulant use (actively prescribed coumadin, therapeutic enoxaparin, therapeutic unfractionated heparin, or direct oral anticoagulant), ventilator or noninvasive positive pressure ventilation (NIPPV) at time of CVC placement, and vasopressor requirement within 24 hours of CVC placement. The procedure note was reviewed to gather information about site of CVC placement, size and type of catheter, number of attempts, procedural success, training level of the operator, and attending presence. Small bore CVCs were defined as 7 French (Fr) or lower. Large bore CVCs were defined as >7 Fr; this includes dialysis catheters, Cordis catheters (Cordis, Fremont, CA), and cooling catheters. The times of the procedure note and postprocedure chest x-ray (CXR) were recorded, including whether the CVC was placed on a weekend (Friday 7
Primary Outcome
The primary outcome was the rate of severe mechanical complications related to CVC placement. Similar to prior studies,2 we defined severe mechanical complications as arterial placement of dilator or catheter, hemothorax, pneumothorax, cerebral ischemia, patient death (related to procedure), significant hematoma, or vascular injury (defined as complication requiring expert consultation or blood product transfusion). We did not require a lower limit on blood transfusion. We considered pneumothorax a complication regardless of whether chest tube intervention was performed, as pneumothorax subjects the patient to additional tests (eg, serial CXRs) and sometimes symptoms (shortness of breath, pain, anxiety) regardless of whether or not a chest tube was required. Complications were confirmed by a direct review of procedure notes, progress notes, discharge summaries, and imaging studies.
Trainee Survey
A survey was electronically disseminated to all internal medicine and medicine-pediatric residents to inquire about CVC experiences, including time spent in the medical ICU, number of CVCs performed, postprocedure behavior for both failed and successful CVCs, and supervision experience and attitudes. Please see supplemental materials for full survey contents.
Statistical Methods
Descriptive statistics (percentage) were used to summarize data. Continuous and categorical variables were compared using Student t tests and chi-square tests, respectively. All analyses were performed using SAS 9.3 (SAS Institute, Cary, NC).
Ethical and Regulatory Oversight
The study was deemed exempt by the University of Michigan Institutional Review Board (HUM00100549) as data collection was part of a quality improvement effort.
RESULTS
Demographics and Characteristics of Device Insertion
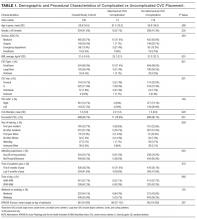
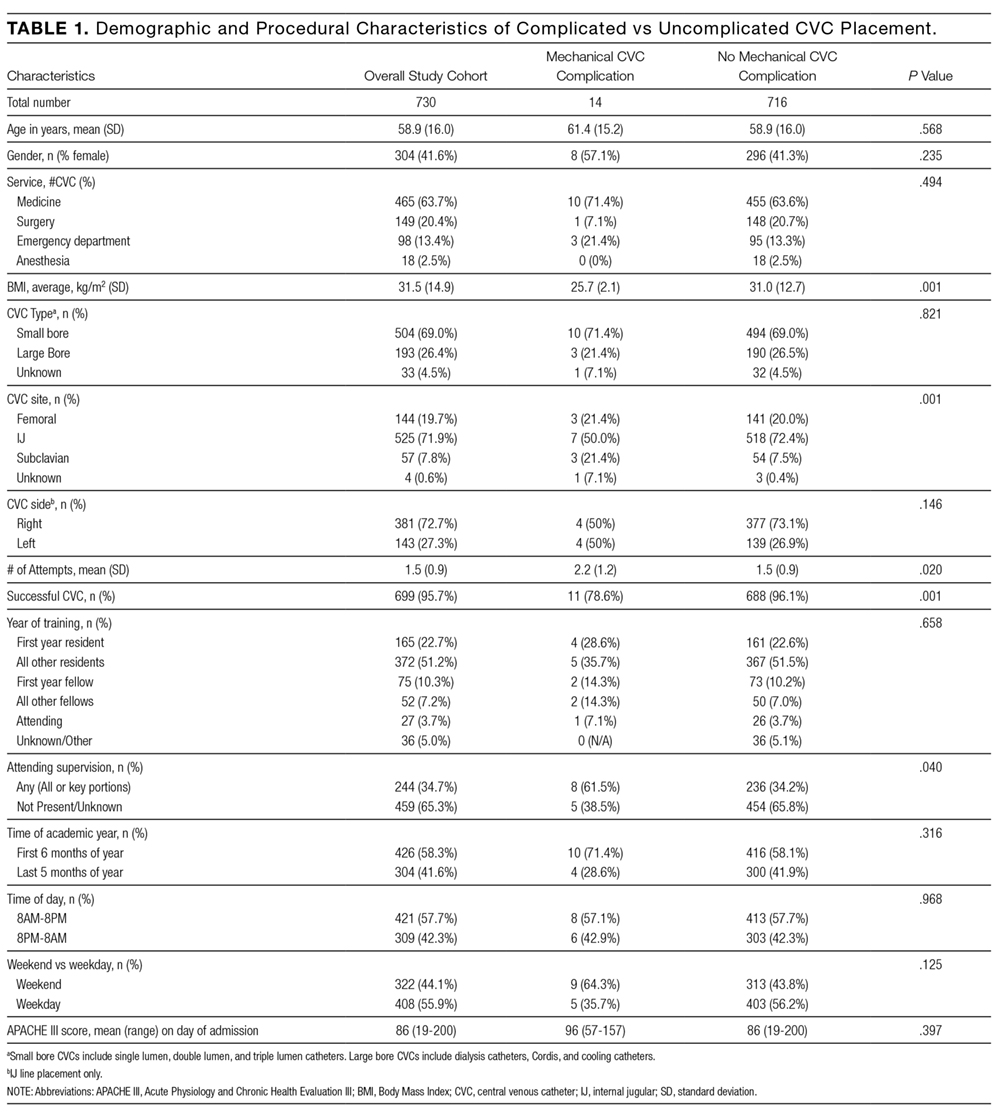
Between June 1, 2014, and May 1, 2015, 730 CVC procedure notes were reviewed (Table 1). The mean age of the study population was 58.9 years, and 41.6% (n = 304) were female. BMI data were available in 400 patients without complications and 5 patients with complications; the average BMI was 31.5 kg/m2. The APACHE III score was available for 442 patients without complications and 10 patients with complications; the average score was 86 (range 19-200). Most of the CVCs placed (n= 504, 69%) were small bore (<7 Fr). The majority of catheters were placed in the internal jugular (IJ) position (n = 525, 71.9%), followed by femoral (n = 144, 19.7%), subclavian (N = 57, 7.8%), and undocumented (n = 4, 0.6%). Ninety-six percent (n = 699) of CVCs were successfully placed. Seventy-six percent (n = 558) of procedure notes included documentation of the number of CVC attempts; of these, 85% documented 2 or fewer attempts. The majority of CVCs were placed by residents (n = 537, 73.9%), followed by fellows (N = 127, 17.5%) and attendings (n = 27, 3.7%). Attending supervision for all or key portions of CVC placement occurred 34.7% (n = 244) of the time overall and was lower for internal medicine trainees (n = 98/463, 21.2%) compared with surgical trainees (n = 73/127, 57.4%) or emergency medicine trainees (n = 62/96, 64.6%; P < 0.001). All successful IJ and subclavian CVCs except for 2 insertions (0.3%) had a postprocedure CXR. A minority of notes documented pressure transduction (4.5%) or blood gas analysis (0.2%) to confirm venous placement.
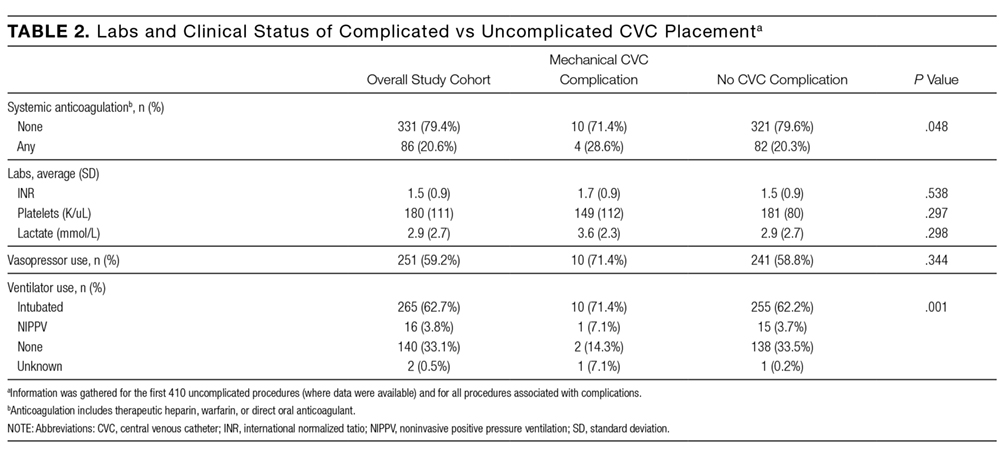
Mechanical Complications
The mechanical complications identified included pneumothorax (n = 5), bleeding requiring transfusion (n = 3), vascular injury requiring expert consultation or intervention (n = 3), stroke (n = 1), and death (n = 2). Vascular injuries included 1 neck hematoma with superinfection requiring antibiotics, 1 neck hematoma requiring otolaryngology and vascular surgery consultation, and 1 venous dissection of IJ vein requiring vascular surgery consultation. None of these cases required operative intervention. The stroke was caused by inadvertent CVC placement into the carotid artery. One patient experienced tension pneumothorax and died due to this complication; this death occurred after 3 failed left subclavian CVC attempts and an ultimately successful CVC placement into left IJ vein. Another death occurred immediately following unsuccessful Cordis placement. As no autopsy was performed, it is impossible to know if the cause of death was the line placement. However, it would be prudent to consider this as a CVC complication given the temporal relationship to line placement. Thus, the total number of patients who experienced severe mechanical complications was 14 out of 730 (1.92%).
Risk Factors for Mechanical Complications
Certain patient factors were more commonly associated with complications. For example, BMI was significantly lower in the group that experienced complications vs those that did not (25.7 vs 31.0 kg/m2, P = 0.001). No other associations between demographic factors, including age (61.4 years vs 58.9 years, P = 0.57) or sex (57.1% male vs 41.3% female, P = 0.24), or admission APACHE III score (96 vs 86, P = 0.397) were noted. The mean INR, platelets, and lactate did not differ between the 2 groups. There was no difference between the use of vasopressors. Ventilator use (including endotracheal tube or NIPPV) was found to be significantly higher in the group that experienced mechanical complications (78.5% vs 65.9%, P = 0.001). Anticoagulation use was also associated with mechanical complications (28.6% vs 20.6%, P = 0.05); 3 patients on anticoagulation experienced significant hematomas. Mechanical complications were more common with subclavian location (21.4% vs 7.8%, P = 0.001); in all 3 cases involving subclavian CVC placement, the complication experienced was pneumothorax. The number of attempts significantly differed between the 2 groups, with an average of 1.5 attempts in the group without complications and 2.2 attempts in the group that experienced complications (P = 0.02). Additionally, rates of successful placement were lower among patients who experienced complications (78.6% vs 95.7%, P = 0.001).
With respect to operator characteristics, no significant difference between the levels of training was noted among those who experienced complications vs those who did not. Attending supervision was more frequent for the group that experienced complications (61.5% vs 34.2%, P = 0.04). There was no significant difference in complication rate according to the first vs the second half of the academic year (0.4% vs 0.3% per month, P = 0.30) or CVC placement during the day vs night (1.9% vs 2.0%, P = 0.97). A trend toward more complications in CVCs placed over the weekend compared to a weekday was observed (2.80% vs 1.23%, P = 0.125).
Unsuccessful CVCs
There were 30 documented unsuccessful CVC procedures, representing 4.1% of all procedures. Of these, 3 procedures had complications; these included 2 pneumothoraxes (1 leading to death) and 1 unexplained death. Twenty-four of the unsuccessful CVC attempts were in either the subclavian or IJ location; of these, 5 (21%) did not have a postprocedure CXR obtained.
Survey Results
The survey was completed by 103 out of 166 internal medicine residents (62% response rate). Of these, 55% (n = 57) reported having performed 5 or more CVCs, and 14% (n = 14) had performed more than 15 CVCs.
All respondents who had performed at least 1 CVC (n = 80) were asked about their perceptions regarding attending supervision. Eighty-one percent (n = 65/80) responded that they have never been directly supervised by an attending during CVC placement, while 16% (n = 13/80) reported being supervised less than 25% of the time. Most (n = 53/75, 71%) did not feel that attending supervision affected their performance, while 21% (n = 16/75) felt it affected performance negatively, and only 8% (n = 6/75) stated it affected performance positively. Nineteen percent (n = 15/80) indicated that they prefer more supervision by attendings, while 35% (n = 28/80) did not wish for more attending supervision, and 46% (n = 37/80) were indifferent.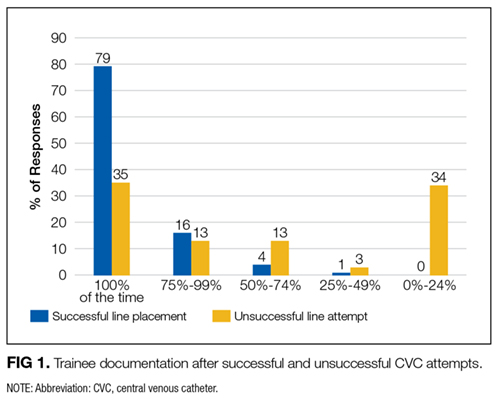

DISCUSSION
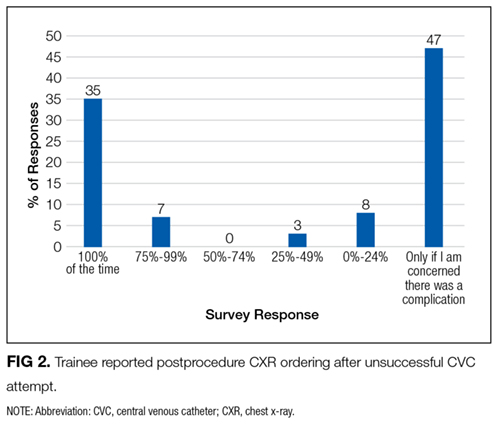
We performed a contemporary analysis of CVC placement at an academic tertiary care center and observed a rate of severe mechanical complications of 1.9%. This rate is within previously described acceptable thresholds.16 Our study adds to the literature by identifying several important risk factors for development of mechanical complications. We confirm many risk factors that have been noted historically, such as subclavian line location,2,3 attending supervision,3 low BMI,4 number of CVC attempts, and unsuccessful CVC placement.3,4,7,15 We identified several unique risk factors, including systemic anticoagulation as well as ventilator use. Lastly, we identified unexpected deficits in trainee knowledge surrounding management of failed CVCs and negative attitudes regarding attending supervision.
Most existing literature evaluated risk factors for CVC complication prior to routine ultrasound use;3-5,7,15 surprisingly, it appears that severe mechanical complications do not differ dramatically in the real-time ultrasound era. Eisen et al.3 prospectively studied CVC placement at an academic medical center and found a severe mechanical complication rate (as defined in our paper) of 1.9% due to pneumothorax (1.3%), hemothorax (0.3%), and death (0.3%).We would expect the number of complications to decrease in the postultrasound era, and indeed it appears that pneumothoraces have decreased likely due to ultrasound guidance and decrease in subclavian location. However, in contrast, rates of significant hematomas and bleeding are higher in our study. Although we are unable to state why this may be the case, increasing use of anticoagulation in the general population might explain this finding.17 For instance, of the 6 patients who experienced hematomas or vascular injuries in our study, 3 were on anticoagulation at the time of CVC placement.
Interestingly, time of academic year of CVC placement and level of training were not correlated with an increased risk of complications, nor was time of day of CVC placement. In contrast, Merrer et al.showed that CVC insertion during nighttime was significantly associated with increased mechanical complications (odds ratio 2.06, 95% confidence interval, 1.04-4.08;,P = 0.03).5 This difference may be attributable to the fact that most of our ICUs now have a night float system rather than a more traditional 24-hour call model; therefore, trainees are less likely to be sleep deprived during CVC placement at night.
Severity of illness did not appear to significantly affect mechanical complication rates based on similar APACHE scores between the 2 groups. In addition, other indicators of illness severity (vasopressor use or lactate level) did not suggest that sicker patients may be more likely to experience mechanical complications than others. One could conjecture that perhaps sicker patients were more likely to have lines placed by more experienced trainees, although the present study design does not allow us to answer this question. Interestingly, ventilator use was associated with higher rates of complications. We cannot say definitively why this was the case; however, 1 contributing factor may be the physical constraints of placing the CVC around ventilator tubing.
Several unexpected findings surrounding attending supervision were noted: first, attending supervision appears to be significantly associated with increased complication rate, and second, trainees have negative perceptions regarding attending supervision. Eisen et al.showed a similar association between attending supervision and complication rate.3 It is possible that the increased complication rate is because sicker patients are more likely to have procedural supervision by attendings, attending physicians may be called to supervise when a CVC placement is not going as planned, or attendings may supervise more inexperienced operators. Reasons behind negative trainee attitudes surrounding supervision are unclear and literature on this topic is limited. This is an area that warrants further exploration in future studies.
Another unexpected finding is trainee practices regarding unsuccessful CVC placement; most trainees do not document failed procedures or order follow-up CXRs after unsuccessful CVC attempts. Given the higher risk of complications after unsuccessful CVCs, it is paramount that all physicians are trained to order postprocedure CXR to rule out pneumothorax or hemothorax. Furthermore, documentation of failed procedures is important for medical accuracy, transparency, and also hospital billing. It is unknown if these practices surrounding unsuccessful CVCs are institution-specific or more widespread. As far as we know, this is the first time that trainee practices regarding failed CVC placement have been published. Interestingly, while many current guidelines call attention to prevention, recognition, and management of central line-associated mechanical complications, specific recommendations about postprocedure behavior after failed CVC placement are not published.9-11 We feel it is critical that institutions reflect on their own practices, especially given that unsuccessful CVCs are shown to be correlated with a significant increase in complication rate. At our own institution, we have initiated an educational component of central line training for medicine trainees specifically addressing failed central line attempts.
This study has several limitations, including a retrospective study design at a single institution. There was a low overall number of complications, which reduced our ability to detect risk factors for complications and did not allow us to perform multivariable adjustment. Other limitations are that only documented CVC attempts were recorded and only those that met our search criteria. Lastly, not all notes contain information such as the number of attempts or peer supervision. Furthermore, the definition of CVC “attempt” is left to the operator’s discretion.
In conclusion, we observed a modern CVC mechanical complication rate of 1.9%. While the complication rate is similar to previous studies, there appear to be lower rates of pneumothorax and higher rates of bleeding complications. We also identified a deficit in trainee education regarding unsuccessful CVC placement; this is a novel finding and requires further investigation at other centers.
Disclosure: The authors have no conflicts of interest to report.
1. McGee DC, Gould MK. Preventing complications of central venous catheterization. N Engl J Med. 2003;348(12):1123-1133. PubMed
2. Parienti JJ, Mongardon N, Mégarbane B, et al. Intravascular complications of central venous catheterization by insertion site. N Engl J Med. 2015;373(13):1220-1229. PubMed
3. Eisen LA, Narasimhan M, Berger JS, Mayo PH, Rosen MJ, Schneider RF. Mechanical complications of central venous catheters. J Intensive Care Med. 2006;21(1):40-46. PubMed
4. Mansfield PF, Hohn DC, Fornage BD, Gregurich MA, Ota DM. Complications and failures of subclavian-vein catheterization. N Engl J Med. 1994;331(26):1735-1738. PubMed
5. Merrer J, De Jonghe B, Golliot F, et al. Complications of femoral and subclavian venous catheterization in critically ill patients: A randomized controlled trial. JAMA. 2001;286(6):700-707. PubMed
6. Steele R, Irvin CB. Central line mechanical complication rate in emergency medicine patients. Acad Emerg Med. 2001;8(2):204-207. PubMed
7. Calvache JA, Rodriguez MV, Trochez A, Klimek M, Stolker RJ, Lesaffre E. Incidence of mechanical complications of central venous catheterization using landmark technique: Do not try more than 3 times. J Intensive Care Med. 2016;31(6):397-402. PubMed
8. Barsuk JH, McDaghie WC, Cohen ER, Balachandran JS, Wayne DB. Use of simulation-based mastery learning to improve the quality of central venous catheter placement in a medical intensive care unit. J Hosp Med. 2009;4(7):397-403. PubMed
9. American Society of Anesthesiologists Task Force on Central Venous Access, Rupp SM, Apfelbaum JL, et al. Practice guidelines for central venous access: A report by the American Society of Anesthesiologists Task Force on Central Venous Access. Anesthesiology. 2012;116(3):539-573. PubMed
10. Bodenham Chair A, Babu S, Bennett J, et al. Association of Anaesthetists of Great Britian and Irealand: Safe vascular access 2016. Anaesthesia. 2016;71:573-585. PubMed
11. Frykholm P, Pikwer A, Hammarskjöld F, et al. Clinical guidelines on central venous catheterisation. Swedish Society of Anaesthesiology and Intensic Care Medicine. Acta Anaesteshiol Scand. 2014;58(5):508-524. PubMed
12. Sekiguchi H, Tokita JE, Minami T, Eisen LA, Mayo PH, Narasimhan M. A prerotational, simulation-based workshop improves the safety of central venous catheter insertion: Results of a successful internal medicine house staff training program. Chest. 2011;140(3): 652-658. PubMed
13. Dong Y, Suri HS, Cook DA, et al. Simulation-based objective assessment discerns clinical proficiency in central line placement: A construct validation. Chest. 2010;137(5):1050-1056. PubMed
14. Evans LV, Dodge KL, Shah TD, et al. Simulation training in central venous catheter insertion: Improved performance in clinical practice. Acad Med. 2010;85(9):1462-1469. PubMed
15. Lefrant JY, Muller L, De La Coussaye JE et al. Risk factors of failure and immediate complication of subclavian vein catheterization in critically ill patients. Intensive Care Med. 2002;28(8):1036-1041. PubMed
16. Dariushnia SR, Wallace MJ, Siddigi NH, et al. Quality improvement guidelines for central venous access. J Vasc Interv Radiol. 2010;21(7):976-981. PubMed
17. Barnes GD, Lucas E, Alexander GC, Goldberger ZD. National trends in ambulatory oral anticoagulant use. Am J Med. 2015;128(12):1300-1305.e2. PubMed
Central venous catheter (CVC) placement is commonly performed in emergency and critical care settings for parenteral access, central monitoring, and hemodialysis. Although potentially lifesaving CVC insertion is associated with immediate risks including injury to nerves, vessels, and lungs.1-3 These “insertion-related complications” are of particular interest for several reasons. First, the frequency of such complications varies widely, with published rates between 1.4% and 33.2%.2-7 Reasons for such variation include differences in study definitions of complications (eg, pneumothorax and tip position),2,5 setting of CVC placement (eg, intensive care unit [ICU] vs emergency room), timing of placement (eg, elective vs emergent), differences in technique, and type of operator (eg, experienced vs learner). Thus, the precise incidence of such events in modern-day training settings with use of ultrasound guidance remains uncertain. Second, mechanical complications might be preventable with adequate training and supervision. Indeed, studies using simulation-based mastery techniques have demonstrated a reduction in rates of complications following intensive training.8 Finally, understanding risk factors associated with insertion complications might inform preventative strategies and improve patient safety.9-11
Few studies to date have examined trainees’ perceptions on CVC training, experience, supervision, and ability to recognize and prevent mechanical complications. While research investigating effects of simulation training has accumulated, most focus on successful completion of the procedure or individual procedural steps with little emphasis on operator perceptions.12-14 In addition, while multiple studies have shown that unsuccessful line attempts are a risk factor for CVC complications,3,4,7,15 there is very little known about trainee behavior and perceptions regarding unsuccessful line placement. CVC simulation trainings often assume successful completion of the procedure and do not address the crucial postprocedure steps that should be undertaken if a procedure is unsuccessful. For these reasons, we developed a survey to specifically examine trainee experience with CVC placement, supervision, postprocedural behavior, and attitudes regarding unsuccessful line placement.
Therefore, we designed a study with 2 specific goals: The first is to perform a contemporary analysis of CVC mechanical complication rate at an academic teaching institution and identify potential risk factors associated with these complications. Second, we sought to determine trainee perceptions regarding CVC complication experience, prevention, procedural supervision, and perceptions surrounding unsuccessful line placement.
METHODS
Design and Setting
We conducted a single-center retrospective review of nontunneled acute CVC procedures between June 1, 2014, and May 1, 2015, at the University of Michigan Health System (UMHS). UMHS is a tertiary care referral center with over 900 inpatient beds, including 99 ICU beds.
All residents in internal medicine, surgery, anesthesia, and emergency medicine receive mandatory education in CVC placement that includes an online training module and simulation-based training with competency assessment. Use of real-time ultrasound guidance is considered the standard of care for CVC placement.
Data Collection
Inpatient procedure notes were electronically searched for terms indicating CVC placement. This was performed by using our hospital’s Data Office for Clinical and Translational Research using the Electronic Medical Record Search Engine tool. Please see the supplemental materials for the full list of search terms. We electronically extracted data, including date of procedure, gender, and most recent body mass index (BMI), within 1 year prior to note. Acute Physiology and Chronic Health Evaluation III (APACHE III) data are tracked for all patients on admission to ICU; this was collected when available. Charts were then manually reviewed to collect additional data, including international normalized ratio (INR), platelet count, lactate level on the day of CVC placement, anticoagulant use (actively prescribed coumadin, therapeutic enoxaparin, therapeutic unfractionated heparin, or direct oral anticoagulant), ventilator or noninvasive positive pressure ventilation (NIPPV) at time of CVC placement, and vasopressor requirement within 24 hours of CVC placement. The procedure note was reviewed to gather information about site of CVC placement, size and type of catheter, number of attempts, procedural success, training level of the operator, and attending presence. Small bore CVCs were defined as 7 French (Fr) or lower. Large bore CVCs were defined as >7 Fr; this includes dialysis catheters, Cordis catheters (Cordis, Fremont, CA), and cooling catheters. The times of the procedure note and postprocedure chest x-ray (CXR) were recorded, including whether the CVC was placed on a weekend (Friday 7
Primary Outcome
The primary outcome was the rate of severe mechanical complications related to CVC placement. Similar to prior studies,2 we defined severe mechanical complications as arterial placement of dilator or catheter, hemothorax, pneumothorax, cerebral ischemia, patient death (related to procedure), significant hematoma, or vascular injury (defined as complication requiring expert consultation or blood product transfusion). We did not require a lower limit on blood transfusion. We considered pneumothorax a complication regardless of whether chest tube intervention was performed, as pneumothorax subjects the patient to additional tests (eg, serial CXRs) and sometimes symptoms (shortness of breath, pain, anxiety) regardless of whether or not a chest tube was required. Complications were confirmed by a direct review of procedure notes, progress notes, discharge summaries, and imaging studies.
Trainee Survey
A survey was electronically disseminated to all internal medicine and medicine-pediatric residents to inquire about CVC experiences, including time spent in the medical ICU, number of CVCs performed, postprocedure behavior for both failed and successful CVCs, and supervision experience and attitudes. Please see supplemental materials for full survey contents.
Statistical Methods
Descriptive statistics (percentage) were used to summarize data. Continuous and categorical variables were compared using Student t tests and chi-square tests, respectively. All analyses were performed using SAS 9.3 (SAS Institute, Cary, NC).
Ethical and Regulatory Oversight
The study was deemed exempt by the University of Michigan Institutional Review Board (HUM00100549) as data collection was part of a quality improvement effort.
RESULTS
Demographics and Characteristics of Device Insertion
Between June 1, 2014, and May 1, 2015, 730 CVC procedure notes were reviewed (Table 1). The mean age of the study population was 58.9 years, and 41.6% (n = 304) were female. BMI data were available in 400 patients without complications and 5 patients with complications; the average BMI was 31.5 kg/m2. The APACHE III score was available for 442 patients without complications and 10 patients with complications; the average score was 86 (range 19-200). Most of the CVCs placed (n= 504, 69%) were small bore (<7 Fr). The majority of catheters were placed in the internal jugular (IJ) position (n = 525, 71.9%), followed by femoral (n = 144, 19.7%), subclavian (N = 57, 7.8%), and undocumented (n = 4, 0.6%). Ninety-six percent (n = 699) of CVCs were successfully placed. Seventy-six percent (n = 558) of procedure notes included documentation of the number of CVC attempts; of these, 85% documented 2 or fewer attempts. The majority of CVCs were placed by residents (n = 537, 73.9%), followed by fellows (N = 127, 17.5%) and attendings (n = 27, 3.7%). Attending supervision for all or key portions of CVC placement occurred 34.7% (n = 244) of the time overall and was lower for internal medicine trainees (n = 98/463, 21.2%) compared with surgical trainees (n = 73/127, 57.4%) or emergency medicine trainees (n = 62/96, 64.6%; P < 0.001). All successful IJ and subclavian CVCs except for 2 insertions (0.3%) had a postprocedure CXR. A minority of notes documented pressure transduction (4.5%) or blood gas analysis (0.2%) to confirm venous placement.
Mechanical Complications
The mechanical complications identified included pneumothorax (n = 5), bleeding requiring transfusion (n = 3), vascular injury requiring expert consultation or intervention (n = 3), stroke (n = 1), and death (n = 2). Vascular injuries included 1 neck hematoma with superinfection requiring antibiotics, 1 neck hematoma requiring otolaryngology and vascular surgery consultation, and 1 venous dissection of IJ vein requiring vascular surgery consultation. None of these cases required operative intervention. The stroke was caused by inadvertent CVC placement into the carotid artery. One patient experienced tension pneumothorax and died due to this complication; this death occurred after 3 failed left subclavian CVC attempts and an ultimately successful CVC placement into left IJ vein. Another death occurred immediately following unsuccessful Cordis placement. As no autopsy was performed, it is impossible to know if the cause of death was the line placement. However, it would be prudent to consider this as a CVC complication given the temporal relationship to line placement. Thus, the total number of patients who experienced severe mechanical complications was 14 out of 730 (1.92%).
Risk Factors for Mechanical Complications
Certain patient factors were more commonly associated with complications. For example, BMI was significantly lower in the group that experienced complications vs those that did not (25.7 vs 31.0 kg/m2, P = 0.001). No other associations between demographic factors, including age (61.4 years vs 58.9 years, P = 0.57) or sex (57.1% male vs 41.3% female, P = 0.24), or admission APACHE III score (96 vs 86, P = 0.397) were noted. The mean INR, platelets, and lactate did not differ between the 2 groups. There was no difference between the use of vasopressors. Ventilator use (including endotracheal tube or NIPPV) was found to be significantly higher in the group that experienced mechanical complications (78.5% vs 65.9%, P = 0.001). Anticoagulation use was also associated with mechanical complications (28.6% vs 20.6%, P = 0.05); 3 patients on anticoagulation experienced significant hematomas. Mechanical complications were more common with subclavian location (21.4% vs 7.8%, P = 0.001); in all 3 cases involving subclavian CVC placement, the complication experienced was pneumothorax. The number of attempts significantly differed between the 2 groups, with an average of 1.5 attempts in the group without complications and 2.2 attempts in the group that experienced complications (P = 0.02). Additionally, rates of successful placement were lower among patients who experienced complications (78.6% vs 95.7%, P = 0.001).
With respect to operator characteristics, no significant difference between the levels of training was noted among those who experienced complications vs those who did not. Attending supervision was more frequent for the group that experienced complications (61.5% vs 34.2%, P = 0.04). There was no significant difference in complication rate according to the first vs the second half of the academic year (0.4% vs 0.3% per month, P = 0.30) or CVC placement during the day vs night (1.9% vs 2.0%, P = 0.97). A trend toward more complications in CVCs placed over the weekend compared to a weekday was observed (2.80% vs 1.23%, P = 0.125).
Unsuccessful CVCs
There were 30 documented unsuccessful CVC procedures, representing 4.1% of all procedures. Of these, 3 procedures had complications; these included 2 pneumothoraxes (1 leading to death) and 1 unexplained death. Twenty-four of the unsuccessful CVC attempts were in either the subclavian or IJ location; of these, 5 (21%) did not have a postprocedure CXR obtained.
Survey Results
The survey was completed by 103 out of 166 internal medicine residents (62% response rate). Of these, 55% (n = 57) reported having performed 5 or more CVCs, and 14% (n = 14) had performed more than 15 CVCs.
All respondents who had performed at least 1 CVC (n = 80) were asked about their perceptions regarding attending supervision. Eighty-one percent (n = 65/80) responded that they have never been directly supervised by an attending during CVC placement, while 16% (n = 13/80) reported being supervised less than 25% of the time. Most (n = 53/75, 71%) did not feel that attending supervision affected their performance, while 21% (n = 16/75) felt it affected performance negatively, and only 8% (n = 6/75) stated it affected performance positively. Nineteen percent (n = 15/80) indicated that they prefer more supervision by attendings, while 35% (n = 28/80) did not wish for more attending supervision, and 46% (n = 37/80) were indifferent.
DISCUSSION
We performed a contemporary analysis of CVC placement at an academic tertiary care center and observed a rate of severe mechanical complications of 1.9%. This rate is within previously described acceptable thresholds.16 Our study adds to the literature by identifying several important risk factors for development of mechanical complications. We confirm many risk factors that have been noted historically, such as subclavian line location,2,3 attending supervision,3 low BMI,4 number of CVC attempts, and unsuccessful CVC placement.3,4,7,15 We identified several unique risk factors, including systemic anticoagulation as well as ventilator use. Lastly, we identified unexpected deficits in trainee knowledge surrounding management of failed CVCs and negative attitudes regarding attending supervision.
Most existing literature evaluated risk factors for CVC complication prior to routine ultrasound use;3-5,7,15 surprisingly, it appears that severe mechanical complications do not differ dramatically in the real-time ultrasound era. Eisen et al.3 prospectively studied CVC placement at an academic medical center and found a severe mechanical complication rate (as defined in our paper) of 1.9% due to pneumothorax (1.3%), hemothorax (0.3%), and death (0.3%).We would expect the number of complications to decrease in the postultrasound era, and indeed it appears that pneumothoraces have decreased likely due to ultrasound guidance and decrease in subclavian location. However, in contrast, rates of significant hematomas and bleeding are higher in our study. Although we are unable to state why this may be the case, increasing use of anticoagulation in the general population might explain this finding.17 For instance, of the 6 patients who experienced hematomas or vascular injuries in our study, 3 were on anticoagulation at the time of CVC placement.
Interestingly, time of academic year of CVC placement and level of training were not correlated with an increased risk of complications, nor was time of day of CVC placement. In contrast, Merrer et al.showed that CVC insertion during nighttime was significantly associated with increased mechanical complications (odds ratio 2.06, 95% confidence interval, 1.04-4.08;,P = 0.03).5 This difference may be attributable to the fact that most of our ICUs now have a night float system rather than a more traditional 24-hour call model; therefore, trainees are less likely to be sleep deprived during CVC placement at night.
Severity of illness did not appear to significantly affect mechanical complication rates based on similar APACHE scores between the 2 groups. In addition, other indicators of illness severity (vasopressor use or lactate level) did not suggest that sicker patients may be more likely to experience mechanical complications than others. One could conjecture that perhaps sicker patients were more likely to have lines placed by more experienced trainees, although the present study design does not allow us to answer this question. Interestingly, ventilator use was associated with higher rates of complications. We cannot say definitively why this was the case; however, 1 contributing factor may be the physical constraints of placing the CVC around ventilator tubing.
Several unexpected findings surrounding attending supervision were noted: first, attending supervision appears to be significantly associated with increased complication rate, and second, trainees have negative perceptions regarding attending supervision. Eisen et al.showed a similar association between attending supervision and complication rate.3 It is possible that the increased complication rate is because sicker patients are more likely to have procedural supervision by attendings, attending physicians may be called to supervise when a CVC placement is not going as planned, or attendings may supervise more inexperienced operators. Reasons behind negative trainee attitudes surrounding supervision are unclear and literature on this topic is limited. This is an area that warrants further exploration in future studies.
Another unexpected finding is trainee practices regarding unsuccessful CVC placement; most trainees do not document failed procedures or order follow-up CXRs after unsuccessful CVC attempts. Given the higher risk of complications after unsuccessful CVCs, it is paramount that all physicians are trained to order postprocedure CXR to rule out pneumothorax or hemothorax. Furthermore, documentation of failed procedures is important for medical accuracy, transparency, and also hospital billing. It is unknown if these practices surrounding unsuccessful CVCs are institution-specific or more widespread. As far as we know, this is the first time that trainee practices regarding failed CVC placement have been published. Interestingly, while many current guidelines call attention to prevention, recognition, and management of central line-associated mechanical complications, specific recommendations about postprocedure behavior after failed CVC placement are not published.9-11 We feel it is critical that institutions reflect on their own practices, especially given that unsuccessful CVCs are shown to be correlated with a significant increase in complication rate. At our own institution, we have initiated an educational component of central line training for medicine trainees specifically addressing failed central line attempts.
This study has several limitations, including a retrospective study design at a single institution. There was a low overall number of complications, which reduced our ability to detect risk factors for complications and did not allow us to perform multivariable adjustment. Other limitations are that only documented CVC attempts were recorded and only those that met our search criteria. Lastly, not all notes contain information such as the number of attempts or peer supervision. Furthermore, the definition of CVC “attempt” is left to the operator’s discretion.
In conclusion, we observed a modern CVC mechanical complication rate of 1.9%. While the complication rate is similar to previous studies, there appear to be lower rates of pneumothorax and higher rates of bleeding complications. We also identified a deficit in trainee education regarding unsuccessful CVC placement; this is a novel finding and requires further investigation at other centers.
Disclosure: The authors have no conflicts of interest to report.
1. McGee DC, Gould MK. Preventing complications of central venous catheterization. N Engl J Med. 2003;348(12):1123-1133. PubMed
2. Parienti JJ, Mongardon N, Mégarbane B, et al. Intravascular complications of central venous catheterization by insertion site. N Engl J Med. 2015;373(13):1220-1229. PubMed
3. Eisen LA, Narasimhan M, Berger JS, Mayo PH, Rosen MJ, Schneider RF. Mechanical complications of central venous catheters. J Intensive Care Med. 2006;21(1):40-46. PubMed
4. Mansfield PF, Hohn DC, Fornage BD, Gregurich MA, Ota DM. Complications and failures of subclavian-vein catheterization. N Engl J Med. 1994;331(26):1735-1738. PubMed
5. Merrer J, De Jonghe B, Golliot F, et al. Complications of femoral and subclavian venous catheterization in critically ill patients: A randomized controlled trial. JAMA. 2001;286(6):700-707. PubMed
6. Steele R, Irvin CB. Central line mechanical complication rate in emergency medicine patients. Acad Emerg Med. 2001;8(2):204-207. PubMed
7. Calvache JA, Rodriguez MV, Trochez A, Klimek M, Stolker RJ, Lesaffre E. Incidence of mechanical complications of central venous catheterization using landmark technique: Do not try more than 3 times. J Intensive Care Med. 2016;31(6):397-402. PubMed
8. Barsuk JH, McDaghie WC, Cohen ER, Balachandran JS, Wayne DB. Use of simulation-based mastery learning to improve the quality of central venous catheter placement in a medical intensive care unit. J Hosp Med. 2009;4(7):397-403. PubMed
9. American Society of Anesthesiologists Task Force on Central Venous Access, Rupp SM, Apfelbaum JL, et al. Practice guidelines for central venous access: A report by the American Society of Anesthesiologists Task Force on Central Venous Access. Anesthesiology. 2012;116(3):539-573. PubMed
10. Bodenham Chair A, Babu S, Bennett J, et al. Association of Anaesthetists of Great Britian and Irealand: Safe vascular access 2016. Anaesthesia. 2016;71:573-585. PubMed
11. Frykholm P, Pikwer A, Hammarskjöld F, et al. Clinical guidelines on central venous catheterisation. Swedish Society of Anaesthesiology and Intensic Care Medicine. Acta Anaesteshiol Scand. 2014;58(5):508-524. PubMed
12. Sekiguchi H, Tokita JE, Minami T, Eisen LA, Mayo PH, Narasimhan M. A prerotational, simulation-based workshop improves the safety of central venous catheter insertion: Results of a successful internal medicine house staff training program. Chest. 2011;140(3): 652-658. PubMed
13. Dong Y, Suri HS, Cook DA, et al. Simulation-based objective assessment discerns clinical proficiency in central line placement: A construct validation. Chest. 2010;137(5):1050-1056. PubMed
14. Evans LV, Dodge KL, Shah TD, et al. Simulation training in central venous catheter insertion: Improved performance in clinical practice. Acad Med. 2010;85(9):1462-1469. PubMed
15. Lefrant JY, Muller L, De La Coussaye JE et al. Risk factors of failure and immediate complication of subclavian vein catheterization in critically ill patients. Intensive Care Med. 2002;28(8):1036-1041. PubMed
16. Dariushnia SR, Wallace MJ, Siddigi NH, et al. Quality improvement guidelines for central venous access. J Vasc Interv Radiol. 2010;21(7):976-981. PubMed
17. Barnes GD, Lucas E, Alexander GC, Goldberger ZD. National trends in ambulatory oral anticoagulant use. Am J Med. 2015;128(12):1300-1305.e2. PubMed
© 2017 Society of Hospital Medicine
Safe and effective bedside thoracentesis: A review of the evidence for practicing clinicians
Pleural effusion can occur in myriad conditions including infection, heart failure, liver disease, and cancer.1 Consequently, physicians from many disciplines routinely encounter both inpatients and outpatients with this diagnosis. Often, evaluation and treatment require thoracentesis to obtain fluid for analysis or symptom relief.
Although historically performed at the bedside without imaging guidance or intraprocedural monitoring, thoracentesis performed in this fashion carries considerable risk of complications. In fact, it has 1 of the highest rates of iatrogenic pneumothorax among bedside procedures.2 However, recent advances in practice and adoption of newer technologies have helped to mitigate risks associated with this procedure. These advances are relevant because approximately 50% of thoracenteses are still performed at the bedside.3 In this review, we aim to identify the most recent key practices that enhance the safety and the effectiveness of thoracentesis for practicing clinicians.
METHODS
Information Sources and Search Strategy
With the assistance of a research librarian, we performed a systematic search of PubMed-indexed articles from January 1, 2000 to September 30, 2015. Articles were identified using search terms such as thoracentesis, pleural effusion, safety, medical error, adverse event, and ultrasound in combination with Boolean operators. Of note, as thoracentesis is indexed as a subgroup of paracentesis in PubMed, this term was also included to increase the sensitivity of the search. The full search strategy is available in the Appendix. Any references cited in this review outside of the date range of our search are provided only to give relevant background information or establish the origin of commonly performed practices.
Study Eligibility and Selection Criteria
Studies were included if they reported clinical aspects related to thoracentesis. We defined clinical aspects as those strategies that focused on operator training, procedural techniques, technology, management, or prevention of complications. Non-English language articles, animal studies, case reports, conference proceedings, and abstracts were excluded. As our intention was to focus on the contemporary advances related to thoracentesis performance, (eg, ultrasound [US]), our search was limited to studies published after the year 2000. Two authors, Drs. Schildhouse and Lai independently screened studies to determine inclusion, excluding studies with weak methodology, very small sample sizes, and those only tangentially related to our aim. Disagreements regarding study inclusion were resolved by consensus. Drs. Lai, Barsuk, and Mourad identified additional studies by hand review of reference lists and content experts (Figure 1).

Conceptual Framework
All selected articles were categorized by temporal relationship to thoracentesis as pre-, intra-, or postprocedure. Pre-procedural topics were those outcomes that had been identified and addressed before attempting thoracentesis, such as physician training or perceived risks of harm. Intraprocedural considerations included aspects such as use of bedside US, pleural manometry, and large-volume drainage. Finally, postprocedural factors were those related to evaluation after thoracentesis, such as follow-up imaging. This conceptual framework is outlined in Figure 2.

RESULTS
The PubMed search returned a total of 1170 manuscripts, of which 56 articles met inclusion criteria. Four additional articles were identified by experts and included in the study.4-7 Therefore, 60 articles were identified and included in this review. Study designs included cohort studies, case control studies, systematic reviews, meta-analyses, narrative reviews, consensus guidelines, and randomized controlled trials. A summary of all included articles by topic can be found in the Table.

PRE-PROCEDURAL CONSIDERATIONS
Physician Training
Studies indicate that graduate medical education may not adequately prepare clinicians to perform thoracentesis.8 In fact, residents have the least exposure and confidence in performing thoracentesis when compared to other bedside procedures.9,10 In 1 survey, 69% of medical trainees desired more exposure to procedures, and 98% felt that procedural skills were important to master.11 Not surprisingly, then, graduating internal medicine residents perform poorly when assessed on a thoracentesis simulator.12
Supplemental training outside of residency is useful to develop and maintain skills for thoracentesis, such as simulation with direct observation in a zero-risk environment. In 1 study, “simulation-based mastery learning” combined an educational video presentation with repeated, deliberate practice on a simulator until procedural competence was acquired, over two 2-hour sessions. In this study, 40 third-year medicine residents demonstrated a 71% improvement in clinical skills performance after course completion, with 93% achieving a passing score. The remaining 7% also achieved passing scores with extra practice time.12 Others have built upon the concept of simulation-based training. For instance, 2 studies suggest that use of a simulation-based curriculum improved both thoracentesis knowledge and performance skills in a 3-hour session.13,14 Similarly, 1 prospective study reported that a half-day thoracentesis workshop using simulation and 1:1 direct observation successfully lowered pneumothorax rates from 8.6% to 1.8% in a group of practicing clinicians. Notably, additional interventions including use of bedside US, limiting operators to a focused group, and standardization of equipment were also a part of this quality improvement initiative.7 Although repetition is required to gain proficiency when using a simulator, performance and confidence appear to plateau with only 4 simulator trials. In medical students, improvements derived through simulator-based teaching were sustained when retested 6 months following training.15
An instrument to ensure competency is necessary, given variability in procedural experience among both new graduates and practicing physicians,. Our search did not identify any clinically validated tools that adequately assessed thoracentesis performance. However, some have been proposed16 and 1 validated in a simulation environment.12 Regarding the incorporation of US for effusion markup, 1 validated tool used an 11-domain assessment covering knowledge of US machine manipulation, recognition of images with common pleural effusion characteristics, and performance of thoracic US with puncture-site marking on a simulator. When used on 22 participants, scores with the tool could reliably differentiate between novice, intermediate, and advanced groups (P < 0.0001).17
Patient Selection
Coagulopathies and Anticoagulation. Historically, the accepted cutoff for performing thoracentesis is an international normalized ratio (INR) less than 1.5 and a platelet count greater than 50,000/µL. McVay et al.18 first showed in 1991 that use of these cutoffs was associated with low rates of periprocedural bleeding, leading to endorsement in the British Thoracic Society (BTS) Pleural Disease Guideline 2010.19 Other recommendations include the 2012 Society for Interventional Radiology guidelines that endorse correction of an INR greater than 2, or platelets less than 50,000/µL, based almost exclusively on expert opinion.5
However, data suggest that thoracentesis may be safely performed outside these parameters. For instance, a prospective study of approximately 9000 thoracenteses over 12 years found that patients with an INR of 1.5-2.9 or platelets of 20,000 - 49,000/µL experienced rates of bleeding complications similar to those with normal values.20 Similarly, a 2014 review21 found that the overall risk of hemorrhage during thoracentesis in the setting of moderate coagulopathy (defined as an INR of 1.5 - 3 or platelets of 25,000-50,000/µL), was not increased. In 1 retrospective study of more than 1000 procedures, no differences in hemorrhagic events were noted in patients with bleeding diatheses that received prophylactic fresh frozen plasma or platelets vs. those who did not.22 Of note, included studies used a variety of criteria to define a hemorrhagic complication, which included: an isolated 2 g/dL or more decrement in hemoglobin, presence of bloody fluid on repeat tap with associated hemoglobin decrement, rapid re-accumulation of fluid with a hemoglobin decrement, or transfusion of 2 units or more of whole blood.
Whether it is safe to perform thoracentesis on patients taking antiplatelet therapy is less well understood. Although data are limited, a few small-scale studies23,24 suggest that hemorrhagic complications following thoracentesis in patients receiving clopidogrel are comparable to the general population. We found no compelling data regarding the safety of thoracentesis in the setting of direct oral anticoagulants, heparin, low-molecular weight heparin, or intravenous direct thrombin inhibitors. Current practice is to generally avoid thoracentesis while these therapeutic anticoagulants are used.
Invasive mechanical ventilation. Pleural effusion is common in patients in the intensive care unit, including those requiring mechanical ventilation.25 Thoracentesis in this population is clinically important: fluid analysis in 1 study was shown to aid the diagnosis in 45% of cases and changes in treatment in 33%.26 However, clinicians may be reluctant to perform thoracentesis on patients who require mechanical ventilation, given the perception of a greater risk of pneumothorax from positive pressure ventilation.
Despite this concern, a 2011 meta-analysis including 19 studies and more than 1100 patients revealed rates of pneumothorax and hemothorax comparable to nonventilated patients.25 Furthermore, a 2015 prospective study that examined thoracentesis in 1377 mechanically ventilated patients revealed no difference in complication rates as well.20 Therefore, evidence suggests that performance of thoracentesis in mechanically ventilated patients is not contraindicated.
Skin Disinfection and Antisepsis Precautions
The 2010 BTS guidelines list empyema and wound infection as possible complications of thoracentesis.19 However, no data regarding incidence are provided. Additionally, an alcohol-based skin cleanser (such as 2% chlorhexidine gluconate/70% isopropyl alcohol), along with sterile gloves, field, and dressing are suggested as precautionary measures.19 In 1 single-center registry of 2489 thoracenteses performed using alcohol or iodine-based antiseptic and sterile drapes, no postprocedure infections were identified.27 Of note, we did not find other studies (including case reports) that reported either incidence or rate of infectious complications such as wound infection and empyema. In an era of modern skin antiseptics that have effectively reduced complications such as catheter-related bloodstream infection,28 the incidence of this event is thus likely to be low.
INTRAPROCEDURAL CONSIDERATIONS
Use of Bedside Ultrasound
Portable US has particular advantages for evaluation of pleural effusion vs other imaging modalities. Compared with computerized tomography (CT), bedside US offers similar performance but is less costly, avoids both radiation exposure and need for patient transportation, and provides results instantaneously.29,30 Compared to chest x-ray (CXR), US is more sensitive at detecting the presence, volume, and characteristics of pleural fluid30,31 and can be up to 100% sensitive for effusions greater than 100 mL.29 Furthermore, whereas CXR typically requires 200 mL of fluid to be present for detection of an effusion, US can reliably detect as little as 20 mL of fluid.29 When US was used to confirm thoracentesis puncture sites in a study involving 30 physicians of varying experience and 67 consecutive patients, 15% of sites found by clinical exam were inaccurate (less than 10 mm fluid present), 10% were at high risk for organ puncture, and a suitable fluid pocket was found 54% of times when exam could not.4
A 2010 meta-analysis of 24 studies and 6605 thoracenteses estimated the overall rate of pneumothorax at 6%; however, procedures performed with US guidance were associated with a 70% reduced risk of this event (odds ratio, 0.30; 95% confidence interval, 0.20 - 0.70).32 In a 2014 randomized control trial of 160 patients that compared thoracentesis with US guidance for site marking vs no US use, 10 pneumothoraces occurred in the control group vs 1 in the US group (12.5% vs 1.25%, P = 0.009).33 Similarly, another retrospective review of 445 consecutive patients with malignant effusions revealed a pneumothorax rate of 0.97% using US in real time during needle insertion compared to 8.89% for unguided thoracenteses (P < 0.0001).34 Several other studies using US guidance for either site markup or in real time reported similar pneumothorax rates, ranging from 1.1% - 4.8%.35-37 However, it is unclear if real-time US specifically provides an additive effect vs site marking alone, as no studies directly comparing the 2 methods were found.
Benefits of US also include a higher rate of procedural success, with 1 study demonstrating a 99% success rate when using US vs. 90% without (P = 0.030).33 A larger volume of fluid removed has been observed with US use as well, and methods have been described using fluid-pocket depth to guide puncture site localization and maximize drainage.38 Finally, US use for thoracentesis has been associated with lower costs and length of stay.39,40
Intercostal Artery Localization
Although rare (incidence, 0.18%-2%20,21,39), the occurrence of hemothorax following thoracentesis is potentially catastrophic. This serious complication is often caused by laceration of the intercostal artery (ICA) or 1 of its branches during needle insertion.41
While risk of injury is theoretically reduced by needle insertion superior to the rib, studies using cadaver dissection and 3D angiography show significant tortuosity of the ICA.6,41-43 The degree of tortuosity is increased within 6 cm of the midline, in more cephalad rib spaces, and in the elderly (older than 60 years).41-43 Furthermore, 1 cadaveric study also demonstrated the presence of arterial collaterals branching off the ICA at multiple intercostal spaces, ranging between 8 cm and 11 cm from the midline.41 This anatomic variability may explain why some have observed low complication and hemothorax rates with an extreme lateral approach.35 Bedside US with color flow Doppler imaging has been used to identify the ICA, with 88% sensitivity compared to CT imaging while adding little to exam time.44,45 Of note, a 37% drop in the rate of hemothorax was observed in 1 study with routine US guidance alone.39
Pleural Pressure Monitoring and Large-Volume Thoracentesis
While normal intrapleural pressures are approximately -5 to -10 cm H2O,46 the presence of a pleural effusion creates a complex interaction between fluid, compressed lung, and chest wall that can increase these pressures.47 During drainage of an effusion, pleural pressures may rapidly drop, provoking re-expansion pulmonary edema (REPE). While rare (0 -1%), clinically-diagnosed REPE is a serious complication that can lead to rapid respiratory failure and death.20,48 REPE is postulated to be caused by increased capillary permeability resulting from inflammation, driven by rapid re-inflation of the lung when exposed to highly negative intrapleural pressures.47,49
Measurement of intrapleural pressure using a water manometer during thoracentesis may minimize REPE by terminating fluid drainage when intrapleural pressure begins to drop rapidly.50,51 A cutoff of -20 cm H2O has been cited repeatedly as safe since being suggested by Light in 1980, but this is based on animal models.50,52 In 1 prospective study of 185 thoracenteses in which manometry was performed, 15% of patients had intrapleural pressure drop to less than -20 cm H2O (at which point the procedure was terminated) but suffered no REPE.50
Manometry is valuable in the identification of an unexpandable or trapped lung when pleural pressures drop rapidly with only minimal fluid volume removal.47,53 Other findings correlated with an unexpandable lung include a negative opening pressure47 and large fluctuations in pressure during the respiratory cycle.54
While development of symptoms (eg, chest pain, cough, or dyspnea) is often used as a surrogate, the correlation between intrapleural pressure and patient symptoms is inconsistent and not a reliable proxy.55 One study found that 22% of patients with chest pain during thoracentesis had intrapleural pressures lower than -20 cm H2O compared with 8.6% of asymptomatic patients,56 but it is unclear if the association is causal.
Thoracentesis is often performed for symptomatic relief and removal of large fluid volume. However, it remains common to halt fluid removal after 1.5 L, a threshold endorsed by BTS.19 While some investigators have suggested that removal of 2 L or more of pleural fluid does not compromise safety,57,58 a 4- to 5-fold rise in the risk of pneumothorax was noted in 2 studies.20,59 when more than 1.5 L of fluid was removed. The majority of these may be related to pneumothorax ex vacuo, a condition in which fluid is drained from the chest, but the lung is unable to expand and fill the space (eg, “trapped lung”), resulting in a persistent pneumothorax. This condition generally does not require treatment.60 When manometry is employed at 200-mL intervals with termination at an intrapleural pressure of less than 20 mm H2O, drainage of 3 L or more has been reported with low rates of pneumothorax and very low rates of REPE.50,51 However, whether this is cause and effect is unknown because REPE is rare, and more work is needed to determine the role of manometry for its prevention.
POSTPROCEDURAL CONSIDERATIONS
Postprocedure Imaging
Performing an upright CXR following thoracentesis is a practice that remains routinely done by many practitioners to monitor for complications. Such imaging was also endorsed by the American Thoracic Society guidelines.61 However, more recent data question the utility of this practice. Multiple studies have confirmed that post-thoracentesis CXR is unnecessary unless clinical suspicion for pneumothorax or REPE is present.36,58,62,63 The BTS guidelines also advocate this approach.19 Interestingly, a potentially more effective way to screen for postprocedure complications is through bedside US, which has been shown to be more sensitive than CXR in detecting pneumothorax.64 In 1 study of 185 patients, bedside US demonstrated a sensitivity of 88% and a specificity of 97% for diagnosing pneumothorax in patients with adequate quality scans, with positive and negative likelihood ratios of 55 and 0.17, respectively.65
DISCUSSION
Thoracentesis remains a core procedural skill for hospitalists, critical care physicians, and emergency physicians. It is the foundational component when investigating and treating pleural effusions. When the most current training, techniques, and technology are used, data suggest this procedure is safe to perform at the bedside. Our review highlights these strategies and evaluates which aspects might be most applicable to clinical practice.
Our findings have several implications for those who perform this procedure. First, appropriate training is central to procedural safety, and both simulation and direct observation by procedural experts have been shown by multiple investigators to improve knowledge and skill. This training should integrate the use of US in performing a focused thoracic exam.
Second, recommendations regarding coagulopathy and a “safe cutoff” of an INR less than 1.5 or platelets greater than 50,000/µL had limited evidentiary support. Rather, multiple studies suggest no difference in bleeding risk following thoracentesis with an INR as high as 3.0 and platelets greater than 25,000/µL. Furthermore, prophylactic transfusion with fresh frozen plasma or platelets before thoracentesis did not alter bleeding risk and exposes patients to transfusion complications. Thus, routine use of this practice can no longer be recommended. Third, further research is needed to understand the bleeding risk for patients on antiplatelet medications, heparin products, and also direct oral anticoagulants, given the growing popularity in their use and the potential consequences of even temporary cessation. Regarding patients on mechanical ventilation, thoracentesis demonstrated no difference in complication rates vs. the general population, and its performance in this population is encouraged when clinically indicated.
Intraprocedural considerations include the use of bedside US. Due to multiple benefits including effusion characterization, puncture site localization, and significantly lower rates of pneumothorax, the standard of care should be to perform thoracentesis with US guidance. Both use of US to mark an effusion immediately prior to puncture or in real time during needle insertion demonstrated benefit; however, it is unclear if 1 method is superior because no direct comparison studies were found. Further work is needed to investigate this potential.
Our review suggests that the location and course of the ICA is variable, especially near the midline, in the elderly, and in higher intercostal spaces, leaving it vulnerable to laceration. We recommend physicians only attempt thoracentesis at least 6 cm lateral to the midline due to ICA tortuosity and, ideally, 12 cm lateral, to avoid the presence of collaterals. Although only 2 small-scale studies were found pertaining to the use of US in identifying the ICA, we encourage physicians to consider learning how to screen for its presence as a part of their routine thoracic US exam in the area underlying the planned puncture site.
Manometry is beneficial because it can diagnose a nonexpandable lung and allows for pleural pressure monitoring.52,53 A simple U-shaped manometer can be constructed from intravenous tubing included in most thoracentesis kits, which adds little to overall procedure time. While low rates of REPE have been observed when terminating thoracentesis if pressures drop below -20 cm H2O or chest pain develops, neither measure appears to have reliable predictive value, limiting clinical utility. Further work is required to determine if a “safe pressure cutoff” exists. In general, we recommend the use of manometry when a nonexpandable (trapped) lung is suspected, because large drops in intrapleural pressure, a negative opening pressure, and respiratory variation can help confirm the diagnosis and avoid pneumothorax ex vacuo or unnecessary procedures in the future. As this condition appears to be more common in the setting of larger effusions, use of manometry when large-volume thoracenteses are planned is also reasonable.
Postprocedurally, routine imaging after thoracentesis is not recommended unless there is objective concern for complication. When indicated, bedside US is better positioned for this role compared with CXR, because it is more sensitive in detecting pneumothorax, provides instantaneous results, and avoids radiation exposure.
Our review has limitations. First, we searched only for articles between defined time periods, restricted our search to a single database, and excluded non-English articles. This has the potential to introduce selection bias, as nonprimary articles that fall within our time restrictions may cite older studies that are outside our search range. To minimize this effect, we performed a critical review of all included studies, especially nonprimary articles. Second, despite the focus of our search strategy to identify any articles related to patient safety and adverse events, we cannot guarantee that all relevant articles for any particular complication or risk factor were captured given the lack of more specific search terms. Third, although we performed a systematic search of the literature, we did not perform a formal systematic review or formally grade included studies. As the goal of our review was to categorize and operationalize clinical aspects, this approach was necessary, and we acknowledge that the quality of studies is variable. Lastly, we aimed to generate clinical recommendations for physicians performing thoracentesis at the bedside; others reviewing this literature may find or emphasize different aspects relevant to practice outside this setting.
In conclusion, evaluation and treatment of pleural effusions with bedside thoracentesis is an important skill for physicians of many disciplines. The evidence presented in this review will help inform the process and ensure patient safety. Physicians should consider incorporating these recommendations into their practice.
The authors thank Whitney Townsend, MLIS, health sciences informationist, for assistance with serial literature searches.
Disclosure
Nothing to report.
1. Kasper DL. Harrison's Principles of Internal Medicine. 19th ed. New York, NY: McGraw Hill Education; 2015.
2. Celik B, Sahin E, Nadir A, Kaptanoglu M. Iatrogenic pneumothorax: etiology, incidence and risk factors. Thorac Cardiovasc Surg. 2009;57(5):286-290. PubMed
3. Hooper CE, Welham SA, Maskell NA, Soc BT. Pleural procedures and patient safety: a national BTS audit of practice. Thorax. 2015;70(2):189-191. PubMed
4. Diacon AH, Brutsche MH, Soler M. Accuracy of pleural puncture sites: a prospective comparison of clinical examination with ultrasound. Chest. 2003;123(2):436-441. PubMed
5. Patel IJ, Davidson JC, Nikolic B, et al. Consensus guidelines for periprocedural management of coagulation status and hemostasis risk in percutaneous image-guided interventions. J Vasc Interv Radiol. 2012;23(6):727-736. PubMed
6. Wraight WM, Tweedie DJ, Parkin IG. Neurovascular anatomy and variation in the fourth, fifth, and sixth intercostal spaces in the mid-axillary line: a cadaveric study in respect of chest drain insertion. Clin Anat. 2005;18(5):346-349. PubMed
7. Duncan DR, Morgenthaler TI, Ryu JH, Daniels CE. Reducing iatrogenic risk in thoracentesis: establishing best practice via experiential training in a zero-risk environment. Chest. 2009;135(5):1315-1320. PubMed
8. Grover S, Currier PF, Elinoff JM, Mouchantaf KJ, Katz JT, McMahon GT. Development of a test to evaluate residents' knowledge of medical procedures. J Hosp Med. 2009;4(7):430-432. PubMed
9. Promes SB, Chudgar SM, Grochowski CO, et al. Gaps in procedural experience and competency in medical school graduates. Acad Emerg Med. 2009;16 Suppl 2:S58-62. PubMed
10. Huang GC, Smith CC, Gordon CE, et al. Beyond the comfort zone: residents assess their comfort performing inpatient medical procedures. Am J Med. 2006;119(1):71 e17-24. PubMed
11. Lagan J, Cutts L, Zaidi S, Benton I, Rylance J. Are we failing our trainees in providing opportunities to attain procedural confidence? Br J Hosp Med (Lond). 2015;76(2):105-108. PubMed
12. Wayne DB, Barsuk JH, O'Leary KJ, Fudala MJ, McGaghie WC. Mastery learning of thoracentesis skills by internal medicine residents using simulation technology and deliberate practice. J Hosp Med. 2008;3(1):48-54. PubMed
13. Lenchus JD. End of the "see one, do one, teach one" era: the next generation of invasive bedside procedural instruction. J Am Osteopath Assoc. 2010;110(6):340-346. PubMed
14. Lenchus J, Issenberg SB, Murphy D, et al. A blended approach to invasive bedside procedural instruction. Med Teach. 2011;33(2):116-123. PubMed
15. Jiang G, Chen H, Wang S, et al. Learning curves and long-term outcome of simulation-based thoracentesis training for medical students. BMC Med Educ. 2011;11:39. PubMed
16. Berg D, Berg K, Riesenberg LA, et al. The development of a validated checklist for thoracentesis: preliminary results. Am J Med Qual. 2013;28(3):220-226. PubMed
17. Salamonsen M, McGrath D, Steiler G, Ware R, Colt H, Fielding D. A new instrument to assess physician skill at thoracic ultrasound, including pleural effusion markup. Chest. 2013;144(3):930-934. PubMed
18. McVay PA, Toy PT. Lack of increased bleeding after paracentesis and thoracentesis in patients with mild coagulation abnormalities. Transfusion. 1991;31(2):164-171. PubMed
19. Havelock T, Teoh R, Laws D, Gleeson F, Group BTSPDG. Pleural procedures and thoracic ultrasound: British Thoracic Society Pleural Disease Guideline 2010. Thorax. 2010;65 Suppl 2:ii61-76. PubMed
20. Ault MJ, Rosen BT, Scher J, Feinglass J, Barsuk JH. Thoracentesis outcomes: a 12-year experience. Thorax. 2015;70(2):127-132. PubMed
21. Puchalski J. Thoracentesis and the risks for bleeding: a new era. Curr Opin Pulm Med. 2014;20(4):377-384. PubMed
22. Hibbert RM, Atwell TD, Lekah A, et al. Safety of ultrasound-guided thoracentesis in patients with abnormal preprocedural coagulation parameters. Chest. 2013;144(2):456-463. PubMed
23. Zalt MB, Bechara RI, Parks C, Berkowitz DM. Effect of routine clopidogrel use on bleeding complications after ultrasound-guided thoracentesis. J Bronchology Interv Pulmonol. 2012;19(4):284-287. PubMed
24. Mahmood K, Shofer SL, Moser BK, Argento AC, Smathers EC, Wahidi MM. Hemorrhagic complications of thoracentesis and small-bore chest tube placement in patients taking clopidogrel. Ann Am Thorac Soc. 2014;11(1):73-79. PubMed
25. Goligher EC, Leis JA, Fowler RA, Pinto R, Adhikari NK, Ferguson ND. Utility and safety of draining pleural effusions in mechanically ventilated patients: a systematic review and meta-analysis. Crit Care. 2011;15(1):R46. PubMed
26. Fartoukh M, Azoulay E, Galliot R, et al. Clinically documented pleural effusions in medical ICU patients: how useful is routine thoracentesis? Chest. 2002;121(1):178-184. PubMed
27. Cervini P, Hesley GK, Thompson RL, Sampathkumar P, Knudsen JM. Incidence of infectious complications after an ultrasound-guided intervention. AJR Am J Roentgenol. 2010;195(4):846-850. PubMed
28. Mimoz O, Chopra V, Timsit JF. What's new in catheter-related infection: skin cleansing and skin antisepsis. Intensive Care Med. 2016;42(11):1784-1786. PubMed
29. Soni NJ, Franco R, Velez MI, et al. Ultrasound in the diagnosis and management of pleural effusions. J Hosp Med. 2015;10(12):811-816. PubMed
30. Feller-Kopman D. Ultrasound-guided thoracentesis. Chest. 2006;129(6):1709-1714. PubMed
31. Shojaee S, Argento AC. Ultrasound-guided pleural access. Semin Respir Crit Care Med. 2014;35(6):693-705. PubMed
32. Gordon CE, Feller-Kopman D, Balk EM, Smetana GW. Pneumothorax following thoracentesis: a systematic review and meta-analysis. Arch Intern Med. 2010;170(4):332-339. PubMed
33. Perazzo A, Gatto P, Barlascini C, Ferrari-Bravo M, Nicolini A. Can ultrasound guidance reduce the risk of pneumothorax following thoracentesis? J Bras Pneumol. 2014;40(1):6-12. PubMed
34. Cavanna L, Mordenti P, Berte R, et al. Ultrasound guidance reduces pneumothorax rate and improves safety of thoracentesis in malignant pleural effusion: report on 445 consecutive patients with advanced cancer. World J Surg Oncol. 2014;12:139. PubMed
35. Soldati G, Smargiassi A, Inchingolo R, Sher S, Valente S, Corbo GM. Ultrasound-guided pleural puncture in supine or recumbent lateral position - feasibility study. Multidiscip Respir Med. 2013;8(1):18. PubMed
36. Pihlajamaa K, Bode MK, Puumalainen T, Lehtimaki A, Marjelund S, Tikkakoski T. Pneumothorax and the value of chest radiography after ultrasound-guided thoracocentesis. Acta Radiol. 2004;45(8):828-832. PubMed
37. Barnes TW, Morgenthaler TI, Olson EJ, Hesley GK, Decker PA, Ryu JH. Sonographically guided thoracentesis and rate of pneumothorax. J Clin Ultrasound. 2005;33(9):442-446. PubMed
38. Zanforlin A, Gavelli G, Oboldi D, Galletti S. Ultrasound-guided thoracenthesis: the V-point as a site for optimal drainage positioning. Eur Rev Med Pharmacol Sci. 2013;17(1):25-28. PubMed
39. Patel PA, Ernst FR, Gunnarsson CL. Ultrasonography guidance reduces complications and costs associated with thoracentesis procedures. J Clin Ultrasound. 2012;40(3):135-141. PubMed
40. Mercaldi CJ, Lanes SF. Ultrasound guidance decreases complications and improves the cost of care among patients undergoing thoracentesis and paracentesis. Chest. 2013;143(2):532-538. PubMed
41. Shurtleff E, Olinger A. Posterior intercostal artery tortuosity and collateral branch points: a cadaveric study. Folia Morphol (Warsz). 2012;71(4):245-251. PubMed
42. Helm EJ, Rahman NM, Talakoub O, Fox DL, Gleeson FV. Course and variation of the intercostal artery by CT scan. Chest. 2013;143(3):634-639. PubMed
43. Yoneyama H, Arahata M, Temaru R, Ishizaka S, Minami S. Evaluation of the risk of intercostal artery laceration during thoracentesis in elderly patients by using 3D-CT angiography. Intern Med. 2010;49(4):289-292. PubMed
44. Salamonsen M, Ellis S, Paul E, Steinke K, Fielding D. Thoracic ultrasound demonstrates variable location of the intercostal artery. Respiration. 2012;83(4):323-329. PubMed
45. Salamonsen M, Dobeli K, McGrath D, et al. Physician-performed ultrasound can accurately screen for a vulnerable intercostal artery prior to chest drainage procedures. Respirology. 2013;18(6):942-947. PubMed
46. Grippi MA. Fishman's pulmonary diseases and disorders. Fifth edition. ed. New York: McGraw-Hill Education; 2015.
47. Huggins JT, Doelken P. Pleural manometry. Clin Chest Med. 2006;27(2):229-240. PubMed
48. Echevarria C, Twomey D, Dunning J, Chanda B. Does re-expansion pulmonary oedema exist? Interact Cardiovasc Thorac Surg. 2008;7(3):485-489. PubMed
49. Sue RD, Matthay MA, Ware LB. Hydrostatic mechanisms may contribute to the pathogenesis of human re-expansion pulmonary edema. Intensive Care Med. 2004;30(10):1921-1926. PubMed
50. Feller-Kopman D, Berkowitz D, Boiselle P, Ernst A. Large-volume thoracentesis and the risk of reexpansion pulmonary edema. Ann Thorac Surg. 2007;84(5):1656-1661. PubMed
51. Villena V, Lopez-Encuentra A, Pozo F, De-Pablo A, Martin-Escribano P. Measurement of pleural pressure during therapeutic thoracentesis. Am J Respir Crit Care Med. 2000;162(4 Pt 1):1534-1538. PubMed
52. Doelken P, Huggins JT, Pastis NJ, Sahn SA. Pleural manometry: technique and clinical implications. Chest. 2004;126(6):1764-1769. PubMed
53. Feller-Kopman D. Therapeutic thoracentesis: the role of ultrasound and pleural manometry. Curr Opin Pulm Med. 2007;13(4):312-318. PubMed
54. Boshuizen RC, Sinaasappel M, Vincent AD, Goldfinger V, Farag S, van den Heuvel MM. Pleural pressure swing and lung expansion after malignant pleural effusion drainage: the benefits of high-temporal resolution pleural manometry. J Bronchology Interv Pulmonol. 2013;20(3):200-205. PubMed
55. Pannu J, DePew ZS, Mullon JJ, Daniels CE, Hagen CE, Maldonado F. Impact of pleural manometry on the development of chest discomfort during thoracentesis: a symptom-based study. J Bronchology Interv Pulmonol. 2014;21(4):306-313. PubMed
56. Feller-Kopman D, Walkey A, Berkowitz D, Ernst A. The relationship of pleural pressure to symptom development during therapeutic thoracentesis. Chest. 2006;129(6):1556-1560. PubMed
57. Abunasser J, Brown R. Safety of large-volume thoracentesis. Conn Med. 2010;74(1):23-26. PubMed
58. Mynarek G, Brabrand K, Jakobsen JA, Kolbenstvedt A. Complications following ultrasound-guided thoracocentesis. Acta Radiol. 2004;45(5):519-522. PubMed
59. Josephson T, Nordenskjold CA, Larsson J, Rosenberg LU, Kaijser M. Amount drained at ultrasound-guided thoracentesis and risk of pneumothorax. Acta Radiol. 2009;50(1):42-47. PubMed
60. Heidecker J, Huggins JT, Sahn SA, Doelken P. Pathophysiology of pneumothorax following ultrasound-guided thoracentesis. Chest. 2006;130(4):1173-1184. PubMed
61. Sokolowski JW Jr, Burgher LW, Jones FL Jr, Patterson JR, Selecky PA. Guidelines for thoracentesis and needle biopsy of the pleura. This position paper of the American Thoracic Society was adopted by the ATS Board of Directors, June 1988. Am Rev Respir Dis. 1989;140(1):257-258. PubMed
62. Jones PW, Moyers JP, Rogers JT, Rodriguez RM, Lee YC, Light RW. Ultrasound-guided thoracentesis: is it a safer method? Chest. 2003;123(2):418-423. PubMed
63. Petersen WG, Zimmerman R. Limited utility of chest radiograph after thoracentesis. Chest. 2000;117(4):1038-1042. PubMed
64. Sachdeva A, Shepherd RW, Lee HJ. Thoracentesis and thoracic ultrasound: state of the art in 2013. Clin Chest Med. 2013;34(1):1-9. PubMed
65. Shostak E, Brylka D, Krepp J, Pua B, Sanders A. Bedside sonography for detection of postprocedure pneumothorax. J Ultrasound Med. 2013;32(6):1003-1009. PubMed
Pleural effusion can occur in myriad conditions including infection, heart failure, liver disease, and cancer.1 Consequently, physicians from many disciplines routinely encounter both inpatients and outpatients with this diagnosis. Often, evaluation and treatment require thoracentesis to obtain fluid for analysis or symptom relief.
Although historically performed at the bedside without imaging guidance or intraprocedural monitoring, thoracentesis performed in this fashion carries considerable risk of complications. In fact, it has 1 of the highest rates of iatrogenic pneumothorax among bedside procedures.2 However, recent advances in practice and adoption of newer technologies have helped to mitigate risks associated with this procedure. These advances are relevant because approximately 50% of thoracenteses are still performed at the bedside.3 In this review, we aim to identify the most recent key practices that enhance the safety and the effectiveness of thoracentesis for practicing clinicians.
METHODS
Information Sources and Search Strategy
With the assistance of a research librarian, we performed a systematic search of PubMed-indexed articles from January 1, 2000 to September 30, 2015. Articles were identified using search terms such as thoracentesis, pleural effusion, safety, medical error, adverse event, and ultrasound in combination with Boolean operators. Of note, as thoracentesis is indexed as a subgroup of paracentesis in PubMed, this term was also included to increase the sensitivity of the search. The full search strategy is available in the Appendix. Any references cited in this review outside of the date range of our search are provided only to give relevant background information or establish the origin of commonly performed practices.
Study Eligibility and Selection Criteria
Studies were included if they reported clinical aspects related to thoracentesis. We defined clinical aspects as those strategies that focused on operator training, procedural techniques, technology, management, or prevention of complications. Non-English language articles, animal studies, case reports, conference proceedings, and abstracts were excluded. As our intention was to focus on the contemporary advances related to thoracentesis performance, (eg, ultrasound [US]), our search was limited to studies published after the year 2000. Two authors, Drs. Schildhouse and Lai independently screened studies to determine inclusion, excluding studies with weak methodology, very small sample sizes, and those only tangentially related to our aim. Disagreements regarding study inclusion were resolved by consensus. Drs. Lai, Barsuk, and Mourad identified additional studies by hand review of reference lists and content experts (Figure 1).
Conceptual Framework
All selected articles were categorized by temporal relationship to thoracentesis as pre-, intra-, or postprocedure. Pre-procedural topics were those outcomes that had been identified and addressed before attempting thoracentesis, such as physician training or perceived risks of harm. Intraprocedural considerations included aspects such as use of bedside US, pleural manometry, and large-volume drainage. Finally, postprocedural factors were those related to evaluation after thoracentesis, such as follow-up imaging. This conceptual framework is outlined in Figure 2.
RESULTS
The PubMed search returned a total of 1170 manuscripts, of which 56 articles met inclusion criteria. Four additional articles were identified by experts and included in the study.4-7 Therefore, 60 articles were identified and included in this review. Study designs included cohort studies, case control studies, systematic reviews, meta-analyses, narrative reviews, consensus guidelines, and randomized controlled trials. A summary of all included articles by topic can be found in the Table.
PRE-PROCEDURAL CONSIDERATIONS
Physician Training
Studies indicate that graduate medical education may not adequately prepare clinicians to perform thoracentesis.8 In fact, residents have the least exposure and confidence in performing thoracentesis when compared to other bedside procedures.9,10 In 1 survey, 69% of medical trainees desired more exposure to procedures, and 98% felt that procedural skills were important to master.11 Not surprisingly, then, graduating internal medicine residents perform poorly when assessed on a thoracentesis simulator.12
Supplemental training outside of residency is useful to develop and maintain skills for thoracentesis, such as simulation with direct observation in a zero-risk environment. In 1 study, “simulation-based mastery learning” combined an educational video presentation with repeated, deliberate practice on a simulator until procedural competence was acquired, over two 2-hour sessions. In this study, 40 third-year medicine residents demonstrated a 71% improvement in clinical skills performance after course completion, with 93% achieving a passing score. The remaining 7% also achieved passing scores with extra practice time.12 Others have built upon the concept of simulation-based training. For instance, 2 studies suggest that use of a simulation-based curriculum improved both thoracentesis knowledge and performance skills in a 3-hour session.13,14 Similarly, 1 prospective study reported that a half-day thoracentesis workshop using simulation and 1:1 direct observation successfully lowered pneumothorax rates from 8.6% to 1.8% in a group of practicing clinicians. Notably, additional interventions including use of bedside US, limiting operators to a focused group, and standardization of equipment were also a part of this quality improvement initiative.7 Although repetition is required to gain proficiency when using a simulator, performance and confidence appear to plateau with only 4 simulator trials. In medical students, improvements derived through simulator-based teaching were sustained when retested 6 months following training.15
An instrument to ensure competency is necessary, given variability in procedural experience among both new graduates and practicing physicians,. Our search did not identify any clinically validated tools that adequately assessed thoracentesis performance. However, some have been proposed16 and 1 validated in a simulation environment.12 Regarding the incorporation of US for effusion markup, 1 validated tool used an 11-domain assessment covering knowledge of US machine manipulation, recognition of images with common pleural effusion characteristics, and performance of thoracic US with puncture-site marking on a simulator. When used on 22 participants, scores with the tool could reliably differentiate between novice, intermediate, and advanced groups (P < 0.0001).17
Patient Selection
Coagulopathies and Anticoagulation. Historically, the accepted cutoff for performing thoracentesis is an international normalized ratio (INR) less than 1.5 and a platelet count greater than 50,000/µL. McVay et al.18 first showed in 1991 that use of these cutoffs was associated with low rates of periprocedural bleeding, leading to endorsement in the British Thoracic Society (BTS) Pleural Disease Guideline 2010.19 Other recommendations include the 2012 Society for Interventional Radiology guidelines that endorse correction of an INR greater than 2, or platelets less than 50,000/µL, based almost exclusively on expert opinion.5
However, data suggest that thoracentesis may be safely performed outside these parameters. For instance, a prospective study of approximately 9000 thoracenteses over 12 years found that patients with an INR of 1.5-2.9 or platelets of 20,000 - 49,000/µL experienced rates of bleeding complications similar to those with normal values.20 Similarly, a 2014 review21 found that the overall risk of hemorrhage during thoracentesis in the setting of moderate coagulopathy (defined as an INR of 1.5 - 3 or platelets of 25,000-50,000/µL), was not increased. In 1 retrospective study of more than 1000 procedures, no differences in hemorrhagic events were noted in patients with bleeding diatheses that received prophylactic fresh frozen plasma or platelets vs. those who did not.22 Of note, included studies used a variety of criteria to define a hemorrhagic complication, which included: an isolated 2 g/dL or more decrement in hemoglobin, presence of bloody fluid on repeat tap with associated hemoglobin decrement, rapid re-accumulation of fluid with a hemoglobin decrement, or transfusion of 2 units or more of whole blood.
Whether it is safe to perform thoracentesis on patients taking antiplatelet therapy is less well understood. Although data are limited, a few small-scale studies23,24 suggest that hemorrhagic complications following thoracentesis in patients receiving clopidogrel are comparable to the general population. We found no compelling data regarding the safety of thoracentesis in the setting of direct oral anticoagulants, heparin, low-molecular weight heparin, or intravenous direct thrombin inhibitors. Current practice is to generally avoid thoracentesis while these therapeutic anticoagulants are used.
Invasive mechanical ventilation. Pleural effusion is common in patients in the intensive care unit, including those requiring mechanical ventilation.25 Thoracentesis in this population is clinically important: fluid analysis in 1 study was shown to aid the diagnosis in 45% of cases and changes in treatment in 33%.26 However, clinicians may be reluctant to perform thoracentesis on patients who require mechanical ventilation, given the perception of a greater risk of pneumothorax from positive pressure ventilation.
Despite this concern, a 2011 meta-analysis including 19 studies and more than 1100 patients revealed rates of pneumothorax and hemothorax comparable to nonventilated patients.25 Furthermore, a 2015 prospective study that examined thoracentesis in 1377 mechanically ventilated patients revealed no difference in complication rates as well.20 Therefore, evidence suggests that performance of thoracentesis in mechanically ventilated patients is not contraindicated.
Skin Disinfection and Antisepsis Precautions
The 2010 BTS guidelines list empyema and wound infection as possible complications of thoracentesis.19 However, no data regarding incidence are provided. Additionally, an alcohol-based skin cleanser (such as 2% chlorhexidine gluconate/70% isopropyl alcohol), along with sterile gloves, field, and dressing are suggested as precautionary measures.19 In 1 single-center registry of 2489 thoracenteses performed using alcohol or iodine-based antiseptic and sterile drapes, no postprocedure infections were identified.27 Of note, we did not find other studies (including case reports) that reported either incidence or rate of infectious complications such as wound infection and empyema. In an era of modern skin antiseptics that have effectively reduced complications such as catheter-related bloodstream infection,28 the incidence of this event is thus likely to be low.
INTRAPROCEDURAL CONSIDERATIONS
Use of Bedside Ultrasound
Portable US has particular advantages for evaluation of pleural effusion vs other imaging modalities. Compared with computerized tomography (CT), bedside US offers similar performance but is less costly, avoids both radiation exposure and need for patient transportation, and provides results instantaneously.29,30 Compared to chest x-ray (CXR), US is more sensitive at detecting the presence, volume, and characteristics of pleural fluid30,31 and can be up to 100% sensitive for effusions greater than 100 mL.29 Furthermore, whereas CXR typically requires 200 mL of fluid to be present for detection of an effusion, US can reliably detect as little as 20 mL of fluid.29 When US was used to confirm thoracentesis puncture sites in a study involving 30 physicians of varying experience and 67 consecutive patients, 15% of sites found by clinical exam were inaccurate (less than 10 mm fluid present), 10% were at high risk for organ puncture, and a suitable fluid pocket was found 54% of times when exam could not.4
A 2010 meta-analysis of 24 studies and 6605 thoracenteses estimated the overall rate of pneumothorax at 6%; however, procedures performed with US guidance were associated with a 70% reduced risk of this event (odds ratio, 0.30; 95% confidence interval, 0.20 - 0.70).32 In a 2014 randomized control trial of 160 patients that compared thoracentesis with US guidance for site marking vs no US use, 10 pneumothoraces occurred in the control group vs 1 in the US group (12.5% vs 1.25%, P = 0.009).33 Similarly, another retrospective review of 445 consecutive patients with malignant effusions revealed a pneumothorax rate of 0.97% using US in real time during needle insertion compared to 8.89% for unguided thoracenteses (P < 0.0001).34 Several other studies using US guidance for either site markup or in real time reported similar pneumothorax rates, ranging from 1.1% - 4.8%.35-37 However, it is unclear if real-time US specifically provides an additive effect vs site marking alone, as no studies directly comparing the 2 methods were found.
Benefits of US also include a higher rate of procedural success, with 1 study demonstrating a 99% success rate when using US vs. 90% without (P = 0.030).33 A larger volume of fluid removed has been observed with US use as well, and methods have been described using fluid-pocket depth to guide puncture site localization and maximize drainage.38 Finally, US use for thoracentesis has been associated with lower costs and length of stay.39,40
Intercostal Artery Localization
Although rare (incidence, 0.18%-2%20,21,39), the occurrence of hemothorax following thoracentesis is potentially catastrophic. This serious complication is often caused by laceration of the intercostal artery (ICA) or 1 of its branches during needle insertion.41
While risk of injury is theoretically reduced by needle insertion superior to the rib, studies using cadaver dissection and 3D angiography show significant tortuosity of the ICA.6,41-43 The degree of tortuosity is increased within 6 cm of the midline, in more cephalad rib spaces, and in the elderly (older than 60 years).41-43 Furthermore, 1 cadaveric study also demonstrated the presence of arterial collaterals branching off the ICA at multiple intercostal spaces, ranging between 8 cm and 11 cm from the midline.41 This anatomic variability may explain why some have observed low complication and hemothorax rates with an extreme lateral approach.35 Bedside US with color flow Doppler imaging has been used to identify the ICA, with 88% sensitivity compared to CT imaging while adding little to exam time.44,45 Of note, a 37% drop in the rate of hemothorax was observed in 1 study with routine US guidance alone.39
Pleural Pressure Monitoring and Large-Volume Thoracentesis
While normal intrapleural pressures are approximately -5 to -10 cm H2O,46 the presence of a pleural effusion creates a complex interaction between fluid, compressed lung, and chest wall that can increase these pressures.47 During drainage of an effusion, pleural pressures may rapidly drop, provoking re-expansion pulmonary edema (REPE). While rare (0 -1%), clinically-diagnosed REPE is a serious complication that can lead to rapid respiratory failure and death.20,48 REPE is postulated to be caused by increased capillary permeability resulting from inflammation, driven by rapid re-inflation of the lung when exposed to highly negative intrapleural pressures.47,49
Measurement of intrapleural pressure using a water manometer during thoracentesis may minimize REPE by terminating fluid drainage when intrapleural pressure begins to drop rapidly.50,51 A cutoff of -20 cm H2O has been cited repeatedly as safe since being suggested by Light in 1980, but this is based on animal models.50,52 In 1 prospective study of 185 thoracenteses in which manometry was performed, 15% of patients had intrapleural pressure drop to less than -20 cm H2O (at which point the procedure was terminated) but suffered no REPE.50
Manometry is valuable in the identification of an unexpandable or trapped lung when pleural pressures drop rapidly with only minimal fluid volume removal.47,53 Other findings correlated with an unexpandable lung include a negative opening pressure47 and large fluctuations in pressure during the respiratory cycle.54
While development of symptoms (eg, chest pain, cough, or dyspnea) is often used as a surrogate, the correlation between intrapleural pressure and patient symptoms is inconsistent and not a reliable proxy.55 One study found that 22% of patients with chest pain during thoracentesis had intrapleural pressures lower than -20 cm H2O compared with 8.6% of asymptomatic patients,56 but it is unclear if the association is causal.
Thoracentesis is often performed for symptomatic relief and removal of large fluid volume. However, it remains common to halt fluid removal after 1.5 L, a threshold endorsed by BTS.19 While some investigators have suggested that removal of 2 L or more of pleural fluid does not compromise safety,57,58 a 4- to 5-fold rise in the risk of pneumothorax was noted in 2 studies.20,59 when more than 1.5 L of fluid was removed. The majority of these may be related to pneumothorax ex vacuo, a condition in which fluid is drained from the chest, but the lung is unable to expand and fill the space (eg, “trapped lung”), resulting in a persistent pneumothorax. This condition generally does not require treatment.60 When manometry is employed at 200-mL intervals with termination at an intrapleural pressure of less than 20 mm H2O, drainage of 3 L or more has been reported with low rates of pneumothorax and very low rates of REPE.50,51 However, whether this is cause and effect is unknown because REPE is rare, and more work is needed to determine the role of manometry for its prevention.
POSTPROCEDURAL CONSIDERATIONS
Postprocedure Imaging
Performing an upright CXR following thoracentesis is a practice that remains routinely done by many practitioners to monitor for complications. Such imaging was also endorsed by the American Thoracic Society guidelines.61 However, more recent data question the utility of this practice. Multiple studies have confirmed that post-thoracentesis CXR is unnecessary unless clinical suspicion for pneumothorax or REPE is present.36,58,62,63 The BTS guidelines also advocate this approach.19 Interestingly, a potentially more effective way to screen for postprocedure complications is through bedside US, which has been shown to be more sensitive than CXR in detecting pneumothorax.64 In 1 study of 185 patients, bedside US demonstrated a sensitivity of 88% and a specificity of 97% for diagnosing pneumothorax in patients with adequate quality scans, with positive and negative likelihood ratios of 55 and 0.17, respectively.65
DISCUSSION
Thoracentesis remains a core procedural skill for hospitalists, critical care physicians, and emergency physicians. It is the foundational component when investigating and treating pleural effusions. When the most current training, techniques, and technology are used, data suggest this procedure is safe to perform at the bedside. Our review highlights these strategies and evaluates which aspects might be most applicable to clinical practice.
Our findings have several implications for those who perform this procedure. First, appropriate training is central to procedural safety, and both simulation and direct observation by procedural experts have been shown by multiple investigators to improve knowledge and skill. This training should integrate the use of US in performing a focused thoracic exam.
Second, recommendations regarding coagulopathy and a “safe cutoff” of an INR less than 1.5 or platelets greater than 50,000/µL had limited evidentiary support. Rather, multiple studies suggest no difference in bleeding risk following thoracentesis with an INR as high as 3.0 and platelets greater than 25,000/µL. Furthermore, prophylactic transfusion with fresh frozen plasma or platelets before thoracentesis did not alter bleeding risk and exposes patients to transfusion complications. Thus, routine use of this practice can no longer be recommended. Third, further research is needed to understand the bleeding risk for patients on antiplatelet medications, heparin products, and also direct oral anticoagulants, given the growing popularity in their use and the potential consequences of even temporary cessation. Regarding patients on mechanical ventilation, thoracentesis demonstrated no difference in complication rates vs. the general population, and its performance in this population is encouraged when clinically indicated.
Intraprocedural considerations include the use of bedside US. Due to multiple benefits including effusion characterization, puncture site localization, and significantly lower rates of pneumothorax, the standard of care should be to perform thoracentesis with US guidance. Both use of US to mark an effusion immediately prior to puncture or in real time during needle insertion demonstrated benefit; however, it is unclear if 1 method is superior because no direct comparison studies were found. Further work is needed to investigate this potential.
Our review suggests that the location and course of the ICA is variable, especially near the midline, in the elderly, and in higher intercostal spaces, leaving it vulnerable to laceration. We recommend physicians only attempt thoracentesis at least 6 cm lateral to the midline due to ICA tortuosity and, ideally, 12 cm lateral, to avoid the presence of collaterals. Although only 2 small-scale studies were found pertaining to the use of US in identifying the ICA, we encourage physicians to consider learning how to screen for its presence as a part of their routine thoracic US exam in the area underlying the planned puncture site.
Manometry is beneficial because it can diagnose a nonexpandable lung and allows for pleural pressure monitoring.52,53 A simple U-shaped manometer can be constructed from intravenous tubing included in most thoracentesis kits, which adds little to overall procedure time. While low rates of REPE have been observed when terminating thoracentesis if pressures drop below -20 cm H2O or chest pain develops, neither measure appears to have reliable predictive value, limiting clinical utility. Further work is required to determine if a “safe pressure cutoff” exists. In general, we recommend the use of manometry when a nonexpandable (trapped) lung is suspected, because large drops in intrapleural pressure, a negative opening pressure, and respiratory variation can help confirm the diagnosis and avoid pneumothorax ex vacuo or unnecessary procedures in the future. As this condition appears to be more common in the setting of larger effusions, use of manometry when large-volume thoracenteses are planned is also reasonable.
Postprocedurally, routine imaging after thoracentesis is not recommended unless there is objective concern for complication. When indicated, bedside US is better positioned for this role compared with CXR, because it is more sensitive in detecting pneumothorax, provides instantaneous results, and avoids radiation exposure.
Our review has limitations. First, we searched only for articles between defined time periods, restricted our search to a single database, and excluded non-English articles. This has the potential to introduce selection bias, as nonprimary articles that fall within our time restrictions may cite older studies that are outside our search range. To minimize this effect, we performed a critical review of all included studies, especially nonprimary articles. Second, despite the focus of our search strategy to identify any articles related to patient safety and adverse events, we cannot guarantee that all relevant articles for any particular complication or risk factor were captured given the lack of more specific search terms. Third, although we performed a systematic search of the literature, we did not perform a formal systematic review or formally grade included studies. As the goal of our review was to categorize and operationalize clinical aspects, this approach was necessary, and we acknowledge that the quality of studies is variable. Lastly, we aimed to generate clinical recommendations for physicians performing thoracentesis at the bedside; others reviewing this literature may find or emphasize different aspects relevant to practice outside this setting.
In conclusion, evaluation and treatment of pleural effusions with bedside thoracentesis is an important skill for physicians of many disciplines. The evidence presented in this review will help inform the process and ensure patient safety. Physicians should consider incorporating these recommendations into their practice.
The authors thank Whitney Townsend, MLIS, health sciences informationist, for assistance with serial literature searches.
Disclosure
Nothing to report.
1. Kasper DL. Harrison's Principles of Internal Medicine. 19th ed. New York, NY: McGraw Hill Education; 2015.
2. Celik B, Sahin E, Nadir A, Kaptanoglu M. Iatrogenic pneumothorax: etiology, incidence and risk factors. Thorac Cardiovasc Surg. 2009;57(5):286-290. PubMed
3. Hooper CE, Welham SA, Maskell NA, Soc BT. Pleural procedures and patient safety: a national BTS audit of practice. Thorax. 2015;70(2):189-191. PubMed
4. Diacon AH, Brutsche MH, Soler M. Accuracy of pleural puncture sites: a prospective comparison of clinical examination with ultrasound. Chest. 2003;123(2):436-441. PubMed
5. Patel IJ, Davidson JC, Nikolic B, et al. Consensus guidelines for periprocedural management of coagulation status and hemostasis risk in percutaneous image-guided interventions. J Vasc Interv Radiol. 2012;23(6):727-736. PubMed
6. Wraight WM, Tweedie DJ, Parkin IG. Neurovascular anatomy and variation in the fourth, fifth, and sixth intercostal spaces in the mid-axillary line: a cadaveric study in respect of chest drain insertion. Clin Anat. 2005;18(5):346-349. PubMed
7. Duncan DR, Morgenthaler TI, Ryu JH, Daniels CE. Reducing iatrogenic risk in thoracentesis: establishing best practice via experiential training in a zero-risk environment. Chest. 2009;135(5):1315-1320. PubMed
8. Grover S, Currier PF, Elinoff JM, Mouchantaf KJ, Katz JT, McMahon GT. Development of a test to evaluate residents' knowledge of medical procedures. J Hosp Med. 2009;4(7):430-432. PubMed
9. Promes SB, Chudgar SM, Grochowski CO, et al. Gaps in procedural experience and competency in medical school graduates. Acad Emerg Med. 2009;16 Suppl 2:S58-62. PubMed
10. Huang GC, Smith CC, Gordon CE, et al. Beyond the comfort zone: residents assess their comfort performing inpatient medical procedures. Am J Med. 2006;119(1):71 e17-24. PubMed
11. Lagan J, Cutts L, Zaidi S, Benton I, Rylance J. Are we failing our trainees in providing opportunities to attain procedural confidence? Br J Hosp Med (Lond). 2015;76(2):105-108. PubMed
12. Wayne DB, Barsuk JH, O'Leary KJ, Fudala MJ, McGaghie WC. Mastery learning of thoracentesis skills by internal medicine residents using simulation technology and deliberate practice. J Hosp Med. 2008;3(1):48-54. PubMed
13. Lenchus JD. End of the "see one, do one, teach one" era: the next generation of invasive bedside procedural instruction. J Am Osteopath Assoc. 2010;110(6):340-346. PubMed
14. Lenchus J, Issenberg SB, Murphy D, et al. A blended approach to invasive bedside procedural instruction. Med Teach. 2011;33(2):116-123. PubMed
15. Jiang G, Chen H, Wang S, et al. Learning curves and long-term outcome of simulation-based thoracentesis training for medical students. BMC Med Educ. 2011;11:39. PubMed
16. Berg D, Berg K, Riesenberg LA, et al. The development of a validated checklist for thoracentesis: preliminary results. Am J Med Qual. 2013;28(3):220-226. PubMed
17. Salamonsen M, McGrath D, Steiler G, Ware R, Colt H, Fielding D. A new instrument to assess physician skill at thoracic ultrasound, including pleural effusion markup. Chest. 2013;144(3):930-934. PubMed
18. McVay PA, Toy PT. Lack of increased bleeding after paracentesis and thoracentesis in patients with mild coagulation abnormalities. Transfusion. 1991;31(2):164-171. PubMed
19. Havelock T, Teoh R, Laws D, Gleeson F, Group BTSPDG. Pleural procedures and thoracic ultrasound: British Thoracic Society Pleural Disease Guideline 2010. Thorax. 2010;65 Suppl 2:ii61-76. PubMed
20. Ault MJ, Rosen BT, Scher J, Feinglass J, Barsuk JH. Thoracentesis outcomes: a 12-year experience. Thorax. 2015;70(2):127-132. PubMed
21. Puchalski J. Thoracentesis and the risks for bleeding: a new era. Curr Opin Pulm Med. 2014;20(4):377-384. PubMed
22. Hibbert RM, Atwell TD, Lekah A, et al. Safety of ultrasound-guided thoracentesis in patients with abnormal preprocedural coagulation parameters. Chest. 2013;144(2):456-463. PubMed
23. Zalt MB, Bechara RI, Parks C, Berkowitz DM. Effect of routine clopidogrel use on bleeding complications after ultrasound-guided thoracentesis. J Bronchology Interv Pulmonol. 2012;19(4):284-287. PubMed
24. Mahmood K, Shofer SL, Moser BK, Argento AC, Smathers EC, Wahidi MM. Hemorrhagic complications of thoracentesis and small-bore chest tube placement in patients taking clopidogrel. Ann Am Thorac Soc. 2014;11(1):73-79. PubMed
25. Goligher EC, Leis JA, Fowler RA, Pinto R, Adhikari NK, Ferguson ND. Utility and safety of draining pleural effusions in mechanically ventilated patients: a systematic review and meta-analysis. Crit Care. 2011;15(1):R46. PubMed
26. Fartoukh M, Azoulay E, Galliot R, et al. Clinically documented pleural effusions in medical ICU patients: how useful is routine thoracentesis? Chest. 2002;121(1):178-184. PubMed
27. Cervini P, Hesley GK, Thompson RL, Sampathkumar P, Knudsen JM. Incidence of infectious complications after an ultrasound-guided intervention. AJR Am J Roentgenol. 2010;195(4):846-850. PubMed
28. Mimoz O, Chopra V, Timsit JF. What's new in catheter-related infection: skin cleansing and skin antisepsis. Intensive Care Med. 2016;42(11):1784-1786. PubMed
29. Soni NJ, Franco R, Velez MI, et al. Ultrasound in the diagnosis and management of pleural effusions. J Hosp Med. 2015;10(12):811-816. PubMed
30. Feller-Kopman D. Ultrasound-guided thoracentesis. Chest. 2006;129(6):1709-1714. PubMed
31. Shojaee S, Argento AC. Ultrasound-guided pleural access. Semin Respir Crit Care Med. 2014;35(6):693-705. PubMed
32. Gordon CE, Feller-Kopman D, Balk EM, Smetana GW. Pneumothorax following thoracentesis: a systematic review and meta-analysis. Arch Intern Med. 2010;170(4):332-339. PubMed
33. Perazzo A, Gatto P, Barlascini C, Ferrari-Bravo M, Nicolini A. Can ultrasound guidance reduce the risk of pneumothorax following thoracentesis? J Bras Pneumol. 2014;40(1):6-12. PubMed
34. Cavanna L, Mordenti P, Berte R, et al. Ultrasound guidance reduces pneumothorax rate and improves safety of thoracentesis in malignant pleural effusion: report on 445 consecutive patients with advanced cancer. World J Surg Oncol. 2014;12:139. PubMed
35. Soldati G, Smargiassi A, Inchingolo R, Sher S, Valente S, Corbo GM. Ultrasound-guided pleural puncture in supine or recumbent lateral position - feasibility study. Multidiscip Respir Med. 2013;8(1):18. PubMed
36. Pihlajamaa K, Bode MK, Puumalainen T, Lehtimaki A, Marjelund S, Tikkakoski T. Pneumothorax and the value of chest radiography after ultrasound-guided thoracocentesis. Acta Radiol. 2004;45(8):828-832. PubMed
37. Barnes TW, Morgenthaler TI, Olson EJ, Hesley GK, Decker PA, Ryu JH. Sonographically guided thoracentesis and rate of pneumothorax. J Clin Ultrasound. 2005;33(9):442-446. PubMed
38. Zanforlin A, Gavelli G, Oboldi D, Galletti S. Ultrasound-guided thoracenthesis: the V-point as a site for optimal drainage positioning. Eur Rev Med Pharmacol Sci. 2013;17(1):25-28. PubMed
39. Patel PA, Ernst FR, Gunnarsson CL. Ultrasonography guidance reduces complications and costs associated with thoracentesis procedures. J Clin Ultrasound. 2012;40(3):135-141. PubMed
40. Mercaldi CJ, Lanes SF. Ultrasound guidance decreases complications and improves the cost of care among patients undergoing thoracentesis and paracentesis. Chest. 2013;143(2):532-538. PubMed
41. Shurtleff E, Olinger A. Posterior intercostal artery tortuosity and collateral branch points: a cadaveric study. Folia Morphol (Warsz). 2012;71(4):245-251. PubMed
42. Helm EJ, Rahman NM, Talakoub O, Fox DL, Gleeson FV. Course and variation of the intercostal artery by CT scan. Chest. 2013;143(3):634-639. PubMed
43. Yoneyama H, Arahata M, Temaru R, Ishizaka S, Minami S. Evaluation of the risk of intercostal artery laceration during thoracentesis in elderly patients by using 3D-CT angiography. Intern Med. 2010;49(4):289-292. PubMed
44. Salamonsen M, Ellis S, Paul E, Steinke K, Fielding D. Thoracic ultrasound demonstrates variable location of the intercostal artery. Respiration. 2012;83(4):323-329. PubMed
45. Salamonsen M, Dobeli K, McGrath D, et al. Physician-performed ultrasound can accurately screen for a vulnerable intercostal artery prior to chest drainage procedures. Respirology. 2013;18(6):942-947. PubMed
46. Grippi MA. Fishman's pulmonary diseases and disorders. Fifth edition. ed. New York: McGraw-Hill Education; 2015.
47. Huggins JT, Doelken P. Pleural manometry. Clin Chest Med. 2006;27(2):229-240. PubMed
48. Echevarria C, Twomey D, Dunning J, Chanda B. Does re-expansion pulmonary oedema exist? Interact Cardiovasc Thorac Surg. 2008;7(3):485-489. PubMed
49. Sue RD, Matthay MA, Ware LB. Hydrostatic mechanisms may contribute to the pathogenesis of human re-expansion pulmonary edema. Intensive Care Med. 2004;30(10):1921-1926. PubMed
50. Feller-Kopman D, Berkowitz D, Boiselle P, Ernst A. Large-volume thoracentesis and the risk of reexpansion pulmonary edema. Ann Thorac Surg. 2007;84(5):1656-1661. PubMed
51. Villena V, Lopez-Encuentra A, Pozo F, De-Pablo A, Martin-Escribano P. Measurement of pleural pressure during therapeutic thoracentesis. Am J Respir Crit Care Med. 2000;162(4 Pt 1):1534-1538. PubMed
52. Doelken P, Huggins JT, Pastis NJ, Sahn SA. Pleural manometry: technique and clinical implications. Chest. 2004;126(6):1764-1769. PubMed
53. Feller-Kopman D. Therapeutic thoracentesis: the role of ultrasound and pleural manometry. Curr Opin Pulm Med. 2007;13(4):312-318. PubMed
54. Boshuizen RC, Sinaasappel M, Vincent AD, Goldfinger V, Farag S, van den Heuvel MM. Pleural pressure swing and lung expansion after malignant pleural effusion drainage: the benefits of high-temporal resolution pleural manometry. J Bronchology Interv Pulmonol. 2013;20(3):200-205. PubMed
55. Pannu J, DePew ZS, Mullon JJ, Daniels CE, Hagen CE, Maldonado F. Impact of pleural manometry on the development of chest discomfort during thoracentesis: a symptom-based study. J Bronchology Interv Pulmonol. 2014;21(4):306-313. PubMed
56. Feller-Kopman D, Walkey A, Berkowitz D, Ernst A. The relationship of pleural pressure to symptom development during therapeutic thoracentesis. Chest. 2006;129(6):1556-1560. PubMed
57. Abunasser J, Brown R. Safety of large-volume thoracentesis. Conn Med. 2010;74(1):23-26. PubMed
58. Mynarek G, Brabrand K, Jakobsen JA, Kolbenstvedt A. Complications following ultrasound-guided thoracocentesis. Acta Radiol. 2004;45(5):519-522. PubMed
59. Josephson T, Nordenskjold CA, Larsson J, Rosenberg LU, Kaijser M. Amount drained at ultrasound-guided thoracentesis and risk of pneumothorax. Acta Radiol. 2009;50(1):42-47. PubMed
60. Heidecker J, Huggins JT, Sahn SA, Doelken P. Pathophysiology of pneumothorax following ultrasound-guided thoracentesis. Chest. 2006;130(4):1173-1184. PubMed
61. Sokolowski JW Jr, Burgher LW, Jones FL Jr, Patterson JR, Selecky PA. Guidelines for thoracentesis and needle biopsy of the pleura. This position paper of the American Thoracic Society was adopted by the ATS Board of Directors, June 1988. Am Rev Respir Dis. 1989;140(1):257-258. PubMed
62. Jones PW, Moyers JP, Rogers JT, Rodriguez RM, Lee YC, Light RW. Ultrasound-guided thoracentesis: is it a safer method? Chest. 2003;123(2):418-423. PubMed
63. Petersen WG, Zimmerman R. Limited utility of chest radiograph after thoracentesis. Chest. 2000;117(4):1038-1042. PubMed
64. Sachdeva A, Shepherd RW, Lee HJ. Thoracentesis and thoracic ultrasound: state of the art in 2013. Clin Chest Med. 2013;34(1):1-9. PubMed
65. Shostak E, Brylka D, Krepp J, Pua B, Sanders A. Bedside sonography for detection of postprocedure pneumothorax. J Ultrasound Med. 2013;32(6):1003-1009. PubMed
© 2017 Society of Hospital Medicine
Do Clinicians Understand Quality Metric Data?
Central line-associated bloodstream infections (CLABSIs) are common and serious occurrences across healthcare systems, with an attributable mortality of 12% to 25%.1,2 Given this burden,3–5 CLABSI is a focus for both high-profile public reporting and quality improvement interventions. An integral component of such interventions is audit and feedback via quality metrics. These measures are intended to allow decision makers to assess their own performance and appropriately allocate resources. Quality metrics present a substantial cost to health systems, with an estimated $15.4 billion dollars spent annually simply for reporting.6 Despite this toll, “audit and feedback” interventions have proven to be variably successful.7–9 The mechanisms that limit the effectiveness of these interventions remain
poorly understood.
One plausible explanation for limited efficacy of quality metrics is inadequate clinician numeracy—that is, “the ability to understand the quantitative aspects of clinical medicine, original research, quality improvement, and financial matters.”10 Indeed, clinicians are not consistently able to interpret probabilities and or clinical test characteristics. For example, Wegwarth et al. identified shortcomings in physician application of lead-time bias toward cancer screening.11 Additionally, studies have demonstrated systematic misinterpretations of probabilistic information in clinical settings, along with misconceptions regarding the impact of prevalence on post-test probabilities.12,13 Effective interpretation of rates may be a key—if unstated—requirement of many CLABSI quality improvement efforts.14–19 Our broader hypothesis is that clinicians who can more accurately interpret quality data, even if only from their own institution, are more likely to act on it appropriately and persistently than those who feel they must depend on a preprocessed interpretation of that same data by some other expert.
Therefore, we designed a survey to assess the numeracy of clinicians on CLABSI data presented in a prototypical feedback report. We studied 3 domains of comprehension: (1) basic numeracy: numerical tasks related to simple data; (2) risk-adjustment numeracy: numerical tasks related to risk-adjusted data; and (3) risk-adjustment interpretation: inferential tasks concerning risk-adjusted data. We hypothesized that clinician performance would vary substantially across domains, with the poorest performance in risk-
adjusted data.
METHODS
We conducted a cross-sectional survey of clinician numeracy regarding CLABSI feedback data. Respondents were also asked to provide demographic information and opinions regarding the reliability of quality metric data. Survey recruitment occurred on Twitter, a novel approach that leveraged social media to facilitate rapid recruitment of participants. The study instrument was administered using a web survey with randomized question order to preclude any possibility of order effects between questions. The study was deemed Institutional Review Board exempt by the University of Michigan: protocol HUM00106696.
Data Presentation Method
To determine the optimal mode of presenting data, we reviewed the literature on quality metric numeracy and presentation methods. Additionally, we evaluated quality metric presentation methods used by the Centers for Disease Control and Prevention (CDC), Centers for Medicare & Medicaid Services (CMS), and a tertiary academic medical center. After assessing the available literature and options, we adapted a CLABSI data presentation array from a study that had qualitatively validated the format using physician feedback (Appendix).20 We used hypothetical CLABSI data for our survey.
Survey Development
We developed a survey that included an 11-item test regarding CLABSI numeracy and data interpretation. Additional questions related to quality metric reliability and demographic information were included. No preexisting assessment tools existed for our areas of interest. Therefore, we developed a novel instrument using a broad, exploratory approach as others have employed.21
First, we defined 3 conceptual categories related to CLABSI data. Within this conceptual framework, an iterative process of development and revision was used to assemble a question bank from which the survey would be constructed. A series of think-aloud sessions were held to evaluate each prompt for precision, clarity, and accuracy in assessing the conceptual categories. Correct and incorrect answers were defined based on literature review in conjunction with input from methodological and content experts (TJI and VC) (see Appendix for answer explanations).
Within the conceptual categories related to CLABSI risk-adjustment, a key measure is the standardized infection ratio (SIR). This value is defined as the ratio of observed number of CLABSI over the expected number of CLABSIs.22 This is the primary measure to stratify hospital performance, and it was used in our assessment of risk-adjustment comprehension. In total, 54 question prompts were developed and subsequently narrowed to 11 study questions for the initial survey.
The instrument was then pretested in a cohort of 8 hospitalists and intensivists to ensure appropriate comprehension, retrieval, and judgment processes.23 Questions were revised based on feedback from this cognitive testing to constitute the final instrument. During the survey, the data table was reshown on each page directly above each question and so was always on the same screen for the respondents.
Survey Sample
We innovated by using Twitter as an online platform for recruiting participants; we used Survey Monkey to host the electronic instrument. Two authors (TJI, VC) systematically sent out solicitation tweets to their followers. These tweets clearly indicated that the recruitment was for the purpose of a research study, and participants would receive no financial reward/incentive (Appendix). A link to the survey was provided in each tweet, and the period of recruitment was 30 days. To ensure respondents were clinicians, they needed to first answer a screening question recognizing that central lines were placed in the subclavian site but not the aorta, iliac, or radial sites.
To prevent systematic or anchoring biases, the order of questions was electronically randomized for each respondent. The primary outcome was the percentage correct of attempted questions.
Statistical Analysis
Descriptive statistics were calculated for all demographic variables. The primary outcome was evaluated as a dichotomous variable for each question (correct vs. incorrect response), and as a continuous variable when assessing mean percent correct on the overall survey. Demographic and conceptual associations were assessed via t-tests, chi-square, or Fisher exact tests. Point biserial correlations were calculated to assess for associations between response to a single question and overall performance on the survey.
To evaluate the association between various respondent characteristics and responses, logistic regression analyses were performed. An ANOVA was performed to assess the association between self-reported reliability of quality metric data and the overall performance on attempted items. Analyses were conducted using STATA MP 14.0 (College Station, TX); P <0.05 was considered statistically significant.
RESULTS
A total of 97 respondents attempted at least 1 question on the survey, and 72 respondents attempted all 11 questions, yielding 939 unique responses for analysis. Seventy respondents (87%) identified as doctors or nurses, and 44 (55%) reported having 6 to 20 years of experience; the survey cohort also came from 6 nations (Table 1). All respondents answered the CLABSI knowledge filter question correctly.

Primary Outcome
The mean percent correct of attempted questions was 61% (standard deviation 21%, interquartile range 50%-75%) (Figure 1). Of those who answered all 11 CLABSI questions, the mean percent correct was 63% (95% CI, 59%-67%). Some questions were answered correctly more often than others—ranging from 17% to 95% (Table 2). Doctors answered 68% of questions correctly (95% CI, 63%-73%), while nurses and other respondents answered 57% of questions correctly (95% CI, 52%-62%) (P = 0.003). Other demographic variables—including self-reported involvement in a quality improvement committee and being from the United States versus elsewhere—were not associated with survey performance. The point biserial correlations for each individual question with overall performance were all more than 0.2 (range 0.24–0.62) and all statistically significant at P < 0.05.

Concept-Specific Performance
Average percent correct declined across categories as numeracy requirements increased (P < 0.05 for all pairwise comparisons). In the area of basic numeracy, respondents’ mean percent correct was 82% (95% CI, 77%-87%) of attempted. This category had 4 questions, with a performance range of 77% to 90%. For example, on the question, “Which hospital has the lowest CLABSI rate?”, 80% of respondents answered correctly. For risk-adjustment numeracy, the mean percent correct was 70% (95% CI, 64%-76%); 2 items assessed this category. For “Which is better: a higher or lower SIR?”, 95% of the cohort answered correctly. However, on “If hospital B had its number of projected infection halved, what is its SIR?”, only 46% of those who attempted the question answered correctly.
Questions featuring risk-adjustment interpretation had an average percent correct of 43% (95% CI, 37%-49%). Five questions made up this category, with a percent correct range of 17% to 75%. For example, on the question, “Which hospital’s patients are the most predisposed to developing CLABSI?”, only 32% of respondents answered this correctly. In contrast, for the question “Which hospital is most effective at preventing CLABSI?”, 51% answered correctly. Figure 2 illustrates the cohort’s performance on each conceptual category while Table 2 displays question-by-question results.


Opinions Regarding CLABSI Data Reliability
Respondents were also asked about their opinion regarding the reliability of CLABSI quality metric data. Forty-three percent of respondents stated that such data were reliable at best 50% of the time. Notably, 10% of respondents indicated that CLABSI quality metric data were rarely or never reliable. There was no association between perceived reliability of quality metric data and survey performance (P = 0.87).
DISCUSSION
This Twitter-based study found wide variation in clinician interpretation of CLABSI quality data, with low overall performance. In particular, comprehension and interpretation of risk-adjusted data were substantially worse than unadjusted data. Although doctors performed somewhat better than nurses and other respondents, those involved in quality improvement initiatives performed no better than respondents who were not. Collectively, these findings suggest clinicians may not reliably comprehend quality metric data, potentially affecting their ability to utilize audit and feedback data. These results may have important implications for policy efforts that seek to leverage quality metric data to improve patient safety.
An integral component of many contemporary quality improvement initiatives is audit and feedback through metrics.6 Unfortunately, formal audit and feedback, along with other similar methods that benchmark data, have not consistently improved outcomes.24–27 A recent meta-analysis noted that audit and feedback interventions are not becoming more efficacious over time; the study further asserted that “new trials have provided little new knowledge regarding key effect modifiers.”9 Our findings suggest that numeracy and comprehension of quality metrics may be important candidate effect modifiers not previously considered. Simply put: we hypothesize that without intrinsic comprehension of data, impetus or insight to change practice might be diminished. In other words, clinicians may be more apt to act on insights they themselves derive from the data than when they are simply told what the data “mean.”
The present study further demonstrates that clinicians do not understand risk-adjusted data as well as raw data. Risk-adjustment has long been recognized as necessary to compare outcomes among hospitals.28,29 However, risk-adjustment is complex and, by its nature, difficult to understand. Although efforts have focused on improving the statistical reliability of quality metrics, this may represent but one half of the equation. Numeracy and interpretation of the data by decision makers are potentially equally important to effecting change. Because clinicians seem to have difficulty understanding risk-adjusted data, this deficit may be of growing importance as our risk-adjustment techniques become more sophisticated.
We note that clinicians expressed concerns regarding the reliability of quality metric feedback. These findings corroborate recent research that has reported reservations from hospital leaders concerning quality data.30,31 However, as shown in the context of patients and healthcare decisions, the aversion associated with quality metrics may be related to incomplete understanding of the data.32 Whether perceptions of unreliability drive lack of understanding or, conversely, whether lack of understanding fuels perceived unreliability is an important question that requires further study.
This study has several strengths. First, we used rigorous survey development techniques to evaluate the understudied issue of quality metric numeracy. Second, our sample size was sufficient to show statistically significant differences in numeracy and comprehension of CLABSI quality metric data. Third, we leveraged social media to rapidly acquire this sample. Finally, our results provided new insights that may have important implications in the area of quality metrics.
There were also limitations to our study. First, the Twitter-derived sample precludes the calculation of a response rate and may not be representative of individuals engaged in CLABSI prevention. However, respondents were solicited from the Twitter-followers of 2 health services researchers (TJI, VC) who are actively engaged in scholarly activities pertaining to critically ill patients and hospital-acquired complications. Thus, our sample likely represents a highly motivated subset that engages in these topics on a regular basis—potentially making them more numerate than average clinicians. Second, we did not ask whether the respondents had previously seen CLABSI data specifically, so we cannot stratify by exposure to such data. Third, this study assessed only CLABSI quality metric data; generalizations regarding numeracy with other metrics should be made with caution. However, as many such data are presented in similar formats, we suspect our findings are applicable to similar audit-and-feedback initiatives.
The findings of this study serve as a stimulus for further inquiry. Research of this nature needs to be carried out in samples drawn from specific, policy-relevant populations (eg, infection control practitioners, bedside nurses, intensive care unit directors). Such studies should include longitudinal assessments of numeracy that attempt to mechanistically examine its impact on CLABSI prevention efforts and outcomes. The latter is an important issue as the link between numeracy and behavioral response, while plausible, cannot be assumed, particularly given the complexity of issues related to behavioral modification.33 Additionally, whether alternate presentations of quality data affect numeracy, interpretation, and performance is worthy of further testing; indeed, this has been shown to be the case in other forms of communication.34–37 Until data from larger samples are available, it may be prudent for quality improvement leaders to assess the comprehension of local clinicians regarding feedback and whether lack of adequate comprehension is a barrier to deploying quality improvement interventions.
Quality measurement is a cornerstone of patient safety as it seeks to assess and improve the care delivered at the bedside. Rigorous metric development is important; however, ensuring that decision makers understand complex quality metrics may be equally fundamental. Given the cost of examining quality, elucidating the mechanisms of numeracy and interpretation as decision makers engage with quality metric data is necessary, along with whether improved comprehension leads to behavior change. Such inquiry may provide an evidence-base to shape alterations in quality metric deployment that will ensure maximal efficacy in driving practice change.
Disclosures
This work was supported by VA HSR&D IIR-13-079 (TJI). Dr. Chopra is supported by a career development award from the Agency of Healthcare Research and Quality (1-K08-HS022835-01). The views expressed here are the authors’ own and do not necessarily represent the view of the US Government or the Department of Veterans’ Affairs. The authors report no conflicts of interest.
1. Scott RD II. The direct medical costs of healthcare-associated infections in us hospitals and the benefits of prevention. Centers for Disease Control and Prevention. Available at: http://www.cdc.gov/HAI/pdfs/hai/Scott_CostPaper.pdf. Published March 2009. Accessed November 8, 2016.
2. O’Grady NP, Alexander M, Burns LA, et al. Guidelines for the prevention of intravascular catheter-related infections. Am J Infect Control. 2011;39(4 suppl 1)::S1-S34. PubMed
3. Blot K, Bergs J, Vogelaers D, Blot S, Vandijck D. Prevention of central line-associated bloodstream infections through quality improvement interventions: a systematic review and meta-analysis. Clin Infect Dis. 2014;59(1):96-105. PubMed
4. Mermel LA. Prevention of intravascular catheter-related infections. Ann Intern Med. 2000;132(5):391-402. PubMed
5. Siempos II, Kopterides P, Tsangaris I, Dimopoulou I, Armaganidis AE. Impact of catheter-related bloodstream infections on the mortality of critically ill patients: a meta-analysis. Crit Care Med. 2009;37(7):2283-2289. PubMed
6. Casalino LP, Gans D, Weber R, et al. US physician practices spend more than $15.4 billion annually to report quality measures. Health Aff (Millwood). 2016;35(3):401-406. PubMed
7. Hysong SJ. Meta-analysis: audit and feedback features impact effectiveness on care quality. Med Care. 2009;47(3):356-363. PubMed
8. Ilgen DR, Fisher CD, Taylor MS. Consequences of individual feedback on behavior in organizations. J Appl Psychol. 1979;64:349-371.
9. Ivers NM, Grimshaw JM, Jamtvedt G, et al. Growing literature, stagnant science? Systematic review, meta-regression and cumulative analysis of audit and feedback interventions in health care. J Gen Intern Med. 2014;29(11):1534-1541. PubMed
10. Rao G. Physician numeracy: essential skills for practicing evidence-based medicine. Fam Med. 2008;40(5):354-358. PubMed
11. Wegwarth O, Schwartz LM, Woloshin S, Gaissmaier W, Gigerenzer G. Do physicians understand cancer screening statistics? A national survey of primary care physicians in the United States. Ann Intern Med. 2012;156(5):340-349. PubMed
12. Bramwell R, West H, Salmon P. Health professionals’ and service users’ interpretation of screening test results: experimental study. BMJ. 2006;333(7562):284. PubMed
13. Agoritsas T, Courvoisier DS, Combescure C, Deom M, Perneger TV. Does prevalence matter to physicians in estimating post-test probability of disease? A randomized trial. J Gen Intern Med. 2011;26(4):373-378. PubMed
14. Warren DK, Zack JE, Mayfield JL, et al. The effect of an education program on the incidence of central venous catheter-associated bloodstream infection in a medical ICU. Chest. 2004;126(5):1612-1618. PubMed
15. Rinke ML, Bundy DG, Chen AR, et al. Central line maintenance bundles and CLABSIs in ambulatory oncology patients. Pediatrics. 2013;132(5):e1403-e1412. PubMed
16. Pronovost P, Needham D, Berenholtz S, et al. An intervention to decrease catheter-related bloodstream infections in the ICU. N Engl J Med. 2006;355(26):
2725-2732. PubMed
17. Rinke ML, Chen AR, Bundy DG, et al. Implementation of a central line maintenance care bundle in hospitalized pediatric oncology patients. Pediatrics. 2012;130(4):e996-e1004. PubMed
18. Sacks GD, Diggs BS, Hadjizacharia P, Green D, Salim A, Malinoski DJ. Reducing the rate of catheter-associated bloodstream infections in a surgical intensive care unit using the Institute for Healthcare Improvement Central Line Bundle. Am J Surg. 2014;207(6):817-823. PubMed
19. Berenholtz SM, Pronovost PJ, Lipsett PA, et al. Eliminating catheter-related bloodstream infections in the intensive care unit. Crit Care Med. 2004;32(10):2014-2020. PubMed
20. Rajwan YG, Barclay PW, Lee T, Sun IF, Passaretti C, Lehmann H. Visualizing central line-associated blood stream infection (CLABSI) outcome data for decision making by health care consumers and practitioners—an evaluation study. Online J Public Health Inform. 2013;5(2):218. PubMed
21. Fagerlin A, Zikmund-Fisher BJ, Ubel PA, Jankovic A, Derry HA, Smith DM. Measuring numeracy without a math test: development of the Subjective Numeracy Scale. Med Decis Making 2007;27(5):672-680. PubMed
22. HAI progress report FAQ. 2016. Available at: http://www.cdc.gov/hai/surveillance/progress-report/faq.html. Last updated March 2, 2016. Accessed November 8, 2016.
23. Collins D. Pretesting survey instruments: an overview of cognitive methods. Qual Life Res. 2003;12(3):229-238. PubMed
24. Ivers N, Jamtvedt G, Flottorp S, et al. Audit and feedback: effects on professional practice and healthcare outcomes. Cochrane Database Syst Rev. 2012;(6):CD000259. PubMed
25. Chatterjee P, Joynt KE. Do cardiology quality measures actually improve patient outcomes? J Am Heart Assoc. 2014;3(1):e000404. PubMed
26. Joynt KE, Blumenthal DM, Orav EJ, Resnic FS, Jha AK. Association of public reporting for percutaneous coronary intervention with utilization and outcomes among Medicare beneficiaries with acute myocardial infarction. JAMA. 2012;308(14):1460-1468. PubMed
27. Ryan AM, Nallamothu BK, Dimick JB. Medicare’s public reporting initiative on hospital quality had modest or no impact on mortality from three key conditions. Health Aff (Millwood). 2012;31(3):585-592. PubMed
28. Thomas JW. Risk adjustment for measuring health care outcomes, 3rd edition. Int J Qual Health Care. 2004;16(2):181-182.
29. Iezzoni LI. Risk Adjustment for Measuring Health Care Outcomes. Ann Arbor, Michigan: Health Administration Press; 1994.
30. Goff SL, Lagu T, Pekow PS, et al. A qualitative analysis of hospital leaders’ opinions about publicly reported measures of health care quality. Jt Comm J Qual Patient Saf. 2015;41(4):169-176. PubMed
31. Lindenauer PK, Lagu T, Ross JS, et al. Attitudes of hospital leaders toward publicly reported measures of health care quality. JAMA Intern Med. 2014;174(12):
1904-1911. PubMed
32. Peters E, Hibbard J, Slovic P, Dieckmann N. Numeracy skill and the communication, comprehension, and use of risk-benefit information. Health Aff (Millwood). 2007;26(3):741-748. PubMed
33. Montano DE, Kasprzyk D. Theory of reasoned action, theory of planned behavior, and the integrated behavioral model. In: Glanz K, Rimer BK, Viswanath K, eds. Health Behavior and Health Education: Theory, Research and Practice. 5th ed. San Francisco, CA: Jossey-Bass; 2015:95–124.
34. Hamstra DA, Johnson SB, Daignault S, et al. The impact of numeracy on verbatim knowledge of the longitudinal risk for prostate cancer recurrence following radiation therapy. Med Decis Making. 2015;35(1):27-36. PubMed
35. Hawley ST, Zikmund-Fisher B, Ubel P, Jancovic A, Lucas T, Fagerlin A. The impact of the format of graphical presentation on health-related knowledge and treatment choices. Patient Educ Couns. 2008;73(3):448-455. PubMed
36. Zikmund-Fisher BJ, Witteman HO, Dickson M, et al. Blocks, ovals, or people? Icon type affects risk perceptions and recall of pictographs. Med Decis Making. 2014;34(4):443-453. PubMed
37. Korfage IJ, Fuhrel-Forbis A, Ubel PA, et al. Informed choice about breast cancer prevention: randomized controlled trial of an online decision aid intervention. Breast Cancer Res. 2013;15(5):R74. PubMed
Central line-associated bloodstream infections (CLABSIs) are common and serious occurrences across healthcare systems, with an attributable mortality of 12% to 25%.1,2 Given this burden,3–5 CLABSI is a focus for both high-profile public reporting and quality improvement interventions. An integral component of such interventions is audit and feedback via quality metrics. These measures are intended to allow decision makers to assess their own performance and appropriately allocate resources. Quality metrics present a substantial cost to health systems, with an estimated $15.4 billion dollars spent annually simply for reporting.6 Despite this toll, “audit and feedback” interventions have proven to be variably successful.7–9 The mechanisms that limit the effectiveness of these interventions remain
poorly understood.
One plausible explanation for limited efficacy of quality metrics is inadequate clinician numeracy—that is, “the ability to understand the quantitative aspects of clinical medicine, original research, quality improvement, and financial matters.”10 Indeed, clinicians are not consistently able to interpret probabilities and or clinical test characteristics. For example, Wegwarth et al. identified shortcomings in physician application of lead-time bias toward cancer screening.11 Additionally, studies have demonstrated systematic misinterpretations of probabilistic information in clinical settings, along with misconceptions regarding the impact of prevalence on post-test probabilities.12,13 Effective interpretation of rates may be a key—if unstated—requirement of many CLABSI quality improvement efforts.14–19 Our broader hypothesis is that clinicians who can more accurately interpret quality data, even if only from their own institution, are more likely to act on it appropriately and persistently than those who feel they must depend on a preprocessed interpretation of that same data by some other expert.
Therefore, we designed a survey to assess the numeracy of clinicians on CLABSI data presented in a prototypical feedback report. We studied 3 domains of comprehension: (1) basic numeracy: numerical tasks related to simple data; (2) risk-adjustment numeracy: numerical tasks related to risk-adjusted data; and (3) risk-adjustment interpretation: inferential tasks concerning risk-adjusted data. We hypothesized that clinician performance would vary substantially across domains, with the poorest performance in risk-
adjusted data.
METHODS
We conducted a cross-sectional survey of clinician numeracy regarding CLABSI feedback data. Respondents were also asked to provide demographic information and opinions regarding the reliability of quality metric data. Survey recruitment occurred on Twitter, a novel approach that leveraged social media to facilitate rapid recruitment of participants. The study instrument was administered using a web survey with randomized question order to preclude any possibility of order effects between questions. The study was deemed Institutional Review Board exempt by the University of Michigan: protocol HUM00106696.
Data Presentation Method
To determine the optimal mode of presenting data, we reviewed the literature on quality metric numeracy and presentation methods. Additionally, we evaluated quality metric presentation methods used by the Centers for Disease Control and Prevention (CDC), Centers for Medicare & Medicaid Services (CMS), and a tertiary academic medical center. After assessing the available literature and options, we adapted a CLABSI data presentation array from a study that had qualitatively validated the format using physician feedback (Appendix).20 We used hypothetical CLABSI data for our survey.
Survey Development
We developed a survey that included an 11-item test regarding CLABSI numeracy and data interpretation. Additional questions related to quality metric reliability and demographic information were included. No preexisting assessment tools existed for our areas of interest. Therefore, we developed a novel instrument using a broad, exploratory approach as others have employed.21
First, we defined 3 conceptual categories related to CLABSI data. Within this conceptual framework, an iterative process of development and revision was used to assemble a question bank from which the survey would be constructed. A series of think-aloud sessions were held to evaluate each prompt for precision, clarity, and accuracy in assessing the conceptual categories. Correct and incorrect answers were defined based on literature review in conjunction with input from methodological and content experts (TJI and VC) (see Appendix for answer explanations).
Within the conceptual categories related to CLABSI risk-adjustment, a key measure is the standardized infection ratio (SIR). This value is defined as the ratio of observed number of CLABSI over the expected number of CLABSIs.22 This is the primary measure to stratify hospital performance, and it was used in our assessment of risk-adjustment comprehension. In total, 54 question prompts were developed and subsequently narrowed to 11 study questions for the initial survey.
The instrument was then pretested in a cohort of 8 hospitalists and intensivists to ensure appropriate comprehension, retrieval, and judgment processes.23 Questions were revised based on feedback from this cognitive testing to constitute the final instrument. During the survey, the data table was reshown on each page directly above each question and so was always on the same screen for the respondents.
Survey Sample
We innovated by using Twitter as an online platform for recruiting participants; we used Survey Monkey to host the electronic instrument. Two authors (TJI, VC) systematically sent out solicitation tweets to their followers. These tweets clearly indicated that the recruitment was for the purpose of a research study, and participants would receive no financial reward/incentive (Appendix). A link to the survey was provided in each tweet, and the period of recruitment was 30 days. To ensure respondents were clinicians, they needed to first answer a screening question recognizing that central lines were placed in the subclavian site but not the aorta, iliac, or radial sites.
To prevent systematic or anchoring biases, the order of questions was electronically randomized for each respondent. The primary outcome was the percentage correct of attempted questions.
Statistical Analysis
Descriptive statistics were calculated for all demographic variables. The primary outcome was evaluated as a dichotomous variable for each question (correct vs. incorrect response), and as a continuous variable when assessing mean percent correct on the overall survey. Demographic and conceptual associations were assessed via t-tests, chi-square, or Fisher exact tests. Point biserial correlations were calculated to assess for associations between response to a single question and overall performance on the survey.
To evaluate the association between various respondent characteristics and responses, logistic regression analyses were performed. An ANOVA was performed to assess the association between self-reported reliability of quality metric data and the overall performance on attempted items. Analyses were conducted using STATA MP 14.0 (College Station, TX); P <0.05 was considered statistically significant.
RESULTS
A total of 97 respondents attempted at least 1 question on the survey, and 72 respondents attempted all 11 questions, yielding 939 unique responses for analysis. Seventy respondents (87%) identified as doctors or nurses, and 44 (55%) reported having 6 to 20 years of experience; the survey cohort also came from 6 nations (Table 1). All respondents answered the CLABSI knowledge filter question correctly.
Primary Outcome
The mean percent correct of attempted questions was 61% (standard deviation 21%, interquartile range 50%-75%) (Figure 1). Of those who answered all 11 CLABSI questions, the mean percent correct was 63% (95% CI, 59%-67%). Some questions were answered correctly more often than others—ranging from 17% to 95% (Table 2). Doctors answered 68% of questions correctly (95% CI, 63%-73%), while nurses and other respondents answered 57% of questions correctly (95% CI, 52%-62%) (P = 0.003). Other demographic variables—including self-reported involvement in a quality improvement committee and being from the United States versus elsewhere—were not associated with survey performance. The point biserial correlations for each individual question with overall performance were all more than 0.2 (range 0.24–0.62) and all statistically significant at P < 0.05.
Concept-Specific Performance
Average percent correct declined across categories as numeracy requirements increased (P < 0.05 for all pairwise comparisons). In the area of basic numeracy, respondents’ mean percent correct was 82% (95% CI, 77%-87%) of attempted. This category had 4 questions, with a performance range of 77% to 90%. For example, on the question, “Which hospital has the lowest CLABSI rate?”, 80% of respondents answered correctly. For risk-adjustment numeracy, the mean percent correct was 70% (95% CI, 64%-76%); 2 items assessed this category. For “Which is better: a higher or lower SIR?”, 95% of the cohort answered correctly. However, on “If hospital B had its number of projected infection halved, what is its SIR?”, only 46% of those who attempted the question answered correctly.
Questions featuring risk-adjustment interpretation had an average percent correct of 43% (95% CI, 37%-49%). Five questions made up this category, with a percent correct range of 17% to 75%. For example, on the question, “Which hospital’s patients are the most predisposed to developing CLABSI?”, only 32% of respondents answered this correctly. In contrast, for the question “Which hospital is most effective at preventing CLABSI?”, 51% answered correctly. Figure 2 illustrates the cohort’s performance on each conceptual category while Table 2 displays question-by-question results.
Opinions Regarding CLABSI Data Reliability
Respondents were also asked about their opinion regarding the reliability of CLABSI quality metric data. Forty-three percent of respondents stated that such data were reliable at best 50% of the time. Notably, 10% of respondents indicated that CLABSI quality metric data were rarely or never reliable. There was no association between perceived reliability of quality metric data and survey performance (P = 0.87).
DISCUSSION
This Twitter-based study found wide variation in clinician interpretation of CLABSI quality data, with low overall performance. In particular, comprehension and interpretation of risk-adjusted data were substantially worse than unadjusted data. Although doctors performed somewhat better than nurses and other respondents, those involved in quality improvement initiatives performed no better than respondents who were not. Collectively, these findings suggest clinicians may not reliably comprehend quality metric data, potentially affecting their ability to utilize audit and feedback data. These results may have important implications for policy efforts that seek to leverage quality metric data to improve patient safety.
An integral component of many contemporary quality improvement initiatives is audit and feedback through metrics.6 Unfortunately, formal audit and feedback, along with other similar methods that benchmark data, have not consistently improved outcomes.24–27 A recent meta-analysis noted that audit and feedback interventions are not becoming more efficacious over time; the study further asserted that “new trials have provided little new knowledge regarding key effect modifiers.”9 Our findings suggest that numeracy and comprehension of quality metrics may be important candidate effect modifiers not previously considered. Simply put: we hypothesize that without intrinsic comprehension of data, impetus or insight to change practice might be diminished. In other words, clinicians may be more apt to act on insights they themselves derive from the data than when they are simply told what the data “mean.”
The present study further demonstrates that clinicians do not understand risk-adjusted data as well as raw data. Risk-adjustment has long been recognized as necessary to compare outcomes among hospitals.28,29 However, risk-adjustment is complex and, by its nature, difficult to understand. Although efforts have focused on improving the statistical reliability of quality metrics, this may represent but one half of the equation. Numeracy and interpretation of the data by decision makers are potentially equally important to effecting change. Because clinicians seem to have difficulty understanding risk-adjusted data, this deficit may be of growing importance as our risk-adjustment techniques become more sophisticated.
We note that clinicians expressed concerns regarding the reliability of quality metric feedback. These findings corroborate recent research that has reported reservations from hospital leaders concerning quality data.30,31 However, as shown in the context of patients and healthcare decisions, the aversion associated with quality metrics may be related to incomplete understanding of the data.32 Whether perceptions of unreliability drive lack of understanding or, conversely, whether lack of understanding fuels perceived unreliability is an important question that requires further study.
This study has several strengths. First, we used rigorous survey development techniques to evaluate the understudied issue of quality metric numeracy. Second, our sample size was sufficient to show statistically significant differences in numeracy and comprehension of CLABSI quality metric data. Third, we leveraged social media to rapidly acquire this sample. Finally, our results provided new insights that may have important implications in the area of quality metrics.
There were also limitations to our study. First, the Twitter-derived sample precludes the calculation of a response rate and may not be representative of individuals engaged in CLABSI prevention. However, respondents were solicited from the Twitter-followers of 2 health services researchers (TJI, VC) who are actively engaged in scholarly activities pertaining to critically ill patients and hospital-acquired complications. Thus, our sample likely represents a highly motivated subset that engages in these topics on a regular basis—potentially making them more numerate than average clinicians. Second, we did not ask whether the respondents had previously seen CLABSI data specifically, so we cannot stratify by exposure to such data. Third, this study assessed only CLABSI quality metric data; generalizations regarding numeracy with other metrics should be made with caution. However, as many such data are presented in similar formats, we suspect our findings are applicable to similar audit-and-feedback initiatives.
The findings of this study serve as a stimulus for further inquiry. Research of this nature needs to be carried out in samples drawn from specific, policy-relevant populations (eg, infection control practitioners, bedside nurses, intensive care unit directors). Such studies should include longitudinal assessments of numeracy that attempt to mechanistically examine its impact on CLABSI prevention efforts and outcomes. The latter is an important issue as the link between numeracy and behavioral response, while plausible, cannot be assumed, particularly given the complexity of issues related to behavioral modification.33 Additionally, whether alternate presentations of quality data affect numeracy, interpretation, and performance is worthy of further testing; indeed, this has been shown to be the case in other forms of communication.34–37 Until data from larger samples are available, it may be prudent for quality improvement leaders to assess the comprehension of local clinicians regarding feedback and whether lack of adequate comprehension is a barrier to deploying quality improvement interventions.
Quality measurement is a cornerstone of patient safety as it seeks to assess and improve the care delivered at the bedside. Rigorous metric development is important; however, ensuring that decision makers understand complex quality metrics may be equally fundamental. Given the cost of examining quality, elucidating the mechanisms of numeracy and interpretation as decision makers engage with quality metric data is necessary, along with whether improved comprehension leads to behavior change. Such inquiry may provide an evidence-base to shape alterations in quality metric deployment that will ensure maximal efficacy in driving practice change.
Disclosures
This work was supported by VA HSR&D IIR-13-079 (TJI). Dr. Chopra is supported by a career development award from the Agency of Healthcare Research and Quality (1-K08-HS022835-01). The views expressed here are the authors’ own and do not necessarily represent the view of the US Government or the Department of Veterans’ Affairs. The authors report no conflicts of interest.
1. Scott RD II. The direct medical costs of healthcare-associated infections in us hospitals and the benefits of prevention. Centers for Disease Control and Prevention. Available at: http://www.cdc.gov/HAI/pdfs/hai/Scott_CostPaper.pdf. Published March 2009. Accessed November 8, 2016.
2. O’Grady NP, Alexander M, Burns LA, et al. Guidelines for the prevention of intravascular catheter-related infections. Am J Infect Control. 2011;39(4 suppl 1)::S1-S34. PubMed
3. Blot K, Bergs J, Vogelaers D, Blot S, Vandijck D. Prevention of central line-associated bloodstream infections through quality improvement interventions: a systematic review and meta-analysis. Clin Infect Dis. 2014;59(1):96-105. PubMed
4. Mermel LA. Prevention of intravascular catheter-related infections. Ann Intern Med. 2000;132(5):391-402. PubMed
5. Siempos II, Kopterides P, Tsangaris I, Dimopoulou I, Armaganidis AE. Impact of catheter-related bloodstream infections on the mortality of critically ill patients: a meta-analysis. Crit Care Med. 2009;37(7):2283-2289. PubMed
6. Casalino LP, Gans D, Weber R, et al. US physician practices spend more than $15.4 billion annually to report quality measures. Health Aff (Millwood). 2016;35(3):401-406. PubMed
7. Hysong SJ. Meta-analysis: audit and feedback features impact effectiveness on care quality. Med Care. 2009;47(3):356-363. PubMed
8. Ilgen DR, Fisher CD, Taylor MS. Consequences of individual feedback on behavior in organizations. J Appl Psychol. 1979;64:349-371.
9. Ivers NM, Grimshaw JM, Jamtvedt G, et al. Growing literature, stagnant science? Systematic review, meta-regression and cumulative analysis of audit and feedback interventions in health care. J Gen Intern Med. 2014;29(11):1534-1541. PubMed
10. Rao G. Physician numeracy: essential skills for practicing evidence-based medicine. Fam Med. 2008;40(5):354-358. PubMed
11. Wegwarth O, Schwartz LM, Woloshin S, Gaissmaier W, Gigerenzer G. Do physicians understand cancer screening statistics? A national survey of primary care physicians in the United States. Ann Intern Med. 2012;156(5):340-349. PubMed
12. Bramwell R, West H, Salmon P. Health professionals’ and service users’ interpretation of screening test results: experimental study. BMJ. 2006;333(7562):284. PubMed
13. Agoritsas T, Courvoisier DS, Combescure C, Deom M, Perneger TV. Does prevalence matter to physicians in estimating post-test probability of disease? A randomized trial. J Gen Intern Med. 2011;26(4):373-378. PubMed
14. Warren DK, Zack JE, Mayfield JL, et al. The effect of an education program on the incidence of central venous catheter-associated bloodstream infection in a medical ICU. Chest. 2004;126(5):1612-1618. PubMed
15. Rinke ML, Bundy DG, Chen AR, et al. Central line maintenance bundles and CLABSIs in ambulatory oncology patients. Pediatrics. 2013;132(5):e1403-e1412. PubMed
16. Pronovost P, Needham D, Berenholtz S, et al. An intervention to decrease catheter-related bloodstream infections in the ICU. N Engl J Med. 2006;355(26):
2725-2732. PubMed
17. Rinke ML, Chen AR, Bundy DG, et al. Implementation of a central line maintenance care bundle in hospitalized pediatric oncology patients. Pediatrics. 2012;130(4):e996-e1004. PubMed
18. Sacks GD, Diggs BS, Hadjizacharia P, Green D, Salim A, Malinoski DJ. Reducing the rate of catheter-associated bloodstream infections in a surgical intensive care unit using the Institute for Healthcare Improvement Central Line Bundle. Am J Surg. 2014;207(6):817-823. PubMed
19. Berenholtz SM, Pronovost PJ, Lipsett PA, et al. Eliminating catheter-related bloodstream infections in the intensive care unit. Crit Care Med. 2004;32(10):2014-2020. PubMed
20. Rajwan YG, Barclay PW, Lee T, Sun IF, Passaretti C, Lehmann H. Visualizing central line-associated blood stream infection (CLABSI) outcome data for decision making by health care consumers and practitioners—an evaluation study. Online J Public Health Inform. 2013;5(2):218. PubMed
21. Fagerlin A, Zikmund-Fisher BJ, Ubel PA, Jankovic A, Derry HA, Smith DM. Measuring numeracy without a math test: development of the Subjective Numeracy Scale. Med Decis Making 2007;27(5):672-680. PubMed
22. HAI progress report FAQ. 2016. Available at: http://www.cdc.gov/hai/surveillance/progress-report/faq.html. Last updated March 2, 2016. Accessed November 8, 2016.
23. Collins D. Pretesting survey instruments: an overview of cognitive methods. Qual Life Res. 2003;12(3):229-238. PubMed
24. Ivers N, Jamtvedt G, Flottorp S, et al. Audit and feedback: effects on professional practice and healthcare outcomes. Cochrane Database Syst Rev. 2012;(6):CD000259. PubMed
25. Chatterjee P, Joynt KE. Do cardiology quality measures actually improve patient outcomes? J Am Heart Assoc. 2014;3(1):e000404. PubMed
26. Joynt KE, Blumenthal DM, Orav EJ, Resnic FS, Jha AK. Association of public reporting for percutaneous coronary intervention with utilization and outcomes among Medicare beneficiaries with acute myocardial infarction. JAMA. 2012;308(14):1460-1468. PubMed
27. Ryan AM, Nallamothu BK, Dimick JB. Medicare’s public reporting initiative on hospital quality had modest or no impact on mortality from three key conditions. Health Aff (Millwood). 2012;31(3):585-592. PubMed
28. Thomas JW. Risk adjustment for measuring health care outcomes, 3rd edition. Int J Qual Health Care. 2004;16(2):181-182.
29. Iezzoni LI. Risk Adjustment for Measuring Health Care Outcomes. Ann Arbor, Michigan: Health Administration Press; 1994.
30. Goff SL, Lagu T, Pekow PS, et al. A qualitative analysis of hospital leaders’ opinions about publicly reported measures of health care quality. Jt Comm J Qual Patient Saf. 2015;41(4):169-176. PubMed
31. Lindenauer PK, Lagu T, Ross JS, et al. Attitudes of hospital leaders toward publicly reported measures of health care quality. JAMA Intern Med. 2014;174(12):
1904-1911. PubMed
32. Peters E, Hibbard J, Slovic P, Dieckmann N. Numeracy skill and the communication, comprehension, and use of risk-benefit information. Health Aff (Millwood). 2007;26(3):741-748. PubMed
33. Montano DE, Kasprzyk D. Theory of reasoned action, theory of planned behavior, and the integrated behavioral model. In: Glanz K, Rimer BK, Viswanath K, eds. Health Behavior and Health Education: Theory, Research and Practice. 5th ed. San Francisco, CA: Jossey-Bass; 2015:95–124.
34. Hamstra DA, Johnson SB, Daignault S, et al. The impact of numeracy on verbatim knowledge of the longitudinal risk for prostate cancer recurrence following radiation therapy. Med Decis Making. 2015;35(1):27-36. PubMed
35. Hawley ST, Zikmund-Fisher B, Ubel P, Jancovic A, Lucas T, Fagerlin A. The impact of the format of graphical presentation on health-related knowledge and treatment choices. Patient Educ Couns. 2008;73(3):448-455. PubMed
36. Zikmund-Fisher BJ, Witteman HO, Dickson M, et al. Blocks, ovals, or people? Icon type affects risk perceptions and recall of pictographs. Med Decis Making. 2014;34(4):443-453. PubMed
37. Korfage IJ, Fuhrel-Forbis A, Ubel PA, et al. Informed choice about breast cancer prevention: randomized controlled trial of an online decision aid intervention. Breast Cancer Res. 2013;15(5):R74. PubMed
© 2017 Society of Hospital Medicine
Inherited Thrombophilia Testing
The Things We Do for No Reason (TWDFNR) series reviews practices which have become common parts of hospital care but which may provide little value to our patients. Practices reviewed in the TWDFNR series do not represent black and white conclusions or clinical practice standards, but are meant as a starting place for research and active discussions among hospitalists and patients. We invite you to be part of that discussion. https://www.choosingwisely.org/

Inherited thrombophilia refers to a genetic condition that predisposes to an increased risk of venous thromboembolism (VTE). This disorder is prevalent in approximately 7% of the population and includes mutations such as factor V Leiden, prothrombin 20210, protein C deficiency, protein S deficiency, antithrombin deficiency, and methylene tetrahydrofolate reductase. The relative risk of VTE is 3‐ to 20‐fold greater in patients with inherited thrombophilia compared with the general population. Is testing for inherited thrombophilia recommended? The available evidence suggests that testing for inherited thrombophilia is not recommended in most clinical settings. In patients without a personal history of VTE, thrombophilia results do not change management, as there is no evidence to support thromboprophylaxis in this setting. In patients with a personal history of provoked or unprovoked VTE, inpatient testing is not indicated, as results do not influence management, testing is not cost‐effective, and a positive test result may lead to unnecessary patient anxiety or may result in unnecessary involvement of consultants. Testing in hospitalized patients has even more limitations because many thrombophilia tests are inaccurate in the setting of acute VTE and/or anticoagulation.
CASE PRESENTATION
A 23‐year‐old man presents to the emergency room with pleuritic chest pain and new oxygen requirement of 2 L nasal cannula. He has a history of unprovoked lower extremity deep venous thrombosis (DVT) diagnosed at age 20 and completed 3 months of systemic anticoagulation without complications. He reports no family history of clotting disorders or venous thromboembolism (VTE) and no reversible risk factors for VTE such as prolonged immobility, recent surgery, or high‐risk medications. A computed tomogram pulmonary embolism protocol shows multiple right lower lobe, segmental pulmonary emboli. Anticoagulation is initiated, and the patient is admitted to the hospital. Will inpatient inherited thrombophilia testing impact management for this case?
WHY MAY INHERITED THROMBOPHILIA TESTING PROVE HELPFUL?
The annual incidence rate of a first VTE event is estimated as 117 per 100,000 individuals per year.[1] The most common presentations are symptomatic DVT of the leg (annual incidence approximately 48 per 100,000 people), or a pulmonary embolism (annual incidence approximately 69 per 100,000 people).[1] Pulmonary embolism results in death in up to 30% of untreated patients and 2.5% of patients who receive systemic anticoagulation.[2] Principal in the pathogenesis of VTE are factors described by Virchow's triad: venous stasis, endothelial injury, and systemic hypercoagulability. By identifying a mutation in 1 or more of the factors in the clotting pathway, an evaluation for inherited thrombophilia theoretically may unearth factors that drive systemic hypercoagulability and inform decision making so as to prevent future events.
Inherited thrombophilia refers to a genetic condition that predisposes to an increased risk of VTE.[3] Approximately 7% of the general population has inherited thrombophilia, which includes factor V Leiden (FVL) mutation, prothrombin 20210 mutation (PT20210), protein C deficiency, protein S deficiency, antithrombin III (ATIII) deficiency, and methylene tetrahydrofolate reductase mutation (MTHFR).[4] Of note, the definition does not include acquired etiologies, such as antiphospholipid antibody syndrome. Depending on the underlying condition and expression of the genetic abnormality, the relative risk of VTE in patients with inherited thrombophilia is 3‐ to 20‐fold greater than that of the general population.[5] Therefore, it is logical to consider that testing for inherited thrombophilia might be clinically useful. However, the evidence for doing so is very limited.
DOES INHERITED THROMBOPHILIA TESTING CHANGE MANAGEMENT?
An inherited thrombophilia evaluation is unlikely to affect management in most clinical settings. There is no current evidence to support primary prophylaxis[6] nor is there evidence that management of patients with recurrent VTE should be altered in the setting of inherited thrombophilia.
To date, no prospective trials have evaluated the efficacy of anticoagulant use for primary prevention of VTE in patients with inherited thrombophilia.[6] Given the limited evidence for thromboprophylaxis and risks of anticoagulation, primary prevention for patients with inherited thrombophilia that remain asymptomatic is not recommended by the current American College of Chest Physicians guidelines.[7, 8]
Similarly, in patients with a first VTE or recurrent VTE, diagnosis of inherited thrombophilia is often not associated with recurrent events, which suggests that other nongenetic factors may be just as important, if not more important, in determining the risk of recurrence.[9] Although no randomized controlled or controlled clinical trials have evaluated the effects of testing for inherited thrombophilia on recurrent VTE,[10, 11] several prospective studies have assessed risk factors for recurrence. Data from these studies suggest that recurrence rates after unprovoked VTE are only weakly correlated with inherited thrombophilia status.[12, 13] Rather, it is postulated that patients with recurrent VTE may exhibit a prothrombotic tendency regardless of underlying genetic predisposition. In this case, decisions regarding anticoagulation do not vary by thrombophilia status. Instead, thrombophilia testing may divert attention away from the management of more prevalent, potentially modifiable risk factors such as immobility, oral contraceptive use, or malignancy, all of which are associated with recurrent VTE.[14] These provoking factors are the most important determinants of the chance of VTE recurrence as well as the most significant factors to take into account when deciding duration of anticoagulation.
Christiansen et al. performed a prospective study evaluating the association between recurrent VTE and thrombophilia status. After following 474 patients with confirmed first episode VTE for a mean of 7.3 years, no statistically significant risk of VTE was found for patients with FVL (hazard ratio [HR]: 1.2, 95% confidence interval [CI]: 0.7‐1.9), PT20210 (HR: 0.7, 95% CI: 0.3‐2.0), or an anticoagulant (protein C, protein S or ATIII) deficiency (HR: 1.8, 95% CI: 0.9‐3.7).[15] Although unexplained VTE was statistically associated with VTE recurrence, heritable thrombophilia status was not.
In a systematic review and meta‐analysis investigating the association of FVL and PT20210 with recurrent VTE, Ho and colleagues found a statistically significant risk of recurrent VTE in patients with inherited thrombophilia due to FVL (odds ratio [OR]: 1.41, 95% CI: 1.14‐1.75) and PT20210 (OR: 1.72, 95% CI: 1.27‐2.31), and reported that at most, only up to 1 in 6 recurrent VTEs may be attributable to these mutations.[16] Based on this relatively modest effect, the authors question the utility of testing for inherited thrombophilia, as thrombophilia status is unlikely to warrant a change in type or duration of treatment.
Regardless of whether an underlying inherited thrombophilia is identified, patients with history of recurrent VTE are often candidates for long‐term anticoagulation. Testing for inherited thrombophilia in patients with prior VTE events will therefore not influence decisions regarding clinical management. Additionally, such testing may be confounded by ongoing disease or treatment (Table 1). For example, protein C, protein S antigen, and ATIII levels are low in the setting of acute VTE.[17, 18] Likewise, protein C and S (vitamin Kdependent proteins) will be low in the setting of anticoagulation with warfarin.[19] Moreover, ATIII activity and antigen levels are low in the setting of heparin use.[20] Lack of provider awareness regarding these interactions may have important negative consequences, including a spurious diagnosis of thrombophilia,[21, 22] unnecessary hematology consultation, and psychological distress to patients in the form of ongoing unwarranted testing or apprehension regarding recurrence.[23]
| Acute VTE | Anticoagulation With Warfarin | Anticoagulation With NOACs | Anticoagulation With Heparin/LMWH | |
|---|---|---|---|---|
| ||||
| FVL/PT20210/MTHFR gene mutations | No Impact | No Impact | No Impact | No Impact |
| Protein C* | Decreased | Decreased | No impact | No impact |
| Protein S* | Decreased | Decreased | No impact | No impact |
| ATIII activity | Decreased | Slight increase | Slight increase | Decreased |
| ATIII antigen | Decreased | Slight increase | Slight increase | Decreased |
Additionally, this expensive evaluation has estimated direct costs of $1100 to $2400 per thrombophilia panel based on estimation of charges billed by a large commercial laboratory.[24, 25] In 2014, over 280,000 claims were submitted under Medicare Part B across all care settings for a thrombophilia analysis including FVL, PT20210, and MTHFR gene mutations,[24] which would equate to between $300 million to $672 million.[26] Unfortunately, there have been no large‐scale trials to assess cost‐effectiveness. However, the Evaluation of Genomic Applications in Practice and Prevention (EGAPP) Working Group stated that cost‐effectiveness modeling studies in this area require updating with current VTE risk estimates but are suggestive that routine FVL/PT20210 testing is not cost‐effective.[27]
ARE THERE CIRCUMSTANCES IN WHICH INPATIENT INHERITED THROMBOPHILIA TESTING PROVES BENEFICIAL?
The evidence for when to test for inherited thrombophilia is very limited and is often based on individualized risk. The current EGAPP guidelines acknowledge this limitation, specifically noting that there is a paucity of data evaluating management or prophylaxis of patients with homozygous or compound heterozygous FVL or P20210 mutation, and a lack of data surrounding whether or not knowledge of thrombophilia mutation should affect anticoagulation treatment.[27] This is why an individualized approach is deemed necessary. For example, the decision to prescribe hormone replacement therapy in women with a family history of inherited thrombophilia may be better informed by testing prior to treatment. Similarly, pregnant women with a family history or personal history of VTE may also benefit from inherited thrombophilia testing, as this may influence antepartum or postpartum management.[28, 29] The National Institute for Health and Clinical Excellence (NICE) guidelines recommend consideration of testing for hereditary thrombophilia in patients with unprovoked VTE and a first‐degree relative with VTE, if stopping anticoagulation treatment is planned; however, these recommendations are based solely on Guideline Development Group's experience and opinion.[30] Regardless, testing for inherited thrombophilia has significant potential consequences. Patients at risk should meet with an outpatient hematologist and/or a genetic counselor, if available, to determine the risks and benefits of testing.
WHAT DO GUIDELINES SAY ABOUT INHERITED THROMBOPHILIA TESTING?
The most recent NICE guidelines recommend against offering inherited thrombophilia testing to patients presenting with a provoked VTE in any clinical setting.[30] In patients diagnosed with unprovoked VTE, testing should not be considered unless a first degree relative with a history of VTE exists.[30] The NICE guidelines also recommend against routinely offering thrombophilia testing to asymptomatic first‐degree relatives of patients with a history of VTE or known inherited thrombophilia. This recommendation is reflected in the American Society of Hematology's Choosing Wisely recommendations since 2013.[31] Further, The American College of Medical Genetics and Genomics' Choosing Wisely recommendations from 2015 state that MTHFR mutations should never be included in any thrombophilia workup, as recent meta‐analyses have disproven an association between the presence of these variants and venous thromboembolism.[32]
The EGAPP Working Group recommends against routine testing for FVL or PT20210 in patients who present with an idiopathic VTE, as longer‐term anticoagulation offers similar benefits to patients with or without these mutations.[27] EGAPP also recommends against testing asymptomatic adult family members of patients with VTE and/or an FVL or PT20210 mutation for the purpose of considering primary prophylactic anticoagulation. In these circumstances, it is felt that the potential risks of thrombophilia testing outweigh any potential benefits.
HOW SHOULD HOSPITALISTS APPROACH TESTING OF INHERITED THROMBOPHILIA?
The providers in our case presentation are challenged with determining whether inpatient thrombophilia evaluation will add value to the evaluation of patients with unprovoked VTE. The available evidence suggests that clinicians should avoid ordering thrombophilia testing for hospitalized patients with unprovoked VTE because (1) many thrombophilia tests are inaccurate in the setting of acute VTE and/or anticoagulation, (2) results of testing often do not influence management, (3) testing is not cost‐effective, (4) a positive test result may lead to unnecessary patient anxiety, and (5) testing may result in inappropriately prolonged anticoagulation courses or unnecessary involvement of inpatient consultants. For these reasons, the patient in our case presentation should not be tested for inherited thrombophilia. In patients with personal or family histories of recurrent thromboembolism, modifiable clinical risk factors should be addressed, as these are more likely to influence treatment decisions compared to genetic testing. Finally, patients may be referred to an outpatient hematologist or geneticist for individualized discussions of risks and benefits of testing for inherited thrombophilia.
CONCLUSION
Inpatient evaluation for inherited thrombophilia for VTE is not clinically useful, cost‐effective, or reliable in the setting of VTE. The result of such testing does not affect management of acute primary or recurrent VTE. Testing should only be considered using an individualized approach in the outpatient setting with appropriate genetic counseling.
Disclosure: Christopher M. Petrilli, MD, and Lauren Heidemann, MD, contributed equally to this work. The authors report no conflicts of interest.
Do you think this is a low‐value practice? Is this truly a Thing We Do for No Reason? Share what you do in your practice and join in the conversation online by retweeting it on Twitter (#TWDFNR) and liking it on Facebook. We invite you to propose ideas for other Things We Do for No Reason topics by emailing TWDFNR@hospitalmedicine.org.
- , , , , , . Trends in the incidence of deep vein thrombosis and pulmonary embolism: a 25‐year population‐based study. Arch Intern Med. 1998;158(6):585–593.
- , , , et al. The clinical course of pulmonary embolism. N Engl J Med. 1992;326(19):1240–1245.
- , . Hereditary thrombophilia. Thromb J. 2006;4:15.
- , , , . Deep‐vein thrombosis. Lancet. 1999;353(9151):479–485.
- , , , et al. A risk assessment model for the identification of hospitalized medical patients at risk for venous thromboembolism: the Padua Prediction Score. J Thromb Haemost. 2010;8(11):2450–2457.
- , , , et al. VTE, thrombophilia, antithrombotic therapy, and pregnancy: Antithrombotic Therapy and Prevention of Thrombosis, 9th ed: American College of Chest Physicians Evidence‐Based Clinical Practice Guidelines. Chest. 2012;141(2 suppl):e691S–e736S.
- , . Testing for inherited thrombophilia and consequences for antithrombotic prophylaxis in patients with venous thromboembolism and their relatives. A review of the Guidelines from Scientific Societies and Working Groups. Thromb Haemost. 2013;110(4):697–705.
- , , , et al. Prevention of VTE in nonsurgical patients: antithrombotic therapy and prevention of thrombosis, 9th ed: American College of Chest Physicians Evidence‐Based Clinical Practice Guidelines. Chest. 2012;141(2 suppl):e195S–e226S.
- , , , et al. Predictive value of factor V Leiden and prothrombin G20210A in adults with venous thromboembolism and in family members of those with a mutation: a systematic review. JAMA. 2009;301(23):2472–2485.
- , , , . Thrombophilia testing for prevention of recurrent venous thromboembolism. Cochrane Database Syst Rev. 2009;(1):CD007069.
- , , , . Thrombophilia testing for prevention of recurrent venous thromboembolism. Cochrane Database Syst Rev. 2012;12:CD007069.
- , , , . Incidence of recurrent venous thromboembolism in relation to clinical and thrombophilic risk factors: prospective cohort study. Lancet. 2003;362(9383):523–526.
- , , , et al. Influence of thrombophilia on risk of recurrent venous thromboembolism while on warfarin: results from a randomized trial. Blood. 2008;112(12):4432–4436.
- , . Testing for thrombophilia: an evidence‐based approach. Postgrad Med J. 2006;82(973):699–704.
- , , , , . Thrombophilia, clinical factors, and recurrent venous thrombotic events. JAMA. 2005;293(19):2352–2361.
- , , , . Risk of recurrent venous thromboembolism in patients with common thrombophilia: a systematic review. Arch Intern Med. 2006;166(7):729–736.
- , , , . Relationship between protein C antigen and anticoagulant activity during oral anticoagulation and in selected disease states. J Clin Invest. 1986;77(2):416–425.
- , . Inherited antithrombin deficiency: a review. Haemophilia. 2008;14(6):1229–1239.
- , , , . Decline of proteins C and S and factors II, VII, IX and X during the initiation of warfarin therapy. Thromb Res. 1987;45(6):783–790.
- . Thrombophilia: common questions on laboratory assessment and management. Hematology Am Soc Hematol Educ Program. 2007:127–135.
- , , . Activated protein C resistance testing for factor V Leiden. Am J Hematol. 2014;89(12):1147–1150.
- , . Quantitation of human protein S in the plasma of normal and warfarin‐treated individuals by radioimmunoassay. Thromb Res. 1984;36(6):527–535.
- , , , . Social aspects of genetic testing for factor V Leiden mutation in healthy individuals and their importance for daily practice. Thromb Res. 2004;113(1):7–12.
- , . Hypercoagulability: clinical assessment and treatment. South Med J. 2001;94(10):1013–1020.
- , , . An evaluation of thrombophilia screening in an urban tertiary care medical center: A “real world” experience. Am J Clin Pathol. 2006;126(1):120–127.
- CodeMap. Available at: https://www.codemap.com. Accessed January 18, 2016.
- Evaluation of Genomic Applications in Practice and Prevention (EGAPP) Working Group. Recommendations from the EGAPP Working Group: routine testing for Factor V Leiden (R506Q) and prothrombin (20210G>A) mutations in adults with a history of idiopathic venous thromboembolism and their adult family members. Genet Med. 2011;13(1):67–76.
- , , , et al. Safety of withholding heparin in pregnant women with a history of venous thromboembolism. Recurrence of Clot in This Pregnancy Study Group. N Engl J Med. 2000;343(20):1439–1444.
- , , , et al. Frequency of pregnancy‐related venous thromboembolism in anticoagulant factor‐deficient women: implications for prophylaxis. Ann Intern Med. 1996;125(12):955–960.
- , , , ; Guideline Development Group. Management of venous thromboembolic diseases and the role of thrombophilia testing: summary of NICE guidance. BMJ. 2012;344:e3979.
- American Society of Hematology. Ten things physicians and patients should question. Choosing Wisely website. Available at: http://www.choosingwisely.org/societies/american‐society‐of‐hematology. Published December 4, 2013. Accessed January 18, 2016.
- American College of Medical Genetics and Genomics. Five Things patients and providers should question. Choosing Wisely website. Available at: http://www.choosingwisely.org/societies/american‐college‐of‐medical‐genetics‐and‐genomics. Published July 10, 2015. Accessed March 13, 2016.
The Things We Do for No Reason (TWDFNR) series reviews practices which have become common parts of hospital care but which may provide little value to our patients. Practices reviewed in the TWDFNR series do not represent black and white conclusions or clinical practice standards, but are meant as a starting place for research and active discussions among hospitalists and patients. We invite you to be part of that discussion. https://www.choosingwisely.org/
Inherited thrombophilia refers to a genetic condition that predisposes to an increased risk of venous thromboembolism (VTE). This disorder is prevalent in approximately 7% of the population and includes mutations such as factor V Leiden, prothrombin 20210, protein C deficiency, protein S deficiency, antithrombin deficiency, and methylene tetrahydrofolate reductase. The relative risk of VTE is 3‐ to 20‐fold greater in patients with inherited thrombophilia compared with the general population. Is testing for inherited thrombophilia recommended? The available evidence suggests that testing for inherited thrombophilia is not recommended in most clinical settings. In patients without a personal history of VTE, thrombophilia results do not change management, as there is no evidence to support thromboprophylaxis in this setting. In patients with a personal history of provoked or unprovoked VTE, inpatient testing is not indicated, as results do not influence management, testing is not cost‐effective, and a positive test result may lead to unnecessary patient anxiety or may result in unnecessary involvement of consultants. Testing in hospitalized patients has even more limitations because many thrombophilia tests are inaccurate in the setting of acute VTE and/or anticoagulation.
CASE PRESENTATION
A 23‐year‐old man presents to the emergency room with pleuritic chest pain and new oxygen requirement of 2 L nasal cannula. He has a history of unprovoked lower extremity deep venous thrombosis (DVT) diagnosed at age 20 and completed 3 months of systemic anticoagulation without complications. He reports no family history of clotting disorders or venous thromboembolism (VTE) and no reversible risk factors for VTE such as prolonged immobility, recent surgery, or high‐risk medications. A computed tomogram pulmonary embolism protocol shows multiple right lower lobe, segmental pulmonary emboli. Anticoagulation is initiated, and the patient is admitted to the hospital. Will inpatient inherited thrombophilia testing impact management for this case?
WHY MAY INHERITED THROMBOPHILIA TESTING PROVE HELPFUL?
The annual incidence rate of a first VTE event is estimated as 117 per 100,000 individuals per year.[1] The most common presentations are symptomatic DVT of the leg (annual incidence approximately 48 per 100,000 people), or a pulmonary embolism (annual incidence approximately 69 per 100,000 people).[1] Pulmonary embolism results in death in up to 30% of untreated patients and 2.5% of patients who receive systemic anticoagulation.[2] Principal in the pathogenesis of VTE are factors described by Virchow's triad: venous stasis, endothelial injury, and systemic hypercoagulability. By identifying a mutation in 1 or more of the factors in the clotting pathway, an evaluation for inherited thrombophilia theoretically may unearth factors that drive systemic hypercoagulability and inform decision making so as to prevent future events.
Inherited thrombophilia refers to a genetic condition that predisposes to an increased risk of VTE.[3] Approximately 7% of the general population has inherited thrombophilia, which includes factor V Leiden (FVL) mutation, prothrombin 20210 mutation (PT20210), protein C deficiency, protein S deficiency, antithrombin III (ATIII) deficiency, and methylene tetrahydrofolate reductase mutation (MTHFR).[4] Of note, the definition does not include acquired etiologies, such as antiphospholipid antibody syndrome. Depending on the underlying condition and expression of the genetic abnormality, the relative risk of VTE in patients with inherited thrombophilia is 3‐ to 20‐fold greater than that of the general population.[5] Therefore, it is logical to consider that testing for inherited thrombophilia might be clinically useful. However, the evidence for doing so is very limited.
DOES INHERITED THROMBOPHILIA TESTING CHANGE MANAGEMENT?
An inherited thrombophilia evaluation is unlikely to affect management in most clinical settings. There is no current evidence to support primary prophylaxis[6] nor is there evidence that management of patients with recurrent VTE should be altered in the setting of inherited thrombophilia.
To date, no prospective trials have evaluated the efficacy of anticoagulant use for primary prevention of VTE in patients with inherited thrombophilia.[6] Given the limited evidence for thromboprophylaxis and risks of anticoagulation, primary prevention for patients with inherited thrombophilia that remain asymptomatic is not recommended by the current American College of Chest Physicians guidelines.[7, 8]
Similarly, in patients with a first VTE or recurrent VTE, diagnosis of inherited thrombophilia is often not associated with recurrent events, which suggests that other nongenetic factors may be just as important, if not more important, in determining the risk of recurrence.[9] Although no randomized controlled or controlled clinical trials have evaluated the effects of testing for inherited thrombophilia on recurrent VTE,[10, 11] several prospective studies have assessed risk factors for recurrence. Data from these studies suggest that recurrence rates after unprovoked VTE are only weakly correlated with inherited thrombophilia status.[12, 13] Rather, it is postulated that patients with recurrent VTE may exhibit a prothrombotic tendency regardless of underlying genetic predisposition. In this case, decisions regarding anticoagulation do not vary by thrombophilia status. Instead, thrombophilia testing may divert attention away from the management of more prevalent, potentially modifiable risk factors such as immobility, oral contraceptive use, or malignancy, all of which are associated with recurrent VTE.[14] These provoking factors are the most important determinants of the chance of VTE recurrence as well as the most significant factors to take into account when deciding duration of anticoagulation.
Christiansen et al. performed a prospective study evaluating the association between recurrent VTE and thrombophilia status. After following 474 patients with confirmed first episode VTE for a mean of 7.3 years, no statistically significant risk of VTE was found for patients with FVL (hazard ratio [HR]: 1.2, 95% confidence interval [CI]: 0.7‐1.9), PT20210 (HR: 0.7, 95% CI: 0.3‐2.0), or an anticoagulant (protein C, protein S or ATIII) deficiency (HR: 1.8, 95% CI: 0.9‐3.7).[15] Although unexplained VTE was statistically associated with VTE recurrence, heritable thrombophilia status was not.
In a systematic review and meta‐analysis investigating the association of FVL and PT20210 with recurrent VTE, Ho and colleagues found a statistically significant risk of recurrent VTE in patients with inherited thrombophilia due to FVL (odds ratio [OR]: 1.41, 95% CI: 1.14‐1.75) and PT20210 (OR: 1.72, 95% CI: 1.27‐2.31), and reported that at most, only up to 1 in 6 recurrent VTEs may be attributable to these mutations.[16] Based on this relatively modest effect, the authors question the utility of testing for inherited thrombophilia, as thrombophilia status is unlikely to warrant a change in type or duration of treatment.
Regardless of whether an underlying inherited thrombophilia is identified, patients with history of recurrent VTE are often candidates for long‐term anticoagulation. Testing for inherited thrombophilia in patients with prior VTE events will therefore not influence decisions regarding clinical management. Additionally, such testing may be confounded by ongoing disease or treatment (Table 1). For example, protein C, protein S antigen, and ATIII levels are low in the setting of acute VTE.[17, 18] Likewise, protein C and S (vitamin Kdependent proteins) will be low in the setting of anticoagulation with warfarin.[19] Moreover, ATIII activity and antigen levels are low in the setting of heparin use.[20] Lack of provider awareness regarding these interactions may have important negative consequences, including a spurious diagnosis of thrombophilia,[21, 22] unnecessary hematology consultation, and psychological distress to patients in the form of ongoing unwarranted testing or apprehension regarding recurrence.[23]
| Acute VTE | Anticoagulation With Warfarin | Anticoagulation With NOACs | Anticoagulation With Heparin/LMWH | |
|---|---|---|---|---|
| ||||
| FVL/PT20210/MTHFR gene mutations | No Impact | No Impact | No Impact | No Impact |
| Protein C* | Decreased | Decreased | No impact | No impact |
| Protein S* | Decreased | Decreased | No impact | No impact |
| ATIII activity | Decreased | Slight increase | Slight increase | Decreased |
| ATIII antigen | Decreased | Slight increase | Slight increase | Decreased |
Additionally, this expensive evaluation has estimated direct costs of $1100 to $2400 per thrombophilia panel based on estimation of charges billed by a large commercial laboratory.[24, 25] In 2014, over 280,000 claims were submitted under Medicare Part B across all care settings for a thrombophilia analysis including FVL, PT20210, and MTHFR gene mutations,[24] which would equate to between $300 million to $672 million.[26] Unfortunately, there have been no large‐scale trials to assess cost‐effectiveness. However, the Evaluation of Genomic Applications in Practice and Prevention (EGAPP) Working Group stated that cost‐effectiveness modeling studies in this area require updating with current VTE risk estimates but are suggestive that routine FVL/PT20210 testing is not cost‐effective.[27]
ARE THERE CIRCUMSTANCES IN WHICH INPATIENT INHERITED THROMBOPHILIA TESTING PROVES BENEFICIAL?
The evidence for when to test for inherited thrombophilia is very limited and is often based on individualized risk. The current EGAPP guidelines acknowledge this limitation, specifically noting that there is a paucity of data evaluating management or prophylaxis of patients with homozygous or compound heterozygous FVL or P20210 mutation, and a lack of data surrounding whether or not knowledge of thrombophilia mutation should affect anticoagulation treatment.[27] This is why an individualized approach is deemed necessary. For example, the decision to prescribe hormone replacement therapy in women with a family history of inherited thrombophilia may be better informed by testing prior to treatment. Similarly, pregnant women with a family history or personal history of VTE may also benefit from inherited thrombophilia testing, as this may influence antepartum or postpartum management.[28, 29] The National Institute for Health and Clinical Excellence (NICE) guidelines recommend consideration of testing for hereditary thrombophilia in patients with unprovoked VTE and a first‐degree relative with VTE, if stopping anticoagulation treatment is planned; however, these recommendations are based solely on Guideline Development Group's experience and opinion.[30] Regardless, testing for inherited thrombophilia has significant potential consequences. Patients at risk should meet with an outpatient hematologist and/or a genetic counselor, if available, to determine the risks and benefits of testing.
WHAT DO GUIDELINES SAY ABOUT INHERITED THROMBOPHILIA TESTING?
The most recent NICE guidelines recommend against offering inherited thrombophilia testing to patients presenting with a provoked VTE in any clinical setting.[30] In patients diagnosed with unprovoked VTE, testing should not be considered unless a first degree relative with a history of VTE exists.[30] The NICE guidelines also recommend against routinely offering thrombophilia testing to asymptomatic first‐degree relatives of patients with a history of VTE or known inherited thrombophilia. This recommendation is reflected in the American Society of Hematology's Choosing Wisely recommendations since 2013.[31] Further, The American College of Medical Genetics and Genomics' Choosing Wisely recommendations from 2015 state that MTHFR mutations should never be included in any thrombophilia workup, as recent meta‐analyses have disproven an association between the presence of these variants and venous thromboembolism.[32]
The EGAPP Working Group recommends against routine testing for FVL or PT20210 in patients who present with an idiopathic VTE, as longer‐term anticoagulation offers similar benefits to patients with or without these mutations.[27] EGAPP also recommends against testing asymptomatic adult family members of patients with VTE and/or an FVL or PT20210 mutation for the purpose of considering primary prophylactic anticoagulation. In these circumstances, it is felt that the potential risks of thrombophilia testing outweigh any potential benefits.
HOW SHOULD HOSPITALISTS APPROACH TESTING OF INHERITED THROMBOPHILIA?
The providers in our case presentation are challenged with determining whether inpatient thrombophilia evaluation will add value to the evaluation of patients with unprovoked VTE. The available evidence suggests that clinicians should avoid ordering thrombophilia testing for hospitalized patients with unprovoked VTE because (1) many thrombophilia tests are inaccurate in the setting of acute VTE and/or anticoagulation, (2) results of testing often do not influence management, (3) testing is not cost‐effective, (4) a positive test result may lead to unnecessary patient anxiety, and (5) testing may result in inappropriately prolonged anticoagulation courses or unnecessary involvement of inpatient consultants. For these reasons, the patient in our case presentation should not be tested for inherited thrombophilia. In patients with personal or family histories of recurrent thromboembolism, modifiable clinical risk factors should be addressed, as these are more likely to influence treatment decisions compared to genetic testing. Finally, patients may be referred to an outpatient hematologist or geneticist for individualized discussions of risks and benefits of testing for inherited thrombophilia.
CONCLUSION
Inpatient evaluation for inherited thrombophilia for VTE is not clinically useful, cost‐effective, or reliable in the setting of VTE. The result of such testing does not affect management of acute primary or recurrent VTE. Testing should only be considered using an individualized approach in the outpatient setting with appropriate genetic counseling.
Disclosure: Christopher M. Petrilli, MD, and Lauren Heidemann, MD, contributed equally to this work. The authors report no conflicts of interest.
Do you think this is a low‐value practice? Is this truly a Thing We Do for No Reason? Share what you do in your practice and join in the conversation online by retweeting it on Twitter (#TWDFNR) and liking it on Facebook. We invite you to propose ideas for other Things We Do for No Reason topics by emailing TWDFNR@hospitalmedicine.org.
- , , , , , . Trends in the incidence of deep vein thrombosis and pulmonary embolism: a 25‐year population‐based study. Arch Intern Med. 1998;158(6):585–593.
- , , , et al. The clinical course of pulmonary embolism. N Engl J Med. 1992;326(19):1240–1245.
- , . Hereditary thrombophilia. Thromb J. 2006;4:15.
- , , , . Deep‐vein thrombosis. Lancet. 1999;353(9151):479–485.
- , , , et al. A risk assessment model for the identification of hospitalized medical patients at risk for venous thromboembolism: the Padua Prediction Score. J Thromb Haemost. 2010;8(11):2450–2457.
- , , , et al. VTE, thrombophilia, antithrombotic therapy, and pregnancy: Antithrombotic Therapy and Prevention of Thrombosis, 9th ed: American College of Chest Physicians Evidence‐Based Clinical Practice Guidelines. Chest. 2012;141(2 suppl):e691S–e736S.
- , . Testing for inherited thrombophilia and consequences for antithrombotic prophylaxis in patients with venous thromboembolism and their relatives. A review of the Guidelines from Scientific Societies and Working Groups. Thromb Haemost. 2013;110(4):697–705.
- , , , et al. Prevention of VTE in nonsurgical patients: antithrombotic therapy and prevention of thrombosis, 9th ed: American College of Chest Physicians Evidence‐Based Clinical Practice Guidelines. Chest. 2012;141(2 suppl):e195S–e226S.
- , , , et al. Predictive value of factor V Leiden and prothrombin G20210A in adults with venous thromboembolism and in family members of those with a mutation: a systematic review. JAMA. 2009;301(23):2472–2485.
- , , , . Thrombophilia testing for prevention of recurrent venous thromboembolism. Cochrane Database Syst Rev. 2009;(1):CD007069.
- , , , . Thrombophilia testing for prevention of recurrent venous thromboembolism. Cochrane Database Syst Rev. 2012;12:CD007069.
- , , , . Incidence of recurrent venous thromboembolism in relation to clinical and thrombophilic risk factors: prospective cohort study. Lancet. 2003;362(9383):523–526.
- , , , et al. Influence of thrombophilia on risk of recurrent venous thromboembolism while on warfarin: results from a randomized trial. Blood. 2008;112(12):4432–4436.
- , . Testing for thrombophilia: an evidence‐based approach. Postgrad Med J. 2006;82(973):699–704.
- , , , , . Thrombophilia, clinical factors, and recurrent venous thrombotic events. JAMA. 2005;293(19):2352–2361.
- , , , . Risk of recurrent venous thromboembolism in patients with common thrombophilia: a systematic review. Arch Intern Med. 2006;166(7):729–736.
- , , , . Relationship between protein C antigen and anticoagulant activity during oral anticoagulation and in selected disease states. J Clin Invest. 1986;77(2):416–425.
- , . Inherited antithrombin deficiency: a review. Haemophilia. 2008;14(6):1229–1239.
- , , , . Decline of proteins C and S and factors II, VII, IX and X during the initiation of warfarin therapy. Thromb Res. 1987;45(6):783–790.
- . Thrombophilia: common questions on laboratory assessment and management. Hematology Am Soc Hematol Educ Program. 2007:127–135.
- , , . Activated protein C resistance testing for factor V Leiden. Am J Hematol. 2014;89(12):1147–1150.
- , . Quantitation of human protein S in the plasma of normal and warfarin‐treated individuals by radioimmunoassay. Thromb Res. 1984;36(6):527–535.
- , , , . Social aspects of genetic testing for factor V Leiden mutation in healthy individuals and their importance for daily practice. Thromb Res. 2004;113(1):7–12.
- , . Hypercoagulability: clinical assessment and treatment. South Med J. 2001;94(10):1013–1020.
- , , . An evaluation of thrombophilia screening in an urban tertiary care medical center: A “real world” experience. Am J Clin Pathol. 2006;126(1):120–127.
- CodeMap. Available at: https://www.codemap.com. Accessed January 18, 2016.
- Evaluation of Genomic Applications in Practice and Prevention (EGAPP) Working Group. Recommendations from the EGAPP Working Group: routine testing for Factor V Leiden (R506Q) and prothrombin (20210G>A) mutations in adults with a history of idiopathic venous thromboembolism and their adult family members. Genet Med. 2011;13(1):67–76.
- , , , et al. Safety of withholding heparin in pregnant women with a history of venous thromboembolism. Recurrence of Clot in This Pregnancy Study Group. N Engl J Med. 2000;343(20):1439–1444.
- , , , et al. Frequency of pregnancy‐related venous thromboembolism in anticoagulant factor‐deficient women: implications for prophylaxis. Ann Intern Med. 1996;125(12):955–960.
- , , , ; Guideline Development Group. Management of venous thromboembolic diseases and the role of thrombophilia testing: summary of NICE guidance. BMJ. 2012;344:e3979.
- American Society of Hematology. Ten things physicians and patients should question. Choosing Wisely website. Available at: http://www.choosingwisely.org/societies/american‐society‐of‐hematology. Published December 4, 2013. Accessed January 18, 2016.
- American College of Medical Genetics and Genomics. Five Things patients and providers should question. Choosing Wisely website. Available at: http://www.choosingwisely.org/societies/american‐college‐of‐medical‐genetics‐and‐genomics. Published July 10, 2015. Accessed March 13, 2016.
© 2016 Society of Hospital Medicine
Building an Academic Pipeline
Now in its 20th year, hospital medicine hasfrom many perspectivesreached full bloom. Hospitalists populate settings as diverse as academic hospitals, community hospitals, and long‐term care facilities. Many traditional academic medical centers have taken notice of hospitalists, not just for their clinical role in an era of restricted duty hours, but also for the value they provide in advancing the academic and teaching mission of the institution.[1, 2]
As a result, hospital medicine has expanded rapidly, from 10,000 hospitalists in the United States in 2004 to 48,000 hospitalists in 2014.[3] Unfortunately, such growth has led to a profession that is bottom heavy, with leaders that spearheaded the movement occupying the upper echelon followed by a conglomeration of junior faculty at the base. For many at the bottom of this pyramid, the path to promotion remains challenging. Core academic metrics such as peer‐reviewed publications, quality improvement activities, superb teaching evaluations, and a national reputation are challenging to achieve for faculty who remain highly clinically occupied.[4] Mentorship has been cited as a key contributor for academic success and career satisfaction, but not enough senior hospitalists exist with the experience, skills, and bandwidth to adequately groom protgs.[5, 6]
The brief article in this month's edition of the Journal of Hospital Medicine is important and timely. Cumbler and colleagues describe the creation of a visiting professor program specifically aimed at cross‐pollinating junior faculty on the precipice of promotion with senior members from other institutions.[7] Using a model of reciprocity, the visiting professor innovation provided a mechanism by which midcareer faculty could travel to another site, exchange ideas, mentor or be mentored, and find partners and like‐minded faculty to grow their work. Starting with just 2 sites, the program quickly expanded to 5, with exchanges of 7 visiting professors. Initial metrics of success appear promising: early career faculty that interacted with the visiting professor provided positive feedback in key domains including mentor‐mentee relationships and advancement of academic careers. We applaud the authors not only for introducing this novel idea, but also for building in evaluative components such as publications and letters for promotion that allow for assessment of success.
Programs such as these help fill key gaps. First, they provide important mechanisms for expanding the network of available mentors for junior faculty. Second, they provide a venue to promote cross‐institutional collaborations, receive feedback, and grow the circle of stakeholders around innovative projects. Third, they help junior faculty establish a national reputation, propelling them toward promotion. Finally, the program does what few others can; it provides a means by which clinically busy junior faculty can get much‐needed validation for their academic efforts.
How may this innovation be expanded to a national scale? As chairs of the Society of Hospital Medicines Academic and Research Committee, we think this a worthy mission. Following a lively discussion at the national meeting, both committees have established a workgroup to support a visiting professor program. The Visiting Professorship in Hospital Medicine Program will follow the model introduced by Cumbler and colleagues by cross‐linking facilities represented within our committees into the existing network of visiting professor sites. New sites will be asked to name a site lead who will be responsible for identifying appropriate faculty members and areas of expertise that would benefit from interinstitutional exchange. The Society of Hospital Medicine's Chapters Committee has joined the dialogue and will help by developing a database of faculty, domains of expertise, and geographic locations to create a veritable
We are a field that began with innovation. Developing and diffusing a junior faculty program to grow future academic leaders is just an extension of this type of thinking and demonstrates how we continuously remodel our specialty to meet our unique needs. Ultimately, we envision the program to be a national model adopted by the Society of Hospital Medicine to help grow not only academic, but also community‐hospitalist superstars who also have great ideas and innovations. Faced with the constant peril of clinical workload, academic burnout, and career success, our field must begin to invest in infrastructure that nurtures our young and provides them with the opportunities needed to shine. The innovation proposed by Cumbler et al. is a superb example of this type of initiative, one we are proud to help diffuse on a national level. Onward!
Disclosure
Nothing to report.
- , , , . Where should hospitalists sit within the academic medical center? J Gen Intern Med. 2008;23(8):1269–1272.
- . The hospitalist movement—time to move on. N Engl J Med. 2007;357(25):2627–2629.
- , . A history of the hospitalist movement. Obstet Gynecol Clin North Am. 2015;42(3):419–432.
- , , , , . Tried and true: a survey of successfully promoted academic hospitalists. J Hosp Med. 2011;6(7):411–415.
- , , , , , . Mentorship, productivity, and promotion among academic hospitalists. J Gen Intern Med. 2012;27(1):23–27.
- , , . Career satisfaction and the role of mentorship: a survey of pediatric hospitalists. Hosp Pediatr. 2012;2(3):141–148.
- , , , , , . Visiting professorship in hospital medicine: an innovative twist for a growing specialty. J Hosp Med. 2016;11(10):714–718.
Now in its 20th year, hospital medicine hasfrom many perspectivesreached full bloom. Hospitalists populate settings as diverse as academic hospitals, community hospitals, and long‐term care facilities. Many traditional academic medical centers have taken notice of hospitalists, not just for their clinical role in an era of restricted duty hours, but also for the value they provide in advancing the academic and teaching mission of the institution.[1, 2]
As a result, hospital medicine has expanded rapidly, from 10,000 hospitalists in the United States in 2004 to 48,000 hospitalists in 2014.[3] Unfortunately, such growth has led to a profession that is bottom heavy, with leaders that spearheaded the movement occupying the upper echelon followed by a conglomeration of junior faculty at the base. For many at the bottom of this pyramid, the path to promotion remains challenging. Core academic metrics such as peer‐reviewed publications, quality improvement activities, superb teaching evaluations, and a national reputation are challenging to achieve for faculty who remain highly clinically occupied.[4] Mentorship has been cited as a key contributor for academic success and career satisfaction, but not enough senior hospitalists exist with the experience, skills, and bandwidth to adequately groom protgs.[5, 6]
The brief article in this month's edition of the Journal of Hospital Medicine is important and timely. Cumbler and colleagues describe the creation of a visiting professor program specifically aimed at cross‐pollinating junior faculty on the precipice of promotion with senior members from other institutions.[7] Using a model of reciprocity, the visiting professor innovation provided a mechanism by which midcareer faculty could travel to another site, exchange ideas, mentor or be mentored, and find partners and like‐minded faculty to grow their work. Starting with just 2 sites, the program quickly expanded to 5, with exchanges of 7 visiting professors. Initial metrics of success appear promising: early career faculty that interacted with the visiting professor provided positive feedback in key domains including mentor‐mentee relationships and advancement of academic careers. We applaud the authors not only for introducing this novel idea, but also for building in evaluative components such as publications and letters for promotion that allow for assessment of success.
Programs such as these help fill key gaps. First, they provide important mechanisms for expanding the network of available mentors for junior faculty. Second, they provide a venue to promote cross‐institutional collaborations, receive feedback, and grow the circle of stakeholders around innovative projects. Third, they help junior faculty establish a national reputation, propelling them toward promotion. Finally, the program does what few others can; it provides a means by which clinically busy junior faculty can get much‐needed validation for their academic efforts.
How may this innovation be expanded to a national scale? As chairs of the Society of Hospital Medicines Academic and Research Committee, we think this a worthy mission. Following a lively discussion at the national meeting, both committees have established a workgroup to support a visiting professor program. The Visiting Professorship in Hospital Medicine Program will follow the model introduced by Cumbler and colleagues by cross‐linking facilities represented within our committees into the existing network of visiting professor sites. New sites will be asked to name a site lead who will be responsible for identifying appropriate faculty members and areas of expertise that would benefit from interinstitutional exchange. The Society of Hospital Medicine's Chapters Committee has joined the dialogue and will help by developing a database of faculty, domains of expertise, and geographic locations to create a veritable
We are a field that began with innovation. Developing and diffusing a junior faculty program to grow future academic leaders is just an extension of this type of thinking and demonstrates how we continuously remodel our specialty to meet our unique needs. Ultimately, we envision the program to be a national model adopted by the Society of Hospital Medicine to help grow not only academic, but also community‐hospitalist superstars who also have great ideas and innovations. Faced with the constant peril of clinical workload, academic burnout, and career success, our field must begin to invest in infrastructure that nurtures our young and provides them with the opportunities needed to shine. The innovation proposed by Cumbler et al. is a superb example of this type of initiative, one we are proud to help diffuse on a national level. Onward!
Disclosure
Nothing to report.
- , , , . Where should hospitalists sit within the academic medical center? J Gen Intern Med. 2008;23(8):1269–1272.
- . The hospitalist movement—time to move on. N Engl J Med. 2007;357(25):2627–2629.
- , . A history of the hospitalist movement. Obstet Gynecol Clin North Am. 2015;42(3):419–432.
- , , , , . Tried and true: a survey of successfully promoted academic hospitalists. J Hosp Med. 2011;6(7):411–415.
- , , , , , . Mentorship, productivity, and promotion among academic hospitalists. J Gen Intern Med. 2012;27(1):23–27.
- , , . Career satisfaction and the role of mentorship: a survey of pediatric hospitalists. Hosp Pediatr. 2012;2(3):141–148.
- , , , , , . Visiting professorship in hospital medicine: an innovative twist for a growing specialty. J Hosp Med. 2016;11(10):714–718.