User login
VA Pathologist Indicted for Patient Deaths Due to Misdiagnoses
Levy was chief pathologist at Veterans Health Care System of the Ozarks in Fayetteville, Arkansas. During his 12-year tenure at the US Department of Veterans Affairs (VA), he read almost 34,000 pathology slides. However, at the same time, he was working under the influence of alcohol and 2-methyl-2-butanol (2M2B)—a substance that intoxicates but cannot be detected in routine tests.
The VA fired Levy last year, and the VA Office of the Inspector General (OIG) began an investigation of his actions and of agency lapses in overseeing him. The 18-month review found that 8.9% of Levy’s diagnoses involved clinical errors—the normal misdiagnosis rate for pathologists is 0.7%. Hundreds of Levy’s misdiagnoses were not serious, but ≥ 15 may have led to deaths and harmful illness in 15 other patients. Some patients were not diagnosed when they should have been. Some were told they were sick when they were not and suffered unnecessary invasive treatment.
Levy knowingly falsified diagnoses for 3 veterans. One patient was diagnosed with diffuse large B-cell lymphoma—a type of cancer he did not have. He received the wrong treatment and died. Levy diagnosed another patient, also wrongly, with small cell carcinoma; that patient died of squamous cell carcinoma that spread. The third patient was given a benign test result for prostate cancer. Untreated, he died after the cancer spread.
One patient was given antibiotics instead of treatment for what was later diagnosed as late-stage neck and throat cancer. In an interview with the Washington Post he said, “I went from ‘Your earache isn’t anything’ to stage 4.”
How was Levy able to wreak such havoc? One reason was that despite concerns and complaints from colleagues, he looked good on paper. He falsified records to indicate that his deputy concurred with his diagnoses in mandated peer reviews. He also appeared “clean” in inspections through using 2M2B.
Levy was fired not for his work performance but for being arrested for driving while intoxicated. He had been a “star hire” with an medical degree from the University of Chicago, who had completed a pathology residency at the University of California at San Francisco and a fellowship at Duke University focusing on disease of the blood. But he also had a 1996 arrest for a driving under the influence (DUI) on his record when he joined the VA in 2005.
In 2015, a fact-finding panel interviewed Levy about reports that he was under the influence while on duty. He denied the allegations. In 2016, Levy arrived at the radiology department to assist with a biopsy with a blood alcohol level of nearly 0.4. He was suspended, his alcohol impairment was reported to the state medical boards, and his medical privileges were revoked. He entered a VA treatment program in 2016, then returned to work. Levy, who also sat on oversight boards and medical committees, seemed drowsy and was speaking “nonsense” at an October 2017 meeting of the hospital’s tumor board, according to meeting minutes provided to The Post.
He was suspended again in 2017 for being under the influence but allowed to continue with nonclinical work until he was again arrested for DUI in 2018, when the police toxicology test detected 2M2B. He was finally dismissed in April 2018. Nonetheless, even after he had arrived impaired at the laboratory twice, the VA had awarded him 2 performance bonuses, based on the supposedly low clinical error rate and 42 urine and blood samples that turned up negative for alcohol and drugs.
In addition to 3 counts of involuntary manslaughter, the indictment charges that Levy devised a scheme to defraud the VA and to obtain money and property from the VA in the form of salary, benefits, and performance awards. He is charged with 12 counts of wire fraud, 12 counts of mail fraud, and 4 counts of making false statements related to 12 occasions between 2017 and 2018, when Levy was reportedly buying 2M2B over the Internet while he was contractually obligated to submit to random drug and alcohol screens.
After being fired, Levy moved to a small island in the Dutch Caribbean and found a position teaching pathology at a local medical school. At the time of his VA hiring, Levy held a medical license issued by Mississippi. His active medical licenses in California and Florida were revoked only this spring. The VA did not notify the3 states where Levy was licensed that he could no longer practice until June 2018.
The Office of Inspector General (OIG) has identified other VA physicians who continued to practice even after they were found to have compromised patient care, and the Government Accountability Office found “weak systems” for ensuring that problems are addressed in a timely fashion. A VA spokesperson, however, quoted in The Washington Post, said the Levy case was “an isolated incident,” and that the agency has “strengthened internal controls” to ensure that errors are more quickly identified and addressed. The Fayetteville Medical Center also has increased monitoring of its clinical laboratory, according to a Washington Post report. VA officials also said they have added oversight of small specialty staffs across the system to ensure “independent and objective oversight.”
The VA has contacted the families in the 30 most serious cases to advise them of their legal and treatment options, according to the Washington Post.
“The arrest of Dr. Levy was accomplished as a result of the strong leadership of the US Attorney’s Office and the extensive work of special agents of the VA OIG, supported by the medical expertise of the OIG’s health care inspection professionals,” said Michael Missal, the VA’s inspector general, in a press release issued by the US Attorney’s Office in the Western District of Arkansas. “These charges send a clear signal that anyone entrusted with the care of veterans will be held accountable for placing them at risk by working while impaired or through other misconduct.”
Levy is in jail in Fayetteville. The trial date for his case is set for October 7.
Addressing the Shortage of Physician Assistants in Medicine Clerkship Sites
The Federal Bureau of Labor Statistics projects 37% job growth for physician assistants (PAs) from 2016 to 2026, much greater than the average for all other occupations as well as for other medical professions.1 This growth has been accompanied by increased enrollment in medical (doctor of medicine [MD], doctor of osteopathic medicine) and nurse practitioner (NP) schools.2 Clinical teaching sites serve a crucial function in the training of all clinical disciplines. These sites provide hands-on and experiential learning in medical settings, necessary components for learners practicing to become clinicians. Significant PA program expansion has led to increased demand for clinical training, creating competition for sites and a shortage of willing and well-trained preceptors.3
This challenge has been recognized by PA program directors. In the Joint Report of the 2013 Multi-Discipline Clerkship/Clinical Training Site Survey, PA program directors expressed concern about the adequacy of clinical opportunities for students, increased difficulty developing new core sites, and preserving existing core sites. In addition, they noted that a shortage of clinical sites was one of the greatest barriers to the PA programs’ sustained growth and success.4
Program directors also indicated difficulty securing clinical training sites in internal medicine (IM) and high rates of attrition of medicine clinical preceptors for their students.5 The reasons are multifold: increasing clinical demands, time, teaching competence, lack of experience, academic affiliation, lack of reimbursement, or compensation. Moreover, there is a declining number of PAs who work in primary care compared with specialty and subspecialty care, limiting the availability of clinical training preceptors in medicine and primary care.6-8 According to the American Academy of PAs (AAPA) census and salary survey data, the percentage of PAs working in the primary care specialties (ie, family medicine, IM, and general pediatrics) has decreased from > 47% in 1995 to 24% in 2017.9 As such, there is a need to broaden the educational landscape to provide more high-quality training sites in IM.
The postacute health care setting may address this training need. It offers a unique clinical opportunity to expose learners to a broad range of disease complexity and clinical acuity, as the percentage of patients discharged from hospitals to postacute care (PAC) has increased and care shifts from the hospital to the PAC setting.10,11 The longer PAC length of stay also enables learners to follow patients longitudinally over several weeks and experience interprofessional team-based care. In addition, the PAC setting offers learners the ability to acquire the necessary skills for smooth and effective transitions of care. This setting has been extensively used for trainees of nursing, pharmacy, physical therapy (PT) and occupational therapy (OT), speech-language pathology, psychology, and social work (SW), but few programs have used the PAC setting as clerkship sites for IM rotations for PA students. To address this need for IM sites, the VA Boston Healthcare System (VABHS), in conjunction with the Boston University School of Medicine Physician Assistant Program, developed a novel medicine clinical clerkship site for physician assistants in the PAC unit of the community living center (CLC) at VABHS. This report describes the program structure, curriculum, and participant evaluation results.
Clinical Clerkship Program
VABHS CLC is a 110-bed facility comprising 3 units: a 65-bed PAC unit, a 15-bed closed hospice/palliative care unit, and a 30-bed long-term care unit. The service is staffed continuously with physicians, PAs, and NPs. A majority of patients are admitted from the acute care hospital of VABHS (West Roxbury campus) and other regional VA facilities. The CLC offers dynamic services, including phlebotomy, general radiology, IV diuretics and antibiotics, wound care, and subacute PT, OT, and speech-language pathology rehabilitation. The CLC serves as a venue for transitioning patients from acute inpatient care to home. The patient population is often elderly, with multiple active comorbidities and variable medical literacy, adherence, and follow-up.
The CLC provides a diverse interprofessional learning environment, offering core IM rotations for first-year psychiatry residents, oral and maxillofacial surgery residents, and PA students. The CLC also has expanded as a clinical site both for transitions-in-care IM resident curricula and electives as well as a geriatrics fellowship. In addition, the site offers rotations for NPs, nursing, pharmacy, physical and occupational therapies, speech-language pathology, psychology, and SW.
The Boston University School of Medicine Physician Assistant Program was founded in 2015 as a master’s degree program completed over 28 months. The first 12 months are didactic, and the following 16 months are clinical training with 14 months of rotations (2 IM, family medicine, pediatrics, emergency medicine, general surgery, obstetrics and gynecology, psychiatry, neurology, and 5 elective rotations), and 2 months for a thesis. The program has about 30 students per year and 4 clerkship sites for IM.
Program Description
The VABHS medicine clerkship hosts 1 to 2 PA students for 4-week blocks in the PAC unit of the CLC. Each student rotates on both PA and MD teams. Students follow 3 to 4 patients and participate fully in their care from admission to discharge; they prepare daily presentations and participate in medical management, family meetings, chart documentation, and care coordination with the interprofessional team. Students are provided a physical examination checklist and feedback form, and they are expected to track findings and record feedback and goals with their supervising preceptor weekly. They also make formal case presentations and participate in monthly medicine didactic rounds available to all VABHS IM students and trainees via videoconference.
In addition, beginning in July 2017, all PA students in the CLC began to participate in a 4-week Interprofessional Curriculum in Transitional Care. The curriculum includes 14 didactic lectures taught by 16 interprofessional faculty, including medicine, geriatric, and palliative care physicians; PAs; social workers; physical and occupational therapists; pharmacists; and a geriatric psychologist. The didactics include topics on the interprofessional team, the care continuum, teams and teamwork, interdisciplinary coordination of care, components of effective transitions in care, medication reconciliation, approaching difficult conversations, advance care planning, and quality improvement. The goal of the curriculum is to provide learners the knowledge, skills, and dispositions necessary for high-quality transitional care and interprofessional practice as well as specific training for effective and safe transfers of care between clinical settings. Although PA students are the main participants in this curriculum, all other learners in the PAC unit are also invited to attend the lectures.
The unique attributes of this training site include direct interaction with supervising PAs and physicians, rather than experiencing the traditional teaching hierarchy (with interns, residents, fellows); observation of the natural progression of disease of both acute care and primary care issues due to the longer length of stay (2 to 6 weeks, where the typical student will see the same patient 7 to 10 times during their rotation); exposure to a host of medically complex patients offering a multitude of clinical scenarios and abnormal physical exam findings; exposure to a hospice/palliative care ward and end-of-life care; and interaction within an interprofessional training environment of nursing, pharmacy, PT, OT, speech-language pathology, psychology, and SW trainees.
Program Evaluation
At the end of rotations continuously through the year, PA students electronically complete a site evaluation from the Boston University School of Medicine Physician Assistant Program. The evaluation consists of 14 questions: 6 about site quality and 8 about instruction quality. The questions are answered on a 5-point Likert scale. Also included are 2 open-ended response questions that ask what they liked about the rotation and what they felt could be improved. Results are anonymous, de-identified and blinded both to the program as well as the clerkship site. Results are aggregated and provided to program sites annually. Responses are converted to a dichotomous variable, where any good or excellent response (4 or 5) is considered positive and any neutral or below (3, 2, 1) is considered a nonpositive response.
Results
The clerkship site has been operational since June 22, 2015. There have been 59 students who participated in the rotation. A different scale in these evaluations was used between June 22, 2015, and September 13, 2015. Therefore, 7 responses were excluded from the analysis, leaving 52 usable evaluations. The responses were analyzed both in total (for the CLC as well as other IM rotation sites) and by individual clerkship year to look for any trends over time: September 14, 2015, through April 24, 2016; April 25, 2016, through April 28, 2017; and May 1, 2017, through March 1, 2018 (Table).
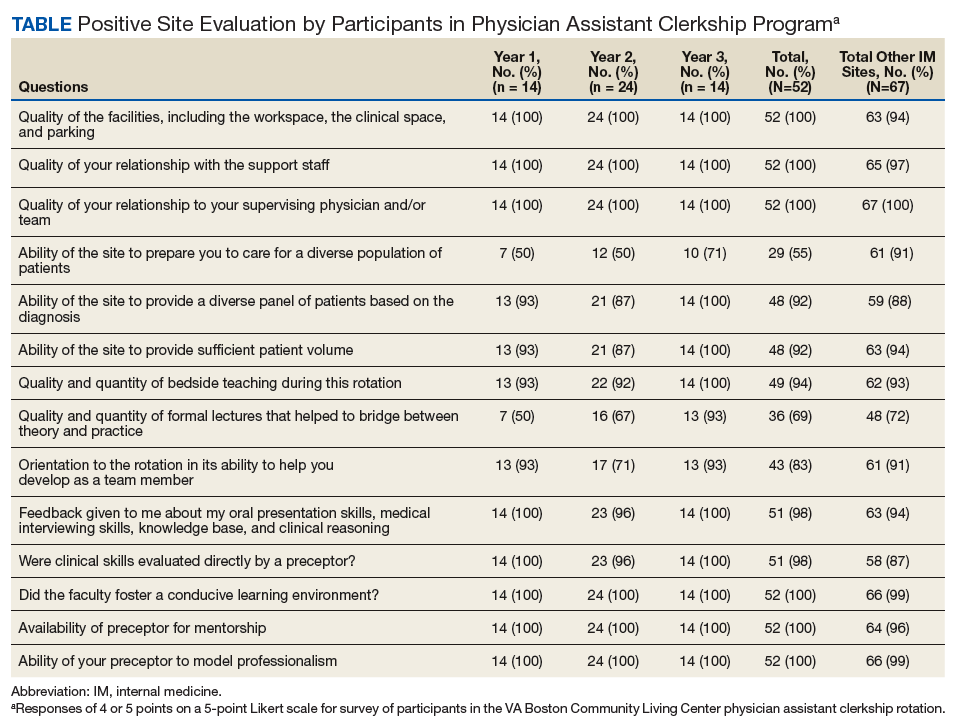
Site evaluations showed high satisfaction regarding the quality of the physical environment as well as the learning environment. Students endorsed the PAC unit having resources and physical space for them, such as a desk and computer, opportunity for participation in patient care, and parking (100%; n = 52). Site evaluations revealed high satisfaction with the quality of teaching and faculty encouragement and support of their learning (100%; n = 52). The evaluations revealed that bedside teaching was strong (94%; n = 49). The students reported high satisfaction with the volume of patients provided (92%; n = 48) as well as the diversity of diagnoses (92%; n = 48).
There were fewer positive responses in the first 2 years of the rotation with regard to formal lectures (50% and 67%; 7/14 and 16/24, respectively). In the third year of the rotation, students had a much higher satisfaction rate (93%; 13/14). This increased satisfaction was associated with the development and incorporation of the Interprofessional Curriculum in Transitional Care in 2017.
Discussion
Access to high-quality PA student clerkship sites has become a pressing issue in recent years because of increased competition for sites and a shortage of willing and well-trained preceptors. There has been marked growth in schools and enrollment across all medical professions. The Accreditation Review Commission on Education for the PA (ARC-PA) reported that the total number of accredited entry-level PA programs in 2018 was 246, with 58 new accredited programs projected by 2022.12 The Joint Report of the 2013 Multi-Discipline Clerkship/Clinical Training Site Survey reported a 66% increase in first-year enrollment in PA programs from 2002 to 2012.5 Programs must implement alternative strategies to attract clinical sites (eg, academic appointments, increased clinical resources to training sites) or face continued challenges with recruiting training sites for their students. Postacute care may be a natural extension to expand the footprint for clinical sites for these programs, augmenting acute inpatient and outpatient rotations. This implementation would increase the pool of clinical training sites and preceptors.
The experience with this novel training site, based on PA student feedback and evaluations, has been positive, and the postacute setting can provide students with high-quality IM clinical experiences. Students report adequate patient volume and diversity. In addition, evaluations are comparable with that of other IM site rotations the students experience. Qualitative feedback has emphasized the value of following patients over longer periods; eg, weeks vs days (as in acute care) enabling students to build relationships with patients as well as observe a richer clinical spectrum of disease over a less compressed period. “Patients have complex issues, so from a medical standpoint it challenges you to think of new ways to manage their care,” commented a representative student. “It is really beneficial that you can follow them over time.”
Furthermore, in response to student feedback on didactics, an interprofessional curriculum was developed to add formal structure as well as to create a curriculum in care transitions. This curriculum provided a unique opportunity for PA students to receive formal instruction on areas of particular relevance for transitional care (eg, care continuum, end of life issues, and care transitions). The curriculum also allows the interprofessional faculty a unique and enjoyable opportunity for interprofessional collaboration.
The 1 month PAC rotation is augmented with inpatient IM and outpatient family medicine rotations, consequently giving exposure to the full continuum of care. The PAC setting provides learners multifaceted benefits: the opportunity to strengthen and develop the knowledge, attitudes, and skills necessary for IM; increased understanding of other professions by observing and interacting as a team caring for a patient over a longer period as opposed to the acute care setting; the ability to perform effective, efficient, and safe transfer between clinical settings; and broad exposure to transitional care. As a result, the PAC rotation enhances but does not replace the necessary and essential rotations of inpatient and outpatient medicine.
Moreover, this rotation provides unique and core IM training for PA students. Our site focuses on interprofessional collaboration, emphasizing the importance of team-based care, an essential concept in modern day medicine. Formal exposure to other care specialties, such as PT and OT, SW, and mental health, is essential for students to appreciate clinical medicine and a patient’s physical and mental experience over the course of a disease and clinical state. In addition, the physical exam checklist ensures that students are exposed to the full spectrum of IM examination findings during their rotation. Finally, weekly feedback forms require students to ask and receive concrete feedback from their supervising providers.
Limitations
The generalizability of this model requires careful consideration. VABHS is a tertiary care integrated health care system, enabling students to learn from patients moving through multiple care transitions in a single health care system. In addition, other settings may not have the staffing or clinical volume to sustain such a model. All PAC clinical faculty teach voluntarily, and local leadership has set expectations for all clinicians to participate in teaching of trainees and PA students. Evaluations also note less diversity in the patient population, a challenge that some VA facilities face. This issue could be addressed by ensuring that students also have IM rotations at other inpatient medical facilities. A more balanced experience, where students reap the positive benefits of PAC but do not lose exposure to a diverse patient pool, could result. Furthermore, some of the perceived positive impacts also may be related to professional and personal attributes of the teaching clinicians rather than to the PAC setting.
Conclusion
PAC settings can be effective training sites for medicine clerkships for PA students and can provide high-quality training in IM as PA programs continue to expand. This setting offers students exposure to interprofessional, team-based care and the opportunity to care for patients with a broad range of disease complexity. Learning is further enhanced by the ability to follow patients longitudinally over their disease course as well as to work directly with teaching faculty and other interprofessional health care professionals. Evaluations of this novel clerkship experience have shown high levels of student satisfaction in knowledge growth, clinical skills, bedside teaching, and mentorship.
Acknowledgments
We thank Juman Hijab for her critical role in establishing and maintaining the clerkship. We thank Steven Simon, Matt Russell, and Thomas Parrino for their leadership and guidance in establishing and maintaining the clerkship. We thank the Boston University School of Medicine Physician Assistant Program Director Mary Warner for her support and guidance in creating and supporting the clerkship. In addition, we thank the interprofessional education faculty for their dedicated involvement in teaching, including Stephanie Saunders, Lindsay Lefers, Jessica Rawlins, Lindsay Brennan, Angela Viani, Eric Charette, Nicole O’Neil, Susan Nathan, Jordana Meyerson, Shivani Jindal, Wei Shen, Amy Hanson, Gilda Cain, and Kate Hinrichs.
1. US Department of Labor, Bureau of Labor Statistics. Occupational outlook handbook: physician assistants. https://www.bls.gov/ooh/healthcare/physician-assistants.htm. Updated June 18, 2019. Accessed August 13, 2019.
2. Association of American Medical Colleges. 2019 update: the complexities of physician supply and demand: projections from 2017 to 2032. https://aamc-black.global.ssl.fastly.net/production/media/filer_public/31/13/3113ee5c-a038-4c16-89af-294a69826650/2019_update_-_the_complexities_of_physician_supply_and_demand_-_projections_from_2017-2032.pdf. Published April 2019. Accessed August 15, 2019.
3. Glicken AD, Miller AA. Physician assistants: from pipeline to practice. Acad Med. 2013;88(12):1883-1889.
4. Erikson C, Hamann R, Levitan T, Pankow S, Stanley J, Whatley M. Recruiting and maintaining US clinical training sites: joint report of the 2013 multi-discipline clerkship/clinical training site survey. https://paeaonline.org/wp-content/uploads/2015/10/Recruiting-and-Maintaining-U.S.-Clinical-Training-Sites.pdf. Accessed August 13, 2019.
5. Physician Assistant Education Association. By the numbers: 30th annual report on physician assistant educational programs. 2015. http://paeaonline.org/wp-content/uploads/2016/12/2015-by-the-numbers-program-report-30.pdf. Published 2015. Accessed August 15, 2019.
6. Morgan P, Himmerick KA, Leach B, Dieter P, Everett C. Scarcity of primary care positions may divert physician assistants into specialty practice. Med Care Res Rev. 2017;74(1):109-122.
7. Coplan B, Cawley J, Stoehr J. Physician assistants in primary care: trends and characteristics. Ann Fam Med. 2013;11(1):75-79.
8. Morgan P, Leach B, Himmerick K, Everett C. Job openings for PAs by specialty. JAAPA. 2018;31(1):45-47.
9. American Academy of Physician Assistants. 2017 AAPA Salary Report. Alexandria, VA; 2017.
10. Barnett ML, Grabowski DC, Mehrotra A. Home-to-home time—measuring what matters to patients and payers. N Engl J Med. 2017;377(1):4-6.
11. Werner RM, Konetzka RT. Trends in post-acute care use among Medicare beneficiaries: 2000 to 2015. JAMA. 2018;319(15):1616-1617.
12. Accreditation Review Commission on Education for the Physician Assistant. http://www.arc-pa.org/accreditation/accredited-programs. Accessed May 10, 2019.
The Federal Bureau of Labor Statistics projects 37% job growth for physician assistants (PAs) from 2016 to 2026, much greater than the average for all other occupations as well as for other medical professions.1 This growth has been accompanied by increased enrollment in medical (doctor of medicine [MD], doctor of osteopathic medicine) and nurse practitioner (NP) schools.2 Clinical teaching sites serve a crucial function in the training of all clinical disciplines. These sites provide hands-on and experiential learning in medical settings, necessary components for learners practicing to become clinicians. Significant PA program expansion has led to increased demand for clinical training, creating competition for sites and a shortage of willing and well-trained preceptors.3
This challenge has been recognized by PA program directors. In the Joint Report of the 2013 Multi-Discipline Clerkship/Clinical Training Site Survey, PA program directors expressed concern about the adequacy of clinical opportunities for students, increased difficulty developing new core sites, and preserving existing core sites. In addition, they noted that a shortage of clinical sites was one of the greatest barriers to the PA programs’ sustained growth and success.4
Program directors also indicated difficulty securing clinical training sites in internal medicine (IM) and high rates of attrition of medicine clinical preceptors for their students.5 The reasons are multifold: increasing clinical demands, time, teaching competence, lack of experience, academic affiliation, lack of reimbursement, or compensation. Moreover, there is a declining number of PAs who work in primary care compared with specialty and subspecialty care, limiting the availability of clinical training preceptors in medicine and primary care.6-8 According to the American Academy of PAs (AAPA) census and salary survey data, the percentage of PAs working in the primary care specialties (ie, family medicine, IM, and general pediatrics) has decreased from > 47% in 1995 to 24% in 2017.9 As such, there is a need to broaden the educational landscape to provide more high-quality training sites in IM.
The postacute health care setting may address this training need. It offers a unique clinical opportunity to expose learners to a broad range of disease complexity and clinical acuity, as the percentage of patients discharged from hospitals to postacute care (PAC) has increased and care shifts from the hospital to the PAC setting.10,11 The longer PAC length of stay also enables learners to follow patients longitudinally over several weeks and experience interprofessional team-based care. In addition, the PAC setting offers learners the ability to acquire the necessary skills for smooth and effective transitions of care. This setting has been extensively used for trainees of nursing, pharmacy, physical therapy (PT) and occupational therapy (OT), speech-language pathology, psychology, and social work (SW), but few programs have used the PAC setting as clerkship sites for IM rotations for PA students. To address this need for IM sites, the VA Boston Healthcare System (VABHS), in conjunction with the Boston University School of Medicine Physician Assistant Program, developed a novel medicine clinical clerkship site for physician assistants in the PAC unit of the community living center (CLC) at VABHS. This report describes the program structure, curriculum, and participant evaluation results.
Clinical Clerkship Program
VABHS CLC is a 110-bed facility comprising 3 units: a 65-bed PAC unit, a 15-bed closed hospice/palliative care unit, and a 30-bed long-term care unit. The service is staffed continuously with physicians, PAs, and NPs. A majority of patients are admitted from the acute care hospital of VABHS (West Roxbury campus) and other regional VA facilities. The CLC offers dynamic services, including phlebotomy, general radiology, IV diuretics and antibiotics, wound care, and subacute PT, OT, and speech-language pathology rehabilitation. The CLC serves as a venue for transitioning patients from acute inpatient care to home. The patient population is often elderly, with multiple active comorbidities and variable medical literacy, adherence, and follow-up.
The CLC provides a diverse interprofessional learning environment, offering core IM rotations for first-year psychiatry residents, oral and maxillofacial surgery residents, and PA students. The CLC also has expanded as a clinical site both for transitions-in-care IM resident curricula and electives as well as a geriatrics fellowship. In addition, the site offers rotations for NPs, nursing, pharmacy, physical and occupational therapies, speech-language pathology, psychology, and SW.
The Boston University School of Medicine Physician Assistant Program was founded in 2015 as a master’s degree program completed over 28 months. The first 12 months are didactic, and the following 16 months are clinical training with 14 months of rotations (2 IM, family medicine, pediatrics, emergency medicine, general surgery, obstetrics and gynecology, psychiatry, neurology, and 5 elective rotations), and 2 months for a thesis. The program has about 30 students per year and 4 clerkship sites for IM.
Program Description
The VABHS medicine clerkship hosts 1 to 2 PA students for 4-week blocks in the PAC unit of the CLC. Each student rotates on both PA and MD teams. Students follow 3 to 4 patients and participate fully in their care from admission to discharge; they prepare daily presentations and participate in medical management, family meetings, chart documentation, and care coordination with the interprofessional team. Students are provided a physical examination checklist and feedback form, and they are expected to track findings and record feedback and goals with their supervising preceptor weekly. They also make formal case presentations and participate in monthly medicine didactic rounds available to all VABHS IM students and trainees via videoconference.
In addition, beginning in July 2017, all PA students in the CLC began to participate in a 4-week Interprofessional Curriculum in Transitional Care. The curriculum includes 14 didactic lectures taught by 16 interprofessional faculty, including medicine, geriatric, and palliative care physicians; PAs; social workers; physical and occupational therapists; pharmacists; and a geriatric psychologist. The didactics include topics on the interprofessional team, the care continuum, teams and teamwork, interdisciplinary coordination of care, components of effective transitions in care, medication reconciliation, approaching difficult conversations, advance care planning, and quality improvement. The goal of the curriculum is to provide learners the knowledge, skills, and dispositions necessary for high-quality transitional care and interprofessional practice as well as specific training for effective and safe transfers of care between clinical settings. Although PA students are the main participants in this curriculum, all other learners in the PAC unit are also invited to attend the lectures.
The unique attributes of this training site include direct interaction with supervising PAs and physicians, rather than experiencing the traditional teaching hierarchy (with interns, residents, fellows); observation of the natural progression of disease of both acute care and primary care issues due to the longer length of stay (2 to 6 weeks, where the typical student will see the same patient 7 to 10 times during their rotation); exposure to a host of medically complex patients offering a multitude of clinical scenarios and abnormal physical exam findings; exposure to a hospice/palliative care ward and end-of-life care; and interaction within an interprofessional training environment of nursing, pharmacy, PT, OT, speech-language pathology, psychology, and SW trainees.
Program Evaluation
At the end of rotations continuously through the year, PA students electronically complete a site evaluation from the Boston University School of Medicine Physician Assistant Program. The evaluation consists of 14 questions: 6 about site quality and 8 about instruction quality. The questions are answered on a 5-point Likert scale. Also included are 2 open-ended response questions that ask what they liked about the rotation and what they felt could be improved. Results are anonymous, de-identified and blinded both to the program as well as the clerkship site. Results are aggregated and provided to program sites annually. Responses are converted to a dichotomous variable, where any good or excellent response (4 or 5) is considered positive and any neutral or below (3, 2, 1) is considered a nonpositive response.
Results
The clerkship site has been operational since June 22, 2015. There have been 59 students who participated in the rotation. A different scale in these evaluations was used between June 22, 2015, and September 13, 2015. Therefore, 7 responses were excluded from the analysis, leaving 52 usable evaluations. The responses were analyzed both in total (for the CLC as well as other IM rotation sites) and by individual clerkship year to look for any trends over time: September 14, 2015, through April 24, 2016; April 25, 2016, through April 28, 2017; and May 1, 2017, through March 1, 2018 (Table).
Site evaluations showed high satisfaction regarding the quality of the physical environment as well as the learning environment. Students endorsed the PAC unit having resources and physical space for them, such as a desk and computer, opportunity for participation in patient care, and parking (100%; n = 52). Site evaluations revealed high satisfaction with the quality of teaching and faculty encouragement and support of their learning (100%; n = 52). The evaluations revealed that bedside teaching was strong (94%; n = 49). The students reported high satisfaction with the volume of patients provided (92%; n = 48) as well as the diversity of diagnoses (92%; n = 48).
There were fewer positive responses in the first 2 years of the rotation with regard to formal lectures (50% and 67%; 7/14 and 16/24, respectively). In the third year of the rotation, students had a much higher satisfaction rate (93%; 13/14). This increased satisfaction was associated with the development and incorporation of the Interprofessional Curriculum in Transitional Care in 2017.
Discussion
Access to high-quality PA student clerkship sites has become a pressing issue in recent years because of increased competition for sites and a shortage of willing and well-trained preceptors. There has been marked growth in schools and enrollment across all medical professions. The Accreditation Review Commission on Education for the PA (ARC-PA) reported that the total number of accredited entry-level PA programs in 2018 was 246, with 58 new accredited programs projected by 2022.12 The Joint Report of the 2013 Multi-Discipline Clerkship/Clinical Training Site Survey reported a 66% increase in first-year enrollment in PA programs from 2002 to 2012.5 Programs must implement alternative strategies to attract clinical sites (eg, academic appointments, increased clinical resources to training sites) or face continued challenges with recruiting training sites for their students. Postacute care may be a natural extension to expand the footprint for clinical sites for these programs, augmenting acute inpatient and outpatient rotations. This implementation would increase the pool of clinical training sites and preceptors.
The experience with this novel training site, based on PA student feedback and evaluations, has been positive, and the postacute setting can provide students with high-quality IM clinical experiences. Students report adequate patient volume and diversity. In addition, evaluations are comparable with that of other IM site rotations the students experience. Qualitative feedback has emphasized the value of following patients over longer periods; eg, weeks vs days (as in acute care) enabling students to build relationships with patients as well as observe a richer clinical spectrum of disease over a less compressed period. “Patients have complex issues, so from a medical standpoint it challenges you to think of new ways to manage their care,” commented a representative student. “It is really beneficial that you can follow them over time.”
Furthermore, in response to student feedback on didactics, an interprofessional curriculum was developed to add formal structure as well as to create a curriculum in care transitions. This curriculum provided a unique opportunity for PA students to receive formal instruction on areas of particular relevance for transitional care (eg, care continuum, end of life issues, and care transitions). The curriculum also allows the interprofessional faculty a unique and enjoyable opportunity for interprofessional collaboration.
The 1 month PAC rotation is augmented with inpatient IM and outpatient family medicine rotations, consequently giving exposure to the full continuum of care. The PAC setting provides learners multifaceted benefits: the opportunity to strengthen and develop the knowledge, attitudes, and skills necessary for IM; increased understanding of other professions by observing and interacting as a team caring for a patient over a longer period as opposed to the acute care setting; the ability to perform effective, efficient, and safe transfer between clinical settings; and broad exposure to transitional care. As a result, the PAC rotation enhances but does not replace the necessary and essential rotations of inpatient and outpatient medicine.
Moreover, this rotation provides unique and core IM training for PA students. Our site focuses on interprofessional collaboration, emphasizing the importance of team-based care, an essential concept in modern day medicine. Formal exposure to other care specialties, such as PT and OT, SW, and mental health, is essential for students to appreciate clinical medicine and a patient’s physical and mental experience over the course of a disease and clinical state. In addition, the physical exam checklist ensures that students are exposed to the full spectrum of IM examination findings during their rotation. Finally, weekly feedback forms require students to ask and receive concrete feedback from their supervising providers.
Limitations
The generalizability of this model requires careful consideration. VABHS is a tertiary care integrated health care system, enabling students to learn from patients moving through multiple care transitions in a single health care system. In addition, other settings may not have the staffing or clinical volume to sustain such a model. All PAC clinical faculty teach voluntarily, and local leadership has set expectations for all clinicians to participate in teaching of trainees and PA students. Evaluations also note less diversity in the patient population, a challenge that some VA facilities face. This issue could be addressed by ensuring that students also have IM rotations at other inpatient medical facilities. A more balanced experience, where students reap the positive benefits of PAC but do not lose exposure to a diverse patient pool, could result. Furthermore, some of the perceived positive impacts also may be related to professional and personal attributes of the teaching clinicians rather than to the PAC setting.
Conclusion
PAC settings can be effective training sites for medicine clerkships for PA students and can provide high-quality training in IM as PA programs continue to expand. This setting offers students exposure to interprofessional, team-based care and the opportunity to care for patients with a broad range of disease complexity. Learning is further enhanced by the ability to follow patients longitudinally over their disease course as well as to work directly with teaching faculty and other interprofessional health care professionals. Evaluations of this novel clerkship experience have shown high levels of student satisfaction in knowledge growth, clinical skills, bedside teaching, and mentorship.
Acknowledgments
We thank Juman Hijab for her critical role in establishing and maintaining the clerkship. We thank Steven Simon, Matt Russell, and Thomas Parrino for their leadership and guidance in establishing and maintaining the clerkship. We thank the Boston University School of Medicine Physician Assistant Program Director Mary Warner for her support and guidance in creating and supporting the clerkship. In addition, we thank the interprofessional education faculty for their dedicated involvement in teaching, including Stephanie Saunders, Lindsay Lefers, Jessica Rawlins, Lindsay Brennan, Angela Viani, Eric Charette, Nicole O’Neil, Susan Nathan, Jordana Meyerson, Shivani Jindal, Wei Shen, Amy Hanson, Gilda Cain, and Kate Hinrichs.
1. US Department of Labor, Bureau of Labor Statistics. Occupational outlook handbook: physician assistants. https://www.bls.gov/ooh/healthcare/physician-assistants.htm. Updated June 18, 2019. Accessed August 13, 2019.
2. Association of American Medical Colleges. 2019 update: the complexities of physician supply and demand: projections from 2017 to 2032. https://aamc-black.global.ssl.fastly.net/production/media/filer_public/31/13/3113ee5c-a038-4c16-89af-294a69826650/2019_update_-_the_complexities_of_physician_supply_and_demand_-_projections_from_2017-2032.pdf. Published April 2019. Accessed August 15, 2019.
3. Glicken AD, Miller AA. Physician assistants: from pipeline to practice. Acad Med. 2013;88(12):1883-1889.
4. Erikson C, Hamann R, Levitan T, Pankow S, Stanley J, Whatley M. Recruiting and maintaining US clinical training sites: joint report of the 2013 multi-discipline clerkship/clinical training site survey. https://paeaonline.org/wp-content/uploads/2015/10/Recruiting-and-Maintaining-U.S.-Clinical-Training-Sites.pdf. Accessed August 13, 2019.
5. Physician Assistant Education Association. By the numbers: 30th annual report on physician assistant educational programs. 2015. http://paeaonline.org/wp-content/uploads/2016/12/2015-by-the-numbers-program-report-30.pdf. Published 2015. Accessed August 15, 2019.
6. Morgan P, Himmerick KA, Leach B, Dieter P, Everett C. Scarcity of primary care positions may divert physician assistants into specialty practice. Med Care Res Rev. 2017;74(1):109-122.
7. Coplan B, Cawley J, Stoehr J. Physician assistants in primary care: trends and characteristics. Ann Fam Med. 2013;11(1):75-79.
8. Morgan P, Leach B, Himmerick K, Everett C. Job openings for PAs by specialty. JAAPA. 2018;31(1):45-47.
9. American Academy of Physician Assistants. 2017 AAPA Salary Report. Alexandria, VA; 2017.
10. Barnett ML, Grabowski DC, Mehrotra A. Home-to-home time—measuring what matters to patients and payers. N Engl J Med. 2017;377(1):4-6.
11. Werner RM, Konetzka RT. Trends in post-acute care use among Medicare beneficiaries: 2000 to 2015. JAMA. 2018;319(15):1616-1617.
12. Accreditation Review Commission on Education for the Physician Assistant. http://www.arc-pa.org/accreditation/accredited-programs. Accessed May 10, 2019.
Reframing Clinician Distress: Moral Injury Not Burnout
*This version has been corrected. In the original version the first sentence incorrectly referred to moral injury instead of burnout.
For more than a decade, the term burnout has been used to describe clinician distress.1,2 Although some clinicians in federal health care systems may be protected from some of the drivers of burnout, other federal practitioners suffer from rule-driven health care practices and distant, top-down administration. The demand for health care is expanding, driven by the aging of the US population.3 Massive information technology investments, which promised efficiency for health care providers,4 have instead delivered a triple blow: They have diverted capital resources that might have been used to hire additional caregivers,5 diverted the time and attention of those already engaged in patient care,6 and done little to improve patient outcomes.7 Reimbursements are falling, and the only way for health systems to maintain their revenue is to increase the number of patients each clinician sees per day.8 As the resources of time and attention shrink, and as spending continues with no improvement in patient outcomes, clinician distress is on the rise.9 It will be important to understand exactly what the drivers of the problem are for federal clinicians so that solutions can be appropriately targeted. The first step in addressing the epidemic of physician distress is using the most accurate terminology to describe it.
Freudenberger defined burnout in 1975 as a constellation of symptoms—malaise, fatigue, frustration, cynicism, and inefficacy—that arise from “making excessive demands on energy, strength, or resources” in the workplace.10 The term was borrowed from other fields and applied to health care in the hopes of readily transferring the solutions that had worked in other industries to address a growing crisis among physicians. Unfortunately, the crisis in health care has proven resistant to solutions that have worked elsewhere, and many clinicians have resisted being characterized as burned out, citing a subtle, elusive disconnect between what they have experienced and what burnout encapsulates.
In July 2018, the conversation about clinician distress shifted with an article we wrote in STAT that described the moral injury of health care.11 The concept of moral injury was first described in service members who returned from the Vietnam War with symptoms that loosely fit a diagnosis of posttraumatic stress disorder (PTSD), but which did not respond to standard PTSD treatment and contained symptoms outside the PTSD constellation.12 On closer assessment, what these service members were experiencing had a different driver. Whereas those with PTSD experienced a real and imminent threat to their mortality and had come back deeply concerned for their individual, physical safety, those with this different presentation experienced repeated insults to their morality and had returned questioning whether they were still, at their core, moral beings. They had been forced, in some way, to act contrary to what their beliefs dictated was right by killing civilians on orders from their superiors, for example. This was a different category of psychological injury that required different treatment.
Moral injury occurs when we perpetrate, bear witness to, or fail to prevent an act that transgresses our deeply held moral beliefs. In the health care context, that deeply held moral belief is the oath each of us took when embarking on our paths as health care providers: Put the needs of patients first. That oath is the lynchpin of our working lives and our guiding principle when searching for the right course of action. But as clinicians, we are increasingly forced to consider the demands of other stakeholders—the electronic medical record (EMR), the insurers, the hospital, the health care system, even our own financial security—before the needs of our patients. Every time we are forced to make a decision that contravenes our patients’ best interests, we feel a sting of moral injustice. Over time, these repetitive insults amass into moral injury.
The difference between burnout and moral injury is important because using different terminology reframes the problem and the solutions. Burnout suggests that the problem resides within the individual, who is in some way deficient. It implies that the individual lacks the resources or resilience to withstand the work environment. Since the problem is in the individual, the solutions to burnout must be in the individual, too, and therefore, it is the individual’s responsibility to find and implement them. Many of the solutions to physician distress posited to date revolve around this conception; hence, the focus on yoga, mindfulness, wellness retreats, and meditation.13 While there is nothing inherently wrong with any of those practices, it is absurd to believe that yoga will solve the problems of treating a cancer patient with a declined preauthorization for chemotherapy, having no time to discuss a complex diagnosis, or relying on a computer system that places metrics ahead of communication. These problems are not the result of some failing on the part of the individual clinician.
Moral injury, on the other hand, describes the challenge of simultaneously knowing what care patients need but being unable to provide it due to constraints that are beyond our control. Moral injury is the consequence of the ever-present double binds in health care: Do we take care of our patient, the hospital, the insurer, the EMR, the health care system, or our productivity metrics first? There should be only 1 answer to that question, but the current business framework of medicine pressures us to serve all these masters at once. Moral injury locates the source of distress in a broken system, not a broken individual, and allows us to direct solutions at the causes of distress. And in the end, addressing the drivers of moral injury on a large scale may be the most effective preventive treatment for its cumulative effects among health care providers.
The long-term solutions to moral injury demand changes in the business framework of health care. The solutions reside not in promoting mindfulness or resilience among individual physicians, but in creating a health care environment that finally acknowledges the value of the time clinicians and patients spend together developing the trust, understanding, and compassion that accompany a true relationship. The long-term solutions to moral injury include a health care system that prioritizes healing over profit and that trusts its clinicians to always put their patients’ best interests first.
Treating moral injury will not be simple. It cannot happen quickly, and it will not happen without widespread clinician engagement. Change can begin when clinicians identify the double binds they face every day and convey those challenges to their administrators. If administrators and clinicians are willing to work together to resolve these double binds, health care will improve for everyone.
The following are our recommendations for how you can bring change both locally and on a broader scale.
Bring together the 2 sides of the health care house: administrators and clinicians. Invite administrators to join you on rounds, in clinic, or in the operating room. Ask them to follow you during a night of call or to spend an overnight shift with you in the emergency department. The majority of people, including health care administrators, have had only glancing encounters with the medical system. They see their primary care doctor, have regular screening procedures, and maybe get treated for a routine illness or injury. None of those encounters expose them to the depth of challenge in the system.
It takes exposure over a longer duration, or with greater intensity, to appreciate the tensions and double binds that patients and clinicians face regularly.14,15 Whether or not the administrators accept your invitation, you must also ask to see the challenges from their side. Block out an afternoon, a day, or a week to follow them and learn where they struggle in their work. Only when we understand the other party’s perspective can we truly begin to empathize and communicate meaningfully. That profound understanding is the place where commonality and compromises are found.
Make clinician satisfaction a financial priority. Although care team well-being is now part of the quadruple aim (patient experience, population health, reducing costs, and provider experience), organizations must be held accountable to ensure it is a priority. If we choose to link patient satisfaction with clinician compensation, why not link clinician satisfaction with executive compensation?
Make sure every physician leader has and uses the cell phone number of his or her legislators. Hospitals and big pharma have nearly bottomless lobbying budgets, which makes competing with them for lawmakers’ attention a formidable prospect. Despite this, physician leaders (ie, chief wellness officer, department chairperson, medical society president, etc) have a responsibility to communicate with legislators about the needs of patients (their constituents) and what role our legislators can play in fulfilling those needs. We must understand how policy, regulation, and legislation work, and we need to find seats at every table where the decisions that impact clinical care are made. The first step is opening lines of communication with those who have the power to enact large-scale change.
Reestablish a sense of community among clinicians. Too often clinicians are pitted against one another as resources shrink. Doctors compete with each other for referrals, advanced practitioners and nurses compete with doctors, and everyone feels overstressed. What we tend to forget is that we are all working toward the same goal: To give patients the best care possible. It’s time to view each other with the presumption of charity and to have each other’s backs. Uniting for support, camaraderie, mentorship, and activism is a necessary step in making change.
1 . West CP, Dyrbye LN, Sloan JA, Shanafelt TD. Single item measures of emotional exhaustion and depersonalization are useful for assessing burnout in medical professionals. J Gen Intern Med. 2009;24(12):1318-1321.
2. Shanafelt TD, Noseworthy JH. Executive leadership and physician well-being: nine organizational strategies to promote engagement and reduce burnout. Mayo Clin Proc. 2017;92(1):129-146.
3. Institute of Medicine (US) National Cancer Policy Forum. Ensuring Quality Cancer Care through the Oncology Workforce: Sustaining Care in the 21st Century: Workshop Summary. Washington, DC: National Academies Press; 2009.
4. Menachemi N, Collum TH. Benefits and drawbacks of electronic health record systems. Risk Manag Healthc Policy. 2011;4:47-55.
5. Palabindala V, Pamarthy A, Jonnalagadda NR. Adoption of electronic health records and barriers. J Community Hosp Intern Med Perspect. 2016;6(5):32643.
6. Zeng X. The impacts of electronic health record implementation on the health care workforce. N C Med J. 2016;77(2):112-114.
7. Squires D. U.S. health care from a global perspective: spending, use of services, prices, and health in 13 countries. https://www.commonwealthfund.org/publications/issue-briefs/2015/oct/us-health-care-global-perspective. Published October 8, 2015. Accessed August 19, 2019.
8. Fifer R. Health care economics: the real source of reimbursement problems. https://www.asha.org/Articles/Health-Care-Economics-The-Real-Source-of-Reimbursement-Problems/. Published July 2016. Accessed August 19, 2019.
9. Jha AK, Iliff AR, Chaoui AA, Defossez S, Bombaugh MC, Miller YR. A crisis in health care: a call to action on physician burnout. http://www.massmed.org/News-and-Publications/MMS-News-Releases/Physician-Burnout-Report-2018/. Published March 28, 2019. Accessed August 19, 2019.
10. Freudenberger HJ. The staff burn-out syndrome in alternative institutions. Psychother Theory Res Pract. 1975;12(1):73-82.
11. Dean W, Talbot S. Physicians aren’t “burning out.” They’re suffering from moral injury. STAT . July 26, 2018. https://www.statnews.com/2018/07/26/physicians-not-burning-out-they-are-suffering-moral-injury/. Accessed August 19, 2019.
12. Shay J. Moral injury. Psychoanal Psych. 2014;31(2):182-191.
13. Sinsky C, Shanafelt TD, Murphy ML, et al. Creating the organizational foundation for joy in medicine: organizational changes lead to physician satisfaction. https://edhub.ama-assn.org/steps-forward/module/2702510. Published September 7, 2017. Accessed August 19, 2019.
14. Golshan Ma. When a cancer surgeon becomes a cancer patient. https://elemental.medium.com/when-a-cancer-surgeon-becomes-a-cancer-patient-3b9d984066da. Published June 25, 2019. Accessed August 19, 2019.
15. Joseph S, Japa S. We were inspired to become primary care physicians. Now we’re reconsidering a field in crisis. STAT . June 20, 2019. https://www.statnews.com/2019/06/20/primary-care-field-crisis/. Accessed August 19, 2019.
*This version has been corrected. In the original version the first sentence incorrectly referred to moral injury instead of burnout.
For more than a decade, the term burnout has been used to describe clinician distress.1,2 Although some clinicians in federal health care systems may be protected from some of the drivers of burnout, other federal practitioners suffer from rule-driven health care practices and distant, top-down administration. The demand for health care is expanding, driven by the aging of the US population.3 Massive information technology investments, which promised efficiency for health care providers,4 have instead delivered a triple blow: They have diverted capital resources that might have been used to hire additional caregivers,5 diverted the time and attention of those already engaged in patient care,6 and done little to improve patient outcomes.7 Reimbursements are falling, and the only way for health systems to maintain their revenue is to increase the number of patients each clinician sees per day.8 As the resources of time and attention shrink, and as spending continues with no improvement in patient outcomes, clinician distress is on the rise.9 It will be important to understand exactly what the drivers of the problem are for federal clinicians so that solutions can be appropriately targeted. The first step in addressing the epidemic of physician distress is using the most accurate terminology to describe it.
Freudenberger defined burnout in 1975 as a constellation of symptoms—malaise, fatigue, frustration, cynicism, and inefficacy—that arise from “making excessive demands on energy, strength, or resources” in the workplace.10 The term was borrowed from other fields and applied to health care in the hopes of readily transferring the solutions that had worked in other industries to address a growing crisis among physicians. Unfortunately, the crisis in health care has proven resistant to solutions that have worked elsewhere, and many clinicians have resisted being characterized as burned out, citing a subtle, elusive disconnect between what they have experienced and what burnout encapsulates.
In July 2018, the conversation about clinician distress shifted with an article we wrote in STAT that described the moral injury of health care.11 The concept of moral injury was first described in service members who returned from the Vietnam War with symptoms that loosely fit a diagnosis of posttraumatic stress disorder (PTSD), but which did not respond to standard PTSD treatment and contained symptoms outside the PTSD constellation.12 On closer assessment, what these service members were experiencing had a different driver. Whereas those with PTSD experienced a real and imminent threat to their mortality and had come back deeply concerned for their individual, physical safety, those with this different presentation experienced repeated insults to their morality and had returned questioning whether they were still, at their core, moral beings. They had been forced, in some way, to act contrary to what their beliefs dictated was right by killing civilians on orders from their superiors, for example. This was a different category of psychological injury that required different treatment.
Moral injury occurs when we perpetrate, bear witness to, or fail to prevent an act that transgresses our deeply held moral beliefs. In the health care context, that deeply held moral belief is the oath each of us took when embarking on our paths as health care providers: Put the needs of patients first. That oath is the lynchpin of our working lives and our guiding principle when searching for the right course of action. But as clinicians, we are increasingly forced to consider the demands of other stakeholders—the electronic medical record (EMR), the insurers, the hospital, the health care system, even our own financial security—before the needs of our patients. Every time we are forced to make a decision that contravenes our patients’ best interests, we feel a sting of moral injustice. Over time, these repetitive insults amass into moral injury.
The difference between burnout and moral injury is important because using different terminology reframes the problem and the solutions. Burnout suggests that the problem resides within the individual, who is in some way deficient. It implies that the individual lacks the resources or resilience to withstand the work environment. Since the problem is in the individual, the solutions to burnout must be in the individual, too, and therefore, it is the individual’s responsibility to find and implement them. Many of the solutions to physician distress posited to date revolve around this conception; hence, the focus on yoga, mindfulness, wellness retreats, and meditation.13 While there is nothing inherently wrong with any of those practices, it is absurd to believe that yoga will solve the problems of treating a cancer patient with a declined preauthorization for chemotherapy, having no time to discuss a complex diagnosis, or relying on a computer system that places metrics ahead of communication. These problems are not the result of some failing on the part of the individual clinician.
Moral injury, on the other hand, describes the challenge of simultaneously knowing what care patients need but being unable to provide it due to constraints that are beyond our control. Moral injury is the consequence of the ever-present double binds in health care: Do we take care of our patient, the hospital, the insurer, the EMR, the health care system, or our productivity metrics first? There should be only 1 answer to that question, but the current business framework of medicine pressures us to serve all these masters at once. Moral injury locates the source of distress in a broken system, not a broken individual, and allows us to direct solutions at the causes of distress. And in the end, addressing the drivers of moral injury on a large scale may be the most effective preventive treatment for its cumulative effects among health care providers.
The long-term solutions to moral injury demand changes in the business framework of health care. The solutions reside not in promoting mindfulness or resilience among individual physicians, but in creating a health care environment that finally acknowledges the value of the time clinicians and patients spend together developing the trust, understanding, and compassion that accompany a true relationship. The long-term solutions to moral injury include a health care system that prioritizes healing over profit and that trusts its clinicians to always put their patients’ best interests first.
Treating moral injury will not be simple. It cannot happen quickly, and it will not happen without widespread clinician engagement. Change can begin when clinicians identify the double binds they face every day and convey those challenges to their administrators. If administrators and clinicians are willing to work together to resolve these double binds, health care will improve for everyone.
The following are our recommendations for how you can bring change both locally and on a broader scale.
Bring together the 2 sides of the health care house: administrators and clinicians. Invite administrators to join you on rounds, in clinic, or in the operating room. Ask them to follow you during a night of call or to spend an overnight shift with you in the emergency department. The majority of people, including health care administrators, have had only glancing encounters with the medical system. They see their primary care doctor, have regular screening procedures, and maybe get treated for a routine illness or injury. None of those encounters expose them to the depth of challenge in the system.
It takes exposure over a longer duration, or with greater intensity, to appreciate the tensions and double binds that patients and clinicians face regularly.14,15 Whether or not the administrators accept your invitation, you must also ask to see the challenges from their side. Block out an afternoon, a day, or a week to follow them and learn where they struggle in their work. Only when we understand the other party’s perspective can we truly begin to empathize and communicate meaningfully. That profound understanding is the place where commonality and compromises are found.
Make clinician satisfaction a financial priority. Although care team well-being is now part of the quadruple aim (patient experience, population health, reducing costs, and provider experience), organizations must be held accountable to ensure it is a priority. If we choose to link patient satisfaction with clinician compensation, why not link clinician satisfaction with executive compensation?
Make sure every physician leader has and uses the cell phone number of his or her legislators. Hospitals and big pharma have nearly bottomless lobbying budgets, which makes competing with them for lawmakers’ attention a formidable prospect. Despite this, physician leaders (ie, chief wellness officer, department chairperson, medical society president, etc) have a responsibility to communicate with legislators about the needs of patients (their constituents) and what role our legislators can play in fulfilling those needs. We must understand how policy, regulation, and legislation work, and we need to find seats at every table where the decisions that impact clinical care are made. The first step is opening lines of communication with those who have the power to enact large-scale change.
Reestablish a sense of community among clinicians. Too often clinicians are pitted against one another as resources shrink. Doctors compete with each other for referrals, advanced practitioners and nurses compete with doctors, and everyone feels overstressed. What we tend to forget is that we are all working toward the same goal: To give patients the best care possible. It’s time to view each other with the presumption of charity and to have each other’s backs. Uniting for support, camaraderie, mentorship, and activism is a necessary step in making change.
1 . West CP, Dyrbye LN, Sloan JA, Shanafelt TD. Single item measures of emotional exhaustion and depersonalization are useful for assessing burnout in medical professionals. J Gen Intern Med. 2009;24(12):1318-1321.
2. Shanafelt TD, Noseworthy JH. Executive leadership and physician well-being: nine organizational strategies to promote engagement and reduce burnout. Mayo Clin Proc. 2017;92(1):129-146.
3. Institute of Medicine (US) National Cancer Policy Forum. Ensuring Quality Cancer Care through the Oncology Workforce: Sustaining Care in the 21st Century: Workshop Summary. Washington, DC: National Academies Press; 2009.
4. Menachemi N, Collum TH. Benefits and drawbacks of electronic health record systems. Risk Manag Healthc Policy. 2011;4:47-55.
5. Palabindala V, Pamarthy A, Jonnalagadda NR. Adoption of electronic health records and barriers. J Community Hosp Intern Med Perspect. 2016;6(5):32643.
6. Zeng X. The impacts of electronic health record implementation on the health care workforce. N C Med J. 2016;77(2):112-114.
7. Squires D. U.S. health care from a global perspective: spending, use of services, prices, and health in 13 countries. https://www.commonwealthfund.org/publications/issue-briefs/2015/oct/us-health-care-global-perspective. Published October 8, 2015. Accessed August 19, 2019.
8. Fifer R. Health care economics: the real source of reimbursement problems. https://www.asha.org/Articles/Health-Care-Economics-The-Real-Source-of-Reimbursement-Problems/. Published July 2016. Accessed August 19, 2019.
9. Jha AK, Iliff AR, Chaoui AA, Defossez S, Bombaugh MC, Miller YR. A crisis in health care: a call to action on physician burnout. http://www.massmed.org/News-and-Publications/MMS-News-Releases/Physician-Burnout-Report-2018/. Published March 28, 2019. Accessed August 19, 2019.
10. Freudenberger HJ. The staff burn-out syndrome in alternative institutions. Psychother Theory Res Pract. 1975;12(1):73-82.
11. Dean W, Talbot S. Physicians aren’t “burning out.” They’re suffering from moral injury. STAT . July 26, 2018. https://www.statnews.com/2018/07/26/physicians-not-burning-out-they-are-suffering-moral-injury/. Accessed August 19, 2019.
12. Shay J. Moral injury. Psychoanal Psych. 2014;31(2):182-191.
13. Sinsky C, Shanafelt TD, Murphy ML, et al. Creating the organizational foundation for joy in medicine: organizational changes lead to physician satisfaction. https://edhub.ama-assn.org/steps-forward/module/2702510. Published September 7, 2017. Accessed August 19, 2019.
14. Golshan Ma. When a cancer surgeon becomes a cancer patient. https://elemental.medium.com/when-a-cancer-surgeon-becomes-a-cancer-patient-3b9d984066da. Published June 25, 2019. Accessed August 19, 2019.
15. Joseph S, Japa S. We were inspired to become primary care physicians. Now we’re reconsidering a field in crisis. STAT . June 20, 2019. https://www.statnews.com/2019/06/20/primary-care-field-crisis/. Accessed August 19, 2019.
ObGyn compensation: Strides in the gender wage gap indicate closure possible
The gender wage gap in physician compensation persists but is narrowing. According to information gleaned from self-reported compensation surveys, collected by Doximity and completed by 90,000 full-time, US-licensed physicians, while wages for men idled between 2017 and 2018, they increased for women by 2%.1 So, whereas the gender wage gap was 27.7% in 2017, it dropped to 25.2% in 2018. This translates to female physicians making $90,490 less than male counterparts in 2018 vs $105,000 less in 2017.1
Gender wage gap and geography. Metropolitan areas with the smallest gender wage gaps according to the Doximity report include Birmingham, Alabama (9%); Bridgeport, Connecticut (10%); and Seattle, Washington (15%). Areas with the largest gender wage gap include Louisville/Jefferson County, Kentucky-Indiana (40%); New Orleans, Louisiana (32%); and Austin, Texas (31%).1
Gender wage gap and specialty. Specialties with the widest gender wage gaps are pediatric pulmonology (23%), otolaryngology (22%), and urology (22%). Those with the narrowest gaps are hematology (4%), rheumatology (8%), and radiation oncology (9%).1
Interestingly, although female physicians continue to earn less than men across the board, women were the slight majority of US medical school applicants (50.9%) and matriculants (51.6%) in 2018.2
What are physicians earning?
The overall average salary for physicians in 2019 is $313,000, according to a Medscape report, and the average annual compensation for ObGyns is $303,000, up from $300,000 in 2018.3 Doximity’s figure was slightly different; it reported average annual compensation for ObGyns to be $335,000 in 2018, ranking ObGyns 20th in specialties with the highest annual compensation.1
Compensation by specialty. The specialties with the highest average annual compensation in 2018 according to the Doximity report were neurosurgery ($617K), thoracic surgery ($584K), and orthopedic surgery ($526K). Those with the lowest were pediatric infectious disease ($186K), pediatric endocrinology ($201K), and general pediatrics ($223K).1
While women make up 61% of the ObGyn workforce, fewer than 15% of cardiologists, urologists, and orthopedists—some of the highest paying specialties—are women, although this alone does not explain the gender wage gap.3
Compensation by employment type. While average annual compensation increased from 2017 to 2018 for physicians working in single specialty groups (1%), multispecialty groups (1%), solo practices (3%), and industry/pharmaceutical (17%), compensation decreased for those working in health maintenance organizations (-1%), hospitals (-7%), and academia (-9%).1 Only 14% of private practices are owned by female physicians (TABLE 1).1
Satisfaction with compensation. Exactly half (50%) of ObGyns report feeling fairly compensated.3 Those physicians working in public health and preventive medicine are the most likely to feel fairly compensated (73%), while those working in infectious disease are least likely (42%).3
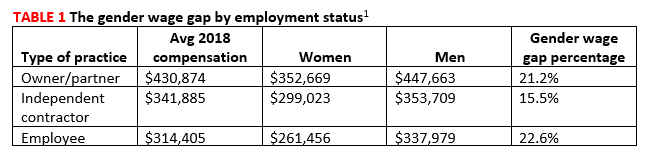
Location matters and may surprise you
Contrary to what many believe, less populated metropolitan areas tend to pay better than larger, more populated cities.1 This may be because metropolitan areas without academic institutions or nationally renowned health systems tend to offer slightly higher compensation than those with such facilities. The reason? The presence of large or prestigious medical schools ensures a pipeline of viable physician candidates for limited jobs, resulting in institutions and practices needing to pay less for qualified applicants.1
The 5 markets paying the highest physician salaries in 2018 were (from highest to lowest) Milwaukee; New Orleans; Riverside, California; Minneapolis; and Charlotte, North Carolina. Those paying the lowest were Durham, North Carolina; Providence, Rhode Island; San Antonio; Virginia Beach; and New Haven, Connecticut.1 Rural areas continue to have problems luring physicians (see “Cures for the famine of rural physicians?”3,4).
Job satisfaction
ObGyns rank 16th in terms of specialists who are happiest at work; 27% responded that they were very or extremely happy. Plastic surgeons ranked first in happiness on the job (41%), while those in physical medicine and rehabilitation ranked last (19%).5
Physicians as a whole report that the most rewarding part of the job is the gratitude from and relationships with patients, followed by “being good at a what I do”/finding answers/diagnoses, and “knowing that I’m making the world a better place.”3 Three-quarters (74%) of ObGyns would choose medicine again, and 75% would choose the same specialty. Those most likely to choose medicine again are those in infectious disease (84%), while those least likely work in physical medicine and rehabilitation (62%). Those most satisfied with their chosen specialty are ophthalmologists; 96% would choose the specialty again, whereas only 62% of internists would do so.3
Burnout. In a Medscape survey of 15,000 physicians in 29 specialties, 45% of ObGyns reported being burned out.5 Another 15% reported being “colloquially” depressed (sad, despondent, but not clinically depressed), and 7% reported clinical depression. While physicians overall most frequently engage in exercise as a coping mechanism, ObGyns most frequently report isolating themselves from others (47%)(TABLE 2).6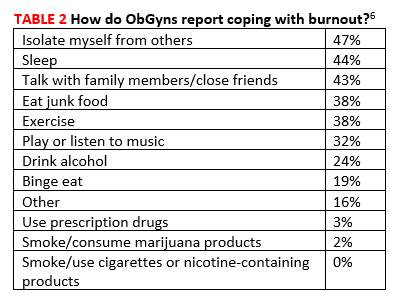
Across all specialties, more female physicians report being burned out than men (50% vs 39%). The 3 highest contributors to burnout are too many bureaucratic tasks (charting, paperwork), spending too many hours at work/insufficient compensation, and the increasing computerization of practices (electronic health records [EHRs])(TABLE 3).6 While 44% of ObGyns report that their feelings of being burned out or depressed do not affect their interactions with patients, 39% say such feelings make them easily exasperated with their patients.6 One in five (20%) responding ObGyns reported having had thoughts of suicide (vs 14% for physicians as a whole).5,6
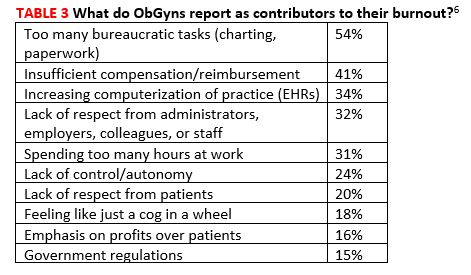
Fortunately, ObGyns are the third most likely type of specialists to seek help for burnout or depression (37%), following psychiatrists (45%) and public health and preventive medicine specialists (45%).6 Those least likely to seek help are allergists/immunologists (13%).5
Sources of frustration on the job
Long hours. Physicians responding to the Medscape survey say that the most frustrating part of their job is having so many rules and regulations, followed by having to work with an EHR, and having to work long hours.3
As for the latter, 60% of responding ObGyns reported working long hours, which places obstetrics/gynecology in the 11th position on a list of specialties with physicians reporting working too many hours.5 Surgeons were number 1 with 77% reporting working long hours, and emergency medicine physicians were last with only 13% reporting working long hours.
Paper and administrative tasks. Thirty-eight percent of the physicians responding to the Medscape survey report spending 10 to 19 hours per week on paperwork; another 36% report spending 20 hours or more.3 This is almost identical to last year when the figures were 38% and 32%, respectively. However, the trend in the last few years has been dramatic. In 2017, the total percentage of physicians spending 10 of more hours on paperwork per week was 57%, compared with this year’s 74%.3
According to the latest Medscape report, 50% of responding physicians employ nurse practitioners (NPs) and 36% employ physician assistants (PAs); 38% employ neither. Almost half (47%) of respondents report increased profitability as a result of employing NPs/PAs.1
NPs and PAs may be increasingly important in rural America, suggests Skinner and colleagues in an article in New England Journal of Medicine.2,3 They report that the total number of rural physicians grew only 3% between 2000 and 2017 (from 61,000 to 62,700) and that the number of physicians under 50 years of age living in rural areas decreased by 25% during the same time period (from 39,200 to 29,600). As a result, the rural physician workforce is aging. In 2017, only about 25% of rural physicians were under the age of 50 years. Without a sizeable influx of younger physicians, the size of the rural physician workforce will decrease by 23% by 2030, as all of the current rural physicians retire.
To help offset the difference, the authors suggest that the rapidly growing NP workforce is poised to help. NPs provide cost-effective, high-quality care, and many more go into primary care in rural areas than do physicians. The authors suggest that sites training primary care clinicians, particularly those in or near rural areas, should work with programs educating NPs to develop ways to make it conducive for rural NPs to consult with physicians and other rural health specialists, and, in this way, help to stave off the coming dearth of physicians in rural America.
In addition to utilizing an NP workforce, Skinner and colleagues suggest that further strategies will be needed to address the rural physician shortfall and greater patient workload. Although certain actions instituted in the past have been helpful, including physician loan repayment, expansion of the national health service corps, medical school grants, and funding of rural teaching clinics, they have not done enough to address the growing needs of rural patient populations. The authors additionally suggest2:
- expansion of graduate medical education programs in rural hospitals
- higher payments for physicians in rural areas
- expanding use of mobile health vans equipped with diagnostic and treatment technology
- overcoming barriers that have slowed adoption of telehealth services.
References
- Kane L. Medscape physician compensation report 2019. Color/Word_R0_G0_B255https://www.medscape.com/slideshow/2019-compensation-overview-6011286#30. Accessed August 19, 2019.
- Skinner L, Staiger DO, Auerbach DI, Buerhaus PI. Implications of an aging rural physician workforce. N Engl J Med. 2019;381(4):299-300. https://www.nejm.org/doi/pdf/10.1056/NEJMp1900808?articleTools=true. Accessed August 19, 2019.
- Morr M. Nurse practitioners may alleviate dwindling physician workforce in rural populations. Clinical Advisor.
- Doximity. 2019 Physician Compensation Report. Third annual study. https://s3.amazonaws.com/s3.doximity.com/press/doximity_third_annual_physician_compensation_report_round4.pdf Color/Word_R0_G0_B255 March 2019. Accessed August 19, 2019.
- Association of American Medical Colleges (AAMC). Women were majority of US medical school applicants in 2018. Press release, December 4, 2018. Color/Word_R0_G0_B255https://news.aamc.org/press-releases/article/applicant-data-2018/. Accessed August 19, 2019.
- Kane L. Medscape physician compensation report 2019. Color/Word_R0_G0_B255https://www.medscape.com/slideshow/2019-compensation-overview-6011286#30. Accessed August 19, 2019.
- Skinner L, Staiger DO, Auerbach DI, et al. Implications of an aging rural physician workforce. N Engl J Med. 2019;381:299-300. https://www.nejm.org/doi/pdf/10.1056/NEJMp1900808?articleTools=true. Accessed August 19, 2019.
- Kane L. Medscape national physician burnout, depression and suicide report 2019. January 16, 2019. https://www.medscape.com/slideshow/2019-lifestyle-burnout-depression-6011056. Accessed August 19, 2019.
- Kane L. Medscape obstetrician and gynecologist lifestyle, happiness and burnout report 2019. February 20, 2019. https://www.medscape.com/slideshow/2019-lifestyle-obgyn-6011131Color/Word_R0_G0_B255. Accessed August 20, 2019.
The gender wage gap in physician compensation persists but is narrowing. According to information gleaned from self-reported compensation surveys, collected by Doximity and completed by 90,000 full-time, US-licensed physicians, while wages for men idled between 2017 and 2018, they increased for women by 2%.1 So, whereas the gender wage gap was 27.7% in 2017, it dropped to 25.2% in 2018. This translates to female physicians making $90,490 less than male counterparts in 2018 vs $105,000 less in 2017.1
Gender wage gap and geography. Metropolitan areas with the smallest gender wage gaps according to the Doximity report include Birmingham, Alabama (9%); Bridgeport, Connecticut (10%); and Seattle, Washington (15%). Areas with the largest gender wage gap include Louisville/Jefferson County, Kentucky-Indiana (40%); New Orleans, Louisiana (32%); and Austin, Texas (31%).1
Gender wage gap and specialty. Specialties with the widest gender wage gaps are pediatric pulmonology (23%), otolaryngology (22%), and urology (22%). Those with the narrowest gaps are hematology (4%), rheumatology (8%), and radiation oncology (9%).1
Interestingly, although female physicians continue to earn less than men across the board, women were the slight majority of US medical school applicants (50.9%) and matriculants (51.6%) in 2018.2
What are physicians earning?
The overall average salary for physicians in 2019 is $313,000, according to a Medscape report, and the average annual compensation for ObGyns is $303,000, up from $300,000 in 2018.3 Doximity’s figure was slightly different; it reported average annual compensation for ObGyns to be $335,000 in 2018, ranking ObGyns 20th in specialties with the highest annual compensation.1
Compensation by specialty. The specialties with the highest average annual compensation in 2018 according to the Doximity report were neurosurgery ($617K), thoracic surgery ($584K), and orthopedic surgery ($526K). Those with the lowest were pediatric infectious disease ($186K), pediatric endocrinology ($201K), and general pediatrics ($223K).1
While women make up 61% of the ObGyn workforce, fewer than 15% of cardiologists, urologists, and orthopedists—some of the highest paying specialties—are women, although this alone does not explain the gender wage gap.3
Compensation by employment type. While average annual compensation increased from 2017 to 2018 for physicians working in single specialty groups (1%), multispecialty groups (1%), solo practices (3%), and industry/pharmaceutical (17%), compensation decreased for those working in health maintenance organizations (-1%), hospitals (-7%), and academia (-9%).1 Only 14% of private practices are owned by female physicians (TABLE 1).1
Satisfaction with compensation. Exactly half (50%) of ObGyns report feeling fairly compensated.3 Those physicians working in public health and preventive medicine are the most likely to feel fairly compensated (73%), while those working in infectious disease are least likely (42%).3
Location matters and may surprise you
Contrary to what many believe, less populated metropolitan areas tend to pay better than larger, more populated cities.1 This may be because metropolitan areas without academic institutions or nationally renowned health systems tend to offer slightly higher compensation than those with such facilities. The reason? The presence of large or prestigious medical schools ensures a pipeline of viable physician candidates for limited jobs, resulting in institutions and practices needing to pay less for qualified applicants.1
The 5 markets paying the highest physician salaries in 2018 were (from highest to lowest) Milwaukee; New Orleans; Riverside, California; Minneapolis; and Charlotte, North Carolina. Those paying the lowest were Durham, North Carolina; Providence, Rhode Island; San Antonio; Virginia Beach; and New Haven, Connecticut.1 Rural areas continue to have problems luring physicians (see “Cures for the famine of rural physicians?”3,4).
Job satisfaction
ObGyns rank 16th in terms of specialists who are happiest at work; 27% responded that they were very or extremely happy. Plastic surgeons ranked first in happiness on the job (41%), while those in physical medicine and rehabilitation ranked last (19%).5
Physicians as a whole report that the most rewarding part of the job is the gratitude from and relationships with patients, followed by “being good at a what I do”/finding answers/diagnoses, and “knowing that I’m making the world a better place.”3 Three-quarters (74%) of ObGyns would choose medicine again, and 75% would choose the same specialty. Those most likely to choose medicine again are those in infectious disease (84%), while those least likely work in physical medicine and rehabilitation (62%). Those most satisfied with their chosen specialty are ophthalmologists; 96% would choose the specialty again, whereas only 62% of internists would do so.3
Burnout. In a Medscape survey of 15,000 physicians in 29 specialties, 45% of ObGyns reported being burned out.5 Another 15% reported being “colloquially” depressed (sad, despondent, but not clinically depressed), and 7% reported clinical depression. While physicians overall most frequently engage in exercise as a coping mechanism, ObGyns most frequently report isolating themselves from others (47%)(TABLE 2).6
Across all specialties, more female physicians report being burned out than men (50% vs 39%). The 3 highest contributors to burnout are too many bureaucratic tasks (charting, paperwork), spending too many hours at work/insufficient compensation, and the increasing computerization of practices (electronic health records [EHRs])(TABLE 3).6 While 44% of ObGyns report that their feelings of being burned out or depressed do not affect their interactions with patients, 39% say such feelings make them easily exasperated with their patients.6 One in five (20%) responding ObGyns reported having had thoughts of suicide (vs 14% for physicians as a whole).5,6
Fortunately, ObGyns are the third most likely type of specialists to seek help for burnout or depression (37%), following psychiatrists (45%) and public health and preventive medicine specialists (45%).6 Those least likely to seek help are allergists/immunologists (13%).5
Sources of frustration on the job
Long hours. Physicians responding to the Medscape survey say that the most frustrating part of their job is having so many rules and regulations, followed by having to work with an EHR, and having to work long hours.3
As for the latter, 60% of responding ObGyns reported working long hours, which places obstetrics/gynecology in the 11th position on a list of specialties with physicians reporting working too many hours.5 Surgeons were number 1 with 77% reporting working long hours, and emergency medicine physicians were last with only 13% reporting working long hours.
Paper and administrative tasks. Thirty-eight percent of the physicians responding to the Medscape survey report spending 10 to 19 hours per week on paperwork; another 36% report spending 20 hours or more.3 This is almost identical to last year when the figures were 38% and 32%, respectively. However, the trend in the last few years has been dramatic. In 2017, the total percentage of physicians spending 10 of more hours on paperwork per week was 57%, compared with this year’s 74%.3
According to the latest Medscape report, 50% of responding physicians employ nurse practitioners (NPs) and 36% employ physician assistants (PAs); 38% employ neither. Almost half (47%) of respondents report increased profitability as a result of employing NPs/PAs.1
NPs and PAs may be increasingly important in rural America, suggests Skinner and colleagues in an article in New England Journal of Medicine.2,3 They report that the total number of rural physicians grew only 3% between 2000 and 2017 (from 61,000 to 62,700) and that the number of physicians under 50 years of age living in rural areas decreased by 25% during the same time period (from 39,200 to 29,600). As a result, the rural physician workforce is aging. In 2017, only about 25% of rural physicians were under the age of 50 years. Without a sizeable influx of younger physicians, the size of the rural physician workforce will decrease by 23% by 2030, as all of the current rural physicians retire.
To help offset the difference, the authors suggest that the rapidly growing NP workforce is poised to help. NPs provide cost-effective, high-quality care, and many more go into primary care in rural areas than do physicians. The authors suggest that sites training primary care clinicians, particularly those in or near rural areas, should work with programs educating NPs to develop ways to make it conducive for rural NPs to consult with physicians and other rural health specialists, and, in this way, help to stave off the coming dearth of physicians in rural America.
In addition to utilizing an NP workforce, Skinner and colleagues suggest that further strategies will be needed to address the rural physician shortfall and greater patient workload. Although certain actions instituted in the past have been helpful, including physician loan repayment, expansion of the national health service corps, medical school grants, and funding of rural teaching clinics, they have not done enough to address the growing needs of rural patient populations. The authors additionally suggest2:
- expansion of graduate medical education programs in rural hospitals
- higher payments for physicians in rural areas
- expanding use of mobile health vans equipped with diagnostic and treatment technology
- overcoming barriers that have slowed adoption of telehealth services.
References
- Kane L. Medscape physician compensation report 2019. Color/Word_R0_G0_B255https://www.medscape.com/slideshow/2019-compensation-overview-6011286#30. Accessed August 19, 2019.
- Skinner L, Staiger DO, Auerbach DI, Buerhaus PI. Implications of an aging rural physician workforce. N Engl J Med. 2019;381(4):299-300. https://www.nejm.org/doi/pdf/10.1056/NEJMp1900808?articleTools=true. Accessed August 19, 2019.
- Morr M. Nurse practitioners may alleviate dwindling physician workforce in rural populations. Clinical Advisor.
- Doximity. 2019 Physician Compensation Report. Third annual study. https://s3.amazonaws.com/s3.doximity.com/press/doximity_third_annual_physician_compensation_report_round4.pdf Color/Word_R0_G0_B255 March 2019. Accessed August 19, 2019.
- Association of American Medical Colleges (AAMC). Women were majority of US medical school applicants in 2018. Press release, December 4, 2018. Color/Word_R0_G0_B255https://news.aamc.org/press-releases/article/applicant-data-2018/. Accessed August 19, 2019.
- Kane L. Medscape physician compensation report 2019. Color/Word_R0_G0_B255https://www.medscape.com/slideshow/2019-compensation-overview-6011286#30. Accessed August 19, 2019.
- Skinner L, Staiger DO, Auerbach DI, et al. Implications of an aging rural physician workforce. N Engl J Med. 2019;381:299-300. https://www.nejm.org/doi/pdf/10.1056/NEJMp1900808?articleTools=true. Accessed August 19, 2019.
- Kane L. Medscape national physician burnout, depression and suicide report 2019. January 16, 2019. https://www.medscape.com/slideshow/2019-lifestyle-burnout-depression-6011056. Accessed August 19, 2019.
- Kane L. Medscape obstetrician and gynecologist lifestyle, happiness and burnout report 2019. February 20, 2019. https://www.medscape.com/slideshow/2019-lifestyle-obgyn-6011131Color/Word_R0_G0_B255. Accessed August 20, 2019.

Opioid Epidemic

How Do Drug Shortages Affect Dermatologists?
The frequency of drug shortages in the United States has considerably increased over the last decade, affecting different areas of health care practice.1,2 Basic products needed to care for patients in hospitals and clinics are many of the same drugs that are in short supply.3 This issue has become an ongoing public health concern that directly affects health care providers and their patients.4 In dermatology, similar to other specialties, success often is influenced by the efficacy of medications used to treat patients, and lack of appropriate medications has the potential to diminish health outcomes. Therefore, it is imperative for dermatology providers to recognize the factors that contribute to this issue, understand the effects of drug shortages on patients, and learn how they can improve stewardship of scarce resources and contribute to the solution.
Causes of Drug Shortages
Drug shortages can occur due to discontinuations, delays, or manufacturing and quality problems.5 Shortages of the most basic hospital products represent market failure.1 In such cases, a small number of manufacturers supply these products, and if a manufacturer discontinues a particular product—as in the case of lidocaine with epinephrine—a shortage results, as the current system does not have the capacity to deal with such as issue.1,6
An important playmaker affecting the market for medical supplies and drugs are group purchasing organizations (GPOs). The 4 largest GPOs in the United States account for 90% of the medical supply market.7 Although they have simplified the process for hospitals to purchase supplies by taking on the work and expense of dealing with hundreds of manufacturers, GPOs have considerable power to affect the supply chain. By allowing certain manufacturers to become the sole suppliers of products in return for premium fees, GPOs have narrowed the supply chain of key products to sometimes only 1 or 2 manufacturers.7 This practice may lead to decreased capacity of regional and national supply chains, setting up the system to eventual product shortage in scenarios of production problems or a decrease in the already limited number of manufacturers.
The US Food and Drug Administration (FDA) works closely with manufacturers to prevent or reduce the impact of drug shortages. Although the FDA recently has taken more action to address the issue, solutions such as allowing imported products and underlying or approving new suppliers are only temporary fixes.1 The root of the problem needs to be dealt with by ensuring there is a broad competitive supply chain.
Impact on Dermatologists
The nationwide shortage of lidocaine with epinephrine that occurred in 2017 is a specific example of how drug shortages affect dermatologists.6 This product is used in the typical dermatology clinic on a daily basis for biopsies. Possible solutions to decrease usage include drawing up 1.5 mL lidocaine with epinephrine instead of 3 mL and mixing readily available normal saline with lidocaine to produce a 1:200,000 mixture to yield a 0.5% concentration that still maintains good vasoconstrictor effects. Options for dermatologists who run out of lidocaine with epinephrine are to either use lidocaine without epinephrine, which disrupts optimal patient care, or to purchase 1% lidocaine with epinephrine at a much higher cost.6 A study that analyzed changes in drug pricing following shortages in the United States indicated that prices of drugs facing a shortage increased more than twice as quickly as expected between 2015 and 2016 vs those that were not in shortage, which may reflect opportunistic behaviors of drug manufacturers during shortages.8
The American Academy of Dermatology Association has created a letter and encouraged patients to notify their lawmakers about the severity of the drug shortage issue. Given the shortage of local anesthetics and their importance to the practice of dermatology, the American Academy of Dermatology Association also has created guidelines discussing local anesthetics that could be an alternative to lidocaine for office-based dermatologic surgery.9
Final Thoughts
Dermatology practitioners should be aware of current shortages impacting their practice and address the potential shortage proactively. We propose that dermatology clinics should keep an emergency reservoir of products routinely used in practice that currently are on the FDA drug shortage list, particularly lidocaine hydrochloride (with and without epinephrine) and sodium bicarbonate,10 which may diminish the negative impact a shortage may have on the high quality of health care we strive to provide. On a bigger scale, providers should be more proactive to have their voices heard and get involved with policymaking given the potential for patient harm and suboptimal care associated with drug shortages.
- Mazer-Amirshahi M, Fox ER, Zocchi MS, et al. Longitudinal trends in US shortages of sterile solutions, 2001-17. Am J Health Syst Pharm. 2018;75:1903-1908.
- Fox ER, Sweet BV, Jensen V. Drug shortages: a complex health care crisis. Mayo Clin Proc. 2014;89:361-373.
- Drug shortages roundtable: minimizing impact on patient care [published online March 15, 2018]. Am J Health Syst Pharm. 2018;75:816-820.
- Fox ER, McLaughlin MM. ASHP guidelines on managing drug product shortages. Am J Health Syst Pharm. 2018;75:1742-1750.
- Bowles SK. Drug shortages: more than just a background noise [published online February 28, 2018]. Can J Hosp Pharm. 2019;72:3-4.
- Bodie B, Brodell RT, Helms SE. Shortage of lidocaine with epinephrine: causes and solutions. J Am Acad Dermatol. 2018;79:392-393.
- Bruhn WE, Fracica EA, Makary MA. Group purchasing organizations, health care costs, and drug shortages. JAMA. 2018;320:1859-1860.
- Hernandez I, Sampathkumar S, Good CB, et al. Changes in drug pricing after drug shortages in the United States. Ann Intern Med. 2018;170:74-76.
- AADA, other specialties continue pressing FDA on drug shortages American Academy of Dermatology Association website.
https://www.aad.org/advocacy/news/news/2018/02/aada-other-specialties-continue-pressing-fda-on-drug-shortages. Published February 23, 2018. Accessed July 24, 2019. - FDA drug shortages. US Food & Drug Administration website. https://www.aad.org/advocacy/drug-pricing-and-availability/dermatologic-drug-shortages. Accessed July 24, 2019.
The frequency of drug shortages in the United States has considerably increased over the last decade, affecting different areas of health care practice.1,2 Basic products needed to care for patients in hospitals and clinics are many of the same drugs that are in short supply.3 This issue has become an ongoing public health concern that directly affects health care providers and their patients.4 In dermatology, similar to other specialties, success often is influenced by the efficacy of medications used to treat patients, and lack of appropriate medications has the potential to diminish health outcomes. Therefore, it is imperative for dermatology providers to recognize the factors that contribute to this issue, understand the effects of drug shortages on patients, and learn how they can improve stewardship of scarce resources and contribute to the solution.
Causes of Drug Shortages
Drug shortages can occur due to discontinuations, delays, or manufacturing and quality problems.5 Shortages of the most basic hospital products represent market failure.1 In such cases, a small number of manufacturers supply these products, and if a manufacturer discontinues a particular product—as in the case of lidocaine with epinephrine—a shortage results, as the current system does not have the capacity to deal with such as issue.1,6
An important playmaker affecting the market for medical supplies and drugs are group purchasing organizations (GPOs). The 4 largest GPOs in the United States account for 90% of the medical supply market.7 Although they have simplified the process for hospitals to purchase supplies by taking on the work and expense of dealing with hundreds of manufacturers, GPOs have considerable power to affect the supply chain. By allowing certain manufacturers to become the sole suppliers of products in return for premium fees, GPOs have narrowed the supply chain of key products to sometimes only 1 or 2 manufacturers.7 This practice may lead to decreased capacity of regional and national supply chains, setting up the system to eventual product shortage in scenarios of production problems or a decrease in the already limited number of manufacturers.
The US Food and Drug Administration (FDA) works closely with manufacturers to prevent or reduce the impact of drug shortages. Although the FDA recently has taken more action to address the issue, solutions such as allowing imported products and underlying or approving new suppliers are only temporary fixes.1 The root of the problem needs to be dealt with by ensuring there is a broad competitive supply chain.
Impact on Dermatologists
The nationwide shortage of lidocaine with epinephrine that occurred in 2017 is a specific example of how drug shortages affect dermatologists.6 This product is used in the typical dermatology clinic on a daily basis for biopsies. Possible solutions to decrease usage include drawing up 1.5 mL lidocaine with epinephrine instead of 3 mL and mixing readily available normal saline with lidocaine to produce a 1:200,000 mixture to yield a 0.5% concentration that still maintains good vasoconstrictor effects. Options for dermatologists who run out of lidocaine with epinephrine are to either use lidocaine without epinephrine, which disrupts optimal patient care, or to purchase 1% lidocaine with epinephrine at a much higher cost.6 A study that analyzed changes in drug pricing following shortages in the United States indicated that prices of drugs facing a shortage increased more than twice as quickly as expected between 2015 and 2016 vs those that were not in shortage, which may reflect opportunistic behaviors of drug manufacturers during shortages.8
The American Academy of Dermatology Association has created a letter and encouraged patients to notify their lawmakers about the severity of the drug shortage issue. Given the shortage of local anesthetics and their importance to the practice of dermatology, the American Academy of Dermatology Association also has created guidelines discussing local anesthetics that could be an alternative to lidocaine for office-based dermatologic surgery.9
Final Thoughts
Dermatology practitioners should be aware of current shortages impacting their practice and address the potential shortage proactively. We propose that dermatology clinics should keep an emergency reservoir of products routinely used in practice that currently are on the FDA drug shortage list, particularly lidocaine hydrochloride (with and without epinephrine) and sodium bicarbonate,10 which may diminish the negative impact a shortage may have on the high quality of health care we strive to provide. On a bigger scale, providers should be more proactive to have their voices heard and get involved with policymaking given the potential for patient harm and suboptimal care associated with drug shortages.
- Mazer-Amirshahi M, Fox ER, Zocchi MS, et al. Longitudinal trends in US shortages of sterile solutions, 2001-17. Am J Health Syst Pharm. 2018;75:1903-1908.
- Fox ER, Sweet BV, Jensen V. Drug shortages: a complex health care crisis. Mayo Clin Proc. 2014;89:361-373.
- Drug shortages roundtable: minimizing impact on patient care [published online March 15, 2018]. Am J Health Syst Pharm. 2018;75:816-820.
- Fox ER, McLaughlin MM. ASHP guidelines on managing drug product shortages. Am J Health Syst Pharm. 2018;75:1742-1750.
- Bowles SK. Drug shortages: more than just a background noise [published online February 28, 2018]. Can J Hosp Pharm. 2019;72:3-4.
- Bodie B, Brodell RT, Helms SE. Shortage of lidocaine with epinephrine: causes and solutions. J Am Acad Dermatol. 2018;79:392-393.
- Bruhn WE, Fracica EA, Makary MA. Group purchasing organizations, health care costs, and drug shortages. JAMA. 2018;320:1859-1860.
- Hernandez I, Sampathkumar S, Good CB, et al. Changes in drug pricing after drug shortages in the United States. Ann Intern Med. 2018;170:74-76.
- AADA, other specialties continue pressing FDA on drug shortages American Academy of Dermatology Association website.
https://www.aad.org/advocacy/news/news/2018/02/aada-other-specialties-continue-pressing-fda-on-drug-shortages. Published February 23, 2018. Accessed July 24, 2019. - FDA drug shortages. US Food & Drug Administration website. https://www.aad.org/advocacy/drug-pricing-and-availability/dermatologic-drug-shortages. Accessed July 24, 2019.

Changing the VA’s OC Pill Dispensing Could Save Money—and Avoid Unwanted Pregnancy
The VA currently stipulates a 3-month maximum dispensing limit for all medications, including oral contraceptive pills (OCPs). But a 12-month cycle for OCPs improves adherence, reduces coverage gaps, and reduces unintended pregnancy, say researchers from University of Pittsburgh and the VA Pittsburgh Health Care System, both in Pennsylvania. Not only that, they add, the VA could save > $2 million a year.
OCPs are among the most commonly used methods of contraception among women veterans. VA data indicate that 43% of women dispensed 3-month supplies experience ≤ 1 gap of ≤ 7 days between refills during a year of use. Citing research that has found women on 12-month dispensing cycles have fewer gaps, which leads to fewer unintended pregnancies and abortions. US guidelines now recommend routine initial dispensing of up to 1-year supplies of hormonal contraception.
However, the financial consequences for such a switch in the VA were unclear, the researchers say. To find out, they developed a decision analysis model from the VA perspective to compare incremental costs of a 12-month supply vs a 3-month supply dispensed quarterly. Basing their model on a cohort of 24,309 women, the researchers looked at the effects of each strategy on resulting coverage gaps, discontinuation of OCPs, pregnancy, birth, miscarriage, and abortion.
The model projected that the 12-month system would reduce unintended pregnancies by 14%, or 583 unintended pregnancies averted annually—a conservative estimate, the researchers say.
Overall, the model estimated total savings of > $2 million annually.
Their results suggest obvious financial benefits for the VA—for example, less money spent on intrapartum care, the researchers say. But they add, “it is vital that contraceptive policies serve first and foremost to augment women’s reproductive outcomes and autonomy.” They highlight the potential financial gains as a “secondary benefit to the more important and evidence-based goal of improving contraceptive access.”
Receipt of Primary Care Linked to High-Value Care, Better Health Care Experience
Study Overview
Objective. To examine whether receiving primary care is associated with receipt of high-value services and low-value services and quality of patient experience.
Design. Secondary data analysis of the Medical Expenditure
To define whether a respondent received primary care, respondents were asked if they have a “usual source of care” and to provide the name of a physician they usually visit if they “are sick or need advice” about their health. Four additional questions asked respondents if they would visit their usual source of care for (1) “new health problems,” (2) “preventive health care such as general checkups, examinations, and immunizations,” (3) “ongoing health problems,” and (4) “referrals to other health professionals when needed.” These questions were intended to reflect the essential functions of primary care: providing first contact care that is comprehensive, continuous, and coordinated. Any respondents who indicated that they did not have a usual source of care or answered no to any of the 4 questions were considered to not have primary care. Among respondents who identified a usual source of care, 95% met criteria for having primary care.
Setting and participants. The study included 49,286 US adults with primary care and 21,133 US adults without primary care. The average age was 50 years (95% confidence interval [CI], 50-51) among those with primary care and 38 years (95% CI, 38-39) among those without primary care. Among those who had primary care, 55% were female, 50% were non-Hispanic white, 32% Hispanic, and 13% black; among those without primary care, 43% were female, 43% were non-Hispanic white, 35% Hispanic, and 13% black. Among respondents with primary care, 58% considered their health status to be excellent or very good, as compared with 66% of respondents without primary care. Lack of insurance was reported by 7% of respondents with primary care and 34% of respondents without primary care. Chronic disease was reported in 78% of respondents without primary care, as compared with 42% of respondents with primary care. The study uses propensity score matching methods to produce a matched cohort, taking into account potential confounders. The matching procedure resulted in a final sample of 43,766 respondents with primary care matched to 17,964 respondents without primary care.
Main outcome measures. Main study outcome measures included 39 quality measures aggregated into quality composites (6 high-value services and 4 low-value services), and 7 patient care experience measures aggregated into an overall patient experience rating and 2 experience composites. High-value services are defined as delivery of services that are likely of benefit, and include the use of recommended cancer screening such as colorectal cancer screening in appropriate age groups; recommended diagnostic and preventive testing such as cholesterol measurement and influenza vaccination; recommended diabetes care such as hemoglobin A1c measurement; recommended medical treatment for medical conditions such as heart failure, coronary artery disease, and chronic obstructive pulmonary disease; and recommended counseling such as smoking cessation. Low-value services are defined as delivery of services that are considered either inappropriate or of little to no benefit, and include cancer screening in older adults; inappropriate use of antibiotics such as for bronchitis; inappropriate medical treatment such as anxiolytic, sedative, or hypnotic prescriptions for older adults; and inappropriate imaging tests for certain conditions.
Composites of underuse (high-value care) and overuse (low-value care) were constructed from each measure of high- or low-value services by identifying respondents who were eligible for the measure and determining the proportion in which recommended care was delivered (for high-value measures) or avoided (for low-value measures). Patient care experience was measured by standardized CAHPS (Consumer Assessment of Healthcare Providers and Systems) measurement for global rating of health care, doctor communication, and access to care. The patient care experience measures were dichotomized into positive responses as a rating of 8, 9, or 10 on items scored from 0 to 10, and 4 for items scored from 1 to 4. The experience composite was constructed by computing the mean for each respondent and then the mean for all respondents.
Main results. The study found that respondents with primary care were more likely to receive high-value care in 4 of 5 composite measures—cancer screening, diagnostic and preventive testing, diabetes care, and recommended counseling such as smoking cessation—but not in the composite recommended treatment for specific medical conditions such as heart failure. Respondents with primary care were more likely to receive recommended cancer screening, as compared to those without primary care (78% vs 67%, respectively, with a difference of 10.8%; 95% CI, 8.5%-13.0%). Respondents with primary care were also more likely to receive recommended diagnostic and preventive testing (with a difference of 9.9%; 95% CI, 8.7%-11.2%), to receive high-value diabetes care (with a difference of 7.8%; 95% CI, 1.2%-14.4%), and to receive counselling (with a difference of 6.9%; 95% CI, 4.1%-9.7%) when compared to respondents without primary care. However the rates of receipt of high-value medical treatments were similar among respondents with or without primary care (with a difference of –4.6% (95% CI, –14.3% to 5.0%). In contrast, rates of low-value care were similar for those with or without primary care in 3 of 4 composites, including low-value cancer screening, medical treatment, and imaging, while those with primary care had higher rates of low-value antibiotic use (with a difference of 11.0%; 95% CI, 2.8%-19.3%). Respondents with primary care reported better patient care experience, including global rating of their health care, physician communication, and access to care, when compared to those without primary care.
Conclusion. Receipt of primary care is associated with a better patient care experience, more high-value care, and slightly more low-value care.
Commentary
Primary care has long been considered the bedrock of modern health care, and the delivery of comprehensive, continuous, high-quality primary care yields benefits to patients and the health care system.1 Primary care is associated with better outcomes, such as lower mortality and reduced rates of potentially avoidable hospitalizations, and people living in areas with higher concentrations of primary care are more likely to report better health.2 Primary care is also associated with reductions in health care cost and utilization while maintaining quality.2 The current study adds to what is known about the potential benefits of primary care by directly examining the association of the use of primary care versus no primary care with outcomes of high-value care, low-value care, and patient care experience. Because this study used nationally representative data, it was able to examine adults in all age groups, not only older adults in Medicare, which prior studies have relied on.3 The study’s findings—that adults seen in primary care receive more high-value care and report better care experiences—are not surprising. The study also found that slightly more low-value care is being delivered in primary care. These findings are consistent with prior studies. Also, although primary care overall may be associated with health care benefits, there is substantial variation in the rates of overuse (of low-value care) and underuse (of high-value care) in primary care, and this may represent opportunities for improvement.4
This study has several limitations. Because the study defined primary care using questions that identify essential elements of primary care—first contact, comprehensiveness, continuity, and coordinated care—the findings may not apply to all individuals who have identified a primary care provider, but only to those who experience comprehensive, continuous, and coordinated care. Inclusion of all individuals who identify a usual source of primary care as the sole criteria may attenuate the association of primary care with the outcome measures. It is, however, reassuring that among those who identified a usual source of care (primary care), 95% indicated that they have care that is consistent with the principles of first contact care, comprehensiveness, continuity, and coordinated care. Another limitation is that the use of the criteria to indicate high- or low-value care may not capture the nuances of patient-centered care, preferences, or individualized decision-making that occurs in clinical care. Nonetheless, definitions used in the study for high- and low-value care are consistent with prior literature, and offer a standardized measure to indicate quality of care.
Applications for Clinical Practice
A recent trend in health care is the shift of continuity of care from primary care providers or practices to facility-based care or no continuity of care at all, and this shift disproportionately affects patients with low income and is associated with more emergency room visits.5 The current study makes a strong case for the potential benefits of receiving primary care that is comprehensive, continuous, and coordinated, as patients in primary care are more likely to receive high-value over low-value care, and to have a better care experience. The ongoing debate on changes to the health care system and insurance options must take into account the impact of any changes on the population receiving primary care coverage, with the goal that more, rather than fewer, individuals realize the potential benefits of comprehensive primary care.
— William W. Hung, MD MPH
1. Starfield B, Shi L, Macinko J. Contribution of primary care to health systems and health. Milbank Q. 2005;83:457-502.
2. American College of Physicians. How is a shortage of primary care physicians affecting the quality and cost of medical care? www.acponline.org/acp_policy/policies/primary_care_shortage_affecting_hc_2008.pdf. Published 2008. Accessed June 11, 2019.
3. Bazemore A, Petterson S, Peterson LE, et al. Higher primary care physician continuity is associated with lower costs and hospitalizations. Ann Fam Med. 2018;16:492-497.
4. O’Sullivan JW, Albasri A, Nicholson BD, et al. Overtesting and undertesting in primary care: a systematic review and meta-analysis. BMJ Open. 2018;8:e018557.
5. Liaw W, Jetty A, Petterson S, et al. Trends in the types of usual sources of care: a shift from people to places or nothing at all. Health Serv Res. 2018;53:2346-2367.
Study Overview
Objective. To examine whether receiving primary care is associated with receipt of high-value services and low-value services and quality of patient experience.
Design. Secondary data analysis of the Medical Expenditure
To define whether a respondent received primary care, respondents were asked if they have a “usual source of care” and to provide the name of a physician they usually visit if they “are sick or need advice” about their health. Four additional questions asked respondents if they would visit their usual source of care for (1) “new health problems,” (2) “preventive health care such as general checkups, examinations, and immunizations,” (3) “ongoing health problems,” and (4) “referrals to other health professionals when needed.” These questions were intended to reflect the essential functions of primary care: providing first contact care that is comprehensive, continuous, and coordinated. Any respondents who indicated that they did not have a usual source of care or answered no to any of the 4 questions were considered to not have primary care. Among respondents who identified a usual source of care, 95% met criteria for having primary care.
Setting and participants. The study included 49,286 US adults with primary care and 21,133 US adults without primary care. The average age was 50 years (95% confidence interval [CI], 50-51) among those with primary care and 38 years (95% CI, 38-39) among those without primary care. Among those who had primary care, 55% were female, 50% were non-Hispanic white, 32% Hispanic, and 13% black; among those without primary care, 43% were female, 43% were non-Hispanic white, 35% Hispanic, and 13% black. Among respondents with primary care, 58% considered their health status to be excellent or very good, as compared with 66% of respondents without primary care. Lack of insurance was reported by 7% of respondents with primary care and 34% of respondents without primary care. Chronic disease was reported in 78% of respondents without primary care, as compared with 42% of respondents with primary care. The study uses propensity score matching methods to produce a matched cohort, taking into account potential confounders. The matching procedure resulted in a final sample of 43,766 respondents with primary care matched to 17,964 respondents without primary care.
Main outcome measures. Main study outcome measures included 39 quality measures aggregated into quality composites (6 high-value services and 4 low-value services), and 7 patient care experience measures aggregated into an overall patient experience rating and 2 experience composites. High-value services are defined as delivery of services that are likely of benefit, and include the use of recommended cancer screening such as colorectal cancer screening in appropriate age groups; recommended diagnostic and preventive testing such as cholesterol measurement and influenza vaccination; recommended diabetes care such as hemoglobin A1c measurement; recommended medical treatment for medical conditions such as heart failure, coronary artery disease, and chronic obstructive pulmonary disease; and recommended counseling such as smoking cessation. Low-value services are defined as delivery of services that are considered either inappropriate or of little to no benefit, and include cancer screening in older adults; inappropriate use of antibiotics such as for bronchitis; inappropriate medical treatment such as anxiolytic, sedative, or hypnotic prescriptions for older adults; and inappropriate imaging tests for certain conditions.
Composites of underuse (high-value care) and overuse (low-value care) were constructed from each measure of high- or low-value services by identifying respondents who were eligible for the measure and determining the proportion in which recommended care was delivered (for high-value measures) or avoided (for low-value measures). Patient care experience was measured by standardized CAHPS (Consumer Assessment of Healthcare Providers and Systems) measurement for global rating of health care, doctor communication, and access to care. The patient care experience measures were dichotomized into positive responses as a rating of 8, 9, or 10 on items scored from 0 to 10, and 4 for items scored from 1 to 4. The experience composite was constructed by computing the mean for each respondent and then the mean for all respondents.
Main results. The study found that respondents with primary care were more likely to receive high-value care in 4 of 5 composite measures—cancer screening, diagnostic and preventive testing, diabetes care, and recommended counseling such as smoking cessation—but not in the composite recommended treatment for specific medical conditions such as heart failure. Respondents with primary care were more likely to receive recommended cancer screening, as compared to those without primary care (78% vs 67%, respectively, with a difference of 10.8%; 95% CI, 8.5%-13.0%). Respondents with primary care were also more likely to receive recommended diagnostic and preventive testing (with a difference of 9.9%; 95% CI, 8.7%-11.2%), to receive high-value diabetes care (with a difference of 7.8%; 95% CI, 1.2%-14.4%), and to receive counselling (with a difference of 6.9%; 95% CI, 4.1%-9.7%) when compared to respondents without primary care. However the rates of receipt of high-value medical treatments were similar among respondents with or without primary care (with a difference of –4.6% (95% CI, –14.3% to 5.0%). In contrast, rates of low-value care were similar for those with or without primary care in 3 of 4 composites, including low-value cancer screening, medical treatment, and imaging, while those with primary care had higher rates of low-value antibiotic use (with a difference of 11.0%; 95% CI, 2.8%-19.3%). Respondents with primary care reported better patient care experience, including global rating of their health care, physician communication, and access to care, when compared to those without primary care.
Conclusion. Receipt of primary care is associated with a better patient care experience, more high-value care, and slightly more low-value care.
Commentary
Primary care has long been considered the bedrock of modern health care, and the delivery of comprehensive, continuous, high-quality primary care yields benefits to patients and the health care system.1 Primary care is associated with better outcomes, such as lower mortality and reduced rates of potentially avoidable hospitalizations, and people living in areas with higher concentrations of primary care are more likely to report better health.2 Primary care is also associated with reductions in health care cost and utilization while maintaining quality.2 The current study adds to what is known about the potential benefits of primary care by directly examining the association of the use of primary care versus no primary care with outcomes of high-value care, low-value care, and patient care experience. Because this study used nationally representative data, it was able to examine adults in all age groups, not only older adults in Medicare, which prior studies have relied on.3 The study’s findings—that adults seen in primary care receive more high-value care and report better care experiences—are not surprising. The study also found that slightly more low-value care is being delivered in primary care. These findings are consistent with prior studies. Also, although primary care overall may be associated with health care benefits, there is substantial variation in the rates of overuse (of low-value care) and underuse (of high-value care) in primary care, and this may represent opportunities for improvement.4
This study has several limitations. Because the study defined primary care using questions that identify essential elements of primary care—first contact, comprehensiveness, continuity, and coordinated care—the findings may not apply to all individuals who have identified a primary care provider, but only to those who experience comprehensive, continuous, and coordinated care. Inclusion of all individuals who identify a usual source of primary care as the sole criteria may attenuate the association of primary care with the outcome measures. It is, however, reassuring that among those who identified a usual source of care (primary care), 95% indicated that they have care that is consistent with the principles of first contact care, comprehensiveness, continuity, and coordinated care. Another limitation is that the use of the criteria to indicate high- or low-value care may not capture the nuances of patient-centered care, preferences, or individualized decision-making that occurs in clinical care. Nonetheless, definitions used in the study for high- and low-value care are consistent with prior literature, and offer a standardized measure to indicate quality of care.
Applications for Clinical Practice
A recent trend in health care is the shift of continuity of care from primary care providers or practices to facility-based care or no continuity of care at all, and this shift disproportionately affects patients with low income and is associated with more emergency room visits.5 The current study makes a strong case for the potential benefits of receiving primary care that is comprehensive, continuous, and coordinated, as patients in primary care are more likely to receive high-value over low-value care, and to have a better care experience. The ongoing debate on changes to the health care system and insurance options must take into account the impact of any changes on the population receiving primary care coverage, with the goal that more, rather than fewer, individuals realize the potential benefits of comprehensive primary care.
— William W. Hung, MD MPH
1. Starfield B, Shi L, Macinko J. Contribution of primary care to health systems and health. Milbank Q. 2005;83:457-502.
2. American College of Physicians. How is a shortage of primary care physicians affecting the quality and cost of medical care? www.acponline.org/acp_policy/policies/primary_care_shortage_affecting_hc_2008.pdf. Published 2008. Accessed June 11, 2019.
3. Bazemore A, Petterson S, Peterson LE, et al. Higher primary care physician continuity is associated with lower costs and hospitalizations. Ann Fam Med. 2018;16:492-497.
4. O’Sullivan JW, Albasri A, Nicholson BD, et al. Overtesting and undertesting in primary care: a systematic review and meta-analysis. BMJ Open. 2018;8:e018557.
5. Liaw W, Jetty A, Petterson S, et al. Trends in the types of usual sources of care: a shift from people to places or nothing at all. Health Serv Res. 2018;53:2346-2367.
The Affordable Care Act, closing in on a decade
The Affordable Care Act (ACA) was enacted on March 23, 2010. Controversies, complaints, and detractors have and continue to abound. But the ACA’s landmark women’s health gains are unmistakable. Contraceptive coverage, maternity coverage, Medicaid coverage of low-income women, coverage for individuals with preexisting conditions, and gender-neutral premiums are now a part of the fabric of our society. For most.
Many physicians and patients—many lawmakers, too—do not remember the serious problems people had with their insurance companies before the ACA. Maternity coverage was usually a free-standing rider to an insurance policy, making it very expensive. Insurance plans did not have to, and often did not, cover contraceptives, and none did without copays or deductibles. Women were routinely denied coverage if they had ever had a cesarean delivery, had once been the victim of domestic violence, or had any one of many common conditions, like diabetes. The many exclusionary conditions are so common, in fact, that one study estimated that around 52 million adults in the United States (27% of those younger than age 65 years) have preexisting conditions that would potentially make them uninsurable without the ACA’s protections.1
Before the ACA, it also was common for women with insurance policies to find their coverage rescinded, often with no explanation, even though they paid their premiums every month. And women with serious medical conditions often saw their coverage ended midway through their course of treatment. That placed their ObGyns in a terrible situation, too.
The insurance industry as a whole was running rough-shod over its customers, and making a lot of money by creatively and routinely denying coverage and payment for care. People were often insured, but not covered. The ACA halted many of these practices, and required insurers to meet high medical loss ratios, guaranteeing that 80% of the premiums’ for individual and small market insurers (and 85% for large insurers) are returned to patients in care payments or even in checks. In fact, nearly $4 billion in premiums have been rebated to insured individuals over the last 7 years under the ACA.2
The commitment of the American College of Obstetricians and Gynecologists (ACOG) to women’s health and to our members’ ability to provide the best care has centered on preserving the critical gains of the ACA for women, improving them when we can, and making sure politicians don’t turn back the clock on women’s health. We have been busy.
In this article, we will look at what has happened to these landmark gains and promises of improved women’s health, specifically preexisting condition protections and contraceptive coverage, under a new Administration. What happens when good health care policy and political enmity collide?

Preexisting coverage protections
The 1996 Health Insurance Portability and Accountability Act (HIPAA) defines a preexisting condition exclusionas a “limitation or exclusion of benefits relating to a condition based on the fact that the condition was present before the date of enrollment for the coverage, whether or not any medical advice, diagnosis, care, or treatment was recommended or received before that date.” HIPPA prohibited employer-sponsored health plans from discriminating against individuals through denying them coverage or charging them more based on their or their family members’ health problems. The ACA expanded protections to prohibit the insurance practice of denying coverage altogether to an individual with a preexisting condition.3
Continue to: Under Congress...
Under Congress
Republicans held the majority in both chambers of the 115th Congress (2017–2018), and hoped to use their majority status to get an ACA repeal bill to the Republican President’s desk for speedy enactment. It was not easy, and they were not successful. Four major bills—the American Health Care Act, the Better Care Reconciliation Act, the Health Care Freedom Act, and the Graham-Cassidy Amendment—never made it over the finish line, with some not even making it to a vote. The Health Care Freedom Act was voted down in the Senate 51-49 when Senator John McCain came back from brain surgery to cast his famous thumbs-down vote.4 These bills all would have repealed or hobbled guaranteed issue, community rating, and essential health benefits of the ACA. Of all the legislative attempts to undermine the ACA, only the 2017 Tax Cuts and Jobs Act (TCJA) was signed into law, repealing the ACA individual mandate.
Handling by the courts
The TCJA gave ACA opponents their opening in court. Twenty Republican state attorneys general and governors brought suit in February 2018 (Texas v Azar), arguing that because the ACA relies on the mandate, and the mandate has been repealed, the rest of the ACA also should be struck down. A federal district judge agreed, on December 15, 2018, declaring the entire ACA unconstitutional.5
That decision has been limited in its practical effect so far, and maybe it was not altogether unexpected. What was unexpected was that the US Department of Justice (DOJ) refused to defend a federal law, in this case, the ACA. In June 2018, the DOJ declined to defend the individual mandate, as well as guaranteed issue, community rating, the ban on preexisting condition exclusions, and discrimination based on health status in the ACA. The DOJ at that time, however, did not agree with the plaintiffs that without the mandate the entire ACA should be struck down. It said, “There is no reason why the ACA’s particular expansion of Medicaid hinges on the individual mandate.” Later, after the December 15 ruling, the DOJ changed its position and agreed with the judge, in a two-sentence letter to the court, that the ACA should be stricken altogether—shortly after which 3 career DOJ attorneys resigned.6
A legal expert observed: “The DOJ’s decision not to defend the ACA breaks with the Department’s long-standing bipartisan commitment to defend federal laws if reasonable arguments can be made in their defense. Decisions not to defend federal law are exceedingly rare. It seems even rarer to change the government’s position mid-appeal in such a high-profile lawsuit that risks disrupting the entire health care system and health insurance coverage for millions of Americans.”7
Regulatory tactics
What a policy maker cannot do by law, he or she can try to accomplish by regulation. The Administration is using 3 regulatory routes to undercut the ACA preexisting coverage protections and market stability.
Route 1: Short-Term Limited Duration (STLD) plans. These plans were created in the ACA to provide bridge coverage for up to 3 months for individuals in between health insurance plans. These plans do not have to comply with ACA patient protections, can deny coverage for preexisting conditions, and do not cover maternity care. In 2018, the Administration moved to allow these plans to be marketed broadly and renewed for up to 3 years. Because these plans provide less coverage and often come with high deductibles, they can be marketed with lower premiums, skimming off healthier younger people who do not expect to need much care, as well as lower-income families. This destabilizes the market and leaves people insured but not covered, exactly the situation before the ACA. Seven public health and medical groups sued to challenge the Administration’s STLD regulation; the lawsuit is presently pending.
Continue to: Route 2: Association Health Plans (AHPs)...
Route 2: Association Health Plans (AHPs). The Administration also has allowed the sale of AHPs, marketed to small employers and self-employed individuals. These plans also do not have to comply with ACA consumer protections. They often do not cover maternity care or other essential benefits, and can charge women higher premiums for the same insurance. This regulation, too, resulted in litigation and a federal judge enjoined the rule, but the case is now on appeal.
Route 3: ACA Section 1332 waivers. These waivers were created in the ACA to encourage state innovation to increase access to health coverage, under certain guardrails: states must ensure coverage is at least as comprehensive as the Essential Health Benefits; cost sharing protections must be at least as affordable as under the ACA; the plan must cover at least a comparable number of its residents; and the plan must not increase the federal deficit.
The Adminstration has come under fire for approving 1332 waiver plans that do not meet these guardrails, and allow insurers to exclude coverage for individuals with preexisting conditions, as well as skirt other important ACA patient protections. In response, Seema Verma, Administrator of the Centers for Medicare & Medicaid Services, promised as recently as April 23, that the Administration will not allow any weakening of the ACA preexisting coverage guarantee.8 So far, however, we do not know what action this means, and not surprisingly, House Democrats, now in the majority, are waiting to see those assurances come true. Consistent polling shows that a large majority of Americans, across political parties, think preexisting coverage protections are very important.9
Already, the House passed HR986, to repeal the Administration’s changes to the 1332 waiver rules. The bill won only 4 Republican votes in the House and now waits a Senate vote.
The House is ready to vote on HR1010, which returns the STLD rules to the original ACA version. The Congressional Budget Office has determined that this bill will reduce the federal deficit by $8.9 billion over 10 years, in part by reestablishing a large risk pool. Lower ACA premiums would mean lower federal subsidies and small federal outlays.
Contraceptive coverage
Since 2012, the ACA has required non-grandfathered individual and group health plans to cover, with no copays or deductibles, women’s preventive services, as determined by the Health Resources and Services Administration (HRSA). HRSA asked the National Academy of Medicine (the Institute of Medicine [IOM] at the time) to develop these coverage guidelines based on clinical and scientific relevance. The IOM relied heavily on ACOG’s testimony and women’s health guidelines. The guidelines are updated every 5 years, based on extensive review by the Women’s Preventive Services Initiative, led by ACOG. By law and regulation, covered services include:
- well-woman visits
- contraceptive methods and counseling, including all methods approved for women by the FDA
- breast and cervical cancer screening
- counseling for sexually transmitted infections
- counseling and screening for HIV
- screening for gestational diabetes
- breastfeeding support, supplies, and counseling
- screening and counseling for interpersonal and domestic violence.
Continue to: The previous administration offered a narrow exemption...
The previous administration offered a narrow exemption—an accommodation—for churches, religious orders, and integrated auxiliaries (organizations with financial support primarily from churches). That accommodation was expanded in the Supreme Court’s decision in Hobby Lobby, for closely held for-profit organizations that had religious objections to covering some or all contraceptives. Under the accommodation, the entity’s insurer or third-party administrator was responsible for providing contraceptive services to the entity’s plan participants and beneficiaries.
In October 2017, the Trump administration acted to greatly expand the ability of any employer, college or university, individual, or insurer to opt out of the ACA’s contraceptive coverage requirement. You will read more about this later.
ACOG’s business case for contraception
Early in the Trump Administration, the White House released a statement saying, “Ensuring affordable, accessible, and quality healthcare is critical to improving women’s health and ensuring that it fits their priorities at any stage of life.”10 ACOG could not agree more, and we encouraged the President to accomplish this important goal by protecting the landmark women’s health gains of the ACA. Our call to the President and the US Congress was: “Don’t turn back the clock on women’s health.”
We made a business case for continued contraceptive coverage:
Contraception reduces unintended pregnancies and saves federal dollars.
- Approximately 45% of US pregnancies are unintended.11
- No-copay coverage of contraception has contributed to a dramatic decline in the unintended pregnancy rate in the United States, now at a 30-year low.12
- When cost is not a barrier, women choose more effective forms of contraception, such as intrauterine devices and implants.13
- Unintended pregnancies cost approximately $12.5 billion in government expenditures in 2008.14
- Private health plans spend as much as $4.6 billion annually in costs related to unintended pregnancies.15
Contraception means healthier women and healthier families.
- Under the ACA, the uninsured rate among women ages 18 to 64 almost halved, decreasing from 19.3% to 10.8%.16
- More than 55 million women gained access to preventive services, including contraception, without a copay or a deductible.16
- Women with unintended pregnancies are more likely to delay prenatal care. Infants are at greater risk of birth defects, low birth weight, and poor mental and physical functioning in early childhood.17
Increased access to contraception helps families and improves economic security.
- Women saved $1.4 billion in out-of-pocket costs for contraception in 1 year.18
- Before the ACA, women were spending between 30% and 44% of their total out-of-pocket health costs just on birth control.19
- The ability to plan a pregnancy increases engagement of women in the workforce and improves economic stability for women and their families.20
Administration expands religious exemptions to contraception coverage
Still, on October 6, 2017, the Trump Administration moved to curtail women’s access to and coverage of contraception with the Religious Exemptions and Accommodations for Coverage of Certain Preventive Services under the Affordable Care Act and Moral Exemptions and Accommodations for Coverage of Certain Preventive Services Under the Affordable Care Act. In November 2018, the Administration published a revised rule, to take effect in January 2019.21 The rule immediately was taken to court by more than a dozen states and, 1 month later, was subject to an injunction by the US Court of Appeals for the Ninth Circuit, blocking the rules from going into effect in those states.
Continue to: The rule vastly expands the Obama Administration’s religious accommodation...
The rule vastly expands the Obama Administration’s religious accommodation to include “nonprofit organizations, small businesses, and individuals that have nonreligious moral convictions opposing services covered by the contraceptive mandate.” The covered entities include21:
- churches, integrated auxiliaries, and religious orders with religious objections
- nonprofit organizations with religious or moral objections
- for-profit entities that are not publicly traded, with religious or moral objections
- for-profit entities that are publicly traded, with religious objections
- other nongovernmental employers with religious objections
- nongovernmental institutions of higher education with religious or moral objections
- individuals with religious or moral objections, with employer sponsored or individual market coverage, where the plan sponsor and/or issuer (as applicable) are willing to offer them a plan omitting contraceptive coverage to which they object
- issuers with religious or moral objections, to the extent they provide coverage to a plan sponsor or individual that is also exempt.
The Administration says women losing coverage can get contraceptives through Title X clinics or other government programs. Of course, many women losing coverage are employed, and earn above the low income (100% of the federal poverty level) eligibility requirement for Title X assistance. To address that, the Administration, through its proposed Title X regulations, broadens the definition of “low income” in that program to include women who lose their contraceptive coverage through the employer-base health insurance plan. This move further limits the ability of the Title X program to adequately care for already-qualified individuals.
The Administration’s rule also relied on major inaccuracies, which ACOG corrected.22 First, ACOG pointed out that, in fact, FDA-approved contraceptive methods are not abortifacients, countering the Administration’s contention that contraception is an abortifacient, and that contraceptives cause abortions or miscarriages. Every FDA-approved contraceptive acts before implantation, does not interfere with a pregnancy, and is not effective after a fertilized egg has implanted successfully in the uterus.23 No credible research supports the false statement that birth control causes miscarriages.24
Second, ACOG offered data proving that increased access to contraception is not associated with increased unsafe sexual behavior or increased sexual activity.25,26 The facts are that:
- The percentage of teens who are having sex has declined significantly, by 14% for female and 22% for male teenagers, over the past 25 years.27
- More women are using contraception the first time they have sex. Young women who do not use birth control at first sexual intercourse are twice as likely to become teen mothers.28
- Increased access to and use of contraception has contributed to a dramatic decline in rates of adolescent pregnancy.29
- School-based health centers that provide access to contraceptives are proven to increase use of contraceptives by already sexually active students, not to increase onset of sexual activity.30,31
Third, ACOG made clear the benefits to women’s health from contraception. ACOG asserted: As with any medication, certain types of contraception may be contraindicated for patients with certain medical conditions, including high blood pressure, lupus, or a history of breast cancer.32,33 For these and many other reasons, access to the full range of FDA-approved contraception, with no cost sharing or other barriers, is critical to women’s health. Regarding VTE, the risk among oral contraceptive users is very low. In fact, it is much lower than the risk of VTE during pregnancy or in the immediate postpartum period.34
Continue to: Regarding breast cancer: there is no proven increased risk...
Regarding breast cancer: there is no proven increased risk of breast cancer among contraceptive users, particularly among those younger than age 40. For women older than 40, health care providers must consider both the risks of becoming pregnant at advanced reproductive age and the risks of continuing contraception use until menopause.35
ACOG has 2 clear messages for politicians
ACOG has remained steadfast in its opposition to the Administration’s proposals to block access to contraception. ACOG expressed its strong opposition to political interference in medical care, saying “Every woman, regardless of her insurer, employer, state of residence, or income, should have affordable, seamless access to the right form of contraception for her, free from interference from her employer or politicians.”22
ACOG’s voice has been joined by 5 other major medical associations—American Academy of Family Physicians, American Academy of Pediatrics, American Psychiatric Association, American Academy of Pediatrics, and American Osteopathic Association—together representing more than 560,000 physicians and medical students, in urging the Administration to immediately withdraw its proposals. This broad coalition unequivocally stated36:
Contraception is an integral part of preventive care and a medical necessity for women during approximately 30 years of their lives. Access to no-copay contraception leads to healthier women and families. Changes to our healthcare system come with very high stakes – impacting tens of millions of our patients. Access to contraception allows women to achieve, lead and reach their full potentials, becoming key drivers of our Nation’s economic success. These rules would create a new standard whereby employers can deny their employees coverage, based on their own moral objections. This interferes in the personal health care decisions of our patients, and inappropriately inserts a patient’s employer into the physician-patient relationship. In addition, these rules open the door to moral exemptions for other essential health care, including vaccinations.
These are challenging days for women’s health policy and legislation federally, and in many states. ACOG has two clear messages for politicians: Don’t turn back the clock on women’s health, and stay out of our exam rooms.
- Claxton G, Cox C, Damico A, et al. Pre-existing conditions and medical underwriting in the individual insurance market prior to the ACA. Kaiser Family Foundation website. Published December 12, 2016. Accessed June 25, 2019.
- Norris L. Billions in ACA rebates show 80/20 rule’s impact. HealthInsurance.org website. Published May 10, 2019. Accessed June 25, 2019.
- Patient Protection and Affordable Care Act: Preexisting condition exclusions, lifetime and annual limits, rescissions, and patient protections. Regulations.gov website. Accessed June 25, 2019.
- Jost T. The Senate’s Health Care Freedom Act. Health Affairs website. Updated July 28, 2017. Accessed June 25, 2019.
- Texas v Azar decision. American Medical Association website. Accessed June 25, 2019.
- Keith K. DOJ, plaintiffs file in Texas v United States. Health Affairs website. Published May 2 2019. Accessed June 25, 2019.
- John & Rusty Report. Trump Administration asks court to strike down entire ACA. March 26, 2019. https://jrreport.wordandbrown.com/2019/03/26/trump-administration-asks-court-to-strike-down-entire-aca/. Accessed June 29, 2019.
- Speech: Remarks by Administrator Seema Verma at the CMS National Forum on State Relief and Empowerment Waivers. Centers for Medicare & Medicaid website. Published April 23, 2019. Accessed June 25, 2019.
- Poll: The ACA’s pre-existing condition protections remain popular with the public, including republicans, as legal challenge looms this week. Kaiser Family Foundation website. Published September 5, 2018. Accessed June 25, 2019.
- Statement from President Donald J. Trump on Women’s Health Week. White House website. Issued May 14, 2017. Accessed June 26, 2019.
- Finer LB, Zolna MR. Declines in unintended pregnancy in the United States, 2008-2011. N Engl J Med. 2016;374:843-852.
- Insurance coverage of contraception. Guttmacher Institute website. Published August 2018. Accessed June 26, 2019.
- Carlin CS, Fertig AR, Dowd BE. Affordable Care Act’s mandate eliminating contraceptive cost sharing influenced choices of women with employer coverage. Health Affairs. 2016;35:1608-1615.
- American College of Obstetricians and Gynecologists. Access to contraception. Committee Opinion No. 615. Obstet Gynecol. 2015;125:250–255.
- Canestaro W, et al. Implications of employer coverage of contraception: cost-effectiveness analysis of contraception coverage under an employer mandate. Contraception. 2017;95:77-89.
- Simmons A, et al. The Affordable Care Act: Promoting better health for women. Office of the Assistant Secretary for Planning and Evaluation Issue Brief, Department of Health and Human Services. June 14, 2016. Accessed June 25, 2019.
- Conde-Agudelo A, Rosas-Bermudez A, Kafury-Goeta AC. Birth spacing and risk of adverse perinatal outcomes: a meta-analysis. JAMA. 2006;295:1809–1823.
- Becker NV, Polsky D. Women saw large decrease in out-of-pocket spending for contraceptives after ACA mandate removed cost sharing. Health Affairs. 2015;34:1204-1211. Accessed June 25, 2019.
- Becker NV, Polsky D. Women saw large decrease in out-of-pocket spending for contraceptives after ACA mandate removed cost sharing. Health Affairs. 2015;34(7).
- Sonfield A, Hasstedt K, Kavanaugh ML, Anderson R. The social and economic benefits of women’s ability to determine whether and when to have children. New York, NY: Guttmacher Institute; 2013.
- Department of Health and Human Services. Fact sheet: Final rules on religious and moral exemptions and accommodation for coverage of certain preventive services under the Affordable Care Act. November 7, 2018. Accessed June 26, 2019.
- American College of Obstetricians and Gynecologists. Facts are important: Correcting the record on the Administration’s contraceptive coverage roll back rule. October 2017. Accessed June 26, 2019.
- Brief for Physicians for Reproductive Health, American College of Obstetricians and Gynecologists et al. as Amici Curiae Supporting Respondents, Sebelius v. Hobby Lobby, 573 U.S. XXX. 2014. (No. 13-354).
- Early pregnancy loss. FAQ No. 90. American College of Obstetricians and Gynecologists. August 2015.
- Kirby D. Emerging answers 2007: Research findings on programs to reduce teen pregnancy and sexually transmitted diseases. Washington, DC: The National Campaign to Prevent Teen and Unplanned Pregnancy; 2009.
- Meyer JL, Gold MA, Haggerty CL. Advance provision of emergency contraception among adolescent and young adult women: a systematic review of literature. J Pediatr Adolesc Gynecol. 2011;24:2-9.
- Martinez GM and Abma JC. Sexual activity, contraceptive use, and childbearing of teenagers aged 15–19 in the United States. NCHS Data Brief, 2015, No. 209. Hyattsville, MD: National Center for Health Statistics; 2015.
- Martinez GM, Abma JC. Sexual activity, contraceptive use, and childbearing of teenagers aged 15-19 in the United States. NCHS Data Brief. July 2015. Accessed June 26, 2019.
- Lindberg L, Santelli J, Desai S. Understanding the decline in adolescent fertility in the United States, 2007–2012. J Adolesc Health. 2016;59:577-583.
- Minguez M, Santelli JS, Gibson E, et al. Reproductive health impact of a school health center. J Adolesc Health. 2015;56:338-344.
- Knopf JA, Finnie RK, Peng Y, et al. Community Preventive Services Task Force. School-based health centers to advance health equity: a Community Guide systematic review. Am J Preventive Med. 2016;51:114-126.
- Progestin-only hormonal birth control: pill and injection. FAQ No. 86. American College of Obstetricians and Gynecologists. July 2014.
- Combined hormonal birth control: pill, patch, and ring. FAQ No. 185. American College of Obstetricians and Gynecologists. July 2014.
- Risk of venous thromboembolism among users of drospirenone-containing oral contraceptive pills. Committee Opinion No. 540. American College of Obstetricians and Gynecologists. Obstet Gynecol. 2012;120:1239-1242.
- Curtis KM, Jatlaoui TC, Tepper NK, et al. U.S. Selected Practice Recommendations for Contraceptive Use, 2016. MMWR Recomm Rep. 2016;65(No. RR-4):1–66.
- Letter to President Donald J. Trump. October 6, 2017. https://www.aafp.org/dam/AAFP/documents/advocacy/coverage/aca/LT-Group6-President-ContraceptionIFRs-100617.pdf. Accessed June 26, 2019.

Ms. DiVenere is Officer, Government and Political Affairs, at the American College of Obstetricians and Gynecologists in Washington, DC. She is an
The author reports no financial relationships relevant to this article.
Ms. DiVenere is Officer, Government and Political Affairs, at the American College of Obstetricians and Gynecologists in Washington, DC. She is an
The author reports no financial relationships relevant to this article.
Ms. DiVenere is Officer, Government and Political Affairs, at the American College of Obstetricians and Gynecologists in Washington, DC. She is an
The author reports no financial relationships relevant to this article.
The Affordable Care Act (ACA) was enacted on March 23, 2010. Controversies, complaints, and detractors have and continue to abound. But the ACA’s landmark women’s health gains are unmistakable. Contraceptive coverage, maternity coverage, Medicaid coverage of low-income women, coverage for individuals with preexisting conditions, and gender-neutral premiums are now a part of the fabric of our society. For most.
Many physicians and patients—many lawmakers, too—do not remember the serious problems people had with their insurance companies before the ACA. Maternity coverage was usually a free-standing rider to an insurance policy, making it very expensive. Insurance plans did not have to, and often did not, cover contraceptives, and none did without copays or deductibles. Women were routinely denied coverage if they had ever had a cesarean delivery, had once been the victim of domestic violence, or had any one of many common conditions, like diabetes. The many exclusionary conditions are so common, in fact, that one study estimated that around 52 million adults in the United States (27% of those younger than age 65 years) have preexisting conditions that would potentially make them uninsurable without the ACA’s protections.1
Before the ACA, it also was common for women with insurance policies to find their coverage rescinded, often with no explanation, even though they paid their premiums every month. And women with serious medical conditions often saw their coverage ended midway through their course of treatment. That placed their ObGyns in a terrible situation, too.
The insurance industry as a whole was running rough-shod over its customers, and making a lot of money by creatively and routinely denying coverage and payment for care. People were often insured, but not covered. The ACA halted many of these practices, and required insurers to meet high medical loss ratios, guaranteeing that 80% of the premiums’ for individual and small market insurers (and 85% for large insurers) are returned to patients in care payments or even in checks. In fact, nearly $4 billion in premiums have been rebated to insured individuals over the last 7 years under the ACA.2
The commitment of the American College of Obstetricians and Gynecologists (ACOG) to women’s health and to our members’ ability to provide the best care has centered on preserving the critical gains of the ACA for women, improving them when we can, and making sure politicians don’t turn back the clock on women’s health. We have been busy.
In this article, we will look at what has happened to these landmark gains and promises of improved women’s health, specifically preexisting condition protections and contraceptive coverage, under a new Administration. What happens when good health care policy and political enmity collide?
Preexisting coverage protections
The 1996 Health Insurance Portability and Accountability Act (HIPAA) defines a preexisting condition exclusionas a “limitation or exclusion of benefits relating to a condition based on the fact that the condition was present before the date of enrollment for the coverage, whether or not any medical advice, diagnosis, care, or treatment was recommended or received before that date.” HIPPA prohibited employer-sponsored health plans from discriminating against individuals through denying them coverage or charging them more based on their or their family members’ health problems. The ACA expanded protections to prohibit the insurance practice of denying coverage altogether to an individual with a preexisting condition.3
Continue to: Under Congress...
Under Congress
Republicans held the majority in both chambers of the 115th Congress (2017–2018), and hoped to use their majority status to get an ACA repeal bill to the Republican President’s desk for speedy enactment. It was not easy, and they were not successful. Four major bills—the American Health Care Act, the Better Care Reconciliation Act, the Health Care Freedom Act, and the Graham-Cassidy Amendment—never made it over the finish line, with some not even making it to a vote. The Health Care Freedom Act was voted down in the Senate 51-49 when Senator John McCain came back from brain surgery to cast his famous thumbs-down vote.4 These bills all would have repealed or hobbled guaranteed issue, community rating, and essential health benefits of the ACA. Of all the legislative attempts to undermine the ACA, only the 2017 Tax Cuts and Jobs Act (TCJA) was signed into law, repealing the ACA individual mandate.
Handling by the courts
The TCJA gave ACA opponents their opening in court. Twenty Republican state attorneys general and governors brought suit in February 2018 (Texas v Azar), arguing that because the ACA relies on the mandate, and the mandate has been repealed, the rest of the ACA also should be struck down. A federal district judge agreed, on December 15, 2018, declaring the entire ACA unconstitutional.5
That decision has been limited in its practical effect so far, and maybe it was not altogether unexpected. What was unexpected was that the US Department of Justice (DOJ) refused to defend a federal law, in this case, the ACA. In June 2018, the DOJ declined to defend the individual mandate, as well as guaranteed issue, community rating, the ban on preexisting condition exclusions, and discrimination based on health status in the ACA. The DOJ at that time, however, did not agree with the plaintiffs that without the mandate the entire ACA should be struck down. It said, “There is no reason why the ACA’s particular expansion of Medicaid hinges on the individual mandate.” Later, after the December 15 ruling, the DOJ changed its position and agreed with the judge, in a two-sentence letter to the court, that the ACA should be stricken altogether—shortly after which 3 career DOJ attorneys resigned.6
A legal expert observed: “The DOJ’s decision not to defend the ACA breaks with the Department’s long-standing bipartisan commitment to defend federal laws if reasonable arguments can be made in their defense. Decisions not to defend federal law are exceedingly rare. It seems even rarer to change the government’s position mid-appeal in such a high-profile lawsuit that risks disrupting the entire health care system and health insurance coverage for millions of Americans.”7
Regulatory tactics
What a policy maker cannot do by law, he or she can try to accomplish by regulation. The Administration is using 3 regulatory routes to undercut the ACA preexisting coverage protections and market stability.
Route 1: Short-Term Limited Duration (STLD) plans. These plans were created in the ACA to provide bridge coverage for up to 3 months for individuals in between health insurance plans. These plans do not have to comply with ACA patient protections, can deny coverage for preexisting conditions, and do not cover maternity care. In 2018, the Administration moved to allow these plans to be marketed broadly and renewed for up to 3 years. Because these plans provide less coverage and often come with high deductibles, they can be marketed with lower premiums, skimming off healthier younger people who do not expect to need much care, as well as lower-income families. This destabilizes the market and leaves people insured but not covered, exactly the situation before the ACA. Seven public health and medical groups sued to challenge the Administration’s STLD regulation; the lawsuit is presently pending.
Continue to: Route 2: Association Health Plans (AHPs)...
Route 2: Association Health Plans (AHPs). The Administration also has allowed the sale of AHPs, marketed to small employers and self-employed individuals. These plans also do not have to comply with ACA consumer protections. They often do not cover maternity care or other essential benefits, and can charge women higher premiums for the same insurance. This regulation, too, resulted in litigation and a federal judge enjoined the rule, but the case is now on appeal.
Route 3: ACA Section 1332 waivers. These waivers were created in the ACA to encourage state innovation to increase access to health coverage, under certain guardrails: states must ensure coverage is at least as comprehensive as the Essential Health Benefits; cost sharing protections must be at least as affordable as under the ACA; the plan must cover at least a comparable number of its residents; and the plan must not increase the federal deficit.
The Adminstration has come under fire for approving 1332 waiver plans that do not meet these guardrails, and allow insurers to exclude coverage for individuals with preexisting conditions, as well as skirt other important ACA patient protections. In response, Seema Verma, Administrator of the Centers for Medicare & Medicaid Services, promised as recently as April 23, that the Administration will not allow any weakening of the ACA preexisting coverage guarantee.8 So far, however, we do not know what action this means, and not surprisingly, House Democrats, now in the majority, are waiting to see those assurances come true. Consistent polling shows that a large majority of Americans, across political parties, think preexisting coverage protections are very important.9
Already, the House passed HR986, to repeal the Administration’s changes to the 1332 waiver rules. The bill won only 4 Republican votes in the House and now waits a Senate vote.
The House is ready to vote on HR1010, which returns the STLD rules to the original ACA version. The Congressional Budget Office has determined that this bill will reduce the federal deficit by $8.9 billion over 10 years, in part by reestablishing a large risk pool. Lower ACA premiums would mean lower federal subsidies and small federal outlays.
Contraceptive coverage
Since 2012, the ACA has required non-grandfathered individual and group health plans to cover, with no copays or deductibles, women’s preventive services, as determined by the Health Resources and Services Administration (HRSA). HRSA asked the National Academy of Medicine (the Institute of Medicine [IOM] at the time) to develop these coverage guidelines based on clinical and scientific relevance. The IOM relied heavily on ACOG’s testimony and women’s health guidelines. The guidelines are updated every 5 years, based on extensive review by the Women’s Preventive Services Initiative, led by ACOG. By law and regulation, covered services include:
- well-woman visits
- contraceptive methods and counseling, including all methods approved for women by the FDA
- breast and cervical cancer screening
- counseling for sexually transmitted infections
- counseling and screening for HIV
- screening for gestational diabetes
- breastfeeding support, supplies, and counseling
- screening and counseling for interpersonal and domestic violence.
Continue to: The previous administration offered a narrow exemption...
The previous administration offered a narrow exemption—an accommodation—for churches, religious orders, and integrated auxiliaries (organizations with financial support primarily from churches). That accommodation was expanded in the Supreme Court’s decision in Hobby Lobby, for closely held for-profit organizations that had religious objections to covering some or all contraceptives. Under the accommodation, the entity’s insurer or third-party administrator was responsible for providing contraceptive services to the entity’s plan participants and beneficiaries.
In October 2017, the Trump administration acted to greatly expand the ability of any employer, college or university, individual, or insurer to opt out of the ACA’s contraceptive coverage requirement. You will read more about this later.
ACOG’s business case for contraception
Early in the Trump Administration, the White House released a statement saying, “Ensuring affordable, accessible, and quality healthcare is critical to improving women’s health and ensuring that it fits their priorities at any stage of life.”10 ACOG could not agree more, and we encouraged the President to accomplish this important goal by protecting the landmark women’s health gains of the ACA. Our call to the President and the US Congress was: “Don’t turn back the clock on women’s health.”
We made a business case for continued contraceptive coverage:
Contraception reduces unintended pregnancies and saves federal dollars.
- Approximately 45% of US pregnancies are unintended.11
- No-copay coverage of contraception has contributed to a dramatic decline in the unintended pregnancy rate in the United States, now at a 30-year low.12
- When cost is not a barrier, women choose more effective forms of contraception, such as intrauterine devices and implants.13
- Unintended pregnancies cost approximately $12.5 billion in government expenditures in 2008.14
- Private health plans spend as much as $4.6 billion annually in costs related to unintended pregnancies.15
Contraception means healthier women and healthier families.
- Under the ACA, the uninsured rate among women ages 18 to 64 almost halved, decreasing from 19.3% to 10.8%.16
- More than 55 million women gained access to preventive services, including contraception, without a copay or a deductible.16
- Women with unintended pregnancies are more likely to delay prenatal care. Infants are at greater risk of birth defects, low birth weight, and poor mental and physical functioning in early childhood.17
Increased access to contraception helps families and improves economic security.
- Women saved $1.4 billion in out-of-pocket costs for contraception in 1 year.18
- Before the ACA, women were spending between 30% and 44% of their total out-of-pocket health costs just on birth control.19
- The ability to plan a pregnancy increases engagement of women in the workforce and improves economic stability for women and their families.20
Administration expands religious exemptions to contraception coverage
Still, on October 6, 2017, the Trump Administration moved to curtail women’s access to and coverage of contraception with the Religious Exemptions and Accommodations for Coverage of Certain Preventive Services under the Affordable Care Act and Moral Exemptions and Accommodations for Coverage of Certain Preventive Services Under the Affordable Care Act. In November 2018, the Administration published a revised rule, to take effect in January 2019.21 The rule immediately was taken to court by more than a dozen states and, 1 month later, was subject to an injunction by the US Court of Appeals for the Ninth Circuit, blocking the rules from going into effect in those states.
Continue to: The rule vastly expands the Obama Administration’s religious accommodation...
The rule vastly expands the Obama Administration’s religious accommodation to include “nonprofit organizations, small businesses, and individuals that have nonreligious moral convictions opposing services covered by the contraceptive mandate.” The covered entities include21:
- churches, integrated auxiliaries, and religious orders with religious objections
- nonprofit organizations with religious or moral objections
- for-profit entities that are not publicly traded, with religious or moral objections
- for-profit entities that are publicly traded, with religious objections
- other nongovernmental employers with religious objections
- nongovernmental institutions of higher education with religious or moral objections
- individuals with religious or moral objections, with employer sponsored or individual market coverage, where the plan sponsor and/or issuer (as applicable) are willing to offer them a plan omitting contraceptive coverage to which they object
- issuers with religious or moral objections, to the extent they provide coverage to a plan sponsor or individual that is also exempt.
The Administration says women losing coverage can get contraceptives through Title X clinics or other government programs. Of course, many women losing coverage are employed, and earn above the low income (100% of the federal poverty level) eligibility requirement for Title X assistance. To address that, the Administration, through its proposed Title X regulations, broadens the definition of “low income” in that program to include women who lose their contraceptive coverage through the employer-base health insurance plan. This move further limits the ability of the Title X program to adequately care for already-qualified individuals.
The Administration’s rule also relied on major inaccuracies, which ACOG corrected.22 First, ACOG pointed out that, in fact, FDA-approved contraceptive methods are not abortifacients, countering the Administration’s contention that contraception is an abortifacient, and that contraceptives cause abortions or miscarriages. Every FDA-approved contraceptive acts before implantation, does not interfere with a pregnancy, and is not effective after a fertilized egg has implanted successfully in the uterus.23 No credible research supports the false statement that birth control causes miscarriages.24
Second, ACOG offered data proving that increased access to contraception is not associated with increased unsafe sexual behavior or increased sexual activity.25,26 The facts are that:
- The percentage of teens who are having sex has declined significantly, by 14% for female and 22% for male teenagers, over the past 25 years.27
- More women are using contraception the first time they have sex. Young women who do not use birth control at first sexual intercourse are twice as likely to become teen mothers.28
- Increased access to and use of contraception has contributed to a dramatic decline in rates of adolescent pregnancy.29
- School-based health centers that provide access to contraceptives are proven to increase use of contraceptives by already sexually active students, not to increase onset of sexual activity.30,31
Third, ACOG made clear the benefits to women’s health from contraception. ACOG asserted: As with any medication, certain types of contraception may be contraindicated for patients with certain medical conditions, including high blood pressure, lupus, or a history of breast cancer.32,33 For these and many other reasons, access to the full range of FDA-approved contraception, with no cost sharing or other barriers, is critical to women’s health. Regarding VTE, the risk among oral contraceptive users is very low. In fact, it is much lower than the risk of VTE during pregnancy or in the immediate postpartum period.34
Continue to: Regarding breast cancer: there is no proven increased risk...
Regarding breast cancer: there is no proven increased risk of breast cancer among contraceptive users, particularly among those younger than age 40. For women older than 40, health care providers must consider both the risks of becoming pregnant at advanced reproductive age and the risks of continuing contraception use until menopause.35
ACOG has 2 clear messages for politicians
ACOG has remained steadfast in its opposition to the Administration’s proposals to block access to contraception. ACOG expressed its strong opposition to political interference in medical care, saying “Every woman, regardless of her insurer, employer, state of residence, or income, should have affordable, seamless access to the right form of contraception for her, free from interference from her employer or politicians.”22
ACOG’s voice has been joined by 5 other major medical associations—American Academy of Family Physicians, American Academy of Pediatrics, American Psychiatric Association, American Academy of Pediatrics, and American Osteopathic Association—together representing more than 560,000 physicians and medical students, in urging the Administration to immediately withdraw its proposals. This broad coalition unequivocally stated36:
Contraception is an integral part of preventive care and a medical necessity for women during approximately 30 years of their lives. Access to no-copay contraception leads to healthier women and families. Changes to our healthcare system come with very high stakes – impacting tens of millions of our patients. Access to contraception allows women to achieve, lead and reach their full potentials, becoming key drivers of our Nation’s economic success. These rules would create a new standard whereby employers can deny their employees coverage, based on their own moral objections. This interferes in the personal health care decisions of our patients, and inappropriately inserts a patient’s employer into the physician-patient relationship. In addition, these rules open the door to moral exemptions for other essential health care, including vaccinations.
These are challenging days for women’s health policy and legislation federally, and in many states. ACOG has two clear messages for politicians: Don’t turn back the clock on women’s health, and stay out of our exam rooms.
- Claxton G, Cox C, Damico A, et al. Pre-existing conditions and medical underwriting in the individual insurance market prior to the ACA. Kaiser Family Foundation website. Published December 12, 2016. Accessed June 25, 2019.
- Norris L. Billions in ACA rebates show 80/20 rule’s impact. HealthInsurance.org website. Published May 10, 2019. Accessed June 25, 2019.
- Patient Protection and Affordable Care Act: Preexisting condition exclusions, lifetime and annual limits, rescissions, and patient protections. Regulations.gov website. Accessed June 25, 2019.
- Jost T. The Senate’s Health Care Freedom Act. Health Affairs website. Updated July 28, 2017. Accessed June 25, 2019.
- Texas v Azar decision. American Medical Association website. Accessed June 25, 2019.
- Keith K. DOJ, plaintiffs file in Texas v United States. Health Affairs website. Published May 2 2019. Accessed June 25, 2019.
- John & Rusty Report. Trump Administration asks court to strike down entire ACA. March 26, 2019. https://jrreport.wordandbrown.com/2019/03/26/trump-administration-asks-court-to-strike-down-entire-aca/. Accessed June 29, 2019.
- Speech: Remarks by Administrator Seema Verma at the CMS National Forum on State Relief and Empowerment Waivers. Centers for Medicare & Medicaid website. Published April 23, 2019. Accessed June 25, 2019.
- Poll: The ACA’s pre-existing condition protections remain popular with the public, including republicans, as legal challenge looms this week. Kaiser Family Foundation website. Published September 5, 2018. Accessed June 25, 2019.
- Statement from President Donald J. Trump on Women’s Health Week. White House website. Issued May 14, 2017. Accessed June 26, 2019.
- Finer LB, Zolna MR. Declines in unintended pregnancy in the United States, 2008-2011. N Engl J Med. 2016;374:843-852.
- Insurance coverage of contraception. Guttmacher Institute website. Published August 2018. Accessed June 26, 2019.
- Carlin CS, Fertig AR, Dowd BE. Affordable Care Act’s mandate eliminating contraceptive cost sharing influenced choices of women with employer coverage. Health Affairs. 2016;35:1608-1615.
- American College of Obstetricians and Gynecologists. Access to contraception. Committee Opinion No. 615. Obstet Gynecol. 2015;125:250–255.
- Canestaro W, et al. Implications of employer coverage of contraception: cost-effectiveness analysis of contraception coverage under an employer mandate. Contraception. 2017;95:77-89.
- Simmons A, et al. The Affordable Care Act: Promoting better health for women. Office of the Assistant Secretary for Planning and Evaluation Issue Brief, Department of Health and Human Services. June 14, 2016. Accessed June 25, 2019.
- Conde-Agudelo A, Rosas-Bermudez A, Kafury-Goeta AC. Birth spacing and risk of adverse perinatal outcomes: a meta-analysis. JAMA. 2006;295:1809–1823.
- Becker NV, Polsky D. Women saw large decrease in out-of-pocket spending for contraceptives after ACA mandate removed cost sharing. Health Affairs. 2015;34:1204-1211. Accessed June 25, 2019.
- Becker NV, Polsky D. Women saw large decrease in out-of-pocket spending for contraceptives after ACA mandate removed cost sharing. Health Affairs. 2015;34(7).
- Sonfield A, Hasstedt K, Kavanaugh ML, Anderson R. The social and economic benefits of women’s ability to determine whether and when to have children. New York, NY: Guttmacher Institute; 2013.
- Department of Health and Human Services. Fact sheet: Final rules on religious and moral exemptions and accommodation for coverage of certain preventive services under the Affordable Care Act. November 7, 2018. Accessed June 26, 2019.
- American College of Obstetricians and Gynecologists. Facts are important: Correcting the record on the Administration’s contraceptive coverage roll back rule. October 2017. Accessed June 26, 2019.
- Brief for Physicians for Reproductive Health, American College of Obstetricians and Gynecologists et al. as Amici Curiae Supporting Respondents, Sebelius v. Hobby Lobby, 573 U.S. XXX. 2014. (No. 13-354).
- Early pregnancy loss. FAQ No. 90. American College of Obstetricians and Gynecologists. August 2015.
- Kirby D. Emerging answers 2007: Research findings on programs to reduce teen pregnancy and sexually transmitted diseases. Washington, DC: The National Campaign to Prevent Teen and Unplanned Pregnancy; 2009.
- Meyer JL, Gold MA, Haggerty CL. Advance provision of emergency contraception among adolescent and young adult women: a systematic review of literature. J Pediatr Adolesc Gynecol. 2011;24:2-9.
- Martinez GM and Abma JC. Sexual activity, contraceptive use, and childbearing of teenagers aged 15–19 in the United States. NCHS Data Brief, 2015, No. 209. Hyattsville, MD: National Center for Health Statistics; 2015.
- Martinez GM, Abma JC. Sexual activity, contraceptive use, and childbearing of teenagers aged 15-19 in the United States. NCHS Data Brief. July 2015. Accessed June 26, 2019.
- Lindberg L, Santelli J, Desai S. Understanding the decline in adolescent fertility in the United States, 2007–2012. J Adolesc Health. 2016;59:577-583.
- Minguez M, Santelli JS, Gibson E, et al. Reproductive health impact of a school health center. J Adolesc Health. 2015;56:338-344.
- Knopf JA, Finnie RK, Peng Y, et al. Community Preventive Services Task Force. School-based health centers to advance health equity: a Community Guide systematic review. Am J Preventive Med. 2016;51:114-126.
- Progestin-only hormonal birth control: pill and injection. FAQ No. 86. American College of Obstetricians and Gynecologists. July 2014.
- Combined hormonal birth control: pill, patch, and ring. FAQ No. 185. American College of Obstetricians and Gynecologists. July 2014.
- Risk of venous thromboembolism among users of drospirenone-containing oral contraceptive pills. Committee Opinion No. 540. American College of Obstetricians and Gynecologists. Obstet Gynecol. 2012;120:1239-1242.
- Curtis KM, Jatlaoui TC, Tepper NK, et al. U.S. Selected Practice Recommendations for Contraceptive Use, 2016. MMWR Recomm Rep. 2016;65(No. RR-4):1–66.
- Letter to President Donald J. Trump. October 6, 2017. https://www.aafp.org/dam/AAFP/documents/advocacy/coverage/aca/LT-Group6-President-ContraceptionIFRs-100617.pdf. Accessed June 26, 2019.

Usage of and Attitudes Toward Health Information Exchange Before and After System Implementation in a VA Medical Center
More than 9 million veterans are enrolled in the Veterans Health Administration (VHA). A high percentage of veterans who use VHA services have multiple chronic conditions and complex medical needs.1 In addition to receiving health care from the VHA, many of these patients receive additional services from non-VHA providers in the community. Furthermore, recent laws enacted, such as the 2018 VA MISSION Act and the 2014 VA Choice Program, have increased veterans’ use of community health care services.
VHA staff face considerable barriers when seeking documentation about non-VHA services delivered in the community, which can be fragmented across multiple health care systems. In many VHA medical centers, staff must telephone non-VHA sites of care and/or use time-consuming fax services to request community-based patient records. VA health care providers (HCPs) often complain that community records are not available to make timely clinical decisions or that they must do so without knowing past or co-occurring assessments or treatment plans. Without access to comprehensive health records, patients are at risk for duplicated treatment, medication errors, and death.2,3
Background
To improve the continuity and safety of health care, US governmental and health information experts stimulated formal communication among HCPs via the 2009 Health Information Technology for Economic and Clinical Health (HITECH) Act.4,5 One of the primary aims of the HITECH Act was to promote reliable and interoperable electronic sharing of clinical information through health information exchange (HIE) for both patients and HCPs. Monetary incentives encouraged regional, state, or state-funded organizations to create and promote HIE capabilities.
Presently, empirical data are not available that describe the effect of external HIE systems in VHA settings. However, data examining non-VHA settings suggest that HIE may improve quality of care, although findings are mixed. For example, some research has found that HIE reduces hospital admissions, duplicated test ordering, and health care costs and improves decision making, whereas other research has found no change.3,6-13 Barriers to HIE use noted in community settings include poorly designed interfaces, inefficient workflow, and incomplete record availability.3,6-10,14
A few US Department of Veterans Affairs (VA) medical centers have recently initiated contracts with HIE organizations. Because much of the present research evaluates internally developed HIE systems, scholars in the field have identified a pressing need for useful statistics before and after implementation of externally developed HIE systems.13,15 Additionally, scholars call for data examining nonacademic settings (eg, VHA medical centers) and for diverse patient populations (eg, individuals with chronic disorders, veterans).13This quality improvement project had 2 goals. The first goal was to assess baseline descriptive statistics related to requesting/obtaining community health records in a VHA setting. The second goal was to evaluate VHA staff access to needed community health records (eg, records stemming from community consults) before and after implementation of an externally developed HIE system.
Methods
This project was a single-center, quality improvement evaluation examining the effect of implementing an HIE system, developed by an external nonprofit organization. The project protocol was approved by the VA Pacific Islands Healthcare System (VAPIHCS) Evidence-Based Practices Council. Clinicians’ responses were anonymous, and data were reported only in aggregate. Assessment was conducted by an evaluator who was not associated with the HIE system developers and its implementation, reducing the chance of bias.15
Coinciding with the HIE system implementation and prior to having access to it, VAPIHCS medical and managed care staff were invited to complete an online needs assessment tool. Voluntary trainings on the system were offered at various times on multiple days and lasted approximately 1 hour. Six months after the HIE system was implemented, a postassessment tool reevaluated HIE-related access.
VHA Setting and HIE System
VAPIHCS serves about 55,000 unique patients across a 2.6 million square-mile catchment area (Hawaii and Pacific Island territories). Facilities include a medium-sized, urban VA medical center and 7 suburban or rural/remote primary care outpatient clinics.
VAPIHCS contracted with Hawaii Health Information Exchange (HHIE), a nonprofit organization that was designated by the state of Hawaii to develop a seamless, secure HIE system. According to HHIE, 83% of the 23 hospitals in the state and 55% of Hawaii’s 2,927 active practicing physicians have adopted the HIE system (F. Chan, personal communication, December 12, 2018). HHIE’s data sources provide real-time access to a database of 20 million health records. Records include, among other records, data such as patients’ reasons for referral, encounter diagnoses, medications, immunizations, and discharge instructions from many (but not all) HCPs in Hawaii.
HHIE reports that it has the capacity to interface with all electronic health records systems currently in use in the community (F. Chan, personal communication, December 12, 2018). Although the HIE system can provide directed exchange (ie, sending and receiving secure information electronically between HCPs), the HIE system implemented in the VAPIHCS was limited to query-retrieve (ie, practitioner-initiated requests for information from other community HCPs). Specifically, to access patient records, practitioners log in to the HIE portal and enter a patient’s name in a search window. The system then generates a consolidated virtual chart with data collected from all HIE data-sharing participants. To share records, community HCPs either build or enable a profile in an integrated health care enterprise electronic communication interface into their data. However, VHA records were not made available to community HCPs at this initial stage.
Measures and Statistical Analysis
A template of quality improvement-related questions was adapted for this project with input from subject matter experts. Questions were then modified further based on interviews with 5 clinical and managed care staff members. The final online tool consisted of up to 20 multiple choice items and 2 open-ended questions delivered online. A 22-item evaluation tool was administered 6 months after system implementation. Frequencies were obtained for descriptive items, and group responses were compared across time.
Results
Thirty-nine staff (32 medical and 7 managed care staff) completed the needs assessment, and 20 staff (16 medical and 4 managed care staff) completed the postimplementation evaluation.
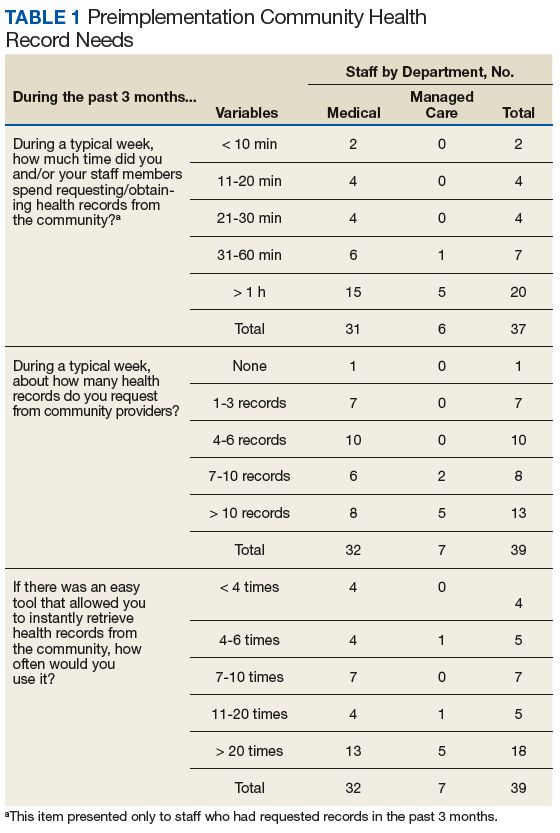
Before implementation of the HIE system, most staff (54%) indicated that they spent > 1 hour a week conducting tasks related to seeking and/or obtaining health records from the community. The largest percentage of staff (27%) requested > 10 community records during a typical week. Most respondents indicated that they would use an easy tool to instantly retrieve community health records at least 20 times per week (Table 1).
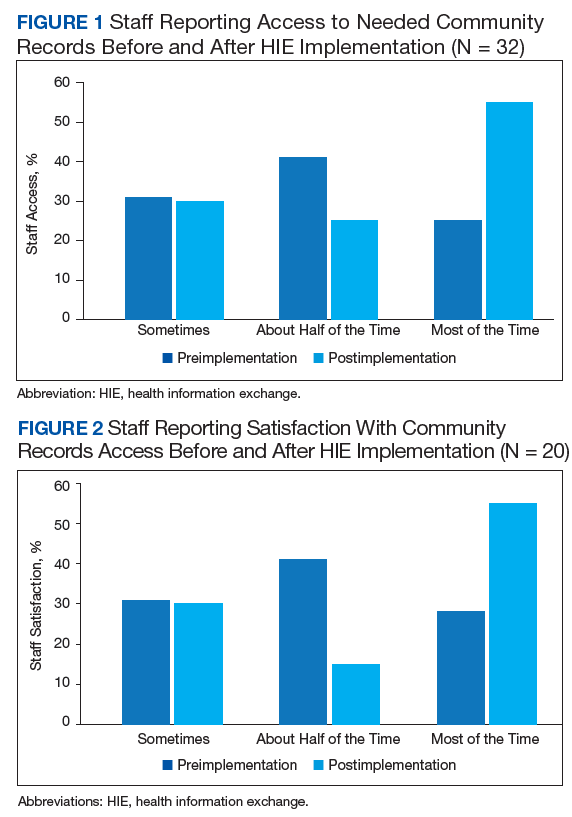
Preimplementation, 32.4% of respondents indicated that they could access community-based health records sometimes. Postimplementation, most respondents indicated they could access the records most of the time (Figure 1).
Preimplementation, staff most frequently indicated they were very dissatisfied with the current level of access to community records. Postimplementation, more staff were somewhat satisfied or very satisfied (Figure 2). Postimplementation, 48% of staff most often reported using the HIE system either several times a month or 2 to 4 times a week, 19% used the system daily, 19% used 1 to 2 times, and 14% never used the system. Most staff (67%) reported that the system improved access to records somewhat and supported continuing the contract with the HIE system. Conversely, 18% of respondents said that their access did not improve enough for the system to be of use to them.
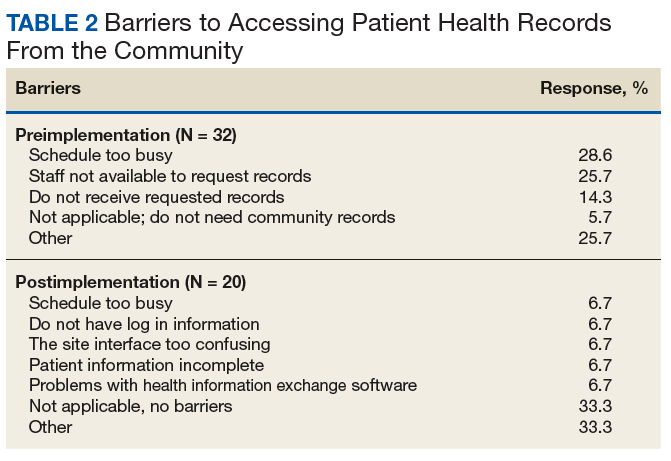
Preimplementation, staff most frequently indicated that they did not have time (28.6%) or sufficient staff (25.7%) to request records (Table 2). Postimplementation, staff most frequently (33.3%) indicated that they had no problems accessing the HIE system, but 6.7% reported having time or interface/software difficulties.
Discussion
This report assessed a quality improvement project designed to increase VHA access to community health records via an external HIE system. Prior to this work, no data were available on use, barriers, and staff satisfaction related to implementing an externally developed HIE system within a VA medical center.13,15
Before the medical center implemented the HIE system, logistical barriers prevented most HCPs and managed care staff from obtaining needed community records. Staff faced challenges such as lacking time as well as rudimentary barriers, such as community clinics not responding to requests or the fax machine not working. Time remained a challenge after implementation, but this work demonstrated that the HIE system helped staff overcome many logistical barriers.
After implementation of the HIE system, staff reported an improvement in access and satisfaction related to retrieving community health records. These findings are consistent with most but not all evaluations of HIE systems.3,6,7,12,13 In the present work, staff used the system several times a month or several times a week, and most staff believed that access to the HIE system should be continued. Still, improvement was incomplete. The HIE system increased access to specific types of records (eg, reports) and health care systems (eg, large hospitals), but not others. As a result, the system was more useful for some staff than for others.
Research examining HIE systems in community and academic settings have identified factors that deter their use, such as poorly designed interfaces, inefficient workflow, and incomplete record availability.3,6,7,14,16 In the present project, incomplete record availability was a noted barrier. Additionally, a few staff reported system interface issues. However, most staff found the system easy to use as part of their daily workflow.
Because the HIE system had a meaningful, positive impact on VHA providers and staff, it will be sustained at VAPIHCS. Specifically, the contract with the HHIE has been renewed, and the number of user licenses has increased. Staff users now self-refer for the service or can be referred by their service chiefs.
Limitations
This work was designed to evaluate the effect of an HIE system on staff in 1 VHA setting; thus, findings may not be generalizable to other settings or HIE systems. Limitations of the present work include small sample size of respondents; limited time frame for responses; and limited response rate. The logical next step would be research efforts to compare access to the HIE system with no access on factors such as workload productivity, cost savings, and patient safety.
Conclusion
The vision of the HITECH Act was to improve the continuity and safety of health care via reliable and interoperable electronic sharing of clinical information across health care entities.6 This VHA quality improvement project demonstrated a meaningful improvement in staff’s level of satisfaction with access to community health records when staff used an externally developed HIE system. Not all types of records (eg, progress notes) were accessible, which resulted in the system being useful for most but not all staff.
In the future, the federal government’s internally developed Veterans Health Information Exchange (formerly known as the Virtual Lifetime Electronic Record [VLER]) is expected to enable VHA, the Department of Defense, and participating community care providers to access shared electronic health records nationally. However, until we can achieve that envisioned interoperability, VHA staff can use HIE and other clinical support applications to access health records.
1. Yu W, Ravelo A, Wagner TH, et al. Prevalence and costs of chronic conditions in the VA health care system. Med Care Res Rev. 2003;60(3)(suppl):146S-167S.
2. Bourgeois FC, Olson KL, Mandl KD. Patients treated at multiple acute health care facilities: quantifying information fragmentation. Arch Intern Med. 2010;170(22):1989-1995.
3. Rudin RS, Motala A, Goldzweig CL, Shekelle PG. Usage and effect of health information exchange: a systematic review. Ann Intern Med. 2014;161(11):803-811.
4. Blumenthal D. Implementation of the federal health information technology initiative. N Engl J Med. 2011;365(25):2426-2431.
5. The Office of the National Coordinator for Health Information Technology. Connecting health and care for the nation: a shared nationwide interoperability roadmap. Final version 1.0. https://www.healthit.gov/sites/default/files/hie-interoperability/nationwide-interoperability-roadmap-final-version-1.0.pdf. Accessed May 22, 2019.
6. Detmer D, Bloomrosen M, Raymond B, Tang P. Integrated personal health records: transformative tools for consumer-centric care. BMC Med Inform Decis Mak. 2008;8:45.
7. Hersh WR, Totten AM, Eden KB, et al. Outcomes from health information exchange: systematic review and future research needs. JMIR Med Inform. 2015;3(4):e39.
8. Vest JR, Kern LM, Campion TR Jr, Silver MD, Kaushal R. Association between use of a health information exchange system and hospital admissions. Appl Clin Inform. 2014;5(1):219-231.
9. Vest JR, Jung HY, Ostrovsky A, Das LT, McGinty GB. Image sharing technologies and reduction of imaging utilization: a systematic review and meta-analysis. J Am Coll Radiol. 2015;12(12 pt B):1371-1379.e3.
10. Walker DM. Does participation in health information exchange improve hospital efficiency? Health Care Manag Sci. 2018;21(3):426-438.
11. Gordon BD, Bernard K, Salzman J, Whitebird RR. Impact of health information exchange on emergency medicine clinical decision making. West J Emerg Med. 2015;16(7):1047-1051.
12. Hincapie A, Warholak T. The impact of health information exchange on health outcomes. Appl Clin Inform. 2011;2(4):499-507.
13. Rahurkar S, Vest JR, Menachemi N. Despite the spread of health information exchange, there is little evidence of its impact on cost, use, and quality of care. Health Aff (Millwood). 2015;34(3):477-483.
14. Eden KB, Totten AM, Kassakian SZ, et al. Barriers and facilitators to exchanging health information: a systematic review. Int J Med Inform. 2016;88:44-51.
15. Hersh WR, Totten AM, Eden K, et al. The evidence base for health information exchange. In: Dixon BE, ed. Health Information Exchange: Navigating and Managing a Network of Health Information Systems. Cambridge, MA: Academic Press; 2016:213-229.
16. Blavin F, Ramos C, Cafarella Lallemand N, Fass J, Ozanich G, Adler-Milstein J. Analyzing the public benefit attributable to interoperable health information exchange. https://aspe.hhs.gov/system/files/pdf/258851/AnalyzingthePublicBenefitAttributabletoInteroperableHealth.pdf. Published July 2017. Accessed May 22, 2019.
More than 9 million veterans are enrolled in the Veterans Health Administration (VHA). A high percentage of veterans who use VHA services have multiple chronic conditions and complex medical needs.1 In addition to receiving health care from the VHA, many of these patients receive additional services from non-VHA providers in the community. Furthermore, recent laws enacted, such as the 2018 VA MISSION Act and the 2014 VA Choice Program, have increased veterans’ use of community health care services.
VHA staff face considerable barriers when seeking documentation about non-VHA services delivered in the community, which can be fragmented across multiple health care systems. In many VHA medical centers, staff must telephone non-VHA sites of care and/or use time-consuming fax services to request community-based patient records. VA health care providers (HCPs) often complain that community records are not available to make timely clinical decisions or that they must do so without knowing past or co-occurring assessments or treatment plans. Without access to comprehensive health records, patients are at risk for duplicated treatment, medication errors, and death.2,3
Background
To improve the continuity and safety of health care, US governmental and health information experts stimulated formal communication among HCPs via the 2009 Health Information Technology for Economic and Clinical Health (HITECH) Act.4,5 One of the primary aims of the HITECH Act was to promote reliable and interoperable electronic sharing of clinical information through health information exchange (HIE) for both patients and HCPs. Monetary incentives encouraged regional, state, or state-funded organizations to create and promote HIE capabilities.
Presently, empirical data are not available that describe the effect of external HIE systems in VHA settings. However, data examining non-VHA settings suggest that HIE may improve quality of care, although findings are mixed. For example, some research has found that HIE reduces hospital admissions, duplicated test ordering, and health care costs and improves decision making, whereas other research has found no change.3,6-13 Barriers to HIE use noted in community settings include poorly designed interfaces, inefficient workflow, and incomplete record availability.3,6-10,14
A few US Department of Veterans Affairs (VA) medical centers have recently initiated contracts with HIE organizations. Because much of the present research evaluates internally developed HIE systems, scholars in the field have identified a pressing need for useful statistics before and after implementation of externally developed HIE systems.13,15 Additionally, scholars call for data examining nonacademic settings (eg, VHA medical centers) and for diverse patient populations (eg, individuals with chronic disorders, veterans).13This quality improvement project had 2 goals. The first goal was to assess baseline descriptive statistics related to requesting/obtaining community health records in a VHA setting. The second goal was to evaluate VHA staff access to needed community health records (eg, records stemming from community consults) before and after implementation of an externally developed HIE system.
Methods
This project was a single-center, quality improvement evaluation examining the effect of implementing an HIE system, developed by an external nonprofit organization. The project protocol was approved by the VA Pacific Islands Healthcare System (VAPIHCS) Evidence-Based Practices Council. Clinicians’ responses were anonymous, and data were reported only in aggregate. Assessment was conducted by an evaluator who was not associated with the HIE system developers and its implementation, reducing the chance of bias.15
Coinciding with the HIE system implementation and prior to having access to it, VAPIHCS medical and managed care staff were invited to complete an online needs assessment tool. Voluntary trainings on the system were offered at various times on multiple days and lasted approximately 1 hour. Six months after the HIE system was implemented, a postassessment tool reevaluated HIE-related access.
VHA Setting and HIE System
VAPIHCS serves about 55,000 unique patients across a 2.6 million square-mile catchment area (Hawaii and Pacific Island territories). Facilities include a medium-sized, urban VA medical center and 7 suburban or rural/remote primary care outpatient clinics.
VAPIHCS contracted with Hawaii Health Information Exchange (HHIE), a nonprofit organization that was designated by the state of Hawaii to develop a seamless, secure HIE system. According to HHIE, 83% of the 23 hospitals in the state and 55% of Hawaii’s 2,927 active practicing physicians have adopted the HIE system (F. Chan, personal communication, December 12, 2018). HHIE’s data sources provide real-time access to a database of 20 million health records. Records include, among other records, data such as patients’ reasons for referral, encounter diagnoses, medications, immunizations, and discharge instructions from many (but not all) HCPs in Hawaii.
HHIE reports that it has the capacity to interface with all electronic health records systems currently in use in the community (F. Chan, personal communication, December 12, 2018). Although the HIE system can provide directed exchange (ie, sending and receiving secure information electronically between HCPs), the HIE system implemented in the VAPIHCS was limited to query-retrieve (ie, practitioner-initiated requests for information from other community HCPs). Specifically, to access patient records, practitioners log in to the HIE portal and enter a patient’s name in a search window. The system then generates a consolidated virtual chart with data collected from all HIE data-sharing participants. To share records, community HCPs either build or enable a profile in an integrated health care enterprise electronic communication interface into their data. However, VHA records were not made available to community HCPs at this initial stage.
Measures and Statistical Analysis
A template of quality improvement-related questions was adapted for this project with input from subject matter experts. Questions were then modified further based on interviews with 5 clinical and managed care staff members. The final online tool consisted of up to 20 multiple choice items and 2 open-ended questions delivered online. A 22-item evaluation tool was administered 6 months after system implementation. Frequencies were obtained for descriptive items, and group responses were compared across time.
Results
Thirty-nine staff (32 medical and 7 managed care staff) completed the needs assessment, and 20 staff (16 medical and 4 managed care staff) completed the postimplementation evaluation.
Before implementation of the HIE system, most staff (54%) indicated that they spent > 1 hour a week conducting tasks related to seeking and/or obtaining health records from the community. The largest percentage of staff (27%) requested > 10 community records during a typical week. Most respondents indicated that they would use an easy tool to instantly retrieve community health records at least 20 times per week (Table 1).
Preimplementation, 32.4% of respondents indicated that they could access community-based health records sometimes. Postimplementation, most respondents indicated they could access the records most of the time (Figure 1).
Preimplementation, staff most frequently indicated they were very dissatisfied with the current level of access to community records. Postimplementation, more staff were somewhat satisfied or very satisfied (Figure 2). Postimplementation, 48% of staff most often reported using the HIE system either several times a month or 2 to 4 times a week, 19% used the system daily, 19% used 1 to 2 times, and 14% never used the system. Most staff (67%) reported that the system improved access to records somewhat and supported continuing the contract with the HIE system. Conversely, 18% of respondents said that their access did not improve enough for the system to be of use to them.
Preimplementation, staff most frequently indicated that they did not have time (28.6%) or sufficient staff (25.7%) to request records (Table 2). Postimplementation, staff most frequently (33.3%) indicated that they had no problems accessing the HIE system, but 6.7% reported having time or interface/software difficulties.
Discussion
This report assessed a quality improvement project designed to increase VHA access to community health records via an external HIE system. Prior to this work, no data were available on use, barriers, and staff satisfaction related to implementing an externally developed HIE system within a VA medical center.13,15
Before the medical center implemented the HIE system, logistical barriers prevented most HCPs and managed care staff from obtaining needed community records. Staff faced challenges such as lacking time as well as rudimentary barriers, such as community clinics not responding to requests or the fax machine not working. Time remained a challenge after implementation, but this work demonstrated that the HIE system helped staff overcome many logistical barriers.
After implementation of the HIE system, staff reported an improvement in access and satisfaction related to retrieving community health records. These findings are consistent with most but not all evaluations of HIE systems.3,6,7,12,13 In the present work, staff used the system several times a month or several times a week, and most staff believed that access to the HIE system should be continued. Still, improvement was incomplete. The HIE system increased access to specific types of records (eg, reports) and health care systems (eg, large hospitals), but not others. As a result, the system was more useful for some staff than for others.
Research examining HIE systems in community and academic settings have identified factors that deter their use, such as poorly designed interfaces, inefficient workflow, and incomplete record availability.3,6,7,14,16 In the present project, incomplete record availability was a noted barrier. Additionally, a few staff reported system interface issues. However, most staff found the system easy to use as part of their daily workflow.
Because the HIE system had a meaningful, positive impact on VHA providers and staff, it will be sustained at VAPIHCS. Specifically, the contract with the HHIE has been renewed, and the number of user licenses has increased. Staff users now self-refer for the service or can be referred by their service chiefs.
Limitations
This work was designed to evaluate the effect of an HIE system on staff in 1 VHA setting; thus, findings may not be generalizable to other settings or HIE systems. Limitations of the present work include small sample size of respondents; limited time frame for responses; and limited response rate. The logical next step would be research efforts to compare access to the HIE system with no access on factors such as workload productivity, cost savings, and patient safety.
Conclusion
The vision of the HITECH Act was to improve the continuity and safety of health care via reliable and interoperable electronic sharing of clinical information across health care entities.6 This VHA quality improvement project demonstrated a meaningful improvement in staff’s level of satisfaction with access to community health records when staff used an externally developed HIE system. Not all types of records (eg, progress notes) were accessible, which resulted in the system being useful for most but not all staff.
In the future, the federal government’s internally developed Veterans Health Information Exchange (formerly known as the Virtual Lifetime Electronic Record [VLER]) is expected to enable VHA, the Department of Defense, and participating community care providers to access shared electronic health records nationally. However, until we can achieve that envisioned interoperability, VHA staff can use HIE and other clinical support applications to access health records.
1. Yu W, Ravelo A, Wagner TH, et al. Prevalence and costs of chronic conditions in the VA health care system. Med Care Res Rev. 2003;60(3)(suppl):146S-167S.
2. Bourgeois FC, Olson KL, Mandl KD. Patients treated at multiple acute health care facilities: quantifying information fragmentation. Arch Intern Med. 2010;170(22):1989-1995.
3. Rudin RS, Motala A, Goldzweig CL, Shekelle PG. Usage and effect of health information exchange: a systematic review. Ann Intern Med. 2014;161(11):803-811.
4. Blumenthal D. Implementation of the federal health information technology initiative. N Engl J Med. 2011;365(25):2426-2431.
5. The Office of the National Coordinator for Health Information Technology. Connecting health and care for the nation: a shared nationwide interoperability roadmap. Final version 1.0. https://www.healthit.gov/sites/default/files/hie-interoperability/nationwide-interoperability-roadmap-final-version-1.0.pdf. Accessed May 22, 2019.
6. Detmer D, Bloomrosen M, Raymond B, Tang P. Integrated personal health records: transformative tools for consumer-centric care. BMC Med Inform Decis Mak. 2008;8:45.
7. Hersh WR, Totten AM, Eden KB, et al. Outcomes from health information exchange: systematic review and future research needs. JMIR Med Inform. 2015;3(4):e39.
8. Vest JR, Kern LM, Campion TR Jr, Silver MD, Kaushal R. Association between use of a health information exchange system and hospital admissions. Appl Clin Inform. 2014;5(1):219-231.
9. Vest JR, Jung HY, Ostrovsky A, Das LT, McGinty GB. Image sharing technologies and reduction of imaging utilization: a systematic review and meta-analysis. J Am Coll Radiol. 2015;12(12 pt B):1371-1379.e3.
10. Walker DM. Does participation in health information exchange improve hospital efficiency? Health Care Manag Sci. 2018;21(3):426-438.
11. Gordon BD, Bernard K, Salzman J, Whitebird RR. Impact of health information exchange on emergency medicine clinical decision making. West J Emerg Med. 2015;16(7):1047-1051.
12. Hincapie A, Warholak T. The impact of health information exchange on health outcomes. Appl Clin Inform. 2011;2(4):499-507.
13. Rahurkar S, Vest JR, Menachemi N. Despite the spread of health information exchange, there is little evidence of its impact on cost, use, and quality of care. Health Aff (Millwood). 2015;34(3):477-483.
14. Eden KB, Totten AM, Kassakian SZ, et al. Barriers and facilitators to exchanging health information: a systematic review. Int J Med Inform. 2016;88:44-51.
15. Hersh WR, Totten AM, Eden K, et al. The evidence base for health information exchange. In: Dixon BE, ed. Health Information Exchange: Navigating and Managing a Network of Health Information Systems. Cambridge, MA: Academic Press; 2016:213-229.
16. Blavin F, Ramos C, Cafarella Lallemand N, Fass J, Ozanich G, Adler-Milstein J. Analyzing the public benefit attributable to interoperable health information exchange. https://aspe.hhs.gov/system/files/pdf/258851/AnalyzingthePublicBenefitAttributabletoInteroperableHealth.pdf. Published July 2017. Accessed May 22, 2019.